oregon public employees retirement system …...develop recommended assumptions for december 31,...
TRANSCRIPT
www.mercer.com
Oregon Public Employees’ Retirement System Experience Study for December 31, 2008 Actuarial Valuation - Demographic Assumptions - Investment Return Assumptions
July 16, 2009
Bill Hallmark and Matt Larrabee

1G:\WP\Retire\2009\Opersu\Board Mtgs\20090716 Board Meeting - InvestReturn and demographic assumptions final.pptMercer
Contents
Introduction
Demographic Assumptions
Investment Return Assumptions
Decisions (Selection of Economic and Demographic Assumptions)
Next Steps
Appendix

2G:\WP\Retire\2009\Opersu\Board Mtgs\20090716 Board Meeting - InvestReturn and demographic assumptions final.pptMercer
Introduction Retirement Plan Financial Management Framework
ManagedManaged CostsCostsObjectivesObjectives
FundingFunding
Governance
InvestmentInvestment
BenefitBenefit
Total Contributions = Benefits Paid - Investment Earnings
Actuarial methods/assumptions primarily affect the timing of contributions

3G:\WP\Retire\2009\Opersu\Board Mtgs\20090716 Board Meeting - InvestReturn and demographic assumptions final.pptMercer
Introduction Objectives for Actuarial Methods and Assumptions
Transparent
Predictable and stable rates
Protect funded status
Equitable across generations
Actuarially sound
GASB compliant
4G:\WP\Retire\2009\Opersu\Board Mtgs\20090716 Board Meeting - InvestReturn and demographic assumptions final.pptMercer
Introduction Summary of Recommendations
Two Significant Assumptions to Address– Investment Return
Mercer capital market assumptions and Strategic Investment Solutions (SIS) capital market assumptions differ significantlyMercer assumptions suggest decreasing the investment return assumption to 7.5%SIS assumptions suggest increasing the investment return assumption to at least 8.5%
– Healthy MortalityCurrent assumption is based on a static mortality table adjusted for projected improvements in mortality beyond the experience periodRecommendation is to base the assumption on a generational mortality table and match the experience during the study periodGenerational mortality tables build in projections for future improvement in mortality by creating a separate mortality table for each year of birthA generational mortality table should match future experience more closely than a static table

5G:\WP\Retire\2009\Opersu\Board Mtgs\20090716 Board Meeting - InvestReturn and demographic assumptions final.pptMercer
Introduction Summary of Recommendations
Additional assumptions with minor aggregate impact– Retirement rates – Added additional service band with different rates– Disability rates – Reduced rates to match continued reduction in disability
incidence– Termination rates – Reduced school district rates and increased SLGRP
rates– Merit salary increases – Slight increase in long-term rates, but added a
two-year freeze on merit increases to reflect the current economic environment
– Other assumptionsLump sum at retirement – slight reduction in partial lump sum ratePurchase service – increase in waiting time purchases for non-Money Match retirementsRefund – reduction in probability of refund before retirementUnused sick leave – minor adjustments to current assumptions for some groups
Demographic Assumptions
7G:\WP\Retire\2009\Opersu\Board Mtgs\20090716 Board Meeting - InvestReturn and demographic assumptions final.pptMercer
Demographic Assumptions Overview
Compared actual experience from January 1, 2005 through December 31, 2008 to expected experience based on assumptions from the December 31, 2007 actuarial valuation
Actual experience, combined with future expectations, are used to develop recommended assumptions for December 31, 2008 actuarial valuation
The presentation summarizes those results, primarily for assumptions where significant changes are recommended.
More details are available in:– Our forthcoming written report– The appendix of this presentation

8G:\WP\Retire\2009\Opersu\Board Mtgs\20090716 Board Meeting - InvestReturn and demographic assumptions final.pptMercer
Demographic Assumptions Confidence Intervals
We have used 50% and 90% confidence intervals in our analysis.
The 90% confidence interval represents the range around the observed rate that contains the true rate during the period of study with 90% probability
The size of the confidence interval depends on the number of observations
If an assumption is outside the 90% confidence interval and there is no other information to explain the observed experience, a change in assumption should be considered.
0.0%
5.0%
10.0%
15.0%
20.0%
25.0%
30.0%
50% ConfidenceInterval90% ConfidenceInterval

9G:\WP\Retire\2009\Opersu\Board Mtgs\20090716 Board Meeting - InvestReturn and demographic assumptions final.pptMercer
Mortality Assumptions Summary of Recommendations
Current Assumption Recommended Changes
Healthy Retired RP 2000, StaticCombined Active/Healthy Retired, Sex distinct
RP 2000, GenerationalCombined Active/Healthy Retired, Sex distinct
School district maleOther GS maleP&F male
No collar, set back 36 monthsNo collar, set back 24 monthsNo collar, set back 12 months
White collar, set back 12 monthsWhite collar, no set backBlend 33% blue collar, no set back
School district femaleOther female
No collar, set back 36 monthsNo collar, set back 18 months
White collar, set back 18 monthsBlend 33% blue collar, no set back
Disabled Retired RP 2000, Static, No CollarCombined Active/Healthy Retired, Sex distinct
RP 2000, Static, No CollarCombined Active/Healthy Retired, Sex distinct
MaleFemale
Set forward 36 months, min of 2.50%Set forward 36 months, min of 2.75%
Set forward 60 months, min of 2.25%Set forward 48 months, min of 2.25%
Non-Retired Mortality % of Healthy Retired Mortality % of Healthy Retired Mortality
School district maleOther GS maleP&F male
65%65%70%
75%75%70%
School district femaleOther female
50%55%
50%50%
Note that “white collar” and “blue collar” are terms used in the RP 2000 mortality table to adjust levels of mortality. They are used here to identify the adjustments made and are not intended to classify any employees as either
“blue collar” or “white collar.”

10G:\WP\Retire\2009\Opersu\Board Mtgs\20090716 Board Meeting - InvestReturn and demographic assumptions final.pptMercer
Mortality Assumptions Healthy Retired Mortality
Current Assumption
Recommended Assumption
ExposuresActual Deaths
Expected Deaths A/E Ratio
Expected Deaths A/E Ratio
School District Male 58,543 1,614 1,541 105% 1,613 100%
Other General Service Male* 86,441 2,735 2,632 104% 2,751 99%
Police & Fire Male 19,758 331 337 98% 331 100%
School District Female 113,269 2,683 2,541 106% 2,676 100%
Other Female* 108,247 3,232 2,939 110% 3,196 101%
The Actual/Expected ratio for healthy retirees under a static table should be approximately 110% in order to anticipate mortality improvement in the future. The Actual/Expected ratio for most groups is below 110%. The gold standard in mortality assumptions is to use a generational table that anticipates mortality improvements on a generational basis. Because the table has mortality improvements built into it, we can target an A/E ratio of 100%.We used “white collar”/”blue collar” adjustments and age set backs to adjust the standard table to match Oregon PERS experience.
* Includes beneficiaries.

11G:\WP\Retire\2009\Opersu\Board Mtgs\20090716 Board Meeting - InvestReturn and demographic assumptions final.pptMercer
Retirement Assumptions Structure for General Service Members
Current Structure Proposed Structure
Groupings<15
Years15 to 29 Years
30+ Years
<15 Years
15 to 29 Years
30+ Years
School Districts
Tier 1
Tier 2
SLGRP / Independent Employers
Tier 1
Tier 2
OPSRP
Instead of structuring retirement rates based on Tier, we recommend dividing the less than 30 year assumption into a less than 15 year assumption and a 15 to 29 year assumption (For P&F members, 0 to 12 years and 13 to 24 years).
This structure will likely track member retirement decisions more closely to the extent those decisions contemplate the amount of the retirement benefit and the affordability of retirement.
12G:\WP\Retire\2009\Opersu\Board Mtgs\20090716 Board Meeting - InvestReturn and demographic assumptions final.pptMercer
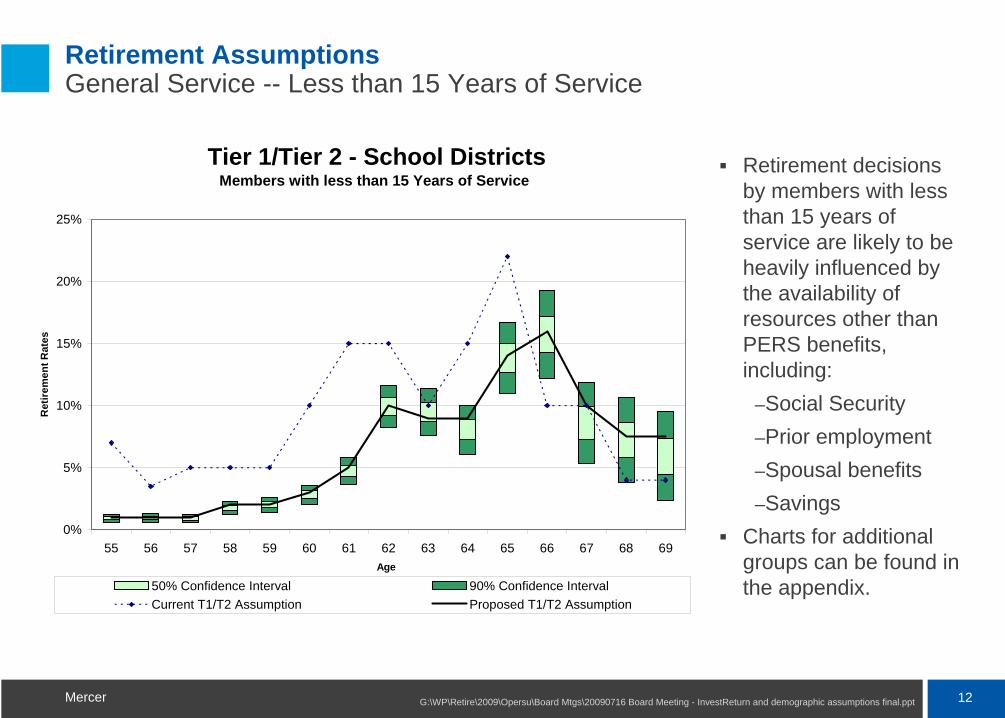
Retirement Assumptions General Service -- Less than 15 Years of Service
Retirement decisions by members with less than 15 years of service are likely to be heavily influenced by the availability of resources other than PERS benefits, including:
–Social Security–Prior employment–Spousal benefits–Savings
Charts for additional groups can be found in the appendix.
Tier 1/Tier 2 - School DistrictsMembers with less than 15 Years of Service
0%
5%
10%
15%
20%
25%
55 56 57 58 59 60 61 62 63 64 65 66 67 68 69Age
Ret
irem
ent R
ates
50% Confidence Interval 90% Confidence IntervalCurrent T1/T2 Assumption Proposed T1/T2 Assumption

13G:\WP\Retire\2009\Opersu\Board Mtgs\20090716 Board Meeting - InvestReturn and demographic assumptions final.pptMercer
Retirement Assumptions General Service -- 15 to 29 Years of Service
Retirement decisions by members with 15 to 29 years of service are likely to be influenced by the structure of PERS benefits as well as the availability of other resources, including:
–Social Security–Prior employment–Spousal benefits–Savings
Charts for additional groups can be found in the appendix.
Tier 1/Tier 2 - School DistrictsMembers with 15 - 29 Years of Service
0%
5%
10%
15%
20%
25%
30%
35%
55 56 57 58 59 60 61 62 63 64 65 66 67 68 69
Age
Ret
irem
ent R
ates
50% Confidence Interval 90% Confidence IntervalCurrent T1/T2 Assumption Proposed T1/T2 Assumption
14G:\WP\Retire\2009\Opersu\Board Mtgs\20090716 Board Meeting - InvestReturn and demographic assumptions final.pptMercer
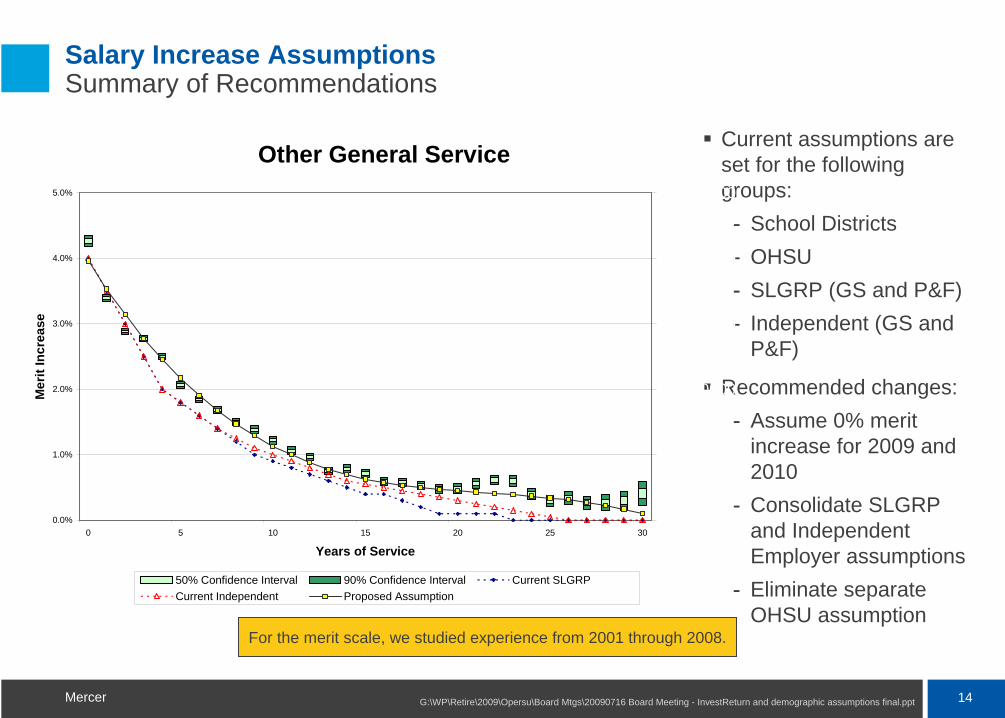
Salary Increase Assumptions Summary of Recommendations
For the merit scale, we studied experience from 2001 through 2008.
Current assumptions are set for the following groups:
School Districts
OHSU
SLGRP (GS and P&F)
Independent (GS and P&F)
Recommended changes:
Assume 0% merit increase for 2009 and 2010
Consolidate SLGRP and Independent Employer assumptions
Eliminate separate OHSU assumption
Other General Service
0.0%
1.0%
2.0%
3.0%
4.0%
5.0%
0 5 10 15 20 25 30
Years of Service
Mer
it In
crea
se
1.000000
1.010000
1.020000
1.030000
1.040000
1.050000
50% Confidence Interval 90% Confidence Interval Current SLGRPCurrent Independent Proposed Assumption
15G:\WP\Retire\2009\Opersu\Board Mtgs\20090716 Board Meeting - InvestReturn and demographic assumptions final.pptMercer
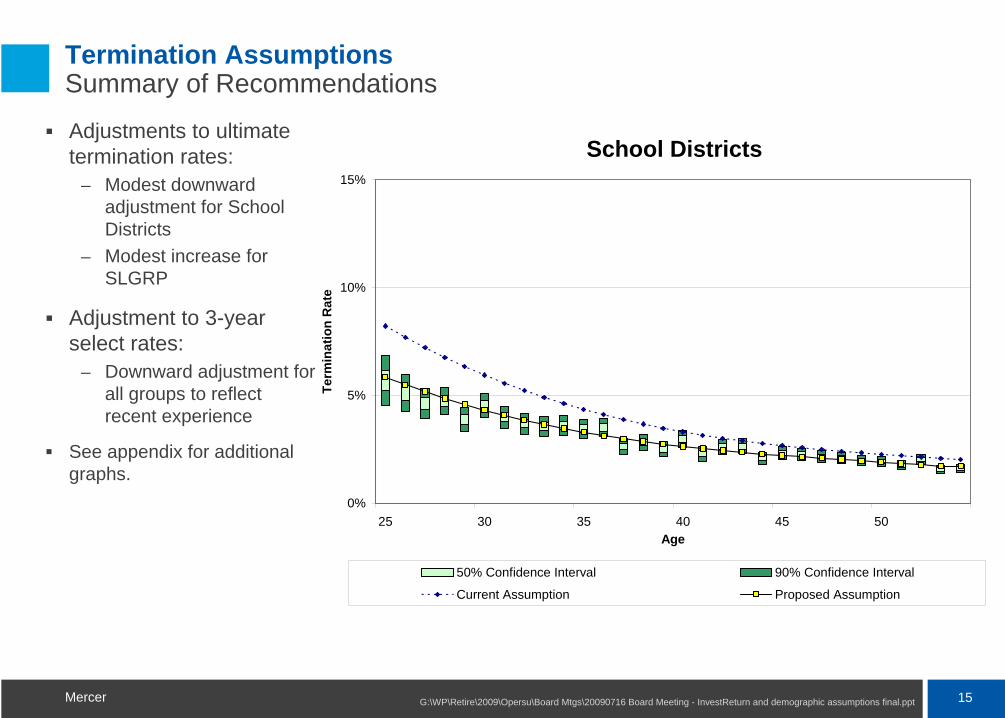
Termination Assumptions Summary of Recommendations
Adjustments to ultimate termination rates:
– Modest downward adjustment for School Districts
– Modest increase for SLGRP
Adjustment to 3-year select rates:
– Downward adjustment for all groups to reflect recent experience
See appendix for additional graphs.
School Districts
0%
5%
10%
15%
25 30 35 40 45 50Age
Term
inat
ion
Rat
e
50% Confidence Interval 90% Confidence Interval
Current Assumption Proposed Assumption
16G:\WP\Retire\2009\Opersu\Board Mtgs\20090716 Board Meeting - InvestReturn and demographic assumptions final.pptMercer
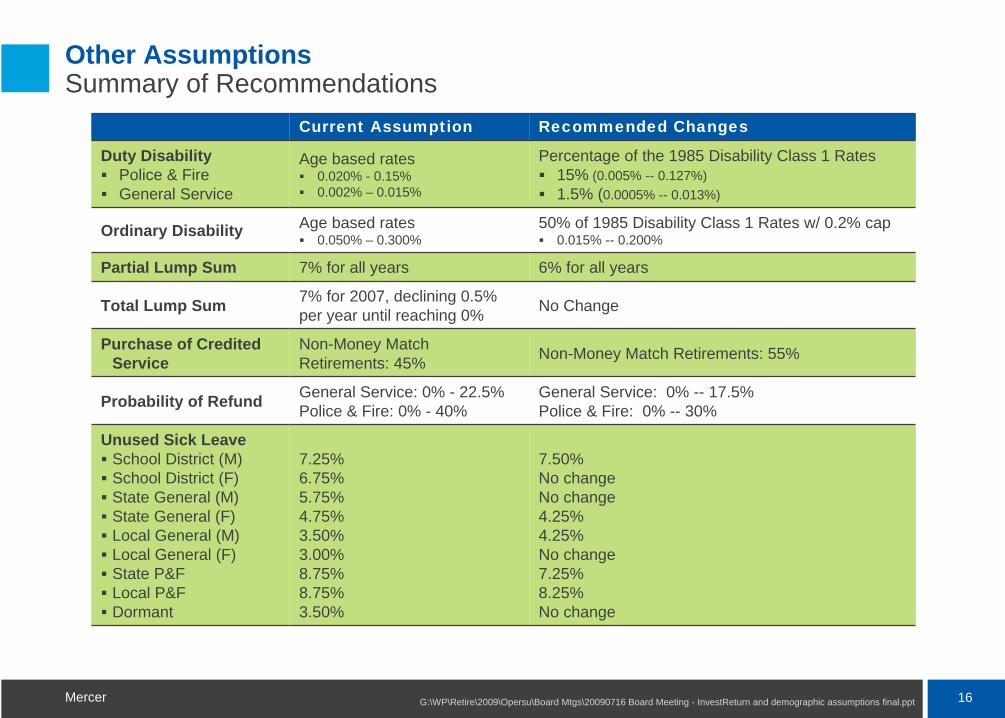
Other Assumptions Summary of Recommendations
Current Assumption Recommended Changes
Duty DisabilityPolice & FireGeneral Service
Age based rates 0.020% - 0.15%0.002% – 0.015%
Percentage of the 1985 Disability Class 1 Rates15% (0.005% -- 0.127%)1.5% (0.0005% -- 0.013%)
Ordinary Disability Age based rates0.050% – 0.300%
50% of 1985 Disability Class 1 Rates w/ 0.2% cap0.015% -- 0.200%
Partial Lump Sum 7% for all years 6% for all years
Total Lump Sum 7% for 2007, declining 0.5% per year until reaching 0% No Change
Purchase of Credited Service
Non-Money Match Retirements: 45% Non-Money Match Retirements: 55%
Probability of Refund General Service: 0% - 22.5%Police & Fire: 0% - 40%
General Service: 0% -- 17.5%Police & Fire: 0% -- 30%
Unused Sick LeaveSchool District (M)School District (F)State General (M)State General (F)Local General (M)Local General (F)State P&FLocal P&FDormant
7.25%6.75%5.75%4.75%3.50%3.00%8.75%8.75%3.50%
7.50%No changeNo change4.25%4.25%No change7.25%8.25%No change

17G:\WP\Retire\2009\Opersu\Board Mtgs\20090716 Board Meeting - InvestReturn and demographic assumptions final.pptMercer
Retiree Healthcare Assumptions Summary of Recommendations
Participation rates in both RHIA and RHIPA continue to decline.
The decline for RHIA may be due to the diminishing relevance of the flat dollar subsidy.
The decline for RHIPA may be due to competition from the PEBB alternative. Changes in the competitive relationship could make participation rates in RHIPA change quickly.
To remain conservative on these assumptions, we recommend rates at or above the top of the 90% confidence interval.
RHIA Participation Rates
10%
15%
20%
25%
30%
35%
40%
45%
50%
RHIA - Healthy RHIA - Disabled
Rat
e
50% Confidence Interval 90% Confidence Interval Current Assumption Proposed Assumption Actual
RHIPA Participation Rates
4%
6%
8%
10%
12%
14%
RHIPA - Total
Rat
e
50% Confidence Interval 90% Confidence Interval Current Assumption Actual Proposed Assumption

Investment Return Assumptions

19G:\WP\Retire\2009\Opersu\Board Mtgs\20090716 Board Meeting - InvestReturn and demographic assumptions final.pptMercer
Economic Assumptions Investment Return
In our May 29, 2009 Board presentation, we deferred a recommendation on the investment return assumption until the OIC’sinvestment consultant completed their review of capital market assumptions.
In order to add a broader perspective to the discussion, the chart on the right shows the assumptions used by the 125 large public sector systems in NASRA’s survey.
The current assumption of 8.0% is the median and most common assumption in the survey.
Distribution of Investment Return Assumptions 2007 NASRA Survey Data
0 20 40 60
< 7.25%
7.25%
7.50%
7.75%
8.00%
8.25%
8.50%
>8.50%
Inve
stm
ent R
etur
n A
ssum
ptio
n
Number of Plans
20G:\WP\Retire\2009\Opersu\Board Mtgs\20090716 Board Meeting - InvestReturn and demographic assumptions final.pptMercer
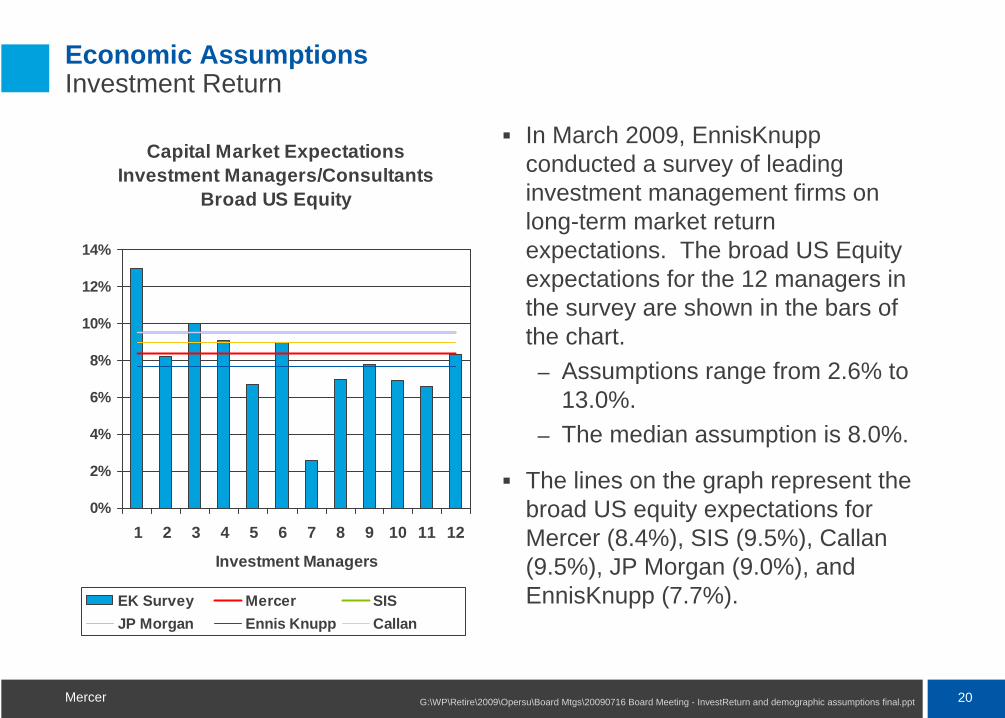
Economic Assumptions Investment Return
Capital Market ExpectationsInvestment Managers/Consultants
Broad US Equity
0%
2%
4%
6%
8%
10%
12%
14%
1 2 3 4 5 6 7 8 9 10 11 12
Investment Managers
EK Survey Mercer SISJP Morgan Ennis Knupp Callan
In March 2009, EnnisKnuppconducted a survey of leading investment management firms on long-term market return expectations. The broad US Equity expectations for the 12 managers in the survey are shown in the bars of the chart.
– Assumptions range from 2.6% to 13.0%.
– The median assumption is 8.0%.
The lines on the graph represent the broad US equity expectations for Mercer (8.4%), SIS (9.5%), Callan(9.5%), JP Morgan (9.0%), and EnnisKnupp (7.7%).
21G:\WP\Retire\2009\Opersu\Board Mtgs\20090716 Board Meeting - InvestReturn and demographic assumptions final.pptMercer
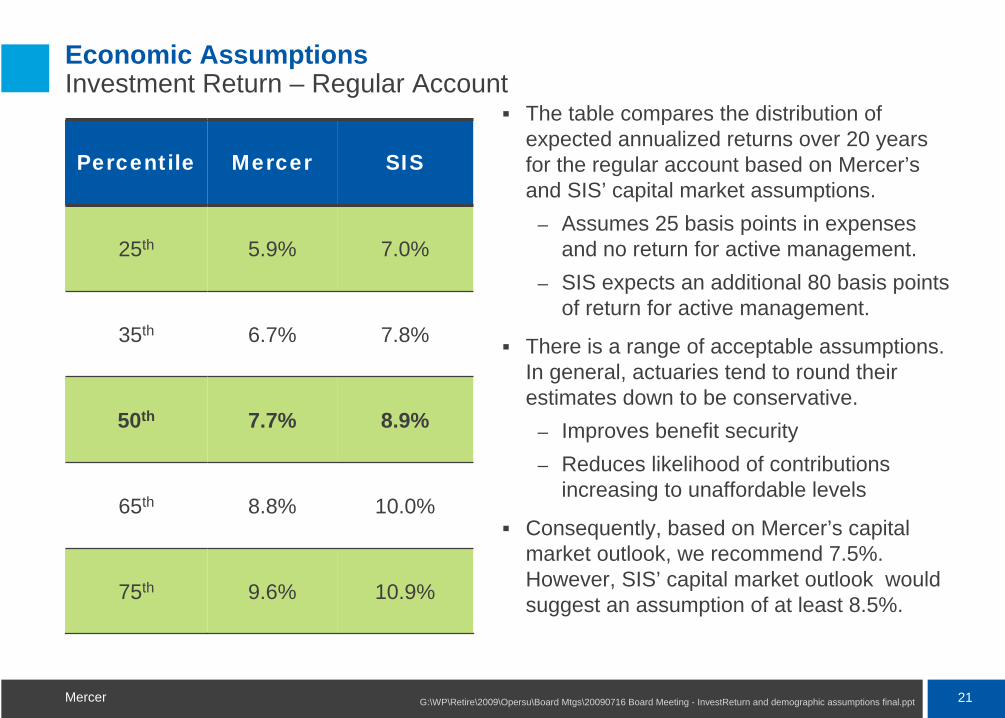
Economic Assumptions Investment Return – Regular Account
The table compares the distribution of expected annualized returns over 20 years for the regular account based on Mercer’s and SIS’ capital market assumptions.
– Assumes 25 basis points in expenses and no return for active management.
– SIS expects an additional 80 basis points of return for active management.
There is a range of acceptable assumptions. In general, actuaries tend to round their estimates down to be conservative.
– Improves benefit security– Reduces likelihood of contributions
increasing to unaffordable levels
Consequently, based on Mercer’s capital market outlook, we recommend 7.5%. However, SIS’ capital market outlook would suggest an assumption of at least 8.5%.
Percentile Mercer SIS
25th 5.9% 7.0%
35th 6.7% 7.8%
50th 7.7% 8.9%
65th 8.8% 10.0%
75th 9.6% 10.9%

Decisions

23G:\WP\Retire\2009\Opersu\Board Mtgs\20090716 Board Meeting - InvestReturn and demographic assumptions final.pptMercer
Estimated Impact of Changes Ignoring Rate Collar
Tier 1/Tier 2 OPSRP RHIA/RHIPA
Normal Cost Rate UAL Rate Normal
Cost Rate UAL Rate Normal Cost Rate UAL Rate
Mortality 0.2% 0.5% 0.2% 0.0% 0.0% 0.0%
Other Demographic Assumptions
0.0% (0.1%) (0.2%) 0.0% 0.0% 0.0%
Economic Assumptions and Methods
0.0% (2.9%) (0.1%) 0.0% 0.0% 0.3%
Total 0.2% (2.5%) (0.1%) 0.0% 0.0% 0.3%
7.5% Assumption 1.5% 1.5% 0.7% 0.0% 0.0% 0.0%
Total 1.7% (1.0%) 0.6% 0.0% 0.0%` 0.3%
Estimated impact is shown on a systemwide basis. The impact from rate pool to rate pool (or among individual independent employers) will vary.
The decrease in the Tier 1/Tier 2 UAL rate is primarily due to the elimination of the 3-year PUC change amortization.
24G:\WP\Retire\2009\Opersu\Board Mtgs\20090716 Board Meeting - InvestReturn and demographic assumptions final.pptMercer
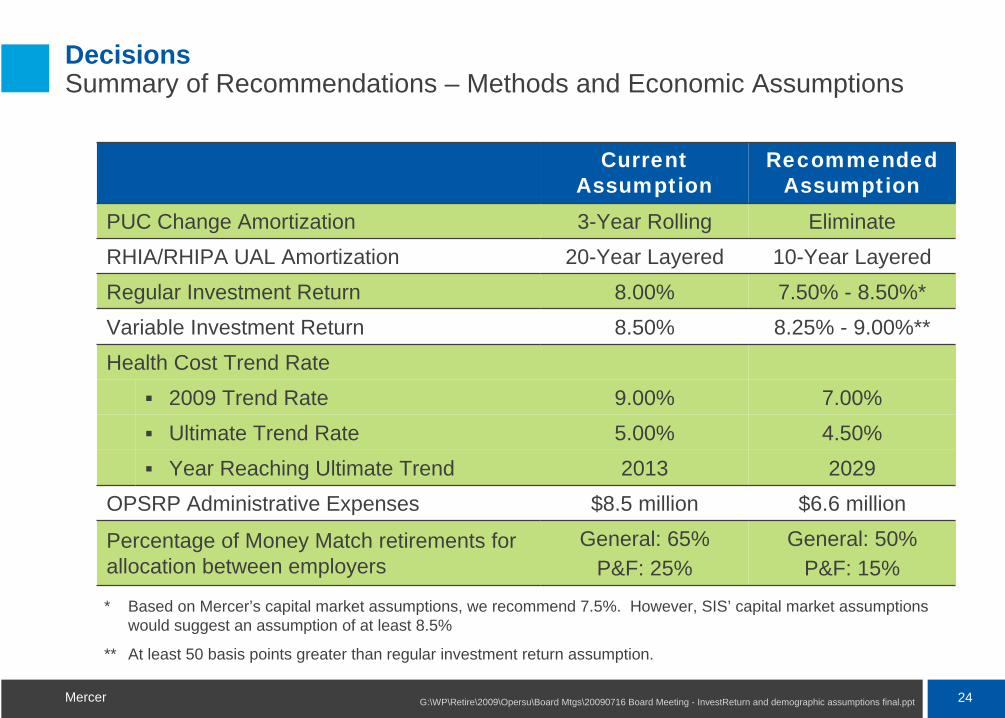
Decisions Summary of Recommendations – Methods and Economic Assumptions
Current Assumption
Recommended Assumption
PUC Change Amortization 3-Year Rolling EliminateRHIA/RHIPA UAL Amortization 20-Year Layered 10-Year LayeredRegular Investment Return 8.00% 7.50% - 8.50%*Variable Investment Return 8.50% 8.25% - 9.00%**Health Cost Trend Rate
2009 Trend Rate 9.00% 7.00%Ultimate Trend Rate 5.00% 4.50%Year Reaching Ultimate Trend 2013 2029
OPSRP Administrative Expenses $8.5 million $6.6 million
Percentage of Money Match retirements for allocation between employers
General: 65%P&F: 25%
General: 50%P&F: 15%
* Based on Mercer’s capital market assumptions, we recommend 7.5%. However, SIS’ capital market assumptions would suggest an assumption of at least 8.5%
** At least 50 basis points greater than regular investment return assumption.

25G:\WP\Retire\2009\Opersu\Board Mtgs\20090716 Board Meeting - InvestReturn and demographic assumptions final.pptMercer
Decisions Summary of Recommendations – Demographic Assumptions
Current Assumption Recommended Assumption
Mortality Static Tables Generational Tables
Retirement 2 Service Levels 3 Service Levels
Merit Salary Increases Ultimate only0% for 2009 and 2010,
then slightly higher ultimate rates
RHIA Participation RateHealthy: 50%Disabled: 25%
Healthy: 42.5%Disabled: 20%
RHIPA Participation Rate 11% 9%
Other demographic changes shown in presentation
26G:\WP\Retire\2009\Opersu\Board Mtgs\20090716 Board Meeting - InvestReturn and demographic assumptions final.pptMercer
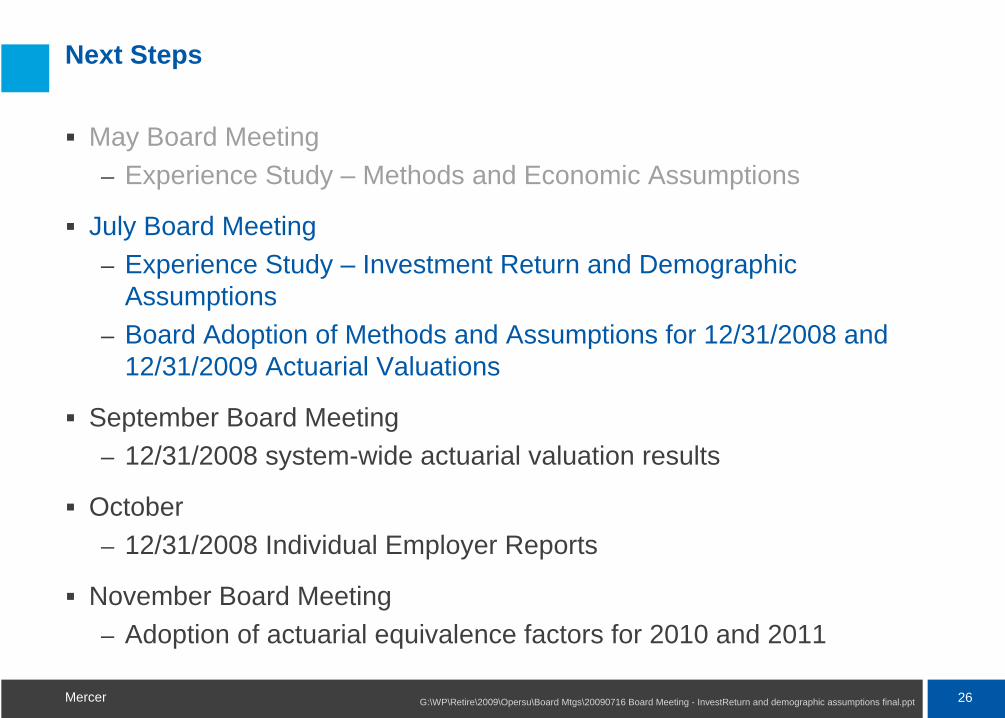
Next Steps
May Board Meeting– Experience Study – Methods and Economic Assumptions
July Board Meeting– Experience Study – Investment Return and Demographic
Assumptions– Board Adoption of Methods and Assumptions for 12/31/2008 and
12/31/2009 Actuarial Valuations
September Board Meeting– 12/31/2008 system-wide actuarial valuation results
October– 12/31/2008 Individual Employer Reports
November Board Meeting– Adoption of actuarial equivalence factors for 2010 and 2011

Appendix
28G:\WP\Retire\2009\Opersu\Board Mtgs\20090716 Board Meeting - InvestReturn and demographic assumptions final.pptMercer
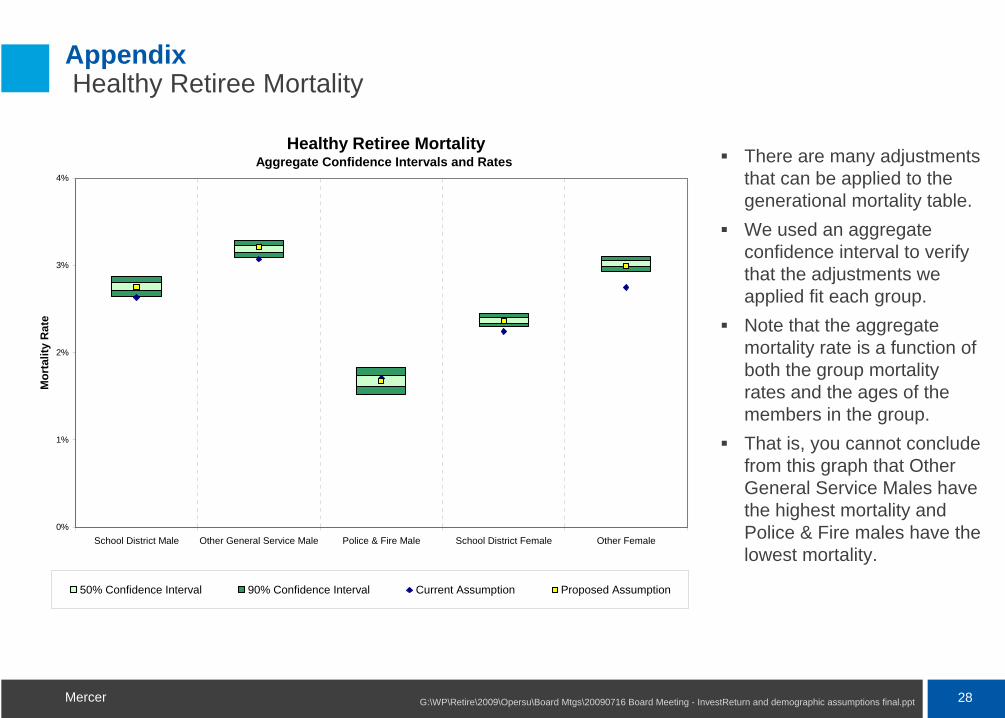
Appendix Healthy Retiree Mortality
There are many adjustments that can be applied to the generational mortality table. We used an aggregate confidence interval to verify that the adjustments we applied fit each group.Note that the aggregate mortality rate is a function of both the group mortality rates and the ages of the members in the group.That is, you cannot conclude from this graph that Other General Service Males have the highest mortality and Police & Fire males have the lowest mortality.
Healthy Retiree Mortality Aggregate Confidence Intervals and Rates
0%
1%
2%
3%
4%
School District Male Other General Service Male Police & Fire Male School District Female Other Female
Mor
talit
y R
ate
50% Confidence Interval 90% Confidence Interval Current Assumption Proposed Assumption

29G:\WP\Retire\2009\Opersu\Board Mtgs\20090716 Board Meeting - InvestReturn and demographic assumptions final.pptMercer
Appendix Disabled Retiree Mortality
Although the current rates fall within the aggregate confidence intervals, we are recommending minor adjustments to the disabled mortality tables to bring the A/E ratios closer to 100% and to better fit the experience by age group.In particular, the proposed mortality rates are lower at younger ages and higher at older ages.
Current Assumption
Recommended Assumption
ExposuresActual Deaths
Expected Deaths A/E Ratio
Expected Deaths A/E Ratio
Male 8,350 350 322 109% 347 101%
Female 8,841 308 325 95% 303 102%
Disabled Retired Mortality Aggregate Confidence Intervals and Rates
0%
1%
2%
3%
4%
5%
Male Female
Mor
talit
y R
ate
50% Confidence Interval 90% Confidence Interval Current Assumption Proposed Assumption
30G:\WP\Retire\2009\Opersu\Board Mtgs\20090716 Board Meeting - InvestReturn and demographic assumptions final.pptMercer
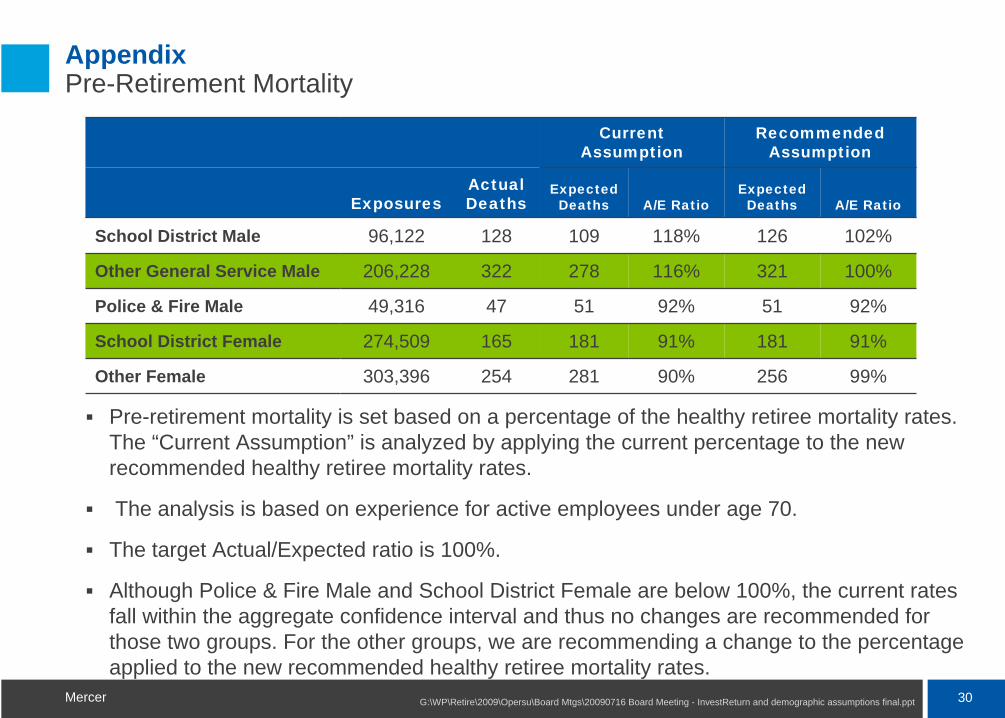
Appendix Pre-Retirement Mortality
Pre-retirement mortality is set based on a percentage of the healthy retiree mortality rates. The “Current Assumption” is analyzed by applying the current percentage to the new recommended healthy retiree mortality rates.
The analysis is based on experience for active employees under age 70.
The target Actual/Expected ratio is 100%.
Although Police & Fire Male and School District Female are below 100%, the current rates fall within the aggregate confidence interval and thus no changes are recommended for those two groups. For the other groups, we are recommending a change to the percentage applied to the new recommended healthy retiree mortality rates.
Current Assumption
Recommended Assumption
ExposuresActual Deaths
Expected Deaths A/E Ratio
Expected Deaths A/E Ratio
School District Male 96,122 128 109 118% 126 102%
Other General Service Male 206,228 322 278 116% 321 100%
Police & Fire Male 49,316 47 51 92% 51 92%
School District Female 274,509 165 181 91% 181 91%
Other Female 303,396 254 281 90% 256 99%

31G:\WP\Retire\2009\Opersu\Board Mtgs\20090716 Board Meeting - InvestReturn and demographic assumptions final.pptMercer
Appendix Pre-Retirement Mortality (continued)
Changes are recommended to School District Male, Other GS Male, and Other Female so the aggregate rate falls within the confidence interval.Note that the aggregate mortality rate is a function of both the group mortality rates and the ages of the members in the group.
Pre-Retirement Mortality Aggregate Confidence Intervals and Rates
0.00%
0.05%
0.10%
0.15%
0.20%
School District Male Other General ServiceMale
Police & Fire Male School District Female Other Female
Mor
talit
y R
ate
50% Confidence Interval 90% Confidence Interval Current Assumption Proposed Assumption

32G:\WP\Retire\2009\Opersu\Board Mtgs\20090716 Board Meeting - InvestReturn and demographic assumptions final.pptMercer
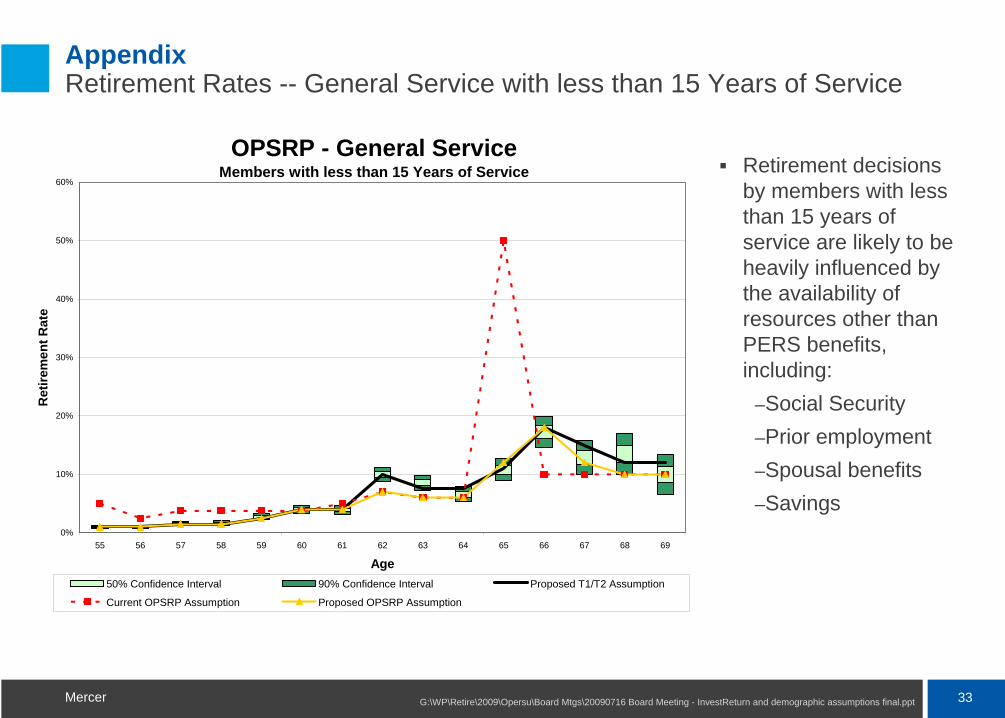
Appendix Retirement Rates -- General Service with less than 15 Years of Service
Retirement decisions by members with less than 15 years of service are likely to be heavily influenced by the availability of resources other than PERS benefits, including:
–Social Security–Prior employment–Spousal benefits–Savings
Tier 1/Tier 2 - Other General Service Members with less than 15 Years of Service
0%
5%
10%
15%
20%
25%
55 56 57 58 59 60 61 62 63 64 65 66 67 68 69
Age
Ret
irem
ent R
ates
50% Confidence Interval 90% Confidence IntervalCurrent T1/T2 Assumption Proposed T1/T2 Assumption
33G:\WP\Retire\2009\Opersu\Board Mtgs\20090716 Board Meeting - InvestReturn and demographic assumptions final.pptMercer
Appendix Retirement Rates -- General Service with less than 15 Years of Service
Retirement decisions by members with less than 15 years of service are likely to be heavily influenced by the availability of resources other than PERS benefits, including:
–Social Security–Prior employment–Spousal benefits–Savings
OPSRP - General ServiceMembers with less than 15 Years of Service
0%
10%
20%
30%
40%
50%
60%
55 56 57 58 59 60 61 62 63 64 65 66 67 68 69
Age
Ret
irem
ent R
ate
50% Confidence Interval 90% Confidence Interval Proposed T1/T2 Assumption
Current OPSRP Assumption Proposed OPSRP Assumption

34G:\WP\Retire\2009\Opersu\Board Mtgs\20090716 Board Meeting - InvestReturn and demographic assumptions final.pptMercer
Appendix Retirement Rates -- General Service with 15 to 29 Years of Service
Retirement decisions by members with 15 to 29 years of service are likely to be influenced by the structure of PERS benefits as well as the availability of other resources, including:
–Social Security–Prior employment–Spousal benefits–Savings
Tier 1/Tier 2 - Other General ServiceMembers with 15 - 29 Years of Service
0%
5%
10%
15%
20%
25%
30%
35%
55 56 57 58 59 60 61 62 63 64 65 66 67 68 69
Age
Ret
irem
ent R
ates
50% Confidence Interval 90% Confidence IntervalCurrent T1/T2 Assumption Proposed T1/T2 Assumption

35G:\WP\Retire\2009\Opersu\Board Mtgs\20090716 Board Meeting - InvestReturn and demographic assumptions final.pptMercer
Appendix Retirement Rates -- General Service with 15 to 29 Years of Service
Retirement decisions by members with 15 to 29 years of service are likely to be influenced by the structure of PERS benefits as well as the availability of other resources, including:
–Social Security–Prior employment–Spousal benefits–Savings
OPSRP - General ServiceMembers with 15 to 29 Years of Service
0%
10%
20%
30%
40%
50%
60%
55 56 57 58 59 60 61 62 63 64 65 66 67 68 69
Age
Ret
irem
ent R
ate
50% Confidence Interval 90% Confidence Interval Proposed T1/T2 AssumptionCurrent OPSRP Assumption Proposed OPSRP Assumption

36G:\WP\Retire\2009\Opersu\Board Mtgs\20090716 Board Meeting - InvestReturn and demographic assumptions final.pptMercer
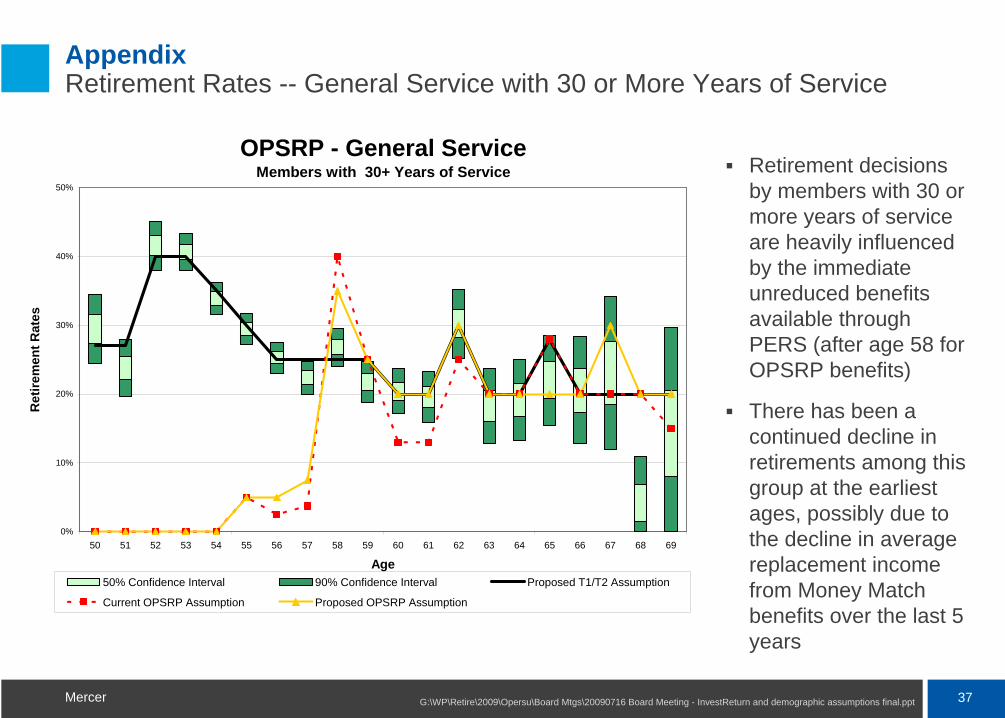
Appendix Retirement Rates -- General Service with 30 or More Years of Service
Retirement decisions by members with 30 or more years of service are heavily influenced by the immediate unreduced benefits available through PERS (after age 58 for OPSRP benefits)
There has been a continued decline in retirements among this group at the earliest ages, possibly due to the decline in average replacement income from Money Match benefits over the last 5 years
Tier 1/Tier 2 - General ServiceMembers with 30+ Years of Service
0%
10%
20%
30%
40%
50%
60%
50 51 52 53 54 55 56 57 58 59 60 61 62 63 64 65 66 67 68 69
Age
Ret
irem
ent R
ates
50% Confidence Interval 90% Confidence IntervalCurrent T1/T2 Assumption Proposed T1/T2 Assumption
37G:\WP\Retire\2009\Opersu\Board Mtgs\20090716 Board Meeting - InvestReturn and demographic assumptions final.pptMercer
Appendix Retirement Rates -- General Service with 30 or More Years of Service
Retirement decisions by members with 30 or more years of service are heavily influenced by the immediate unreduced benefits available through PERS (after age 58 for OPSRP benefits)
There has been a continued decline in retirements among this group at the earliest ages, possibly due to the decline in average replacement income from Money Match benefits over the last 5 years
OPSRP - General ServiceMembers with 30+ Years of Service
0%
10%
20%
30%
40%
50%
50 51 52 53 54 55 56 57 58 59 60 61 62 63 64 65 66 67 68 69
Age
Ret
irem
ent R
ates
50% Confidence Interval 90% Confidence Interval Proposed T1/T2 Assumption
Current OPSRP Assumption Proposed OPSRP Assumption
38G:\WP\Retire\2009\Opersu\Board Mtgs\20090716 Board Meeting - InvestReturn and demographic assumptions final.pptMercer
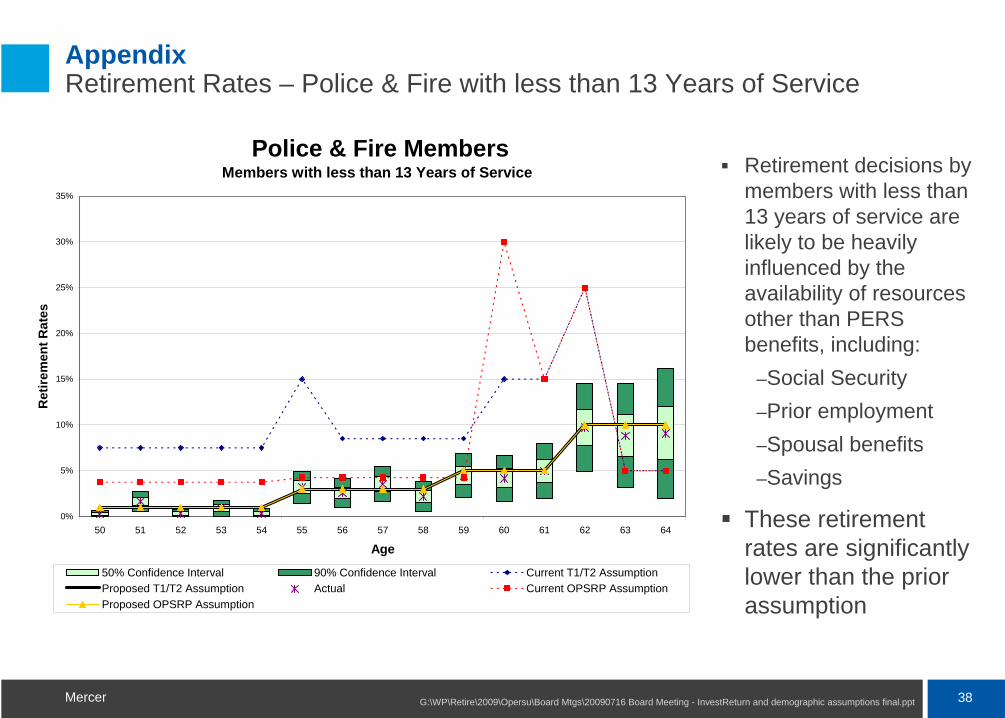
Appendix Retirement Rates – Police & Fire with less than 13 Years of Service
Retirement decisions by members with less than 13 years of service are likely to be heavily influenced by the availability of resources other than PERS benefits, including:
–Social Security–Prior employment–Spousal benefits–Savings
These retirement rates are significantly lower than the prior assumption
Police & Fire MembersMembers with less than 13 Years of Service
0%
5%
10%
15%
20%
25%
30%
35%
50 51 52 53 54 55 56 57 58 59 60 61 62 63 64
Age
Ret
irem
ent R
ates
50% Confidence Interval 90% Confidence Interval Current T1/T2 AssumptionProposed T1/T2 Assumption Actual Current OPSRP AssumptionProposed OPSRP Assumption
39G:\WP\Retire\2009\Opersu\Board Mtgs\20090716 Board Meeting - InvestReturn and demographic assumptions final.pptMercer
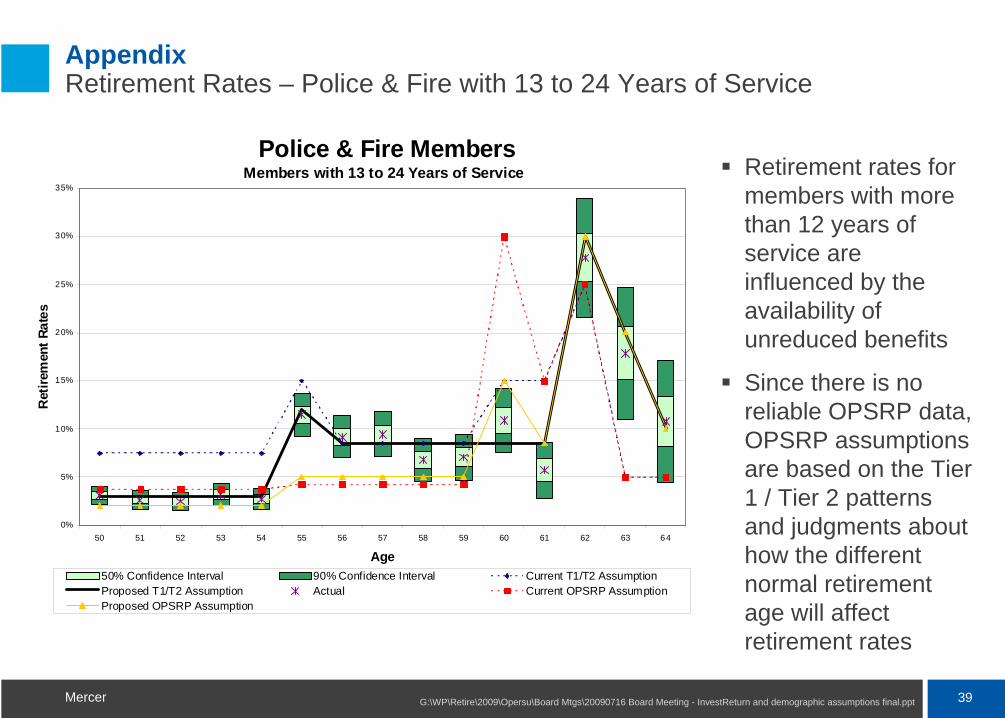
Appendix Retirement Rates – Police & Fire with 13 to 24 Years of Service
Retirement rates for members with more than 12 years of service are influenced by the availability of unreduced benefits
Since there is no reliable OPSRP data, OPSRP assumptions are based on the Tier 1 / Tier 2 patterns and judgments about how the different normal retirement age will affect retirement rates
Police & Fire MembersMembers with 13 to 24 Years of Service
0%
5%
10%
15%
20%
25%
30%
35%
50 51 52 53 54 55 56 57 58 59 60 61 62 63 64
Age
Ret
irem
ent R
ates
50% Confidence Interval 90% Confidence Interval Current T1/T2 AssumptionProposed T1/T2 Assumption Actual Current OPSRP AssumptionProposed OPSRP Assumption
40G:\WP\Retire\2009\Opersu\Board Mtgs\20090716 Board Meeting - InvestReturn and demographic assumptions final.pptMercer
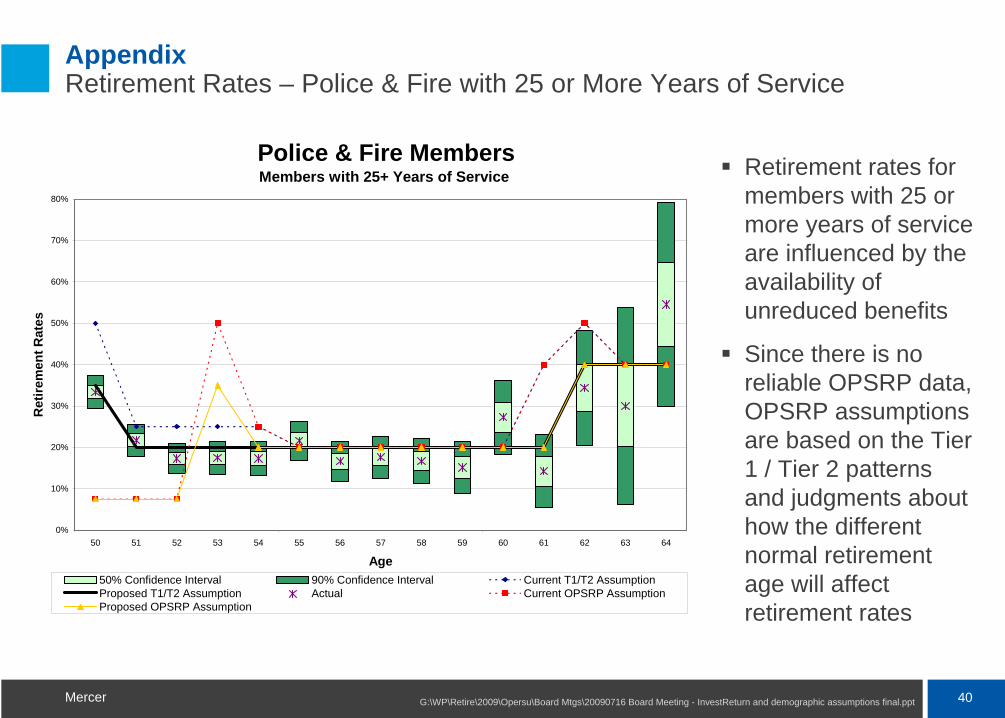
Appendix Retirement Rates – Police & Fire with 25 or More Years of Service
Retirement rates for members with 25 or more years of service are influenced by the availability of unreduced benefits
Since there is no reliable OPSRP data, OPSRP assumptions are based on the Tier 1 / Tier 2 patterns and judgments about how the different normal retirement age will affect retirement rates
Police & Fire MembersMembers with 25+ Years of Service
0%
10%
20%
30%
40%
50%
60%
70%
80%
50 51 52 53 54 55 56 57 58 59 60 61 62 63 64
Age
Ret
irem
ent R
ates
50% Confidence Interval 90% Confidence Interval Current T1/T2 AssumptionProposed T1/T2 Assumption Actual Current OPSRP AssumptionProposed OPSRP Assumption
41G:\WP\Retire\2009\Opersu\Board Mtgs\20090716 Board Meeting - InvestReturn and demographic assumptions final.pptMercer
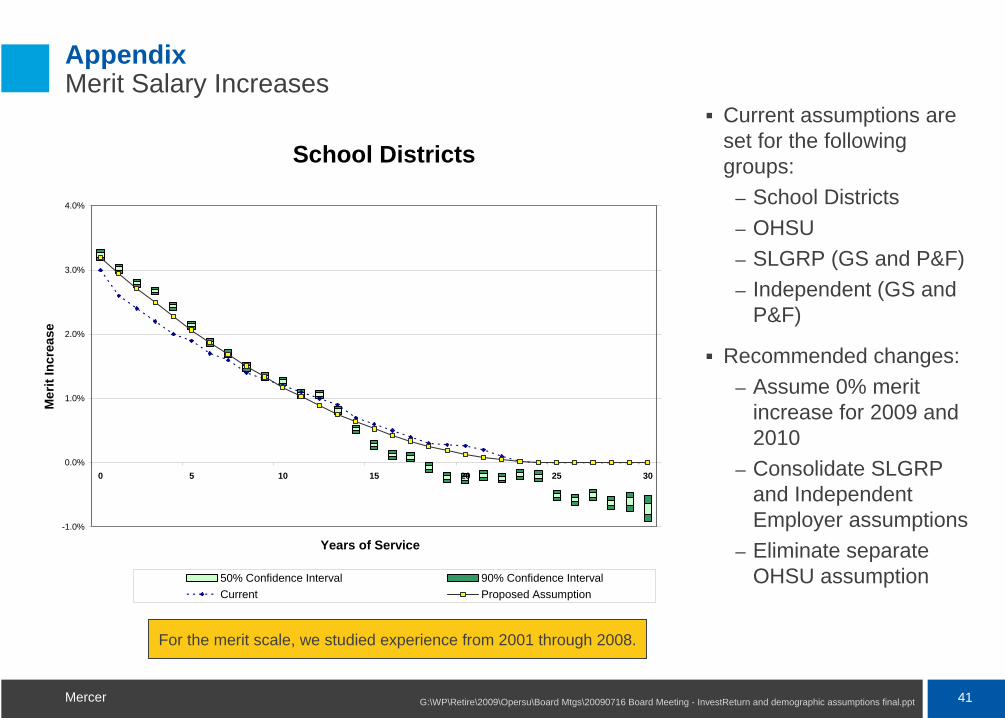
Appendix Merit Salary Increases
Current assumptions are set for the following groups:
– School Districts– OHSU– SLGRP (GS and P&F)– Independent (GS and
P&F)
Recommended changes:– Assume 0% merit
increase for 2009 and 2010
– Consolidate SLGRP and Independent Employer assumptions
– Eliminate separate OHSU assumption
For the merit scale, we studied experience from 2001 through 2008.
School Districts
-1.0%
0.0%
1.0%
2.0%
3.0%
4.0%
0 5 10 15 20 25 30
Years of Service
Mer
it In
crea
se
0.990000
1.000000
1.010000
1.020000
1.030000
1.040000
50% Confidence Interval 90% Confidence IntervalCurrent Proposed Assumption
42G:\WP\Retire\2009\Opersu\Board Mtgs\20090716 Board Meeting - InvestReturn and demographic assumptions final.pptMercer
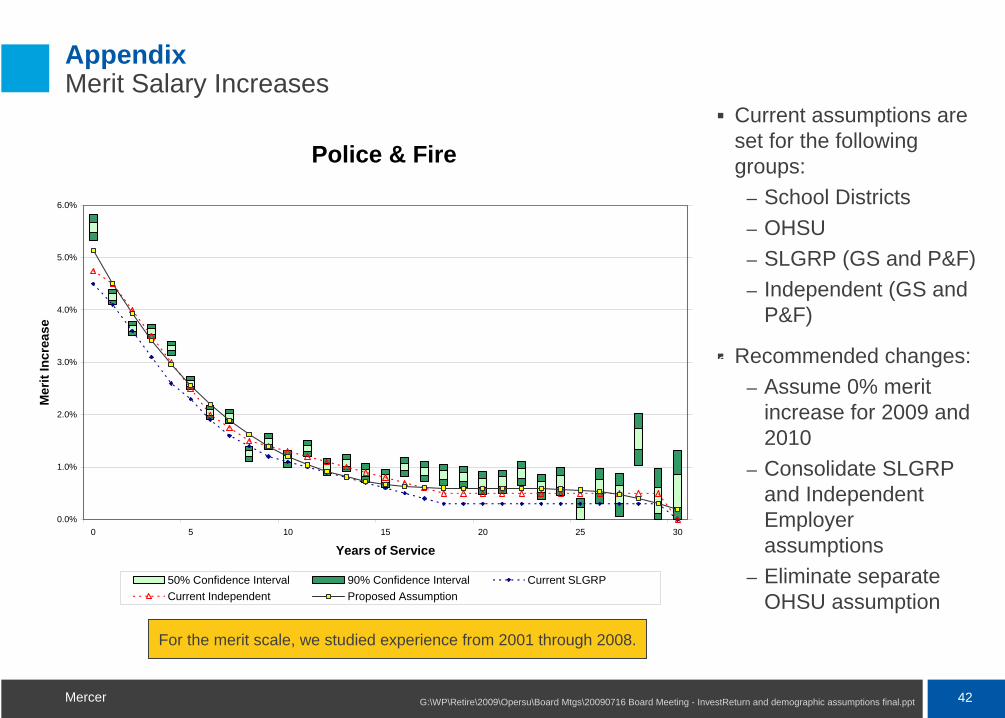
Appendix Merit Salary Increases
Current assumptions are set for the following groups:
– School Districts– OHSU– SLGRP (GS and P&F)– Independent (GS and
P&F)
Recommended changes:– Assume 0% merit
increase for 2009 and 2010
– Consolidate SLGRP and Independent Employer assumptions
– Eliminate separate OHSU assumption
For the merit scale, we studied experience from 2001 through 2008.
Police & Fire
0.0%
1.0%
2.0%
3.0%
4.0%
5.0%
6.0%
0 5 10 15 20 25 30
Years of Service
Mer
it In
crea
se
1.00
1.01
1.02
1.03
1.04
1.05
1.06
50% Confidence Interval 90% Confidence Interval Current SLGRPCurrent Independent Proposed Assumption
43G:\WP\Retire\2009\Opersu\Board Mtgs\20090716 Board Meeting - InvestReturn and demographic assumptions final.pptMercer
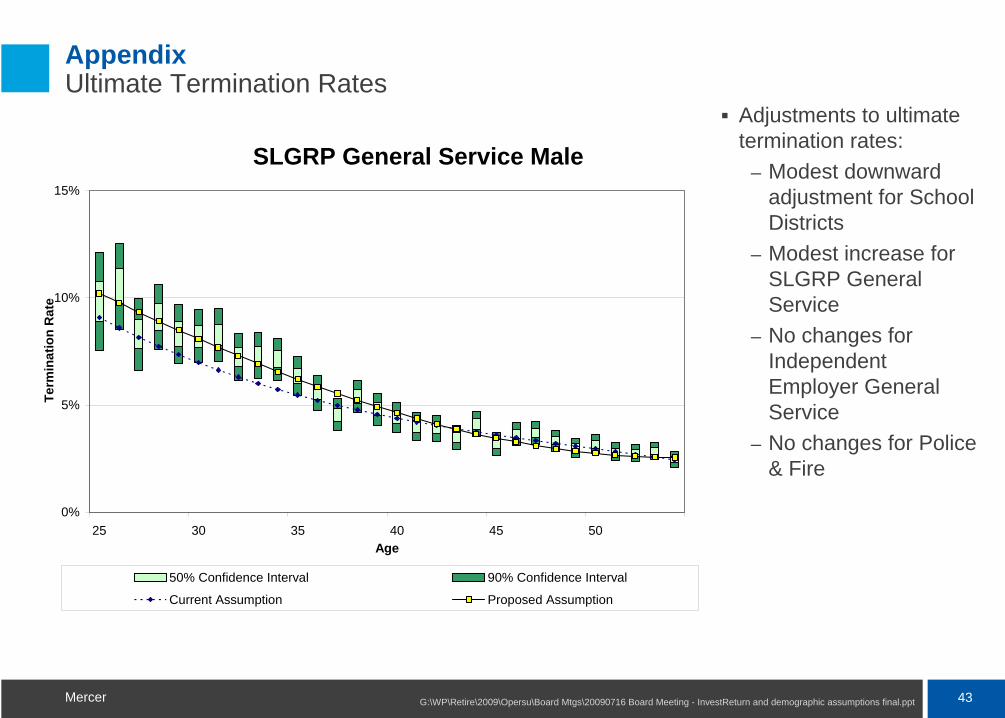
Appendix Ultimate Termination Rates
Adjustments to ultimate termination rates:
– Modest downward adjustment for School Districts
– Modest increase for SLGRP General Service
– No changes for Independent Employer General Service
– No changes for Police & Fire
SLGRP General Service Male
0%
5%
10%
15%
25 30 35 40 45 50Age
Term
inat
ion
Rat
e
50% Confidence Interval 90% Confidence Interval
Current Assumption Proposed Assumption

44G:\WP\Retire\2009\Opersu\Board Mtgs\20090716 Board Meeting - InvestReturn and demographic assumptions final.pptMercer
Appendix Ultimate Termination Rates
Adjustments to ultimate termination rates:
– Modest downward adjustment for School Districts
– Modest increase for SLGRP General Service
– No changes for Independent Employer General Service
– No changes for Police & Fire
SLGRP General Service Female
0%
5%
10%
15%
25 30 35 40 45 50Age
Term
inat
ion
Rat
e
50% Confidence Interval 90% Confidence Invterval
Current Assumption Proposed Assumption

45G:\WP\Retire\2009\Opersu\Board Mtgs\20090716 Board Meeting - InvestReturn and demographic assumptions final.pptMercer
Appendix Ultimate Termination Rates
Adjustments to ultimate termination rates:
– Modest downward adjustment for School Districts
– Modest increase for SLGRP General Service
– No changes for Independent Employer General Service
– No changes for Police & Fire
Independent General Service Male
0%
5%
10%
15%
25-29 30-34 35-39 40-44 45-49 50-54
Age band
Term
inat
ion
Rat
e
50% Confidence Interval 90% Confidence Interval Current Assumption

46G:\WP\Retire\2009\Opersu\Board Mtgs\20090716 Board Meeting - InvestReturn and demographic assumptions final.pptMercer
Appendix Ultimate Termination Rates
Adjustments to ultimate termination rates:
– Modest downward adjustment for School Districts
– Modest increase for SLGRP General Service
– No changes for Independent Employer General Service
– No changes for Police & Fire
Independent General Service Female
0%
5%
10%
15%
25-29 30-34 35-39 40-44 45-49 50-54
Age band
Term
inat
ion
Rat
e
50% Confidence Interval 90% Confidence Interval Current Assumption

47G:\WP\Retire\2009\Opersu\Board Mtgs\20090716 Board Meeting - InvestReturn and demographic assumptions final.pptMercer
Appendix Ultimate Termination Rates
Adjustments to ultimate termination rates:
– Modest downward adjustment for School Districts
– Modest increase for SLGRP General Service
– No changes for Independent Employer General Service
– No changes for Police & Fire
Police & Fire
0%
2%
4%
6%
25 30 35 40 45Age
Term
inat
ion
Rat
e
50% Confidence Interval 90% Confidence Interval Current Assumption

48G:\WP\Retire\2009\Opersu\Board Mtgs\20090716 Board Meeting - InvestReturn and demographic assumptions final.pptMercer
Termination Assumptions 3-Year Select Rates
Select rates for all groups have been reduced to more closely align with recent experience.
Additional details are provided in the full report.

49G:\WP\Retire\2009\Opersu\Board Mtgs\20090716 Board Meeting - InvestReturn and demographic assumptions final.pptMercer
Appendix Duty Disability Incidence
Duty disability rates have declined since the prior study.
With limited experience for all 5-year age bands, we recommend adopting a standard table, adjusted to fit within the aggregate confidence interval.
Duty Disability Incidence Aggregate Confidence Intervals and Rates
0.00%
0.01%
0.02%
0.03%
0.04%
0.05%
0.06%
Police & Fire General Service
Dis
abili
ty R
ate
50% Confidence Interval 90% Confidence Interval Current Assumption Proposed Assumption
50G:\WP\Retire\2009\Opersu\Board Mtgs\20090716 Board Meeting - InvestReturn and demographic assumptions final.pptMercer
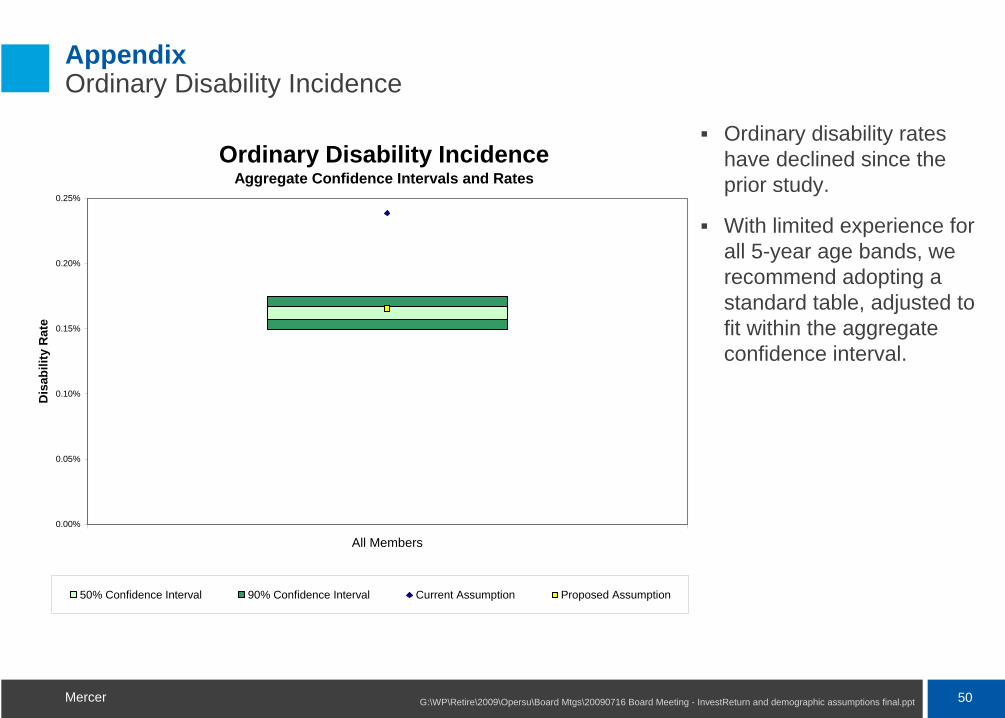
Appendix Ordinary Disability Incidence
Ordinary disability rates have declined since the prior study.
With limited experience for all 5-year age bands, we recommend adopting a standard table, adjusted to fit within the aggregate confidence interval.
Ordinary Disability Incidence Aggregate Confidence Intervals and Rates
0.00%
0.05%
0.10%
0.15%
0.20%
0.25%
All Members
Dis
abili
ty R
ate
50% Confidence Interval 90% Confidence Interval Current Assumption Proposed Assumption

51G:\WP\Retire\2009\Opersu\Board Mtgs\20090716 Board Meeting - InvestReturn and demographic assumptions final.pptMercer
Appendix Unused Sick Leave
Based on recent experience, we recommend adjusting rates for State General Service Female, School District Male, Local General Service Male, State and Local Police & Fire.
Unused Sick Leave
0.00%
1.00%
2.00%
3.00%
4.00%
5.00%
6.00%
7.00%
8.00%
9.00%
10.00%
State GeneralService Male
State GeneralService Female
School DistrictMale
School DistrictFemale
Local GeneralService Male
Local GeneralService Female
State Police &Fire
Local Police &Fire
Rat
e
50% Confidence Interval 90% Confidence Interval Current Assumption Proposed Assumption

52G:\WP\Retire\2009\Opersu\Board Mtgs\20090716 Board Meeting - InvestReturn and demographic assumptions final.pptMercer
Appendix Lump Sum Option at Retirement
When a member elects a partial lump sum at retirement, they receive their account balance and a reduced annuity.
When a member elects a total lump sum at retirement, they receive two times their account balance.
In both cases, the member gives up the value of the COLA on the portion of the annuity they receive in a lump sum.
If the member’s benefit is determined under Full Formula, electing a total lump sum may cause the member to give up a substantial portion of the benefit.
Consequently, the assumption phases out the total lump sum assumption over a period of time reflecting the transition from Money Match to Full Formula benefits.
Lump Sum Election Count
Actual %
Current Assumption
Partial LS 824 6.04% 7.00%
Total LS 1,095 8.03% 7.25%*
Annuity 11,720 85.93% 85.25%*
Total Elections 13,639 100% 100%
Lump Sum Election Recommended Assumption
Partial LS 6% for all years
Total LSNo Change.
6% for 2009, declining by 0.5% per year until reaching 0.0%
* “Total” lump sum elections are assumed to decrease 0.5% per year. Amount shown is the average over the experience study period.
53G:\WP\Retire\2009\Opersu\Board Mtgs\20090716 Board Meeting - InvestReturn and demographic assumptions final.pptMercer
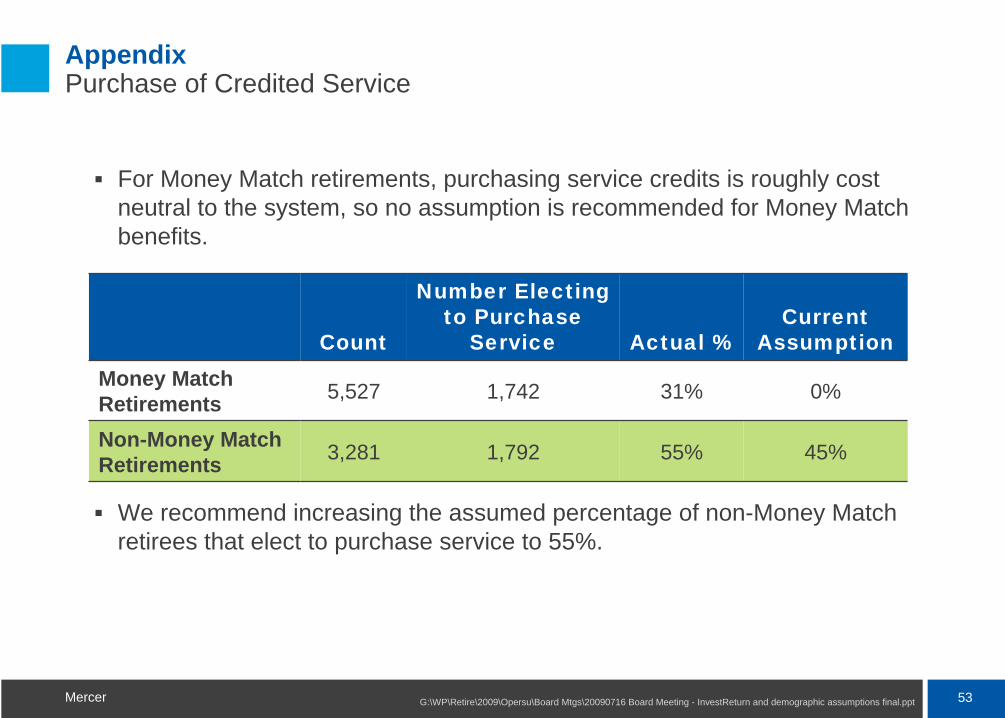
Appendix Purchase of Credited Service
For Money Match retirements, purchasing service credits is roughly cost neutral to the system, so no assumption is recommended for Money Match benefits.
We recommend increasing the assumed percentage of non-Money Match retirees that elect to purchase service to 55%.
Count
Number Electing to Purchase
Service Actual %Current
AssumptionMoney Match Retirements 5,527 1,742 31% 0%
Non-Money Match Retirements 3,281 1,792 55% 45%
54G:\WP\Retire\2009\Opersu\Board Mtgs\20090716 Board Meeting - InvestReturn and demographic assumptions final.pptMercer
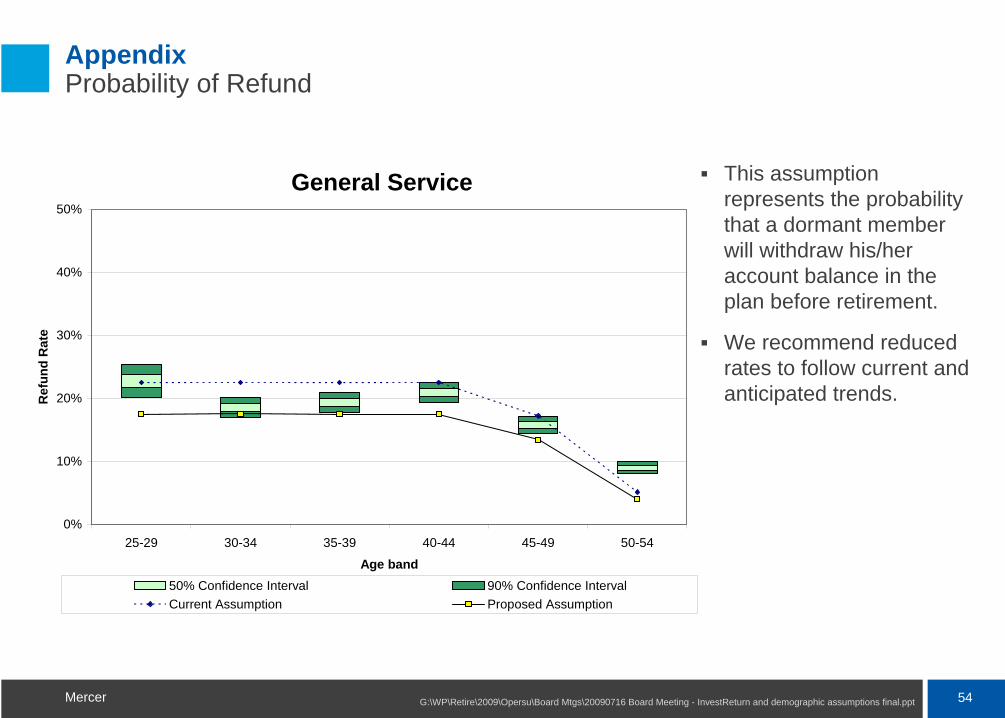
Appendix Probability of Refund
This assumption represents the probability that a dormant member will withdraw his/her account balance in the plan before retirement.
We recommend reduced rates to follow current and anticipated trends.
General Service
0%
10%
20%
30%
40%
50%
25-29 30-34 35-39 40-44 45-49 50-54
Age band
Ref
und
Rat
e
50% Confidence Interval 90% Confidence IntervalCurrent Assumption Proposed Assumption

55G:\WP\Retire\2009\Opersu\Board Mtgs\20090716 Board Meeting - InvestReturn and demographic assumptions final.pptMercer
Appendix Probability of Refund
This assumption represents the probability that a dormant member will withdraw his/her account balance in the plan before retirement.
We recommend reduced rates to follow current and anticipated trends.
Police and Fire
0%
10%
20%
30%
40%
50%
25-29 30-34 35-39 40-44 45-49 50-54
Age band
Ref
und
Rat
e
50% Confidence Interval 90% Confidence IntervalCurrent Assumption Proposed Assumption

www.mercer.com