our school vision - rossmoyneps.wa.edu.au
TRANSCRIPT

1
Rossmoyne Primary School 2019 Annual Report
Our School Vision Together we empower global citizens.

2
Our School Purpose To inspire lifelong learners who strive for personal
excellence and community engagement.

3
Contents
Page
Principal’s Message 4
2019 Student Academic Performance 5
Student Attendance 10
Student Attitude, Behaviour and Effort 10
Our 2018 to 2020 Business Plan 11
Our 2018 to 2020 Business Plan Targets 14
National School Opinion Survey Results 15
Financial Summary 16
Our School Values Integrity Respect Courage Belonging
Integrity……doing the right thing even when no-one is watching.
Respect…...caring for self, others, the community and our environment.
Courage…..facing challenges, showing resilience and doing our personal best.
Belonging…..being an active and valued member of our communities.
4
Principal’s Message
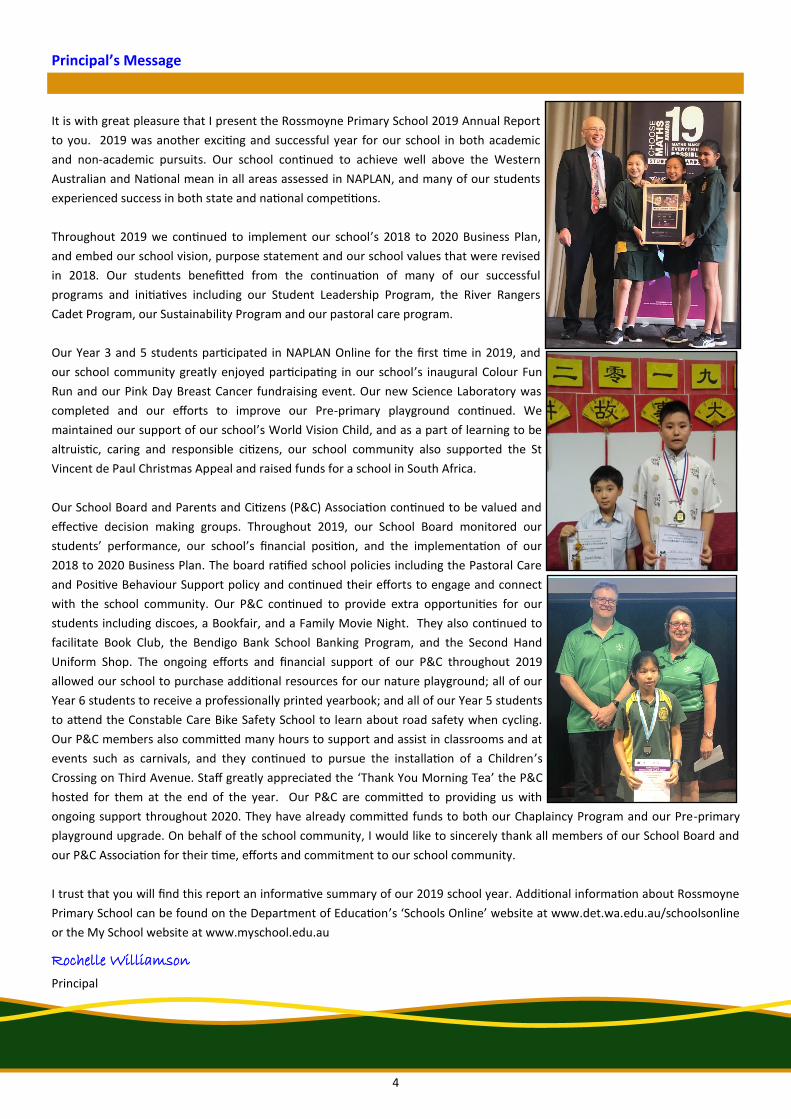
It is with great pleasure that I present the Rossmoyne Primary School 2019 Annual Report
to you. 2019 was another exciting and successful year for our school in both academic
and non-academic pursuits. Our school continued to achieve well above the Western
Australian and National mean in all areas assessed in NAPLAN, and many of our students
experienced success in both state and national competitions.
Throughout 2019 we continued to implement our school’s 2018 to 2020 Business Plan,
and embed our school vision, purpose statement and our school values that were revised
in 2018. Our students benefitted from the continuation of many of our successful
programs and initiatives including our Student Leadership Program, the River Rangers
Cadet Program, our Sustainability Program and our pastoral care program.
Our Year 3 and 5 students participated in NAPLAN Online for the first time in 2019, and
our school community greatly enjoyed participating in our school’s inaugural Colour Fun
Run and our Pink Day Breast Cancer fundraising event. Our new Science Laboratory was
completed and our efforts to improve our Pre-primary playground continued. We
maintained our support of our school’s World Vision Child, and as a part of learning to be
altruistic, caring and responsible citizens, our school community also supported the St
Vincent de Paul Christmas Appeal and raised funds for a school in South Africa.
Our School Board and Parents and Citizens (P&C) Association continued to be valued and
effective decision making groups. Throughout 2019, our School Board monitored our
students’ performance, our school’s financial position, and the implementation of our
2018 to 2020 Business Plan. The board ratified school policies including the Pastoral Care
and Positive Behaviour Support policy and continued their efforts to engage and connect
with the school community. Our P&C continued to provide extra opportunities for our
students including discoes, a Bookfair, and a Family Movie Night. They also continued to
facilitate Book Club, the Bendigo Bank School Banking Program, and the Second Hand
Uniform Shop. The ongoing efforts and financial support of our P&C throughout 2019
allowed our school to purchase additional resources for our nature playground; all of our
Year 6 students to receive a professionally printed yearbook; and all of our Year 5 students
to attend the Constable Care Bike Safety School to learn about road safety when cycling.
Our P&C members also committed many hours to support and assist in classrooms and at
events such as carnivals, and they continued to pursue the installation of a Children’s
Crossing on Third Avenue. Staff greatly appreciated the ‘Thank You Morning Tea’ the P&C
hosted for them at the end of the year. Our P&C are committed to providing us with
ongoing support throughout 2020. They have already committed funds to both our Chaplaincy Program and our Pre-primary
playground upgrade. On behalf of the school community, I would like to sincerely thank all members of our School Board and
our P&C Association for their time, efforts and commitment to our school community.
I trust that you will find this report an informative summary of our 2019 school year. Additional information about Rossmoyne
Primary School can be found on the Department of Education’s ‘Schools Online’ website at www.det.wa.edu.au/schoolsonline
or the My School website at www.myschool.edu.au
Rochelle Williamson
Principal

5
2019 Student Academic Performance
The two assessments mandated by the Department of Education for primary schools in Western Australia
are the On-entry assessments conducted in Term 1 in Pre-primary and the NAPLAN assessments
conducted in May in Years 3 and 5 every year. As in previous years, our students performed very well in
these assessments.
On-entry Assessment
This assessment is primarily a diagnostic tool to determine where our students are at in reading, speaking
and listening, writing and numeracy. Our staff use the results to inform their teaching and learning
programs. The information is also shared with the staff at the Rossmoyne Community Kindy who consider
possible implications for their programs. The tables below show that a greater percentage of our 2019
Pre-primary students achieved higher scale scores than all Pre-primary students in Western Australian
government schools in all assessments.
The Department of Education only requires schools to administer the On-entry assessment at the
beginning of Pre-primary, however, we elect to also assess selected Year One and Two students using the
Year 1 and 2 On-entry assessments that are available. The results of these assessments help to determine
the learning needs of individual children and small groups of students which are then catered for.
READING
Scale Score
RPS
% of students
WA
% of students
0 to 149 0 0
150 to 299 0 2
300 to 449 17 35
450 to 599 83 63
600 to 749 0 0
WRITING
Scale Scores
RPS
% of students
WA
% of students
0 to 149 2 23
150 to 299 77 64
300 to 449 21 11
450 to 599 2 2
600 to 749 0 0
NUMERACY
Scale Score
RPS
% of students
WA
% of students
0 to 149 0 0
150 to 299 0 4
300 to 449 36 61
450 to 599 64 34
600 to 749 0 1
SPEAKING & LISTENING
Scale Score
RPS
% of students
WA
% of students
0 to 149 0 1
150 to 299 0 5
300 to 449 19 32
450 to 599 72 54
600 to 749 9 8
6
2019 Student Academic Performance cont.
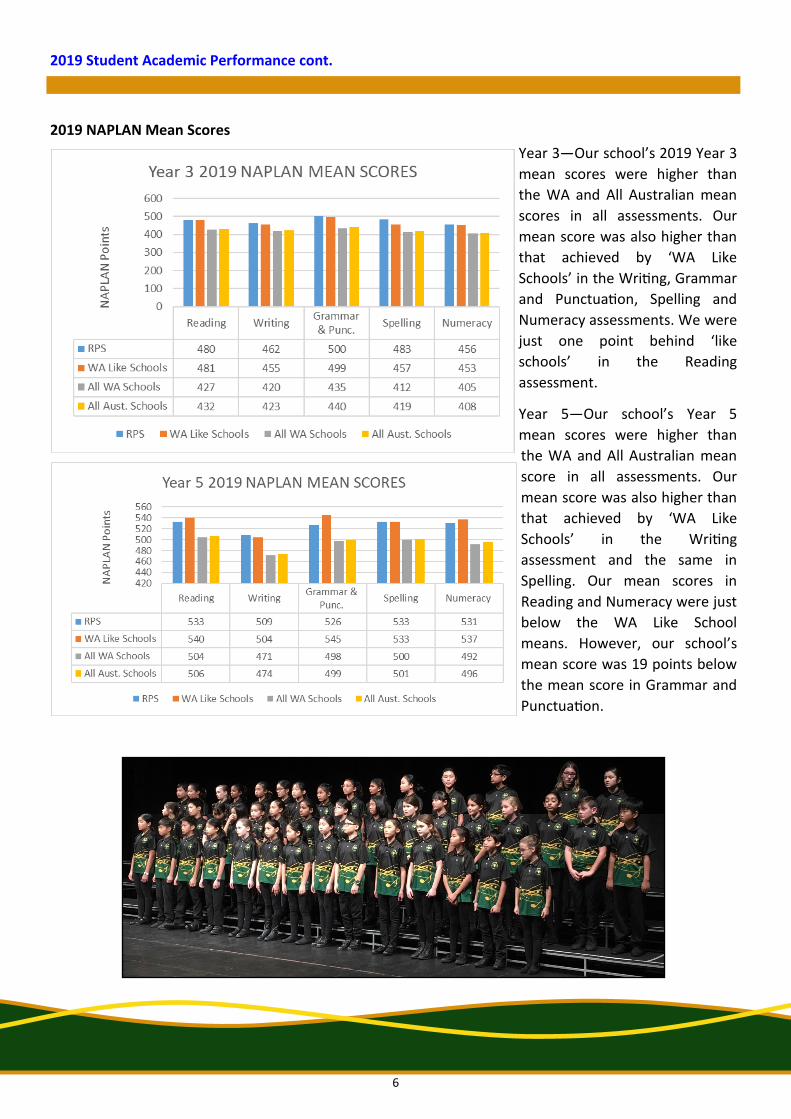
2019 NAPLAN Mean Scores
Year 3—Our school’s 2019 Year 3
mean scores were higher than
the WA and All Australian mean
scores in all assessments. Our
mean score was also higher than
that achieved by ‘WA Like
Schools’ in the Writing, Grammar
and Punctuation, Spelling and
Numeracy assessments. We were
just one point behind ‘like
schools’ in the Reading
assessment.
Year 5—Our school’s Year 5
mean scores were higher than
the WA and All Australian mean
score in all assessments. Our
mean score was also higher than
that achieved by ‘WA Like
Schools’ in the Writing
assessment and the same in
Spelling. Our mean scores in
Reading and Numeracy were just
below the WA Like School
means. However, our school’s
mean score was 19 points below
the mean score in Grammar and
Punctuation.

7
2019 Student Academic Performance cont.
Progress Achieved by our Students Between
Pre-primary (2016) to Year 3 (2019)
The graphs to the right show the progress achieved
by our students who attended Pre-primary at our
school in 2016 and were still attending our school
when the Year 3 NAPLAN assessments were
conducted in 2019. Over 45% of our students
achieved ‘very high’ progress in Numeracy between
Pre-primary to Year 3, as opposed to 30% of students
in ‘WA like schools’. Consequently, we had less
students represented in all other categories. Our
stable cohort of students achieved similar progress to
students in ‘WA like schools’ in the Reading
assessment, but more of our students were
represented in the ‘moderate’ progress and less achieved ‘high’ progress.
(Note – PP to Year 3 Writing progress is not available).
Progress Achieved by our Students Between Year 3
(2017) to Year 5 (2019)
The graphs to the left show the progress achieved by
students who were in Year 3 in 2017 at our school and
were still attending our school when the Year 5 NAPLAN
assessments were conducted in 2019. Our students’
progress was slightly better than that of students in
‘WA like schools’ in Reading and Numeracy. However,
approximately 10% more of our students achieved
‘very low’ progress in Numeracy when compared to
students in ‘WA like schools’.

8
2019 Student Academic Performance cont.
2019 NAPLAN—Performance of Sub-groups of Students in NAPLAN
In addition to interrogating the academic performance of cohorts of students we also monitor the
performance of sub-groups of students to ensure we are catering for their needs, identifying any
developing trends and are providing timely intervention, when needed. These sub-groups include male
students, female students and students from a Language Background Other Than English (LBOTE). The
performance of these sub-groups in 2019 NAPLAN is detailed in the tables below.
The performance of our Year 3
LBOTE (Language Background
Other Than English) students
was similar to that of the full
cohort of students. Some
differences between the
performance of our male and
female students were noted and
are highlighted.
The performance of our Year 5
LBOTE (Language Background
Other Than English) students
was slightly higher than that
achieved by our full cohort of
students in the writing and
numeracy assessments, and
similar in the reading
assessment. Our male and
female students performed
similarly to each other in
writing. However, a discrepancy
in the percentage of male and
female students in reading and
numeracy, is highlighted.
Yr 3 NAPLAN
2019
All Aust. Students
All RPS Students (%)
Male Students (%)
Female Students (%)
LBOTE Students
(%)
Writing Top 20% 60 54 68 65
Middle 60% 39 43 32 32
Bottom 20% 1 3 0 3
Reading Top 20% 32 32 32 38
Middle 60% 61 57 68 62
Bottom 20% 7 11 0 0
Numeracy Top 20% 37 46 24 41
Middle 60% 60 51 72 53
Bottom 20% 3 3 4 6
Yr 5 NAPLAN
2019
All Aust. Students
All RPS Students
(%)
Male Students (%)
Female Students (%)
LBOTE Students
(%)
Writing Top 20% 38 36 39 50
Middle 60% 54 55 53 43
Bottom 20% 8 9 8 7
Reading Top 20% 33 33 34 33
Middle 60% 58 55 60 63
Bottom 20% 9 12 6 4
Numeracy Top 20% 37 42 32 48
Middle 60% 53 52 53 48
Bottom 20% 10 6 15 4

9
2019 Student Academic Performance cont.
The table above shows the performance of our 2018 Year 6 students who were still enrolled in
government schools in Year 7, 2019 and participated in NAPLAN. Our students’ mean score was well
above the WA and ‘All Australian Schools’ mean score in all assessments. This has been the case for many
years which suggests that we are successfully preparing our students for their high school careers.
RPS (Yr 6, 2018) All WA School Mean
All Australian Mean
Numeracy 614 558 554
Reading 586 546 546
Writing 575 542 542
Spelling 583 547 546
Grammar & Punctuation 548 513 513
10
Student Attendance
As expected, our student attendance rate in 2019 was above that
of WA Public Schools and also above that of ‘like schools’.
Our percentage of students
attending regularly was also
higher than that of WA Public
Schools and ‘WA like schools’.
In 2020 we will continue to encourage families to not take
vacations during the school term. We will also continue to
remind families about the importance of arriving at school on
time and providing explanations when their child/ren are
absent.
Student Attitude, Behaviour and Effort
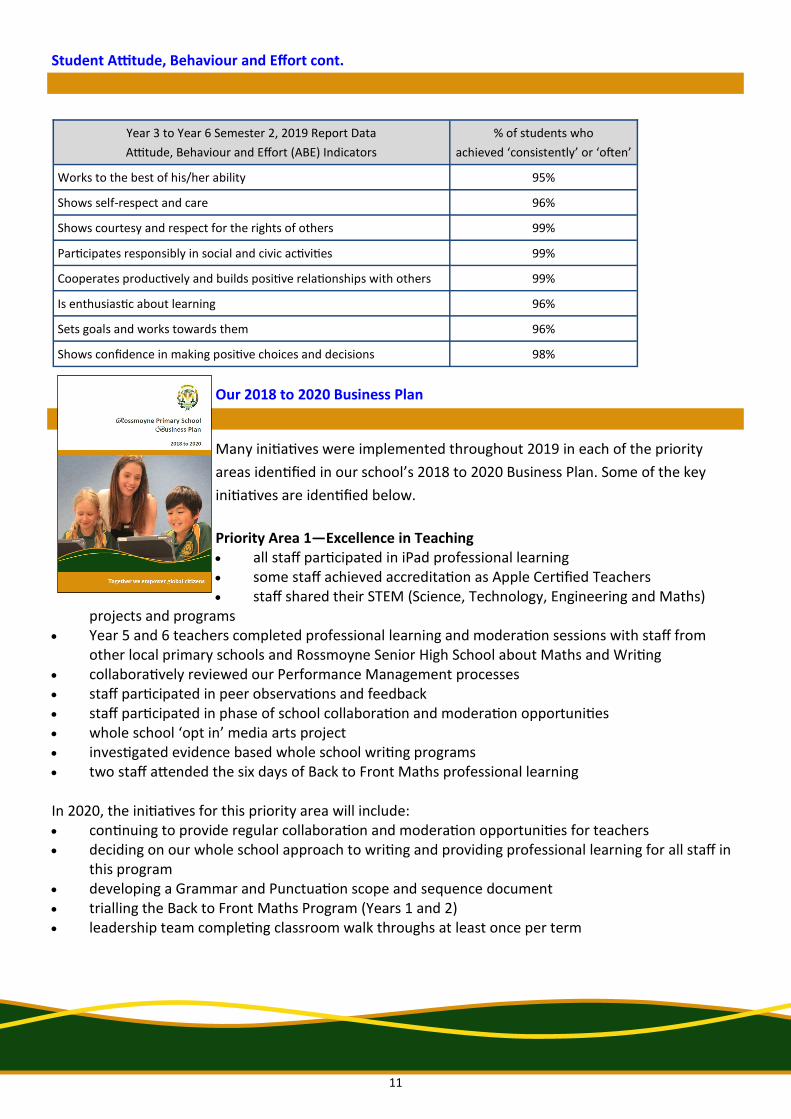
The attitude, behaviour and effort of all students was assessed and reported to parents at the end of each
semester in 2019. The tables below show that a very high percentage of our students demonstrated all of
the attitude, behaviour and effort indicators either ‘consistently’ or ‘often’ when assessed in December
2019. No student suspensions were issued in 2019. These results reflect the high expectations of our
school community.
2019 Attendance Rate
Rossmoyne Primary School 96%
WA Like Schools 94.6%
WA Public Schools 91.6%
2019 Attendance Categories
At Risk
Indicated Moderate Severe Regular
Rossmoyne Primary School 91.6% 7.5% 0.9% 0%
Like Schools 85.1% 12.3% 2.2% 0.4%
WA Public Schools 73% 19% 6% 2%
Pre-primary to Year 2 Semester 2, 2019 Report Data
Attitude, Behaviour and Effort Indicators
% of students who achieved
‘consistently’ or ‘often’
Is enthusiastic about learning 96%
Participates responsibly 98%
Sets goals and works towards them 90%
11
Student Attitude, Behaviour and Effort cont.
Our 2018 to 2020 Business Plan
Many initiatives were implemented throughout 2019 in each of the priority
areas identified in our school’s 2018 to 2020 Business Plan. Some of the key
initiatives are identified below.
Priority Area 1—Excellence in Teaching all staff participated in iPad professional learning some staff achieved accreditation as Apple Certified Teachers staff shared their STEM (Science, Technology, Engineering and Maths)
projects and programs Year 5 and 6 teachers completed professional learning and moderation sessions with staff from
other local primary schools and Rossmoyne Senior High School about Maths and Writing collaboratively reviewed our Performance Management processes staff participated in peer observations and feedback staff participated in phase of school collaboration and moderation opportunities whole school ‘opt in’ media arts project investigated evidence based whole school writing programs two staff attended the six days of Back to Front Maths professional learning In 2020, the initiatives for this priority area will include: continuing to provide regular collaboration and moderation opportunities for teachers deciding on our whole school approach to writing and providing professional learning for all staff in
this program developing a Grammar and Punctuation scope and sequence document trialling the Back to Front Maths Program (Years 1 and 2) leadership team completing classroom walk throughs at least once per term
Year 3 to Year 6 Semester 2, 2019 Report Data
Attitude, Behaviour and Effort (ABE) Indicators
% of students who
achieved ‘consistently’ or ‘often’
Works to the best of his/her ability 95%
Shows self-respect and care 96%
Shows courtesy and respect for the rights of others 99%
Participates responsibly in social and civic activities 99%
Cooperates productively and builds positive relationships with others 99%
Is enthusiastic about learning 96%
Sets goals and works towards them 96%
Shows confidence in making positive choices and decisions 98%

12
2018 to 2020 Business Plan cont.
Priority Area 2—Successful Students continued to support our SAER (Students at Educational Risk) initiatives and differentiation of
curriculum with physical and human resources successfully implemented NAPLAN Online recess and lunch times were adjusted to allow for blocks of literacy and numeracy teaching and
learning time in the mornings all staff participated in a range of PL (Professional Learning) opportunities including PL on reading,
Numero, understanding learning difficulties and using para-professionals effectively selected staff attended professional learning on Whole School Self-Assessment selected staff attended professional learning and have trialled SEN (Special Educational Needs)
planning and reporting GATE (Gifted and Talented Education) Committee continued to meet and attend professional
learning opportunities staff interrogated our 2019 NAPLAN data additional opportunities were provided for students including clubs and a boys’ reading group conducted an extensive review of our SAER (Students at Educational Risk) policy and procedures a range of initiatives were introduced to promote reading and writing to our students applied for grants to upgrade the Pre-primary playground introduced several phase of school scope and sequence documents, approaches and assessment
tools Our 2020 initiatives for this priority area will include: supporting staff to implement the SAER policy promoting the use of SEN planning and reporting for students with special educational needs our school’s GATE Committee to determine our school’s approach to catering for the needs of our
gifted and talented students finalising and commencing implementation of our whole school assessment schedule investigating the Disability Standards for Education online professional learning upgrading the Pre-primary playground continuing to promote whole school and phase of school approaches

13
2018 to 2020 Business Plan cont.
Priority Area 3—Health and Well-being increased our YouthCARE School Chaplaincy Service to 2 days per week funded additional School Psychology Service time continued to participate in the 2018 to 2021 MHiS (Mental Health in Schools) Initiative introduced new Year 3 to 6 student diaries that contain mindfulness, well-being and resiliency suggestions and activities implemented and analysed the results of the BE You Mental Health surveys all staff completed the BE You ‘Responding Together’ modules
whole school celebrations and events for special occasions including Harmony Day, Book Week and Science Week
whole school participation in the National Day of Action Against Bullying and Violence and R U OK? Day
staff implemented opportunities such as share circles and class meetings students participated in buddy and multi age group activities introduced Environmental Advocates to our Student Leadership Team staff participated in health and well-being activities implemented suggestions to reduce staff workload reviewed our Pastoral Care and Positive Behaviour Support policy Student Leadership Team lunches with the Principal Our 2020 initiatives for this priority area will include: professional learning on the SDERA Challenges and Choices resiliency program whole school implementation of the SDERA Challenges and Choices resiliency program support staff to implement the revised Pastoral Care and Positive Behaviour Support policy promotion of our school’s Code of Conduct Priority Area 4—A Connected Community continued to implement the suggestions received at the 2017 ‘Our School, Our Say’ Forum the School Board implemented their Engagement and Connection Plan increased the use of Connect with parents and carers all teachers participated in the Wadjuck Learning Forum promotion of our school vision and purpose statements and our school values formed a Reconciliation Committee to promote our school’s cultural responsiveness increased efforts to engage with the local community and attend local community events Our 2020 initiatives for this priority area will include: developing a new school webpage developing our school’s Reconciliation Action Plan reviewing our Reporting to Parents Policy conducting the National School Opinion Surveys seeking school community input regarding our 2021 to 2023
Business Plan

14
2018 to 2020 Business Plan Targets
The table below identifies the targets for each of the four priority areas in our school’s 2018 to 2020
Business Plan and whether they were achieved in 2019.
PRIORITY AREAS AND TARGETS Achieved Working
Towards
Priority Area 1—Excellence in Teaching
To increase the percentage of teachers who rate themselves as ‘confident’ with planning, teaching
and assessing the WA Curriculum Phase 3 learning areas (Digital and Design Technologies and Media
Arts) introduced in 2018 from 20% in 2018 to 85% by the end of 2020.
To increase the percentage of staff who agree or strongly agree with the statement ‘I receive useful
feedback about my work at this school’ from 69% in 2016 to 80% in the 2020 National School Opinion
Survey.
For all staff to progress at least one level in all five characteristics of the Technology Integration
Matrix by the end of 2020.
Priority Area 2—Successful Students
The percentage of Rossmoyne Primary School students in the top two proficiency bands in all Year 3
and Year 5 NAPLAN assessments to be greater than like WA schools in 2020.
The Numeracy, Reading and Writing NAPLAN trend lines for Year 3 and 5 to be on an incline by 2020.
A schedule that incorporates standardised assessments in non-NAPLAN years will be developed and
implemented by the end of 2020.
Priority Area 3—Health and Well-being
Increase the percentage of students who ‘strongly agree’ or ‘agree’ with the following statements in
the 2020 National School Opinion Survey:
(i) ‘I can talk to my teachers about my concerns’ to increase from 72% (2016) to 82% (2020).
(ii) ‘I feel safe at my school’ from 85% (2016) to 95% (2020).
Increase the percentage of staff who ‘strongly agree’ or ‘agree’ with the following statements in the
2020 Staff Health and Well-being Survey:
(i) ‘I rate my health and well-being as high’ from 63% (2018) to 80% (2020).
(ii) ‘I feel my workload is manageable’ from 44% (2018) to 66% (2020).
(iii) ‘The staff morale at Rossmoyne Primary School is high’ from 36% (2018) to 66% (2020).
Priority Area 4—A Connected Community
Increase the percentage of parents who ‘strongly agree’ or ‘agree’ with the following statements in
the National School Opinion Survey:
(i) ‘This school takes parents’ opinions seriously’ from 69% (2016) to 80% (2020).
(ii) ‘This school works with me to support my child’s learning’ from 61% (2016) to 70% (2020).
Increase the percentage of students who ‘strongly agree’ or ‘agree’ with the statement, ‘My school
takes student opinions seriously’ in the 2020 National School Opinion Survey from 69% (2016) to 80%
(2020).

15
2018 to 2020 Business Plan Targets cont.
National School Opinion Survey Results
Our Year 5 and 6 students, all families and staff were invited to participate in the National School Opinion Survey in August 2018. All of our Year 5 and 6 students participated and 124 parents and 18 staff responded. The results of the survey were pleasing and show that there is overall satisfaction with our school. A thorough analysis was completed by staff and the School Board. The results were also reported to our school community via the school newsletter. Parent Survey Results Strengths: 91% of parents strongly agreed or agreed that their child feels safe at our school. 88% of parents strongly agreed or agreed that that child likes being at our school. 88% of parents strongly agreed or agreed that they can talk to their child’s teacher about their concerns. 87% of parents strongly agreed or agreed that our school is well maintained. 85% of parents strongly agreed or agreed that teachers at our school expect their child to do his or
her best work. Student Survey Results 94% of students strongly agreed or agreed that their teachers expect them to do their best; 83% of students strongly agreed or agreed that our school is well maintained; 83% of students strongly agreed or agreed that their teachers are good teachers; 81% of students strongly agreed or agreed that they feel safe at our school, and 81% of students strongly agreed or agreed that our school looks for ways to improve. Staff Survey Results 100% of staff strongly agreed or agreed that: they expect students to do their best; teachers at our school provide students with useful feedback about their work; teachers at our school treat students fairly; students feel safe at our school; parents at this school can talk to teachers about their concerns; our school looks for ways to improve; teachers at our school motivate students to learn; they are satisfied with the overall standard of education achieved at
our school; they would recommend this school to others; teachers at this school are good teachers; and teachers at this school care about their students. The surveys will be conducted again in Term 2, 2020. The results of this survey will be one source of information considered when the 2021 to 2023 Business Plan is developed.

16
2019 Financial Summary