food consumption patterns in the eastern … food consumption patterns in eastern mediterranean...
TRANSCRIPT

DR.
Food Consumption Patterns in the Eastern Mediterranean RegionRegion

1
Food Consumption Patterns in Eastern Mediterranean Countries
Dr. Abdulrahman Obaid Musaiger
Director of the Arab Center for Nutrition Professor of Nutrition, University of Bahrain
Manama – Bahrain
First Edition, 2011 Arab Center for Nutrition
Manama-Bahrain
1
Food Consumption Patterns in Eastern Mediterranean Countries
Dr. Abdulrahman Obaid Musaiger
Director of the Arab Center for Nutrition Professor of Nutrition, University of Bahrain
Manama – Bahrain
First Edition, 2011 Arab Center for Nutrition
Manama-Bahrain
Food Consumption Patterns in the Eastern Mediterranean RegionRegion

2
2
ISBN No. 978-99901-15-73-4 Public Library No.2011/9011 ع .د
©Copyright 2011 Arab Center for Nutrition Manama - Bahrain
All rights reserved. No part of this publication may be reproduced, stored in a retrieval system or translated in any form or by any means, electronic, photocopying, mimeographing, or otherwise, without prior permission from the Arab Center for Nutrition, Manama, Bahrain.
Published by: Arab Center for Nutrition P.O. Box 26923 Manama – Bahrain Tel: +973-17 343460 Fax: +973-17 346339
www.acnut.com
3
3
CONTENTS
Page SUMMARY 5 1. INTRODUCTION 7 2. AVAILABILITY OF DIETARY MACRONUTRIENT 8
1.1. Availability of Dietary Energy 8 1.2. Protein Availability 10 1.3. Fat 17 1.4. Carbohydrates 21
3. CONSUMPTION OF FOODSTUFS 23
3.1. Cereals and Roots 23 3.2. Meat, Poultry, Fish and Eggs 27 3.3. Red Meat 28 3.4. Poultry Meat 29 3.5. Eggs 30 3.6. Fish 31 3.7. Milk and Dairy Products 36 3.8. Legumes and Nuts 37 3.9. Fruits and Vegetables 40
4. FACTORS DETERMINING FOOD CONSUMPTION PATTERNS IN THE
EMR COUNTRIES 46
4.1. Income 46 4.2. Urbanization 47 4.3. Demographic Changes and Population Growth 48 4.4. The Globalization of the Food Distribution System 49 4.5. Food Price 49 4.6. Improvement in Food Processing 51 4.7. Growing-up of Fast Food Industry, Ready-to-Eat Meals and
Restaurants 51
4.8. Food Subsidy 51 4.9. Migration 53 4.10. Mass Media and Advertisements 54
2
ISBN No. 978-99901-15-73-4 Public Library No.2011/9011 ع .د
©Copyright 2011 Arab Center for Nutrition Manama - Bahrain
All rights reserved. No part of this publication may be reproduced, stored in a retrieval system or translated in any form or by any means, electronic, photocopying, mimeographing, or otherwise, without prior permission from the Arab Center for Nutrition, Manama, Bahrain.
Published by: Arab Center for Nutrition P.O. Box 26923 Manama – Bahrain Tel: +973-17 343460 Fax: +973-17 346339
www.acnut.com

4
4
5. SPECIAL ISSUES RELATED TO FOOD CONSUMPTION IN THE EMR
COUNTRIES 56
5.1. Street Food 56 5.2. Healthy Marketplace 58 5.3. Utilization of Essential Elements 60 5.4. Food Safety 61 5.5. Food Composition Data 65 5.6. Food-Based Dietary Guidelines 68 5.7. Calculating Dietary Intake Using Food Consumption Surveys 72
6. FOOD CONSUMPTION PATTERN AND ITS RELATION TO CHRONIC
DISEASES IN THE EMR COUNTRIES 74
6.1. Obesity and Overweight 74 6.2. Cardiovascular Disease (CVD) 74 6.3. Diabetes 75 6.4. Cancer 76 6.5. Osteoporosis 76 6.6. Anaemia 77
7. CONCLUSION AND RECOMMENDATIONS 81
8. REFRENCES 83
9. APPENDIXES 90
9.1. Daily per capita availability of foods staffs (1990-2005) 90 9.2. Regional projection of population and cereal demand
(millions of tons) 1990-2025 97
9.3. Projected food consumption trends of meat and milk, 1997-2020
98

5
5
SUMMARY
The food consumption pattern has changed dramatically in the Eastern Mediterranean (EMR) countries during the past four decades. An increase in the intake of animal products and a decrease in the intake of fruit and vegetables and complex carbohydrates has been documented during the period 1970-2005. Consequently, the intake of fat, particularly saturated fat and free sugar, has increased, and at the same time the intake of dietary fiber has decreased, with the result that there are increasing risk factors for diet-related non-communicable diseases especially cardiovascular disease, diabetes, obesity and cancer.
Several factors have contributed to this change in food consumption patterns. Among these factors are changes in lifestyle, income, urbanization, demographic changes, food price changes as well as improvements in food processing, food subsidy policies, migration and the influence of the mass media.
The study of food consumption patterns would be incomplete, however, without studying the many issues related to these patterns. Many countries in the Region have a high dependence on street food, with subsequent exposure to the risk of consuming contaminated foods. The interaction between some micronutrients and food components may have a negative effect on the health of people. An effective food control system is essential to the consumption of healthy and safe food. The Region still faces many deficiencies in their food safety systems. The lack of local food composition data is one of the main reasons for inadequacy of measuring nutrient intake. Establishing food-based dietary guidelines for the Region will help the consumer to select healthy and appropriate food.
There is various food consumption patterns in the EMR countries associated with the risks of chronic disease. A low intake of fruit and
4
5. SPECIAL ISSUES RELATED TO FOOD CONSUMPTION IN THE EMR
COUNTRIES 56
5.1. Street Food 56 5.2. Healthy Marketplace 58 5.3. Utilization of Essential Elements 60 5.4. Food Safety 61 5.5. Food Composition Data 65 5.6. Food-Based Dietary Guidelines 68 5.7. Calculating Dietary Intake Using Food Consumption Surveys 72
6. FOOD CONSUMPTION PATTERN AND ITS RELATION TO CHRONIC
DISEASES IN THE EMR COUNTRIES 74
6.1. Obesity and Overweight 74 6.2. Cardiovascular Disease (CVD) 74 6.3. Diabetes 75 6.4. Cancer 76 6.5. Osteoporosis 76 6.6. Anaemia 77
7. CONCLUSION AND RECOMMENDATIONS 81
8. REFRENCES 83
9. APPENDIXES 90
9.1. Daily per capita availability of foods staffs (1990-2005) 90 9.2. Regional projection of population and cereal demand
(millions of tons) 1990-2025 97
9.3. Projected food consumption trends of meat and milk, 1997-2020
98

6
6
vegetables may be associated with some types of cancer. A high intake of energy-dense foods and sugary drinks is associated with obesity. A high intake of saturated fat and salty foods, in addition to a low intake of complex carbohydrates is associated with cardiovascular disease. The increasing prevalence of osteoporosis may be associated in part to low intake of vitamin D and calcium in the Region.
Several recommendations have been suggested to obtain more reliable data on food consumption patterns in the EMR countries.

7
7
1. INTRODUCTION
There are several broad categories of food related to health problems, for which data on food consumption patterns are needed. These related to reproduction, growth and development, chronic diseases, food safety and food insecurity. However, many changes have been occurred that pose challenges for food consumption monitoring: Expansion in new food products on the market, advances in food proceeding and preparation, increased concern in food safety, increase intake of food outside the home, and socio-cultural changes (Pelletier and Habicht, 1994).
Data on food consumption, surveys are useful on determining change in food habits and trends in consumption of various foods in the different geographic locations and between socio-economic groups. Food consumption and dietary habits information are essential for the promotion of nutrition improvement programmes. They are also an important item in policies related to food subsidies, nutrition intervention programmes and nutrition education to prevent and control of nutritional problem.
Changes in food consumption patterns during the past four decades in the Eastern Mediterranean (EMR) countries have had a great impact on the nutritional status of their communities. These changes, together with the change in lifestyle by many people in this region account for the increase in nutrition related chronic diseases. These diseases have become major public health problem and represent more than half of the mortality in most countries of the Region.
This report aims to highlight the food consumption patterns in EMR countries, based on the Food Balance Sheet provided by FAO, as well as to discuss factors associated with food consumption patterns, and special issues related to these patterns in this Eastern Mediterranean Region.
6
vegetables may be associated with some types of cancer. A high intake of energy-dense foods and sugary drinks is associated with obesity. A high intake of saturated fat and salty foods, in addition to a low intake of complex carbohydrates is associated with cardiovascular disease. The increasing prevalence of osteoporosis may be associated in part to low intake of vitamin D and calcium in the Region.
Several recommendations have been suggested to obtain more reliable data on food consumption patterns in the EMR countries.

8
8
2. AVAILABILITY OF DIETARY MACRONUTRIENT
The average data for macronutrients in this section were derived from FAOSTAT, which in turn comes from the National Food Balance Sheet rather than from food consumption surveys. Although such average per capita supplies are derived from National data, they may not correspond to actual per capita availability, which is determined by many other factors such as inequality in access to food. Likewise, these data refer to “average food available for consumption”, which, for a number of reasons (for example, waste at the household level), is not equal to average food intake or average food consumption. In the remainder of this section, therefore, the terms “food consumption” or “food intake” should be read as “food available for consumption” (WHO, 2003).
2.1. Availability of Dietary Energy
The composition of the diet in the EMR countries has changed remarkably over the past four decades. This change has not been equal throughout the Region. High income countries like the GCC countries experienced changes since the early 1980s. In the middle (such as Lebanon, Jordan and Tunisia) and low income (such as Djibouti, Sudan and Yemen) countries, the change during 1980-2005 took two stages: first, the main thrust was towards higher energy supplies whereby additional calories came largely from low cost foodstuffs of plant origin. The second stage saw a shift from consumption of carbohydrate rich foods to animal source foods; this is particularly true in urban areas in these countries.
In general, dietary energy measured in kcals per capita per day has been steadily increasing in all regions of the world. Globally, the percentage increase in per capita energy availability was 19% in 1964 and 1999, from 2358 to 2803 kcal, respectively. The change has not, however, been the same and has varied between regions. The per capita energy available in the Near East and North Africa (which represents all EMR countries) has been increased by 716

9
9
kcal during 1964-1966 and 1997-1999 (Table 1 and Figure 1) and projected to be 880 kcal in 2030.
Table 1: Change in per capita availability of calories (kcal) during 1964-1966 and 2030 (projected) by regions.
Region 1964-1966 Kcal
2030 (projected)
Kcal
Change (kcal)
% Change
Near East and North Africa
2290 3170 880 38.4
Sub-Saharan Africa
2058 2540 482 23.4
Latin America and the Caribbean
2393 3140 747 31.2
East Asia 1957 3190 1233 63.0 South Asia 2017 2900 883 43.8 Industrialized countries
2947 3500 553 18.8
Calculated from WHO (2003)
8
2. AVAILABILITY OF DIETARY MACRONUTRIENT
The average data for macronutrients in this section were derived from FAOSTAT, which in turn comes from the National Food Balance Sheet rather than from food consumption surveys. Although such average per capita supplies are derived from National data, they may not correspond to actual per capita availability, which is determined by many other factors such as inequality in access to food. Likewise, these data refer to “average food available for consumption”, which, for a number of reasons (for example, waste at the household level), is not equal to average food intake or average food consumption. In the remainder of this section, therefore, the terms “food consumption” or “food intake” should be read as “food available for consumption” (WHO, 2003).
2.1. Availability of Dietary Energy
The composition of the diet in the EMR countries has changed remarkably over the past four decades. This change has not been equal throughout the Region. High income countries like the GCC countries experienced changes since the early 1980s. In the middle (such as Lebanon, Jordan and Tunisia) and low income (such as Djibouti, Sudan and Yemen) countries, the change during 1980-2005 took two stages: first, the main thrust was towards higher energy supplies whereby additional calories came largely from low cost foodstuffs of plant origin. The second stage saw a shift from consumption of carbohydrate rich foods to animal source foods; this is particularly true in urban areas in these countries.
In general, dietary energy measured in kcals per capita per day has been steadily increasing in all regions of the world. Globally, the percentage increase in per capita energy availability was 19% in 1964 and 1999, from 2358 to 2803 kcal, respectively. The change has not, however, been the same and has varied between regions. The per capita energy available in the Near East and North Africa (which represents all EMR countries) has been increased by 716

10
10
Energy density is one of the most important qualities of food with regard to both overweight and malnourished persons. If the energy density is low, the food become too bulky, and the person will not be able to eat adequate amounts, and therefore will be susceptible to becoming underweight. At the same time if the energy density is high, the person will consume extra energy and this can lead to overweight (Michaelsen et al, 2009).
The proposed nutrient densities for the family diet depends on the consumption of adequate amounts of energy for adults and adolescents. If intake for adolescents of adults is under 8.4MJ (2000 kcal) per day, it is unlikely that their vitamin and mineral needs will be met (WHO/FAO). Figure (2) shows the per capita availability of energy for 2003-2005 which exceeds 2000 calories in all countries of the Region. About 10 countries reached or almost reached the 3000 calories/person/day. The energy supplies in the EMR countries surged to levels that are giving rise to new concern, as overweight and obesity are becoming one of the main nutritional problems.
2.2. Protein Availability
Dietary protein content and quality are of major importance in the treatment of malnourished children. If the content, quality, or availability is too low, it will limit growth and thereby recovery. If the intake is above the requirement, the surplus protein will be metabolized into energy, which is not an energy-efficient process. At present, no upper limit on protein intake has been set, yet animal and human data suggest that excessive protein intake has an adverse effect on kidney function. Glomerular filtration rates increase acutely in response to protein overload, but long-term hyperfiltration may reduce renal function. The latest American recommendation is to limit total protein intake to twice the RDA (Michaelsen et al, 2009).
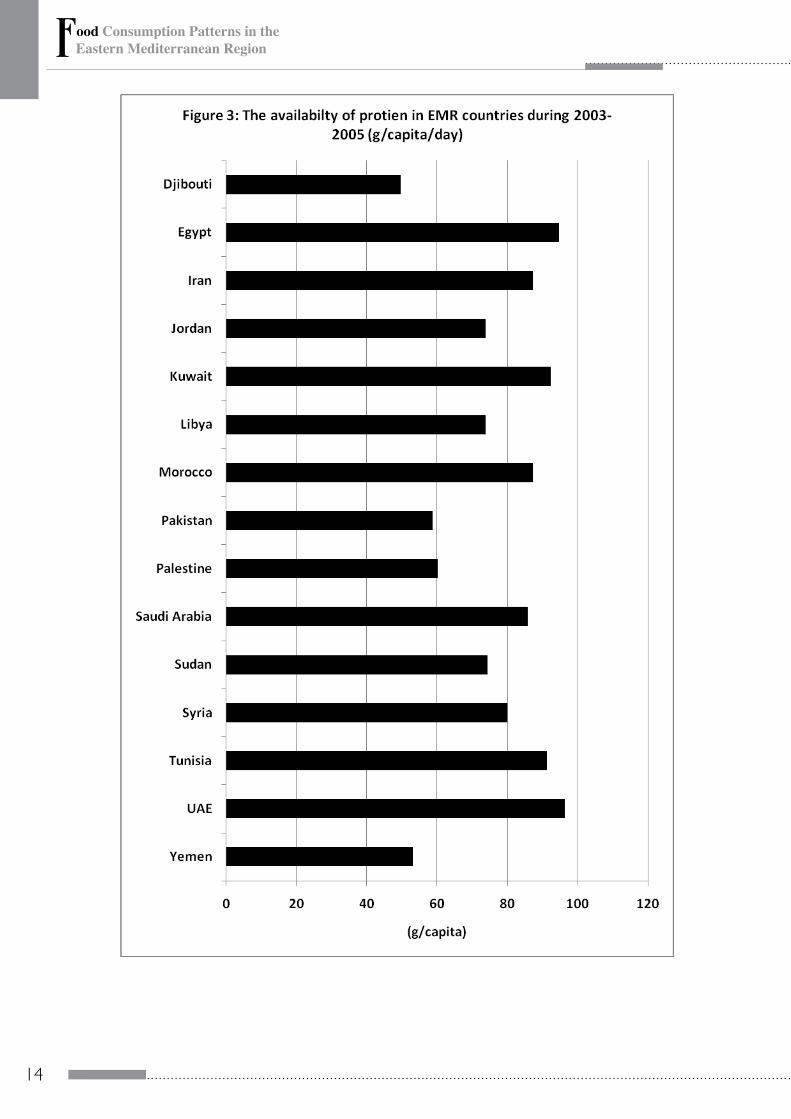
Data in Table (2) indicate that protein per capita daily supply for the period 2003-2005 ranged from 49.7 g/day in Djibouti to 96.4
11
11
g/day in United Arab Emirates. In general, most of the countries in the Region exceed 65g/day of protein, and about 50% of these countries reached more than 80 g/day (Figure 3).
It is well known that animal protein contains all the essential amino acids, and therefore is of a higher quality than plant protein, which has deficiency in one or more of these amino acids. Therefore, the recommendations for protein intake are based on the percentage of animal protein in the diet.
The contribution of protein to the total dietary energy consumption in the EMR countries, ranged from 9% in Djibouti to 13% in Sudan and United Arab Emirates (Table 3). This is close to several food consumption surveys in the Region. For example Esmaillzadeh and Azadbakhr (2008) found that protein in Iranian diet provide 13-14% of total daily energy intake. For high quality proteins, the requirements for most people can be met by providing 8-10% of total energy as protein. For predominantly vegetable-based, mixed diets, which are common in a developing country setting, 10-12% is suggested to account for lower digestibility and increased incidence of diarrhoea diseases. In the case of the elderly, where energy intake is low, protein should represent 12-14% of total energy (WHO, 1998).
10
Energy density is one of the most important qualities of food with regard to both overweight and malnourished persons. If the energy density is low, the food become too bulky, and the person will not be able to eat adequate amounts, and therefore will be susceptible to becoming underweight. At the same time if the energy density is high, the person will consume extra energy and this can lead to overweight (Michaelsen et al, 2009).
The proposed nutrient densities for the family diet depends on the consumption of adequate amounts of energy for adults and adolescents. If intake for adolescents of adults is under 8.4MJ (2000 kcal) per day, it is unlikely that their vitamin and mineral needs will be met (WHO/FAO). Figure (2) shows the per capita availability of energy for 2003-2005 which exceeds 2000 calories in all countries of the Region. About 10 countries reached or almost reached the 3000 calories/person/day. The energy supplies in the EMR countries surged to levels that are giving rise to new concern, as overweight and obesity are becoming one of the main nutritional problems.
2.2. Protein Availability
Dietary protein content and quality are of major importance in the treatment of malnourished children. If the content, quality, or availability is too low, it will limit growth and thereby recovery. If the intake is above the requirement, the surplus protein will be metabolized into energy, which is not an energy-efficient process. At present, no upper limit on protein intake has been set, yet animal and human data suggest that excessive protein intake has an adverse effect on kidney function. Glomerular filtration rates increase acutely in response to protein overload, but long-term hyperfiltration may reduce renal function. The latest American recommendation is to limit total protein intake to twice the RDA (Michaelsen et al, 2009).
Data in Table (2) indicate that protein per capita daily supply for the period 2003-2005 ranged from 49.7 g/day in Djibouti to 96.4

12
12

13
13
Table 2: Availability of Macronutrients in EMR countries during 2003-2005 (per capita/day)
Country Energy
(kcal/capita)
Protein
(g/capita)
Fat
(g/capita)
Djibouti 2218 49.7 66.3
Egypt 3334 94.7 56.4
Iran 3102 87.3 62.8
Jordan 2912 73.8 89.7
Kuwait 3108 92.4 116.2
Libya 3022 73.9 97.1
Morocco 3168 87.4 57.0
Pakistan 2318 58.9 69.4
Palestine 2172 60.2 62.2
Saudi Arabia 3073 85.9 84.8
Sudan 2306 74.5 66.4
Syria 3042 80.1 104.2
Tunisia 3265 91.4 89.7
United Arab Emirates 2923 96.4 74.4
Yemen 2003 53.2 46.7
Source: FAO (2009a)
12
14
14

15
15
Table 3: Source of energy supply in EMR countries during 2003-2005 (per
capita/day).
Country
Vegetable Animal
Kcal Protein
(g/capita)
Fat
(g/capita)
Kcal Protein
(g/capita)
Fat
(g/capita)
Djibouti 1985 35.2 50.2 233 14.5 16.1
Egypt 3078 75.6 38.0 256 19.1 18.4
Iran 2736 63.5 36.1 366 23.8 26.6
Jordan 2598 51.1 68.4 313 22.8 21.3
Kuwait 2451 44.4 69.8 657 47.9 46.5
Libya 2645 46.9 75.1 376 27.0 22.0
Morocco 2939 70.0 41. 6 229 17.3 15.5
Pakistan 1854 35.7 37.1 464 23.1 32.3
Palestine 1897 41.5 43.1 275 18.7 19.0
Saudi Arabia 2630 51.7 56.6 443 34.2 28.2
Sudan 1737 42.8 28.1 568 31.7 38.3
Syria 2596 57.1 69.7 446 23.1 34.5
Tunisia 2920 66.8 68.3 345 24.6 21.3
UAE 2346 52.3 36.7 576 44.1 37.7
Yemen 1824 39.6 34.9 179 13.5 11.8
14

16
16
Table 4: Share (%) of macronutrients in total dietary energy consumption (2003-2005) in EMR countries.
Country Carbohydrate
(%)
Protein
(%)
Fat
(%)
Djibouti 65 9 26
Egypt 73 11 16
Iran 71 11 18
Jordan 62 10 28
Kuwait 56 11 33
Lebanon 57 11 32
Libya 61 10 29
Morocco 72 11 17
Pakistan 63 10 27
Palestine 63 11 26
Saudi Arabia 64 11 25
Sudan 60 13 27
Syria 59 11 30
Tunisia 63 11 26
UAE 63 13 24
Yemen 68 11 21
Animal protein represents 19.8% to 51.8% of total per capita daily supply of protein in the EMR countries (Figure 4). The countries can be divided into three groups regarding animal protein intake: countries with high per capita supply of animal protein (Kuwait, UAE, Saudi Arabia, and Sudan), countries with medium supply (Jordan, Libya, Pakistan and Palestine), and countries with low supply (Djibouti, Egypt, Iran, Morocco, Syria, Tunisia and Yemen). The relatively high supply of per capita protein in Sudan is mainly due to the high numbers of animals, especially cows in the

17
17
country, which makes the meat less expensive compared to many other countries.
2.3. Fat
In general, adults should obtain at least 15% of their energy intake from dietary fats and oils. Women of childbearing age should obtain at least 20% to better ensure an adequate intake of essential fatty acids, needed for foetal and infant brain development. Active individuals who are not obese may consume up to 35% fat energy, as long as saturated fatty acids do not exceed 10% of energy intake. Sedentary individuals should limit fat not more than 30% of energy intake. Saturated fatty acids should be limited to less than 10% of intake (WHO, 1998).
Data from food balance sheets indicates that the per capita daily supply of fat is high in most EMR countries. Excluding Yemen, all the countries reached about 60 g/fat/day and 7 countries exceeded 80g/fat/day (Table 2, Figure 5). The per capita daily availability of fat represents 16% to 33% of total available energy (Table 4). However, the source of fat is the main issue in this matter. Animal fat represents 22.7% to 57.7% of total daily available fat (Figure 6). Five countries (Iran, Kuwait, Pakistan, Sudan and UAE) exceed 40%. Excessive intake of animal fat is associated with cardiovascular disease and diabetes. The WHO (2003) recommended that saturated fat should not exceed 10% of total energy intake. Data from various nutrition surveys in the Region has shown that the intake of saturated fat is very high, even in the countries with a relatively low daily supply of fat (Musaiger, 2002).
16
Table 4: Share (%) of macronutrients in total dietary energy consumption (2003-2005) in EMR countries.
Country Carbohydrate
(%)
Protein
(%)
Fat
(%)
Djibouti 65 9 26
Egypt 73 11 16
Iran 71 11 18
Jordan 62 10 28
Kuwait 56 11 33
Lebanon 57 11 32
Libya 61 10 29
Morocco 72 11 17
Pakistan 63 10 27
Palestine 63 11 26
Saudi Arabia 64 11 25
Sudan 60 13 27
Syria 59 11 30
Tunisia 63 11 26
UAE 63 13 24
Yemen 68 11 21
Animal protein represents 19.8% to 51.8% of total per capita daily supply of protein in the EMR countries (Figure 4). The countries can be divided into three groups regarding animal protein intake: countries with high per capita supply of animal protein (Kuwait, UAE, Saudi Arabia, and Sudan), countries with medium supply (Jordan, Libya, Pakistan and Palestine), and countries with low supply (Djibouti, Egypt, Iran, Morocco, Syria, Tunisia and Yemen). The relatively high supply of per capita protein in Sudan is mainly due to the high numbers of animals, especially cows in the

18
18

19
19
18

20
20

21
21
2.4. Carbohydrates
Carbohydrates are the main source of energy in the diet (55-75%) for most people. Most dietary carbohydrates come from plant origins and include sugars, oligosaccharides, starch and dietary fiber. Carbohydrates represent 56% to 73% of total per capita energy available in the EMR countries (Table 4). This is within the range of WHO (2003) recommendation.
Sugars usually increase the acceptability and energy density of the diet and total sugar intake is often inversely related to total fat intake. Moderate intakes of sugar are compatible with a varied and nutritious diet. Sugar available for consumption during 2003-2005 in EMR countries was found to be high in Egypt and Pakistan (200g and 150g/person/day, respectively). The sugar available in other countries ranged between 55g to 120g/person/day (Figure 7).
Sugar is either consumed as sweetener (especially sugar beverages), or in the form of manufactured sugar-containing foods such as cakes, biscuits and confectionery. The high per capita availability of sugar in Egypt and Pakistan is partially attributed to the high intake of sweetened tea in these countries.
WHO (2003) reported that frequent consumption of sugar and other fermentable carbohydrates throughout the day increases the cariogenic risk potential of the diet, especially in the absence of reasonable oral hygiene practices. On the other hand, reduction of sugar intake plays a minor role in caries prevention where fluoridation and hygienic measures have been taken. Dental caries is a problem of concern particularly among school children in all countries of the Region. Therefore, special attention should be taken to the frequently intake of sweety-foods and beverages, as well as oral hygiene practices.
20

22
22

23
23
3. CONSUMPTION OF FOODSTUFS
3.1. Cereals and Roots
In EMR countries, cereals consumed are mainly wheat, rice and maize while the roots are mainly potatoes, and in some African Arab countries, cassava. These cereals and roots all have carbohydrates as their main macronutrients. They are starches, complex carbohydrates or chain of simple sugars-linked together (Hark and Deen, 2005).
Most cereals consumed in the Region are refined-based, which means they contain low fiber and limited nutrients. In addition, processing makes the starch more readily available to the digestive system. Mineral content decreases with the refining process, and the contents of dietary fiber, protein and fat also decrease significantly. The extraction rate of potassium and magnesium in whole-wheat flour, for example, is typically 85%, whereas white flour has an extraction rate of about 60%. In white flour, most of the fiber is lost (Michaelsen et al, 2009).
Excluding, Europe, and North America EMR countries have the highest cereals consumption in the World. It was estimated that the per capita consumption of cereal in the Region in 1990 was 386 kg in 2025 (Appendix 1). However, levels of per capita cereal consumption will not constant. Rising income will increase levels of consumption in some countries, although in others, health concerns about eating meat could reduce level of per capita intake (Dyson, 1999). Data from Food Balance Sheet (FAO, 2009) showed that the daily availability of cereals has increased in six countries (Djibouti, Kuwait, Lebanon, Morocco, Saudi Arabia and UAE) during 1990-1992 and 2003-2005 and decreased in the rest
22

24
24
of countries. The highest proportion of increase was reported in Kuwait (35%), followed by Djibouti (28.7%) and UAE (26.7%) (Appendix 2).
Cereal availability for daily supply during 2003-2005 is high in Egypt, Iran, Morocco and Tunisia which exceeds 500g/person/day. These countries are the main cereal producers in the Region. The daily per capita availability of cereals was below 400 g in Djibouti, Kuwait, Lebanon, Pakistan, Palestine, Sudan and Yemen (Figure 8). The food consumption survey in urban Lebanon, showed that cereals contributed 324.5 g/day, providing 35% of daily energy intake, with bread being the most highly consumed (146 g/day) in this food group (Nasreddine et al, 2006).
Roots primarily provide energy in the human diet in the form of carbohydrates. In low-income countries, the main nutritional value of roots is their potential ability to provide one of the cheapest sources of energy in the form of carbohydrates. Both protein and fat content is very low. The daily per capita supply of roots does not exceed 50g in 8 countries in the Region, and does not exceed 100g/day, except in Iran, Lebanon and Morocco. The per capita availability of root was the highest in Lebanon (200 g/person/day) (Figure 9). There is no specific explanation for this, possibly the intake of potatoes is high. In general, the contribution of roots to daily energy availability is low in most countries of the Region.

25
25
24
of countries. The highest proportion of increase was reported in Kuwait (35%), followed by Djibouti (28.7%) and UAE (26.7%) (Appendix 2).
Cereal availability for daily supply during 2003-2005 is high in Egypt, Iran, Morocco and Tunisia which exceeds 500g/person/day. These countries are the main cereal producers in the Region. The daily per capita availability of cereals was below 400 g in Djibouti, Kuwait, Lebanon, Pakistan, Palestine, Sudan and Yemen (Figure 8). The food consumption survey in urban Lebanon, showed that cereals contributed 324.5 g/day, providing 35% of daily energy intake, with bread being the most highly consumed (146 g/day) in this food group (Nasreddine et al, 2006).
Roots primarily provide energy in the human diet in the form of carbohydrates. In low-income countries, the main nutritional value of roots is their potential ability to provide one of the cheapest sources of energy in the form of carbohydrates. Both protein and fat content is very low. The daily per capita supply of roots does not exceed 50g in 8 countries in the Region, and does not exceed 100g/day, except in Iran, Lebanon and Morocco. The per capita availability of root was the highest in Lebanon (200 g/person/day) (Figure 9). There is no specific explanation for this, possibly the intake of potatoes is high. In general, the contribution of roots to daily energy availability is low in most countries of the Region.

26
26

27
27
3.2. Meat, Poultry, Fish and Eggs
Animal source foods such as meat, poultry, fish and eggs, provide a variety of important nutrients not easy obtained from plant foods, particularly bioavailable iron, zinc, vitamin B12 and lysine.
Globally, livestock production is growing rapidly, which is interpreted as a result of the increasing demand for animal products. Although there is a large rise in global livestock production, the pattern of consumption is very uneven. The countries that consume the least amount of meat are in Africa and South Asia. The main determinant of per capita meat consumption appears to be wealth. Overall, there has been a rise in the production of livestock products and this is expected to continue in the future. This is particularly the case in developing countries. The greatest increase is in the production of poultry, eggs and milk. However, this overall increase obscures the fact that the increased supply is restricted to certain countries and regions, and is not occurring in the poorer African countries (Delgado, 2003; Speedy, 2003).
The calories available from livestock products are increasing all over the world. The growth is highest in Latin America, followed by East Africa. In the Near East/North Africa Region the calorie availability from animal products has increased over the past 40 years (1962-1998) from 215 to 261 kcal/person/day, and is projected to reach 362 kcal in 2030 (Table 5).
26

28
28
Table 5: Calorie availability from livestock products**
1962* 1970* 1980* 1990* 1998* 2015 2030
Calories per person and day
World 281 301 321 351 380 397 438 Industrialized Countries
670 725 759 779 786 824 847
Developing countries 117 133 165 214 284 345 393 Sub-Saharan Africa 106 112 125 115 108 120 138 Latin America 315 333 394 391 468 550 633 Near East/North Africa
215 220 278 264 261 312 362
East Asia 57 88 124 218 360 460 527 South Asia 113 106 118 158 185 247 314
Transition countries 525 616 764 748 568 628 658
* 3-year average centred on the year indicated **meats, eggs, milk and dairy products (excluding butter and fish) Source: Bruinsma (2003)
3.3. Red Meat
The word “meat” refers to skeletal muscle and related fat. Muscle tissue has a very high content of protein, about 20% in fresh and 80% in dried meat. Its protein contains all of the essential amino acids, it contains good amount of iron and zinc. Furthermore, it contains “the meat factor”, which enhances nonheme iron absorption. Meat contains no fiber, has a negligible content of carbohydrates, and has a relatively high content of fat. However, the fat content of meat can vary, depending on the type of animal and how it was raised, the feed, and the part of the body. Game meat is typically leaner than meat from farm animals and has a more favorable fatty acid composition, with more n-3 fatty acids (Hark and Deen, 2005; Michaelsen et al, 2009).
In the EMR countries, the red meat availability for consumption has slightly increased during 1990-92 to 2003-05 in six countries, with a range from 2.2% in Djibouti to 9% in Syria. Lebanon and

29
29
Sudan were an exception, as the red meat available for consumption increased by 76.6% and 30.6%, respectively. Eight countries in the region showed a decline in the availability of meat, with a decrease of 6.3% in Saudi Arabia to 42.9% in Palestine (Appendix 2). Part of this decrease may be due to increase in nutrition awareness regarding the health effect of high consumption of red meat. This may be also true in Kuwait and Saudi Arabia. Another explanation is related to the high price of red meat. This can be applied to Palestine, Jordan and Morocco.
In general, the per capita availability of red meat during 2003-2005 is the highest in UAE, Lebanon, Sudan and Kuwait, where the daily per capita availability exceeded 60 g, and in UAE exceeded 80g. Yemen and Palestine showed the lowest availability with about 20 g/person/day (Figure 10). In general, red meat is consumed less on a daily basis compared to poultry. In Bahrain, only 5.2% and 1.5% of adult males and females consumed red meat daily (Musaiger et al, 2005a). The corresponding proportions in UAE were 4.2% and 1.9% for men and women respectively (Musaiger, 2000). In Oman, about 1% of women reported eating red meat daily (Musaiger et al, 2005b). However, the National Survey in Sudan indicated a high intake of red meat with about 24% of adults consuming it daily (MOH, 1997).
3.4. Poultry Meat
In contrast to red meat, the availability of poultry meat for consumption showed a remarkable increase in all countries of the region during 1990-92 and 2003-05. This increase ranged from 14.6% in Libya to 15.4% in Yemen (Appendix 2). Data in Figure 11, indicated, a high per capita availability of meat of poultry in Kuwait, UAE and Saudi Arabia, where the daily per capita availability during 2003-2005 exceed 100 g. In Kuwait, the figure exceeds 150g. The availability in Sudan, Pakistan and Djibouti is very low and almost negligible (Figure 10). In general, although
28
Table 5: Calorie availability from livestock products**
1962* 1970* 1980* 1990* 1998* 2015 2030
Calories per person and day
World 281 301 321 351 380 397 438 Industrialized Countries
670 725 759 779 786 824 847
Developing countries 117 133 165 214 284 345 393 Sub-Saharan Africa 106 112 125 115 108 120 138 Latin America 315 333 394 391 468 550 633 Near East/North Africa
215 220 278 264 261 312 362
East Asia 57 88 124 218 360 460 527 South Asia 113 106 118 158 185 247 314
Transition countries 525 616 764 748 568 628 658
* 3-year average centred on the year indicated **meats, eggs, milk and dairy products (excluding butter and fish) Source: Bruinsma (2003)
3.3. Red Meat
The word “meat” refers to skeletal muscle and related fat. Muscle tissue has a very high content of protein, about 20% in fresh and 80% in dried meat. Its protein contains all of the essential amino acids, it contains good amount of iron and zinc. Furthermore, it contains “the meat factor”, which enhances nonheme iron absorption. Meat contains no fiber, has a negligible content of carbohydrates, and has a relatively high content of fat. However, the fat content of meat can vary, depending on the type of animal and how it was raised, the feed, and the part of the body. Game meat is typically leaner than meat from farm animals and has a more favorable fatty acid composition, with more n-3 fatty acids (Hark and Deen, 2005; Michaelsen et al, 2009).
In the EMR countries, the red meat availability for consumption has slightly increased during 1990-92 to 2003-05 in six countries, with a range from 2.2% in Djibouti to 9% in Syria. Lebanon and

30
30
the availability of poultry meat has increased during 1990-92 and 2003-05, the availability of red meat is still higher (Appendix 2).
3.5. Eggs
As with poultry, eggs showed a large increase in availability in most countries of the Region during 1990-92 to 2003-05. The exception was in Morocco, United Arab Emirates and Jordan where the eggs availability for consumption declined. Three countries showed no change in eggs consumption during the same period; Lebanon, Sudan and Saudi Arabia (Appendix 2). During 2003-2005, the per capita daily egg availability for consumption was the highest in Kuwait, Libya, Palestine and UAE, where availability exceeded 25g/person/day. Iran, Lebanon and Syria had availability between 22-23 g eggs/person/day. The availability of eggs in Djibouti, Pakistan, Sudan and Yemen was the lowest and ranged from 2-5 g eggs/person /day (Figure 12).
Previously, in many countries of the EMR, the shift towards higher meat and milk consumption reflected acceptable nutritional behavior as it improved the diet with high quality protein and essential minerals and vitamins. This contributed to improving the quality of diet and to reducing micronutrient deficiencies, as well as undernutrition in infants, children and women. However, the intake of animal products has since risen and has reached adequate levels if not over-adequate in most countries of the region. It is well-documented that increased consumption of red meat tends to increase the risk of colorectum cancer (AICR,2007) and increased intakes of saturated fat and cholesterol from meat, dairy products and eggs increases the risk of the coronary heart diseases (WHO, 2003).
The high intake of meat, meat products, eggs and milk is associated with a higher intake of saturated fatty acids and cholesterol. In Tunisia, Elati et al (2004) found that 23% of total fat

31
31
intake by adults was saturated fat. In Egypt, Mahmoud (2004) reported that 37% of fat intake by women was saturated fat, in both urban and rural areas.
3.6. Fish
All fish are a rich source of high-quality protein and provide a range of other important nutrients, depending on species and processing. The fat content in fish species ranges from less than 1 to more than 30g of fat/100g of raw fish. Fatty fish are a valuable source on n-3 LCPUFAs. Small, soft-boned fish that are eaten with the bones are an excellent source of calcium and phosphorus. Furthermore, fish is a good source of zinc and bioavaiable iron, and fish enhances nonheme iron absorption due to the “meat-factor” effect (Michaelsen et al, 2009).
The change in the availability of fish for consumption for the period 1990-92 and 2003-05 has increased in all countries in the Region, with the exception of Djibouti, Palestine, Pakistan and UAE, where fish availability decreased in this period (Appendix 2). Syria showed the highest availability of fish, followed by Lebanon. However, the amount available for consumption is relatively low. It ranged from 1 g/person/day in Palestine and Pakistan to 52 g/person/day in UAE, in 2003-2005 (Figure 13).
In general, the calories availability from livestock products in the EMR region increased steadily during 1962-1998, and projected to increase by 20% in 2015 and by 39% in 2030, compared to the availability in 1998 (Figure 14).
30
the availability of poultry meat has increased during 1990-92 and 2003-05, the availability of red meat is still higher (Appendix 2).
3.5. Eggs
As with poultry, eggs showed a large increase in availability in most countries of the Region during 1990-92 to 2003-05. The exception was in Morocco, United Arab Emirates and Jordan where the eggs availability for consumption declined. Three countries showed no change in eggs consumption during the same period; Lebanon, Sudan and Saudi Arabia (Appendix 2). During 2003-2005, the per capita daily egg availability for consumption was the highest in Kuwait, Libya, Palestine and UAE, where availability exceeded 25g/person/day. Iran, Lebanon and Syria had availability between 22-23 g eggs/person/day. The availability of eggs in Djibouti, Pakistan, Sudan and Yemen was the lowest and ranged from 2-5 g eggs/person /day (Figure 12).
Previously, in many countries of the EMR, the shift towards higher meat and milk consumption reflected acceptable nutritional behavior as it improved the diet with high quality protein and essential minerals and vitamins. This contributed to improving the quality of diet and to reducing micronutrient deficiencies, as well as undernutrition in infants, children and women. However, the intake of animal products has since risen and has reached adequate levels if not over-adequate in most countries of the region. It is well-documented that increased consumption of red meat tends to increase the risk of colorectum cancer (AICR,2007) and increased intakes of saturated fat and cholesterol from meat, dairy products and eggs increases the risk of the coronary heart diseases (WHO, 2003).
The high intake of meat, meat products, eggs and milk is associated with a higher intake of saturated fatty acids and cholesterol. In Tunisia, Elati et al (2004) found that 23% of total fat

32
32

33
33
32

34
34

35
35
34

36
36
3.7. Milk and Dairy Products
Milk and dairy products are excellent source of both calcium and protein. However, these foods can also be a source of fat, especially saturated fat. This is particularly true for butter, cheese and creams. Therefore, more attention should be taken, when consuming such foods (McCrindle and Wengle, 2005).
The availability of milk and dairy products for consumption during 1990-92 and 2003-05 has increased from 3.1% in Palestine to 65.6% in Sudan. Kuwait and United Arab Emirates showed a significant decrease (20% and 33%, respectively), during this period (Appendix 2). In 2003-2005 the per capita availability of milk and dairy products was the highest in Sudan and Pakistan, where it exceeded 40g/person/day. Libya, Saudi Arabia, Syria,

37
37
Tunisia and UAE come next with a per capita daily availability that ranged between 200 to 270 g/person/day. Egypt, Morocco and Yemen had the lowest availability of milk and dairy products in the Region with less than 100g/person/day (Figure 15).
Food surveys in the Region demonstrated a low frequency intake of milk among both children and adults. In Egypt for example, only 47% of adolescents (10-18 years) consumed milk daily (NNI, 2008), and the proportion in Bahrain was 37% among school children aged 15-18 years (Musaiger et al, 2010). In Pakistan, Hydre et al (2004) found that 87% of school children (18-12 years) had poor intake of milk. Among adults, Musaiger et al (2005b) found that 48.7% of Omani women consume milk daily. The percentage was higher among Sudani adults (73%) (MOH, 1997), as well as Iranian adults, 79.5% for men and 77% for women (Dastgiri et al, 2006).
3.8. Legumes and Nuts
Legumes (beans, peas, and lentils) and nuts are a good source of protein, healthy fat, vitamins, minerals, antioxidants and phytochemicals. Nuts are specially a good source of mono and poly-unsaturated fats and should be part of a balanced diet. However, because of high content of fat in the nuts, their intake should be in moderation to avoid excessive calories (Hark and Deen, 2005).
Palestine showed the highest increase of per capita availability of legumes and nuts during 1990-92 to 2003-05 (143.5%), followed by Syria, Sudan and Egypt (Appendix 2). As for the availability in 2003-2005, Lebanon, Syria and UAE had the highest per capita daily availability in the Region (exceeded 60g/person/day). The availability of legumes and nuts ranged from 40-60 g/person/day in Egypt, Jordan, Palestine and Tunisia. Djibouti, Pakistan, Saudi Arabia and Yemen had the lowest availability which did not exceed 20g/person/day (Figure 16).
36
3.7. Milk and Dairy Products
Milk and dairy products are excellent source of both calcium and protein. However, these foods can also be a source of fat, especially saturated fat. This is particularly true for butter, cheese and creams. Therefore, more attention should be taken, when consuming such foods (McCrindle and Wengle, 2005).
The availability of milk and dairy products for consumption during 1990-92 and 2003-05 has increased from 3.1% in Palestine to 65.6% in Sudan. Kuwait and United Arab Emirates showed a significant decrease (20% and 33%, respectively), during this period (Appendix 2). In 2003-2005 the per capita availability of milk and dairy products was the highest in Sudan and Pakistan, where it exceeded 40g/person/day. Libya, Saudi Arabia, Syria,

38
38

39
39
38
40
40
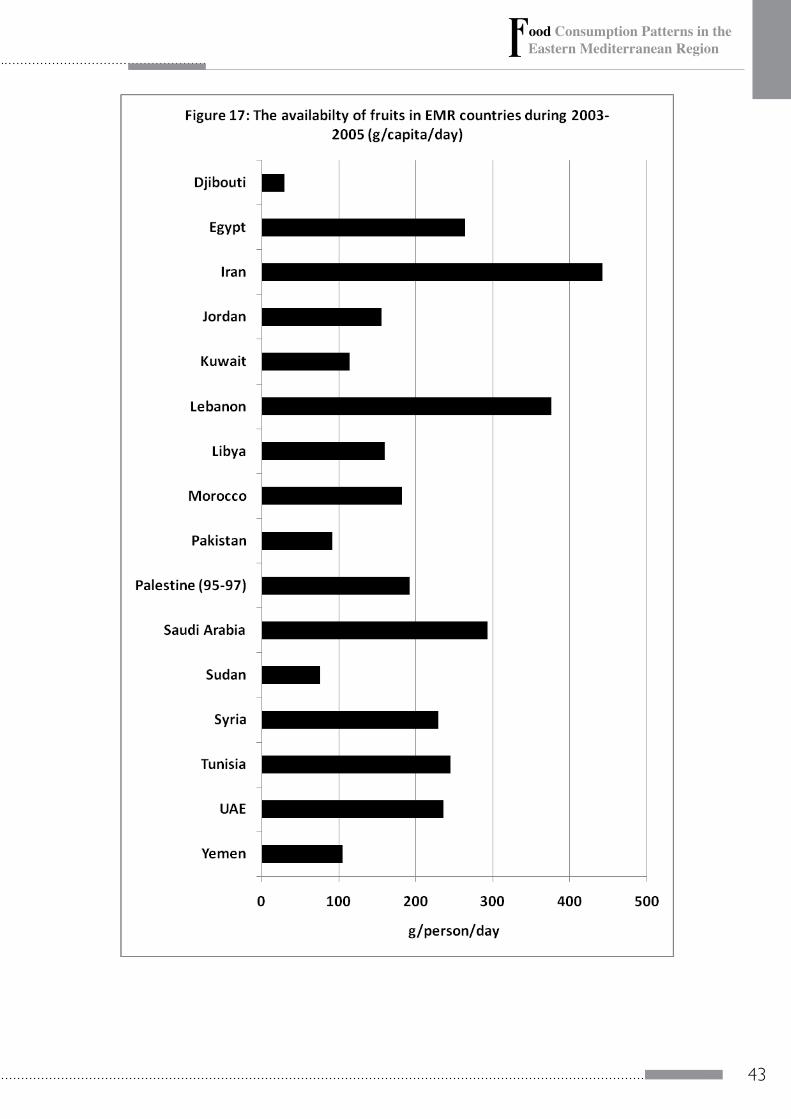
3.9. Fruits and Vegetables
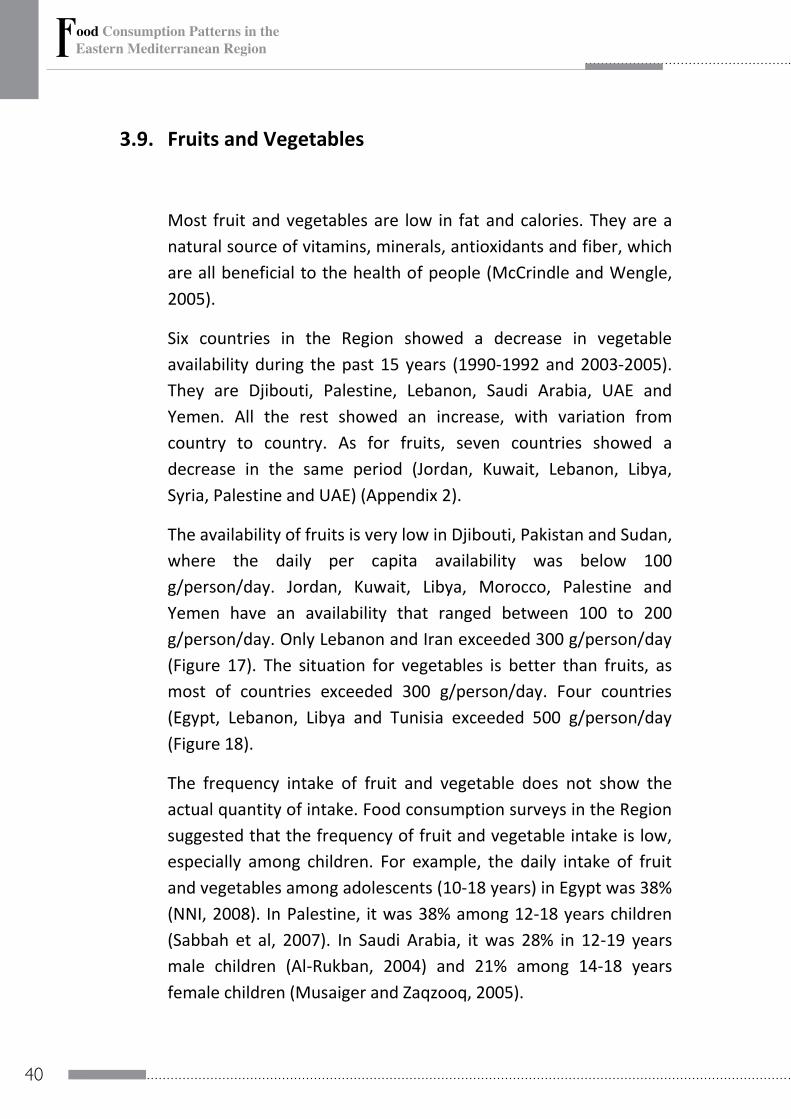
Most fruit and vegetables are low in fat and calories. They are a natural source of vitamins, minerals, antioxidants and fiber, which are all beneficial to the health of people (McCrindle and Wengle, 2005).
Six countries in the Region showed a decrease in vegetable availability during the past 15 years (1990-1992 and 2003-2005). They are Djibouti, Palestine, Lebanon, Saudi Arabia, UAE and Yemen. All the rest showed an increase, with variation from country to country. As for fruits, seven countries showed a decrease in the same period (Jordan, Kuwait, Lebanon, Libya, Syria, Palestine and UAE) (Appendix 2).
The availability of fruits is very low in Djibouti, Pakistan and Sudan, where the daily per capita availability was below 100 g/person/day. Jordan, Kuwait, Libya, Morocco, Palestine and Yemen have an availability that ranged between 100 to 200 g/person/day. Only Lebanon and Iran exceeded 300 g/person/day (Figure 17). The situation for vegetables is better than fruits, as most of countries exceeded 300 g/person/day. Four countries (Egypt, Lebanon, Libya and Tunisia exceeded 500 g/person/day (Figure 18).
The frequency intake of fruit and vegetable does not show the actual quantity of intake. Food consumption surveys in the Region suggested that the frequency of fruit and vegetable intake is low, especially among children. For example, the daily intake of fruit and vegetables among adolescents (10-18 years) in Egypt was 38% (NNI, 2008). In Palestine, it was 38% among 12-18 years children (Sabbah et al, 2007). In Saudi Arabia, it was 28% in 12-19 years male children (Al-Rukban, 2004) and 21% among 14-18 years female children (Musaiger and Zaqzooq, 2005).

41
41
The daily fruits and vegetables intake among adults is better than children. In UAE, it was found that 53% and 59% of adult male and female, consumed fruits and vegetables daily (Musaiger, 2000). The proportion was 73% in Iran (Soori, 2001), and 54% in Bahrain (Musaiger et al, 2005a), 32% in Sudan (MOH, 1977) and 77% in Oman (Musaiger et al, 2005b). In urban Lebanon, Nasreddine et al (2006) found that the mean intake of fruits and vegetables among adults was 367 g/day, and 45% of subjects consumed less than the recommended 400g daily.
Lock et al (2005) tried to calculate the fruits and vegetables intake in various regions in the world, by age and sex. They divided EMR countries into two groups: group A (Bahrain, Iran, Jordan, Kuwait, Lebanon, Libya, Oman, Saudi Arabia, Syria, Tunisia and UAE) and group B, which included the rest of the countries. For preschool children (0-4 years) the estimated mean intake of fruits and vegetables (g/person/day) was higher in group A than B. At school age the mean intake was almost similar for both males and females. For males, there is a gradual increase of fruits and vegetables that reached a peak at age 60-69 years in both groups, with higher intake by males in group B. There were no similar trends among females in both groups. The mean intake of fruits and vegetables exceeded 400 g/person/day at age above 44 years in male and at age ≥80 years in group B. whereas non of the age groups or sexes reached the minimum requirement of daily intake of fruits and vegetables (400g) in group A (Table 6).
Increasing individual consumption of fruit and vegetables up to an optimal level of intake could reduce the worldwide burden of disease and ischemic heart disease and ischemic stroke by about 31% and 19%, respectively. For stomach and esophageal cancer, the potential reduction in disease attributable to an increase in fruit and vegetable intake was 19% and 20%, respectively. Attributable risk fractions were lower for lung and colorectal cancer (12% and 2%). The total worldwide mortality attributable to inadequate consumption of fruit and vegetables was estimated
40
3.9. Fruits and Vegetables
Most fruit and vegetables are low in fat and calories. They are a natural source of vitamins, minerals, antioxidants and fiber, which are all beneficial to the health of people (McCrindle and Wengle, 2005).
Six countries in the Region showed a decrease in vegetable availability during the past 15 years (1990-1992 and 2003-2005). They are Djibouti, Palestine, Lebanon, Saudi Arabia, UAE and Yemen. All the rest showed an increase, with variation from country to country. As for fruits, seven countries showed a decrease in the same period (Jordan, Kuwait, Lebanon, Libya, Syria, Palestine and UAE) (Appendix 2).
The availability of fruits is very low in Djibouti, Pakistan and Sudan, where the daily per capita availability was below 100 g/person/day. Jordan, Kuwait, Libya, Morocco, Palestine and Yemen have an availability that ranged between 100 to 200 g/person/day. Only Lebanon and Iran exceeded 300 g/person/day (Figure 17). The situation for vegetables is better than fruits, as most of countries exceeded 300 g/person/day. Four countries (Egypt, Lebanon, Libya and Tunisia exceeded 500 g/person/day (Figure 18).
The frequency intake of fruit and vegetable does not show the actual quantity of intake. Food consumption surveys in the Region suggested that the frequency of fruit and vegetable intake is low, especially among children. For example, the daily intake of fruit and vegetables among adolescents (10-18 years) in Egypt was 38% (NNI, 2008). In Palestine, it was 38% among 12-18 years children (Sabbah et al, 2007). In Saudi Arabia, it was 28% in 12-19 years male children (Al-Rukban, 2004) and 21% among 14-18 years female children (Musaiger and Zaqzooq, 2005).

42
42
to be approximately 2.6 million deaths in 2000. This is equivalent to approximately 1.8% of total global burden of disease. The regional analyses show that fruit and vegetables intake is a significant determinant of disease burden in both developed and developing regions (Lock et al, 2005).
43
43
42
to be approximately 2.6 million deaths in 2000. This is equivalent to approximately 1.8% of total global burden of disease. The regional analyses show that fruit and vegetables intake is a significant determinant of disease burden in both developed and developing regions (Lock et al, 2005).

44
44

45
45 Table 6: Estim
ated regional intake of fruit and vegetables in EMR countries
Region Countries in region
b
Estimated regional m
ean intake of fruit and vegetables(grams per person per day)
Age group (years)
Sex 0-4
5-14 15-29
30-44 45-59
60-69 70-79
≥80
Group A
Bahrain, Cyprus, Iran, Jordan, Kuwait,
Lebanon, Libyan Arab Jam
ahiriya, Om
an, Q
atar, Saudi Arabia, Syrian A
rab Republic, Tunisia, U
nited Arab Em
irates
Male
218 335
296 368
374 392
350 334
Female
218 327
323 362
346 392
336 319
Group B
Afghanistan, D
jibouti, Egypt, Iraq, M
orocco, Pakistan, Somalia,
Sudan, Yemen
Male
174 342
312 388
409 446
442 420
Female
174 333
348 352
319 385
372 409
Source: Lock et al (2005)
44

46
46
4. FACTORS DETERMINING FOOD CONSUMPTION PATTERNS IN THE EMR COUNTRIES
4.1. Income
Income is considered to be one of the most important factors in determining food consumption patterns. A substantial increase in the income occurred in all countries in the Region, which resulted in a significant change in dietary patterns. This was more apparent in the oil-exporting countries (especially the Arab countries of the Gulf), where the per capita income increased dramatically, mainly due to oil revenues (Musaiger, 1993). In general, as income increases the intake of animal protein foods increased (Musaiger and Miladi, 1997). The high income countries showed a marked rise in the consumption of meat, poultry, milk and eggs between 1980s and 2005.
Data from the Food and Agriculture Organization (FAO) from different countries and regions indicate that higher incomes are associated with greater access to food energy, higher consumption of animal products (meat and dairy), and reduced consumption of grains and complex carbohydrates (including in fruits and vegetables). Consumption of sugars, total fat, and animal fat also rises with income, leading to more energy-dense diets. Usually, these changes occur unevenly within a population. Diverse survey data show that, as transition proceeds, higher income households typically spend more on food eaten away from home, especially meat and other animal products, and less on grains. Poorer households, in contrast, typically have less varied diets, often exceeding energy needs, while being deficient in vitamins and minerals. Further intra-population differentials evolve with time. (McMichael et al, 2007).
Although consumers with higher income levels spend more money on food, the food share of total household expenditure is

47
47
low for wealthier consumers, who typically spend a larger share of their incomes on more expensive items, such as health care, energy, and recreation. The share of food consumption expenditure in total household expenditure is the lowest in high income countries in the Region, such as Arab countries of the Gulf, where the food expenditure ranged from 24% to 33%, while the share ranged from 37% to 60% in other countries (FAO, 2009).
The increased share of high-value food expenditures in total food expenditures reflects not only consumers’ increased purchasing power but also lifestyle changes brought about by the increased prevalence of household amenities. For example, increases in acquisitions of refrigerators may lead to greater household purchases of perishable food products, while increases in ownership of microwave ovens may lead to increased purchases of ready-to-eat foods that require minimal preparation. Ownership of refrigerators has risen significantly in most developing countries over the last decade (Gehlhar and Regmi, 2004).
Analysis of the situation, however, is complex because the income distribution within the population is unequal. In general, income inequity tends to increase during the early stages of economic development. If the per capita income exceeds 2,000 US dollars this inequity becomes very low. This means that, for the majority of the countries in the Region facing income mal-distribution, diversification occurs in the quantity and quality of food consumed (Musaiger and Miladi, 1997).
4.2. Urbanization
The shift in the urban-rural population balance is another important aspect which will influence food consumption. Urbanization will proceed slowly in the Arab Gulf countries, where the vast majority of the population is already living in urban areas. However, in other countries urbanization is growing fastly with an average of nearly 3% per year (Schmishuber and Shetty, 2005).
46
4. FACTORS DETERMINING FOOD CONSUMPTION PATTERNS IN THE EMR COUNTRIES
4.1. Income
Income is considered to be one of the most important factors in determining food consumption patterns. A substantial increase in the income occurred in all countries in the Region, which resulted in a significant change in dietary patterns. This was more apparent in the oil-exporting countries (especially the Arab countries of the Gulf), where the per capita income increased dramatically, mainly due to oil revenues (Musaiger, 1993). In general, as income increases the intake of animal protein foods increased (Musaiger and Miladi, 1997). The high income countries showed a marked rise in the consumption of meat, poultry, milk and eggs between 1980s and 2005.
Data from the Food and Agriculture Organization (FAO) from different countries and regions indicate that higher incomes are associated with greater access to food energy, higher consumption of animal products (meat and dairy), and reduced consumption of grains and complex carbohydrates (including in fruits and vegetables). Consumption of sugars, total fat, and animal fat also rises with income, leading to more energy-dense diets. Usually, these changes occur unevenly within a population. Diverse survey data show that, as transition proceeds, higher income households typically spend more on food eaten away from home, especially meat and other animal products, and less on grains. Poorer households, in contrast, typically have less varied diets, often exceeding energy needs, while being deficient in vitamins and minerals. Further intra-population differentials evolve with time. (McMichael et al, 2007).
Although consumers with higher income levels spend more money on food, the food share of total household expenditure is

48
48
Urbanization also means a higher female participation in the work force and with that a shift away from traditional time-intensive food preparations towards precooked, convenience food at home or fast food and snacks outside the home. The enrollment of women in the employment sector is increasing dramatically in all countries in the Region. Particularly for the urban poor, the shift towards fast and convenience foods is also a shift away from fresh fruits and vegetables, pulses, potatoes and other roots and tubers towards a much more sugary, salty, and fatty diet. It is also often a shift from a diet rich in fiber, minerals and vitamins towards one rich in energy, saturated fats and cholesterol (Schmirdhuber, 2003).
4.3. Demographic Changes and Population Growth
The latest UN population projections suggest a marked slow-down in population growth over the next decades. This should allow to maintain and even to increase food production per person in the future. The projection of FAO for 2030 suggest that the average dietary energy availability in EMR countries could increase from 3090 in 2015 to 3170 in 2030 (WHO, 2003).
Another aspect of demographic change in population that will influence food availability and consumption is the shift in the demographic pyramids of countries in the Region. Life expectancy is increasing while birth rates are on the decline. The share of population above the age of 60 is growing at a rapid rate and those who reach the age of 60 today are expected to live to over 75 years of age. These changes in the demographic profiles of developing countries will impact both food needs and consumption patterns but also the related health burden of these societies (Schmidhuber and Shetty, 2005).
WHO/EMRO (2006) estimated that the proportion of elderly people will increase markedly over the coming four decades. By 2050, the increase in the percentage of the elderly will increase by
49
49
more than 20% in 10 countries of the Region. About 8 countries will face an increase between 10-20% (Table 7).
4.4. The Globalization of the Food Distribution System
The acceleration of food consumption change is driven by a fundamental change in the food marketing and distribution system. The rise of supermarkets in most of the high and middle income countries in the Region plays an important role in shifting dietary habits of the people. The rapid expansion of the supermarkets has moved far beyond their original bases, and they have expand from large to small and poor countries, from towns to rural areas and have expanded the consumers from the upper/middle to the lower class (Schmidhuber, 2003). In Bahrain, Musaiger (2009) demonstrated that consumers were highly dependent on purchasing food from supermarkets. With the exception of fish, more than 80% of foods purchased for the family were from supermarkets.
4.5. Food Price
Rising food prices means that larger shares of income are being devoted to food expenditure, thus leaving less money available for non-food items, such as housing, transportation, health and educational services particularly in low and middle income countries in the Region. In high income countries, like the GCC countries, the contribution of food price increases to overall inflation has been quite limited over the past year ending February 2009. This is not because food prices increases were relatively moderate, but due to the share of food in the total consumer basket is small (OECD-FAO, 2009).
48
Urbanization also means a higher female participation in the work force and with that a shift away from traditional time-intensive food preparations towards precooked, convenience food at home or fast food and snacks outside the home. The enrollment of women in the employment sector is increasing dramatically in all countries in the Region. Particularly for the urban poor, the shift towards fast and convenience foods is also a shift away from fresh fruits and vegetables, pulses, potatoes and other roots and tubers towards a much more sugary, salty, and fatty diet. It is also often a shift from a diet rich in fiber, minerals and vitamins towards one rich in energy, saturated fats and cholesterol (Schmirdhuber, 2003).
4.3. Demographic Changes and Population Growth
The latest UN population projections suggest a marked slow-down in population growth over the next decades. This should allow to maintain and even to increase food production per person in the future. The projection of FAO for 2030 suggest that the average dietary energy availability in EMR countries could increase from 3090 in 2015 to 3170 in 2030 (WHO, 2003).
Another aspect of demographic change in population that will influence food availability and consumption is the shift in the demographic pyramids of countries in the Region. Life expectancy is increasing while birth rates are on the decline. The share of population above the age of 60 is growing at a rapid rate and those who reach the age of 60 today are expected to live to over 75 years of age. These changes in the demographic profiles of developing countries will impact both food needs and consumption patterns but also the related health burden of these societies (Schmidhuber and Shetty, 2005).
WHO/EMRO (2006) estimated that the proportion of elderly people will increase markedly over the coming four decades. By 2050, the increase in the percentage of the elderly will increase by

50
50
Table 7: Percentage of population aged 60+ in the Eastern Mediterranean Region (1950-2050)
Country 1950 1975 2000 2025 2020
Afghanistan 4.5 4.7 4.7 5.2 7.7
Bahrain 4.6 3.6 4.7 20.4 24.9
Djibouti 3.4 3.3 5.5 6.2 5.8
Egypt 5.1 6.5 6.3 11.5 20.8
Iran, Islamic republic 8.3 5.4 5.2 10.5 21.7
Iraq 4.3 4.1 4.6 7.5 15.1
Jordan 7.4 4.3 4.5 7.0 15.6
Kuwait 4.5 2.6 4.4 15.7 25.7
Lebanon 10.4 7.5 8.5 13.5 25.4
Libyan Arab Jamahiriya 7.3 3.7 5.5 9.9 21.1
Morocco 4.6 5.2 6.4 11.2 20.6
Oman 5.0 4.4 4.2 6.6 10.5
Pakistan 8.2 5.5 5.8 7.3 12.4
Palestine 7.4 4.9 4.9 5.6 9.9
Qatar 5.7 3.1 3.1 21.8 20.7
Saudi Arabia 5.6 4.8 4.8 7.9 12.9
Somalia 4.6 4.8 3.9 4.0 5.7
Sudan 5.4 4.6 5.5 7.9 14.4
Syrian Arab republic 6.8 5.3 4.7 7.7 18.0
Tunisia 8.0 5.8 8.4 13.4 24.6
United Arab emirates 5.7 3.4 5.1 23.6 26.7
Yemen 6.2 4.4 3.6 3.6 5.3
Average 6.7 5.3 5.8 8.7 15.0
WHO/EMRO (2006)

51
51
4.6. Improvement in Food Processing
The growing processing of foodstuffs has also an effect on food consumption patterns. Advances in food processing and preservation in many countries in the Region has led to availability of a wide range of food products in the market. Vegetable oils, for example, were not commonly used three decades ago in the EMR countries, but now are readily available in portable packaging and at a very low cost. Milk and dairy products are available in various packaging and reach rural and even remoter areas. However, the processing of foods has also negative aspects on food consumption pattern, through providing refined wheat flour, which contains less fiber, minerals and vitamins than whole wheat flour.
4.7. Growing-up of Fast Food Industry, Ready-to-Eat Meals and Restaurants
The number of restaurants and fast food chains has increased remarkably in all the EMR countries, but especially in high and middle income countries. This is due to several factors: more involvement of women in workforce with no time to prepare foods, expanding of private sectors with longer working hours (till 5 p.m.), and an increase in the proportion of people eating outside the home. Consequently, people in these countries are more likely to consume foods rich in fat and carbohydrates.
4.8. Food Subsidy
The food policies conducted in most of the countries in the Region have also done much to change consumption in recent years by subsidizing staple food products. In all the countries the main objective has been to develop industry and to keep industrial costs relatively low by limiting salaries, which is made possible by a policy of low food prices. In the Maghreb and most of the Middle East countries the prices of staple products are artificially
50
Table 7: Percentage of population aged 60+ in the Eastern Mediterranean Region (1950-2050)
Country 1950 1975 2000 2025 2020
Afghanistan 4.5 4.7 4.7 5.2 7.7
Bahrain 4.6 3.6 4.7 20.4 24.9
Djibouti 3.4 3.3 5.5 6.2 5.8
Egypt 5.1 6.5 6.3 11.5 20.8
Iran, Islamic republic 8.3 5.4 5.2 10.5 21.7
Iraq 4.3 4.1 4.6 7.5 15.1
Jordan 7.4 4.3 4.5 7.0 15.6
Kuwait 4.5 2.6 4.4 15.7 25.7
Lebanon 10.4 7.5 8.5 13.5 25.4
Libyan Arab Jamahiriya 7.3 3.7 5.5 9.9 21.1
Morocco 4.6 5.2 6.4 11.2 20.6
Oman 5.0 4.4 4.2 6.6 10.5
Pakistan 8.2 5.5 5.8 7.3 12.4
Palestine 7.4 4.9 4.9 5.6 9.9
Qatar 5.7 3.1 3.1 21.8 20.7
Saudi Arabia 5.6 4.8 4.8 7.9 12.9
Somalia 4.6 4.8 3.9 4.0 5.7
Sudan 5.4 4.6 5.5 7.9 14.4
Syrian Arab republic 6.8 5.3 4.7 7.7 18.0
Tunisia 8.0 5.8 8.4 13.4 24.6
United Arab emirates 5.7 3.4 5.1 23.6 26.7
Yemen 6.2 4.4 3.6 3.6 5.3
Average 6.7 5.3 5.8 8.7 15.0
WHO/EMRO (2006)

52
52
kept at a very low level through direct or indirect subsidies on consumption With the rise in the prices of agricultural commodities on world markets in recent years, the subsidies have become a very heavy burden on the state budget for the countries which practice them (FAO, 1987).
The immediate effects of subsidization policies are, of course, positive, because they enable a very wide range of the population to have access to basic foodstuffs, thereby improving the nutritional status of the most impoverished. For example, calculations made for Tunisia on the effect of the compensation on income distribution and diet, show that the subsidies have a distributive effect, despite their unequal nature (the poorest quarter of the population receives 14% of the subsidy and accounts for only 8% of the total expenditure while the wealthiest quarter of the population 35% of the subsidy and accounts for more than half - 52.5% - of the total expenditure). In addition, food subsidies have usually made it possible to keep price rises at a reasonable level (FAO, 1987).
However, this policy of fixing a uniform price for consumers which is generally lower than the cost price and making up the difference from the state budget has its risks. From the point of view of consumption, it has the drawback of subsidizing primarily the households which consume most, i.e. the middle and wealthy classes. From the point of view of production, low food price tends to discourage local farmers. The countries of the Region provide many examples of such negative effects. In Morocco, the system of subsidizing imported vegetable oils, particularly soya bean oil, has checked the development of local oilseed crops, particularly sunflower, thus increasing dependence on imported oils. In Tunisia, the inadequate price paid to sugar producers led to a decrease in the number of sugar-beet producers between 1971 and 1975. In Egypt and Algeria, the relative success of fruit and vegetable farming and livestock rearing owes much to the farmers’ loss of interest in the traditional crops, for which prices

53
53
are not very remunerative (rice, wheat) (Musaiger and Miladi, 1987).
4.9. Migration
The rapid change in consumption models owes much to the migratory movements which have reached an unusual scale in the Region. In Europe this already long-standing phenomena reached its peak during the sixties and undoubtedly helped to spread the consumption models of the more developed European countries to the Southern European and Maghreb countries from which most of the immigrants came. With the halt in migration to the EEC countries and the industrial development of the petroleum-producing countries that began in the seventies, the main poles of migration have moved to the Middle East (FAO, 1987).
Migration has a big impact on food consumption. In the countries with a shortage of labour such the GCC countries, the influx of foreign work has led to a very rapid growth in population, and a corresponding rapid increase in food demand. In the countries supplying the labour, the consumption models of the largely westernized petroleum-producing countries spread very rapidly through population movements, a spread facilitated by the size of the earnings sent home by the foreign workers. The growth in consumption is increasingly being met by imports, local farmers no longer being able to produce enough for the national markets.
There are three types of migration which determine the food consumption patterns in the Region. The first of these is the migration of rural people to urban areas, which affects the food consumption of both rural and urban inhabitants. The shifted rural families are deprived of certain economic functions, such as food production and preservation, because in the cities foods must be bought from groceries or supermarkets. This trend toward urban living has had an effect on the population growth in urban areas, with a resultant increase in the demand for food. In Sudan, for instance, the main reason for increasing wheat consumption in
52
kept at a very low level through direct or indirect subsidies on consumption With the rise in the prices of agricultural commodities on world markets in recent years, the subsidies have become a very heavy burden on the state budget for the countries which practice them (FAO, 1987).
The immediate effects of subsidization policies are, of course, positive, because they enable a very wide range of the population to have access to basic foodstuffs, thereby improving the nutritional status of the most impoverished. For example, calculations made for Tunisia on the effect of the compensation on income distribution and diet, show that the subsidies have a distributive effect, despite their unequal nature (the poorest quarter of the population receives 14% of the subsidy and accounts for only 8% of the total expenditure while the wealthiest quarter of the population 35% of the subsidy and accounts for more than half - 52.5% - of the total expenditure). In addition, food subsidies have usually made it possible to keep price rises at a reasonable level (FAO, 1987).
However, this policy of fixing a uniform price for consumers which is generally lower than the cost price and making up the difference from the state budget has its risks. From the point of view of consumption, it has the drawback of subsidizing primarily the households which consume most, i.e. the middle and wealthy classes. From the point of view of production, low food price tends to discourage local farmers. The countries of the Region provide many examples of such negative effects. In Morocco, the system of subsidizing imported vegetable oils, particularly soya bean oil, has checked the development of local oilseed crops, particularly sunflower, thus increasing dependence on imported oils. In Tunisia, the inadequate price paid to sugar producers led to a decrease in the number of sugar-beet producers between 1971 and 1975. In Egypt and Algeria, the relative success of fruit and vegetable farming and livestock rearing owes much to the farmers’ loss of interest in the traditional crops, for which prices

54
54
the cities is the continuous movement of rural people to urban areas. Similar situations have been observed in most countries in the Region (Musaiger and Miladi, 1987).
The second type of migration is occurring within the population of the Middle Eastern countries. Beginning with the oil-price boom in 1973, the oil-producing countries became highly affluent and attracted labourers from other countries in the Region, particularly from Egypt, Syria, Jordan, West Bank, Sudan and Yemen (Mamarbachi et al, 1980). These immigrants brought with them new food habits.
The third type of migration is that related to non-Arab nationals. The migration has not been limited to the Arab people, but has expanded to include nationals from India, Pakistan, Sri Lanka, Bangladesh, Korea, the Philippines and Indonesia. In the Arab Gulf countries, foods of the Indian subcontinent have become part of the diets of most local households. Generally, in most Middle Eastern Arab countries, food consumption has become more diversified to satisfy the different ethnic origins and various tastes and preferences of the immigrant labour forces.
4.10. Mass Media and Advertisements
The increase in family income has put television and other electrical appliances within the reach of most households in the Region. Even in rural areas ownership of radios, television, and tape recorders is widespread. This is especially true for migrant workers who return to their homeland with considerable resources. People spend much of their time watching television or using internet, and these media are therefore expected to have a remarkable impact on food beliefs and practices. In Tunisia, for example, the government used public service spots on the radio to encourage people to eat certain nutritious foods, for example, people were recommended to eat lentils and 6 months later, the demand for lentils increased so that the government was forced to import more lentils to satisfy the local demand (Gehart, 1986).

55
55
Advertising deals with all mass media and it is widely accepted that food advertisements have an influence on what people eat. In most EMR countries advertising has developed rapidly since it represents a good income source for the media industries. A careful study of the influence of advertising on food habits of housewives was done in Bahrain (Musaiger, 1983). It was found that television food advertising played an important role in shaping food attitudes and practices of housewives. Almost 42% of housewives strongly believed food advertisements, and 47% moderately believed them. About 42% of the housewives were found to have used a newly advertised beverage product. Another study showed that 59% of children in Bahrain always requested food items they saw advertised on television, 29.8% sometimes requested them, and only 11% rarely requested them (Musaiger et al, 1986).
54
the cities is the continuous movement of rural people to urban areas. Similar situations have been observed in most countries in the Region (Musaiger and Miladi, 1987).
The second type of migration is occurring within the population of the Middle Eastern countries. Beginning with the oil-price boom in 1973, the oil-producing countries became highly affluent and attracted labourers from other countries in the Region, particularly from Egypt, Syria, Jordan, West Bank, Sudan and Yemen (Mamarbachi et al, 1980). These immigrants brought with them new food habits.
The third type of migration is that related to non-Arab nationals. The migration has not been limited to the Arab people, but has expanded to include nationals from India, Pakistan, Sri Lanka, Bangladesh, Korea, the Philippines and Indonesia. In the Arab Gulf countries, foods of the Indian subcontinent have become part of the diets of most local households. Generally, in most Middle Eastern Arab countries, food consumption has become more diversified to satisfy the different ethnic origins and various tastes and preferences of the immigrant labour forces.
4.10. Mass Media and Advertisements
The increase in family income has put television and other electrical appliances within the reach of most households in the Region. Even in rural areas ownership of radios, television, and tape recorders is widespread. This is especially true for migrant workers who return to their homeland with considerable resources. People spend much of their time watching television or using internet, and these media are therefore expected to have a remarkable impact on food beliefs and practices. In Tunisia, for example, the government used public service spots on the radio to encourage people to eat certain nutritious foods, for example, people were recommended to eat lentils and 6 months later, the demand for lentils increased so that the government was forced to import more lentils to satisfy the local demand (Gehart, 1986).

56
56
5. SPECIAL ISSUES RELATED TO FOOD CONSUMPTION IN THE EMR COUNTRIES
5.1. STREET FOOD
Studies in developing countries have shown that up to 20-25% of household food expenditure is incurred outside the home, and some segments of the population depend entirely on street foods. This has been one of the consequences of rapid urbanization, with millions of people having no access to a kitchen or other cooking facilities. There are millions of single workers without families and a large floating population who move in and out of the city for work, and these people largely depend upon street foods for their daily sustenance (FAO, 1979).
In many developing countries, street food vendors are an important component of the food supply chain. Being reasonably priced and conveniently available, street food satisfies a vital need of the urban population. These ready-to-eat foods and beverages are prepared and/or sold by vendors or hawkers mainly in streets or other convenient public places such as around places of work, schools, hospitals, railway stations and bus terminals (FAO, 1979).
Food safety is a major concern with street foods. These foods are generally prepared and sold under unhygienic conditions, with limited access to safe water, sanitary services, or garbage disposal facilities. Hence street foods pose a high risk of food poisoning due to microbial contamination, as well as improper use of food additives, adulteration and environmental contamination (FAO, 2003).
In Pakistan, a hazard analysis (which included watching operations, measuring temperatures of foods throughout preparation and display, and sampling and testing for

57
57
microorganisms of concern) was conducted on a street vendor’s operation. Chat is a popular dish in certain areas of Pakistan. It consists of sliced cooked potatoes, fried graham and pulse dough, and chick peas or red beans garnished with lasi (a fermented milk) and a fruit syrup. Staphylococci infected the cooked potatoes during peeling, cutting, and other handling. These bacteria increased up to 10 (5) while the contaminated foods were held for several hours. Counts up to 10 (5) Bacillus cereus were isolated from the cooked doughs after a 6-h or longer holding period. Large numbers (usually 10(5)) of coliform bacteria and aerobic mesophilic colonies (10(6-9)) were isolated from all foods after handling and holding for several hours. Ingestion of these foods must be considered high risk unless handling of cooked items can be kept to a minimum and the time of holding reduced to less than 6h. Critical control points are handling after cooking and holding on display. Health agency personnel in developing countries, vendors, and consumers of these foods need to be informed of the hazards and appropriate preventive measures (Bryan et al, 1992).
Microbiological profiles of ready-to-eat foods collected over a period of 3 years from street vendors in Egypt were assessed. The 114 samples of foods investigated included meat, meat organs and edible viscera, fish rice and dishes containing rice, raw vegetables and salads, macaroni, spaghetti, desserts, milk, cheese, bean dishes, dates, tahina (sesame paste), pickles, olives and barley-sugar water. Salmonella was not isolated from any sample. Shigella was isolated from a sample of greens and from a sample of tamea (deep-fat fried whipped beans and parsley). 41% of the samples that were tested for Staphylococcus aurous were positive, 58% of them had counts of at least 10³/g, four of 15 samples of cooked meat, meat organs and edible viscera contained Clostridium perfringens. Presumptive Bacillus cereus was isolated from 37% of samples of rice and dishes containing rice, macaroni, spaghetti, desserts and beans dishes, half had counts of 10³/g pr greater. Vibro parahaemolyticus was neither
56
5. SPECIAL ISSUES RELATED TO FOOD CONSUMPTION IN THE EMR COUNTRIES
5.1. STREET FOOD
Studies in developing countries have shown that up to 20-25% of household food expenditure is incurred outside the home, and some segments of the population depend entirely on street foods. This has been one of the consequences of rapid urbanization, with millions of people having no access to a kitchen or other cooking facilities. There are millions of single workers without families and a large floating population who move in and out of the city for work, and these people largely depend upon street foods for their daily sustenance (FAO, 1979).
In many developing countries, street food vendors are an important component of the food supply chain. Being reasonably priced and conveniently available, street food satisfies a vital need of the urban population. These ready-to-eat foods and beverages are prepared and/or sold by vendors or hawkers mainly in streets or other convenient public places such as around places of work, schools, hospitals, railway stations and bus terminals (FAO, 1979).
Food safety is a major concern with street foods. These foods are generally prepared and sold under unhygienic conditions, with limited access to safe water, sanitary services, or garbage disposal facilities. Hence street foods pose a high risk of food poisoning due to microbial contamination, as well as improper use of food additives, adulteration and environmental contamination (FAO, 2003).
In Pakistan, a hazard analysis (which included watching operations, measuring temperatures of foods throughout preparation and display, and sampling and testing for

58
58
isolated from four samples of raw seafoods nor from three samples of cooked seafoods. 68% of the samples had aerobic colony counts (30° C) that exceeds 106 CFU/g. 97% of the samples were within the temperature range of 15 to 44°C, at the time of collection; therefore, common microorganisms and many pathogens could multiply, particularly because holding times were usually prolonged (El-Sherbeeny, 1985).
5.2. Healthy Marketplace
In most communities, marketplaces have emerged spontaneously at given locations. They have generally evolved, sometimes over hundreds of years, with limited involvement on the part of urban planners and little consideration for health protection and health promotion. Marketplaces, particularly in developing countries, are often one of the defining characteristics of a community, reflecting the local culture of the people. They commonly reflect community values, traditions and practices, and serve as an informal platform for the exchange of information. In many cities and rural communities, the marketplaces prove to have a great drawing power for tourists, who find in them a microcosm of the community they have come to discover and enjoy. However, the realities of modern life are sadly endangering the continued existence of marketplaces, with urban populations in particular increasing and the demand for ease of access and assured food safety taking precedence over the need for social interaction that marketplaces also provide (WHO/EMRO, 2003).
Marketplaces typically offer an array of local or regional street-vended foods, which form an important part of the daily diet of the surrounding community. Street-vended foods are not only appreciated for their unique flavors as well as their convenience, but they are in addition accessible and affordable for even the lowest income members of the community. Marketplaces are often essential for maintaining the nutritional status and health of urban populations, especially in developing countries. However, as

59
59
colorful as markets may be, they also symbolize traditional attitudes and beliefs that are often at odd with practices that protect and promote health. There is lack of water, sanitation and solid waste disposal can readily lead to improper hygiene, thus effecting the transmission of disease and the contamination of food (WHO/EMRO, 2003).
From an economic point of view, a healthy marketplace offers the possibility of establishing linkages between development and health. If resources generated in the marketplace are used to improve health as well as to create demand for safe products among consumers, business in the market will improve, thus generating even more resources for further improvements. This mutually supportive dynamic can lead to sustainable long-term improvement in the health status of the population. In addition, a healthy marketplace will create a business culture that is in harmony with health and other needs of society. Because marketplaces also play an important social role in the exchange of ideas and knowledge, they offer a good opportunity for the practical education of both vendors and consumers on a range of health issues.
Marketplaces Experiences in Alexandria, Egypt (WHO/EMRO, 2003)
Ibrahimiya market is located in the Middle District of Alexandria Governorate. It is strictly a traditional market for the middle classes, and was built in 1912 by the Greek community of Alexandria. It is rather unique because it was purpose-built as a marketplace, and did not develop haphazardly into one. A healthy marketplace Task Force was set up for this market, consisting of representative from the national and local authorities, academia and donors. The preliminary situation analysis results indicate interesting trends that could also apply to other traditional marketplaces in Egypt.
58
isolated from four samples of raw seafoods nor from three samples of cooked seafoods. 68% of the samples had aerobic colony counts (30° C) that exceeds 106 CFU/g. 97% of the samples were within the temperature range of 15 to 44°C, at the time of collection; therefore, common microorganisms and many pathogens could multiply, particularly because holding times were usually prolonged (El-Sherbeeny, 1985).
5.2. Healthy Marketplace
In most communities, marketplaces have emerged spontaneously at given locations. They have generally evolved, sometimes over hundreds of years, with limited involvement on the part of urban planners and little consideration for health protection and health promotion. Marketplaces, particularly in developing countries, are often one of the defining characteristics of a community, reflecting the local culture of the people. They commonly reflect community values, traditions and practices, and serve as an informal platform for the exchange of information. In many cities and rural communities, the marketplaces prove to have a great drawing power for tourists, who find in them a microcosm of the community they have come to discover and enjoy. However, the realities of modern life are sadly endangering the continued existence of marketplaces, with urban populations in particular increasing and the demand for ease of access and assured food safety taking precedence over the need for social interaction that marketplaces also provide (WHO/EMRO, 2003).
Marketplaces typically offer an array of local or regional street-vended foods, which form an important part of the daily diet of the surrounding community. Street-vended foods are not only appreciated for their unique flavors as well as their convenience, but they are in addition accessible and affordable for even the lowest income members of the community. Marketplaces are often essential for maintaining the nutritional status and health of urban populations, especially in developing countries. However, as

60
60
A survey of the levels of pesticide residues and heavy metals, as well as a microbiological analysis of vegetable and fruit present in Ibrahimiya Market, was carried out as part of the situation analysis. The microbiological screening indicated faecal contamination as well as parasitic infestation, especially shigellosis, thus demonstrating that sanitation standards, rather than other contamination factors, are not adequate thus need improving. The contamination levels found were not alarming, except for products eaten without cooking. Here the need for the hygienic education of food handlers and consumers is very important.
Pesticide contamination was absent; although it should be noted that sampling took place in the winter season. However, alarming high lead and cadmium levels were found on fresh fruit and vegetables. This will require extensive preventive measures, and the Task Force is working with the relevant authorities to identify the exact cause of the contamination. The measures will possibly involve the producers, as well as protection from roads with heavy traffic, since it is believed that lead contamination may be due to the extensive use of leaded gasoline and subsequent air, water and soil contamination. It was recommended that soils and water from suppliers’ agricultural land should be monitored. All products were, however, free of mercury contamination.
5.3. Utilization of Essential Elements
The interaction between some micronutrients and food components has been the focus of great concern over the past two decades. Some foods contain inhibitors of element absorption that reduces their availability, such as the excessive consumption of vegetable sources of phytates, oxalates, tannin (e.g. tea), polyphenols and calcium reduce the absorption of non-heme iron. The excessive intake of dietary fiber in associated phytate, plants

61
61
rich in oxalates and fat malabsorption effects the utilization of calcium by the body. At the same time there are many foods containing promoters of essential elements. For example foods rich in vitamin C promote the absorption of non-heme iron (WHO, 1998) (Table7).
Table 7: Promoters and antagonists of the uptake or utilization of inorganic elements from foods.
Essential elements
Promoters Factors reducing availability
Iron Vitamin C, iron in the heam of animal tissues
Excessive consumption of vegetable sources of phyates; a (legumes and whole wheat food) oxalates (e.g. spinach), tannins (e.g. tea), polyphenols (tea) and calcium salts (>500 mg Ca)
Iodine Brassicas consumed in excess; cassava inadequately dried or fermented
Calcium Lactose-containing foods; unidentified factors in milk
Excessive dietary fiber rich in associated phytate; a plants rich in oxalates or uronic acids; fat malabsorption
Zinc Unidentified factors in animal protein
Phyate-rich foodsa (e.g. whole-grain cereal foods) if accompanied by high calcium
Magnesium Potentially
Factors promoting retention or toxicity
Phyate-rich foodsa if dietary calcium high
a Includes maize, brown rice, beans, whole wheat flour and sorghum. Source: WHO (1998)
5.4. Food Safety
Effective national food control systems are essential to protect the health and safety of domestic consumers. They are also critical in enabling countries to assure the safety and quality of their foods entering international trade and to ensure that imported foods conform to national requirements. The new global environment
60
A survey of the levels of pesticide residues and heavy metals, as well as a microbiological analysis of vegetable and fruit present in Ibrahimiya Market, was carried out as part of the situation analysis. The microbiological screening indicated faecal contamination as well as parasitic infestation, especially shigellosis, thus demonstrating that sanitation standards, rather than other contamination factors, are not adequate thus need improving. The contamination levels found were not alarming, except for products eaten without cooking. Here the need for the hygienic education of food handlers and consumers is very important.
Pesticide contamination was absent; although it should be noted that sampling took place in the winter season. However, alarming high lead and cadmium levels were found on fresh fruit and vegetables. This will require extensive preventive measures, and the Task Force is working with the relevant authorities to identify the exact cause of the contamination. The measures will possibly involve the producers, as well as protection from roads with heavy traffic, since it is believed that lead contamination may be due to the extensive use of leaded gasoline and subsequent air, water and soil contamination. It was recommended that soils and water from suppliers’ agricultural land should be monitored. All products were, however, free of mercury contamination.
5.3. Utilization of Essential Elements
The interaction between some micronutrients and food components has been the focus of great concern over the past two decades. Some foods contain inhibitors of element absorption that reduces their availability, such as the excessive consumption of vegetable sources of phytates, oxalates, tannin (e.g. tea), polyphenols and calcium reduce the absorption of non-heme iron. The excessive intake of dietary fiber in associated phytate, plants

62
62
for food trade places considerable obligations on both importing and exporting countries to strengthen their food control systems and to implement and enforce risk-based food control strategies. Consumers are taking unprecedented interest in the way food is produced, processed and marketed, and are increasingly calling for their Governments to accept greater responsibility for food safety and consumer protection (FAO, 2003).
Three main guideline principles govern modern food safety systems and directly impact on their effectiveness, namely: the realization that food safety is multi-sectoral; that food safety should be addressed throughout the farm to fork food continuum; and any decision, measure or approach should be science based (FAO/WHO, 2005).
The status and performance of food safety systems in the Near East region varies considerably from one country to another, reflecting the existing differences in economic conditions and in agricultural and food sector development between the countries of the region. In recent years, an increasing number of these countries have made serious efforts to update and strengthen their food safety systems and infrastructure. Some countries have engaged in profound reform of their food safety system by moving towards the integration of some of the functions of the system and in the introduction of modern risk-based approaches to food safety management. These efforts have led to a relative improvement in the effectiveness of the food safety systems in protecting the health and economic interest of consumers and in enhancing food export capabilities of a number of countries. The situation is, however, far from being adequate as many serious problems continue to persist (FAO/WHO, 2005).
Both types of food hazards exist in the EMR countries: chemical contamination of food and food borne diseases. Foods may be contaminated by harmful metals such as lead, cadmium and mercury. This kind of contamination can be occur during the initial stages of production, and during post-harvest processing, handling

63
63
and preparation. Although most published reports suggest that food contamination with heavy metals in EMR countries is scarce, there are reports indicating that a number of countries have a serious problem, particularly with regard to locally prepared foods, such as street foods (Musaiger and Miladi, 1987).
Foodborne diseases are considered one of the main health problems facing several countries in the Region as these diseases continue to cause a substantial incidence of ill-health. The World Health Organization reported that foodborne disease now represented a major public health problem all over the world. Infants, young children and the elderly are particularly susceptible due to a lower resistance to disease. These diseases can also have major economic impacts through loss of income, manpower, foodstuffs, and an increase in medical care and a decrease in tourism (Kafestein et al, 1992).
Several factors contribute to the occurrence of foodborne diseases in EMR countries: changes food related behavior with an increase in eating outside the home, inadequate training of food handlers, lack of hygienic awareness among both food handlers and the public, inadequate legislations and regulations related to food safety and lack of coordination among the various institutes involving in food safety.
Improvement of Food Safety in the EMR Countries
It is well recognized that without an effective food equality control system, it would be difficult to ensure that food supplies are safe. To obtain an adequate and effective food safety programme in the Near East countries the following measures should be taken into consideration (Musaiger and Meladi, 1997):
1. Revision of the current Food Law. Unfortunately the law is far from being comprehensive in all countries of the region. In view of the rapid technical development in food processing and handling, more attention should be given to updating the
62
for food trade places considerable obligations on both importing and exporting countries to strengthen their food control systems and to implement and enforce risk-based food control strategies. Consumers are taking unprecedented interest in the way food is produced, processed and marketed, and are increasingly calling for their Governments to accept greater responsibility for food safety and consumer protection (FAO, 2003).
Three main guideline principles govern modern food safety systems and directly impact on their effectiveness, namely: the realization that food safety is multi-sectoral; that food safety should be addressed throughout the farm to fork food continuum; and any decision, measure or approach should be science based (FAO/WHO, 2005).
The status and performance of food safety systems in the Near East region varies considerably from one country to another, reflecting the existing differences in economic conditions and in agricultural and food sector development between the countries of the region. In recent years, an increasing number of these countries have made serious efforts to update and strengthen their food safety systems and infrastructure. Some countries have engaged in profound reform of their food safety system by moving towards the integration of some of the functions of the system and in the introduction of modern risk-based approaches to food safety management. These efforts have led to a relative improvement in the effectiveness of the food safety systems in protecting the health and economic interest of consumers and in enhancing food export capabilities of a number of countries. The situation is, however, far from being adequate as many serious problems continue to persist (FAO/WHO, 2005).
Both types of food hazards exist in the EMR countries: chemical contamination of food and food borne diseases. Foods may be contaminated by harmful metals such as lead, cadmium and mercury. This kind of contamination can be occur during the initial stages of production, and during post-harvest processing, handling

64
64
current Food Law, with more emphasis on local situations in each country.
2. Active and effective food inspection services. Food inspection in the Region has concentrated more on general hygienic and sanitation aspects, without taking into consideration the many other sources of food contamination. This is particularly true given the great limitation in facilities and number of health inspectors. Inspection should focus on storage and preservation of foods, cooking methods, cleaning materials and methods, sterilization and disinfection, kitchen design and equipment and control of infestation. This can be done effectively through adoption of the HACCP system.
3. Improve the quality and quantity of analytical services. This can be achieved by training staff and carrying out more chemical tests such as those determining pesticide residues in foods, mycotoxins, food additives, and artificial hormones.
4. Preparation of food standards which are related to the local circumstances in each country. Standards relating to levels of mycotoxins in foods, additives, pesticide residues, and heavy metals are urgently needed. Equipment used in preparation and processing should be standardized to avoid any defect in processing of unsafe foods.
5. Appropriate training for both inspectors and chemists. This should be conducted in two ways: in-service training to update knowledge and improve skills, and overseas training for senior staff to gain skills in specific techniques or advanced methods of inspection and analysis.
6. Revision of the current food inspection organization in order to cover the broader aspects of food control and to increase efficiency.
7. Involvement of other related governmental and private bodies in preparation of food standards, such as the Ministry of

65
65
Agriculture, nongovernmental societies, food factories and so on.
8. Adequate and appropriate educational programmes for the public and food-handlers on the various aspects of food safety. This educational programme should be an integral part of primary health-care education.
5.5. Food Composition Data
Data on food composition are essential for any food consumption surveys. Without adequate data on food composition, it is difficult to obtain accurate information on nutrient intake. The lack of such data in EMR countries may be one of the main reasons for inaccuracy of several surveys in nutrients intake in this Region.
Data on food composition can be used as a tool for nutrition education and to help in planning special diets for therapeutic purposes. These are important steps to prevent and control nutritional problems. In addition, the availability of food composition data will help in studying the relationship between diet and disease, as well as assisting in the design and implementation of food regulations, particularly those associated with nutritional ingredients (Musaiger, 2006).
Food composition activities are receiving renewed attention worldwide. This is due in part to the continuing recognition of the importance of food composition information in formulating policies and programmes to improve nutrition. It is also due to the new and broader applications for food composition data that are currently emerging in marketing, trade and consumer information (Menza, 1999).
Several meetings on establishing food composition tables in EMR countries have been held over the past two decades. The first was held in 1995 in the United Arab Emirates for Arab Gulf countries
64
current Food Law, with more emphasis on local situations in each country.
2. Active and effective food inspection services. Food inspection in the Region has concentrated more on general hygienic and sanitation aspects, without taking into consideration the many other sources of food contamination. This is particularly true given the great limitation in facilities and number of health inspectors. Inspection should focus on storage and preservation of foods, cooking methods, cleaning materials and methods, sterilization and disinfection, kitchen design and equipment and control of infestation. This can be done effectively through adoption of the HACCP system.
3. Improve the quality and quantity of analytical services. This can be achieved by training staff and carrying out more chemical tests such as those determining pesticide residues in foods, mycotoxins, food additives, and artificial hormones.
4. Preparation of food standards which are related to the local circumstances in each country. Standards relating to levels of mycotoxins in foods, additives, pesticide residues, and heavy metals are urgently needed. Equipment used in preparation and processing should be standardized to avoid any defect in processing of unsafe foods.
5. Appropriate training for both inspectors and chemists. This should be conducted in two ways: in-service training to update knowledge and improve skills, and overseas training for senior staff to gain skills in specific techniques or advanced methods of inspection and analysis.
6. Revision of the current food inspection organization in order to cover the broader aspects of food control and to increase efficiency.
7. Involvement of other related governmental and private bodies in preparation of food standards, such as the Ministry of

66
66
(Musaiger and Miladi, 1996). The second meeting was held in 1997 in Cyprus for the Mediterranean countries, and the last one in 1998 in Bahrain for the Near East Region (Musaiger and Meladi, 1998).
In the early seventies, the American University of Beirut published Food Composition Tables for the Middle East. The title was misleading since the data included an analysis of Lebanese foods only, which are also consumed in Jordan and Syrian. It was however, an extremely useful reference (Pellet and Shadarevian, 1970), but although extensively used, suffers from a number of drawbacks (Baba, 1999):
1. Many nutrients are missing e.g. sugar, saturated fats and cholesterol.
2. There was no mention of dietary fiber.
3. Many composite dishes were not analyzed.
4. Vitamins were not accurately determined due to limitations of analytical procedure in the 80s.
5. There is a lack of data on many locally processed foods.
The FAO regional office for the Near East (Cairo), in cooperation with the FAO Food Policy and Nutrition Division (Rome), collected published and unpublished food composition data from different institutions and individuals in the region. These data were complied and published by FAO in 1982 as “Food Composition Tables for the Near East”. This publication covered a limited number of foods, limited nutrients, and in some cases the methods used for analysis are no longer valid. The sampling techniques were not specified (Miladi, 1998).
The collation of a worldwide system of compatible food composition databases lies at the heart of the INFOODS programme. INFOODS - the International Network of Food Data Systems - was established in 1984 and operates under the

67
67
auspices of the Food and Agriculture Organization of the United Nations (FAO) and the United Nations University (UNU). Its goal is to stimulate and coordinate efforts to improve the quality and availability of food analysis data worldwide and to ensure that anyone, anywhere, would be able to obtain adequate and reliable food composition data. It has established a framework for the development of standards and guidelines for the collection, compilation and reporting of food component data (Greenfield and Southgate, 2003).
The INFOODS programme divided the Eastern Mediterranean into several sub-regions: Arab Gulf countries (GULFOODS), North Africa countries (NAFOODS), Middle East countries (MEDFOODS), which include Lebanon, Jordan, Syria, Iraq and Palestine and Egypt, Iran, Pakistan and Sudan as a separate project for each country.
In 2006, the Arab Center for Nutrition released the first Food Composition Table for use in the GCC countries (GULFOODS). This publication was based on the collection of unpublished and published data, as well as chemical analysis of several foods commonly consumed in the Gulf. The book is also includes composition of composite dishes of 5 countries, namely Bahrain, Kuwait, Saudi Arabia, Qatar and Oman (Musaiger, 2006).
Two institutes have been coordinating and cooperating to establish Food Composition Table for Egypt; the National Nutrition Institute and the National Research Center. The result has been the production of two sets of food composition tables. Iran and Pakistan have a national food composition tables, but they are missing some local and ready-to eat foods, and many composite dishes. There are also some limited activities related to the compilation of data on food composition in Tunisia, Morocco and Libya.
It would be most useful if the WHO/EMRO in collaboration with FAO/Near East, could establish a project to compile food composition data for the EMR countries. The details for
66
(Musaiger and Miladi, 1996). The second meeting was held in 1997 in Cyprus for the Mediterranean countries, and the last one in 1998 in Bahrain for the Near East Region (Musaiger and Meladi, 1998).
In the early seventies, the American University of Beirut published Food Composition Tables for the Middle East. The title was misleading since the data included an analysis of Lebanese foods only, which are also consumed in Jordan and Syrian. It was however, an extremely useful reference (Pellet and Shadarevian, 1970), but although extensively used, suffers from a number of drawbacks (Baba, 1999):
1. Many nutrients are missing e.g. sugar, saturated fats and cholesterol.
2. There was no mention of dietary fiber.
3. Many composite dishes were not analyzed.
4. Vitamins were not accurately determined due to limitations of analytical procedure in the 80s.
5. There is a lack of data on many locally processed foods.
The FAO regional office for the Near East (Cairo), in cooperation with the FAO Food Policy and Nutrition Division (Rome), collected published and unpublished food composition data from different institutions and individuals in the region. These data were complied and published by FAO in 1982 as “Food Composition Tables for the Near East”. This publication covered a limited number of foods, limited nutrients, and in some cases the methods used for analysis are no longer valid. The sampling techniques were not specified (Miladi, 1998).
The collation of a worldwide system of compatible food composition databases lies at the heart of the INFOODS programme. INFOODS - the International Network of Food Data Systems - was established in 1984 and operates under the

68
68
implementing such a project were discussed in a previous meeting in Bahrain in 1998 (see Appendix 2).
5.6. Food-Based Dietary Guidelines
Food-based dietary guidelines (FBDGs) are needed because consumers focus on foods, not nutrients, in choosing what to eat. Individuals must be provided with guidance on choice of foods in order to prevent both nutrient deficiencies and chronic disease. The development of FBDGs is not a simple matter. It should be informed by public health issues (the science-based dietary guidelines); the social, economic, agricultural and environmental factors affecting food availability; and eating patterns and food patterns (not numerical goals). FBDGs should provide positive messages encouraging enjoyment of appropriate dietary intakes while acknowledging that a wide range of dietary patterns can be consistent with good health (Anderson, 1998).
Several efforts have been carried out in the Region to establish FBDGs. The first meeting was in Cyprus in 1996 (WHO/FAO, 1996), the second in Jordan in 1998 (Musaiger and Miladi, 2002), and the last one was in Egypt in 2004 (WHO/FAO, 2006). All these meetings emphasised on the importance of FBDGs to promote healthy nutrition and lifestyle.
The last meeting in Cairo, Egypt (FAO/WHO, 2006) concluded that:
The countries in the region are at different stages of nutrition transition and so face the entire spectrum of nutritional conditions.
FBDGs remain an important educational and communication tool in addressing the burden of nutritional conditions. They have great potential for placing nutritional concerns on the national agenda, providing guidance for food and nutrition education activities. They can also identify policy options for food supply and demand that promote lifelong healthy eating
69
69
patterns, influencing the nutrition transition towards healthier outcomes and a decrease in the economic burden of disease.
Physical activity messages should be closely integrated with food-related messages in the dietary guidelines of this region.
FBDGs could contribute substantially to the implementation of other initiatives to promote healthy diets.
A considerable amount of basic and supportive data to enable the development of national FBDGs already exists in all countries that participated in the consultation. External technical assistance may be required for further analyses in order to generate appropriate information in a number of countries.
In order to develop and implement effective FBDGs, key stakeholders need to be involved in the process, such as the ministries of health, agriculture, education, commerce, finance and planning, research institutions and universities, consumer groups, United Nations agencies, nongovernmental organizations, private sector and other relevant bodies.
In order to utilize the available resources within the Region for the development of FBDGs, several countries with similar social, health and economic characteristics could consider the possibility of pooling their available resources and developing a common FBDG, where appropriate.
The meeting also put a set of recommendations to establish a FBDG in the Region (FAO/WHO, 2006):
1. In view of the dual burden of nutritional problems affecting countries in the Region, immediate action should be taken at the country level to follow up on the development and implementation of their FBDGs.
2. FBDG development and implementation is an ongoing process. Countries that have already initiated work on their national
68
implementing such a project were discussed in a previous meeting in Bahrain in 1998 (see Appendix 2).
5.6. Food-Based Dietary Guidelines
Food-based dietary guidelines (FBDGs) are needed because consumers focus on foods, not nutrients, in choosing what to eat. Individuals must be provided with guidance on choice of foods in order to prevent both nutrient deficiencies and chronic disease. The development of FBDGs is not a simple matter. It should be informed by public health issues (the science-based dietary guidelines); the social, economic, agricultural and environmental factors affecting food availability; and eating patterns and food patterns (not numerical goals). FBDGs should provide positive messages encouraging enjoyment of appropriate dietary intakes while acknowledging that a wide range of dietary patterns can be consistent with good health (Anderson, 1998).
Several efforts have been carried out in the Region to establish FBDGs. The first meeting was in Cyprus in 1996 (WHO/FAO, 1996), the second in Jordan in 1998 (Musaiger and Miladi, 2002), and the last one was in Egypt in 2004 (WHO/FAO, 2006). All these meetings emphasised on the importance of FBDGs to promote healthy nutrition and lifestyle.
The last meeting in Cairo, Egypt (FAO/WHO, 2006) concluded that:
The countries in the region are at different stages of nutrition transition and so face the entire spectrum of nutritional conditions.
FBDGs remain an important educational and communication tool in addressing the burden of nutritional conditions. They have great potential for placing nutritional concerns on the national agenda, providing guidance for food and nutrition education activities. They can also identify policy options for food supply and demand that promote lifelong healthy eating

70
70
FBDG should expedite the process. Countries that have not initiated development of FBDGs should organize follow-up meetings and set up a steering committee.
3. Regular regional and sub-regional follow-up meetings should be organized to report progress, share experiences and lessons learned in the development and implementation of FBDGs. FAO and WHO should facility this process.
4. An email list should be established among countries to facilitate the dissemination of information and sharing of experiences on the development and implementation of FBDGs in the Region.
5. Resources for the development and implementation of FBDGs should be identified by countries. In addition, assistance from international organizations may be solicited, as required.
6. Intersectoral cooperation is essential for the development of successful FBDGs. Based on available information; intersectional cooperation should be strengthened in most countries.
7. Physical activity recommendations should be integrated into the FBDGs throughout the Region.
Experience of the Arab Countries in the Gulf
The action needed to promote healthy nutrition and a healthy lifestyle has already been emphasized at two meetings in Arab Gulf countries (Musaiger and Miladi, 1998, FAO/WHO, 2006). In 1997, the first workshop on Diet, Nutrition and a Healthy Lifestyle in the Arab Gulf countries was held in Manama, Bahrain. Two main recommendations were proposed: establishing food-based dietary guidelines (FBDG) for the Arab Gulf countries, and promoting a healthy lifestyle in these countries (Musaiger and Miladi, 1998).

71
71
The FBDGs for the GCC countries were developed through 6 steps process: 1) Determining the purpose and goals for establishing FBDGs, 2) Clarifying the characteristics of FBDGs, 3) Determining food consumption patterns, 4) Reviewing the food and nutritional status of each county. 5) Determining the lifestyle patterns that are associated with diet-related diseases. 6) Formulation of the FBDGs.
The FBDGs consist of 14 simple and practical recommendations that take into consideration the socio-cultural status and nutritional problems in the Arab Gulf countries. The FBDGs can be a useful tool in educating the public about healthy eating and preventing of diet-related chronic diseases. However, further testing of these guidelines is needed in order to determine the understanding of the messages by target population (Musaiger et al, 2007).
Food-Based Dietary Guidelines for Arab Countries of the Gulf
Box: Food-based Dietary Guidelines for Arab Countries of the Gulf
(To prevent and control diet-related disease)
1. Eat a variety of foods every day.
2. East an adequate amount of fruit and vegetables daily.
3. Eat meat, fish, chicken, legumes and nuts regularly.
4. Make sure that the daily diet contains an adequate amount of cereals and their products.
5. Consume an adequate amount of milk and products every day.
6. Reduce intake of food rich in fat.
7. Reduce the intake of food and drinks that are high in sugar content.
70
FBDG should expedite the process. Countries that have not initiated development of FBDGs should organize follow-up meetings and set up a steering committee.
3. Regular regional and sub-regional follow-up meetings should be organized to report progress, share experiences and lessons learned in the development and implementation of FBDGs. FAO and WHO should facility this process.
4. An email list should be established among countries to facilitate the dissemination of information and sharing of experiences on the development and implementation of FBDGs in the Region.
5. Resources for the development and implementation of FBDGs should be identified by countries. In addition, assistance from international organizations may be solicited, as required.
6. Intersectoral cooperation is essential for the development of successful FBDGs. Based on available information; intersectional cooperation should be strengthened in most countries.
7. Physical activity recommendations should be integrated into the FBDGs throughout the Region.
Experience of the Arab Countries in the Gulf
The action needed to promote healthy nutrition and a healthy lifestyle has already been emphasized at two meetings in Arab Gulf countries (Musaiger and Miladi, 1998, FAO/WHO, 2006). In 1997, the first workshop on Diet, Nutrition and a Healthy Lifestyle in the Arab Gulf countries was held in Manama, Bahrain. Two main recommendations were proposed: establishing food-based dietary guidelines (FBDG) for the Arab Gulf countries, and promoting a healthy lifestyle in these countries (Musaiger and Miladi, 1998).

72
72
8. Reduce the intake of sodium and salty foods.
9. Consume an adequate amount of water and other liquids daily.
10. Maintain an appropriate weight for your height.
11. Make physical activity a part of your daily routine.
12. Do not smoke and reduce the risk of exposure to smoking environment.
13. Avoid drinking alcoholic beverages.
14. Ensure safety of food eaten.
5.7. Calculating Dietary Intake Using Food Consumption Surveys
National surveys related to actual nutrient intake are limited and have many drawbacks. The findings of these studies are controversial. Some studies have shown a higher intake than the recommended daily allowances (RDA) for energy, protein, fat and some nutrients, while other surveys have shown a lower intake for these nutrients. For example, the national nutrition survey in Tunisia reveals that the daily intake of energy was lower than the RDA for all age groups, except for the elderly (≥ 60 years), whereas the daily protein intake was higher in all age groups (Qanji et al, 2002). In Egypt, Mahmoud (2004) found that the intake of energy, protein and folacin by women was adequate. However, the intake of calcium, iron and most vitamins was below the RDA.
In Morocco, Belgnaoui and Belahsen (2006) found that the mean intake of energy, protein, vitamin C and E, magnesium and phosphorus of pregnant women was higher than the RDA. In general, 82.6% of pregnant women in urban areas had an intake higher than 100% of RDA. In contrast, Mossa and Zein (1996) found that 100% of the pregnant women in Bahrain had an energy

73
73
intake below the RDA during the first semester, 64% in second semester and 45% in third semester.
In general, it is very difficult to calculate dietary intake if depends on currently available food consumption surveys in the Region. This is due to the following drawbacks:
1. The absence of comparative food composition tables for use in the country or the Region. Most of the available food composition tables missed many local and imported foods, as well as some essential nutrients. This makes the calculation values of food intake a bit difficult to do with any accuracy.
2. The difficulty in obtaining actual quantity of ingredients used in composite dishes.
3. The difficulty in obtaining of actual food intake for each member in the family, due to the common habit of eating together from the same plate, particularly in the rural and poorer areas.
4. The lack of qualified and trained staff available to collect the food intake.
5. The absence of local software programmes to calculate the nutrient intake.
It is mentioning that, most of consumption surveys in the Region are limited in some areas in the country and not national-based. Therefore, it is difficult to compare the data from food balance sheet with data based on specific area in the country. This creates the need for a standardize method and procedure to carry out national-based food consumption surveys in the EMR countries.
72
8. Reduce the intake of sodium and salty foods.
9. Consume an adequate amount of water and other liquids daily.
10. Maintain an appropriate weight for your height.
11. Make physical activity a part of your daily routine.
12. Do not smoke and reduce the risk of exposure to smoking environment.
13. Avoid drinking alcoholic beverages.
14. Ensure safety of food eaten.
5.7. Calculating Dietary Intake Using Food Consumption Surveys
National surveys related to actual nutrient intake are limited and have many drawbacks. The findings of these studies are controversial. Some studies have shown a higher intake than the recommended daily allowances (RDA) for energy, protein, fat and some nutrients, while other surveys have shown a lower intake for these nutrients. For example, the national nutrition survey in Tunisia reveals that the daily intake of energy was lower than the RDA for all age groups, except for the elderly (≥ 60 years), whereas the daily protein intake was higher in all age groups (Qanji et al, 2002). In Egypt, Mahmoud (2004) found that the intake of energy, protein and folacin by women was adequate. However, the intake of calcium, iron and most vitamins was below the RDA.
In Morocco, Belgnaoui and Belahsen (2006) found that the mean intake of energy, protein, vitamin C and E, magnesium and phosphorus of pregnant women was higher than the RDA. In general, 82.6% of pregnant women in urban areas had an intake higher than 100% of RDA. In contrast, Mossa and Zein (1996) found that 100% of the pregnant women in Bahrain had an energy

74
74
6. FOOD CONSUMPTION PATTERN AND ITS RELATION TO CHRONIC DISEASES IN THE EMR
COUNTRIES
6.1. Obesity and Overweight
Obesity has reached epidemic proportion in the Eastern Mediterranean Region, particularly among high and middle income countries. It is estimated that more than 20% of adolescents and more than 40% of adults are suffered from overweight and obesity in the EMR countries (Musaiger, 2004). Several dietary factors in the Region contributed to the high prevalence of obesity in the EMR countries. Among these factors are low dietary intake of fiber and complex carbohydrates, high intake of fat and energy-dense foods and large portion sizes (Box 1).
Box 1: Food consumption pattern risks associated with obesity in the EMR countries
1. Low intake of fruit, vegetables and complex carbohydrates.
2. High intake of sugary drinks and juices.
3. High intake of energy-dense foods (e.g. rich fat and carbohydrates).
4. Intake of large protein size of foods.
5. Eating outside the home.
6.2. Cardiovascular Disease (CVD)
Cardiovascular disease is the main cause of death in EMR countries. It is estimated that 25-35% of total deaths is due to CVD

75
75
in most countries of the Region (WHO/EMRO, 2009). The rise in CVD in this region reflects a significant change in food consumption patterns, physical activity and tobacco consumption. The low intake of vegetable and fruits, whole grains cereals and fish and fish oils, in addition to high intake fat, salty foods and alcohol (in some countries) are the main dietary risk factors associated with CVD in the EMR countries (Box 2).
Box 2: Food consumption pattern risks associated with CVD in EMR countries
1. Low intake of fruit and vegetables.
2. High intake of fat (especially saturated fat and trans fatty acids).
3. High intake of salty foods and salt.
4. Low intake of fish and fish oils.
6.3. Diabetes
The incidence of diabetes in the EMR countries has been growing rapidly over the past 3 decades, making diabetes one of the main health problems in the Region. Obesity, physical inactivity, maternal diabetes and dietary habits are among the most important risk factors contributing to high incidence of diabetes in the Region. The possible dietary risk factors associated with diabetes in this Region are listed in Box 3. The low intake of high dietary fiber and high intake of fat are the main dietary risk factors.
74
6. FOOD CONSUMPTION PATTERN AND ITS RELATION TO CHRONIC DISEASES IN THE EMR
COUNTRIES
6.1. Obesity and Overweight
Obesity has reached epidemic proportion in the Eastern Mediterranean Region, particularly among high and middle income countries. It is estimated that more than 20% of adolescents and more than 40% of adults are suffered from overweight and obesity in the EMR countries (Musaiger, 2004). Several dietary factors in the Region contributed to the high prevalence of obesity in the EMR countries. Among these factors are low dietary intake of fiber and complex carbohydrates, high intake of fat and energy-dense foods and large portion sizes (Box 1).
Box 1: Food consumption pattern risks associated with obesity in the EMR countries
1. Low intake of fruit, vegetables and complex carbohydrates.
2. High intake of sugary drinks and juices.
3. High intake of energy-dense foods (e.g. rich fat and carbohydrates).
4. Intake of large protein size of foods.
5. Eating outside the home.
6.2. Cardiovascular Disease (CVD)
Cardiovascular disease is the main cause of death in EMR countries. It is estimated that 25-35% of total deaths is due to CVD

76
76
6.4. Cancer
Cancer is becoming an increasingly important factor contributing to the burden of diseases in the EMR countries. It is estimated that 7-12% of total deaths in most countries of the Region is due to cancer (WHO/EMRO, 2009). Dietary factors are estimated to account for about 30% of cancers in Western countries. As most EMR countries become urbanized, patterns of cancer tend to shift towards the patterns of developed countries, especially cancers associated with diet and physical activity. Cancer rates also change as population move between countries and adopt different dietary patterns (Salim et al, 2009). Among the most important dietary risk factors related to cancer in the Region are: the low intake of fruit and vegetables, which increases the risk of oral, cavity, stomach and colorectal cancer, and high intake of salty foods which is associated with stomach cancer (Box 4).
Box 4: Food consumption patterns in EMR countries
Possible risk of cancer
Low intake of fruit and vegetables Oral, cavity, stomach, colorectum
High intake of red meat Colorectum
High salt-preserved foods and salt Stomach
Habits of drinking very hot (thermally)drinks and foods
Oral cavity, pharynx, osteophagus
Low intake of dietary fiber Colorectum
Box 3: Food consumption pattern risks associated with diabetes in the EMR countries
1. Low intake of food rich in dietary fiber.
2. High intake of food rich in fat (especially saturated fat).
3. Short duration of exclusive breastfeeding.
4. High intake of food with high glycemic index.

77
77
6.5. Osteoporosis
The prevalence of osteoporosis in the EMR countries is increasing gradually, which is mainly due to an increase in the elderly population. Dietary habits and physical inactivity are the main causes of this disease. Low intake of vitamin D and calcium may be the most attributable dietary risk for osteoporosis in the Region. Vitamin D deficiency is mainly a result of low sunlight exposure and inadequate dietary intake of vitamin D. Studies in the EMR region reveal to a high prevalence of vitamin D deficiency among both children and adults (Meaalouf et al, 2006). The main dietary factors that are possibly associated with the prevalence of osteoporosis in the EMR countries are summarized in Box 5.
Box 5: Food consumption pattern risks associated with osteoporosis in the EMR countries
1. Low intake of food rich in vitamin D.
2. Low intake of food rich in calcium (particularly that from dairy products).
3. Low intake of fruits and vegetables.
4. High intake of salty foods and salt (sodium)
5. Low protein intake (in older people).
6.6. Anaemia
Anaemia remains a global public health problem. Iron Deficiency Anaemia (IDA) is considered the most common type of anemia in the Region. Studies have showed that prevalence of IDA in the GCC countries is 20-60% among preschoolers, 13-50% among school aged children and 23-54% in women of childbearing age (Musaiger, 2002). Other studies in the region have similarly shown the prevalence among preschoolers to be 17-70%, with it being
76
6.4. Cancer
Cancer is becoming an increasingly important factor contributing to the burden of diseases in the EMR countries. It is estimated that 7-12% of total deaths in most countries of the Region is due to cancer (WHO/EMRO, 2009). Dietary factors are estimated to account for about 30% of cancers in Western countries. As most EMR countries become urbanized, patterns of cancer tend to shift towards the patterns of developed countries, especially cancers associated with diet and physical activity. Cancer rates also change as population move between countries and adopt different dietary patterns (Salim et al, 2009). Among the most important dietary risk factors related to cancer in the Region are: the low intake of fruit and vegetables, which increases the risk of oral, cavity, stomach and colorectal cancer, and high intake of salty foods which is associated with stomach cancer (Box 4).
Box 4: Food consumption patterns in EMR countries
Possible risk of cancer
Low intake of fruit and vegetables Oral, cavity, stomach, colorectum
High intake of red meat Colorectum
High salt-preserved foods and salt Stomach
Habits of drinking very hot (thermally)drinks and foods
Oral cavity, pharynx, osteophagus
Low intake of dietary fiber Colorectum
Box 3: Food consumption pattern risks associated with diabetes in the EMR countries
1. Low intake of food rich in dietary fiber.
2. High intake of food rich in fat (especially saturated fat).
3. Short duration of exclusive breastfeeding.
4. High intake of food with high glycemic index.

78
78
lower in adolescents (14-42%) and around 11-49% in pregnant women (Bagchi et al, 2004).
Several dietary factors can be attributed to causing of anaemia. A low intake of total iron, high consumption of non-heme compared to heme iron, low intake of foods rich in vitamin C, high intake of foods contain iron-inhibiting factors and unhealthy eating habits are the main dietary factors associated with anaemia in the EMR countries (Box 6).
Box 6: Food consumption pattern risks associated with anaemia in the EMR countries
1. Low intake of food rich in iron, especially heme-iron.
2. Low intake of food rich in vitamin C (mostly fruit and vegetables).
3. High intake of food contains iron-inhibiting factors (tannins and phytaters).
Dietary Iron Availability
Available iron in the diet should be sufficient to reduce the currently high prevalence of iron deficiency. Iron from plant origin (non-heme iron) is generally poorly absorbed by the body. Animal foods and ascorbate are important enhancers of non-heam iron, while phytates, polyphenols, tannins and fiber lower it. Thus, recent RNIs are defined in terms of very low (<5%) low (5-10%), intermediate (11-18%) and high (>19%) bioavailability. This is based on composition of the diet. The bioavailability increased as animal based food increased in the diet (WHO, 1998).
There is no significant change in iron availability during the past two decades in all countries in the Region. Vegetable-origin is the main source of iron, even in high income countries. The vegetable-origin iron available for consumption in 2003-05 ranged from 6.8 mg/person/day in Djibouti to 16.4 mg/person/day in Egypt.

79
79
Whereas, the availability of animal-origin ranged from 1.1 mg/person/day in Yemen to 3.8 mg/person/day in both Kuwait and UAE. There is a good relationship between the income of a country and availability of animal iron. The rich countries, such as the GCC countries have the highest availability, followed by middle income countries. The low income countries such as Djibouti, Palestine, Pakistan and Yemen have the lowest availability of iron. The exception is Sudan, where the iron availability is relatively higher (Table 8). This is confirming by the previous data as Sudan consumed more livestock foods than the other Middle and Low income countries in the Region.
78
lower in adolescents (14-42%) and around 11-49% in pregnant women (Bagchi et al, 2004).
Several dietary factors can be attributed to causing of anaemia. A low intake of total iron, high consumption of non-heme compared to heme iron, low intake of foods rich in vitamin C, high intake of foods contain iron-inhibiting factors and unhealthy eating habits are the main dietary factors associated with anaemia in the EMR countries (Box 6).
Box 6: Food consumption pattern risks associated with anaemia in the EMR countries
1. Low intake of food rich in iron, especially heme-iron.
2. Low intake of food rich in vitamin C (mostly fruit and vegetables).
3. High intake of food contains iron-inhibiting factors (tannins and phytaters).
Dietary Iron Availability
Available iron in the diet should be sufficient to reduce the currently high prevalence of iron deficiency. Iron from plant origin (non-heme iron) is generally poorly absorbed by the body. Animal foods and ascorbate are important enhancers of non-heam iron, while phytates, polyphenols, tannins and fiber lower it. Thus, recent RNIs are defined in terms of very low (<5%) low (5-10%), intermediate (11-18%) and high (>19%) bioavailability. This is based on composition of the diet. The bioavailability increased as animal based food increased in the diet (WHO, 1998).
There is no significant change in iron availability during the past two decades in all countries in the Region. Vegetable-origin is the main source of iron, even in high income countries. The vegetable-origin iron available for consumption in 2003-05 ranged from 6.8 mg/person/day in Djibouti to 16.4 mg/person/day in Egypt.

80
80
Table 8: Dietary Iron Available for Human Consumption in the EMR countries (1990-2005)
Animal and vegetable iron (mg/person/day)
Country name 1990-92 1995-97 2003-05
Animal
origin
Vegetable
origin
Animal
origin
Vegetable
origin
Animal
origin
Vegetable
origin
Djibouti 1.3 6.6 1.3 5.8 1.3 6.8
Egypt 1.3 14.5 1.4 15.8 1.6 16.4
Iran 1.7 10.7 1.8 11.2 2.0 11.2
Jordan 1.8 9.0 1.6 8.1 1.4 9.1
Kuwait 3.0 9.1 4.4 11.9 3.8 11.6
Lebanon 2.0 13.6 2.1 14.3 2.7 13.6
Libyan 2.1 12.2 2.1 12.7 1.8 11.0
Morocco 1.4 13.5 1.4 12.7 1.5 14.4
Palestine - - 1.5 8.9 1.4 11.0
Pakistan 1.3 7.6 1.4 8.1 1.4 7.4
Saudi Arabia 2.3 11.3 2.4 12.5 2.5 12.1
Sudan 1.5 14.3 1.9 15.4 2.1 14.1
Syrian 1.6 9.3 1.7 9.3 1.9 11.8
Tunisia 1.4 12.9 1.6 13.1 1.7 13.2
United Arab Emirates 4.5 14.7 5.0 13.6 3.8 12.9
Yemen 0.8 9.1 0.7 8.6 1.1 8.5
FAO (2009)

81
81
7. CONLUSION AND RECOMMENDATIONS
Conclusion
There has been a great change in food consumption patterns in most EMR countries during the past four decades. The per capita availability of energy increased by 716 kcal during 1964-1999, and is projected to reach 880 kcal by 2030. This makes the average daily per capita energy availability in excess of 3000 kcal in most countries of the Region. Although, the change in food consumption patterns is not the same in all EMR countries, the traditional diet which consisted of complex carbohydrates, fruit and vegetables has been replaced with a more diversified diet, characterized by an excessive intake of energy-dense food rich in fat and free sugars, and deficient in complex carbohydrates.
These changes in food consumption patterns in addition to the change in lifestyle have led to an increase in the prevalence of diet-related chronic-diseases such as cardiovascular disease, diabetes, hypertension, obesity and cancer. These diseases have become the major health problem in most EMR countries, and account for more than 50% of total annual deaths.
Recommendations
Data on food consumption patterns with actual nutrient intake in the EMR countries are at most scanty. There is an urgent need to initiate and implement activities that will enhance the current status of available data, which in turn will help in preparing a nutrition 'plan of action' for these countries. Some suggested activities can be as the following:
1. To compile data on composition of food consumed in the Region in order to establish Food Composition Tables for EMR countries. Such a project firstly requires the organization of a workshop to discuss the facilities, steps needed and the institutes which could be involved in
80
Table 8: Dietary Iron Available for Human Consumption in the EMR countries (1990-2005)
Animal and vegetable iron (mg/person/day)
Country name 1990-92 1995-97 2003-05
Animal
origin
Vegetable
origin
Animal
origin
Vegetable
origin
Animal
origin
Vegetable
origin
Djibouti 1.3 6.6 1.3 5.8 1.3 6.8
Egypt 1.3 14.5 1.4 15.8 1.6 16.4
Iran 1.7 10.7 1.8 11.2 2.0 11.2
Jordan 1.8 9.0 1.6 8.1 1.4 9.1
Kuwait 3.0 9.1 4.4 11.9 3.8 11.6
Lebanon 2.0 13.6 2.1 14.3 2.7 13.6
Libyan 2.1 12.2 2.1 12.7 1.8 11.0
Morocco 1.4 13.5 1.4 12.7 1.5 14.4
Palestine - - 1.5 8.9 1.4 11.0
Pakistan 1.3 7.6 1.4 8.1 1.4 7.4
Saudi Arabia 2.3 11.3 2.4 12.5 2.5 12.1
Sudan 1.5 14.3 1.9 15.4 2.1 14.1
Syrian 1.6 9.3 1.7 9.3 1.9 11.8
Tunisia 1.4 12.9 1.6 13.1 1.7 13.2
United Arab Emirates 4.5 14.7 5.0 13.6 3.8 12.9
Yemen 0.8 9.1 0.7 8.6 1.1 8.5
FAO (2009)

82
82
this project, as well as the time frame and plan of action for preparing these Tables.
2. To prepare a manual for conducting food consumption surveys, taking into consideration the various social and cultural factors of the countries in the Region.
3. To conduct training courses in up-to-date methods for collecting food intake data, analysis and presentation of findings for nutritionists and other health workers involved in collecting and analyzing data on food consumption patterns.
4. To prepare Food-Based Dietary Guidelines (FBDGs) that can be used as a guide for establishing FBDGs for each country or for a group of countries in the Region.
5. It is very important to put more emphasis on issues linked with food consumption patterns, and that have an effect on the health of people, such as street foods, food safety, subsidization policy and pricing of foods.

83
83
8. REFERENCES
Al-Rukban MO (2003): Obesity among Saudi male adolescents in Riyadh, S, Arabia. Saudi Med J, 24, 1, 27-37.
American Institute for Cancer Research (AICR) (2007): Food, Nutrition, Physical Activity, and the Prevention of Cancer: a Global Perspective. Washington, DC.
Anderson GH (1998): Developing and implementing science-based dietary guidelines. Bah Med Bull, 20, 3,123-127
Baba N (1998): Establishing Food Composition Data for Lebanon. In Musaiger & Miladi (ed): Establishing Food Composition Data for the Near East, FAO / Cairo, pp 9 – 16
Bagchi K. (2004): Iron deficiency anemia- an old enemy. Eastern Mediterranean Health Journal, 10 (6): 754-760
Bahrain Medical Bulletin (special issue), 20, 3, pp 1 – 127
Belgnaoui S and Belahsen R (2006): Nutrient intake and food consumption among pregnant women from an agricultural region of Morocco. Int J Food Science Nutrition. 57, 1, 19-27.
Bryan FL, Teufel P, and Riaz S et al (1992): Hazards and critical control points of street-vended chat, a regionally popular food in Pakistan. Journal of food protection, 55, 9, 708-713.
Btuinsma (ed) (2003): World Agriculture towards 2015/2080, An FAO Prospective. FAO, Rome and Earthscan, London.
Dastgiri S, Mahdavi R, and TuTunchi H et al (2006): Prevalence of obesity, food choices and socio-economic status: a cross-sectional study in the north-west of Iran. Public Health Nutrition, 9, 8, 996-1000.
82
this project, as well as the time frame and plan of action for preparing these Tables.
2. To prepare a manual for conducting food consumption surveys, taking into consideration the various social and cultural factors of the countries in the Region.
3. To conduct training courses in up-to-date methods for collecting food intake data, analysis and presentation of findings for nutritionists and other health workers involved in collecting and analyzing data on food consumption patterns.
4. To prepare Food-Based Dietary Guidelines (FBDGs) that can be used as a guide for establishing FBDGs for each country or for a group of countries in the Region.
5. It is very important to put more emphasis on issues linked with food consumption patterns, and that have an effect on the health of people, such as street foods, food safety, subsidization policy and pricing of foods.

84
84
Delgado CL (2003): Rising consumption of meat and milk in developing countries has created a new food revolution. J. Nutr., 133, 3907S-3910S.
Dyson T (1999): World food trends and prospects to 2025. Proc. Natl. Acad. Sci. USA, 96, 5929-5936.
El-Sherbeeny MR, Saddik MF, and Bryan FL (1985): Microbiological profiles of foods served by street vendors in Egypt. International Journal of Food Microbiology, 2, 6, 355-364.
Esmaillzadeh A, and Azadbakht (2008): Major dietary patterns in relation to general obesity and central adiposity among Iranian women. J. Nutr. 138, 358-363.
FAO (1987): Changes in food supplies and consumption patterns in the Near East Region. FAO, Rome, Italy.
FAO (1997): Street Food. Rome. Italy.
FAO (2003): Assuring food safety and quality: Guidelines for strengthening national food control systems. Food and Agriculture Organization and World Health Organization, Rome.
FAO (2009a): Food Balance Sheet, Rome, Italy.
FAO/WHO (2005): Regional Meeting on Food Safety for the Near East, Amman, Jordan, 5 – 6 March 2005. FAO/regional Office, Cairo.
FAO/WHO (2006): Technical Consultation on National Food-Based Dietary Guidelines. FAO/Cairo, WHO/EMRO, Cairo, Egypt.
Gehart, J. D. (1986): Food production and nutrition in the Middle East. In: Nygaard F., Pellet P.L. (eds). Dry Cereal, Agriculture, Food Science and Human Nutrition. Pergamon Press, London, 159-174.
Gehlhar M, and Regmi A (2005): New Directions in Global Food Markets: Factors shaping global food markets. Agriculture Information Bulliten, 794, 5-17.

85
85
Greenfield H and Southgate DAT (2003): Food Composition Data. FAO, Rome, Italy.
Hark L and Deen D (2005): Nutrition for Life. Dorling Kindersley. UK.
Hydrie MZI, Basit A, and Badruddin N et al (2004): Diabetes risk factors in middle income Pakistani school children. Pakistan Journal of Nutrition, 3, 1, 43-49.
Lock Karen, Pomerleau J, Causer L et al (2005): The global burden of disease attributable to low consumption of fruit and vegetable. Bull World Health Org. 83, 2, 100-108.
Maalouf G., Salem S, Sandid M. Attallah, P, Eid,J., Saliba N., Nehme I. and Johnell O (2003): Bone Mineral Density of the Lebanese Reference population. Osteoporosis Int. 11, 9, 756-764.
Mahmood A et al (2004): Nutritional status and anthropometric measurements among women in Egypt. Arab J Food Nutr. 11, 5, 98 - 107
Mamarabachi, D., Pellet, P. L., Basha, H. M. and Djani F. (1980). Observations on nutritional marasmus in a newly rich nation. Ecol Food Nutr 9, 43-54.
McCridle BW and Wengle JG (2005): Get a Healthy Weight for your Child. Rebert Rose Inc. Canada.
McMichael AJ, Powles JW, and Butler CD et al (2007): Food, livestock production, energy, climate change, and health. Lancet, 370, 1253-1263.
Menza V (1998): The Use of Food Composition Data. In Musaiger & Miladi (ed):establishing Food Composition Data for the Near East, FAO / Cairo, pp 3 – 8
Michaelsen KF, Hoppe C, and Roos N et al (2009): Choice of foods and ingredients for moderately malnourished children 6 months to 5 years of age. Food and Nutrition Bulletin, 30, 3, S343-S397.
84
Delgado CL (2003): Rising consumption of meat and milk in developing countries has created a new food revolution. J. Nutr., 133, 3907S-3910S.
Dyson T (1999): World food trends and prospects to 2025. Proc. Natl. Acad. Sci. USA, 96, 5929-5936.
El-Sherbeeny MR, Saddik MF, and Bryan FL (1985): Microbiological profiles of foods served by street vendors in Egypt. International Journal of Food Microbiology, 2, 6, 355-364.
Esmaillzadeh A, and Azadbakht (2008): Major dietary patterns in relation to general obesity and central adiposity among Iranian women. J. Nutr. 138, 358-363.
FAO (1987): Changes in food supplies and consumption patterns in the Near East Region. FAO, Rome, Italy.
FAO (1997): Street Food. Rome. Italy.
FAO (2003): Assuring food safety and quality: Guidelines for strengthening national food control systems. Food and Agriculture Organization and World Health Organization, Rome.
FAO (2009a): Food Balance Sheet, Rome, Italy.
FAO/WHO (2005): Regional Meeting on Food Safety for the Near East, Amman, Jordan, 5 – 6 March 2005. FAO/regional Office, Cairo.
FAO/WHO (2006): Technical Consultation on National Food-Based Dietary Guidelines. FAO/Cairo, WHO/EMRO, Cairo, Egypt.
Gehart, J. D. (1986): Food production and nutrition in the Middle East. In: Nygaard F., Pellet P.L. (eds). Dry Cereal, Agriculture, Food Science and Human Nutrition. Pergamon Press, London, 159-174.
Gehlhar M, and Regmi A (2005): New Directions in Global Food Markets: Factors shaping global food markets. Agriculture Information Bulliten, 794, 5-17.
86
86
Miladi S (1998): Food Composition Activities in the Near East Region. In Musaiger & Miladi (ed): establishing Food Composition Data for the Near East, FAO / Cairo, pp 9 – 16
Ministry of Health (MOH) (1997). Comprehensive Nutrition Survey. Khartoum, Sudan.
Moosa K, and Zein ZA (1996): Assessment of the iron status and dietary intakes of pregnant women in Bahrain. Ministry of Health, Kingdom of Bahrain.
Musaiger AO, Takruri H, Sadiq A, Abu-Tarboush H and Miladi S (2007): Food-based Dietary Guideline for Arab Gulf Countries. Arab J. Food Nutrition, 8, 18, 94-113.
Musaiger AO (1993): Socio-cultural and economic factors affecting food consumption patterns in the Arab countries. J. Roy. Soc. Health, 113, 2, 68-74.
Musaiger AO (1993): Socio-cultural and economic factors affecting food consumption patterns in the Arab countries. J. Royal Society Health. 113, 69-75.
Musaiger AO (2000): Food consumption pattern and prevalence of chronic diseases among adult citizens in the Emirati society. Arab Journal of Food and Nutrition, 1, 2, 8-22.
Musaiger AO (2002): Diet and prevention of coronary heart disease in the Arab Middle
Musaiger AO (2002): Iron deficiency anaemia in the Arab Gulf countries: the need for action. Nutr Health, 16,161-171.
Musaiger AO (2006): Food Composition Tables for Arab Gulf Countries (GULFOODS). Arab Center for Nutrition, Bahrain.
Musaiger AO (2009): Behavior and attitudes of Bahraini consumers towards food shopping and storage. Arab J Food Nutr, 10,22, 60 – 79
Musaiger AO and Miladi S (1997): The State of Food and Nutrition in the Near East. FAO/Regional, Cairo, Egypt.

87
87
Musaiger AO and Miladi S (editors) (1996): Proceedings of Workshop on Establishing Food Composition Data for the Arab Countries of the Gulf. FAO / Regional Office, Cairo, Egypt.
Musaiger AO and Miladi S (editors) (1998): Establishing Food Composition Data for the Near East. FAO/Cairo, Egypt.
Musaiger AO and Miladi S (editors) (1998): Proceeding of the workshop on Diet, Nutrition and Healthy Lifestyle in Arab Gulf Countries.
Musaiger AO and Zagzoog N (2005): Dietary habits and lifestyle of adolescents girls in Jeddah, S. Arabia. Arb J. Food Nurt. 6, 13, 205-212.
Musaiger AO, Ajlan D, and Al-Awadhi Z et al (2005a): Dietary habits, lifestyle patterns, and chronic diseases among adult population in Bahrain. Bahrain Center for Studies and Research, Bahrain.
Musaiger AO, Al-Bloushi H, and Al-Rabaie et al (2005b): Health and dietary habits among women in Oman. Bahrain Center for Studies and Research, Bahrain.
Musaiger AO, Al-Sherbini AF, Elsayed NA, Amine EK and Darwish OA (1986): Children’s response to television food advertisements in Bahrain. Int J Hlth Educ (Hygie) V, 30-35.
Musaiger AO, Bader Z and Al-Roomi K (2010): Dietary habits of adolescents in Bahrain (in press).
Nasreddine L, Hawalla N, and Sibai A et al (2006): Food consumption patterns in an adult urban population in Beirut, Lebanon. Public Health Nutrition, 9, 2, 194-203.
National Nutrition Institute (NNI) (2008): Diet, Nutrition and Prevention of Chronic Non-Communicable Diseases among Egyptian Adolescents. Ministry of Health, Egypt.
OECD-FAO (2009): OECD-FAO Agricultural Outlook 2009-2018. 26-39. FAO, Rome.
86
Miladi S (1998): Food Composition Activities in the Near East Region. In Musaiger & Miladi (ed): establishing Food Composition Data for the Near East, FAO / Cairo, pp 9 – 16
Ministry of Health (MOH) (1997). Comprehensive Nutrition Survey. Khartoum, Sudan.
Moosa K, and Zein ZA (1996): Assessment of the iron status and dietary intakes of pregnant women in Bahrain. Ministry of Health, Kingdom of Bahrain.
Musaiger AO, Takruri H, Sadiq A, Abu-Tarboush H and Miladi S (2007): Food-based Dietary Guideline for Arab Gulf Countries. Arab J. Food Nutrition, 8, 18, 94-113.
Musaiger AO (1993): Socio-cultural and economic factors affecting food consumption patterns in the Arab countries. J. Roy. Soc. Health, 113, 2, 68-74.
Musaiger AO (1993): Socio-cultural and economic factors affecting food consumption patterns in the Arab countries. J. Royal Society Health. 113, 69-75.
Musaiger AO (2000): Food consumption pattern and prevalence of chronic diseases among adult citizens in the Emirati society. Arab Journal of Food and Nutrition, 1, 2, 8-22.
Musaiger AO (2002): Diet and prevention of coronary heart disease in the Arab Middle
Musaiger AO (2002): Iron deficiency anaemia in the Arab Gulf countries: the need for action. Nutr Health, 16,161-171.
Musaiger AO (2006): Food Composition Tables for Arab Gulf Countries (GULFOODS). Arab Center for Nutrition, Bahrain.
Musaiger AO (2009): Behavior and attitudes of Bahraini consumers towards food shopping and storage. Arab J Food Nutr, 10,22, 60 – 79
Musaiger AO and Miladi S (1997): The State of Food and Nutrition in the Near East. FAO/Regional, Cairo, Egypt.

88
88
Pellet PL and Shadarevian S (1970): Food Composition Tables for use in the Middle East. American University of Beirut, Lebanon.
Pelletrer DL and Habricht J, (1004): Continuing needs for food consumption data for public health policy. J. Nutrition. Supplement, 1846-1852.
Qanji AM et al (2002): National nutrition survey in Tunisia. Arab J Food Nutr. 6, 3, 566 – 579
Sabbah H, Vereecken C, and Kolsteren P et al (2007): Food habits and physical activity patterns among Palestinian adolescents: findings from the national study of Palestinian schoolchildren. Public Health Nutrition, 10, 7, 739-746.
Salim E I, Moore MA, Al-Lawati JA (2009): Cancer epidemiology and control in the Arab World-Past, present and future. Asian Pacific Journal Cancer Prev. 10, 3-16.
Schmidhuber J (2003): A long term outlook for long term change in food consumption patterns. FAO, Scientific Workshop. FAO, Rome, Italy.
Schmidhuber J and Shetty P (2005): Nutrition transition, obesity & noncommunicable diseases: drivers, outlook and concerns. SCN News, 29,13-19.
Soori H (2001): Pattern of dietary behavior and obesity in Ahwaz, Islamic Republic of Iran. Eastern Mediterranean Health Journal, 7, 1/2, 163-170.
Speedy AW (2003): Global production and consumption of animal source foods. J. Nutr., 133, 4048S-4053S.
Walker P, Rhubart-Berg P, and McKenzie S et al (2005): Public health implications of meat production and consumption. Public Health Nutrition, 8, 4, 348-356.
WHO (1998): Preparation and Use of Food-Based Dietary Guidelines. WHO Technical Report Series 880, Geneva, Switzerland.
89
89
WHO (2003). Diet, Nutrition and prevention of Chronic Diseases, Technical Report No: 916, Geneva.
WHO/EMRO (2003): Healthy marketplaces: working towards ensuring the supply of safer food. World Health Organization, Cairo.
WHO/EMRO (2009): Regional data on non-communicable diseases risk factors. Available at World Health organization, Regional Office of East Mediterranean. Non-communicable diseases website: http/www.emro.who.int.ncd)
WHO/FAO (1992): International Conference on Nutrition. Final Report, Rome, Italy.
WHO-EMRO (2006): Active ageing and promotion of the health of older people. World Health Organization, Cairo.
Wik M, Pingali P, and Broca S (2008): Global agricultural performance: Past trends and future prospects. The World Development Report 2008.
Wilson JP, and Bruins HJ (2005): Food security in the Middle East sicne 1961. Options Méditerranéennes. Série A : Séminaires Méditerranéens (CIHEAM), 65, 49-56.
Yahia N, Achkar A, and Abdallah A et al (2008): Eating habits and obesity among Lebanese university students. Nutrition Journal, 7, 32.
88
Pellet PL and Shadarevian S (1970): Food Composition Tables for use in the Middle East. American University of Beirut, Lebanon.
Pelletrer DL and Habricht J, (1004): Continuing needs for food consumption data for public health policy. J. Nutrition. Supplement, 1846-1852.
Qanji AM et al (2002): National nutrition survey in Tunisia. Arab J Food Nutr. 6, 3, 566 – 579
Sabbah H, Vereecken C, and Kolsteren P et al (2007): Food habits and physical activity patterns among Palestinian adolescents: findings from the national study of Palestinian schoolchildren. Public Health Nutrition, 10, 7, 739-746.
Salim E I, Moore MA, Al-Lawati JA (2009): Cancer epidemiology and control in the Arab World-Past, present and future. Asian Pacific Journal Cancer Prev. 10, 3-16.
Schmidhuber J (2003): A long term outlook for long term change in food consumption patterns. FAO, Scientific Workshop. FAO, Rome, Italy.
Schmidhuber J and Shetty P (2005): Nutrition transition, obesity & noncommunicable diseases: drivers, outlook and concerns. SCN News, 29,13-19.
Soori H (2001): Pattern of dietary behavior and obesity in Ahwaz, Islamic Republic of Iran. Eastern Mediterranean Health Journal, 7, 1/2, 163-170.
Speedy AW (2003): Global production and consumption of animal source foods. J. Nutr., 133, 4048S-4053S.
Walker P, Rhubart-Berg P, and McKenzie S et al (2005): Public health implications of meat production and consumption. Public Health Nutrition, 8, 4, 348-356.
WHO (1998): Preparation and Use of Food-Based Dietary Guidelines. WHO Technical Report Series 880, Geneva, Switzerland.

90
90
9. APPENDIXES
Appendix 1: Daily per capita availability of foods staffs (1990-2005)
Table 1: Daily percapita availability of cereals and roots in the EMR countries (1990-1992 and 2003-2005)
Country Cereals Roots
1990 1992 2003 2005 % increase 1990 1992 2003 2005 % increase
Djibouti 286 368 28.7 9 8 -11.1
Egypt 671 657 -2.1 68 74 8.8
Iran 547 541 -1.1 104 152 46.2
Jordan 456 401 -12.1 43 68 58.1
Kuwait 287 388 35.2 46 49 6.5
Lebanon 342 352 2.9 127 250 96.9
Libya 527 462 -12.3 80 86 7.5
Morocco 676 709 4.9 83 111 33.7
Pakistan 393 379 -3.6 23 37 60.9
Palestine (95-97) 391 372 -4.9 52 39 -25.0
Saudi Arabia 419 442 5.5 31 47 51.6
Sudan 380 354 -6.8 24 33 37.5
Syria 487 465 -4.5 49 68 38.8
Tunisia 596 556 -6.7 63 84 33.3
UAE 337 427 26.7 51 36 -29.4
Yemen 432 388 -10.2 32 25 -21.9
Measured Food Items
Cereals Wheat, Maize, Sorghum, Rice, Barley, Oats, Millet, & Other Cereals
Roots
Potatoes, Sweet Potatoes, Yams, Cassava, & Other Roots

91
91
Table 2: Daily percapita availability of red meats, poultry meats and eggs in the EMR countries (1990-1992 and 2003-2005)
Country
Red Meat Poultry Meat Eggs
1990-92 2003-05 %
increase 1990-92 2003-05
% increase
1990-92 2003 -05 %
increase
Djibouti 46 47 2.2 1 8 700.0 2 1 -50.0
Egypt 36 39 8.3 14 25 78.6 6 7 16.7
Iran 40 42 5.0 22 47 113.6 14 21 50.0
Jordan 35 28 -20.0 60 70 16.7 24 14 -41.7
Kuwait 78 63 -19.2 75 163 117.3 24 32 33.3
Lebanon 43 76 76.7 55 73 32.7 21 21 0.0
Libya 52 33 -36.5 41 47 14.6 18 27 50.0
Morocco 37 33 -10.8 18 33 83.3 16 15 -6.3
Pakistan 33 31 -6.1 4 7 75.0 5 6 20.0
Palestine (95-97)
35 20 -42.9 50 55 10.0 22 27 22.7
Saudi Arabia
48 45 -6.3 80 106 32.5 13 13 0.0
Sudan 49 64 30.6 2 2 0.0 3 3 0.0
Syria 41 45 9.8 15 23 53.3 15 23 53.3
Tunisia 40 41 2.5 18 33 83.3 15 19 26.7
UAE 120 89 -25.8 90 134 48.9 35 27 -22.9
Yemen 22 22 0.0 11 28 154.5 4 5 25.0
Measured Food Items
Red Meat
Bovine Meat, Mutton, Goat Meat, Pigmeat, Edible Offals, & Other Meat
Poultry Meat and Eggs
90
9. APPENDIXES
Appendix 1: Daily per capita availability of foods staffs (1990-2005)
Table 1: Daily percapita availability of cereals and roots in the EMR countries (1990-1992 and 2003-2005)
Country Cereals Roots
1990 1992 2003 2005 % increase 1990 1992 2003 2005 % increase
Djibouti 286 368 28.7 9 8 -11.1
Egypt 671 657 -2.1 68 74 8.8
Iran 547 541 -1.1 104 152 46.2
Jordan 456 401 -12.1 43 68 58.1
Kuwait 287 388 35.2 46 49 6.5
Lebanon 342 352 2.9 127 250 96.9
Libya 527 462 -12.3 80 86 7.5
Morocco 676 709 4.9 83 111 33.7
Pakistan 393 379 -3.6 23 37 60.9
Palestine (95-97) 391 372 -4.9 52 39 -25.0
Saudi Arabia 419 442 5.5 31 47 51.6
Sudan 380 354 -6.8 24 33 37.5
Syria 487 465 -4.5 49 68 38.8
Tunisia 596 556 -6.7 63 84 33.3
UAE 337 427 26.7 51 36 -29.4
Yemen 432 388 -10.2 32 25 -21.9
Measured Food Items
Cereals Wheat, Maize, Sorghum, Rice, Barley, Oats, Millet, & Other Cereals
Roots
Potatoes, Sweet Potatoes, Yams, Cassava, & Other Roots

92
92
Table 3: Daily percapita availability of fish in the EMR countries (1990-1992 and 2003-2005)
Country Fish
1990 1992 2003 2005 % increase
Djibouti 4 3 -25.0
Egypt 24 44 83.3
Iran 12 17 41.7
Jordan 10 16 60.0
Kuwait 26 30 15.4
Lebanon 7 24 242.9
Libya 21 26 23.8
Morocco 21 25 19.0
Pakistan 6 1 -83.3
Palestine (95-97) 2 1 -50.0
Saudi Arabia 15 24 60.0
Sudan 3 4 33.3
Syria 1 8 700.0
Tunisia 24 34 41.7
UAE 65 52 -20.0
Yemen 16 17 6.3
Measured Food Items Fish Demersal Fish, Pelagic Fish, Other Marine Fish, Other Molluscs, Freshwater Fish, Crustaceans & Cephalopods

93
93
Table 4: Daily percapita availability of milk and dairy products in the EMR countries (1990-1992 and 2003-2005)
Country Milk & Dairy Products
1990 1992 2003 2005 % increase
Djibouti 124 163 31.5
Egypt 55 76 38.2
Iran 105 155 47.6
Jordan 179 191 6.7
Kuwait 227 181 -20.3
Lebanon 121 183 51.2
Libya 232 228 -1.7
Morocco 91 97 6.6
Pakistan 308 424 37.7
Palestine (95-97) 131 135 3.1
Saudi Arabia 192 221 15.1
Sudan 308 510 65.6
Syria 179 213 19.0
Tunisia 197 266 35.0
UAE 386 260 -32.6
Yemen 79 78 -1.3
Measured Food Items Milk & Dairy Products Whole Milk, Ghee Butter, Cheese, Skimmed Milk, Whey, & Cream
92
Table 3: Daily percapita availability of fish in the EMR countries (1990-1992 and 2003-2005)
Country Fish
1990 1992 2003 2005 % increase
Djibouti 4 3 -25.0
Egypt 24 44 83.3
Iran 12 17 41.7
Jordan 10 16 60.0
Kuwait 26 30 15.4
Lebanon 7 24 242.9
Libya 21 26 23.8
Morocco 21 25 19.0
Pakistan 6 1 -83.3
Palestine (95-97) 2 1 -50.0
Saudi Arabia 15 24 60.0
Sudan 3 4 33.3
Syria 1 8 700.0
Tunisia 24 34 41.7
UAE 65 52 -20.0
Yemen 16 17 6.3
Measured Food Items Fish Demersal Fish, Pelagic Fish, Other Marine Fish, Other Molluscs, Freshwater Fish, Crustaceans & Cephalopods

94
94
Table 5: Daily percapita availability of legumes and nuts in the EMR countries (1990-1992 and 2003-2005)
Country Legumes & Nuts
1990 1992 2003 2005 % increase
Djibouti 12 15 25.0
Egypt 29 43 48.3
Iran 33 36 9.1
Jordan 41 42 2.4
Kuwait 33 34 3.0
Lebanon 82 93 13.4
Libya 56 60 7.1
Morocco 41 28 -31.7
Pakistan 24 22 -8.3
Palestine (95-97) 23 56 143.5
Saudi Arabia 17 21 23.5
Sudan 19 31 63.2
Syria 41 67 63.4
Tunisia 44 49 11.4
UAE 71 69 -2.8
Yemen 18 20 11.1
Measured Food Items Legumes & Nuts Beans, Peas, Nuts, Soyabeans, Groundnuts, Coconuts, Sesameseed, Olives, Sunflowerseed, Rape and Mustardseed, Other Pulses, & Other Oilcrops

95
95
Table 6: Daily percapita availability of vegetables and fruits in the EMR countries (1990-1992 and 2003-2005)
Country Vegetables Fruits
1990 1992 2003 2005 %
increase 1990 1992 2003 2005
% increase
Djibouti 137 105 -23.4 25 30 20.0
Egypt 395 531 34.4 206 264 28.2
Iran 388 484 24.7 307 442 44.0
Jordan 277 325 17.3 194 156 -19.6
Kuwait 401 411 2.5 173 114 -34.1
Lebanon 694 541 -22.0 604 376 -37.7
Libya 541 572 5.7 175 160 -8.6
Morocco 266 382 43.6 152 182 19.7
Pakistan 74 81 9.5 87 92 5.7
Palestine (95-97) 446 405 -9.2 324 192 -40.7
Saudi Arabia 369 284 -23.0 261 293 12.3
Sudan 109 114 4.6 69 76 10.1
Syria 286 340 18.9 261 229 -12.3
Tunisia 452 529 17.0 187 245 31.0
UAE 701 431 -38.5 371 236 -36.4
Yemen 108 89 -17.6 73 105 43.8
Measured Food Items Vegetables Tomatoes, Onions & Other Vegetables
Fruits Oranges, Mandarins, Lemons, Limes, Grapefruit, Other Citrus, Bananas, Apples, Pineapples, Dates, Grapes, Other Fruits
94
Table 5: Daily percapita availability of legumes and nuts in the EMR countries (1990-1992 and 2003-2005)
Country Legumes & Nuts
1990 1992 2003 2005 % increase
Djibouti 12 15 25.0
Egypt 29 43 48.3
Iran 33 36 9.1
Jordan 41 42 2.4
Kuwait 33 34 3.0
Lebanon 82 93 13.4
Libya 56 60 7.1
Morocco 41 28 -31.7
Pakistan 24 22 -8.3
Palestine (95-97) 23 56 143.5
Saudi Arabia 17 21 23.5
Sudan 19 31 63.2
Syria 41 67 63.4
Tunisia 44 49 11.4
UAE 71 69 -2.8
Yemen 18 20 11.1
Measured Food Items Legumes & Nuts Beans, Peas, Nuts, Soyabeans, Groundnuts, Coconuts, Sesameseed, Olives, Sunflowerseed, Rape and Mustardseed, Other Pulses, & Other Oilcrops

96
96
Table 7: Daily percapita availability of vegetables Oils and animal fat in the EMR countries (1990-1992 and 2003-2005)
Country Vegetable Oils Animal Fat
1990 1992 2003 2005 % increase 1990 1992 2003 2005
% increase
Djibouti 19 41 115.8 2 1 -50.0
Egypt 21 15 -28.6 2 1 -50.0
Iran 30 21 -30.0 0 0 0.0
Jordan 36 51 41.7 0 0 0.0
Kuwait 30 56 86.7 0 0 0.0
Lebanon 45 49 8.9 9 3 -66.7
Libya 57 58 1.8 1 0 -100.0
Morocco 28 28 0.0 2 1 -50.0
Pakistan 25 31 24.0 2 4 100.0
Palestine (95-97) 32 26 -18.8 1 1 0.0
Saudi Arabia 40 42 5.0 1 1 0.0
Sudan 15 12 -20.0 1 1 0.0
Syria 40 45 12.5 4 4 0.0
Tunisia 52 56 7.7 1 1 0.0
UAE 35 23 -34.3 3 2 -33.3
Yemen 18 23 27.8 1 1 0.0
Measured Food Items Vege. Oils Soyabean Oil, Sunflowerseed Oil, Rape and Mustard Oil, Palmkernel Oil, Palm Oil, Coconut Oil, Groundnut Oil, Cottonseed Oil, Maize Germ Oil, Sesameseed Oil, Olive Oil, & Other Oilcrops Oils
Animal Fat Raw Animal Fats

97
97
Appendix 2: Regional projection of population and cereal demand (millions of tons) 1990-2025
Region Population millions Cereal consumption in 1990
Projected cereal demand in 2025 based on
1990 2025 Per captia, kg
Volume, mill. tons
Population increase
only
Population plus income
Sub-Saharan Africa
490 1.197 150 73.6 179.8 179.8
The Middle East 276 534 386 106.6 206.4 231.9
South Asia 1,193 2,021 237 282.2 478.1 549.7
East and Southeast Asia
1,794 2,387 338 605.8 806.2 1,040.9
Latin America 440 690 265 116.6 182.7 217.9
Europe/FSU 788 799 634 499.3 506.5 506.5
North America/ Oceania
304 410 780 237.1 319.5 319.5
World 5,285 8,039 363 1.921.3 2,673.0 3,0465
96
Table 7: Daily percapita availability of vegetables Oils and animal fat in the EMR countries (1990-1992 and 2003-2005)
Country Vegetable Oils Animal Fat
1990 1992 2003 2005 % increase 1990 1992 2003 2005
% increase
Djibouti 19 41 115.8 2 1 -50.0
Egypt 21 15 -28.6 2 1 -50.0
Iran 30 21 -30.0 0 0 0.0
Jordan 36 51 41.7 0 0 0.0
Kuwait 30 56 86.7 0 0 0.0
Lebanon 45 49 8.9 9 3 -66.7
Libya 57 58 1.8 1 0 -100.0
Morocco 28 28 0.0 2 1 -50.0
Pakistan 25 31 24.0 2 4 100.0
Palestine (95-97) 32 26 -18.8 1 1 0.0
Saudi Arabia 40 42 5.0 1 1 0.0
Sudan 15 12 -20.0 1 1 0.0
Syria 40 45 12.5 4 4 0.0
Tunisia 52 56 7.7 1 1 0.0
UAE 35 23 -34.3 3 2 -33.3
Yemen 18 23 27.8 1 1 0.0
Measured Food Items Vege. Oils Soyabean Oil, Sunflowerseed Oil, Rape and Mustard Oil, Palmkernel Oil, Palm Oil, Coconut Oil, Groundnut Oil, Cottonseed Oil, Maize Germ Oil, Sesameseed Oil, Olive Oil, & Other Oilcrops Oils
Animal Fat Raw Animal Fats

98
98
Appendix 3: Projected food consumption trends of meat and milk, 1997-2020
Region
Projected annual growth
1997-2020
Total consumption in 2020
Per capita consumption in
2020 Meat Milk Meat Milk Meat Milk
(%/y) (million metric tons) (kg) China 3.1 3.8 107 24 73 16 India 3.5 3.5 10 133 8 105 Other Eat Asia 3.2 2.5 5 2 54 29 Other South Asia
3.5 3.1 7 42 13 82
Southeast Asia 3.4 3.0 19 12 30 19 Latin America of which is brazil only
2.5 1.9 46 85 70 130
WANA 2.4 1.8 20 30 94 145 Sub-Saharan 2.7 2.3 13 42 26 82 Africa 3.2 3.3 11 35 12 37 Developing world
3.0 2.9 217 375 36 62
Developed world
0.8 0.6 117 286 86 210
World 2.1 1.7 334 660 45 89 FAO (2002)

100