personalized nutrition glycemic responses - nugo · personalized nutrition by prediction of...
TRANSCRIPT

Personalized Nutrition by Prediction of
Glycemic Responses
Tal KoremLab of Prof. Eran Segal
Weizmann Institute of Science

Changes in our nutrition greatly contributedto the recent metabolic syndrome epidemic

General recommendations in nutrition
Source: USDA
1943 1992 2015

Consumption of artificial sweeteners

Increase in artificial sweetener consumptionis a major recent change in our nutrition
86% of Americans use ‘diet’ products Consumers spend $21B per year on diet drinks
Sylvetsky et al., Am J Clinical Nutrition 2012

Artificial sweeteners are recommended forweight loss and for assisting in blood glucose control
“REPLACING SUGARY FOODS AND DRINKS WITH SUGAR-FREE OPTIONS CONTAINING NON-NUTRITIVE SWEETENERS IS ONE WAY TO LIMIT CALORIES
AND ACHIEVE OR MAINTAIN A HEALTHY WEIGHT.”
“WHEN USED TO REPLACE FOODS AND DRINKS WITH ADDED SUGARS, IT CAN HELP PEOPLE WITH DIABETES MANAGE BLOOD GLUCOSE LEVELS”

Artificial sweeteners induce glucose intoleranceby altering the gut microbiota
Suez et al., Nature 2014
Eran ElinavJothamSuez

What is the effect of artificial sweeteners on mice?
Suez et al., Nature 2014

Artificial sweeteners induce glucose intolerance in mice
Lean mice Obese mice Different formulations Different doses Different mouse strains
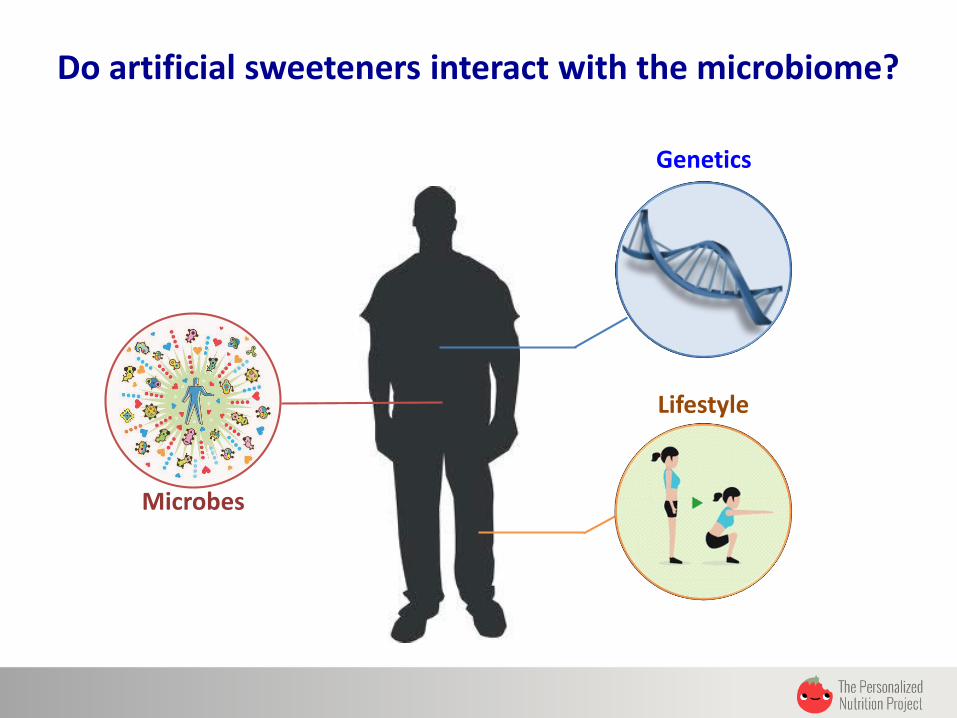
Genetics
Lifestyle
Microbes
Do artificial sweeteners interact with the microbiome?

What is the effect of artificial sweeteners on mice?
Suez et al., Nature 2014

Antibiotics reverse the effect of artificial sweeteners
A, Ciprofloxacin & Metronidazole (targets Gram-)B, Vancomycin (targets Gram+)
Suez et al., Nature 2014

Transferring the microbiota of mice that consume artificial sweeteners transfers the glucose intolerance
Suez et al., Nature 2014

Transferring the microbiota grown in the presence of artificial sweeteners transfers the glucose intolerance
Suez et al., Nature 2014

Artificial sweeteners drive glucose intolerance in mice by altering the
gut microbiota
… but what about people?

What happens to humans after just five daysof consuming artificial sweeteners?
Suez et al., Nature 2014

Artificial sweeteners induce glucose intolerance in most but not all individuals
Responders Non-responders
Suez et al., Nature 2014
Before massive consumptionAfter massive consumption

Transferring the microbiota of responders to artificial sweeteners transfers the glucose intolerance phenotype
Suez et al., Nature 2014
Responders Non-Responders

Validation studies (2015)
LETTER
Positive association between artif icially sweetened beverageconsumption and incidenceof diabetes
Allison C. Sylvetsky Meni 1,2&Susan E. Swithers3
&Kristina I . Rother 1
Received: 15 May 2015 /Accepted: 30 June2015# Springer-Verlag (outside theUSA) 2015
Keywords Artificial sweeteners . Artificially sweetened
beverages . Diabetes . Diet soda . Non-nutritivesweeteners .
Obesity . Soda . Sugar-sweetenedbeverages
Abbreviations
ASB Artificially sweetened beverages
SSB Sugar-sweetened beverages
To the Editor: O’Connor and colleagues are to be applauded
for evaluating theeffectsof sweetened and unsweetened non-
alcoholic beverage intake on the incidence of type 2 diabetes
in 24,653 individuals [1]. In addition to the large cohort size,
thestudy participantswere followed for almost 11 years. The
finding that intake of sugar-sweetened beverages (SSB, soda
and milk) was strongly associated with the eventual de-
velopment of type 2 diabetes is very important and not
unexpected. However, we believe that another finding is
particularly noteworthy, namely, intake of artificially
sweetened beverages (ASB) was an equally strong pre-
dictor of type 2 diabetes.
When corrected for BMI and waist circumference, thesig-
nificant association between sugar-sweetened soft drinks and
type 2 diabetes persisted whereas the relationship between
ASB intake and type 2 diabetes was attenuated, pointing to
obesity asan important link betweenASB and type2diabetes.
In fact, the prevalence of obesity was strikingly higher in the
ASB cohort than among the SSB consumers, despite the fact
that their energy intakes were similar (ASB consumers: BMI
27.2±4.2 kg/m2, obesity prevalence 20.3%, energy intake
7,899±2,046 kJ/day; SSB consumers: BMI 26.2±3.9 kg/m2,
obesity prevalence 14.4%, energy intake 8,389±2,071 kJ/
day). The authors state that the positive association between
ASB intakeand type2 diabetesmay bean artefact of reverse
causality, meaning that heavier individuals consume more
beveragescontaining artificial sweetenersto prevent addition-
al weight gain or even promoteweight loss. In our opinion, a
direct detrimental effect of artificial sweeteners on metabolic
health warrants further consideration, especially in light of re-
cent findingsinanimal [2, 3] andhuman[2, 4, 5] studies. These
findings include interference of artificial sweeteners with
learned signals linking sweet taste to its post-ingestive conse-
quences [3] and induction of changes in the gut microbiome
[2]. Both may impair blood glucose regulation and enhance
metabolic efficiency. In addition, stimulation of insulin secre-
tion by artificial sweeteners, as observed in in vitro studies [6]
and in a recent human study evaluating acute ASB consump-
tion [4], offersanother plausiblemechanism that could explain
the relationship between ASB and greater adiposity.
Based on mathematical modelling, O’Connor and col-
leagues [1] predict that replacing SSB with ASB would not
reduce the diabetes risk. This supports the notion that even if
artificial sweeteners reduce overall energy intake, they may
exert adverse metabolic effects, especially by increasing
weight and adiposity. Thesefindingshave important implica-
tions for individuals of all ages, including children, whose
* Kristina I. Rother
1 Section on Pediatric Diabetesand Metabolism, National Instituteof
Diabetes and Digestiveand Kidney Diseases, National Institutesof
Health, 9000 RockvillePike, Building 10, Room 8C432A,
Bethesda, MD 20892-1645, USA
2 Department of Exercise and Nutrition Sciences, Milken Institute
School of Public Health, TheGeorgeWashington University,
Washington, DC, USA
3 Department of Psychological Sciences, PurdueUniversity, West
Lafayette, IN, USA
Diabetologia
DOI 10.1007/s00125-015-3694-5

If nutritional changes drove the metabolic syndrome epidemic, can it be treated by
restoring healthy nutrition?

What is healthy nutrition?
201420112003
20021984
1972
1999
How can we take a science-based approach to nutrition?
David Zeevi

What should a marker of healthy nutrition satisfy?
Relevant for weight management
Relevant for metabolic disease
Easily measurable quantitatively

Postprandial (post-meal) glucose responseas a measure of healthy nutrition
Blo
od
su
gar
leve
ls
Time
Hunger
Strongly associated with disease
Diabetes
Obesity
Cardiovasculardisease
Chronic metabolic disorders
Directly affects fat storage, weight gain and hunger
Bonora et al., Diabetologia 2001; Cavalot et al., Diabetes Care 2011; Wang et al., Diabetes Care 2004; Temelkova-Kurktschiev et al., Diabetes Care 2000; O'Keefe et al., Am J Cardiol 2007
Easily measurable
Maintaining normal blood glucose levels is key to fighting the rise in disease

People have widely differentglucose responses to the same food
PhilJill NancyCarl
Adapted from Vega-López et al., Diabetes Care 2007
Glu
cose
leve
ls (
mg
/dl)
40
80
120
160
0 21 0 21 0 21
Time (hours)
0 21

Diets that maintain normal blood glucose levels must be personally tailored
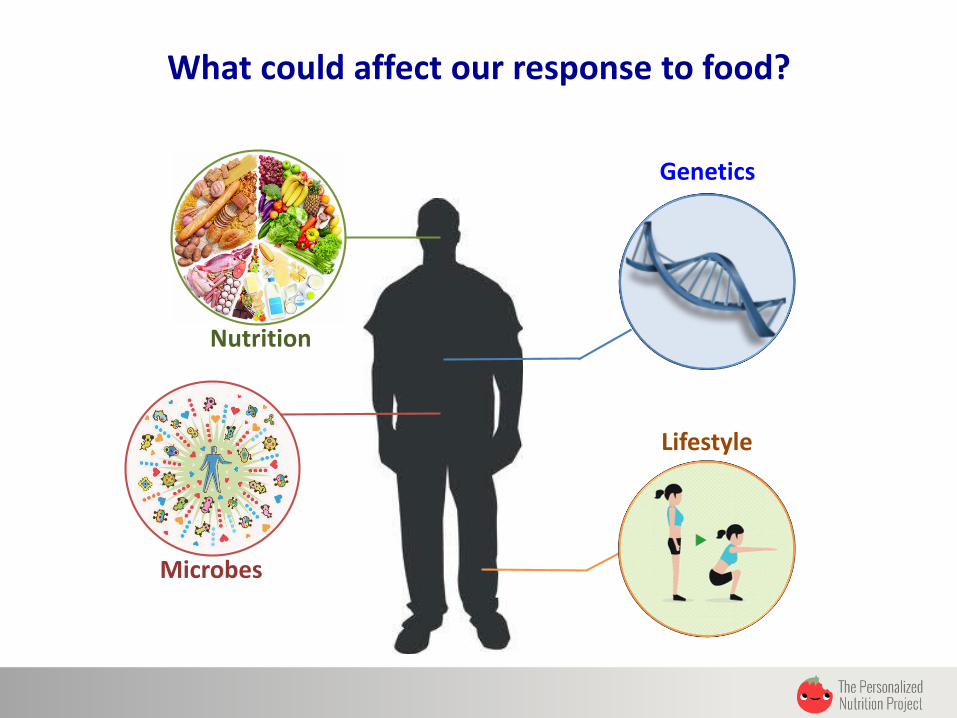
What could affect our response to food?
Genetics
Lifestyle
Microbes
Nutrition

התזונה כגורם מרכזי המשפיע על הרכב המיקרוביום
Koeth et al., Nature Medicine 2013
The microbiome affects our response to food

Transfer of intestinal microbiota from lean donors increases insulin sensitivity in individuals with metabolic syndrome
Insu
lin s
ensi
tivi
ty
Healthydonor
Recipient w/MetabolicSyndrome
Vrieze et al, Gastroenterology 2012
Recipient w/MetabolicSyndrome

What could affect our response to food?
Genetics
Lifestyle
Microbes
Nutrition

The Personalized Nutrition Project:Clinical and microbiome data collected
Profiling 800 people

Continuous glucose monitoring
Zeevi et al., Cell 2015

The Personalized Nutrition Project:Cohort statistics
25-70 years of age 55% overweight 22% obese 21% pre-diabetic
Fre
qu
en
cy
Age
Zeevi et al., Cell 2015

Cohort bacterial composition comparable to other international cohorts

What is the variability across people inthe response to the same food?

Testing the cohort response to standardized meals
800 x
Zeevi et al., Cell 2015
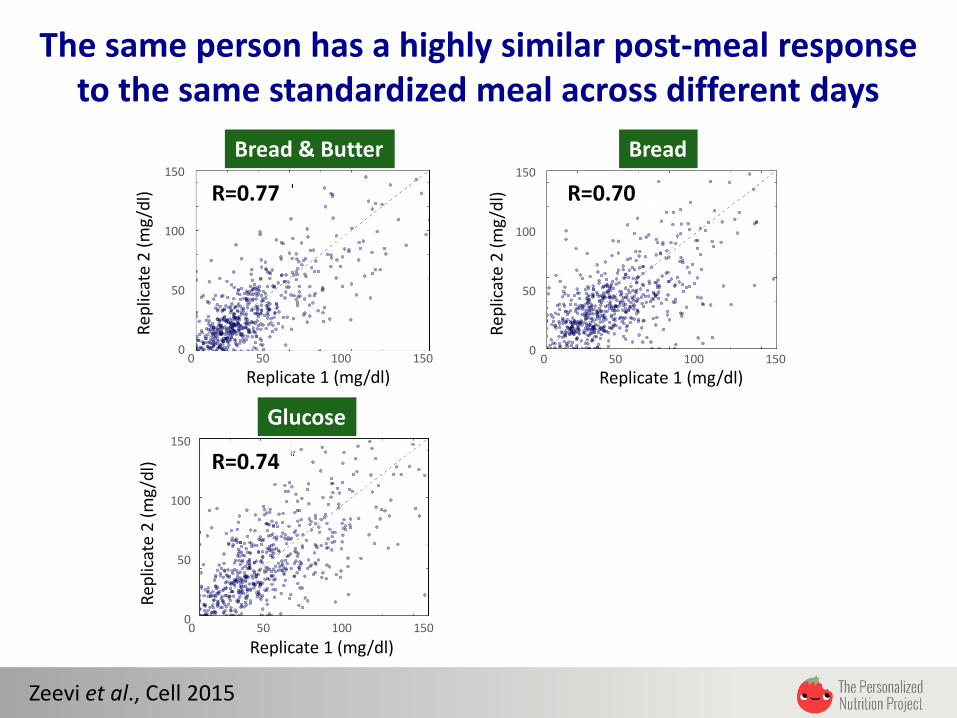
The same person has a highly similar post-meal response to the same standardized meal across different days
Bread
Replicate 1 (mg/dl)
Rep
licat
e 2
(m
g/d
l)
0
50
100
150
R=0.70
Bread & Butter
Glucose
R=0.77
R=0.74
Replicate 1 (mg/dl)
Rep
licat
e 2
(m
g/d
l)
0 50 100 150
Replicate 1 (mg/dl)
Rep
licat
e 2
(m
g/d
l)
0 50 100 150
0 50 100 1500
50
100
150
0
50
100
150
Zeevi et al., Cell 2015
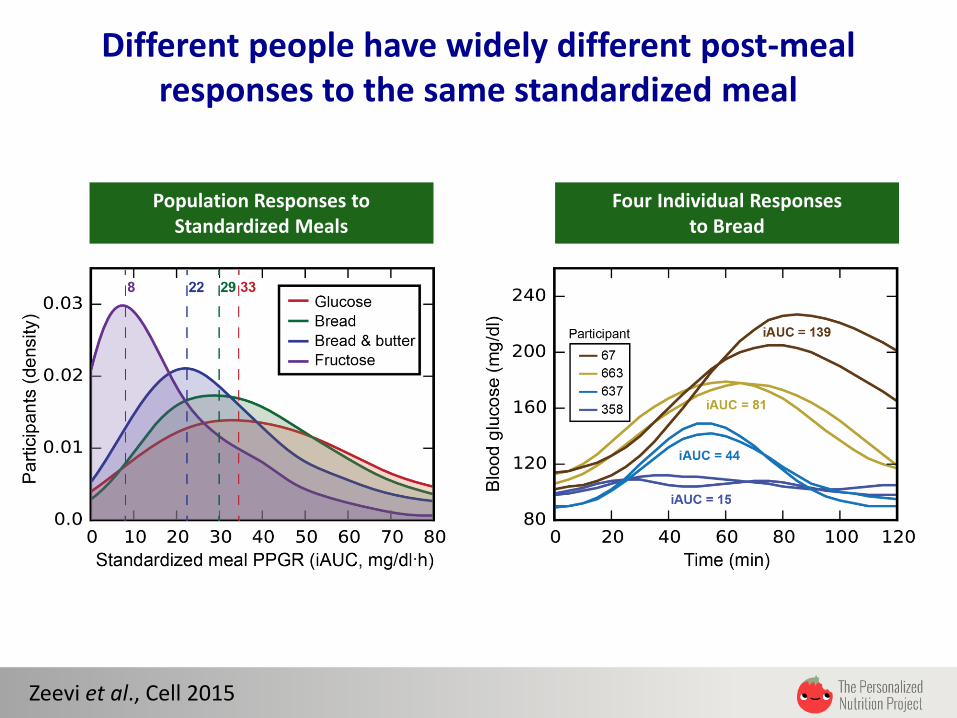
Different people have widely different post-meal responses to the same standardized meal
Population Responses to Standardized Meals
Four Individual Responsesto Bread
Zeevi et al., Cell 2015

Different people have opposite responses to different standardized meals
Zeevi et al., Cell 2015
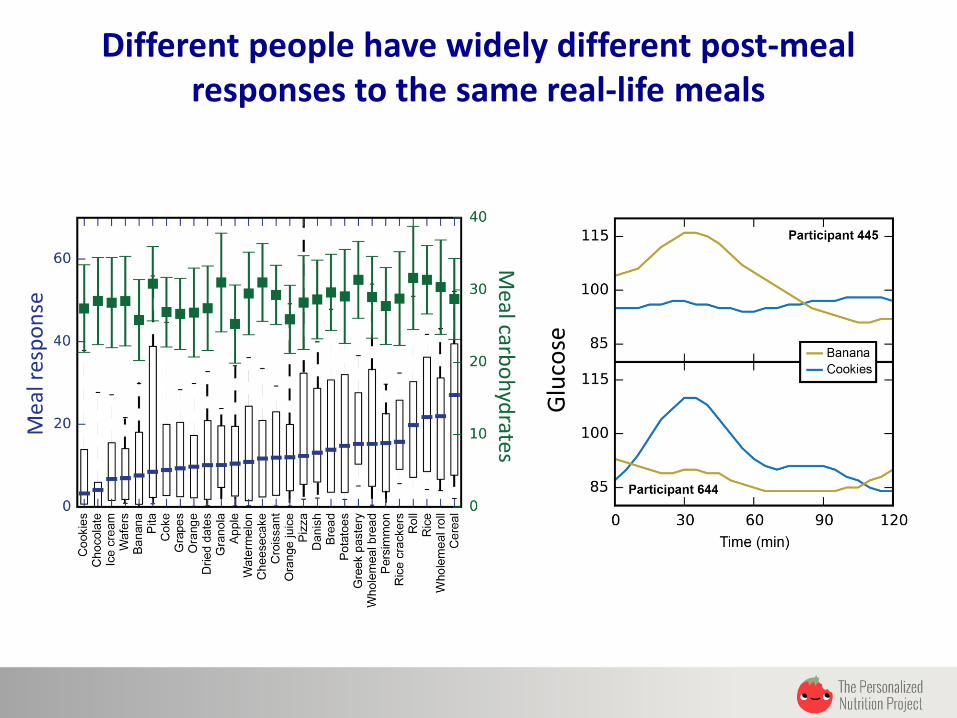
Different people have widely different post-meal responses to the same real-life meals
Mea
l res
po
nse
Glu
cose
Meal carb
oh
ydrates

General recommendations in nutrition
Source: USDA
1943 1992 2015

What explains the variability inpeople’s response to the same food?

Variability in post-meal glucose response across people associates with microbiota composition and function
Zeevi et al., Cell 2015

Variability in post-meal glucose response across people associates with microbiota composition and function
• Positive association with PPGR to glucose + bread
• High levels associate with a high-fat low-fiber diet
(Wu et al., 2011)

Positive association between ABC transporters andpost-meal glucose response to all standardized meals
• Positive association with TIIDM (Karlsson et al., 2013)
• Positive association with western high-fat/high-sugar diet (Turnbaugh et al., 2009)
Zeevi et al., Cell 2015

Can we predict the personal post-prandial glucose response to any complex meal?
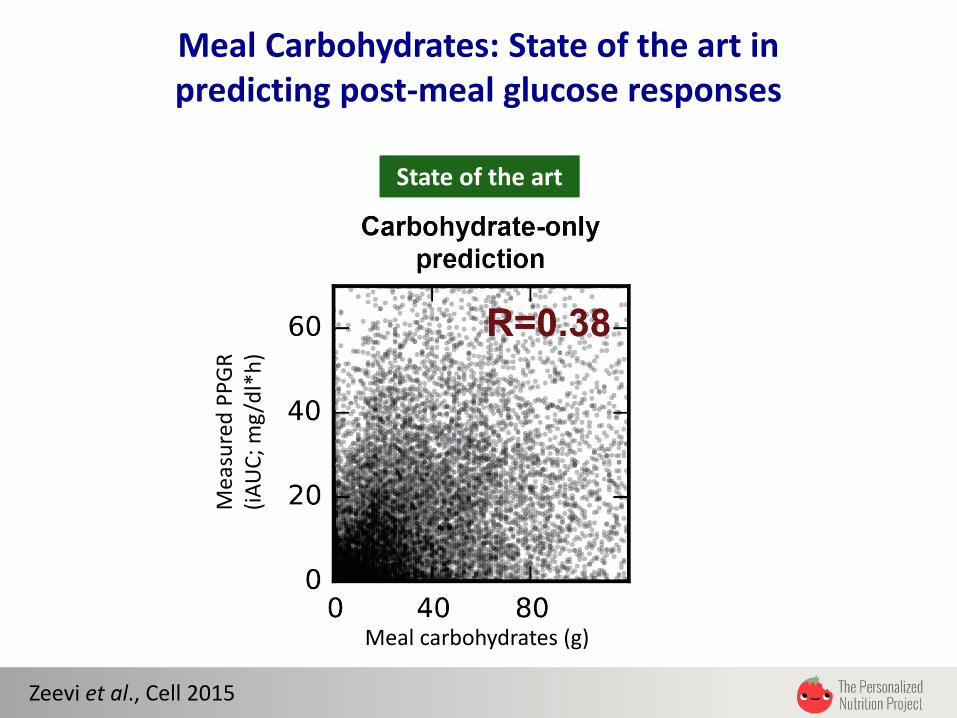
Meal Carbohydrates: State of the art inpredicting post-meal glucose responses
State of the art
Meal carbohydrates (g)
Mea
sure
d P
PG
R
(iA
UC
; mg
/dl*
h)
Zeevi et al., Cell 2015

Prediction scheme
Zeevi et al., Cell 2015

Model features
200 NutrientsIncluding fatty acids, vitamins and minerals
46,898 Meals
X
Multiple recorded featuresMeal times, sleep, exercise, stress, hunger, medication
5,417 Days
X
30Blood parameters
100Questions
100FFQ features
X800 People
MetaPhlAnabundances
800 People
KEGG abundances
16S OTUsX Growth dynamics
Zeevi et al., Cell 2015

Accurate predictions of personalized glucose responses
State of the art
Meal carbohydrates (g)
Mea
sure
d P
PG
R
(iA
UC
; mg
/dl*
h)
Predicted PPGR (iAUC; mg/dl*h)
Predicted PPGR (iAUC; mg/dl*h)
Our prediction800 participants
Prediction validation100 participants
Zeevi et al., Cell 2015
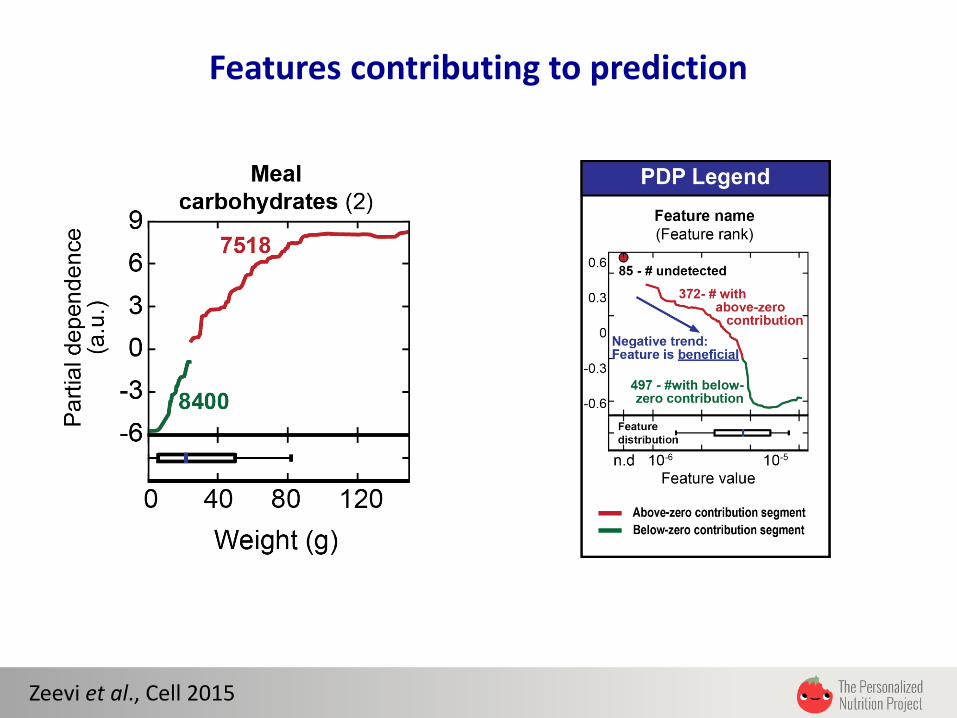
Features contributing to prediction
Zeevi et al., Cell 2015

Features contributing to prediction
Mea
l res
po
nse

Features contributing to prediction
Zeevi et al., Cell 2015

Features contributing to prediction
Zeevi et al., Cell 2015

Can personally tailored dietary interventions improve post-prandial glucose responses?

Constructing personally tailored diets thatachieve normal post-prandial glucose responses
Zeevi et al., Cell 2015

Can you distinguish between the good and bad menus?
Breakfast
Snack
Dinner
Night snack
Lunch
Egg with bread and coffee
Edamame
Ice cream
Hummus and pita
Vegetable noodles with tofu
Muesli
Marzipan
Corn and nuts
Tobleroneand coffee
Sushi
“Good “ Diet
“Bad” Diet ? “Good “
Diet“Bad” Diet ?
Zeevi et al., Cell 2015

Can you distinguish between the good and bad menus?
Breakfast
Snack
Dinner
Night snack
Lunch
Bad Diet
Good Diet
Egg with bread and coffee
Edamame
Ice cream
Hummus and pita
Vegetable noodles with tofu
Muesli
Marzipan
Corn and nuts
Tobleroneand coffee
Sushi
Zeevi et al., Cell 2015
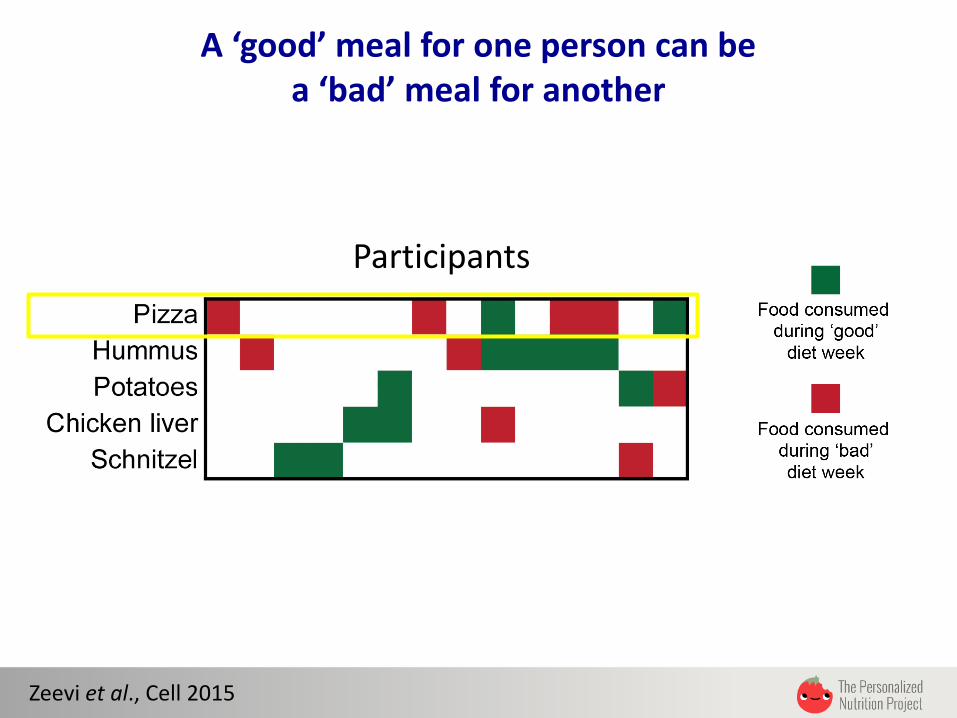
A ‘good’ meal for one person can bea ‘bad’ meal for another
Participants
Zeevi et al., Cell 2015

Personally tailored diets reducethe post-prandial glucose response
1 2 3 4 5 6
Day
Zeevi et al., Cell 2015

Personally tailored diets improve post-meal responses
Zeevi et al., Cell 2015

Dietary interventions targeting post-meal glucose responses induce consistent changes in microbiota
Zeevi et al., Cell 2015

Dietary interventions targeting post-prandial glucose responses induce consistent changes in microbiota
• Bifidobacterium adolescentis decreases
during ‘good’ week.
• Low levels associated with greater
weight loss (Santacruz et al., 2009)

Dietary interventions targeting post-meal glucose responses induce consistent changes in microbiota
• Roseburia inulinivorans increases
following the ‘good’ diet week
• Low levels associate with TIIDM
(Qin et al., 2012)
Zeevi et al., Cell 2015

Summary
• Artificial sweeteners induce glucose intolerance driven
by gut microbial changes
• High interpersonal variability in post-meal glucose
observed in an 800-person cohort
• Using personal and microbiome features enables accurate
glucose response prediction
• Short-term personalized dietary interventions successfully
lower post-meal glucose

Segal Lab
David ZeeviAdina WeinbergerDaphna RothschildNastya GodnevaTali Avnit-SagiMaya Pompan-LotanElad Matot
Elinav Lab
Niv ZmoraJotham SuezJamel Abu-MahdiGili Zilberman-SchapiraLenka Dohnalova ́Merav Pevsner-FischerChristoph Thaiss
Tel-Aviv SouraskyMedical CenterProf. Zamir Halpern
Kfar Shaul Medical CenterDr. David Israeli
Dar LadorMichal ReinOrly Ben YaakovRony BikovskyNoa KossowerGal Malka