pharma intelligence | is achieving trial success a roll of .../media/informa-shop-window/.........
TRANSCRIPT

Is Achieving Trial Success a Roll of the Dice? Dissecting Trials with Positive Outcomes to Identify Strategies for Success.
SYLVIA MARECKI, PhDSenior Director, Product Management & Strategy
TrialtrovePharma intelligence |

TrialtrovePharma intelligence |
2
3
Drug development is a risky endeavor—some might even say a gamble—but what are the odds of running a successful trial? Although many studies have evaluated overall drug development success rates, predominantly by assessing therapeutics’ phase transition rates and probabilities of approval, none have reported trial-level success rates to date. Here, we delve into this area to take a closer look at trial-level success with an eye toward identifying strategies that may correlate with success.
Trialtrove and Trialpredict data were leveraged to identify Phase II – III, industry-sponsored trials completing
between January 1, 2008 and December 31, 2012 with a positive outcome, defined as the trial’s primary
endpoint(s) were met with statistical significance and/or the trial’s sponsor or investigator stated that it had
a positive outcome or was successful. A total of 7,005 trials were completed during this timeframe and 3,686
trials achieved a positive outcome for an overall success rate of 52.6%, slightly better than a roll of the dice.
The top 10 diseases spanned several major therapeutic areas but type 2 diabetes saw the most successful
trials completing during this period (Table 1). Major pharmaceutical companies occupied the top 10
sponsor slots, biologics factored heavily among top 10 drugs, and the US was the top location among
successful trials (Table 1). Notably, Poland and Russia were among the top 10 trial locations for successful
trials, suggesting country selection expanding into emerging markets may be starting to reap rewards and
may also signal one strategy for success.
table 1. the top 10 Most Successful Diseases, companies, Drugs, and trial locations
Diseases Sponsors Drugs trial locations
• Type 2 Diabetes
• Respiratory Infections, Vaccines
• Breast Cancer
• Asthma
• Chronic Obstructive Pulmonary Disease
• Rheumatoid Arthritis
• Non-Small Cell Lung Cancer
• Hypertension
• HIV
• Allergic Rhinitis
• Roche
• GSK
• Novartis
• Pfizer
• Merck
• Sanofi
• J&J
• AstraZeneca
• BMS
• Lilly
• Bevacizumab
• Erlotinib
• Rituximab
• Docetaxel
• Indacaterol
• Cetuximab
• Bortezomib
• Ranibizumab
• Linalidomide
• Capecitabine
• US
• Germany
• Canada
• France
• UK
• Spain
• Italy
• Poland
• Russia
• Belgium
Source: Trialtrove® and Trialpredict®, August 2013

TrialtrovePharma intelligence |
3
4
Some therapeutic areas experienced a higher proportion of successful trials than others (Figure 1). While
oncology and CNS had the greatest number of clinical trials completed 2008 – 2012 overall, their success
rates were 51.9% and 47.2%, respectively; both lower than the overall success rate of 52.6%. Meanwhile,
autoimmune/inflammation had the highest success rate of 56%, followed by metabolic and cardiovascular
areas. Many factors certainly underlie trial success. This analysis will explore some of them to begin to
understand factors that may correlate with success and how sponsors may be employing these strategies
to drive trial success.
Which companies sponsored these successful trials and how was success distributed among top industry
sponsors? As noted in Table 1, Roche completed the most successful trials during the 2008 – 2012 period
overall. When trial success by therapeutic area is stratified by sponsor, Roche emerges as the top sponsor
within oncology, Novartis for autoimmune/inflammation and ophthalmology, and GSK for infectious
diseases but these sponsors as well as others in the top 20 typically experienced trial success across
multiple therapeutic areas.
Source: Trialtrove® and Trialpredict®, August 2013
Figure 1. Trial Success by Therapeutic Area
40
42
44
46
48
50
52
54
56
58
60
0
200
400
600
800
1000
1200
1400
1600
1800
ONC CNS A/I MET INF DIS CV OPHTH GU
ONC = oncology, CNS = central nervous system, MET = metabolic and endocrine, INF DIS = infectious diseases,CV = cardiovascular, OPHTH = ophthalmology, GU = genitourinary diseases
Other completed trials
Positive outcome
Success (% of completed)
Num
ber
of
Tria
ls Success Rate

TrialtrovePharma intelligence |
4
5
Were there any differences in country utilization across therapeutic areas among these successful trials?
What is striking is that despite differences in sponsorship across therapeutic areas, the relative utilization
of the top 20 countries within a given therapeutic area is generally consistent across therapeutic areas,
with the United States remaining the most-utilized country (Figure 3). This observation suggests that
country selection strategies are generally consistent across sponsors and therapeutic areas at a macro level
but that there is variation in the average number of countries utilized per trial within each therapeutic area,
as evidenced by autoimmune/inflammation jumping to the first position by count of country utilization
(compare Figure 1 and Figure 3).
It also is noteworthy that these top 20 countries include Eastern European, Latin American, and Asia Pacific
regions and their relative utilization is roughly proportional to other top 20 countries, apart from the United
States. It is clear that Eastern Europe has become an important region and that we are likely to see growth
in utilization of countries in Latin American and Asia Pacific regions in the future.
Source: Trialtrove® and Trialpredict®, August 2013
Figure 2. Successful Trial Activity by Top 20 Sponsors
0
100
200
300
400
500
600
700
800
ONC MET A/I INF DIS CNS CV OPHTH GU
Daiichi Sankyo Forest Laboratories Novo Nordisk Amgen Astellas Celgene AbbVie Bayer Takeda Boehringer Ingelheim Eli Lilly BMS AstraZeneca Johnson & Johnson Sanofi Merck & Co Pfizer Novartis GSK Roche
Num
ber
of
Tria
ls
ONC = oncology, CNS = central nervous system, MET = metabolic and endocrine, INF DIS = infectious diseases,CV = cardiovascular, OPHTH = ophthalmology, GU = genitourinary diseases
It is clear that Eastern Europe has become an important region and that we are likely to see growth in utilization of countries in Latin American and Asia Pacific regions in the future.

TrialtrovePharma intelligence |
5
6
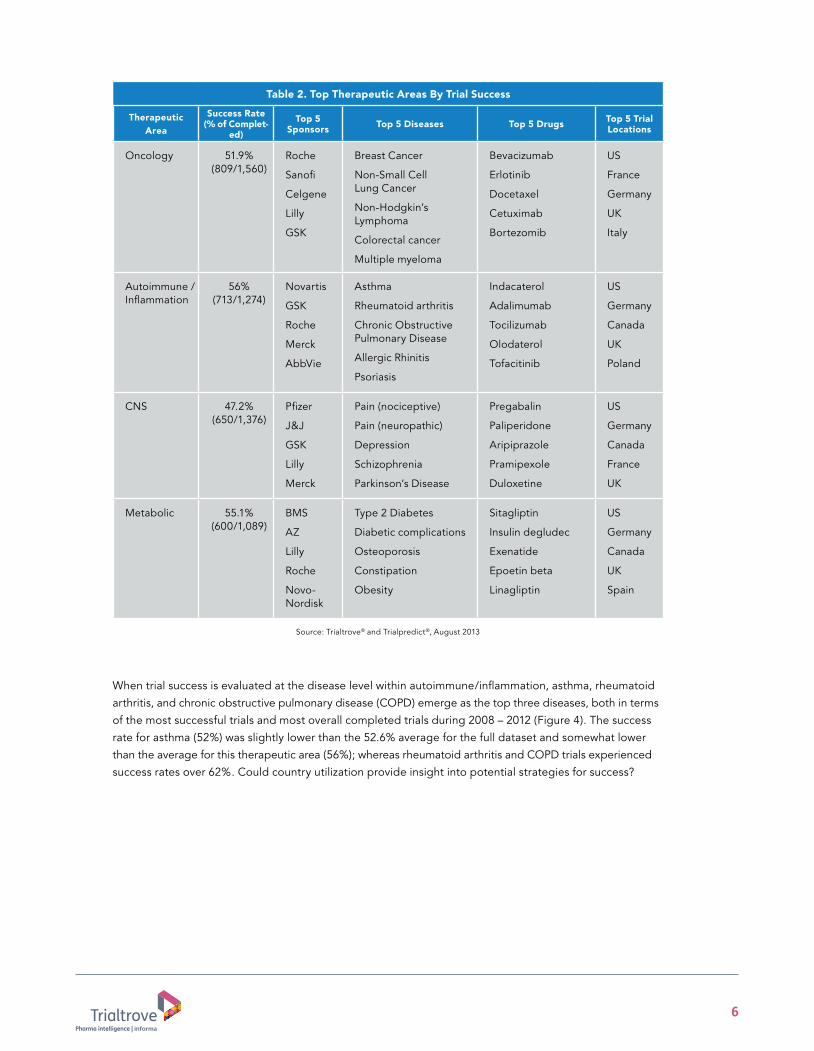
Among the top therapeutic areas with the most successful trials, GSK, Lilly, and Roche are among the top 5
sponsors in three out of four areas presented in Table 2. The US and UK remain top locations across these
therapeutic areas but only within autoimmune/inflammation does Poland appear among the top 5 locations
for successful trials. It is intriguing to speculate that trial success may somehow correlate with country
utilization. Given that the trial success rate was highest within autoimmune/inflammation and that it was the
only therapeutic area where an Eastern European country appeared in the top five most utilized countries,
this area served as a case study to investigate the potential impact of country selection on trial success and
to investigate other potential strategies for success.
Figure 3. Successful Trial Activity by Therapeutic Area: Top 20 Countries
0
500
1000
1500
2000
2500
3000
A/I ONC MET CNS CV INF DIS GU OPHTH
Romania Mexico Austria Sweden Japan India Hungary Czech Republic Netherlands Australia Belgium Russia Poland Italy Spain United Kingdom France Canada Germany United States
Num
ber
of
Tria
ls
ONC = oncology, CNS = central nervous system, MET = metabolic and endocrine, INF DIS = infectious diseases,CV = cardiovascular, OPHTH = ophthalmology, GU = genitourinary diseases
Source: Trialtrove® and Trialpredict®, August 2013
It is intriguing to speculate that trial success may somehow correlate with country utilization.
TrialtrovePharma intelligence |
6
7
When trial success is evaluated at the disease level within autoimmune/inflammation, asthma, rheumatoid
arthritis, and chronic obstructive pulmonary disease (COPD) emerge as the top three diseases, both in terms
of the most successful trials and most overall completed trials during 2008 – 2012 (Figure 4). The success
rate for asthma (52%) was slightly lower than the 52.6% average for the full dataset and somewhat lower
than the average for this therapeutic area (56%); whereas rheumatoid arthritis and COPD trials experienced
success rates over 62%. Could country utilization provide insight into potential strategies for success?
table 2. top therapeutic areas By trial Success
therapeutic area
Success rate (% of complet-
ed)
top 5 Sponsors top 5 Diseases top 5 Drugs top 5 trial
locations
Oncology 51.9% (809/1,560)
Roche
Sanofi
Celgene
Lilly
GSK
Breast Cancer
Non-Small Cell Lung Cancer
Non-Hodgkin’s Lymphoma
Colorectal cancer
Multiple myeloma
Bevacizumab
Erlotinib
Docetaxel
Cetuximab
Bortezomib
US
France
Germany
UK
Italy
Autoimmune / Inflammation
56% (713/1,274)
Novartis
GSK
Roche
Merck
AbbVie
Asthma
Rheumatoid arthritis
Chronic Obstructive Pulmonary Disease
Allergic Rhinitis
Psoriasis
Indacaterol
Adalimumab
Tocilizumab
Olodaterol
Tofacitinib
US
Germany
Canada
UK
Poland
CNS 47.2% (650/1,376)
Pfizer
J&J
GSK
Lilly
Merck
Pain (nociceptive)
Pain (neuropathic)
Depression
Schizophrenia
Parkinson’s Disease
Pregabalin
Paliperidone
Aripiprazole
Pramipexole
Duloxetine
US
Germany
Canada
France
UK
Metabolic 55.1% (600/1,089)
BMS
AZ
Lilly
Roche
Novo-Nordisk
Type 2 Diabetes
Diabetic complications
Osteoporosis
Constipation
Obesity
Sitagliptin
Insulin degludec
Exenatide
Epoetin beta
Linagliptin
US
Germany
Canada
UK
Spain
Source: Trialtrove® and Trialpredict®, August 2013

TrialtrovePharma intelligence |
7
8
The relative impact of Eastern Europe becomes even more apparent in autoimmune/inflammation, with
four of the top 15 countries coming from this region: Poland, Hungary, Russia, and Romania (Figure 5).
Furthermore, Mexico and Argentina appear among the top 20 countries, providing further evidence to
suggest that expanding geography may play a role in trial success.
Success rates in trials involving any of these top 20 countries was above average for this therapeutic area,
highest among trials involving South Korea, where nearly 76% of trials involving this country were successful.
Clearly, simply including a particular country in a clinical trial is no guarantee for success but a closer look
at trials that involved this country may provide some insight into successful strategies.
Figure 5. Trial Success Rate Among Top 20 Countries in Autoimmune/Inflammation, 2008 – 2012
50
55
60
65
70
75
80
0
100
200
300
400
500
600
700
German
y
United
Stat
es
Canad
a
United
King
dom
Poland
Fran
ce Sp
ain
Italy
Hungar
y
Russia
Belgium
Czech
Rep
ublic
Nethe
rland
s
Austra
lia
Romania
Swed
en
Mex
ico
Sout
h Kore
a
Sout
h Afri
ca
Argen
tina
Other completed trials
Positive outcome
Success (% of completed)
Num
ber
of
Tria
ls Success Rate
Source: Trialtrove® and Trialpredict®, August 2013
Source: Trialtrove® and Trialpredict®, August 2013
Figure 4. Top 10 Diseases in Autoimmune/Inflammation, 2008 – 2012
40
45
50
55
60
65
70
0
100
50
150
200
250
Rheum
atoid ar
thrit
is
Asthma
COPD
Allerg
ic Rhin
itis
Psoria
sis
Osteoar
thrit
is
Tran
splan
tatio
n
Cystic
Fibro
sis
Ulcera
tive C
olitis
Crohn
’s Dise
ase
Other completed trials
Positive outcome
Success (% of completed) N
umb
er o
f Tr
ials Success R
ate

TrialtrovePharma intelligence |
8
9
Not only were asthma, COPD, and rheumatoid arthritis the top three indications in autoimmune/inflammation
overall, they also accounted for 68% of all successful trials involving South Korea. In fact, South Korea was
the only country among the top 20 in autoimmune/inflammation that was utilized in clinical trials for all
three indications where there was a success rate of more than 75% (Figure 6). Success rates in Estonia and
the Philippines also exceeded 75% in these three indications but because of the smaller sample size, they
were not analyzed. To gain clarity around the types of trials that were conducted in South Korea, a deeper
analysis of these highly successful trials was undertaken.
Source: Trialtrove® and Trialpredict®, August 2013
20
30
40
50
60
70
80
90
100
0
20
40
60
80
100
120
20
30
40
50
60
70
80
90
100
0 10 20 30 40 50 60 70 80 90
100
20
30
40
50
60
70
80
90
100
0
20
40
60
80
100
120
United
Stat
es
German
y
Poland
Canad
a
United
King
dom
Russia
Hungar
y
Romania
Ukrain
e
Fran
ce Per
u Ita
ly
Japan
Mex
ico
Bulgar
ia
Sout
h Afri
ca
Czech
Nethe
rland
s
Argen
tina
Colombia
Austra
lia Ind
ia
Spain
Denmar
k
Slova
kia
Swed
en
Sout
h Kore
a
Estonia
New Z
ealan
d
Philippine
s
Figure 6. Top 30 Countries In Asthma, COPD, And RA
Other outcome
Positive outcome
Success rate
Num
ber
of
Ast
hma
Tria
lsN
umb
er o
f R
A T
rial
s
Success Rate
Success Rate
Success Rate
Num
ber
of
CO
PD T
rial
s

TrialtrovePharma intelligence |
9
10
Expanding to a wider geography for country selection is one strategy sponsors are employing that
appears to correlate with trial success. Indeed, when we look at asthma, COPD, and rheumatoid arthritis,
successful trials involved more countries on average than trials completed during this same timeframe that
were not successful (Figure 8a) and they also involved more sites per trial than trials that were not successful
(Figure 8b). Intriguingly, the target accrual for successful trials was higher than for other trials completing
during this timeframe, suggesting that these were larger trials. Despite the expanded geography of these
trials, the increased number of sites and higher average target accrual, the average enrollment period was
shorter among successful trials in all three diseases compared with other trials completing during this timeframe
in these diseases. Future analyses are required to gain clarity around other factors influencing trial success.
Top drug mechanisms of action for these South Korean trials included long-acting beta-2 adrenergic
(LABA) agonists, long-acting muscarinic antagonists (LAMA), CD80/CD86 antagonists, Jak inhibitors,
and TNF alpha antagonists, reflecting drugs with more novel as well as established mechanisms of action.
In addition, Boehringer Ingelheim, GSK, Novartis, and Pfizer conducted 60% of these successful South
Korean trials. Therefore, it is unlikely that success was driven solely by established drugs or a single
drug development program.
The vast majority of successful trials involving South Korea were multinational; only 20% were conducted
exclusively in South Korea. Among these multinational trials, 70 different countries were utilized alongside
South Korea, the top 20 of which appear in Figure 7. In 62% of these South Korean trials, sites within the
United States also were involved; consistent with the observation already noted that most clinical trials
tend to involve the United States. What is intriguing is that among these top 20 countries, many more
countries in Latin America, Eastern Europe, and Asia Pacific were utilized along with South Korea as
compared with the dataset overall (Figure 3). This trend suggests that country selection spanning a wider
geography is taking hold and that these countries in emerging regions are playing an increasingly important
role in trial success, hinting at one strategy for success.
Figure 7. Country Selection Strategies in Autoimmune/Inflammation Trials Involving South Korea
0%
10%
20%
30%
40%
50%
60%
70%
Can
ada
Ger
man
y
Russia
Po
land
Fr
ance
Argen
tina
M
exico
Austra
lia
United
King
dom
United
Stat
es
Bra
zil
Sp
ain
Belg
ium
Czech
Rep
ublic
Hun
gary
Ind
ia
Ta
iwan
Ita
ly
Pe
ru
Sout
h Afri
ca
% S
outh
Kor
ean
Tria
ls
Source: Trialtrove® and Trialpredict®, August 2013

TrialtrovePharma intelligence |
10
11
Trials completing during the 2008 – 2012 period had a slightly better rate of achieving success than a roll
of the dice but at 52.6%, it was only slightly better than chance overall. These odds are much better than
the drug development success rates reported in recent analyses from Tufts Center for the Study of Drug in
a recent analysis conducted by Hay and colleagues where the likelihood of approval for a drug in Phase I
development was a mere 10.4% (Hay, M., et al Nature Biotechnol. 2014 Jan 9, 32(1): 40 - 51). With ever-
increasing drug development costs and lower-than-house odds of drug approval, insight into successful
clinical trial strategies can help drive the odds of trial success in a more favorable direction.
While country selection may be one factor influencing success of clinical trials, trial design, the nature of
the therapeutic tested, and site/investigator selection are all likely to impact the potential for trial success
and will be investigated in future analyses. This insight then can be leveraged to design and conduct
better trials, improving trials success rates and potentially driving overall drug approval rates higher.
Figure 8. Average Enrollment-Related Metrics for Successful Trials and Other Trials Completed 2008 – 2012 in Asthma, COPD and Rheumatoid Arthritis
Figure 8a
Figure 8b
Figure 8d
Figure 8c
Ave
rag
e C
ount
ries
per
Tri
al
Ave
rag
e Ta
rget
Acc
rual
per
Tri
al
Ave
rag
e R
epor
ted
Sit
es p
er T
rial
Ave
rag
e E
nrol
lmen
t Pe
riod
(mo.
) per
Tri
al
0
1
2
3
4
5
6
7
8
9
Asthma COPD RA 0
100
200
300
400
500
600
Asthma COPD RA
0
5
10
15
20
Asthma COPD RA 0
10
20
30
40
50
60
70
80
Asthma COPD RA
Other outcome Positive outcome
Source: Trialtrove® and Trialpredict®, August 2013