planning and programming committee february 19,2014...
TRANSCRIPT

One Gateway Plaza Los Angeles, CA 90012-2952
213.922.2000 Tel metro. net
PLANNING AND PROGRAMMING COMMITTEE FEBRUARY 19,2014
SUBJECT: LOS ANGELES COUNTY BUS RAPID TRANSIT AND STREET DESIGN IMPROVEMENT STUDY
ACTION: RECEIVE AND FILE
RECOMMENDATION
Receive and file this report on the Los Angeles County Bus Rapid Transit (BRT) and Street Design Improvement Study completed in response to the August 2011 Board motion.
ISSUE
At the August 4, 2011 meeting, the Board approved a motion (Attachment A) directing staff to identify, analyze and recommend a minimum of five corridors that could accommodate an effective BRT system, including dedicated bus lanes, throughout the County (Item 62, Number 6). This report presents the study findings and identifies nine potential BRT candidate corridors.
DISCUSSION
The purpose of the Los Angeles County BRT and Street Design Improvement Study was to develop recommendations for an effective countywide BRT system, including dedicated peak hour bus lanes and/or other general bus speed improvements using evaluation criteria established as part of the study. The study also identified feasible and cost-effective techniques to improve the quality of street life at bus stops along the identified BRT corridors.
The Los Angeles County BRT and Street Design Improvement Study's overall approach was designed to advance Metro's goal of a countywide BRT network, one that leverages the success of the Metro Rapid program as well as the Metro Orange and Silver Lines, thereby creating a more seamless, intermodal connectivity for a greater number of Los Angeles County residents and visitors.
A special project advisory committee con!?isting of the Los Angeles Department of Transportation (LADOT), the Los Angeles County Department of Public Works
21

(LACDPW), the Bus Riders Union, Metro Operations, some select transit agencies, and a number of key stakeholders (Attachment B) was established to provide input.
Background
At the last study update to the Planning and Programming Committee in June 2013, staff reviewed the methodology for identifying, selecting, and evaluating over 100 transit corridors countywide, which included corridors operated by Metro and the county's larger municipal operators. Upon further analysis of these initial 100 plus corridors, 43 were selected as the top most promising corridors for an effective countywide BRT system. The criteria used to guide the selection of these 43 transit corridors included: ridership potential using socio-economic data, regional connectivity and access to public transportation options, and adjacent corridor plans.
The 43 corridors were then ranked based on how well they scored in terms of the above criteria. The top two to four were selected from each of the five service areas to ensure a balanced countywide BRT system. As a result, 14 corridors were carried forward to another level of detailed analysis and field reviews. The purpose of the field reviews was to evaluate the most effective ways to implement peak period bus lanes and/or other bus speed improvements, verify the number of traffic and parking lanes, confirm parking restrictions, look at street geometries, identify areas of bus and traffic delays, and observe any existing streetscape.
Potential bus speed improvements include a wide range of capital and engineering improvements and operation measures which enhance bus passenger travel times and bus schedule reliability. Specific improvements consist of new transit signal priority (TSP) implementation or enhancements to the existing TSP system, restriping and signage for bus lanes, limited stop service, selective road repaving, optimize traffic signal operations, and all-door boarding. Street design improvements include enhanced sidewalks, street landscaping, and improved street furniture.
Study Findings
Based on the set of recommended improvements and length of bus lanes outlined for each corridor during the field reviews, a cost-benefit analysis was conducted to prioritize and rank them. The cost-benefit analysis compared the cost of implementing the proposed recommendations, to the potential operating savings and/or costs plus the potential revenue gain from increased ridership, over a 20-year period. This approach captured the multi-year life of assets and the multi-year operating savings and/or costs and additional revenue.
Upon completion of the cost-benefit analysis (Attachment C), the strongest candidate corridor from each of the five service areas was identified to ensure a balanced countywide BRT system. These five corridors include Vermont Avenue, Hawthorne Boulevard, Valley Boulevard, Atlantic Boulevard, and the North Hollywood to Pasadena corridor. Because this study was a countywide effort, two municipal operated corridors,
Los Angeles County Bus Rapid Transit and Street Design Improvement Study Page 2

Whittier {Montebello Bus Lines) Boulevard and Artesia Boulevard {Long Beach Transit), were added to the list of potential candidate corridors. Additionally, the Santa Monica Boulevard and Pico Boulevard corridors show significant net benefits from implementing bus lanes and warrant consideration. This brought the total number of potential BRT candidate corridors to nine as shown on the map in Attachment D. The study's Executive Summary is contained in Attachment E.
Staff suggests moving forward with conducting a more detailed corridor level technical analysis of each of the nine regional BRT candidate corridors {including peak period bus lanes) that would establish a countywide BRT network. The detailed corridor technical analysis could be conducted over four phases with two to three corridors contained in each phase as described in Attachment F.
NEXT STEPS
Staff will disseminate the final report. Staff will request funding to conduct continued technical analysis of the Phase 1 corridors and two Full Time Equivalents {FTEs) to manage this work effort through the FY 15 budget.
ATTACHMENTS
A. Board Motion of August 2011 B. Los Angeles County BRT & Street Design Improvement TAC Members C. Corridor Cost-Benefit Analysis D. Map of Nine Potential BRT Candidate Corridors E. Los Angeles County BRT & Street Design Improvement Study Executive Summary F. Proposed Countywide BRT Phasing Strategy
Prepared by: Annelle Albarran, Transportation Planning Manager, {213) 922-4025 Michael Richmai, Transportation Planning Manager, {213) 922-2558 Martha Butler, Director, Regional Transit Planning, {213) 922-7651 Brad McAIIester, Executive Officer, Long Range Planning & Coordination {213) 922-2814
Los Angeles County Bus Rapid Transit and Street Design Improvement Study Page3

Chief Planning Officer
Arthur T. Leahy Chief Executive Officer
Los Angeles County Bus Rapid Transit and Street Design Improvement Study Page 4

ATTACHMENT A
August 4, 2011 Item 62 Regular Board Meeting
MOTION BY MAYOR ANTONIO R. VILLARAIGOSA
Customer-Oriented, Integrated Bus Service Enhancements & Innovations
August 4, 2011
The MT A bus system is the backbone of the County's transportation system with over 350 million bus boardings every year.
Many transit riders depend and use the bus system for work, to get to school or to get around town for their daily needs.
This diverse class of bus users - representing all income levels -should have a system that is safe, clean, convenient, efficient and dependable.
While Measure R and other funding sources include significant investment in expanding rail transit in the County, these projects will take time to build.
In the near term, the MTA must continue improving its transit services and the customer experience by investing in its bus system.
In the spirit of partnership, the MTA and County Municipal Bus Operator Agencies have discussed tools to provide fare structures that are convenient to transit and student riders.
This includes a universal fare system (UFS) so transit users can navigate the County bus system seamlessly.
In addition to a UFS system, creating a countywide Bus Rapid Transit (BRT} network that is fast, convenient, safe and affordable needs to be explored.
BRT has been defined by the Federal Transit Administration {FTA) as a "rapid mode of transportation that can provide the quality of rail transit and the flexibility of buses. n
Cities across the world including Bogota (TransMilenio ), Lima (Metropolitano ), Curitiba, Madrid, Johannesburg have implemented successful BRT systems that are used by millions of riders each year.
CONTINUED

August 4, 2011 Item 62 Regular Board Meeting
While a higher percentage of future boardings will occur on more costeffective fixed guideway lines, in the long-term bus service levels need to be maintained or even expanded to accommodate projected population growth and to make sure that they are convenient transit connections to and from the subway, light rail and busway lines.
MTA needs to make a commitment that it will continue to operate a robust, customer-oriented bus service and that it will continue to innovate.
I THEREFORE MOVE that the MTA Board of Directors direct the CEO to:
1. Maintain bus revenue service hours on all Tier 1 and MTA Rapid Bus lines for FY12.
2. Regularly monitor passenger loads and on-time performance to ensure satisfactory bus service.
3. Direct the CEO to report on a strategy and timeline for the completion of the UFS, or Transit Access Pass (TAP), card by the October 2011 Board meeting.
4. Direct the CEO to provide an implementation plan for the quarterly bus service evaluation program that was outlined in the June 2011 report on bus service modifications to the Operations Committee.
5. Direct the CEO to appoint an internal compliance manager to report on all existing MTA bus services in coordination with the Service Councils at a monthly basis; the report should include but not be limited to the following:
A. Bus & station cleanliness
B. Graffiti free buses & stations
C. On-time performance & wait times
D. Walking distances to service
E. A thorough customer survey
CONTINUED

August 4, 2011 Item 62 Regular Board Meeting
6. Direct the CEO to work with local jurisdictions to identify, analyze and recommend a minimum of five corridors in the County that can accommodate an effective Bus Rapid Transit system. The selection of the routes should include but not limited to the following:
A. Ridership
B. Station stops/spacing
C. Physical attributes of routes & limited transfers
D. Transfer convenience/demand
E. Congestion and Level of Service levels
F. General Public and community support
G. Economic development opportunities around stations
H. Partnerships with other transit agencies outside of the County
The CEO shall report back on the BRT system recommendations by the October 2011 MTA Board meeting.
###

ATTACHMENT B
Los Angeles County Bus Rapid Transit & Street Design Improvement Study Technical Advisory Committee
Transit Agencies:
Diana Chang
LaShawn Gillespie
Susan Bok
Shirley Hsiao
Metro (Service Planning and Development) Dana Woodbu
Montebello Bus Lines ose Medrano
OCTA Charlie Larwood
Santa Monica Big Blue Bus Timothy McCormick and Paul Ca
rrance Transit James Lee
Karen Sakoda
Cities/County:
County of Los Angeles (Public Works) Vince Aguilar
Glendale Katherine En
Los Angeles (LADOT) & LA City Planning Jane Choi (L.A. City Planning Dept.) and
esus Serrano
Pasadena Valerie Gibson
od Sharon Perlstein and Melissa Antol
Council of Governments:
San Fernando Valley COG Bob Scott (Jaime
San Gabriel Vall COG Fran Delach
South Bay Cities COG Jacki Bacharach
stside Cities COG Maria licki
Other Interest Groups:
Bus Riders Union Sunyoung Yang
Coalition for Clean Air Martin Sch

Countywide BRT & Street Design Improvement Study Cost and Benefit Ana
78% -52%
($969,400) to 99% ($20,532,200) $145,700 to
Santa Monica 1
I WSC
Hawthorne 1 ·
2 SB -WSC -- 83% ($1 ,645,600)
wsc 0% ($96,900) $218,600
Western 1 0% ($59,900) $107,300 --Verno 0% ($61,600) $76,000
Atlantic 1 Gate 95% -Pi co (east) 1 wsc 67%
SO% (arterial option) 10%
(freeway NoHo- Pasadena 3
' 4
SFV option
Burbank -NoHo4 SFV 24% -Whittier 4 Gate 55% -Artesia 4 Gate 94% -
4 SGV 64% -Roscoe 4
SFV 72%
1. Existing Metro Rapid Corridors
2. Study included looking at multiple alternatives/operating segments
3. Study included looking at two freeway and one arterial alternatives
4. Indicates new BRT corridors. Study assumed no reallocation of existing service hours to new BRT services, therefore, a net cost shown
Should some existing service hours be reallocated to the new BRT services, any net operating costs would be negated
Travel times would be improved by at least 30% and service reliability improved significantly on these new BRT corridors
Note: Operating costs assumed a 15-hour span of service weekdays with headways of 15-minute peakf20-minute off-peak for brand
new BRT corridors and Atlantic Metro Rapid
ATTACHMENT C
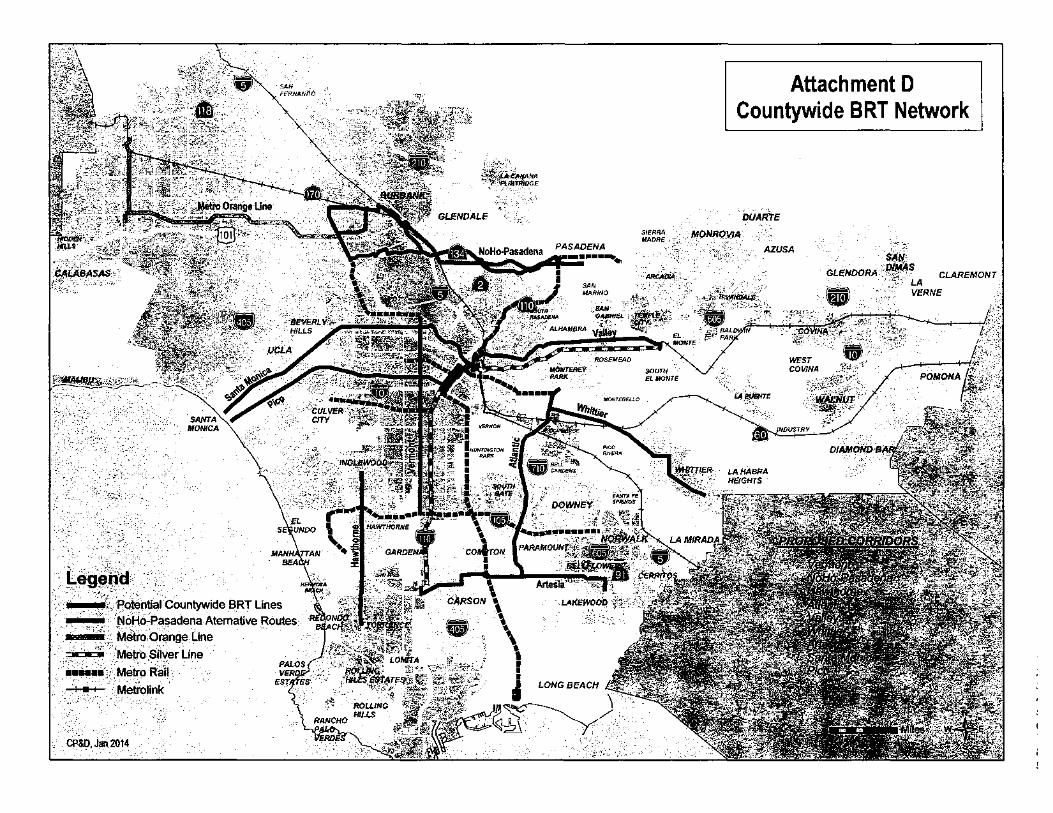
Attachment D Countywide BRT Network

f., (D "; Metro

Los Angeles County Bus Rapid Transit and Street Design Improvement Study
EXECUTIVE SUM MARY
Final Report Executive Summary
Los Angeles County benefits from the largest Bus Rapid Transit (BRT) network in the world, with a mix of arterial, fixed-guideway and freeway-based BRT lines. The Los Angeles County Metropolitan Transportation Authority (Metro) is both the largest public transportation agency in Los Angeles County as well as manager of County revenues dedicated to public transportation. Metro conducted the Los Angeles County Bus Rapid Transit (BRT) and Street Design Improvement Study to examine the potential for a Countywide BRT system that includes dedicated peak period bus lanes. Bus lanes, whether arterial, at-grade, or grade-separated, are one of the most critical elements of a BRT system. The implementation of bus lanes will significantly improve travel times and schedule reliability.
The study was conducted in collaboration with a special project advisory committee consisting of the City of Los Angeles Department ofTransportation (LADOT), the Los Angeles County Department of Public Works (LACDPW}, the Bus Riders Union, Metro Operations, some select transit agencies, and a number of other key stakeholders
Study Purpose
The purpose of the Los Angeles County Bus Rapid Transit (BRT) and Street Design Improvement Study was to identify, analyze and develop recommendations for an effective Countywide BRT system that includes dedicated peak hour bus lanes along with a number of other general bus speed improvements. The study was also to identify and recommend feasible and cost-effective techniques to improve the quality of street life at or near the bus stops along the recommended BRT corridors. Metro has already begun to address both goals in a variety of ways with the implementation of the Metro Rapid Program as well as the Metro Orange and Silver Line services and their related improvements.
The Los Angeles County BRT and Street Design Improvement Study's overall approach was designed to advance Metro's goal of a Countywide BRT system; one that leverages the success of the Metro Rapid program as well as the Metro Orange and Silver Lines, thereby creating a more seamless, intermodal connectivity for a greater number of the County's residents and visitors. Using evaluation and implementation criteria established as part of the study, a multistep approach was taken in evaluating and identifying promising BRT corridors. Figure 1 below illustrates the various screening stages of the study along with the defined criteria developed for each. This approach and process is discussed in more detail in Chapter 2 of this report.
Figure 1: LACBRT Candidate Corridor Screening Process
~Metro Page ES-1

Los Angeles County Bus Rapid Transit and Street Design Improvement Study
Screening Stages and Results
Final Report Executive Summary
The study began by examining all potential candidate corridors Countywide based upon their potential for enhancing regional connectivity, improving public transportation access, attracting additional ridership, and improving service efficiencies. An initial list of 108 corridors was identified as potentially promising candidates to be included in the BRT network. The initial list of108 corridors included lines operated by Metro and some of the larger municipal transit operators.
Other factors guiding the identification ofthe initial108 corridors included: other recent andjor current transit reportsjstudies; transit corridors with headways of 15 minutes or better; recommendations from the special project technical advisory committee; corridors with connections to the existing transporta-tion system; corridors with the potential to improve regional connectivity; regional balance; corridors with the potential to improve inter-County connectivity with neighboring counties; and, industry best practices. Table 1 below lists the 108 initial candidate corridors identified as potential BRT corridors.
Table 1. Initial Countywide List of108 Corridors
Wilshire Blvd (west) Wilshire Blvd (central) 3rd St Santa Monica Blvd Venice Blvd
Florence Ave Sunset Blvd Vernon Ave Hollywood West Olympic
Whittier Blvd Manchester-Firestone Pico Blvd Slauson Ventura Blvd
Fairfax Ave 6th St Colorado (Pasadena) Sherman Way Garvey
Beverly Huntington-Las Tunas Roscoe Compton Gage Ave
Valley Blvd. Cesar Chavez Ave Vanowen Way East Olympic Blvd Century Blvd
1st St Reseda Nordhoff Rapid Blue 7 Corridor Rapid Blue 10 (via 1-10)
Artesia Blvd Del Amo Blvd Willow Ave Cherry Ave Cerritos Ave
Vermont Ave Western Ave (north) Western Ave (south) Van Nuys Blvd Hawthorne Blvd
San Fernando/ Crenshaw North Long Beach Blvd Soto St Broadway Lankershim
Atlantic- Fair Oaks Avalon Blvd Normandie Ave La Brea Blvd Central
Sepulveda (S.F. Valley) Sepulveda (Culver City) Sepulveda (South Bay) North Figueroa South Figueroa
Alvarado-Hoover Sepulveda Pass Lincoln Silver Line (Downtown Lakewood Blvd (Westside) core segment)
Norwalk/Hawaiian Glendale Blvd/San 23rd St/West Adams Ocean Blvd (Long Beach) 8th St Gardens Fernando Rd. Blvd.
West Washington Virgil/7th St Huntington Dr. East Washington Blvd Norwalk Connector (new)
North Hollywood- Hollywood-Burbank 1-405 Corridor Santa Anita Ave Orange Line Pasadena (new) BRT (new) (Sepulveda Pass) East/Burbank Montebello Blvd. San Gabriel/ Enhanced LA downtown 1-10 Silver Streak (east) Huntington Drive East
Montebello circulator SR-101 South Pasadena- Metro Blue Line to CSU Azusa-Ontario Airport South Bay-Harbor
Harbor Corridor (new) Long Beach BRT (new) BRT Harbor Subdivision 1-405 Corridor North North Hollywood-Sylmar Glendale-Downtown LA 1-605 North-South
BRT (new) Corridor (SR-2) Corridor (new) West Valley -West LA Long Beach to West Santa Ana Branch Orangeline North Rosemead Blvd Direct Whittier Direct BRT Palmdale BRT (new)
Imperial Hwy. South 1-405 corridor Burbank via Glendale to Azusa Ave. South Atlantic Ave. Hollywood (new)
Westwood Blvd/ Pacific Coast 7th St. Overland Ave Hwy./South Bay (Long Beach)
~Metro Page ES-2

Los Angeles County Bus Rapid Transit and Street Design Improvement Study
Final Report Executive Summary
Several corridors or segments of corridors had great potential for BRT development, but were immediately eliminated for further study to avoid redundancies with other studies or development projects already underway. For example, Wilshire Boulevard (Wilshire BRT Project), the northern segment of Atlantic Boulevard (1-710 North Study), the West Santa Ana Branch of the Harbor Subdivision (West Santa Ana Transit Corridor), Sepulveda Boulevard north of Los Angeles International Airport (Sepulveda Pass Corridor), and Van Nuys Boulevard (East San Fernando Valley Transit Corridor), were excluded from this study for this reason.
Upon further analysis of the initial1 08 corridors, 43 were selected for the next level of evaluation. Additional criteria were used to guide the selection of these 43 transit corridors in order to identify the top most promising corridors for an effective Countywide BRT system. These criteria included:
• Ridership potential/transit suitability • Regional connectivity/access to public transportation options • Adjacent corridor plans
The 43 corridors were then ranked based on a combined standardized score in each of the above areas. The results for the 43 corridors were presented to the special project Technical Advisory Committee (TAC) and other stakeholders for review. Based on input from the TAC, 14 corridors were selected to be advanced to the next level of detailed analysis and field reviews. In order to ensure that the potential candidate corridors and recommendations represented a balanced, Countywide BRT system that was not confined to a few communities, the 14 corridors consisted of two to three corridors from each sub-region of the County. The 14 corridors recommended for further evaluation and field reviews include:
• Artesia (Gateway CitiesfSouth Bay) • North Hollywood-Pasadena (San
• Atlantic (Gateway Cities) Fernando/San Gabriel Valleys)
• Broadway (WestsidefCentral) • Roscoe (San Fernando Valley)
• Burbank-North Hollywood (San Fernando • Santa Monica (WestsidefCentral) Valley) • Valley (San Gabriel Valley)
• Hawthorne (South Bay) • Vermont (WestsidefCentral)
• La Cienega-Vernon (Westside/Central) • Western (WestsidefCentral)
• Pico (Westside/Central) • Whittier (Gateway Cities)
A map of the 14 corridors is provided on the following page in Figure 2.
®Metro
Page ES-3

Los Angeles County Bus Rapid Transit and Street Design Improvement Study
Final Report Executive Summary
Figure 2: Map ofl4 Countywide BRT Candidate Corridors
Field Reviews
Countywide BRT Study 14Conidors
The purpose of the corridor field reviews was to evaluate the most effective ways to implement peak period bus lanes and for other bus speed improvements where buses experience delay. As a result of the field reviews, a set of recommendations was developed for each of the 14 corridors that included a variety of improvements designed to improve service to BRT standards, as well as recommendations for bus lanes, queue jumps, repaving where needed, implementation of other key BRT attributes such as limited stops, parking restructuring and installation of transit signal priority (TSP) or optimization of the TSP system where it already exists. Enhancements of the streetscape as well as each corridor's economic development potential were also considerations evaluated during the field reviews. The recommended streetscape improvements are included in Chapter 3. The analysis of each corridor's economic development potential can be found in Appendix B.
Cost and Benefit Analysis
In order to prioritize and rank the remaining 14 corridors, a cost and benefit analysis was conducted. The cost and benefit analysis compared the capital costs, operating costs, travel time savings and
G) Metro
Page ES-4

Los Angeles County Bus Rapid Transit and Street Design Improvement Study
Final Report Executive Summary
projected increase in ridership and revenue for each of the 14 corridors. Details ofthis analysis and the specific results are included in Chapter 4.
The capital improvements proposed for each corridor covered a range of costs including street repaving where needed, re-striping and signage for bus lanes, design and construction of new TSP or enhancements to the existing TSP system and branded stations/shelters. The net operating costs and for savings were derived from the projected travel time savings and increased revenues expected from increased ridership as a result of implementing the proposed BRT service and capital improvements. Other elements examined but not included in the cost and benefit analysis included streetscape improvements and all-door boarding as these two elements are not immediately needed to implement BRT.
Upon completion ofthe cost and benefit analysis, a final list of nine regional BRT candidate corridors
were identified and recommended for a more detailed corridor level analysis and environmental
review. These nine BRT candidate corridors include:
• Vermont
• Hawthorne
• North Hollywood-Pasadena
• Atlantic
• Whittier
• Valley
• Artesia
• Santa Monica
• Pico
The Map in Figure 3 on the following page illustrates the final nine corridors recommended for
additional study and potential development.
~Metro Page ES-5

Los Angeles County Bus Rapid Transit and Street Design Improvement Study
Final Report Executive Summary
Figure 3: Map ofFinal9 Countywide BRT Candidate Corridors
---~~~~~~·~'~" - flloHo..Piudlll AtllnlliYe - Me1ro Otengt Ufte ~ Metro so-Line
- MelroRllll
·-~
Next Steps
Countywide BRT Study 9 Con1dors
Further steps undertaken for any ofthe recommended corridors should include a more detailed corridor level analysis andfor environmental review, detailed planning and conceptual design work, public outreach, and further work with the affected jurisdictions along the individual corridors. The environmental reviews will identify and evaluate any significant or potentially significant environmental impacts associated with the implementation of bus lanes and address appropriate and feasible mitigation measures and alternatives that would reduce or eliminate those impacts. This more detailed work is needed should Metro decide later to seek discretionary grant funds to implement any ofthe proposed BRT corridors.
It is also recommended that the detailed corridor studies be developed in several phases beginning with the Vermont (Westside/Central) and the North Hollywood to Pasadena (San FernandofSan Gabriel Valleys) corridors. Vermont is the second (behind Wilshire Boulevard) most important bus transit corridor in the County with almost 50,000 weekday boardings. It also ranks at the top of this study for having the highest potential 20-year net benefits. The North Hollywood to Pasadena corridor is a new potential BRT corridor that has been identified in several studies as being a key regional connection that is currently missing within the existing transit system. This corridor also has strong support from the affected cities of Pasadena, Glendale, Burbank, and the Burbank Bob Hope Airport.
~Metro Page ES-6

Los Angeles County Bus Rapid Transit and Street Design Improvement Study
Final Report Executive Summary
Once these first two corridor studies are complete, the next group of corridors can begin their corridor level analysis/environmental review, followed by two more phases of corridor studies. It is recommended that the second phase of studies include the Hawthorne (South Bay service area), Valley (San Gabriel Valley service area), and Atlantic (Gateway service area) corridors. This would allow for at least one corridor from each service area to be completed.
The third phase of corridor studies would include the Artesia (Gateway service area) and the Whittier (Gateway service area) corridors. These BRT corridors are proposed to be operated by Long Beach Transit and Montebello bus lines, respectively. The last phase of corridor studies would include the Santa Monica (WestsidefCentral service area) and the Pico (Westside/Central service area) corridors. These two corridors were deemed worthy offurther study as they both rank high for producing significant 20-year net benefits with the implementation of peak period bus lanes and other improvements.
Although the above phasing of the corridor studies is recommended, the actual completion and phasing of the studies will be dependent upon whether or not Metro chooses to pursue further BRT project development and implementation of new BRT corridors.
®Metro
Page ES-7

ATTACHMENT F
Proposed Countywide BRT Phasing Strategy
Phase 1:
This phase consists of the Vermont and the North Hollywood to Pasadena corridors. The study revealed that Vermont is the top overall candidate corridor yielding a potential 20-year net savings of $38,557,800 and a relatively low one-time capital cost investment of approximately $1,599,900. Vermont is the second busiest bus transit corridor in the county with approximately 48,500 weekday boardings and appears to be able to accommodate peak hour bus lanes for a majority of its route.
The North Hollywood to Pasadena would be a new potential BRT corridor. It has been identified in several studies as a key regional connection that is currently missing within the existing transit system. This corridor has strong support from the Cities of Pasadena, Glendale, Burbank, and the Burbank Bob Hope Airport. We recommend that the Los Angeles Department of Transportation (LADOT) consider modifying their existing Commuter Express Line 549 service along the SR-134 Freeway from Pasadena to Encino. This service currently operates during weekday peak hours only.
The proposed modified service could potentially operate as an all-day demonstration BRT line from the North Hollywood Metro Orange/Red Line Station to the Del Mar Metro Gold Line Station in Pasadena. Additional operating dollars would need to be identified for the new added service hours. With the identification of operating funds, this demonstration could operate while the corridor technical analysis of the North Hollywood to Pasadena alternatives, potentially linking the Burbank Airport, is completed.
Phase 2:
The next group of corridor studies would include the Hawthorne, Atlantic and Valley corridors. These three corridors are the top BRT candidate corridors for the South Bay, Gateway, and San Gabriel Valley service areas, respectively. Corridors in Phases 1 and 2 would allow for at least one corridor technical analysis from each service area be completed.
Phase 3:
The third phase would consist of the Whittier and Artesia corridors. These BRT candidate corridors are proposed to be operated by Montebello Bus Lines and Long Beach Transit, respectively. Given the strong interest from both transit agencies to implement some type of BRT service, it may be possible to identify and seek a potential source of funding to implement Rapid type service earlier, while studying the feasibility of implementing enhanced BRT service that includes peak period bus lanes.
Phase 4:
The last phase includes the Santa Monica and Pico corridors. Although these two corridors did not rank as high as Vermont in the Westside/Central service area, they were both deemed worthy of further study. Both corridors produce a significant potential 20-year net savings of $24,478,500 and $11,452,600, respectively, with the implementation of peak period bus lanes and other bus speed improvements.
