platzhalter für bild, bild auf titelfolie hinter das logo einsetzen sheetal gangula, institute of...
TRANSCRIPT
Platzhalter für Bild, Bild auf Titelfolie hinter das Logo einsetzen
Sheetal Gangula, Institute of Food chemistry
Quantitative analysis of complex oligomeric mixtures by MS
8 May 2014 | Sheetal Gangula |TU Braunschweig 2
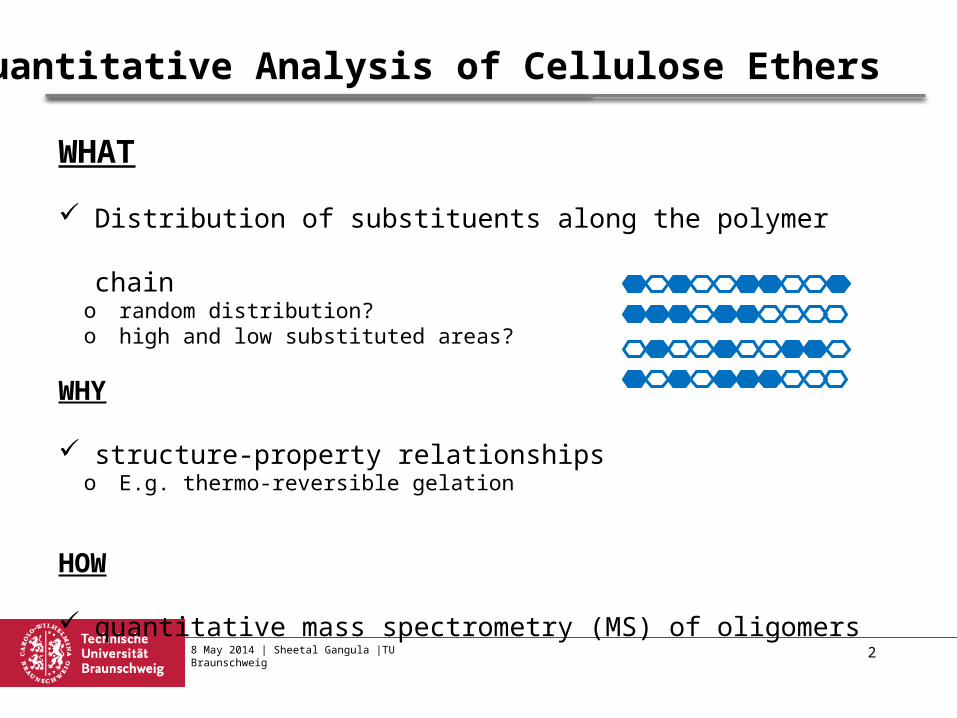
WHAT
Distribution of substituents along the polymer chaino random distribution?o high and low substituted areas?
WHY
structure-property relationships o E.g. thermo-reversible gelation
HOW
quantitative mass spectrometry (MS) of oligomers
Quantitative Analysis of Cellulose Ethers
8 May 2014 | Sheetal Gangula |TU Braunschweig 3
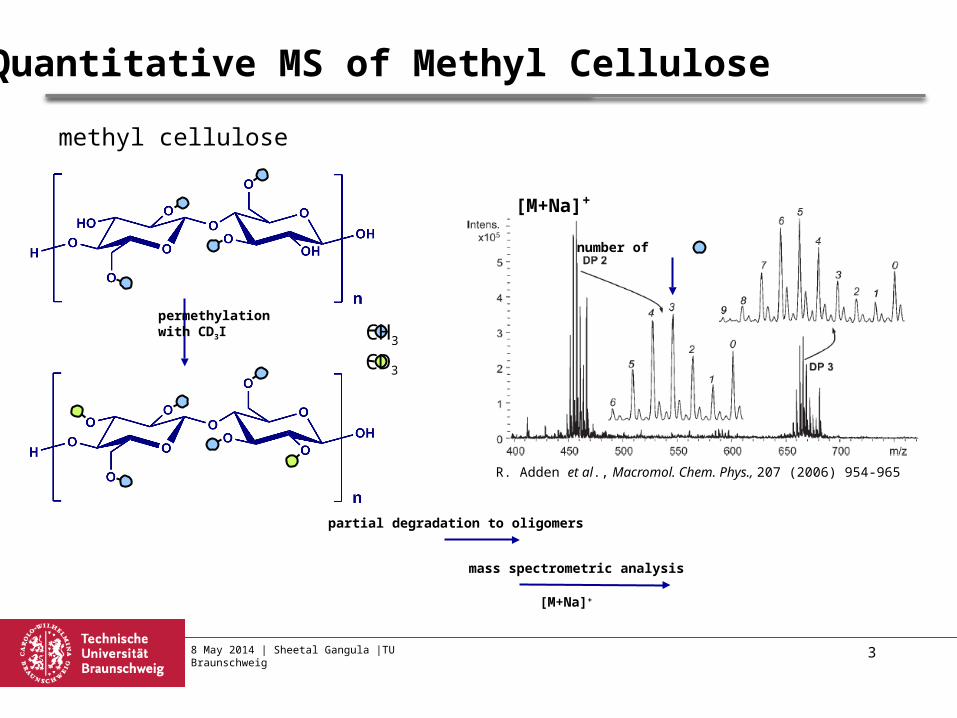
Quantitative MS of Methyl Cellulose
methyl cellulose
CH3
CD3
permethylationwith CD3I
partial degradation to oligomers
mass spectrometric analysis
R. Adden et al., Macromol. Chem. Phys., 207 (2006) 954-965
number of
[M+Na]+
[M+Na]+
8 May 2014 | Sheetal Gangula |TU Braunschweig
Analysis by MS
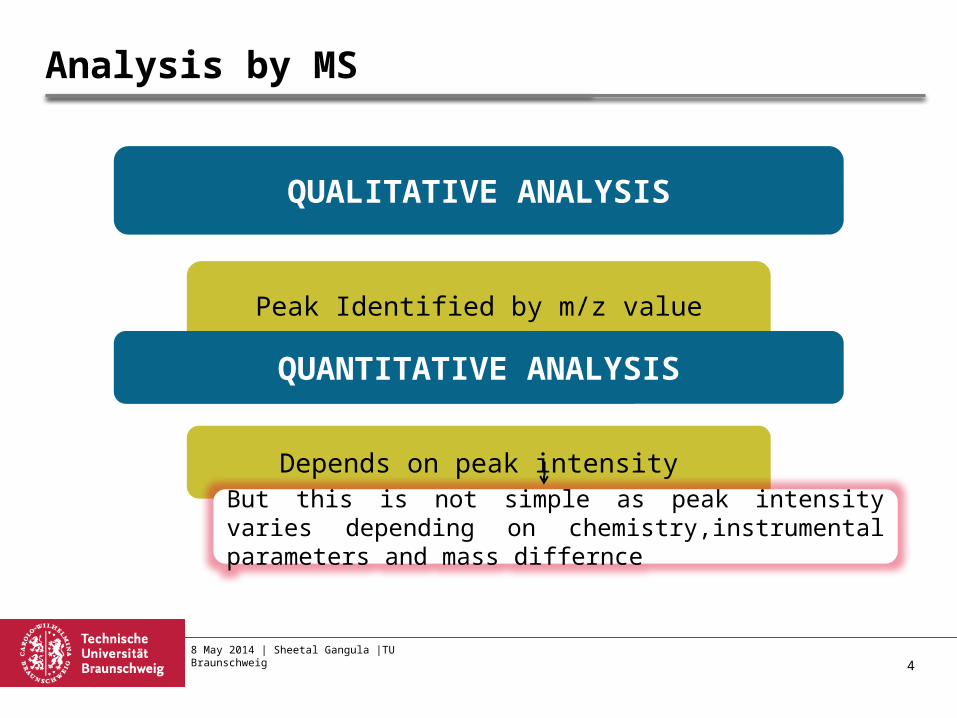
QUALITATIVE ANALYSIS
Peak Identified by m/z value
QUANTITATIVE ANALYSIS
Depends on peak intensity
But this is not simple as peak intensity varies depending on chemistry,instrumental parameters and mass differnce
4
8 May 2014 | Sheetal Gangula |TU Braunschweig
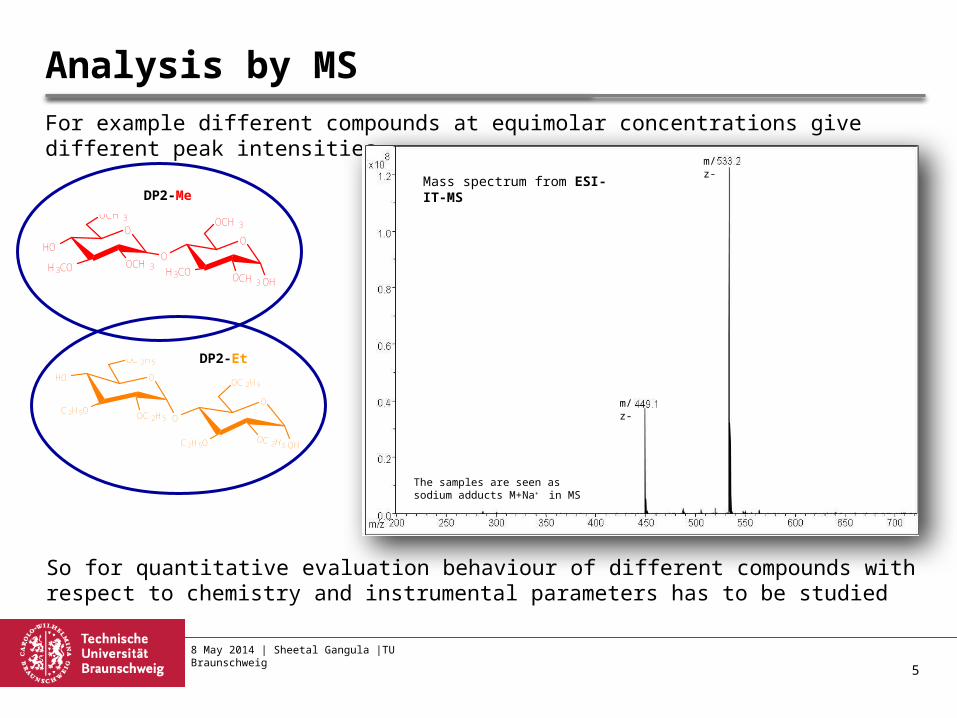
For example different compounds at equimolar concentrations give different peak intensities
Analysis by MS
So for quantitative evaluation behaviour of different compounds with respect to chemistry and instrumental parameters has to be studied
Mass spectrum from ESI-IT-MS
m/z-
m/z-
O
O
H3CO OCH3
OCH3
OH
O
HO
H3CO OCH3
OCH3
O
O
C2H5O
OC2H5
OH
OHO
C2H5OOC2H5
OC2H5
DP2-Me
DP2-Et
The samples are seen as sodium adducts M+Na+ in MS
5
8 May 2014 | Sheetal Gangula |TU Braunschweig
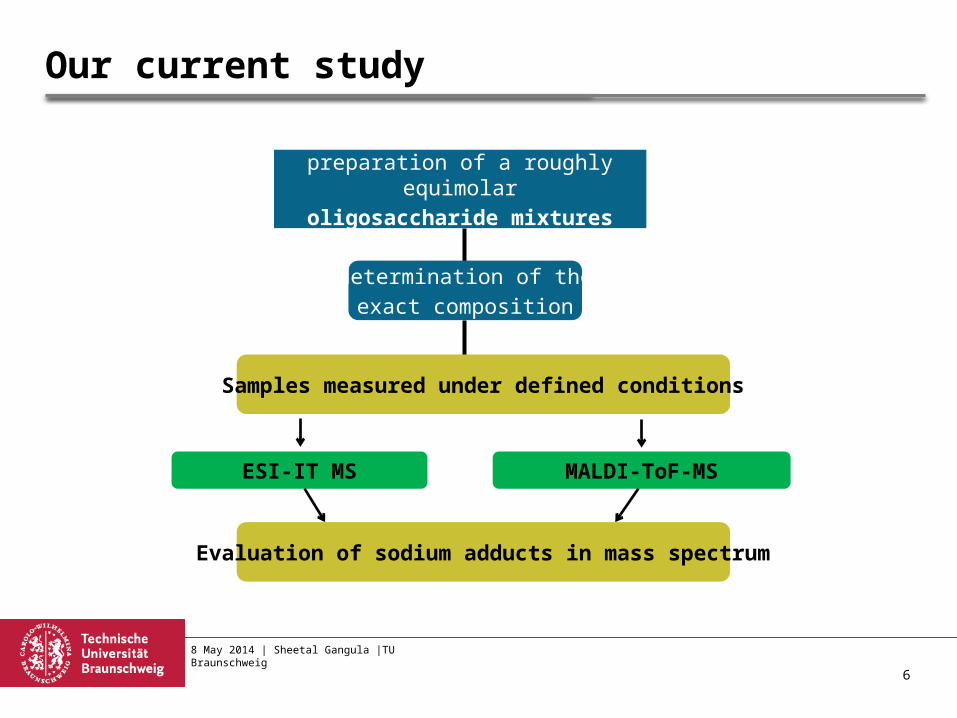
Our current study
preparation of a roughly equimolar
oligosaccharide mixtures
determination of the
exact composition
Evaluation of sodium adducts in mass spectrum
ESI-IT MS MALDI-ToF-MS
Samples measured under defined conditions
6
8 May 2014 | Sheetal Gangula |TU Braunschweig
Sample PreparationO
OH3CO
OCH3
OCH3
O
O
H3CO
H3CO
OCH3
O
OH3CO
H3CO
OCH3
O
OOCH3
H3CO
H3CO
O
O
OCH3
OCH3
H3CO
O
OOCH3
OCH3
H3CO
2
O
OD3CO
OCD3
OCD3
O
O
D3CO
D3CO
OCD3
O
OD3CO
D3CO
OCD3
O
OOCD3
D3CO
D3CO
O
O
OCD3
OCD3
D3CO
O
OOCD3
OCD3D3CO
2
O
OC2H5O
OC2H5
OC2H5
O
O
C2H5O
OC2H5
O
O
OC2H5
O
OC2H5O
C2H5O
O
O
OC2H5
OC2H5
C2H5O
O
O
OC2H5
OC2H5C2H5O
2
OC2H5
C2H5O
C2H5O
C2H5O
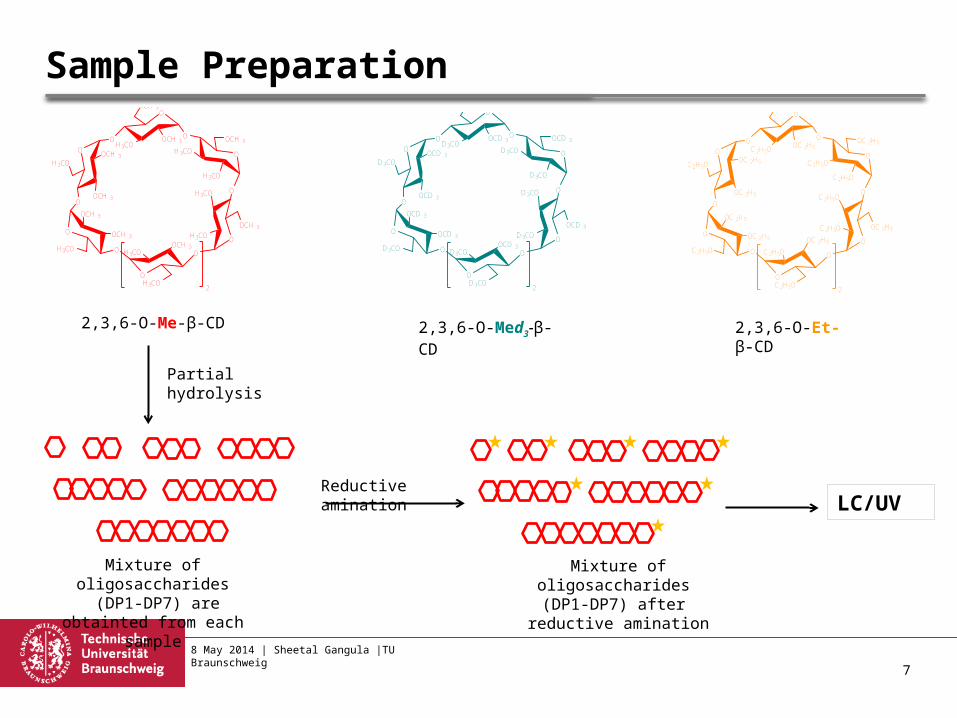
2,3,6-O-Me-β-CD 2,3,6-O-Med3-β-CD 2,3,6-O-Et-β-CD
Reductive amination
Mixture of oligosaccharides (DP1-DP7) are obtainted
from each sample
Mixture of oligosaccharides (DP1-DP7) after
reductive amination
LC/UV
Partial hydrolysis
7
8 May 2014 | Sheetal Gangula |TU Braunschweig
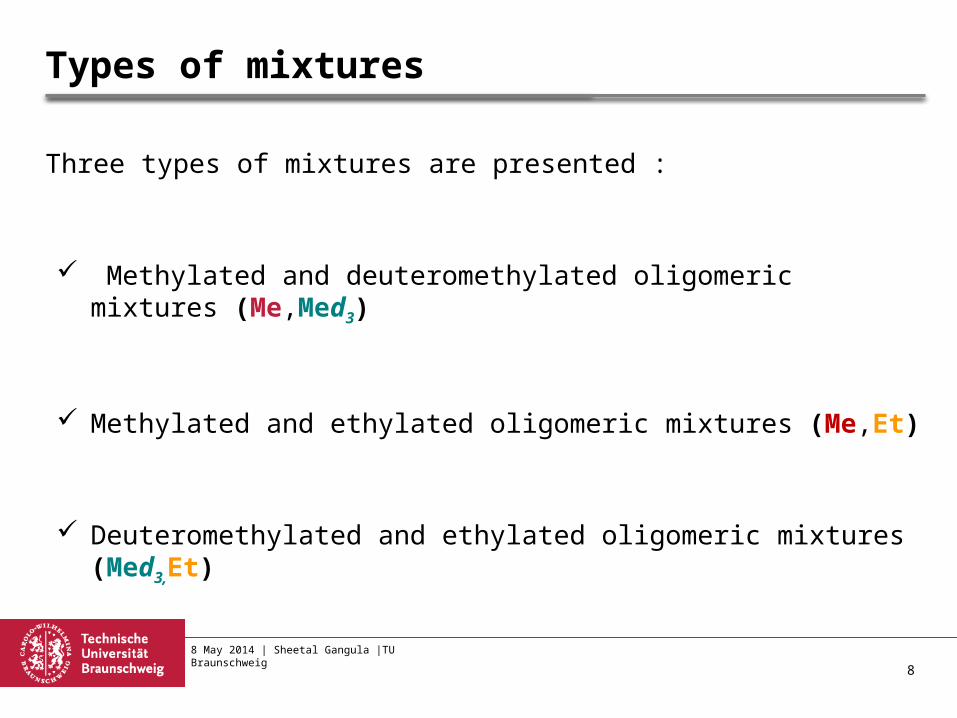
Types of mixtures
Three types of mixtures are presented :
Methylated and deuteromethylated oligomeric mixtures (Me,Med3)
Methylated and ethylated oligomeric mixtures (Me,Et)
Deuteromethylated and ethylated oligomeric mixtures (Med3,Et)
8
8 May 2014 | Sheetal Gangula |TU Braunschweig
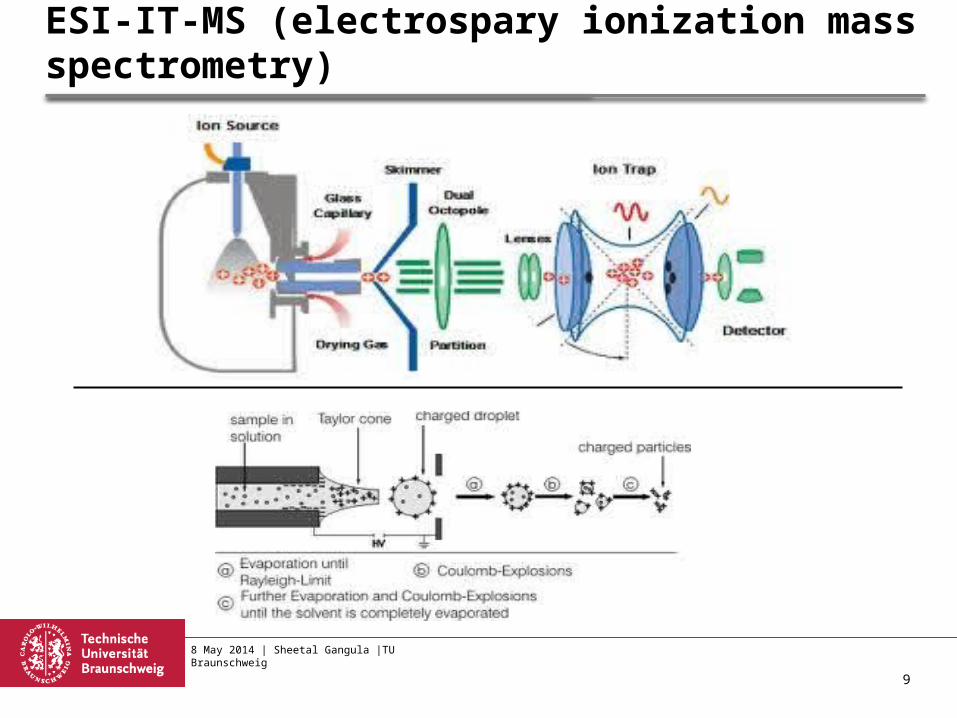
ESI-IT-MS (electrospary ionization mass spectrometry)
9
8 May 2014 | Sheetal Gangula |TU Braunschweig
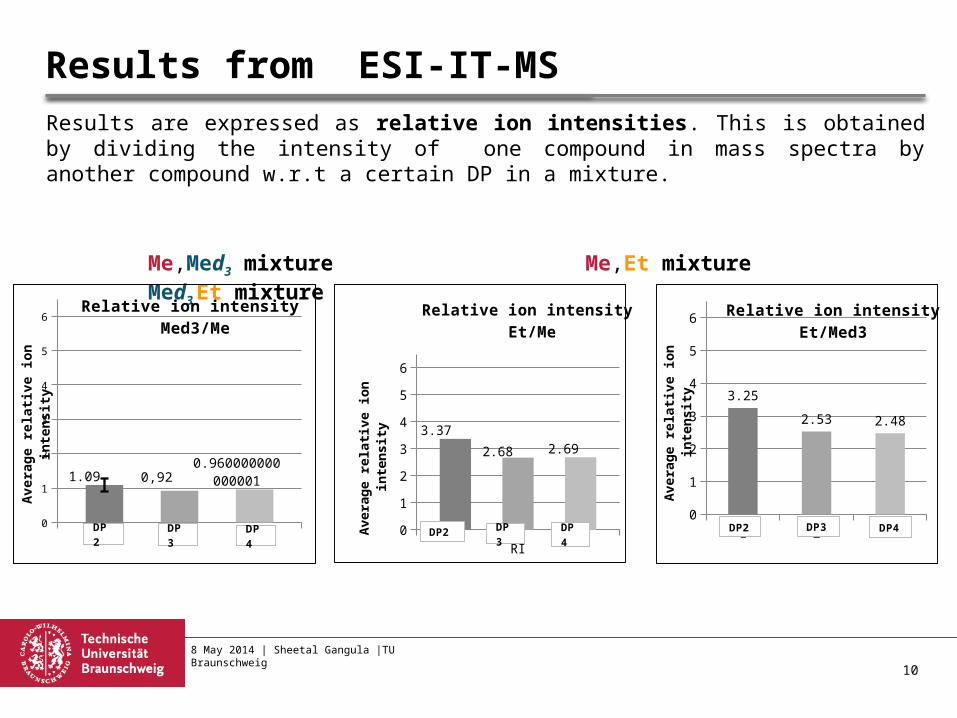
Results are expressed as relative ion intensities. This is obtained by dividing the intensity of one compound in mass spectra by another compound w.r.t a certain DP in a mixture.
Me,Med3 mixture Me,Et mixture Med3,Et mixture
Results from ESI-IT-MS
RI0
1
2
3
4
5
6
1.09 0,920.96000000000
0001
Relative ion intensity Med3/Me
Ave
rag
e re
lati
ve i
on
in
ten
sity
DP3 DP4DP2
RI0
1
2
3
4
5
6
3.37
2.68 2.69
Relative ion intensity Et/Me
Ave
rag
e re
lati
ve i
on
in
ten
sity
DP3 DP4DP2 1 2 30
1
2
3
4
5
6
3.25
2.53 2.48
Relative ion intensity Et/Med3
Ave
rag
e re
lati
ve i
on
in
ten
sity
DP2 DP3 DP4
10
8 May 2014 | Sheetal Gangula |TU Braunschweig
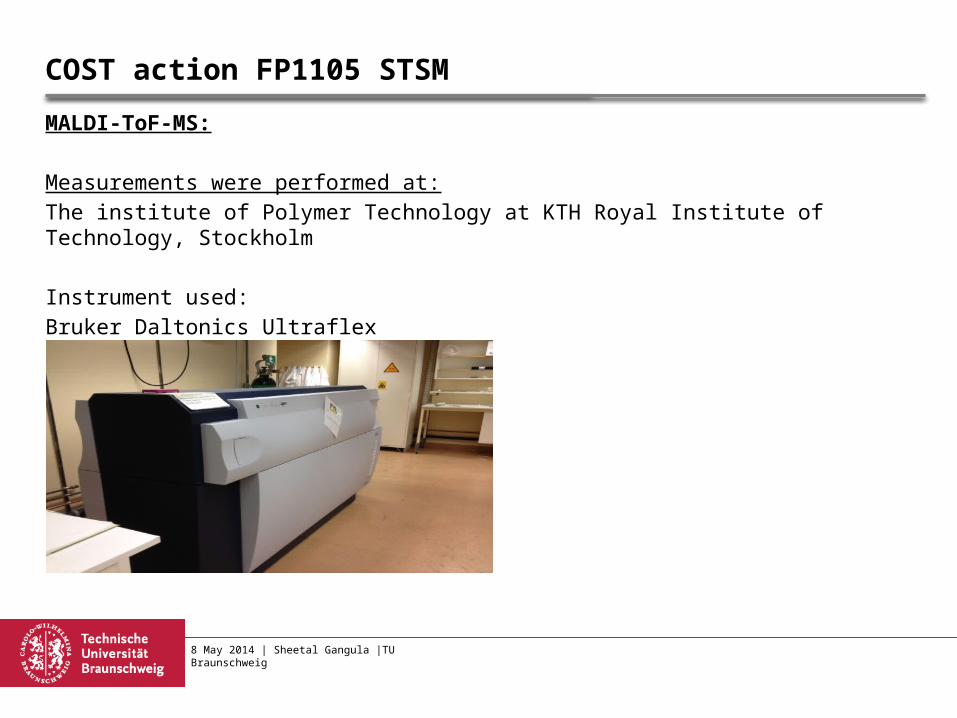
COST action FP1105 STSM
MALDI-ToF-MS:
Measurements were performed at:
The institute of Polymer Technology at KTH Royal Institute of Technology, Stockholm
Instrument used:
Bruker Daltonics Ultraflex
8 May 2014 | Sheetal Gangula |TU Braunschweig
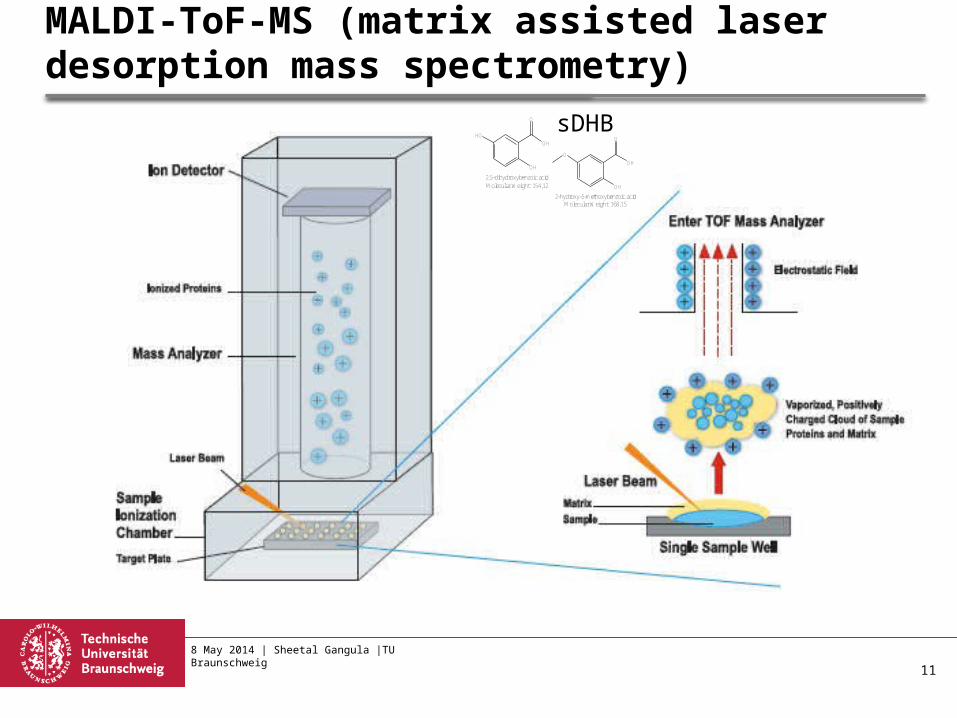
MALDI-ToF-MS (matrix assisted laser desorption mass spectrometry)
11
2,5-dihydroxybenzoic acid
O
OH
HO
OH
2-hydroxy-5-methoxybenzoic acid
O
OH
O
OHMolecular Weight: 154,12
Molecular Weight: 168,15
sDHB
8 May 2014 | Sheetal Gangula |TU Braunschweig
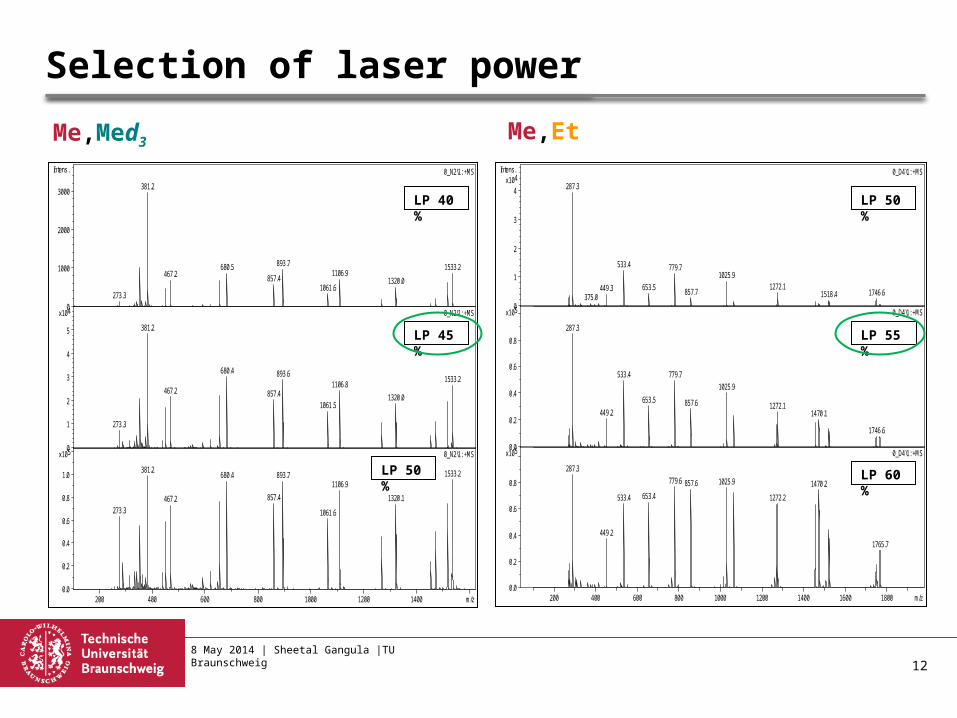
Selection of laser power
Me,Et
273.3
381.2
467.2680.5
857.4
893.7
1061.6
1106.91320.0
1533.2
0_N2\1: +MS
273.3
381.2
467.2
680.4
857.4
893.6
1061.5
1106.8
1320.0
1533.2
0_N2\1: +MS
273.3
381.2
467.2
680.4
857.4
893.7
1061.6
1106.9
1320.1
1533.2
0_N2\1: +MS
0
1000
2000
3000
Intens.
0
1
2
3
4
5
4x10
0.0
0.2
0.4
0.6
0.8
1.0
5x10
200 400 600 800 1000 1200 1400 m/z
Me,Med3
LP 40 %
LP 45 %
LP 50 %
287.3
375.0449.3
533.4
653.5
779.7
857.7
1025.91272.1
1518.4 1746.6
0_D4\1: +MS
287.3
449.2
533.4
653.5
779.7
857.6
1025.9
1272.11470.1
1746.6
0_D4\1: +MS
287.3
449.2
533.4 653.4
779.6 857.6 1025.9
1272.2
1470.2
1765.7
0_D4\1: +MS
0
1
2
3
4
4x10Intens.
0.0
0.2
0.4
0.6
0.8
5x10
0.0
0.2
0.4
0.6
0.8
5x10
200 400 600 800 1000 1200 1400 1600 1800 m/z
LP 50 %
LP 55 %
LP 60 %
12
8 May 2014 | Sheetal Gangula |TU Braunschweig
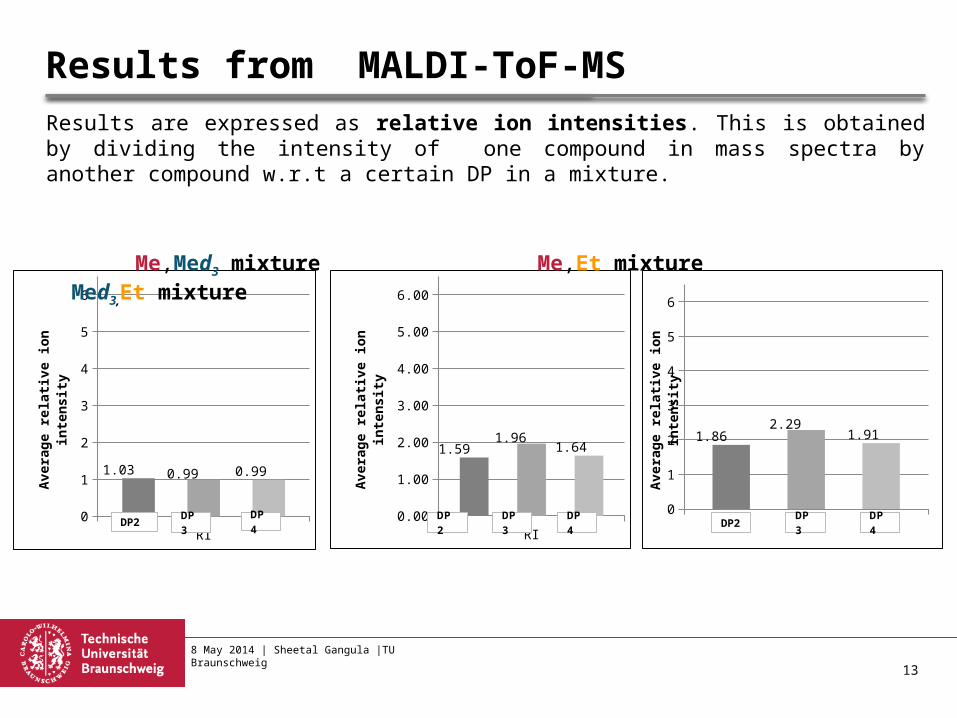
Results from MALDI-ToF-MS
RI0
1
2
3
4
5
6
1.03 0.99 0.99
Ave
rag
e re
lati
ve i
on
in
ten
sity
DP3 DP4DP2RI
0.00
1.00
2.00
3.00
4.00
5.00
6.00
1.591.96
1.64
Ave
rag
e re
lati
ve i
on
in
ten
sity
DP3 DP4DP2 RI0
1
2
3
4
5
6
1.862.29
1.91
Ave
rag
e re
lati
ve i
on
in
ten
sity
DP3 DP4DP2
Results are expressed as relative ion intensities. This is obtained by dividing the intensity of one compound in mass spectra by another compound w.r.t a certain DP in a mixture.
Me,Med3 mixture Me,Et mixture Med3,Et mixture
13
8 May 2014 | Sheetal Gangula |TU Braunschweig
SUMMARY
Under optimal conditions for both instruments...
Me and Med3 oligosaccharides are similar in polarities, hence their relative ion intensities
in mass spectra are almost 1:1 with a little scattering for various DP. The scattering of data is lees in MALDI-ToF-MS compared to ESI-IT-MS.
Polarity of Et oligosaccharides is lower than that of Me-derivatives and Med3-derivatives,
these compounds in
ESI-IT-MS: show 3-4 times higher intensities, but this factor is decreasing with DP
MALDI-ToF-MS: the factor is scattering around 1.5-2.5, but it has no clear trend. May be since there is
difference in polarities of the compounds they may have different interaction with matrix so the scattering is higher. This has to be further investigated.
14

8 May 2014 | Sheetal Gangula |TU Braunschweig
Thank you for your kind attention
15