population in india - our greatest resourse
TRANSCRIPT
MODULE - 2India: Natural Environ-
ment, Resources and
Development
295
Population: Our Greatest Resource
SOCIAL SCIENCE
Notes
14
POPULATION: OUR GREATEST
RESOURCE
All of us hear many people saying that the population of India is a great problem.
You also may be feeling the same. You may be aware that the population of India
is more than a billion and it is still growing. It may overtake the population of China
within the next couple of decades, eventually making India the most populous nation
of the world. It is in this way the population is quite often seen as a liability, a major
hindrance to development and quality of life of the people. But is it true? Let’s think
and understand. Has population not been an asset, a resource for the country? Today,
India is considered as a leading nation in the world in terms of human power. One
of the major contributory factors for this global standing has been the young, educated
and productive people of our country. They are contributing to the development of
not only our country, but many of the foreign countries also. In this context, population
is an asset for the economy, the greatest resource of the country rather than a liability.
In this lesson, you shall know how population of our country can be viewed as the
greatest resource.
OBJECTIVES
After studying this lesson you will be able to:
l analyze population not in terms of simple numbers and a problem, but as the
greatest resource of the country;
l explain factors that make population a human resource;
l identify areas of high, moderate and low density of population and locate the
same on the outline map of India;
l analyze the factors affecting the distribution and density of population;
l examine the implications of the population change and population composition,
rural-urban composition, age composition, sex composition and literacy;
SOCIAL SCIENCE
MODULE - 2 Population: Our Greatest Resource
India: Natural Environ-
ment, Resources and
Development
296
Notes
l appreciate needs of adolescents as a critical population group and the growing
potential human resource;
l recognize the need for empowerment of women in India; and
l evaluate population policies adopted by the Government of India, especially in
the context of human resource development.
14.1 POPULATION AS A RESOURCE
Generally, we understand that population means a collection of people. Let us go
through the meanings of population stated in the box below. This term has been
defined differently in different
contexts. You may find that the
meaning of population stated in a
science or biology textbook is
different from how it has been used
in a social science, geography,
economics or sociology textbooks.
You will learn later on that in statistics
this term has yet another meaning.
Will you like to find out what it is?
You may do it by consulting books on
Statistics. However, in the present
lesson we will be using population to
mean the collection of people living in
a given geographic area or territory.
This is how it is used in the census.
The collection of people is seen and
understood primarily in terms of number. But population is also considered as a
resource, a human resource.
What is resource? It is something that can be used and reused. Let us look around
the room. We find things like furniture, books, notebooks, pen, cups and others. We
consider them as our resources and use and reuse them in our daily life.
Now, let us try to trace their origin. These are made out of the resources which we
get from nature. The furniture is made from timber that we obtain from the forest.
Books and notebooks are made from the wood pulp which comes from the forest.
The pen is made up of plastic which is the by-product of petroleum. The cup is made
of clay found in the soil. These and many more things which are part of our daily
life are extracted, processed or manufactured from the natural resources. It is the
people who with their physical and mental efforts convert the natural resources into
various goods of utility.
What does population mean?
l Total number of people inhabiting a
specified area or territory (e.g.
population of a village, city, state,
country, world).
l Total number of people of a particular
group, race, class or category (e.g.
population of Scheduled Castes,
Scheduled Tribes, or religious groups
like Hindus, Muslims, Christians,
Sikhs)
l In biology, collection of inter-breeding
organisms of a particular species (e.g.
population of tigers, deer, etc.)
MODULE - 2India: Natural Environ-
ment, Resources and
Development
297
Population: Our Greatest Resource
SOCIAL SCIENCE
Notes
The Government of India created a Ministry of Human Resource Development
in 1985, in place of its earlier Ministry of Education and Culture. Some of the
States also have done so. This suggests that the idea of people being a human
resource has gained acceptance.
If resources are things that are used and reused, how can population be considered
a resource? We all know that the grains which are cultivated in the fields, the minerals
that are mined and the goods which are manufactured in factories are all produced
by people. People of the country produce and develop various facilities and services
to make their lives comfortable. The facilities, whether these are means of transport
and communication, schools, colleges, hospitals, electricity producing units,
infrastructure for irrigation and others, play a significant role in the development of
a country.
For producing and developing all such facilities and converting them into useful
resources, human beings play the role of the best resource. Without human beings,
other resources cannot be developed and utilized properly. Therefore, the number
as well as the quality of people, collectively, is the real and ultimate resource of a
country.
In view of the above, the sheer number of people, which is determined by census
conducted at periodic intervals, may be a liability, but the qualitative population
becomes the human capital of a country. For converting the number into capital, the
country has to invest a lot in the form of improving the health and nutritional status
of the people, their education and specialized training and their overall quality of life.
The investments for improving the quality of the people made by the state as well
as the society matter a lot. It is essential that every individual develops to the fullest
capability and is engaged in the development process of the country. It is therefore
important to understand that people as human resource are both an object of
development and also a participant in development. As we discussed earlier the
number of people may not be called resource, but there are certain factors which
convert these numbers into a useful resource.
Human capital: Over the years, the terms used to describe staff and employees
in businesses have changed. We have moved from ‘personnel’ to ‘human
resources’ to ‘human capital’. Human capital represents attributes of a person
that are productive in the economic context. It refers to the stock of productive
skills and technical knowledge embodied in labour.
SOCIAL SCIENCE
MODULE - 2 Population: Our Greatest Resource
India: Natural Environ-
ment, Resources and
Development
298
Notes
Census: The procedure of systematically acquiring and recording information
about the members of a given population. The term is used mostly in connection
with ‘national population and door to door censuses’ to be taken every 10 years.
The Government of India, with the assistance of States, has been conducting
census to collect data about various demographic and socio-economic aspects
of our population.
Factors making population a Human Resource
What are the factors that influence the role of population as the human resource?
You may infer from the above discussion that the education, health and nutritional
status of the people, and their specialized training determine the quality of population
as a human resource. But besides these, there are key socio-demographic factors
that have significant impact on the role of population as a resource. These are: (i)
Distribution of Population; (ii) Growth of Population; and (iii) Population Composition.
We shall try to understand these three factors. Let us begin with Distribution of
Population.
INTEXT QUESTIONS 14.1
1. What is meant by resource?
2. Enumerate qualities that are essential for making human beings a resource.
14.2 DISTRIBUTION OF POPULATION
You may be knowing that resources, whether natural or any other, are not
evenlydistributed. For example, natural resources like forests or iron ore or coal are
not found evenly in the world and also within our own country. The same is the case
with human resources. They are not evenly spread everywhere in the world and their
numbers keep on changing. The spread of population over an area, may be in a state
or the entire country, is known as the distribution of population.
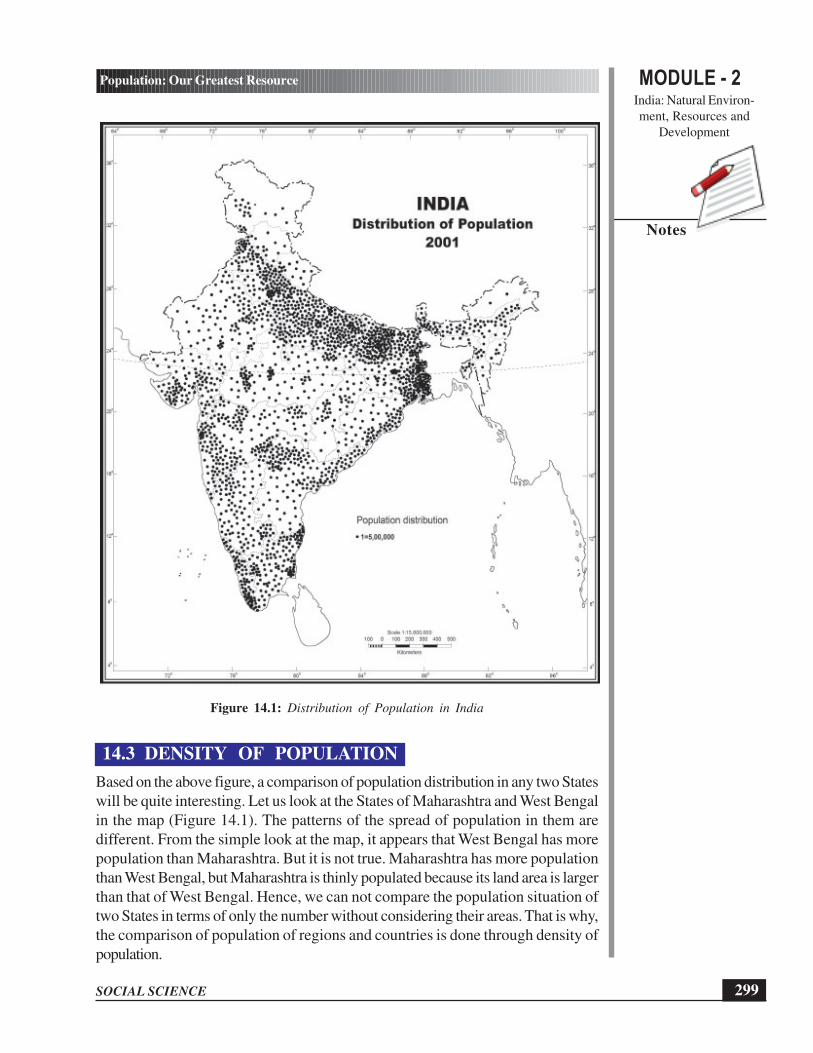
You will find it very interesting when you look at the following map of India (Figure
14.1). It shows how the population of India is spread across various States and Union
Territories (UTs). This has been shown through dots. Each dot represents five lakh
persons. As you see, in some States, the number of dots is less, even if the area
is substantially large. It means that the population in these States is either widely
spread or moderately spread. But in some other States, the dots are very close to
one another, so close that those parts in the map look almost painted. In them, the
spread of population is very dense. Let us prepare a list of sparsely populated,
moderately populated and densely populated States and Union Territories (UTs)
of India.
MODULE - 2India: Natural Environ-
ment, Resources and
Development
299
Population: Our Greatest Resource
SOCIAL SCIENCE
Notes
Figure 14.1: Distribution of Population in India
14.3 DENSITY OF POPULATION
Based on the above figure, a comparison of population distribution in any two States
will be quite interesting. Let us look at the States of Maharashtra and West Bengal
in the map (Figure 14.1). The patterns of the spread of population in them are
different. From the simple look at the map, it appears that West Bengal has more
population than Maharashtra. But it is not true. Maharashtra has more population
than West Bengal, but Maharashtra is thinly populated because its land area is larger
than that of West Bengal. Hence, we can not compare the population situation of
two States in terms of only the number without considering their areas. That is why,
the comparison of population of regions and countries is done through density of
population.
SOCIAL SCIENCE
MODULE - 2 Population: Our Greatest Resource
India: Natural Environ-
ment, Resources and
Development
300
Notes
Density of Population: The density of population is the number of persons living
per unit of an area. It is usually expressed as number of people per square
kilometre (sq km). The formula for its computation is:
Density of population = Number of people in a defined area unit
Total area in square km of that particular area
For determining the density, the number of people living in a specific territory is
divided by the total area of that territory. This provides an average number of persons
living per sq km in the territory. For example, let us assume that the population of
a district is 250,000 and its area is 1000 square km. The density of population of
this district can be calculated as follows:
Density of Population =
250000 persons
1000 sq km area
= 250 persons per sq km.
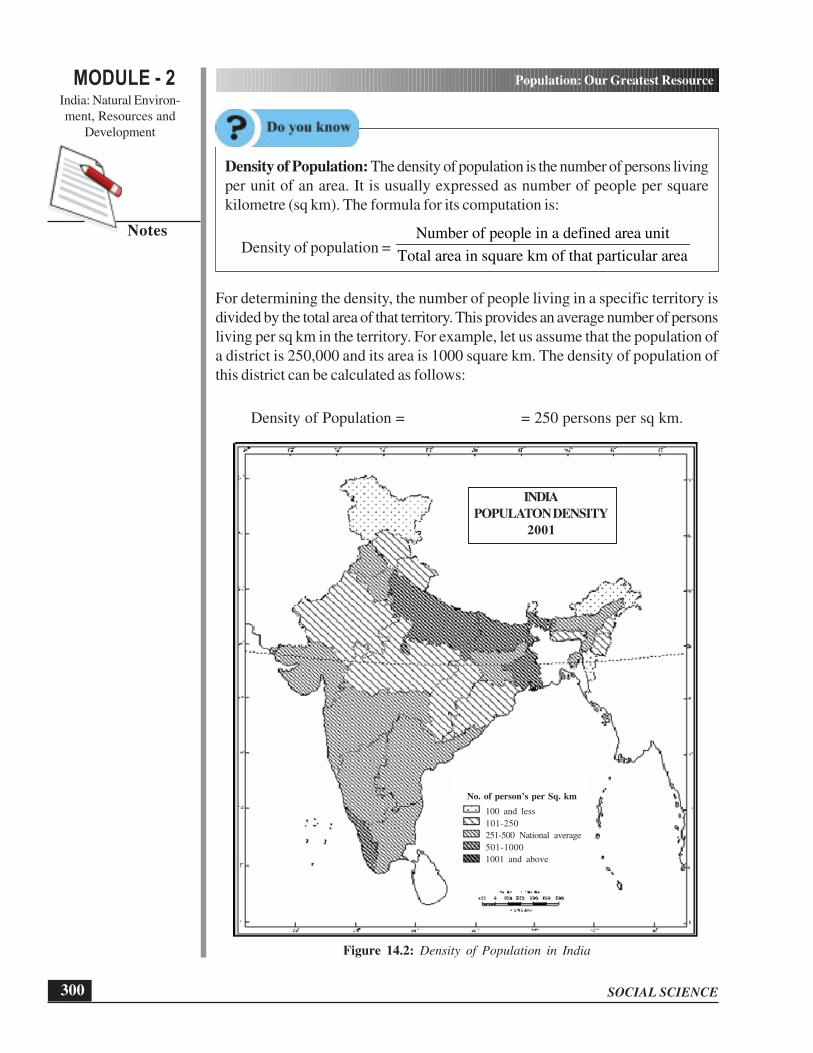
Figure 14.2: Density of Population in India
INDIA
POPULATON DENSITY
2001
No. of person’s per Sq. km
100 and less
101-250
251-500 National average
501-1000
1001 and above
MODULE - 2India: Natural Environ-
ment, Resources and
Development
301
Population: Our Greatest Resource
SOCIAL SCIENCE
Notes
The map (Fig. 14.2) shows that the density of population in India is uneven. It varies
from one state to another.
ACTIVITY 14.1
Look at the Figure 14.2. Identify and name the States having high
(more than 500 persons per sq km), moderate (100-500 persons
per sq km) and low (less than 100 persons per sq km) density.
States having high density
States having moderate density
States having low density
Can you state the reasons for such a variation in density among
States?
Hints: Unfavorable/harsh climatic conditions, rugged terrain and
poor soil fertility are mainly responsible for the low density. Rich
soil, abundance of rainfall, developed irrigational facilities, moderate
climate and urbanization support high density of population. The
areas of average fertility, modest rainfall, less developed irrigational
facilities and, to some extent, stony/sandy surface sustain moderate
density of population.
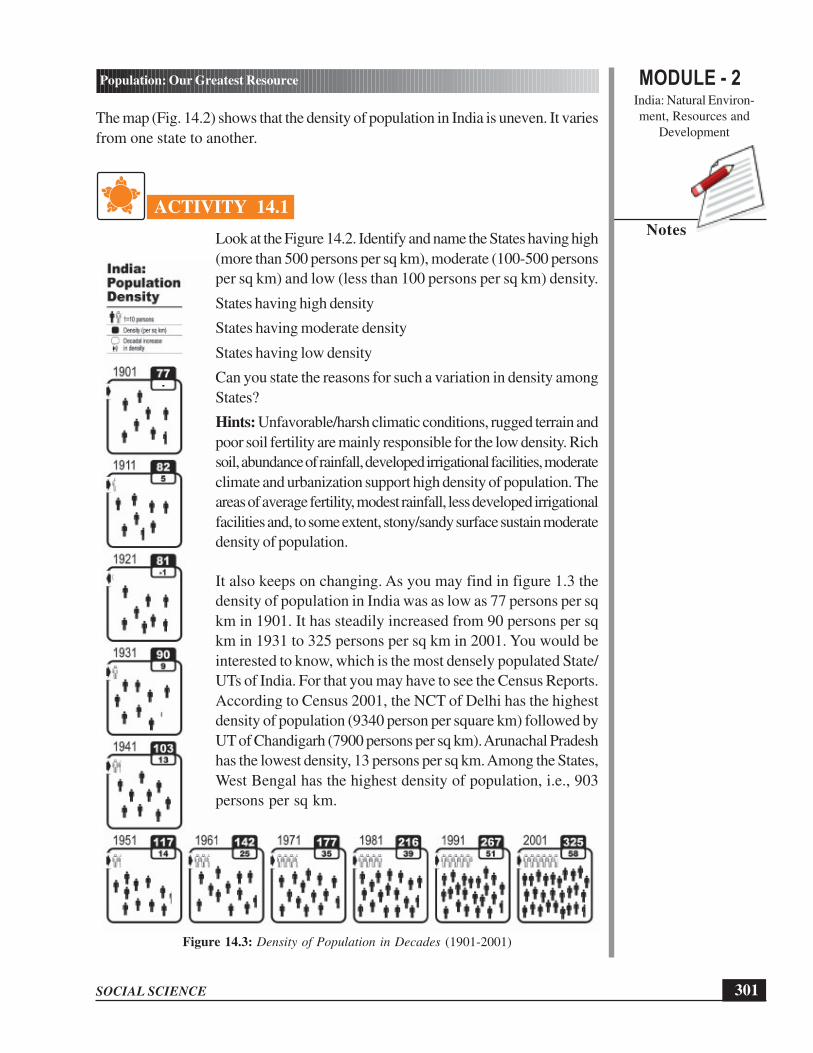
It also keeps on changing. As you may find in figure 1.3 the
density of population in India was as low as 77 persons per sq
km in 1901. It has steadily increased from 90 persons per sq
km in 1931 to 325 persons per sq km in 2001. You would be
interested to know, which is the most densely populated State/
UTs of India. For that you may have to see the Census Reports.
According to Census 2001, the NCT of Delhi has the highest
density of population (9340 person per square km) followed by
UT of Chandigarh (7900 persons per sq km). Arunachal Pradesh
has the lowest density, 13 persons per sq km. Among the States,
West Bengal has the highest density of population, i.e., 903
persons per sq km.
Figure 14.3: Density of Population in Decades (1901-2001)
SOCIAL SCIENCE
MODULE - 2 Population: Our Greatest Resource
India: Natural Environ-
ment, Resources and
Development
302
Notes
Factors affecting distribution and density of population
Why is the distribution of population uneven? It is human nature that people like to
live in the areas where resources are easily available. These resources may be fresh
water, fertile soil, food and shelter, opportunities of work and others. The availability
of these resources is influenced by geographical features which cause uneven
distribution. And therefore, density and distribution of population are also uneven.
We can divide the factors which affect distribution and density of population into two
broad categories: Physical and Socio-economic.
A. Physical Factors
Three important physical factors influence the distribution and density of population,
namely relief, climate and soil.
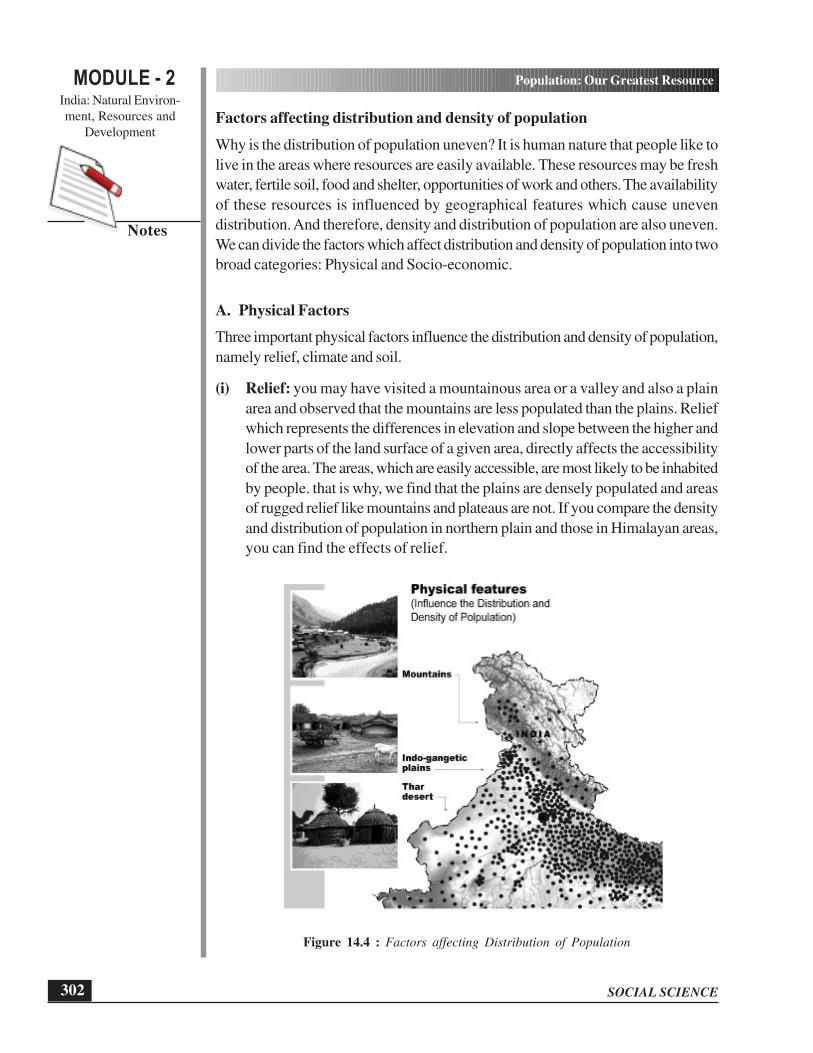
(i) Relief: you may have visited a mountainous area or a valley and also a plain
area and observed that the mountains are less populated than the plains. Relief
which represents the differences in elevation and slope between the higher and
lower parts of the land surface of a given area, directly affects the accessibility
of the area. The areas, which are easily accessible, are most likely to be inhabited
by people. that is why, we find that the plains are densely populated and areas
of rugged relief like mountains and plateaus are not. If you compare the density
and distribution of population in northern plain and those in Himalayan areas,
you can find the effects of relief.
Figure 14.4 : Factors affecting Distribution of Population
MODULE - 2India: Natural Environ-
ment, Resources and
Development
303
Population: Our Greatest Resource
SOCIAL SCIENCE
Notes
Relief : Elevations of land; the variations in height of a land surface and
its being shaped into hills and valleys.
(ii) Climate: Climatic condition is one of the most important factors which affects
density and distribution of population. Favourable climate provides convenient
living conditions for human beings. The higher density of population is found
in the areas where the climate is favorable. But areas with harsh climate, i.e.,
areas that are too hot, too cold, too dry or too wet have lower density of
population. In India, the area having dry climate such as Rajasthan and the areas
with extreme cold climate such as the Valley in Jammu and Kashmir, or Himachal
Pradesh and Uttarakhand have low density of population.
(iii) Soil: Human beings depend upon the quality of soil for agriculture. Areas of
fertile soil can, therefore, support larger population. That is why, the regions
of fertile soil such as the alluvial plains of North India and coastal plains have
higher density of population. On the other hand, the areas with less fertile soils
like parts of Madhya Pradesh, Rajasthan and Chhattisgarh have lower density
of population.
B. Socio-economic Factors
The density and distribution of population also depend on the following socio-
economic conditions of the area:
(i) Industrialization and Urbanization: As you always find, large number of
people reside in the area having industries. They also prefer to live in the urban
areas, towns and cities. The areas which are rich in mineral resources also attract
large population. The mining areas in Jharkhand are very densely populated.
This is so because these areas support several economic activities and offer lots
of employment opportunities. Moreover, the education and health facilities are
better in these areas. We are aware that all large cities of India like Delhi,
Mumbai, Bangalore, Hyderabad, Chennai, Kolkata and many more have high
density of population.
(ii) Transport and Communication: Some parts of the country have better
transport and communication facilities and other public utility services than the
other parts. Areas of northern plain are very well connected, whereas north
eastern areas have comparatively poor connectivity. All such areas where the
public facilities are well developed have a comparatively higher density of
population. Sometimes we find that the places of cultural and religious
significance are also densely populated.
All the above mentioned factors operate in combination. We can take the example
of the high density population in the Ganga plain. It is caused by a combination of
factors: level land, fertile soils, a favorable climate, industrialisation and urbanisation,
SOCIAL SCIENCE
MODULE - 2 Population: Our Greatest Resource
India: Natural Environ-
ment, Resources and
Development
304
Notes
and comparatively well developed means of transport and communication. On the
other hand, factors like rugged hilly terrain, unfavorable climate, poor means of
transport and communication together cause low density of population in areas like
those in Arunachal Pradesh.
ACTIVITY 14.2
Study the maps of physiographic divisions of India, the great northern mountains and
the peninsular plateau of India in lesson 11. The smiling face of our Mother Land.
Read these maps along with the data given in the figure numbers 14.1, 14.2 and
14.4 showing the distribution and density of population, respectively.
Co-relate and analyze the maps and identify the areas where physical conditions are
favourable for people.
INTEXT QUESTIONS 14.2
1. Which one of the following States has the highest density of population according
to 2001?
A. West Bengal B. Kerala
C. Tamil Nadu D. Uttar Pradesh
2. The population of a district is 3, 00,000 and its area is1000 square km. What
would be the density of population?
A. 150 persons/sq. km B. 200 persons/sq. km
C. 250 persons/sq. km D. 300 persons/sq. km
3. Mention four important factors that are responsible for high density of population
in big cities like Delhi, Mumbai, Kolkata and Chennai.
4. Why is density of population of Uttarakhand low? Give two reasons.
14.4 GROWTH OF POPULATION
The quality of population as a human resource in any country is greatly influenced
by the pattern of population change. The change can be in terms of population growth
or population negative growth. Although the population of the world is still growing,
there are countries where it is declining. Both the situations of population change have
their impact on the quality of human resources. If population grows at a faster rate,
it results into an imbalance between population growth and resources of a country.
This situation has an adverse impact on the quality of human resources.
MODULE - 2India: Natural Environ-
ment, Resources and
Development
305
Population: Our Greatest Resource
SOCIAL SCIENCE
Notes
The Indian population has been growing since long. From a population of 238 millions
in the year 1901, it increased to 1028 millions in 2001and is still growing. This
increase in population is more than four times within a span of a century. On the
other hand there are countries in Western Europe where population is declining. Why
it is so? Let us identify those factors which are responsible for population growth.
Factors of Growth of Population
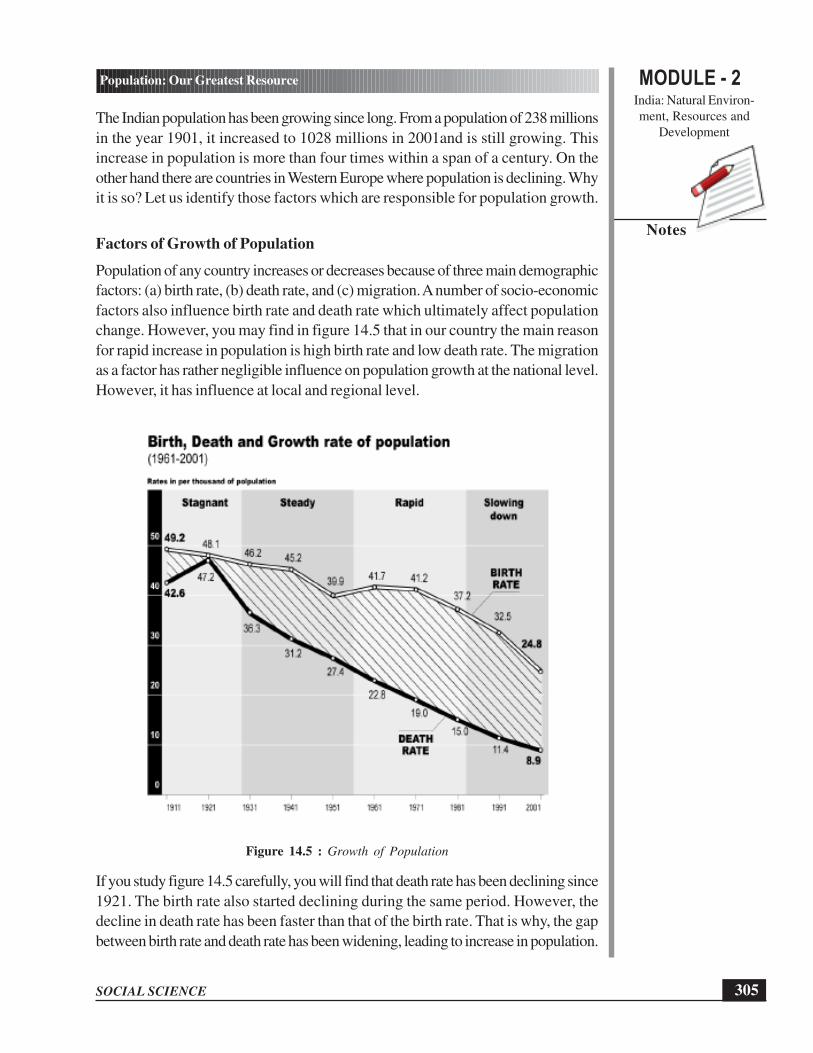
Population of any country increases or decreases because of three main demographic
factors: (a) birth rate, (b) death rate, and (c) migration. A number of socio-economic
factors also influence birth rate and death rate which ultimately affect population
change. However, you may find in figure 14.5 that in our country the main reason
for rapid increase in population is high birth rate and low death rate. The migration
as a factor has rather negligible influence on population growth at the national level.
However, it has influence at local and regional level.
Figure 14.5 : Growth of Population
If you study figure 14.5 carefully, you will find that death rate has been declining since
1921. The birth rate also started declining during the same period. However, the
decline in death rate has been faster than that of the birth rate. That is why, the gap
between birth rate and death rate has been widening, leading to increase in population.
SOCIAL SCIENCE
MODULE - 2 Population: Our Greatest Resource
India: Natural Environ-
ment, Resources and
Development
306
Notes
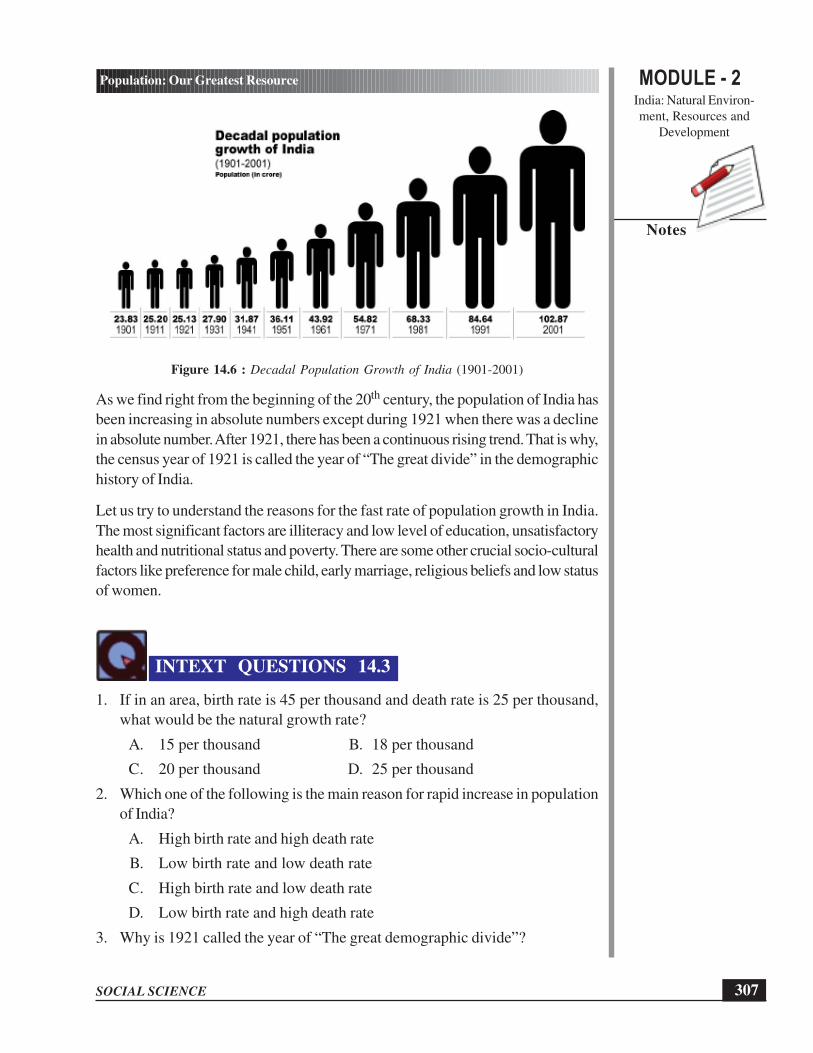
The population growth is also visible when you look at the decadal growth given
in figure 14.6. The decadal growth rate have declined marginally between 1981 and
1991 and again between 1991-2001. It is a happy sign. But you may be surprised
to know that in spite of decreasing growth rates, the absolute population has been
increasing continuously over the successive years. Based on the outcome of birth
rate and death rate, the entire period since 1901 to 2001 has been divided into four
groups – stagnant, steady, rapid and slowing down stages of population growth.
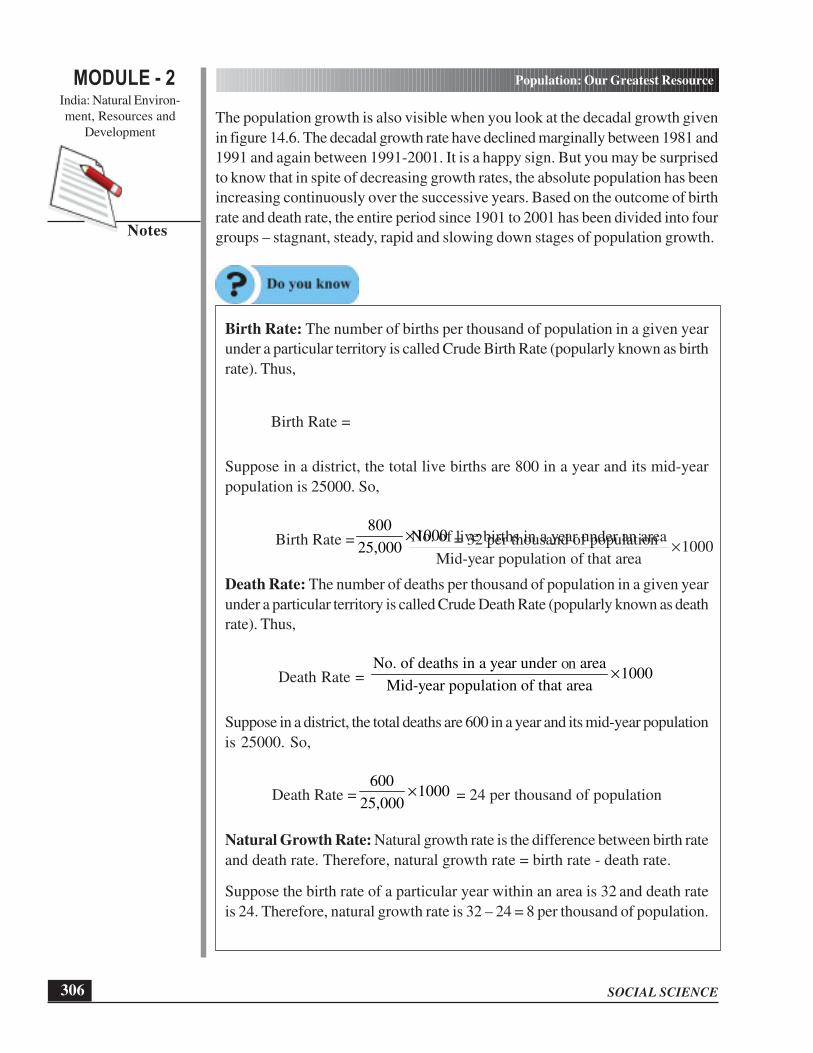
Birth Rate: The number of births per thousand of population in a given year
under a particular territory is called Crude Birth Rate (popularly known as birth
rate). Thus,
Birth Rate =
No. of live births in a year under an area1000
Mid-year population of that area×
Suppose in a district, the total live births are 800 in a year and its mid-year
population is 25000. So,
Birth Rate =800
100025,000
× = 32 per thousand of population
Death Rate: The number of deaths per thousand of population in a given year
under a particular territory is called Crude Death Rate (popularly known as death
rate). Thus,
Death Rate = No. of deaths in a year under ab area
1000Mid-year population of that area
×
Suppose in a district, the total deaths are 600 in a year and its mid-year population
is 25000. So,
Death Rate =600
100025,000
× = 24 per thousand of population
Natural Growth Rate: Natural growth rate is the difference between birth rate
and death rate. Therefore, natural growth rate = birth rate - death rate.
Suppose the birth rate of a particular year within an area is 32 and death rate
is 24. Therefore, natural growth rate is 32 – 24 = 8 per thousand of population.
on
MODULE - 2India: Natural Environ-
ment, Resources and
Development
307
Population: Our Greatest Resource
SOCIAL SCIENCE
Notes
Figure 14.6 : Decadal Population Growth of India (1901-2001)
As we find right from the beginning of the 20th century, the population of India has
been increasing in absolute numbers except during 1921 when there was a decline
in absolute number. After 1921, there has been a continuous rising trend. That is why,
the census year of 1921 is called the year of “The great divide” in the demographic
history of India.
Let us try to understand the reasons for the fast rate of population growth in India.
The most significant factors are illiteracy and low level of education, unsatisfactory
health and nutritional status and poverty. There are some other crucial socio-cultural
factors like preference for male child, early marriage, religious beliefs and low status
of women.
INTEXT QUESTIONS 14.3
1. If in an area, birth rate is 45 per thousand and death rate is 25 per thousand,
what would be the natural growth rate?
A. 15 per thousand B. 18 per thousand
C. 20 per thousand D. 25 per thousand
2. Which one of the following is the main reason for rapid increase in population
of India?
A. High birth rate and high death rate
B. Low birth rate and low death rate
C. High birth rate and low death rate
D. Low birth rate and high death rate
3. Why is 1921 called the year of “The great demographic divide”?
SOCIAL SCIENCE
MODULE - 2 Population: Our Greatest Resource
India: Natural Environ-
ment, Resources and
Development
308
Notes
14.5 POPULATION COMPOSITION
We have studied the distribution, density and growth of population so far. You would
have been able to understand that the net effect of the difference between birth rate
and death rate determines the pace and trend of population change. This net effect
also demonstrates the composition of population which is an important factor
influencing not only the pace of population growth but also the quality of population
as a human resource. What is population composition? Population composition is
the description of population defined by characteristics such as age, sex, rural-urban
or literacy status. We shall, therefore, try to understand the following aspects of the
population composition in India:
(i) Age composition,
(ii) Sex composition,
(iii) Rural-urban composition, and
(iv) Literacy
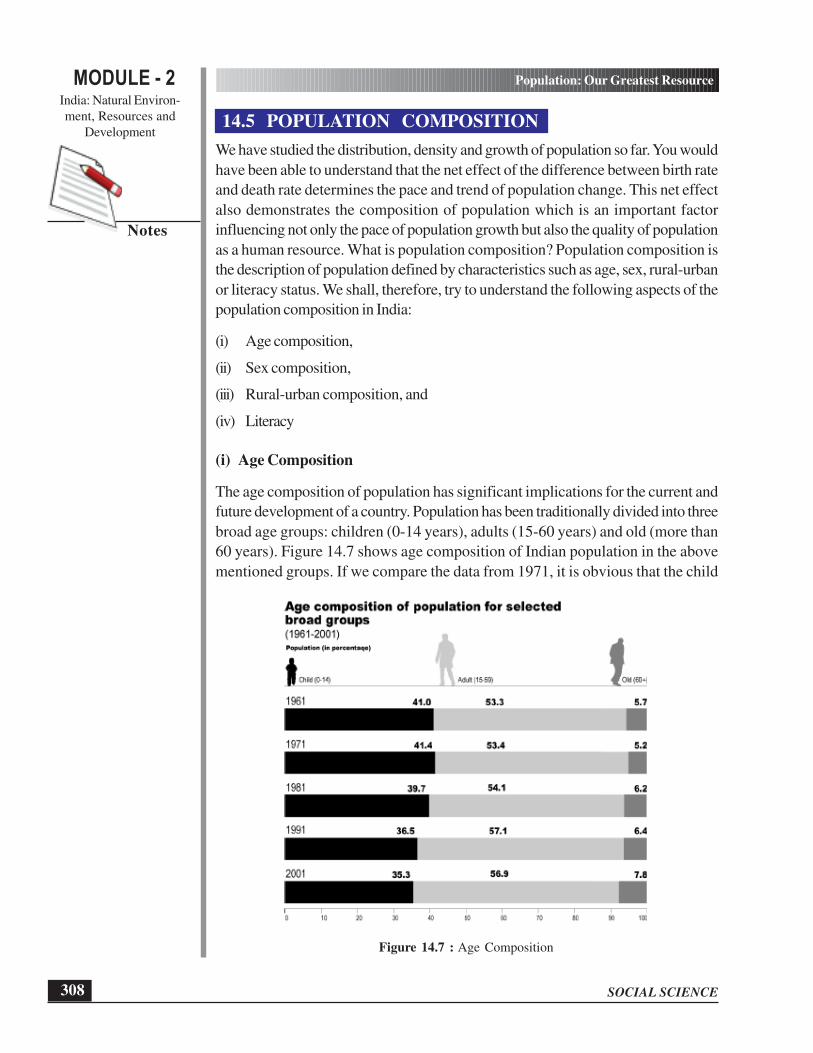
(i) Age Composition
The age composition of population has significant implications for the current and
future development of a country. Population has been traditionally divided into three
broad age groups: children (0-14 years), adults (15-60 years) and old (more than
60 years). Figure 14.7 shows age composition of Indian population in the above
mentioned groups. If we compare the data from 1971, it is obvious that the child
Figure 14.7 : Age Composition
MODULE - 2India: Natural Environ-
ment, Resources and
Development
309
Population: Our Greatest Resource
SOCIAL SCIENCE
Notes
population is declining and the population of adults has been increasing. However,
population of the old is also increasing. In this way, the share of dependent population
is increasing. Population of the old and children put together constitutes the dependent
population. When the number of dependent population increases, the dependency
ratio goes up. As a result, the country has to invest more on the growth and
development of children and welfare of the old people; otherwise the same resources
can be used for other productive purposes.
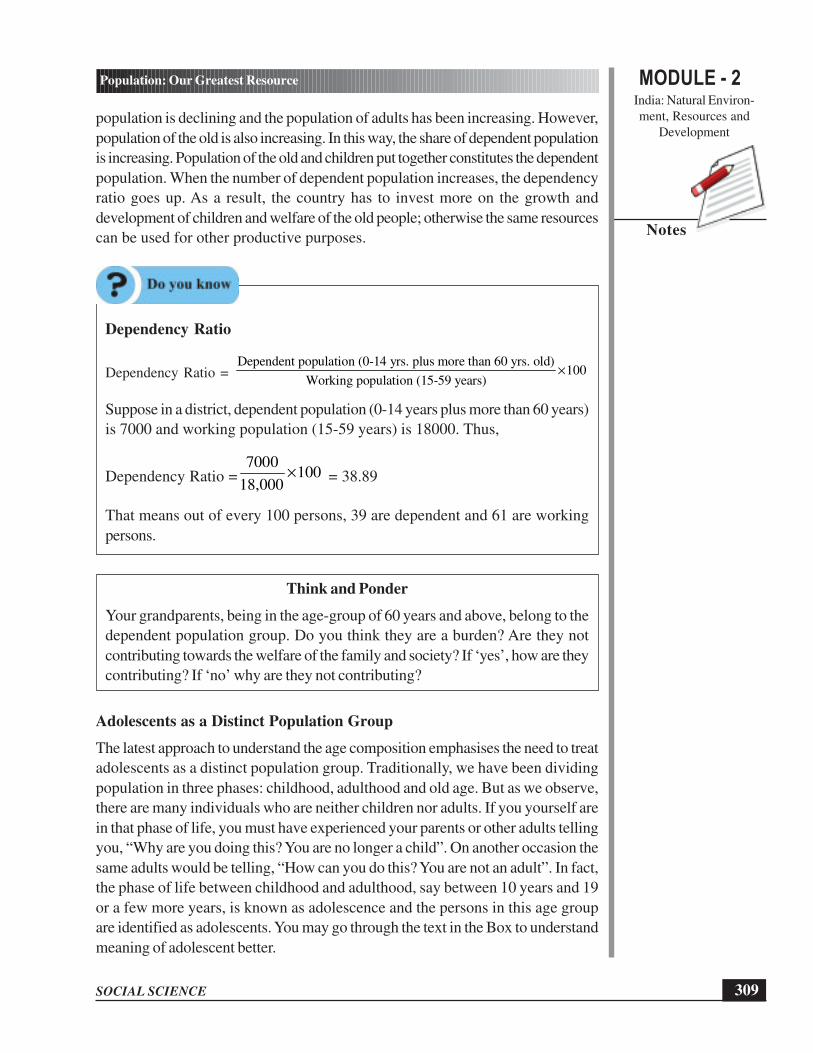
Dependency Ratio
Dependency Ratio = Dependent population (0-14 yrs. plus more than 60 yrs. old)
100Working population (15-59 years)
×
Suppose in a district, dependent population (0-14 years plus more than 60 years)
is 7000 and working population (15-59 years) is 18000. Thus,
Dependency Ratio =7000
10018,000
× = 38.89
That means out of every 100 persons, 39 are dependent and 61 are working
persons.
Think and Ponder
Your grandparents, being in the age-group of 60 years and above, belong to the
dependent population group. Do you think they are a burden? Are they not
contributing towards the welfare of the family and society? If ‘yes’, how are they
contributing? If ‘no’ why are they not contributing?
Adolescents as a Distinct Population Group
The latest approach to understand the age composition emphasises the need to treat
adolescents as a distinct population group. Traditionally, we have been dividing
population in three phases: childhood, adulthood and old age. But as we observe,
there are many individuals who are neither children nor adults. If you yourself are
in that phase of life, you must have experienced your parents or other adults telling
you, “Why are you doing this? You are no longer a child”. On another occasion the
same adults would be telling, “How can you do this? You are not an adult”. In fact,
the phase of life between childhood and adulthood, say between 10 years and 19
or a few more years, is known as adolescence and the persons in this age group
are identified as adolescents. You may go through the text in the Box to understand
meaning of adolescent better.
SOCIAL SCIENCE
MODULE - 2 Population: Our Greatest Resource
India: Natural Environ-
ment, Resources and
Development
310
Notes
What does Adolescent Mean?
United Nations definitions are based on number of years as follows:
l Adolescents: 10-19 years olds
l Youth: 15-24 years olds
l Young People: 10-24 years olds
But adolescents as a population group may not be seen only in association with
the precise number of years, as its periodicity varies from person to person.
Adolescents belong to “a developmental period which extends from the end of
childhood to the beginning of adulthood”.
Adolescence is defined as the period of physical, psychological and social
maturation from childhood to adulthood, the period extending from puberty to
the attainment of full reproductive maturity.
As shown in Table 1.1, adolescents as a distinct population group constitute almost
22.0 per cent of total population of India. This was their share in 2001. Their number
is still growing and currently (in 2009) their percentage share has increased. The
National Population Policy 2000 identifies them as an “under-served population
group”, because their needs have not been specifically addressed so far. The Policy
describes various strategies to address different needs of adolescents. These are:
(i) provide accurate information about physical, physiological, psychological and
social changes and developments that take place during adolescence; (ii) develop
the needed life skills to empower them to avoid risky situations and to attain sound
physical, mental and social health; (iii) provide food supplements and nutritional
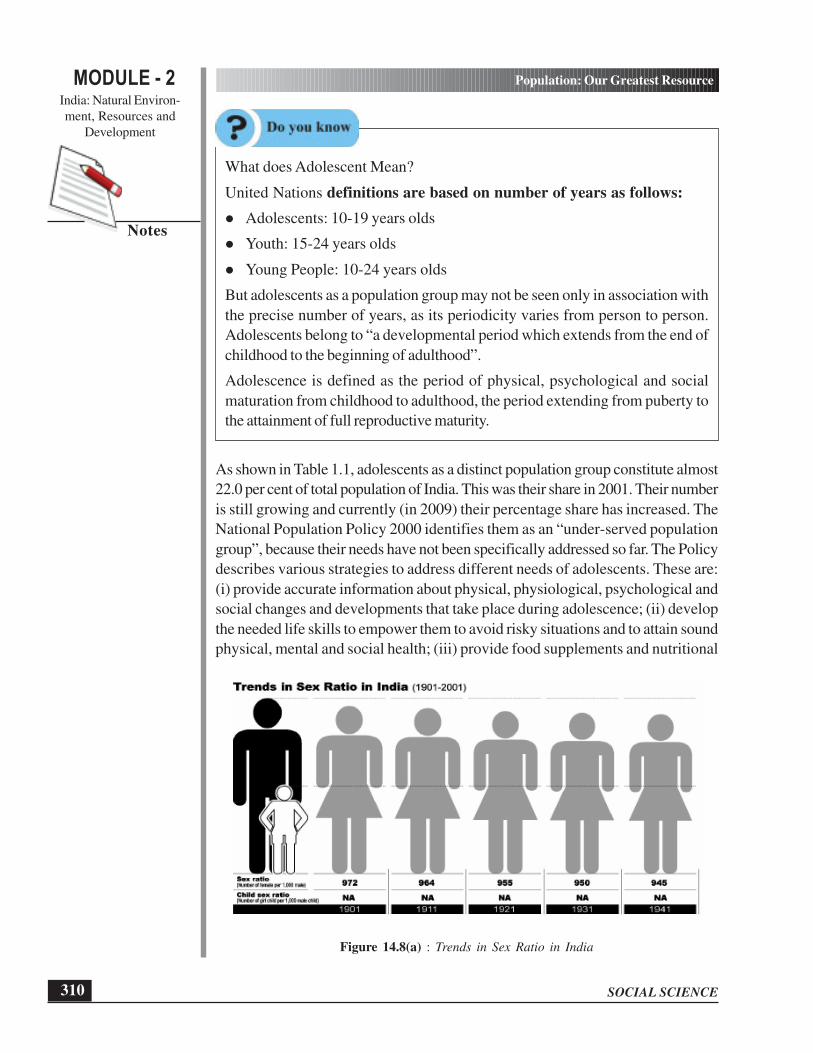
Figure 14.8(a) : Trends in Sex Ratio in India
MODULE - 2India: Natural Environ-
ment, Resources and
Development
311
Population: Our Greatest Resource
SOCIAL SCIENCE
Notes
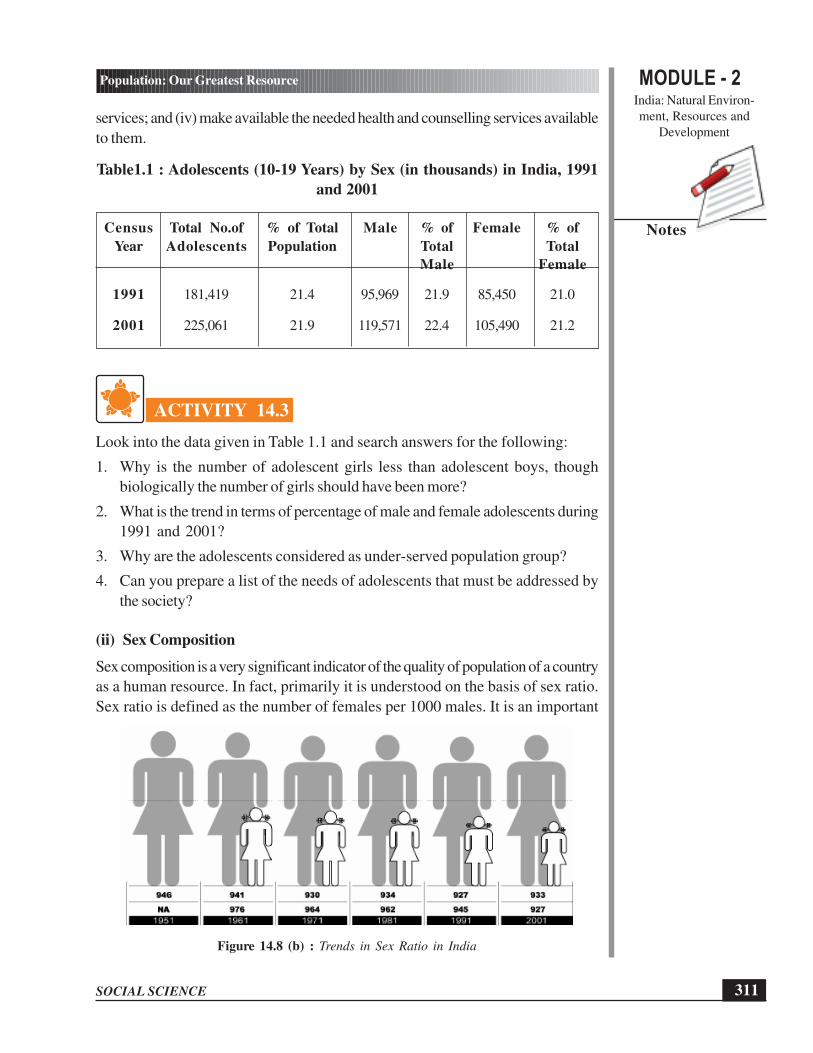
services; and (iv) make available the needed health and counselling services available
to them.
Table1.1 : Adolescents (10-19 Years) by Sex (in thousands) in India, 1991
and 2001
Census Total No.of % of Total Male % of Female % of
Year Adolescents Population Total Total
Male Female
1991 181,419 21.4 95,969 21.9 85,450 21.0
2001 225,061 21.9 119,571 22.4 105,490 21.2
ACTIVITY 14.3
Look into the data given in Table 1.1 and search answers for the following:
1. Why is the number of adolescent girls less than adolescent boys, though
biologically the number of girls should have been more?
2. What is the trend in terms of percentage of male and female adolescents during
1991 and 2001?
3. Why are the adolescents considered as under-served population group?
4. Can you prepare a list of the needs of adolescents that must be addressed by
the society?
(ii) Sex Composition
Sex composition is a very significant indicator of the quality of population of a country
as a human resource. In fact, primarily it is understood on the basis of sex ratio.
Sex ratio is defined as the number of females per 1000 males. It is an important
Figure 14.8 (b) : Trends in Sex Ratio in India
SOCIAL SCIENCE
MODULE - 2 Population: Our Greatest Resource
India: Natural Environ-
ment, Resources and
Development
312
Notes
social indicator to measure the extent of prevailing equity between males and females
at a given point of time. Sex ratio should be favourable. But in our country, sex ratio
has always remained unfavorable to females, and the matter of concern is that it has
been declining. In the year 1901, there were 972 females per 1000 males. In 2001,
it has come down to 933 only. This trend is shown in figure 14.8 (a) and (b).
Sex Ratio is calculated as follows:
Sex Ratio = Total number of females in a particular area
1000Total numbers of the male in same area
×
Suppose in a district, the total number of females is 12000 and total number of
males is 13000. Thus,
Sex Ratio =12,000
100013,000
× = 923 females per thousand male
Let us think why sex ratio is unfavorable in our country? It is primarily because of
the prevailing discrimination against the females in our society. The favourable sex
ratio is available only in one State and one Union Territory. It is 1058 in the State
of Kerala and 1001in the Union Territory of Pondichery, now known as Puducherry.
Child Sex Ratio
The trend of decline in child sex ratio in the country is a matter of great concern.
The sex ratio in 0-6 year population (child population) is continuously decreasing.
Whereas the 1991 and 2001 Census Reports showed some improvement in overall
sex ratio, the sex ratio of 0-6 year population has decreased sharply. Out of 28 States
and 7 Union Territories, only in four States, namely Kerala, Mizoram, Sikkim, Tripura
and Union Territory of Lakshadweep the child sex ratio is in tune with the overall
sex ratio. The worst affected States are Haryana, Himachal Pradesh, Gujarat, Punjab,
and Uttarakhand, and the Union Territory of Chandigarh and National Capital Region
of Delhi. This decline in child sex ratio suggests the prevalence of the practices of
female foeticide and female infanticide in these States. These practices are against
the norms of a civil society.
(iii) Rural-urban Composition
India has been a land of farmers and a country of villages. At the beginning of the
twentieth century nine out of ten persons used to live in villages. More than three-
MODULE - 2India: Natural Environ-
ment, Resources and
Development
313
Population: Our Greatest Resource
SOCIAL SCIENCE
Notes
fourths of our population still lives in rural areas. The urban area in India is defined
as one, in which three-fourth of the population depends directly or indirectly on non-
agricultural pursuits, with a minimum of 5000 population and the density being not
less than 400 persons per sq. km and should have muciplaity town area or Municipal
Corporation.
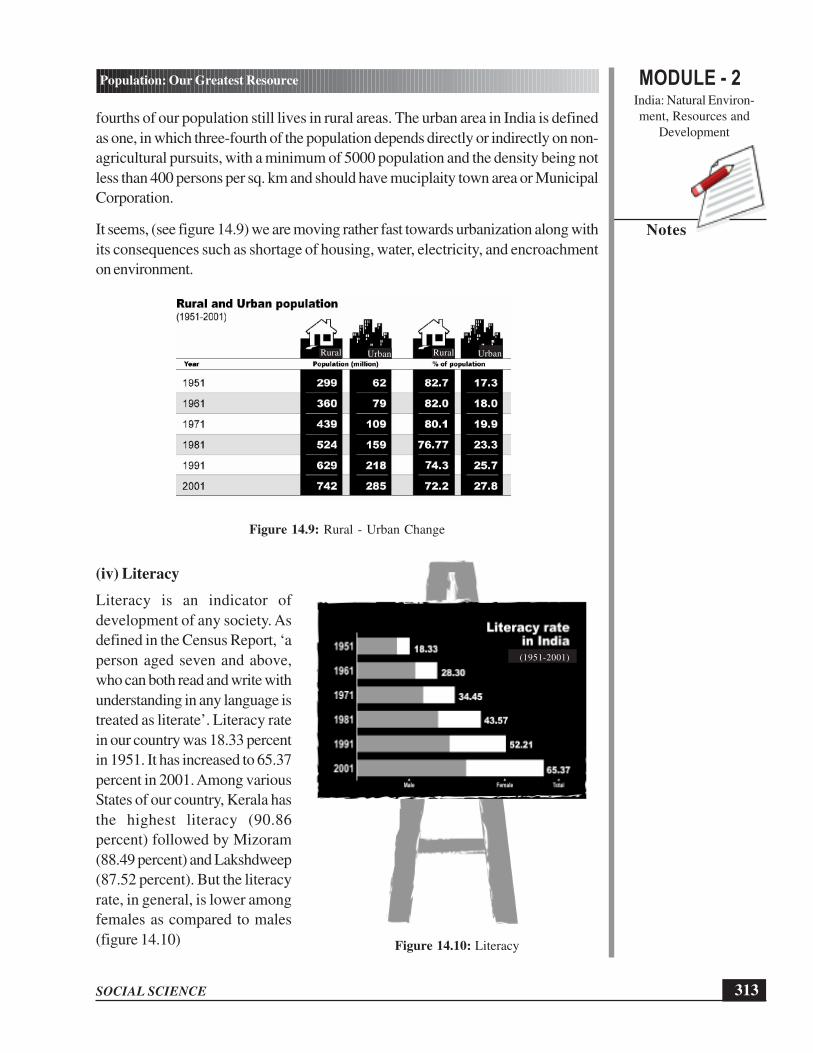
It seems, (see figure 14.9) we are moving rather fast towards urbanization along with
its consequences such as shortage of housing, water, electricity, and encroachment
on environment.
Figure 14.9: Rural - Urban Change
(iv) Literacy
Literacy is an indicator of
development of any society. As
defined in the Census Report, ‘a
person aged seven and above,
who can both read and write with
understanding in any language is
treated as literate’. Literacy rate
in our country was 18.33 percent
in 1951. It has increased to 65.37
percent in 2001. Among various
States of our country, Kerala has
the highest literacy (90.86
percent) followed by Mizoram
(88.49 percent) and Lakshdweep
(87.52 percent). But the literacy
rate, in general, is lower among
females as compared to males
(figure 14.10) Figure 14.10: Literacy
Rural RuralUrban Urban
(1951-2001)
SOCIAL SCIENCE
MODULE - 2 Population: Our Greatest Resource
India: Natural Environ-
ment, Resources and
Development
314
Notes
ACTIVITY 14.4
Collect the following information from your vicinity for about 10-15 households:
1. Name of the person interviewed .......................
2. Age ....................... Years .......................
3. Academic Qualification .......................
4. Number of persons earning in the family .......................
5. Total no. of members M ....................... F .......................
6. Members of family in the age groups
(a) Up to 14 years .......................
(b) 15 years to 60 years .......................
(c) More than 60 years .......................
7. Based on the data collected above, compute and analyze :
(a) Sex-ratio
(b) Dependency ratio .......................
(i) Below 14 years ....................... and its percentage .......................
(ii) More than 60 years ....................... and its percentage .......................
We have been thus able to understand that the population of any country cannot
become its greatest resource only by virtue of its number. The country has to invest
to improve the quality of demographic characteristics and convert the number into
a resource. For converting the number into human resource, India like many other
countries of the world has been adopting and implementing policies and programmes.
In the next section, therefore, we shall try to understand policies of Government of
India in respect of population and empowerment of women.
INTEXT QUESTIONS 14.4
1. According to 2001 census, the sex ratio of India is:
A. 920 B. 927
C. 933 D. 943
2. The percentage of urban population, according to 2001 census is:
A. 27.8 B. 26.7
C. 25.7 D. 24.0
3. What would be the result if the dependency ratio is more?
4. State any two reasons responsible for unfavourable sex ratio in India.
MODULE - 2India: Natural Environ-
ment, Resources and
Development
315
Population: Our Greatest Resource
SOCIAL SCIENCE
Notes
14.6 POPULATION POLICIES IN INDIA
Do you know that discussions on population growth and the need to adopt a
population policy had begun in India even before Independence? A Sub-Committee
on population was set up by the National Planning Committee appointed in 1938
by the Interim Government. This Committee, in its resolution in 1940 said, “in the
interest of social economy, family happiness and national planning, family planning
and a limitation of children are essential”.
In 1952, India was the first country in the world to launch a national population
programme emphasizing family planning. The aim of the programme was to reduce
birth rates “to stabilize the population at a level consistent with the requirement of
national economy”. Since then India has been reformulating its population policy from
time to time, the details of which you can get from relevant books or when you study
in higher classes. At present we shall try to understand the latest population policy
which was adopted by Government of India in 2000.
National Population Policy (NPP) 2000
The National Population Policy 2000 has made a qualitative departure in its approach
to population issues. It does not directly lay emphasis on population control. It states
that the objective of economic and social development is to improve the quality of
lives that people lead, to enhance their well-being, and to provide the opportunities
and choices to become productive assets (resources) in the society. Stabilizing
population is an essential requirement for promoting sustainable development. The
immediate objective of the NPP 2000 is to address the unmet needs for
contraception, health care infrastructure, and health personnel, and to provide
integrated service delivery for basic reproductive and child health care. The medium-
term objective is to bring the total fertility rate (TFR) to replacement levels by 2010
through vigorous implementation of inter-sectoral operational strategies. The long-
term objective is to achieve a stable population by 2045 with sustainable economic
growth, social development, and environmental protection.
Total Fertility Rate at Replacement Level: It is the total fertility rate at which
newborn girls would have an average of exactly one daughter over their lifetimes.
In more familiar terms, every woman has as many babies as needed to replace
her. It results into zero population growth.
Stable Population: A population where fertility and mortality are constant over
a period of time. This type of population will show an unvarying age distribution
and will grow at a constant rate. Where fertility and mortality are equal, the stable
population is stationary.
SOCIAL SCIENCE
MODULE - 2 Population: Our Greatest Resource
India: Natural Environ-
ment, Resources and
Development
316
Notes
Women Empowerment in India
The empowerment of women is very crucial for improving the quality of population
as a human resource. Women, in India, although making up almost 50% of the total
population, have been looked down upon and subjected to discrimination. By simple
logic, this has deprived the nation of the contribution of half of its population as human
resources. This is quite opposite of what is seen and observed in the developed world.
The role of women in our country has been limited to looking after their families,
also being mute spectators to all kinds of discrimination, ill treatments and crimes
against them.
If you go through the Indian Constitution, you will find that in its Articles14, 15, 16,
19, 39, 42, 51e provisions have been made to ensure justice and equality to all. Many
laws have been passed like Special Marriage Act 1954, Medical Termination of
Pregnancy Act 1971 and Child Marriage Restraint Act (Amendment) 1978. Yet the
status of women continues to be a matter of great concern.
Some steps have been taken and it is hoped that there will be qualitative change
in the status of women. The empowerment of women received a major boost when
the 73rd and 74th Constitutional Amendments providing 33 percent reservation of
seats for Women in Panchayati Raj institutions and Urban Local Bodies were passed
by the Parliament. Another Constitution Amendment Bill has been introduced, which
aims at providing 33 percent reservation for women in the House of the People and
State Legislative Assemblies. A National Commission for Women came into existence
in 1992, through an Act passed in 1990. Wide ranging functions have been assigned
to the Commission to look into and investigate into any ill treatment brought to their
notice against women and to safeguard their interest.
The ultimate objective is to facilitate the advancement, development and empowerment
of women and to eliminate all forms of discrimination. These steps will also ensure
their active participation in all spheres of life and activities. You can read, learn and
understand about the need of women empowerment and its efforts made more in
detail in the lesson ‘Socio –Economic Development and Empowerment of
Disadvantaged Groups’.
INTEXT QUESTIONS 14.5
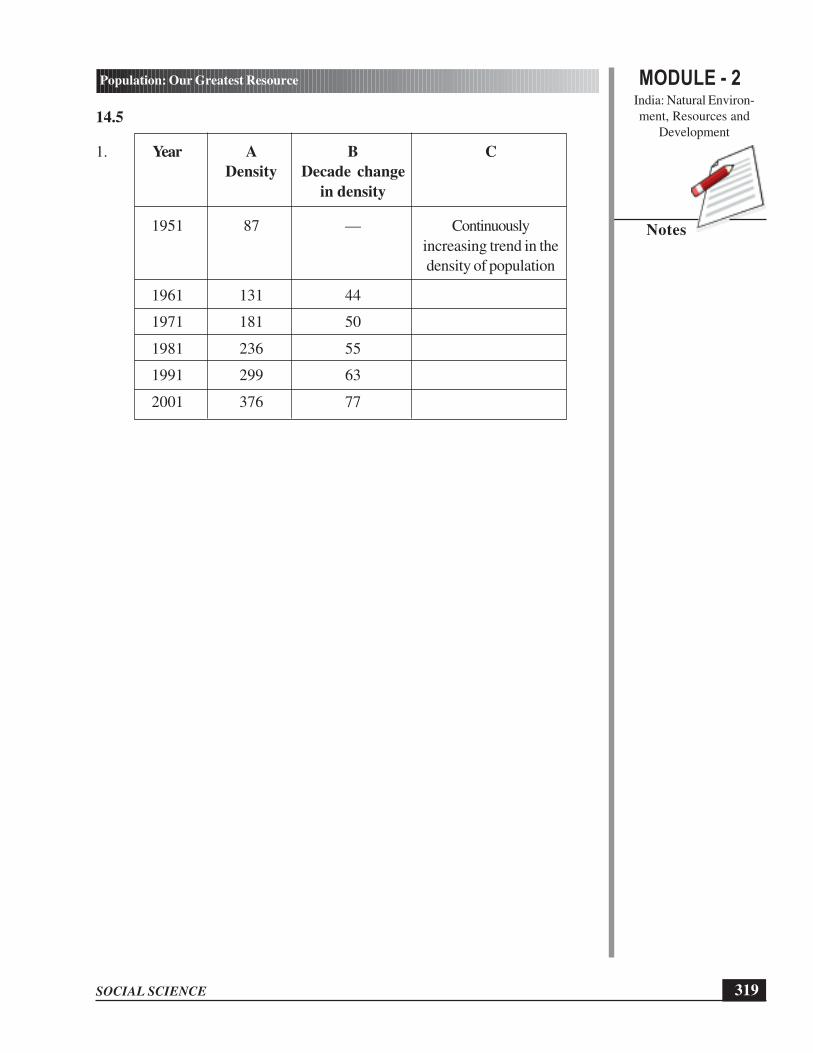
1. Suppose a particular district has an area of 200 square Km. The same district
records the total number of persons as 17400, 26200, 36200, 47200, 59800,
75200 according to 1951, 1961, 1971, 1981, 1991 and 2001 census,
respectively.
A. Calculate the density of population for all six censuses.
B. Find out the decadal change in density.
C. Can you find any trend from your calculation of population density?
MODULE - 2India: Natural Environ-
ment, Resources and
Development
317
Population: Our Greatest Resource
SOCIAL SCIENCE
Notes
WHAT YOU HAVE LEARNT
l Population is the total number of people living in a country at a given time. The
data regarding various socio-economic and demographic aspects of our population
is collected by the Government of India at the beginning of each decade and
it is called census.
l The total population of India according to the 2001 census is 1028.7 millions
which is more than four times to that of 1901 (238.3 millions). The difference
between the birth rate and death rate is called natural growth rate.
l Density of population is defined as the number of persons per square kilometer.
Its distribution in India is highly uneven. NCT of Delhi has the highest density
of 9294 persons/sq. km. and Arunachal Pradesh has the lowest 14 persons/sq.
km.
l Sex ratio is defined as the number of females per 1000 male in the total
population. Sex ratio is unfavorable in India. It is 933 according to the census
of 2001. The sex ratio can be improved by empowering women.
l Population of India is divided mainly into three age-group; (i) children (0-14
years), (ii) adults (15-60 years) and (iii) old (60+years). Children and old form
the dependent population and their percentage in the total population is about
43.
l For an awakened society, literacy is an important indicator. As per the census
‘a person aged seven and above should be able to read and write with
understanding’. Literacy rate in our country has improved a lot. It was only 18.33
in 1951 which has gone up to 65.37% in 2001. Kerala has the highest literacy
rate 90.86 percent.
l The main objective of the National Population Policy is to improve the quality
of life of the people by reducing birth and death rates, family welfare, stabilizing
population, economic growth, social development and environmental protection.
By making appropriate investment in improving the quality of life, our large
population can be transformed into a productive resource of our country.
TERMINAL EXERCISES
1. Define sex-ratio. Why is the sex-ratio in India unfavorable?
2. Define population growth rate and explain how it is arrived at.
3. What inferences can we draw from the age composition data of India?
4. How can we turn our huge population into a resource?
SOCIAL SCIENCE
MODULE - 2 Population: Our Greatest Resource
India: Natural Environ-
ment, Resources and
Development
318
Notes
5 Define the following terms
(i) Density of population
(ii) Birth rate, Death rate and Growth rate.
(iii) Literacy
6 Explain the National Population Policy?
7 What is meant by women empowerment? How does women empowerment
empower the whole society/community?
ANSWER TO INTEXT QUESTIONS
14.1
1. Something that can be used or reused by us.
2. Education, health and nutrition, specialized training.
14.2
1. A. West Bengal
2. D. 300 persons/square km
3. Industrialization; (ii) Urbanization; (iii) Employment opportunities; (iv) Means of
transport and communication.
4. (i) Rugged topography
(ii) Harsh climatic condition
14.3
1. C. 20 per thousand
2. C. High birth rate and low death rate
3. The year 1921 shows decline in population but after that it has been increasing
continuously.
14.4
1. C. 933
2. A. 27.8
3. Government has to invest more for the welfare of dependent population and
hence less available fund for greater developmental works in country.
4. (i) Discrimination against females.
(ii) Female foeticide and infanticide.
MODULE - 2India: Natural Environ-
ment, Resources and
Development
319
Population: Our Greatest Resource
SOCIAL SCIENCE
Notes
14.5
1. Year A B C
Density Decade change
in density
1951 87 — Continuously
increasing trend in the
density of population
1961 131 44
1971 181 50
1981 236 55
1991 299 63
2001 376 77