power plant cooling system overview for … plant cooling system overview for researchers and...
TRANSCRIPT

Power Plant Cooling System Overview for Researchers and Technology Developers
3002001915


Power Plant Cooling System Overview for Researchers and Technology Developers
3002001915
May 2013
Contributors John L. Tsou, John L. Tsou Consulting Services
John Maulbetsch, Maulbetsch Consulting
Jessica Shi, EPRI
ELECTRIC POWER RESEARCH INSTITUTE 3420 Hillview Avenue, Palo Alto, California 94304-1338 ▪ PO Box 10412, Palo Alto, California 94303-0813 ▪ USA
800.313.3774 ▪ 650.855.2121 ▪ [email protected] ▪ www.epri.com

DISCLAIMER OF WARRANTIES AND LIMITATION OF LIABILITIES THIS DOCUMENT WAS PREPARED BY THE ORGANIZATION(S) NAMED BELOW AS AN ACCOUNT OF WORK SPONSORED OR COSPONSORED BY THE ELECTRIC POWER RESEARCH INSTITUTE, INC. (EPRI). NEITHER EPRI, ANY MEMBER OF EPRI, ANY COSPONSOR, THE ORGANIZATION(S) BELOW, NOR ANY PERSON ACTING ON BEHALF OF ANY OF THEM:
(A) MAKES ANY WARRANTY OR REPRESENTATION WHATSOEVER, EXPRESS OR IMPLIED, (I) WITH RESPECT TO THE USE OF ANY INFORMATION, APPARATUS, METHOD, PROCESS, OR SIMILAR ITEM DISCLOSED IN THIS DOCUMENT, INCLUDING MERCHANTABILITY AND FITNESS FOR A PARTICULAR PURPOSE, OR (II) THAT SUCH USE DOES NOT INFRINGE ON OR INTERFERE WITH PRIVATELY OWNED RIGHTS, INCLUDING ANY PARTY'S INTELLECTUAL PROPERTY, OR (III) THAT THIS DOCUMENT IS SUITABLE TO ANY PARTICULAR USER'S CIRCUMSTANCE; OR
(B) ASSUMES RESPONSIBILITY FOR ANY DAMAGES OR OTHER LIABILITY WHATSOEVER (INCLUDING ANY CONSEQUENTIAL DAMAGES, EVEN IF EPRI OR ANY EPRI REPRESENTATIVE HAS BEEN ADVISED OF THE POSSIBILITY OF SUCH DAMAGES) RESULTING FROM YOUR SELECTION OR USE OF THIS DOCUMENT OR ANY INFORMATION, APPARATUS, METHOD, PROCESS, OR SIMILAR ITEM DISCLOSED IN THIS DOCUMENT.
REFERENCE HEREIN TO ANY SPECIFIC COMMERCIAL PRODUCT, PROCESS, OR SERVICE BY ITS TRADE NAME, TRADEMARK, MANUFACTURER, OR OTHERWISE, DOES NOT NECESSARILY CONSTITUTE OR IMPLY ITS ENDORSEMENT, RECOMMENDATION, OR FAVORING BY EPRI.
THE FOLLOWING ORGANIZATION PREPARED THIS REPORT:
Electric Power Research Institute (EPRI)
NOTE For further information about EPRI, call the EPRI Customer Assistance Center at 800.313.3774 or e-mail [email protected].
Electric Power Research Institute, EPRI, and TOGETHER…SHAPING THE FUTURE OF ELECTRICITY are registered service marks of the Electric Power Research Institute, Inc.
Copyright © 2013 Electric Power Research Institute, Inc. All rights reserved.

iii
CONTENTS 1 INTRODUCTION ..................................................................................................................1-1
1.1 Objective ......................................................................................................................1-1 1.2 Innovation Opportunities ...............................................................................................1-1
2 COOLING SYSTEM TYPES .................................................................................................2-1 2.1 Once-Through Cooling .................................................................................................2-1 2.2 Closed-Cycle Wet Cooling ............................................................................................2-3 2.3 Cooling Pond ................................................................................................................2-5 2.4 Dry Cooling ..................................................................................................................2-6 2.5 Hybrid Cooling ..............................................................................................................2-7
3 COST, PERFORMANCE, AND DESIGN DATA FOR VARIOUS TYPES OF COOLING SYSTEMS ................................................................................................................................3-1
4 APPROACHES TO WATER USE REDUCTION ...................................................................4-1 4.1 Modifications to Wet Cooling Towers ............................................................................4-1 4.2 Use of Dry Cooling and Hybrid Cooling ........................................................................4-2 4.3 Improvements in Plant Efficiency ..................................................................................4-3 4.4 Other Sources of Water ................................................................................................4-3


v
LIST OF FIGURES Figure 1-1 Innovation Opportunities to Dramatically Reduce Steam Power Plant Water Withdrawal and Consumption ..................................................................................................1-2 Figure 1-2 Effect of Steam Condensation Temperatures on Power Production ........................1-3 Figure 2-1 Once-Through Cooling ............................................................................................2-2 Figure 2-2 Wet Cooling Tower .................................................................................................2-4 Figure 2-3 Wet Cooling Tower Designs ....................................................................................2-5 Figure 2-4 Direct Dry Cooling ...................................................................................................2-6 Figure 2-5 Hybrid Cooling ........................................................................................................2-7 Figure 4-1 Cooling Tower Makeup Water Flow Rate Versus Cycles of Concentration..............4-1 Figure 4-2 Inlet Spray for Enhanced Dry Cooling .....................................................................4-2 Figure 4-3 U.S. Department of Energy Projection for Nonagricultural Water Consumption ......4-3 Figure 4-4 San Juan Generating Station Water System Integration for Recycling and Recovery ..................................................................................................................................4-4


vii
LIST OF TABLES Table 3-1 Base-Case Cooling System Design Specification.....................................................3-1 Table 3-2 Cost and Design Point Comparison for Various Types of Cooling Systems for a 500-MWe, Coal-Fired Steam Power Plant ................................................................................3-1 Table 3-3 Dimensional Data for Various Types of Cooling Systems for a 500-MWe Coal-Fired Power Plant ....................................................................................................................3-2 Table 3-4 Once-Through Cooling (Water-Cooled, Shell-and-Tube Steam Condenser) Design Parameters for a 500-MWe Power Plant ..................................................................................3-2 Table 3-5 Closed-Cycle Wet Cooling (Condenser and Mechanical-Draft Cooling Tower) Design Parameters for a 500-MWe Power Plant ......................................................................3-3 Table 3-6 Dry Cooling (Air-Cooled Condenser) Design Parameters for a 500-MWe Power Plant ........................................................................................................................................3-4


1-1
1 INTRODUCTION 1.1 Objective Thermoelectric power plants traditionally have required large volumes of water to condense steam from the turbine exhaust. EPRI is seeking proposals for early-stage, high-risk concepts with game-changing potential for reducing water withdrawal and consumption at existing power plants and facilitating the siting of new fossil, nuclear, biomass, geothermal, and concentrating solar thermal power generators.
This paper was prepared for researchers and technology developers, with the following objectives:
• Provide educational information and design and performance data for power plant cooling systems
• Support initial feasibility assessment of advanced concepts and technologies for power industry applications
Proposals submitted to EPRI for funding consideration are expected to include first-order energy and water balance assessments addressing flow rate, pressure, temperature, and other key parameters at the inlet and exit of each component in a system-level diagram.
1.2 Innovation Opportunities About 90% of power plant water withdrawal and consumption is for cooling steam exiting the turbine. Accordingly, to address the root cause of water use, EPRI is focusing on cooling system innovations. The four balloons in Figure 1-1 identify high-impact research and development (R&D) opportunities to dramatically reduce power plant water requirements.

1-2
Figure 1-1 Innovation Opportunities to Dramatically Reduce Steam Power Plant Water Withdrawal and Consumption
As shown in Figure 1-1, at least 60% of the heat energy input to existing thermoelectric power plants is lost to the ambient environment. Steam condensation systems account for the majority of losses, releasing large amounts of potentially recoverable waste heat at about 102°F (39°C). As a point of reference, note that the recoverable flue gas waste heat from a 500-MWe coal-fired plant is estimated to be about 50 MW at 340°F (171°C).
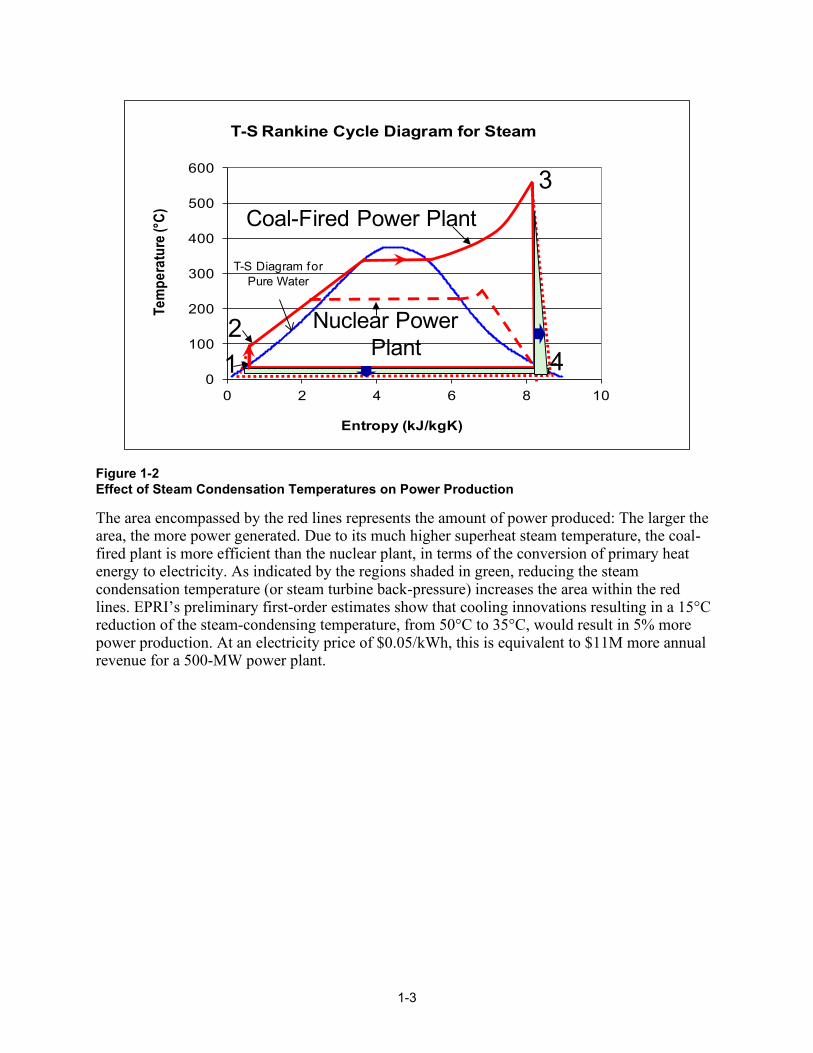
Figure 1-2 shows the Rankine cycle on a temperature-entropy diagram for a steam power plant. The solid red lines are for a coal-fired power plant; the large-dash red lines are for a nuclear plant. The condensed steam is pressurized with a pump from Point 1 to Point 2 and is then heated up in a boiler to reach from Point 2 to Point 3. From Point 3 to Point 4, the superheated steam expands through multiple stages of a turbine to generate power. From Point 4 to Point 1, the steam from the turbine exhaust is condensed into water by a steam condenser to complete the cycle.
Evaporation5,000 gpm
andDrift Loss2.5 gpm
500 MWGenerator
Flue Gas340°F
4,060,000 lb/hr
BoilerSteam1000°F
Turbine
Fan
DriftEliminator
CoolingTower Steam
2,500,000 lb/hr
AirAir
TWB = 75°F15-30 M acfm
Warm Water102°F
250,000 gpm Condenser
BoilerAsh
Fill∆P=0.5-.7 in H2O
Makeup Water6,253 gpm
BlowdownWater1,250 gpm
Cold Water82°F
Water109°F
(2.5” Hg)
CondenseVapor
Use Less Waterfor Cooling
Improve CycleEfficiency
Utilize Waste Heat(60%Wasted.
Mainly from SteamCondensation
System)
1-3
Figure 1-2 Effect of Steam Condensation Temperatures on Power Production
The area encompassed by the red lines represents the amount of power produced: The larger the area, the more power generated. Due to its much higher superheat steam temperature, the coal-fired plant is more efficient than the nuclear plant, in terms of the conversion of primary heat energy to electricity. As indicated by the regions shaded in green, reducing the steam condensation temperature (or steam turbine back-pressure) increases the area within the red lines. EPRI’s preliminary first-order estimates show that cooling innovations resulting in a 15°C reduction of the steam-condensing temperature, from 50°C to 35°C, would result in 5% more power production. At an electricity price of $0.05/kWh, this is equivalent to $11M more annual revenue for a 500-MW power plant.
0
100
200
300
400
500
600
0 2 4 6 8 10
Tem
pera
ture
(°C)
Entropy (kJ/kgK)
T-S Rankine Cycle Diagram for Steam
Nuclear Power Plant
Coal-Fired Power Plant
2
3
41
T-S Diagram for Pure Water


2-1
2 COOLING SYSTEM TYPES Cooling system technologies, which differ greatly in the amounts of water withdrawn and consumed, include the following:
• Once-through cooling 1 • Closed-cycle wet cooling • Cooling pond • Dry cooling • Hybrid cooling At present, about 43% of U.S. thermoelectric generating capacity is served by once-through systems, 42% by closed-cycle systems, 1% by dry cooling systems, and the remainder by cooling ponds. Regulatory requirements in several states are forcing existing plants to switch from once-through to closed-cycle systems with wet cooling towers, and plants in many areas of the country are facing water constraints that result in production losses and are leading to increased interest in hybrid or dry cooling system retrofits. For new U.S. plants, permitting and public acceptance issues have almost eliminated once-through cooling from consideration and have created significant challenges to the use of current closed-cycle wet cooling technology. Many new plants are required to use dry cooling only.
2.1 Once-Through Cooling Once-through cooling systems withdraw cold water from and return heated water to a natural water body such as a lake, a river, or the ocean. As shown in Figure 2-1, the water is pumped through the tubes of a steam condenser.
1 Program on Technology Innovation: New Concepts of Water Conservation Cooling and Water Treatment Technologies. EPRI, Palo Alto, CA: 2012. 1025642.

2-2
Figure 2-1 Once-Through Cooling
As steam condenses on the outside of the tubes, the heat of condensation is absorbed by the water flowing through the tubes. The water exiting the condenser, warmed by 15°F to 30°F depending on system design, is returned to the original source. The amount withdrawn varies from 25,000 to 50,000 gallons/MWh. Although none of the water is consumed within the plant, some “consumptive” loss results from enhanced evaporation from the surface of the receiving water due to the heated water discharge. The loss due to this enhanced evaporation is not well known and is expected to be site-specific, but it has been variously estimated as 0.5% to 2% of the withdrawn amount or 100 to 400 gallons/MWh.
The biggest drawback of once-through systems is that heated discharges may degrade the receiving water body. The thermal pollution is most significant when the source of the water is a river or other body with limited volume. Since the power plant requires a large quantity of cooling water, it can become a significant percentage of the total water flow. Even after the hot discharge water is blended with cold water, it can still increase the overall water temperature.

2-3
Increase in water temperature will reduce dissolved oxygen in the water. This could be harmful to marine life.
Another drawback of the once-through system is fish impingement, especially small fish and aquatic organisms in the larvae stage. Power plants often use travelling water screens at the intake to prevent debris from entering the cooling system. The impact of fish to the screen can sometimes cause injury or mortality.
Microfouling is the accumulation of deposits on the inside surface of the surface condenser tube. Microfouling consists of organic deposits/scaling, biofouling materials, etc. The deposits decrease the heat transfer rate. In order to control microfouling, power plants add chemicals such as chlorine in the cooling water. The residual chemicals in the cooling water will be discharged into the source water. This could also be harmful to marine life.
U.S. power plants using once-through cooling need a Clean Water Act 316(a) variance demonstrating that the degree of harm done to the environment is no greater than what would result from a closed-cycle system.
2.2 Closed-Cycle Wet Cooling Closed-cycle wet cooling (Figure 2-2) is similar to once-through cooling in that cold water flows through the tubes of a steam condenser and steam condenses on the outside of the tubes. However, the heated water leaving the condenser, instead of being returned to the source, is pumped to a cooling device such as a cooling tower, cooling pond, or cooling canal, where it is cooled by evaporation of a small portion of the water to the atmosphere. The cooled water is then recirculated in a closed cycle to the condenser tube inlets. The circulating water can be cooled to within 5°F to 10°F of the ambient wet-bulb temperature at design conditions.

2-4
Figure 2-2 Wet Cooling Tower
Wet cooling towers are heat removal devices used to transfer thermal energy from heated cooling water to the atmosphere. They transfer thermal energy through both sensible heat transfer to the ambient air and evaporation to near the wet-bulb air temperature.
As ambient air is drawn past a flow of water, a small portion of the water evaporates, and the energy required to evaporate that portion of the water is taken from the remaining mass of water, thus reducing its temperature. Approximately 970 Btu of thermal energy is absorbed for each pound of water evaporated. Evaporation results in saturated air conditions, lowering the temperature of the cooling water to a value close to wet-bulb air temperature. To achieve better performance, the heated cooling water is sprayed to a medium, called fill, to increase the surface area and the time of contact between the air and water flow. Splash fill consists of material placed to interrupt the water flow causing splashing. Film fill is composed of thin sheets of material (usually PVC) upon which the water flows.
With respect to drawing air through the tower, there are two types of cooling towers: natural draft and mechanical draft (Figure 2-3). Natural draft cooling towers utilize buoyancy via a tall chimney. Warm, moist air naturally rises due to the density differential compared to the dry, cooler outside air. Warm moist air is less dense than drier air at the same pressure. This moist air

2-5
buoyancy produces an upward current of air through the tower. Hyperbolic towers have become the design standard for all natural draft cooling towers due to their structural strength and minimum usage of material. The hyperbolic shape also aids in accelerating air flow through the tower and thus increases efficiency. Mechanical draft towers use motor-driven fans to force or draw air through the towers. Induced draft towers employ a fan at the top that pulls air up through the tower. Forced draft towers use a blower-type of fan at the bottom, which forces the air into the tower.
Figure 2-3 Wet Cooling Tower Designs
Since a cooling tower uses air to cool water, it does not cause thermal pollution of the source water. However, it does consume water. The water is lost in the cooling tower through evaporation, blowdown, and drift loss. Evaporation loss is directly related to heat load. Blowdown is used to control the concentration of the dissolved minerals in the circulating water. If the makeup water contains higher minerals content, then the blowdown volume will be higher. Generally, the cycles of concentration are maintained between 3 to 7. The drift is water droplets carried out by the exiting air. Modern drift eliminators can reduce the drift loss to at least 0.0005% of the circulating water flow.
Cooling towers also use a number of chemicals such as biocide to control biofouling, scale inhibitor to control scaling, and corrosion inhibitor to control corrosion. The blowdown may also contain these chemicals.
2.3 Cooling Pond A cooling pond is a man-made body of water primarily formed for the purpose of supplying cooling water to a nearby power plant. Cooling ponds are used where sufficient land is available, as an alternative to a cooling tower or a once-through cooling system drawing on a natural water body. The pond receives thermal energy in the heated water from the plant’s surface condensers, and the energy is dissipated mainly through evaporation. The pond must be of sufficient size to provide continuous cooling. Makeup water is added to the pond system to replace the water lost through evaporation.

2-6
2.4 Dry Cooling Dry cooling systems can be either of the direct type (Figure 2-4), in which turbine exhaust steam is condensed in an air-cooled condenser (ACC); or of the indirect type, in which the steam is condensed in a conventional water-cooled condenser (as in the case of once-through or closed-cycle cooling) and the heated condenser cooling water is then recirculated to an air-cooled heat exchanger before being returned to the water-cooled condenser. In the direct system, the steam is condensed in the ACC in finned tube bundles (galvanized steel tubes with aluminum fins) as diagrammed in Figure 2-4.
The water either withdrawn or consumed for cooling in either case is zero. A small amount of water is typically used to clean the air-side surfaces of the air-cooled condenser or heat exchanger once or twice a year.
Figure 2-4 Direct Dry Cooling
The condensing temperature, in the case of direct dry cooling, or the cold water temperature, in the case of indirect dry cooling, is limited by the ambient temperature, which is always higher than the ambient wet-bulb temperature. Although dry cooling achieves significant water savings, the capital and operating costs are much higher than they are for closed-cycle wet cooling, and the physical footprint is larger. Also, plant performance is reduced in the hotter times of the year when the steam-condensing temperature (and hence the turbine exhaust pressure) is substantially higher than it would be with wet cooling.
Another indirect dry cooling system is the so-called Heller System, which uses a direct contact condenser instead of a steam surface condenser. The turbine exhaust steam is in direct contact

2-7
with the cold water spray, and no condenser tubes are used. The resultant hot condensate and water mixture are pumped to an external air-cooled heat exchanger. The air-cooled heat exchanger can be either mechanical draft, natural draft or fan-assisted natural draft type. The direct contact condenser has the advantage of lower terminal temperature difference (TTD, which is the temperature difference between the saturation steam temperature and the cooling water outlet temperature) and thus lower turbine back-pressure.
2.5 Hybrid Cooling Hybrid cooling systems have both dry and wet cooling elements that are used individually or together to achieve the best features of each; that is, the wet cooling performance on the hottest days of the year and the water conservation capability of dry cooling at other times. The wet and dry components can be arranged in series or parallel as separate structures or integrated into a single tower. The dry elements can be either direct or indirect types, as is the case for all-dry cooling. The most common configuration to date has been parallel, separate structures with direct dry cooling (Figure 2-5).
Figure 2-5 Hybrid Cooling
The drawback to hybrid cooling is that significant amounts of water are still required, particularly during the summer. Therefore, it is most suitable for sites that have significant water availability but not enough for all-wet cooling at all times of the year. For sites where water use is highly limited and contentious, even the use of 20% of the all-wet amounts might be unacceptable, requiring all-dry cooling to allow the plant to be permitted. For sites with adequate water, the performance and economic advantages of all-wet cooling are large. In some cases, plant siting might be eased by evidence of “responsible citizenship,” in which a plant developer offers some degree of reduced water use to the local community concerned about water for agriculture, recreation, or industry.


3-1
3 COST, PERFORMANCE, AND DESIGN DATA FOR VARIOUS TYPES OF COOLING SYSTEMS Tables 3-1 through 3-6 provide cost, performance, and design data for various types of cooling systems for a 500-MWe coal-fired plant.
Table 3-1 Base-Case Cooling System Design Specification
Base Plant
Type Coal-fired steam
Capacity 500 MWe
Steam flow 2.5 × 10⁶ lb/hr
Cooling system heat load 2.5 × 10⁹ Btu/hr
Ambient Temperature 90O F
Ambient Wet Bulb 70O F
Table 3-2 Cost and Design Point Comparison for Various Types of Cooling Systems for a 500-MWe, Coal-Fired Steam Power Plant
Cooling System
Design Backpressure
(in Hg)
System Cost
(US$Million)
Cost Ratio
Relative to Wet
Evaporative Loss
(kgal/MWh)
Steam Condensation Temperature*
(°F)
Coolant Flow Rate
(kgpm)
Wet cooling tower and condenser
2.5 20–25 1.00 0.5–0.7 110 150-250
Dry direct 5 60–100 2.5–5 0 135 0
Once-through cooling
2.5 10–15 0.4–0.75 0.2–0.3 110 200-300
Hybrid 3 40–75 2–4 0.1–0.5 115 50–150
* Steam condensation temperatures are based on ambient air dry-bulb temperature of 100°F and ambient air wet-bulb temperature of 78°F.

3-2
Table 3-3 Dimensional Data for Various Types of Cooling Systems for a 500-MWe Coal-Fired Power Plant
Steam Condenser Tower/Air-Cooled Condenser
Cooling System
Heat Transfer Area (ft2)
Tube Diameter (in.)
Number of Tubes
Tube Length (ft)
Cost (US$ Million)
No. of Cells
Cell Dimensions (ft)
Footprint (ft2)
Cost (US$ Millions)
Wet cooling tower and condenser
175,000–350,000 1.125–1.25 17,000–
35,000 30–40 1–2.5 15–20 48 × 48 to 60 × 60
50,000–80,000 7–10
Dry direct N/A N/A N/A N/A N/A 40–72 40 × 40 64,000–
120,000 60–100
Once-through cooling
175,000–350,000 1.125–1.25 17,000–
35,000 30–40 1–2.5 N/A N/A N/A N/A
Hybrid 50,000–350,000 1.125–1.25 10,000–
350,000 30–40 0.4–2.5 4–10 15–30
48 × 48 to 60 × 60 40 × 40
10,000–36,000
24,000–48,000
30–80
Table 3-4 Once-Through Cooling (Water-Cooled, Shell-and-Tube Steam Condenser) Design Parameters for a 500-MWe Power Plant
Design Parameters
Circulating water flow (gpm) 250,000
Cooling water temperature rise (°F) 20
Condenser terminal temperature difference (°F) 10
Condensing temperature (°F) 110
Condensing pressure (in. Hga) 2.5
Physical Dimensions
Arrangement Single-pass
Tube length (ft) 60
Tube diameter (in.) 1.25
No. of tubes 17,000–35,000
Heat transfer area (ft2) 175,000–350,000
Condenser Cost
Cost assumed per unit heat transfer area (US$)/ft2 7
Water Use
Withdrawal (gpm) 250,000
Consumption (gpm) ~2000–3000
3-3
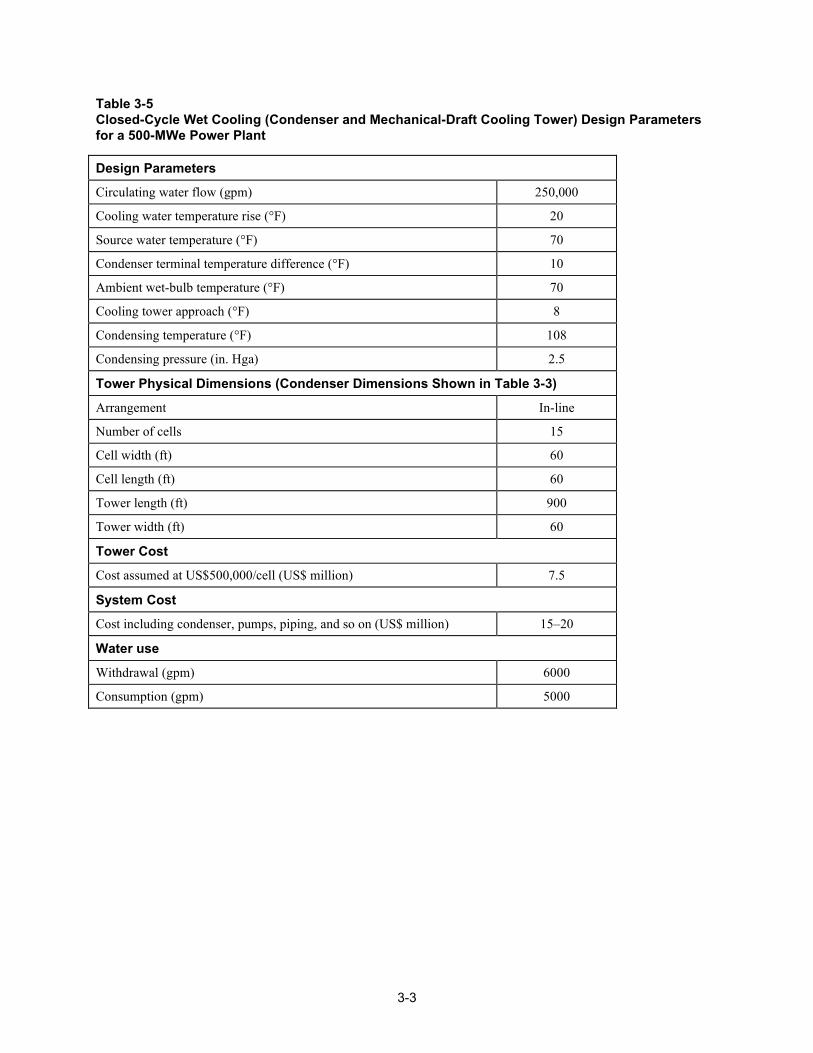
Table 3-5 Closed-Cycle Wet Cooling (Condenser and Mechanical-Draft Cooling Tower) Design Parameters for a 500-MWe Power Plant
Design Parameters
Circulating water flow (gpm) 250,000
Cooling water temperature rise (°F) 20
Source water temperature (°F) 70
Condenser terminal temperature difference (°F) 10
Ambient wet-bulb temperature (°F) 70
Cooling tower approach (°F) 8
Condensing temperature (°F) 108
Condensing pressure (in. Hga) 2.5
Tower Physical Dimensions (Condenser Dimensions Shown in Table 3-3)
Arrangement In-line
Number of cells 15
Cell width (ft) 60
Cell length (ft) 60
Tower length (ft) 900
Tower width (ft) 60
Tower Cost
Cost assumed at US$500,000/cell (US$ million) 7.5
System Cost
Cost including condenser, pumps, piping, and so on (US$ million) 15–20
Water use
Withdrawal (gpm) 6000
Consumption (gpm) 5000

3-4
Table 3-6 Dry Cooling (Air-Cooled Condenser) Design Parameters for a 500-MWe Power Plant
Design Parameters
Air flow (acfm) ~7 × 10⁷
Air temperature rise (°F) ~30
Ambient air temperature (°F) 90
Air-cooled condenser initial temperature difference (°F) 45
Condensing temperature (°F) 135
Condensing pressure (in. Hga) ~5
Physical Dimensions
Arrangement 10 × 6
Number of cells 60
Cell width (ft) 40
Cell length (ft) 40
Air-cooled condenser footprint (ft2) 96,000
Air-Cooled Condenser Cost
Cost assumed at US$1.5 million/cell (US$ million) 90
Water Use
Withdrawal (gpm) 0
Consumption (gpm) 0

4-1
4 APPROACHES TO WATER USE REDUCTION A number of approaches can be taken to reduce the freshwater requirements for power plant cooling, including the following:
• Modifications to wet cooling towers • Use of dry and hybrid dry-wet cooling • Improvements in plant efficiency • Use of other sources of water
4.1 Modifications to Wet Cooling Towers Because the amount of water evaporated in a wet cooling tower is essentially set by the heat load on the tower, there is little opportunity to reduce the evaporation loss. However, a fraction of the heat load is carried by sensible rather than latent heat, in the form of the increased temperature of the air stream as it passes through the tower. Changes in the choice of design choices for the range, approach, and water–to–air flow rate ratio (L/G) can lead to slight variations in the sensible/latent heat ratio. Savings available, even with extreme choices, are limited to a few percent and might well come at unacceptable cost in tower cost and performance.
Increased makeup or side-stream water treatment can allow operation at higher cycles of concentration to reduce blowdown volume. As indicated in Figure 4-1, increasing the cycles of concentration from 3 to 6 reduces the makeup required by 20%. However, an additional increase to 10 cycles of concentration reduces makeup requirements by only an additional 9%. Above 10 cycles, the effect is essentially insignificant.
Figure 4-1 Cooling Tower Makeup Water Flow Rate Versus Cycles of Concentration
Cooling Tower Make-up(for evaporation rate of 600 gallons/MWh)
0
200
400
600
800
1,000
1,200
1,400
1,600
1,800
2,000
0 1 2 3 4 5 6 7 8 9 10
Cycles of concentration
Mak
e-up
requ
irem
ent,
gal/M
Wh

4-2
4.2 Use of Dry Cooling and Hybrid Cooling Dry and hybrid cooling can provide significant water savings at the price of significantly higher capital cost for cooling equipment, increased operating power requirements, and some reduction in plant output, which is higher for dry cooling than for hybrid cooling. A number of considerations can be investigated, including the following:
• Direct dry cooling (air-cooled condensers) has better cost/performance characteristics than indirect dry cooling (air-cooled heat exchangers). However, indirect systems might be required for nuclear applications. Modifications to the design and operation of nuclear systems to accommodate direct dry cooling might be valuable.
• The limiting heat transfer resistance in dry-cooled elements is on the air side of the exchanger. The finned surfaces used to reduce this resistance are a major contributor to the cost of dry cooling. Advances would come from enhanced, extended-surface heat transfer performance, which avoids a corresponding increase in fan power requirements.
• Other approaches with the potential to improve dry cooling and the dry portion of hybrid systems include integration with thermal storage, improved resistance to wind effects, or other innovative concepts such as inlet air cooling. An example of inlet air cooling with water sprayed into the inlet air stream is shown in Figure 4-2.
• Hybrid cooling systems will benefit from any improvements to dry-cooled elements. Reductions in the cost of condensers or heat exchangers will permit hybrid systems to be designed for lower water use targets for the same cost and power requirements as present designs.
Figure 4-2 Inlet Spray for Enhanced Dry Cooling
4-3
4.3 Improvements in Plant Efficiency Improved plant efficiency reduces the amount of heat rejection required per unit of power produced and, therefore, reduces the specific water demand. Efficiency improvements can be approached through improved plant design (better turbines; higher peak temperatures and pressures); improved condenser design to lower turbine exhaust pressure; or other innovative approaches.
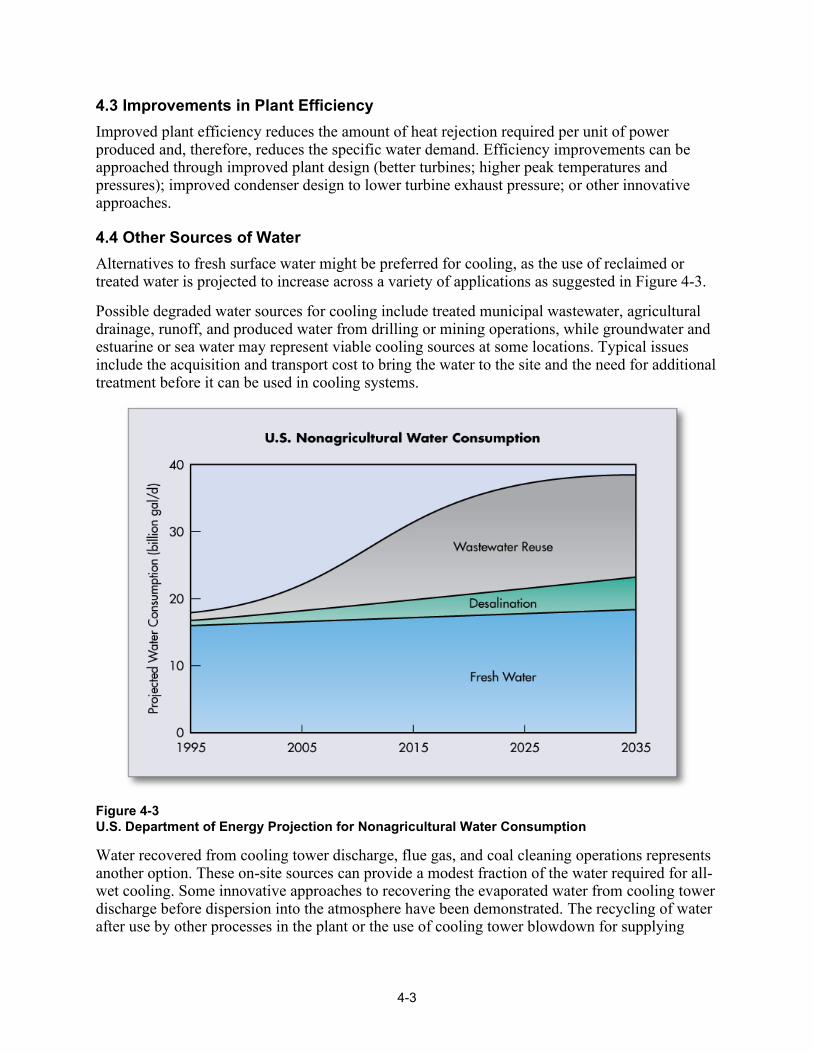
4.4 Other Sources of Water Alternatives to fresh surface water might be preferred for cooling, as the use of reclaimed or treated water is projected to increase across a variety of applications as suggested in Figure 4-3.
Possible degraded water sources for cooling include treated municipal wastewater, agricultural drainage, runoff, and produced water from drilling or mining operations, while groundwater and estuarine or sea water may represent viable cooling sources at some locations. Typical issues include the acquisition and transport cost to bring the water to the site and the need for additional treatment before it can be used in cooling systems.
Figure 4-3 U.S. Department of Energy Projection for Nonagricultural Water Consumption
Water recovered from cooling tower discharge, flue gas, and coal cleaning operations represents another option. These on-site sources can provide a modest fraction of the water required for all-wet cooling. Some innovative approaches to recovering the evaporated water from cooling tower discharge before dispersion into the atmosphere have been demonstrated. The recycling of water after use by other processes in the plant or the use of cooling tower blowdown for supplying
4-4
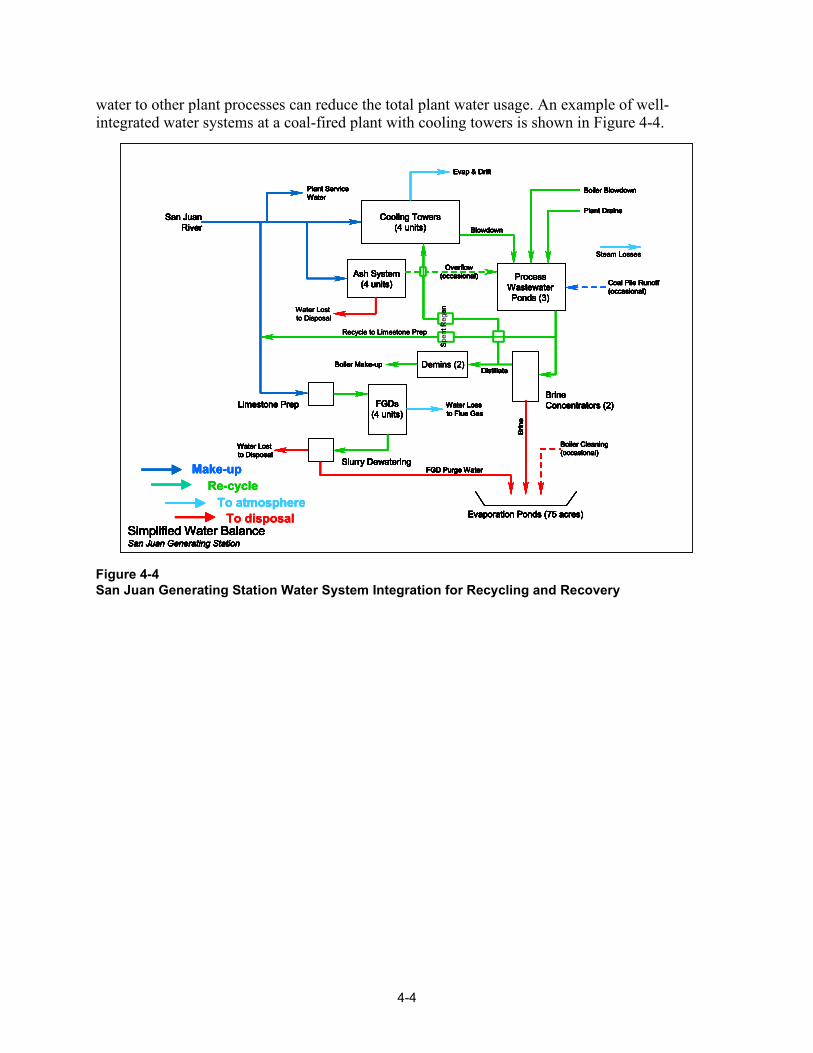
water to other plant processes can reduce the total plant water usage. An example of well-integrated water systems at a coal-fired plant with cooling towers is shown in Figure 4-4.
Figure 4-4 San Juan Generating Station Water System Integration for Recycling and Recovery
Re-cycle
Demins (2)
Water Lostto Disposal
Recycle to Limestone Prep
Steam Losses
ProcessWastewaterPonds (3)
Simplified Water BalanceSan Juan Generating Station
Cooling Towers(4 units)
Ash System(4 units)
BrineConcentrators (2)FGDs
(4 units)
Evaporation Ponds (75 acres)
Limestone Prep
Slurry Dewatering
San JuanRiver
Water Lostto Disposal
Boiler Make-up
Brin
e
FGD Purge Water
Boiler Cleaning(occasional)
Evap & Drift
Blowdown
Boiler Blowdown
Plant Drains
Distillate
Water Lossto Flue Gas
Plant ServiceWater
Coal Pile Runoff(occasional)
Overflow(occasional)
Spe
nt R
egen
Make-up
To atmosphereTo disposal
Re-cycle
Demins (2)
Water Lostto Disposal
Recycle to Limestone Prep
Steam Losses
ProcessWastewaterPonds (3)
Simplified Water BalanceSan Juan Generating Station
Cooling Towers(4 units)
Ash System(4 units)
BrineConcentrators (2)FGDs
(4 units)
Evaporation Ponds (75 acres)
Limestone Prep
Slurry Dewatering
San JuanRiver
Water Lostto Disposal
Boiler Make-up
Brin
e
FGD Purge Water
Boiler Cleaning(occasional)
Evap & Drift
Blowdown
Boiler Blowdown
Plant Drains
Distillate
Water Lossto Flue Gas
Plant ServiceWater
Coal Pile Runoff(occasional)
Overflow(occasional)
Spe
nt R
egen
Make-up
To atmosphere
Demins (2)
Water Lostto Disposal
Recycle to Limestone Prep
Steam Losses
ProcessWastewaterPonds (3)
Simplified Water BalanceSan Juan Generating Station
Cooling Towers(4 units)
Ash System(4 units)
BrineConcentrators (2)FGDs
(4 units)
Evaporation Ponds (75 acres)
Limestone Prep
Slurry Dewatering
San JuanRiver
Water Lostto Disposal
Boiler Make-up
Brin
e
FGD Purge Water
Boiler Cleaning(occasional)
Evap & Drift
Blowdown
Boiler Blowdown
Plant Drains
Distillate
Water Lossto Flue Gas
Plant ServiceWater
Coal Pile Runoff(occasional)
Overflow(occasional)
Spe
nt R
egen
Demins (2)
Water Lostto Disposal
Recycle to Limestone Prep
Steam Losses
ProcessWastewaterPonds (3)
Simplified Water BalanceSan Juan Generating Station
Cooling Towers(4 units)
Ash System(4 units)
BrineConcentrators (2)FGDs
(4 units)
Evaporation Ponds (75 acres)
Limestone Prep
Slurry Dewatering
San JuanRiver
Water Lostto Disposal
Boiler Make-up
Brin
e
FGD Purge Water
Boiler Cleaning(occasional)
Evap & Drift
Blowdown
Boiler Blowdown
Plant Drains
Distillate
Water Lossto Flue Gas
Plant ServiceWater
Coal Pile Runoff(occasional)
Overflow(occasional)
Steam Losses
ProcessWastewaterPonds (3)
Simplified Water BalanceSan Juan Generating Station
Cooling Towers(4 units)
Ash System(4 units)
BrineConcentrators (2)FGDs
(4 units)
Evaporation Ponds (75 acres)
Limestone Prep
Slurry Dewatering
San JuanRiver
Water Lostto Disposal
Boiler Make-up
Brin
e
FGD Purge Water
Boiler Cleaning(occasional)
Evap & Drift
Blowdown
Boiler Blowdown
Plant Drains
Distillate
Water Lossto Flue Gas
Plant ServiceWater
Coal Pile Runoff(occasional)
Overflow(occasional) Process
WastewaterPonds (3)
Simplified Water BalanceSan Juan Generating Station
Cooling Towers(4 units)
Ash System(4 units)
BrineConcentrators (2)FGDs
(4 units)
Evaporation Ponds (75 acres)
Limestone Prep
Slurry Dewatering
San JuanRiver
Water Lostto Disposal
Boiler Make-up
Brin
e
FGD Purge Water
Boiler Cleaning(occasional)
Evap & Drift
Blowdown
Boiler Blowdown
Plant Drains
Distillate
Water Lossto Flue Gas
Plant ServiceWater
Coal Pile Runoff(occasional)
Overflow(occasional)
Spe
nt R
egen
Make-up
To atmosphereTo disposal


Electric Power Research Institute 3420 Hillview Avenue, Palo Alto, California 94304-1338 • PO Box 10412, Palo Alto, California 94303-0813 • USA
800.313.3774 • 650.855.2121 • [email protected] • www.epri.com
Export Control Restrictions
Access to and use of EPRI Intellectual Property is granted with the specific understanding and requirement that responsibility for ensuring full compliance with all applicable U.S. and foreign export laws and regulations is being undertaken by you and your company. This includes an obligation to ensure that any individual receiving access hereunder who is not a U.S. citizen or permanent U.S. resident is permitted access under applicable U.S. and foreign export laws and regulations. In the event you are uncertain whether you or your company may lawfully obtain access to this EPRI Intellectual Property, you acknowledge that it is your obligation to consult with your company’s legal counsel to determine whether this access is lawful. Although EPRI may make available on a case-by-case basis an informal assessment of the applicable U.S. export classification for specific EPRI Intellectual Property, you and your company acknowledge that this assessment is solely for informational purposes and not for reliance purposes. You and your company acknowledge that it is still the obligation of you and your company to make your own assessment of the applicable U.S. export classification and ensure compliance accordingly. You and your company understand and acknowledge your obligations to make a prompt report to EPRI and the appropriate authorities regarding any access to or use of EPRI Intellectual Property hereunder that may be in violation of applicable U.S. or foreign export laws or regulations.
The Electric Power Research Institute, Inc. (EPRI, www.epri.com) conducts research and development relating to the generation, delivery and use of electricity for the benefit of the public. An independent, nonprofit organization, EPRI brings together its scientists and engineers as well as experts from academia and industry to help address challenges in electricity, including reliability, efficiency, affordability, health, safety and the environment. EPRI also provides technology, policy and economic analyses to drive long-range research and development planning, and supports research in emerging technologies. EPRI’s members represent approximately 90 percent of the electricity generated and delivered in the United States, and international participation extends to more than 30 countries. EPRI’s principal offices and laboratories are located in Palo Alto, Calif.; Charlotte, N.C.; Knoxville, Tenn.; and Lenox, Mass.
Together…Shaping the Future of Electricity
© 2013 Electric Power Research Institute (EPRI), Inc. All rights reserved. Electric Power Research Institute, EPRI, and TOGETHER…SHAPING THE FUTURE OF ELECTRICITY are registered service marks of the Electric Power Research Institute, Inc.