process capability 1_nopw
TRANSCRIPT
8/7/2019 process capability 1_noPW
http://slidepdf.com/reader/full/process-capability-1nopw 1/16
© Don Winton 1999 ---- 8500_CPU:Desktop Folder:CPK.DOC
Page 1 of 16 © Don Winton 1999 Revision Date: 01/08/99
Process Capability Studies
[The following is based in part on the paper “Process Capability Studies” prepared by M.
Suozzi, Member of the Technical Staff, Hughes Aircraft Company, Tucson, Arizona,
27NOV90]
Introduction
Process capability is an important concept for industrial managers to understand. The
challenge in today’s competitive markets is to be on the leading edge of producing high
quality products at minimum costs. This cannot be done without a systematic approach and
this approach is contained within what has been called “statistical quality control” or
“industrial statistics.” The segment of statistical quality control (SQC) discussed here is the
process capability study.
So why is process capability so important? Because it allows one to quantify how well a
process can produce acceptable product. As a result, a manager or engineer can prioritize
needed process improvements and identify those processes that do not need immediate
process improvements. Process capability studies indicate if a process is capable of
producing virtually all conforming product. If the process is capable, then statistical process
controls can be used to monitor the process and conventional acceptance efforts can be
reduced or eliminated entirely. This not only yields great cost savings in eliminating non-
value added inspections but also eliminates scrap, rework and increases customer
satisfaction. The benefits of performing process capability studies are certainly worth the
effort in the long run.
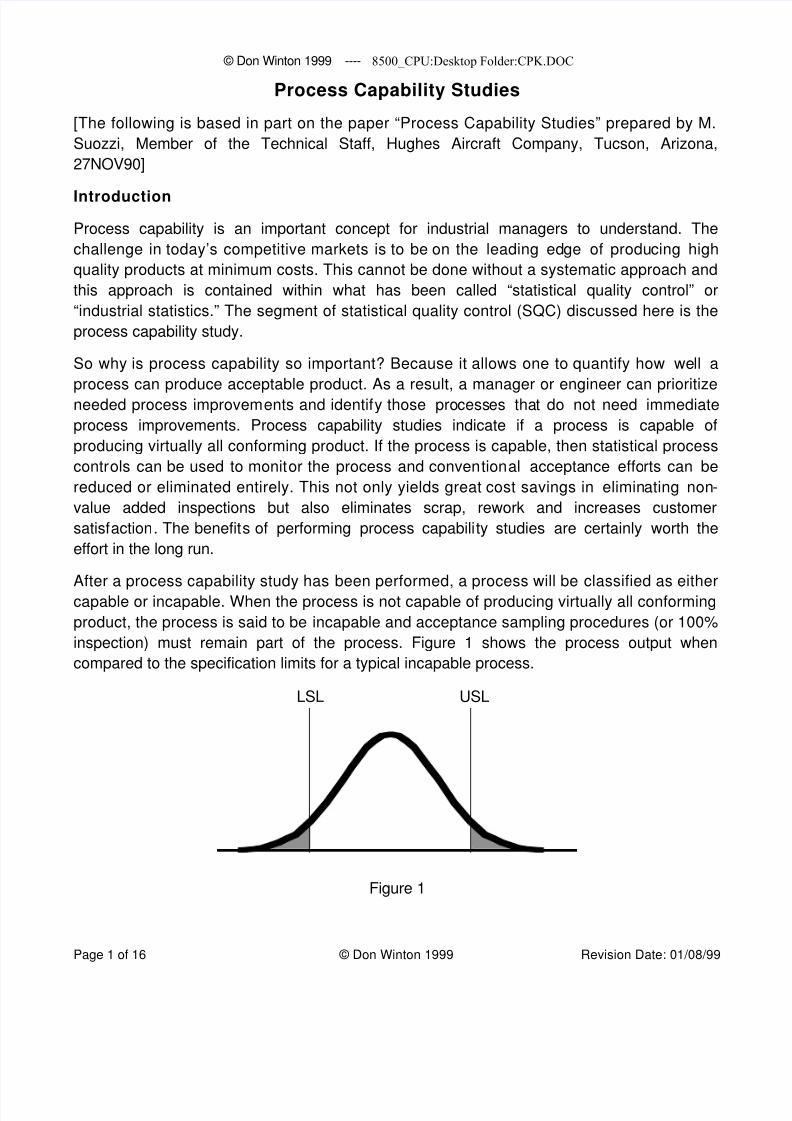
After a process capability study has been performed, a process will be classified as either
capable or incapable. When the process is not capable of producing virtually all conforming
product, the process is said to be incapable and acceptance sampling procedures (or 100%
inspection) must remain part of the process. Figure 1 shows the process output when
compared to the specification limits for a typical incapable process.
LSL USL
Figure 1

8/7/2019 process capability 1_noPW
http://slidepdf.com/reader/full/process-capability-1nopw 2/16
© Don Winton 1999 ---- 8500_CPU:Desktop Folder:CPK.DOC
Page 2 of 16 © Don Winton 1999 Revision Date: 01/08/99
Processes may also start out as capable but changes over time to have more variability. In
addition, the process mean may also shift placing the process too close to one of the
specification limits. Both increases in process variabili ty and shifting of the mean may result
in once capable processes becoming incapable.
LSL USL
Figure 2
Figure 2 illustrates a once capable process that, over time, has become incapable due to
increased variation. Figure 3 illustrates the effects of process capability due to shifting in the
mean with variation remaining the same.
C pk = 0.0
Nominal
X = 100
USL
LSL
C p = 1.0 (σ= 2.0)
X = 103
X = 106
X = 109
C pk = 1.0
C pk = 0.5
C pk = 0.0
C pk = -0.5
Nominal
X = 100
USL
LSL
C p = 2.0 (σ= 1.0)
C pk = 2.0
X = 103
C pk = 1.0
X = 106
X = 109
C pk
= -1.0
Figure 3
8/7/2019 process capability 1_noPW
http://slidepdf.com/reader/full/process-capability-1nopw 3/16
© Don Winton 1999 ---- 8500_CPU:Desktop Folder:CPK.DOC
Page 3 of 16 © Don Winton 1999 Revision Date: 01/08/99
Definitions
Process : Process refers to any system of causes; any combination of conditions which work
together to produce a given result.
Process Capability : Process capability refers to the normal behavior of a process when
operating in a state of statistical control. It refers to the inherent ability of a process to producesimilar parts for a sustained period of time under a given set of conditions.
Process Capability Indices : Process capability can be expressed as percent nonconforming
or in terms of the natural spread related to the specification spread.
Process Capability Study : A process capability study is a systematic procedure for
determining the capability of a process. The process capability study may include studies to
improve the process and in turn the capability of the process. Process capability studies are
usually performed as part of a process certification effort or a process optimization effort.
Process Capability Study Steps
The general process capability study steps are:
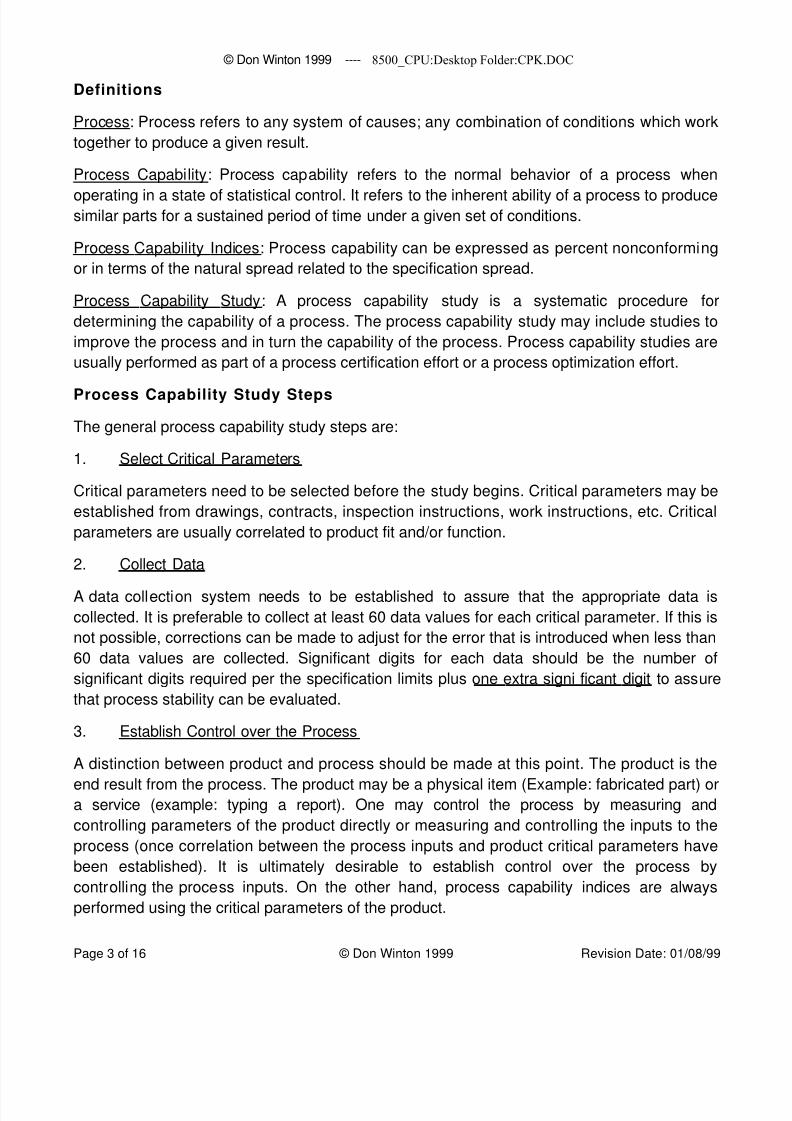
1. Select Critical Parameters
Critical parameters need to be selected before the study begins. Critical parameters may be
established from drawings, contracts, inspection instructions, work instructions, etc. Critical
parameters are usually correlated to product fit and/or function.
2. Collect Data
A data collection system needs to be established to assure that the appropriate data is
collected. It is preferable to collect at least 60 data values for each critical parameter. If this is
not possible, corrections can be made to adjust for the error that is introduced when less than
60 data values are collected. Significant digits for each data should be the number of
significant digits required per the specification limits plus one extra signi ficant digit to assure
that process stability can be evaluated.
3. Establish Control over the Process
A distinction between product and process should be made at this point. The product is the
end result from the process. The product may be a physical item (Example: fabricated part) ora service (example: typing a report). One may control the process by measuring and
controlling parameters of the product directly or measuring and controlling the inputs to the
process (once correlation between the process inputs and product critical parameters have
been established). It is ultimately desirable to establish control over the process by
controlling the process inputs. On the other hand, process capability indices are always
performed using the critical parameters of the product.
8/7/2019 process capability 1_noPW
http://slidepdf.com/reader/full/process-capability-1nopw 4/16
© Don Winton 1999 ---- 8500_CPU:Desktop Folder:CPK.DOC
Page 4 of 16 © Don Winton 1999 Revision Date: 01/08/99
Calculation of predictable process capability indices is dependent on the statistical control of
the process. If the process is not in statistical control, then the results of the study are subject
to fluctuate unpredictably. The statistical control of the process can be studied using control
charts (usually Xbar-R charts).
4. Analyze Process Data
To calculate the process capability indices, estimates of the process average and dispersion
(standard deviation) must be obtained from the process data. In addition, the formulas for
process capability indices assume that the process data came from a normal statistical
distribution. It is important that one prove that the data is normally distributed prior to reporting
the process capability indices because errors in misjudgment can lead to the same
undesirable effects as listed in Step 1. Methods for handling non-normal data and formulas
for several process capability indices will be addressed in separate sections.
5. Analyze Sources of Variation
Study of the component sources of variation and their magnitudes may range from simple
statistical tests to complex experimental designs carried out over a long period of time. If
possible, tests should be kept simple. Analyzing sources of variation involves determining
what process factors affect the natural process spread (process variation) and the process
centering. With this knowledge, it may be possible to improve the process’ capability.
Analyzing sources of variation always involve careful planning and data collection.
6. Establish Process Monitoring System
Once the process capability indices indicate a capable process, a routine process control
technique should be employed to assure that the process remains stable. This may be doneby a variety of methods such as establishing a statistical process (SPC) program.
The process capability indices should also be periodically recalculated to assure the process
mean and spread has not significantly changed.
Process Capability Indices
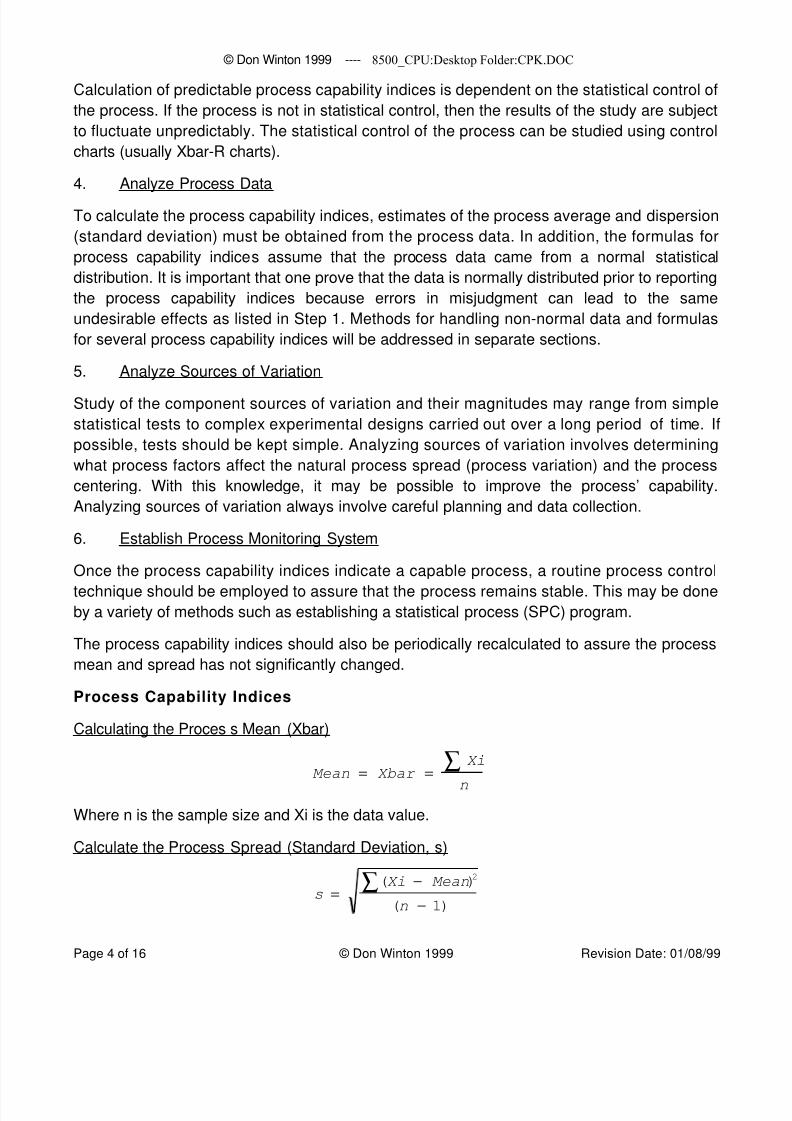
Calculating the Proces s Mean (Xbar)
Mean = Xbar =Xi∑n
Where n is the sample size and Xi is the data value.
Calculate the Process Spread (Standard Deviation, s)
s =(Xi − Mean)
2∑(n − 1)
8/7/2019 process capability 1_noPW
http://slidepdf.com/reader/full/process-capability-1nopw 5/16
© Don Winton 1999 ---- 8500_CPU:Desktop Folder:CPK.DOC
Page 5 of 16 © Don Winton 1999 Revision Date: 01/08/99
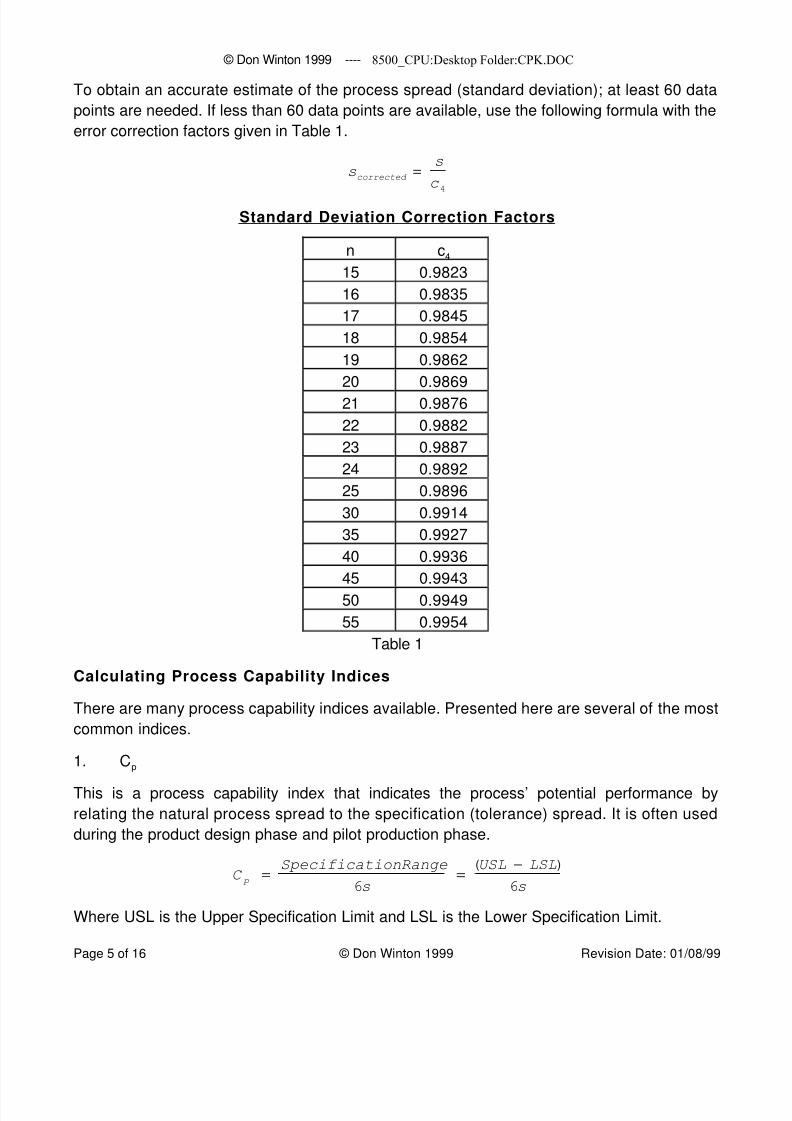
To obtain an accurate estimate of the process spread (standard deviation); at least 60 data
points are needed. If less than 60 data points are available, use the following formula with the
error correction factors given in Table 1.
scorrected
=s
c4
Standard Deviation Correction Factors
n c4
15 0.9823
16 0.9835
17 0.9845
18 0.9854
19 0.9862
20 0.9869
21 0.9876
22 0.9882
23 0.9887
24 0.9892
25 0.9896
30 0.9914
35 0.9927
40 0.9936
45 0.9943
50 0.9949
55 0.9954
Table 1
Calculating Process Capability Indices
There are many process capability indices available. Presented here are several of the most
common indices.
1. Cp
This is a process capability index that indicates the process’ potential performance by
relating the natural process spread to the specification (tolerance) spread. It is often used
during the product design phase and pilot production phase.
C p
=SpecificationRange
6s=(USL − LSL)
6s
Where USL is the Upper Specification Limit and LSL is the Lower Specification Limit.
8/7/2019 process capability 1_noPW
http://slidepdf.com/reader/full/process-capability-1nopw 6/16
© Don Winton 1999 ---- 8500_CPU:Desktop Folder:CPK.DOC
Page 6 of 16 © Don Winton 1999 Revision Date: 01/08/99
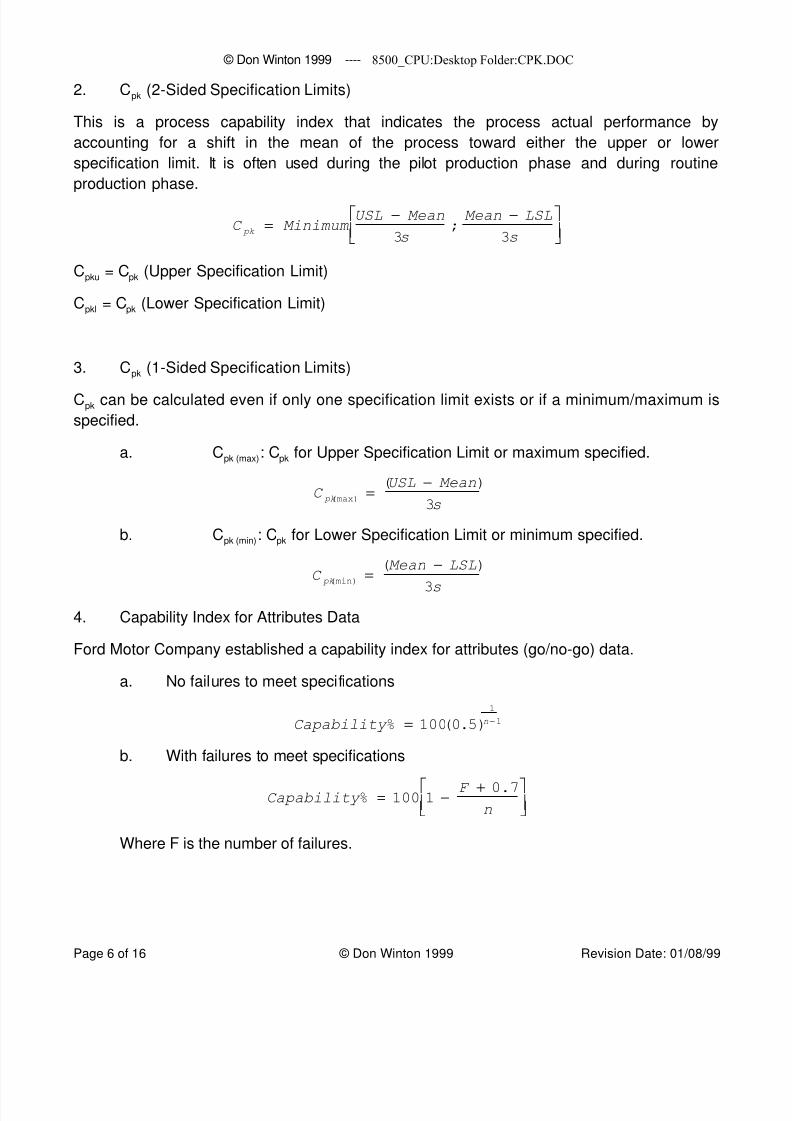
2. Cpk (2-Sided Specification Limits)
This is a process capability index that indicates the process actual performance by
accounting for a shift in the mean of the process toward either the upper or lower
specification limit. It is often used during the pilot production phase and during routine
production phase.
C pk
= MinimumUSL − Mean
3s;Mean − LSL
3s
Cpku = Cpk (Upper Specification Limit)
Cpkl = Cpk (Lower Specification Limit)
3. Cpk (1-Sided Specification Limits)
Cpk can be calculated even if only one specification limit exists or if a minimum/maximum is
specified.
a. Cpk (max): Cpk for Upper Specification Limit or maximum specified.
C pk(max)
=(USL − Mean)
3s
b. Cpk (min): Cpk for Lower Specification Limit or minimum specified.
C pk(min)
=(Mean − LSL)
3s
4. Capability Index for Attributes Data
Ford Motor Company established a capability index for attributes (go/no-go) data.
a. No failures to meet specifications
Capability % = 100(0.5)
1
n−1
b. With failures to meet specifications
Capability % = 100 1 − F + 0.7
n
Where F is the number of failures.
8/7/2019 process capability 1_noPW
http://slidepdf.com/reader/full/process-capability-1nopw 7/16
© Don Winton 1999 ---- 8500_CPU:Desktop Folder:CPK.DOC
Page 7 of 16 © Don Winton 1999 Revision Date: 01/08/99
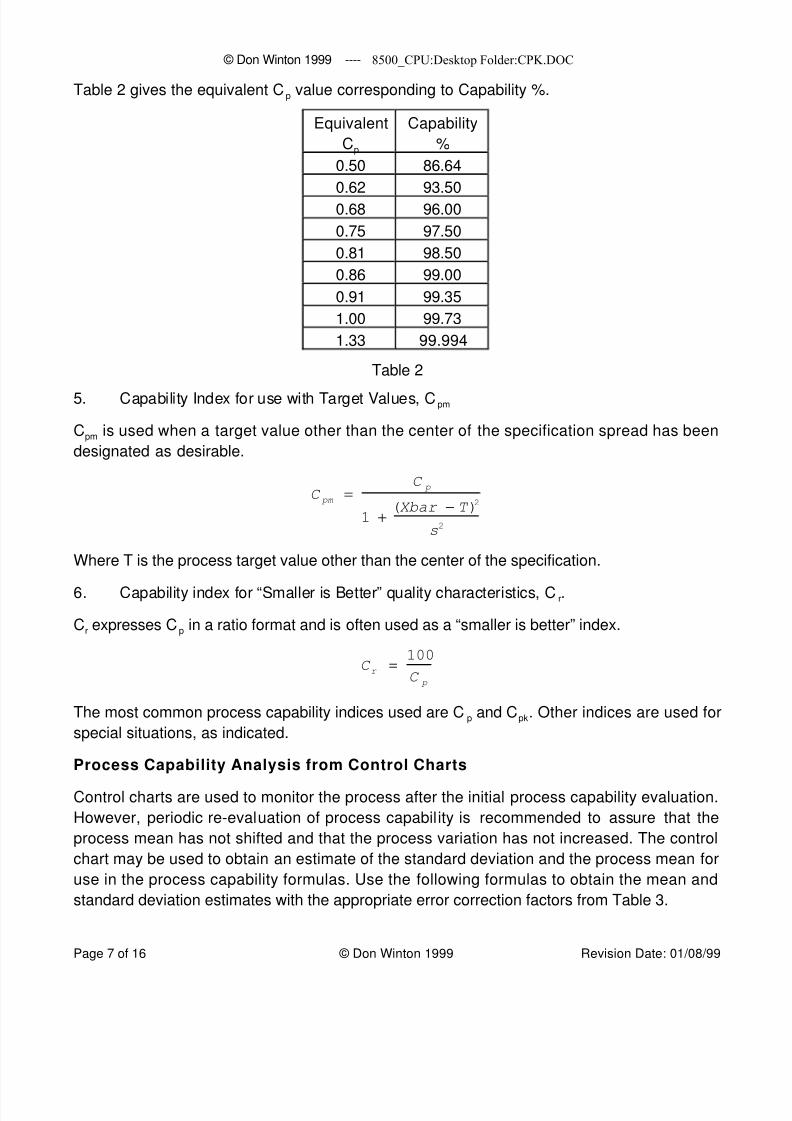
Table 2 gives the equivalent Cp value corresponding to Capability %.
Equivalent
Cp
Capability
%
0.50 86.64
0.62 93.50
0.68 96.00
0.75 97.50
0.81 98.50
0.86 99.00
0.91 99.35
1.00 99.73
1.33 99.994
Table 2
5. Capability Index for use with Target Values, Cpm
Cpm is used when a target value other than the center of the specification spread has been
designated as desirable.
C pm
=C p
1 +(Xbar − T )2
s2
Where T is the process target value other than the center of the specification.
6. Capability index for “Smaller is Better” quality characteristics, Cr.
Cr expresses Cp in a ratio format and is often used as a “smaller is better” index.
C r
=100
C p
The most common process capability indices used are Cp and Cpk. Other indices are used for
special situations, as indicated.
Process Capability Analysis from Control Charts
Control charts are used to monitor the process after the initial process capability evaluation.
However, periodic re-evaluation of process capabil ity is recommended to assure that the
process mean has not shifted and that the process variation has not increased. The control
chart may be used to obtain an estimate of the standard deviation and the process mean for
use in the process capability formulas. Use the following formulas to obtain the mean and
standard deviation estimates with the appropriate error correction factors from Table 3.
8/7/2019 process capability 1_noPW
http://slidepdf.com/reader/full/process-capability-1nopw 8/16
© Don Winton 1999 ---- 8500_CPU:Desktop Folder:CPK.DOC
Page 8 of 16 © Don Winton 1999 Revision Date: 01/08/99
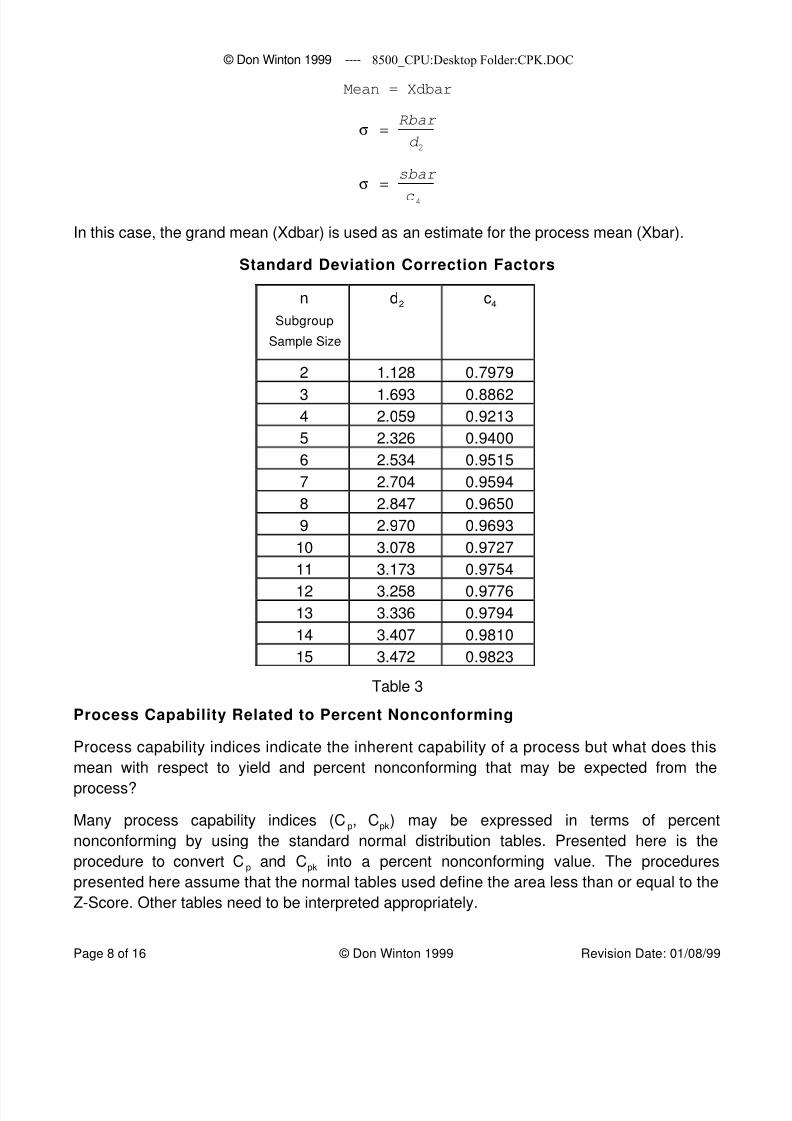
Mean = Xdbar
σ =Rbar
d 2
σ =sbar
c4
In this case, the grand mean (Xdbar) is used as an estimate for the process mean (Xbar).
Standard Deviation Correction Factors
n
Subgroup
Sample Size
d2 c4
2 1.128 0.7979
3 1.693 0.88624 2.059 0.9213
5 2.326 0.9400
6 2.534 0.9515
7 2.704 0.9594
8 2.847 0.9650
9 2.970 0.9693
10 3.078 0.9727
11 3.173 0.9754
12 3.258 0.977613 3.336 0.9794
14 3.407 0.9810
15 3.472 0.9823
Table 3
Process Capability Related to Percent Nonconforming
Process capability indices indicate the inherent capability of a process but what does this
mean with respect to yield and percent nonconforming that may be expected from the
process?
Many process capability indices (Cp, Cpk) may be expressed in terms of percent
nonconforming by using the standard normal distribution tables. Presented here is the
procedure to convert Cp and Cpk into a percent nonconforming value. The procedures
presented here assume that the normal tables used define the area less than or equal to the
Z-Score. Other tables need to be interpreted appropriately.
8/7/2019 process capability 1_noPW
http://slidepdf.com/reader/full/process-capability-1nopw 9/16
© Don Winton 1999 ---- 8500_CPU:Desktop Folder:CPK.DOC
Page 9 of 16 © Don Winton 1999 Revision Date: 01/08/99
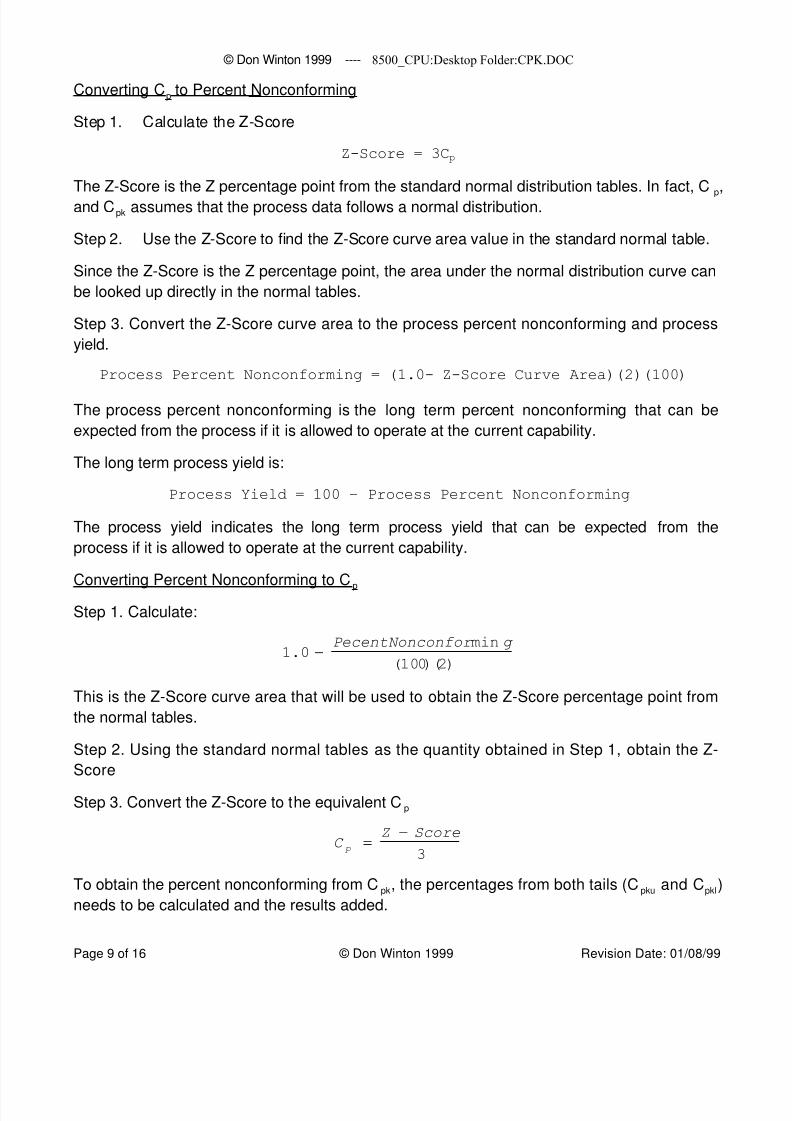
Converting Cp to Percent Nonconforming
Step 1. Calculate the Z-Score
Z-Score = 3Cp
The Z-Score is the Z percentage point from the standard normal distribution tables. In fact, Cp
,
and Cpk assumes that the process data follows a normal distribution.
Step 2. Use the Z-Score to find the Z-Score curve area value in the standard normal table.
Since the Z-Score is the Z percentage point, the area under the normal distribution curve can
be looked up directly in the normal tables.
Step 3. Convert the Z-Score curve area to the process percent nonconforming and process
yield.
Process Percent Nonconforming = (1.0- Z-Score Curve Area)(2)(100)
The process percent nonconforming is the long term percent nonconforming that can be
expected from the process if it is allowed to operate at the current capability.
The long term process yield is:
Process Yield = 100 – Process Percent Nonconforming
The process yield indicates the long term process yield that can be expected from the
process if it is allowed to operate at the current capability.
Converting Percent Nonconforming to Cp
Step 1. Calculate:
1.0 −PecentNonconfor min g
(100)(2)
This is the Z-Score curve area that will be used to obtain the Z-Score percentage point from
the normal tables.
Step 2. Using the standard normal tables as the quantity obtained in Step 1, obtain the Z-
Score
Step 3. Convert the Z-Score to the equivalent Cp
C p
=Z − Score
3
To obtain the percent nonconforming from Cpk, the percentages from both tails (Cpku and Cpkl)
needs to be calculated and the results added.
8/7/2019 process capability 1_noPW
http://slidepdf.com/reader/full/process-capability-1nopw 10/16
© Don Winton 1999 ---- 8500_CPU:Desktop Folder:CPK.DOC
Page 10 of 16 © Don Winton 1999 Revision Date: 01/08/99
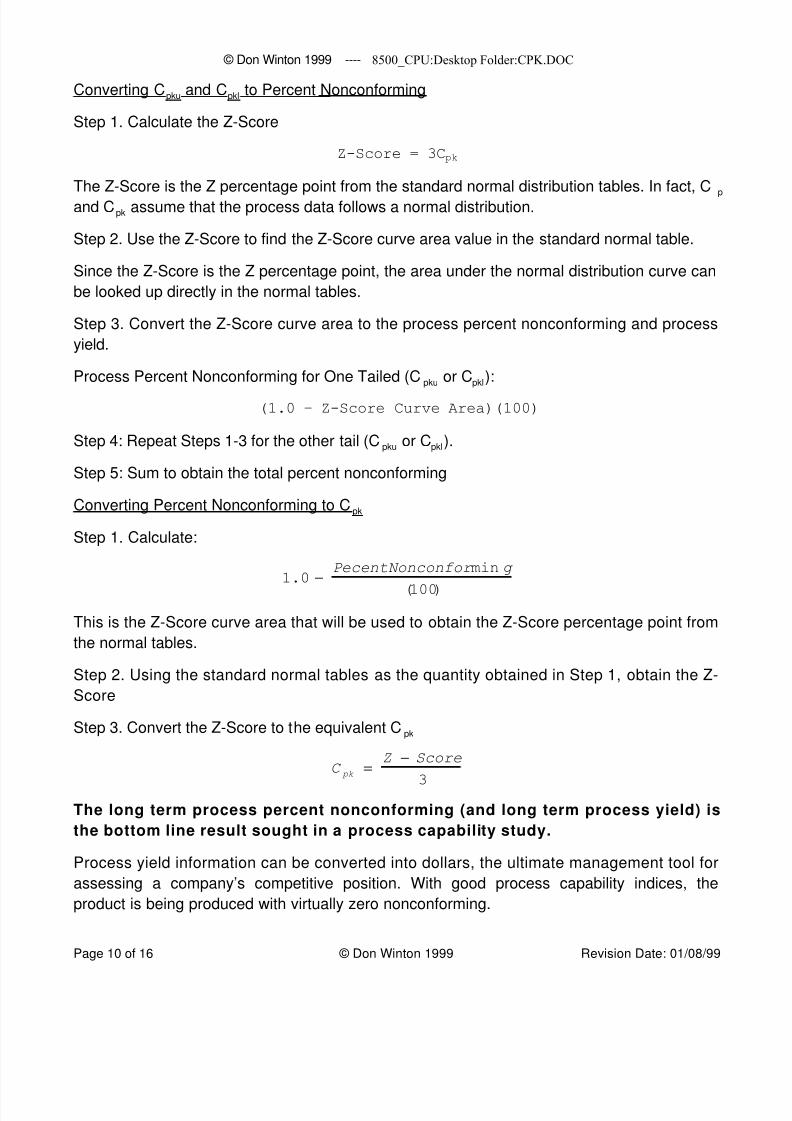
Converting Cpku and Cpkl to Percent Nonconforming
Step 1. Calculate the Z-Score
Z-Score = 3Cpk
The Z-Score is the Z percentage point from the standard normal distribution tables. In fact, Cp
and Cpk assume that the process data follows a normal distribution.
Step 2. Use the Z-Score to find the Z-Score curve area value in the standard normal table.
Since the Z-Score is the Z percentage point, the area under the normal distribution curve can
be looked up directly in the normal tables.
Step 3. Convert the Z-Score curve area to the process percent nonconforming and process
yield.
Process Percent Nonconforming for One Tailed (Cpku or Cpkl):
(1.0 – Z-Score Curve Area)(100)
Step 4: Repeat Steps 1-3 for the other tail (Cpku or Cpkl).
Step 5: Sum to obtain the total percent nonconforming
Converting Percent Nonconforming to Cpk
Step 1. Calculate:
1.0 −PecentNonconfor min g
(100)
This is the Z-Score curve area that will be used to obtain the Z-Score percentage point from
the normal tables.
Step 2. Using the standard normal tables as the quantity obtained in Step 1, obtain the Z-
Score
Step 3. Convert the Z-Score to the equivalent Cpk
C pk
=Z − Score
3
The long term process percent nonconforming (and long term process yield) is
the bottom line result sought in a process capability study.
Process yield information can be converted into dollars, the ultimate management tool for
assessing a company’s competitive position. With good process capability indices, the
product is being produced with virtually zero nonconforming.
8/7/2019 process capability 1_noPW
http://slidepdf.com/reader/full/process-capability-1nopw 11/16
© Don Winton 1999 ---- 8500_CPU:Desktop Folder:CPK.DOC
Page 11 of 16 © Don Winton 1999 Revision Date: 01/08/99
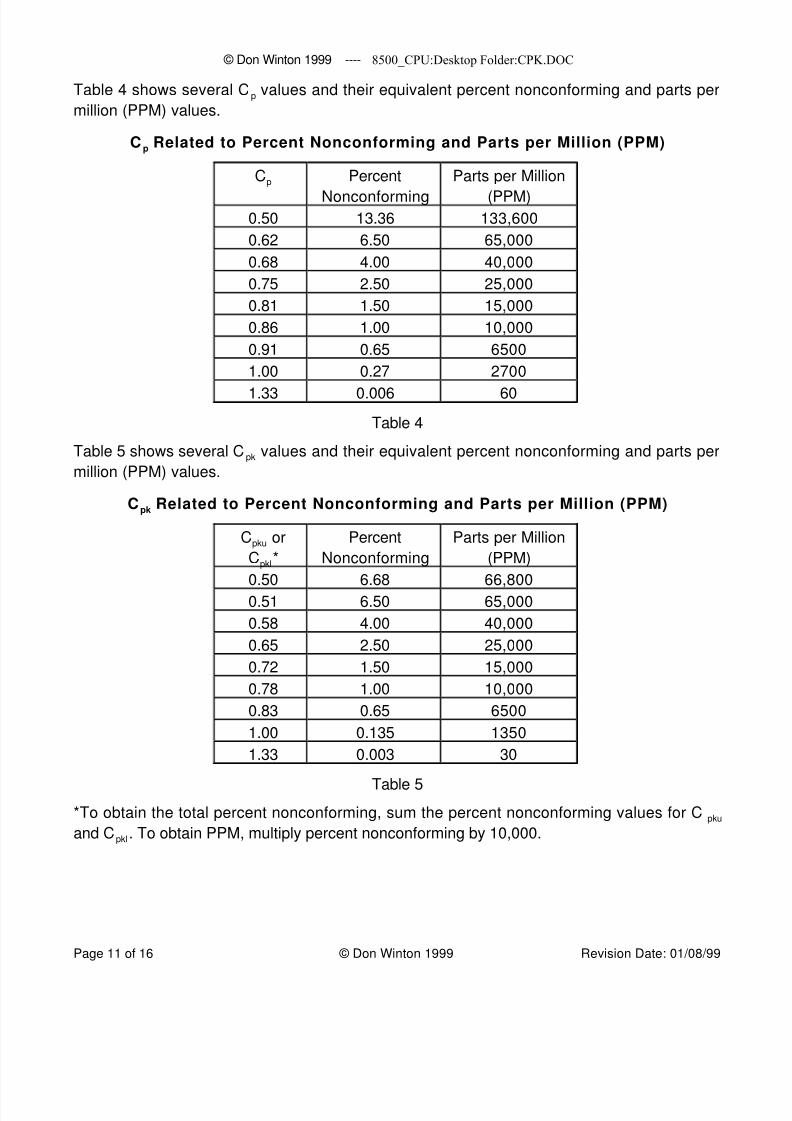
Table 4 shows several Cp values and their equivalent percent nonconforming and parts per
million (PPM) values.
C p Related to Percent Nonconforming and Parts per Million (PPM)
Cp Percent
Nonconforming
Parts per Million
(PPM)0.50 13.36 133,600
0.62 6.50 65,000
0.68 4.00 40,000
0.75 2.50 25,000
0.81 1.50 15,000
0.86 1.00 10,000
0.91 0.65 6500
1.00 0.27 2700
1.33 0.006 60
Table 4
Table 5 shows several Cpk values and their equivalent percent nonconforming and parts per
million (PPM) values.
Cpk Related to Percent Nonconforming and Parts per Million (PPM)
Cpku or
Cpkl*
Percent
Nonconforming
Parts per Million
(PPM)
0.50 6.68 66,800
0.51 6.50 65,000
0.58 4.00 40,000
0.65 2.50 25,000
0.72 1.50 15,000
0.78 1.00 10,000
0.83 0.65 6500
1.00 0.135 1350
1.33 0.003 30
Table 5
*To obtain the total percent nonconforming, sum the percent nonconforming values for Cpku
and Cpkl . To obtain PPM, multiply percent nonconforming by 10,000.
8/7/2019 process capability 1_noPW
http://slidepdf.com/reader/full/process-capability-1nopw 12/16
© Don Winton 1999 ---- 8500_CPU:Desktop Folder:CPK.DOC
Page 12 of 16 © Don Winton 1999 Revision Date: 01/08/99
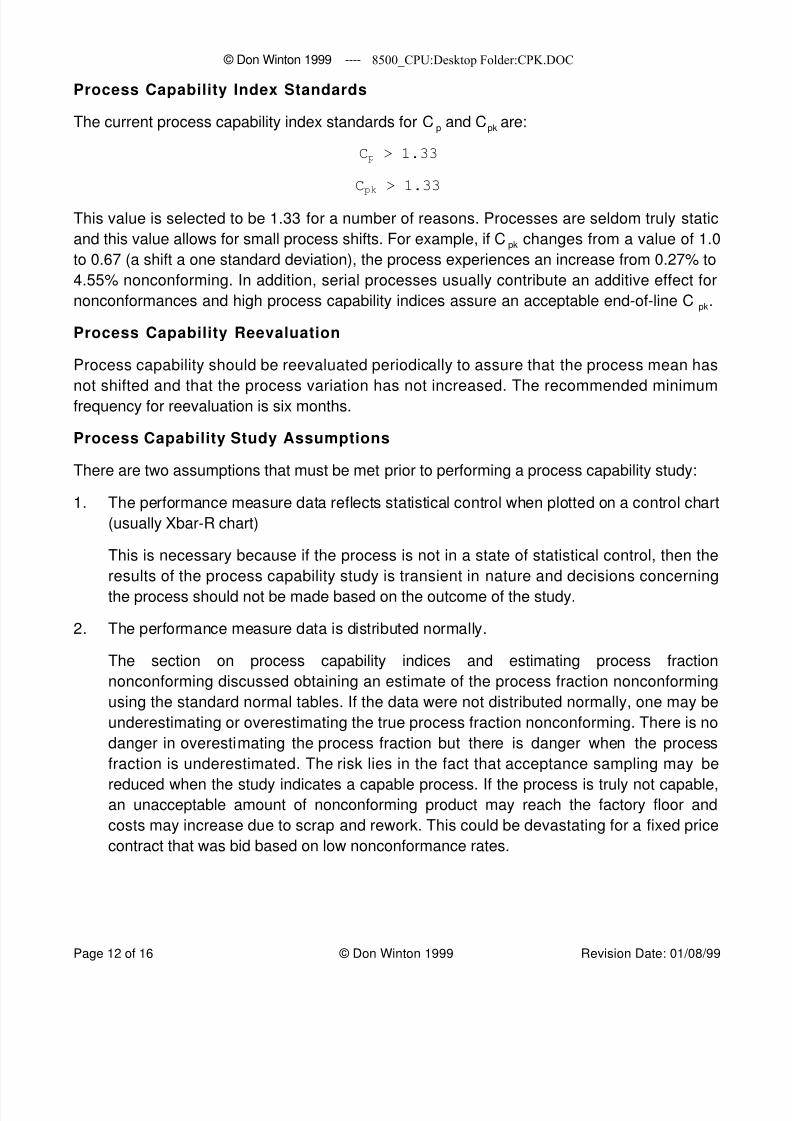
Process Capability Index Standards
The current process capability index standards for Cp and Cpk are:
Cp > 1.33
Cpk > 1.33
This value is selected to be 1.33 for a number of reasons. Processes are seldom truly static
and this value allows for small process shifts. For example, if Cpk changes from a value of 1.0
to 0.67 (a shift a one standard deviation), the process experiences an increase from 0.27% to
4.55% nonconforming. In addition, serial processes usually contribute an additive effect for
nonconformances and high process capability indices assure an acceptable end-of-line Cpk.
Process Capability Reevaluation
Process capability should be reevaluated periodically to assure that the process mean has
not shifted and that the process variation has not increased. The recommended minimumfrequency for reevaluation is six months.
Process Capability Study Assumptions
There are two assumptions that must be met prior to performing a process capability study:
1. The performance measure data reflects statistical control when plotted on a control chart
(usually Xbar-R chart)
This is necessary because if the process is not in a state of statistical control, then the
results of the process capability study is transient in nature and decisions concerning
the process should not be made based on the outcome of the study.
2. The performance measure data is distributed normally.
The section on process capability indices and estimating process fraction
nonconforming discussed obtaining an estimate of the process fraction nonconforming
using the standard normal tables. If the data were not distributed normally, one may be
underestimating or overestimating the true process fraction nonconforming. There is no
danger in overestimating the process fraction but there is danger when the process
fraction is underestimated. The risk lies in the fact that acceptance sampling may be
reduced when the study indicates a capable process. If the process is truly not capable,an unacceptable amount of nonconforming product may reach the factory floor and
costs may increase due to scrap and rework. This could be devastating for a fixed price
contract that was bid based on low nonconformance rates.
8/7/2019 process capability 1_noPW
http://slidepdf.com/reader/full/process-capability-1nopw 13/16
© Don Winton 1999 ---- 8500_CPU:Desktop Folder:CPK.DOC
Page 13 of 16 © Don Winton 1999 Revision Date: 01/08/99
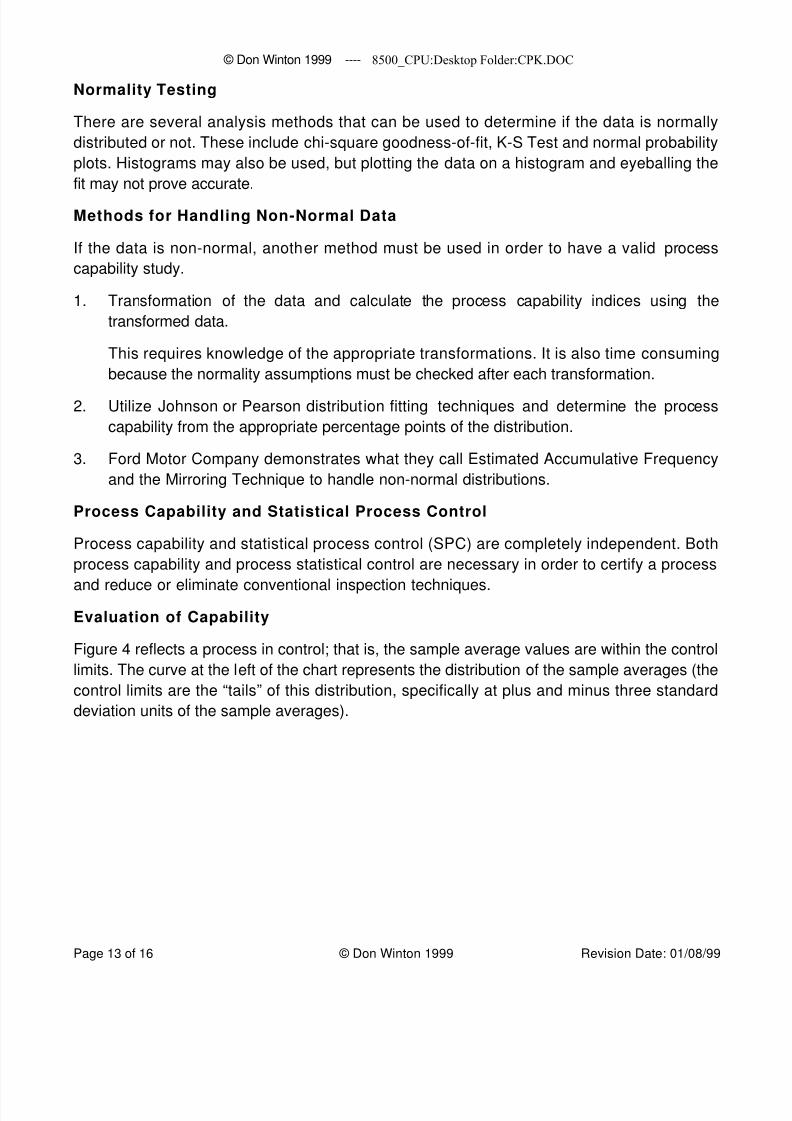
Normality Testing
There are several analysis methods that can be used to determine if the data is normally
distributed or not. These include chi-square goodness-of-fit, K-S Test and normal probability
plots. Histograms may also be used, but plotting the data on a histogram and eyeballing the
fit may not prove accurate.
Methods for Handling Non-Normal Data
If the data is non-normal, another method must be used in order to have a valid process
capability study.
1. Transformation of the data and calculate the process capability indices using the
transformed data.
This requires knowledge of the appropriate transformations. It is also time consuming
because the normality assumptions must be checked after each transformation.
2. Utilize Johnson or Pearson distribution fitting techniques and determine the process
capability from the appropriate percentage points of the distribution.
3. Ford Motor Company demonstrates what they call Estimated Accumulative Frequency
and the Mirroring Technique to handle non-normal distributions.
Process Capability and Statistical Process Control
Process capability and statistical process control (SPC) are completely independent. Both
process capability and process statistical control are necessary in order to certify a process
and reduce or eliminate conventional inspection techniques.
Evaluation of Capability
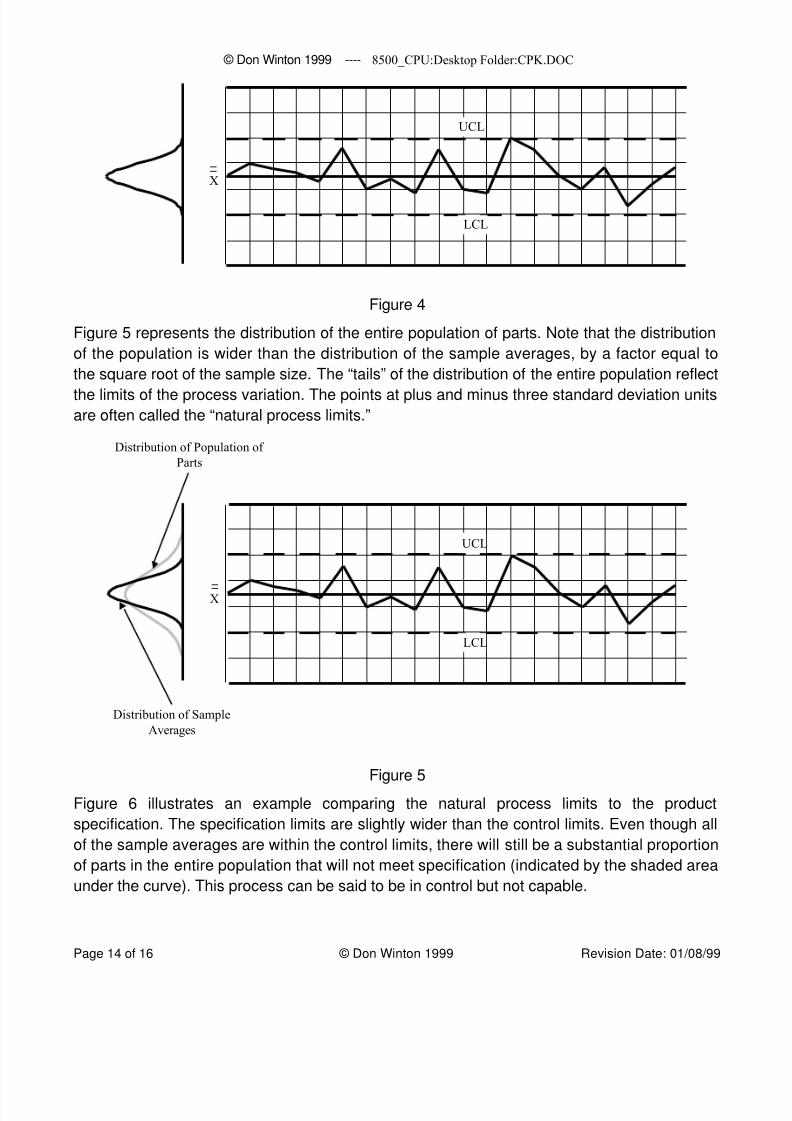
Figure 4 reflects a process in control; that is, the sample average values are within the control
limits. The curve at the left of the chart represents the distribution of the sample averages (the
control limits are the “tails” of this distribution, specifically at plus and minus three standard
deviation units of the sample averages).
8/7/2019 process capability 1_noPW
http://slidepdf.com/reader/full/process-capability-1nopw 14/16
© Don Winton 1999 ---- 8500_CPU:Desktop Folder:CPK.DOC
Page 14 of 16 © Don Winton 1999 Revision Date: 01/08/99
X
UCL
LCL
Figure 4
Figure 5 represents the distribution of the entire population of parts. Note that the distribution
of the population is wider than the distribution of the sample averages, by a factor equal to
the square root of the sample size. The “tails” of the distribution of the entire population reflect
the limits of the process variation. The points at plus and minus three standard deviation unitsare often called the “natural process limits.”
X
UCL
LCL
Distribution of Population of
Parts
Distribution of Sample
Averages
Figure 5
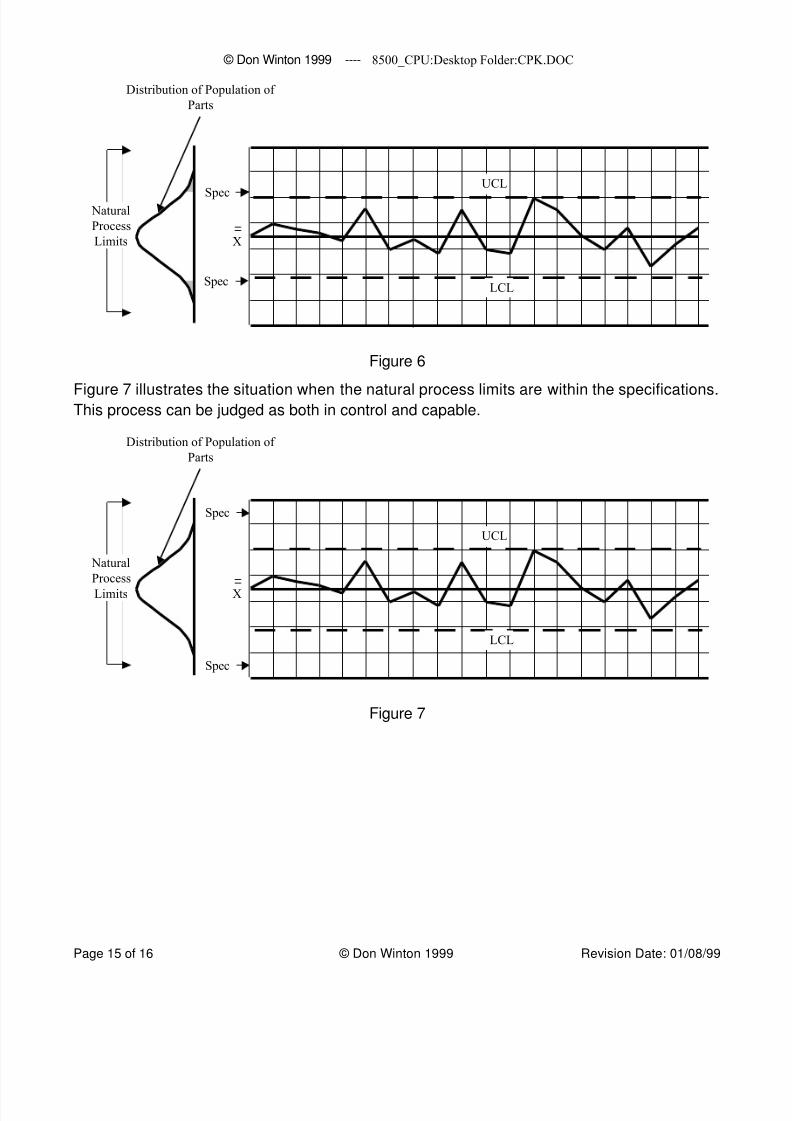
Figure 6 illustrates an example comparing the natural process limits to the product
specification. The specification limits are slightly wider than the control limits. Even though all
of the sample averages are within the control limits, there will still be a substantial proportion
of parts in the entire population that will not meet specification (indicated by the shaded area
under the curve). This process can be said to be in control but not capable.
8/7/2019 process capability 1_noPW
http://slidepdf.com/reader/full/process-capability-1nopw 15/16
© Don Winton 1999 ---- 8500_CPU:Desktop Folder:CPK.DOC
Page 15 of 16 © Don Winton 1999 Revision Date: 01/08/99
Spec
Spec
X
UCL
LCL
Distribution of Population of
Parts
Natural
Process
Limits
Figure 6
Figure 7 illustrates the situation when the natural process limits are within the specifications.This process can be judged as both in control and capable.
Spec
Spec
X
UCL
LCL
Distribution of Population of
Parts
Natural
Process
Limits
Figure 7
8/7/2019 process capability 1_noPW
http://slidepdf.com/reader/full/process-capability-1nopw 16/16
© Don Winton 1999 ---- 8500_CPU:Desktop Folder:CPK.DOC
Page 16 of 16 © Don Winton 1999 Revision Date: 01/08/99
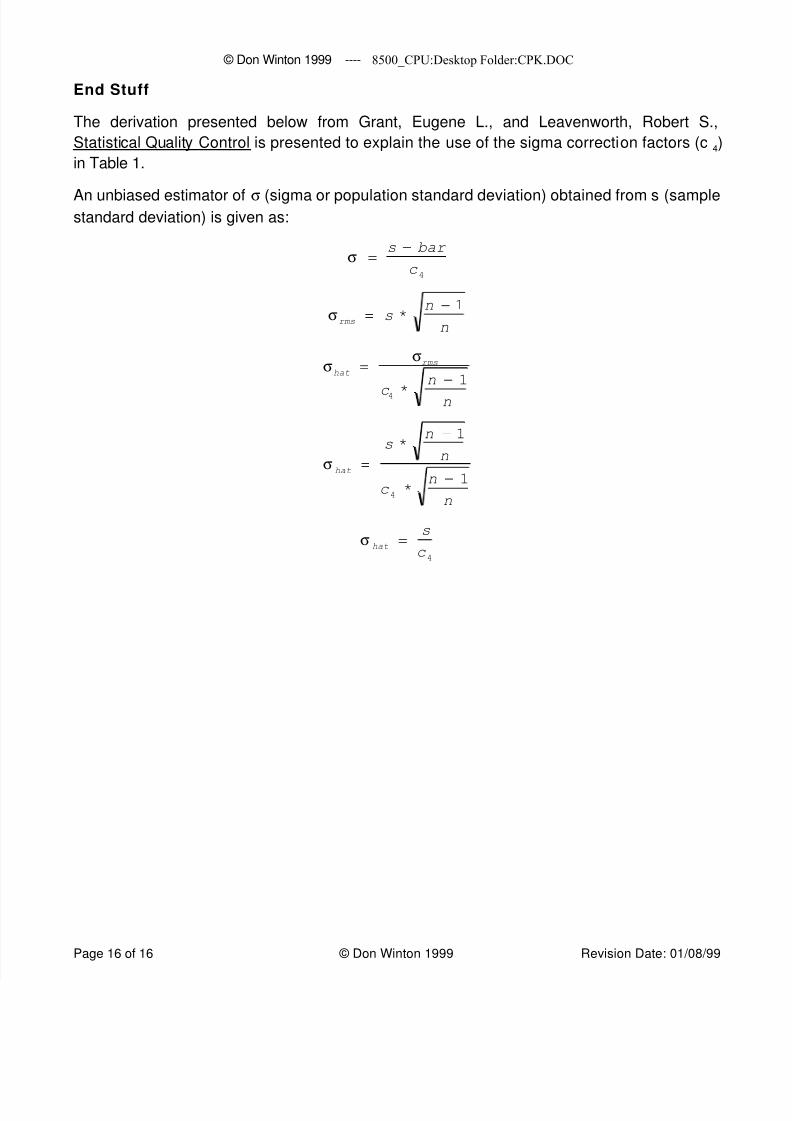
End Stuff
The derivation presented below from Grant, Eugene L., and Leavenworth, Robert S.,
Statistical Quality Control is presented to explain the use of the sigma correction factors (c4)
in Table 1.
An unbiased estimator of σ (sigma or population standard deviation) obtained from s (samplestandard deviation) is given as:
σ =s − bar
c4
σrms
= s *n − 1
n
σhat
=σrms
c4 *
n − 1
n
σhat
=
s *n − 1
n
c4*
n − 1
n
σhat
=s
c4