production harding public - az659834.vo.msecnd.net
TRANSCRIPT

The Impact of EV policy on the New Zealand Power System
A retro-analysis
1

Team
Authors:
• Patricio Gallardo • BSc. Mech Eng
• MEng. Sustainable Energy
• Daniel Bishop• BE(Hon) Mech Eng
Supervisory Team:
• Prof. Susan Krumdieck (Mechanical Engineering)
• Prof. Rua Murray (Mathematics and Statistics)
2
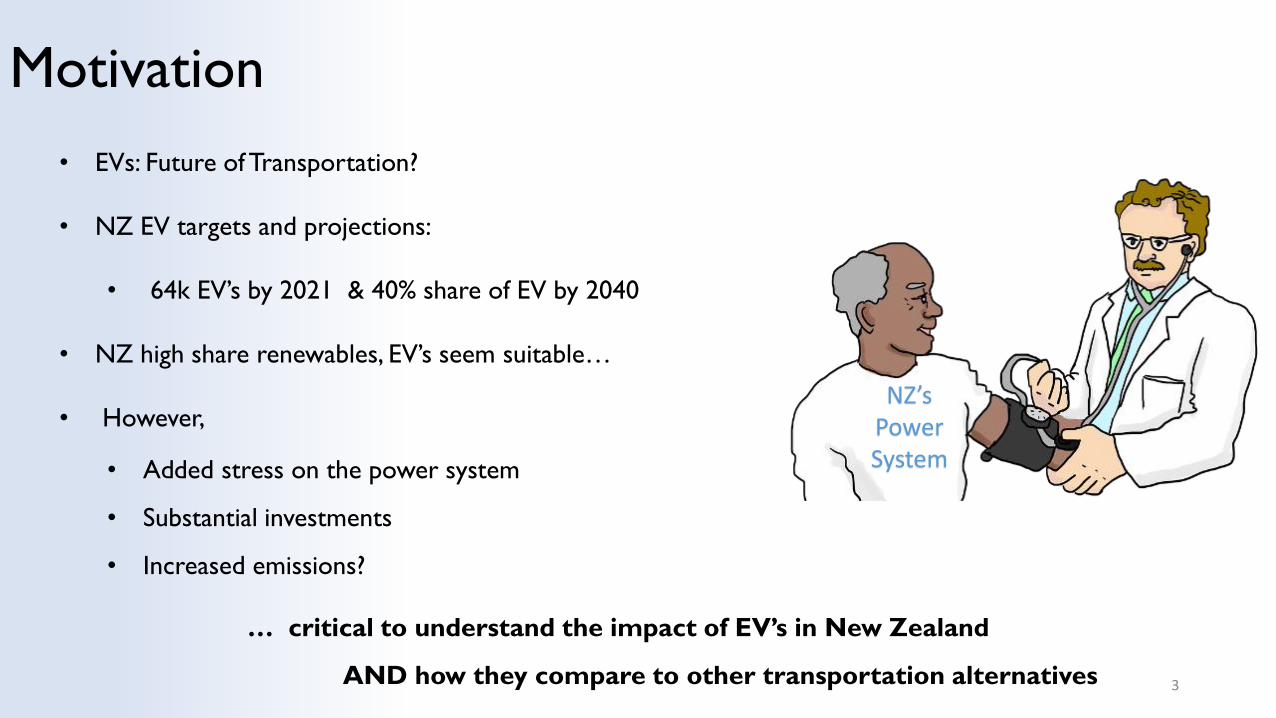
Motivation
3
NZ’s Power System
• EVs: Future of Transportation?
• NZ EV targets and projections:
• 64k EV’s by 2021 & 40% share of EV by 2040
• NZ high share renewables, EV’s seem suitable…
• However,
• Added stress on the power system
• Substantial investments
• Increased emissions?
… critical to understand the impact of EV’s in New Zealand
AND how they compare to other transportation alternatives

Two Stories: Norway vs. Thailand• Norway world leaders in EV adoption (2.7%
total fleet)
• Fiscal incentives (VAT & VRT)
• High oil prices
• Cheap (mostly renewable) electricity
• Reduced emissions (with grid capacity expansion)
• 53% EV share - 35% reduction in emissions
• Utilities warning of higher capacity vehicle charging
• Low share of EV’s, charging can affect grid stability
4
• Thailand (electricity ~20% renewable)
• Modelling in for Thailand predicts higher GHG emissions with EV’s.
• Emissions from EV’s is highly dependent on grid composition.
As large load (EV charging) added to the grid the source of
electricity may change, Simple calculation from current grid data
(grid-emission factor) not adequate modelling required
Source: Holtsmark and Skonhoft (2014)
Source: Bjerkan, Nørbech and Nordtømme (2016)

Research Questions
1. What is the impact of EVs on an unmodified grid?Power system performance and emissions
2. What is the impact of added EV with an upgraded power system?Power system performance and emissions
3. How does this compare to other transportation strategies
5

Key concepts
Reserve margin & peak power
6
Direct and indirect emissions
0
10
20
30
40
50
60
70
80
90
100
0 30 60 90 120 150 180 210 240 270 300 330 360
Ava
ilab
ility
(%
)
Day
Hydroelectric
Wind
Geothermal

Key Concepts: Retro-Analysis
• Models an energy system in a year where
there is known data:
• Transportation demand
• Electricity sector performance (supply, demand,
availability)
• Fuel reserves
• Emission data (Model validation)
• Impose changes
• Avoids speculating of future demand or
availability
7
THIS ANALYSIS:
Base year is 2012 due to availability of
transport activity and grid composition data.

Method
• Energy Planning software used to simulate
complex energy systems
• Countries power and transportation
systems
• Industry standard (researchers and consultants)
• Build a model of energy system given…
• Transportation activity
• Energy intensities
• Power plant specifications
… uses the model to calculate the response of
potential interventions on demand, transmission or
supply8
Sankey Diagram: NZ Energy Balance
Shows transformation from raw resource to end use
Datasets (2012 base year)
Fuel Reserves Energy Statistics (MBIE)
Transmission and Distribution losses Energy Statistics (MBIE)
Power Plants (capacity and availability) Electricity Authority
Electricity, Gas, Oil demand Energy Balance (MBIE)
Sector electricity consumption profiles Electricity Authority
Transportation Activity Ministry of transport, Freight Demand Study
Performance of Power Generation
Technologies and Costs
Multiple Sources, scientific literature

Method: Scenarios – Four parameters
9Source: Arias and Bae (2016)
% of EV’s
EV ChargingBehaviour
Grid Composition
Transport Alternatives
Level of ICE to EV replacement & EV charging behavior
• Two levels of ICE to EV replacement
1. Government target 64,000 EV by 2021, (2.3% light vehicle fleet)
2. MOT projects a 40% replacement by 2040
• Two charging EV charging strategies (power system very sensitive to charging strategy)
1. Whole fleet charging load over 8 off peak-hours (11pm – 7am)
2. Whole fleet charging load over 3 off peak-hours (11pm – 2am)

Method: Scenarios – Four parameters
10
0
2000
4000
6000
8000
10000
12000
14000
MW
Hydro
Wind
Geothermal
Thermal Coal
Thermal Natural Gas
Thermal Diesel
Wood
Thermal Biogas
Solar
MBIE’s Mixed Renewables Scenario
% of EV’s
EV ChargingBehaviour
Grid Composition
Transport Alternatives
Modifications to power system
• Emissions from EV’s are highly dependent on grid composition
• should look proposed additions or modifications to the power system
• Mixed renewable scenario from the MBIE report was modelled
• Believed to be the most realistic scenario.
• Note: increase of wind power capacity which comes with its own challenges…

Method: Scenarios – Four parameters
11Source: Watcharasukarn, Page and Krumdieck (2012)
% of EV’s
EV ChargingBehaviour
Grid Composition
Transport Alternatives
Transportation Alternatives (benchmark the effects of EV’s)
• 40% shift to bus transportation
• 40% VKT reduction due from behavioral change
• Adaptive capacity: capability of transportation reduction from behavioral change while maintaining essential activites
• With existing resources and infrastructure
• Useful measure of resilience to energy crisis

Results
• Current reserve margin (RM) is at a critical (-2.3%).
• load shedding
• 64k EV (2.3% ) likely tolerated
40% ICE to EV replacement
• Not facilitated by current grid (RM -7 to -13.6%)
• With more EV’s, charging behavior greater impact on
RM.
• Emissions:
• Small reductions in total (3.2%)
• Embedded emissions from batteries
• (estimated at 1.1 – 1.8% emissions)
• Total ~1.7% reduction
12
Scenario Designation
Reserve Margin (%)
Peak Power (MW)
% from BASE
Energy Demand (PJ)
% from BASE
GHG Emissions (MT CO2e)
% from BASE
BASE -2.3 6,696 - 540 - 33.02 -
EV2-8h -2.5 6,710 0.2% 539 -0.3% 32.98 -0.1%
EV2-3h -2.5 6,710 0.2% 539 -0.3% 32.98 -0.1%
EV40-8h -7.0 7,030 5.0% 510 -5.6% 31.97 -3.2%
EV40-3h -13.6 7,573 13.1% 510 -5.6% 31.97 -3.2%
What is the impact of EVs on an unmodified grid?

Results
40% ICE to EV replacement
• Large increase in RM due to added capacity
• Results sensitive to charging strategy (5.1 –
13.2%)
• Decreases in total emissions
• Upgraded grid without EV’s 25% reduction
• With EV’s 32%
• Isolated effect of EV’s = 7.2%
• Considering battery embedded emissions ->
5.7% reduction
• Added capacity from wind
• Not best for handling peak power to
intermittency 13
Scenario Designation
Reserve Margin (%)
Peak Power (MW)
% from BASE
Energy Demand (PJ)
% from BASE
GHG Emissions (MT CO2e)
% from BASE
BASE -2.3 6,696 - 540 - 33.02 -
MR-EV40-8h 13.2 7,030 5.0% 510 -5.6% 22.36 -32.3%
MR-EV40-3h 5.1 7,573 13.1% 510 -5.6% 22.36 -32.3%
MR 18.8 6,696 - 540 - 24.73 -25.1%
0
5
10
15
20
25
30
35
Mill
ion
To
nn
es C
O2
e
Residential
Commercial
Industry and Agriculture
Transport
What is the impact of added EV with an upgraded power system?

Results
14
• 40% pkm shift to bus (proven technology) (5.1%) reduction in emissions
• as effective as EV (5.1% vs. 5.7%)
• No impacts on peak power requirements or reserve margin
• No investments required for grid functionality.
• Feasible with existing infrastructure (Adaptive Capacity)
How does this compare to other transportation strategies?
Scenario Designation
Reserve Margin (%)
Peak Power (MW)
% from BASE
Energy Demand (PJ)
% from BASE
GHG Emissions (MT CO2e)
% from BASE
BASE -2.3 6,696 - 540 - 33.02 -
MT40 -2.3 6,696 - 516 -4.5% 31.35 -5.1%
AC40 -2.3 6,696 - 501 -7.4% 30.18 -8.6%
MR-EV40-8h 13.2 7,030 5.0% 510 -5.6% 22.36-32.3% (5.7%)
Better CO2/$ Return?

Additional Remarks: Energy Costs
• Transport & Electricity production
Not included:
• EV vehicles & battery replacement
• Transmission, distribution or metering infrastructure.
Included:
• Capital Ex for generation
• Maintenance
• Fuel consumption for whole system
• Cost of in-action
• Exhaustion of reserves
• Dependence on fuel imports
• Trends
• Transportation alternatives:
• Lower total cost (even with other considerations)
• Less NR use & no increased CAPEX & OPEX
• EV scenarios
• With grid enhancement (GE) = increased CAPEX & OPEX
• Without GE = similar to alternatives (non functional grid)
• Lower NR
0.00
2000.00
4000.00
6000.00
8000.00
10000.00
12000.00
Mill
ion
NZD
Transformation\Electricity Generation
Resources\Secondary
Resources\Primary

Additional Remarks: V2G or the “Smart-Grid”
• Distributed Energy Storage
• To Improve power supply
• To integrate of intermittent generation (wind)
• Modelling results:
• Improved reserve margin
• Higher total energy expenditure
• Higher emissions
• May play a role BUT…
• Economic Feasibility
• Max profit at high frequency trading
• Enhanced battery degradation
• Technical challenges
• Comms and infrastructure
• Availability to grid
• Competing battery requirements (SoC)
• Better than other storage?16

Additional Remarks: Lithium Supply
• Lithium availability
• Is there enough Lithium?
• Can it be produced fast
enough?• Metals are finite resources, their deposits
are limited either physically, technically, or economically.
• Model: family of arbitrary curves, area encompass available recoverable resources and bounded by a maximum depletion rate.
• Can it be recycled?
• ~2%
17
Source: Vikstrom, Davidsson and Hook (2013)

Conclusions
• Uncoordinated charging or poor storage strategies may do substantial damage to the functionality of the grid.
• Future research should explore the costs associated with added grid and EV charging infrastructure, so the full costs of
these policy decisions may be evaluated.
• Strategies involving multiple pathways (EV’s, electric rail etc.) should be combined and analyzed to explore what multi-
pronged solutions have the best fit for NZ.
• Economic feasibility of V2G in NZ should be assessed
• The availability and production rate of lithium is a critical factor for the uptake of EV’s as Lithium is the likely battery
technology for these cars.
18
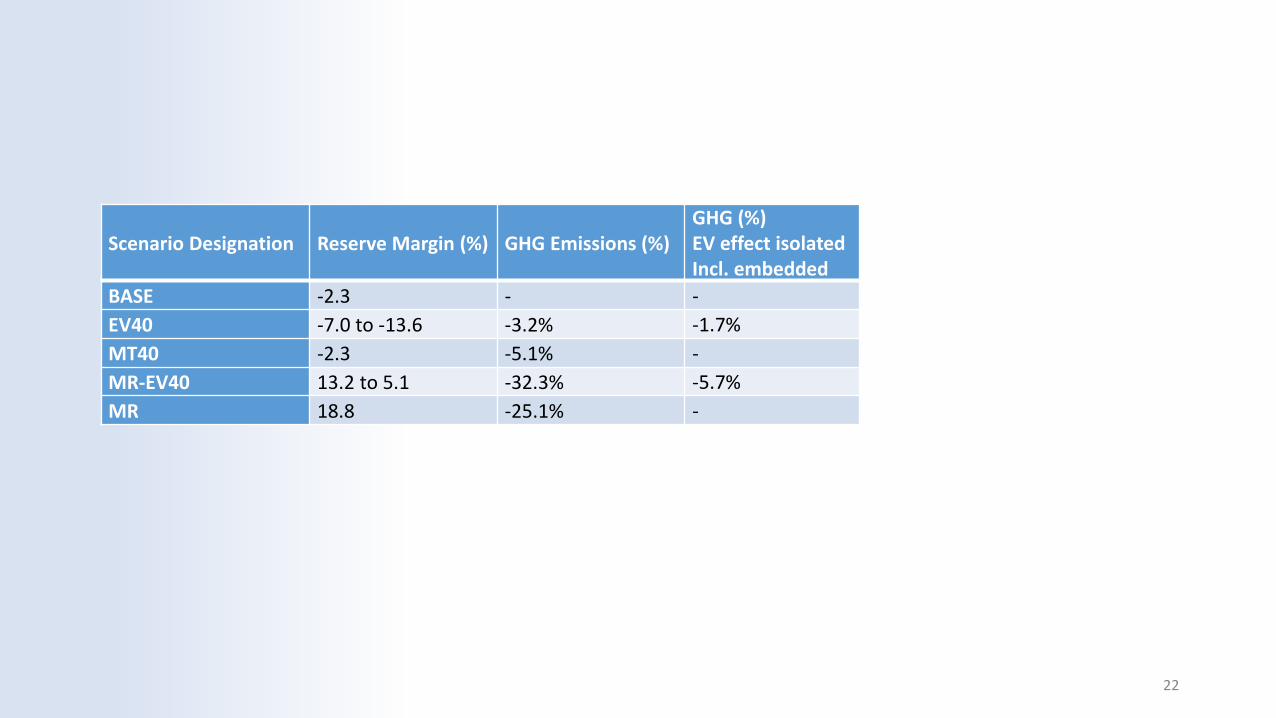
Scenario Designation Reserve Margin (%) GHG Emissions (%) GHG (%)EV effect isolatedIncl. embedded
BASE -2.3 - -
EV40 -7.0 to -13.6 -3.2% -1.7%
MT40 -2.3 -5.1% -
MR-EV40 13.2 to 5.1 -32.3% -5.7%
MR 18.8 -25.1% -

References
• Arias, MB & Bae, S 2016, 'Electric vehicle charging demand forecasting model based on big data technologies', Applied Energy, vol. 183, pp. 327-39, 10.1016/j.apenergy.2016.08.080.
• Bjerkan, KY, Nørbech, TE & Nordtømme, ME 2016, 'Incentives for promoting Battery Electric Vehicle (BEV) adoption in Norway', Transportation Research Part D: Transport and Environment, vol. 43, pp. 169-80, https://doi.org/10.1016/j.trd.2015.12.002.
• Electricity Authority 2018, Electricity in New Zealand, viewed 2/19/2019, <https://www.ea.govt.nz/about-us/media-and-publications/electricity-nz/>.
• Figenbaum, E 2017, 'Perspectives on Norway's supercharged electric vehiclepolicy policy', Environmental Innovation and Societal Transitions, vol. 25, pp. 14-34, <<Go to ISI>://WOS:000417610800002>.
• Heaps, CG 2016, Long-range energy alternatives planning (LEAP) system.[Software version 2018.1.20]. , MA (USA): Stockholm Environment Institute Somerville.
• Holtsmark, B & Skonhoft, A 2014, 'The Norwegian support and subsidy policy of electric cars. Should it be adopted by other countries?', Environmental Science & Policy, vol. 42, pp. 160-8, https://doi.org/10.1016/j.envsci.2014.06.006.
• Ministry for the Environment 2018, New Zealand's Greenhouse Gas Inventory 1990-2016, Wellington, New Zealand, <http://www.mfe.govt.nz/sites/default/files/media/Climate%20Change/National%20GHG%20Inventory%20Report%201990-2016-final.pdf>.
• Ministry of Business Innovation and Employment 2012, New Zealand's Energy Outlook Electricity Insight, ISSN 1179-4011.
• Ministry of Transport 2017, Transport Outlook: Future State, Ministry of Transport, <transport.govt.nz/transportoutlook>.
• Peterson, SB, Whitacre, JF & Apt, J 2010, 'The economics of using plug-in hybrid electric vehicle battery packs for grid storage', Journal of Power Sources, vol. 195, no. 8, pp. 2377-84, <<Go to ISI>://WOS:000273914300032>.
• Raugei, M, Hutchinson, A & Morrey, D 2018, 'Can electric vehicles significantly reduce our dependence on non-renewable energy? Scenarios of compact vehicles in the UK as a case in point', Journal of Cleaner Production, vol. 201, pp. 1043-51, 10.1016/j.jclepro.2018.08.107.
• Uddin, K, Dubarry, M & Glick, MB 2018, 'The viability of vehicle-to-grid operations from a battery technology and policy perspective', Energy Policy, vol. 113, pp. 342-7, 10.1016/j.enpol.2017.11.015.
• Vikstrom, H, Davidsson, S & Hook, M 2013, 'Lithium availability and future production outlooks', Applied Energy, vol. 110, pp. 252-66, <<Go to ISI>://WOS:000321601900024>.
• Watcharasukarn, M, Page, S & Krumdieck, S 2012, 'Virtual reality simulation game approach to investigate transport adaptive capacity for peak oil planning', Transportation Research Part A: Policy and Practice, vol. 46, no. 2, pp. 348-67, https://doi.org/10.1016/j.tra.2011.10.003.
• Winyuchakrit, P, Sukamongkol, Y & Limmeechokchai, B 2017, 'Do Electric Vehicles Really Reduce GHG Emissions in Thailand?', Energy Procedia, vol. 138, pp. 348-53, https://doi.org/10.1016/j.egypro.2017.10.137.
19

Thank you!
Questions?
20

Results for all Scenarios
21
Scenario Designation
Reserve Margin (%)
Peak Power (MW)
% from BASE
Energy Demand (PJ)
% from BASE
GHG Emissions (MT CO2e)
% from BASE
BASE -2.3 6,696 - 540 - 33.02 -EV2-8h -2.5 6,710 0.2% 539 -0.3% 32.98 -0.1%EV2-3h -2.5 6,710 0.2% 539 -0.3% 32.98 -0.1%EV40-8h -7.0 7,030 5.0% 510 -5.6% 31.97 -3.2%EV40-3h -13.6 7,573 13.1% 510 -5.6% 31.97 -3.2%MT40 -2.3 6,696 - 516 -4.5% 31.35 -5.1%AC40 -2.3 6,696 - 501 -7.4% 30.18 -8.6%MR-EV40-8h 13.2 7,030 5.0% 510 -5.6% 22.36 -32.3%MR-EV40-3h 5.1 7,573 13.1% 510 -5.6% 22.36 -32.3%MR 18.8 6,696 - 540 - 24.73 -25.1%
22
Scenario Designation Reserve Margin (%) GHG Emissions (%) GHG (%)EV effect isolatedIncl. embedded
BASE -2.3 - -
EV40 -7.0 to -13.6 -3.2% -1.7%
MT40 -2.3 -5.1% -
MR-EV40 13.2 to 5.1 -32.3% -5.7%
MR 18.8 -25.1% -