projecting the u.s. population to 2050 -...
TRANSCRIPT

A R e p o r t b y t h e F e d e r a t i o n f o r A m e r i c a n I m m i g r a t i o n R e f o r m
Projecting the U.S. Population to 2050:Four Immigration Scenarios
by Jack Martin and Stanley Fogel
March 2006

Projecting the U.S. Population to 2050:Four Immigration Scenarios
Projecting the U.S. Population to 2050: Four Scenarios 1
Projecting the U.S. Population to 2050:Four Immigration Scenarios
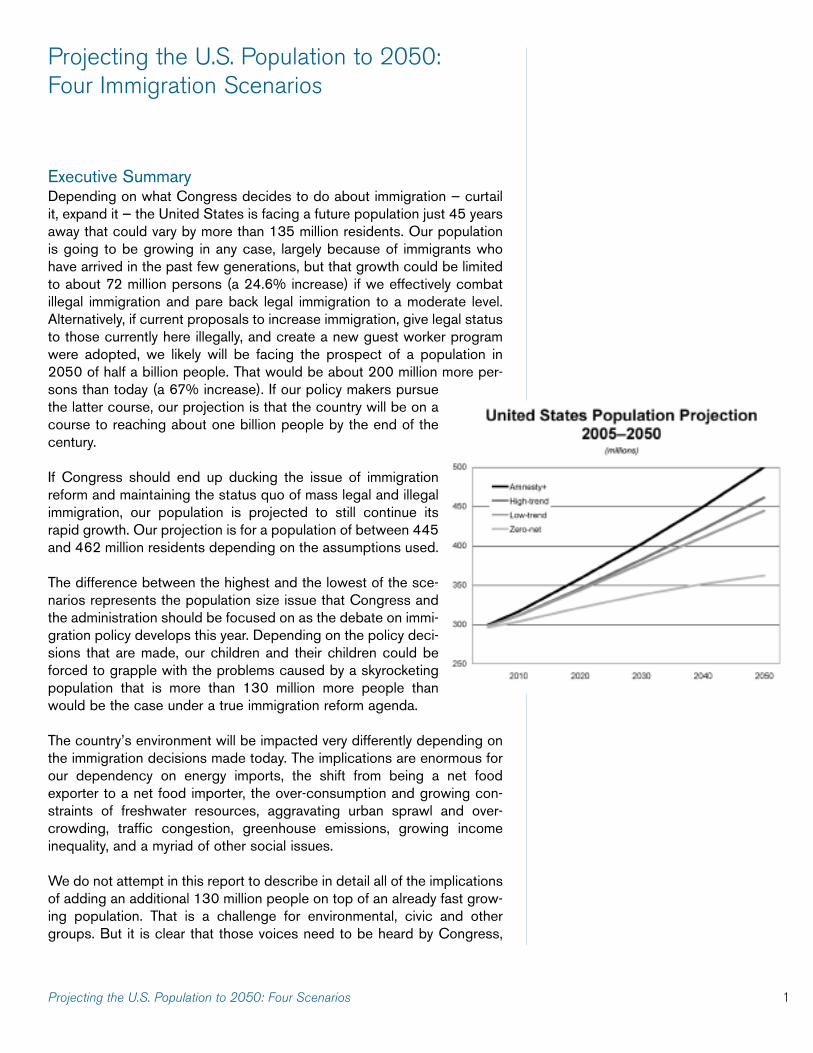
Executive SummaryDepending on what Congress decides to do about immigration — curtailit, expand it — the United States is facing a future population just 45 yearsaway that could vary by more than 135 million residents. Our populationis going to be growing in any case, largely because of immigrants whohave arrived in the past few generations, but that growth could be limitedto about 72 million persons (a 24.6% increase) if we effectively combatillegal immigration and pare back legal immigration to a moderate level.Alternatively, if current proposals to increase immigration, give legal statusto those currently here illegally, and create a new guest worker programwere adopted, we likely will be facing the prospect of a population in2050 of half a billion people. That would be about 200 million more per-sons than today (a 67% increase). If our policy makers pursuethe latter course, our projection is that the country will be on acourse to reaching about one billion people by the end of thecentury.
If Congress should end up ducking the issue of immigrationreform and maintaining the status quo of mass legal and illegalimmigration, our population is projected to still continue itsrapid growth. Our projection is for a population of between 445and 462 million residents depending on the assumptions used.
The difference between the highest and the lowest of the sce-narios represents the population size issue that Congress andthe administration should be focused on as the debate on immi-gration policy develops this year. Depending on the policy deci-sions that are made, our children and their children could beforced to grapple with the problems caused by a skyrocketingpopulation that is more than 130 million more people thanwould be the case under a true immigration reform agenda.
The country’s environment will be impacted very differently depending onthe immigration decisions made today. The implications are enormous forour dependency on energy imports, the shift from being a net foodexporter to a net food importer, the over-consumption and growing con-straints of freshwater resources, aggravating urban sprawl and over-crowding, traffic congestion, greenhouse emissions, growing incomeinequality, and a myriad of other social issues.
We do not attempt in this report to describe in detail all of the implicationsof adding an additional 130 million people on top of an already fast grow-ing population. That is a challenge for environmental, civic and othergroups. But it is clear that those voices need to be heard by Congress,

2
not just the voices of business interests that seek access to additional for-eign workers and ethnic advocacy groups that seek to increase the flowof co-ethnic immigrants.
The effects of immigration impact different areas of the country and statesdifferently. To assist our members across the country and their electedrepresentatives in assessing the effects on their state from potential immi-gration changes, our projections show the different population size thatwould likely result under the different scenarios for each state.

Projecting the U.S. Population to 2050: Four Scenarios 3
IntroductionThe population of the United States is growing and changing rapidly. Thistrend is largely because of the current massive flow of immigrants — bothlegal and illegal. With proposals now on the table from the BushAdministration and members of Congress to further increase immigration,it is important to consider the implications of those proposed changes forour nation.
The American public recently has been reminded of looming problemsassociated with resource limitations. For example, we are now warnedthat today’s high gasoline prices may continue and may go still higherbecause of our dependence on imports and greater international compe-tition for dwindling reserves.
We also face the prospect of increasing competition for access to freshwater resources as our population increases. These and other nationalenvironmental concerns such as urban sprawl, unhealthy air quality, trafficcongestion and diminishing wetlands add to the need for Americans tostop and think about population issues.
To assist in an informed consideration of the issues related to policies thatwould result from immigration policy changes currently being proposed,we offer below a 45-year projection of the United States population basedon current demographic trends. We also offer alternative immigration sce-narios that demonstrate the differences in the rate of population changethat could result from different public policy decisions. These populationprojections have been developed for each state individually and thenaggregated for the country as a whole.
If there is no major change in immigration law or enforcement, we projectthat by 2050 the country will have a population of 445 to 462 million peo-ple — 147 to 163 million more people than in 2005. This projection alsoindicates that about 33 million of the increase will come from people whowere in the country in 1970 and their descendants. Another 32 million ofthis increase will be from post-1970 immigrants who are already in thecountry and the children born to them after their arrival. That leaves themajority of the increase resulting from the post-2005 continuinglegal and illegal immigration — 50 to 62.5 million additional legalresidents and 32.6 to 36.7 million additional illegal residentsrespectively.2
If the current proposals for some form of amnesty for illegalaliens, a new guest worker program and an increased level ofimmigration were adopted, our rate of population increase wouldbe still higher, i.e., adding a further 39 million residents by 2050.
If, on the other hand, effective measures to deter illegal immigra-tion are adopted and legal immigration categories and/or limitsare reduced to a moderate level, the rate of population increasecould be slowed, and, over time, population stability could beachieved.
“I read articles about water andenergy shortages or traffic con-gestion, and they miss theunderlying driving force of pop-ulation growth.” 1
—Bill Elder, Ph.D., DirectorOffice of Social and
Economic Data Analysis, University of Missouri-St. Louis

In this population projection discussion, we will not go into the position ofsome environmental scientists that the United States is already over-pop-ulated from the perspective of the long-term ‘carrying capacity’ of our nat-ural heritage. That perspective argues for policies aimed not at stabilizingthe U.S. population but, rather, at policies that would allow a declining pop-ulation until it reached a level that would be sustainable over the long term.
It is a mistake to assume that population change is immutable. The level ofimmigrant admissions has been steadily increased since 1965 by variouslegislative measures. As an example of the changing population dynamics,the average number of babies born to women during their reproductiveyears, i.e., the total fertility rate (TFR), has decreased as the United Stateshas become more urban and women have entered the workforce in greaternumbers. Just since 1950 the TFR has decreased from 3.0 to 1.8 in 1980and has risen again to about 2.1 in 2000. This current level would meanthat the U.S. population would be near stabilization if it were not for theaddition to the population from immigration. Immigration — both legal andillegal — is subject to public policy, i.e., the limits on legal immigration canbe changed by law, and immigration law enforcement can be lessened orincreased.
The Past as PrologueThe United States has gone through cycles of high immigration and lowimmigration. During the first two decades of the past century, immigrantadmissions averaged nearly 727,000 new ‘green card’ holders each year.As a reaction to and rejection of this high level of immigration, the countryadopted in the early 1920s a more restrictive admissions policy based onnational quotas. The average level of immigration for the half centurybetween 1920 and 1970 was just slightly higher than 230,000 personsper year.
The current massive wave of immigrant admissions began as the result ofthe Immigration Act of 1965 that ended the national quotas system. Sincethe 1965 change took place, immigration has steadily grown to nearly amillion persons per year. And, that does not count the illegal immigrationthat currently adds an additional about half a million persons to our popu-lation each year. Contributing to this current wave of immigration havebeen increased ceilings adopted in 1990, a major increase in refugee andother humanitarian admissions, and the adoption of a broad amnesty forillegal aliens in 1986 and other mini-amnesties for Cubans, Haitians,Central Americans and others.
The significance of the 1965 Immigration Act is not just that it launched anew surge in immigrant admissions but also that it radically changed thecomposition of legal immigration to allow a shift of the flow from Europeanimmigrants to immigrants from Asian and Latin American countries. Thisshift is important to a focus on future trends in the U.S. population to theextent that depending on where they come from, immigrants have differentimpacts on the population depending on their average family size. In gen-eral, immigrants tend to have larger families than the native-born popula-tion, but this varies by country of origin.
4 Federation for American Immigration Reform
“The most powerful engine ofethno-racial diversification inthe history of any nation, thislaw [the 1965 Immigration Act]constitutes one of the greatturning points of Americanhistory.”
—Peter Schuck, Yale Law Professor
Managing Diversity, 2003

Projecting the U.S. Population to 2050: Four Scenarios 5
“We disagree with those whowould label efforts to controlimmigration as being inherentlyanti-immigrant. Rather, it isboth a right and a responsibilityof a democratic society tomanage immigration so itserves the national interest.”
—Barbara Jordan, former Congresswoman,
constitutional law professor andChair, U.S. Commission on
Immigration Reform8
“We have looked for, and havenot found, any convincingeconomic argument forcontinued population growth.The health of our country doesnot depend on it, nor does thevitality of business nor thewelfare of the average person.”
—Report of the Commission on Population Growth and the
American Future, 1972
A recent report by the Center for Immigration Studies found that immi-grant women from the top ten source countries of current immigrationhave an average of 2.9 children, which is not only half-again higher thanthe average for native-born women, it is also nearly a quarter higher thanaverage birth rates in their native countries. In part, this higher birth rate isaccentuated as a result of illegal immigration. Women illegally present inthe United States have an average of 3.1 children, whereas legal immi-grant women have an average of 2.6 children.3
Current Demographic DynamicsAt present, immigration and births to immigrants after their arrival accountfor about four-fifths of the country’s annual population increase. This esti-mate is derived from a calculation that new immigration and births to immi-grants already here account for about 2.3 million of the estimated annualaverage increase in our population since 2000 of about 2.87 million per-sons.4 Because immigration is the largest factor in population dynamicsand is discretionary, it is the primary factor to be focused on in any exam-ination of population policy.
As may be seen in a data display that disaggregates our current popula-tion into those who are foreign-born, those who are other immigrant stock5
(meaning U.S.-born offspring of immigrants), and other native-bornAmericans, both of the immigration-related population components aregrowing rapidly while the non-stock, native-born population is leveling off.6
This demonstrates the major impact that immigration has had on popula-tion change through 2000.
In 1969, President Nixon made a major address on population in which henoted, “Only recently has it come to be seen that pressing problems arealso posed for advanced industrial countries when their populationsincrease at the rate that the United States, for example, must now antici-pate. Food supplies may be ample in such nations, but social supplies —the capacity to educate youth, to provide privacy and living space, to main-tain the processes of open, democratic government — may be grievouslystrained.”7 This message presaged the development of societal effects ofcrowding that, inter alia, have led to the coining of terms such as “roadrage,” “smog” and “urban sprawl.”
In 1972, a two-year study by a joint presidential-congressional commis-sion with representatives of major corporations, unions, environmentalorganizations, and urban, ethnic, and women’s groups recommendedfreezing immigration at its then-current level of about 400,000 a year aspart of a national population policy.
The U.S. Commission on Immigration Reform, chaired by the late BarbaraJordan, a former member of Congress from Texas and a law school pro-fessor, recommended in the mid 1990s that legal immigration be signifi-cantly restructured and reduced and that extensive measures be adoptedto diminish illegal immigration. Though illegal immigration recommenda-tions were acted on in 1996, the recommended reforms to legal immigra-tion were largely shelved, and have been left to gather dust.

Now, rather than acting to reduce immigration, as public opinion pollshave shown to be desired by a strong majority of Americans,9 PresidentBush has proposed increasing immigration as well as increasing thenumber of guest workers admitted to take American jobs each year.10
Legislation has been introduced in Congress to not only increase legalimmigration and guest workers, but also to offer legal work status orpermanent residence — amnesty — to those now residing illegally in thecountry.
Advocates of increased immigration include national ethnic groups thathave seen the size of their co-ethnic population increase dramaticallysince the pivotal change in the immigrant admissions system adopted in1965. Since 1970 the Asian population has soared from 2.9 million to10.5 million residents. During that period, 7.4 million immigrants from Asiawere admitted for legal residence, accounting for virtually all of theincrease. During the same period, the population identifying itself asHispanic increased from 8.7 million to 35.3 million, and, in the process,surpassed blacks as the nation’s largest minority. During that period, immi-gration from the Western Hemisphere other than Canada (including
Mexico, all of Central and South America, Cuba and theDominican Republic as well as a few non-Hispanic countries,such as Haiti, Jamaica and Guyana) totaled about 9.7 millionadmissions.12 Thus legal immigration during this period repre-sented about 35 percent of the increase in the Hispanic popu-lation. Illegal immigration from these same countriescontributed nearly as large a share of the increase, so that thecombined immigration effect explains most of the increase inthe Hispanic population.
During the three decades from 1970 to 2000, the U.S. popula-tion increased by 39 percent. Over the same period the Asianpopulation increased by 236 percent and the Hispanic popula-tion increased by 305 percent. Besides legal and illegal immi-gration, the rapid rise of these populations also results from thehigher birth rates noted above.
A Questionable FutureAs our focus shifts to future population trends, we note that populationprojections depend upon the assumptions that underlie them. The CensusBureau issued a population projection in February 1996 that included alow, middle, and high projection. The three projections each incorporateddifferent assumptions regarding fertility, life expectancy and net immigra-tion. The middle scenario used an assumption of net immigration at820,000 additions per year, while the low and high projections usedassumptions of 300,000 and 1,370,000 per year respectively. There werealso different assumptions regarding fertility and life expectancy for eachof the alternative projections. The high 2050 projection was for a popula-tion of 518.9 million residents; the low projection was for 282.5 millionpeople; and the middle projection — the one considered most likely — wasfor 393.9 million persons.
6 Federation for American Immigration Reform
“This is a sensitive issue, butreducing immigration levels is anecessary part of population sta-bilization and the drive towardsustainability.”
—President’s Council on Sustainable Development, 199611
“It’s difficult to make predictions— particularly about the future.”
— Yogi Berra

Projecting the U.S. Population to 2050: Four Scenarios 7
The 1996 projection also included an immigration stability pro-jection (zero-net immigration) that used the mid-range assump-tions for fertility and for life expectancy but with immigrationbalancing emigration for a zero-net increase to the populationfrom immigration. The difference between the Census Bureau’scurrent trend projection and the zero-net projection in 2050was 79.8 million fewer residents if immigration were not fuelingthe increase.
In January 2000 — before the 2000 Census data were col-lected — the Census Bureau released a new projection for a fullcentury in the future. That projection offered a vast range froma high of nearly 1.2 billion residents in 2100 to a low of about283 million. The mid-level projection was for a population in2100 of 571 million persons. The difference was, naturally, aresult of the difference in the assumptions used. The highestprojection used an increasing total fertility (from 2.059 to2.737) and an increasing average life expectancy (from 74.1 years for menand 79.8 years for women to 92.3 years for men and 95.2 years forwomen). The immigration assumptions were for a net addition from about1.2 million to over 3 million persons each year. The mid-range projectionswere for fertility to increase moderately, and the low projection had fertil-ity decreasing. The mid-range life expectancy had the average for malesincreasing to 88 years and to 91.8 years for women, while in the low pro-jection average male life expectancy also increased, but to 85 years andfor females to 89.3 years. The immigration assumptions in the mid-rangeprojection were for a varying rate that began at 954,000 per year,decreased to 912,000 by 2025, then increased to 984,000 by 2050, andthen decreased again to 926,000 per year to 2100. The low projectionhad a major drop-off in immigration from 739,000 at the start to 183,000followed by 169,000, and 117,000 net additions per year.
This projection also included an immigration stability projection (zero-net)in which it was assumed that immigration would match emigration. Theassumption also used the mid-range assumptions for fertilityand life expectancy. The resulting projection was for a signifi-cantly lower population than the mid-range projection, but notas low as the low projection because of the latter’s assump-tions of much lower fertility and life expectancy.
We show the 2000 projection only out as far as the year 2050because that is the range of our new projection, but it shouldbe kept in mind that it is not inconceivable that our populationcould reach one billion residents as early as 2090, if theassumed immigration levels and other high assumptions wereto occur.
What should be learned from this projection is that the differ-ence in population in 2050 between the mid-level and the immi-gration stability projections is 76.1 million residents. Rememberthat the immigration stability projection is not based on zero

immigration but, rather, on having immigration at a low level where it bal-ances emigration.
The 2000 Census Bureau projection was updated in March 2004because the 2000 Census revealed that the assumed size of the 2000U.S. population — upon which the projection had been based — wasunderestimated by about 6.8 million persons. A minimal revision wasissued for the mid-level projection that raised the population starting pointfor the findings of the 2000 Census. This projection update also slightlydecreased the fertility assumption and slightly increased the immigrationassumption (from 912,000 to 996,000 in 2025 rising in 2050 from984,000 to 1,097,000).
The resulting mid-level projection for 2050 by the Census Bureau is for apopulation of 419.9 million residents. This projection raises the mid-levelpopulation projection in 2050 by 17.6 million people from the projectionfour years earlier.
The Census Bureau has often underestimated the rate of increase in theU.S. population in the mid-level projection, and subsequent projectionshave adjusted the projection higher. If this pattern holds true, we canexpect the next projection of the Census Bureau to reflect a still highermid-range projection for 2050 than the 420 million residents projected in2004.
Why it Matters: Less Space, More Diversity In the 2000 Census, more than 13 million residents said they had arrivedto live in the United States since 1990 — an average increase of more than1.3 million per year. Those who avoided being counted because they werehere in violation of the law would add additional millions. Nearly 18 per-cent of those who were counted said they spoke a language other thanEnglish at home, and nearly half of them acknowledged that they spokeEnglish “less than very well.”
As the immigrant population surges, income inequality increaseswith both the well-off and the poor increasing and the middle-class shrinking.13 Increasingly, low-skilled American workers arelosing jobs to foreign workers willing to work for lower wages,and wage rates are falling or stagnating in those sectors of theeconomy so that American workers become less able to supporta family.14
In 2005, the United States may have become a net food importerfor the first time in 44 years.15 As the population expands andfood needs increase, the country is steadily paving over produc-tive crop lands to provide housing, schools, hospitals, job sites,retail outlets and for other uses. We are already dependent onimports of petroleum to keep our cars running, our factories hum-ming and for producing the fertilizers that produce our crops.Every year as our population increases and our imports grow tokeep up, we become more dependent on foreign suppliers.
8 Federation for American Immigration Reform
“The environmental messes wesee all around us are onlysymptoms of the real cause —way too many people in manyparts of the country, and alooming tidal wave ofoverpopulation that threatens toswamp any hope that our great-grandchildren will enjoy the kindof outdoors pursuits we do. …Doyou think we could continue tomaintain the kind of wildlifehabitat we have now if thedemand for living space forpeople were to double? Do youthink the best efforts atcontrolling air and water pollutioncan do more than slow the rateof degradation?”
—Eric Sharp, sports columnist,“Overpopulation is the real culprit,”
Detroit Free Press, January 21, 2006
From an environmental perspective, the addition of 135million people to today’s U.S. population of some 300million over the next 45 years would be extremelydestructive because population size is the majordeterminant of environmental impact.
It would be of more than just domestic concern becauseU.S. population size and consumption have a largerglobal effect than that of people anywhere else, animpact currently greater than that of China and Indiacombined! Our cars and industrial processes causesome 30 percent of all greenhouse gases responsiblefor global warming, climate change and increasingly-destructive weather events. And the U.S. is the majorcontributor of the gases which cause thinning of theprotective stratospheric ozone layer.
Up close, considering “environment” as our immediatesurroundings, it’s obvious that the increase would bringmore congestion, delays, crowding, public expenditurefor additional needed infrastructure and faster depletionof finite resources like coal, oil, gas and mineralcommodities which would affect people through higherprices.
While humans can adapt to change relatively quickly,plants and animals generally cannot. So, the impact onecosystems and even on inanimate systems like glacierswould be far greater than the impact on people.
But a 45% increase in U.S. population, within a time-frame about three-fifths of an average U.S. lifetime, is solarge and so fast that, even for humans, adjustmentwould not be easy.
While our concerns are global, an environmental focuson the U.S. makes sense.
1.) The U.S. is our habitat. We want to maintain itsnatural endowments for future generations. 2.) U.S.population is growing, albeit needlessly, at a far fasterrate than that of any other large industrialized nation. 3.)The U.S. is looked upon as an example by many ThirdWorld nations whose citizens equate our populationgrowth with economic success.
Our population growth impacts other species mainlythrough competition for habitat and food. It impactsinanimate Nature through increasing use of topsoil,pasture, forest and waters, often in irreversible ways likewind- and water-erosion, salinization, coastal salt-waterintrusion, desertification and pre-empting of lands andwaters through paving, mining, drilling, damming, over-pumping of ground- and surface-water sources,draining of wetlands, siltation and air and waterpollution, particularly toxic pollution.
The environmental impact of a rapid 45% increase inU.S. population, today due mainly to a continuingImmigration Boom, the highest numbers in Americanhistory, would be greater than the considerable impactof the post-WWII Baby Boom, a 65% jump over a 40-year span, occurring when our population was some125 million, less than half today’s.
That earlier population surge had an enormous impacton urbanization, growth in energy demand, and inexpansion of highways and other infrastructure,encouraging sprawl. It ushered in new concerns aboutpollution, smog, acid rain and nuclear accidents.
Today the Boom would be starting from not only a muchlarger U.S. population number but also a much-depletednatural base. U.S. population is already so large thatmany water supplies are no longer being renewednaturally at a sustainable rate. Air pollution is endemic inurban and industrial areas and downwind from them.Even Grand Canyon, Great Smoky and other NationalParks are impacted! Less than half of America’s watersare fishable and swimmable. Even the Great Lakes areseriously polluted, particularly from heavily-populatedareas like many others where expenditure for sewagetreatment and overflow-prevention facilities have notkept up with population growth. In efforts to meet thedemand for fossil fuel, minerals and timber, natural areasare increasingly encroached upon and exploited. Ouroverpopulation has put some 1,000 U.S. plant andanimal species on the threatened and endangered list.Some of them have already been rendered extinct.
Today’s unsustainable U.S. population growth is mainlythe result of adoption by Congress and theAdministration of outdated 19th Century-era massimmigration, pre-environmental-preservation policies.These policies, among other effects, subsidize andencourage larger than replacement family size. They arethe antithesis of an environmental perspective thatrecognizes that long-term sustainable population size islimited by the essential ecosystem services that Naturecan provide renewably. Our population growth hasexceeded that limit since the 1950s. Therefore,government policies which directly or indirectlyencourage further increase in U.S. population areirresponsible, rob the future, and must be rejected.
—Alan Kuper, Ph.D., is an environmental commentator,founder and President of CUSP (Comprehensive
Sustainable U.S. Population), and a member of theFAIR Board of Advisors.
AN E NVI RON M E NTAL PE R S PECTIVE

10 Federation for American Immigration Reform
Our leaders have gotten the nation on a dangerous treadmill. As our pop-ulation surges — fueled by immigration — the real estate industry insists itneeds more foreign workers to build homes for the growing population,more schools have to be built to accommodate the children who areincreasingly the children of immigrants, shortages of teachers and nurses— especially ones who speak foreign languages — are asserted as a rea-son to hire additional foreign workers. And these additional foreign work-ers need places to live, so the treadmill grinds inexorably onward.
The Changing Composition of the PopulationAlthough the current Census Bureau projection is out of date, its findingsare worth noting as a prelude to describing the results of our projection.As noted above, the racial/ethnic composition of the population is under-going rapid change as the population increases. This change is due bothto the effects of immigration and larger average family size. Another effecton the population is in the age structure, as a result of the fact that thelargest share of immigrants entering the country are already adults.
The Census Bureau’s 2004 mid-level projection indicates the white (non-Hispanic) population will account for a decreasing share of thepopulation increase over the 50-year period. From constitutingone-fifth (20.1%) of the increase between 2000 and 2010, theshare steadily drops to zero for the 2040-50 period. TheHispanic population has a steadily rising share of the populationincrease: from 45.5 percent of the 2000-10 populationincrease to more than half of the increase (53.6%) at the end ofthe projection. Blacks have a fairly constant population share,accounting for 13.4 percent at first and ending up with 12.9percent in 2050. Asians, like Hispanics, have a steadily risingshare of the projected population change: from 13.1 percent atfirst, then rising to 19.3 percent for 2040-50. Finally, persons inthe “Other” category, which includes American Indians,Eskimos, Aleuts, and those who assert multiple race, rise from7.8 percent of the population to 14.3 percent, largely due toincreased multiple race identification.
In 2050, according to this Census Bureau projection, whites(non-Hispanic) will constitute just barely over half (50.1%) of the popula-tion, Hispanics will constitute nearly one-quarter (24.4%), and non-Hispanic blacks will be half the size of the Hispanic population (12.2%),while Asians will be 8 percent and others will constitute 5.3 percent.These changes in the relative size of the different racial/ethnic groups area factor of both different rates of immigration and different rates of fertility.When either or both of these factors change, the relative change betweenthe races/ethnic groups is also subject to change.
Population Effects of Immigration FAIR’s projection of the nation’s population between now and 2050 isdesigned to demonstrate the relationship between immigration and itseffect on population change at a time when Congress is considering amajor change in immigration policy.
Projecting the U.S. Population to 2050: Four Scenarios 11
A description of the population effects of continuity or change in immigra-tion policy at the national level follows. Then we provide projections for thestates and for the District of Columbia. In developing the national projec-tion, we have simply summed the separate projections for the states andthe District of Columbia. In brief, the following effects may be seen fromthe state projections.
If the U.S. continues its current trend of immigration-fueled rapid popula-tion increase, two states — Nevada and Arizona — are projected to morethan double their population over the next 45 years — nearly tripling in thecase of Nevada. Another 16 states are projected to experience a morethan 50 percent increase in population. Those states, in order of largestto smallest change, are: California, Texas, Colorado, Florida, Georgia,Utah, Idaho, Washington, New Jersey, Oregon, North Carolina,Massachusetts, Maryland, New Mexico, Delaware and Virginia.Washington, D.C. also falls in this category. An additional 21 states areprojected to have an increase of more than 20 percent in their populationby 2050. That would leave just 11 states with moderate populationchange.
If, on top of the current trend, proposals for a new guest worker programand amnesty for current illegal alien workers were adopted along with anincrease in immigration, Nevada is projected to more than triple its popu-lation (242%), and an additional two states would be added to those hav-ing more than a doubling in population, i.e., California and Texas. Threeadditional states would move into the ranks of those projected to havemore than a 20 percent increase in population, i.e., Iowa, Vermont andMississippi. This would shrink the remaining number of states with moder-ate population growth to 8.
However, if legislation were adopted to effectively combat illegal immigra-tion and to reduce legal immigration to more moderate levels, the numberof states projected to experience huge population increases woulddecrease. Nevada would still more than double its population (136%), butit would be the only state with hyper-growth. The only other state thatwould still have more than a 50 percent growth rate would be Arizona.16
There would still be 20 states projected to have more than a 20 percentincrease in population, but in all cases a much lower level than withoutimmigration reduction. In descending order of increase, they are: Idaho,Colorado, Texas, Utah, Georgia, Florida, North Carolina, South Carolina,California, Delaware, Washington, Oregon, New Mexico, Alaska,Tennessee, Rhode Island, Maryland, Massachusetts, Virginia and NewHampshire. That would leave 28 states with moderate growth or nearpopulation stability. Most importantly, the groundwork would be in placefor a gradual slowing of national population growth to a stable level.
First we provide summary data for each decade, beginning with 2010.Following the sections describing the national and the state projections isan appendix that describes in detail the methodology used in arriving atthese projections.
“The ecosystem doesn’t needanother 300 million consumingAmericans. I’m just appalled thatthe environmental movement, inits political correctness, doesn’ttake on this question of how bigwe want to be.”
—Dick Lamm, formerColorado Governor
dailycamera.comJan. 23, 2006.

Total Population by CohortThe United States population in mid-2005 stood at about 295 million. Ifillegal immigration were effectively curbed and legal immigration werereduced to a moderate level, our population would increase to about 362million persons in the year 2050. This is our immigration stability or zero-net scenario.
With legal and illegal immigration continuing at current levels, the 2050population would increase to between 445 and 462 million persons,depending on the assumptions used. That constitutes an increase of 49to 55 percent above the 2005 population.
Adoption of proposed immigration changes for an amnesty, new guestworker program and increases in legal immigrant admissions would pushthe projected population up to slightly more than 500 million residents.
The wedge diagram to the left shows the dramatic effect on population ofpost-1965 immigration and its continuation for the first half of the century.
This chart is based on the high assumption for continuing legaland illegal immigration and the increase currently being pro-posed.
The great failure of the environmental movement of the early1970s was the failure to induce U.S. policy makers to follow therecommendation of leading environmentalists by reducing netimmigration to a level close to zero. Had immigration beenreduced in 1970 to a replacement level,17 the total populationwould be fewer than 250 million residents in 2050 — 47 millionfewer than today. The population would still be rising, but the rateof increase would be decreasing toward leveling off. That wouldlead to population stability. But, as a result of immigration since1970, our population in 2005 is 47 million higher than it wouldhave been without mass immigration, and, because of the higherfertility rate of the post-1970 immigrant population, that cohort isprojected to continue to add another nearly 34 million residentsover the next 45 years.
If legal immigration continues at its current rate of increase, it is projectedto add nearly an additional 63 million residents to our population over thenext 45 years — including the children born to those immigrants.Continuing illegal immigration is projected to add about an additional 37million residents over the next 45 years, including the children born tothose illegal immigrants.
Finally, the projection shows the combined population effects of currentproposals for an amnesty for illegal alien residents, a new guest workerprogram, and increased admission levels for legal immigrants. Thosemeasures are projected to add a further nearly 39 million people to thecountry’s population by 2050.
12 Federation for American Immigration Reform

Projecting the U.S. Population to 2050: Four Scenarios 13
Change in Ethnic CompositionThe ethnic composition of the United States has rapidly changedas a result of the 1965 changes in immigration policy. It will con-tinue to be rapidly changed by the continuation of that policy, and,if immigration is increased, as currently proposed, the U.S. popu-lation will be even more rapidly altered.
The chart to the right shows the close to replacement level fertil-ity of non-Hispanic whites. This population segment is projectedto increase slightly (10%) over the next 45 years assuming con-tinuing legal and illegal immigration and an amnesty/guest workeraugmentation of population growth.
The Mexican immigrant and heritage segment of the populationshows the greatest increase (by 345%). This increase is fueledby ongoing legal and illegal immigration, the effects of an amnesty/guestworker program, and by the larger family size of Mexican immigrants.
Other Hispanic immigrants and their offspring are projected to rise overthe next 45 years by 206 percent — from about 17 million to about 52 mil-lion residents. The rapid increase in this population segment also is fueledby amnesty, illegal immigration, family size and continuing legal immigra-tion.
The black population, whose size is less influenced by immigration, is pro-jected to increase by almost 66 percent. The difference in the rate ofincrease between blacks and non-Hispanic whites is largely a factor of dif-ferent fertility rates.
The Asian population is projected to also increase rapidly over the next 45years, i.e., from 14.4 million to nearly 45 million. That would be an increaseof 213 percent. Most of that increase would result from continuing large-scale legal immigration from Asian countries, but some of the increasealso results from illegal immigration and higher fertility ratesamong some nationality groups in the Asian immigrant popula-tion.
While our focus is on the size of the population increase result-ing from immigration, it should be noted that the social capital ofthe immigrants is also an issue of concern. All studies of the char-acteristics of recent immigrants note a difference between legalimmigrants, refugees and illegal immigrants. Illegal immigrantstend in general to have lower levels of education and skills thanall but high school dropouts among native-born Americans. As aresult they tend to compete for jobs with our most vulnerable cit-izens. As a result of the large number of amnestied illegal aliensin our society, some of whom obtain U.S. citizenship, under ourcurrent immigration law we may expect an increasing flow of fam-ily sponsored immigrants who have similarly low levels of educa-tion and skills.

The amnesty proposal currently being urged on Congress would incorpo-rate 11-13 million illegal aliens who generally are poorly skilled and putthem on the path to becoming able to sponsor extended family membersfor immigration. Similarly, a new guest worker program, besides creatingadditional competition with American workers for low-end jobs, wouldtend to bring into the country persons with many of the same characteris-tics as today’s influx of illegal immigrants.
So, beyond focusing on the number of immigrants being proposed foradmission as permanent members of our society, policy makers shouldalso give careful thought to the long-term effects on social cohesion, theworkforce of tomorrow and the likelihood that many of these guest work-ers are unlikely to go home at the end of a supposedly temporary periodof work in our country.
By contrast, if an immigration stability (net-zero) policy were adopted, theresults would be very different. This policy, which FAIR advocates, is oftendescribed by Hispanic activists as discriminatory against Hispanicsbecause Hispanics currently constitute the largest share of both illegaland legal immigration and would proportionately be reduced the most in acurtailment of legal and illegal immigration. However, the adoption of thestability policy would not change the fact that the Mexican origin and otherHispanic populations would continue to grow rapidly as may be seen inthe zero-migration graphic.
The Mexican ethnic population would still more than double (108%) overthe next 45 years. The other Hispanic population would increase by 84percent and the Asian ethnic population would increase by 25 percent.The black population would increase by 45 percent and the white popu-lation by 6 percent.
Part of this continuing increase would result from the greater than replace-ment level fertility of these population segments, part would come fromcontinuing legal immigration, and part would result from the fact that thepolicies to brake illegal immigration and reduce legal immigration wouldtake time to become wholly operational. Beyond 2050, the trend lineswould be expected to level off towards population stability.
The Need for a National Population PolicyThe United States has no population policy. The closest it comes to sucha policy is an income tax structure that encourages larger families throughreduced obligations for persons with dependent children, educational andchild-care deductions. Child support, welfare programs and school feed-ing programs for needy children — although aimed at benefiting children —also have the effect of reducing the consequences of out-of-wedlockbirths. Similarly, an immigration policy that admits newcomers in numbersthat cause the population to expand is, in effect, a form of de facto popu-lation policy. But, these are ad hoc components of a non-policy, and thereis no over-arching framework within which these programs have beenadopted.
14 Federation for American Immigration Reform
“If you can look into the seedsof time, And say which grainwill grow, and which will not,Speak then to me.”
—William Shakespeare, “Macbeth”

Projecting the U.S. Population to 2050: Four Scenarios 15
Given the advent of ever-growing resource constraints as a real aspect ofAmerica’s future, the nation needs a population policy that considers thecomponents that relate to population size and structure and provides spe-cific guidelines to shape the country’s long-term interests. It should beclear that a population policy must incorporate an immigration policy thatfocuses on the overall size and composition of the flow of immigrants.
By the middle of this century, our projection shows that the population ofthe United States could be half a billion residents, a size once associatedonly with densely populated India and China. The current Census Bureauestimate of 420 million residents by the year 2050 is outdated because ofthe effects of immigration. That underestimate will obviously become morepronounced if currently proposed amnesty provisions are adopted.
If the current trend in immigration is unchanged, or if it is increased, theincremental impact on the environment and resources will be magnified.The implications of those effects on the quality of life, standard of living,increased income inequality, the potential for social conflict, and thepotential erosion of traditional American liberties must be a cause for con-cern for all Americans.
Indeed, the concern should be of such urgency as to lead to a sea changein current policy. The need for strict border control, interior enforcementand an immigration moratorium as part of designing a rationalpopulation/immigration policy should be obvious to all who are not wear-ing blinders.
The Significance of the ProjectionsIt is clearly difficult to second-guess what the nation’s policy makers arelikely to decide with regard to immigration policy. It is, therefore, difficult toidentify the most likely scenario for the nation’s population future at a timewhen Congress is contemplating a major immigration policy change.Nevertheless, it is an abdication of responsibility by the administration notto use the expertise of its demographic experts to chart the populationalternatives that may flow from decisions that lawmakers are being askedto consider at the present time. FAIR, with this population projectionstudy, is addressing this void.
The implications of immigration policy changes are profound not only onthe United States, but also for countries that are the source of large migra-tion flows into our country. Mexico is the chief example. Mexico is the pri-mary source by a large margin of current legal and illegal immigration.Mexico accounted for more than 18 percent of the legal immigrant admis-sions between FY 1993-2002 — about two-and-a-half times as many asfrom India, the second largest source of immigrants over this period.Mexico also accounts for more than two-thirds of the illegal alien popula-tion. Recent polling in Mexico reported by the Pew Hispanic Center indi-cates that 40% of its population, i.e., more than 42 million persons, wouldlike to migrate to the United States, and half of those respondents saidthey were prepared to do so illegally.18 Add the fact that the poll presum-ably was of adults, and the number of uninvited migrants would be still

“In our every deliberation wemust consider the impact of ourdecisions on the next sevengenerations.”
—Iroquois Confederacy Wisdom
higher because of the children they would bring with them. Mexico, likepoorer countries to its south, has increasingly counted on remittancesfrom illegal aliens in the United States as a balance of payments asset andresource that assists impoverished communities.
If the United States were to adopt an immigration stability (zero-net) pol-icy, the results would be beneficial to our country in beginning a processthat would reverse the trend in growing social, environmental and fiscalburden of illegal immigration, and at the same time reverse the growingreliance of migrant source countries on the social and economic benefitsto them from the export of their citizens. It should be noted that the effectsof the change would be both short term, in reducing legal and illegal entryinto the United States, and long term, in decreasing immigration opportu-nities through chain migration and in pressuring the current illegal alienpopulation to return to their home countries.
If, on the other hand, the United States were to adopt an amnesty and anincrease in immigrant and guest worker admissions, the results wouldheighten the environmental, social and fiscal burden on our country whileat the same time accommodating the ability of Mexico and other countriesto alleviate the population pressures from their faster growing populationsand obtain greater benefit from the flow of remittances. The two-edgedsword of remittances is that while they benefit the home countries of themigrants to the United States, they are earnings removed from our econ-omy to its detriment.
Those who tout the idea of a new amnesty/guest worker program claim itwould reduce illegal immigration. But the fact is there are already legalguest worker programs, i.e., those for agricultural workers (H-2A visas)and for unskilled workers (H-2B visas), and those programs have had lit-tle, if any, impact on illegal immigration. This is because hiring illegal work-ers involves less paperwork for employers, avoidance of protectionsrelated to housing and return travel, and because the illegal workers areprepared to work for less. There is no reason to expect any different resultin deterring the hiring of illegal workers from another guest worker pro-gram. In addition, the issue of guest workers is tied into the issue ofamnesty. Proposals for a new guest worker program include a provisionfor them to gain the ability to apply for permanent residence outside ofcurrent limits after several years working as supposedly temporary work-ers.19 That obviously would increase legal immigration.
A guest worker program that is truly temporary would have a populationeffect equal to the number of new entrants — beyond what is alreadyauthorized — times the number of years they could stay. Current propos-als in Congress would confer guest worker status on already present ille-gal workers. Because they are already in the country, the populationimpact could in theory be nil, but practical considerations belie that poten-tiality. No country that has experience with guest worker programs, includ-ing the United States, has found that most guest workers after a numberof years earning higher salaries and becoming used to a more affluentsociety willingly return to their home country. Instead, they regularly
16 Federation for American Immigration Reform

Projecting the U.S. Population to 2050: Four Scenarios 17
become illegal residents and await permanent residence through someform of amnesty. Considering that those who are currently being pro-posed for guest worker status are living and working here illegally, it defieslogic to anticipate that they would voluntarily leave the country after addi-tional years of residence here. Rather, they would likely simply resume ille-gal residence.
ConclusionThe enormous difference between the amnesty/guest worker scenarioand the immigration stability scenario highlights the importance of thedecisions Congress is currently considering as it grapples with immigra-tion reform legislation. The prospect of continuing mass immigration andspeeding toward a population of 445 to 462 million in 2050 — or accel-erating that rate of increase by an amnesty/guest worker plan and addinga further 38 to 55 million residents — is one that should be at the top ofthe agenda of every group in the country that is concerned about theimpact of population on the environment and our society.
Sadly, however, the groups that are most actively lobbying Congress onthe issue of an amnesty/guest worker program appear to be largely busi-ness interests — that have become increasingly dependent on low-wagelabor — and a segment of the union movement that seeks to reverse fallingmembership with recruitment of low-wage foreign workers. They arejoined by the political extremes of the civil libertarians on the left and thelibertarians on the right, both of whom advocate more open borders. Thevoice of the American public, which has for decades consistentlyexpressed in public opinion polls opposition to immigration increases, isbeing fiercely challenged by these narrow interests.
Because Congress and the Administration have ignored the populationimpact of various immigration reform proposals, Congress is, in effect,working in the dark. Not only is it working in the dark, it is groping towarddealing with short-range interests rather than focusing on long-rangeimpacts.
Our population projection is intended to shed light on the relationshipbetween immigration policy and population change. Our objective is toempower Congress, environmentalists and the American public in generalto address the population impact issues that flow from immigration policychanges and do so in an informed fashion. The environmental, economicand social health of the country that we leave to our children, grandchil-dren and continuing generations thereafter will be enormously affected byimmigration policy decisions made now.

1 Montavalli, Jim, “Can we save the cities? “E”, September 1, 2005.
2 We do not mean that the population of illegal residents will be that size. Rather, this is the population increase that will result from newillegal residents plus their children born after their arrival. The estimate of legal entrants does not mean that all of these persons will comeinto the country legally. Many will enter illegally and be converted to legal residents through provisions such as for Cubans or asylumapplicants or other amnesty-type provisions.
3 Camarota, Steven, “Birth Rates Among Immigrants in America: A Comparison of Fertility Between Immigrants in the U.S. and Their HomeCountries,” Center for Immigration Studies, October 2005.
4 The estimate of an annual increase of 2.3 million people is from the above cited CIS study, and the 2.87 million is an estimate of the U.S.Census Bureau. The Census Bureau estimate attributes 42.6 % of the increase to net international migration.
5 The term “immigrant stock” as used by the U.S. Census Bureau refers to the foreign-born population and residents with one or moreparents who are foreign-born. In the chart that accompanies this discussion the immigrant stock is shown from 1960 separated into theforeign born and those born to immigrants, who are identified in shortened form as “stock”.
6 See Fogel, Lee, Martin, “Immigrant Stock’s Share of U.S. Population Growth 1970-2004,” FAIR, February 2005.
7 "Special Message to the Congress on Problems of Population Growth," July 18, 1969.
8 U.S. Commission on Immigration Reform, 1994 Report to Congress.
9 A March 2003 national survey by Roper that asked what the “desirable” level of immigration would be found 76 percent gave an answerthat was below the current level of one million a year. A Zogby International poll of May 2002 found that 58 percent of the respondentsagreed that the U.S. should “admit fewer immigrants each year.”
10 The factsheet on President Bush’s January 7, 2003 proposal states, “A reasonable increase in the annual limit of legal immigrants willbenefit those who follow the lawful path to citizenship.” (Fact Sheet: Fair and Secure Immigration Reform,www.whitehouse.gov/news/releases/2004/01/20040107-1.html).
11 President’s Council on Sustainable Development. 1996. Population and Consumption Task Force Report. Washington, D.C.; U.S.Government Printing Office. Executive Summary, p. iv.
12 Immigrant admissions data are reported by country and region in the annual Statistical Yearbooks (formerly of the Immigration andNaturalization Service and now of the Dept. of Homeland Security).
13 Martin, Jack, Immigration and Income Inequality, FAIR, April 2004.
14 See FAIR Issue Brief “Immigration and Job Displacement,”(http://www.fairus.org/site/PageServer?pagename=iic_immigrationissuecentersd1fb).
15 On Nov. 22, 2004, the U.S. Department of Agriculture Economic Research Service released an estimate that 2005 will be the first year innearly 50 that America will not have an agricultural trade surplus. See the Peoria Journal Star, December 7, 2004. The USDA has sincehedged this conclusion, now saying they expect the net deficit to happen during this decade. See also “Economists: U.S. on Verge ofBecoming Net Agricultural Importer,” by Phillip Paarlberg and Phillip Abbott, News Release, University News Service, Purdue University,September 19, 2003.
16 The District of Columbia would also have a projected increase of more than 50 percent.
17 Replacement level immigration over the long-term is assumed to be a quarter to a third of a million persons.
18 Suro, Roberto, “Attitudes toward Immigrants and Immigration Policy: Surveys among Latinos in the U.S. and in Mexico,” Pew HispanicCenter, August 2005.
19 While experience with current guest worker programs shows that it is improbable that a new program would have the effect of endingillegal immigration, as suggested by the backers of that policy option, that is not to say that it would have no effect. The likelihoodprobably lies somewhere between having no effect on illegal immigration, and, therefore, being totally additive to the population, andreducing illegal immigration to zero, and, therefore, being population neutral.
Endnotes

Appendix AState Population Projections

In addition, we offer examples of how these data influence the population projection for selected states. Thosedescribed below are Illinois, New Mexico, North Carolina and Oregon. These four have been selected forrepresenting different areas of the country, having neither extremely high nor low population projections, andreflecting differing immigration influences. Two of the states (Illinois and New Mexico) have less than 50 percentprojected population increases in all scenarios except the amnesty/guest worker and high trend scenarios, whereasthe other two (Oregon and North Carolina) have greater than 50 percent population increases in all scenarios exceptthe population stability (zero net) scenario. Similar descriptive data will be made available for each state on ourwebsite at www.fairus.org in the research section.
As will be seen in the map on the right,the region of most heavily impactedstates in 2050 in the amnesty/guestworker scenario (more than 100%population increase), as might beexpected, is located largely in theSouthwest with its high concentrationof illegal immigrants. The secondlargest collection of heavily impactedstates (50% to 99% increase) is alsoconcentrated in the Southwest and inthe southeastern coastal states, butstretching north to include Oregon,Washington and Idaho in the Westand Virginia, Maryland, Delaware, NewJersey and Massachusetts in the East. The third impacted tier of eight states(20% to 49% population increase)expands into the center of the country
We provide below tables that show the projected population change for each state by:
n Scenario • zero-net, or immigration stability• low trend (current amount of change)• high trend (current rate of change)• amnesty/guest worker/increased immigration (current proposals)
n Component• 1970 population• Post-1970 immigration• Post-2005 legal immigration• Post-2005 illegal immigration• amnesty/guest worker/increased immigration (current proposals)
n Ethnic/Racial composition of change• White (not-Hispanic)• Mexican• Other Hispanic• Black• Asian• Other (includes multiple identification, American Indians, etc.)
A1
STATE POPULATION PROJECTIONS

by including Minnesota, Kansas,Nebraska, Wisconsin, Michigan andIndiana, among others.
Under the immigration stability (net-zero)scenario, the 20 states that haveprojected population increases in therange of 20 to 49 percent have anaverage increase of 31.6 percent. Thosesame 20 states have average populationincreases of 70.5 percent in theamnesty/guest worker scenario.
IllinoisRecent trend: Illinois’ population tendedto stagnate from 1970 to 1990 andwould have declined because of out-
migration had it not been for the influx of immigrants. Immigrant settlement was high enough from 1990 to 2000 thatthe population again rose significantly, i.e., by nearly one million residents, or 8.n6 percent. The increase in foreign-born newcomers – not including their children born after their arrival – over that decade accounted for most (about58%) of that increase.
The Census Bureau currently estimates that the increase in thestate’s population from net international migration (immigrantsarriving less those leaving) since 2000 has averaged more than69,200 per year. This is more than 94 percent of the CensusBureau’s estimate of overall population change in the state.
Projection scenarios: Absent any change in immigration policy, i.e.,with the current trend in large-scale legal and illegal immigration, thestate’s population is likely to increase from today’s about 12.8 millionresidents to 18.1 to 18.7 million in 2050. That would be an increaseof 41 to 47 percent.
If, however, measures were adopted to curb illegal immigration andreduce legal immigration to a more moderate level, the population would increase by less than 1.6 million residents(about 13%) over the next 45 years.
On the other hand, if policies that would accommodate today’s illegalalien population, allow a new stream of guest workers and increaselegal immigration were adopted, the projected population wouldbecome more than 21 million residents (an increase of 63%). Thedifference in Illinois’ projected population in 2050 between these twoscenarios is more than 7 million residents.
Cohorts: The projection indicates that the pre-1970 population –that was already in the country in 1970 before the effects of the 1965major change in immigration law began to usher in large immigrationincreases – may be expected to increase by about 210,000 persons(2%) over the next 45 years – from 10.55 million to 10.76 millionresidents.
A2

The immigrant cohort that entered the U.S. after 1970, however, isprojected to continue to grow by more than one million people overthe 45-year period. At the beginning of the projection, this cohortalready accounted for nearly 2.2 million residents, and they areprojected to increase to 3.26 million by 2050. The continued growthof this post-1970 immigrant cohort is due to the fact that theseimmigrants and their offspring have on average larger thanreplacement level families.
Illinois has had an average of more than 39,100 legal immigrantadmissions per year from 1994 to 2003. More than 25 percent ofthose admissions have been Mexican. With immigrants from otherSpanish-speaking countries, about 35 percent are presumed to beHispanic. The next largest share of Illinois’ new immigrants is Asian(32%), with India, Philippines and China leading source countries.About 31 percent of Illinois’ immigrants are presumed to be white, as
they come from countries such as Poland, former Yugoslavia, and former USSR. Slightly more than two percent ofrecent immigrants have come from countries with black populations in Africa, the Caribbean and Latin America. Weproject that all of these new immigrants and their children will add nearly 2.8 million persons to the state’s populationover the next 45 years.
Illegal immigration to Illinois is dominated by Mexicans, adding more than seven-eighths of an annual addition of morethan 40,000 residents. We estimate that Illinois’ illegal alien population now numbers more than 600,000 persons.We project that, absent changes in immigration enforcement, the Mexican illegal alien population will continue to growby more than 35,000 persons per year. The continued increase of the illegal alien population over the next 45 yearsis projected to add nearly 2.1 million persons to the population.
Finally, we project a further nearly 2.2 million persons will be added to the state’s population over the next 45 yearsif any form of amnesty is adopted that provides legal status for current illegal residents. These persons are already inthe country, but the increase will occur because they will bring additional family members to live in the United States,the amnesty will not diminish illegal immigration, and there will be increased legal immigration and an additionalincrease in foreigners living long-term in the country through a new guest worker program.
Demographic change: The rate of population change for the various scenarios depends on the racial/ethniccomposition of the influx of continuing and additional immigrants because they represent different trends in familysize. That is true for the post-70 immigrant cohort as well as for new immigrant populations. Illinois’ 1970 population
was predominantly non-Hispanic white, which has a slightly less thanreplacement level fertility. Thus, the projection for non-Hispanicwhites between 2005 and 2050 is for a generally stabilized number– and shrinking share – of the population.
Because a large share of the post-70 immigrant population as well ascontinuing immigration and amnesty beneficiaries is assumed to beheavily influenced by Mexicans, and this population has a muchhigher than replacement fertility rate, this cohort of the population isprojected to rise significantly. The Mexican-born and Mexicanheritage population is projected to rise from about 1.5 million in 2005to more than 7 million in 2050 (379%) under the amnesty/guestworker scenario. Other Hispanics are projected to rise from about420,000 to more than 1 million (142%) over the 45 years. Asians areprojected to grow less rapidly – from about 580,000 now to about
A3

1.6 million in 2050 (179%). The black and non-Hispanic white populations would have lower rates of increase (42%and 1.7% respectively).
New MexicoRecent trend: The rate of growth of New Mexico’s population hasincreased rapidly in recent decades, in part due to large scaleimmigration – both legal and illegal. From 1990 to 2000, the stateadded 304,000 residents – an increase of 20.1 percent. Bycomparison, the foreign-born population of the state increased byabout 86 percent between the 1990 and 2000 censuses – to about150,000 persons. In 2005, the Census Bureau estimates the state’spopulation at about 1.9 million.
The Census Bureau also estimates that since the 2000 census, netinternational migration (arriving immigrants minus departingimmigrants) has added an average of more than 13,200 residentseach year.
Projection scenarios: New Mexico’s projected population in 2050could range anywhere from less than 2.5 million to over 3.2 million.The about three-fourths of a million resident difference between theseextremes depends on whether policies aimed at immigration stabilityare adopted or, instead, currently advocated policies that wouldaccommodate today’s illegal alien population, allow a new stream ofguest workers and increase legal immigration are adopted.
Without any change in immigration policy or enforcement, i.e., with thecurrent trend in large-scale legal and illegal immigration and laxenforcement, the state’s population is likely to increase from today’sabout 1.9 million residents to nearly 2.9 to 3 million in 2050 – anincrease of 49 to 53 percent.
The largest difference from the current trend comes in comparisonwith a zero-net immigration scenario (when arriving immigrantsbalance those who are departing). In that case, the population wouldstill grow, but more modestly by about 30 percent. However, if thecurrently proposed immigration expansionist and illegal alienaccommodationist policies were adopted, the increase in theprojected population over the next 45 years would be 66 percent.
Cohorts: The projection indicates that the population that wasalready in the country in 1970 – before the effects of the 1965 majorchange in immigration law – will continue to rise steadily. This is in partdue to migration of members of this cohort to New Mexico from otherstates and in part because the already large Latino segment of thispopulation has greater than replacement level fertility. This cohort isprojected to have a 21.5 percent increase by 2050.
Post-1970 immigrants are projected to be growing more rapidly – bynearly 72 percent. The higher rate of growth is influenced by the largeraverage family size of the largely Mexican immigrants. At the
A4
beginning of the projection, this post-1970 immigrant cohort already accounted for about 248,000 residents. By2050, this cohort is projected to rise to about 426,000 residents.
Without any change in the immigration laws, current mass immigration will continue. New Mexico has had an averageof nearly 3,400 legal immigrant admissions per year between 1994 and 2003. About 65 percent of those admissionshave been Mexicans. Mexicans combined with immigrants from other Spanish-speaking countries constitute morethan 82 percent of the new arrivals. Immigration from Asian countries has amounted to about one-in-eight immigrants,leaving immigration from countries with predominantly white populations at about 5 percent, and less than 1 percentfrom countries with black populations in Africa, the Caribbean and Latin America. We project that new immigrantsand their children from all sources will add about 253,000 people to the state’s population over the next 45 years.
Illegal immigration, like legal immigration to New Mexico, is dominated by Mexicans. We estimate that New Mexico’sillegal alien population now numbers about 73,300 persons, and Mexicans constitute about four-fifths of the influx ofabout 5,000 persons per year. This continued addition of illegal immigrants over the next 45 years, assuming itcontinues, is projected to add about a quarter of a million persons to the population.
Finally, we project that proposals for amnesty and other provisions that are currently being advocated, if adopted,would add a further 262,000 persons to the state’s population over the next 45 years. This would result from thefamily members of amnesty recipients, increased legal immigration and increased long-term guest worker residents.
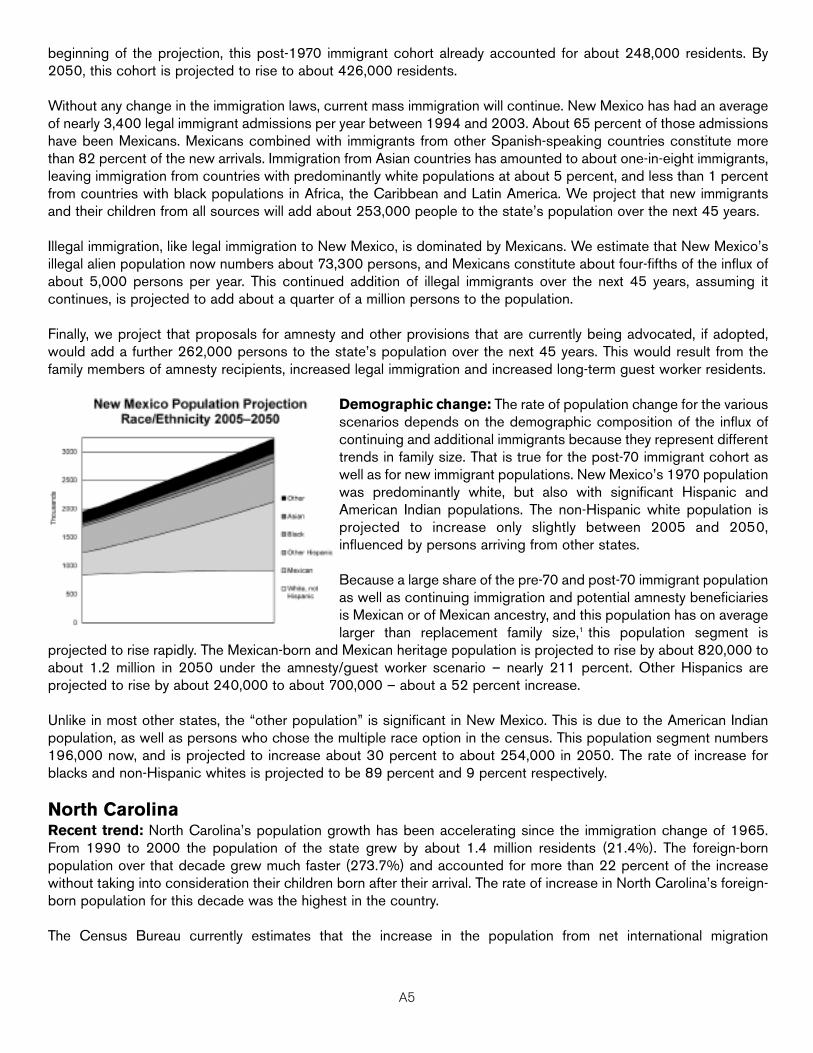
Demographic change: The rate of population change for the variousscenarios depends on the demographic composition of the influx ofcontinuing and additional immigrants because they represent differenttrends in family size. That is true for the post-70 immigrant cohort aswell as for new immigrant populations. New Mexico’s 1970 populationwas predominantly white, but also with significant Hispanic andAmerican Indian populations. The non-Hispanic white population isprojected to increase only slightly between 2005 and 2050,influenced by persons arriving from other states.
Because a large share of the pre-70 and post-70 immigrant populationas well as continuing immigration and potential amnesty beneficiariesis Mexican or of Mexican ancestry, and this population has on averagelarger than replacement family size,1 this population segment is
projected to rise rapidly. The Mexican-born and Mexican heritage population is projected to rise by about 820,000 toabout 1.2 million in 2050 under the amnesty/guest worker scenario – nearly 211 percent. Other Hispanics areprojected to rise by about 240,000 to about 700,000 – about a 52 percent increase.
Unlike in most other states, the “other population” is significant in New Mexico. This is due to the American Indianpopulation, as well as persons who chose the multiple race option in the census. This population segment numbers196,000 now, and is projected to increase about 30 percent to about 254,000 in 2050. The rate of increase forblacks and non-Hispanic whites is projected to be 89 percent and 9 percent respectively.
North CarolinaRecent trend: North Carolina’s population growth has been accelerating since the immigration change of 1965.From 1990 to 2000 the population of the state grew by about 1.4 million residents (21.4%). The foreign-bornpopulation over that decade grew much faster (273.7%) and accounted for more than 22 percent of the increasewithout taking into consideration their children born after their arrival. The rate of increase in North Carolina’s foreign-born population for this decade was the highest in the country.
The Census Bureau currently estimates that the increase in the population from net international migration
A5

(immigrants arriving less those leaving) has averaged nearly 33,000per year since 2000. This is nearly 27 percent of the Census Bureau’sestimate of overall population change in the state.
Projection scenarios: Absent any change in immigration policy, i.e.,with the current trend in large-scale legal and illegal immigration, thestate’s population is projected to increase rapidly from nearly 8.8million residents to 13.4 to 13.8 million in 2050. That would be anincrease of 54 to 57 percent.
If, however, measures were adopted to curb illegal immigration andreduce legal immigration to a more moderate level, the populationwould increase by about 3.1 million residents over the next 45 years(35%). On the other hand, if currently advocated policies are adoptedthat accommodate today’s illegal alien population, allow a new streamof guest workers and increase legal immigration, the projectedpopulation would be more than 15.2 million residents (a 73%increase). The difference in North Carolina’s projected population in2050 between these two scenarios is about 3.6 million residents.
Cohorts: The projection indicates that the population that wasalready in the country in 1970 – before the effects of the 1965 majorchange in immigration law began to usher in mass immigrationincreases – could rise by nearly 2.2 million persons over the next 45years – from 8 million to 10.2 million residents (a 27% increase). Thisincludes migration of persons in this cohort into the state.
Post-1970 immigrants are also projected to be continuously growingthroughout the 45-year period. At the beginning of the projection, thiscohort already accounted for about 660,000 residents, and it isprojected to increase to 1.3 million by 2050 (by 103%).
North Carolina has had an average of more than 8,200 legalimmigrant admissions per year between 1994 to 2003. The largestshare (44%) is from Asian countries, with India, Vietnam and Chinaleading source countries. Mexico accounted for 13 percent of thoseadmissions, and, with immigrants from other Spanish-speakingcountries, about 26 percent of continuing immigrants are presumedto be Hispanic. About 25 percent of North Carolina’s immigrants arepresumed to be white, as they come from countries such as Canada,Germany and former USSR. Slightly less than 5 percent of recentimmigrants have come from countries with black populations in Africa,the Caribbean and Latin America. We project that all of thiscontinuing immigration and their children will add more than 790,000persons to the state’s population over the next 45 years.
Illegal immigration to North Carolina is dominated by Mexicans –adding more than seven-eighths of an annual increase of more than 28,000 residents. We estimate that NorthCarolina’s illegal alien population now numbers more than 405,000 persons, and, absent changes in immigrationenforcement, illegal immigration will continue to grow. We project it will add nearly 1.4 million persons to thepopulation over the next 45 years – from both the illegal immigrants and their children born here.
A6
Lastly, we project that nearly an additional more than 1.4 million persons will be added to the state’s population overthe next 45 years if any form of amnesty is adopted that provides legal status for illegal residents. We project that thiscohort will bring additional family members to live in the United States. The other measures that will contribute to thisincrease is continuing illegal immigration, which we project will not diminish, an additional increase in foreigners livinglong-term in the country through a new guest worker program, and a major increase in legal immigrant admissions.
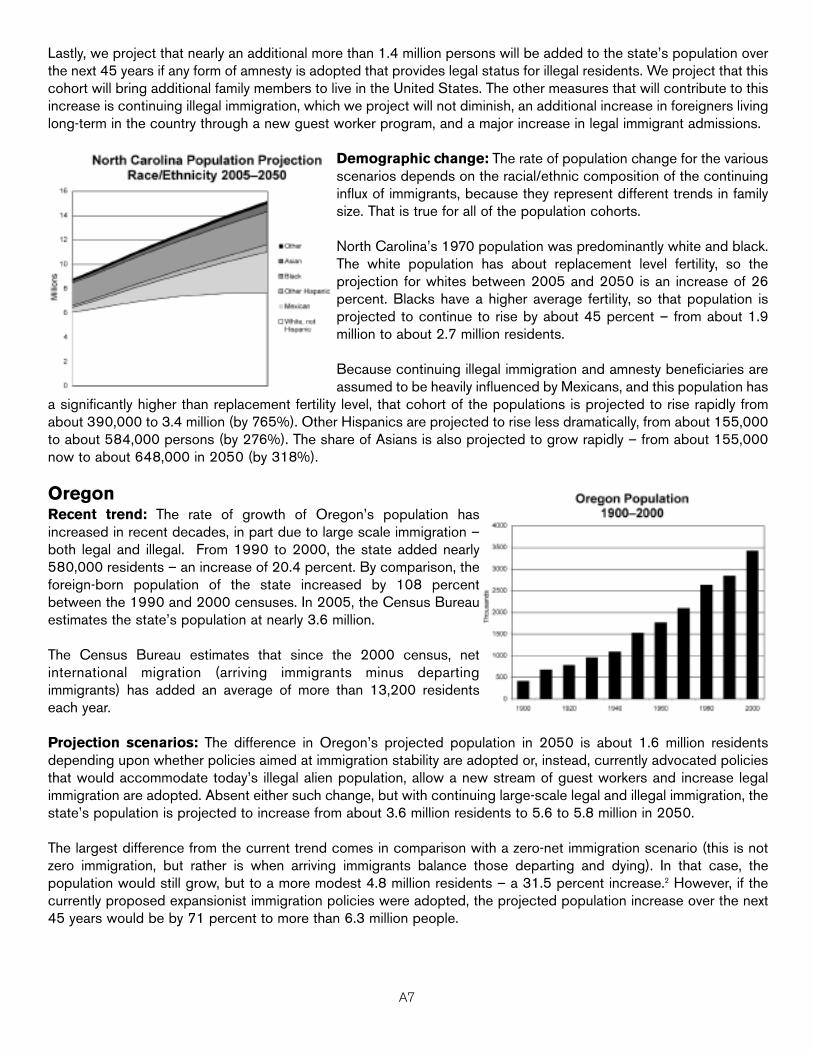
Demographic change: The rate of population change for the variousscenarios depends on the racial/ethnic composition of the continuinginflux of immigrants, because they represent different trends in familysize. That is true for all of the population cohorts.
North Carolina’s 1970 population was predominantly white and black.The white population has about replacement level fertility, so theprojection for whites between 2005 and 2050 is an increase of 26percent. Blacks have a higher average fertility, so that population isprojected to continue to rise by about 45 percent – from about 1.9million to about 2.7 million residents.
Because continuing illegal immigration and amnesty beneficiaries areassumed to be heavily influenced by Mexicans, and this population has
a significantly higher than replacement fertility level, that cohort of the populations is projected to rise rapidly fromabout 390,000 to 3.4 million (by 765%). Other Hispanics are projected to rise less dramatically, from about 155,000to about 584,000 persons (by 276%). The share of Asians is also projected to grow rapidly – from about 155,000now to about 648,000 in 2050 (by 318%).
OregonRecent trend: The rate of growth of Oregon’s population hasincreased in recent decades, in part due to large scale immigration –both legal and illegal. From 1990 to 2000, the state added nearly580,000 residents – an increase of 20.4 percent. By comparison, theforeign-born population of the state increased by 108 percentbetween the 1990 and 2000 censuses. In 2005, the Census Bureauestimates the state’s population at nearly 3.6 million.
The Census Bureau estimates that since the 2000 census, netinternational migration (arriving immigrants minus departingimmigrants) has added an average of more than 13,200 residentseach year.
Projection scenarios: The difference in Oregon’s projected population in 2050 is about 1.6 million residentsdepending upon whether policies aimed at immigration stability are adopted or, instead, currently advocated policiesthat would accommodate today’s illegal alien population, allow a new stream of guest workers and increase legalimmigration are adopted. Absent either such change, but with continuing large-scale legal and illegal immigration, thestate’s population is projected to increase from about 3.6 million residents to 5.6 to 5.8 million in 2050.
The largest difference from the current trend comes in comparison with a zero-net immigration scenario (this is notzero immigration, but rather is when arriving immigrants balance those departing and dying). In that case, thepopulation would still grow, but to a more modest 4.8 million residents – a 31.5 percent increase.2 However, if thecurrently proposed expansionist immigration policies were adopted, the projected population increase over the next45 years would be by 71 percent to more than 6.3 million people.
A7

Cohorts: The projection indicates that the population that wasalready in the country in 1970 – before the effects of the 1965 majorchange in immigration law began to usher in mass immigrationincreases – would increase by about 19 percent and be near stabilityin about 2040. This indicates replacement level, i.e., where deathsare balanced by births.
Post-1970 immigrants, however, are projected to be continuouslygrowing throughout the 45-year period. At the beginning of theprojection, this cohort already accounted for about 420,000residents. By 2050, this cohort is projected to rise to about 867,000residents, an increase of 107 percent. The continued rapid growth ofthis immigrant population compared to the stabilized pre-1970population is due to the fact that the immigrants and their offspringhave larger families. Our assumption is that with succeedinggenerations the fertility level of this cohort will trend toward the levelof the pre-1970 population, but it will take several generations to seethis segment of the population also begin to move toward populationstability.
Without any change in the immigration laws, mass immigration willcontinue. Oregon has had an average of more than 7,500 legalimmigrant admissions per year between 1994 and 2003. The largestshare of Oregon’s new immigrants is from Asia (37%), with Vietnamand China leading the list of source countries. About 26 percent of theadmissions have been Mexican. When immigrants from Mexico areadded to those from other Spanish-speaking countries, more than 35percent of continuing immigrant arrivals are presumed to be Hispanic.About 27 percent of Oregon’s immigrants are presumed to be white,as they come from former Yugoslavia, former USSR and countriessuch as Germany, Canada and the United Kingdom. Less than onepercent of recent immigrants have come from countries with blackpopulations in Africa, the Caribbean and Latin America. We projectthat continuing immigration from all sources and the children bornafter their arrival will add about 627,000 people to the state’s population over the next 45 years.
Illegal immigration into Oregon is dominated by Mexicans. We estimate that Oregon’s illegal alien population nownumbers more than 100,000 persons, and Mexicans constitute nearly all of that population. We project that, absentchanges in immigration enforcement, the Mexican illegal alien population will continue to grow by about 9,500persons per year. This continued increase over the next 45 years is projected to add nearly 474,000 persons to thepopulation.
Finally, we project a further nearly half million persons added to the state’s population over the next 45 years ifcurrently advocated proposals for some form of amnesty are adopted that provide legal status for illegal residents.Most of these persons are already counted as part of the population, but we project that an amnesty would attractothers, will bring additional family members to live in the United States, and will increase the number of foreignersliving long-term in the country through a new guest worker program. In addition, current proposals also include amajor increase in legal immigrant admissions.
Demographic change: The rates of population change for the various scenarios depend on the racial/ethniccomposition of the influx of continuing and additional immigrants because they represent different trends in family
A8

size. That is true for the post-70 immigrant cohort as well as for newimmigrant populations. Oregon’s 1970 population was predominantlynon-Hispanic white, which has a slightly less than replacement levelfertility. However, Oregon is receiving migration of pre-1970 residentsfrom other states, and this results in a projection that non-Hispanicwhites between 2005 and 2050 will increase by about 21 percentand have a gradually stabilizing number – but shrinking share – of thepopulation.
Because a large share of the post-70 immigrant population as well ascontinuing immigration and potential amnesty beneficiaries isassumed to be Mexican, and this population has a much higher fertilityrate, the Mexican and Mexican-ancestry population is projected to riserapidly from less than 290,000 in 2005 to more than 1.8 million in2050 (by 532%) under the amnesty/guest worker scenario. Asians,because of their large share of legal immigration admissions in
Oregon, are also projected to grow rapidly – from about 145,000 now to more than 426,000 in 2050 (by 195%).Blacks and Hispanics (other than Mexicans) have smaller population shares and are projected to rise less rapidly(71% and 160% respectively).
General TrendsWhat each of these state projections has in common is that the population will continue to grow, regardless of thescenario. Even if illegal and legal immigration are significantly curtailed in the near term, the population will continueto increase, in part because of the momentum from post-1970 immigration, and in part because reductions in legaland illegal immigration will not take effect immediately.
Only states with significant out migration to other states are projected to have a declining post-1970 population overthe 45 year period of this projection.
Yet, it is also clear that there is a great difference in the population effect of the different scenarios depending on whatimmigration policies are adopted. The differences may be seen both in the size of the population and also in itsdemographic composition.
In the absence of any change in immigration policy or enforcement, the nation’s population will remain on the path ofrapid increase. The immigration stability scenario demonstrates that a very large share of that increase could becurbed by a change in policy and enforcement. It also shows that a transition to demographic stability cannot beachieved overnight. By acting now to set in motion policies to restore moderation to our immigration policies, wewould only be approaching immigration stability in 2050.
The other extreme – the amnesty/guest worker scenario – shows how today’s already rapid population increasewould be further boosted if changes were made in the near-term that accommodated today’s illegal residents andinvited in still more foreigners in new immigration and guest worker programs.
A9

Amnesty+ High-trend Low-trend Zero-net
Alabama 5,766,597 5,578,559 5,529,547 5,285,581
Alaska 981,925 959,172 938,222 853,682
Arizona 14,292,225 12,530,505 12,138,233 10,093,654
Arkansas 3,782,770 3,606,016 3,555,320 3,308,559
California 82,183,113 72,324,403 67,837,211 47,863,458
Colorado 9,419,955 8,473,159 8,214,532 6,941,169
Connecticut 5,154,414 4,961,811 4,803,021 4,157,192
Delaware 1,356,612 1,285,875 1,255,169 1,117,721
D.C. 1,113,687 1,078,921 1,037,857 873,794
Florida 33,455,308 31,498,757 30,164,814 24,569,009
Georgia 16,811,180 15,227,338 14,832,343 12,844,243
Hawaii 1,812,670 1,802,126 1,724,713 1,433,411
Idaho 2,511,192 2,388,634 2,347,657 2,155,256
Illinois 21,044,748 18,861,138 18,064,790 14,403,350
Indiana 8,072,680 7,734,653 7,618,549 7,077,194
Iowa 3,671,635 3,532,528 3,456,432 3,130,827
Kansas 3,800,814 3,529,017 3,444,085 3,038,253
Kentucky 5,272,842 5,173,850 5,109,917 4,842,751
Louisiana 5,257,391 5,200,353 5,152,886 4,957,955
Maine 1,488,008 1,476,442 1,460,641 1,399,445
Maryland 8,977,520 8,662,784 8,344,187 7,063,005
Mass. 10,663,863 10,130,251 9,718,408 8,029,083
Michigan 13,124,190 12,682,215 12,387,757 11,162,205
Minnesota 7,609,543 7,174,675 6,983,529 6,137,090
Miss. 3,528,137 3,475,552 3,455,626 3,363,917
Missouri 7,263,865 7,086,906 6,970,523 6,485,934
Montana 1,139,676 1,128,111 1,121,089 1,091,800
Nebraska 2,421,479 2,279,833 2,217,910 1,941,147
Nevada 8,688,545 7,434,079 7,182,940 5,830,466
N.H. 1,810,013 1,784,371 1,749,519 1,614,020
N.J. 15,543,405 14,287,532 13,442,516 9,901,152
N.M. 3,231,327 2,969,205 2,890,576 2,509,903
New York 29,301,275 27,033,475 25,377,912 18,525,625
N.C. 15,205,799 13,753,948 13,437,982 11,785,485
N.D. 684,758 662,681 653,341 612,199
Ohio 13,307,806 13,048,361 12,853,895 12,055,868
Oklahoma 4,688,819 4,392,549 4,315,010 3,928,304
Oregon 6,322,147 5,822,965 5,642,281 4,809,169
Penn. 14,547,975 14,262,384 13,989,146 12,892,717
A10
STATE DATA TABLES
I. 2050 Scenarios

Amnesty+ High-trend Low-trend Zero-netR.I. 1,677,169 1,604,331 1,558,837 1,366,197S.C. 6,373,401 6,101,385 6,038,085 5,713,628S.D. 898,333 886,438 876,415 836,018Tenn. 8,451,765 8,155,376 8,056,227 7,591,673Texas 49,036,997 43,229,146 41,560,904 33,413,044Utah 4,515,303 4,127,976 4,027,676 3,527,864Vermont 758,012 746,446 734,605 688,289Virginia 12,147,984 11,477,767 11,080,176 9,383,833Washington 11,045,211 10,305,297 9,933,414 8,320,317W.V. 1,880,541 1,851,445 1,840,134 1,788,730Wisconsin 7,474,785 7,167,566 7,049,816 6,514,039Wyoming 607,562 595,594 590,533 568,064U.S. 500,176,977 461,543,905 444,766,908 369,797,289
A11
II. 2050 Cohorts
1970 Pop. Post-’70 Stock Legal Post-’04 Illegal Post-’04 Amnesty+Alabama 4,977,136 280,183 142,630 178,611 188,038Alaska 746,352 100,261 90,875 21,684 22,753Arizona 7,475,854 2,368,363 1,013,579 1,672,710 1,761,720Arkansas 3,044,145 236,538 157,509 167,824 176,755California 22,503,817 23,387,301 17,058,179 9,375,106 9,858,710Colorado 5,788,356 1,007,112 778,732 898,959 946,796Connecticut 3,122,487 979,565 676,404 183,354 192,602Delaware 968,709 135,382 114,526 67,257 70,737D.C. 721,196 139,332 185,265 33,127 34,767Florida 16,902,028 7,166,269 5,568,406 1,862,053 1,956,552Georgia 10,926,044 1,684,970 1,111,257 1,505,067 1,583,842Hawaii 1,069,537 343,314 379,255 10,020 10,544Idaho 1,907,550 226,951 137,766 116,367 122,558Illinois 10,762,814 3,257,095 2,767,025 2,074,204 2,183,610Indiana 6,626,552 392,878 394,275 320,948 338,027Iowa 2,902,087 198,174 300,166 132,101 139,107Kansas 2,650,191 343,434 277,326 258,065 271,798Kentucky 4,569,726 248,895 261,239 93,990 98,992Louisiana 4,751,993 189,202 204,928 54,230 57,039Maine 1,337,448 57,252 70,714 11,028 11,566Maryland 5,850,890 1,106,096 1,406,068 299,730 314,736Mass. 5,566,036 2,317,187 1,738,321 508,707 533,612Michigan 10,156,737 895,918 1,209,357 420,203 441,975Minnesota 5,393,151 660,119 707,868 413,538 434,868Miss. 3,260,574 93,874 71,177 49,928 52,585Missouri 6,155,273 287,139 476,302 168,192 176,958Montana 1,062,298 26,839 27,946 11,028 11,566Nebraska 1,728,769 184,684 231,890 134,489 141,646Nevada 3,702,283 1,958,483 580,383 1,192,931 1,254,466N.H. 1,467,360 136,089 156,495 24,427 25,642N.J. 6,548,812 3,035,515 3,507,323 1,195,882 1,255,873N.M. 2,042,015 425,577 252,531 249,083 262,122
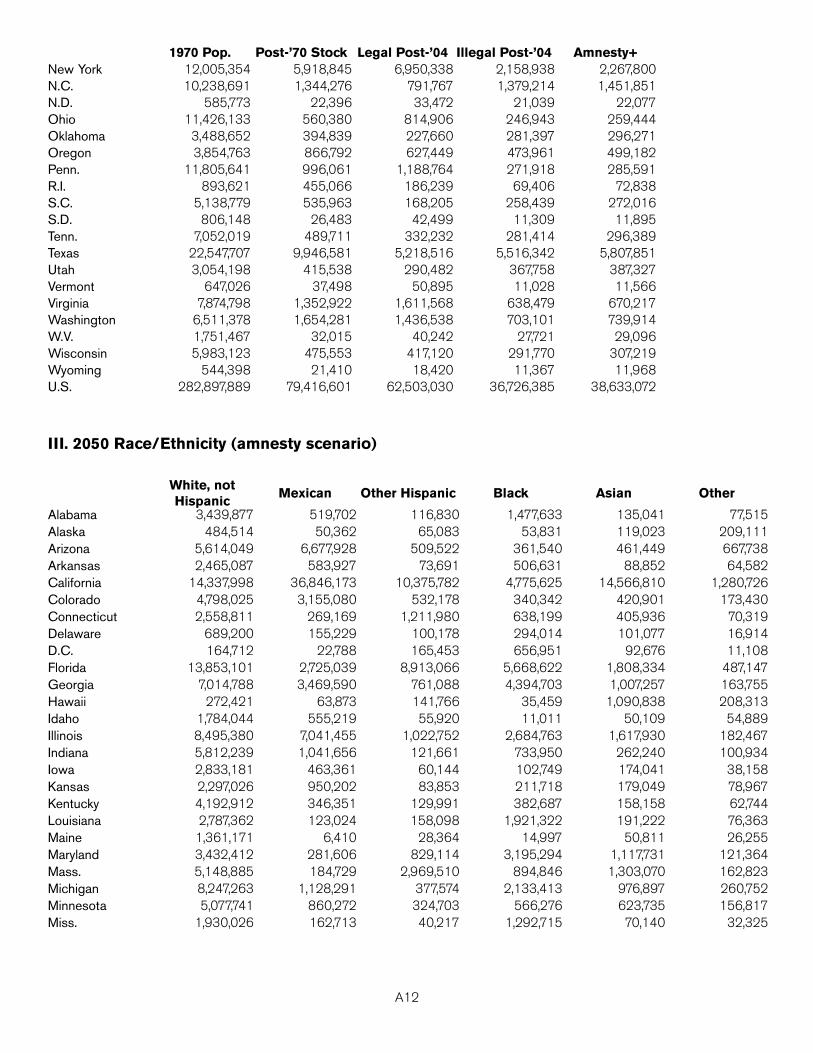
A12
1970 Pop. Post-’70 Stock Legal Post-’04 Illegal Post-’04 Amnesty+New York 12,005,354 5,918,845 6,950,338 2,158,938 2,267,800N.C. 10,238,691 1,344,276 791,767 1,379,214 1,451,851N.D. 585,773 22,396 33,472 21,039 22,077Ohio 11,426,133 560,380 814,906 246,943 259,444Oklahoma 3,488,652 394,839 227,660 281,397 296,271Oregon 3,854,763 866,792 627,449 473,961 499,182Penn. 11,805,641 996,061 1,188,764 271,918 285,591R.I. 893,621 455,066 186,239 69,406 72,838S.C. 5,138,779 535,963 168,205 258,439 272,016S.D. 806,148 26,483 42,499 11,309 11,895Tenn. 7,052,019 489,711 332,232 281,414 296,389Texas 22,547,707 9,946,581 5,218,516 5,516,342 5,807,851Utah 3,054,198 415,538 290,482 367,758 387,327Vermont 647,026 37,498 50,895 11,028 11,566Virginia 7,874,798 1,352,922 1,611,568 638,479 670,217Washington 6,511,378 1,654,281 1,436,538 703,101 739,914W.V. 1,751,467 32,015 40,242 27,721 29,096Wisconsin 5,983,123 475,553 417,120 291,770 307,219Wyoming 544,398 21,410 18,420 11,367 11,968U.S. 282,897,889 79,416,601 62,503,030 36,726,385 38,633,072
III. 2050 Race/Ethnicity (amnesty scenario)
White, notHispanic
Mexican Other Hispanic Black Asian Other
Alabama 3,439,877 519,702 116,830 1,477,633 135,041 77,515Alaska 484,514 50,362 65,083 53,831 119,023 209,111Arizona 5,614,049 6,677,928 509,522 361,540 461,449 667,738Arkansas 2,465,087 583,927 73,691 506,631 88,852 64,582California 14,337,998 36,846,173 10,375,782 4,775,625 14,566,810 1,280,726Colorado 4,798,025 3,155,080 532,178 340,342 420,901 173,430Connecticut 2,558,811 269,169 1,211,980 638,199 405,936 70,319Delaware 689,200 155,229 100,178 294,014 101,077 16,914D.C. 164,712 22,788 165,453 656,951 92,676 11,108Florida 13,853,101 2,725,039 8,913,066 5,668,622 1,808,334 487,147Georgia 7,014,788 3,469,590 761,088 4,394,703 1,007,257 163,755Hawaii 272,421 63,873 141,766 35,459 1,090,838 208,313Idaho 1,784,044 555,219 55,920 11,011 50,109 54,889Illinois 8,495,380 7,041,455 1,022,752 2,684,763 1,617,930 182,467Indiana 5,812,239 1,041,656 121,661 733,950 262,240 100,934Iowa 2,833,181 463,361 60,144 102,749 174,041 38,158Kansas 2,297,026 950,202 83,853 211,718 179,049 78,967Kentucky 4,192,912 346,351 129,991 382,687 158,158 62,744Louisiana 2,787,362 123,024 158,098 1,921,322 191,222 76,363Maine 1,361,171 6,410 28,364 14,997 50,811 26,255Maryland 3,432,412 281,606 829,114 3,195,294 1,117,731 121,364Mass. 5,148,885 184,729 2,969,510 894,846 1,303,070 162,823Michigan 8,247,263 1,128,291 377,574 2,133,413 976,897 260,752Minnesota 5,077,741 860,272 324,703 566,276 623,735 156,817Miss. 1,930,026 162,713 40,217 1,292,715 70,140 32,325
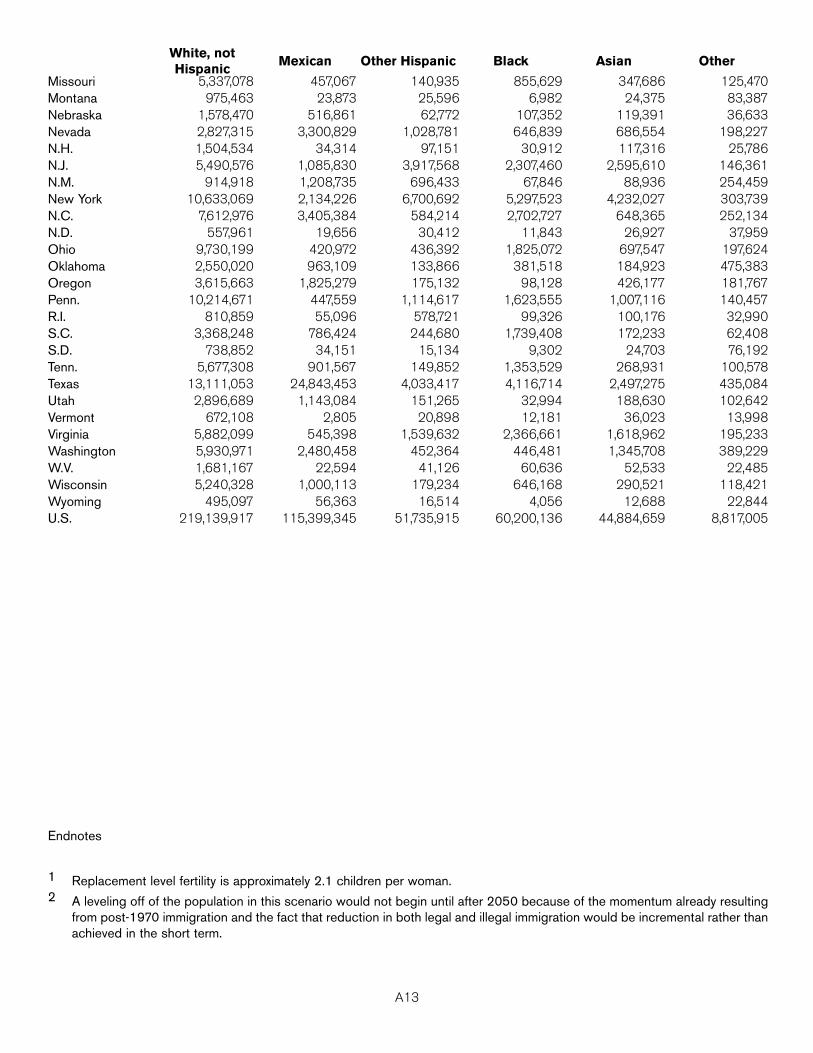
A13
White, notHispanic
Mexican Other Hispanic Black Asian Other
Missouri 5,337,078 457,067 140,935 855,629 347,686 125,470Montana 975,463 23,873 25,596 6,982 24,375 83,387Nebraska 1,578,470 516,861 62,772 107,352 119,391 36,633Nevada 2,827,315 3,300,829 1,028,781 646,839 686,554 198,227N.H. 1,504,534 34,314 97,151 30,912 117,316 25,786N.J. 5,490,576 1,085,830 3,917,568 2,307,460 2,595,610 146,361N.M. 914,918 1,208,735 696,433 67,846 88,936 254,459New York 10,633,069 2,134,226 6,700,692 5,297,523 4,232,027 303,739N.C. 7,612,976 3,405,384 584,214 2,702,727 648,365 252,134N.D. 557,961 19,656 30,412 11,843 26,927 37,959Ohio 9,730,199 420,972 436,392 1,825,072 697,547 197,624Oklahoma 2,550,020 963,109 133,866 381,518 184,923 475,383Oregon 3,615,663 1,825,279 175,132 98,128 426,177 181,767Penn. 10,214,671 447,559 1,114,617 1,623,555 1,007,116 140,457R.I. 810,859 55,096 578,721 99,326 100,176 32,990S.C. 3,368,248 786,424 244,680 1,739,408 172,233 62,408S.D. 738,852 34,151 15,134 9,302 24,703 76,192Tenn. 5,677,308 901,567 149,852 1,353,529 268,931 100,578Texas 13,111,053 24,843,453 4,033,417 4,116,714 2,497,275 435,084Utah 2,896,689 1,143,084 151,265 32,994 188,630 102,642Vermont 672,108 2,805 20,898 12,181 36,023 13,998Virginia 5,882,099 545,398 1,539,632 2,366,661 1,618,962 195,233Washington 5,930,971 2,480,458 452,364 446,481 1,345,708 389,229W.V. 1,681,167 22,594 41,126 60,636 52,533 22,485Wisconsin 5,240,328 1,000,113 179,234 646,168 290,521 118,421Wyoming 495,097 56,363 16,514 4,056 12,688 22,844U.S. 219,139,917 115,399,345 51,735,915 60,200,136 44,884,659 8,817,005
Endnotes
1 Replacement level fertility is approximately 2.1 children per woman.2 A leveling off of the population in this scenario would not begin until after 2050 because of the momentum already resulting
from post-1970 immigration and the fact that reduction in both legal and illegal immigration would be incremental rather thanachieved in the short term.

Appendix BAssumptions

Family Reunification: Because of the effects of chain-migration, i.e., the current U.S. immigration system thatempowers an immigrant both as a legal resident and as a naturalized citizen to directly and indirectly sponsorimmediate family and extended family members, it is our assumption that as currently provided in our immigration lawthe chain is theoretically never-ending as long as the rest of the world continues to provide additional migrants. Thatis especially true as long as new chains are created by immigrants coming into the country for employment,refugee/asylum, lottery, etc. There are four strands of family reunification:
1. Immediate relatives of immigrants who become naturalized United States citizens and U.S.-born citizens –which currently has no limit;
2. Nuclear family members of non-citizen immigrants – who currently are subject to an annual limit of 114,200visas;
3. Family members of persons admitted to the United States as refugees/asylees following to join. This strandis part of the overall refugee admissions ceiling which is subject to a limit set by the administration andCongress each year – currently at 70,000 for fiscal year 2005; and
4. Illegal aliens who are judged non-deportable because of hardship to their U.S. spouse or other family member– this currently has a separate annual limit of 4,000 visas.
Just as overall immigration levels have steadily increased since the current immigration system was enacted in 1965,so too has family reunification immigration. The numerically-limited, family-sponsored immigration preference categoryhas remained fairly constant at around 200,000 per year since 1970, but the unlimited immediate relative categoryhas steadily increased (see chart below). In 1970, immediate relative immigrant admissions were less than 100,000per year. This number has steadily risen over the years to about 400,000 at present, and that does not include thefamily members of amnestied illegal aliens allowed to get green cards in a special visa program.
The rate of increase has been an average of about10,000 per year, or 100,000 per decade.
Under our immigration stability scenario, we assumethat chain migration is ended by restricting entitlementto immigrant visas to only the spouse and minorchildren of an immigrant or a U.S. citizen. We alsoassume ending unneeded immigrant flows for programssuch as the visa lottery and for unskilled aliens. Wefurther assume a continuing refugee resettlementprogram at a ceiling of 50,000 per year (compared tothe current ceiling of 70,000 that allows us to acceptmore refugees than the rest of the world combined).
Nuclear family reunification is related to the size of the influx of new immigrants. As the size is reduced, we assumethat immediate family reunification visas will also fall. For the 2005-10 period, we have assumed family reunificationvisas at 250,000 per year (plus refugees). For each succeeding decade we have assumed a drop in nuclear familyreunification by 25,000 fewer immigrant visas per year. By the 2041-50 decade, family reunification would be at150,000 per year, and the total with refugee admissions would be 200,000 new immigrants. That level of immigrationwould conform to a net-zero level in which emigration balanced immigration.
The low-trend scenario is based on an assumption of continued entry of an average of 800,000 immigrants per yearafter reducing it by 200,000 for emigration. This is approximately the current level when adjusted for the effects ofprocessing the current immigrant visa backlog.
B1
ASSUMPTIONS

The high-trend scenario starts at the same point for 2005, but instead, assumes that rather than maintaining aconstant rate of admissions, the trend of steadily rising immigrant admissions described above continues for the next45 years. That increase is assumed to be an increase of 100,000 per decade above the level of the previous decade.The amnesty/guest worker scenario also uses the high-trend assumption of increasing immigrant admissions, and italso adds the effects of expanded immigrant admissions contemplated in the McCain-Kennedy and other legislationand in the nebulous proposal by President Bush. First, an amnesty is assumed to add an additional 3 million peoplein the first 4 years and 1 million in the next 4 years.
It is not higher than that because most illegal aliens are already included in the U.S. population as residents (albeitillegal residents). Our estimate of the additional impact on the U.S. population from proposed amnesty/guest workerproposals is based on three factors. First, we allow for illegal aliens currently not included in official populationestimates coming forward in order to benefit from the amnesty. Second, we assume that the amnesty provisionswould provide for family members of illegal aliens who are currently not here to qualify for entry as permanentresidents. Third, the change in the law would exempt some family reunification immigration from current limits, whichwe estimate would increase immigrant visas by an average of 400,000 immigrants per year1
The combined effect of these assumptions is that average annual immigration in the amnesty/guest worker scenariowould be 1,900,000 for the period 2005-10. After the initial amnesty surge, legal admissions would drop back beforeresuming the historical climb. The assumption is for annual immigration for the four decades following 2010 toaverage 1,650,000 (2011-20), 1,500,000 (2021-30), 1,600,000 (2031-40), and 1,700,000 (2041-50). Part of thisimmigration would, of course, be offset by emigration.
Illegal Aliens: Without a new comprehensive immigration law enforcement effort, there is no reason to expect otherthan a continuation of the trend in increased employment of illegal aliens, which has grown from about 2 million –after the amnesty in 1987 – to 11-13 million today. Our assumption is that there are currently about 11 million illegalaliens in the country who are included in the base population for 2005 that marks the start of the populationprojections. We assume that there are at least another 2 million illegal aliens in the population who are not includedin the base population, but would be eligible for an amnesty. In addition, we estimate that as many as an additionalmillion aliens would likely enter the country subsequent to the adoption of an amnesty seeking to fraudulently qualifyfor the terms of the amnesty. There are estimates by others of the illegal alien population that are significantly higher.2
Because the illegal alien population is different from the U.S. population in its racial/ethnic makeup, and will, therefore,affect population growth rates differently, we have estimated the composition of that population for each state on thebasis of the countries from which they come. For example, illegal aliens from Mexico and El Salvador, etc., arepresumed to be Hispanic. Illegal aliens from China and India, etc., are presumed to be Asian. Illegal aliens from Haitiand Nigeria, etc., are presumed to be black. And, illegal aliens from Canada and Ireland, etc., are presumed to bewhite. Our projection uses official estimates of country sources of the illegal alien population in 20003 and allocatesthe “other” nationalities on the basis of the distribution of the illegal aliens from other countries who applied for the1986 amnesty.4
This calculation results in an estimate that the illegal alien population is 85.2 percent Hispanic, 7.8 percent Asian, 5.2percent black, and 1.8 percent white. This ratio is held constant over the period of the projection. Data are notavailable that would allow for this percentage to be tailored specifically by state, which, in theory, will vary dependingon the sources of the illegal aliens in that state. However, the preponderance of the illegal alien population for allstates consistently will be Hispanic even though the major flow varies by source country. For example, the bulk of theillegal alien population is from Mexico in California, Arizona, Texas and Illinois, and from Cuba in Florida, and from theDominican Republic in New York and New Jersey, and from El Salvador in the District of Columbia.
For the different scenarios we use different assumptions regarding the illegal alien population. For the immigrationstability projection we assume that by more effective interior and border enforcement new illegal immigration can be
B2

increasingly deterred and border control can be rapidly enhanced. From an initial level of a net addition of 500,000illegal residents added to our population each year, we project a rapid decrease in new illegal entrants andoverstayers and some increased departure of illegal aliens from the country. The result is a projected halving of thecurrent influx during the 2005-10 period, i.e., an addition of 1,250,000 illegal aliens. Over the following decade, weproject net illegal alien settlement being further reduced to a residual of 100,000 per year as a result of more effectivedeterrence and increased voluntary or enforced removal from the country. We assume zero-net illegal immigration tothe country being achieved by 2021. That is not to say that there will be no illegal entrants or overstayers, but ratherthat enforcement will be able to keep pace with the residual influx, and removals will balance illegal newcomers.
In the low-trend scenario, we assume the continuation of the current level of a net addition of half a million illegal alienseach year added to our population. Illegal immigration will fluctuate somewhat on the basis of the economy andenforcement strategies, but the trend has been for the flow of illegal immigrants to adapt to the impediments andresume its flow.
The difference between the low-trend scenario and the high-trend scenario is that the latter assumes that thehistorical pattern of rising illegal immigration will continue its climb despite current deterrence strategies. Ourassumption is that illegal immigration will climb at an average rate of a net increase of 25,000 more illegal aliens eachyear than during the previous decade.
In the amnesty/guest worker scenario, we use the same assumption for illegal immigration as with the high-trendscenario. Advocates for an amnesty and new guest worker program argue that these provisions would end illegalimmigration because the new guest worker program would allow those who would come in illegally to enter in a legalprogram. This argument ignores the continued build-up of illegal immigration despite the already existing guest workerprograms. As long as employers are able to hire unskilled workers outside of a regulated program of guest workersat lower wages and evade minimum employment standards with relative impunity, some will continue to do so. Inaddition, the adoption of an amnesty for illegal aliens will further encourage potential illegal aliens abroad to believethat the United States is not serious about enforcing its immigration laws, and that periodic amnesties willaccommodate those who continue to violate our immigration laws. A new amnesty provision could actually increasethe trend in illegal immigration more than the assumption that we have used.
Guest worker Program: Our assumptions regarding a new guest worker program impact only the amnesty/guestworker scenario. Under the immigration stability scenario and the two current trend scenarios no change from thepresent use of guest worker programs is contemplated. However, it could be that under the immigration stabilityscenario an increasing shortage of illegal alien workers would result in a greater recourse to guest workers.Nevertheless, we assume in the stability scenario that guest worker visas will become restricted to admit foreignworkers only if wage offers in a sector of the economy indicate a true worker shortage by rising after adjusting forinflation. That supply/demand test, in our view, would limit guest worker increases. Even if there were some increasein guest workers, our assumption is that the population effect would be short lived as those guest workers returnhome and are replaced.
The amnesty/guest worker scenario assumes an addition of 100,000 resident guest workers per year, i.e., 500,000from 2005 to 2010 and one million per decade thereafter. This is necessarily an arbitrary estimate. It is also possiblethat initial increases in guest worker admissions would be higher but fall off later as the labor market becamesaturated with foreign workers. Practice would depend not just on the economy but also on employerpreference/recruitment of foreign workers as well as political pressure to curb the program because of risingunemployment and/or dropping real wage rates.
Methodology In brief, there are two general methods used to make projections of future population. A component method is usedwhen detailed forecasts of population structure are needed. The mathematical method, a less time consuming and
B3

less resource intensive methodology, gives satisfactory results for population totals at specific points in time, providedreasonable assumptions regarding growth rates are used.5 Our study uses a mathematical model.
The components used in our model are: first, current trends in the segment of the population that was native-born in1970 (before the major effects unleashed by the 1965 Immigration Act kicked in); second, the trend for post-1970immigrant stock (new immigrants and their children), and third, demographic effects of new immigrants during theprojection period. The alternative projections based on different assumptions include: 1. the population effects thatcould be expected if, as is currently proposed, an amnesty for illegal immigrants were adopted, a new guest workerprogram were launched and current immigration levels were increased; 2. the status quo assuming (a) continuationof the current numerical increase in legal and illegal immigration, and (b) continuation of the trend in growth in bothlegal and illegal immigration, and 3. the population effects if immigration were reduced to replacement level, i.e.,between a fourth and a third of a million persons per year.
Unlike the Census Bureau’s projection, we have not done a high-assumption projection that combines higher fertility,longer lifetimes and higher immigration than currently proposed, nor have we projected a low scenario based on acombination of dropping fertility and shortening average lifetimes. Nevertheless, we believe that our projections basedon differing immigration assumptions will be within the bounds of whatever new projection is done by the CensusBureau to reflect the findings of the 2000 Census.
The usefulness of a population projection is not in describing what the population size and its composition will be atsome point in the future, but rather in describing what it might be given certain circumstances. Public policies andprivate decisions shape our population for better or worse. By projecting population trends based on varyingassumptions, public policy makers are provided an opportunity to consider the possible outcomes and considerchanges in policy that can change the outcome.
State Distribution of ImmigrationTo arrive at the state projections it was necessary to calculate the distribution of both legal and illegal immigration foreach state. And to include a different rate of population growth for each of the racial/ethnic components of legal andillegal immigration, an effort to differentiate the immigration flows of each stream of residents was undertaken. Forlegal immigration, the distribution is derived from 10-year legal admissions data for each state of persons from thetop 31 country sources of immigrants. Immigrants from those countries have been arbitrarily divided by thepredominant racial/ethnic group in that country.
Mexican admissions were used separately. Admissions from Colombia, Cuba, Dominican Republic, Ecuador, ElSalvador, Guatemala, Honduras, Nicaragua and Peru were treated as Other Hispanic immigrants. Bangladesh, China(including Hong Kong and Taiwan), India, Iran, Japan, Korea, Pakistan, Philippines and Vietnam were aggregated assources of Asian immigrants. Countries that were aggregated as sending black immigrants were Guyana, Haiti,Jamaica, Nigeria and Trinidad & Tobago. Admissions from Canada, Germany, Ireland, Poland, former Soviet Union(Russia, etc.), United Kingdom, and former Yugoslavia were treated as sources of white immigrants. These groups ofcountries constitute 75-85 percent of the immigrant admissions for most states, so the percentages derived from thedata are likely to be fairly representative.
Nationally, the distribution of legal immigration was 40.4 percent Hispanic (including 22.4% Mexican), 35.2 percentAsian, 7.7 percent black, and 16.8 percent white. These shares can of course change over time based on such factorsas refugee flows or simply backlog reduction, but there are no known reasons to expect them to change significantlyover the next 45 years, unless as a deliberate act of policy makers.6
For the illegal alien population, this level of separation of the flow did not prove to be feasible, because statebreakdowns by race/ethnicity or by nationality are not available. However, government estimates are available for thedistribution of the Mexican illegal immigrant population by state. Therefore, we assumed a continuation of the
B4

distribution of the estimated Mexican illegal population by state in the projection and allocated the balance of theestimated illegal alien population in each state based on common shares by ethnicity of the nationwide illegal alienpopulation. This estimation procedure is less precise than the one used for legal immigration, but, because Mexicanillegal immigration represents a much larger share of the overall flow of illegal immigration than Mexican legalimmigration does in overall legal admissions, any possible distortion will be moderated.
The factors that influence population change for the country include births, deaths, longevity, and immigration (in-migration) and emigration (out-migration). We have chosen in this study to focus on immigration, although differencesin the other demographic factors are included to the extent that they have influenced the varying demographic trendsin each state from 1970 to the present.
In this population projection, our focus on immigration leads to the development of four scenarios designed tohighlight a broad range of possible outcomes depending on policy decisions made today. These four alternativeprojections are: 1. immigration stability, 2. low-trend immigration, 3. high-trend immigration, and 4. a surge inimmigration from an amnesty/guest worker policy. Those four are described briefly below:
n Immigration stability scenario – If policy makers act in the current Congress to curb illegal immigrationwith comprehensive reforms that remove the incentive for illegal immigration and reduce legal immigration tonuclear family reunification and refugees – as proposed in the TRUE enforcement bill (H.R.4313) – over theperiod of this projection the level of immigration could be brought into balance with emigration (out-migration)currently estimated at about 300,000 per year. This would be a significant reduction from immigration todayat nearly a million per year. Immigration stability would end the role of immigration in driving the nation’scurrent rapid population increase. A significant portion of the population increase resulting from immigrationresults from the children born to immigrants after their arrival. This would lessen gradually over time with thereduction in the volume of new immigration.
n Low-trend immigration scenario – Current immigration is not low; it is massive by any standard, but, if itcontinues at the same average numerical level of increase as at present, that would constitute a lower impacton our future population than if the pattern of increasing levels of immigration over the past three decadeswere to continue. This scenario contemplates no increase in legal or illegal immigration from today’s level.
n High-trend immigration scenario – Unlike the low-trend scenario described above, this scenario focuseson the trend toward both illegal and legal immigration increasing over time, and it incorporates a continuationof that upward trend.7 This scenario assumes no change in law and with border enforcement against illegalimmigration continuing to be hit and miss and interior enforcement largely non-existent. It also assumes thatlegal immigration will continue to grow in categories that are not numerically limited.
n Amnesty/Guest worker scenario – The projection of the highest population in 2050 results from addingthe effects of new immigration provisions to the high-trend scenario. The assumptions regarding newprovisions are derived from the new immigration measures outlined by President Bush and those introducedin the 109th Congress. These measures include granting legal presence to the illegal aliens already residingin the United States, i.e., an amnesty, adoption of a new guest worker program and increases in authorizedlegal immigration.
An amnesty measure, whether it is called that or by some deceptive euphemism such as “earned legalization,”theoretically would not have a population effect in terms of moving those already here from illegal resident status tolegal status. But, in fact, there would be significant effects resulting from empowering the illegal alien population toimmediately bring family members into the country and eventually sponsor extended family members for immigration.Other effects would result from a likely surge of aliens entering the country illegally in an attempt to fraudulentlybenefit from the amnesty opportunity.
B5

Our assumption is that a new amnesty would not decrease illegal immigration. The 1986 amnesty actually usheredin a period of increasing illegal immigration. Similarly, our assumption is that a new guest worker program would haveno more effect on illegal immigration than did the adoption of the current guest worker programs for agriculturalworkers and other unskilled workers, i.e., none. Finally, proposed increases for legal immigration that wouldsignificantly increase both family-reunification and employer-sponsored immigration also affect the amnesty/guestworker scenario.
When these scenarios are developed into projections, each one has different effects in each state based on thedifferent distribution of the existing racial/ethnic composition of the population and the assumed changes to it. This,in turn, has some effect on future population change because of the age structure and different fertility/longevitytrends among the racial/ethnic groups. For example, the current Hispanic preponderance among illegal immigrantscauses further population increase because this population, on average, is disproportionately of reproductive age andtends to have larger family size than the overall population. In each projection the assumption regarding both legaland illegal immigration is an annual net change, which means the number of arriving immigrants is discounted toaccount for emigration.
The divergent results from the four scenarios depict a range of opportunity for policy makers to shape the populationdynamics for future generations. As may be seen in the projections, demographic change is not achieved overnight.It entails foresight and long-term advanced planning. It is precisely for this reason that a focus on the nation’spopulation future must not be deferred for political expediency.
FAIR’s policy position is in favor of the immigration stability scenario. The reason for this position is grounded in theeffects of population growth on the national environment and society. These effects include a very broad range ofaspects from sprawl to non-renewable resource depletion, shrinking fresh water supplies, greenhouse emissions,income inequality, poverty, wages and working conditions, assimilation and many other issues that are explained atlength on our website (www.fairus.org) and will not be expounded on here.
Assumptions related to Growth Rates by Race/EthnicityThe Census Bureau in its population projections has used differing assumptions on total fertility rates and longevityfor different segments of the population. By contrast, our projection uses different assumptions regarding populationgrowth rates by different segments of the population for each state on the basis of the historical pattern of changefor that segment. Those rates vary for each state on the basis of a combination of factors involving fertility andlongevity as well as the net immigration and domestic migration patterns.
In applying past patterns of change to the future it has been necessary to make assumptions as to how those patternsmay change over time. Our assumption, based on past trends, is that the pre-1970 non-Hispanic white (NHW)population will continue to display the lowest rate of growth, dipping slightly into negative growth after 2040. From2020-40 the annual rate of growth diminishes to .00043 (.043%), i.e., nearly a zero rate of growth. The NHW post-1970 immigrant population is assumed to grow at .002074 (.2074%) after 2040. This rate also applies to the NHWpopulation included in the amnesty population.
For Asians in the post-1970 immigrant cohort, the same rate of growth through 2020 is used as for the NHWpopulation. Beginning in 2020, the Asian and “other” post-1970 immigrant cohorts are assumed to have the samerate of growth as they had during the 1960-80 period.
Hispanics, including Mexicans, in the post-1970 immigrant population are assumed to have the same rate of growthas they exhibited during the 1960-2004 period. The same is true for blacks in the post-1970 immigrant population,except the 2040 rate is .01028 (1.028%).
For post-2005 immigrants the assumed rates of growth vary by race/ethnicity. For the NHW population, the rate is
B6

.00543 (.543%). It is .015822 (1.582%) for Hispanics including Mexicans. For Asians and “others,” the rate is
.014821 per year (1.4821%). For blacks in this post-2005 cohort, the assumed rate of increase is .012007(1.2007%).
These rates are derived from the 1960-2004 experience for each racial/ethnic group except for Asians and “others”for whom the 1960-80 historical trend is used because of later data inconsistencies.
Although these population growth estimates are not dependent upon separate assumptions regarding fertility, as thatis built into the growth rate assumptions, at the national level, because there is no intra-state migration, approximatefertility assumptions may be imputed from the prevailing growth rates. The following table indicates those rates bycohort and by race/ethnicity.
CohortWhite, notHispanic
MexicanOther
HispanicBlack Asian Other
1970 Population 2.19 2.82 2.82 2.66 2.45 2.30
Post-1970 Foreign Stock 2.34 3.42 2.82 2.87 2.34 2.96
Post-2004 Immigration 2.44 3.30 3.30 2.97 3.21 3.20
B7
Endnotes1 The Kennedy-McCain current proposal in Congress would increase family reunification immigration by removing from the ceiling the siblings,
stepchildren and grandchildren of naturalized immigrants and U.S.-born sponsors. This could add as many as 400,000 additional familyreunification admissions each year. This should be factored in as an increase in an amnesty/guest worker scenario.)
2 Justich, Robert and Betty Ng, “The Underground Labor Force Is Rising To The Surface,” Bear Stearns, January 2005. This analysis concludedthat, “The number of illegal immigrants in the United States may be as high as 20 million people…”.
3 Office of Immigration Statistics, Department of Homeland Security, “2002 Yearbook of Immigration Statistics,” October 2003 (p. 214).
4 Immigration and Naturalization Service, “1989 Statistical Yearbook of the Immigration and Naturalization Service”, September 1990 (pp. 46-47).
5 Hinde, Andrew, Demographic Methods, Arnold Publishers, London, 1998, p. 199.
6 Changed policies would be required to achieve the immigration stability (zero-net) scenario, and those changes could reshape the flow oflegal immigrants over time, but not radically as long as family reunification remained a major component of that policy.
7 Immigrant admissions were an annual average of 449,000 during the 1970s, 598,000 during the 1980s, and 779,000 during the 1990s,and the average from 2000 to 2004 was 945,000. The illegal immigrant population was estimated to be 2.775 million in 1988, 3.9 millionin 1992, 5 million in 1996, and 7 million in 2000. This suggests that at the end of the 1990s illegal immigration was adding a net increaseof about half a million persons per year to our population compared to less than 300,000 per year earlier. These numbers are net increasesafter accounting for illegal aliens who have gained legal status through some form of amnesty or sponsorship, those who have returned homeand those who have died. Some demographers believe that the influx of illegal aliens dropped somewhat since the 9/11 terrorist attacks,perhaps as a result of increased border security or a downturn in the economy. However, our assessment is that even if this estimate iscorrect, it is ephemeral, and without significantly increased enforcement measures the upward trend will continue. In fact, it may already haveagain increased as a result of the administration’s announced support for a form of two-step amnesty, the upturn in the economy, and thejob opportunities resulting from Hurricane Katrina and other natural disasters.
The Federation for American Immigration Reform (FAIR) is a national, nonprofit, public-interest,membership organization of concerned citizens who share a common belief that our nation's immigrationpolicies must be reformed to serve the national interest.
FAIR seeks to improve border security, to stop illegal immigration, and to promote immigration levelsconsistent with the national interest—more traditional rates of about 300,000 a year.
With more than 198,000 members and supporters nationwide, FAIR is a non-partisan group whosemembership runs the gamut from liberal to conservative. Our grassroots networks help concerned citizensuse their voices to speak up for effective, sensible immigration policies that work for America’s bestinterests.
About FAIR
HHeerree’’ss aann aaddddiittiioonnaall ccoonnttrriibbuuttiioonn ttoo hheellpp sspprreeaadd tthhee wwoorrdd!!
r $25 r $50 r $100 r $250 r $500 r $1,000 r Other $_________________
I am making my donation by check ppaayyaabbllee ttoo FFAAIIRR, or credit card
r Visa r MasterCard r American Express r Discover
Name on Card:_________________________________________________________
Card # :_________________________________________________ Expiration Date:___________
Amount:_________________ Signature:_______________________________________________
Please mail your tax-deductible contribution to: FAIR, PO Box 1859, Merrifield, VA 22116-9635If you have any questions or would like to receive membership information, please contact Melissa Bradley-Wilson: (202) 328-7004.
Help stop illegal immigration andbring legal immigration under control.

1666 Connecticut Avenue, NW | Suite 400 | Washington, DC 20009202.328.7004 | 202.347.3887 (fax) | [email protected] | www.fairus.org
ISBN 0-9746733-3-1
Federation for AmericanImmigration Reform
TM © March 2006 (Rev. Dec. 2006) FAIR Horizon PressTM | All rights reserved Printed in the United States of America