quarterly newsletter - cdda newsletter q4.pdf · the center for dynamic data analytics quarterly...
TRANSCRIPT

- White House Technology Convergence Commission: The CDDA has been invited to participate
in the White House Technology Convergence Commission, organized by TechAmerica. The goal
of the commission is to proactively provide recommendations to the U.S. federal government on
the convergence of social, mobile, analytics, and cloud (SMAC) and its ability to improve effi-
ciency, services and capabilities while driving innovation and the economy. More info here.
- The CDDA Fall 2014 Workshop and IAB Meeting is scheduled for Tues. Nov. 4th and Wed.
Nov. 5th and will be held at the Livingston Student Center on the Rutgers Livingston Campus in
Piscataway, NJ. Please register here.
- The CDDA is in the early stages of organizing a Big Data Tools Marketplace Report to help cata-
log and describe the multitude of data analytics tools that are being offered and implemented in
the current technology market. A presentation is being planned for the Fall 2014 CDDA Meeting
to describe the report. If you are interested in learning more, please contact
[email protected] for further information.
Tissue Quantification Project: PI, Dimitris Metaxas, IAB Collaborators, Colin Miller and Hui Jing Yu,
BioClinica
Anomaly Detection in Dynamic Networks: PI, Leman Akoglu, IAB Collaborator, Steve Cento, North-
rop Grumman Aerospace Sector
Remote Volume Rendering Pipeline for mHealth Applications: Researcher, Ievgeniia Gutenko, IAB
Collaborator, Ron Cha, Samsung Research America
Statistical Stylometry: PI, Yejin Choi, Stony Brook
Big Graph Mining: PI, Tina Eliassi-Rad, Rutgers
Privacy Preserving Data Mining: PI, Jaideep Vaidya, Rutgers
The Reality Deck - 1.5 Gigapixel Display: PI, Arie Kaufman, Stony Brook
4D Cardiac Fluid Flow Modeling: PI, Dimitris Metaxas, Rutgers
Optimal Bidding Strategies in Sequential Auctions: PI, Michael Katehakis, Rutgers
Exploring the Role of Gaze Behavior in Video Annotation: PI, Dimitris Samaras, Stony Brook
How Fast is NFSv4.1 -- A Benchmark Study of the Linux NFSv4.1: PI, Erez Zadok, Stony Brook
Surgical Tool Segmentation from Ultrasound: PI, Ilker Hacihaliloglu, Rutgers
Scalable Parallel Processing Algorithms for Sequence Alignment and Assembly: PI, Song Wu, SB
Polyglot: NLP for all the World's Languages: PI, Steve Skiena, Stony Brook
Natural Language Understanding with Logic Programming: PI, Paul Fodor, Stony Brook
RFID Sense-a-Tags for the Internet of Things: PI, Petar M. Djuric, Stony Brook
Collaborative Information Seeking: PI, Chirag Shah, Rutgers
Announcements
The Center for Dynamic Data Analytics
Quarterly Newsletter
Published October 10, 2014 Edition: Fourth Quarter, 2014
Contents
Announcements
Current Projects
Publications
Big Data News
Upcoming
Conferences
Featured
Publications
Collaboration
Outreach
Current Projects

Focused Clustering and Outlier Detection in Large Attributed Graphs
From Large Scale Image Categorization to Entry-Level Categories
A Guide to Selecting a Network Similarity Method
Improved Heuristic Search for Sparse Motion Planning Data Structures
Planning with Transaction Logic
Visual Correlation Analysis of Numerical and Categorical Data on the Correlation Map
Mining data from mobile devices: a survey of smart sensing and analytics
Cost-Oblivious Storage Reallocation
User-driven system-mediated collaborative information retrieval
Volume-specific parameter optimization of 3D local phase features for improved ex-traction of bone surfaces in ultrasound
11/4-5/14: Piscataway, NJ—CDDA Fall 2014 Workshop and IAB Meeting
11/6-7/14: Miami, FL—Social and Digital Analytics Innovation
11/10-13/14: Las Vegas, NV—Data Analytics Week
11/17-18/14: Barcelona, Spain—1st Intl. Conf. on Predictive APIs and Apps
11/18-19/14: Boston, MA—Big Data for Finance Summit
12/2-3/14: London, England—Big Data Europe Conference 2014
12/15-19/14: Cambridge, MA—4th ASE Intl. Conference on Big Data
12/28-29/14: New Delhi, India—Big Data and Analytics for Business
1/11-13/15: Richmond, VA—Ops Research and Comp., Algor. and Softw. For Analytics
1/14-16/15: Rio de Janiero, Brazil—NetScix2015, Conference on Network Science
Publications
Upcoming Conferences
Big Data News
How Cities Are Using Analytics to Improve Public Health
A Predictive Analytics Primer
IBM Watson Data Analysis Service Revealed
Visual Data Discovery: 4 Storytelling Approaches Compared
A Process for Human-Algorithm Decision Making
ebook: Moneyball Analytics for Healthcare
Do You Know Who Owns Analytics at Your Company?
Page 2 The Center for Dynamic Data Analytics Quarterly Newsletter
Informationarchitects.jp presents the 200
most successful websites on the web,
ordered by category, proximity, success,
popularity and perspective in a mindmap.
“Hiding within those
mounds of data is
knowledge that could
change the life of a
patient, or change the
world.” – Atul Butte,
Stanford School of
Medicine
The Top 50 UK PR Twitter accounts and their
followers. Porter Novelli Global via Flickr.
Abstract— Human spending behavior is essentially social. This work moti-vates and grounds the use of mobile phone based social interaction fea-tures for classifying spending behavior. Using a data set involving 52 adults (26 couples) living in a community for over a year, we find that social behav-ior measured via face-to-face interac-tion, call, and SMS logs, can be used to predict the spending behavior for couples in terms of their propensity to explore diverse businesses, become loyal customers, and overspend. Our results show that mobile phone based social interaction patterns can provide more predictive power on spending behavior than often-used personality based features. Obtaining novel in-sights on spending behavior using social-computing frameworks can be of vital importance to economists, marketing professionals, and policy makers.
Introduction—People’s social behav-ior has been shown to affect their obesity levels, reproductive fitness, productivity, software adoption, college choices, substance abuse, political affiliations, and health char-acteristics (e.g. [5, 6]). In the last decades, many researchers in sociol-ogy, social psychology, cultural an-thropology, and even economics have also described the spending behavior as a social construct, pointing out that social relations influence consumer behavior (e.g. [22]). Recently, mobile devices have been employed to both study the links between the various facets of human behavior [8, 9], and also influence human behavior in positive ways [4]. Multiple efforts have attempted to monitor health state, affect, mobility, social domi-nance and personality traits (e.g. [10, 12, 15]) using mobile sensing. Our work extends these efforts to a new domain: spending behavior. Analyzing a dataset consisting of social interac-tion patterns and self-reported spend-ing data for 52 adults (26 couples), we
show that there are significant links between social behavior and spending patterns. In particular social interac-tion patterns measured via face-to-face interactions, call, and SMS logs, can be used to predict couple’s pro-pensity to: (1) explore diverse busi-nesses, (2) engage frequently with them, (3) and overspend. These find-ings not only motivate a potentially new line of investigation into spend-ing behavior using mobile phone sensing, they also demonstrate the feasibility of undertaking similar studies at a larger scale in the near future. Understanding which couples are likely to explore diverse busi-nesses and engage frequently with them is vital information for market-ing campaign managers. It affects two fundamental aspects of marketing: customer acquisition and customer retention.
(for more, please visit here)
To discuss possible ideas based on this publication, please contact Dr. Vivek Singh at [email protected]
Featured Publication - Predicting Spending Behavior using Socio-Mobile Features
Collaboration Outreach
This section will feature requests for introductions to potential collaborators for all CDDA participants. Example: “Jane Doe from Rutgers is looking for collaborators in the Ads and Commerce Division of Google.” or “John Doe from (CDDA Member Company) would like to discuss a possible collaboration with data scientists who have expertise in analytical chemistry.” Listings will be anonymized upon request. Please contact [email protected] for postings
Page 3 Edition: Fourth Quarter, 2014
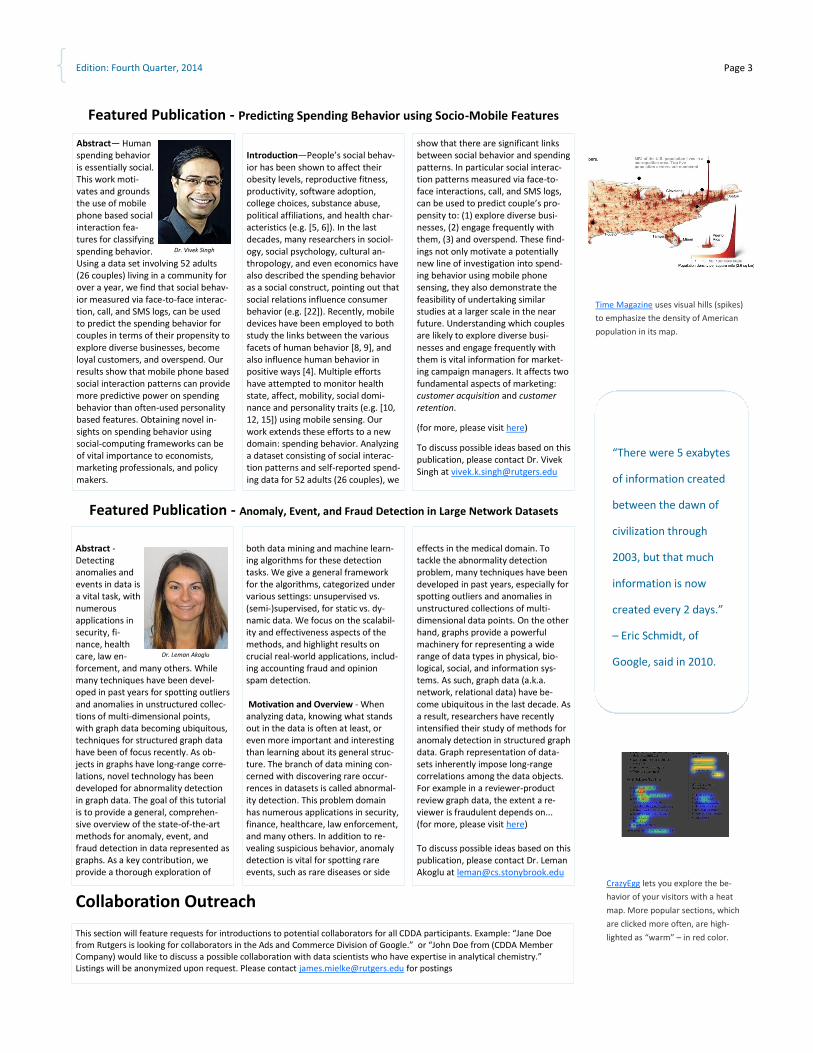
Time Magazine uses visual hills (spikes)
to emphasize the density of American
population in its map.
CrazyEgg lets you explore the be-
havior of your visitors with a heat
map. More popular sections, which
are clicked more often, are high-
lighted as “warm” – in red color.
“There were 5 exabytes
of information created
between the dawn of
civilization through
2003, but that much
information is now
created every 2 days.”
– Eric Schmidt, of
Google, said in 2010.
Abstract - Detecting anomalies and events in data is a vital task, with numerous applications in security, fi-nance, health care, law en-forcement, and many others. While many techniques have been devel-oped in past years for spotting outliers and anomalies in unstructured collec-tions of multi-dimensional points, with graph data becoming ubiquitous, techniques for structured graph data have been of focus recently. As ob-jects in graphs have long-range corre-lations, novel technology has been developed for abnormality detection in graph data. The goal of this tutorial is to provide a general, comprehen-sive overview of the state-of-the-art methods for anomaly, event, and fraud detection in data represented as graphs. As a key contribution, we provide a thorough exploration of
both data mining and machine learn-ing algorithms for these detection tasks. We give a general framework for the algorithms, categorized under various settings: unsupervised vs. (semi-)supervised, for static vs. dy-namic data. We focus on the scalabil-ity and effectiveness aspects of the methods, and highlight results on crucial real-world applications, includ-ing accounting fraud and opinion spam detection. Motivation and Overview - When analyzing data, knowing what stands out in the data is often at least, or even more important and interesting than learning about its general struc-ture. The branch of data mining con-cerned with discovering rare occur-rences in datasets is called abnormal-ity detection. This problem domain has numerous applications in security, finance, healthcare, law enforcement, and many others. In addition to re-vealing suspicious behavior, anomaly detection is vital for spotting rare events, such as rare diseases or side
effects in the medical domain. To tackle the abnormality detection problem, many techniques have been developed in past years, especially for spotting outliers and anomalies in unstructured collections of multi-dimensional data points. On the other hand, graphs provide a powerful machinery for representing a wide range of data types in physical, bio-logical, social, and information sys-tems. As such, graph data (a.k.a. network, relational data) have be-come ubiquitous in the last decade. As a result, researchers have recently intensified their study of methods for anomaly detection in structured graph data. Graph representation of data-sets inherently impose long-range correlations among the data objects. For example in a reviewer-product review graph data, the extent a re-viewer is fraudulent depends on... (for more, please visit here) To discuss possible ideas based on this publication, please contact Dr. Leman Akoglu at [email protected]
Featured Publication - Anomaly, Event, and Fraud Detection in Large Network Datasets
Dr. Leman Akoglu
Dr. Vivek Singh

Rutgers Address:
617 Bowser Rd.
Piscataway, NJ
08854
Stony Brook Address:
1500 Stony Brook Rd.
Stony Brook, NY
11794
E-mail: [email protected]
Phone: 848-445-8824
E-mail: [email protected]
Phone: 631-632-4627
About CDDA
The Center for Dynamic Data Analytics
(CDDA) is a National Science Foundation
(NSF) sponsored Industry and University
Cooperative Research Program (I/UCRC)
established between Rutgers University
and the State University of New York
(SUNY), Stony Brook.
The motivation for this center is the lack
of scalable algorithms, methods and solu-
tions for addressing the ever increasing
amounts of industry-related data. The
focus is on data sets that are massive,
dynamic, complex and multidimensional,
or what is commonly known as Big Data
analytics. The goal of the center is to dis-
cover, develop and apply data analytics
solutions to industry problems such that
the chaotic data is transformed into
knowledge and industry products.
NSF Factsheet—CDDA
The Center for
Dynamic Data Analytics
“From Chaos to Knowledge”
cdda.rutgers.edu
Logos featured in this logo collage represent several partners and sponsors of the CDDA. All logos are property of their respective owners. Presence, position or size in
the collage does not reflect center membership, specific significance or specific contribution to the CDDA.
CDDA Partners and Sponsors