report cover page - cebra.unimelb.edu.au · 3.data mining methods should be further developed and...
TRANSCRIPT

AQIS Import Clearance Review
Report Cover Page
ACERA Project
0804
Title
AQIS Import Clearance Review
Author(s) / Address (es)
A. Robinson, Department of Mathematics and Statistics, University of Melbourne, M. Burgman, ACERA, University of Melbourne, W. Atkinson, AQIS, R. Cannon, AQIS, C. Miller, AQIS, H. Immonen, AQIS.
Material Type and Status (Internal draft, Final Technical or Project report, Manuscript, Manual, Software)
Final Project report
Summary
This report outlines a system that will assist AQIS managers to allocate effort among
inspection activities. It provides a means of guaranteeing a specified degree of reliability in
detection that takes into account the underlying risk, and that also provides information and
a degree of deterrence for less risky pathways. The system is provided within a wider
framework that will assist managers to feed back improved knowledge on risk to those who
set policy, as information accumulates over time.
Received By: Date:
ACERA / AMSI SAC Approval: Date: ACERA Use only
DAFF Endorsement: ( ) Yes ( ) No Date:
Report Cover Page
ACERA Project
1206F
Title
Statistical Modelling and Risk Return Improvements for the Plant Quarantine Pathway
Author(s) / Address(es)
Tony Arthur, ABARES, Department of Agriculture
Sam Zhao, ABARES, Department of Agriculture
Andrew Robinson, Australian Centre of Excellence for Risk Analysis
Brendan Woolcott, Plant Division, Department of Agriculture
Enrico Perotti, Plant Division, Department of Agriculture
Christina Aston, Plant Division, Department of Agriculture
Material Type and Status
Progress and Final Report
Summary
Background: Studies of CSP (continuous sampling plan) strategies carried out by ACERA,ABARES and the Plant Division of Department of Agriculture have shown that CSPcombined with stratification by factors such as importers, suppliers, and countries canincrease detection rate relative to random sampling with the same effort for some path-ways of import activity. This project is designed to extend the usability of CSP technologyinto further pathways by various means, including data mining.
Overview: The original objectives of this project were to (1) analyse six additional pathwaysusing CSP methods; (2) extend ACERA project 1101C to develop methodologies fordata mining to identify high- and low-risk pathways; (3) determine whether simultaneousanalysis of multiple pathways using CSP is possible and develop the methodology; and(4) develop analytical capacity within Department of Agriculture to use the tools andapproaches.
Outcomes: The following outcomes arise from this report.
1. Reanalysis of four pathways currently having CSPs trialled operationally by De-partment of Agriculture (dried apricots, green coffee beans, sesame seeds and drieddates), plus analysis of two additional pathways (cashew nuts and raisins), focussingon stratification by importer and incorporating additional criteria to select valuesfor clearance and (CN) monitoring fraction (MF).
2. Analysis of a combined pathway (‘nuts’), showing that a CSP could be applied to thewhole pathway rather than to all the individual pathways (namely cashews, almonds,walnuts, etc.), and achieve similar biosecurity outcomes with less inspection effort.
3. Development of capacity in ABARES and Plant Import Operations to implementand extend CSP analysis.
Outcomes (ctd):
4. Development of capacity in ABARES to implement and extend data mining ofimport data for the purposes of (1) identifying pathways that may be suitable for aCSP; and (2) identifying factors associated with pathways that may allow targetingof effort to reduce risk.
5. Development of an excellent working relationship between Plant Import Operations,ACERA and ABARES which facilitates the implementation of research into Depart-ment of Agriculture operations and policy development and enhances identificationof the future research agenda.
Recommendations: The following recommendations arise from this report.
1. Plant Import Operations, ACERA (now CEBRA; Centre of Excellence for Biosecu-rity Risk Analysis) and ABARES should continue to work closely together to addressthe issues identified below and to ensure outcomes are appropriately implementedin the department’s operations and policy development.
2. Decisions about the enhanced inspection number and random inspection propor-tion to implement when it becomes operationally active should include a full con-sideration of the CSP analyses for individual pathways presented in this report,particularly leakage and IPD.
3. Data mining methods should be further developed and applied to enable identifica-tion of high risk components of pathways.
4. Combined pathway CSP analysis should be trialled on additional pathways to refinethe methodology. Careful a priori decisions should be made about which pathwaysshould be considered for combining prior to analysis. For example, if a particularsub-component of a pathway contains a risk factor that may be considered too riskyto consider for a CSP it should be excluded from the combined analysis (chestnutsand the risk presented by chestnut blight may be an example).
5. Upgrade computer hardware and software. Current data mining techniques arelimited by the available computer hardware and software (32 bit windows vs. 64 bitwindows) in the department. This needs to be addressed to allow appropriate datamining to proceed.
6. Develop methods to regularly assess CSP performance. This will ensure any changesto the risk posed by the pathway will be managed appropriately once the CSP hasbeen implemented.
ACERA Use only
Received By: Date:
ACERA Use Only ACERA SAC Approval: Date:
Department of Agriculture Endorsement:( ) Yes ( ) No
Date:
2

AQIS Import Clearance Review
Report Cover Page
ACERA Project
0804
Title
AQIS Import Clearance Review
Author(s) / Address (es)
A. Robinson, Department of Mathematics and Statistics, University of Melbourne, M. Burgman, ACERA, University of Melbourne, W. Atkinson, AQIS, R. Cannon, AQIS, C. Miller, AQIS, H. Immonen, AQIS.
Material Type and Status (Internal draft, Final Technical or Project report, Manuscript, Manual, Software)
Final Project report
Summary
This report outlines a system that will assist AQIS managers to allocate effort among
inspection activities. It provides a means of guaranteeing a specified degree of reliability in
detection that takes into account the underlying risk, and that also provides information and
a degree of deterrence for less risky pathways. The system is provided within a wider
framework that will assist managers to feed back improved knowledge on risk to those who
set policy, as information accumulates over time.
Received By: Date:
ACERA / AMSI SAC Approval: Date: ACERA Use only
DAFF Endorsement: ( ) Yes ( ) No Date:
Statistical Modelling and Risk Return Improvements for the PlantQuarantine Pathway
ACERA 1206F Final Report
Tony Arthur, ABARES, Department of AgricultureSam Zhao, ABARES, Department of AgricultureAndrew Robinson, Australian Centre of Excellence for Risk AnalysisBrendan Woolcott, Plant Division, Department of AgricultureEnrico Perotti, Plant Division, Department of AgricultureChristina Aston, Plant Division, Department of Agriculture
November 1, 2013
Final Report on ACERA project 1206F
Statistical Modelling and Risk Return Improvements for the
Plant Quarantine Pathway
Tony Arthur1, Sam Zhao1, Andrew Robinson2, Brendan Woolcott3,
Enrico Perotti3 and Christina Aston3
1. ABARES, Department of Agriculture
2. ACERA, The University of Melbourne
3. Biosecurity Plant Division, Department of Agriculture
1 November, 2013
Contents
Table of Contents 2
Table of Definitions 4
1 Introduction 10
2 Modifications and extensions to Continuous Sampling Plan approaches (includingan analysis of the Raisin Pathway) 132.1 Introduction and general approach . . . . . . . . . . . . . . . . . . . . . . . . . . 13
2.1.1 The simulation method . . . . . . . . . . . . . . . . . . . . . . . . . . . . 142.1.2 Inspection effectiveness . . . . . . . . . . . . . . . . . . . . . . . . . . . . 142.1.3 Choosing inspection strategies . . . . . . . . . . . . . . . . . . . . . . . . 15
2.2 Analysis of the Raisins pathway . . . . . . . . . . . . . . . . . . . . . . . . . . . . 172.2.1 Import Conditions . . . . . . . . . . . . . . . . . . . . . . . . . . . . . . . 172.2.2 Design of the Analysis . . . . . . . . . . . . . . . . . . . . . . . . . . . . . 172.2.3 Pathway Summary . . . . . . . . . . . . . . . . . . . . . . . . . . . . . . . 182.2.4 Simulation Results . . . . . . . . . . . . . . . . . . . . . . . . . . . . . . . 20
3 Analysis of CSP inspection strategies for the nut pathway 293.1 Background . . . . . . . . . . . . . . . . . . . . . . . . . . . . . . . . . . . . . . . 293.2 Import Conditions . . . . . . . . . . . . . . . . . . . . . . . . . . . . . . . . . . . 303.3 Pathway Summary . . . . . . . . . . . . . . . . . . . . . . . . . . . . . . . . . . . 303.4 Simulation Results . . . . . . . . . . . . . . . . . . . . . . . . . . . . . . . . . . . 323.5 Comparison of the combined nut data with individual nut pathways . . . . . . . 44
4 Data mining the nut pathway 474.1 Introduction . . . . . . . . . . . . . . . . . . . . . . . . . . . . . . . . . . . . . . . 474.2 Data summaries . . . . . . . . . . . . . . . . . . . . . . . . . . . . . . . . . . . . 474.3 Data mining using penalised regressions and random forest approaches . . . . . . 49
4.3.1 Methodologies . . . . . . . . . . . . . . . . . . . . . . . . . . . . . . . . . 494.3.2 Results of data-mining . . . . . . . . . . . . . . . . . . . . . . . . . . . . . 514.3.3 Issues arising during the regression process . . . . . . . . . . . . . . . . . 63
4.4 Analysis of shelled vs. unshelled nuts with the Random Forest method . . . . . . 63
5 Discussion and recommendations 665.1 Criteria for assessing a CSP . . . . . . . . . . . . . . . . . . . . . . . . . . . . . . 665.2 Applying a CSP to a combined pathway . . . . . . . . . . . . . . . . . . . . . . . 675.3 Data mining . . . . . . . . . . . . . . . . . . . . . . . . . . . . . . . . . . . . . . . 685.4 Building and using capacity with the department . . . . . . . . . . . . . . . . . . 685.5 Other issues . . . . . . . . . . . . . . . . . . . . . . . . . . . . . . . . . . . . . . . 68
5.5.1 Modelling algorithms and computer infrastructure . . . . . . . . . . . . . 68
2
DA Biosecurity: Plant-Product Pathways CSP and Data-Mining
5.5.2 Changes to the CSP simulation approach . . . . . . . . . . . . . . . . . . 695.5.3 CSP post implementation . . . . . . . . . . . . . . . . . . . . . . . . . . . 69
5.6 Recommendations . . . . . . . . . . . . . . . . . . . . . . . . . . . . . . . . . . . 69
A Analysis of Cashew pathway 71A.1 Import Conditions . . . . . . . . . . . . . . . . . . . . . . . . . . . . . . . . . . . 71A.2 Pathway Summary . . . . . . . . . . . . . . . . . . . . . . . . . . . . . . . . . . . 71A.3 Simulation Results . . . . . . . . . . . . . . . . . . . . . . . . . . . . . . . . . . . 76
B Updated Analysis of Imported Plant Pathways on Current Dashboard 84B.1 Background . . . . . . . . . . . . . . . . . . . . . . . . . . . . . . . . . . . . . . . 85B.2 Methods . . . . . . . . . . . . . . . . . . . . . . . . . . . . . . . . . . . . . . . . . 85B.3 Dried apricots . . . . . . . . . . . . . . . . . . . . . . . . . . . . . . . . . . . . . . 85
B.3.1 Pathway characteristics . . . . . . . . . . . . . . . . . . . . . . . . . . . . 85B.3.2 Simulation Results . . . . . . . . . . . . . . . . . . . . . . . . . . . . . . . 86
B.4 Green coffee beans . . . . . . . . . . . . . . . . . . . . . . . . . . . . . . . . . . . 95B.4.1 Pathway characteristics . . . . . . . . . . . . . . . . . . . . . . . . . . . . 95B.4.2 Simulation Results . . . . . . . . . . . . . . . . . . . . . . . . . . . . . . . 96
B.5 Hulled sesame seeds . . . . . . . . . . . . . . . . . . . . . . . . . . . . . . . . . . 107B.5.1 Pathway characteristics . . . . . . . . . . . . . . . . . . . . . . . . . . . . 107B.5.2 Simulation Results . . . . . . . . . . . . . . . . . . . . . . . . . . . . . . . 107
B.6 Dried Dates Pathway . . . . . . . . . . . . . . . . . . . . . . . . . . . . . . . . . . 115B.6.1 Pathway characteristics . . . . . . . . . . . . . . . . . . . . . . . . . . . . 115B.6.2 Simulation Results . . . . . . . . . . . . . . . . . . . . . . . . . . . . . . . 115
3
DA Biosecurity: Plant-Product Pathways CSP and Data-Mining
Table 1: Table of definitions used throughout the text.
Term Definition
CN , MF CN (Clearance Number ) and MF (monitoring fraction) are key parametersof CSP methods. By definition, a CSP method is designed to have twomodes: an enhanced inspection mode where all consignments are subjectedto mandatory inspections and a monitoring mode where only a proportion,which is called a MF in this report, of consignments are inspected. Under theframework of CSP, inspections start with enhanced modes and then switchbetween these two modes when certain given conditions are satisfied. Anenhanced inspection mode can be switched to a monitoring mode if successivecompliant consignments reached a certain given number. We call this numbera CN .
CSP CSP stands for continuous sampling plan. A CSP is a method for determiningwhether or not to inspect a consignment, based on the recent inspectionhistory of the pathway, and some parameters that the pathway managersets.
Effectiveness Effectiveness is taken to mean the quality of intervention, usually thequality of inspection, and is commonly defined as the probability thatexisting contamination will be detected and rectified. That is, if a unitis contaminated, the effectiveness of inspection is the probability that thecontamination will be detected if the unit is inspected. In this report forsimulation, we assume the effectiveness to be 0.90.
Inspection Inspection refers to the manual examination of a line or consignment.
IPD With IPD (Inspection Per Detection), we measure how many inspections areneeded to detect a quarantine failure. In addition to PIC, IPD is consideredas another criteria for selecting between CSP strategies.
Leakage Leakage is the amount of undetected biosecurity risk material that passesthrough an intervention point.
Pathway The pathway is defined as a collection of activities that culminate in thearrival to Australia of a set of alike inspection units. Pathways can besubdivided to reflect management constraints or to enable focusing inspectionresources on sub-pathways that are thought to be most risky. Examples are:the arrival of ‘nuts’; or the sub-pathway cashews; dried apricot.
Pathway failure(PF )
A pathway failure will be any kind of non-compliance associated with aconsignment on a pathway, including failures that do not necessarily representa biosecurity risk. For example, inadequate documentation for a consignmentis a pathway failure, as is contamination by a pest or disease.
PIC PIC (Post-intervention compliance) is an important selection criteria for CSPstrategies. PIC is defined by a proportion of compliant consignments afterinterventions, e.g. inspections etc, over total volume of a pathway.
Quarantine failure(QF )
A quarantine failure will be non-compliance that is a biosecurity riskassociated with a consignment on a pathway. For example, contamination bya pest or disease is a quarantine failure, but inadequate paperwork is not.
4
DA Biosecurity: Plant-Product Pathways CSP and Data-Mining
ROC curve ROC (Receiver Operating Characteristics) curve is a graphical plot that isconstructed by true positive rates (sensitivity) against false positive rates (1- specificity) of a binary statistical model. AUC (area under curve), rangedbetween zero and one, of ROC curve is an index measuring performance ofthe binary model. The value of one indicates a perfect model.
5
DA Biosecurity: Plant-Product Pathways CSP and Data-Mining
Executive Summary
Many different plant-based products are imported into Australia. Some of these productsmay present a biosecurity risk to Australia because they contain biosecurity risk material(BRM; insects, pathogens, contamination, etc). Hence, these products are subjected to variousquarantine interventions, ranging from documentary assessments to mandatory on-arrival inspections.These interventions are designed to reduce the likelihood of entry of BRM that could haveundesirable impacts in Australia.
Imports are managed by considering plant import “pathways”. Pathways are defined by theDepartment of Agriculture (DA) pathway manager, and can be any grouping of importedproducts, for example “raisins”. Grouping may also relate to things like individual importers,or countries of origin. The overall biosecurity risk presented by a plant import pathway isdetermined by the likelihood of arrival of BRM in an import, and the severity of possibleimpact of that BRM. Current intervention strategies do not necessarily reflect this risk, andthe department is changing pathway management strategies as part of the biosecurity reformagenda arising from the Beale review [1]. The current biosecurity reform process includes theimplementation of a risk-based approach to biosecurity, to minimise the risk to Australia fora given level of investment (risk-return). Moving resources from areas where risk is relativelylow and focusing these resources in areas where more substantial reductions in risk could beachieved, would contribute to this. In this report we extend earlier ACERA work [2, 3] andfocus on two broad areas designed to deal more appropriately with biosecurity risk, namelyContinuous Sampling Plans (CSPs; described below) and data mining.
Broadly speaking the project comprised four themes: (i) comparison of CSP alternatives using anew criterion, namely“inspections per detection”(IPD: the average number of import inspectionscarried out to detect an import containing BRM), and more explicit consideration of existingcriteria such as leakage (leakage refers to the number of imports containing BRM missed oversome time period of interest, hence entering the post-border area of Australia); (ii) the implicationsof applying a CSP to manage a “combined” pathway (e.g. “nuts”) as opposed to componentpathways (e.g. almonds, cashews, walnuts, etc); (iii) investigating the role of data mining foridentifying high-risk components of pathways; and (iv) using and building on internal capacitywithin the department (ABARES) to facilitate the uptake of the outcomes of this work.
Criteria for assessing a Continuous Sampling Plan
CSPs monitor pathways by switching between modes of random inspection, where a proportionof imports are inspected, and enhanced inspection, where a consecutive number of importsare inspected. These are referred to as CSP rates. Switching between modes depends on theoutcomes from recent inspections of imports on a pathway. CSPs are being considered as away of monitoring low-risk pathways that have a low proportion of imports containing BRM,and where the BRM on the pathway is not likely to have severe impact, either because ofthe material itself, or because of the post-entry use of the product in Australia. Earlier workby ACERA indicated that if a pathway was stratified by suppliers (for example), with a CSPapplied independently to each individual supplier (but using the same CSP rates for each one),then with the same overall effort more BRM could be detected using a CSP compared with justrandom sampling of each supplier.
Different CSP rates and different stratifications (e.g. importers, suppliers) produce differentoverall inspection outcomes. Earlier work focussed on Post Intervention Compliance (PIC; theproportion of consignments that are compliant after applying an inspection regime) as the mainperformance/selection criterion for pathway managers to use when deciding which rates to adopt.
6
DA Biosecurity: Plant-Product Pathways CSP and Data-Mining
In this report we focus more attention on absolute leakage, which is determined jointly bycompliance rate (the proportion of imports that don’t contain BRM) and pathway volume (thenumber of imports over some time period of interest). Absolute leakage better reflects biosecurityrisk to Australia. Once a level of acceptable absolute leakage is chosen (say for example 3 BRMin a year on a particular pathway), IPD can be used to determine the most efficient inspectionstrategy to achieve this level of leakage. This is consistent with the new risk-return approach inthe department.
The different pathways analysed in this report present different tradeoffs in IPD and leakage.Some show little variation in leakage as a function of different CSP rates, but substantial variationin IPD, meaning that substantial reductions in IPD can be achieved without a large increasein leakage. In contrast, others show substantial variation in leakage with limited variation inIPD, making the decision on CSP rates more difficult. Determining the preferred strategy forany particular pathway will require analysis of that pathway. We provide a full set of tables andassociated figures for each pathway considered in this report (raisins, cashews, dried apricots,green coffee beans, hulled sesame seeds, and dried dates) so that pathway managers can considerthe potential tradeoffs between different CSP designs.
Applying a CSP to a combined pathway
To date, CSPs have been applied to component pathways, but there may be administrativeand resourcing benefits of applying them to combined pathways. In this report we explorethe implications of combining pathways for the CSP selection criteria used to determine CSPsampling rates (enhanced and random inspection rates). If CSPs are being considered for acombined pathway, then all component pathways should satisfy the definition of low risk givenabove. In this report we analyse the “nut” pathway as an example, but point out that thedecision about whether component pathways for nuts are low risk has not been made at thisstage.
In this example case, the analysis showed that treating nuts as one pathway for both estimatingand applying CSP rates produced the lowest IPD, but at the expense of higher leakage, comparedwith choosing and applying rates for the lowest IPD for each individual pathway. This approachneeds to be investigated further with other pathways, and consideration should be given to otherpros and cons of combining pathways, as opposed to treating them separately, when consideringthe operational usefulness of this approach. For example, we may ask: are failure types likelyto be specific to individual nut types? in which case perhaps they should be separated.
Data mining to identify factors associated with risk
In past projects data mining has been used to identify pathways that may be suitable for CSPmonitoring, for example, those with low proportions of BRM. Alternatively, data mining couldbe used to identify factors associated with higher risk on a pathway. It could be used for exampleto focus inspection effort on a pathway as one way to improve inspection effectiveness (the abilityof an individual inspection to find BRM). In this project we applied to the nut data a new datamining method called group OSCAR, and an existing method known as random forests, asa trial of data mining methods for plant import data. The data mining was constrained byour computer infrastructure (see below), but results suggested that nut type (almond, cashew,etc) was not a strong predictor of risk, relative to the higher risk associated with suppliers,importers or countries. Higher risk importers/suppliers/countries tended to have low numbers ofimports. These types of importers/suppliers/countries would be detected by the initial enhancedinspection applied in a CSP, depending on what stratification the CSP was focussed on. Futurework on data mining would benefit from considering pathways with higher proportions of BRM,
7
DA Biosecurity: Plant-Product Pathways CSP and Data-Mining
and a broader range of potential pathway attributes that could be associated with BRM.
Building and using capacity with the department
This project built a strong collaboration between ACERA, the quantitative sciences sectionin ABARES (DA), and Plant Import Operations, Plant Biosecurity Division (DA). Capacityto carry out future CSP and data mining analyses has been developed in the department,and the research outcomes from the project have been enhanced by including scientists fromthe department directly in the research and analysis. This approach provides one model forimproving both the uptake and outcomes of research and development.
Other issues
The CSP rates are chosen based on simulation of data that comes from mandatory inspection ofa pathway, hence simulated performance assumes the pathway continues to behave in a similarway. Once a CSP is implemented, the inspection history will come from the subset of the importpathway inspected according to the CSP rules and rates applied to the pathway. It is essentialthat methods are developed to determine (i) whether the proportion of BRM on the pathwaydeviates from the original data; (ii) how long it takes to detect deviation and the implicationsthat has for risk; and (iii) how CSP rates can be updated to reflect changes in the proportion ofBRM on a pathway. Future work should address these questions.
Computer hardware and software available for this project limited some of the analyses. Datamining in particular was constrained by this, but the CSP computer simulation would alsobenefit if its speed could be increased.
8
DA Biosecurity: Plant-Product Pathways CSP and Data-Mining
Recommendations
We make the following recommendations:
1. Plant Import Operations, ACERA (now CEBRA; Centre of Excellence for BiosecurityRisk Analysis) and ABARES should continue to work closely together to address the issuesidentified below and to ensure outcomes are appropriately implemented in the department’soperations and policy development.
2. Decisions about the enhanced inspection number and random inspection proportion toimplement when it becomes operationally active should include a full consideration of theCSP analyses for individual pathways presented in this report, particularly leakage andIPD.
3. Data mining methods should be further developed and applied to enable identification ofhigh risk components of pathways.
4. Combined pathway CSP analysis should be trialled on additional pathways to refine themethodology. Careful a priori decisions should be made about which pathways should beconsidered for combining prior to analysis. For example, if a particular sub-component ofa pathway contains a risk factor that may be considered too risky to consider for a CSPit should be excluded from the combined analysis (chestnuts and the risk presented bychestnut blight may be an example).
5. Upgrade computer hardware and software. Current data mining techniques are limited bythe available computer hardware and software (32 bit windows vs. 64 bit windows) in thedepartment. This needs to be addressed to allow appropriate data mining to proceed.
6. Develop methods to regularly assess CSP performance. This will ensure any changes tothe risk posed by the pathway will be managed appropriately once the CSP has beenimplemented.
9
1
Introduction
Many different plant-based products are imported into Australia, including for example freshand dried fruit. Some of these products may present a biosecurity risk to Australia becausethey contain biosecurity risk material (BRM; insects, pathogens, contamination, etc). Hence,these products are subjected to various quarantine interventions, ranging from documentaryassessments to mandatory on-arrival inspections. These interventions are designed to reducethe likelihood of entry of BRM that could have undesirable impacts in Australia. The overallbiosecurity risk presented by each plant import pathway is determined jointly by the likelihoodof arrival of BRM (the approach rate) and the severity of possible impact of that BRM. Currentintervention strategies do not necessarily reflect this risk, and the Department of Agriculture(DA) is changing pathway management strategies as part of the biosecurity reform agenda arisingfrom the Beale review [1]. In this report we extend earlier ACERA work [2, 3] and focus ontwo broad areas designed to deal more appropriately with biosecurity risk, namely ContinuousSampling Plans (CSPs) and data mining. The new studies involve a major contribution fromthe Quantitative Sciences section in ABARES to help facilitate the uptake of this work in thedepartment.
Continuous Sampling Plans
Previous ACERA studies [2] recommended the adoption of CSP to reduce the number ofinspections on import pathways with low approach rates (< 5 % of consignments) of BRMthat is not likely to have severe impacts, leading to a overall low risk. Previously many ofthese pathways were subjected to mandatory inspections. While any reduction in inspectioneffort is likely to decrease the amount of BRM detected at the border, these studies have shownthat a CSP combined with stratification by factors such as importers or suppliers can increasethe detection rate of BRM relative to random sampling with the same effort. Briefly, CSPswere developed to sample manufacturing pathways in the mid 1900’s [4]. The CSP familyworks by switching between a mode with enhanced inspection, where a consecutive number ofimports are inspected, and a mode with random inspection, called monitoring mode, where aproportion of imports are randomly inspected. The aim is to rapidly detect any sustained spikein non-compliance, switching between modes depends on the outcomes from recent inspectionsof imports on the pathway. In this report, within the family, we simulate plant pathways mainlyusing the rules of CSP-1 and CSP-3, which have slight differences in their switching rules. Theyare described in more detail in Chapter 2.
These earlier studies found little difference in the amount of BRM detected for given effortbetween CSP-1 or CSP-3 (or CSP-2 - see earlier reports for a discussion of CSP-2). CSP-3
10
DA Biosecurity: Plant-Product Pathways CSP and Data-Mining
was recommended over CSP-1 because it provides a less severe penalty for suppliers/importersfollowing a failure in monitoring mode (rather than penalising importers/suppliers immediatelyby putting them back into enhanced inspection).
Earlier ACERA studies recommended that CSP rules be determined based on the results fromsimulations [2]. Statistics provides two different types of approaches to assessing the outcome ofapplying an inspection algorithm upon a pathway, namely theory and simulation. The theoreticalproperties of algorithms describe its behaviour on average, under a given range of circumstances.These are useful when little is known about the actual properties of the process. However, ifsuitable historical inspection data are available, then they may be used as a basis for simulationsof the algorithms, which may be undertaken to augment the theoretical assumptions that aremade during model development. Simulations run using real data provide the most accuratepicture of the validity of the required inspection regime for the pathway.
The theoretical performance of the CSP family can be specified if we assume that the underlyingapproach rate is constant. This assumption does not sit comfortably with operational experience,nor with our analyses of the inspection histories of the pathways, which show shifts in approachrates, although this shift does depend on the timescale chosen for analysis. By using historicalinspection data, we allow for the demonstrated propensity of a pathway to have such shifts inapproach rates, and still can develop an idea of how a given algorithm may work with a pathway.
In the earlier studies, CSP sampling rates were chosen based on achieving a post-interventioncompliance (PIC) rate of 99% — i.e., that 99% of the consignments from the simulation wouldbe compliant following the CSP intervention. In Chapter 2 of this report we introduce amore comprehensive assessment of the implications of the different CSP sampling strategiesand rates, including: a consideration of the actual number of non-compliant consignmentsleaked (which ultimately determines the residual risk to Australia when combined with themagnitude of potential impact); introduction of a new indicator based on the number of inspectedconsignments per detection of BRM (Inspections per detection - IPD); a comparison of the PICand leakage and IPD arising from CSP strategies with those arising from full inspection of thepathway (assuming that for each individual inspection there is a 90% chance that BRM will bedetected given it is present, that is 90% “inspection effectiveness”). We also discuss the resultsin terms of the basic summary statistics for each pathway and why particular CSP strategiesmay have produced their outcomes based on the patterns of quarantine failure in the data.
Earlier reports assumed an inspection effectiveness of 90%, but treated the observed failurehistory as the actual failure history before applying simulation. This underestimates the failurerate on the pathway, so in this report we introduced a method for assigning additional failuresto the observed pathway to account for this. The method is described in Chapter 2.
Chapter 2 focuses on the raisin pathway, which has not previously been assessed with the CSPmethod. In the appendix, we provide results for another new pathway (cashews) and also presentthe more comprehensive analysis with the adjusted method for four pathways analysed in theearlier studies that were being trialled by the department (green coffee beans, dried apricots,dried dates and hulled sesame seeds).
So far, the CSP method has been applied to pathways with narrow definitions such as green coffeebeans, dried apricots and cashews. Another possibility is to apply CSP to broader categoriesof pathways, for example “nuts”, where nuts include the types: almonds, brazil nuts, cashews,chestnuts, hazelnuts, macadamias, pistachios, walnuts and “other nuts”. This could simplify theoperation of a CSP for both the department and importers. Chapter 3 explores various waysof defining and applying CSP parameters for the “nut” pathways. Simulation results for the
11

DA Biosecurity: Plant-Product Pathways CSP and Data-Mining
broader category of nuts are then compared to the individual nut type results.
Data mining
Broadly speaking, data mining is used to find patterns in (large) data sets. In ACERA report1101C, data summaries are used as a basic form of data mining to identify pathways with lowfailure rates and high inspection rates as candidates for CSP (with the further caveat that thetypes of BRM on those pathways do not have such impacts of a severity that they would beexcluded from a CSP). Data from these pathways are then used for CSP simulation to determinethe implications of various CSP strategies.
More detailed data mining can be used to identify which factors are associated with the highestapproach rates of BRM on a pathway. If every consignment is not to be inspected, thenspecifically targeting inspections to these factors should produce better outcomes for a givenlevel of inspection relative to random sampling. Alternatively, if the decision is to continue toinspect all consignments, then identifying factors associated with higher BRM approach ratescould provide opportunities to enhance the inspection effort for those consignments — this wouldincrease overall inspection effectiveness.
In Chapter 4 we use data mining to identify sources of variation, or patterns, in historicalimport inspection data for nuts. We use a subset of all available data mining/analysis techniques(a broader consideration of other data mining techniques will occur in future work) includingclassification using random forests and a new regression technique that we refer to as groupOSCAR (Chen [5]). Group OSCAR combines the LASSO (Least Absolute Shrinkage andSelection Operator) [6] and OSCAR (Octagonal Selection and Clustering Algorithm) [7] regressions.Using these methods we rank factors associated with higher approach rates, and asses theoperational implications of choosing to focus inspection effort based on the rankings usingReceiver Operating Characteristics (ROC) curves.
12

2
Modifications and extensions toContinuous Sampling Planapproaches (including an analysis ofthe Raisin Pathway)
2.1 Introduction and general approach
Continuous Sampling Plan (CSP) simulations based on inspection data were used in previousACERA studies to compare different varieties, namely CSP-1, 2, and 3; and to show howdifferent values of clearance number (CN), monitoring fraction (MF ) and stratification type(importer, supplier, country) would affect the Post Intervention Compliance (PIC) and leakageon a pathway [4, 2]. ACERA recommended that CSP-3 be adopted by PIO (Plant ImportOperations), because rather than penalise importers/suppliers immediately by consigning theminto enhanced inspection if they had a failure while in monitoring mode (as CSP-1 would do), itprovides a short-term increase in inspection effort, and switches to enhanced monitoring upondetection of a second failure within a given number of inspections. CSP-3 will be adopted bythe department, but the initial operational trial used CSP-1 because it was easier to implementin the trial environment. We do not revisit the decision about which version of CSP to use, butpresent results for both CSP-1 and CSP-3 to provide compatibility with previous studies.
Under CSP-1, a pathway is initially subjected to enhanced inspection where every consignmentis inspected. If a threshold number, we call it Clearance Number (CN), of inspections is reachedwithin which no non-compliance has been detected then the pathway is moved into monitoringmode. When in monitoring mode, the pathway is inspected randomly, with a monitoring rate,we call it Monitoring Fraction (MF ), until a non-compliance is detected. The pathway thenswitches to an enhanced inspection mode until compliance thresholds have been maintained forCN .
The difference between CSP-3 and CSP-1 is in monitoring mode. Under CSP-3, when anon-compliance is detected in monitoring mode, rather than switching to an enhanced inspectionmode straight away, the switching is dependent on detection of the next non-compliance: if thenext non-compliance is detected within the next k (say, k = CN = 10) inspections, the mode willthen be switched to an enhanced inspection mode. Otherwise, the mode will not be switched.
13

DA Biosecurity: Plant-Product Pathways CSP and Data-Mining
To look for a spike in non-compliance, the k inspections are set to have two parts: a certainnumber, currently four in this report, of mandatory inspections after the first non-compliancewas detected, and random inspections with the rate of MF within the rest. Here we note thatthe choice of four is arbitrary, but follows standard practice with CSP-3. A comprehensivedescription of CSPs is provided in ACERA report [2].
Next we describe the simulation and analysis approach and some additions and changes we havemade to them, before presenting the results for the raisin pathway.
2.1.1 The simulation method
Simulations were carried out using the CSP simulation tool developed by ACERA, as describedin detail in [8, 2]. Briefly, compliance histories for each pathway were derived by merging datafrom two databases maintained by the department, namely, AIMS and Incidents. BRM (whichwe also refer to as a quarantine failure) was identified based on entries in the Incidents databaseof interceptions such as insect pests, weeds, seeds, animal material and soil. For pests there isan additional criterion whether these are not known to be present in Australia — we consideredthem BRM if the field “Present in Australia” is filled in as “no” or “uncertain”, or if it is leftblank and given an incident ID.
Once the history was derived it was stratified by importer, supplier, or country and thensubjected to simulated CSP sampling using the simulation tool. The tool applies the chosenCSP rule (CSP type and associated CN and MF ) to each stratum (e.g. each importer), andif an inspection is conducted on a consignment that has BRM then that BRM is found witha probability that depends on the assumed inspection effectiveness (discussed in more detailbelow). Hence there are two ways the simulation tool can introduce variation into the simulationoutcome: (1) variation based on whether a particular consignment is inspected; and (2) variationbased on whether BRM is detected given it is present. To account for this variation, each CSPoption was simulated 100 times and the results presented are based on the mean and approximate95% confidence interval for the mean.
We use what is called a “burn-in” period to account for the fact that all units of the stratification(all importers for example) will be subjected to the initial clearance. The “burn date” defines theend date of the burn-in period. We omit the records associated with this burn-in period whenreporting on the performance criteria in order to get a more accurate idea of what the long-termperformance of a particular strategy would be, and to focus on the most recent history of thepathway. Following earlier studies the burn-in cutoff in this report was set 2.5 years from theend of the datasets.
2.1.2 Inspection effectiveness
The CSP simulation works by dividing each pathway depending on the stratification and thenapplying the CSP rules with various combinations of CN and MF . When an individualconsignment with BRM is inspected there is some chance that the BRM would be detectedduring the inspection — we call this inspection effectiveness. In earlier studies an inspectioneffectiveness of 90% was assumed; that is if BRM is present in a consignment then there isa 90% chance it will be found if that consignment is inspected. For most pathways we haveno evidence of what inspection effectiveness is, but this value was chosen as an arbitrary buthopefully reasonable value. We use the same value in this report.
14
DA Biosecurity: Plant-Product Pathways CSP and Data-Mining
In earlier reports the observed inspection history was subjected to simulation and if a consignmentwith BRM was inspected the BRM was found with a probability of 0.9. However, this algorithmcan underestimate the BRM on the pathway, because the “observed” history is generated afterinspection and should incorporate the assumed inspection effectiveness. To account for this wemodified the method. To illustrate, say the observed failure history had 53 observed failureswith an inspection effectiveness of 0.9, then the number of consignments that contained BRMwould be 53/0.9 ≈ 59. The extra failures need to be added to the history before each individualsimulation run for a pathway, so we randomly assign the extra failures.
With some pathways the time series pattern of quarantine failure rate had obvious trends overthe years from October 2005 to December 2010 (for example see Figure 2.2). These trendswere taken into account when assigning extra failures to the observed data, by weighting eachconsignment after sorting them into chronological order. The following method was used:(1) A generalised additive model (GAM) was used with quarantine failure being the responsevariable and consignment chronological order being the predictor variable [11]. The fitted failurerate of the ith consignment was denoted by ri.(2) Sum the fitted failure probability of “clean” consignments, which stand for the consignmentsthat have been found uncontaminated during inspection and computed average failure rate, i.e.,
mean(r) =
∑ni=1 rin
,
where n is total number of “clean” consignments.(3) Compare failure probability of each consignment with the average failure probability mean(r)and define weight of the consignment:
wi =ri
mean(r).
(4) Multiply the weight wi to the risk probability pi of “clean” consignments, where pi assumesno time series pattern in failure probability
pi =leaked failures
total number of “clean” consignments
of ith consignment, to obtain the new risk probability Pi,new of the ith consignment incorporatingthe time series pattern.
Pi,new = wi × pi.
Randomly assigning failures according to Pi,new produces the same time series pattern for theunobserved failures.
2.1.3 Choosing inspection strategies
PIC and leakage
In the earlier studies, CSP sampling rates were chosen based on achieving a post-interventioncompliance (PIC) rate of 99%, meaning that 99% of the consignments from the simulation werecompliant following the CSP intervention. PIC is defined based on pathway leakage:
PIC = 100× volume− leakage
volume,
15

DA Biosecurity: Plant-Product Pathways CSP and Data-Mining
If we assume 90% inspection effectiveness, then the maximum PIC that can be achieved isachieved with full inspection. It can be calculated from the observed history as:
PIC = 100× volume− (failures/effectiveness− failures)
volume,
where “volume” and “failures” stands for the total number of consignments and the number ofobserved failures respectively.
While PIC can indicate the relative performance of different CSP strategies it has some problems:(1) the choice of 99% is arbitrary; (2) some pathways cannot have a PIC below 99% even with noinspection of the pathway, because of the very low failure rate on the pathway; (3) the calculatedPIC depends on the assumed inspection effectiveness as well as the CSP strategy; (4) for somepathways more than one combination of inspection parameters can achieve the target PIC value;and (5) focussing on PIC can result in ignoring a discussion of how much is leaked, which isdriven by the compliance rate and the volume of the pathway. When comparing across pathways,leakage is a better reflection of risk to Australia. We suggest a more explicit consideration ofthe absolute leakage associated with each inspection strategy.
Inspections per detection - IPD
The risk-return philosophy being adopted in the department considers how the allocation ofresources influences the biosecurity risks faced by Australia. Ultimately the objective is toachieve the lowest residual risk with the resources available. As part of achieving this, previousACERA studies [2] have recommended the adoption of CSPs to reduce the number of inspectionson import pathways that have recently had low approach rates (< 5 % of consignments) of BRMthat is not likely to have severe impacts (i.e., overall low risk). Previously these pathways weresubjected to mandatory inspections and any reduction in effort here could be applied to higherrisk areas potentially moving the overall systems towards lower residual risk for the same effort.
While any reduction in inspection effort is likely to decrease the amount of BRM detected at theborder on these pathways (i.e., result in increased leakage), previous studies have shown thata CSP combined with stratification by factors such as importers or suppliers can increase thedetection rate of BRM relative to random sampling with the same effort. Here we introduce anew statistic, which we call “inspections per detection” or IPD. For any given strategy we cancalculate the average number of inspections required for each BRM detected. If we define theacceptable level of leakage on the pathway, then the most efficient inspection strategy minimisesIPD.
In this report for each pathway analysis we present leakage, IPD and PIC for each CSP strategyconsidered. We recommend managers consider all three when deciding on which strategyto implement, but with a focus on leakage and IPD, depending on the pathway manager’sobjectives. As in earlier reports we begin each pathway analysis with a summary of the datafrom that pathway, before presenting the CSP analysis. Finally we discuss the results of theCSP analysis in terms of the pathway summary, to provide managers insights into why certainCSP strategies may have produced the results they did.
16
DA Biosecurity: Plant-Product Pathways CSP and Data-Mining
2.2 Analysis of the Raisins pathway
2.2.1 Import Conditions
The pathway consists of a range of raisin (dried grape) products (Tariff code: 8062000), suchas sultanas, currants, etc. Dried fruit generally represent a lower quarantine risk than similarfresh commodities. However, dried commodities can pose serious quarantine risks because theprocess of drying may be insufficient to eliminate disease agents. In some cases, dried fruit willcontain viable seeds which may be of a quarantine concern, such as Prunus spp. which can carryseed-borne diseases such as Plum Pox Virus. All dried fruit may potentially introduce exoticinsect pests and are considered a high risk of introducing khapra beetle if originating from ahost country.
An Import Permit is not required for raisins/dried grapes. Phytosanitary certificates are requiredfor all Full Container Load (FCL) consignments. Non-FCL consignments do not require aphytosanitary certificate. Dried fruits are required to be commercially produced and packed.“Exposed” produce (i.e., exposed to insect infestation) are subject to mandatory fumigationwith methyl bromide. Prior to entry, all consignments must pass an inspection on arrival toverify that the shipment is free of soil, live insects, rice hulls, contamination with restricted andprohibited seed and other material of quarantine concern (e.g. leaf or stem material, faeces,animal remains etc.) and packed in new, clean bags.
Consignments are inspected by selecting sample cartons at random for inspection. No formalimport risk assessment has been undertaken for raisins (dried grapes).
2.2.2 Design of the Analysis
We carried out the analysis using CSP-1 and CSP-3 with the following steps:
• We prepared the data by merging original datasets, which were stored in three differentExcel spreadsheets, i.e., one mainly described the goods, one mainly contained a varietyof information about suppliers and the other one mainly recorded the incidents foundin consignments. Before merging the datasets, we first made the names of commonvariables in the spreadsheets consistent. The merged data were saved in a csv file, i.e.,“Raisin.merged.csv”.
• BRM was defined based on the presence of soil, weeds, insects, etc in the consignment.For things like insects, they were defined as a quarantine failure when the field “Presentin Australia” was labelled “no”, “uncertain”, or left blank.
• In some cases consignment records were duplicated. This occurred for two reasons: (i)more than one incident was found; or (ii) more than one product was contained in aconsignment. We reduced each consignment to a single record where it was deemed afailure if any biosecurity risk material was present. The weight of the consignment wasdetermined by summing the weights of different raisin products.
• Observed data were summarised to indicate patterns of quarantine failure rate over timeand quarantine failure rate by years, importers, countries and suppliers.
• Simulations were carried out as detailed in ACERA and ABARES reports [8, 2] to findhow the number of inspected consignments, monitoring fractions, clearance numbers,inspection strategies (namely CSP-1 and CSP-3) and stratification affect the PIC rate, the
17
DA Biosecurity: Plant-Product Pathways CSP and Data-Mining
number of non-compliant consignments leaked and IPD: the average number of inspectedconsignments per detection of a contaminated consignment.
2.2.3 Pathway Summary
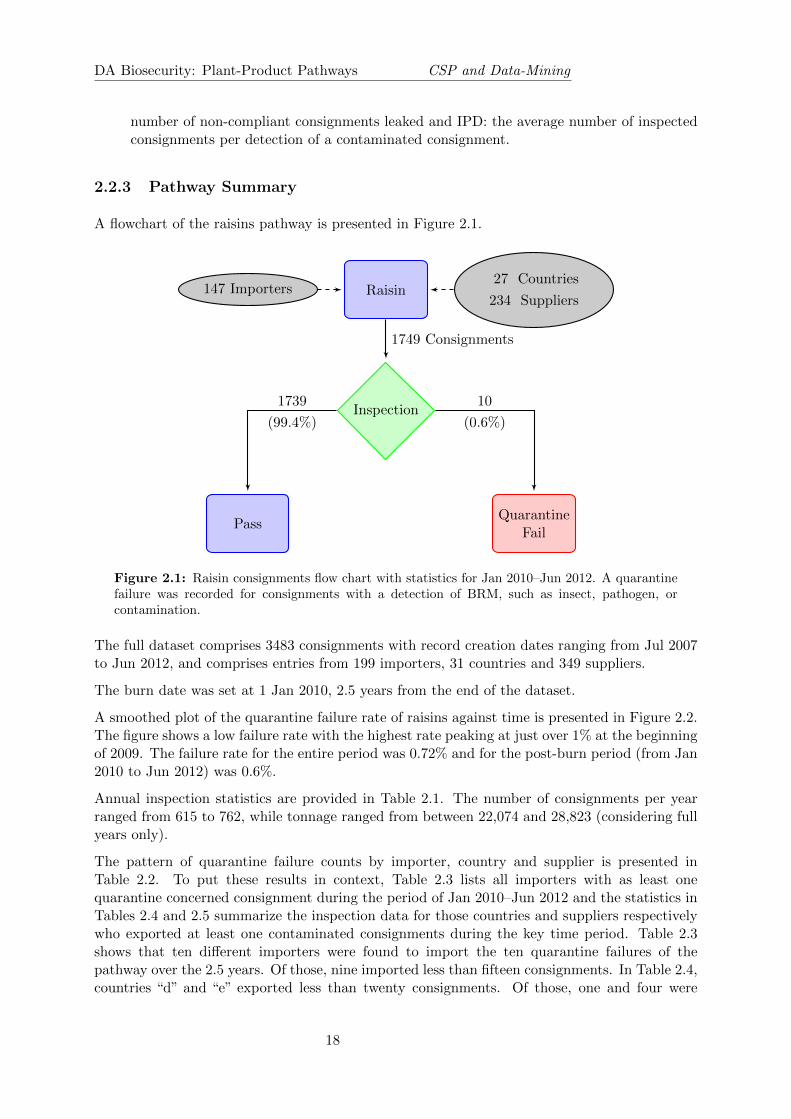
A flowchart of the raisins pathway is presented in Figure 2.1.
147 Importers Raisin27 Countries
234 Suppliers
Inspection
PassQuarantine
Fail
1749 Consignments
1739
(99.4%)
10
(0.6%)
Figure 2.1: Raisin consignments flow chart with statistics for Jan 2010–Jun 2012. A quarantinefailure was recorded for consignments with a detection of BRM, such as insect, pathogen, orcontamination.
The full dataset comprises 3483 consignments with record creation dates ranging from Jul 2007to Jun 2012, and comprises entries from 199 importers, 31 countries and 349 suppliers.
The burn date was set at 1 Jan 2010, 2.5 years from the end of the dataset.
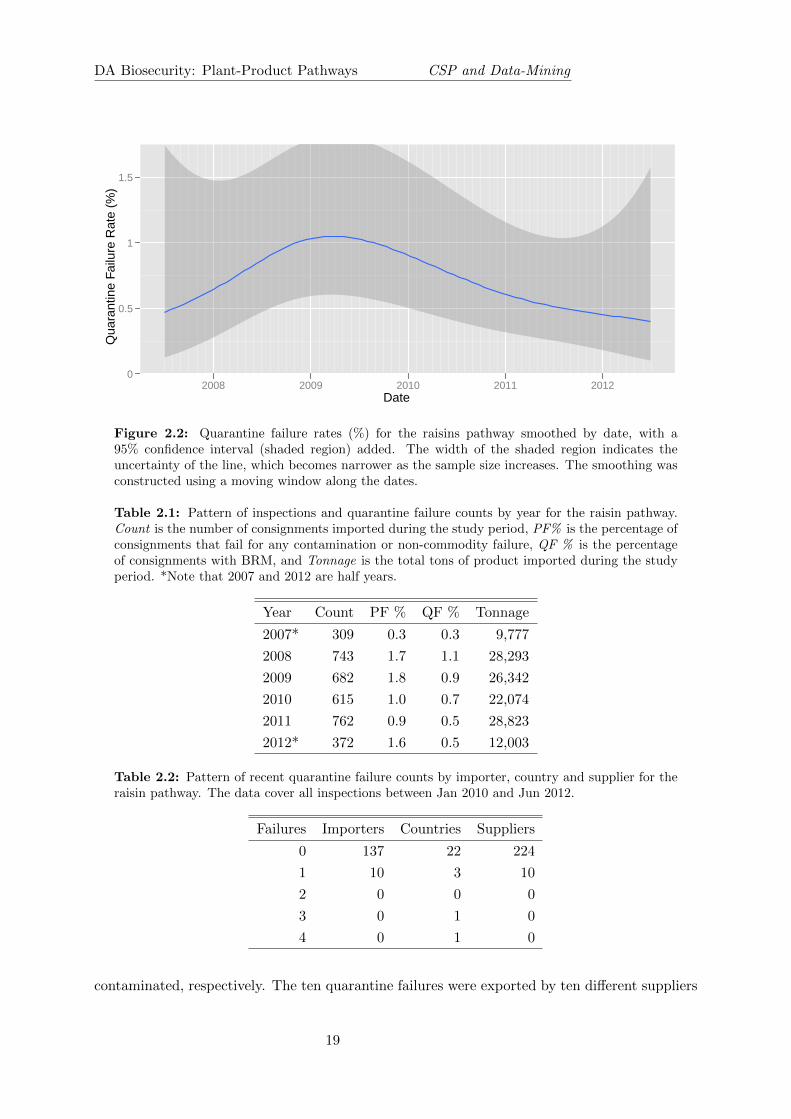
A smoothed plot of the quarantine failure rate of raisins against time is presented in Figure 2.2.The figure shows a low failure rate with the highest rate peaking at just over 1% at the beginningof 2009. The failure rate for the entire period was 0.72% and for the post-burn period (from Jan2010 to Jun 2012) was 0.6%.
Annual inspection statistics are provided in Table 2.1. The number of consignments per yearranged from 615 to 762, while tonnage ranged from between 22,074 and 28,823 (considering fullyears only).
The pattern of quarantine failure counts by importer, country and supplier is presented inTable 2.2. To put these results in context, Table 2.3 lists all importers with as least onequarantine concerned consignment during the period of Jan 2010–Jun 2012 and the statistics inTables 2.4 and 2.5 summarize the inspection data for those countries and suppliers respectivelywho exported at least one contaminated consignments during the key time period. Table 2.3shows that ten different importers were found to import the ten quarantine failures of thepathway over the 2.5 years. Of those, nine imported less than fifteen consignments. In Table 2.4,countries “d” and “e” exported less than twenty consignments. Of those, one and four were
18
DA Biosecurity: Plant-Product Pathways CSP and Data-Mining
Date
Qua
rant
ine
Failu
re R
ate
(%)
0
0.5
1
1.5
2008 2009 2010 2011 2012
Figure 2.2: Quarantine failure rates (%) for the raisins pathway smoothed by date, with a95% confidence interval (shaded region) added. The width of the shaded region indicates theuncertainty of the line, which becomes narrower as the sample size increases. The smoothing wasconstructed using a moving window along the dates.
Table 2.1: Pattern of inspections and quarantine failure counts by year for the raisin pathway.Count is the number of consignments imported during the study period, PF% is the percentage ofconsignments that fail for any contamination or non-commodity failure, QF % is the percentageof consignments with BRM, and Tonnage is the total tons of product imported during the studyperiod. *Note that 2007 and 2012 are half years.
Year Count PF % QF % Tonnage
2007* 309 0.3 0.3 9,777
2008 743 1.7 1.1 28,293
2009 682 1.8 0.9 26,342
2010 615 1.0 0.7 22,074
2011 762 0.9 0.5 28,823
2012* 372 1.6 0.5 12,003
Table 2.2: Pattern of recent quarantine failure counts by importer, country and supplier for theraisin pathway. The data cover all inspections between Jan 2010 and Jun 2012.
Failures Importers Countries Suppliers
0 137 22 224
1 10 3 10
2 0 0 0
3 0 1 0
4 0 1 0
contaminated, respectively. The ten quarantine failures were exported by ten different suppliers
19

DA Biosecurity: Plant-Product Pathways CSP and Data-Mining
Table 2.3: Summary statistics by importer for the raisin pathway. Count is the number ofconsignments imported during the post-burn period. PF is the percentage of consignments thatfail for any contamination or non-commodity failure. QF is the count of consignments with BRM.The Tonnage lists total volume in 1,000 kg of consignments imported by each importer during thestudy period. The Suppliers and Countries columns report the numbers of suppliers and countriesthat have exported to each importer during the time period. The data cover all inspections betweenJan 2010 and Jun 2012. We only include those importers with at least one quarantine concernedconsignment during the time period.
Importer Count PF % QF QF % Tonnage Suppliers Countries
a 51 2.0 1 2.0 1,427 8 5
b 14 7.1 1 7.1 52 4 3
c 6 16.7 1 16.7 <1 1 1
d 4 25.0 1 25.0 3 3 1
e 4 25.0 1 25.0 16 2 1
f 2 50.0 1 50.0 1 2 2
g 2 50.0 1 50.0 <1 1 1
h 1 100.0 1 100.0 3 1 1
i 1 100.0 1 100.0 1 1 1
j 1 100.0 1 100.0 <1 1 1
Table 2.4: Summary statistics by country for the raisin pathway. See caption of Table 2.3 forexplanation of column names. The Suppliers and Importer columns report the numbers of suppliersand importers that have exported and imported from each country during the time period. Thedata cover all inspections between Jan 2010 and Jun 2012. We only include those countries withat least one BRM consignment during the time period.
Country Count PF % QF QF % Tonnage Suppliers Importers
a 353 0.6 1 0.3 8,522 35 36
b 106 2.8 3 2.8 1,400 30 27
c 36 2.8 1 2.8 5 12 13
d 18 5.6 1 5.6 366 1 1
e 16 25.0 4 25.0 85 8 11
(Table 2.5). All these suppliers had less than twenty consignments.
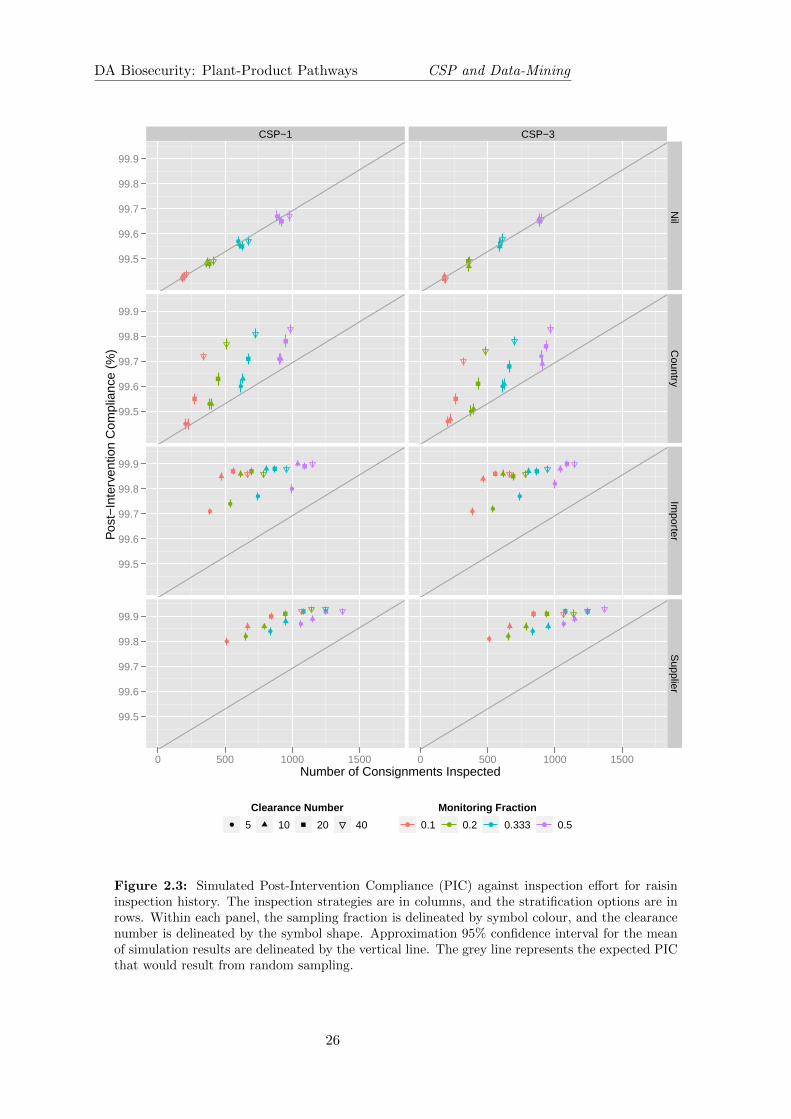
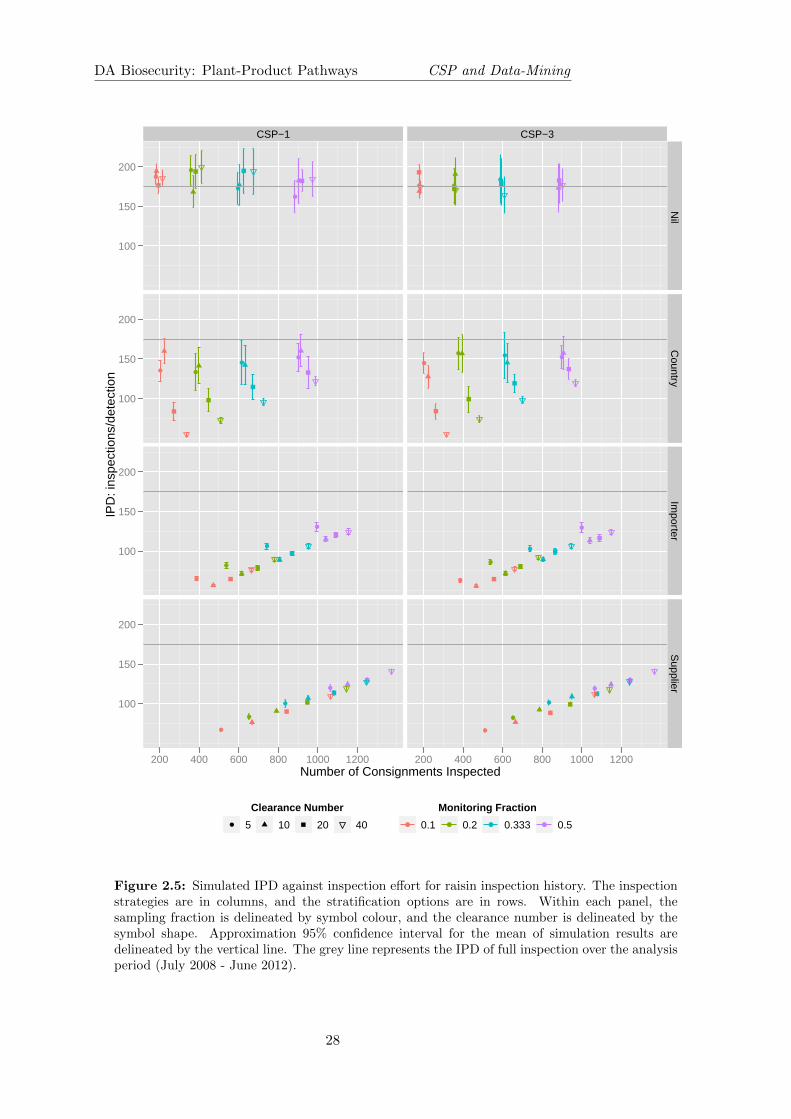
2.2.4 Simulation Results
The simulation results of the pathway are presented in Tables 2.6 - 2.9 and in Figures 2.3 - 2.5.In this simulation, we set inspection effectiveness to be 0.90. Figure 2.3 provides the averagesimulated PIC as a function of inspection strategy (CSP rule and stratification) for a range ofoptions (CN and MF ). Figure 2.4 shows leakage and Figure 2.5 shows IPD. The grey lineshows the expected trade-off for random monitoring, and may be used as a baseline to assessthe improvement resulting from selecting a CSP strategy. The maximum PIC is achieved withfull sampling and is
20
DA Biosecurity: Plant-Product Pathways CSP and Data-Mining
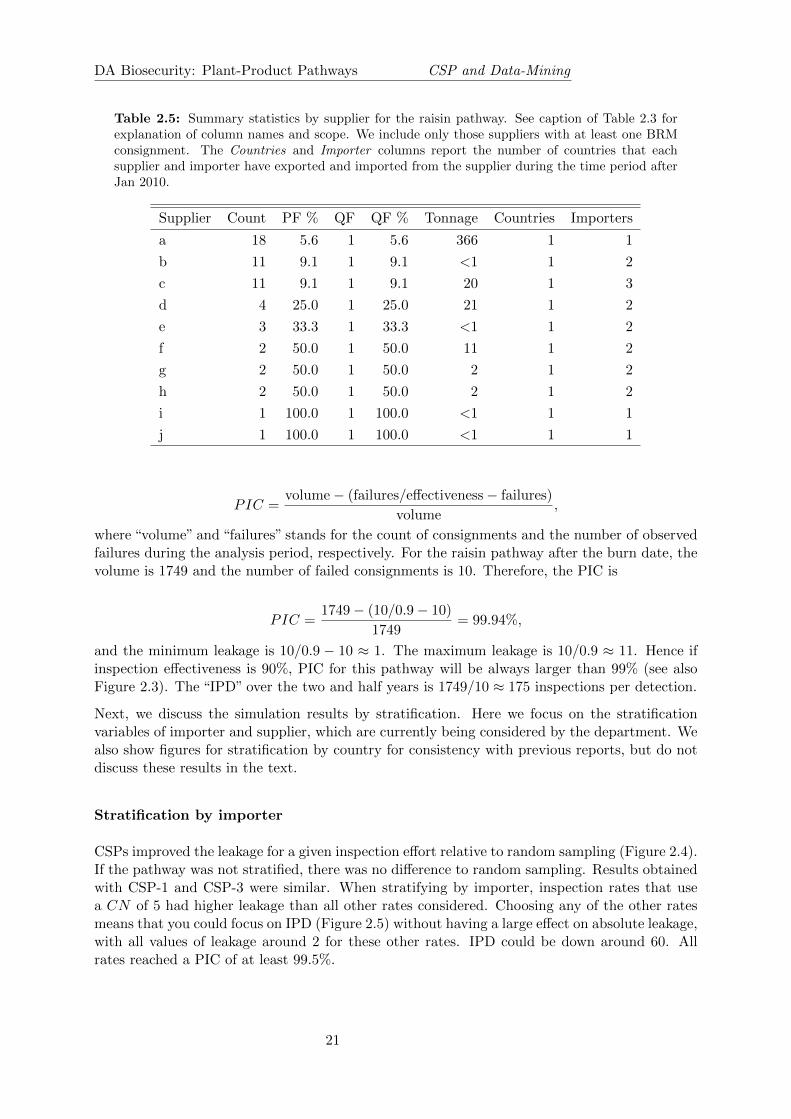
Table 2.5: Summary statistics by supplier for the raisin pathway. See caption of Table 2.3 forexplanation of column names and scope. We include only those suppliers with at least one BRMconsignment. The Countries and Importer columns report the number of countries that eachsupplier and importer have exported and imported from the supplier during the time period afterJan 2010.
Supplier Count PF % QF QF % Tonnage Countries Importers
a 18 5.6 1 5.6 366 1 1
b 11 9.1 1 9.1 <1 1 2
c 11 9.1 1 9.1 20 1 3
d 4 25.0 1 25.0 21 1 2
e 3 33.3 1 33.3 <1 1 2
f 2 50.0 1 50.0 11 1 2
g 2 50.0 1 50.0 2 1 2
h 2 50.0 1 50.0 2 1 2
i 1 100.0 1 100.0 <1 1 1
j 1 100.0 1 100.0 <1 1 1
PIC =volume− (failures/effectiveness− failures)
volume,
where “volume” and “failures” stands for the count of consignments and the number of observedfailures during the analysis period, respectively. For the raisin pathway after the burn date, thevolume is 1749 and the number of failed consignments is 10. Therefore, the PIC is
PIC =1749− (10/0.9− 10)
1749= 99.94%,
and the minimum leakage is 10/0.9 − 10 ≈ 1. The maximum leakage is 10/0.9 ≈ 11. Hence ifinspection effectiveness is 90%, PIC for this pathway will be always larger than 99% (see alsoFigure 2.3). The “IPD” over the two and half years is 1749/10 ≈ 175 inspections per detection.
Next, we discuss the simulation results by stratification. Here we focus on the stratificationvariables of importer and supplier, which are currently being considered by the department. Wealso show figures for stratification by country for consistency with previous reports, but do notdiscuss these results in the text.
Stratification by importer
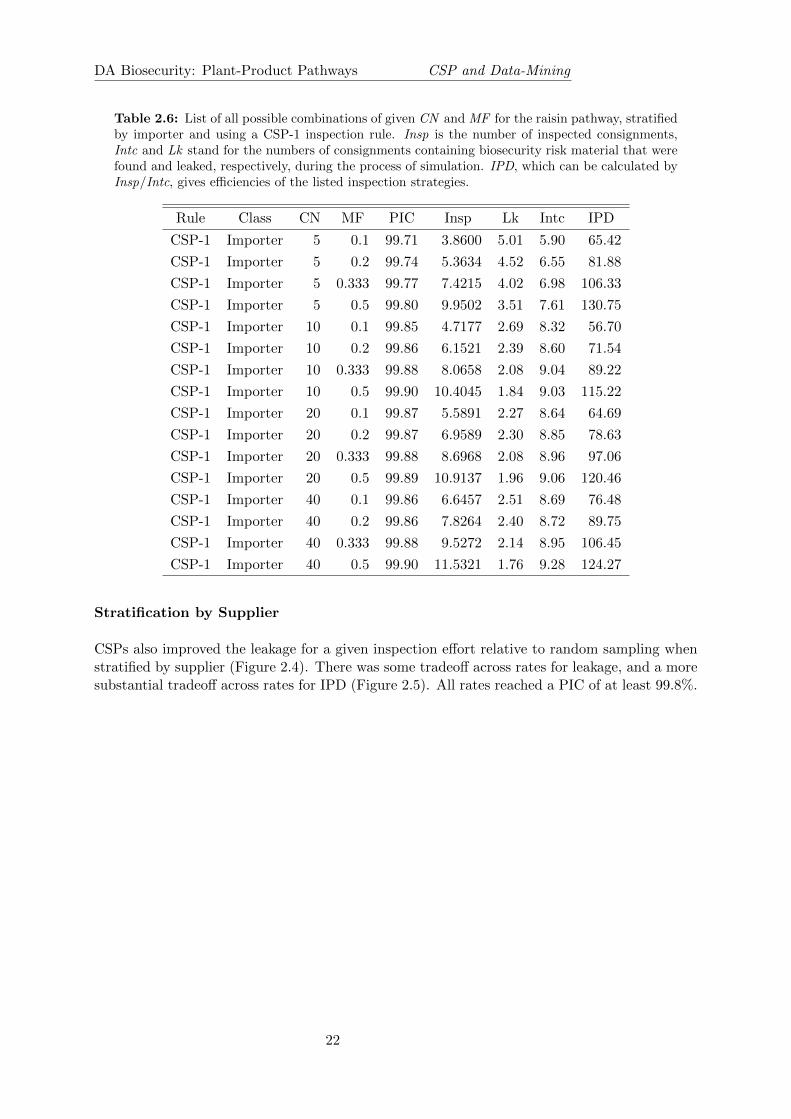
CSPs improved the leakage for a given inspection effort relative to random sampling (Figure 2.4).If the pathway was not stratified, there was no difference to random sampling. Results obtainedwith CSP-1 and CSP-3 were similar. When stratifying by importer, inspection rates that usea CN of 5 had higher leakage than all other rates considered. Choosing any of the other ratesmeans that you could focus on IPD (Figure 2.5) without having a large effect on absolute leakage,with all values of leakage around 2 for these other rates. IPD could be down around 60. Allrates reached a PIC of at least 99.5%.
21
DA Biosecurity: Plant-Product Pathways CSP and Data-Mining
Table 2.6: List of all possible combinations of given CN and MF for the raisin pathway, stratifiedby importer and using a CSP-1 inspection rule. Insp is the number of inspected consignments,Intc and Lk stand for the numbers of consignments containing biosecurity risk material that werefound and leaked, respectively, during the process of simulation. IPD, which can be calculated byInsp/Intc, gives efficiencies of the listed inspection strategies.
Rule Class CN MF PIC Insp Lk Intc IPD
CSP-1 Importer 5 0.1 99.71 3.8600 5.01 5.90 65.42
CSP-1 Importer 5 0.2 99.74 5.3634 4.52 6.55 81.88
CSP-1 Importer 5 0.333 99.77 7.4215 4.02 6.98 106.33
CSP-1 Importer 5 0.5 99.80 9.9502 3.51 7.61 130.75
CSP-1 Importer 10 0.1 99.85 4.7177 2.69 8.32 56.70
CSP-1 Importer 10 0.2 99.86 6.1521 2.39 8.60 71.54
CSP-1 Importer 10 0.333 99.88 8.0658 2.08 9.04 89.22
CSP-1 Importer 10 0.5 99.90 10.4045 1.84 9.03 115.22
CSP-1 Importer 20 0.1 99.87 5.5891 2.27 8.64 64.69
CSP-1 Importer 20 0.2 99.87 6.9589 2.30 8.85 78.63
CSP-1 Importer 20 0.333 99.88 8.6968 2.08 8.96 97.06
CSP-1 Importer 20 0.5 99.89 10.9137 1.96 9.06 120.46
CSP-1 Importer 40 0.1 99.86 6.6457 2.51 8.69 76.48
CSP-1 Importer 40 0.2 99.86 7.8264 2.40 8.72 89.75
CSP-1 Importer 40 0.333 99.88 9.5272 2.14 8.95 106.45
CSP-1 Importer 40 0.5 99.90 11.5321 1.76 9.28 124.27
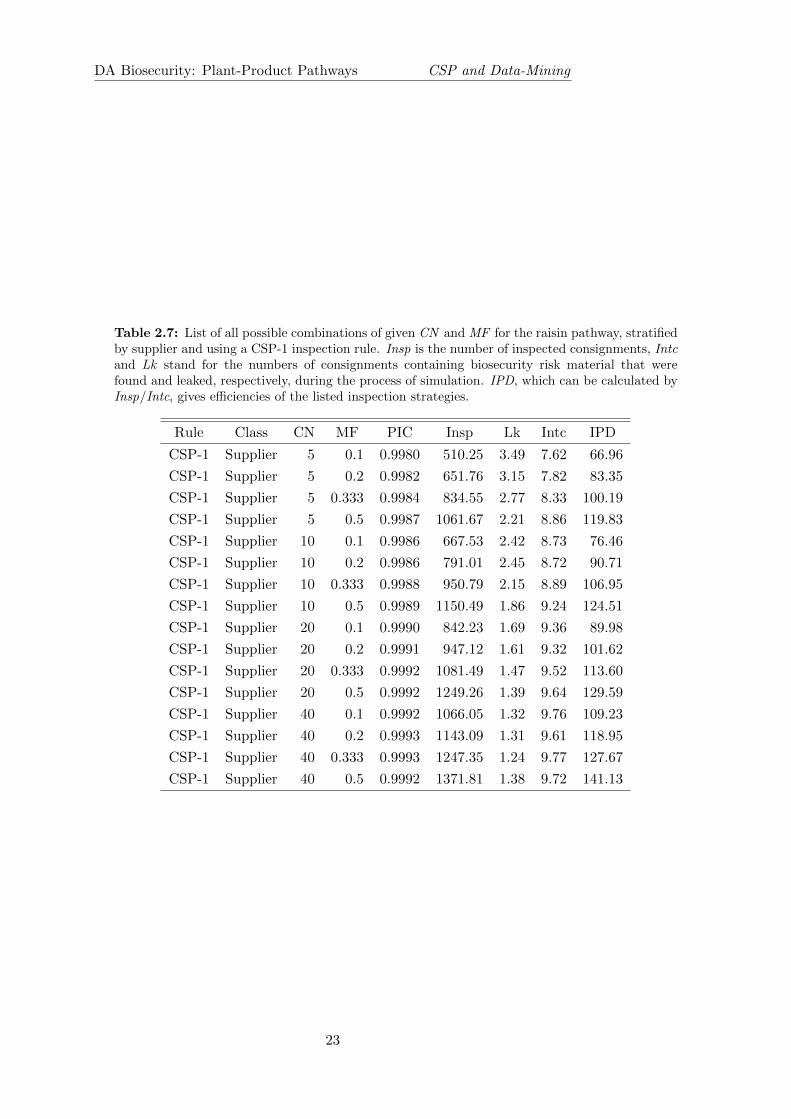
Stratification by Supplier
CSPs also improved the leakage for a given inspection effort relative to random sampling whenstratified by supplier (Figure 2.4). There was some tradeoff across rates for leakage, and a moresubstantial tradeoff across rates for IPD (Figure 2.5). All rates reached a PIC of at least 99.8%.
22
DA Biosecurity: Plant-Product Pathways CSP and Data-Mining
Table 2.7: List of all possible combinations of given CN and MF for the raisin pathway, stratifiedby supplier and using a CSP-1 inspection rule. Insp is the number of inspected consignments, Intcand Lk stand for the numbers of consignments containing biosecurity risk material that werefound and leaked, respectively, during the process of simulation. IPD, which can be calculated byInsp/Intc, gives efficiencies of the listed inspection strategies.
Rule Class CN MF PIC Insp Lk Intc IPD
CSP-1 Supplier 5 0.1 0.9980 510.25 3.49 7.62 66.96
CSP-1 Supplier 5 0.2 0.9982 651.76 3.15 7.82 83.35
CSP-1 Supplier 5 0.333 0.9984 834.55 2.77 8.33 100.19
CSP-1 Supplier 5 0.5 0.9987 1061.67 2.21 8.86 119.83
CSP-1 Supplier 10 0.1 0.9986 667.53 2.42 8.73 76.46
CSP-1 Supplier 10 0.2 0.9986 791.01 2.45 8.72 90.71
CSP-1 Supplier 10 0.333 0.9988 950.79 2.15 8.89 106.95
CSP-1 Supplier 10 0.5 0.9989 1150.49 1.86 9.24 124.51
CSP-1 Supplier 20 0.1 0.9990 842.23 1.69 9.36 89.98
CSP-1 Supplier 20 0.2 0.9991 947.12 1.61 9.32 101.62
CSP-1 Supplier 20 0.333 0.9992 1081.49 1.47 9.52 113.60
CSP-1 Supplier 20 0.5 0.9992 1249.26 1.39 9.64 129.59
CSP-1 Supplier 40 0.1 0.9992 1066.05 1.32 9.76 109.23
CSP-1 Supplier 40 0.2 0.9993 1143.09 1.31 9.61 118.95
CSP-1 Supplier 40 0.333 0.9993 1247.35 1.24 9.77 127.67
CSP-1 Supplier 40 0.5 0.9992 1371.81 1.38 9.72 141.13
23
DA Biosecurity: Plant-Product Pathways CSP and Data-Mining
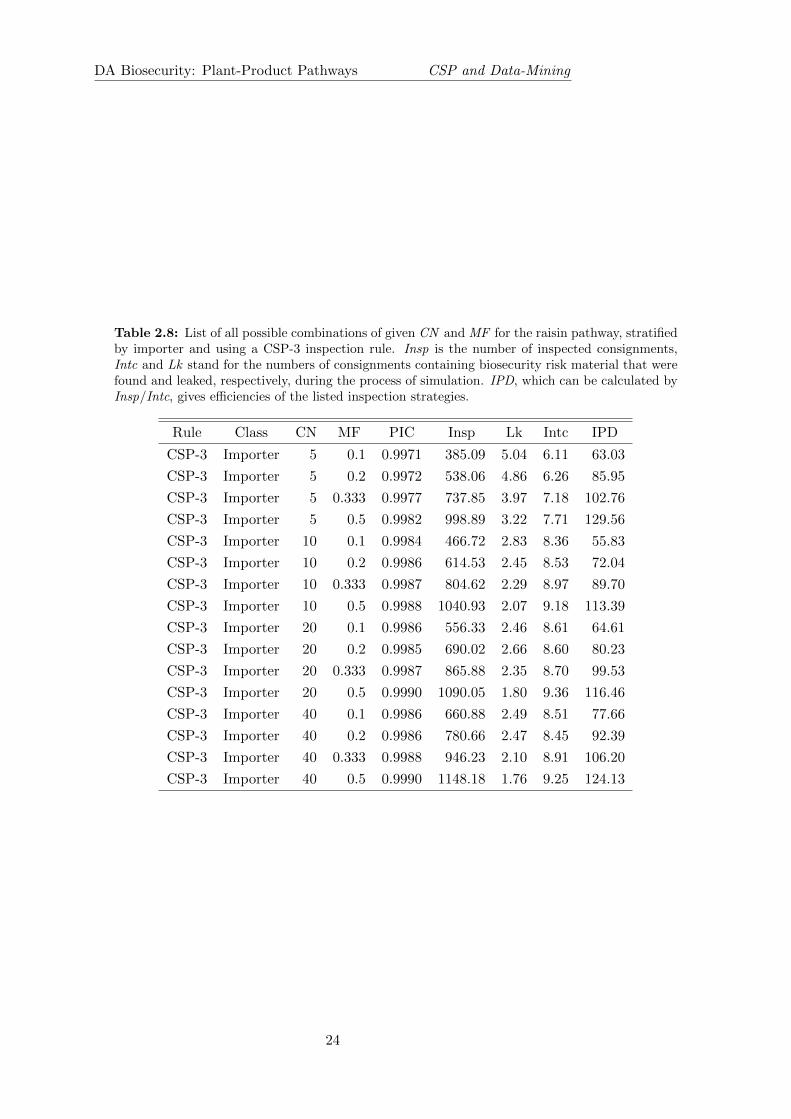
Table 2.8: List of all possible combinations of given CN and MF for the raisin pathway, stratifiedby importer and using a CSP-3 inspection rule. Insp is the number of inspected consignments,Intc and Lk stand for the numbers of consignments containing biosecurity risk material that werefound and leaked, respectively, during the process of simulation. IPD, which can be calculated byInsp/Intc, gives efficiencies of the listed inspection strategies.
Rule Class CN MF PIC Insp Lk Intc IPD
CSP-3 Importer 5 0.1 0.9971 385.09 5.04 6.11 63.03
CSP-3 Importer 5 0.2 0.9972 538.06 4.86 6.26 85.95
CSP-3 Importer 5 0.333 0.9977 737.85 3.97 7.18 102.76
CSP-3 Importer 5 0.5 0.9982 998.89 3.22 7.71 129.56
CSP-3 Importer 10 0.1 0.9984 466.72 2.83 8.36 55.83
CSP-3 Importer 10 0.2 0.9986 614.53 2.45 8.53 72.04
CSP-3 Importer 10 0.333 0.9987 804.62 2.29 8.97 89.70
CSP-3 Importer 10 0.5 0.9988 1040.93 2.07 9.18 113.39
CSP-3 Importer 20 0.1 0.9986 556.33 2.46 8.61 64.61
CSP-3 Importer 20 0.2 0.9985 690.02 2.66 8.60 80.23
CSP-3 Importer 20 0.333 0.9987 865.88 2.35 8.70 99.53
CSP-3 Importer 20 0.5 0.9990 1090.05 1.80 9.36 116.46
CSP-3 Importer 40 0.1 0.9986 660.88 2.49 8.51 77.66
CSP-3 Importer 40 0.2 0.9986 780.66 2.47 8.45 92.39
CSP-3 Importer 40 0.333 0.9988 946.23 2.10 8.91 106.20
CSP-3 Importer 40 0.5 0.9990 1148.18 1.76 9.25 124.13
24
DA Biosecurity: Plant-Product Pathways CSP and Data-Mining
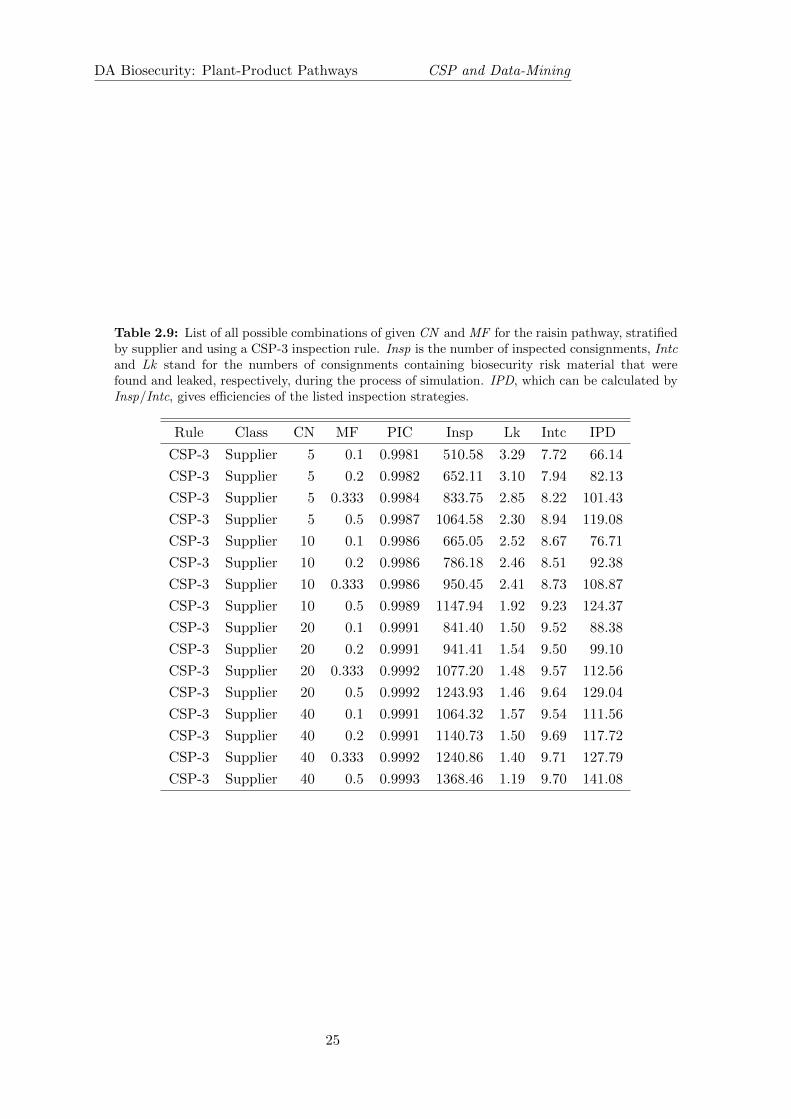
Table 2.9: List of all possible combinations of given CN and MF for the raisin pathway, stratifiedby supplier and using a CSP-3 inspection rule. Insp is the number of inspected consignments, Intcand Lk stand for the numbers of consignments containing biosecurity risk material that werefound and leaked, respectively, during the process of simulation. IPD, which can be calculated byInsp/Intc, gives efficiencies of the listed inspection strategies.
Rule Class CN MF PIC Insp Lk Intc IPD
CSP-3 Supplier 5 0.1 0.9981 510.58 3.29 7.72 66.14
CSP-3 Supplier 5 0.2 0.9982 652.11 3.10 7.94 82.13
CSP-3 Supplier 5 0.333 0.9984 833.75 2.85 8.22 101.43
CSP-3 Supplier 5 0.5 0.9987 1064.58 2.30 8.94 119.08
CSP-3 Supplier 10 0.1 0.9986 665.05 2.52 8.67 76.71
CSP-3 Supplier 10 0.2 0.9986 786.18 2.46 8.51 92.38
CSP-3 Supplier 10 0.333 0.9986 950.45 2.41 8.73 108.87
CSP-3 Supplier 10 0.5 0.9989 1147.94 1.92 9.23 124.37
CSP-3 Supplier 20 0.1 0.9991 841.40 1.50 9.52 88.38
CSP-3 Supplier 20 0.2 0.9991 941.41 1.54 9.50 99.10
CSP-3 Supplier 20 0.333 0.9992 1077.20 1.48 9.57 112.56
CSP-3 Supplier 20 0.5 0.9992 1243.93 1.46 9.64 129.04
CSP-3 Supplier 40 0.1 0.9991 1064.32 1.57 9.54 111.56
CSP-3 Supplier 40 0.2 0.9991 1140.73 1.50 9.69 117.72
CSP-3 Supplier 40 0.333 0.9992 1240.86 1.40 9.71 127.79
CSP-3 Supplier 40 0.5 0.9993 1368.46 1.19 9.70 141.08
25
DA Biosecurity: Plant-Product Pathways CSP and Data-Mining
Number of Consignments Inspected
Pos
t−In
terv
entio
n C
ompl
ianc
e (%
)
99.5
99.6
99.7
99.8
99.9
99.5
99.6
99.7
99.8
99.9
99.5
99.6
99.7
99.8
99.9
99.5
99.6
99.7
99.8
99.9
CSP−1
●
●
●
●
●
●
●
●
●
●
●
●
●
●
●
●
0 500 1000 1500
CSP−3
●
●
●
●
●
●
●
●
●●
●
●
●●
●
●
0 500 1000 1500
Nil
Country
Importer
Supplier
Clearance Number● 5 10 20 40
Monitoring Fraction
● 0.1 ● 0.2 ● 0.333 ● 0.5
Figure 2.3: Simulated Post-Intervention Compliance (PIC) against inspection effort for raisininspection history. The inspection strategies are in columns, and the stratification options are inrows. Within each panel, the sampling fraction is delineated by symbol colour, and the clearancenumber is delineated by the symbol shape. Approximation 95% confidence interval for the meanof simulation results are delineated by the vertical line. The grey line represents the expected PICthat would result from random sampling.
26

DA Biosecurity: Plant-Product Pathways CSP and Data-Mining
Number of Consignments Inspected
Num
ber
of N
on−
com
plia
nt C
onsi
gnm
ents
Lea
ked
2
4
6
8
10
2
4
6
8
10
2
4
6
8
10
2
4
6
8
10
CSP−1
●
●
●
●
●
●
●
●
●
●
●
●
●●
●
●
0 500 1000 1500
CSP−3
●
●
●
●
●
●
●
●
●●
●
●
●●
●
●
0 500 1000 1500
Nil
Country
Importer
Supplier
Clearance Number● 5 10 20 40
Monitoring Fraction
● 0.1 ● 0.2 ● 0.333 ● 0.5
Figure 2.4: Simulated leakage count against inspection effort for raisin inspection history. Theinspection strategies are in columns, and the stratification options are in rows. Within each panel,the sampling fraction is delineated by symbol colour, and the clearance number is delineated bythe symbol shape. Approximation 95% confidence interval for the mean of simulation results aredelineated by the vertical line. The grey line represents the expected leakage that would resultfrom random sampling.
27
DA Biosecurity: Plant-Product Pathways CSP and Data-Mining
Number of Consignments Inspected
IPD
: ins
pect
ions
/det
ectio
n
100
150
200
100
150
200
100
150
200
100
150
200
CSP−1
●
●
●
●
● ●
●
●
●
●
●
●
●
●
●
●
200 400 600 800 1000 1200
CSP−3
● ●●
●
●
●● ●
●
●
●
●
●
●
●
●
200 400 600 800 1000 1200
Nil
Country
Importer
Supplier
Clearance Number● 5 10 20 40
Monitoring Fraction
● 0.1 ● 0.2 ● 0.333 ● 0.5
Figure 2.5: Simulated IPD against inspection effort for raisin inspection history. The inspectionstrategies are in columns, and the stratification options are in rows. Within each panel, thesampling fraction is delineated by symbol colour, and the clearance number is delineated by thesymbol shape. Approximation 95% confidence interval for the mean of simulation results aredelineated by the vertical line. The grey line represents the IPD of full inspection over the analysisperiod (July 2008 - June 2012).
28

3
Analysis of CSP inspection strategiesfor the nut pathway
3.1 Background
To date the CSP method has been applied to plant import pathways such as green coffee beans,dried apricots, hulled sesame seeds, dried dates raisins, and cashew. Another possibility is thatit could be applied to broader categories of pathways, such as “nuts”. This could simplify theoperation of CSP for both the department and importers. There are three options for calculatingand applying CSP rates:
1. Calculate the rate based on combined data and apply the rate to the combined pathway.
2. Calculate the rate based on combined data, but apply the rate to each pathway separately.
3. Calculate and apply the rates separately for each pathway, as is currently done.
In this chapter we explore these options with CSP simulation.
The nut pathway comprises a group of imported nut types, including almonds, brazil nuts,cashews, chestnuts, hazelnuts, macadamias, pistachios, walnuts and “other nuts”. It is a subsetof a fruit dataset, the same one analysed in project 1101C [3].
The fruit dataset consists of all fruit imports over five years (January 2007 - March 2012) andcontains 79359 rows and 17 columns. Main variables of the dataset include quarantine entry,constituent, preparation, tariff number, creation date, importer, supplier and countries. Datacan be grouped by consignment or line, where there can be multiple lines within an individualconsignment. If we want to analyse the data with consignment mode, these lines (rows) wouldbe merged to 66313 unique consignments. Over the analysis time period, 5320 (or 6.70%) and4108 (or 6.19%) quarantine failures were detected with the line mode and with consignmentmode respectively. In this report, if it is not mentioned specifically, the data has been analysedwith line mode.
Quarantine failure rate of the nut pathway was low with the maximum yearly rate of 1.5% foundin 2010. Over the five years, the failure rate was 0.88% compared to 6.19% of the whole fruitdataset.
29
DA Biosecurity: Plant-Product Pathways CSP and Data-Mining
3.2 Import Conditions
Nuts that have been processed pose a low biosecurity risk. These include commercially prepared,and blanched, roasted, fried or boiled nuts. Processed nuts do not require an import permit andare exempt from mandatory treatment and inspection on arrival (they are cleared on verificationof documents). Raw nuts that have been vacuum sealed have these same requirements. Thereforethese would be outside the scope of CSP.
Raw or unprocessed nuts pose a slightly higher biosecurity risk. These include unshelled nuts andshelled raw nuts. Unshelled nuts can be difficult to inspect for insect pests that may be hiddeninside the shells. An import permit is not required, except for Almonds which do require animport permit. All consignments are also subject to mandatory treatment either pre-shipment,in transit or on-arrival, and a partial unpack and inspection to verify freedom from BRM.
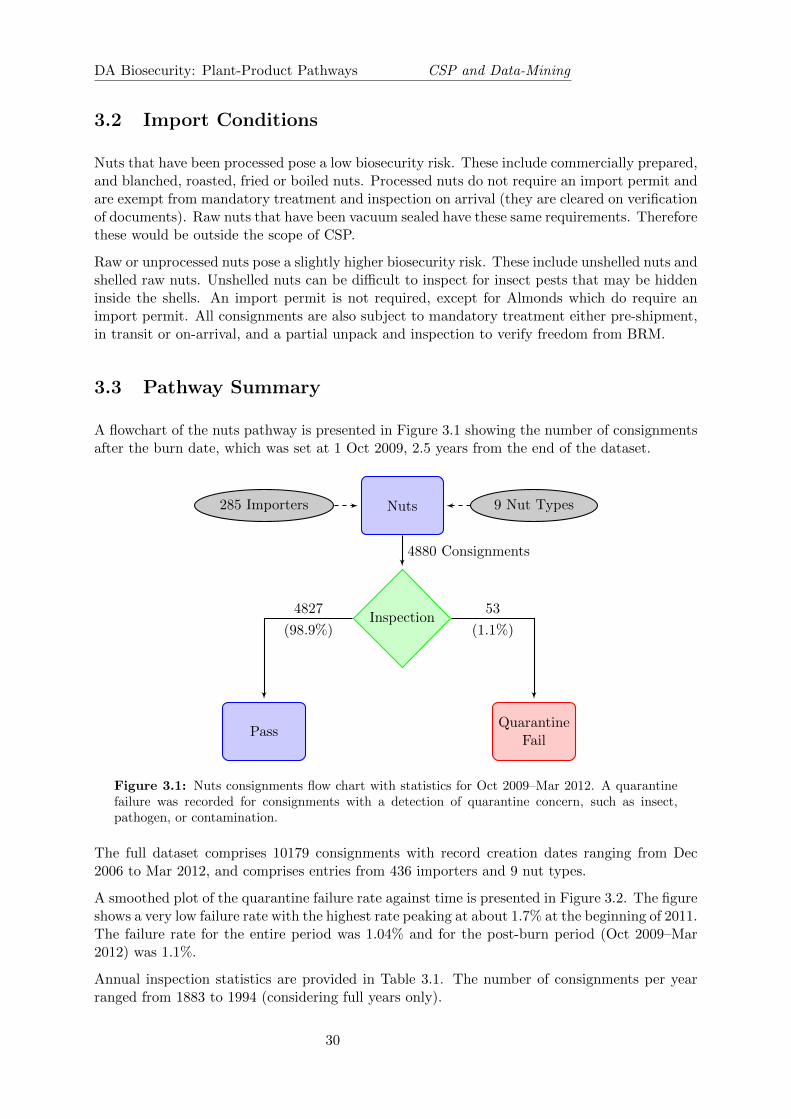
3.3 Pathway Summary
A flowchart of the nuts pathway is presented in Figure 3.1 showing the number of consignmentsafter the burn date, which was set at 1 Oct 2009, 2.5 years from the end of the dataset.
285 Importers Nuts 9 Nut Types
Inspection
PassQuarantine
Fail
4880 Consignments
4827
(98.9%)
53
(1.1%)
Figure 3.1: Nuts consignments flow chart with statistics for Oct 2009–Mar 2012. A quarantinefailure was recorded for consignments with a detection of quarantine concern, such as insect,pathogen, or contamination.
The full dataset comprises 10179 consignments with record creation dates ranging from Dec2006 to Mar 2012, and comprises entries from 436 importers and 9 nut types.
A smoothed plot of the quarantine failure rate against time is presented in Figure 3.2. The figureshows a very low failure rate with the highest rate peaking at about 1.7% at the beginning of 2011.The failure rate for the entire period was 1.04% and for the post-burn period (Oct 2009–Mar2012) was 1.1%.
Annual inspection statistics are provided in Table 3.1. The number of consignments per yearranged from 1883 to 1994 (considering full years only).
30

DA Biosecurity: Plant-Product Pathways CSP and Data-Mining
Table 3.1: Pattern of inspections and quarantine failure rates by year for the nut pathway.Count is the number of consignments imported during the study period, QF % is the percentageof consignments with BRM. Note that 2006 and 2012 have only one and three months respectively.
Year Count QF %
2006* 9 0.0
2007 1994 1.1
2008 1988 1.1
2009 1883 0.9
2010 1979 1.5
2011 1916 0.9
2012* 410 0.0
Table 3.2: Pattern of recent quarantine failure counts by importers and nut types. The datacover all inspections between Oct 2009 and Mar 2012.
Failures Importers Types
0 257 0
1 18 2
2 5 1
3 1 0
4 1 2
5 1 2
6 1 1
7 1 0
8 0 0
9 0 0
10 0 0
11 0 0
12 0 0
13 0 0
14 0 0
15 0 0
16 0 0
17 0 0
18 0 0
19 0 0
20 0 0
21 0 0
22 0 0
23 0 0
24 0 0
25 0 1
31
DA Biosecurity: Plant-Product Pathways CSP and Data-Mining
Date
Qua
rant
ine
Failu
re R
ate
(%)
0
0.5
1
1.5
2
2.5
3
2007 2008 2009 2010 2011 2012
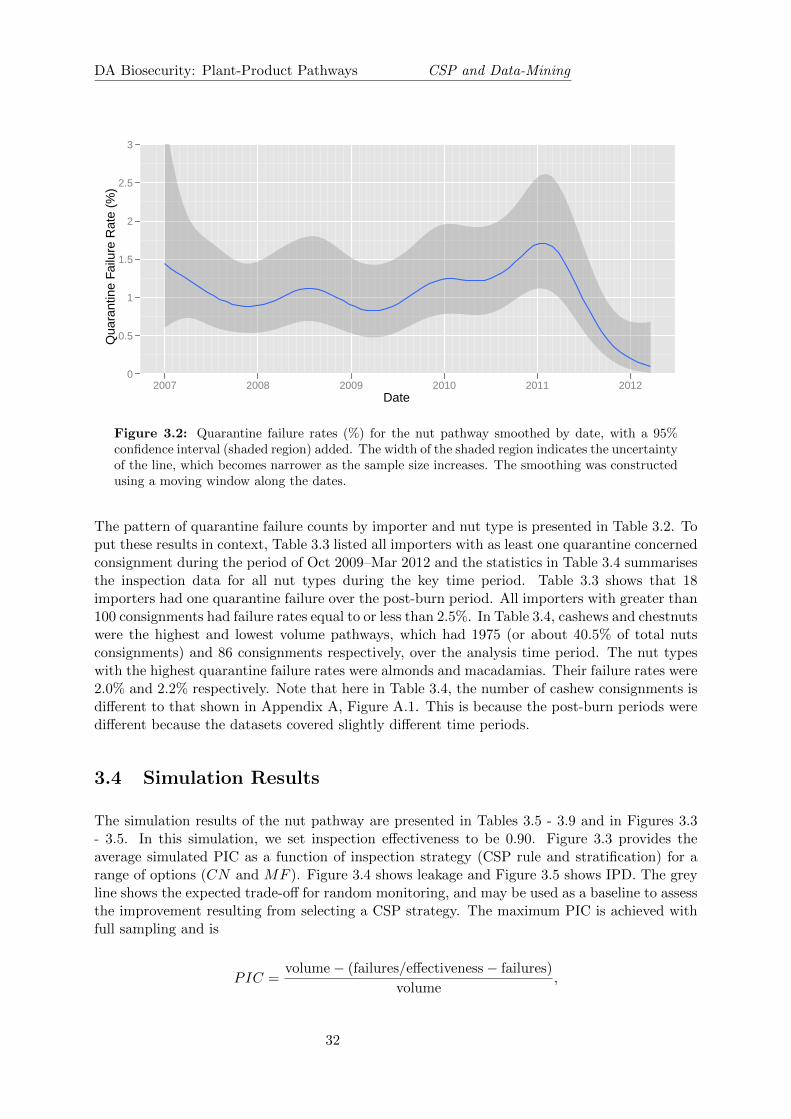
Figure 3.2: Quarantine failure rates (%) for the nut pathway smoothed by date, with a 95%confidence interval (shaded region) added. The width of the shaded region indicates the uncertaintyof the line, which becomes narrower as the sample size increases. The smoothing was constructedusing a moving window along the dates.
The pattern of quarantine failure counts by importer and nut type is presented in Table 3.2. Toput these results in context, Table 3.3 listed all importers with as least one quarantine concernedconsignment during the period of Oct 2009–Mar 2012 and the statistics in Table 3.4 summarisesthe inspection data for all nut types during the key time period. Table 3.3 shows that 18importers had one quarantine failure over the post-burn period. All importers with greater than100 consignments had failure rates equal to or less than 2.5%. In Table 3.4, cashews and chestnutswere the highest and lowest volume pathways, which had 1975 (or about 40.5% of total nutsconsignments) and 86 consignments respectively, over the analysis time period. The nut typeswith the highest quarantine failure rates were almonds and macadamias. Their failure rates were2.0% and 2.2% respectively. Note that here in Table 3.4, the number of cashew consignments isdifferent to that shown in Appendix A, Figure A.1. This is because the post-burn periods weredifferent because the datasets covered slightly different time periods.
3.4 Simulation Results
The simulation results of the nut pathway are presented in Tables 3.5 - 3.9 and in Figures 3.3- 3.5. In this simulation, we set inspection effectiveness to be 0.90. Figure 3.3 provides theaverage simulated PIC as a function of inspection strategy (CSP rule and stratification) for arange of options (CN and MF ). Figure 3.4 shows leakage and Figure 3.5 shows IPD. The greyline shows the expected trade-off for random monitoring, and may be used as a baseline to assessthe improvement resulting from selecting a CSP strategy. The maximum PIC is achieved withfull sampling and is
PIC =volume− (failures/effectiveness− failures)
volume,
32

DA Biosecurity: Plant-Product Pathways CSP and Data-Mining
Table 3.3: Summary statistics by importer for the nut pathway. Count is the number ofconsignments imported during the study period. QF is the count of consignments with BRM.The Types column reports the number of nut types that were imported by each importer duringthe time period. The data cover all inspections between Oct 2009 and Mar 2012. We only includethose importers with at least one BRM consignment during the time period.
Importer Count QF QF % Types
a 715 7 1.0 8
b 466 6 1.3 8
c 404 1 0.2 2
d 236 2 0.8 7
e 222 1 0.5 7
f 201 5 2.5 7
g 199 4 2.0 7
h 174 1 0.6 6
i 127 1 0.8 7
j 35 2 5.7 1
k 25 1 4.0 1
l 15 3 20.0 1
m 12 2 16.7 3
n 12 1 8.3 5
o 11 1 9.1 2
p 5 2 40.0 2
q 4 1 25.0 4
r 3 2 66.7 1
s 3 1 33.3 3
t 3 1 33.3 1
u 2 1 50.0 1
v 2 1 50.0 1
w 1 1 100.0 1
x 1 1 100.0 1
y 1 1 100.0 1
z 1 1 100.0 1
A 1 1 100.0 1
B 1 1 100.0 1
33
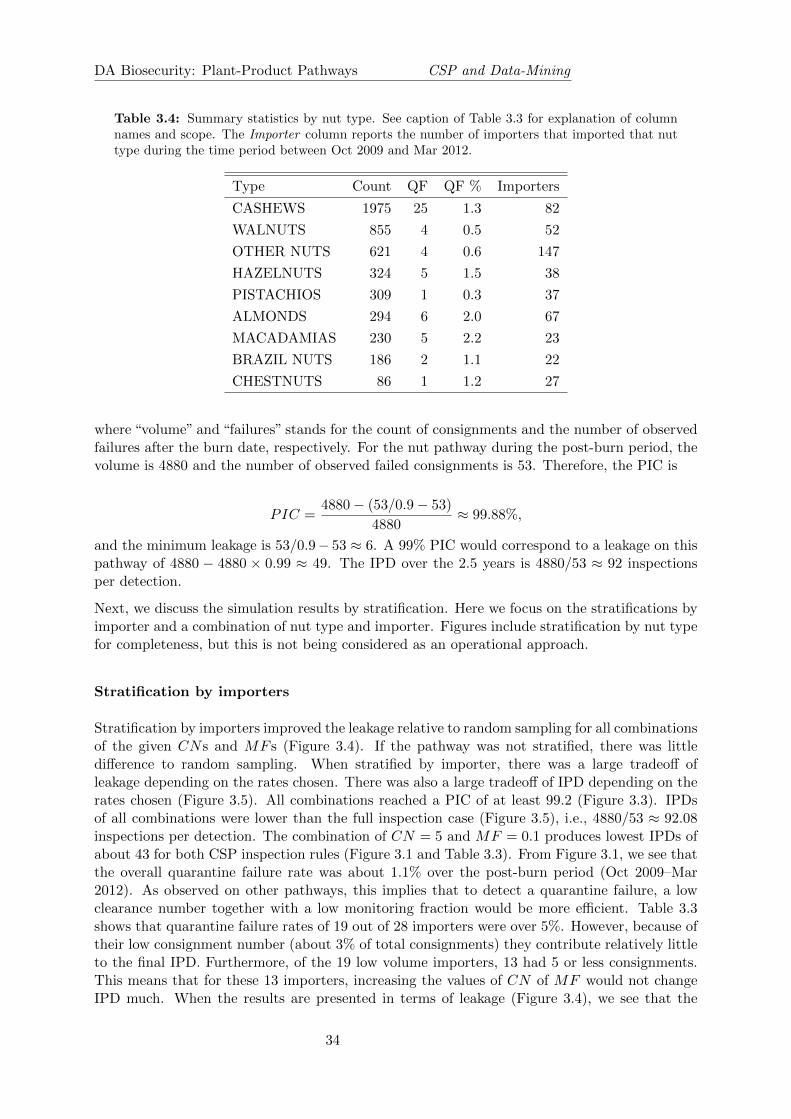
DA Biosecurity: Plant-Product Pathways CSP and Data-Mining
Table 3.4: Summary statistics by nut type. See caption of Table 3.3 for explanation of columnnames and scope. The Importer column reports the number of importers that imported that nuttype during the time period between Oct 2009 and Mar 2012.
Type Count QF QF % Importers
CASHEWS 1975 25 1.3 82
WALNUTS 855 4 0.5 52
OTHER NUTS 621 4 0.6 147
HAZELNUTS 324 5 1.5 38
PISTACHIOS 309 1 0.3 37
ALMONDS 294 6 2.0 67
MACADAMIAS 230 5 2.2 23
BRAZIL NUTS 186 2 1.1 22
CHESTNUTS 86 1 1.2 27
where “volume” and “failures” stands for the count of consignments and the number of observedfailures after the burn date, respectively. For the nut pathway during the post-burn period, thevolume is 4880 and the number of observed failed consignments is 53. Therefore, the PIC is
PIC =4880− (53/0.9− 53)
4880≈ 99.88%,
and the minimum leakage is 53/0.9− 53 ≈ 6. A 99% PIC would correspond to a leakage on thispathway of 4880 − 4880 × 0.99 ≈ 49. The IPD over the 2.5 years is 4880/53 ≈ 92 inspectionsper detection.
Next, we discuss the simulation results by stratification. Here we focus on the stratifications byimporter and a combination of nut type and importer. Figures include stratification by nut typefor completeness, but this is not being considered as an operational approach.
Stratification by importers
Stratification by importers improved the leakage relative to random sampling for all combinationsof the given CNs and MF s (Figure 3.4). If the pathway was not stratified, there was littledifference to random sampling. When stratified by importer, there was a large tradeoff ofleakage depending on the rates chosen. There was also a large tradeoff of IPD depending on therates chosen (Figure 3.5). All combinations reached a PIC of at least 99.2 (Figure 3.3). IPDsof all combinations were lower than the full inspection case (Figure 3.5), i.e., 4880/53 ≈ 92.08inspections per detection. The combination of CN = 5 and MF = 0.1 produces lowest IPDs ofabout 43 for both CSP inspection rules (Figure 3.1 and Table 3.3). From Figure 3.1, we see thatthe overall quarantine failure rate was about 1.1% over the post-burn period (Oct 2009–Mar2012). As observed on other pathways, this implies that to detect a quarantine failure, a lowclearance number together with a low monitoring fraction would be more efficient. Table 3.3shows that quarantine failure rates of 19 out of 28 importers were over 5%. However, because oftheir low consignment number (about 3% of total consignments) they contribute relatively littleto the final IPD. Furthermore, of the 19 low volume importers, 13 had 5 or less consignments.This means that for these 13 importers, increasing the values of CN of MF would not changeIPD much. When the results are presented in terms of leakage (Figure 3.4), we see that the
34
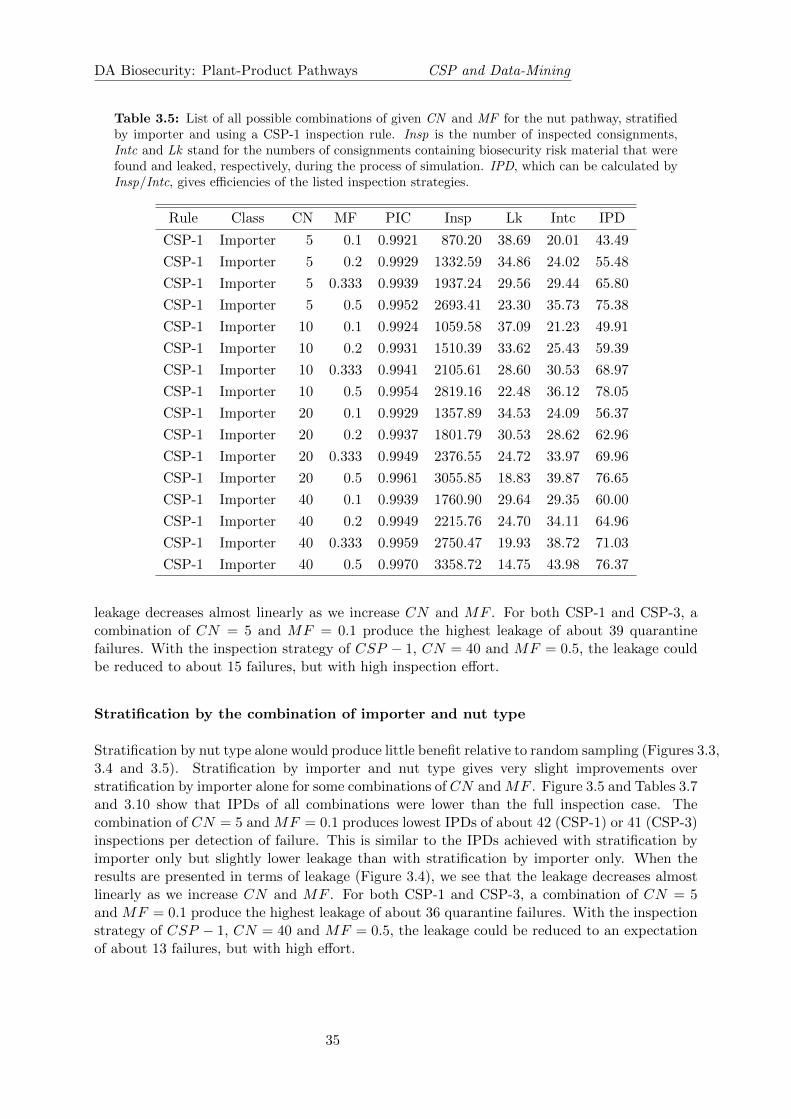
DA Biosecurity: Plant-Product Pathways CSP and Data-Mining
Table 3.5: List of all possible combinations of given CN and MF for the nut pathway, stratifiedby importer and using a CSP-1 inspection rule. Insp is the number of inspected consignments,Intc and Lk stand for the numbers of consignments containing biosecurity risk material that werefound and leaked, respectively, during the process of simulation. IPD, which can be calculated byInsp/Intc, gives efficiencies of the listed inspection strategies.
Rule Class CN MF PIC Insp Lk Intc IPD
CSP-1 Importer 5 0.1 0.9921 870.20 38.69 20.01 43.49
CSP-1 Importer 5 0.2 0.9929 1332.59 34.86 24.02 55.48
CSP-1 Importer 5 0.333 0.9939 1937.24 29.56 29.44 65.80
CSP-1 Importer 5 0.5 0.9952 2693.41 23.30 35.73 75.38
CSP-1 Importer 10 0.1 0.9924 1059.58 37.09 21.23 49.91
CSP-1 Importer 10 0.2 0.9931 1510.39 33.62 25.43 59.39
CSP-1 Importer 10 0.333 0.9941 2105.61 28.60 30.53 68.97
CSP-1 Importer 10 0.5 0.9954 2819.16 22.48 36.12 78.05
CSP-1 Importer 20 0.1 0.9929 1357.89 34.53 24.09 56.37
CSP-1 Importer 20 0.2 0.9937 1801.79 30.53 28.62 62.96
CSP-1 Importer 20 0.333 0.9949 2376.55 24.72 33.97 69.96
CSP-1 Importer 20 0.5 0.9961 3055.85 18.83 39.87 76.65
CSP-1 Importer 40 0.1 0.9939 1760.90 29.64 29.35 60.00
CSP-1 Importer 40 0.2 0.9949 2215.76 24.70 34.11 64.96
CSP-1 Importer 40 0.333 0.9959 2750.47 19.93 38.72 71.03
CSP-1 Importer 40 0.5 0.9970 3358.72 14.75 43.98 76.37
leakage decreases almost linearly as we increase CN and MF . For both CSP-1 and CSP-3, acombination of CN = 5 and MF = 0.1 produce the highest leakage of about 39 quarantinefailures. With the inspection strategy of CSP − 1, CN = 40 and MF = 0.5, the leakage couldbe reduced to about 15 failures, but with high inspection effort.
Stratification by the combination of importer and nut type
Stratification by nut type alone would produce little benefit relative to random sampling (Figures 3.3,3.4 and 3.5). Stratification by importer and nut type gives very slight improvements overstratification by importer alone for some combinations of CN and MF . Figure 3.5 and Tables 3.7and 3.10 show that IPDs of all combinations were lower than the full inspection case. Thecombination of CN = 5 and MF = 0.1 produces lowest IPDs of about 42 (CSP-1) or 41 (CSP-3)inspections per detection of failure. This is similar to the IPDs achieved with stratification byimporter only but slightly lower leakage than with stratification by importer only. When theresults are presented in terms of leakage (Figure 3.4), we see that the leakage decreases almostlinearly as we increase CN and MF . For both CSP-1 and CSP-3, a combination of CN = 5and MF = 0.1 produce the highest leakage of about 36 quarantine failures. With the inspectionstrategy of CSP − 1, CN = 40 and MF = 0.5, the leakage could be reduced to an expectationof about 13 failures, but with high effort.
35
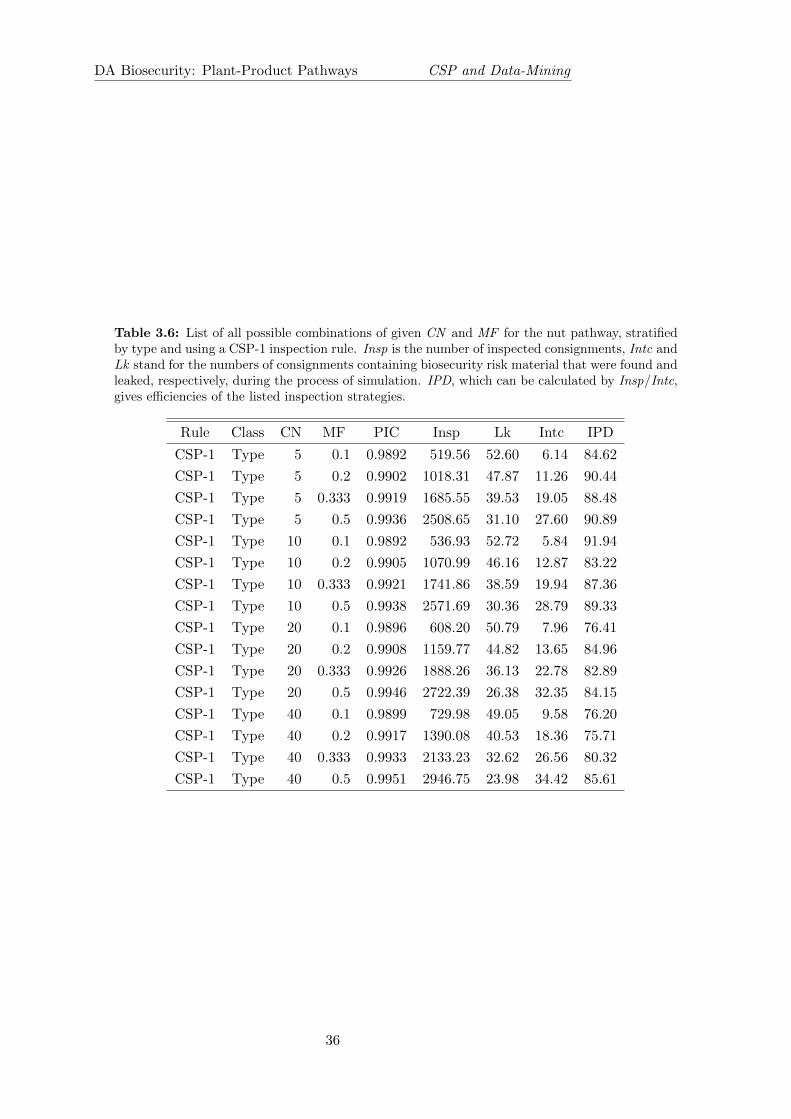
DA Biosecurity: Plant-Product Pathways CSP and Data-Mining
Table 3.6: List of all possible combinations of given CN and MF for the nut pathway, stratifiedby type and using a CSP-1 inspection rule. Insp is the number of inspected consignments, Intc andLk stand for the numbers of consignments containing biosecurity risk material that were found andleaked, respectively, during the process of simulation. IPD, which can be calculated by Insp/Intc,gives efficiencies of the listed inspection strategies.
Rule Class CN MF PIC Insp Lk Intc IPD
CSP-1 Type 5 0.1 0.9892 519.56 52.60 6.14 84.62
CSP-1 Type 5 0.2 0.9902 1018.31 47.87 11.26 90.44
CSP-1 Type 5 0.333 0.9919 1685.55 39.53 19.05 88.48
CSP-1 Type 5 0.5 0.9936 2508.65 31.10 27.60 90.89
CSP-1 Type 10 0.1 0.9892 536.93 52.72 5.84 91.94
CSP-1 Type 10 0.2 0.9905 1070.99 46.16 12.87 83.22
CSP-1 Type 10 0.333 0.9921 1741.86 38.59 19.94 87.36
CSP-1 Type 10 0.5 0.9938 2571.69 30.36 28.79 89.33
CSP-1 Type 20 0.1 0.9896 608.20 50.79 7.96 76.41
CSP-1 Type 20 0.2 0.9908 1159.77 44.82 13.65 84.96
CSP-1 Type 20 0.333 0.9926 1888.26 36.13 22.78 82.89
CSP-1 Type 20 0.5 0.9946 2722.39 26.38 32.35 84.15
CSP-1 Type 40 0.1 0.9899 729.98 49.05 9.58 76.20
CSP-1 Type 40 0.2 0.9917 1390.08 40.53 18.36 75.71
CSP-1 Type 40 0.333 0.9933 2133.23 32.62 26.56 80.32
CSP-1 Type 40 0.5 0.9951 2946.75 23.98 34.42 85.61
36
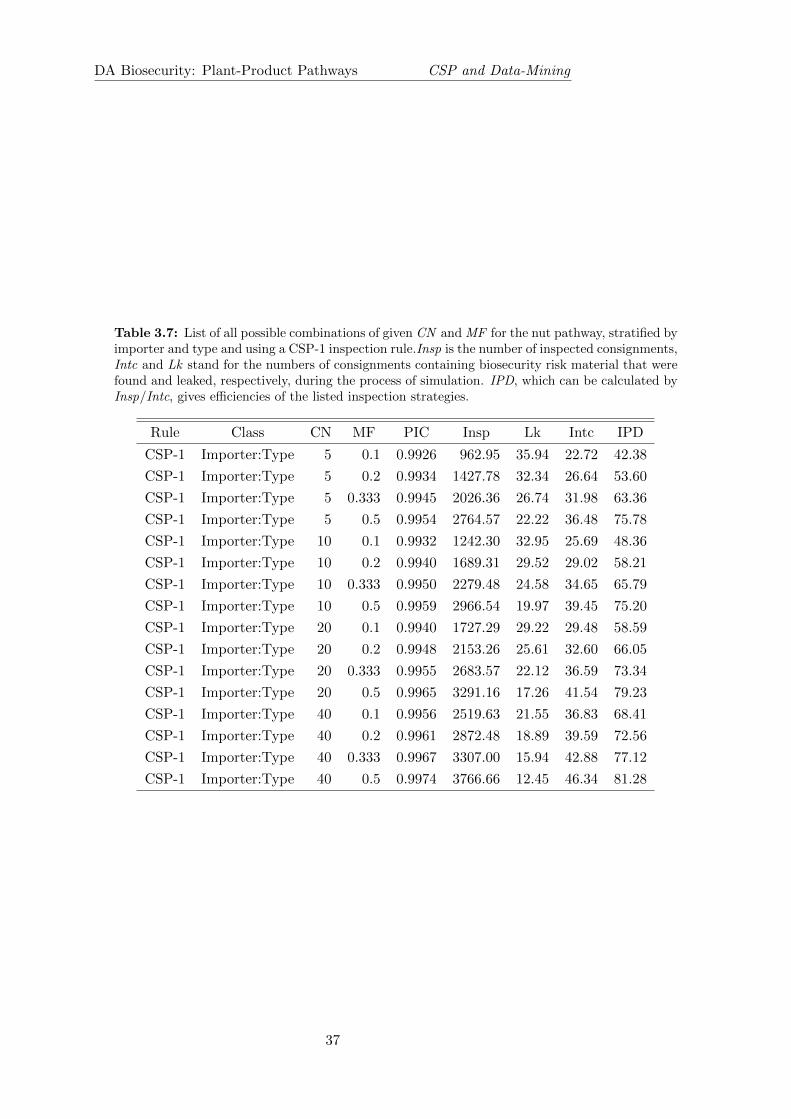
DA Biosecurity: Plant-Product Pathways CSP and Data-Mining
Table 3.7: List of all possible combinations of given CN and MF for the nut pathway, stratified byimporter and type and using a CSP-1 inspection rule.Insp is the number of inspected consignments,Intc and Lk stand for the numbers of consignments containing biosecurity risk material that werefound and leaked, respectively, during the process of simulation. IPD, which can be calculated byInsp/Intc, gives efficiencies of the listed inspection strategies.
Rule Class CN MF PIC Insp Lk Intc IPD
CSP-1 Importer:Type 5 0.1 0.9926 962.95 35.94 22.72 42.38
CSP-1 Importer:Type 5 0.2 0.9934 1427.78 32.34 26.64 53.60
CSP-1 Importer:Type 5 0.333 0.9945 2026.36 26.74 31.98 63.36
CSP-1 Importer:Type 5 0.5 0.9954 2764.57 22.22 36.48 75.78
CSP-1 Importer:Type 10 0.1 0.9932 1242.30 32.95 25.69 48.36
CSP-1 Importer:Type 10 0.2 0.9940 1689.31 29.52 29.02 58.21
CSP-1 Importer:Type 10 0.333 0.9950 2279.48 24.58 34.65 65.79
CSP-1 Importer:Type 10 0.5 0.9959 2966.54 19.97 39.45 75.20
CSP-1 Importer:Type 20 0.1 0.9940 1727.29 29.22 29.48 58.59
CSP-1 Importer:Type 20 0.2 0.9948 2153.26 25.61 32.60 66.05
CSP-1 Importer:Type 20 0.333 0.9955 2683.57 22.12 36.59 73.34
CSP-1 Importer:Type 20 0.5 0.9965 3291.16 17.26 41.54 79.23
CSP-1 Importer:Type 40 0.1 0.9956 2519.63 21.55 36.83 68.41
CSP-1 Importer:Type 40 0.2 0.9961 2872.48 18.89 39.59 72.56
CSP-1 Importer:Type 40 0.333 0.9967 3307.00 15.94 42.88 77.12
CSP-1 Importer:Type 40 0.5 0.9974 3766.66 12.45 46.34 81.28
37
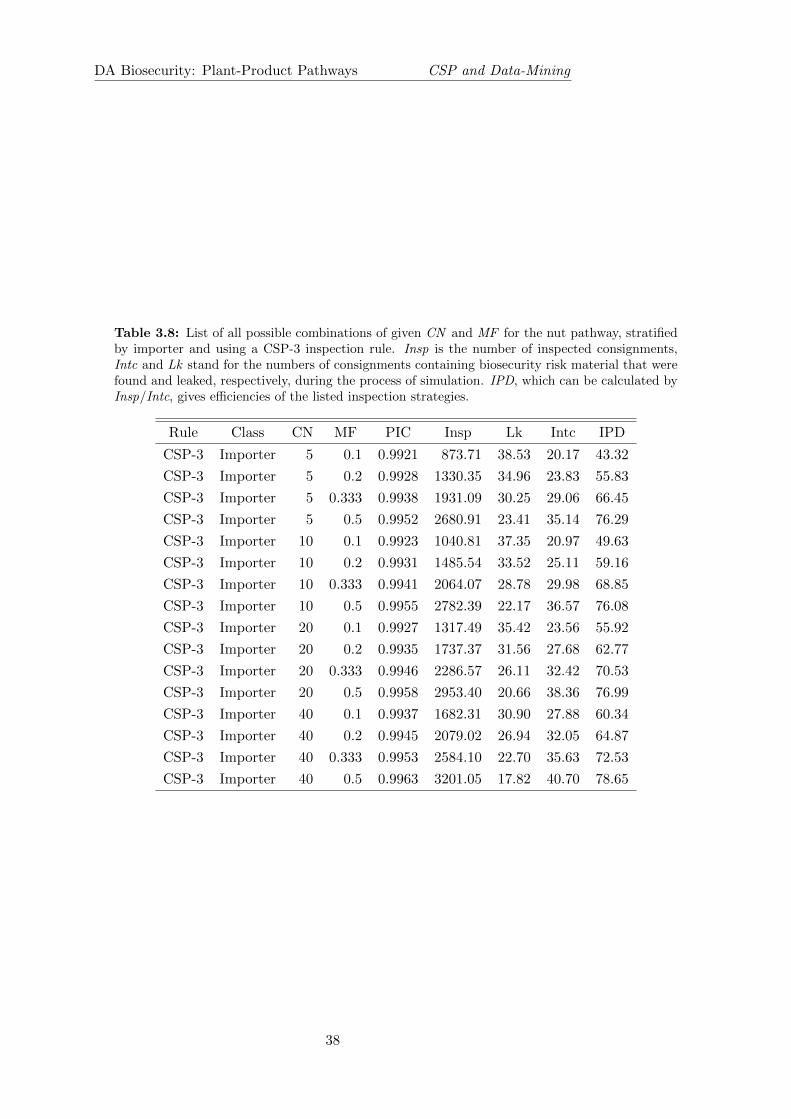
DA Biosecurity: Plant-Product Pathways CSP and Data-Mining
Table 3.8: List of all possible combinations of given CN and MF for the nut pathway, stratifiedby importer and using a CSP-3 inspection rule. Insp is the number of inspected consignments,Intc and Lk stand for the numbers of consignments containing biosecurity risk material that werefound and leaked, respectively, during the process of simulation. IPD, which can be calculated byInsp/Intc, gives efficiencies of the listed inspection strategies.
Rule Class CN MF PIC Insp Lk Intc IPD
CSP-3 Importer 5 0.1 0.9921 873.71 38.53 20.17 43.32
CSP-3 Importer 5 0.2 0.9928 1330.35 34.96 23.83 55.83
CSP-3 Importer 5 0.333 0.9938 1931.09 30.25 29.06 66.45
CSP-3 Importer 5 0.5 0.9952 2680.91 23.41 35.14 76.29
CSP-3 Importer 10 0.1 0.9923 1040.81 37.35 20.97 49.63
CSP-3 Importer 10 0.2 0.9931 1485.54 33.52 25.11 59.16
CSP-3 Importer 10 0.333 0.9941 2064.07 28.78 29.98 68.85
CSP-3 Importer 10 0.5 0.9955 2782.39 22.17 36.57 76.08
CSP-3 Importer 20 0.1 0.9927 1317.49 35.42 23.56 55.92
CSP-3 Importer 20 0.2 0.9935 1737.37 31.56 27.68 62.77
CSP-3 Importer 20 0.333 0.9946 2286.57 26.11 32.42 70.53
CSP-3 Importer 20 0.5 0.9958 2953.40 20.66 38.36 76.99
CSP-3 Importer 40 0.1 0.9937 1682.31 30.90 27.88 60.34
CSP-3 Importer 40 0.2 0.9945 2079.02 26.94 32.05 64.87
CSP-3 Importer 40 0.333 0.9953 2584.10 22.70 35.63 72.53
CSP-3 Importer 40 0.5 0.9963 3201.05 17.82 40.70 78.65
38
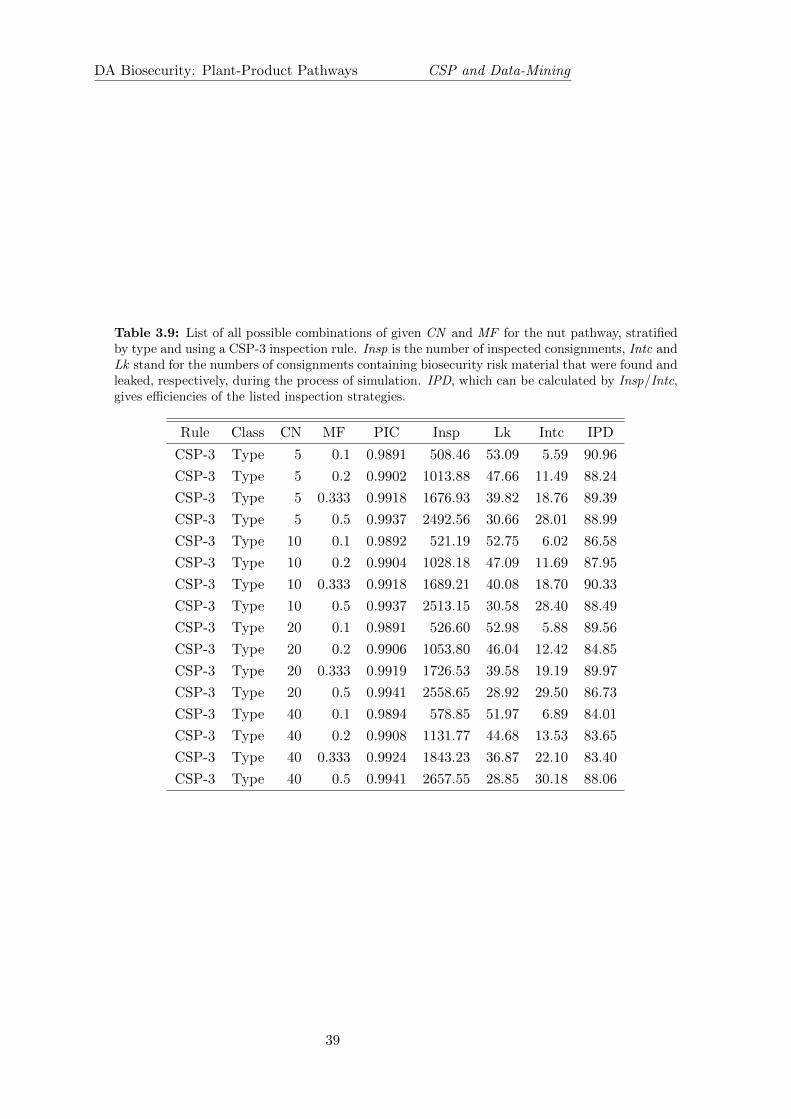
DA Biosecurity: Plant-Product Pathways CSP and Data-Mining
Table 3.9: List of all possible combinations of given CN and MF for the nut pathway, stratifiedby type and using a CSP-3 inspection rule. Insp is the number of inspected consignments, Intc andLk stand for the numbers of consignments containing biosecurity risk material that were found andleaked, respectively, during the process of simulation. IPD, which can be calculated by Insp/Intc,gives efficiencies of the listed inspection strategies.
Rule Class CN MF PIC Insp Lk Intc IPD
CSP-3 Type 5 0.1 0.9891 508.46 53.09 5.59 90.96
CSP-3 Type 5 0.2 0.9902 1013.88 47.66 11.49 88.24
CSP-3 Type 5 0.333 0.9918 1676.93 39.82 18.76 89.39
CSP-3 Type 5 0.5 0.9937 2492.56 30.66 28.01 88.99
CSP-3 Type 10 0.1 0.9892 521.19 52.75 6.02 86.58
CSP-3 Type 10 0.2 0.9904 1028.18 47.09 11.69 87.95
CSP-3 Type 10 0.333 0.9918 1689.21 40.08 18.70 90.33
CSP-3 Type 10 0.5 0.9937 2513.15 30.58 28.40 88.49
CSP-3 Type 20 0.1 0.9891 526.60 52.98 5.88 89.56
CSP-3 Type 20 0.2 0.9906 1053.80 46.04 12.42 84.85
CSP-3 Type 20 0.333 0.9919 1726.53 39.58 19.19 89.97
CSP-3 Type 20 0.5 0.9941 2558.65 28.92 29.50 86.73
CSP-3 Type 40 0.1 0.9894 578.85 51.97 6.89 84.01
CSP-3 Type 40 0.2 0.9908 1131.77 44.68 13.53 83.65
CSP-3 Type 40 0.333 0.9924 1843.23 36.87 22.10 83.40
CSP-3 Type 40 0.5 0.9941 2657.55 28.85 30.18 88.06
39
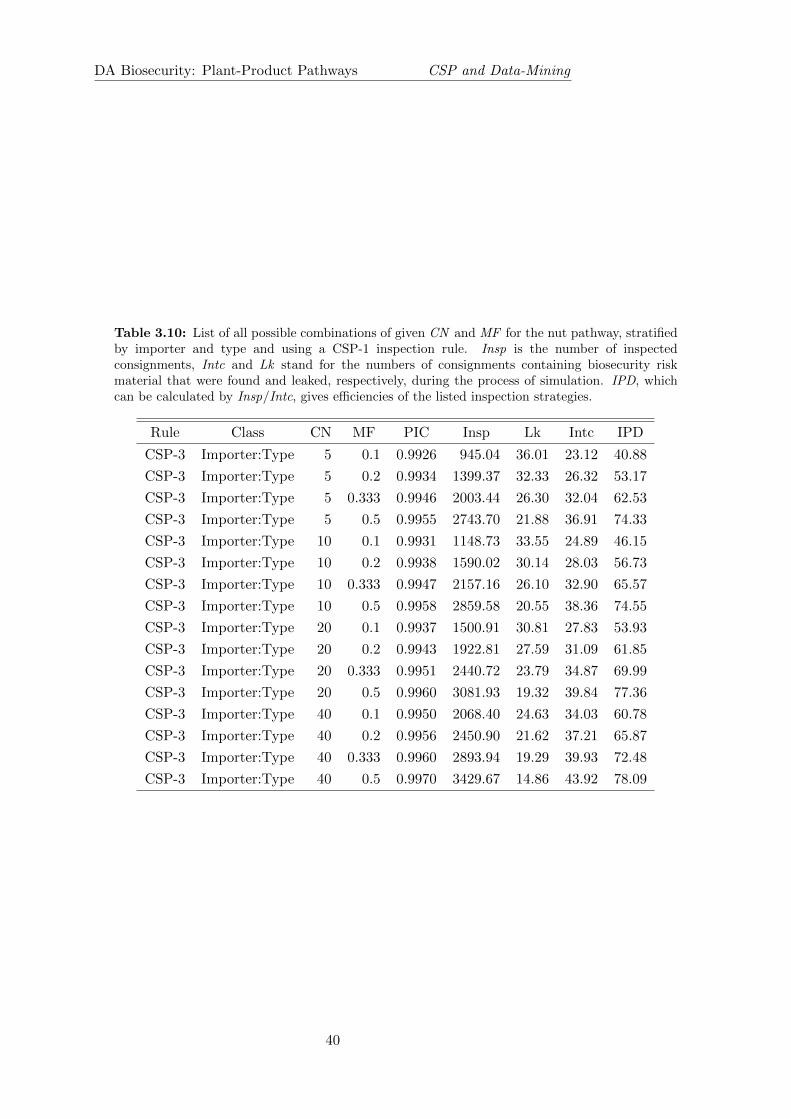
DA Biosecurity: Plant-Product Pathways CSP and Data-Mining
Table 3.10: List of all possible combinations of given CN and MF for the nut pathway, stratifiedby importer and type and using a CSP-1 inspection rule. Insp is the number of inspectedconsignments, Intc and Lk stand for the numbers of consignments containing biosecurity riskmaterial that were found and leaked, respectively, during the process of simulation. IPD, whichcan be calculated by Insp/Intc, gives efficiencies of the listed inspection strategies.
Rule Class CN MF PIC Insp Lk Intc IPD
CSP-3 Importer:Type 5 0.1 0.9926 945.04 36.01 23.12 40.88
CSP-3 Importer:Type 5 0.2 0.9934 1399.37 32.33 26.32 53.17
CSP-3 Importer:Type 5 0.333 0.9946 2003.44 26.30 32.04 62.53
CSP-3 Importer:Type 5 0.5 0.9955 2743.70 21.88 36.91 74.33
CSP-3 Importer:Type 10 0.1 0.9931 1148.73 33.55 24.89 46.15
CSP-3 Importer:Type 10 0.2 0.9938 1590.02 30.14 28.03 56.73
CSP-3 Importer:Type 10 0.333 0.9947 2157.16 26.10 32.90 65.57
CSP-3 Importer:Type 10 0.5 0.9958 2859.58 20.55 38.36 74.55
CSP-3 Importer:Type 20 0.1 0.9937 1500.91 30.81 27.83 53.93
CSP-3 Importer:Type 20 0.2 0.9943 1922.81 27.59 31.09 61.85
CSP-3 Importer:Type 20 0.333 0.9951 2440.72 23.79 34.87 69.99
CSP-3 Importer:Type 20 0.5 0.9960 3081.93 19.32 39.84 77.36
CSP-3 Importer:Type 40 0.1 0.9950 2068.40 24.63 34.03 60.78
CSP-3 Importer:Type 40 0.2 0.9956 2450.90 21.62 37.21 65.87
CSP-3 Importer:Type 40 0.333 0.9960 2893.94 19.29 39.93 72.48
CSP-3 Importer:Type 40 0.5 0.9970 3429.67 14.86 43.92 78.09
40

DA Biosecurity: Plant-Product Pathways CSP and Data-Mining
Number of Consignments Inspected
Pos
t−In
terv
entio
n C
ompl
ianc
e (%
)
99.0
99.2
99.4
99.6
99.0
99.2
99.4
99.6
99.0
99.2
99.4
99.6
99.0
99.2
99.4
99.6
CSP−1
●
●
●
●
●
●
●
●
●
●
●
●
●
●
●
●
0 800 1600 2400 3200 4000 4800
CSP−3
●
●
●
●
●
●
●
●
●
●
●
●
●
●
●
●
0 800 1600 2400 3200 4000 4800
nilType
Importer
Importer:Type
Clearance Number● 5 10 20 40
Monitoring Fraction
● 0.1 ● 0.2 ● 0.333 ● 0.5
Figure 3.3: Simulated Post-Intervention Compliance (PIC) against inspection effort for nutsinspection history. The inspection strategies are in columns, and the stratification options are inrows. Within each panel, the sampling fraction is delineated by symbol colour, and the clearancenumber is delineated by the symbol shape. Approximation 95% confidence interval for the meanof simulation results are delineated by the vertical line. The grey line represents the expected PICthat would result from random sampling.
41
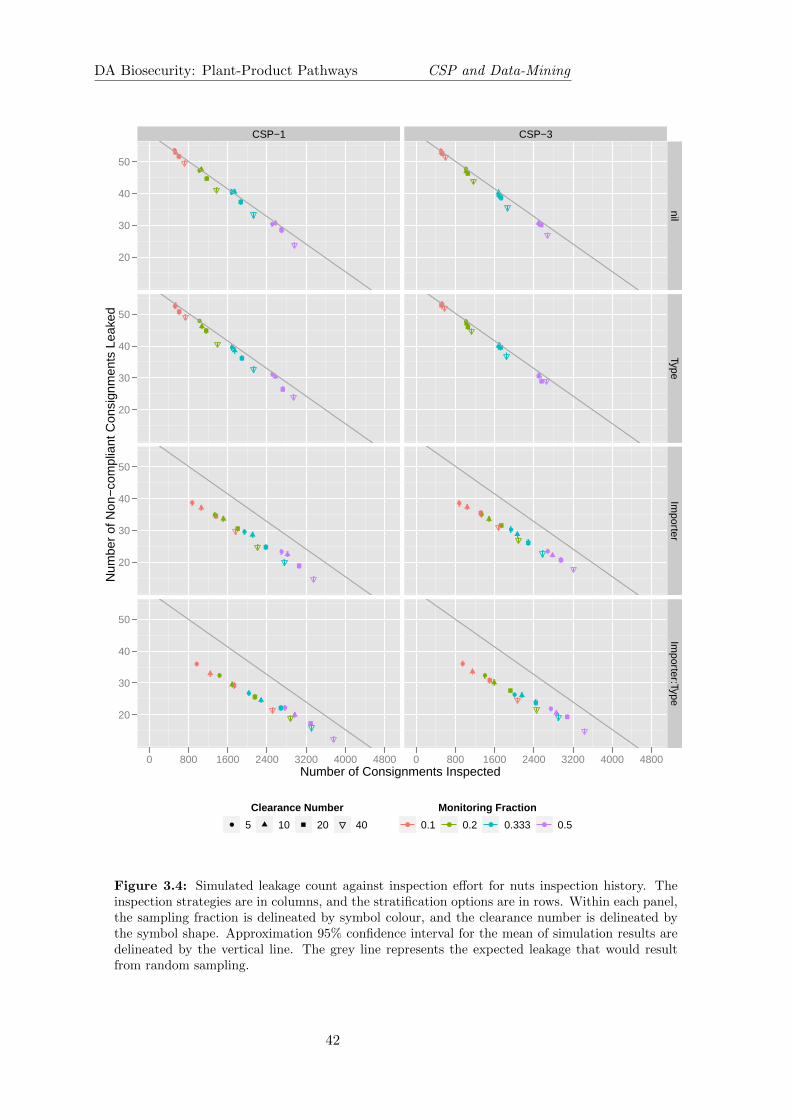
DA Biosecurity: Plant-Product Pathways CSP and Data-Mining
Number of Consignments Inspected
Num
ber
of N
on−
com
plia
nt C
onsi
gnm
ents
Lea
ked
20
30
40
50
20
30
40
50
20
30
40
50
20
30
40
50
CSP−1●
●
●
●
●
●
●
●
●
●
●
●
●
●
●
●
0 800 1600 2400 3200 4000 4800
CSP−3●
●
●
●
●
●
●
●
●
●
●
●
●
●
●
●
0 800 1600 2400 3200 4000 4800
nilType
Importer
Importer:Type
Clearance Number● 5 10 20 40
Monitoring Fraction
● 0.1 ● 0.2 ● 0.333 ● 0.5
Figure 3.4: Simulated leakage count against inspection effort for nuts inspection history. Theinspection strategies are in columns, and the stratification options are in rows. Within each panel,the sampling fraction is delineated by symbol colour, and the clearance number is delineated bythe symbol shape. Approximation 95% confidence interval for the mean of simulation results aredelineated by the vertical line. The grey line represents the expected leakage that would resultfrom random sampling.
42

DA Biosecurity: Plant-Product Pathways CSP and Data-Mining
Number of Consignments Inspected
IPD
: ins
pect
ions
/det
ectio
n
40
50
60
70
80
90
100
40
50
60
70
80
90
100
40
50
60
70
80
90
100
40
50
60
70
80
90
100
CSP−1
●
●
●
●
●
●●
●
●
●
●
●
●
●
●
●
500 1000 1500 2000 2500 3000 3500
CSP−3
●●
●●
●
●● ●
●
●
●
●
●
●
●
●
500 1000 1500 2000 2500 3000 3500
nilType
Importer
Importer:Type
Clearance Number● 5 10 20 40
Monitoring Fraction
● 0.1 ● 0.2 ● 0.333 ● 0.5
Figure 3.5: Simulated IPD against inspection effort for nuts inspection history. The inspectionstrategies are in columns, and the stratification options are in rows. Within each panel, thesampling fraction is delineated by symbol colour, and the clearance number is delineated by thesymbol shape. Approximation 95% confidence interval for the mean of simulation results aredelineated by the vertical line. The grey line represents the IPD of full inspection over the post-burn(July 2008 - June 2012).
43

DA Biosecurity: Plant-Product Pathways CSP and Data-Mining
Table 3.11: List of lowest IPD CSP-1 inspection strategies obtained by analysing each nuttype separately stratified by importer. Individual Nut types are listed in the first column. Seecaptions of Tables 3.5–3.9 for explanations of PIC, IPD, etc. Count is the number of consignmentsimported during the study period. This tables has been sorted according to decreasing order oftotal consignment number of each nut type. Where the lowest IPD does not achieve a PIC of atleast 0.99 an alternative CN and MF combination is shown. We also show the result of applyingCN = 5 and MF = 0.1 for each nut type.
Nut Type Rule Class CN MF PIC Insp Lk Intc IPD Count
cashew CSP-1 Importer 5 0.1 0.9892 306.11 21.34 6.38 47.98 1975
cashew CSP-1 Importer 10 0.2 0.9908 554.95 18.17 9.54 58.17 1975
walnuts CSP-1 Importer 5 0.1 0.9972 145.53 2.42 2.04 71.34 855
othernuts CSP-1 Importer 5 0.1 0.9978 253.44 1.39 3.05 83.10 621
hazelnuts CSP-1 Importer 40 0.1 0.9957 213.43 1.40 4.03 52.96 324
hazelnuts CSP-1 Importer 5 0.1 0.9873 81.95 4.12 1.32 62.08 324
pistachios CSP-1 Importer 5 0.1 0.9992 67.78 0.26 0.92 73.67 309
almonds CSP-1 Importer 5 0.1 0.9939 126.25 1.78 4.84 26.08 294
macadamias CSP-1 Importer 5 0.1 0.9889 71.49 2.56 3.01 23.75 230
macadamias CSP-1 Importer 5 0.2 0.9909 91.16 2.10 3.40 26.81 230
brazilnuts CSP-1 Importer 5 0.1 0.9940 51.19 1.11 1.05 48.75 186
chestnuts CSP-1 Importer 10 0.2 0.9991 59.11 0.08 1.02 57.95 86
chestnuts CSP-1 Importer 5 0.1 0.9883 39.70 1.01 0.13 305.38 86
3.5 Comparison of the combined nut data with individual nutpathways
Tables 3.11 and 3.12 list lowest IPD CSP strategies obtained by simulating individual nutpathways separately with stratification by importer. The tables show that for most individualnut pathways, the lowest IPD CSP strategy is the combination of CN = 5 and MF = 0.1,which is the same as the values obtained when nuts were analysed as one dataset (Table 3.5).For cashews and macadamias this produced lowest IPDs; however, the PICs achieved wereslightly lower than 0.99. Note that the results for the cashew pathway shown here are slightlydifferent to those shown in Appendix A, Tables A.6 and A.8 because the post-burn periods weredifferent. For Table 3.11, during the time period of Oct 2009–Mar 2012, 25 quarantine failureswere detected compared to 19 found over the period of Jan 2010–Jun 2012 (See Figure A.1 inAppendix A for details). This explains why in Table 3.11, the combination of CN = 5 andMF = 0.1 does not exceed a PIC of 0.99 while in the other analysis it did (Tables A.6 andA.8). For hazelnuts and chestnuts, the lowest IPD CSP strategies are not achieved with thecombination of CN = 5 and MF = 0.1.
In Table 3.11–3.12, IPD of 305 (CSP-1) or 209 (CSP-3) for chestnuts is notably larger than theothers. This is because it had only one failure. Variation in detection of this failure would leadto large variation of IPD.
In Table 3.13, we aggregate the results shown in Tables 3.11 and 3.12 for individual nut types toproduce“combined nut” results by summing all inspections, leakages and interceptions accordingto two conditions to compare the different stratifications for applying CSP to nuts. The first
44
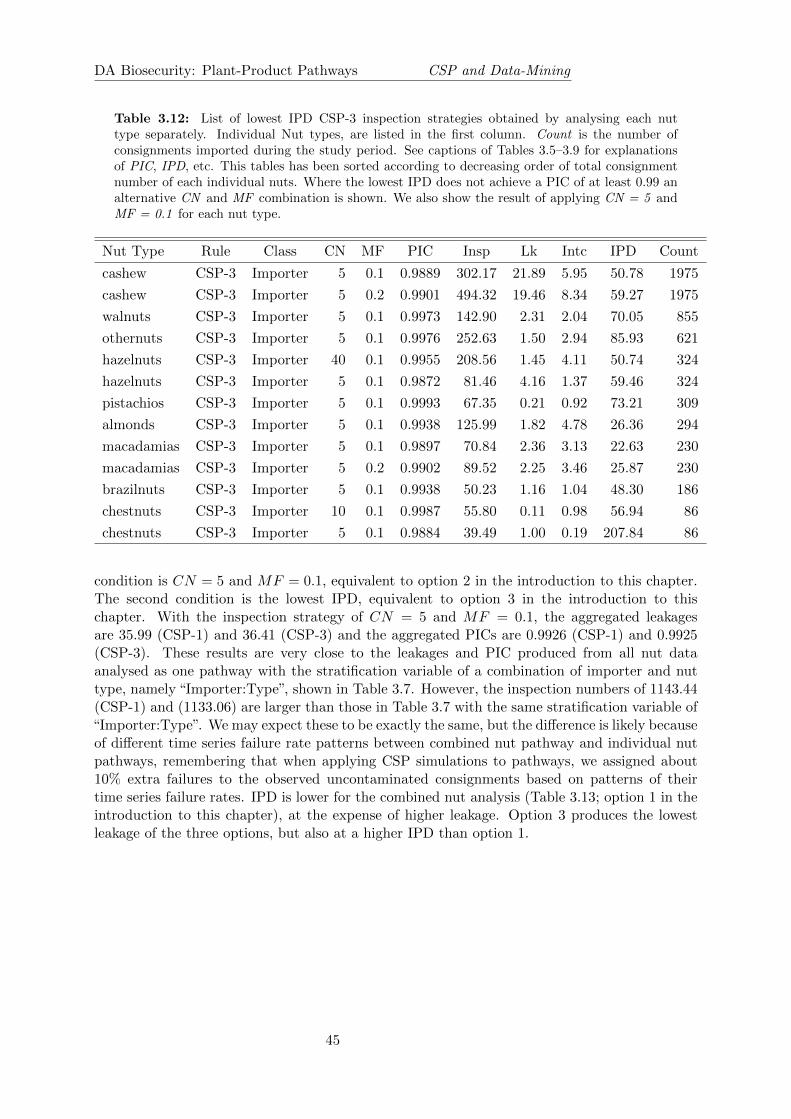
DA Biosecurity: Plant-Product Pathways CSP and Data-Mining
Table 3.12: List of lowest IPD CSP-3 inspection strategies obtained by analysing each nuttype separately. Individual Nut types, are listed in the first column. Count is the number ofconsignments imported during the study period. See captions of Tables 3.5–3.9 for explanationsof PIC, IPD, etc. This tables has been sorted according to decreasing order of total consignmentnumber of each individual nuts. Where the lowest IPD does not achieve a PIC of at least 0.99 analternative CN and MF combination is shown. We also show the result of applying CN = 5 andMF = 0.1 for each nut type.
Nut Type Rule Class CN MF PIC Insp Lk Intc IPD Count
cashew CSP-3 Importer 5 0.1 0.9889 302.17 21.89 5.95 50.78 1975
cashew CSP-3 Importer 5 0.2 0.9901 494.32 19.46 8.34 59.27 1975
walnuts CSP-3 Importer 5 0.1 0.9973 142.90 2.31 2.04 70.05 855
othernuts CSP-3 Importer 5 0.1 0.9976 252.63 1.50 2.94 85.93 621
hazelnuts CSP-3 Importer 40 0.1 0.9955 208.56 1.45 4.11 50.74 324
hazelnuts CSP-3 Importer 5 0.1 0.9872 81.46 4.16 1.37 59.46 324
pistachios CSP-3 Importer 5 0.1 0.9993 67.35 0.21 0.92 73.21 309
almonds CSP-3 Importer 5 0.1 0.9938 125.99 1.82 4.78 26.36 294
macadamias CSP-3 Importer 5 0.1 0.9897 70.84 2.36 3.13 22.63 230
macadamias CSP-3 Importer 5 0.2 0.9902 89.52 2.25 3.46 25.87 230
brazilnuts CSP-3 Importer 5 0.1 0.9938 50.23 1.16 1.04 48.30 186
chestnuts CSP-3 Importer 10 0.1 0.9987 55.80 0.11 0.98 56.94 86
chestnuts CSP-3 Importer 5 0.1 0.9884 39.49 1.00 0.19 207.84 86
condition is CN = 5 and MF = 0.1, equivalent to option 2 in the introduction to this chapter.The second condition is the lowest IPD, equivalent to option 3 in the introduction to thischapter. With the inspection strategy of CN = 5 and MF = 0.1, the aggregated leakagesare 35.99 (CSP-1) and 36.41 (CSP-3) and the aggregated PICs are 0.9926 (CSP-1) and 0.9925(CSP-3). These results are very close to the leakages and PIC produced from all nut dataanalysed as one pathway with the stratification variable of a combination of importer and nuttype, namely “Importer:Type”, shown in Table 3.7. However, the inspection numbers of 1143.44(CSP-1) and (1133.06) are larger than those in Table 3.7 with the same stratification variable of“Importer:Type”. We may expect these to be exactly the same, but the difference is likely becauseof different time series failure rate patterns between combined nut pathway and individual nutpathways, remembering that when applying CSP simulations to pathways, we assigned about10% extra failures to the observed uncontaminated consignments based on patterns of theirtime series failure rates. IPD is lower for the combined nut analysis (Table 3.13; option 1 in theintroduction to this chapter), at the expense of higher leakage. Option 3 produces the lowestleakage of the three options, but also at a higher IPD than option 1.
45

DA Biosecurity: Plant-Product Pathways CSP and Data-Mining
Table 3.13: Aggregation table for simulation results of individual nut types shown in Tables 3.11and 3.12. Here in the column Aggregation condition, we give the conditions of aggregatingthe data. Insp, Lk and Intc list sums of inspections, leakages and interceptions satisfying thegiven aggregation conditions respectively. PIC is defined by 1- Lk/4880, where 4880 is the totalconsignments over the post-burn period. IPD is defined by the aggregated inspections divided bythe aggregated interceptions.
Aggregation condition Rule Class Insp Lk Intc PIC IPD
CN=5 and MF=0.1 CSP-1 Importer 1143.44 35.99 22.74 0.9926 50.28
CN=5 and MF=0.1 CSP-3 Importer 1133.06 36.41 22.36 0.9925 50.67
Lowest IPD CSP-1 Importer 1562.84 28.71 29.89 0.9941 52.29
Lowest IPD CSP-3 Importer 1487.3 30.27 28.61 0.9941 51.99
46
4
Data mining the nut pathway
4.1 Introduction
Broadly speaking, data mining is used to find patterns in (large) data sets. In ACERA report1101C [3], data summaries are used as a basic form of data mining to identify pathways withlow failure rates and high inspection rates as candidates for CSP (with the further caveat thatthe types of BRM presenting do not have such potential impacts that they would be excludedfrom a CSP). Data from these pathways are then used for CSP simulation to determine theimplications of various CSP strategies.
More detailed data mining can be used to identify which factors are associated with the highestapproach rates of BRM on a pathway. If every consignment is not to be inspected, thenspecifically targeting inspections to these factors should produce better outcomes for a givenlevel of inspection relative to random sampling. Alternatively, if the decision is to continue toinspect all consignments, then identifying factors associated with higher BRM approach ratescould provide opportunities to enhance the inspection effort for those consignments - this wouldincrease overall inspection effectiveness.
In this chapter we use data mining to identify sources of variation, or patterns, in historicalimport inspection data for nuts. We use a subset of all available data mining/analysis techniques(a broader consideration of other data mining techniques will occur in future work) includingclassification using random forests and a new regression technique that we refer to as groupOSCAR (Chen [5]). Group OSCAR combines the LASSO (Least Absolute Shrinkage andSelection Operator) [6] and OSCAR (Octagonal Selection and Clustering Algorithm) [7] regressions.Using these methods we rank factors associated with higher approach rates, and asses theoperational implications of choosing to focus inspection effort based on the rankings usingReceiver Operating Characteristics (ROC) curves.
4.2 Data summaries
In this section we provide basic summaries of the nuts data analysed in chapter 3, before applyingthe data mining methods. The following categories are considered here: almonds, Brazil nuts,cashews, chestnuts, hazelnuts, macadamia nuts, pistachios, walnuts, and “other” nuts. In thedata there were 11665 lines of data from 10498 quarantine entries. There were 20 tariff codes
47

DA Biosecurity: Plant-Product Pathways CSP and Data-Mining
which cover the 9 categories of nuts. Imports come from 74 countries. There were 687 importercodes and 1065 supplier codes. A subset of 11162 lines were inspected.
Table 4.1: Number of import records, number of failures (those with BRM) and failure rate fornut imports by nut type.
Nut type No. lines Failure Failure (%)
ALMONDS 580 8 1.38
BRAZIL NUTS 441 4 0.91
CASHEWS 4778 59 1.23
CHESTNUTS 200 4 2.00
HAZELNUTS 727 7 0.96
MACADAMIAS 439 9 2.05
OTHER NUTS 1438 18 1.25
PISTACHIOS 647 2 0.31
WALNUTS 1912 10 0.52
After removing the lines where nuts were not inspected the volumes and failure rates of thedifferent nut types are shown in Table 4.1. We see that cashews with 4778 lines have muchhigher imports than all other categories. Chestnuts have the lowest number of lines with 200.Quarantine failure rates ranged from 0.31% for pistachios to 2.05% for Macadamias.
The nuts come into the country in various forms, but using the tariff codes we have classified thepreparation as shelled (8313 lines), unshelled (180 lines) or“unknown”(2669 lines) (Tables 4.3 & 4.2).
Table 4.2: No. of imports by preparation type for different nut types
Unknown Shelled Unshelled
ALMONDS 0 550 30
BRAZIL NUTS 0 432 9
CASHEWS 0 4733 45
CHESTNUTS 193 7 0
HAZELNUTS 0 715 12
MACADAMIAS 416 22 1
OTHER NUTS 1438 0 0
PISTACHIOS 622 14 11
WALNUTS 0 1840 72
While the number of imports in the unshelled category is low, Tables 4.3 & 4.2 suggest that ingeneral shelled nuts have a lower failure rate than unshelled or “unknown”.
If we summarise the results by importer we see that:
• Only 27 of 687 importers brought in more than 50 imports of nuts.
• 462 importers brought in between 1 and 10 imports.
• Many of the top importers brought in most of the nut types, although chestnuts and to alesser extent macadamias had different importers.
48

DA Biosecurity: Plant-Product Pathways CSP and Data-Mining
Table 4.3: Percent imports containing BRM by preparation type for different nut types
Unknown Shelled Unshelled
ALMONDS 0.00 1.27 3.33
BRAZIL NUTS 0.00 0.69 11.11
CASHEWS 0.00 1.25 0.00
CHESTNUTS 2.07 0.00 0.00
HAZELNUTS 0.00 0.70 16.67
MACADAMIAS 2.16 0.00 0.00
OTHER NUTS 1.25 0.00 0.00
PISTACHIOS 0.32 0.00 0.00
WALNUTS 0.00 0.38 4.17
• The maximum failure percentage among the top 35 importers was 4.65%.
If we summarise the results by supplier we see that:
• 44 of 1065 suppliers brought in more than 50 imports of nuts.
• 830 suppliers brought in between 1 and 10 imports (but this number doesn’t include the180 “blank” suppliers.
• Suppliers tend to specialise in a small number of nut types.
• The maximum failure percentage among the top 35 suppliers was 3.03%.
If we summarise the results by country we see that:
• Only 14 of 74 countries provided more than 50 imports of nuts.
• 40 countries provided between 1 and 10 imports.
• Different countries dominate the supply of different nut types.
4.3 Data mining using penalised regressions and random forestapproaches
In this analysis we assume that all BRM presents the same level of consequence so when werefer to risk levels risk is directly proportional to approach rate.
4.3.1 Methodologies
Let the outcome of quarantine inspection be the response variable with value 0 standing forcompliant and 1 for not compliant. Possible predictor variables will be each supplier, importer,supplier country, constituent (almonds, brazil nuts, etc), tariff code (a finer division thanconstituent of the pathway) and preparation. The dimension of the vector of the responsevariable is 11162, i.e., 11162 lines of data. However, the dimension of predictor variables canbe as high as 1671 because of the high number of different importers, suppliers etc. This is
49
DA Biosecurity: Plant-Product Pathways CSP and Data-Mining
a typical overdetermined system. To solve this problem we may use statistical techniques ofLASSO regression and OSCAR analysis.
LASSO regression
The LASSO regression is an important technique in analysing overdetermined systems. Themain aim of this technique, like normal multiple linear regressions, is to find a linear relationshipbetween predictor and response variables. Under LASSO regression, when fitting a model, thesum of absolute values of fitted coefficients is required to be less than or equal to a finite valueλ1. Note that when λ1 is infinite, this will just be a normal multiple linear regression. Thealgorithm of LASSO regression can be fitted using a standard numerical stepwise regressionalgorithm. However, the LARS procedure, which does not include predictor variables at eachstep, could be a more efficient approach to find out the coefficients that satisfy the condition ofLASSO regression. The main advantage of LASSO regression is that with an appropriate valueof λ1, coefficients of some highly irrelevant predictor variables could be shrunk to zero. Thisproperty facilitates identification of the most relevant predictor variables.
OSCAR analysis
The OSCAR technique, which was proposed by Bondell and Reich in 2008 [7], is quite similar tothe above LASSO regressions. With the OSCAR technique, correlated predictor variables wouldproduce the same coefficients and become a cluster. Let p be the number of observations andβj , βk (j, k = 1, 2, . . . , p) be fitted coefficients of observation xj , xk respectively. The techniqueof OSCAR requires the square of minimised residuals of the fitted model to satisfy the condition
p∑j=1
|βj |+ λ2∑j<k
max (|βj |, |βk|) ≤ t,
where λ2 is a parameter that is used to control the relative weighting of the norms and t is agiven bound for the model. When λ2 goes to zero, the constraint will degenerate to that of theLASSO regression and when λ2 goes to zero and t goes to infinite, the OSCAR will be just thenormal multiple linear regression.
Group OSCAR technique
In a recent work, Chen proposed a technique that combined the techniques of LASSO regressionand OSCAR analysis [5]. The algorithm of the new regression technique can be described asfollows.
1. Start from the normal LASSO regression with a given constraint λ1.
2. Perform the OSCAR analysis. Instead of using original predictor factors, under thenew technique we cluster factors from the variables, namely, supplier, importer etc, bymultiplying vectors of normalised design matrix of the variables by coefficients obtainedfrom LASSO regression and then add up vectors of the same cluster to form a new matrix.The number of columns in the new matrix will be then the number of predictor variables.For instance, for the predictor variables of supplier, importer, tariff and nuts constituent,
50
DA Biosecurity: Plant-Product Pathways CSP and Data-Mining
the number of columns in the new matrix will be 4.
3. Bring results of the OSCAR analysis into the second LASSO regression by multiplyingvectors related to the same variables normalised design matrix by results obtained fromthe previous OSCAR regression and form a new predictor matrix. Then we use the newpredictor matrix to carry our the second LASSO regression.
4. Perform the second OSCAR analysis as the step (2).
5. Repeat the previous steps to perform the next LASSO regressions and OSCAR analysis.
Within the new regression technique, three parameters, namely, λ1, λ2 and niter, which controlsthe number of times of performing LASSO and OSCAR, play important roles.
In this project, we examine the performance of different combinations of the parameters anduse ROC curves to choose the best one to rank the risk levels of the predictor factors. ROCcurves were proposed to illustrate performance of binary statistical systems [9]. Let 0 and1 label the non-failure and failure respectively of a quarantine entry and y = 0, 1 denote theactual observed response variable. Using the regression technique, we can fit failure probabilities,which are denoted by P , for the quarantine entries. Under the framework of ROC analysis, weset a number of cutoffs for the probabilities, that is, for a quarantine entry, if its fitted failureprobability P ≥ cutoff, we then consider it as a failure (labeled by y = 1), otherwise consideras non-failure (labeled by y = 0). We may then divide the observed values yi and fitted valuesyi into four sets: True Positive (TP) that represents a set with y = 1 and y = 1, False Positive(FP) that represents a set with y = 0 and y = 1, True Negative (TN) that represents a set withy = 0 and y = 0 and False Negative (FN) that represents a set with y = 1 and y = 0. Shiftingthe cutoffs from 0 to 1, we can then use False Positive rate (FPR) and True Positive rate (TPR)to plot a curve (called ROC curve). Here FPR is defined by sum of FP over the total numberof observed non-failures and TPR is defined by sum of TP over the total number of observedfailures. The performance of the fitted model can then be estimated by using an index AUC(area under curve) ranged between 0 and 1. AUC = 1 implies a perfect fitted model.
Approach of fitting models
The approach of fitting the regression models can be described as follows. (i). Divide the wholedataset into two groups with equal numbers of quarantine entries based on their creation dates;(ii). use the first group to fit models with given combinations of λ1, λ2 and niter; (iii). predictout-of-sample data with the second group and calculating AUC for each model; (iv). select themodel that produced the highest AUC and then apply the model to the whole dataset.
4.3.2 Results of data-mining
Risk levels of factors with variables of supplier, importer, constituent and tariffcode
As we described before, the nuts data has 11162 quarantine entries (lines). To fit regressionmodels, we first divide the dataset into two groups, namely, fit group and test group, and use
51
DA Biosecurity: Plant-Product Pathways CSP and Data-Mining
the first half of the dataset to fit models. Here we rank risk levels of factors from four variables,i.e., “tariff”, “importer”, “supplier” and “constituent”. Note that original countries affect thequarantine failures as well. However, the current R code cannot handle five variables. After weincluded “country” among our response variables, R stopped with an error “Error in if (zmin <gamhat) { : missing value where TRUE/FALSE needed”. This will be addressed in future work.The statistical models are produced based on the parameters: λ1 = 0.001, 0.002, 0.003, 0.004, 0.005,λ2 = 0.1, 0.15, 0.2 and niter = 10, 20. Hence, we fitted 30 statistical models based on combinationsof these parameters. To test the models, we applied the model to predict the out-of-sample dataof the test group. AUCs for the “fit” sample ranged from 0.52 to 0.62. The results are presentedin Table 4.4.
The highest AUC of 0.62 shown in Table 4.4 indicates that the best performing fitted modelexamined using the data in the test group would be that with parameters of λ1 = 0.005, λ2 = 0.15and niter = 20. In this case Tariff and Consituent had a weight of 0, Supplier had a weightof 2.06 and Importer had a weight of 1.56. The best model can be compared with a similarstatistical model obtained from the technique of random forests. Random forests is anotheruseful technique for analysing categorical variables [10]. With random forests, we use the samefit group to obtain a statistical model and then use the same test group to test the fitted model.Similar to the regression technique, random forest can also allow us to estimate the importanceof each predictor factor. To provide a fair comparison, we use ROC curves to compare betweenthe models with the same datasets (4.1). The figure shows that with the regression technique,the AUC of the ROC curve can be about 0.62, which is notably higher than the value of 0.55achieved from the random forests technique. Therefore, to estimate risk levels of factors withinvariables of supplier, importer, constituent and tariff, we will adopt the regression technique.Applying the best model from the “test” data to the entire nut dataset produce an AUC of 0.957.The high value suggests the data may have been been over-fitted by the model.
Applying the best fitted model to the whole nuts data, we can weight the variables. According tothe group OSCAR technique, weights of the variables can be estimated by a product of LASSOand OSCAR regression results. A higher weight implies a higher risk of a factor. Tables 4.5–4.7list all variables whose estimated weights are greater than zero. Based on the weights, we rankthe factors into five risk levels: rank 1 –rank 5. The cutoff points of the levels are 0.9, 0.5, 0.2and 0.05 respectively.
The regression results show that estimated weights of all tariff codes and nut types are equal to orless than zero, which implies very low risks of all elements of these two variables. For larger thanzero weighted factors, majority quarantine failure contributors are from the variable of supplier.In Tables 4.5—4.7, weights of 16 importers and 76 suppliers were estimated to be larger thanzero. For low line number suppliers/importers, a low number of quarantine failures can leadto comparably higher risk rates and during the regression process, they would be estimated ascomparably higher risk levels. Table 4.5 indicates that of 36 top three ranked risk factors, onlysix exported/imported more than 5 but less than sixteen lines of nuts pathways. Especially,among the highest ranked risk factors, ten out of thirteen had only one line. From Table 4.5, wefound that in the top three ranked quarantine failure contributors, “Importer 2” and “Importer5” imported seven and nine lines respectively and “Supplier 16”, “Supplier 26” and “Supplier 27”exported fourteen, ten and fifteen lines respectively over the analysis time period from January2007 - March 2012. Those with the highest number of importers appeared in Table 4.7. The twohigh numbers were “Importer 13” and “Supplier 69”, whose risk levels were ranked as 5, importedand exported 2289 and 873 lines of nuts pathways respectively over the same time period.
52
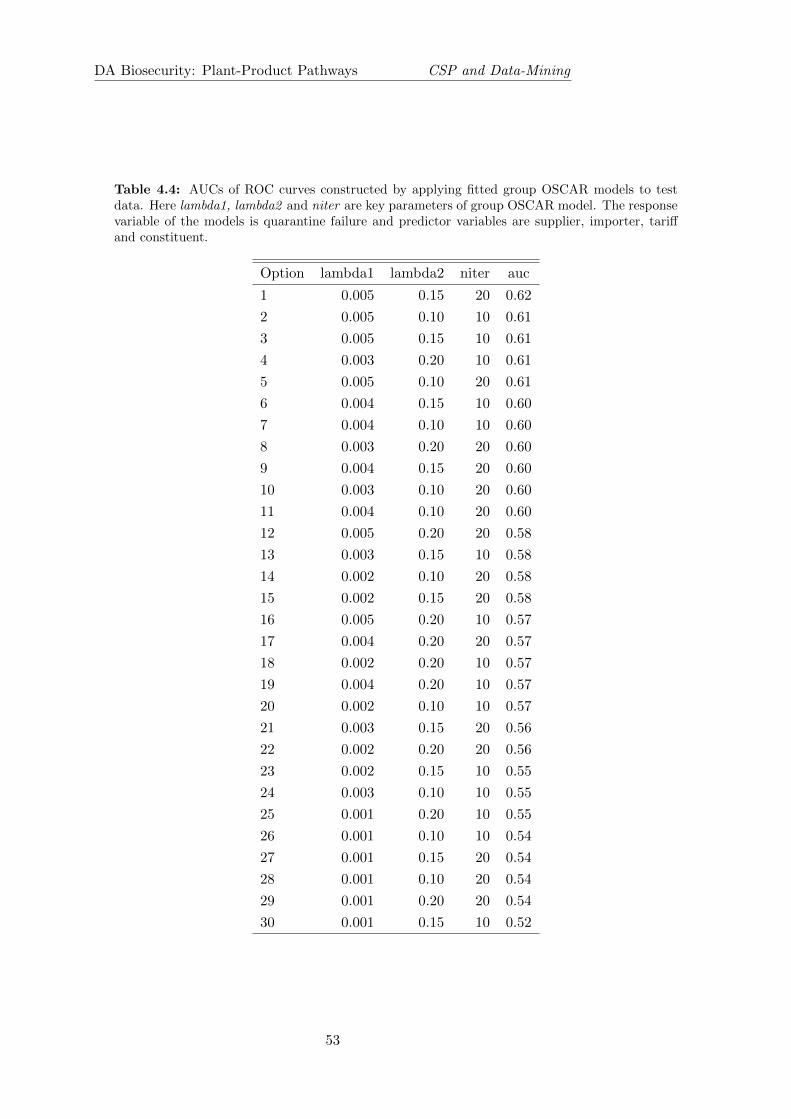
DA Biosecurity: Plant-Product Pathways CSP and Data-Mining
Table 4.4: AUCs of ROC curves constructed by applying fitted group OSCAR models to testdata. Here lambda1, lambda2 and niter are key parameters of group OSCAR model. The responsevariable of the models is quarantine failure and predictor variables are supplier, importer, tariffand constituent.
Option lambda1 lambda2 niter auc
1 0.005 0.15 20 0.62
2 0.005 0.10 10 0.61
3 0.005 0.15 10 0.61
4 0.003 0.20 10 0.61
5 0.005 0.10 20 0.61
6 0.004 0.15 10 0.60
7 0.004 0.10 10 0.60
8 0.003 0.20 20 0.60
9 0.004 0.15 20 0.60
10 0.003 0.10 20 0.60
11 0.004 0.10 20 0.60
12 0.005 0.20 20 0.58
13 0.003 0.15 10 0.58
14 0.002 0.10 20 0.58
15 0.002 0.15 20 0.58
16 0.005 0.20 10 0.57
17 0.004 0.20 20 0.57
18 0.002 0.20 10 0.57
19 0.004 0.20 10 0.57
20 0.002 0.10 10 0.57
21 0.003 0.15 20 0.56
22 0.002 0.20 20 0.56
23 0.002 0.15 10 0.55
24 0.003 0.10 10 0.55
25 0.001 0.20 10 0.55
26 0.001 0.10 10 0.54
27 0.001 0.15 20 0.54
28 0.001 0.10 20 0.54
29 0.001 0.20 20 0.54
30 0.001 0.15 10 0.52
53
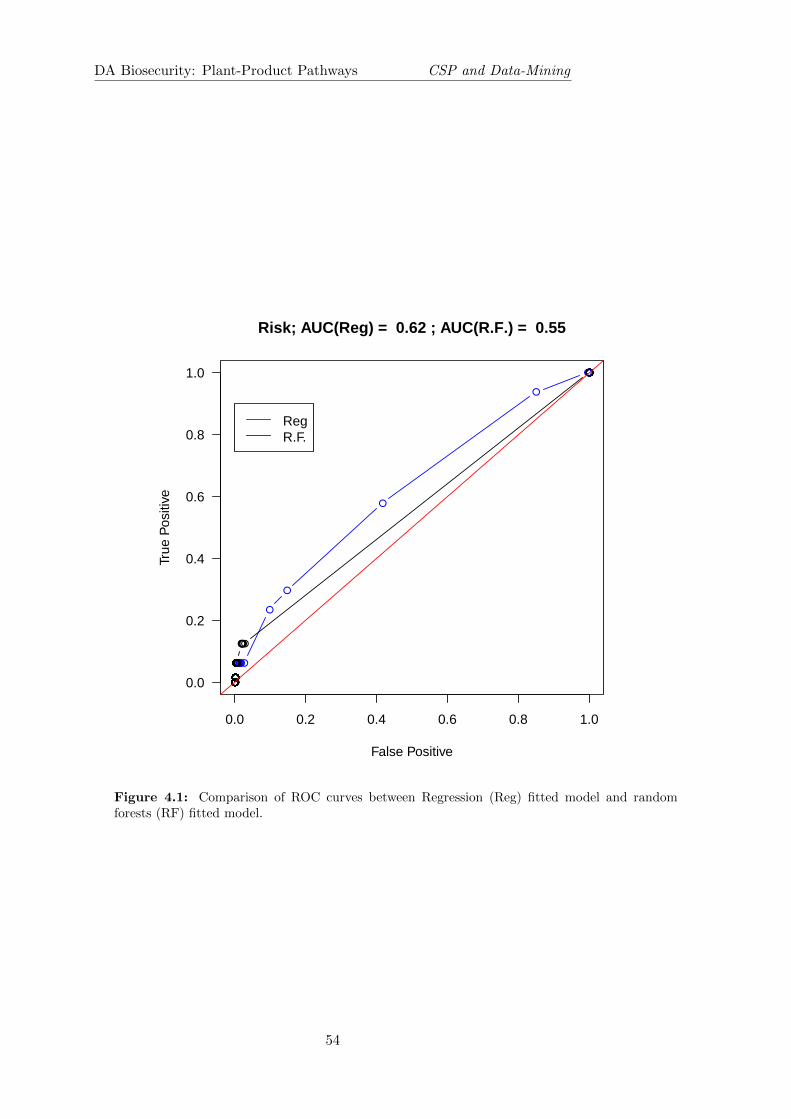
DA Biosecurity: Plant-Product Pathways CSP and Data-Mining
●●●●●●●●●●●●●
●
●
●
●
●●●●●●●●●●●●●●●●●●●●●●●●●●●●●
●●●●●●●●●●●●●●●●●●●●●●●●●●●●●●●●●●●●●●●●●●●●●●●●●●●●●●●●●●●●●●●●●●●●●●●●●●●●●●
0.0 0.2 0.4 0.6 0.8 1.0
0.0
0.2
0.4
0.6
0.8
1.0
Risk; AUC(Reg) = 0.62 ; AUC(R.F.) = 0.55
False Positive
True
Pos
itive
●●●●●●●●●●●
●●●●●●
●●●●●●●●●●●●●●●●●●
●●●●●●●●●●●●●●●●●●●●●●●●●●●●●●●●●●●●●●●●●●●●●●●●●●●●●●●●●●●●●●●●●●●●●●●●●●●●●●●●●●●●●●
RegR.F.
Figure 4.1: Comparison of ROC curves between Regression (Reg) fitted model and randomforests (RF) fitted model.
54
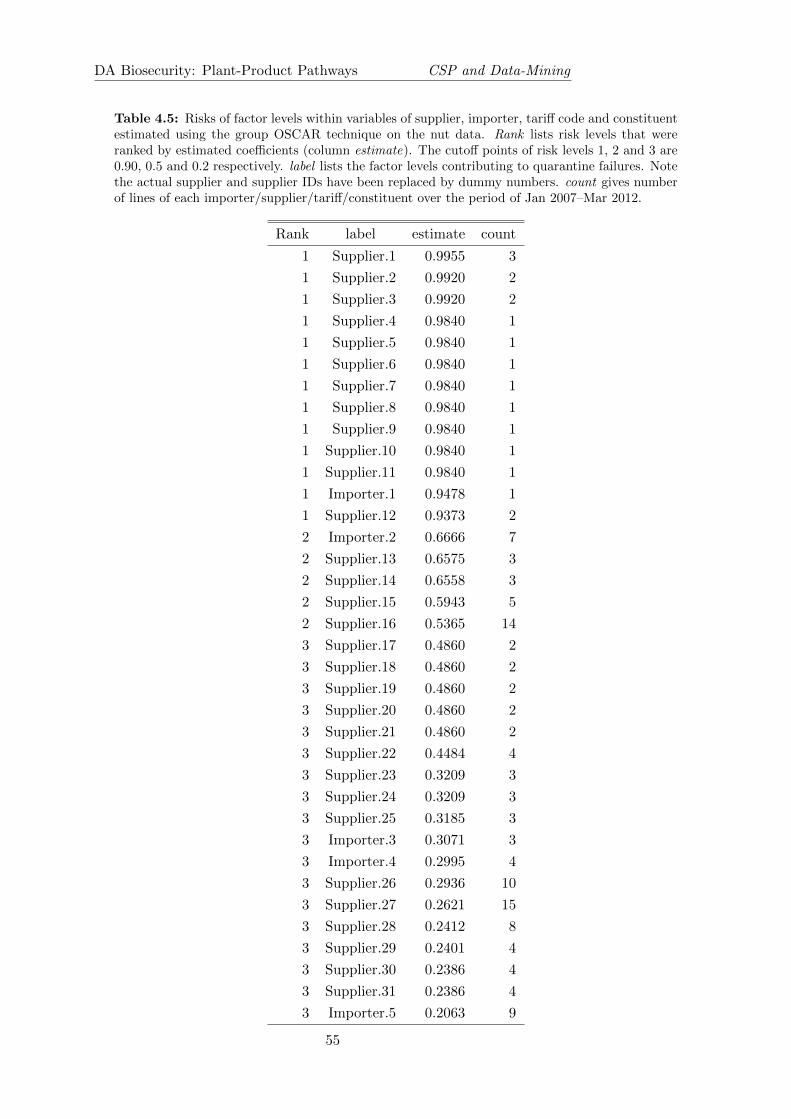
DA Biosecurity: Plant-Product Pathways CSP and Data-Mining
Table 4.5: Risks of factor levels within variables of supplier, importer, tariff code and constituentestimated using the group OSCAR technique on the nut data. Rank lists risk levels that wereranked by estimated coefficients (column estimate). The cutoff points of risk levels 1, 2 and 3 are0.90, 0.5 and 0.2 respectively. label lists the factor levels contributing to quarantine failures. Notethe actual supplier and supplier IDs have been replaced by dummy numbers. count gives numberof lines of each importer/supplier/tariff/constituent over the period of Jan 2007–Mar 2012.
Rank label estimate count
1 Supplier.1 0.9955 3
1 Supplier.2 0.9920 2
1 Supplier.3 0.9920 2
1 Supplier.4 0.9840 1
1 Supplier.5 0.9840 1
1 Supplier.6 0.9840 1
1 Supplier.7 0.9840 1
1 Supplier.8 0.9840 1
1 Supplier.9 0.9840 1
1 Supplier.10 0.9840 1
1 Supplier.11 0.9840 1
1 Importer.1 0.9478 1
1 Supplier.12 0.9373 2
2 Importer.2 0.6666 7
2 Supplier.13 0.6575 3
2 Supplier.14 0.6558 3
2 Supplier.15 0.5943 5
2 Supplier.16 0.5365 14
3 Supplier.17 0.4860 2
3 Supplier.18 0.4860 2
3 Supplier.19 0.4860 2
3 Supplier.20 0.4860 2
3 Supplier.21 0.4860 2
3 Supplier.22 0.4484 4
3 Supplier.23 0.3209 3
3 Supplier.24 0.3209 3
3 Supplier.25 0.3185 3
3 Importer.3 0.3071 3
3 Importer.4 0.2995 4
3 Supplier.26 0.2936 10
3 Supplier.27 0.2621 15
3 Supplier.28 0.2412 8
3 Supplier.29 0.2401 4
3 Supplier.30 0.2386 4
3 Supplier.31 0.2386 4
3 Importer.5 0.2063 9
55

DA Biosecurity: Plant-Product Pathways CSP and Data-Mining
Table 4.6: Continuation of Table 4.5 showing Rank 4. Cutoff point is estimate larger than 0.05.
Rank label estimate count
4 Supplier.32 0.1895 5
4 Supplier.33 0.1871 5
4 Supplier.34 0.1677 23
4 Supplier.35 0.1575 6
4 Supplier.36 0.1575 6
4 Supplier.37 0.1573 6
4 Supplier.38 0.1568 6
4 Supplier.39 0.1568 6
4 Supplier.40 0.1566 6
4 Supplier.41 0.1517 16
4 Supplier.42 0.1470 2
4 Importer.6 0.1381 8
4 Supplier.43 0.1274 15
4 Supplier.44 0.1202 24
4 Supplier.45 0.1172 8
4 Supplier.46 0.1014 9
4 Supplier.47 0.0918 10
4 Supplier.48 0.0918 10
4 Supplier.49 0.0902 7
4 Supplier.50 0.0837 11
4 Supplier.51 0.0695 13
4 Supplier.52 0.0672 13
4 Supplier.53 0.0666 24
4 Supplier.54 0.0597 15
4 Supplier.55 0.0528 17
4 Supplier.56 0.0522 17
56
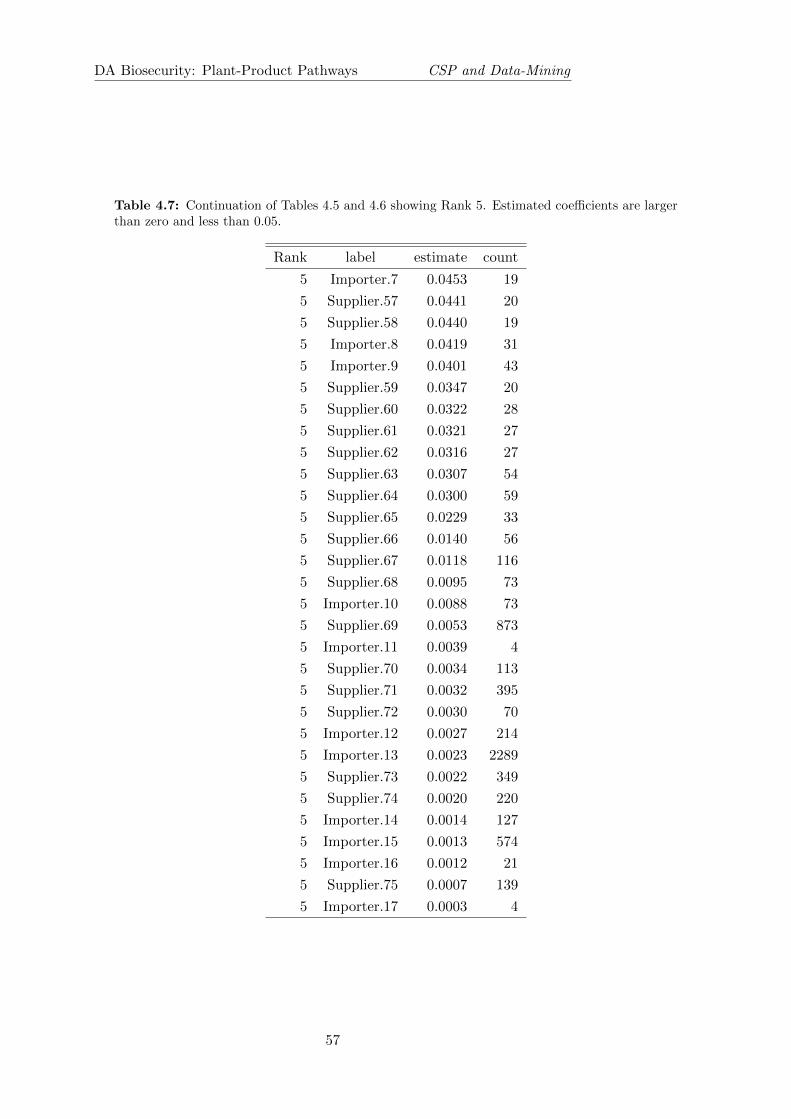
DA Biosecurity: Plant-Product Pathways CSP and Data-Mining
Table 4.7: Continuation of Tables 4.5 and 4.6 showing Rank 5. Estimated coefficients are largerthan zero and less than 0.05.
Rank label estimate count
5 Importer.7 0.0453 19
5 Supplier.57 0.0441 20
5 Supplier.58 0.0440 19
5 Importer.8 0.0419 31
5 Importer.9 0.0401 43
5 Supplier.59 0.0347 20
5 Supplier.60 0.0322 28
5 Supplier.61 0.0321 27
5 Supplier.62 0.0316 27
5 Supplier.63 0.0307 54
5 Supplier.64 0.0300 59
5 Supplier.65 0.0229 33
5 Supplier.66 0.0140 56
5 Supplier.67 0.0118 116
5 Supplier.68 0.0095 73
5 Importer.10 0.0088 73
5 Supplier.69 0.0053 873
5 Importer.11 0.0039 4
5 Supplier.70 0.0034 113
5 Supplier.71 0.0032 395
5 Supplier.72 0.0030 70
5 Importer.12 0.0027 214
5 Importer.13 0.0023 2289
5 Supplier.73 0.0022 349
5 Supplier.74 0.0020 220
5 Importer.14 0.0014 127
5 Importer.15 0.0013 574
5 Importer.16 0.0012 21
5 Supplier.75 0.0007 139
5 Importer.17 0.0003 4
57
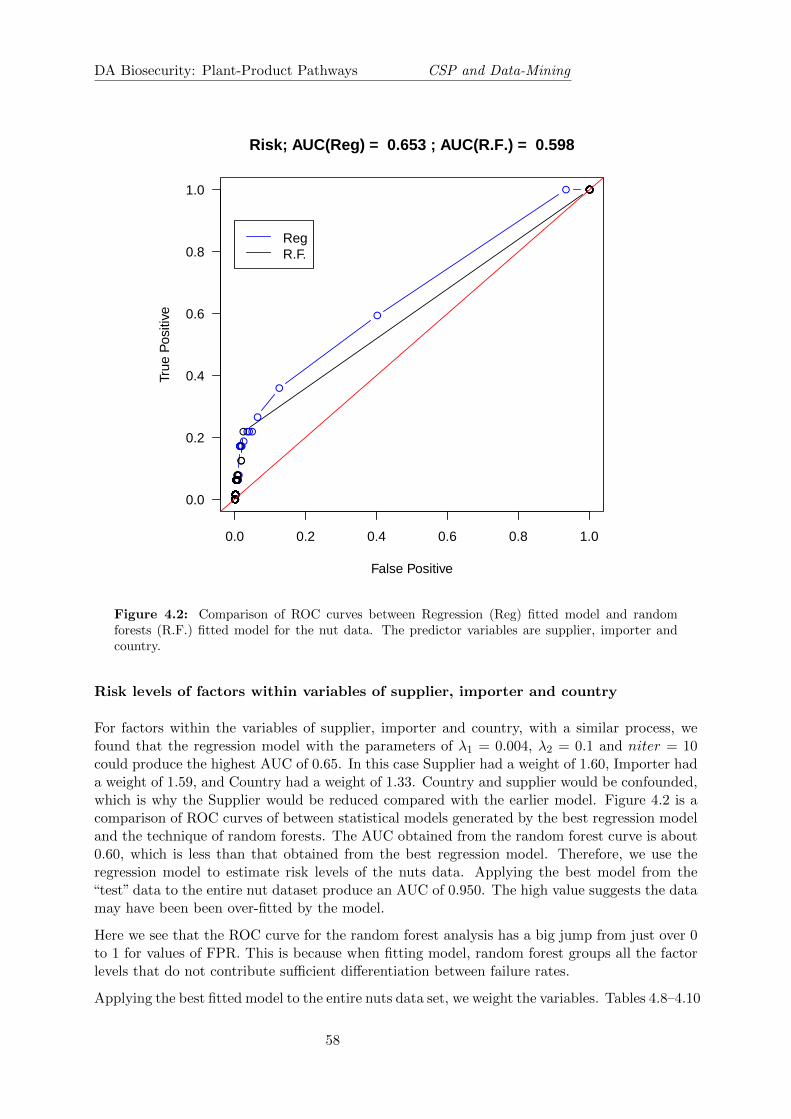
DA Biosecurity: Plant-Product Pathways CSP and Data-Mining
●●●●●●●●●●●●●●●●●●●●●●●●●●
●
●
●
●●●●●●●●●●
●●●●●●●●●●●●●●●●●●●●
●●●●●●●●●●●●●●●●●●●●●●●●●●●●●●●●●●●●●●●●●●●●●●●●●●●●●●●●●●●●●●●●●●●●●●●●●●●●●●
0.0 0.2 0.4 0.6 0.8 1.0
0.0
0.2
0.4
0.6
0.8
1.0
Risk; AUC(Reg) = 0.653 ; AUC(R.F.) = 0.598
False Positive
True
Pos
itive
●●●●●●●●●●●
●
●●
●●●●●●●●●●●●●●●●●●●●●●●●
●●●●●●●●●●●●●●●●●●●●●●●●●●●●●●●●●●●●●●●●●●●●●●●●●●●●●●●●●●●●●●●●●●●●●●●●●●●●●●●●●●●
RegR.F.
Figure 4.2: Comparison of ROC curves between Regression (Reg) fitted model and randomforests (R.F.) fitted model for the nut data. The predictor variables are supplier, importer andcountry.
Risk levels of factors within variables of supplier, importer and country
For factors within the variables of supplier, importer and country, with a similar process, wefound that the regression model with the parameters of λ1 = 0.004, λ2 = 0.1 and niter = 10could produce the highest AUC of 0.65. In this case Supplier had a weight of 1.60, Importer hada weight of 1.59, and Country had a weight of 1.33. Country and supplier would be confounded,which is why the Supplier would be reduced compared with the earlier model. Figure 4.2 is acomparison of ROC curves of between statistical models generated by the best regression modeland the technique of random forests. The AUC obtained from the random forest curve is about0.60, which is less than that obtained from the best regression model. Therefore, we use theregression model to estimate risk levels of the nuts data. Applying the best model from the“test” data to the entire nut dataset produce an AUC of 0.950. The high value suggests the datamay have been been over-fitted by the model.
Here we see that the ROC curve for the random forest analysis has a big jump from just over 0to 1 for values of FPR. This is because when fitting model, random forest groups all the factorlevels that do not contribute sufficient differentiation between failure rates.
Applying the best fitted model to the entire nuts data set, we weight the variables. Tables 4.8–4.10
58

DA Biosecurity: Plant-Product Pathways CSP and Data-Mining
list all variables whose estimated weights are greater than zero. Based on the weights, we rankthe factors into five risk levels: rank 1 — rank 5. The cutoff points of the levels are 0.9, 0.5, 0.2and 0.05 respectively.
Comparing with Tables 4.5–4.7, in Tables 4.8–4.10, risk levels of most suppliers and importersare very similar. The regression model shows that seven countries could contribute positively tothe response variable of quarantine failure. Of the seven countries, “Country.1”, which exportedone line of nut product over the time period of Jan 2007–Mar 2012, is ranked as risk level 3. Theestimated weights of the other six countries are all less than 0.05 and are ranked as risk level 5.Over the same time period, “Country.3” exported over 700 lines, of which 31 were contaminated.“Country.6” exported over 163 lines, of which four were contaminated. “Country.2”, “Country.4”and “Country.5” exported less than 20 lines of nut products, of which six, three and one werecontaminated respectively.
59

DA Biosecurity: Plant-Product Pathways CSP and Data-Mining
Table 4.8: Risks of factor levels within variables of supplier, importer and country estimatedusing the group OSCAR technique on the nuts data. Rank lists risk levels that were ranked byestimated coefficients (column estimate). The cutoff points of risk levels 1, 2 and 3 are 0.90, 0.5and 0.2 respectively. label lists the factor levels contributing to quarantine failures. Note the actualsupplier and supplier IDs have been replaced by dummy numbers. count gives number of lines ofeach importer/supplier/tariff/constituent over the period of Jan 2007–Mar 2012.
Rank label estimate count
1 Supplier.1 1.0193 3
1 Importer.1 1.0116 2
1 Supplier.2 1.0068 1
1 Supplier.3 1.0068 1
1 Importer.2 1.0034 2
1 Importer.3 1.0030 1
1 Importer.4 1.0030 1
1 Importer.5 1.0030 1
1 Importer.6 0.9948 1
1 Supplier.4 0.9900 1
1 Supplier.5 0.9881 1
1 Importer.7 0.9863 1
1 Supplier.6 0.9614 2
2 Importer.8 0.7051 7
2 Supplier.7 0.6891 3
2 Supplier.8 0.6692 3
2 Importer.9 0.5346 5
2 Supplier.9 0.5271 14
2 Importer.10 0.5201 2
3 Importer.11 0.4953 2
3 Importer.12 0.4953 2
3 Importer.13 0.4953 2
3 Supplier.10 0.4785 2
3 Supplier.11 0.4566 4
3 Country.1 0.4137 1
3 Supplier.12 0.3274 3
3 Importer.14 0.3270 3
3 Importer.15 0.3270 3
3 Importer.16 0.3196 4
3 Supplier.13 0.3150 3
3 Supplier.14 0.2992 10
3 Supplier.15 0.2518 15
3 Supplier.16 0.2461 8
3 Supplier.17 0.2461 4
3 Supplier.18 0.2442 4
3 Supplier.19 0.2274 4
3 Importer.17 0.2195 960
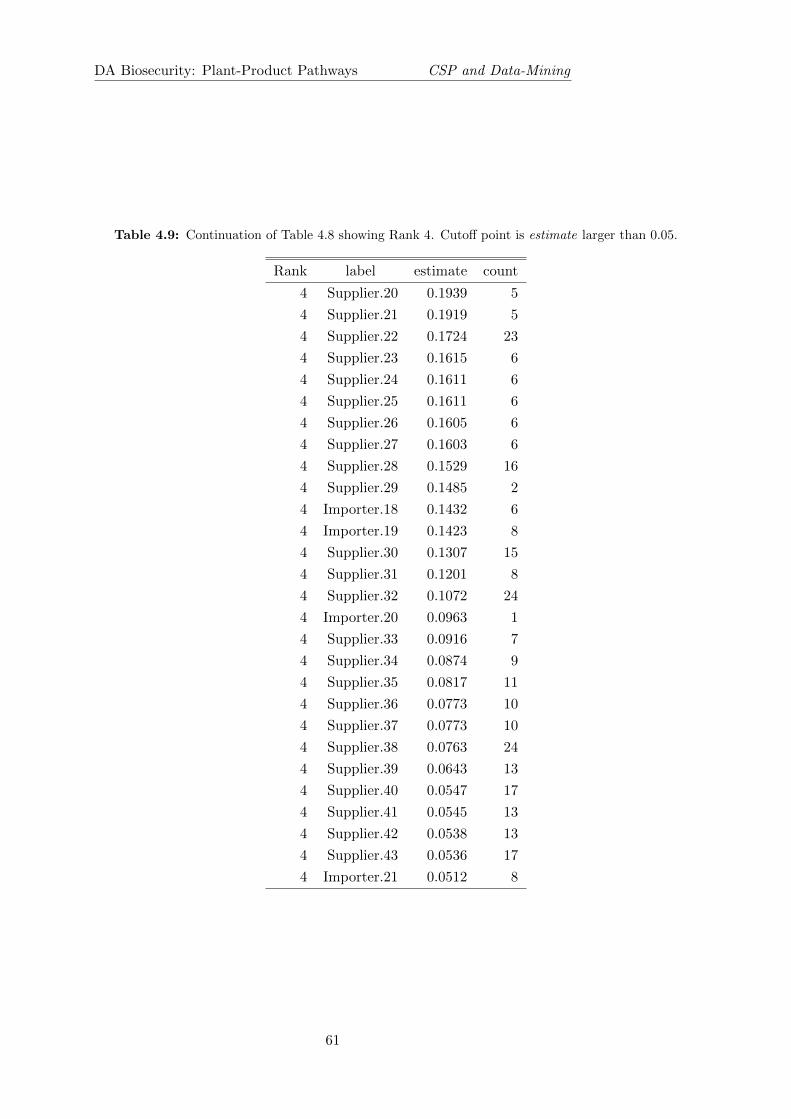
DA Biosecurity: Plant-Product Pathways CSP and Data-Mining
Table 4.9: Continuation of Table 4.8 showing Rank 4. Cutoff point is estimate larger than 0.05.
Rank label estimate count
4 Supplier.20 0.1939 5
4 Supplier.21 0.1919 5
4 Supplier.22 0.1724 23
4 Supplier.23 0.1615 6
4 Supplier.24 0.1611 6
4 Supplier.25 0.1611 6
4 Supplier.26 0.1605 6
4 Supplier.27 0.1603 6
4 Supplier.28 0.1529 16
4 Supplier.29 0.1485 2
4 Importer.18 0.1432 6
4 Importer.19 0.1423 8
4 Supplier.30 0.1307 15
4 Supplier.31 0.1201 8
4 Supplier.32 0.1072 24
4 Importer.20 0.0963 1
4 Supplier.33 0.0916 7
4 Supplier.34 0.0874 9
4 Supplier.35 0.0817 11
4 Supplier.36 0.0773 10
4 Supplier.37 0.0773 10
4 Supplier.38 0.0763 24
4 Supplier.39 0.0643 13
4 Supplier.40 0.0547 17
4 Supplier.41 0.0545 13
4 Supplier.42 0.0538 13
4 Supplier.43 0.0536 17
4 Importer.21 0.0512 8
61
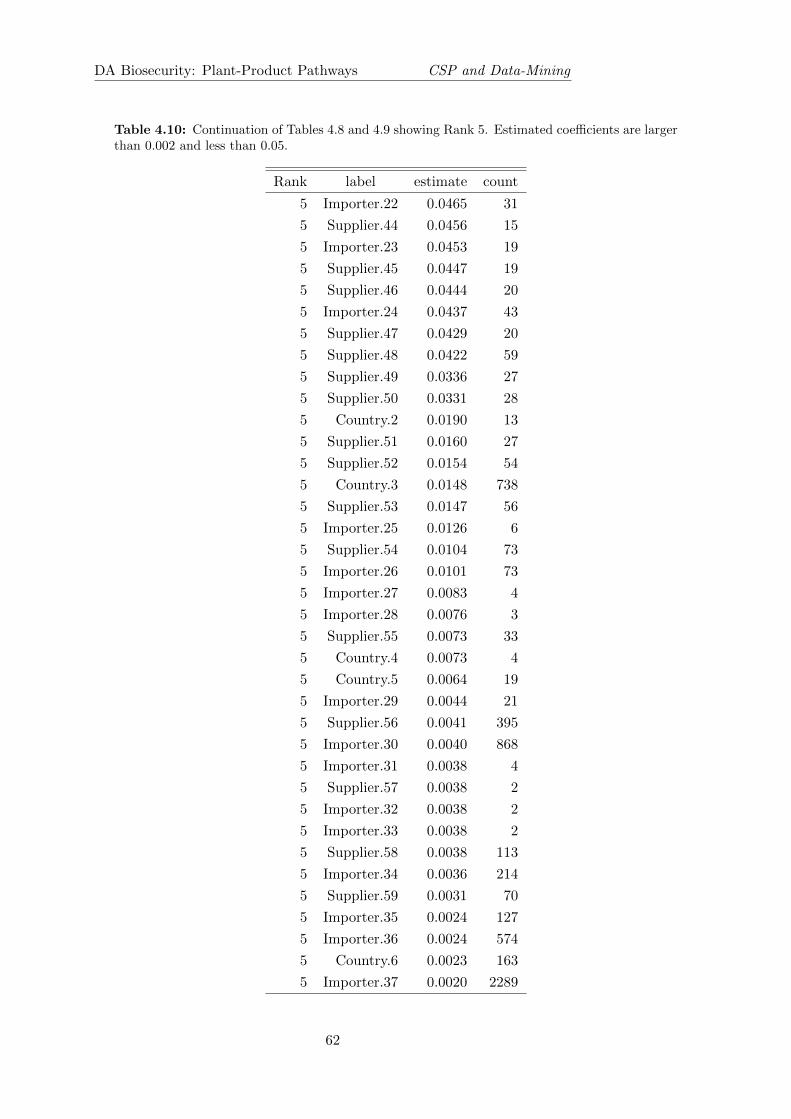
DA Biosecurity: Plant-Product Pathways CSP and Data-Mining
Table 4.10: Continuation of Tables 4.8 and 4.9 showing Rank 5. Estimated coefficients are largerthan 0.002 and less than 0.05.
Rank label estimate count
5 Importer.22 0.0465 31
5 Supplier.44 0.0456 15
5 Importer.23 0.0453 19
5 Supplier.45 0.0447 19
5 Supplier.46 0.0444 20
5 Importer.24 0.0437 43
5 Supplier.47 0.0429 20
5 Supplier.48 0.0422 59
5 Supplier.49 0.0336 27
5 Supplier.50 0.0331 28
5 Country.2 0.0190 13
5 Supplier.51 0.0160 27
5 Supplier.52 0.0154 54
5 Country.3 0.0148 738
5 Supplier.53 0.0147 56
5 Importer.25 0.0126 6
5 Supplier.54 0.0104 73
5 Importer.26 0.0101 73
5 Importer.27 0.0083 4
5 Importer.28 0.0076 3
5 Supplier.55 0.0073 33
5 Country.4 0.0073 4
5 Country.5 0.0064 19
5 Importer.29 0.0044 21
5 Supplier.56 0.0041 395
5 Importer.30 0.0040 868
5 Importer.31 0.0038 4
5 Supplier.57 0.0038 2
5 Importer.32 0.0038 2
5 Importer.33 0.0038 2
5 Supplier.58 0.0038 113
5 Importer.34 0.0036 214
5 Supplier.59 0.0031 70
5 Importer.35 0.0024 127
5 Importer.36 0.0024 574
5 Country.6 0.0023 163
5 Importer.37 0.0020 2289
62

DA Biosecurity: Plant-Product Pathways CSP and Data-Mining
4.3.3 Issues arising during the regression process
1. Reaching the memory limit in R
Currently the department uses a 32 bit windows operating system and the memory limit for Ron this system is 4 gigabytes. The desk top computer we are using in ABARES is an HP Z600.On this system we can apply group OSCAR with a maximum of two predictor variables.
Theoretically, a 64 bit windows operating system can solve the memory problem. In this project,we carried out the above regressions on a Samsung Core i3 laptop computer with a 64 bit windowsoperating system. However, when we tried to perform interaction analyses between the predictorvariables, the same problem occurred. The R error showed that to perform the analyses, R needmore than 1000 GB memory size to allocate a matrix. Our current Samsung laptop computerhas at the most 500 GB memory size including both a 4 GB physical memory and a 500 GBvirtual memory.
2. A problem with the R code
In the project, we attempted to estimate risk levels for all possible predictors variables in oneanalysis to determine their relative importance. However, when analysing risks for five predictorvariables including supplier, importer, country, constituent and tariff, we got the following Rerror “Error in if (zmin < gamhat) { : missing value where TRUE/FALSE needed”. It wasnot possible to solve this problem in the time available for this project, and future work willinvestigate this problem further.
4.4 Analysis of shelled vs. unshelled nuts with the RandomForest method
Here we consider whether the predictor variable of preparation, that is “shelled” or “unshelled”nut products, affects quarantine failures. We found some preliminary evidence that unshellednuts have higher failure rates than shelled nuts (Table 4.3). We tried to carry out the regressionanalysis with the variable of preparation but the analysis was stopped because of the above Rcode problem. To study effects of preparation, we used the technique of random forests. Thepredictor variables were supplier, importer, country and preparation. The results of the randomforests analysis is presented in Table 4.11. The random forests analysis shows that of the 24listed risky factors, none is from the variable of preparation. This implies that the variable doesnot have a large effect on quarantine failures when considered at the same time as suppliers andimporters. Three factors were estimated to be most important to the quarantine failures. Theyare “Supplier 1”, “Importer 1” and supplier “Supplier 2”. Their “mean decrease accuracy” (anindex estimating importance of the variables [10]) are over ten, more than five times that ofother variables.
The performance of the random forest analysis is shown in Figure 4.3. The AUC of 0.632 impliesthat the performance of the random forest is reasonably better than a random sample.
63

DA Biosecurity: Plant-Product Pathways CSP and Data-Mining
Table 4.11: Risks of factors within variables of supplier, importer, country andpreparation estimated using the technique of random forests obtained from the nut data.MeanDecreaseAccuracy is an index estimating importance of the variables. A variable with a largervalue of MeanDecreaseAccuracy is more important in predicting response variable and thereforecontribute more to the response.
Factor MeanDecreaseAccuracy
Supplier.1 20.09
Importer.1 12.90
Supplier.2 11.85
Importer.2 2.51
Importer.3 2.28
Country.1 2.25
Importer.4 1.67
Country.2 1.42
Importer.5 1.27
Importer.6 1.27
Country.3 1.07
Supplier.3 1.00
Supplier.4 1.00
Supplier.5 1.00
Supplier.6 1.00
Supplier.7 1.00
Supplier.8 1.00
Supplier.9 1.00
Supplier.10 1.00
Supplier.11 1.00
Supplier.12 1.00
Supplier.13 0.47
Supplier.14 0.08
Importer.7 0.02
64
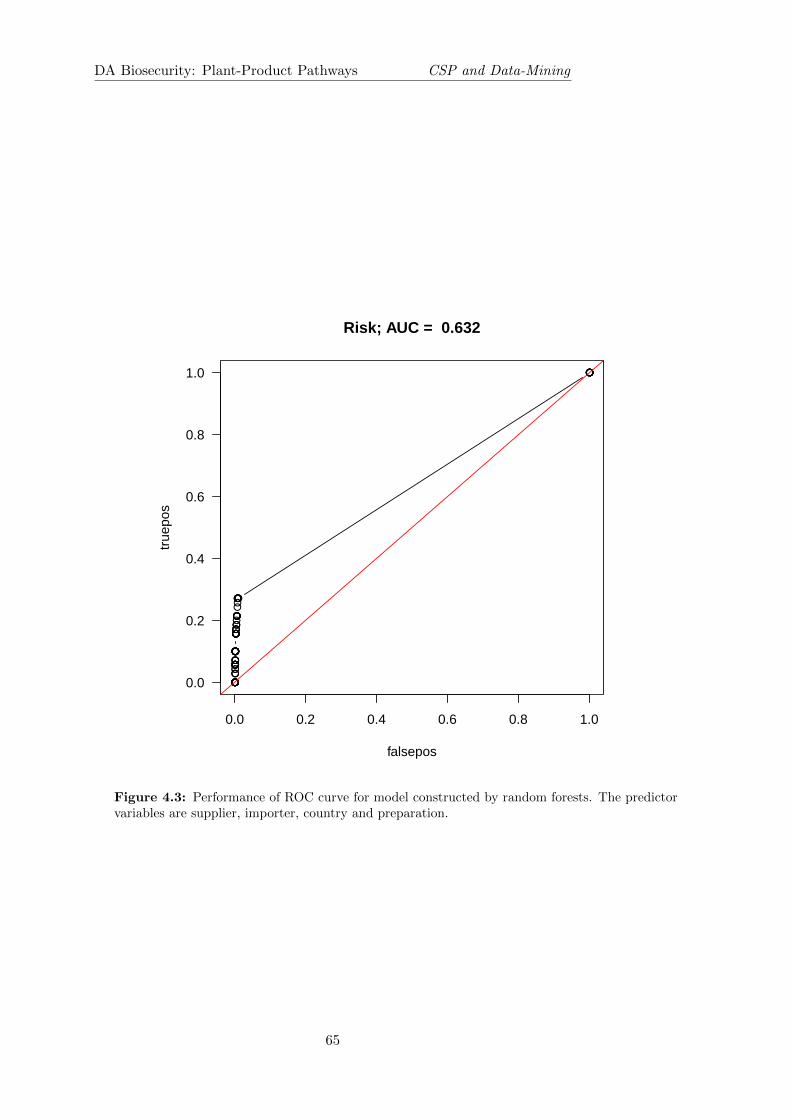
DA Biosecurity: Plant-Product Pathways CSP and Data-Mining
●●●●●●●●●●●
●●●●●●●●●●●●●●●●●●●●●●●●●●●●●●●●●●●
●●●●●●●●●●●●●●●●●●●●●●●●●●●●●●●●●●●●●●●●●●●●●●●●●●●●●●●●●●●●●●●●●●●●●●●●●●●
0.0 0.2 0.4 0.6 0.8 1.0
0.0
0.2
0.4
0.6
0.8
1.0
Risk; AUC = 0.632
falsepos
true
pos
Figure 4.3: Performance of ROC curve for model constructed by random forests. The predictorvariables are supplier, importer, country and preparation.
65
5
Discussion and recommendations
This project built on work previously presented in earlier ACERA reports [2, 3]. Broadlyspeaking the project comprised four themes: (i) comparison of CSP alternatives using a newcriterion, namely “inspections per detection” (IPD), and more explicit consideration of existingcriteria such as leakage; (ii) the implications of applying a CSP to manage a“combined”pathway(e.g. nuts) as opposed to component pathways; (iii) extending the role of data mining beyondthe identification of pathways that may be suitable for a CSP; and (iv) using and building oninternal capacity within the department (ABARES) to facilitate the uptake of the outcomes ofthis work. Below we discuss each in turn, before covering some other issues that arose duringthe project.
5.1 Criteria for assessing a CSP
The risk that BRM poses is determined jointly by the likelihood of arrival (the approach rate) ofthe BRM and the severity of possible impact of that BRM. To date, CSPs have been consideredonly for pathways (i) that have a low approach rate of BRM and (ii) where the BRM on thepathway is not likely to have severe impacts, either because of the material itself, or becauseof the post-entry use of the plant product in Australia. A CSP provides a way of maintainingsome monitoring of these low-risk pathways, but with reduced effort.
In earlier studies, CSP sampling rates were chosen based on achieving a post-interventioncompliance (PIC) rate of 99% because of the focus on low-risk pathways. However,
1. the choice of 99% was arbitrary,
2. some pathways cannot have a PIC below 99% even with no inspection of the pathway,because of the very low failure rate on the pathway,
3. the calculated PIC depends on the assumed inspection effectiveness as well as the CSPstrategy,
4. for some pathways, more than one combination of inspection parameters can achieve thetarget value,
5. focussing on PIC can result in ignoring a discussion of how much is leaked, which is drivenby the compliance rate and the volume of the pathway. When comparing across pathways,the amount (not rate) of leakage is a better reflection of risk to Australia.
66

DA Biosecurity: Plant-Product Pathways CSP and Data-Mining
Hence even with a focus on low-risk pathways we recommend that decision makers consider thelevel of leakage when deciding on which CSP strategy and inspection rates to employ.
Once a level of acceptable leakage is chosen other criteria could be used to inform the CSPdecision. The risk-return approach to biosecurity involves minimising the level of biosecurityrisk for a given amount of resources spent. If a level of acceptable risk (leakage) at the level ofthe individual pathway is defined, then the strategy can be chosen that provides the best return,i.e. that achieves this leakage with the least amount of resources spent (the lowest number ofinspections). In this report we have introduced the criterion “inspections per detection” (IPD)to facilitate this type of decision.
The different pathways analysed in this report (main chapters and appendices) present differenttradeoffs in these criteria. For example, a CSP for the raisin pathway stratified by importershows little variation in leakage as a function of CN and MF , but substantial variation inIPD. This means that substantial reductions in IPD can be achieved without a large increase inleakage. In contrast, the cashew pathway with a CSP stratified by importer, showed substantialvariation in leakage with limited variation in IPD. Cashews also showed much greater benefitsof a CSP when stratified by supplier rather than importer, but operationally it is more desirableto focus a CSP strategy on importers. The cashew result makes the decision on CSP rates forthis pathway more difficult. We provide a full set of tables for each pathway (and associatedfigures) so that pathway managers can consider the tradeoffs. We recommend that all criteria(Leakage, IPD and to a lesser extent PIC) be considered in the decision.
5.2 Applying a CSP to a combined pathway
In this report we applied CSPs to the combined nut pathway, which included the types: almonds,brazil nuts, cashews, chestnuts, hazelnuts, macadamias, pistachios, walnuts and “other nuts”.The analysis was carried out to investigate the implications of applying a CSP in this way. Ifthis was to be considered in an operational context decisions would need to be made about whichnut types to include. Based on current practice all nut types should be considered “low-risk”before being included in a combined analysis; that may not be the case with the analysis wecarried out.
When considering whether to combine sub-pathways, there are three options for calculating andapplying CSP rates:
1. Calculate the rate based on combined data and apply the rate to the combined pathway.
2. Calculate the rate based on combined data, but apply the rate to each pathway separately.
3. Calculate and apply the rates separately for each pathway.
For the case considered here, the analysis showed no major difference in CSP outcomes whetherthe pathway was stratified by importer only, or by importer and nut type. Both options producedimprovements over random sampling. Treating nuts as one pathway for both estimating andapplying CSP rates (option 1) produced the lowest IPD, but at the expense of higher leakagecompared with choosing and applying rates for the lowest IPD for each individual pathway(option 3, which produced the lowest leakage), or choosing rates from a combined analysis, butapplying them to individual nut types (option 2).
This approach needs to be investigated further with other pathways, and consideration shouldbe given to other potential costs and benefits of combining pathways as opposed to treating
67
DA Biosecurity: Plant-Product Pathways CSP and Data-Mining
them separately when considering the operational usefulness of this approach. For example, wemay ask: are failure types likely to be specific to individual nut types? in which case perhapsthey should be separated; what are the administrative implications of the different approaches?
5.3 Data mining
In past projects data mining has been used to identify pathways that may be suitable for CSPmonitoring, for example, those with low failure rates. Data mining can also be used to identifyfactors associated with higher risk on a pathway. It could be used for example to focus inspectioneffort on a pathway as one way to improve inspection effectiveness. In this project we applied anew data mining method called group OSCAR and an existing method known as random foreststo the nut data as a trial of data mining methods for plant import data. The data mining wasconstrained by our computer infrastructure (see below), but our results suggested that for nutsthe variables of tariffs and nut types were not strong predictors of risk relative to the high riskfactors of suppliers, importers or countries. Higher risk importers/suppliers/countries tended tohave low numbers of imports. These types of importers/suppliers/countries would be detectedby the initial clearance number applied in a CSP, depending on what stratification the CSP wasfocussed on. Future work on data mining would benefit from considering pathways with higherfailure rates and a broader range of potential explanatory factors.
5.4 Building and using capacity with the department
This project built a strong collaboration between Andrew Robinson from ACERA, the quantitativesciences section in ABARES (DA), and Plant Import Operations, Plant Biosecurity Division(DA). Capacity to carry out future CSP and data mining analyses have been developed inthe department, and the research outcomes from the project have been enhanced by includingscientists from the department directly in the research and analysis. This approach provides onemodel for improving both the uptake and outcomes of research and development.
5.5 Other issues
5.5.1 Modelling algorithms and computer infrastructure
The current computer implementations of CSP simulation algorithms take many hours (in somecases days) to carry out the simulations. While the majority of time required for a CSP analysisof a pathway is taken up in preparing the data for analysis and reporting on the simulationoutcomes, the simulation tool slows down the process, particularly if simulations need to bere-run after exploring the original results. It would be useful to produce a new version of thecode to speed up the simulations.
Ideally data mining methods consider many different potential explanatory variables at once, aswell as the possibility of interactions between explanatory variables, provided sufficient data areavailable. Computer hardware currently available in the department is limiting the data mininganalyses that can be carried out. This is likely to be an issue for data mining more broadly inthe department.
68
DA Biosecurity: Plant-Product Pathways CSP and Data-Mining
5.5.2 Changes to the CSP simulation approach
In earlier projects CSP simulations were carried out on observed data, but an inspection effectivenessof 90% was applied during the simulation process. This strategy would underestimate the failurerate of a pathway (deflating it to 90% of the observed value), so in this project we inflated theobserved history to account for inspection effectiveness before again applying 90% inspectioneffectiveness during the simulation. This approach results in an appropriate observed failurerate at the level of the entire pathway, but introduces the problem that we need some way toassign these “unobserved” failures. We used a GAM model of the time series of failures to atleast account for the time pattern in failure rate, but we still had to assign these extra failuresto individual importers/suppliers, which is an arbitrary and unsatisfactory approach.
We now believe that the best approach would be to focus on the observed failures and ignoreinspection effectiveness when simulating a CSP. With this approach any variation in the CSPoutcome is due to variation from the approach dictated by the CSP rules, rather than variationin the inspection process which we cannot model properly. This approach will not result inmajor differences to the results presented in this report, but we recommend this new approachbe adopted for future CSP simulation analyses.
5.5.3 CSP post implementation
The CSP rates are chosen based on simulation of data that comes from mandatory inspection ofa pathway, hence simulated performance assumes the pathway continues to behave in a similarway. Once a CSP is implemented, the inspection history will come from the subset of the importpathway inspected according to the CSP rules and rates applied to the pathway. It is essentialthat methods are developed to determine (i) whether the proportion of BRM on the pathwaydeviates from the original data; (ii) how long it takes to detect deviation and the implicationsthat has for risk; and (iii) how CSP rates can be updated to reflect changes in the proportion ofBRM on a pathway. These methods will ensure any changes to the risk posed by the pathwaydue to changes in the approach rate of BRM will be managed appropriately. Future work shouldaddress these questions.
5.6 Recommendations
We make the following recommendations:
1. Plant Import Operations, ACERA (now CEBRA; Centre of Excellence for BiosecurityRisk Analysis) and ABARES should continue to work closely together to address the issuesidentified below and to ensure outcomes are appropriately implemented in the department’soperations and policy development.
2. Decisions about the clearance number and monitoring fraction to implement when itbecomes operationally active should include a full consideration of the CSP analyses forindividual pathways presented in this report, particularly leakage and IPD.
3. Data mining methods should be further developed and applied to enable identification ofhigh risk components of pathways.
4. Combined pathway CSP analysis should be trialled on additional pathways to refine themethodology. Careful a priori decisions should be made about which pathways should be
69
DA Biosecurity: Plant-Product Pathways CSP and Data-Mining
considered for combining prior to analysis. For example, if a particular sub-component ofa pathway contains a risk factor that may be considered too risky to consider for a CSPit should be excluded from the combined analysis (Chestnuts and the risk presented bychestnut blight may be an example).
5. Upgrade computer hardware and software. Current data mining techniques are limited bythe available computer hardware and software (32 bit windows vs. 64 bit windows) in thedepartment. This needs to be addressed to allow appropriate data mining to proceed.
6. Develop methodology to assess CSP performance. This will ensure any changes to the riskposed by the pathway will be managed appropriately once the CSP has been implemented.
70
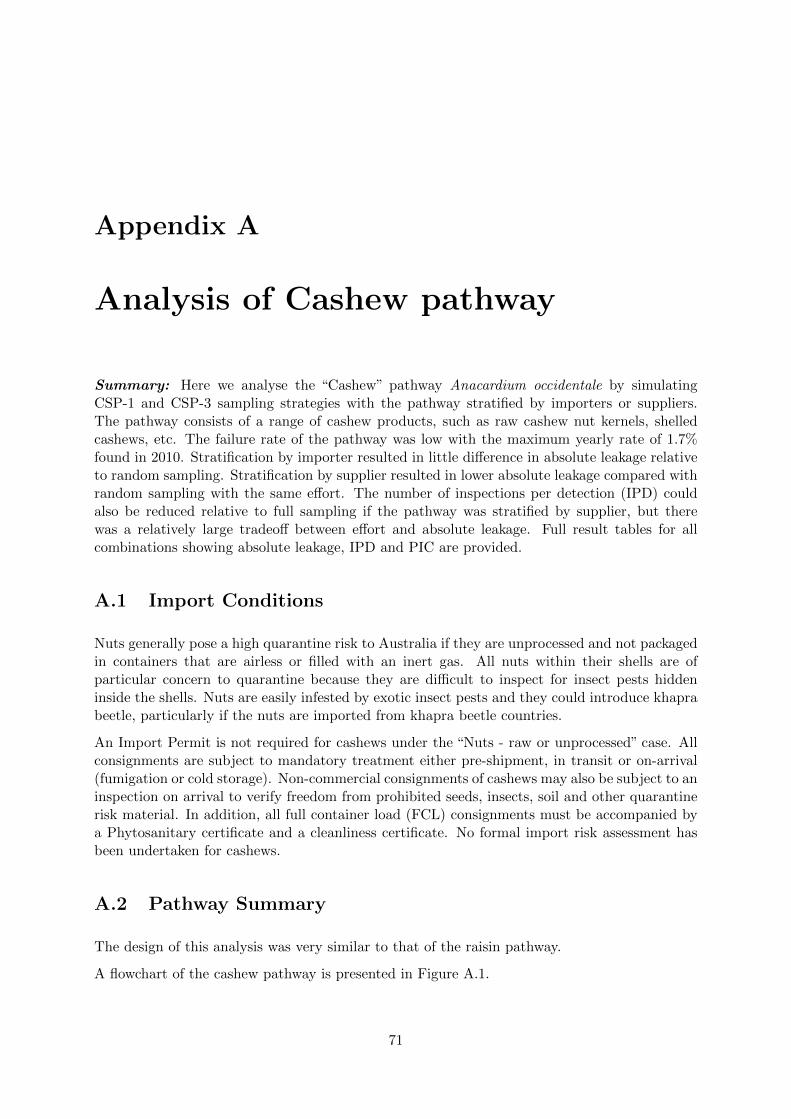
Appendix A
Analysis of Cashew pathway
Summary: Here we analyse the “Cashew” pathway Anacardium occidentale by simulatingCSP-1 and CSP-3 sampling strategies with the pathway stratified by importers or suppliers.The pathway consists of a range of cashew products, such as raw cashew nut kernels, shelledcashews, etc. The failure rate of the pathway was low with the maximum yearly rate of 1.7%found in 2010. Stratification by importer resulted in little difference in absolute leakage relativeto random sampling. Stratification by supplier resulted in lower absolute leakage compared withrandom sampling with the same effort. The number of inspections per detection (IPD) couldalso be reduced relative to full sampling if the pathway was stratified by supplier, but therewas a relatively large tradeoff between effort and absolute leakage. Full result tables for allcombinations showing absolute leakage, IPD and PIC are provided.
A.1 Import Conditions
Nuts generally pose a high quarantine risk to Australia if they are unprocessed and not packagedin containers that are airless or filled with an inert gas. All nuts within their shells are ofparticular concern to quarantine because they are difficult to inspect for insect pests hiddeninside the shells. Nuts are easily infested by exotic insect pests and they could introduce khaprabeetle, particularly if the nuts are imported from khapra beetle countries.
An Import Permit is not required for cashews under the “Nuts - raw or unprocessed” case. Allconsignments are subject to mandatory treatment either pre-shipment, in transit or on-arrival(fumigation or cold storage). Non-commercial consignments of cashews may also be subject to aninspection on arrival to verify freedom from prohibited seeds, insects, soil and other quarantinerisk material. In addition, all full container load (FCL) consignments must be accompanied bya Phytosanitary certificate and a cleanliness certificate. No formal import risk assessment hasbeen undertaken for cashews.
A.2 Pathway Summary
The design of this analysis was very similar to that of the raisin pathway.
A flowchart of the cashew pathway is presented in Figure A.1.
71

DA Biosecurity: Plant-Product Pathways CSP and Data-Mining
79 Importers Cashew15 Countries
222 Suppliers
Inspection
PassQuarantine
Fail
2015 Consignments
1988
(98.7%)
27
(1.3%)
Figure A.1: Cashew consignments flow chart with statistics for Jan 2010–Jun 2012. A quarantinefailure was recorded for consignments with a detection of quarantine concern, such as insect,pathogen, or contamination.
Table A.1: Pattern of inspections and quarantine failure rates by year for the cashew pathway.Count is the number of consignments imported during the study period, PF% is the percentage ofconsignments that fail for any contamination or non-commodity failure, QF % is the percentage ofconsignments with contamination of quarantine interest, and Tonnage is the total tons of productimported during the study period. *Note that 2007 and 2012 are half years.
Year Count PF % QF % Tonnage
2007* 566 2.1 0.9 8,888
2008 928 3.0 1.3 15,135
2009 855 4.6 1.3 13,648
2010 871 3.8 1.7 13,522
2011 766 4.0 1.3 11,817
2012* 378 1.6 0.5 5,929
The full dataset comprises 4364 consignments with record creation dates ranging from July 2007to June 2012, and comprises entries from 117 importers, 21 countries and 347 suppliers.
The burn date was set at 1 Jan 2010, 2.5 years from the end of the dataset.
A smoothed plot of the quarantine failure rate against time is presented in Figure A.2. Thefigure shows a very low failure rate with the highest rate peaking at about 2.4% at Jan 2011.The failure rate for the entire period was 1.26% and for the post-burn period (from Jan 2010 toJun 2012) was 1.3%.
Annual inspection statistics are provided in Table A.1. The number of consignments per yearranged from 766 to 928, while tonnage ranged from between 11,817 and 15,135 (considering fullyears only).
The pattern of quarantine failure counts by importer, country and supplier is presented in
72
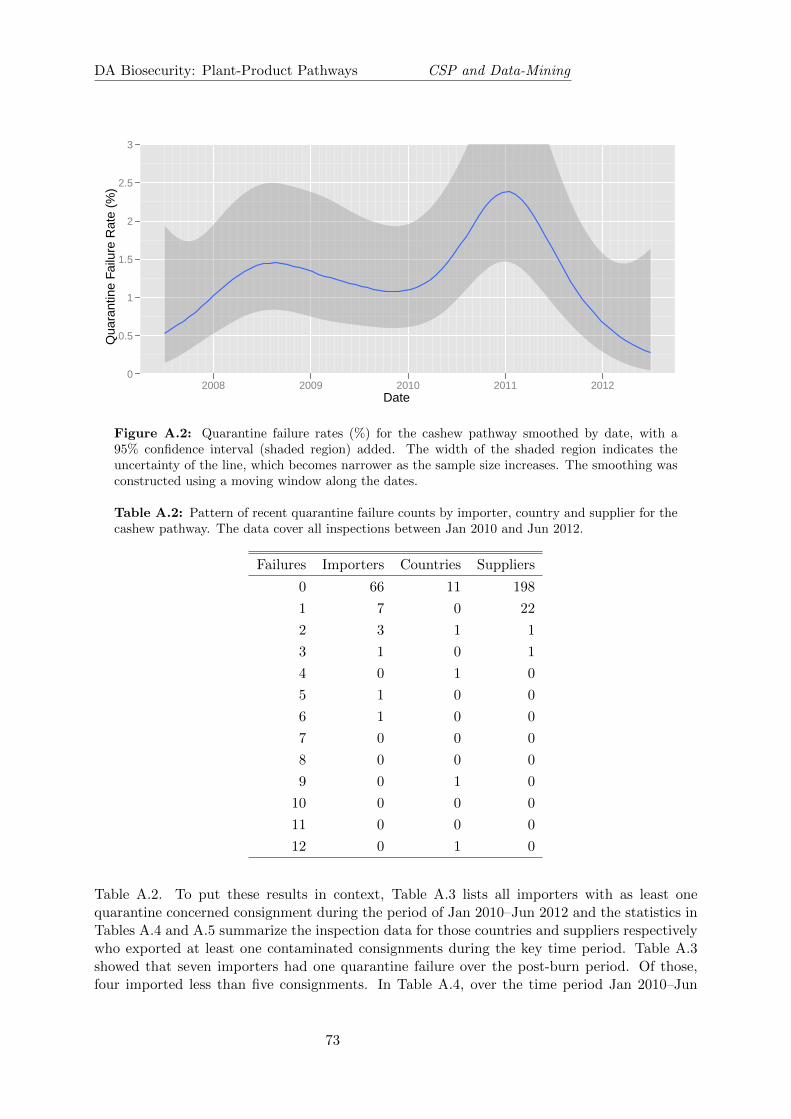
DA Biosecurity: Plant-Product Pathways CSP and Data-Mining
Date
Qua
rant
ine
Failu
re R
ate
(%)
0
0.5
1
1.5
2
2.5
3
2008 2009 2010 2011 2012
Figure A.2: Quarantine failure rates (%) for the cashew pathway smoothed by date, with a95% confidence interval (shaded region) added. The width of the shaded region indicates theuncertainty of the line, which becomes narrower as the sample size increases. The smoothing wasconstructed using a moving window along the dates.
Table A.2: Pattern of recent quarantine failure counts by importer, country and supplier for thecashew pathway. The data cover all inspections between Jan 2010 and Jun 2012.
Failures Importers Countries Suppliers
0 66 11 198
1 7 0 22
2 3 1 1
3 1 0 1
4 0 1 0
5 1 0 0
6 1 0 0
7 0 0 0
8 0 0 0
9 0 1 0
10 0 0 0
11 0 0 0
12 0 1 0
Table A.2. To put these results in context, Table A.3 lists all importers with as least onequarantine concerned consignment during the period of Jan 2010–Jun 2012 and the statistics inTables A.4 and A.5 summarize the inspection data for those countries and suppliers respectivelywho exported at least one contaminated consignments during the key time period. Table A.3showed that seven importers had one quarantine failure over the post-burn period. Of those,four imported less than five consignments. In Table A.4, over the time period Jan 2010–Jun
73

DA Biosecurity: Plant-Product Pathways CSP and Data-Mining
Table A.3: Summary statistics by importer for the cashew pathway. Count is the number ofconsignments imported during the study period. PF is the percentage of consignments that fail forany contamination or non-commodity failure. QF is the count of consignments with contaminationof quarantine interest. The Tonnage lists total volume in 1,000 kg of consignments imported byeach importer during the study period. The Suppliers and Countries columns report the numbersof suppliers and countries that have exported to each importer during the time period. The datacover all inspections between Jan 2010 and Jun 2012. We only include those importers with atleast one quarantine concerned consignment during the time period.
Importer Count PF % QF QF % Tonnage Suppliers Countries
a 412 1.9 2 0.5 6,470 1 1
b 308 4.5 5 1.6 5,700 62 6
c 168 6.5 3 1.8 2,668 36 4
d 126 2.4 1 0.8 2,162 11 2
e 112 12.5 6 5.4 1,751 19 6
f 96 2.1 1 1.0 1,680 23 5
g 88 1.1 1 1.1 1,418 19 5
h 80 2.5 2 2.5 1,289 19 2
i 64 4.7 2 3.1 698 3 1
j 4 25.0 1 25.0 6 1 1
k 3 66.7 1 33.3 10 3 2
l 1 100.0 1 100.0 3 1 1
m 1 100.0 1 100.0 15 1 1
Table A.4: Summary statistics by country for the cashew pathway. See caption of Table A.3for explanation of column names. The Suppliers and Importer columns report the numbers ofsuppliers and importers that have exported and imported from each country during the timeperiod. The data cover all inspections between Jan 2010 and Jun 2012. We only include thosecountries with at least one quarantine concerned consignment during the time period.
Country Count PF % QF QF % Tonnage Suppliers Importers
a 1094 2.6 12 1.1 17,861 121 39
b 532 1.9 2 0.4 8,479 7 6
c 162 12.3 9 5.6 2,449 50 17
d 69 13.0 4 5.8 1,090 7 5
2012, consignments from four countries contained biosecurity risk material. Their quarantinefailure rates were all less than 6%. In Table A.5, supplier “a” exported 412 consignments overthe two and half years. Of those, 2 were contaminated. All the other suppliers listed in the sametable exported less than 60 consignments. Of those, suppliers “u”, “v”, “w” and “x” had only oneconsignment, and that was contaminated.
74

DA Biosecurity: Plant-Product Pathways CSP and Data-Mining
Table A.5: Summary statistics by supplier for the cashew pathway. See caption of Table A.3for explanation of column names and scope. We include only those suppliers with at least onequarantine concerned consignment. The Countries and Importer columns report the number ofcountries that each supplier and importer have exported and imported from the supplier duringthe time period after Jan 2010.
Supplier Count PF % QF QF % Tonnage Countries Importers
a 412 1.9 2 0.5 6,470 1 1
b 59 3.4 1 1.7 1,075 1 5
c 57 1.8 1 1.8 585 1 1
d 30 6.7 1 3.3 545 1 1
e 28 10.7 1 3.6 444 1 2
f 20 5.0 1 5.0 349 1 5
g 17 29.4 3 17.6 269 1 1
h 11 27.3 1 9.1 144 1 1
i 10 10.0 1 10.0 159 1 3
j 10 10.0 1 10.0 178 1 1
k 8 37.5 1 12.5 127 1 1
l 7 14.3 1 14.3 111 1 1
m 6 16.7 1 16.7 95 1 3
n 5 40.0 1 20.0 79 1 1
o 5 20.0 1 20.0 79 1 1
p 4 25.0 1 25.0 6 1 1
q 4 25.0 1 25.0 63 1 2
r 4 50.0 1 25.0 83 1 1
s 3 33.3 1 33.3 79 1 2
t 2 50.0 1 50.0 31 1 1
u 1 100.0 1 100.0 3 1 1
v 1 100.0 1 100.0 15 1 1
w 1 100.0 1 100.0 3 1 1
x 1 100.0 1 100.0 15 1 1
75
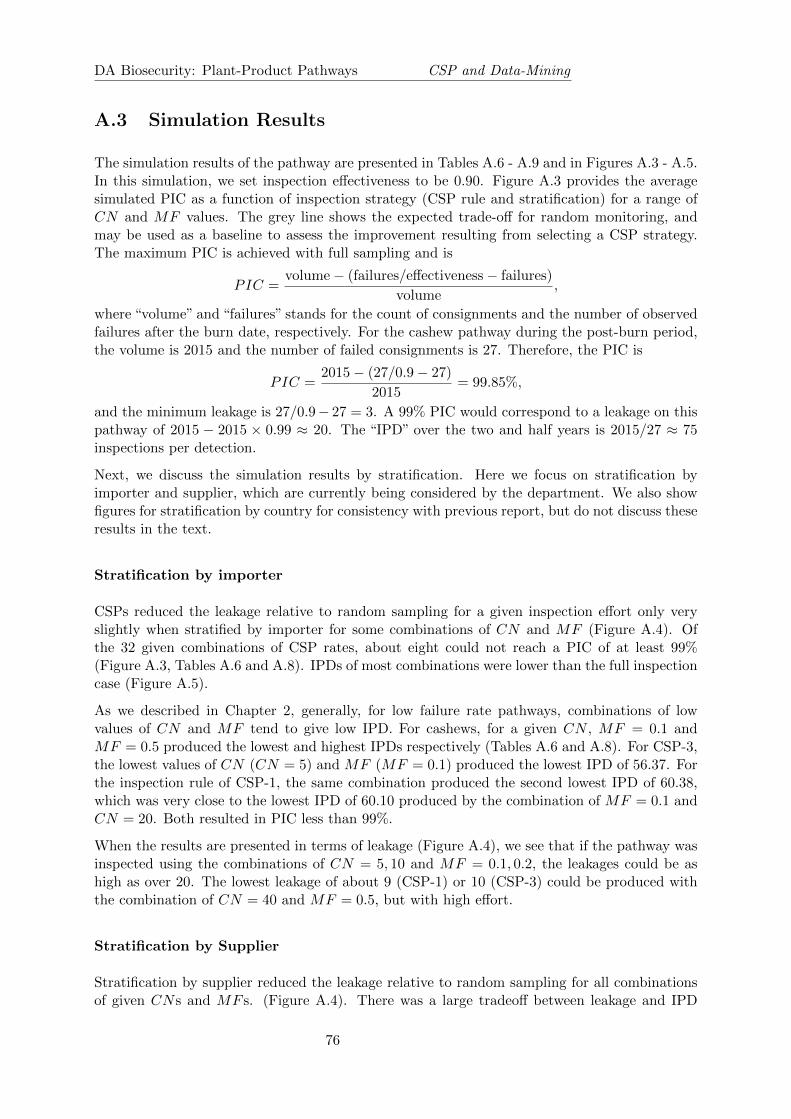
DA Biosecurity: Plant-Product Pathways CSP and Data-Mining
A.3 Simulation Results
The simulation results of the pathway are presented in Tables A.6 - A.9 and in Figures A.3 - A.5.In this simulation, we set inspection effectiveness to be 0.90. Figure A.3 provides the averagesimulated PIC as a function of inspection strategy (CSP rule and stratification) for a range ofCN and MF values. The grey line shows the expected trade-off for random monitoring, andmay be used as a baseline to assess the improvement resulting from selecting a CSP strategy.The maximum PIC is achieved with full sampling and is
PIC =volume− (failures/effectiveness− failures)
volume,
where “volume” and “failures” stands for the count of consignments and the number of observedfailures after the burn date, respectively. For the cashew pathway during the post-burn period,the volume is 2015 and the number of failed consignments is 27. Therefore, the PIC is
PIC =2015− (27/0.9− 27)
2015= 99.85%,
and the minimum leakage is 27/0.9− 27 = 3. A 99% PIC would correspond to a leakage on thispathway of 2015 − 2015 × 0.99 ≈ 20. The “IPD” over the two and half years is 2015/27 ≈ 75inspections per detection.
Next, we discuss the simulation results by stratification. Here we focus on stratification byimporter and supplier, which are currently being considered by the department. We also showfigures for stratification by country for consistency with previous report, but do not discuss theseresults in the text.
Stratification by importer
CSPs reduced the leakage relative to random sampling for a given inspection effort only veryslightly when stratified by importer for some combinations of CN and MF (Figure A.4). Ofthe 32 given combinations of CSP rates, about eight could not reach a PIC of at least 99%(Figure A.3, Tables A.6 and A.8). IPDs of most combinations were lower than the full inspectioncase (Figure A.5).
As we described in Chapter 2, generally, for low failure rate pathways, combinations of lowvalues of CN and MF tend to give low IPD. For cashews, for a given CN , MF = 0.1 andMF = 0.5 produced the lowest and highest IPDs respectively (Tables A.6 and A.8). For CSP-3,the lowest values of CN (CN = 5) and MF (MF = 0.1) produced the lowest IPD of 56.37. Forthe inspection rule of CSP-1, the same combination produced the second lowest IPD of 60.38,which was very close to the lowest IPD of 60.10 produced by the combination of MF = 0.1 andCN = 20. Both resulted in PIC less than 99%.
When the results are presented in terms of leakage (Figure A.4), we see that if the pathway wasinspected using the combinations of CN = 5, 10 and MF = 0.1, 0.2, the leakages could be ashigh as over 20. The lowest leakage of about 9 (CSP-1) or 10 (CSP-3) could be produced withthe combination of CN = 40 and MF = 0.5, but with high effort.
Stratification by Supplier
Stratification by supplier reduced the leakage relative to random sampling for all combinationsof given CNs and MF s. (Figure A.4). There was a large tradeoff between leakage and IPD
76
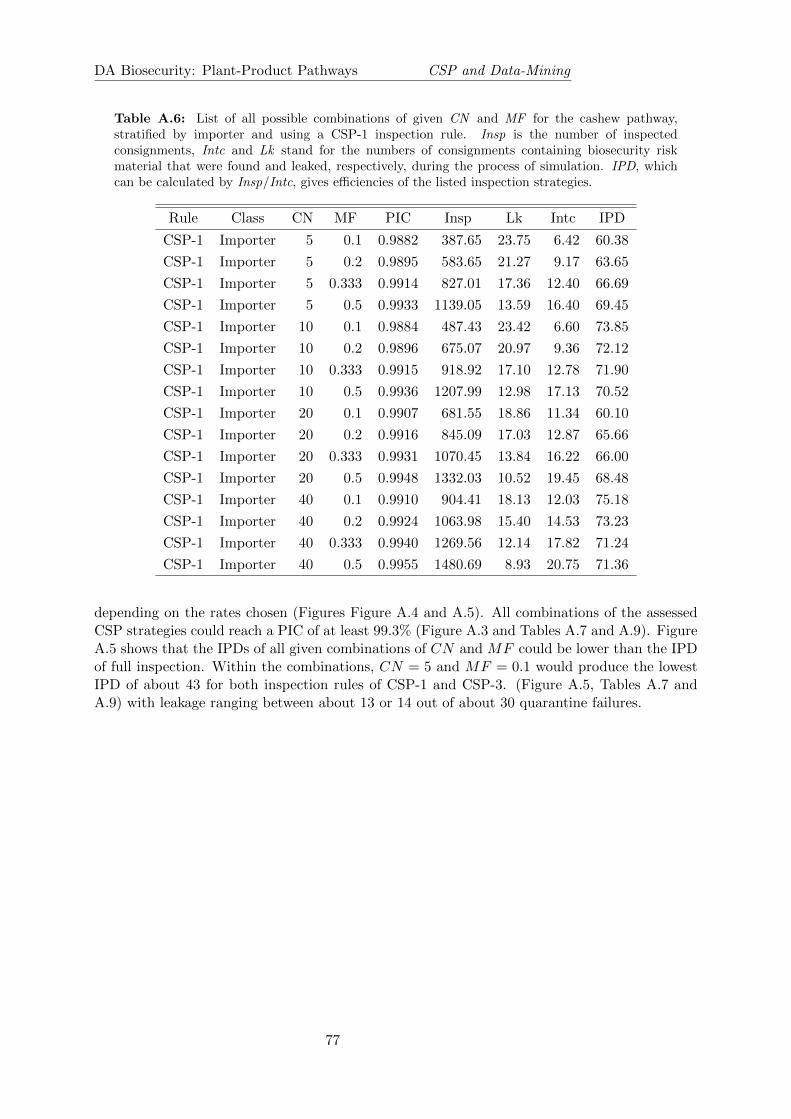
DA Biosecurity: Plant-Product Pathways CSP and Data-Mining
Table A.6: List of all possible combinations of given CN and MF for the cashew pathway,stratified by importer and using a CSP-1 inspection rule. Insp is the number of inspectedconsignments, Intc and Lk stand for the numbers of consignments containing biosecurity riskmaterial that were found and leaked, respectively, during the process of simulation. IPD, whichcan be calculated by Insp/Intc, gives efficiencies of the listed inspection strategies.
Rule Class CN MF PIC Insp Lk Intc IPD
CSP-1 Importer 5 0.1 0.9882 387.65 23.75 6.42 60.38
CSP-1 Importer 5 0.2 0.9895 583.65 21.27 9.17 63.65
CSP-1 Importer 5 0.333 0.9914 827.01 17.36 12.40 66.69
CSP-1 Importer 5 0.5 0.9933 1139.05 13.59 16.40 69.45
CSP-1 Importer 10 0.1 0.9884 487.43 23.42 6.60 73.85
CSP-1 Importer 10 0.2 0.9896 675.07 20.97 9.36 72.12
CSP-1 Importer 10 0.333 0.9915 918.92 17.10 12.78 71.90
CSP-1 Importer 10 0.5 0.9936 1207.99 12.98 17.13 70.52
CSP-1 Importer 20 0.1 0.9907 681.55 18.86 11.34 60.10
CSP-1 Importer 20 0.2 0.9916 845.09 17.03 12.87 65.66
CSP-1 Importer 20 0.333 0.9931 1070.45 13.84 16.22 66.00
CSP-1 Importer 20 0.5 0.9948 1332.03 10.52 19.45 68.48
CSP-1 Importer 40 0.1 0.9910 904.41 18.13 12.03 75.18
CSP-1 Importer 40 0.2 0.9924 1063.98 15.40 14.53 73.23
CSP-1 Importer 40 0.333 0.9940 1269.56 12.14 17.82 71.24
CSP-1 Importer 40 0.5 0.9955 1480.69 8.93 20.75 71.36
depending on the rates chosen (Figures Figure A.4 and A.5). All combinations of the assessedCSP strategies could reach a PIC of at least 99.3% (Figure A.3 and Tables A.7 and A.9). FigureA.5 shows that the IPDs of all given combinations of CN and MF could be lower than the IPDof full inspection. Within the combinations, CN = 5 and MF = 0.1 would produce the lowestIPD of about 43 for both inspection rules of CSP-1 and CSP-3. (Figure A.5, Tables A.7 andA.9) with leakage ranging between about 13 or 14 out of about 30 quarantine failures.
77
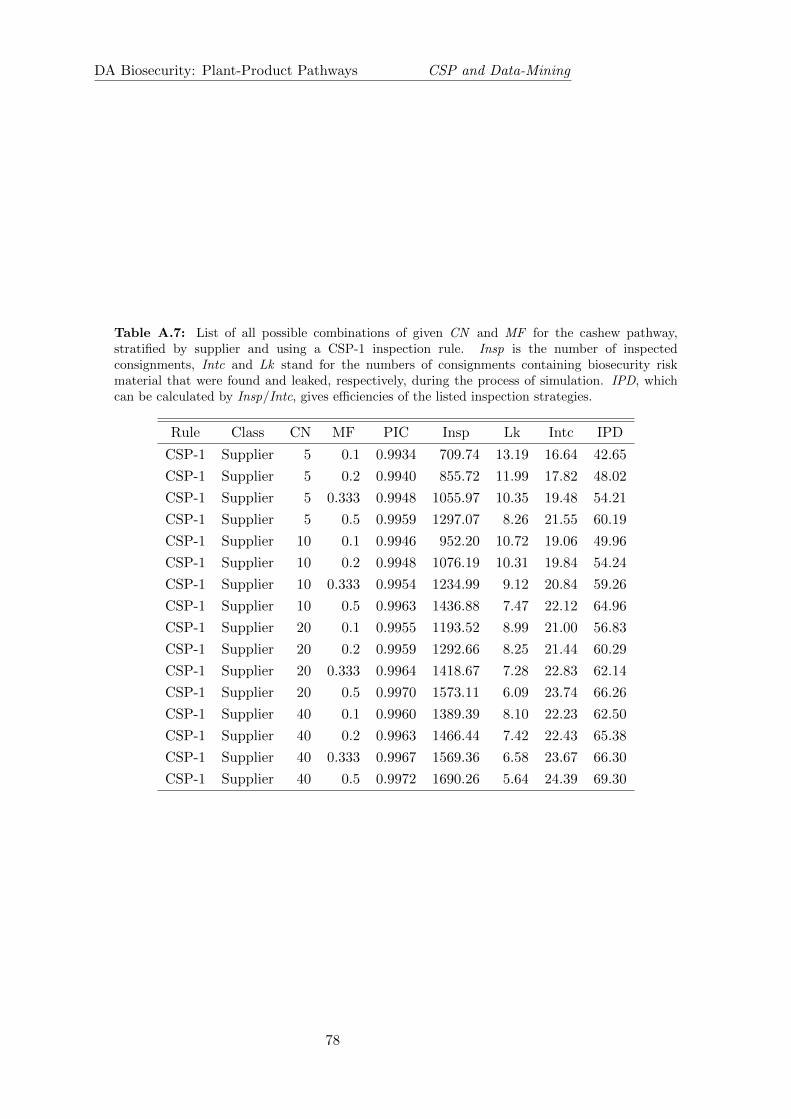
DA Biosecurity: Plant-Product Pathways CSP and Data-Mining
Table A.7: List of all possible combinations of given CN and MF for the cashew pathway,stratified by supplier and using a CSP-1 inspection rule. Insp is the number of inspectedconsignments, Intc and Lk stand for the numbers of consignments containing biosecurity riskmaterial that were found and leaked, respectively, during the process of simulation. IPD, whichcan be calculated by Insp/Intc, gives efficiencies of the listed inspection strategies.
Rule Class CN MF PIC Insp Lk Intc IPD
CSP-1 Supplier 5 0.1 0.9934 709.74 13.19 16.64 42.65
CSP-1 Supplier 5 0.2 0.9940 855.72 11.99 17.82 48.02
CSP-1 Supplier 5 0.333 0.9948 1055.97 10.35 19.48 54.21
CSP-1 Supplier 5 0.5 0.9959 1297.07 8.26 21.55 60.19
CSP-1 Supplier 10 0.1 0.9946 952.20 10.72 19.06 49.96
CSP-1 Supplier 10 0.2 0.9948 1076.19 10.31 19.84 54.24
CSP-1 Supplier 10 0.333 0.9954 1234.99 9.12 20.84 59.26
CSP-1 Supplier 10 0.5 0.9963 1436.88 7.47 22.12 64.96
CSP-1 Supplier 20 0.1 0.9955 1193.52 8.99 21.00 56.83
CSP-1 Supplier 20 0.2 0.9959 1292.66 8.25 21.44 60.29
CSP-1 Supplier 20 0.333 0.9964 1418.67 7.28 22.83 62.14
CSP-1 Supplier 20 0.5 0.9970 1573.11 6.09 23.74 66.26
CSP-1 Supplier 40 0.1 0.9960 1389.39 8.10 22.23 62.50
CSP-1 Supplier 40 0.2 0.9963 1466.44 7.42 22.43 65.38
CSP-1 Supplier 40 0.333 0.9967 1569.36 6.58 23.67 66.30
CSP-1 Supplier 40 0.5 0.9972 1690.26 5.64 24.39 69.30
78
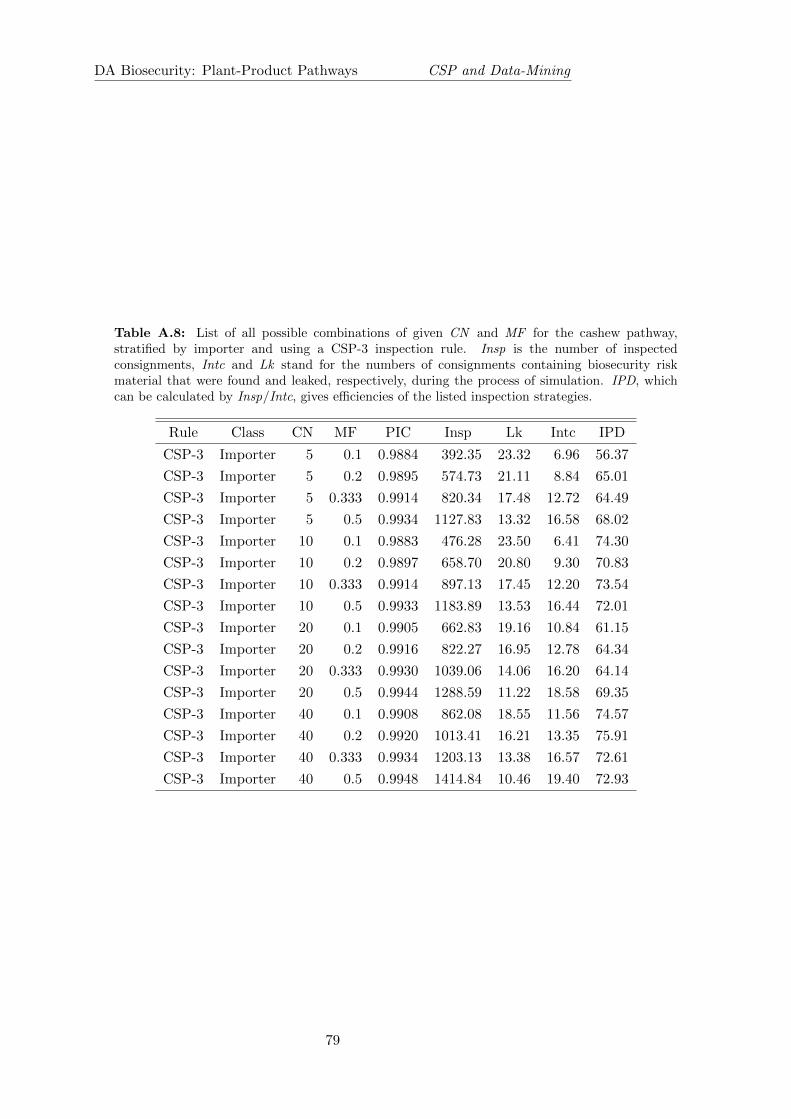
DA Biosecurity: Plant-Product Pathways CSP and Data-Mining
Table A.8: List of all possible combinations of given CN and MF for the cashew pathway,stratified by importer and using a CSP-3 inspection rule. Insp is the number of inspectedconsignments, Intc and Lk stand for the numbers of consignments containing biosecurity riskmaterial that were found and leaked, respectively, during the process of simulation. IPD, whichcan be calculated by Insp/Intc, gives efficiencies of the listed inspection strategies.
Rule Class CN MF PIC Insp Lk Intc IPD
CSP-3 Importer 5 0.1 0.9884 392.35 23.32 6.96 56.37
CSP-3 Importer 5 0.2 0.9895 574.73 21.11 8.84 65.01
CSP-3 Importer 5 0.333 0.9914 820.34 17.48 12.72 64.49
CSP-3 Importer 5 0.5 0.9934 1127.83 13.32 16.58 68.02
CSP-3 Importer 10 0.1 0.9883 476.28 23.50 6.41 74.30
CSP-3 Importer 10 0.2 0.9897 658.70 20.80 9.30 70.83
CSP-3 Importer 10 0.333 0.9914 897.13 17.45 12.20 73.54
CSP-3 Importer 10 0.5 0.9933 1183.89 13.53 16.44 72.01
CSP-3 Importer 20 0.1 0.9905 662.83 19.16 10.84 61.15
CSP-3 Importer 20 0.2 0.9916 822.27 16.95 12.78 64.34
CSP-3 Importer 20 0.333 0.9930 1039.06 14.06 16.20 64.14
CSP-3 Importer 20 0.5 0.9944 1288.59 11.22 18.58 69.35
CSP-3 Importer 40 0.1 0.9908 862.08 18.55 11.56 74.57
CSP-3 Importer 40 0.2 0.9920 1013.41 16.21 13.35 75.91
CSP-3 Importer 40 0.333 0.9934 1203.13 13.38 16.57 72.61
CSP-3 Importer 40 0.5 0.9948 1414.84 10.46 19.40 72.93
79
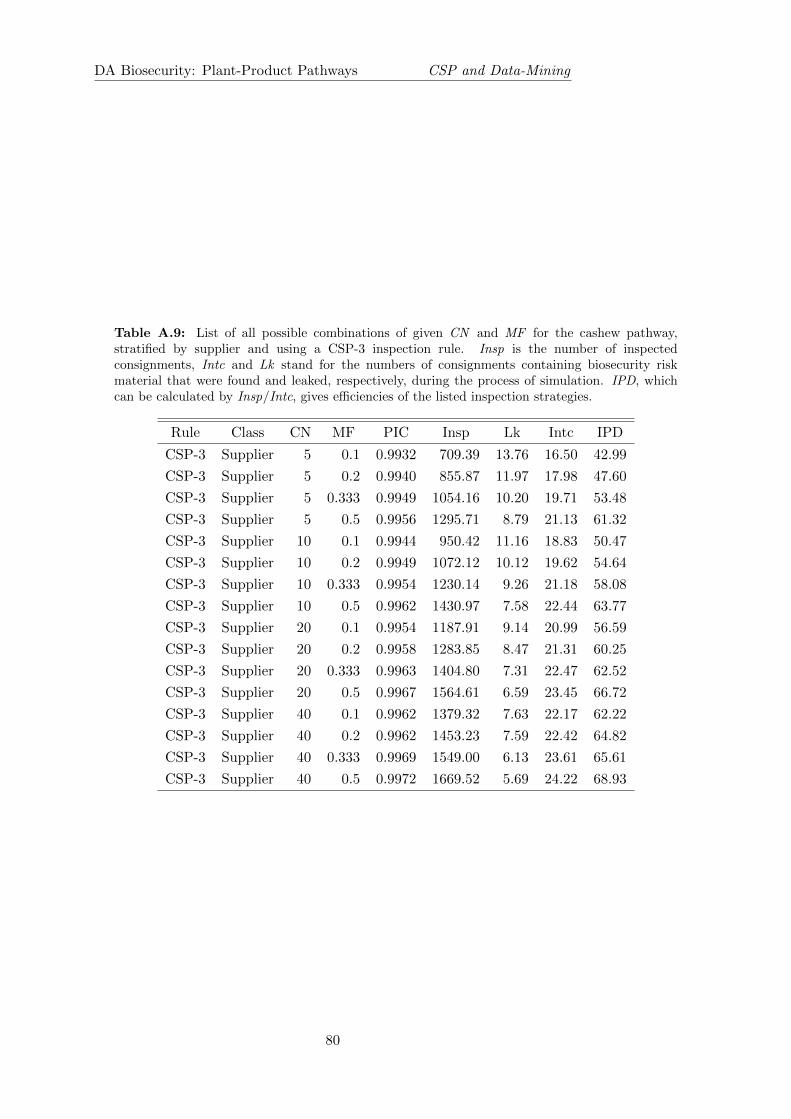
DA Biosecurity: Plant-Product Pathways CSP and Data-Mining
Table A.9: List of all possible combinations of given CN and MF for the cashew pathway,stratified by supplier and using a CSP-3 inspection rule. Insp is the number of inspectedconsignments, Intc and Lk stand for the numbers of consignments containing biosecurity riskmaterial that were found and leaked, respectively, during the process of simulation. IPD, whichcan be calculated by Insp/Intc, gives efficiencies of the listed inspection strategies.
Rule Class CN MF PIC Insp Lk Intc IPD
CSP-3 Supplier 5 0.1 0.9932 709.39 13.76 16.50 42.99
CSP-3 Supplier 5 0.2 0.9940 855.87 11.97 17.98 47.60
CSP-3 Supplier 5 0.333 0.9949 1054.16 10.20 19.71 53.48
CSP-3 Supplier 5 0.5 0.9956 1295.71 8.79 21.13 61.32
CSP-3 Supplier 10 0.1 0.9944 950.42 11.16 18.83 50.47
CSP-3 Supplier 10 0.2 0.9949 1072.12 10.12 19.62 54.64
CSP-3 Supplier 10 0.333 0.9954 1230.14 9.26 21.18 58.08
CSP-3 Supplier 10 0.5 0.9962 1430.97 7.58 22.44 63.77
CSP-3 Supplier 20 0.1 0.9954 1187.91 9.14 20.99 56.59
CSP-3 Supplier 20 0.2 0.9958 1283.85 8.47 21.31 60.25
CSP-3 Supplier 20 0.333 0.9963 1404.80 7.31 22.47 62.52
CSP-3 Supplier 20 0.5 0.9967 1564.61 6.59 23.45 66.72
CSP-3 Supplier 40 0.1 0.9962 1379.32 7.63 22.17 62.22
CSP-3 Supplier 40 0.2 0.9962 1453.23 7.59 22.42 64.82
CSP-3 Supplier 40 0.333 0.9969 1549.00 6.13 23.61 65.61
CSP-3 Supplier 40 0.5 0.9972 1669.52 5.69 24.22 68.93
80

DA Biosecurity: Plant-Product Pathways CSP and Data-Mining
Number of Consignments Inspected
Pos
t−In
terv
entio
n C
ompl
ianc
e (%
)
98.8
99.0
99.2
99.4
99.6
98.8
99.0
99.2
99.4
99.6
98.8
99.0
99.2
99.4
99.6
98.8
99.0
99.2
99.4
99.6
CSP−1
●
●
●
●
●
●
●
●
●
●
●
●
●
●
●
●
0 500 1000 1500 2000
CSP−3
●
●
●
●
●
●
●
●
●
●
●
●
●
●
●
●
0 500 1000 1500 2000
Nil
Country
Importer
Supplier
Clearance Number● 5 10 20 40
Monitoring Fraction
● 0.1 ● 0.2 ● 0.333 ● 0.5
Figure A.3: Simulated Post-Intervention Compliance (PIC) against inspection effort for cashewinspection history. The inspection strategies are in columns, and the stratification options are inrows. Within each panel, the sampling fraction is delineated by symbol colour, and the clearancenumber is delineated by the symbol shape. Approximation 95% confidence interval for the meanof simulation results are delineated by the vertical line. The grey line represents the expected PICthat would result from random sampling.
81
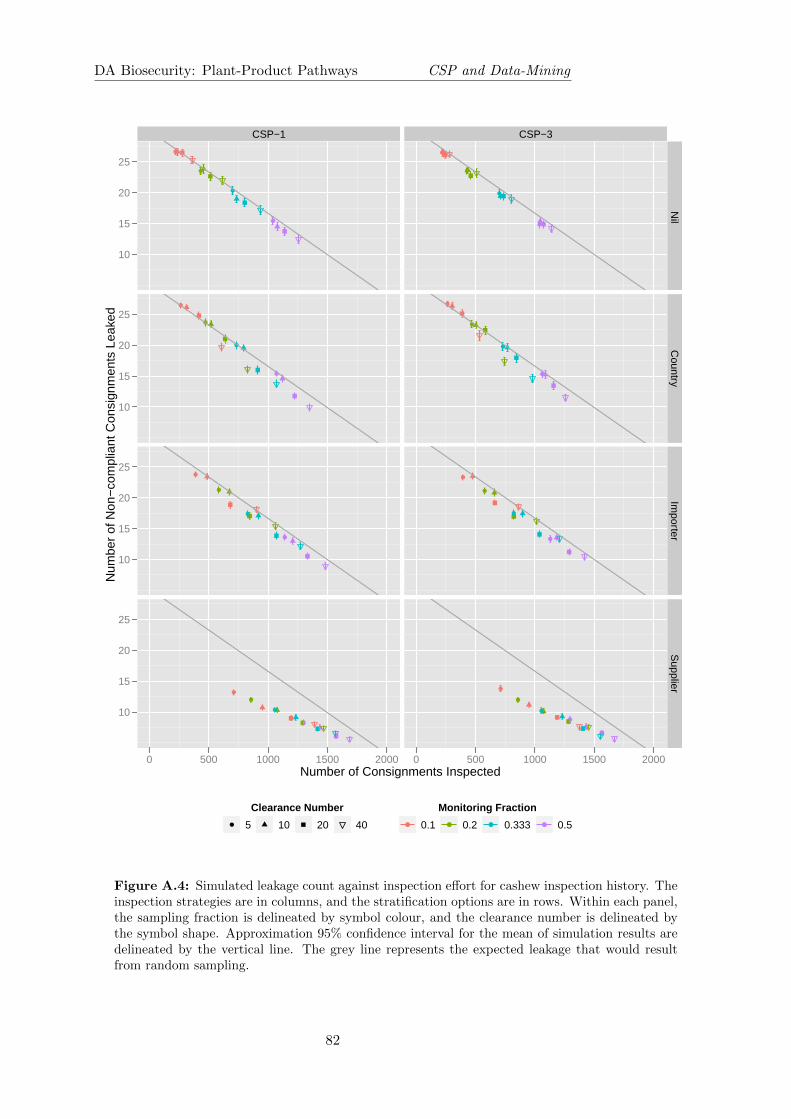
DA Biosecurity: Plant-Product Pathways CSP and Data-Mining
Number of Consignments Inspected
Num
ber
of N
on−
com
plia
nt C
onsi
gnm
ents
Lea
ked
10
15
20
25
10
15
20
25
10
15
20
25
10
15
20
25
CSP−1
●
●
●
●
●
●
●
●
●
●
●
●
●
●
●
●
0 500 1000 1500 2000
CSP−3
●
●
●
●
●
●
●
●
●
●
●
●
●
●
●
●
0 500 1000 1500 2000
Nil
Country
Importer
Supplier
Clearance Number● 5 10 20 40
Monitoring Fraction
● 0.1 ● 0.2 ● 0.333 ● 0.5
Figure A.4: Simulated leakage count against inspection effort for cashew inspection history. Theinspection strategies are in columns, and the stratification options are in rows. Within each panel,the sampling fraction is delineated by symbol colour, and the clearance number is delineated bythe symbol shape. Approximation 95% confidence interval for the mean of simulation results aredelineated by the vertical line. The grey line represents the expected leakage that would resultfrom random sampling.
82
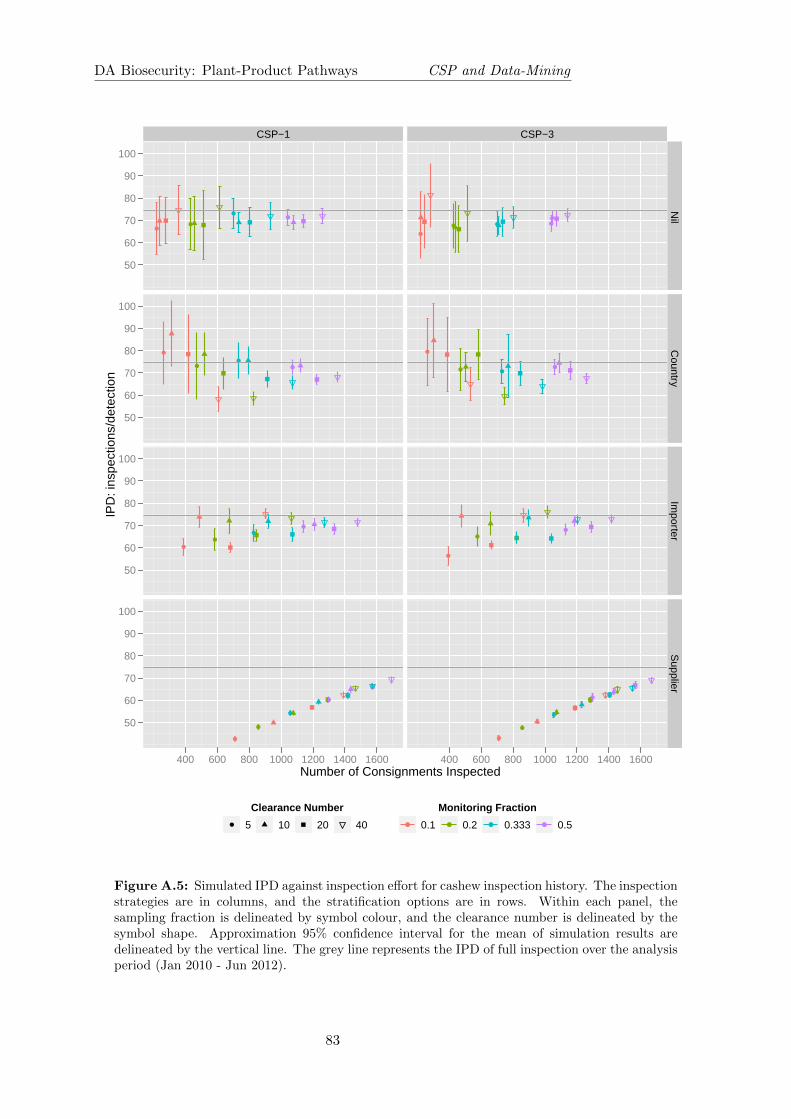
DA Biosecurity: Plant-Product Pathways CSP and Data-Mining
Number of Consignments Inspected
IPD
: ins
pect
ions
/det
ectio
n
50
60
70
80
90
100
50
60
70
80
90
100
50
60
70
80
90
100
50
60
70
80
90
100
CSP−1
●●
●●
●
●
●
●
●
●
●
●
●
●
●
●
400 600 800 1000 1200 1400 1600
CSP−3
●
● ● ●
●
● ●●
●
● ●
●
●
●
●
●
400 600 800 1000 1200 1400 1600
Nil
Country
Importer
Supplier
Clearance Number● 5 10 20 40
Monitoring Fraction
● 0.1 ● 0.2 ● 0.333 ● 0.5
Figure A.5: Simulated IPD against inspection effort for cashew inspection history. The inspectionstrategies are in columns, and the stratification options are in rows. Within each panel, thesampling fraction is delineated by symbol colour, and the clearance number is delineated by thesymbol shape. Approximation 95% confidence interval for the mean of simulation results aredelineated by the vertical line. The grey line represents the IPD of full inspection over the analysisperiod (Jan 2010 - Jun 2012).
83
Appendix B
Updated Analysis of Imported PlantPathways on Current Dashboard
Summary: Previous ACERA work [2] applied CSPs (Continuous Sampling Plans) to greencoffee beans, dried apricots, dried dates and hulled sesame seeds with a focus on PIC (PostIntervention Compliance) and stratification by supplier. Here we reanalyse these pathwaysapplying the broader focus of absolute leakage and inspections per detection (IPD) as introducedin Chapter 2 of this report. We also stratify by importer, which is being considered by thedepartment for implementation.
For dried apricots, the failure rate was very low at about 0.5% over 2.5 years (July 2008 -December 2010). Over that period 4 quarantine failures were detected with an IPD of about219. For CSP-1 and CSP-3 when stratified by importer there was a relative small spread ofleakage across the different clearance (CN) and monitoring MF rates, and a larger spread ofIPD, meaning you could focus on IPD without having a large effect on absolute leakage. Absoluteleakage was reduced to around 1 - 1.5, while IPD could be down around 100.
For green coffee beans, the failure rate was 2.3% over the 2.5 years. Over the period 64 quarantinefailures were detected with an IPD of about 44. There was no benefit of stratifying by importerand applying a CSP relative to random sampling with the same effort. For some sampling ratesleakage was actually higher than with random sampling. IPD was also generally higher than thefull inspection case (Figure B.9), but some rates produced IPDs similar to the full inspectioncase. For example, ACN of 40 combined with an MF of 0.5 would produce a similar IPD withfewer inspections, but at the expense of higher leakage.
For hulled sesame seeds, the failure rate was low at about 0.8% over the 2.5 years. Over thatperiod 3 quarantine failures were detected with an IPD of about 145. CN values of 5 tended toproduce lower leakages compared with random sampling with the same effort. The lowest IPDsof 70 - 80 were obtained with CN = 5 and MF = 0.1, but with these rates “most” of the verysmall number of non-compliant consignments were leaked.
For dried dates, the failure rate was about 1.1% over the 2.5 years. Over the period 5 quarantinefailures were detected with an IPD of about 91. Results obtained with CSP-1 and CSP-3 weresimilar, with leakage showing a tradeoff against CN for high rates of MF , but less of a tradeofffor lower rates of MF . For example, with an MF of 0.1, CN of 5, 10 and 20 produced similarabsolute leakage. At the same time these rates showed reasonable large variation in IPD; IPDsranged from around 50 to 85. For CSP-3, CN = 5 and MF = 0.1 achieved the lowest IPD of
84

DA Biosecurity: Plant-Product Pathways CSP and Data-Mining
54 with a leakage of about 2.
Overall our results show different tradeoffs need to be made for the different pathways. Pathwaymanagers should consult the full analysis presented here for each pathway when deciding whichsampling rates should be implemented in practice.
B.1 Background
In this appendix we reanalyse pathways that were analysed in previous ACERA work [2],applying the additional criterion of IPD and including the more explicit consideration of leakage.In the earlier work inspection outcomes were considered simulating different members of the CSPfamily (particularly CSP-1, CSP-2 and CSP-3), different combinations of CN and MF anddifferent stratifications, namely free of stratification and stratifications by suppliers, countriesand a combination of countries and suppliers. Initially, stratification by suppliers was beingconsidered by the department as the best strategy to implement. Now the department isconsidering importers as a stratification option and we include that stratification here. Weanalyse Dried Apricots, Green Coffee Beans, Hulled Sesame Seeds and Dried Dates using CSP-1,CSP-2 and CSP-3, to allow full comparison with previous work, but we focus our discussion onCSP-1 and CSP-3.
B.2 Methods
Analyses were carried out as described in Chapter 2. The full time frame of the datasets wereall between October 2005 to December 2010 and we divided the burn-in and post-burn periodsby the date 1 July 2008, i.e., the burn-in period of the pathways were from October 2005 to 30June 2008 and the post-burn period from 1 July 2008 to 31 December 2010.
Simulations were carried out using a HP-Z600 with 12 cores and a 32 bit Windows 7 operatingsystem. To further speed up the simulations, we adopted two methods: (i). parallel computationusing the function “parlapply()” in the R package of “parallel”; (ii). simplifying the datasets thatwere imported in every simulation by keeping only the variables related to the calculations.These methods have made the simulations much more efficient. For example, for the pathwayof apricots, the current simulation time was less than 3 hours compared with about 24 hours forprevious simulations with an old computer and with single core computation.
B.3 Dried apricots
B.3.1 Pathway characteristics
A flowchart of the pathway of dried apricots pathway is presented in Figure B.1. This pathwayhad a very low failure rate.
Comparing the flow chart Figure B.1 with ACERA’s report [2], one sees that the numbers ofconsignments and suppliers are different, i.e., Figure B.1 shows that the numbers are 874 and135, respectively, while in ACERA’s report they were 916 and 119. For consignments, we foundthat in ACERA’s original code, some duplicated consignments were not merged (see Sect 2.1).For the suppliers, we used the supplier codes to identify suppliers, while ACERA used supplier
85

DA Biosecurity: Plant-Product Pathways CSP and Data-Mining
108 ImportersDried
Apricots
17 Countries
135 Suppliers
Inspection
PassQuarantine
Fail
874 Consignments
870
(99.5%)
4
(0.5%)
Figure B.1: Dried apricots consignments flow chart with statistics for July 2008–December 2010.A quarantine failure was recorded for consignments with a detection of quarantine concern, suchas insect, pathogen, or contamination.
names. In the dataset, some suppliers used very similar names, e.g. “AK IMPEX” and “AKIMPEX TARIM VE SANAYI”. When ACERA cleaned the data, they were considered to be onesupplier. However, supplier codes indicated that they are actually different suppliers, e.g. thesupplier code of “AK IMPEX” was “CCG3466366W” while “AK IMPEX TARIM VE SANAYI”was “CCE9647697T”.
B.3.2 Simulation Results
The simulation results of the pathway are presented in Tables B.1 - B.4 and in Figures B.2 - B.4.In this simulation, we set inspection effectiveness to be 0.90. Figure B.2 provides the averagesimulated PIC as a function of inspection strategy (CSP rule and stratification) for a range ofoptions (CN and MF ). Figure B.3 shows leakage and Figure B.4 shows IPD. The grey lineshows the expected trade-off for random monitoring, and may be used as a baseline to assessthe improvement resulting from selecting a CSP strategy. The maximum PIC is achieved withfull sampling and is
PICmax =v − (Fobserved/e− Fobserved)
v=
874− (4/0.9− 4)
874≈ 0.9995,
where the number of total and failed consignments during the analysis period were given inthe flowchart (Figure B.1). The minimal leakage of the pathway was 4/0.9 − 4 ≈ 0.4, with amaximum leakage of 4.4. A 99% PIC would correspond to a leakage of 874 − 874 × 0.99 ≈ 9.The “IPD” over 2.5 years is 874/4 ≈ 219 inspections per interception.
Next, we discuss the simulation results by stratification. Here we focus on the stratificationvariables of importer and supplier, which are currently being considered by the department. Wealso show figures for stratification by country for consistency with previous reports, but do notdiscuss these results in the text.
86
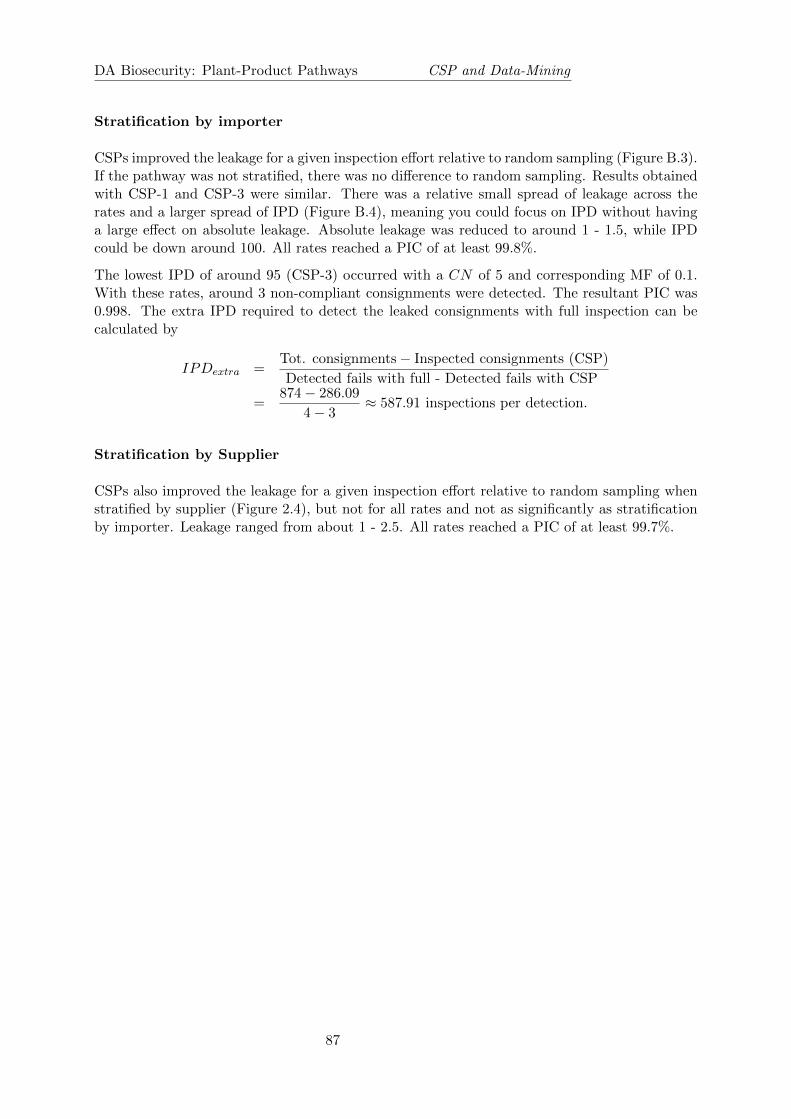
DA Biosecurity: Plant-Product Pathways CSP and Data-Mining
Stratification by importer
CSPs improved the leakage for a given inspection effort relative to random sampling (Figure B.3).If the pathway was not stratified, there was no difference to random sampling. Results obtainedwith CSP-1 and CSP-3 were similar. There was a relative small spread of leakage across therates and a larger spread of IPD (Figure B.4), meaning you could focus on IPD without havinga large effect on absolute leakage. Absolute leakage was reduced to around 1 - 1.5, while IPDcould be down around 100. All rates reached a PIC of at least 99.8%.
The lowest IPD of around 95 (CSP-3) occurred with a CN of 5 and corresponding MF of 0.1.With these rates, around 3 non-compliant consignments were detected. The resultant PIC was0.998. The extra IPD required to detect the leaked consignments with full inspection can becalculated by
IPDextra =Tot. consignments− Inspected consignments (CSP)
Detected fails with full - Detected fails with CSP
=874− 286.09
4− 3≈ 587.91 inspections per detection.
Stratification by Supplier
CSPs also improved the leakage for a given inspection effort relative to random sampling whenstratified by supplier (Figure 2.4), but not for all rates and not as significantly as stratificationby importer. Leakage ranged from about 1 - 2.5. All rates reached a PIC of at least 99.7%.
87

DA Biosecurity: Plant-Product Pathways CSP and Data-Mining
Table B.1: List of all possible combinations of given CN and MF for the dried apricot pathway,stratified by importer and using a CSP-1 inspection rule. Insp is the number of inspectedconsignments, Intc and Lk stand for the numbers of consignments containing biosecurity riskmaterial that were found and leaked, respectively, during the process of simulation. IPD, whichcan be calculated by Insp/Intc, gives efficiencies of the listed inspection strategies.
Rule Class CN MF PIC Insp Lk Intc IPD
CSP-1 Importer 5 0.1 0.9982 285.05 1.58 2.98 95.65
CSP-1 Importer 5 0.2 0.9983 351.39 1.47 3.18 110.50
CSP-1 Importer 5 0.333 0.9987 439.62 1.16 3.36 130.84
CSP-1 Importer 5 0.5 0.9988 550.63 1.08 3.55 155.11
CSP-1 Importer 10 0.1 0.9984 375.19 1.43 3.03 123.83
CSP-1 Importer 10 0.2 0.9982 431.58 1.53 3.05 141.50
CSP-1 Importer 10 0.333 0.9985 504.34 1.33 3.28 153.76
CSP-1 Importer 10 0.5 0.9987 597.71 1.12 3.38 176.84
CSP-1 Importer 20 0.1 0.9982 475.97 1.53 3.08 154.54
CSP-1 Importer 20 0.2 0.9983 521.95 1.46 3.12 167.29
CSP-1 Importer 20 0.333 0.9985 583.36 1.28 3.34 174.66
CSP-1 Importer 20 0.5 0.9986 656.41 1.18 3.64 180.33
CSP-1 Importer 40 0.1 0.9983 570.80 1.47 2.99 190.90
CSP-1 Importer 40 0.2 0.9985 604.84 1.30 3.31 182.73
CSP-1 Importer 40 0.333 0.9986 653.10 1.22 3.47 188.21
CSP-1 Importer 40 0.5 0.9988 707.55 1.07 3.55 199.31
88

DA Biosecurity: Plant-Product Pathways CSP and Data-Mining
Table B.2: List of all possible combinations of given CN and MF for the dried apricot pathway,stratified by supplier and using a CSP-1 inspection rule. Insp is the number of inspectedconsignments, Intc and Lk stand for the numbers of consignments containing biosecurity riskmaterial that were found and leaked, respectively, during the process of simulation. IPD, whichcan be calculated by Insp/Intc, gives efficiencies of the listed inspection strategies.
Rule Class CN MF PIC Insp Lk Intc IPD
CSP-1 Supplier 5 0.1 0.9973 347.78 2.38 2.27 153.21
CSP-1 Supplier 5 0.2 0.9975 408.69 2.15 2.49 164.13
CSP-1 Supplier 5 0.333 0.9978 485.29 1.91 2.73 177.76
CSP-1 Supplier 5 0.5 0.9983 581.96 1.51 2.97 195.95
CSP-1 Supplier 10 0.1 0.9980 471.79 1.73 2.88 163.82
CSP-1 Supplier 10 0.2 0.9982 516.45 1.53 3.08 167.68
CSP-1 Supplier 10 0.333 0.9986 577.47 1.22 3.27 176.60
CSP-1 Supplier 10 0.5 0.9988 653.88 1.08 3.51 186.29
CSP-1 Supplier 20 0.1 0.9984 597.42 1.43 3.15 189.66
CSP-1 Supplier 20 0.2 0.9984 627.71 1.36 3.12 201.19
CSP-1 Supplier 20 0.333 0.9987 670.60 1.16 3.50 191.60
CSP-1 Supplier 20 0.5 0.9989 722.20 0.93 3.53 204.59
CSP-1 Supplier 40 0.1 0.9984 679.68 1.42 3.12 217.85
CSP-1 Supplier 40 0.2 0.9986 701.88 1.21 3.31 212.05
CSP-1 Supplier 40 0.333 0.9987 731.40 1.14 3.41 214.49
CSP-1 Supplier 40 0.5 0.9988 770.35 1.07 3.49 220.73
89
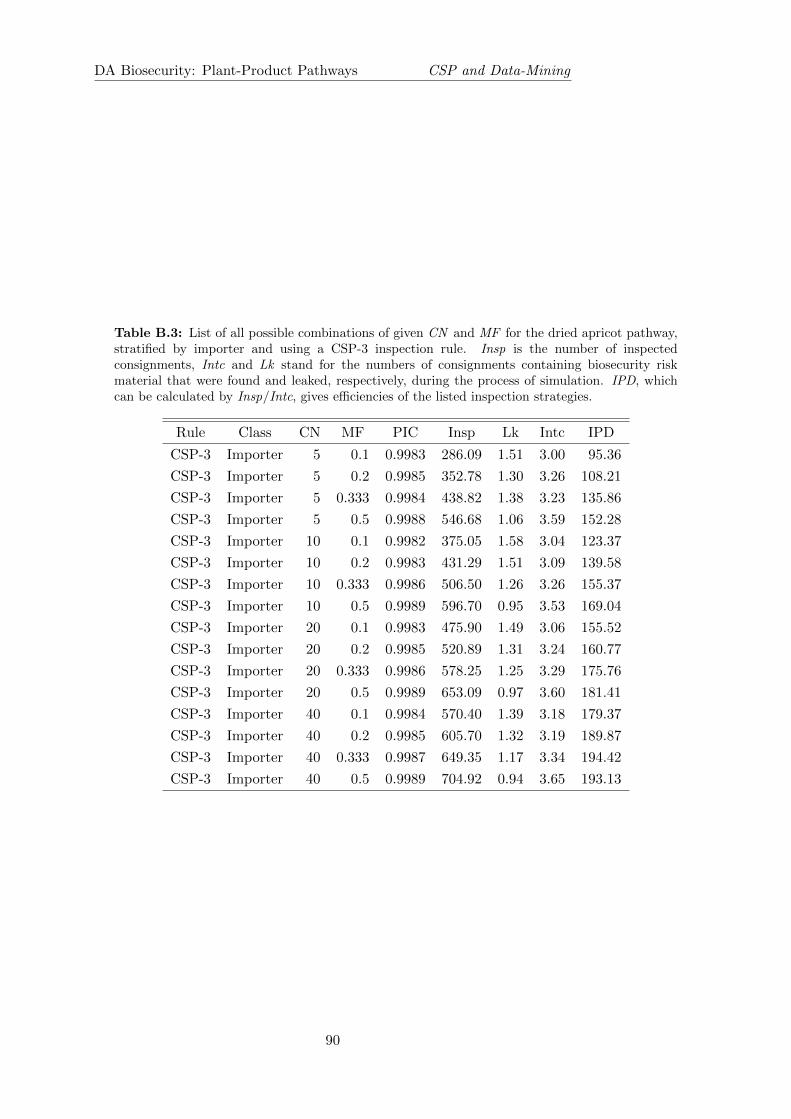
DA Biosecurity: Plant-Product Pathways CSP and Data-Mining
Table B.3: List of all possible combinations of given CN and MF for the dried apricot pathway,stratified by importer and using a CSP-3 inspection rule. Insp is the number of inspectedconsignments, Intc and Lk stand for the numbers of consignments containing biosecurity riskmaterial that were found and leaked, respectively, during the process of simulation. IPD, whichcan be calculated by Insp/Intc, gives efficiencies of the listed inspection strategies.
Rule Class CN MF PIC Insp Lk Intc IPD
CSP-3 Importer 5 0.1 0.9983 286.09 1.51 3.00 95.36
CSP-3 Importer 5 0.2 0.9985 352.78 1.30 3.26 108.21
CSP-3 Importer 5 0.333 0.9984 438.82 1.38 3.23 135.86
CSP-3 Importer 5 0.5 0.9988 546.68 1.06 3.59 152.28
CSP-3 Importer 10 0.1 0.9982 375.05 1.58 3.04 123.37
CSP-3 Importer 10 0.2 0.9983 431.29 1.51 3.09 139.58
CSP-3 Importer 10 0.333 0.9986 506.50 1.26 3.26 155.37
CSP-3 Importer 10 0.5 0.9989 596.70 0.95 3.53 169.04
CSP-3 Importer 20 0.1 0.9983 475.90 1.49 3.06 155.52
CSP-3 Importer 20 0.2 0.9985 520.89 1.31 3.24 160.77
CSP-3 Importer 20 0.333 0.9986 578.25 1.25 3.29 175.76
CSP-3 Importer 20 0.5 0.9989 653.09 0.97 3.60 181.41
CSP-3 Importer 40 0.1 0.9984 570.40 1.39 3.18 179.37
CSP-3 Importer 40 0.2 0.9985 605.70 1.32 3.19 189.87
CSP-3 Importer 40 0.333 0.9987 649.35 1.17 3.34 194.42
CSP-3 Importer 40 0.5 0.9989 704.92 0.94 3.65 193.13
90

DA Biosecurity: Plant-Product Pathways CSP and Data-Mining
Table B.4: List of all possible combinations of given CN and MF for the dried apricot pathway,stratified by supplier and using a CSP-3 inspection rule. Insp is the number of inspectedconsignments, Intc and Lk stand for the numbers of consignments containing biosecurity riskmaterial that were found and leaked, respectively, during the process of simulation. IPD, whichcan be calculated by Insp/Intc, gives efficiencies of the listed inspection strategies.
Rule Class CN MF PIC Insp Lk Intc IPD
CSP-3 Supplier 5 0.1 0.9973 349.31 2.34 2.23 156.64
CSP-3 Supplier 5 0.2 0.9976 406.91 2.12 2.50 162.76
CSP-3 Supplier 5 0.333 0.9977 485.16 2.04 2.35 206.45
CSP-3 Supplier 5 0.5 0.9983 584.63 1.48 3.14 186.19
CSP-3 Supplier 10 0.1 0.9981 471.41 1.64 3.00 157.14
CSP-3 Supplier 10 0.2 0.9984 516.29 1.37 3.17 162.87
CSP-3 Supplier 10 0.333 0.9985 575.00 1.28 3.30 174.24
CSP-3 Supplier 10 0.5 0.9987 651.96 1.12 3.47 187.88
CSP-3 Supplier 20 0.1 0.9985 597.58 1.31 3.19 187.33
CSP-3 Supplier 20 0.2 0.9984 627.56 1.38 3.19 196.73
CSP-3 Supplier 20 0.333 0.9986 669.38 1.25 3.25 205.96
CSP-3 Supplier 20 0.5 0.9987 720.17 1.12 3.43 209.96
CSP-3 Supplier 40 0.1 0.9983 678.77 1.48 3.11 218.25
CSP-3 Supplier 40 0.2 0.9985 702.12 1.31 3.34 210.22
CSP-3 Supplier 40 0.333 0.9986 730.36 1.24 3.44 212.31
CSP-3 Supplier 40 0.5 0.9989 766.25 0.94 3.68 208.22
91
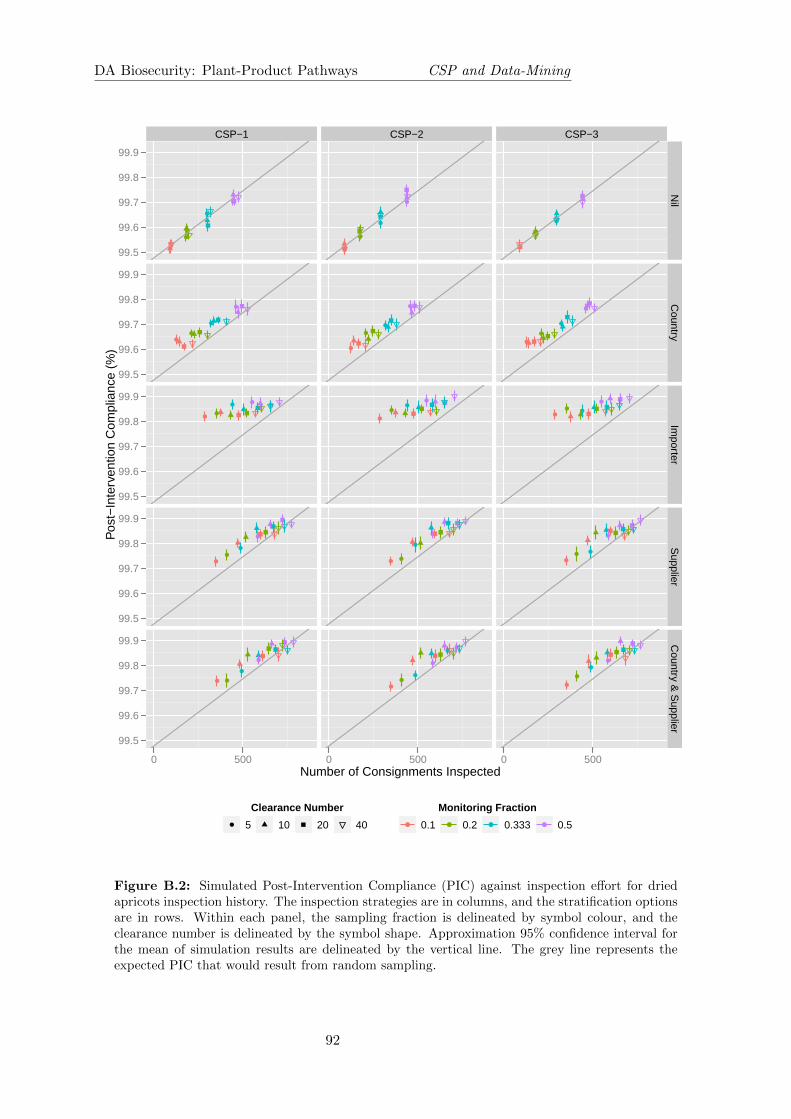
DA Biosecurity: Plant-Product Pathways CSP and Data-Mining
Number of Consignments Inspected
Pos
t−In
terv
entio
n C
ompl
ianc
e (%
)
99.5
99.6
99.7
99.8
99.9
99.5
99.6
99.7
99.8
99.9
99.5
99.6
99.7
99.8
99.9
99.5
99.6
99.7
99.8
99.9
99.5
99.6
99.7
99.8
99.9
CSP−1
●
●
●
●
●
●
●
●
●●
●●
●
●
●
●
● ●
●
●
0 500
CSP−2
●
●
●
●
●
●
●
●
●
●●
●
●●
●
●
●
●●
●
0 500
CSP−3
●
●
●
●
●
●
●
●
●
●●
●
●
●●
●
●
●
●
●
0 500
Nil
Country
Importer
Supplier
Country &
Supplier
Clearance Number● 5 10 20 40
Monitoring Fraction
● 0.1 ● 0.2 ● 0.333 ● 0.5
Figure B.2: Simulated Post-Intervention Compliance (PIC) against inspection effort for driedapricots inspection history. The inspection strategies are in columns, and the stratification optionsare in rows. Within each panel, the sampling fraction is delineated by symbol colour, and theclearance number is delineated by the symbol shape. Approximation 95% confidence interval forthe mean of simulation results are delineated by the vertical line. The grey line represents theexpected PIC that would result from random sampling.
92

DA Biosecurity: Plant-Product Pathways CSP and Data-Mining
Number of Consignments Inspected
Num
ber
of N
on−
com
plia
nt C
onsi
gnm
ents
Lea
ked
1.01.52.02.53.03.54.0
1.01.52.02.53.03.54.0
1.01.52.02.53.03.54.0
1.01.52.02.53.03.54.0
1.01.52.02.53.03.54.0
CSP−1
●
●
●
●
●
●
●
●
●●
●●
●
●
●
●
● ●
●
●
0 500
CSP−2
●
●
●
●
●
●
●
●
●
●●
●
●●
●
●
●
●●
●
0 500
CSP−3
●
●
●
●
●
●
●
●
●
●●
●
●
●●
●
●
●
●
●
0 500
Nil
Country
Importer
Supplier
Country &
Supplier
Clearance Number● 5 10 20 40
Monitoring Fraction
● 0.1 ● 0.2 ● 0.333 ● 0.5
Figure B.3: Simulated leakage count against inspection effort for dried apricots inspection history.The inspection strategies are in columns, and the stratification options are in rows. Within eachpanel, the sampling fraction is delineated by symbol colour, and the clearance number is delineatedby the symbol shape. Approximation 95% confidence interval for the mean of simulation resultsare delineated by the vertical line. The grey line represents the expected leakage that would resultfrom random sampling.
93

DA Biosecurity: Plant-Product Pathways CSP and Data-Mining
Number of Consignments Inspected
IPD
: ins
pect
ions
/det
ectio
n
100
150
200
250
100
150
200
250
100
150
200
250
100
150
200
250
100
150
200
250
CSP−1
●
● ●
●
●
●
●
●
●
●
●
●
●
●
●
●
●
●●
●
100 200 300 400 500 600 700
CSP−2
●
●
●
●
●
●
●
●
●●
●
●
●
● ●●
●
●
● ●
100 200 300 400 500 600 700
CSP−3
●
●
●
●
●
●
●
●
●
●
●
●
●●
●
●
●●
●
●
100 200 300 400 500 600 700
Nil
Country
Importer
Supplier
Country &
Supplier
Clearance Number● 5 10 20 40
Monitoring Fraction
● 0.1 ● 0.2 ● 0.333 ● 0.5
Figure B.4: Simulated IPD against inspection effort for dried apricot inspection history. Theinspection strategies are in columns, and the stratification options are in rows. Within each panel,the sampling fraction is delineated by symbol colour, and the clearance number is delineated bythe symbol shape. Approximation 95% confidence interval for the mean of simulation results aredelineated by the vertical line. The grey line represents the IPD of full inspection over the analysisperiod (July 2008 - December 2010).
94
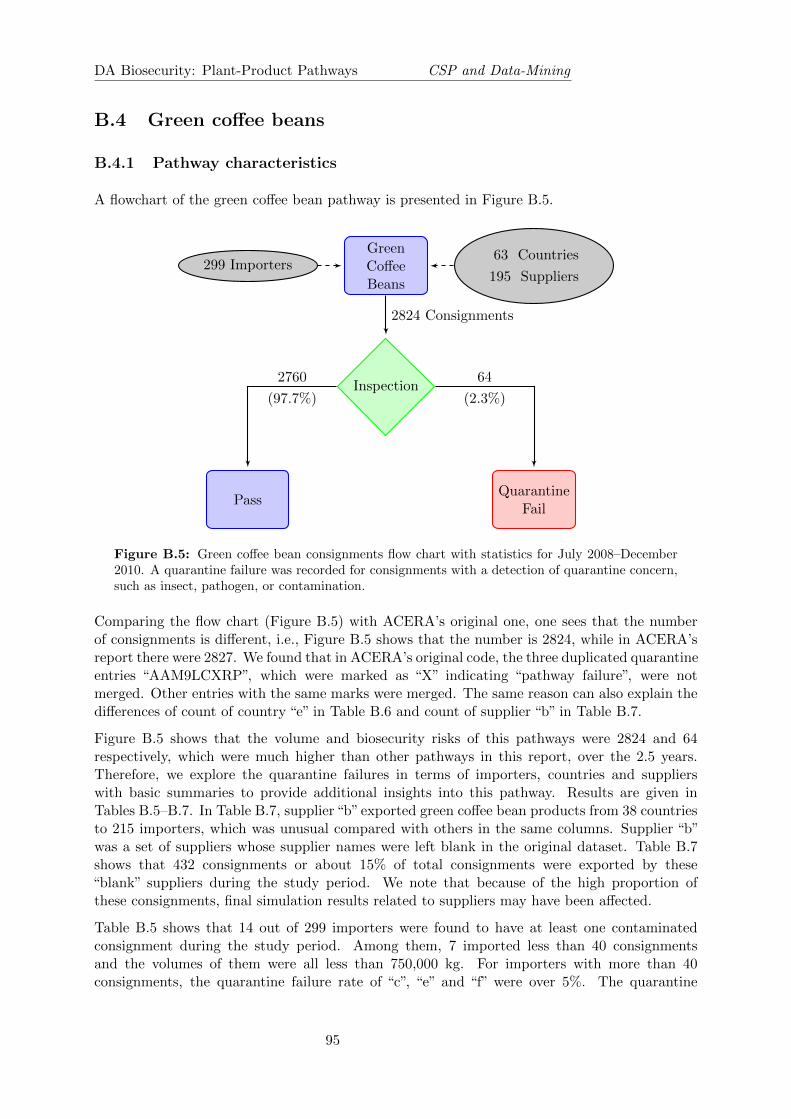
DA Biosecurity: Plant-Product Pathways CSP and Data-Mining
B.4 Green coffee beans
B.4.1 Pathway characteristics
A flowchart of the green coffee bean pathway is presented in Figure B.5.
299 ImportersGreenCoffeeBeans
63 Countries
195 Suppliers
Inspection
PassQuarantine
Fail
2824 Consignments
2760
(97.7%)
64
(2.3%)
Figure B.5: Green coffee bean consignments flow chart with statistics for July 2008–December2010. A quarantine failure was recorded for consignments with a detection of quarantine concern,such as insect, pathogen, or contamination.
Comparing the flow chart (Figure B.5) with ACERA’s original one, one sees that the numberof consignments is different, i.e., Figure B.5 shows that the number is 2824, while in ACERA’sreport there were 2827. We found that in ACERA’s original code, the three duplicated quarantineentries “AAM9LCXRP”, which were marked as “X” indicating “pathway failure”, were notmerged. Other entries with the same marks were merged. The same reason can also explain thedifferences of count of country “e” in Table B.6 and count of supplier “b” in Table B.7.
Figure B.5 shows that the volume and biosecurity risks of this pathways were 2824 and 64respectively, which were much higher than other pathways in this report, over the 2.5 years.Therefore, we explore the quarantine failures in terms of importers, countries and supplierswith basic summaries to provide additional insights into this pathway. Results are given inTables B.5–B.7. In Table B.7, supplier“b”exported green coffee bean products from 38 countriesto 215 importers, which was unusual compared with others in the same columns. Supplier “b”was a set of suppliers whose supplier names were left blank in the original dataset. Table B.7shows that 432 consignments or about 15% of total consignments were exported by these“blank” suppliers during the study period. We note that because of the high proportion ofthese consignments, final simulation results related to suppliers may have been affected.
Table B.5 shows that 14 out of 299 importers were found to have at least one contaminatedconsignment during the study period. Among them, 7 imported less than 40 consignmentsand the volumes of them were all less than 750,000 kg. For importers with more than 40consignments, the quarantine failure rate of “c”, “e” and “f” were over 5%. The quarantine
95
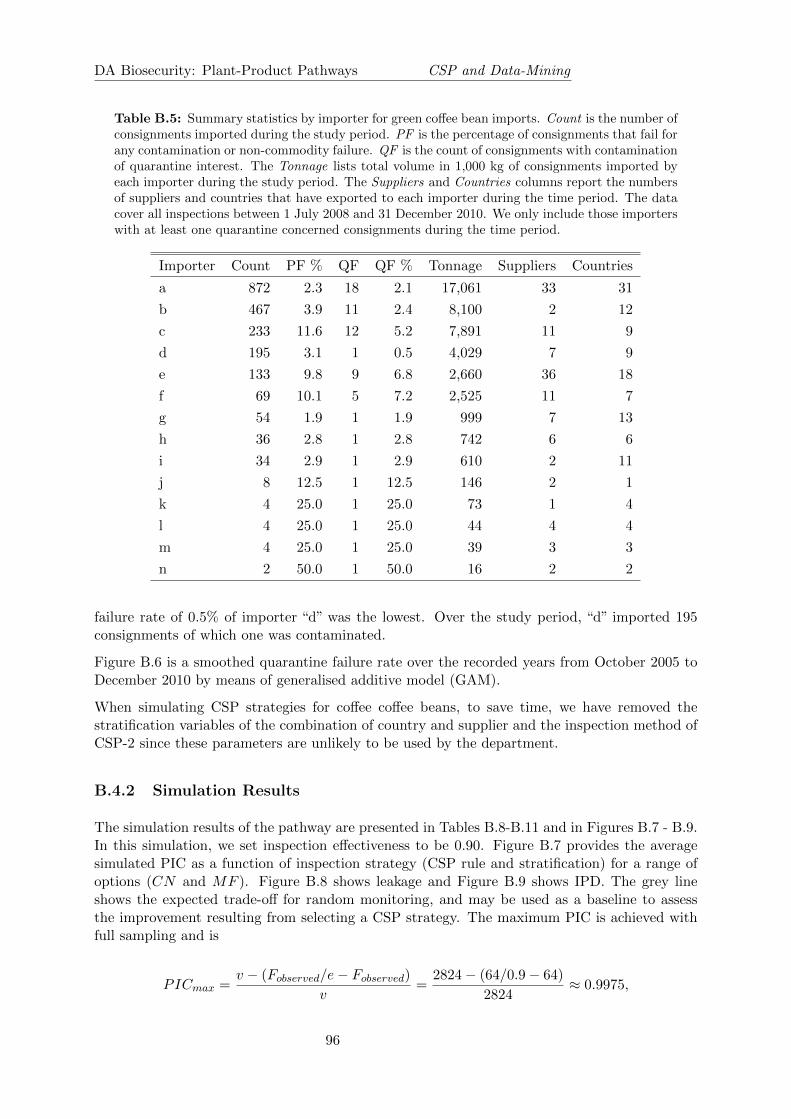
DA Biosecurity: Plant-Product Pathways CSP and Data-Mining
Table B.5: Summary statistics by importer for green coffee bean imports. Count is the number ofconsignments imported during the study period. PF is the percentage of consignments that fail forany contamination or non-commodity failure. QF is the count of consignments with contaminationof quarantine interest. The Tonnage lists total volume in 1,000 kg of consignments imported byeach importer during the study period. The Suppliers and Countries columns report the numbersof suppliers and countries that have exported to each importer during the time period. The datacover all inspections between 1 July 2008 and 31 December 2010. We only include those importerswith at least one quarantine concerned consignments during the time period.
Importer Count PF % QF QF % Tonnage Suppliers Countries
a 872 2.3 18 2.1 17,061 33 31
b 467 3.9 11 2.4 8,100 2 12
c 233 11.6 12 5.2 7,891 11 9
d 195 3.1 1 0.5 4,029 7 9
e 133 9.8 9 6.8 2,660 36 18
f 69 10.1 5 7.2 2,525 11 7
g 54 1.9 1 1.9 999 7 13
h 36 2.8 1 2.8 742 6 6
i 34 2.9 1 2.9 610 2 11
j 8 12.5 1 12.5 146 2 1
k 4 25.0 1 25.0 73 1 4
l 4 25.0 1 25.0 44 4 4
m 4 25.0 1 25.0 39 3 3
n 2 50.0 1 50.0 16 2 2
failure rate of 0.5% of importer “d” was the lowest. Over the study period, “d” imported 195consignments of which one was contaminated.
Figure B.6 is a smoothed quarantine failure rate over the recorded years from October 2005 toDecember 2010 by means of generalised additive model (GAM).
When simulating CSP strategies for coffee coffee beans, to save time, we have removed thestratification variables of the combination of country and supplier and the inspection method ofCSP-2 since these parameters are unlikely to be used by the department.
B.4.2 Simulation Results
The simulation results of the pathway are presented in Tables B.8-B.11 and in Figures B.7 - B.9.In this simulation, we set inspection effectiveness to be 0.90. Figure B.7 provides the averagesimulated PIC as a function of inspection strategy (CSP rule and stratification) for a range ofoptions (CN and MF ). Figure B.8 shows leakage and Figure B.9 shows IPD. The grey lineshows the expected trade-off for random monitoring, and may be used as a baseline to assessthe improvement resulting from selecting a CSP strategy. The maximum PIC is achieved withfull sampling and is
PICmax =v − (Fobserved/e− Fobserved)
v=
2824− (64/0.9− 64)
2824≈ 0.9975,
96
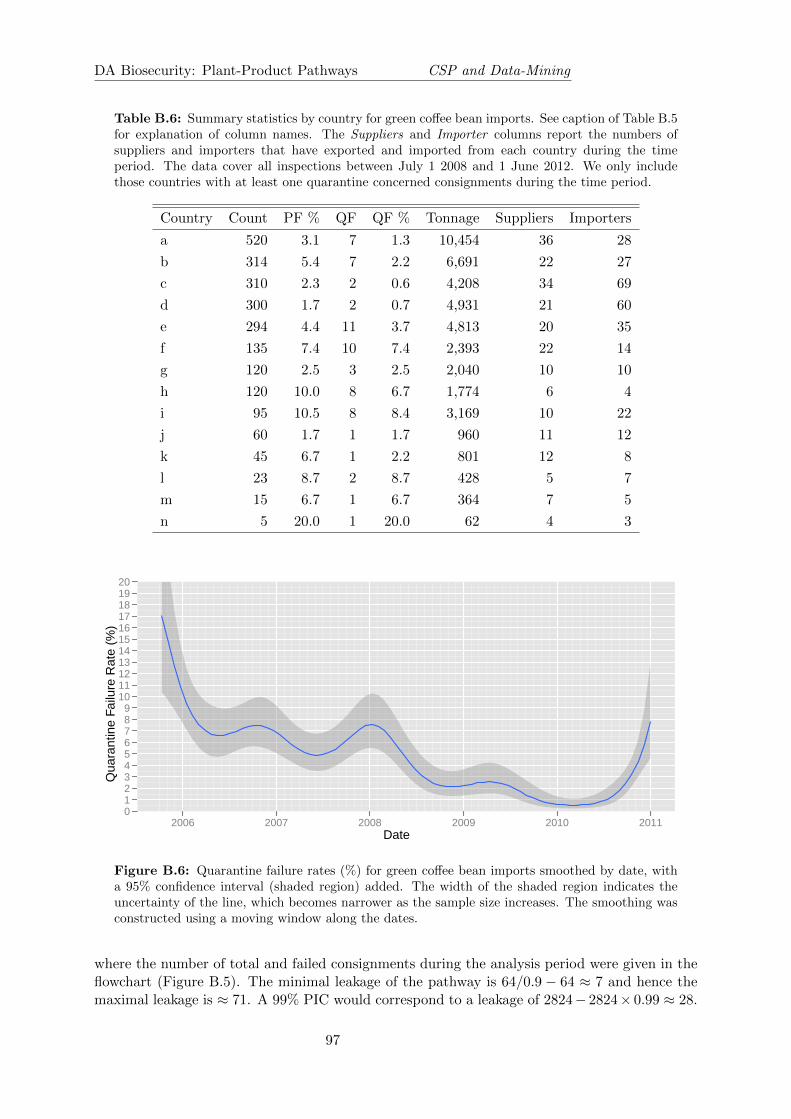
DA Biosecurity: Plant-Product Pathways CSP and Data-Mining
Table B.6: Summary statistics by country for green coffee bean imports. See caption of Table B.5for explanation of column names. The Suppliers and Importer columns report the numbers ofsuppliers and importers that have exported and imported from each country during the timeperiod. The data cover all inspections between July 1 2008 and 1 June 2012. We only includethose countries with at least one quarantine concerned consignments during the time period.
Country Count PF % QF QF % Tonnage Suppliers Importers
a 520 3.1 7 1.3 10,454 36 28
b 314 5.4 7 2.2 6,691 22 27
c 310 2.3 2 0.6 4,208 34 69
d 300 1.7 2 0.7 4,931 21 60
e 294 4.4 11 3.7 4,813 20 35
f 135 7.4 10 7.4 2,393 22 14
g 120 2.5 3 2.5 2,040 10 10
h 120 10.0 8 6.7 1,774 6 4
i 95 10.5 8 8.4 3,169 10 22
j 60 1.7 1 1.7 960 11 12
k 45 6.7 1 2.2 801 12 8
l 23 8.7 2 8.7 428 5 7
m 15 6.7 1 6.7 364 7 5
n 5 20.0 1 20.0 62 4 3
Date
Qua
rant
ine
Failu
re R
ate
(%)
0123456789
1011121314151617181920
2006 2007 2008 2009 2010 2011
Figure B.6: Quarantine failure rates (%) for green coffee bean imports smoothed by date, witha 95% confidence interval (shaded region) added. The width of the shaded region indicates theuncertainty of the line, which becomes narrower as the sample size increases. The smoothing wasconstructed using a moving window along the dates.
where the number of total and failed consignments during the analysis period were given in theflowchart (Figure B.5). The minimal leakage of the pathway is 64/0.9 − 64 ≈ 7 and hence themaximal leakage is ≈ 71. A 99% PIC would correspond to a leakage of 2824− 2824× 0.99 ≈ 28.
97
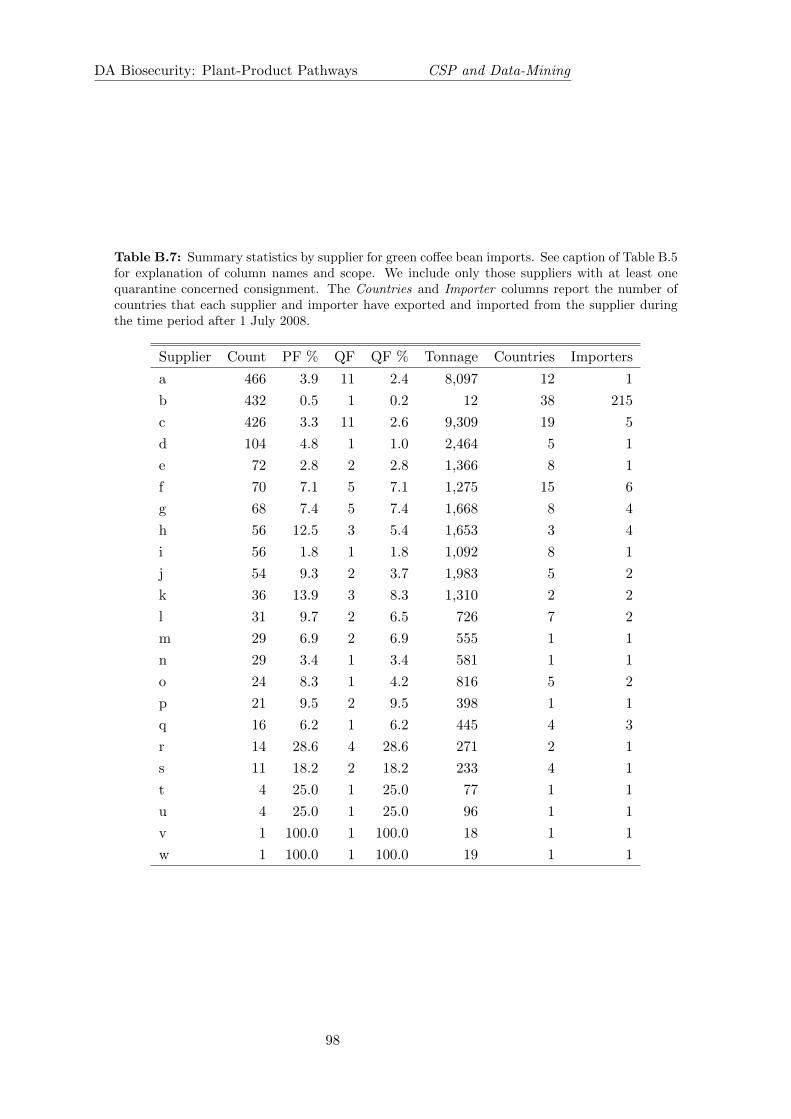
DA Biosecurity: Plant-Product Pathways CSP and Data-Mining
Table B.7: Summary statistics by supplier for green coffee bean imports. See caption of Table B.5for explanation of column names and scope. We include only those suppliers with at least onequarantine concerned consignment. The Countries and Importer columns report the number ofcountries that each supplier and importer have exported and imported from the supplier duringthe time period after 1 July 2008.
Supplier Count PF % QF QF % Tonnage Countries Importers
a 466 3.9 11 2.4 8,097 12 1
b 432 0.5 1 0.2 12 38 215
c 426 3.3 11 2.6 9,309 19 5
d 104 4.8 1 1.0 2,464 5 1
e 72 2.8 2 2.8 1,366 8 1
f 70 7.1 5 7.1 1,275 15 6
g 68 7.4 5 7.4 1,668 8 4
h 56 12.5 3 5.4 1,653 3 4
i 56 1.8 1 1.8 1,092 8 1
j 54 9.3 2 3.7 1,983 5 2
k 36 13.9 3 8.3 1,310 2 2
l 31 9.7 2 6.5 726 7 2
m 29 6.9 2 6.9 555 1 1
n 29 3.4 1 3.4 581 1 1
o 24 8.3 1 4.2 816 5 2
p 21 9.5 2 9.5 398 1 1
q 16 6.2 1 6.2 445 4 3
r 14 28.6 4 28.6 271 2 1
s 11 18.2 2 18.2 233 4 1
t 4 25.0 1 25.0 77 1 1
u 4 25.0 1 25.0 96 1 1
v 1 100.0 1 100.0 18 1 1
w 1 100.0 1 100.0 19 1 1
98

DA Biosecurity: Plant-Product Pathways CSP and Data-Mining
The IPD over 2.5 years was 2824/64 ≈ 44 inspections per detection.
Next, we discuss the simulation results by stratification. Here we focus on the stratificationvariables of importer and supplier, which are currently being considered by the department. Wealso show figures for stratification by country for consistency with previous reports, but do notdiscuss these results in the text.
Stratification by importer
There was no benefit of stratifying by importer and applying a CSP relative to random samplingwith the same effort. For some sampling rates leakage was actually higher than with randomsampling (Figure B.8). IPD was also generally higher than the full inspection case (Figure B.9),but some rates produced IPDs similar to the full inspection case. For example, ACN of 40combined with an MF of 0.5 would produce a similar IPD with fewer inspections, but at theexpense of higher leakage. PIC was down as low as 97.9%.
Stratification by supplier
Stratification by supplier generally resulted in small improvements in absolute leakage relativeto random sampling with the same effort and IPD was generally below that resulting from fullinspection (Tables B.9 and B.11 and Figures B.8 and B.9). CSPs applied with no stratificationalso produced lower leakages relative to random sampling with the same effort for this pathway.
99

DA Biosecurity: Plant-Product Pathways CSP and Data-Mining
Table B.8: List of all possible combinations of given CN and MF for the green coffee beanpathway, stratified by importer and using a CSP-1 inspection rule. Insp is the number of inspectedconsignments, Intc and Lk stand for the numbers of consignments containing biosecurity riskmaterial that were found and leaked, respectively, during the process of simulation. IPD, whichcan be calculated by Insp/Intc, gives efficiencies of the listed inspection strategies.
Rule Class CN MF PIC Insp Lk Intc IPD
CSP-1 Importer 5 0.1 0.9794 740.41 58.12 12.52 59.14
CSP-1 Importer 5 0.2 0.9823 998.92 49.94 20.74 48.16
CSP-1 Importer 5 0.333 0.9854 1321.05 41.35 29.69 44.49
CSP-1 Importer 5 0.5 0.9888 1719.15 31.57 39.35 43.69
CSP-1 Importer 10 0.1 0.9802 864.87 55.85 15.31 56.49
CSP-1 Importer 10 0.2 0.9830 1133.66 47.98 23.42 48.41
CSP-1 Importer 10 0.333 0.9861 1455.95 39.22 32.28 45.10
CSP-1 Importer 10 0.5 0.9898 1834.58 28.76 42.34 43.33
CSP-1 Importer 20 0.1 0.9812 1013.14 53.13 18.03 56.19
CSP-1 Importer 20 0.2 0.9844 1284.61 44.19 26.53 48.42
CSP-1 Importer 20 0.333 0.9876 1610.24 35.10 35.81 44.97
CSP-1 Importer 20 0.5 0.9910 1981.91 25.48 45.73 43.34
CSP-1 Importer 40 0.1 0.9846 1316.04 43.37 27.63 47.63
CSP-1 Importer 40 0.2 0.9879 1621.27 34.15 36.77 44.09
CSP-1 Importer 40 0.333 0.9910 1929.26 25.41 45.61 42.30
CSP-1 Importer 40 0.5 0.9937 2214.98 17.87 53.18 41.65
100

DA Biosecurity: Plant-Product Pathways CSP and Data-Mining
Table B.9: List of all possible combinations of given CN and MF for the green coffee beanpathway, stratified by supplier and using a CSP-1 inspection rule. Insp is the number of inspectedconsignments, Intc and Lk stand for the numbers of consignments containing biosecurity riskmaterial that were found and leaked, respectively, during the process of simulation. IPD, whichcan be calculated by Insp/Intc, gives efficiencies of the listed inspection strategies.
Rule Class CN MF PIC Insp Lk Intc IPD
CSP-1 Supplier 5 0.1 0.9797 592.87 57.29 13.84 42.84
CSP-1 Supplier 5 0.2 0.9821 863.62 50.55 20.45 42.23
CSP-1 Supplier 5 0.333 0.9855 1217.01 40.99 30.24 40.25
CSP-1 Supplier 5 0.5 0.9887 1635.66 31.80 39.52 41.39
CSP-1 Supplier 10 0.1 0.9824 748.30 49.57 21.26 35.20
CSP-1 Supplier 10 0.2 0.9845 1016.67 43.85 27.06 37.57
CSP-1 Supplier 10 0.333 0.9872 1356.95 36.25 34.44 39.40
CSP-1 Supplier 10 0.5 0.9900 1756.11 28.16 42.85 40.98
CSP-1 Supplier 20 0.1 0.9835 957.65 46.63 24.50 39.09
CSP-1 Supplier 20 0.2 0.9865 1247.76 38.15 32.96 37.86
CSP-1 Supplier 20 0.333 0.9886 1564.10 32.33 38.59 40.53
CSP-1 Supplier 20 0.5 0.9914 1935.60 24.22 46.83 41.33
CSP-1 Supplier 40 0.1 0.9875 1324.81 35.21 36.13 36.67
CSP-1 Supplier 40 0.2 0.9896 1574.79 29.30 41.98 37.51
CSP-1 Supplier 40 0.333 0.9924 1887.74 21.53 49.20 38.37
CSP-1 Supplier 40 0.5 0.9943 2184.02 16.03 54.91 39.77
101
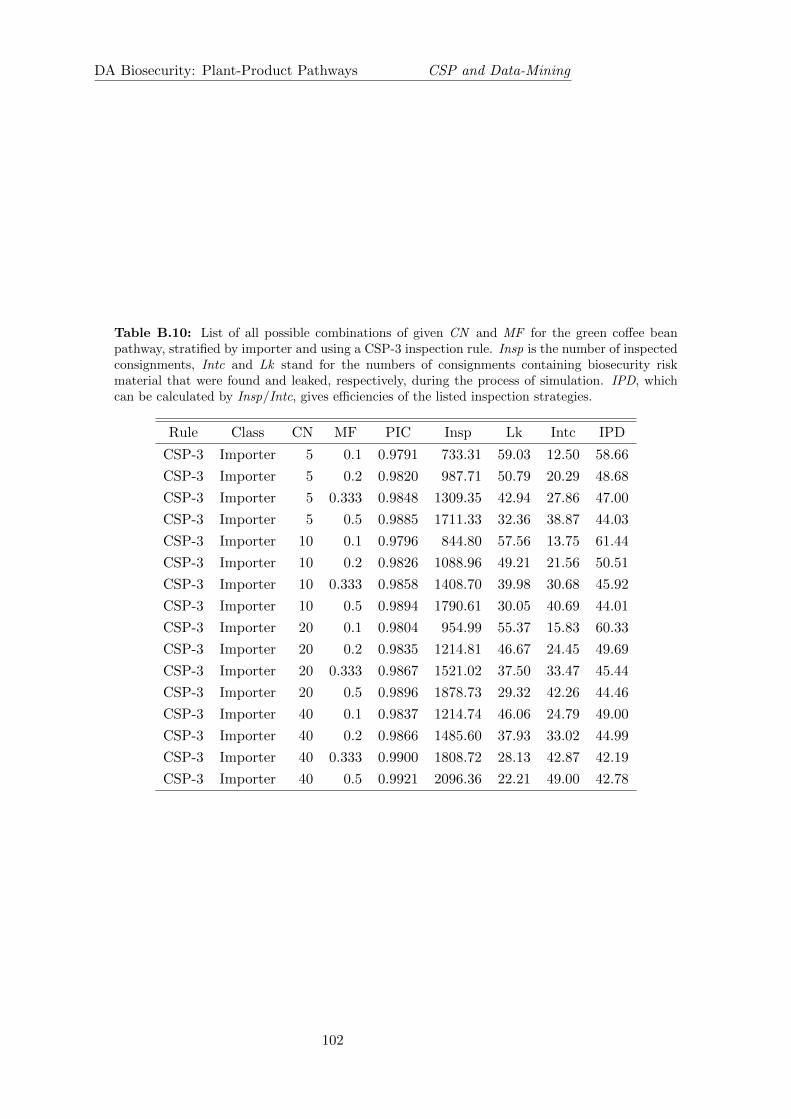
DA Biosecurity: Plant-Product Pathways CSP and Data-Mining
Table B.10: List of all possible combinations of given CN and MF for the green coffee beanpathway, stratified by importer and using a CSP-3 inspection rule. Insp is the number of inspectedconsignments, Intc and Lk stand for the numbers of consignments containing biosecurity riskmaterial that were found and leaked, respectively, during the process of simulation. IPD, whichcan be calculated by Insp/Intc, gives efficiencies of the listed inspection strategies.
Rule Class CN MF PIC Insp Lk Intc IPD
CSP-3 Importer 5 0.1 0.9791 733.31 59.03 12.50 58.66
CSP-3 Importer 5 0.2 0.9820 987.71 50.79 20.29 48.68
CSP-3 Importer 5 0.333 0.9848 1309.35 42.94 27.86 47.00
CSP-3 Importer 5 0.5 0.9885 1711.33 32.36 38.87 44.03
CSP-3 Importer 10 0.1 0.9796 844.80 57.56 13.75 61.44
CSP-3 Importer 10 0.2 0.9826 1088.96 49.21 21.56 50.51
CSP-3 Importer 10 0.333 0.9858 1408.70 39.98 30.68 45.92
CSP-3 Importer 10 0.5 0.9894 1790.61 30.05 40.69 44.01
CSP-3 Importer 20 0.1 0.9804 954.99 55.37 15.83 60.33
CSP-3 Importer 20 0.2 0.9835 1214.81 46.67 24.45 49.69
CSP-3 Importer 20 0.333 0.9867 1521.02 37.50 33.47 45.44
CSP-3 Importer 20 0.5 0.9896 1878.73 29.32 42.26 44.46
CSP-3 Importer 40 0.1 0.9837 1214.74 46.06 24.79 49.00
CSP-3 Importer 40 0.2 0.9866 1485.60 37.93 33.02 44.99
CSP-3 Importer 40 0.333 0.9900 1808.72 28.13 42.87 42.19
CSP-3 Importer 40 0.5 0.9921 2096.36 22.21 49.00 42.78
102
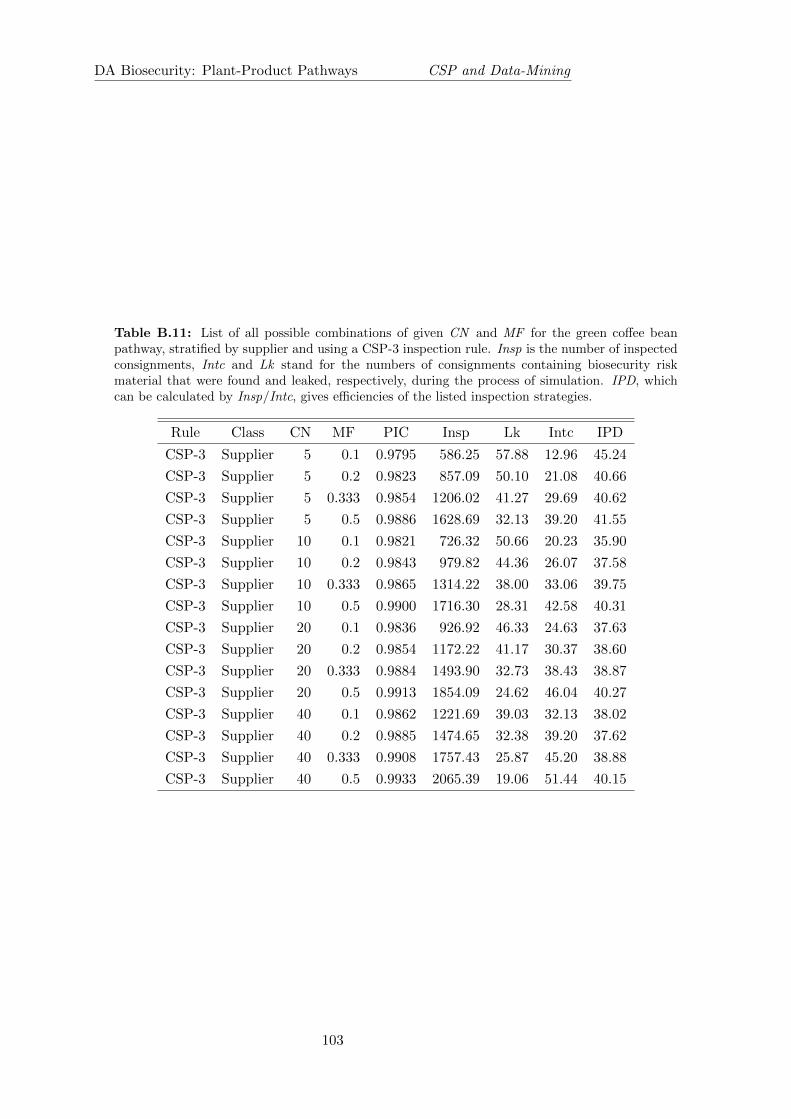
DA Biosecurity: Plant-Product Pathways CSP and Data-Mining
Table B.11: List of all possible combinations of given CN and MF for the green coffee beanpathway, stratified by supplier and using a CSP-3 inspection rule. Insp is the number of inspectedconsignments, Intc and Lk stand for the numbers of consignments containing biosecurity riskmaterial that were found and leaked, respectively, during the process of simulation. IPD, whichcan be calculated by Insp/Intc, gives efficiencies of the listed inspection strategies.
Rule Class CN MF PIC Insp Lk Intc IPD
CSP-3 Supplier 5 0.1 0.9795 586.25 57.88 12.96 45.24
CSP-3 Supplier 5 0.2 0.9823 857.09 50.10 21.08 40.66
CSP-3 Supplier 5 0.333 0.9854 1206.02 41.27 29.69 40.62
CSP-3 Supplier 5 0.5 0.9886 1628.69 32.13 39.20 41.55
CSP-3 Supplier 10 0.1 0.9821 726.32 50.66 20.23 35.90
CSP-3 Supplier 10 0.2 0.9843 979.82 44.36 26.07 37.58
CSP-3 Supplier 10 0.333 0.9865 1314.22 38.00 33.06 39.75
CSP-3 Supplier 10 0.5 0.9900 1716.30 28.31 42.58 40.31
CSP-3 Supplier 20 0.1 0.9836 926.92 46.33 24.63 37.63
CSP-3 Supplier 20 0.2 0.9854 1172.22 41.17 30.37 38.60
CSP-3 Supplier 20 0.333 0.9884 1493.90 32.73 38.43 38.87
CSP-3 Supplier 20 0.5 0.9913 1854.09 24.62 46.04 40.27
CSP-3 Supplier 40 0.1 0.9862 1221.69 39.03 32.13 38.02
CSP-3 Supplier 40 0.2 0.9885 1474.65 32.38 39.20 37.62
CSP-3 Supplier 40 0.333 0.9908 1757.43 25.87 45.20 38.88
CSP-3 Supplier 40 0.5 0.9933 2065.39 19.06 51.44 40.15
103
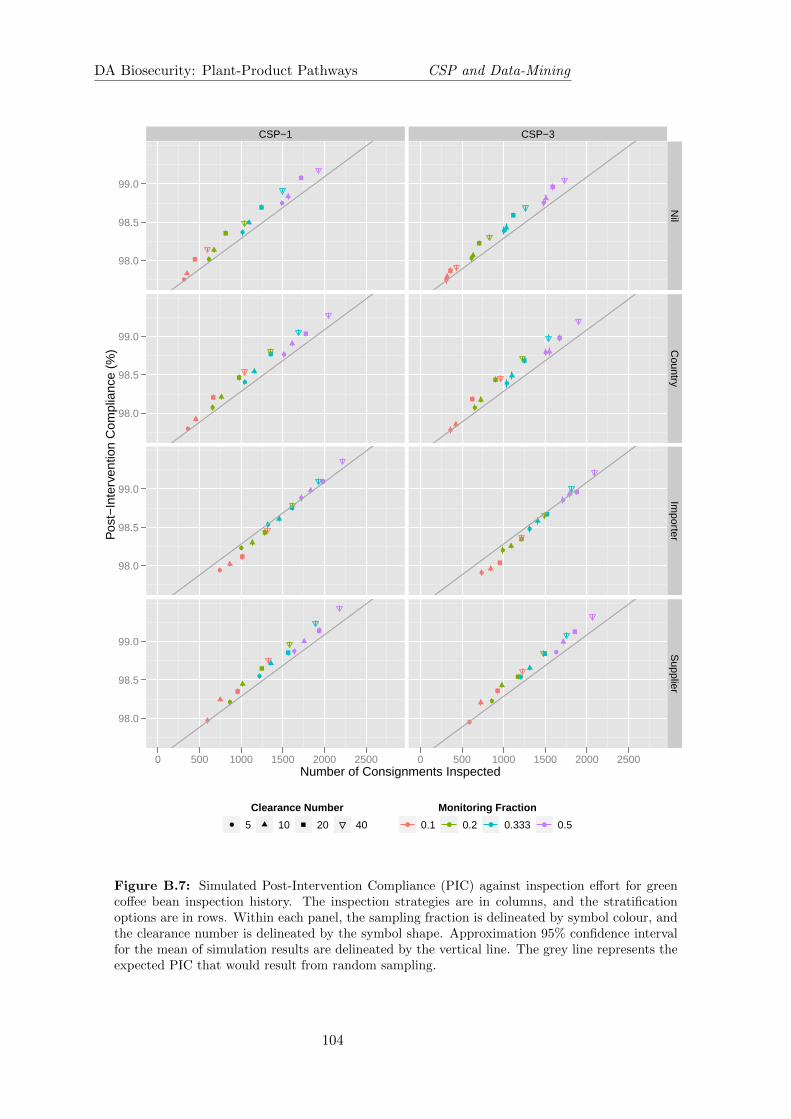
DA Biosecurity: Plant-Product Pathways CSP and Data-Mining
Number of Consignments Inspected
Pos
t−In
terv
entio
n C
ompl
ianc
e (%
)
98.0
98.5
99.0
98.0
98.5
99.0
98.0
98.5
99.0
98.0
98.5
99.0
CSP−1
●
●
●
●
●
●
●
●
●
●
●
●
●
●
●
●
0 500 1000 1500 2000 2500
CSP−3
●
●
●
●
●
●
●
●
●
●
●
●
●
●
●
●
0 500 1000 1500 2000 2500
Nil
Country
Importer
Supplier
Clearance Number● 5 10 20 40
Monitoring Fraction
● 0.1 ● 0.2 ● 0.333 ● 0.5
Figure B.7: Simulated Post-Intervention Compliance (PIC) against inspection effort for greencoffee bean inspection history. The inspection strategies are in columns, and the stratificationoptions are in rows. Within each panel, the sampling fraction is delineated by symbol colour, andthe clearance number is delineated by the symbol shape. Approximation 95% confidence intervalfor the mean of simulation results are delineated by the vertical line. The grey line represents theexpected PIC that would result from random sampling.
104
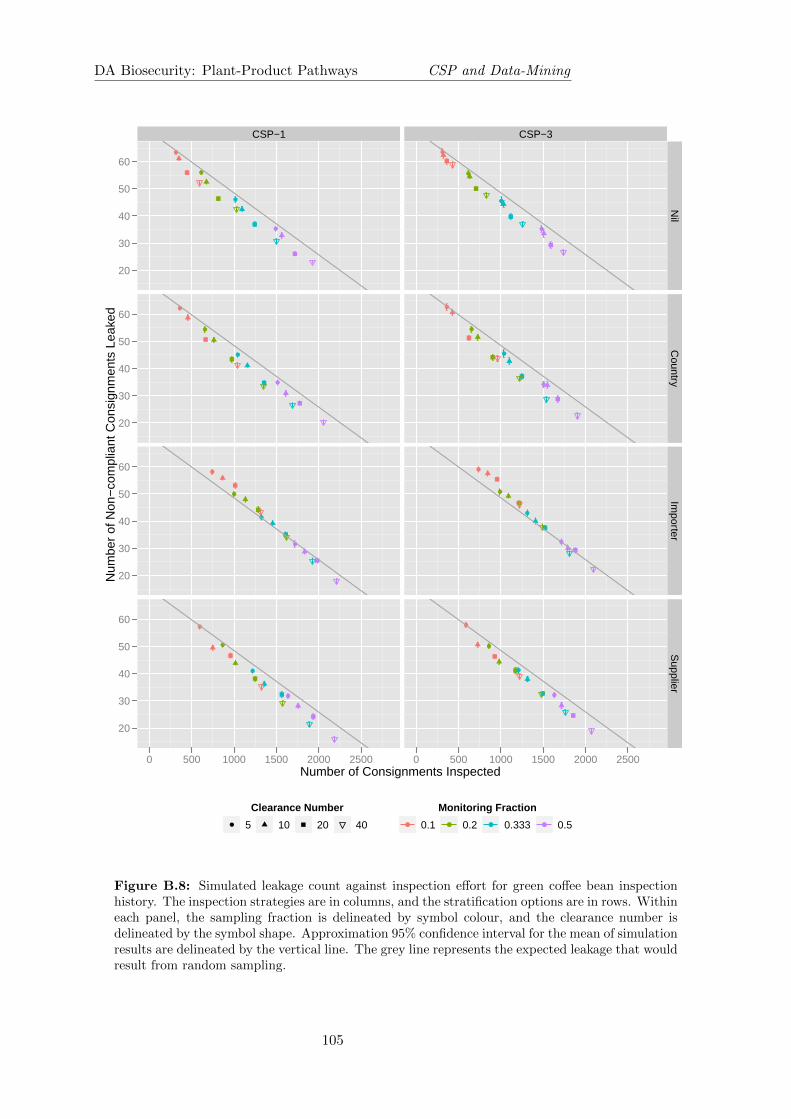
DA Biosecurity: Plant-Product Pathways CSP and Data-Mining
Number of Consignments Inspected
Num
ber
of N
on−
com
plia
nt C
onsi
gnm
ents
Lea
ked
20
30
40
50
60
20
30
40
50
60
20
30
40
50
60
20
30
40
50
60
CSP−1
●
●
●
●
●
●
●
●
●
●
●
●
●
●
●
●
0 500 1000 1500 2000 2500
CSP−3
●
●
●
●
●
●
●
●
●
●
●
●
●
●
●
●
0 500 1000 1500 2000 2500
Nil
Country
Importer
Supplier
Clearance Number● 5 10 20 40
Monitoring Fraction
● 0.1 ● 0.2 ● 0.333 ● 0.5
Figure B.8: Simulated leakage count against inspection effort for green coffee bean inspectionhistory. The inspection strategies are in columns, and the stratification options are in rows. Withineach panel, the sampling fraction is delineated by symbol colour, and the clearance number isdelineated by the symbol shape. Approximation 95% confidence interval for the mean of simulationresults are delineated by the vertical line. The grey line represents the expected leakage that wouldresult from random sampling.
105
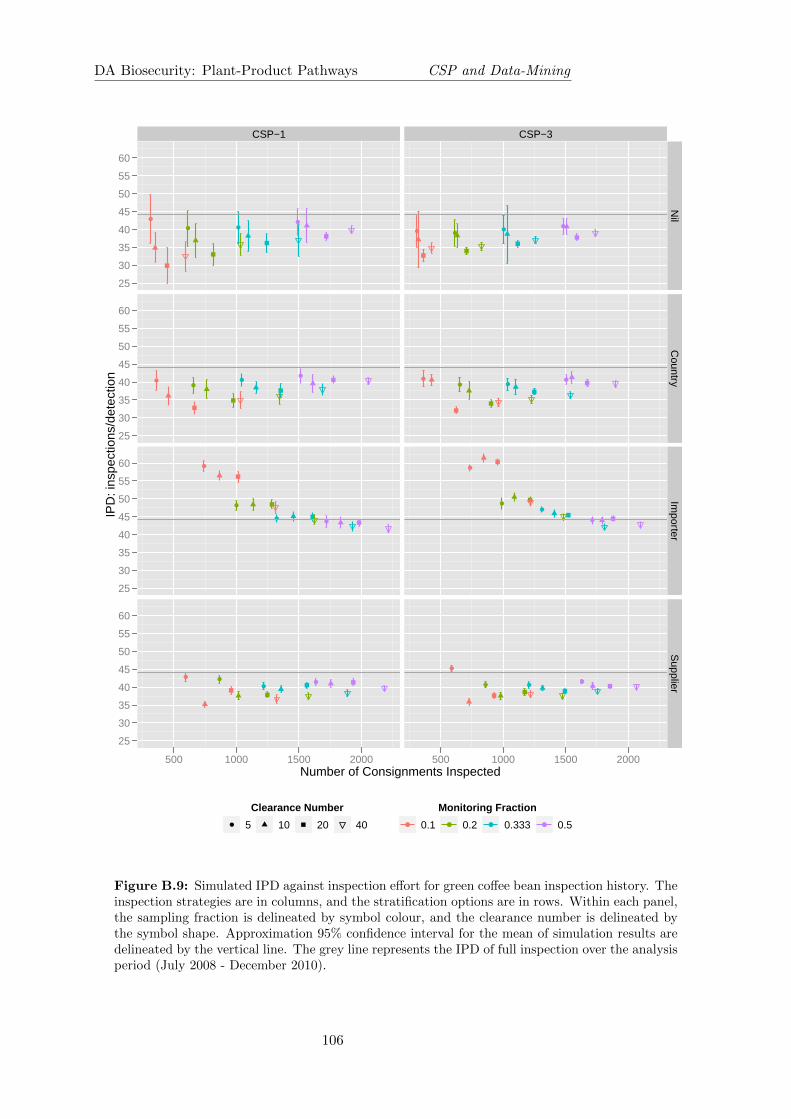
DA Biosecurity: Plant-Product Pathways CSP and Data-Mining
Number of Consignments Inspected
IPD
: ins
pect
ions
/det
ectio
n
25
30
35
40
45
50
55
60
25
30
35
40
45
50
55
60
25
30
35
40
45
50
55
60
25
30
35
40
45
50
55
60
CSP−1
●
● ●
●
●●
●●
●
●
●●
●●
●●
500 1000 1500 2000
CSP−3
● ●●
●
●
● ●●
●
●
●
●
●
● ●●
500 1000 1500 2000
Nil
Country
Importer
Supplier
Clearance Number● 5 10 20 40
Monitoring Fraction
● 0.1 ● 0.2 ● 0.333 ● 0.5
Figure B.9: Simulated IPD against inspection effort for green coffee bean inspection history. Theinspection strategies are in columns, and the stratification options are in rows. Within each panel,the sampling fraction is delineated by symbol colour, and the clearance number is delineated bythe symbol shape. Approximation 95% confidence interval for the mean of simulation results aredelineated by the vertical line. The grey line represents the IPD of full inspection over the analysisperiod (July 2008 - December 2010).
106
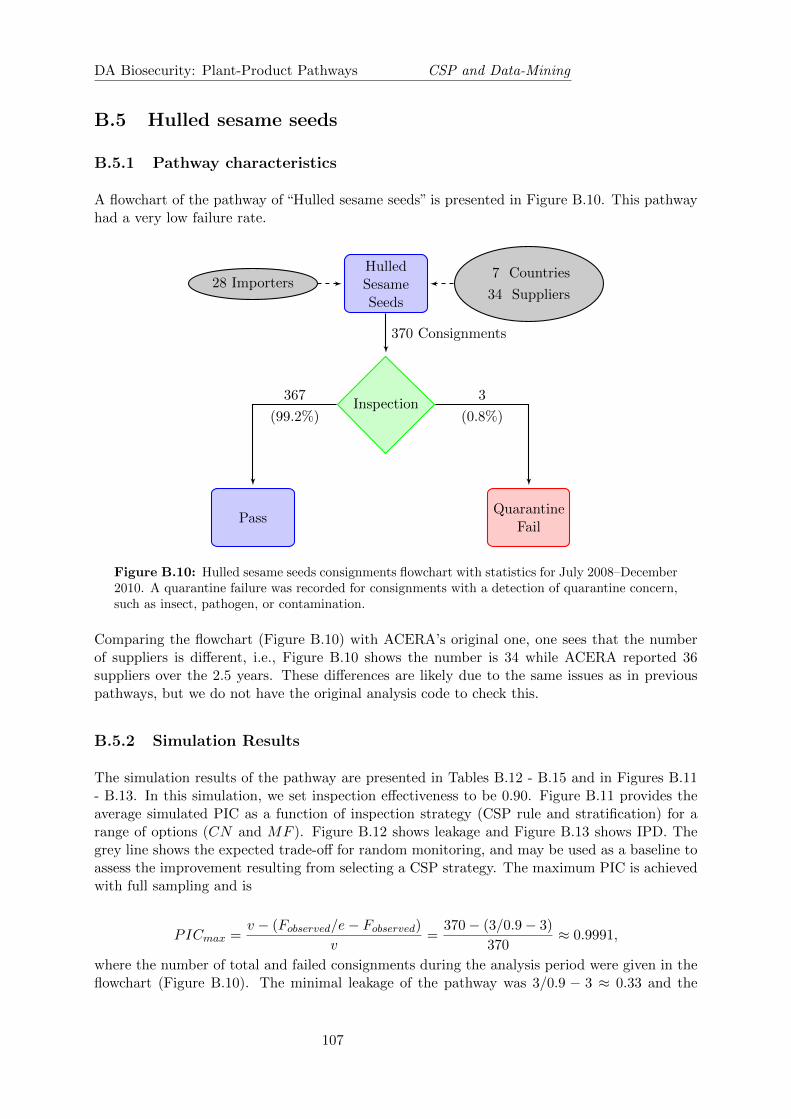
DA Biosecurity: Plant-Product Pathways CSP and Data-Mining
B.5 Hulled sesame seeds
B.5.1 Pathway characteristics
A flowchart of the pathway of “Hulled sesame seeds” is presented in Figure B.10. This pathwayhad a very low failure rate.
28 ImportersHulledSesameSeeds
7 Countries
34 Suppliers
Inspection
PassQuarantine
Fail
370 Consignments
367
(99.2%)
3
(0.8%)
Figure B.10: Hulled sesame seeds consignments flowchart with statistics for July 2008–December2010. A quarantine failure was recorded for consignments with a detection of quarantine concern,such as insect, pathogen, or contamination.
Comparing the flowchart (Figure B.10) with ACERA’s original one, one sees that the numberof suppliers is different, i.e., Figure B.10 shows the number is 34 while ACERA reported 36suppliers over the 2.5 years. These differences are likely due to the same issues as in previouspathways, but we do not have the original analysis code to check this.
B.5.2 Simulation Results
The simulation results of the pathway are presented in Tables B.12 - B.15 and in Figures B.11- B.13. In this simulation, we set inspection effectiveness to be 0.90. Figure B.11 provides theaverage simulated PIC as a function of inspection strategy (CSP rule and stratification) for arange of options (CN and MF ). Figure B.12 shows leakage and Figure B.13 shows IPD. Thegrey line shows the expected trade-off for random monitoring, and may be used as a baseline toassess the improvement resulting from selecting a CSP strategy. The maximum PIC is achievedwith full sampling and is
PICmax =v − (Fobserved/e− Fobserved)
v=
370− (3/0.9− 3)
370≈ 0.9991,
where the number of total and failed consignments during the analysis period were given in theflowchart (Figure B.10). The minimal leakage of the pathway was 3/0.9 − 3 ≈ 0.33 and the
107
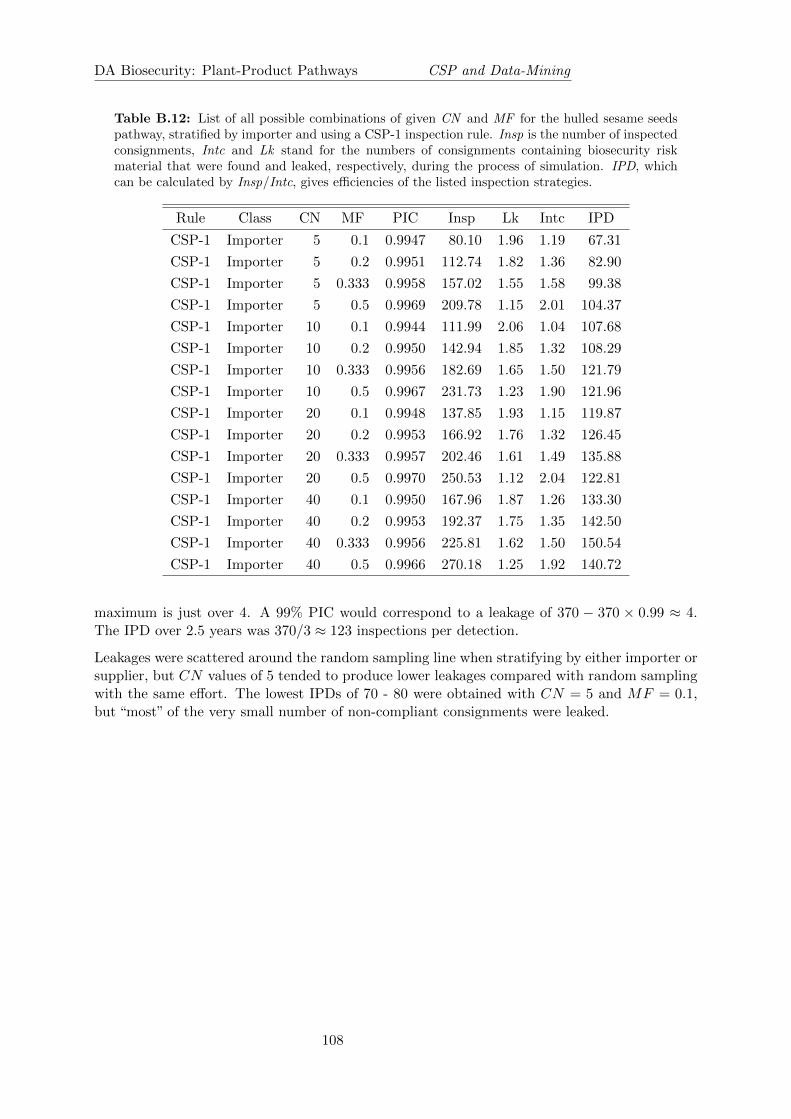
DA Biosecurity: Plant-Product Pathways CSP and Data-Mining
Table B.12: List of all possible combinations of given CN and MF for the hulled sesame seedspathway, stratified by importer and using a CSP-1 inspection rule. Insp is the number of inspectedconsignments, Intc and Lk stand for the numbers of consignments containing biosecurity riskmaterial that were found and leaked, respectively, during the process of simulation. IPD, whichcan be calculated by Insp/Intc, gives efficiencies of the listed inspection strategies.
Rule Class CN MF PIC Insp Lk Intc IPD
CSP-1 Importer 5 0.1 0.9947 80.10 1.96 1.19 67.31
CSP-1 Importer 5 0.2 0.9951 112.74 1.82 1.36 82.90
CSP-1 Importer 5 0.333 0.9958 157.02 1.55 1.58 99.38
CSP-1 Importer 5 0.5 0.9969 209.78 1.15 2.01 104.37
CSP-1 Importer 10 0.1 0.9944 111.99 2.06 1.04 107.68
CSP-1 Importer 10 0.2 0.9950 142.94 1.85 1.32 108.29
CSP-1 Importer 10 0.333 0.9956 182.69 1.65 1.50 121.79
CSP-1 Importer 10 0.5 0.9967 231.73 1.23 1.90 121.96
CSP-1 Importer 20 0.1 0.9948 137.85 1.93 1.15 119.87
CSP-1 Importer 20 0.2 0.9953 166.92 1.76 1.32 126.45
CSP-1 Importer 20 0.333 0.9957 202.46 1.61 1.49 135.88
CSP-1 Importer 20 0.5 0.9970 250.53 1.12 2.04 122.81
CSP-1 Importer 40 0.1 0.9950 167.96 1.87 1.26 133.30
CSP-1 Importer 40 0.2 0.9953 192.37 1.75 1.35 142.50
CSP-1 Importer 40 0.333 0.9956 225.81 1.62 1.50 150.54
CSP-1 Importer 40 0.5 0.9966 270.18 1.25 1.92 140.72
maximum is just over 4. A 99% PIC would correspond to a leakage of 370 − 370 × 0.99 ≈ 4.The IPD over 2.5 years was 370/3 ≈ 123 inspections per detection.
Leakages were scattered around the random sampling line when stratifying by either importer orsupplier, but CN values of 5 tended to produce lower leakages compared with random samplingwith the same effort. The lowest IPDs of 70 - 80 were obtained with CN = 5 and MF = 0.1,but “most” of the very small number of non-compliant consignments were leaked.
108
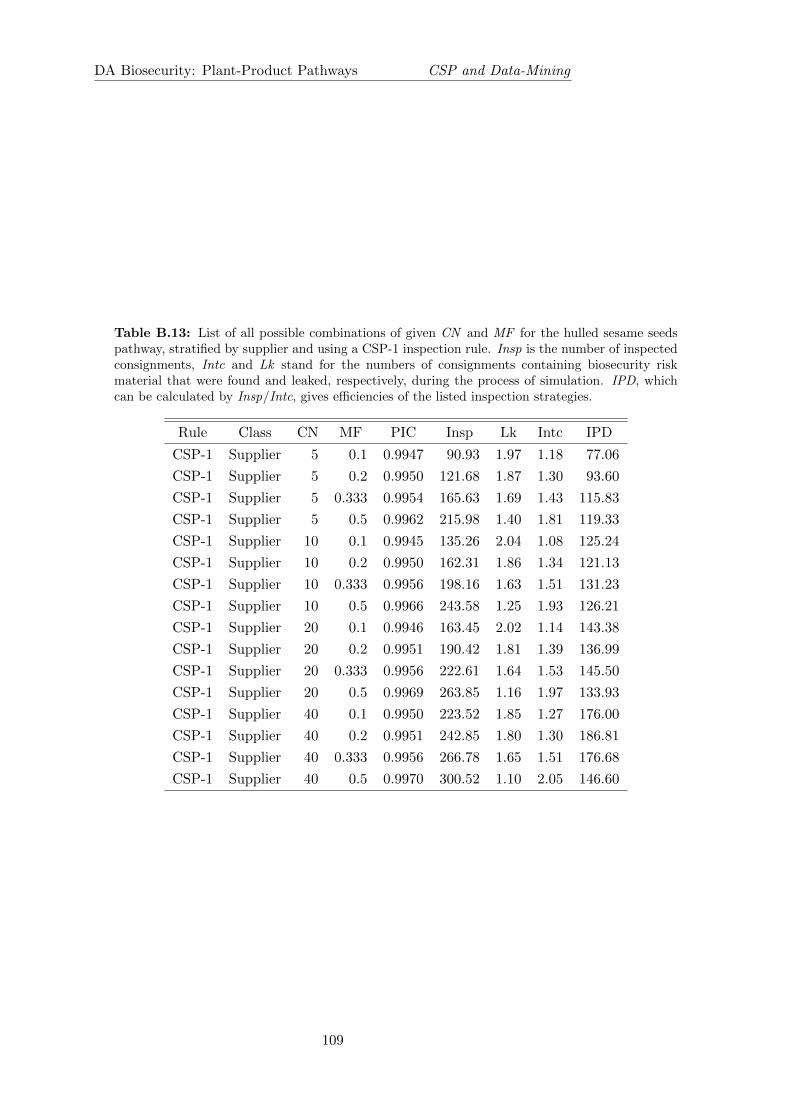
DA Biosecurity: Plant-Product Pathways CSP and Data-Mining
Table B.13: List of all possible combinations of given CN and MF for the hulled sesame seedspathway, stratified by supplier and using a CSP-1 inspection rule. Insp is the number of inspectedconsignments, Intc and Lk stand for the numbers of consignments containing biosecurity riskmaterial that were found and leaked, respectively, during the process of simulation. IPD, whichcan be calculated by Insp/Intc, gives efficiencies of the listed inspection strategies.
Rule Class CN MF PIC Insp Lk Intc IPD
CSP-1 Supplier 5 0.1 0.9947 90.93 1.97 1.18 77.06
CSP-1 Supplier 5 0.2 0.9950 121.68 1.87 1.30 93.60
CSP-1 Supplier 5 0.333 0.9954 165.63 1.69 1.43 115.83
CSP-1 Supplier 5 0.5 0.9962 215.98 1.40 1.81 119.33
CSP-1 Supplier 10 0.1 0.9945 135.26 2.04 1.08 125.24
CSP-1 Supplier 10 0.2 0.9950 162.31 1.86 1.34 121.13
CSP-1 Supplier 10 0.333 0.9956 198.16 1.63 1.51 131.23
CSP-1 Supplier 10 0.5 0.9966 243.58 1.25 1.93 126.21
CSP-1 Supplier 20 0.1 0.9946 163.45 2.02 1.14 143.38
CSP-1 Supplier 20 0.2 0.9951 190.42 1.81 1.39 136.99
CSP-1 Supplier 20 0.333 0.9956 222.61 1.64 1.53 145.50
CSP-1 Supplier 20 0.5 0.9969 263.85 1.16 1.97 133.93
CSP-1 Supplier 40 0.1 0.9950 223.52 1.85 1.27 176.00
CSP-1 Supplier 40 0.2 0.9951 242.85 1.80 1.30 186.81
CSP-1 Supplier 40 0.333 0.9956 266.78 1.65 1.51 176.68
CSP-1 Supplier 40 0.5 0.9970 300.52 1.10 2.05 146.60
109

DA Biosecurity: Plant-Product Pathways CSP and Data-Mining
Table B.14: List of all possible combinations of given CN and MF for the hulled sesame seedspathway, stratified by importer and using a CSP-3 inspection rule. Insp is the number of inspectedconsignments, Intc and Lk stand for the numbers of consignments containing biosecurity riskmaterial that were found and leaked, respectively, during the process of simulation. IPD, whichcan be calculated by Insp/Intc, gives efficiencies of the listed inspection strategies.
Rule Class CN MF PIC Insp Lk Intc IPD
CSP-3 Importer 5 0.1 0.9943 79.70 2.11 1.00 79.70
CSP-3 Importer 5 0.2 0.9948 112.30 1.92 1.23 91.30
CSP-3 Importer 5 0.333 0.9953 155.11 1.74 1.39 111.59
CSP-3 Importer 5 0.5 0.9962 210.22 1.40 1.81 116.14
CSP-3 Importer 10 0.1 0.9945 111.74 2.03 1.11 100.67
CSP-3 Importer 10 0.2 0.9951 142.52 1.80 1.33 107.16
CSP-3 Importer 10 0.333 0.9954 180.18 1.71 1.40 128.70
CSP-3 Importer 10 0.5 0.9965 227.63 1.30 1.88 121.08
CSP-3 Importer 20 0.1 0.9948 135.41 1.92 1.17 115.74
CSP-3 Importer 20 0.2 0.9952 161.10 1.78 1.39 115.90
CSP-3 Importer 20 0.333 0.9958 196.77 1.54 1.61 122.22
CSP-3 Importer 20 0.5 0.9965 241.59 1.28 1.92 125.83
CSP-3 Importer 40 0.1 0.9945 158.84 2.05 1.10 144.40
CSP-3 Importer 40 0.2 0.9949 184.05 1.88 1.27 144.92
CSP-3 Importer 40 0.333 0.9956 215.28 1.64 1.47 146.45
CSP-3 Importer 40 0.5 0.9965 257.25 1.28 1.81 142.13
110
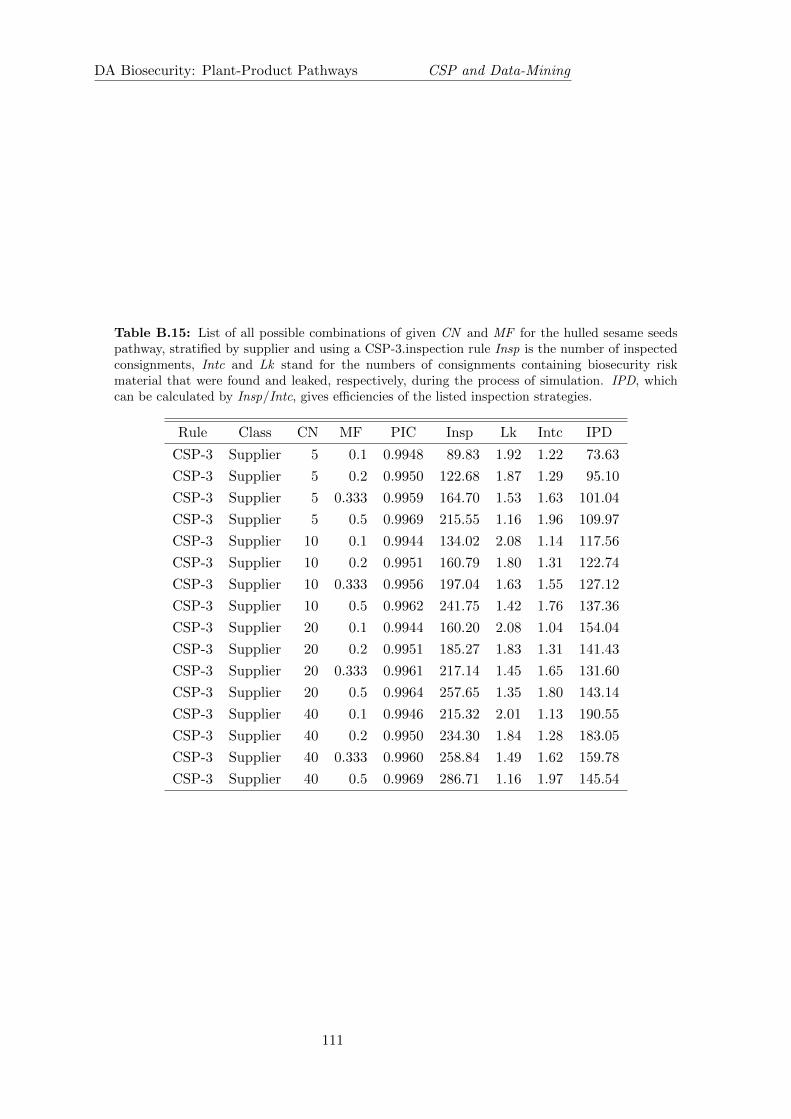
DA Biosecurity: Plant-Product Pathways CSP and Data-Mining
Table B.15: List of all possible combinations of given CN and MF for the hulled sesame seedspathway, stratified by supplier and using a CSP-3.inspection rule Insp is the number of inspectedconsignments, Intc and Lk stand for the numbers of consignments containing biosecurity riskmaterial that were found and leaked, respectively, during the process of simulation. IPD, whichcan be calculated by Insp/Intc, gives efficiencies of the listed inspection strategies.
Rule Class CN MF PIC Insp Lk Intc IPD
CSP-3 Supplier 5 0.1 0.9948 89.83 1.92 1.22 73.63
CSP-3 Supplier 5 0.2 0.9950 122.68 1.87 1.29 95.10
CSP-3 Supplier 5 0.333 0.9959 164.70 1.53 1.63 101.04
CSP-3 Supplier 5 0.5 0.9969 215.55 1.16 1.96 109.97
CSP-3 Supplier 10 0.1 0.9944 134.02 2.08 1.14 117.56
CSP-3 Supplier 10 0.2 0.9951 160.79 1.80 1.31 122.74
CSP-3 Supplier 10 0.333 0.9956 197.04 1.63 1.55 127.12
CSP-3 Supplier 10 0.5 0.9962 241.75 1.42 1.76 137.36
CSP-3 Supplier 20 0.1 0.9944 160.20 2.08 1.04 154.04
CSP-3 Supplier 20 0.2 0.9951 185.27 1.83 1.31 141.43
CSP-3 Supplier 20 0.333 0.9961 217.14 1.45 1.65 131.60
CSP-3 Supplier 20 0.5 0.9964 257.65 1.35 1.80 143.14
CSP-3 Supplier 40 0.1 0.9946 215.32 2.01 1.13 190.55
CSP-3 Supplier 40 0.2 0.9950 234.30 1.84 1.28 183.05
CSP-3 Supplier 40 0.333 0.9960 258.84 1.49 1.62 159.78
CSP-3 Supplier 40 0.5 0.9969 286.71 1.16 1.97 145.54
111

DA Biosecurity: Plant-Product Pathways CSP and Data-Mining
Number of Consignments Inspected
Pos
t−In
terv
entio
n C
ompl
ianc
e (%
)
99.2
99.3
99.4
99.5
99.6
99.7
99.2
99.3
99.4
99.5
99.6
99.7
99.2
99.3
99.4
99.5
99.6
99.7
99.2
99.3
99.4
99.5
99.6
99.7
99.2
99.3
99.4
99.5
99.6
99.7
CSP−1
●
●
●
●
●
●
●
●
●
●
●
●
●●
●
●
● ●
●
●
0
CSP−2
●●
●
●
●
●
●
●
●
●
●
●
●
●
●
●
●
●
●
●
0
CSP−3
●
●
●
●
●
●
●
●
●
●
●
●
●●
●
●
●
●
●
●
0
Nil
Country
Importer
Supplier
Country &
Supplier
Clearance Number● 5 10 20 40
Monitoring Fraction
● 0.1 ● 0.2 ● 0.333 ● 0.5
Figure B.11: Simulated Post-Intervention Compliance (PIC) against inspection effort for hulledsesame seeds inspection history. The inspection strategies are in columns, and the stratificationoptions are in rows. Within each panel, the sampling fraction is delineated by symbol colour, andthe clearance number is delineated by the symbol shape. Approximation 95% confidence intervalfor the mean of simulation results are delineated by the vertical line. The grey line represents theexpected PIC that would result from random sampling.
112
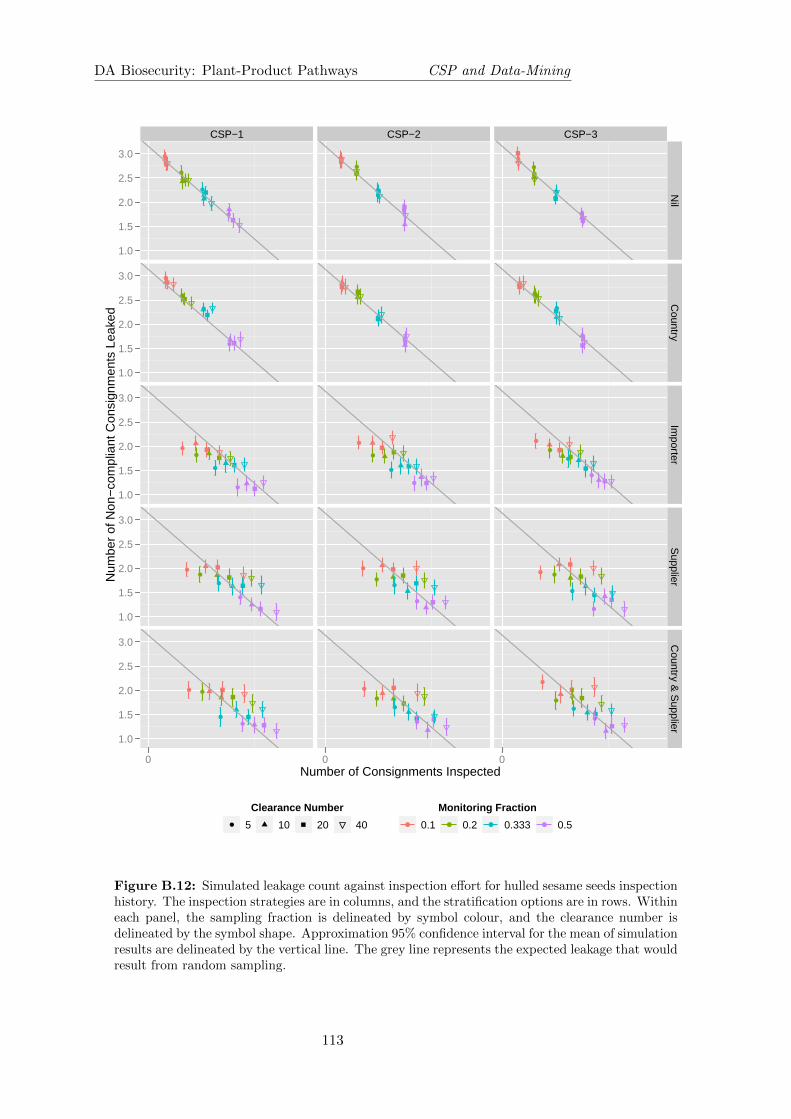
DA Biosecurity: Plant-Product Pathways CSP and Data-Mining
Number of Consignments Inspected
Num
ber
of N
on−
com
plia
nt C
onsi
gnm
ents
Lea
ked
1.0
1.5
2.0
2.5
3.0
1.0
1.5
2.0
2.5
3.0
1.0
1.5
2.0
2.5
3.0
1.0
1.5
2.0
2.5
3.0
1.0
1.5
2.0
2.5
3.0
CSP−1
●
●
●
●
●
●
●
●
●
●
●
●
●●
●
●
● ●
●
●
0
CSP−2
●●
●
●
●
●
●
●
●
●
●
●
●
●
●
●
●
●
●
●
0
CSP−3
●
●
●
●
●
●
●
●
●
●
●
●
●●
●
●
●
●
●
●
0
Nil
Country
Importer
Supplier
Country &
Supplier
Clearance Number● 5 10 20 40
Monitoring Fraction
● 0.1 ● 0.2 ● 0.333 ● 0.5
Figure B.12: Simulated leakage count against inspection effort for hulled sesame seeds inspectionhistory. The inspection strategies are in columns, and the stratification options are in rows. Withineach panel, the sampling fraction is delineated by symbol colour, and the clearance number isdelineated by the symbol shape. Approximation 95% confidence interval for the mean of simulationresults are delineated by the vertical line. The grey line represents the expected leakage that wouldresult from random sampling.
113
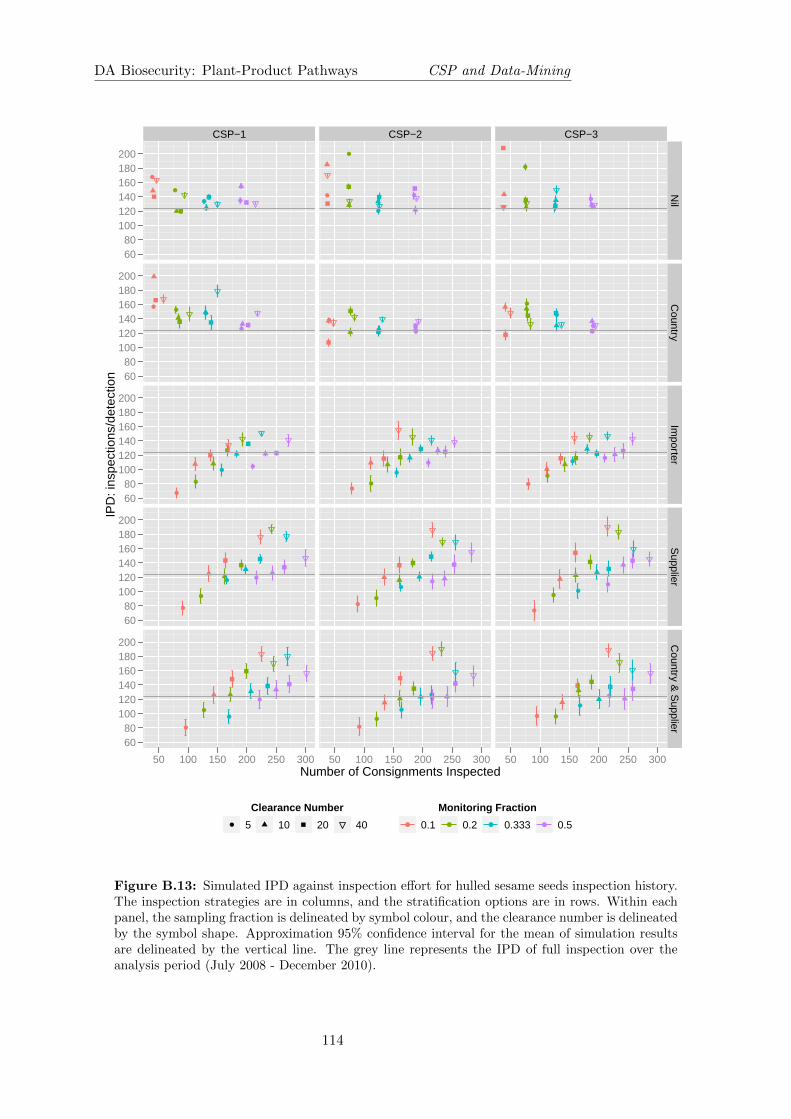
DA Biosecurity: Plant-Product Pathways CSP and Data-Mining
Number of Consignments Inspected
IPD
: ins
pect
ions
/det
ectio
n
6080
100120140160180200
6080
100120140160180200
6080
100120140160180200
6080
100120140160180200
6080
100120140160180200
CSP−1
●
●
● ●
●●
●
●
●
●
●●
●
●
●●
●
●
●
●
50 100 150 200 250 300
CSP−2
●
●
●
●
●
●
● ●
●
●
●
●
●
●
●
●
●
●
●
●
50 100 150 200 250 300
CSP−3
●
●
●
●
●
●
●
●
●
●
●●
●
●●
●
● ●
●
●
50 100 150 200 250 300
Nil
Country
Importer
Supplier
Country &
Supplier
Clearance Number● 5 10 20 40
Monitoring Fraction
● 0.1 ● 0.2 ● 0.333 ● 0.5
Figure B.13: Simulated IPD against inspection effort for hulled sesame seeds inspection history.The inspection strategies are in columns, and the stratification options are in rows. Within eachpanel, the sampling fraction is delineated by symbol colour, and the clearance number is delineatedby the symbol shape. Approximation 95% confidence interval for the mean of simulation resultsare delineated by the vertical line. The grey line represents the IPD of full inspection over theanalysis period (July 2008 - December 2010).
114

DA Biosecurity: Plant-Product Pathways CSP and Data-Mining
B.6 Dried Dates Pathway
B.6.1 Pathway characteristics
A flowchart of the dried dates pathway is presented in Figure B.14. This pathway had a lowfailure rate.
130 ImportersDriedDates
22 Countries
150 Suppliers
Inspection
PassQuarantine
Fail
453 Consignments
448
(98.9%)
5
(1.1%)
Figure B.14: Dried dates consignments flowchart with statistics for July 2008–June 2010. Aquarantine failure was recorded for consignments with a detection of quarantine concern, such asinsect, pathogen, or contamination.
Comparing the flowchart (Figure B.14) with ACERA’s original one, one sees that the numbersof suppliers and consignments are slightly different. These differences are likely due to the sameissues as in previous pathways, but we do not have the original analysis code to check this.
B.6.2 Simulation Results
The simulation results of the pathway are presented in Tables B.16 - B.19 and in Figures B.15- B.17. In this simulation, we set inspection effectiveness to be 0.90. Figure B.15 provides theaverage simulated PIC as a function of inspection strategy (CSP rule and stratification) for arange of options (CN and MF ). Figure B.16 shows leakage and Figure B.17 shows IPD. Thegrey line shows the expected trade-off for random monitoring, and may be used as a baseline toassess the improvement resulting from selecting a CSP strategy. The maximum PIC is achievedwith full sampling and is
PICmax =v − (Fobserved/e− Fobserved)
v=
453− (5/0.9− 5)
453≈ 0.9995,
where the number of total and failed consignments during the analysis period were given in theflowchart (Figure B.14). The minimal leakage of the pathway was 5/0.9−5 ≈ 0.6 and hence themaximum leakage is ≈ 6. A 99% PIC would correspond to a leakage of 453 − 453 × 0.99 ≈ 5.The IPD over 2.5 years with full inspection is 453/5 ≈ 91 inspections per detection.
115
DA Biosecurity: Plant-Product Pathways CSP and Data-Mining
Next, we discuss the simulation results by stratification. Here we focus on the stratificationvariables of importer and supplier, which are currently being considered by the department. Wealso show figures for stratification by country for consistency with previous reports, but do notdiscuss these results in the text.
Stratification by importer
CSPs improved the leakage for a given inspection effort relative to random sampling (Figure B.16).If the pathway was not stratified, there was no difference to random sampling. Results obtainedwith CSP-1 and CSP-3 were similar, with leakage showing a tradeoff against CN for high ratesof MF , but less of a tradeoff for lower rates of MF . For example, with an MF of 0.1, CN of 5,10 and 20 produced similar absolute leakage. At the same time these rates showed reasonablelarge variation in IPD (Figure B.17). Figure B.17 and Tables B.16 and B.18 show that IPDsranged from around 50 to 85. For CSP-3, CN = 5 and MF = 0.1 achieved the lowest IPD of54. PIC and leakage of this strategy were 0.996 and about 2, respectively. The extra IPD of fullinspection is given by
IPDextra =Tot. consignments− Inspected consignments(CSP)
Detected fails with full−Detected fails with CSP
=453− 216.65
5− 4.15≈ 278 inspections per detection.
Stratification by Supplier
CSPs also improved the leakage for a given inspection effort relative to random sampling whenstratified by supplier for some rates(Figure B.16), but not as much as when stratified by importer.
Table B.19 shows that the IPD of the inspection strategy recommended by ACERA [2] (CSP-3,MF = 0.1, CN = 10 and stratification by supplier) would be about 74 inspections per detection,and the PIC would be 0.996.
116

DA Biosecurity: Plant-Product Pathways CSP and Data-Mining
Table B.16: List of all possible combinations of given CN and MF for the dried dates pathway,stratified by importer and using a CSP-1 inspection rule. Insp is the number of inspectedconsignments, Intc and Lk stand for the numbers of consignments containing biosecurity riskmaterial that were found and leaked, respectively, during the process of simulation. IPD, whichcan be calculated by Insp/Intc, gives efficiencies of the listed inspection strategies.
Rule Class CN MF PIC Insp Lk Intc IPD
CSP-1 Importer 5 0.1 0.9961 215.92 1.76 4.07 53.05
CSP-1 Importer 5 0.2 0.9962 242.69 1.71 4.19 57.92
CSP-1 Importer 5 0.333 0.9966 276.42 1.54 4.15 66.61
CSP-1 Importer 5 0.5 0.9976 321.16 1.08 4.51 71.21
CSP-1 Importer 10 0.1 0.9962 274.35 1.73 4.15 66.11
CSP-1 Importer 10 0.2 0.9968 295.13 1.43 4.16 70.94
CSP-1 Importer 10 0.333 0.9969 321.56 1.41 4.31 74.61
CSP-1 Importer 10 0.5 0.9973 355.23 1.24 4.45 79.83
CSP-1 Importer 20 0.1 0.9964 327.40 1.62 4.16 78.70
CSP-1 Importer 20 0.2 0.9971 342.81 1.30 4.42 77.56
CSP-1 Importer 20 0.333 0.9970 361.94 1.36 4.45 81.33
CSP-1 Importer 20 0.5 0.9975 385.55 1.13 4.57 84.37
CSP-1 Importer 40 0.1 0.9987 409.81 0.58 4.98 82.29
CSP-1 Importer 40 0.2 0.9985 415.81 0.69 5.13 81.05
CSP-1 Importer 40 0.333 0.9985 420.22 0.67 5.15 81.60
CSP-1 Importer 40 0.5 0.9984 429.02 0.71 5.07 84.62
117
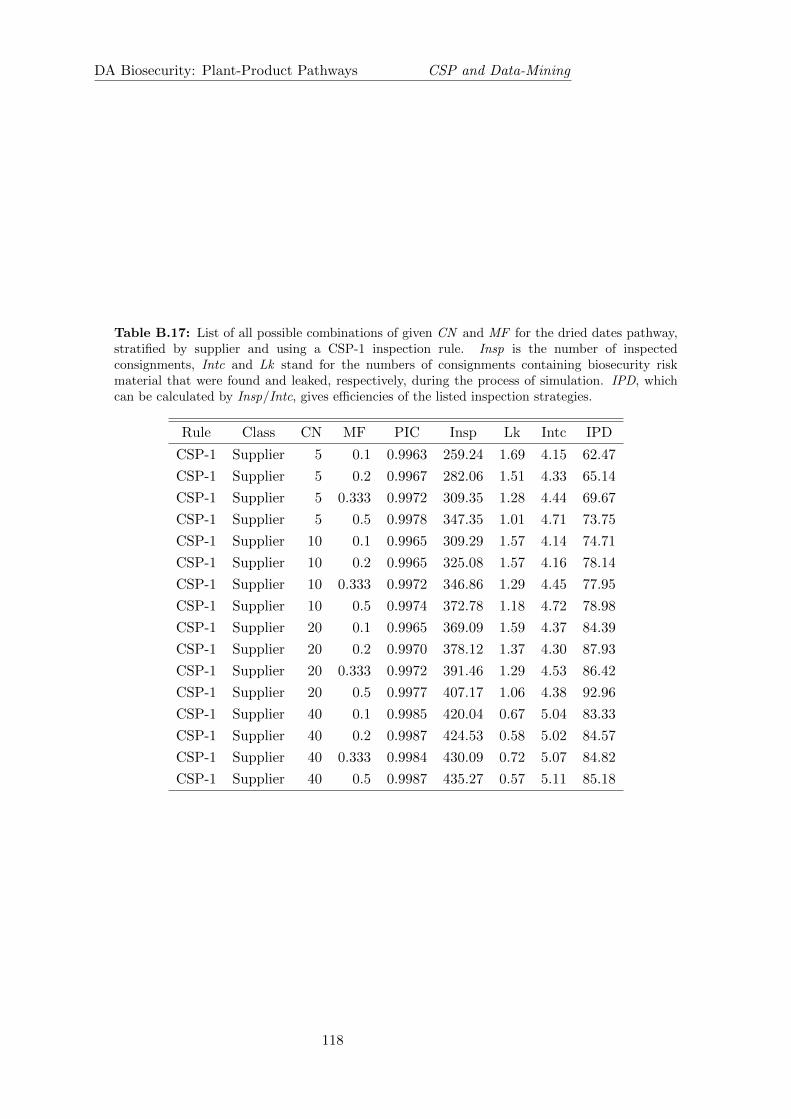
DA Biosecurity: Plant-Product Pathways CSP and Data-Mining
Table B.17: List of all possible combinations of given CN and MF for the dried dates pathway,stratified by supplier and using a CSP-1 inspection rule. Insp is the number of inspectedconsignments, Intc and Lk stand for the numbers of consignments containing biosecurity riskmaterial that were found and leaked, respectively, during the process of simulation. IPD, whichcan be calculated by Insp/Intc, gives efficiencies of the listed inspection strategies.
Rule Class CN MF PIC Insp Lk Intc IPD
CSP-1 Supplier 5 0.1 0.9963 259.24 1.69 4.15 62.47
CSP-1 Supplier 5 0.2 0.9967 282.06 1.51 4.33 65.14
CSP-1 Supplier 5 0.333 0.9972 309.35 1.28 4.44 69.67
CSP-1 Supplier 5 0.5 0.9978 347.35 1.01 4.71 73.75
CSP-1 Supplier 10 0.1 0.9965 309.29 1.57 4.14 74.71
CSP-1 Supplier 10 0.2 0.9965 325.08 1.57 4.16 78.14
CSP-1 Supplier 10 0.333 0.9972 346.86 1.29 4.45 77.95
CSP-1 Supplier 10 0.5 0.9974 372.78 1.18 4.72 78.98
CSP-1 Supplier 20 0.1 0.9965 369.09 1.59 4.37 84.39
CSP-1 Supplier 20 0.2 0.9970 378.12 1.37 4.30 87.93
CSP-1 Supplier 20 0.333 0.9972 391.46 1.29 4.53 86.42
CSP-1 Supplier 20 0.5 0.9977 407.17 1.06 4.38 92.96
CSP-1 Supplier 40 0.1 0.9985 420.04 0.67 5.04 83.33
CSP-1 Supplier 40 0.2 0.9987 424.53 0.58 5.02 84.57
CSP-1 Supplier 40 0.333 0.9984 430.09 0.72 5.07 84.82
CSP-1 Supplier 40 0.5 0.9987 435.27 0.57 5.11 85.18
118

DA Biosecurity: Plant-Product Pathways CSP and Data-Mining
Table B.18: List of all possible combinations of given CN and MF for the dried dates pathway,stratified by importer and using a CSP-3 inspection rule. Insp is the number of inspectedconsignments, Intc and Lk stand for the numbers of consignments containing biosecurity riskmaterial that were found and leaked, respectively, during the process of simulation. IPD, whichcan be calculated by Insp/Intc, gives efficiencies of the listed inspection strategies.
Rule Class CN MF PIC Insp Lk Intc IPD
CSP-3 Importer 5 0.1 0.9963 216.65 1.67 4.15 52.20
CSP-3 Importer 5 0.2 0.9963 243.44 1.66 4.19 58.10
CSP-3 Importer 5 0.333 0.9970 279.10 1.38 4.42 63.14
CSP-3 Importer 5 0.5 0.9972 321.72 1.28 4.39 73.28
CSP-3 Importer 10 0.1 0.9964 274.00 1.65 4.11 66.67
CSP-3 Importer 10 0.2 0.9965 294.36 1.58 4.24 69.42
CSP-3 Importer 10 0.333 0.9965 321.74 1.60 4.12 78.09
CSP-3 Importer 10 0.5 0.9973 354.83 1.21 4.52 78.50
CSP-3 Importer 20 0.1 0.9966 327.35 1.56 4.25 77.02
CSP-3 Importer 20 0.2 0.9967 342.82 1.51 4.31 79.54
CSP-3 Importer 20 0.333 0.9974 361.19 1.19 4.56 79.21
CSP-3 Importer 20 0.5 0.9976 384.41 1.07 4.72 81.44
CSP-3 Importer 40 0.1 0.9986 410.74 0.64 5.12 80.20
CSP-3 Importer 40 0.2 0.9985 413.71 0.70 4.95 83.58
CSP-3 Importer 40 0.333 0.9988 421.24 0.54 5.16 81.64
CSP-3 Importer 40 0.5 0.9988 429.12 0.53 5.16 83.16
119
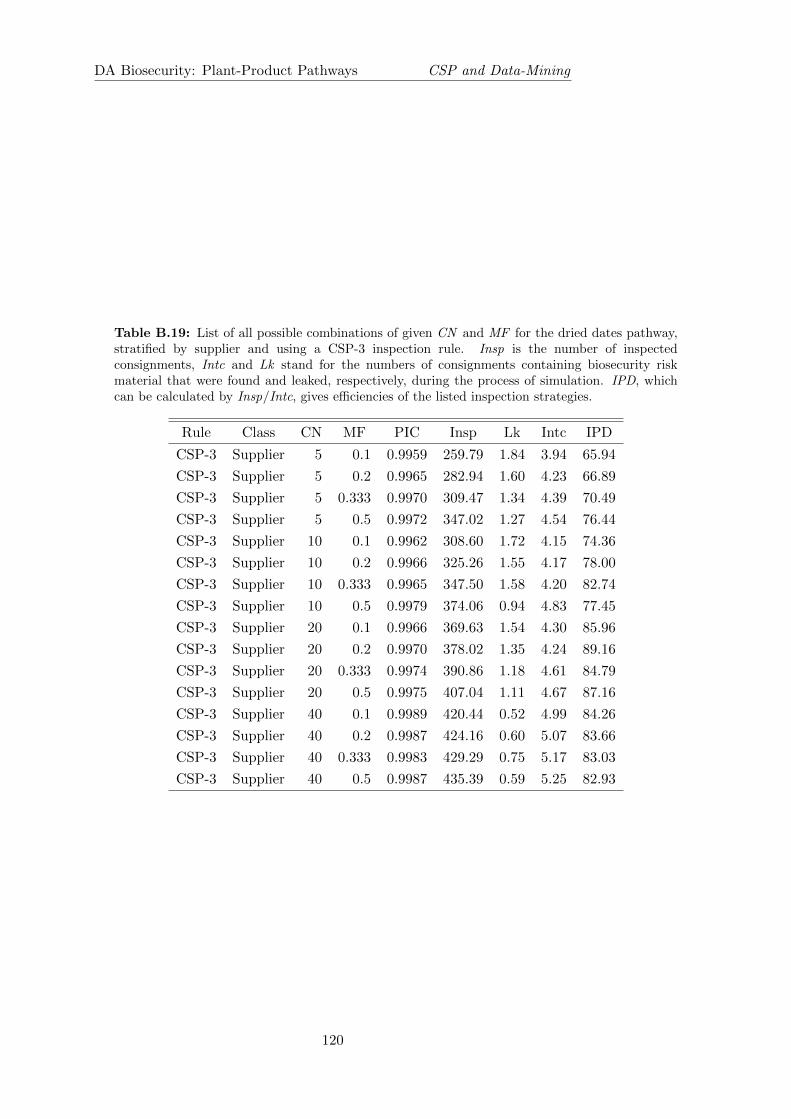
DA Biosecurity: Plant-Product Pathways CSP and Data-Mining
Table B.19: List of all possible combinations of given CN and MF for the dried dates pathway,stratified by supplier and using a CSP-3 inspection rule. Insp is the number of inspectedconsignments, Intc and Lk stand for the numbers of consignments containing biosecurity riskmaterial that were found and leaked, respectively, during the process of simulation. IPD, whichcan be calculated by Insp/Intc, gives efficiencies of the listed inspection strategies.
Rule Class CN MF PIC Insp Lk Intc IPD
CSP-3 Supplier 5 0.1 0.9959 259.79 1.84 3.94 65.94
CSP-3 Supplier 5 0.2 0.9965 282.94 1.60 4.23 66.89
CSP-3 Supplier 5 0.333 0.9970 309.47 1.34 4.39 70.49
CSP-3 Supplier 5 0.5 0.9972 347.02 1.27 4.54 76.44
CSP-3 Supplier 10 0.1 0.9962 308.60 1.72 4.15 74.36
CSP-3 Supplier 10 0.2 0.9966 325.26 1.55 4.17 78.00
CSP-3 Supplier 10 0.333 0.9965 347.50 1.58 4.20 82.74
CSP-3 Supplier 10 0.5 0.9979 374.06 0.94 4.83 77.45
CSP-3 Supplier 20 0.1 0.9966 369.63 1.54 4.30 85.96
CSP-3 Supplier 20 0.2 0.9970 378.02 1.35 4.24 89.16
CSP-3 Supplier 20 0.333 0.9974 390.86 1.18 4.61 84.79
CSP-3 Supplier 20 0.5 0.9975 407.04 1.11 4.67 87.16
CSP-3 Supplier 40 0.1 0.9989 420.44 0.52 4.99 84.26
CSP-3 Supplier 40 0.2 0.9987 424.16 0.60 5.07 83.66
CSP-3 Supplier 40 0.333 0.9983 429.29 0.75 5.17 83.03
CSP-3 Supplier 40 0.5 0.9987 435.39 0.59 5.25 82.93
120
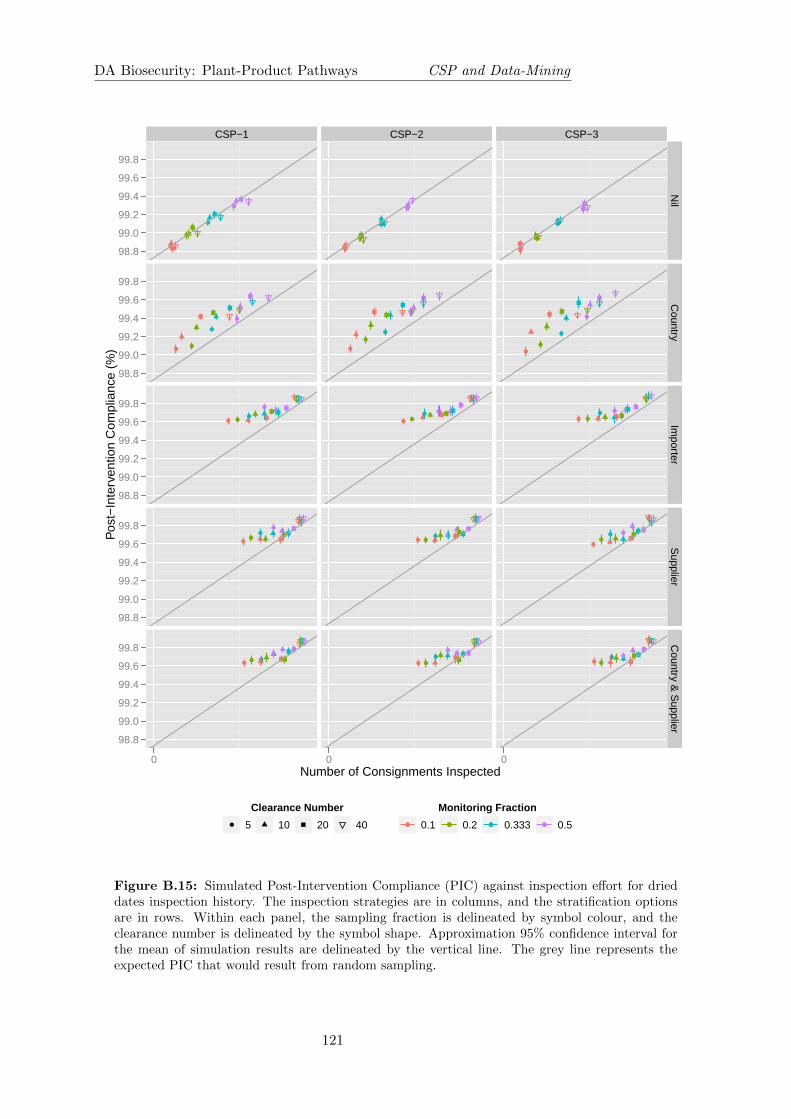
DA Biosecurity: Plant-Product Pathways CSP and Data-Mining
Number of Consignments Inspected
Pos
t−In
terv
entio
n C
ompl
ianc
e (%
)
98.8
99.0
99.2
99.4
99.6
99.8
98.8
99.0
99.2
99.4
99.6
99.8
98.8
99.0
99.2
99.4
99.6
99.8
98.8
99.0
99.2
99.4
99.6
99.8
98.8
99.0
99.2
99.4
99.6
99.8
CSP−1
●
●
●
●
●●
●
●
● ●●
●
●●
●
●
●● ●
●
0
CSP−2
●
●
●
●
●
●
●
●
●●
●●
● ●● ●
● ●
●
●
0
CSP−3
●
●
●
●
●
●
●
●
● ●
●●
●●
● ●
● ●
● ●
0
Nil
Country
Importer
Supplier
Country &
Supplier
Clearance Number● 5 10 20 40
Monitoring Fraction
● 0.1 ● 0.2 ● 0.333 ● 0.5
Figure B.15: Simulated Post-Intervention Compliance (PIC) against inspection effort for drieddates inspection history. The inspection strategies are in columns, and the stratification optionsare in rows. Within each panel, the sampling fraction is delineated by symbol colour, and theclearance number is delineated by the symbol shape. Approximation 95% confidence interval forthe mean of simulation results are delineated by the vertical line. The grey line represents theexpected PIC that would result from random sampling.
121
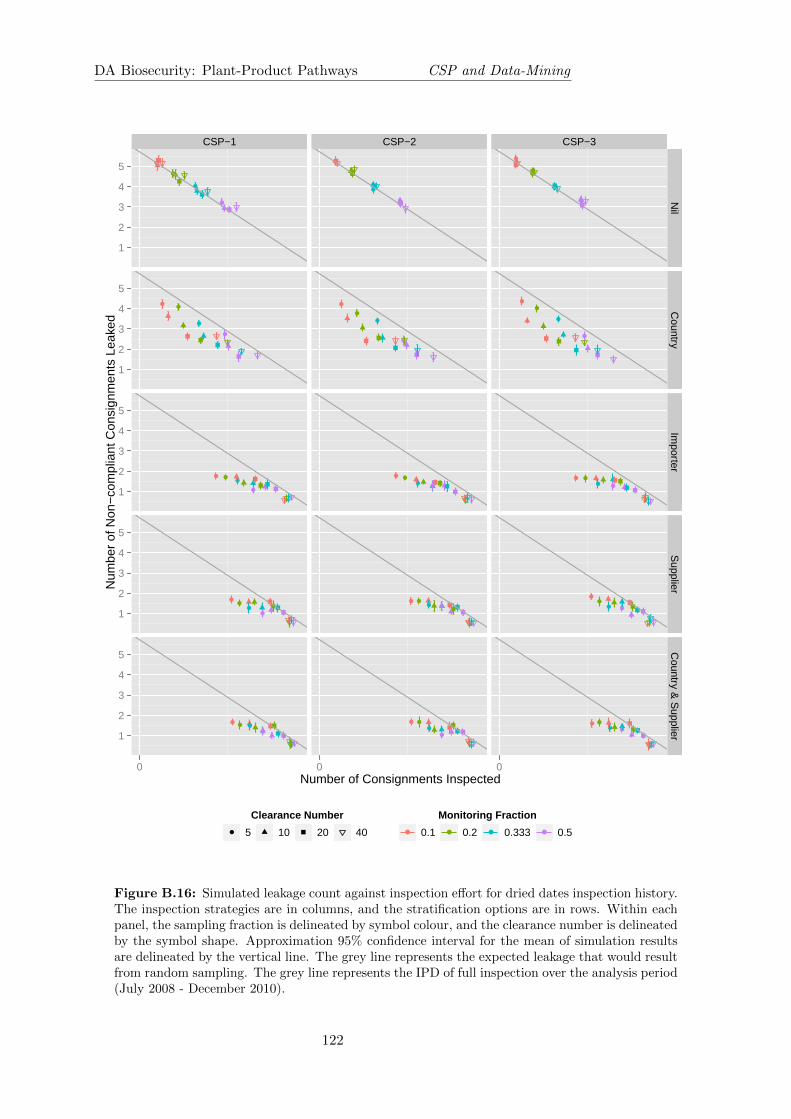
DA Biosecurity: Plant-Product Pathways CSP and Data-Mining
Number of Consignments Inspected
Num
ber
of N
on−
com
plia
nt C
onsi
gnm
ents
Lea
ked
1
2
3
4
5
1
2
3
4
5
1
2
3
4
5
1
2
3
4
5
1
2
3
4
5
CSP−1
●
●
●
●
●●
●
●
● ●●
●
●●
●
●
●● ●
●
0
CSP−2
●
●
●
●
●
●
●
●
●●
●●
● ●● ●
● ●
●
●
0
CSP−3●
●
●
●
●
●
●
●
● ●
●●
●●
● ●
● ●
● ●
0
Nil
Country
Importer
Supplier
Country &
Supplier
Clearance Number● 5 10 20 40
Monitoring Fraction
● 0.1 ● 0.2 ● 0.333 ● 0.5
Figure B.16: Simulated leakage count against inspection effort for dried dates inspection history.The inspection strategies are in columns, and the stratification options are in rows. Within eachpanel, the sampling fraction is delineated by symbol colour, and the clearance number is delineatedby the symbol shape. Approximation 95% confidence interval for the mean of simulation resultsare delineated by the vertical line. The grey line represents the expected leakage that would resultfrom random sampling. The grey line represents the IPD of full inspection over the analysis period(July 2008 - December 2010).
122
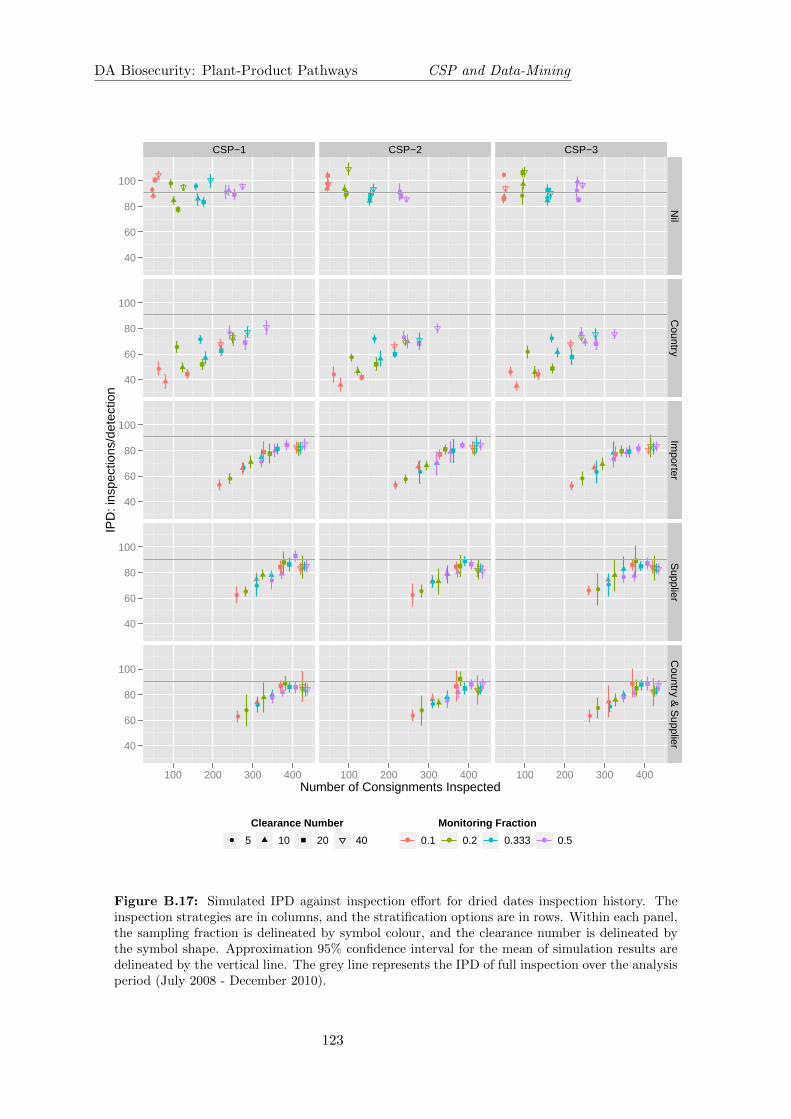
DA Biosecurity: Plant-Product Pathways CSP and Data-Mining
Number of Consignments Inspected
IPD
: ins
pect
ions
/det
ectio
n
40
60
80
100
40
60
80
100
40
60
80
100
40
60
80
100
40
60
80
100
CSP−1
●
●●
●
●
●
●
●
●
●
●
●
●●
●
●
●
●
●
●
100 200 300 400
CSP−2
●
●●
●
●
●
● ●
●
●
●
●
●●
●
●
●
●
●●
100 200 300 400
CSP−3
●
●●
●
●
●
●
●
●
●
●
●
● ●●
●
●
● ●
●
100 200 300 400
Nil
Country
Importer
Supplier
Country &
Supplier
Clearance Number● 5 10 20 40
Monitoring Fraction
● 0.1 ● 0.2 ● 0.333 ● 0.5
Figure B.17: Simulated IPD against inspection effort for dried dates inspection history. Theinspection strategies are in columns, and the stratification options are in rows. Within each panel,the sampling fraction is delineated by symbol colour, and the clearance number is delineated bythe symbol shape. Approximation 95% confidence interval for the mean of simulation results aredelineated by the vertical line. The grey line represents the IPD of full inspection over the analysisperiod (July 2008 - December 2010).
123

Bibliography
[1] Beale, R, Fairbrother, J, Inglis, A and Trebeck,D. (2008) One biosecurity: a workingparternership. A Report released by Australian Government. For details of the report,please see www.quarantinebiosecurityreview.gov.au.
[2] Robinson, A., Bell, J., Woolcott, B. and Perotti, E. (2012). AQIS quarantine operationsrisk return ACERA 1001 Study J: Imported plant-product pathways. Final report.
[3] Robinson, A., Bell, J., Woolcott, B. andKirkham, J. (2012). AQIS quarantine operationsrisk return ACERA 1001 Study C: Imported plant-product pathways. Progress report 1.
[4] Dodge, F. (1943). A sampling plan for continuous production. Ann. Math. Statist. 14, 3,264-279.
[5] Chen, X. (2013). Analysis of Big data by Split-And-Conquer and Penalized Regressions:New Methods and Theories. The State University of New Jersey, PHD thesis,http://rucore.libraries.rutgers.edu/rutgers-lib/39509/.
[6] Tibshirani, R. (1996), Regression shrinkage and selection via the lasso, J. R. Statist. Soc.B 58, 267-288.
[7] Bondell, H.D. and Reich, B.J., (2008). Simultaneous Regression Shrinkage, VariableSelection, and Supervised Clustering of Preditions with OSCAR. Biometreics 64 115-123.
[8] Zhao, S., Arthur, T. and Woolcott, B. (2012). Analysis of Coir Pathway. Internal report,ABARES, Department of Agriculture, Fishries and Forestry.
[9] Egan, J.P., (1975). ( Signal Detection Theory and ROC Analysis, Series in Cognition andPerception. Academic Press, New York.
[10] Breiman, L. Random Forests (2001). Machine Learning 45 5.
[11] Hastie, T and Tibshirani, R. (1986) Generalized additive models. Statistical Science Vol.1 No 3 297-318.
124