requirements effort estimation state of the practice - mohamad kassab
TRANSCRIPT
Requirements Effort Estimation: State of The Practice
Mohamad Kassab [email protected]
IWSM - MENSURA 5 – 7 October 2015
2
OUTLINE
CONTEXT
SURVEY DESIGN
DATA COLLECTION
PROJECTS’ CHARACTERISTICS
CONCLUSION
DATA ANALYSIS: LANDSCAPE OF RE PRACTICES

3
CONTEXT
Agile development practices have become widely accepted as an effective class of approaches to project management in order to have rapid delivery of high-quality software.
Requirements Engineering discipline was challenged under the agile practices.
Little contemporary data exists for document actual practices of software professionals for software RE activities in agile environments.
To remedy this deficiency and provide useful data to other researchers we conducted a survey study on the current RE state of practice.

4
SURVEY DESIGN
The surveys were created as a web-based surveys using the web-based QuestionPro survey tool.
In 2003, 2008 the Advanced SE group at PSGV conducted comprehensive anonymous surveys on RE practices. The 2013 survey is based on these two surveys
Respondents were asked to base all their project responses on one project only that they were either currently involved with or had taken part in during the past five years.

5
DATA COLLECTION
Participants of the survey were drawn from multiple sources.
2003 2008 2013
Number of participants completed the survey 194
93
247
% of participants described their role as product / project Manager; architect, or
analyst
20%
30%
39%
% of participants described their role as programmer / developer, software / system
engineer, tester
80%
70%
61%
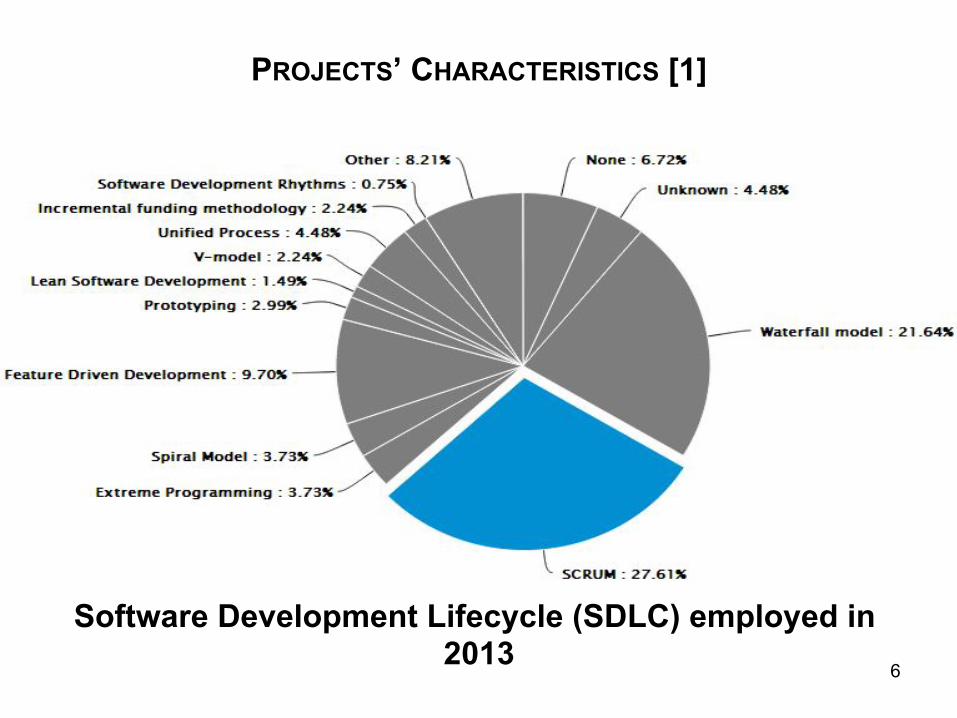
PROJECTS’ CHARACTERISTICS [1]
Software Development Lifecycle (SDLC) employed in 2013
6

PROJECTS’ CHARACTERISTICS [2]
Software Development Life Cycles Adopted Within The Reported Projects in 2003, 2008 and 2013 Surveys. 7
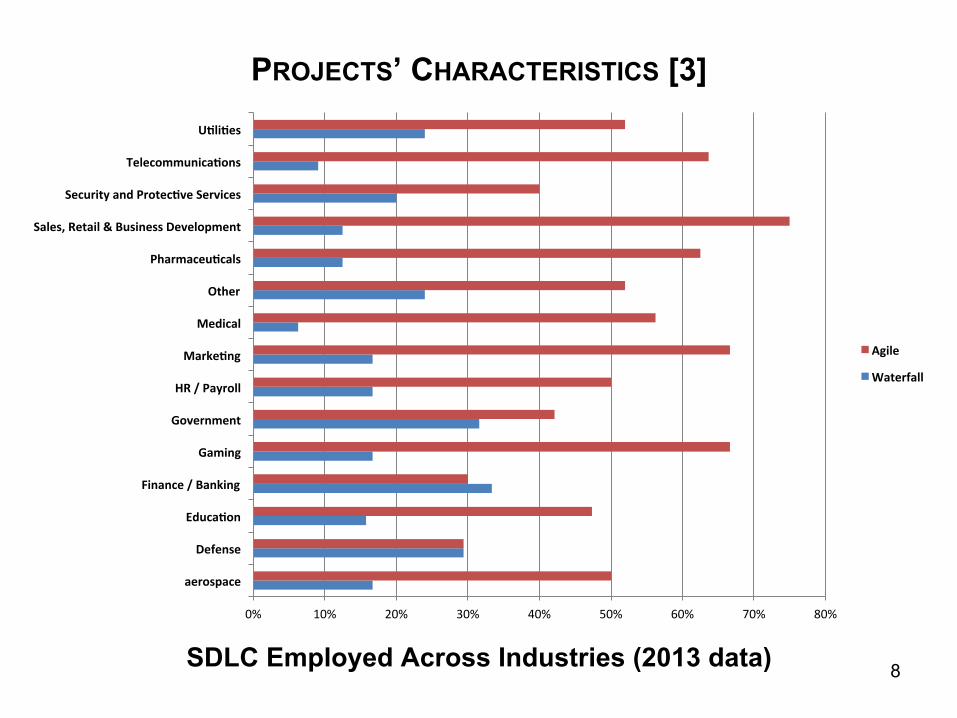
PROJECTS’ CHARACTERISTICS [3]
SDLC Employed Across Industries (2013 data) 8
0% 10% 20% 30% 40% 50% 60% 70% 80%
aerospace
Defense
Educa/on
Finance / Banking
Gaming
Government
HR / Payroll
Marke/ng
Medical
Other
Pharmaceu/cals
Sales, Retail & Business Development
Security and Protec/ve Services
Telecommunica/ons
U/li/es
Agile
Waterfall
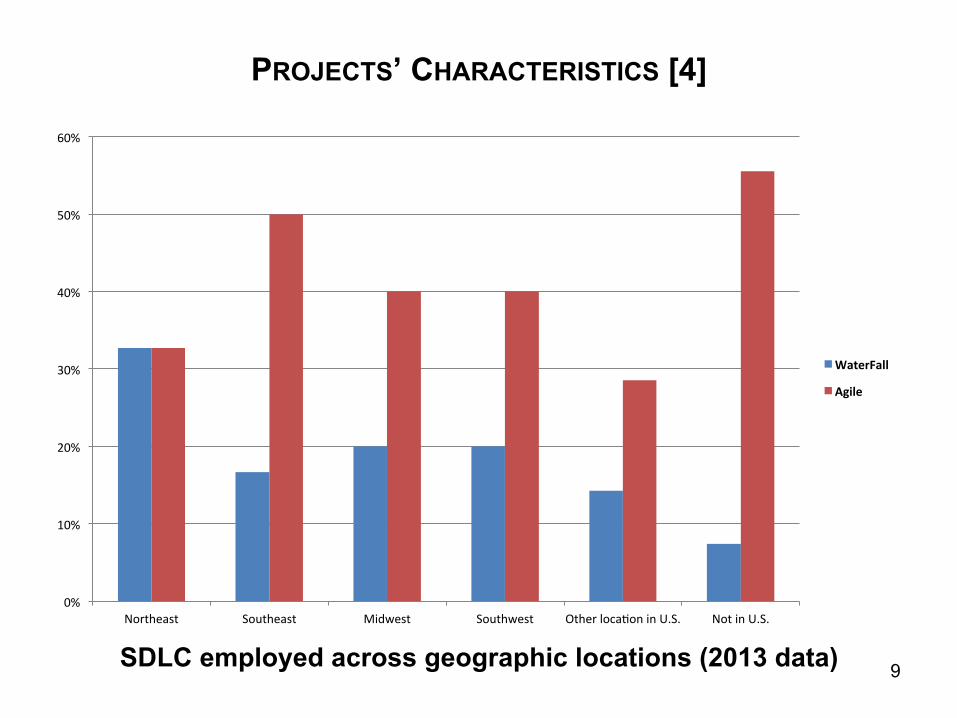
PROJECTS’ CHARACTERISTICS [4]
SDLC employed across geographic locations (2013 data) 9
0%
10%
20%
30%
40%
50%
60%
Northeast Southeast Midwest Southwest Other loca=on in U.S. Not in U.S.
WaterFall
Agile
10
PROJECTS’ CHARACTERISTICS [5]
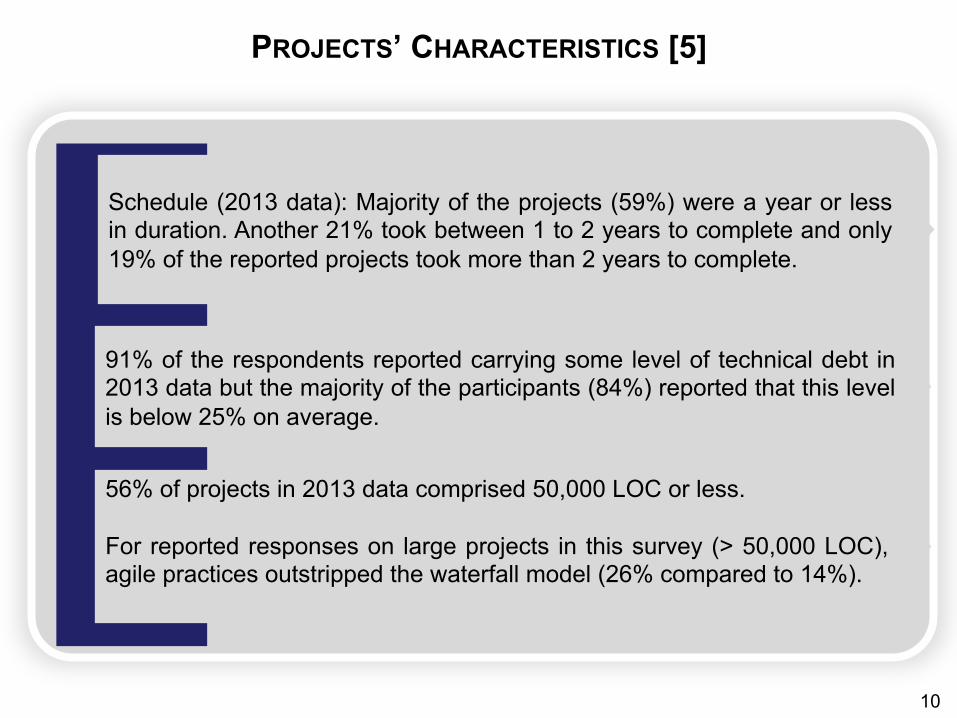
Schedule (2013 data): Majority of the projects (59%) were a year or less in duration. Another 21% took between 1 to 2 years to complete and only 19% of the reported projects took more than 2 years to complete.
91% of the respondents reported carrying some level of technical debt in 2013 data but the majority of the participants (84%) reported that this level is below 25% on average.
56% of projects in 2013 data comprised 50,000 LOC or less. For reported responses on large projects in this survey (> 50,000 LOC), agile practices outstripped the waterfall model (26% compared to 14%).
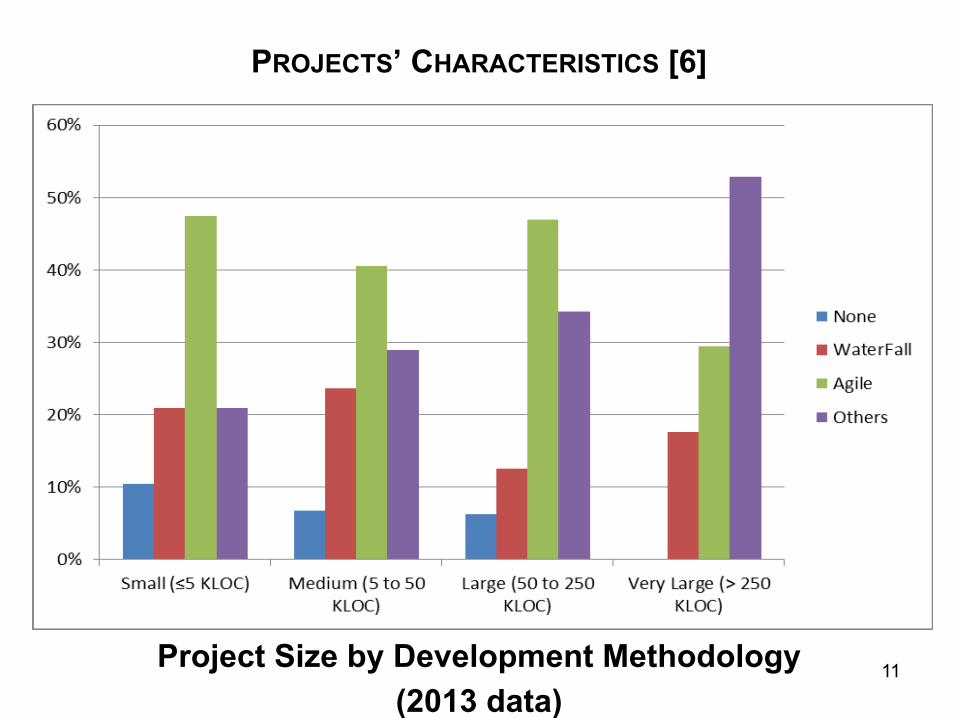
PROJECTS’ CHARACTERISTICS [6]
Project Size by Development Methodology (2013 data)
11
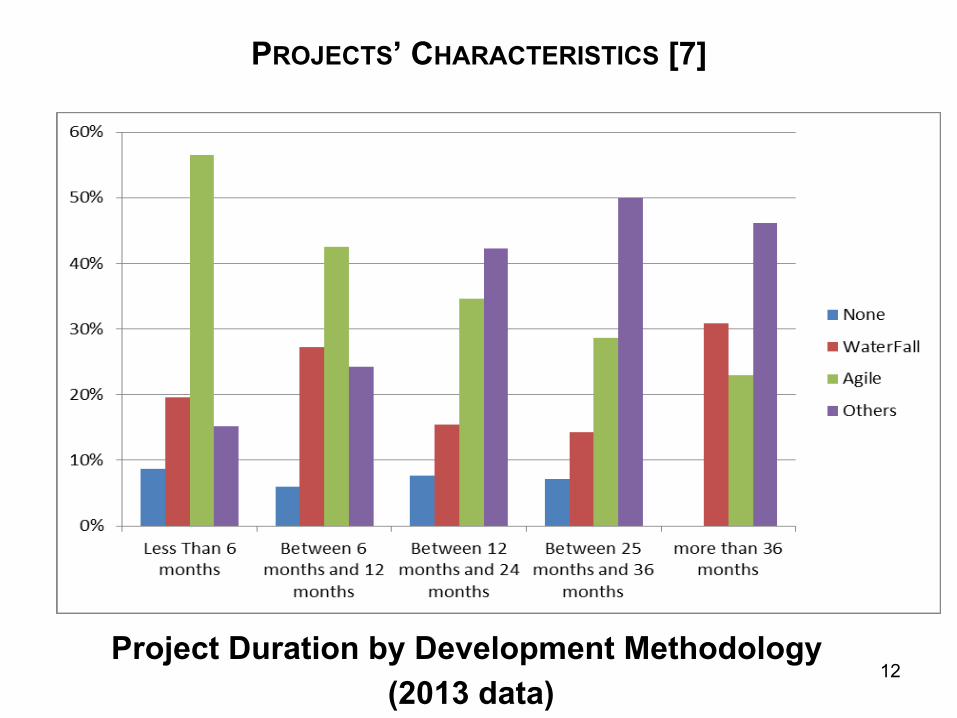
PROJECTS’ CHARACTERISTICS [7]
Project Duration by Development Methodology (2013 data)
12
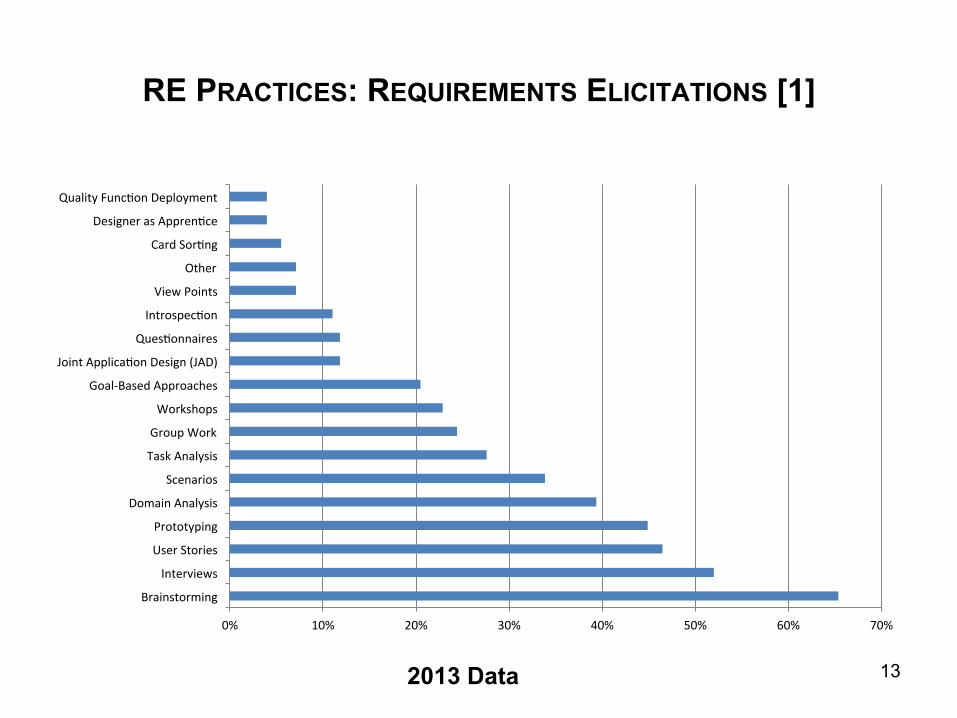
RE PRACTICES: REQUIREMENTS ELICITATIONS [1]
13
0% 10% 20% 30% 40% 50% 60% 70%
Brainstorming
Interviews
User Stories
Prototyping
Domain Analysis
Scenarios
Task Analysis
Group Work
Workshops
Goal-‐Based Approaches
Joint Applica=on Design (JAD)
Ques=onnaires
Introspec=on
View Points
Other
Card Sor=ng
Designer as Appren=ce
Quality Func=on Deployment
2013 Data
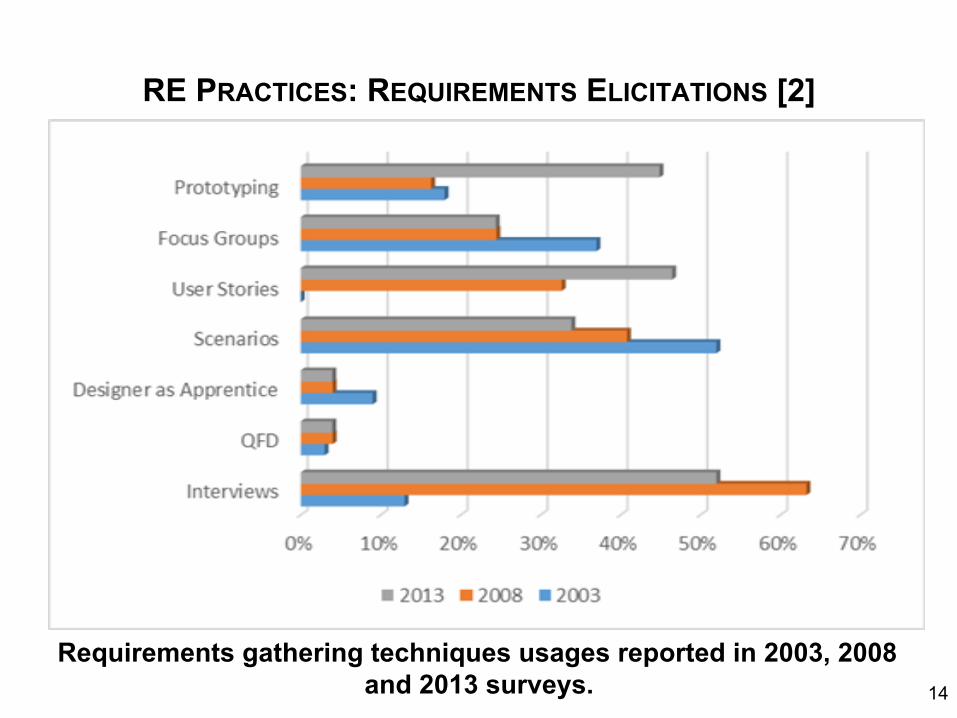
RE PRACTICES: REQUIREMENTS ELICITATIONS [2]
Requirements gathering techniques usages reported in 2003, 2008 and 2013 surveys.
14
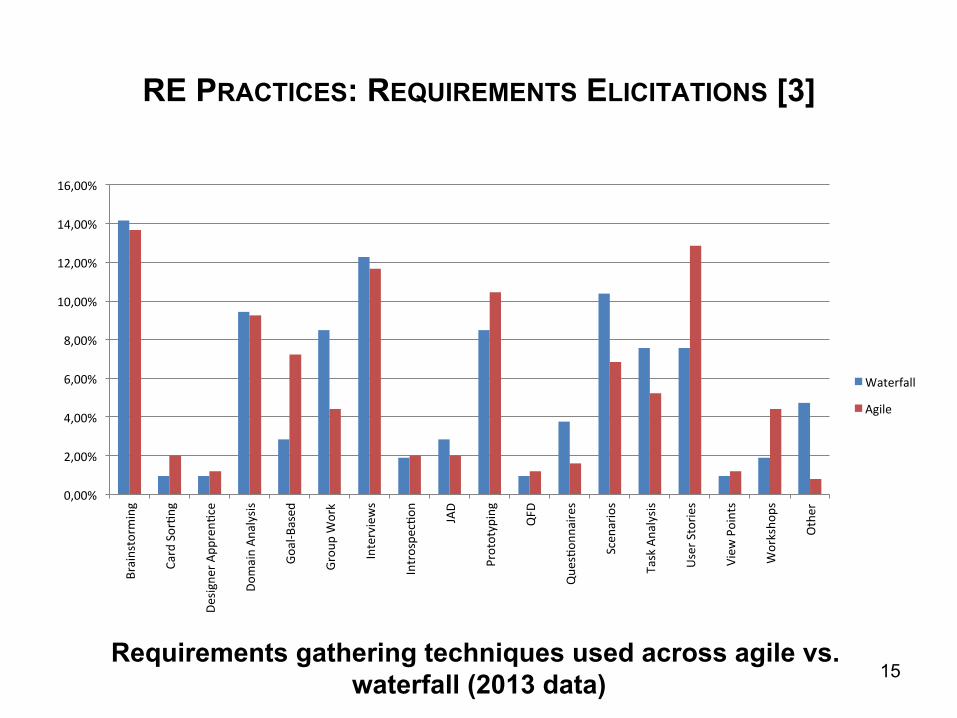
RE PRACTICES: REQUIREMENTS ELICITATIONS [3]
0,00%
2,00%
4,00%
6,00%
8,00%
10,00%
12,00%
14,00%
16,00%
Brainstorm
ing
Card Sor=n
g
Desig
ner A
ppren=
ce
Domain An
alysis
Goal-‐Based
Grou
p Work
Interviews
Introspe
c=on
JAD
Prototyping
QFD
Que
s=on
naire
s
Scen
arios
Task Analysis
User S
torie
s
View
Points
Worksho
ps
Other
Waterfall
Agile
Requirements gathering techniques used across agile vs. waterfall (2013 data)
15

RE PRACTICES: REQUIREMENTS ANALYSIS AND PRESENTATIONS [1]
0% 5% 10% 15% 20% 25% 30% 35% 40% 45%
No Methodology
Structured Analysis and Design (SADT)
Object Oriented Analysis
Structured Requirements Defini=on (SRD)
Other
Agile
Waterfall
Requirements analysis techniques used across agile vs. waterfall (2013 data) 16
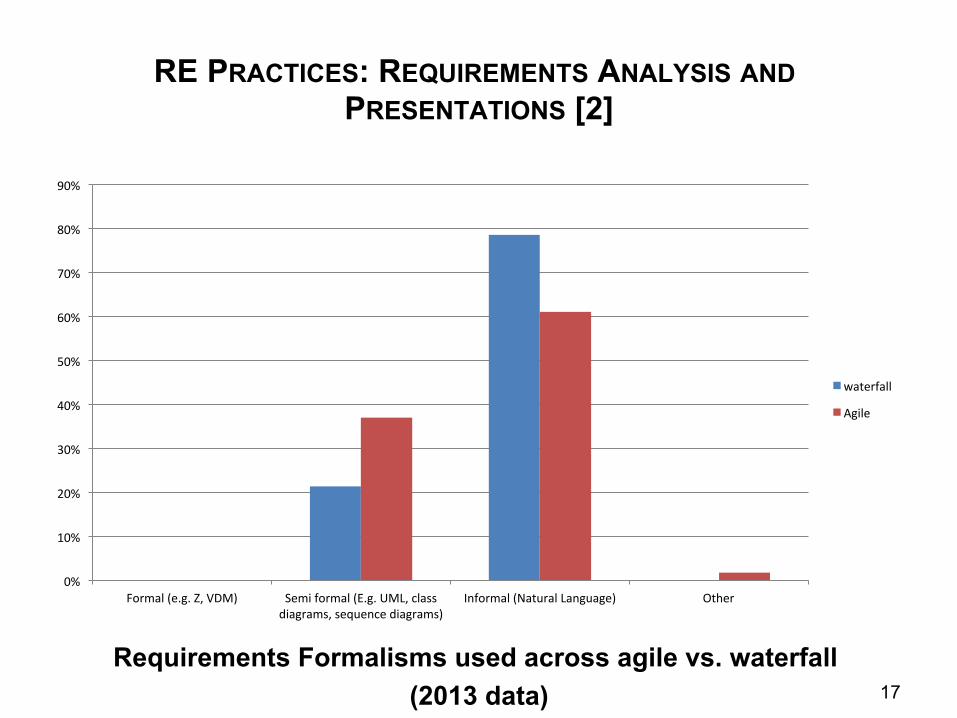
RE PRACTICES: REQUIREMENTS ANALYSIS AND PRESENTATIONS [2]
0%
10%
20%
30%
40%
50%
60%
70%
80%
90%
Formal (e.g. Z, VDM) Semi formal (E.g. UML, class diagrams, sequence diagrams)
Informal (Natural Language) Other
waterfall
Agile
Requirements Formalisms used across agile vs. waterfall (2013 data)
17
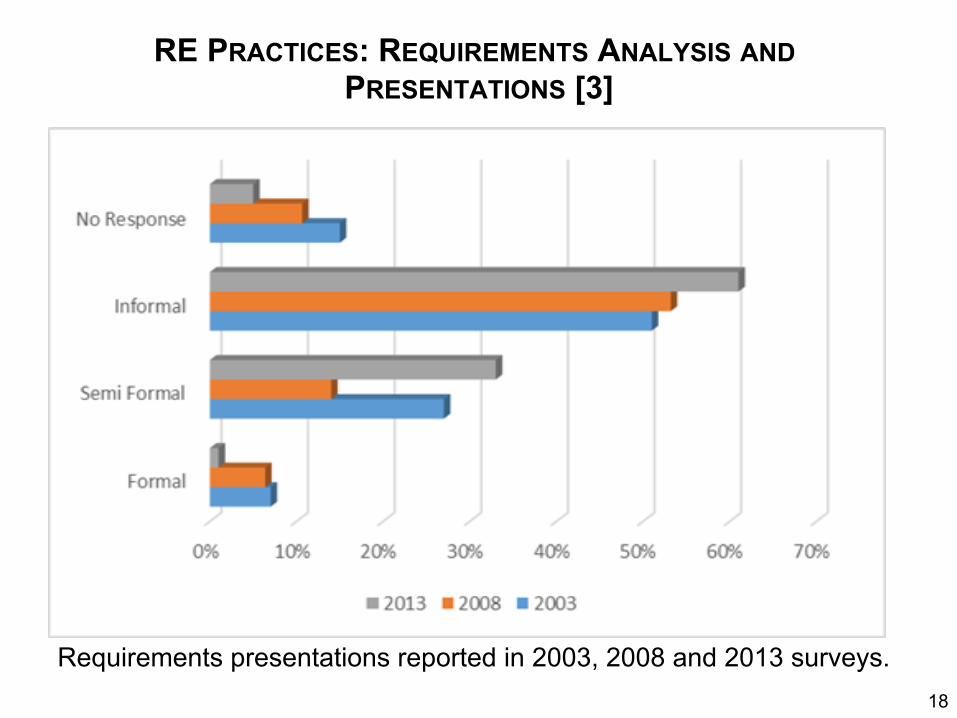
RE PRACTICES: REQUIREMENTS ANALYSIS AND PRESENTATIONS [3]
Requirements presentations reported in 2003, 2008 and 2013 surveys. 18
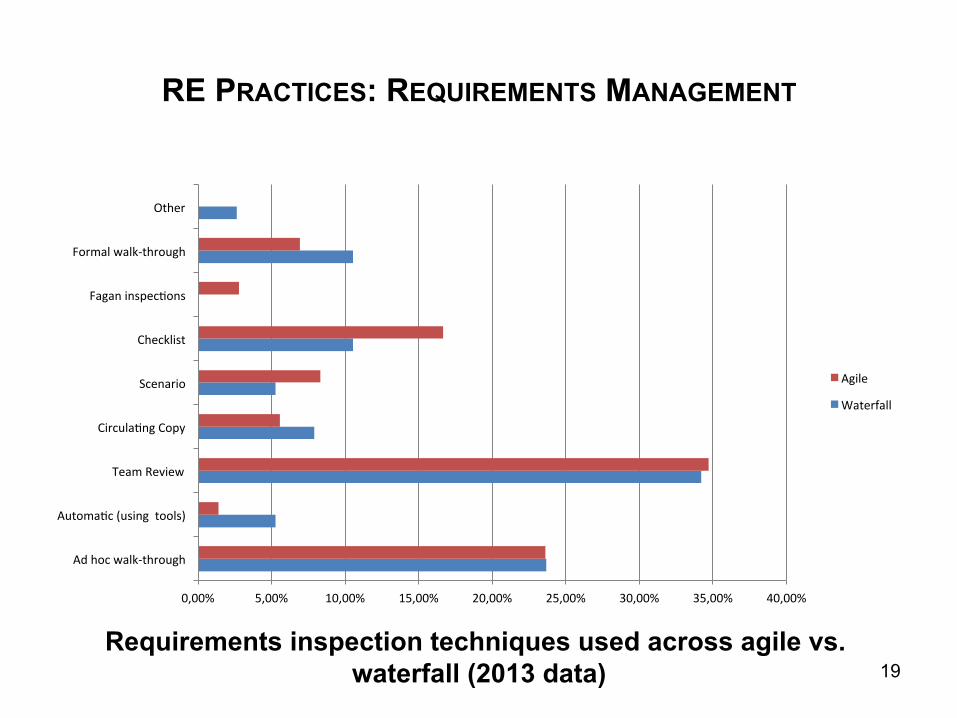
RE PRACTICES: REQUIREMENTS MANAGEMENT
0,00% 5,00% 10,00% 15,00% 20,00% 25,00% 30,00% 35,00% 40,00%
Ad hoc walk-‐through
Automa=c (using tools)
Team Review
Circula=ng Copy
Scenario
Checklist
Fagan inspec=ons
Formal walk-‐through
Other
Agile
Waterfall
Requirements inspection techniques used across agile vs. waterfall (2013 data) 19
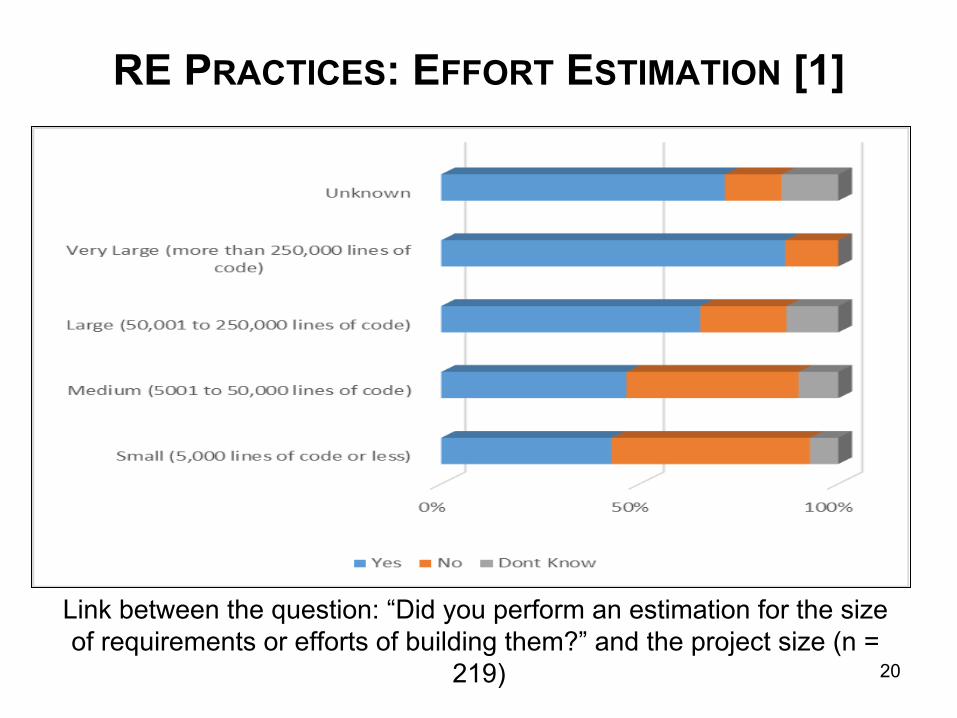
RE PRACTICES: EFFORT ESTIMATION [1]
Link between the question: “Did you perform an estimation for the size of requirements or efforts of building them?” and the project size (n =
219) 20
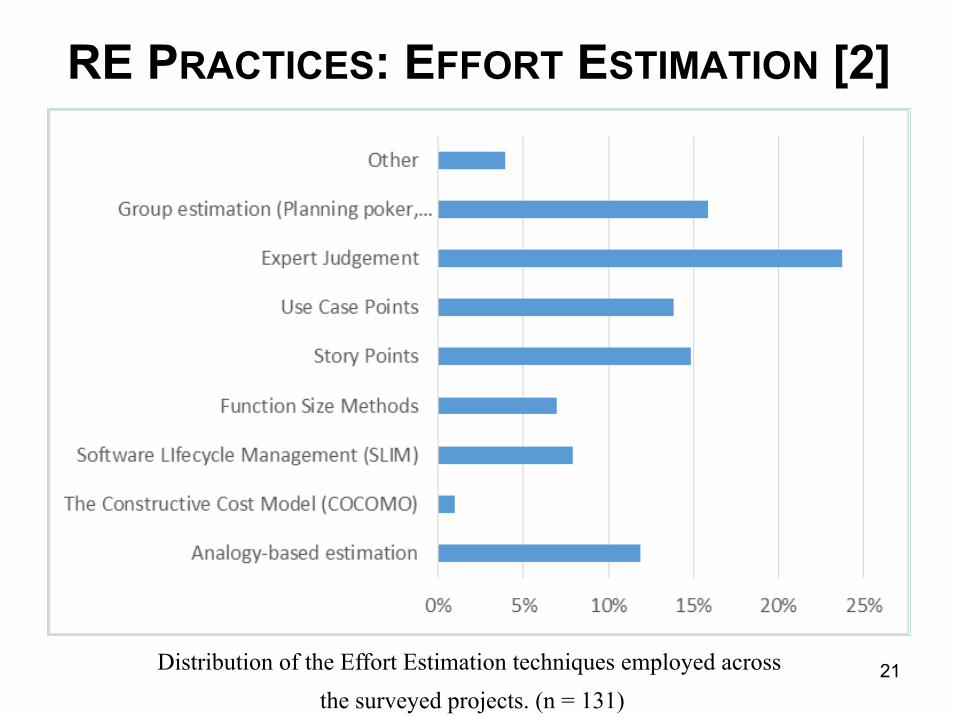
RE PRACTICES: EFFORT ESTIMATION [2]
21 Distribution of the Effort Estimation techniques employed across the surveyed projects. (n = 131)
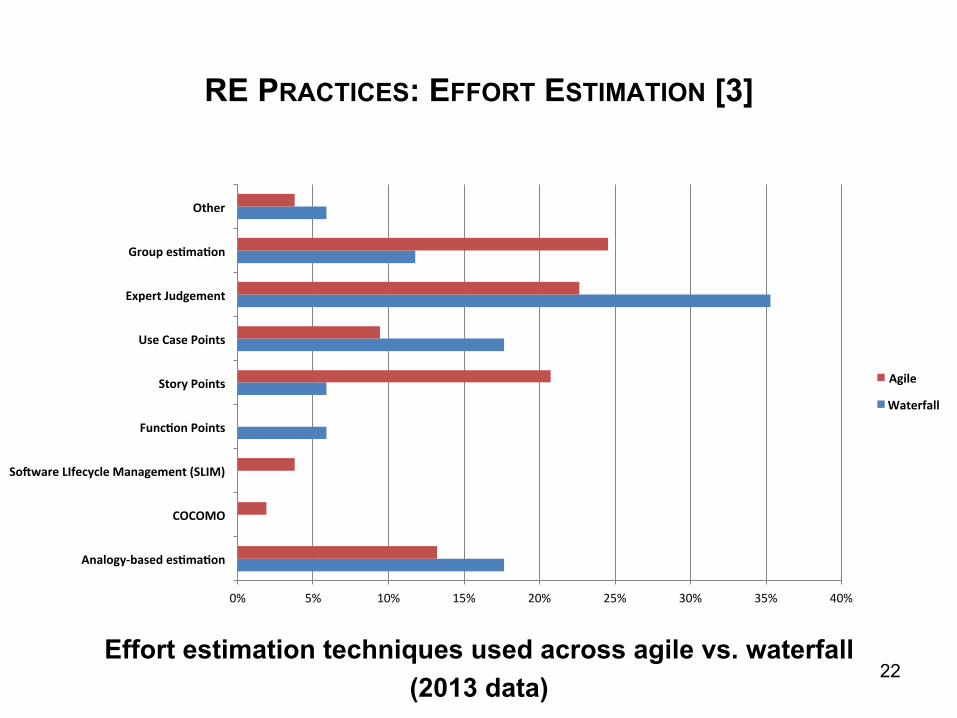
RE PRACTICES: EFFORT ESTIMATION [3]
0% 5% 10% 15% 20% 25% 30% 35% 40%
Analogy-‐based es/ma/on
COCOMO
SoLware LIfecycle Management (SLIM)
Func/on Points
Story Points
Use Case Points
Expert Judgement
Group es/ma/on
Other
Agile
Waterfall
Effort estimation techniques used across agile vs. waterfall (2013 data)
22
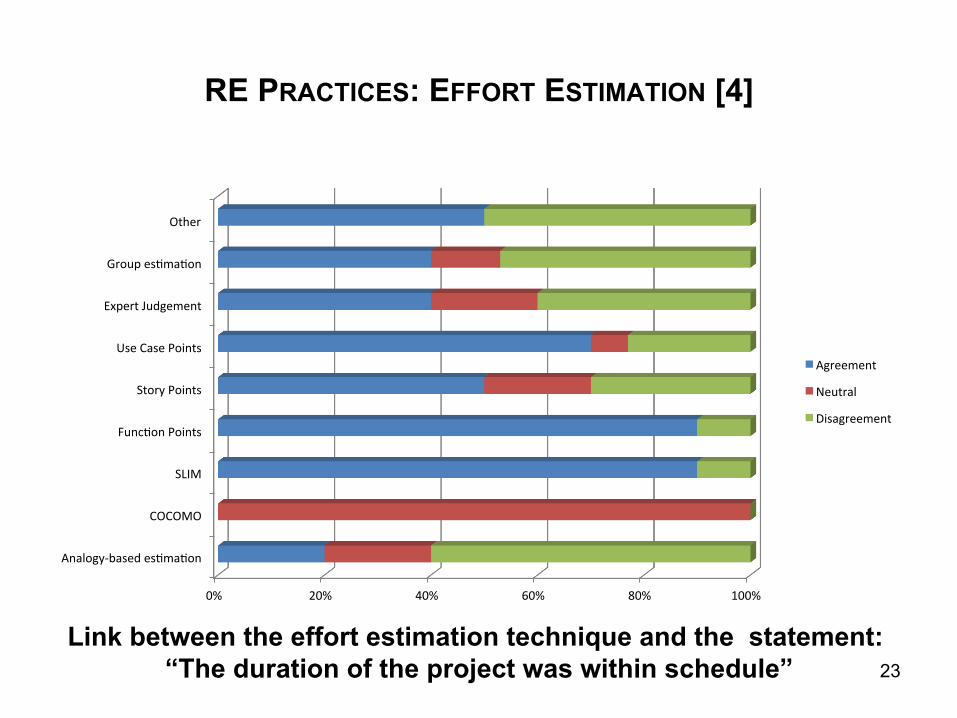
RE PRACTICES: EFFORT ESTIMATION [4]
Link between the effort estimation technique and the statement: “The duration of the project was within schedule” 23
0% 20% 40% 60% 80% 100%
Analogy-‐based es=ma=on
COCOMO
SLIM
Func=on Points
Story Points
Use Case Points
Expert Judgement
Group es=ma=on
Other
Agreement
Neutral
Disagreement
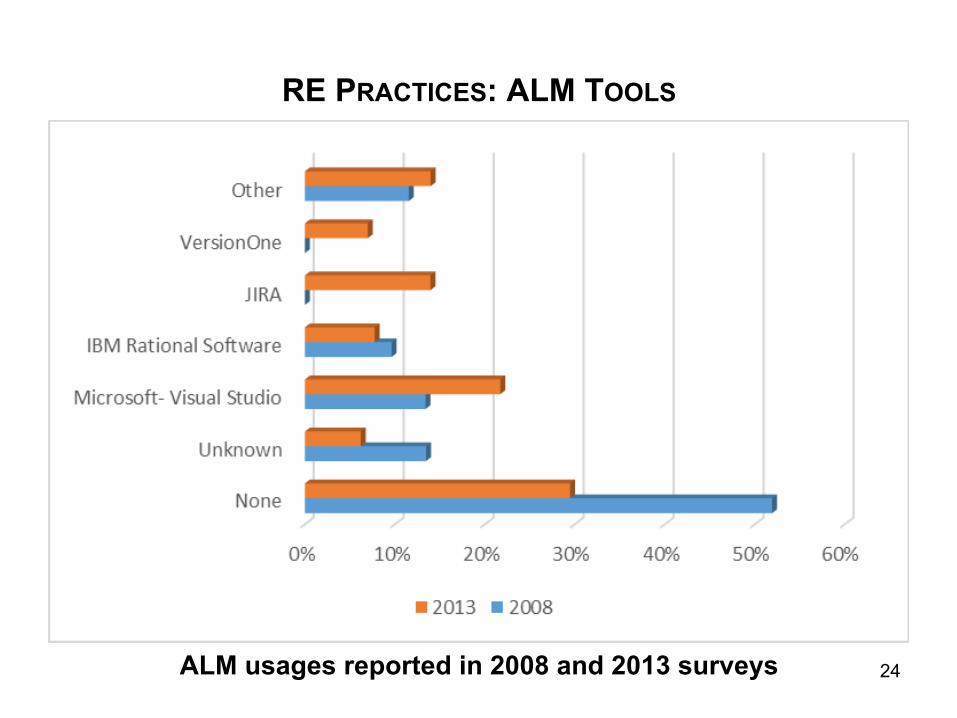
RE PRACTICES: ALM TOOLS
ALM usages reported in 2008 and 2013 surveys 24
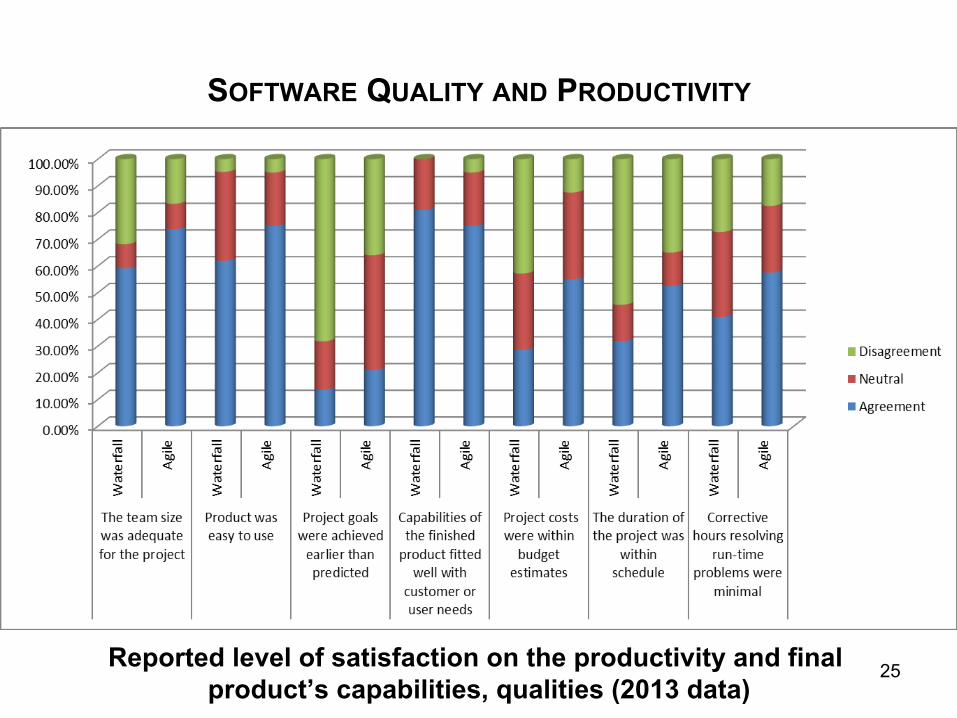
SOFTWARE QUALITY AND PRODUCTIVITY
Reported level of satisfaction on the productivity and final product’s capabilities, qualities (2013 data)
25
26
CONCLUSIONS [1]
There were a number of RE practices showing no significant changes since the past surveys including requirements inspection, and prototyping – although throwaway prototyping has seen a significant decline with the emergence of refactoring.
A number of practices were surprising findings considering the background on agile (e.g. usage of ALM, OO analysis, considering NFRs in effort estimation).
Even though some techniques were developed specifically for a particular SDLC methodology (e.g. user stories for agile); it is interesting to see these techniques finding their way to the other SDLC methodologies (e.g. user stories in waterfall).

Conclusions [2]
Reported level of satisfaction in RE practices across agile vs. waterfall (2013 data) 27

THANK YOU !