rewriting the rules for total cost of storage ownership michael marchi senior director, enterprise...
TRANSCRIPT

Rewriting the Rulesfor
Total Cost of Storage Ownership
Michael MarchiSenior Director, Enterprise Marketing
PRESENTATION HAS NOTES FOR EACH SLIDE
2
Agenda
Understanding Total Cost of Storage Ownership
Methodology for lowering Total Cost of Storage Ownership
Results of third party studies on NetApp and TCO
How NetApp specifically lowers Total Cost of Storage Ownership
Customer Examples

3
Total Cost of Storage OwnershipFactors That Effect TCO
Initial investment cost
Cost of downtime
Operational cost

4
Initial Investment CostImportant Considerations
Initial cost of storage hardware, software, and services over 3 year period
Will data be shared today or in the future?
Will point and time copies be required?
Will disaster recovery / replication be required?

5
Single Copy Data Sharing
NT Data Unix Data
20 TeraBytes 20 TeraBytes
Traditional Disk sharing Single Copy Data sharing
Total Storage = 40 TB
NT Data Unix Data
Total Storage = 30 TB
Same Data with 50% Shared

6
Network Centric Database Example
IBM DB2 or Oracle Database
Sun
UNIXApplication Server
Compaq
Windows Reporting Tool
7
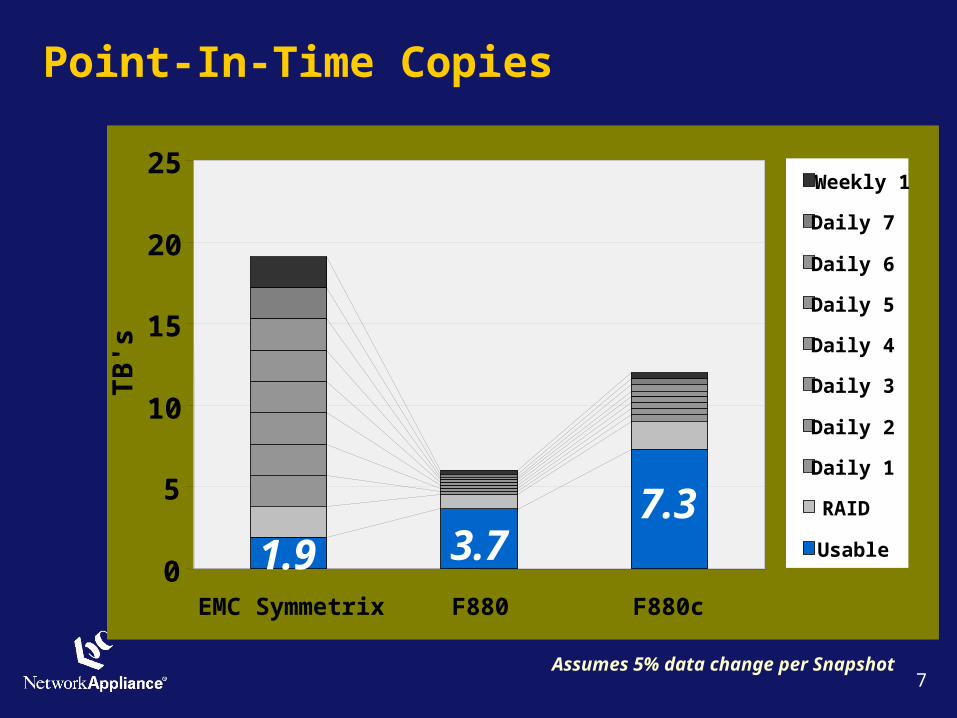
Point-In-Time Copies
0
5
10
15
20
25
EMC Symmetrix F880 F880c
TB
's
Weekly 1
Daily 7
Daily 6
Daily 5
Daily 4
Daily 3
Daily 2
Daily 1
RAID
Assumes 5% data change per Snapshot
3.71.9 Usable
7.3

8
Disaster Recovery
0
5
10
15
20
25
EMC Symmetrix F880 F880c
TB
's
Weekly 1
Daily 7
Daily 6
Daily 5
Daily 4
Daily 3
Daily 2
Daily 1
RAID
3.71.9 Usable
7.3
X 2

9
Information Availability - Cost of Downtime
Source: GartnerGroup
Productivity number of employees impacted time hours out times burdened hourly rate
Damaged Reputation customers suppliers financial markets banks business partners etc.
Other Expenses Temporary employees, equipment rental, overtime costs, extra
shipping costs, travel expenses, etc.
Financial Performance revenue recognition cash flow lost discounts (A/P) payment guarantees credit rating stock price
Revenue direct loss compensatory payments lost future revenues billing losses investment losses
Know your downtime costs per hour, day, two days, etc.

10
Measuring Cost of Downtime
Cost of downtime/hr for application data on storage subsystems
X Hours of planned downtime (measure current versus proposed)
+ Hours of unplanned downtime (measure current versus proposed)
StorageAppsServers
11
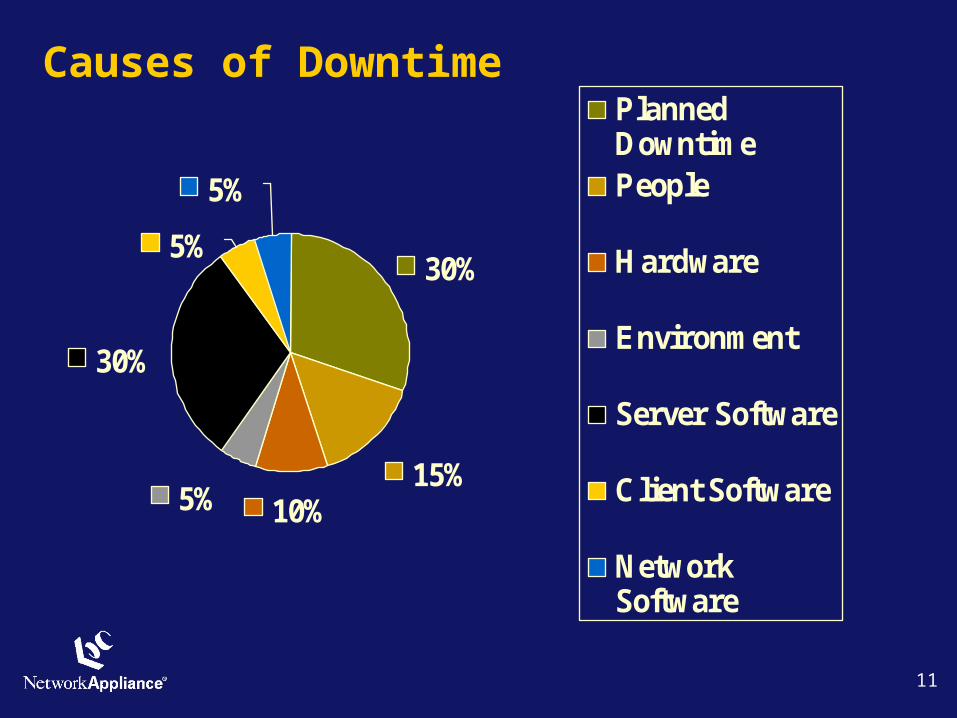
Causes of Downtime
30%
15%10%5%
30%
5%
5%
PlannedDowntimePeople
Hardware
Environment
Server Software
Client Software
NetworkSoftware

12
Activities Freq. Other NetApp Capacity Planning & Expansion
2 8 hrs 10 mins
Storage Reconfiguration 1 8 hrs 15 mins
Upgrades 2 8 hrs 6 mins
Performance Tuning 1 6 hrs -
System Changes 1 4 hrs 3 mins
New Systems 1 4 hrs 3 mins
Total Downtime 38 hrs 37 mins
Minimizing Planned Downtime
Planned downtime is a major contributor to dataavailability
NetApp storage appliances require planned downtime of ~30 minutes annually
Compared to a 38 hours of downtime with a conventional solution At a rate of $50K per hour, this translates to lost revenue of $1.9
million compared to $31K with Network Appliance

13
Minimizing Planned Downtime
Snapshots Online Backup with zero application downtime Perform backups from Snapshot will production
volume remains online Store 31 Snapshots online with minimal overhead
Non-disruptive upgrades
Transparent scalability Adding storage (shelves and drives) with zero
application downtime (and app servers too!)

14
OperatorErrors
ApplicationErrors
TechnologyFailures
Causes of Unplanned Downtime
20%
40%
40%
Less Components Redundant Components Cluster Failover SnapMirror™ for DR
Appliance Paradigm Ease of Management Plug-n-play Low Product Complexity
Multiple point-in-time copy with low overhead
Fast Recovery of Entire Filesystem, Database
Source: GartnerGroup, 1999
15
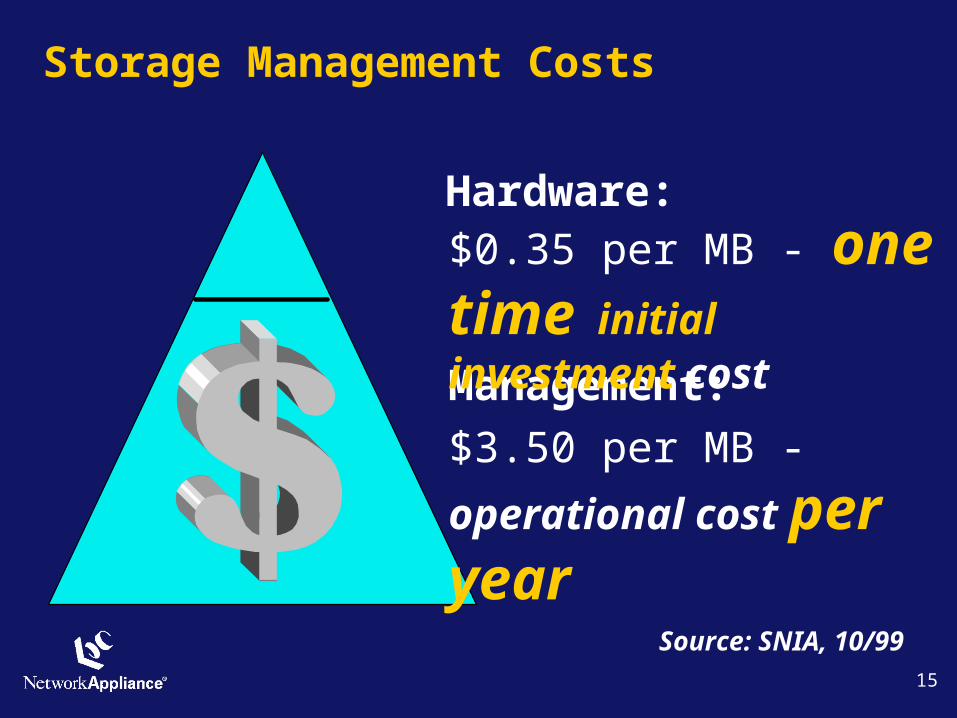
Storage Management Costs
Management:
$3.50 per MB - operational
cost per year
Hardware:$0.35 per MB - one time initial investment cost
Source: SNIA, 10/99

16
Operational Cost Activities
Backup and recovery Supplying data where needed -
revenue and profit opportunity Management and operations -
costs escalate, can't hire skilled staff
Scaling storage infrastructure Reducing latency 7x24 availability

17
Lowering Total Cost of Storage OwnershipMethodology
Select architecture that provides lowest TCO
Evaluate and select vendor that provides lowest TCO within that architecture
Evaluate utilizing lowest TCO architecture and vendor solution for all new project deployments

18
TCO – Architecture Choices
Server Centric
Network Centric
Gbit SAN
Storage Centric
FC-AL SAN
L
O
W
E
R
T
C
O

19
GartnerGroupTotal Cost of Storage Ownership Report
“NAS cost saving is $13,650 per storage expansion when compared to SAN”

20
GartnerGroup
“NAS offers lower cost per storage unit while decreasing systems administration costs”
“The implementation of a large SAN requires significant initial effort and expense that *may* be recovered over time”
Source: Gartner Viewpoint - NAS or SAN: choose the best strategy for your enterprise August 21, 2001

21
TCO Study byDetails
63 users of data storage solutions surveyed with all solutions running Oracle database applications
Respondents were asked to provide data availability service levels, quantify time spent on database administration tasks, and describe back up and recovery procedures.
Respondents were asked to provide product; implementation; support; operations & maintenance; and downtime costs.

22
TCO Study bySurvey Respondents by Annual Company Revenue
35%
27%
17%
15% 6%
Less than $250M
$250M - $1B
$1B - $10B
$10B - $25B
Greater than$25B
23
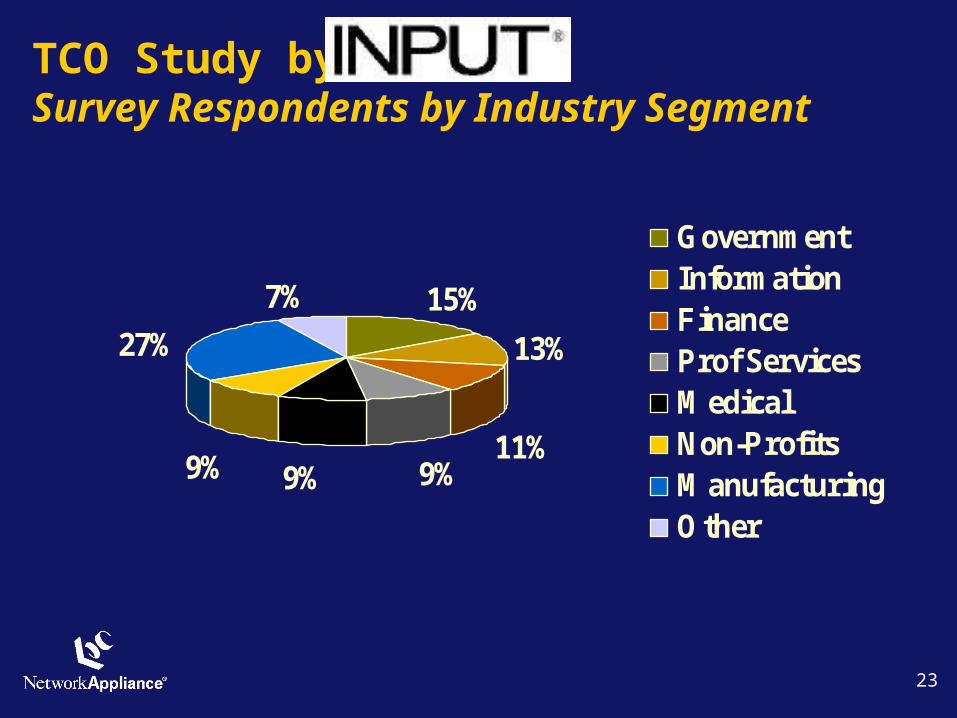
TCO Study bySurvey Respondents by Industry Segment
15%
13%
11%9%9%9%
27%
7%
GovernmentInformationFinanceProf ServicesMedicalNon-ProfitsManufacturingOther

24
TCO Study bySurvey Result by Vendor Brand
40%
21%
17%
22%Compaq
EMC
Hitach
NetworkAppliance

25
TCO Study byDatabase Allocation for Application Types
0% 20% 40% 60% 80%
Data Warehousing
Testing & Reporting
Production
OLTP
ERP
Web Content
E-Commerce
CRM
Other
Percentage of Respondents

26
TCO Study by
Executive Summary
“The total cost of owning the Network Appliance solution is 70% lower than owning SAN solutions from Compaq, EMC, or Hitachi Data Systems”
27
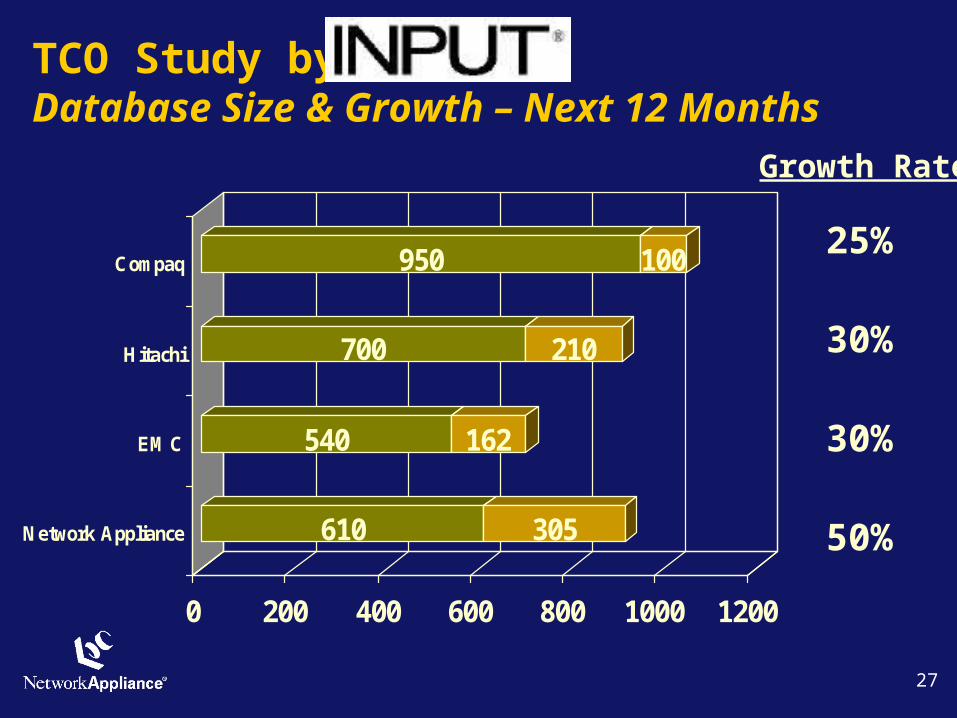
TCO Study byDatabase Size & Growth – Next 12 Months
610 305
540 162
700 210
950 100
0 200 400 600 800 1000 1200
Network Appliance
EMC
Hitachi
Compaq25%
30%
30%
50%
Growth Rate

28
TCO Study byScaling – AVG Time Required to Scale Up by 200 GB.
4 hours
3 hours
5 hours
0.000 1.000 2.000 3.000 4.000 5.000
Network Appliance
EMC
Hitachi
Compaq
30 minutes
29
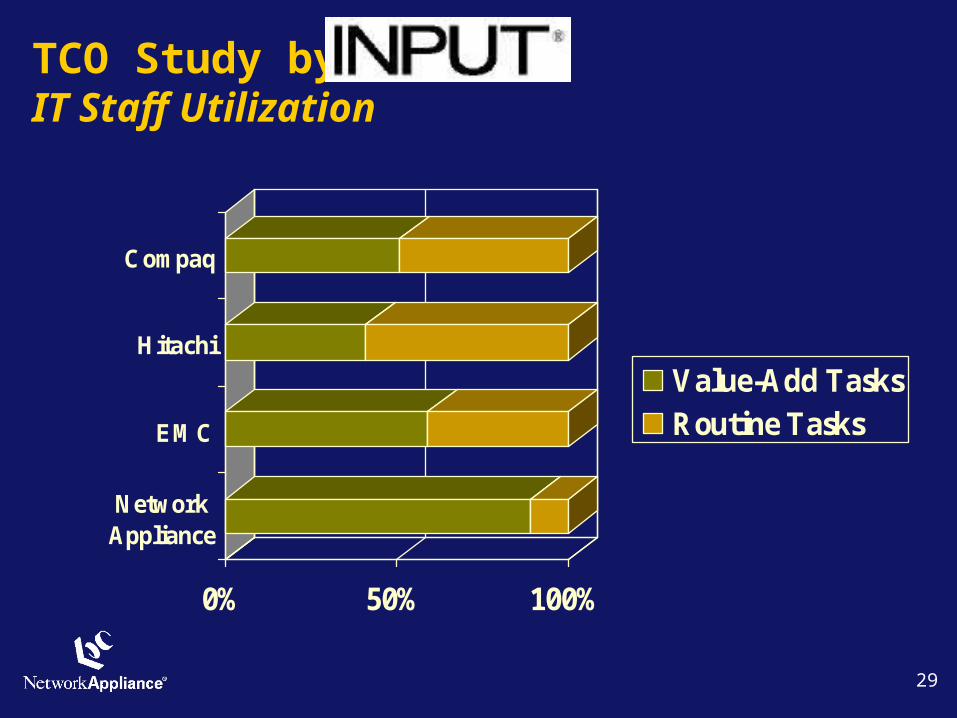
TCO Study byIT Staff Utilization
0% 50% 100%
NetworkAppliance
EMC
Hitachi
Compaq
Value-Add TasksRoutine Tasks

30
TCO Study byUser Satisfaction and Data Availability
4.8
4.4
3.8
4.2
0.0 1.0 2.0 3.0 4.0 5.0
NetworkAppliance
EMC
Hitachi
Compaq
SatisfactionRating
Highest

31
TCO Study byData Availability
67% 33%
57% 29% 14%
25% 50% 25%
19% 31% 31% 19%
0% 50% 100%
NetworkAppliance
EMC
Hitachi
Compaq
Over 99.5%99% to 99.5%97% to 99%95% to 97%Less than 95%

32
TCO Study byTotal Cost of Ownership per Annum
$0
$5,000,000
$10,000,000
$15,000,000
$20,000,000
$25,000,000
NetworkAppliance
EMC Hitachi Compaq
Downtime
Support, Operations &Maintenance
Implentation (Installation,Training)
Product (Hardware,Software, Upgrades)
NetApp savings: 75% 80% 70%

33
Collaborative TCO Reports Say The Same…

34
TCO Study byData Storage Consolidation in a Windows Environment
Executive Summary
“Across the board, based on the experiences and opinions of the customers surveyed, Network Appliance’s Windows data consolidation solution was determined to be the most cost-effective solution for optimizing data storage and high data availability over an entire IT enterprise”

35
TCO Study byData Storage Consolidation in a Windows Environment
Executive Summary
“Based on INPUT’s research, total cost of ownership and ongoing capital cost advantages, as well as efficiency, availability, and backup/recovery benefits are virtually
guaranteed in every implementation”

36
NetApp Research on TCO
Lower Total Cost of Ownership
-
$.5
$1.0
$1.5
$2.0
$2.5
$3.0
$3.5
Server-Centric Storage Centric NetApp
Mill
ion
s
Total Investments Total Operational Costs
3-year TCO Comparisons
www.netapp.com
37
Lowering Total Cost of Storage OwnershipMethodology
Select architecture that provides lowest TCO
Evaluate and select vendor that provides lowest TCO within that architecture
Evaluate utilizing lowest TCO architecture and vendor solution for all new project deployments
38
Lowering Operational Costs
“The average number of file restorations from tape each year per site is 144”
– Strategic Research
The result is lost productivity for the user and additional work for the IT Helpdesk.

39
Snapshot
Read Only images of entire file system Very low overhead point-in-time reflects the
state of the file system at the time it was created
Benefits Perform Backups from SnapShot while
production volume remains online Eliminate tape interaction for retrieving
deleted or corrupted files Store 31 Snapshots online with minimal
overhead

40
Lowering Operational Costs
“The average number of full file system restorations from tape each year per site is 2”
– Strategic Research

41
SnapRestore Database Recovery Example
750 GB database and the entire database requires recovery Tape recovery time is 60 GB/hour Normal recovery time is 12 ½ hours + log replay time
SnapRestore reverts volume to same state as when backup was taken. Duration - 90 seconds
Total recovery time: 90 seconds + log replay time
Oracle Logs
Oracle Database
Gigabit
Oracle Database InstanceF840

42
Lowering Operational Costs
“The average amount of system administration time spent on disk grooming each year per site is 248 hours.”
“The annual amount of user productivity lost per site due to disk grooming each year is 3262 hours.”
– Strategic Research
The result is lost productivity for users and IT administrators

43
Lowering Operational Costs
Simple expandability
File system not limited by disk shelf
Result:
Less administration
Flexibility
NetApp’s 100% Compatible Product Line - File system expansion
Initial file system
Adding disks withsingle command toexpand file system
Disks can be added to any open disk slot

44
Lowering Operational Costs
15 minute installation
No need for tuning. Self tuning appliance
Integrated RAID. No RAID administration
3 minute software upgrades
45
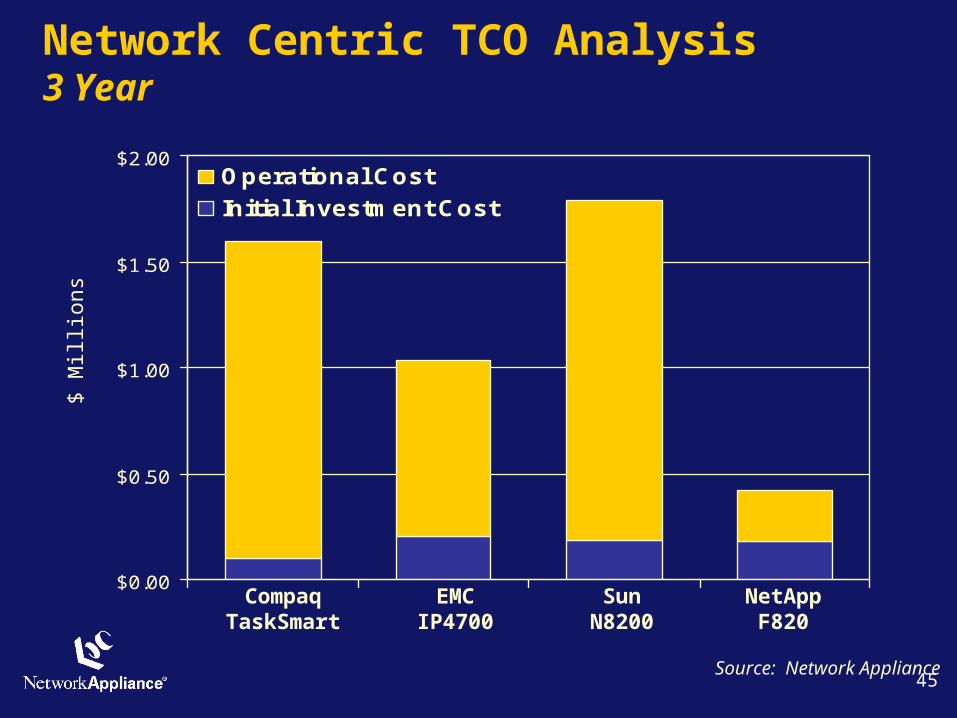
Network Centric TCO Analysis3 Year
Source: Network Appliance
$0.00
$0.50
$1.00
$1.50
$2.00Operational Cost
Initial Investment Cost
CompaqTaskSmart
EMCIP4700
SunN8200
NetAppF820
$ M
illio
ns

46
Lowering Total Cost of Storage OwnershipMethodology
Select architecture that provides lowest TCO
Evaluate and select vendor that provides lowest TCO within that architecture
Evaluate utilizing lowest TCO architecture and vendor solution for all new project deployments

47
New Project DeploymentsLowest TCO is with NetApp

Customer Examples

49
Network Appliance Customer Example
580 Terabytes
Numerous remote locations
10 administrators
58 TB per administrator
50
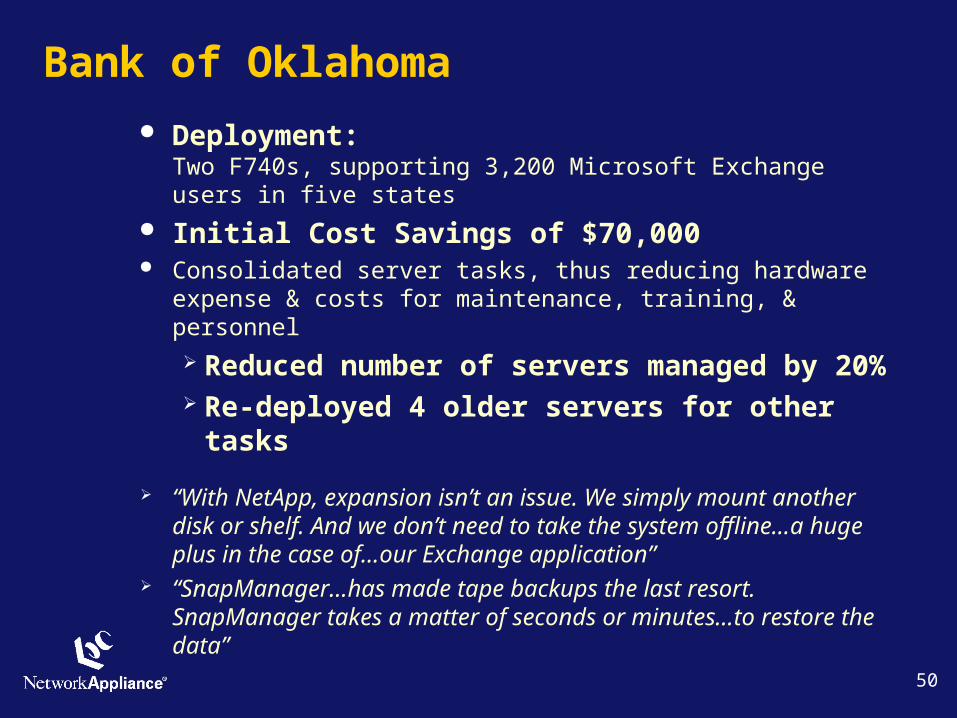
Bank of Oklahoma
Deployment:Two F740s, supporting 3,200 Microsoft Exchange users in five states
Initial Cost Savings of $70,000 Consolidated server tasks, thus reducing hardware expense & costs
for maintenance, training, & personnel
Reduced number of servers managed by 20% Re-deployed 4 older servers for other tasks
“With NetApp, expansion isn’t an issue. We simply mount another disk or shelf. And we don’t need to take the system offline…a huge plus in the case of…our Exchange application”
“SnapManager…has made tape backups the last resort. SnapManager takes a matter of seconds or minutes…to restore the data”

51
GTE
Deployment:Two F630s; One F540, supporting hundreds of thousands of Internet customers
200+% increase in availability over local disk Ability to scale environment to meet anticipated growth and
add NT servers as needed for CPU capacity 10 – 20% performance improvement for large file structures
“We have experienced no downtime since installing the NetApp filers”
“NetApp filers eliminate this restriction [of large file structures]…we spend less time on administration, saving a considerable amount of money”
“We have been extremely impressed with…the support provided by Network Appliance”
“With the help of Network Appliance’s quota solution, we were able to lower our overhead significantly”

52
National Semiconductor Deployment:
Nine filers, supporting 4+ TB of data and 700 clients on a 100Mb network with Sun servers
90+% decrease in restores from tape Users restore their own deleted files.
Snapshots are taken twice daily: Users are “never more than 12 hours away from the latest copy – usually it’s more like 2 or 3 hours.”
Increased capacity several-fold without adding systems administrators
“The filers don’t have a complex operating system…so I do upgrades…myself in about 20 minutes”
“We compared storage solutions, and there’s really nothing else in the market that does so much with so little administrative overhead”
“We tested the filer and found it more reliable and simpler to administer than the other products”
“I’m very happy with the filers and so are our users”

53
National Instruments
Deployment:Single filer with 900GBs of data, supporting a full suite of Oracle database applications.
NetApp filers save at least 40 hours of downtime annually Filers eliminate the need to spend time on disk layout. With NetApp, storage expansion can be done with zero
downtime With conventional storage adding capacity resulted in 8 hours of
downtime “By simply taking a Snapshot of the database before [the developers]
implement any changes, they can be sure that if the change does not work out…they can restore the database…in just minutes.”
“NetApp filers are easy to install, are easy to maintain, minimize downtime otherwise associated with locally attached disks, and provide new flexibility…”
“We will continue to consider NetApp filers…because [they] do exactly what they’re supposed to do.”

54
GTSI Deployment:
1TB filer, supporting 500 users on business critical databases associated with Siebel applications
NetApp for the low TCO Lower initial investment Lower service costs over a 3 – 5 year timeframe
Performance also key Filer outperformed internal arrays by as much as 20%
“The NetApp filer outperformed the internal arrays every time.” “We looked at a lot of good solutions from other vendors, but
stringent testing and total-cost-of-ownership evaluations proved the NetApp system to be the best solution at the best price.”
“Looking at [competitive] proposals over a 3 –5 year time period, we realized that the service costs alone were tens of thousands of dollars more than the NetApp solution.”
55
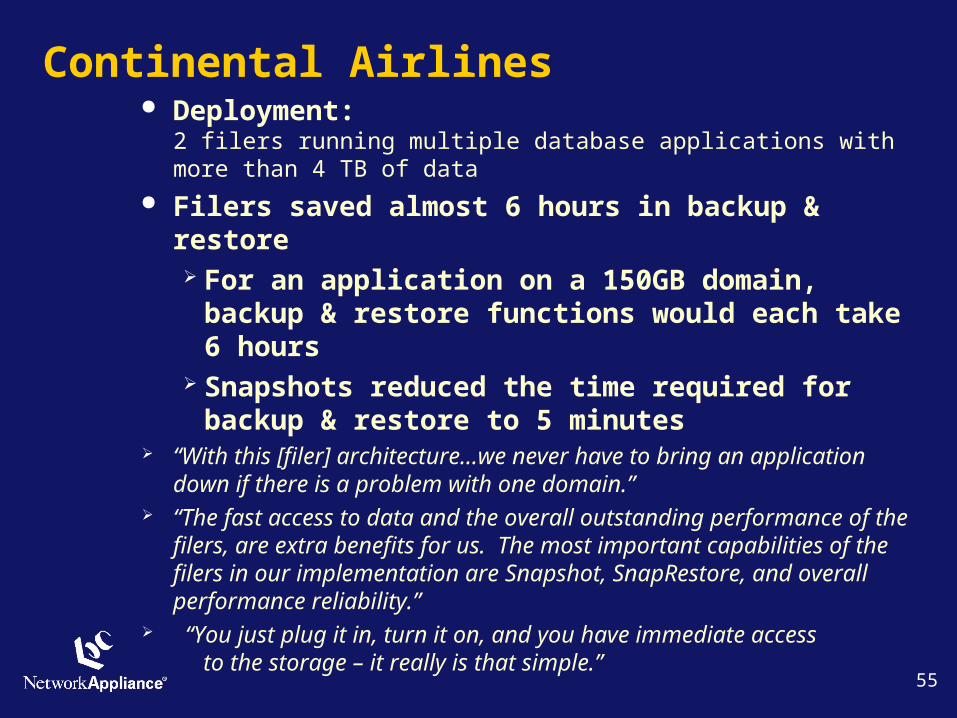
Continental Airlines Deployment:
2 filers running multiple database applications with more than 4 TB of data
Filers saved almost 6 hours in backup & restore For an application on a 150GB domain, backup &
restore functions would each take 6 hours Snapshots reduced the time required for backup &
restore to 5 minutes “With this [filer] architecture…we never have to bring an
application down if there is a problem with one domain.” “The fast access to data and the overall outstanding performance of
the filers, are extra benefits for us. The most important capabilities of the filers in our implementation are Snapshot, SnapRestore, and overall performance reliability.”
“You just plug it in, turn it on, and you have immediate access to the storage – it really is that simple.”

56
Case Study: FANUC Robotics
Deployment:2 filers – one supporting 500+ engineers for CAD drawings & 1,200 employee home directories; one supporting BaaN ERP application
Chose NetApp for the low TCO Ability to redeploy existing server resources and postpone the need
for new equipment in other departments – “which ultimately covered the cost of the NetApp filer”
Performance also key Improved application performance without a major hardware
investment
“NetApp filers provide…capabilities more cost-effectively than any of the competitive solutions evaluated”
“We have had rock-solid performance from [the NetApp] system” “NetApp takes ownership to make sure that we get the technical
resources we need.”

57
Final Thoughts
Challenge is often to manage petabytes of geographically dispersed data
TCO is a key storage imperative
NetApp continues to gain market share
NetApp provides superior TCO Initial investment cost Cost of downtime Operational costs