shenzhen statistical yearbook 三(q):il怠 · cao yi bin huang bai hua zeng su fang peng qiu fang...
TRANSCRIPT

SHENZHEN STATISTICAL YEARBOOK
三(Q):IL怠总第28期
深 圳市统 计 局Shenzhen Statistics Bureau b由
国家统计局深圳调查队 .,..�NBS Survey Office in Shenzhen
��thi:生:t认:
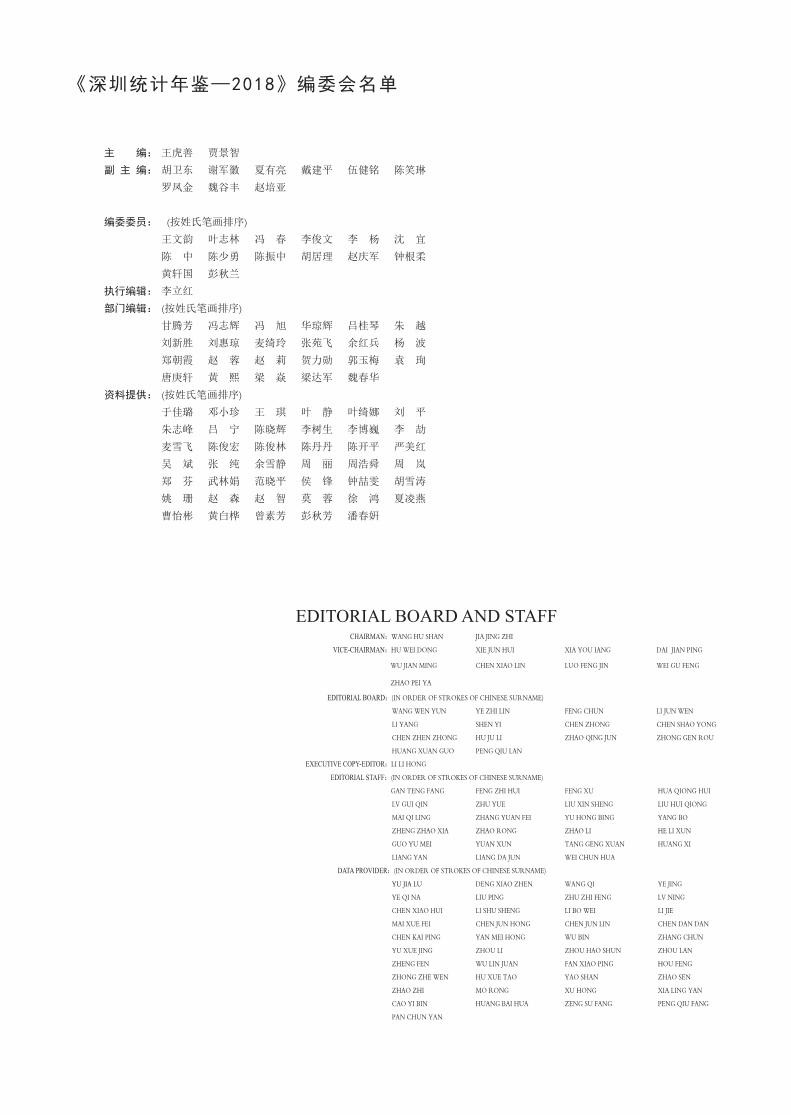
《深圳统计年鉴—2018》编委会名单
主 编: 王虎善 贾景智
副 主 编: 胡卫东 谢军徽 夏有亮 戴建平 伍健铭 陈笑琳
罗凤金 魏谷丰 赵培亚
编委委员: (按姓氏笔画排序)
王文韵 叶志林 冯 春 李俊文 李 杨 沈 宜
陈 中 陈少勇 陈振中 胡居理 赵庆军 钟根柔
黄轩国 彭秋兰
执行编辑: 李立红
部门编辑: (按姓氏笔画排序)
甘腾芳 冯志辉 冯 旭 华琼辉 吕桂琴 朱 越
刘新胜 刘惠琼 麦绮玲 张苑飞 余红兵 杨 波
郑朝霞 赵 蓉 赵 莉 贺力勋 郭玉梅 袁 珣
唐庚轩 黄 熙 梁 焱 梁达军 魏春华
资料提供: (按姓氏笔画排序)
于佳璐 邓小珍 王 琪 叶 静 叶绮娜 刘 平
朱志峰 吕 宁 陈晓辉 李树生 李博巍 李 劼
麦雪飞 陈俊宏 陈俊林 陈丹丹 陈开平 严美红
吴 斌 张 纯 余雪静 周 丽 周浩舜 周 岚
郑 芬 武林娟 范晓平 侯 锋 钟喆雯 胡雪涛
姚 珊 赵 森 赵 智 莫 蓉 徐 鸿 夏凌燕
曹怡彬 黄白桦 曾素芳 彭秋芳 潘春姸
EDITORIAL BOARD AND STAFF CHAIRMAN:WANG HU SHAN JIA JING ZHI
VICE-CHAIRMAN:HU WEI DONG XIE JUN HUI XIA YOU IANG DAI JIAN PING
WU JIAN MING CHEN XIAO LIN LUO FENG JIN WEI GU FENG
ZHAO PEI YA
EDITORIAL BOARD:(IN ORDER OF STROKES OF CHINESE SURNAME)
WANG WEN YUN YE ZHI LIN FENG CHUN LI JUN WEN
LI YANG SHEN YI CHEN ZHONG CHEN SHAO YONG
CHEN ZHEN ZHONG HU JU LI ZHAO QING JUN ZHONG GEN ROU
HUANG XUAN GUO PENG QIU LAN
EXECUTIVE COPY-EDITOR:LI LI HONG
EDITORIAL STAFF:(IN ORDER OF STROKES OF CHINESE SURNAME)
GAN TENG FANG FENG ZHI HUI FENG XU HUA QIONG HUI
LV GUI QIN ZHU YUE LIU XIN SHENG LIU HUI QIONG
MAI QI LING ZHANG YUAN FEI YU HONG BING YANG BO
ZHENG ZHAO XIA ZHAO RONG ZHAO LI HE LI XUN
GUO YU MEI YUAN XUN TANG GENG XUAN HUANG XI
LIANG YAN LIANG DA JUN WEI CHUN HUA
DATA PROVIDER:(IN ORDER OF STROKES OF CHINESE SURNAME)
YU JIA LU DENG XIAO ZHEN WANG QI YE JING
YE QI NA LIU PING ZHU ZHI FENG LV NING
CHEN XIAO HUI LI SHU SHENG LI BO WEI LI JIE
MAI XUE FEI CHEN JUN HONG CHEN JUN LIN CHEN DAN DAN
CHEN KAI PING YAN MEI HONG WU BIN ZHANG CHUN
YU XUE JING ZHOU LI ZHOU HAO SHUN ZHOU LAN
ZHENG FEN WU LIN JUAN FAN XIAO PING HOU FENG
ZHONG ZHE WEN HU XUE TAO YAO SHAN ZHAO SEN
ZHAO ZHI MO RONG XU HONG XIA LING YAN
CAO YI BIN HUANG BAI HUA ZENG SU FANG PENG QIU FANG
PAN CHUN YAN

编 辑 说 明
EDITORIAL BOARD AND STAFF
1.为方便国外读者查阅,本年鉴在目
录、统计表及指标解释等内容上按中英
文对照编辑。
2.本年鉴全面系统地介绍了深圳市国
民经济和社会发展情况,主要指标着重
反映了2017年深圳市经济和社会各方面
所取得的成就,也收录了深圳建市以来
历年统计数据。统计资料内容分为19个
部分,即:(1)综合;(2)国民经济
核算;(3)人口和劳动力;(4)工业
和能源;(5)建筑业;(6)运输和邮
电;(7)农业;(8)固定资产投资;
(9)房地产开发;(10)商业和物价;
(11)财政收支;(12)金融保险业;
(13)对外经济贸易和旅游;(14)劳
动工资;(15)科学技术;(16)文化
和教育;(17)卫生、社会保障和社会
福利业;(18)城市建设和环境保护;
(19)人民生活。为了便于读者正确使
用资料,还附上了主要统计指标解释。
3.根据最新掌握到的统计资料以及
国家新的统计制度之规定,本期年鉴对
过去发表的一些重要统计资料重新予以
核实,对部分历史数据进行了修订。因
此,读者在使用历史资料时,凡与本年
鉴有出入的,均以本年鉴为准。
4.本年鉴中的部分数据由于单位取舍
不同产生的计算误差均未作机械调整。
5.为便于读者使用,本年鉴特编制了
主要指标的定基指数、环比指数和年平
均增长速度。
6.本年鉴使用的符号说明:“...”表
示该项统计指标数据不足本表最小单位
数;“空白”表示数据为零或无该项数
据;“#”表示其中项。
7.2017年起人口、社会劳动者人数、
职工工资、“企业一套表”调查单位、
地区生产总值及分行业增加值、新兴产
业增加值、农业、工业、建筑业、固定
资产投资、社会消费零售总额、发电
量、能源等包含深汕特别合作区计入
数,增速按同口径计算。
8.限于我们的水平,本年鉴仍存在不
足乃至错漏,希望读者不吝批评指正,
帮助我们改进编辑工作,以期更好地为
广大读者服务。

Ⅰ. The contents, pictures and lists of
this book are translated into Chinese and
English in order for the foreigners.
Ⅱ .Shenzhen Statist ical Yearbook
2018 contains comprehensive statistics
o f Shenzhen ' s soc i a l and economic
development in 2017 and selected data of
some important years and of the period
after the establishment of the city. This
book is composed of 19 parts . They
include: 1. General Survey; 2.National
Economic Accounting; 3.Populat ion
and Labor Force; 4.Industry and Energy;
5.Construction; 6.Transport, Postal and
Telecommunication services; 7.Agriculture;
8.Investment in Fixed Assets; 9.Real
Estate; 10.Commerce and Price; 11.Fiscal
Revenue and Expenditure; 12.Finance and
Insurance; 13.Foreign Trade and Tourism;
14.Labor Force and Wage; 15. Science and
Technology; 16.Culture and Education;
17.Public Health, Social Security and
Social Welfare; 18.Urban Constructions
and Environmental Protection; 19.People's
Livelihood. Interpretation of major statistical
indicators attached is a useful tool for readers
of this book.
Ⅲ.We adjust some important historical
data based on the nearest data and state
new statistical system. So in any case the
data of this book shall be deemed as the
authoritative ones.
Ⅳ.Statistical discrepancies in this book
due to rounding are not adjusted.
Ⅴ.This book specially edit the fixed-
base index, chain base index and average
annual growth rate in order for the
convinces by reader's usage.
Ⅵ.Notations used in the yearbook:
“ . . .” indicates that the figure is not
large enough to be measured with the
smallest unit in the table,and“blank
space”indicates data are zero, or are not
available,“#”indicates major item in a
category.
Ⅶ.Since 2017, the population, the
number of employed persons, the wages
of employees, the “enterprise set of
table” survey units, the gross domestic
product (GDP) and the added value of
sub-industries, the added value of strategic
emerging industries, statistics of agriculture,
industry, construction, investment in fixed
assets, the total retail sales, electricity, energy
consumption have included ShenshanSpecial
Cooperation Zone. The growth rate is
calculated according to the same caliber.
Ⅷ.There are a lot of shortages and faults
in the yearbook because of our limited level.
For a better editing, we welcome all candid
comments and criticism from our readers.
EDITOR'S NOTE

一、综合
GENERAL SURVEY
1-1 行 政 区 划(2017年) ADMINISTRATIVE DIVISION(2017) .................................................................................................................. 3
1-2 分区土地面积、人口及人口密度(2017年) TOTAL LAND AREA, POPULATION AND DENSITY OF POPULATION IN DISTRICTS(2017) ............ 3
1-3 各时期国民经济和社会发展统计指标总量及年均增长速度 ANNUAL AVERAGE GROWTH RATE OF MAIN NATIONAL ECONOMIC AND SOCIAL DEVELOPMENT INDICATORS OF EACH PERIOD ........................................................................................................................... 4
1-4 主要年份国民经济主要指标比例关系 PERCENTAGE OF MAIN NATIONAL ECONOMIC INDICATORS IN MAIN YEARS ...................................10
1-5 主要年份国民经济和社会发展主要指标平均每人水平 PER CAPITA MAIN NATIONAL ECONOMIC AND SOCIAL DEVELOPMENT INDICATORS IN MAIN YEARS .........................................................................................................................................................................12
1-6 主要年份国民经济和社会发展主要指标平均每天水平 AVERAGE DAILY LEVEL OF MAIN NATIONAL ECONOMIC AND SOCIAL DEVELOPMENT INDICATORS IN MAIN YEARS ..............................................................................................................................13
1-7 企业登记发展情况 THE DEVELOPMENT OF ENTERPRISES REGISTRATION .............................................................................14
1-8 “企业一套表”年报分区分行业调查单位(2017年) NUMBER OF SURVEY UNIT OF“ENTERPRISE SET OF TABLE”BY SECTOR BY DISTRICT (2017) ......................................................................................................................................................................15
1-9 规模以上服务业(其他)企业分行业主要财务指标(2017年) FINANCE INDICATORS OF SERVICE ENTERPRISES (OTHER) ABOVE THE DESIGNATED SIZE BY SECTOR(2017) ............................................................................................................................................................16
1-10 规模以上服务业(其他)企业分区主要财务指标(2017年) FINANCE INDICATORS OF SERVICE ENTERPRISES (OTHER) ABOVE THE DESIGNATED SIZE BY DISTRICT(2017) .......................................................................................................................................................18
主要统计指标解释.......................................................................................................................................................19 Explanatory Notes on Main Statistical Indicators ...........................................................................................................21
目 录
CONTENTS
二、国民经济核算
NATIONAL ECONOMIC ACCOUNTING
2-1 国民经济核算主要指标 MAIN INDICATORS OF NATIONAL ECONOMIC ACCOUNTING .................................................................24
2-2 地区生产总值 GROSS DOMESTIC PRODUCT ..............................................................................................................................25
2-3 地区生产总值三次产业构成 COMPOSITION OF GROSS DOMESTIC PRODUCT BY THREE INDUSTRIES .............................................27
2-4 地区生产总值指数 INDICES OF GROSS DOMESTIC PRODUCT ......................................................................................................28
2-5 地区生产总值指数 INDICES OF GROSS DOMESTIC PRODUCT ......................................................................................................29
2-6 三次产业贡献率 SHARE OF THE CONTRIBUTIONS OF THE THREE STRATA OF INDUSTRY ...........................................30
2-7 三次产业拉动力 CONTRIBUTION OF THE THREE STRATA OF INDUSTRY ...........................................................................31
2-8 各行业增加值 VALUE ADDED BY SECTOR ..................................................................................................................................32
2-9 各行业增加值比重 PROPORTION OF VALUE ADDED BY SECTOR ................................................................................................34
2-10 各行业增加值增长率 GROWTH RATE OF VALUE ADDED BY INDUSTRIES .....................................................................................35
2-11 各行业增加值构成项目(2017年) COMPONENTS OF VALUE ADDED BY SECTOR(2017) ................................................................................36
2-12 支出法地区生产总值 GROSS DOMESTIC PRODUCT BY EXPENDITURE APPROACH ....................................................................37
2-13 各区生产总值 GROSS DOMESTIC PRODUCT BY DISTRICT ....................................................................................................38
2-14 各区生产总值指数 INDICES OF GROSS DOMESTIC PRODUCT BY DISTRICT .............................................................................40
2-15 各区分行业增加值(2017年) VALUE ADDED OF SECTOR BY DISTRICT (2017) ........................................................................................42
2-16 各区分行业增加增指数(2017年) GROWTH RATE OF VALUE ADDRD OF SECTOR BY DISTRICT(2017) ...................................................44
2-17 新兴产业增加值 ADDED VALUE OF STRATEGIC EMERGING INDUSTRIES .............................................................................46
2-18 新兴产业增加值增长率 GROWTH RATE OF ADDED VALUE OF STRATEGIC EMERGING INDUSTRIES .......................................48
主要统计指标解释.......................................................................................................................................................50

Explanatory Notes on Main Statistical Indicators ...........................................................................................................52
三 、人口和劳动力
POPULATION AND LABOR FORCE
3-1 人口及就业人员主要指标 MAIN INDICATORS OF EMPLOYED PERSONS .................................................................................................56
3-2 户数、人口、出生、死亡及自然增长 HOUSEHOLDS, POPULATION,BIRTH, DEATH AND NATURAL GROWTH .......................................57
3-3 人口指数 INDICES OF POPULATION ....................................................................................................................................60
3-4 计划生育情况 FAMILY PLANNING OF REGISTERED POPULATION .......................................................................................61
3-5 各区年末常住人口数 PERMANENT POPULATION AT THE YEAR-END BY DISTRICT ..................................................................61
3-6 按行业分的就业人员人数(2017年末) NUMBER OF EMPLOYED PERSONS AT YEAR-END GROUPED BY SECTOR(2017) ............................62
3-7 就业人员人数(年末数) NUMBER OF EMPLOYED PERSONS AT YEAR-END .......................................................................................63
3-8 就业人员人数指数 INDICES OF NUMBER OF EMPLOYED PERSONS .............................................................................................64
3-9 分经济类型和行业城镇单位就业人员人数(2017年末) NUMBER OF EMPLOYED PERSONS IN URBAN UNITS AT YEAR-END BY OWNERSHIP AND SECTOR(2017) ......................................................................................................................................................................65
3-10 各区城镇单位分行业在岗职工人数(2017年末) NUMBER OF FULLY EMPLOYED STAFF AND WORKERS IN URBAN UNITS AT YEAR-END BY SECTOR AND BY DISTRICT (2017) .................................................................................................................66
3-11 各区城镇单位就业人员和在岗职工(2017年末) NUMBER OF EMPLOYED PERSONS AND OF FULLY EMPLOYED STAFF AND WORKERS IN URBAN UNITS AT YEAR-END BY DISTRICT(2017) ...................................................................................................68
主要统计指标解释.......................................................................................................................................................69 EXPLANATORY NOTES ON MAIN STATISTICAL INDICATORS ...................................................................70
四、工业和能源
INDUSTRY AND ENERGY
4-1 工业主要指标 MAIN INDICATORS OF INDUSTRY .....................................................................................................................73
4-2 工业总产值 GROSS OUTPUT VALUE OF INDUSTRY .............................................................................................................74
4-3 规模以上工业总产值

GROSS OUTPUT VALUE OF INDUSTRY ABOVE DESIGNATED SIZE ...........................................................75
4-4 工业总产值指数 INDICES OF GROSS OUTPUT VALUE OF INDUSTRY ......................................................................................76
4-5 规模以上工业总产值指数 INDICES OF GROSS OUTPUT VALUE OF INDUSTRY ABOVE DESIGNATED SIZE ....................................77
4-6 规模以上工业总产值构成(2017年) COMPOSITION OF GROSS OUTPUT VALUE OF INDUSTRY ABOVE DESIGNATED SIZE(2017) ........78
4-7 规模以上工业企业主要指标(2017年) MAIN INDICATORS OF INDUSTRIAL ENTERPRISES ABOVE DESIGNATED SIZE(2017) .....................80
4-8 规模以上工业企业主要经济效益指标(2017年) MAIN INDICATORS ON ECONOMIC BENEFIT OF INDUSTRIAL ENTERPRISES ABOVE DESIGNATED SIZE(2017) ..............................................................................................................................................................88
4-9 规模以上国有工业企业主要经济指标(2017年) MAIN ECONOMIC INDICATORS OF STATE-HOLDING INDUSTRIAL ENTERPRISES ABOVE DESIGNATED SIZE(2017) ....................................................................................................................................92
4-10 规模以上集体工业企业主要经济指标(2017年) MAIN ECONOMIC INDICATORS OF COLLECTIVE-OWNED INDUSTRIALE NTERPRISES ABOVE DESIGNATED SIZE (2017) ..................................................................................................................................96
4-11 规模以上股份有限工业企业主要经济指标(2017年)
MAIN ECONOMIC INDICATORS OF SHARE-HOLDING INDUSTRIAL ENTERPRISES LIMITED ABOVE
DESIGNATED SIZE(2017) ..................................................................................................................................100
4-12 规模以上“三资”工业企业主要经济指标(2017年)
MAIN ECONOMIC INDICATORS OF FOREIGN-FUNDED INDUSTRIALENTERPRISES ABOVE
DESIGNATED SIZE(2017) ..................................................................................................................................104
4-13 规模以上私营工业企业主要经济指标(2017年)
MAIN ECONOMIC INDICATORS OF PRIVATE INDUSTRIAL ENTERPRISES ABOVE DESIGNATED
SIZE(2017) ............................................................................................................................................................108
4-14 规模以上大中型工业企业主要经济指标(2017年)
MAIN ECONOMIC INDICATORS OF LARGE AND MEDIUM-SIZED INDUSTRIAL ENTERPRISES
ABOVE DESIGNATED SIZE(2017) ....................................................................................................................112
4-15 主要工业产品产量
PRODUCTION OF MAIN INDUSTRIAL PRODUCTS ......................................................................................116
4-16 全社会能耗水平
ENERGY CONSUMPTION LEVEL OF THE WHOLE SOCIETY ......................................................................121
4-17 主要能源按工业行业分组消费量(2017年)
CONSUMPTION OF ENERGY BY SECTOR(2017) .......................................................................................122
4-18 综合能源平衡表
OVERALL ENERGY BALANCE SHEET ..............................................................................................................126
4-19 各区单位GDP能耗增长速度
ENERGY CONSUMPTION PER UNIT OF GDP BY DISTRICT ......................................................................128

4-20 能源加工转换效率
EFFICIENCY OF ENERGY CONVERSION ........................................................................................................129
4-21 能源消费弹性系数
ELASTICITY RATIO OF ENERGY CONSUMPTION .......................................................................................130
主要统计指标解释.....................................................................................................................................................131
Explanatory Notes on Main Statistical Indicators .........................................................................................................135
五、建筑业
CONSTRUCTION
5-1 建筑企业主要经济指标
MAIN ECONOMIC INDICATORS ON CONSTRUCTION ENTERPRISES ...................................................143
5-2 建筑业总产值
GROSS OUTPUT VALUE OF CONSTRUCTION ...............................................................................................144
5-3 分行业建筑业生产情况(2017年)
STATISTICS ON CONSTRUCTION BY SECTOR(2017) ..............................................................................145
5-4 分登记注册类型建筑业生产情况(2017年)
STATISTICS ON CONSTRUCTION BY TYPE OF REGISTRATION(2017) ...............................................146
5-5 分行业建筑业财务状况(2017年)
FINANCIAL CONDITIONS OF CONSTRUCTION BY SECTOR(2017) .....................................................147
5-6 分登记注册类型建筑业财务状况(2017年)
FINANCIAL CONDITIONS OF CONSTRUCTION BY TYPE OF REGISTRATION(2017) ......................148
5-7 分行业劳务分包建筑企业经营情况(2017年) MANAGEMENT SITUATIONS OF CONSTRUCTION ENTERPRISE OF SERVICE SUBCONTRACTING BY SECTOR(2017) ..............................................................................................................................................149
5-8 总承包和专业承包建筑业企业生产情况 PRODUCTION SITUATIONS OF GENERAL AND SPECIALIZED CONTRACTTING CONSTRUCTION ENTERPRISE ...........................................................................................................................................................150
5-9 总承包和专业承包建筑业企业财务状况 FINANCIAL SITUATIONS OF GENERAL AND SPECIALIZED CONTRACTTING CONSTRUCTION ENTERPRISE ...........................................................................................................................................................151
5-10 劳务分包建筑企业经营情况 MANAGEMENT SITUATIONS OF CONSTRUCTION ENTERPRISE OF SERVICE SUBCONTR ACTING ....................................................................................................................................................................152
主要统计指标解释.....................................................................................................................................................153 Explanatory Notes on Main Statistical Indicators .........................................................................................................154
六、运输和邮电
TRANSPORT,POSTAL AND TELECOMMUNICATION SERVICES
6-1 全社会客货运输(吞吐)量 PASSENGER AND FREIGHT TRAFFIC ...............................................................................................................157
6-2 全社会客货运输和邮电业务量(一) PASSENGER AND FREIGHT TRAFFIC,REVENUE FROM POSTAL ANDTELECOMMUNICATIONS SERVICES .................................................................................................................................................................158
6-2 全社会客货运输和邮电业务量(二) PASSENGER AND FREIGHT TRAFFIC,REVENUE FROM POSTAL ANDTELECOMMUNICATIONS SERVICES ................................................................................................................................................................159
6-3 全社会客货运输和邮电业务量指数 INDICES OF PASSENGER AND FREIGHT TRAFFIC,REVENUE FROM POSTAL AND TELECOMMUNICATIONS SERVICES ................................................................................................................160
6-4 全社会民用车辆和运输船舶拥有量 NUMBER OF CIVIL MOTOR VEHICLES AND TRANSPORT VESSELS OWNED ........................................161
6-5 邮电业务量及邮电通讯设施 BUSINESS VOLUME OF POSTAL AND TELECOMMUNICATIONS SERVICES,FACILITIES OF POST AND TELECOMMUNICATIONS ..............................................................................................................162
6-6 年末公路通车里程到达数(按技术等级) LENGTHS OF OPERATION MILEAGE AT YEAR-END(GROUPED BY GRADE) .................................................163
主要统计指标解释.....................................................................................................................................................164 Explanatory Notes on Main Statistical Indicators .........................................................................................................166
七、农业
AGRICULTURE
7-1 农业总产值 GROSS OUTPUT VALUE OF AGRICULTURE ...................................................................................................170
7-2 农业总产值构成 COMPOSITION OF GROSS OUTPUT VALUE OF AGRICULTURE ...............................................................171
7-3 农业总产值及其指数 GROSS OUTPUT VALUE OF AGRICULTURE AND ITS INDICES .................................................................172
7-4 农作物播种面积 TOTAL SOWN AREAS OF FARM CROPS ...........................................................................................................173
7-5 主要农业产品产量 YIELD OF MAJOR FARM CROPS ........................................................................................................................175
7-6 农作物亩产量 OUTPUT OF FARM CROPS PER MU..................................................................................................................176
7-7 畜牧业、林业和渔业 ANIMAL HUSBANDRY, FORESTRY AND FISHERY ........................................................................................177
主要统计指标解释.....................................................................................................................................................180 Explanatory Notes on Main Statistical Indicators .........................................................................................................181
八、固定资产投资
INVESTMENT IN FIXED ASSETS
8-1 固定资产投资主要指标
MAIN INDICATORS OF INVESTMENT IN FIXED ASSETS ..............................................................................184
8-2 固定资产投资额
INVESTMENT IN FIXED ASSETS ..........................................................................................................................185
8-3 固定资产投资额指数
INDICES OF INVESTMENT IN FIXED ASSETS ...................................................................................................186
8-4 新增固定资产
NEWLY INCREASED FIXED ASSETS ...................................................................................................................187
8-5 固定资产投资额(按区域分)
INVESTMENT IN FIXED ASSETS(GROUPED BY DISTRICT) ....................................................................188
8-6 固定资产投资额指数(按区域分)
INVESTMENT IN FIXED ASSETS(GROUPED BY DISTRICT) ....................................................................190
8-7 固定资产投资额比重(按区域分) INVESTMENT IN FIXED ASSETS(GROUPED BY DISTRICT) ....................................................................192
8-8 固定资产投资额(按注册登记类型分) INVESTMENT IN FIXED ASSETS(GROUPED BY REGISTRATION) .........................................................194
8-9 固定资产投资额(按国民经济行业分) INVESTMENT IN FIXED ASSETS(GROUPED BY NATIONAL ECONOMIC INDUSTRIES) ..................195
8-10 固定资产投资额指数(按注册登记类型分) INVESTMENT IN FIXED ASSETS(GROUPED BY REGISTRATION) .........................................................198
8-11 固定资产投资额比重(按注册登记类型分) INVESTMENT IN FIXED ASSETS(GROUPED BY REGISTRATION) .........................................................199
8-12 固定资产投资财务拨款额 FINANCIAL APPROPRIATION OF INVESTMENT IN INVESTMENT IN FIXED ASSETS ..........................................200
8-13 各区按登记注册类型分固定资产投资(2017年) INVESTMENT IN FIXED ASSETS BY STATUS OF REGISTRATION AND DISTRICT(2017) .................201
8-14 各区按主要行业分固定资产投资(2017年) INVESTMENT IN FIXED ASSETS IN BY DISTRICT AND SECTOR(2017) ................................................202
8-15 国有经济固定资产投资主要指标 MAIN INDICATORS OF INVESTMENT IN FIXED ASSETS OF STATE-OWNED ECONOMY ..................205
8-16 基础产业和基础设施完成投资额 COMPLETED INVESTMENT IN BASIC INDUSTRIES AND INFRASTRUCTURE .......................................206
8-17 各区固定资产投资财务拨款资金来源主要指标(2017年) MAIN INDICATORS OF SOURCES OF FUNDS FOR INVESTMENT BY DISTRICT(2017) ....................207
8-18 各区按构成和建设性质分城镇固定资产投资(2017年)

INVESTMENT IN FIXED ASSETS IN URBAN AREA BY COMPOSITION OF FUNDS, TYPE OF CONSTRUCTION AND DISTRICT(2017) ......................................................................................................208
8-19 房屋施工建筑面积 FLOOR SPACE OF BUILDINGS UNDER CONSTRUCTION ...........................................................................209
8-20 房屋竣工建筑面积 FLOOR SPACE OF BUILDINGS COMPLETED ...................................................................................................210
8-21 竣工房屋价值 VALUE OF BUILDINGS COMPLETED .................................................................................................................211
8-22 住宅投资 INVESTMENT IN RESIDENTIAL HOUSING ......................................................................................................212
8-23 住宅施工建筑面积 FLOOR SPACE OF RESIDENTIAL HOUSING UNDER CONSTRUCTION ...................................................213
8-24 住宅竣工建筑面积 FLOOR SPACE OF RESIDENTIAL HOUSING COMPLETED ...........................................................................214
8-25 住宅竣工价值 VALUE OF RESIDENTIAL HOUSING COMPLETED .........................................................................................215
8-26 固定资产投资完成情况主要指标 MAIN INDICATORS OF INVESTMENT IN FIXED ASSETS ..............................................................................216
8-27 各区固定资产投资 FIXED ASSET INVESTMENT BY DISTRICT ......................................................................................................219
主要统计指标解释.....................................................................................................................................................220 Explanatory Notes on Main Statistical Indicators .........................................................................................................221
九、房地产开发
REAL ESTATE DEVELOPMENT
9-1 房地产开发投资额(按投资去向分) INVESTMENT IN REAL ESTATE DEVELOPMENT(GROUPED BY INVESTMENT DESTINATION) ...225
9-1 房地产开发投资额(按用途分) INVESTMENT IN REAL ESTATE DEVELOPMENT( GROUPED BY USE ) ....................................................225
9-2 房地产开发投资额(按构成分) INVESTMENT IN REAL ESTATE DEVELOPMENT(GROUPED BY COMPOSITION) ....................................226
9-2 房地产开发投资额(按区域分) INVESTMENT IN REAL ESTATE DEVELOPMENT(GROUPED BY DISTRICT) ......................................226
9-3 房地产开发投资额(按注册登记类型分) INVESTMENT IN REAL ESTATE DEVELOPMENT(GROUPED BY REGISTRATION) ...........................227
9-4 房地产开发投资资金来源及构成 TOTAL CAPITAL SOURCE AND COMPOSITION OF REAL ESTATE DEVELOPMENT ....................................227
9-5 商品房施工面积(按用途分) TOTAL FLOOR SPACE UNDER CONSTRUCTION OF COMMODITY HOUSING (GROUPED BY USE) ........................................................................................................................................................................228

9-5 商品房施工面积(按区域分) TOTAL FLOOR SPACE UNDER CONSTRUCTION OF COMMODITY HOUSING(GROUPED BY DISTRICT) .............................................................................................................................................................229
9-6 商品房新开工面积(按用途分) FLOOR SPACE OF NEWLY STARTED OF COMMODITY HOUSING(GROUPED BY USE) ................230
9-6 商品房新开工面积(按区域分) FLOOR SPACE OF NEWLY STARTED OF COMMODITY HOUSING(GROUPED BY DISTRICT) ......230
9-7 商品房竣工面积(按用途分) TOTAL FLOOR SPACE OF COMMERCIAL HOUSES COMPLETED(GROUPED BY USE) ....................231
9-7 商品房竣工面积(按区域分) TOTAL FLOOR SPACE OF COMMERCIAL HOUSES COMPLETED(GROUPED BY DISTRICT) .........231
9-8 商品房销售面积(按用途分) TOTAL FLOOR SPACE OF BUILDINGS SOLD(GROUPED BY USE) ..............................................................232
9-8 商品房销售面积(按区域分) TOTAL FLOOR SPACE OF BUILDINGS SOLD(GROUPED BY DISTRICT) ...................................................232
9-9 商品住宅销售面积(按区域分) TOTAL FLOOR SPACE OF RESIDENTIAL BUILDINGS SOLD(GROUPED BY DISTRICT) ...................233
9-10 办公楼销售面积(按区域分) TOTAL FLOOR SPACE OF OFFICE BUILDINGS SOLD(GROUPED BY DISTRICT) ...............................233
9-11 商业用房销售面积(按区域分) TOTAL FLOOR SPACE OF COMMERCIAL BUILDINGS SOLD(GROUPED BY DISTRICT) .................234
9-12 商品房屋待售面积(按用途分) TOTAL FLOOR SPACE OF COMMERCIALIZED BUILDINGS FOR SALE(GROUPED BY USE) ...............................234
9-13 商品房屋待售面积(按区域分) TOTAL FLOOR SPACE OF VACANT BUILDINGS(GROUPED BY DISTRICT) .......................................235
9-14 商品房二级市场平均交易价格(按用途分) AVERAGE SELLING PRICE OF COMMERCIAL HOUSES IN SECONDARY MARKET(GROUPED BY USE) ........................................................................................................................................................................235
9-14 商品房二级市场平均交易价格(按区域分) AVERAGE SELLING PRICE OF COMMERCIAL HOUSES IN SECONDARY MARKET (GROUPED BY DISTRICT) ..............................................................................................................................236
9-15 商品住宅二级市场平均交易价格(按区域分) AVERAGE SELLING PRICE OF COMMERCIAL HOUSES IN SECONDARY MARKET (GROUPED BYDISTRICT) ...............................................................................................................................236
9-16 房地产开发企业主要财务指标 FINANCIAL INDICATORS OF REAL ESTATE COMPANIES ...........................................................................237
主要统计指标解释.....................................................................................................................................................238 Explanatory Notes on Main Statistical Indicators .........................................................................................................239

十、商业和物价
COMMERCE AND PRICE
10-1 社会消费品零售总额及指数 INDICES OF TOTAL RETAIL SALES OF CONSUMER GOODS .......................................................................242
10-2 限额以上批发零售贸易业商品分类销售(2017年) TOTAL SALES OF ENTERPRISES OVER LEVELS IN WHOLESALE AND RETAIL SALE TRADES GROUPED BY CATEGORY OF COMMODITIES(2017) ....................................................................................................243
10-3 限额以上批发和零售业法人企业商品购销存综合表(2017年) TOTAL PURCHASES SALES AND INVENTORY OF ENTERPRISES ABOVE THE DESIGNATED SIZE IN WHOLESALE AND RETAIL TRADE(2017) .....................................................................................................244
10-4 限额以上批发和零售业法人单位主要财务状况综合表(一)(2017年) MAIN FINANCIAL INDICATORS OF WHOLESALE AND RETAIL SALES ABOVE THE SET SCALE Ⅰ(2017) ....................................................................................................................................................................248
10-4 限额以上批发和零售业法人单位主要财务状况综合表(二)(2017年) MAIN FINANCIAL INDICATORS OF WHOLESALE AND RETAIL SALES ABOVE THE SET SCALE Ⅱ(2017) ....................................................................................................................................................................252
10-4 限额以上批发和零售业法人单位主要财务状况综合表(三)(2017年) MAIN FINANCIAL INDICATORS OF WHOLESALE AND RETAIL SALES ABOVE THE SET SCALE III(2017) ....................................................................................................................................................................256
10-5 限额以上住宿和餐饮业法人企业主要财务状况综合表 (一)(2017年) MAIN FINANCIAL INDICAFORS OF ENTERPRISE ABOVE DESIGNATED SIZE OF HOTELS AND CATERING SERVICESⅠ(2017) ........................................................................................................................260
10-5 限额以上住宿和餐饮业法人企业主要财务状况综合表 (二)(2017年) MAIN FINANCIAL INDICAFORS OF ENTERPRISE ABOVE DESIGNATED SIZE OF HOTELS AND CATERING SERVICESⅡ(2017) ........................................................................................................................264
10-5 限额以上住宿和餐饮业法人企业主要财务状况综合表 (三)(2017年) MAIN FINANCIAL INDICAFORS OF ENTERPRISE ABOVE DESIGNATED SIZE OF HOTELS AND CATERING SERVICES III(2017) ......................................................................................................................268
10-6 限额以上住宿和餐饮业法人企业经营情况综合表(2017年) CONSOLIDATED TABLE OF ENTERPRISES ABOVE DESIGNATED SIZE OF HOTELS AND CATERING SERVICES (2017) .................................................................................................................................................272
10-7 城市商业综合体情况(自营、联营部分)(2017年) URBAN COMMERCIAL COMPLEX (SELF-MANAGEMENT AND JOINT MANAGEMENT)(2017) .276
10-8 城市商业综合体情况(租赁部分)(2017年) URBAN COMMERCIAL COMPLEX (LEASED)(2017) ..............................................................................277
10-9 居民消费价格总指数 CONSUMER PRICE INDICES ...............................................................................................................................278
10-10 居民消费价格指数(2017年) CONSUMER PRICE INDEX(2017) ...................................................................................................................279
10-11 住宅销售价格指数(一) SALES PRICES INDICES OF HOUSESⅠ ...............................................................................................................280
10-11 住宅销售价格指数(二) SALES PRICES INDICES OF HOUSES Ⅱ..............................................................................................................280
10-12 工业生产者出厂价格指数 INDUSTRIAL PRODUCER PRICE INDEX .........................................................................................................281
10-13 工业生产者购进价格指数 INDUSTRIAL PURCHASING PRICE INDEX ......................................................................................................281
主要统计指标解释.....................................................................................................................................................282 Explanatory Notes on Main Statistical Indicators .........................................................................................................284
十一、财政收支
FISCAL REVENUE AND EXPENDITURE
11-1 地方财政收支 LOCAL GOVERNMENT BUDGETARY REVENUE AND EXPENDITURE ...................................................289
11-2 一般公共预算收支及指数 INDICES OF LOCAL GOVERNMENT GENERAL BUDGETARY REVENUE AND EXPENDITURE .........290
11-3 财政收支分级情况 BUDGETARY REVENUE AND EXPENDITURE BY LEVEL .............................................................................291
主要统计指标解释.....................................................................................................................................................292 Explanatory Notes on Main Statistical Indicators .........................................................................................................293
十二、金融保险业
FINANCE AND INSURANCE
12-1 国内金融机构人民币存贷款 DEPOSITS AND LOANS IN RENMINBI OF DOMESTIC FINANCIAL INSTITUTIONS ...............................297
12-2 金融机构(含外资)本外币信贷情况 SOURCES AND USES OF CREDIT FUNDS OF FINANCIAL INSTITUTIONS(INCLUDE FOREIGN FUNDS) ...................................................................................................................................................................298
12-3 金融机构(含外资)本外币分类存贷款 SOURCES AND USES OF CREDIT FUNDS OF FINANCIAL INSTITUTIONS(INCLUDE FOREIGN FUNDS) .....................................................................................................................................................................299
12-4 深圳证券交易所投资者开户情况 ACCOUNT-OPENING BY INVESTORS IN SHENZHEN STOCK EXCHANGE ............................................300
12-5 深圳证券交易所有价证券成交总额 TOTAL VOLUME OF PRICE SECURITIES TRADING IN SHENZHEN .........................................................301
12-6 深证综合指数 SHENZHEN COMPOSITE INDEX ........................................................................................................................301
12-7 社会保险费实际征收收入和支出 PREMIUMS INCOME, AND PAYMENT IN MAIN YEARS ..............................................................................302
12-8 保险费收入和赔款及给付
PRIMIUMS INCOME, INDEMNITY EXPENDITURE AND PAYMENT .........................................................302
12-9 保险公司及保险中介机构 INSURANCE COMPANIES AND INSURANCE AGENTS .................................................................................303
12-10 保险公司主要业务指标(一)(2017年) MAJOR BUSINESS INDICES OF INSURANCE COMPANIES Ⅰ(2017) .......................................................303
12-10 保险公司主要业务指标(二)(2017年) MAJOR BUSINESS INDICES OF INSURANCE COMPANIES Ⅱ(2017) .......................................................303
主要统计指标解释.....................................................................................................................................................304 Explanatory Notes on Main Statistical Indicators .........................................................................................................305
十三、对外经济贸易和旅游
FOREIGN TRADE AND TOURISM
13-1 对外经济主要指标 MAIN INDICATORS OF FOREIGN TRADE AND ECONOMIC COOPERATION .......................................309
13-2 利用外资签订协议(合同)项目 NUMBER OF THE SIGNED AGREEMENTS AND CONTRACTS FOR UTILIZATION OF FOREIGN CAPITAL ...................................................................................................................................................................310
13-3 协议利用外资额 AMOUNT OF FOREIGN CAPITAL TO BE UTILIZED IN THE SIGNED AGREEMENTS AND CONTRACTS ...........................................................................................................................................................314
13-4 实际利用外资额 AMOUNT OF FOREIGN CAPITAL ACTUALLY USED ......................................................................................319
13-5 实际外商直接投资 DIRECT FOREIGN INVESTMENTS ACTUALLY USED ....................................................................................324
13-6 外商投资企业工商登记情况(按企业类别分)(2017年末) BUSINESS REGISTRATION OF FOREIGN INVESTED ENTERPRISES AT YEAR-END(GROUPED BY REGISTRATION STATUS) (2017) ..........................................................................................................................325
13-7 外商投资企业工商登记情况(按行业类别分)(2017年末) BUSINESS REGISTRATION OF FOREIGN INVESTED ENTERPRISES AT YEAR-END(GROUPED BY SECTOR) (2017) ..................................................................................................................................................328
13-8 外商投资企业工商登记情况(按国别、地区分)(2017年末) BUSINESS REGISTRATION OF FOREIGN INVESTED ENTERPRISES AT YEAR-END(GROUPED BY COUNTRIES AND REGIONS)(2017) ...............................................................................................................331
13-9 进出口总额 TOTAL IMPORTS AND EXPORTS ......................................................................................................................334
13-10 进出口总额指数 INDICES OF TOTAL IMPORTS AND EXPORTS ...............................................................................................335
13-11 进出口总额分类 TOTAL IMPORTS AND EXPORTS ......................................................................................................................336
13-12 深圳市与主要国家(地区)进出口总额

SHENZHEN’ S FOREIGN TRADE WITH MAIN RELATED COUNTRIES AND TERRITORIES ...............337
13-13 进口主要商品金额
TOTAL VALUE OF FOREIGN IMPORTS OF MAJOR COMMODITIES ..........................................................338
13-14 出口主要商品金额
TOTAL VALUE OF FOREIGN EXPORTS OF MAJOR COMMODITIES .........................................................338
13-15 旅游业基本情况
BASIC CONDITIONS OF TOURISM ....................................................................................................................339
13-16 按国别分的外国旅游者人数(过夜)
NUMBER OF FOREIGN TOURISTS BY COUNTRY(Over night) ...............................................................340
13-17 旅游部门主要财务指标(2017年)
MAIN FINANCIAL INDICATORS OF TOURISM(2017) ...............................................................................342
13-18 星级酒店基本情况(2017年末)
STATISTICS ON SHENZHEN STAR-RATED HOTELS AT YEAR-END (2017) .......................................343
13-19 星级酒店客房基本情况(2017年末)
STATISTICS OF STAR-RATED HOTELS AT YEAR-END (2017) ..............................................................344
13-20 星级酒店床位基本情况(2017年末)
FACILITIES OF STAR-RATED HOTELS AT YEAR-END (2017) ................................................................344
主要统计指标解释.....................................................................................................................................................345 Explanatory Notes on Main Statistical Indicators .........................................................................................................347
十四、劳动工资
LABOR FORCE AND WAGE
14-1 城镇单位在岗职工人数、工资总额及平均工资
NUMBER, TOTAL WAGE BILL AND AVERAGE WAGE OF FULLY EMPLOYED STAFF AND WORKERSIN URBAN UNITS...................................................................................................................................................350
14-2 城镇单位在岗职工工资总额指数和年平均工资指数
RELATED INDICES OF TOTAL WAGE BILL AND AVERAGE WAGE OF FULLY EMPLOYED STAFF ANDWORKERS IN URBAN UNITS ............................................................................................................................351
14-3 城镇单位在岗职工工资总额指数和年平均工资指数
RELATED INDICES OF TOTAL WAGE BILL AND AVERAGE WAGE OF FULLY EMPLOYED STAFF ANDWORKERS IN URBAN UNITS .............................................................................................................................352
14-4 城镇单位在岗职工工资总额和年平均工资
TOTAL WAGE BILL AND AVERAGE WAGE OF FULLY EMPLOYED STAFF AND WORKERS IN URBANUNITS........................................................................................................................................................................353
14-5 城镇单位就业人员和在岗职工人数(2017年末)
NUMBER OF EMPLOYED PERSONS AND FULLY EMPLOYED STAFF AND WORKERS IN URBANUNITS AT YEAR-END (2017) ..........................................................................................................................354
14-6 分经济类型和行业城镇单位就业人员工资总额、平均人数和年平均工资(2017年)
TOTAL WAGE BILL, AVERAGE NUMBER AND AVERAGE WAGE OF EMPLOYED PERSONS BYOWNERSHIP AND SECTOR IN URBAN UNITS(2017) ...............................................................................356

14-7 分经济类型和行业城镇单位在岗职工工资总额、平均人数和年平均工资(2017年) TOTAL WAGE BILL,AVERAGE NUMBER AND AVERAGE WAGE OF FULLY EMPLOYED STAFF AND WORKERS BY OWNERSHIP AND SECTOR IN URBAN UNITS(2017) ....................................................358
14-8 城镇单位工业、建筑业企业在岗职工人数、工资总额和年平均工资(2017年) NUMBER, TOTAL WAGE BILL AND AVERAGE WAGE OF FULLY EMPLOYED STAFF AND WORKERS IN INDUSTRY AND CONSTRUCTION ENTERPRISES IN URBAN UNITS(2017) .................................360
主要统计指标解释.....................................................................................................................................................362 Explanatory Notes on Main Statistical Indicators .........................................................................................................363
十五、科学技术
SCIENCE AND TECHNOLOGY
15-1 高新技术产品进出口情况 TOTAL IMPORTS AND EXPORTS OF HIGH TECHNOLOGY INDUSTRY ..................................................366
15-2 专利申请授权概况 PATENT APPLICATIONS EXAMINED AND GRANTED ..................................................................................367
15-3 R&D经费支出和人员情况 EXPENDITURES ON R&D AND R&D PERSONNEL ....................................................................................368
15-4 规模以上工业企业科技活动情况 SCIENTIFIC AND TECHNOLOGICAL ACTIVITIES OF INDUSTRIAL ENTERPRISES ABOVE DESIGNATED SIZE ................................................................................................................................................370
15-5 创新载体情况 INNOVATION CARRIER .....................................................................................................................................372
主要统计指标解释.....................................................................................................................................................374 Explanatory Notes on Main Statistical Indicators .........................................................................................................376
十六、文化和教育
CULTURE AND EDUCATION
16-1 各级各类学校数 NUMBER OF SCHOOL BY LEVEL AND TYPE ...................................................................................................381
16-2 各级各类学校教职工数 STAFF AND WORKERS BY LEVEL AND TYPE OF SCHOOL ..........................................................................382
16-3 各级各类学校专任教师数 FULL-TIME TEACHERS BY LEVEL AND TYPE OF SCHOOL .........................................................................383
16-4 各级各类学校在校学生数 STUDENTS ENROLLMENT BY LEVEL AND TYPE OF SCHOOL ...................................................................384
16-5 各级各类学校招生数 NEW STUDENTS ENROLLMENT BY LEVEL AND TYPE OF SCHOOL .........................................................385
16-6 各级各类学校毕业生数 GRADUATES BY LEVEL AND TYPE OF SCHOOL ............................................................................................386

16-7 文化事业 CULTURAL INSTITUTIONS .................................................................................................................................387
主要统计指标解释.....................................................................................................................................................388 Explanatory Notes on Main Statistical Indicators .........................................................................................................389
十七、卫生、社会保障和社会福利业
PUBLIC HEALTH,SOCIAL SECURITY AND SOCIAL WELFARE
17-1 卫 生 事 业(一) PUBLIC HEALTH(Ⅰ) .........................................................................................................................................393
17-1 卫生事业(二) PUBLIC HEALTH(Ⅱ) .........................................................................................................................................398
17-2 体育事业 BASIC STATISTICS ON SPORTS .........................................................................................................................399
17-3 建立最低生活保障制度以来历年低保情况 LIST OF MINIMUM STANDARD OF LIVING SECURITY ................................................................................400
17-4 最低生活保障标准调整表 ADJUSTMENT DATA OF MINIMUM STANDARD OF LIVING SECURITY ...........................................................400
17-5 社会养老机构、救助管理站基本情况 BASIC STATISTICS ON SOCIAL PENSION INSTITUTIONS AND RELIEF MANAGEMENT STATIONS ...........401
主要统计指标解释 ...................................................................................................................................................402 Explanatory Notes on Main Statistical Indicators .........................................................................................................403
十八、城市建设和环境保护
URBAN CONSTRUCTIONS AND ENVIRONMENTAL PROTECTION
18-1 城市建设及公用设施 URBAN CONSTRUCTIONS AND PUBLIC UTILITY ........................................................................................407
18-2 城市环境 URBAN ENVIRONMENT ......................................................................................................................................408
18-3 用电量、供水量 ELECTRICITY CONSUMPTION AND TAP WATER SUPPLY .........................................................................411
18-4 公共交通 PUBLIC TRANSPORTATION ...............................................................................................................................412
18-5 气象情况 CLIMATE ..................................................................................................................................................................413
主要统计指标解释.....................................................................................................................................................414 Explanatory Notes on Main Statistical Indicators .........................................................................................................415

GENERAL SURVEY01
十九、人民生活
PEOPLE,S LIVELIHOOD
19-1 城镇单位在岗职工年平均工资 AVERAGE WAGE OF FULLY EMPLOYED STAFF AND WORKERS IN URBAN UNITS .............................419
19-2 居民家庭生活基本情况 BASIC CONDITIONS OF PERMANENT HOUSEHOLDS ..................................................................................420
19-3 一体化住户调查样本调查户基本情况(2017年) ASIC CONDITIONS OF INTEGRATED HOUSEHOLD AND EXPENDITURE SURVEY (2017) .............421
19-4 居民人均可支配收入(2017年) PER CAPITA DISPOSABLE INCOME OF PERMANENT HOUSEHOLDS(2017) ........................................421
19-5 居民人均消费支出(2017年) PER CAPITA CONSUMPTION EXPENDITURE OF PERMANENT HOUSEHOLDS(2017) .....................422
19-6 居民物质文化生活提高情况 IMPROVEMENT IN RESIDENTS' MATRIAL AND CULTURAL LIFE .............................................................423
主要统计指标解释.....................................................................................................................................................424 Explanatory Notes on Main Statistical Indicators .........................................................................................................425

GENERAL SURVEY01


3
1-1 行政区划(2017年)
ADMINISTRATIVE DIVISION(2017)
单位:个 (unit)
地 区 Region
街道办事处 Urban Subdistrict Office
居民委员会 Neighbourhood Committees
全 市 Total 74 810
福田区 Futian 10 115
罗湖区 Luohu 10 112
盐田区 Yantian 4 23
南山区 Nanshan 8 107
宝安区 Baoan 10 140
龙岗区 Longgang 11 119
龙华区 Longhua 6 108
坪山区 Pingshan 6 30
光明新区 Guangming 6 31
大鹏新区 Dapeng 3 25
1-2 分区土地面积、人口及人口密度(2017年)
TOTAL LAND AREA, POPULATION AND DENSITY OF POPULATION
IN DISTRICTS(2017)
地 区 Region
土地面积 (平方公里)Land Area
(sq.km)
年末常住人口 (万人)
Year-end Permanent Population
(10 000pesons)
人口密度 (人/平方公里)
Density Of Population
(person/sq.km)
常住户籍人口 PermanentRegistered Population
常住非户籍人口
Permanent Non-registered
Population
全 市 Total 1 997.47 1 252.83 434.72 818.11 6 234
福田区 Futian 78.66 156.12 103.87 52.25 19 847
罗湖区 Luohu 78.75 102.72 61.33 41.39 13 044
盐田区 Yantian 74.99 23.72 7.49 16.23 3 163
南山区 Nanshan 187.53 142.46 89.44 53.02 7 597
宝安区 Baoan 396.61 314.90 53.84 261.06 7 940
龙岗区 Longgang 388.22 227.89 65.31 162.58 5 870
龙华区 Longhua 175.58 160.37 29.20 131.17 9 134
坪山区 Pingshan 166.31 42.80 6.49 36.31 2 574
光明新区 Guangming 155.44 59.68 7.01 52.67 3 839
大鹏新区 Dapeng 295.38 14.61 3.94 10.67 495
深汕特别合作区 ShenshanSpecial Cooperation Zone - 7.57 6.81 0.76 -
注: 1、按照国家目前的人口统计制度以及市政府《深圳市人口统计监测办法》,自2006年起,深圳户籍人口指拥有深圳红印户口,在深圳居住半年以上的人口。 Note:Since 2006, according to the country's current demographic system and Shenzhen demographic monitoring methods promulgated by Shenzhen Municipal government, the data of registered population refers to people who have registered and lived in Shenzhen over half a year. 2、按照相关规定,从2016年开始,原常住人口中的户籍人口、非户籍人口名称分别改为常住户籍人口和常住非户籍人口。 Since 2016,according to relevant regulations,the figure of registered population and non-registered population has changed to the figure of permanent registered population and permanent non-registered population. 3、全市人口密度不含深汕特别合作区。 Total density of population does not include ShenshanSpecial Cooperation Zone.

4
1-3 各时期国民经济和社会发展统计指标总量及年均增长速度
ANNUAL AVERAGE GROWTH RATE OF MAIN NATIONAL ECONOMIC AND
SOCIAL DEVELOPMENT INDICATORS OF EACH PERIOD
年 份 Year
年末常住 人口(万人) Year-end Permanent Population
(10 000persons)
年末就业人员合计 (万人)
Number of Employed Persons
(10 000persons)
常住户籍人口
Permanent Registered Population
常住非户籍人口
PermanentNon-
registered Population
在岗职工 Fully Employed
Staff and Workers
私营个体 就业人员
Self- employedIndividuals
1979 31.41 31.26 0.15 13.95 4.02 0.411980 33.29 32.09 1.20 14.89 4.86 0.38
“六五”时期 "Sixth Five-year" Period1981 36.69 33.39 3.30 15.36 5.31 0.131982 44.95 35.45 9.50 18.49 8.28 0.111983 59.52 40.52 19.00 22.37 12.57 0.221984 74.13 43.52 30.61 27.26 18.33 0.501985 88.15 47.86 40.29 32.61 22.66 0.64
年均增长速度(%) Annual Average Growth Rate(%) 21.5 8.3 101.9 17.0 36.1 11.0
“七五”时期 "Seventh Five-year" Period1986 93.56 51.45 42.11 36.04 25.88 0.931987 105.44 55.60 49.84 44.30 32.29 1.101988 120.14 60.14 60.00 54.53 41.74 1.691989 141.60 64.82 76.78 93.65 48.24 2.191990 167.78 68.65 99.13 109.22 55.41 3.36
年均增长速度(%) Annual Average Growth Rate(%) 13.7 7.5 19.7 27.3 19.6 39.3
“八五”时期 "Eighth Five-year" Period1991 226.76 73.22 153.54 149.32 64.89 4.871992 268.02 80.22 187.80 175.97 71.10 12.331993 335.97 87.69 248.28 220.81 78.11 38.841994 412.71 93.97 318.74 273.00 82.29 54.631995 449.15 99.16 349.99 298.51 88.75 72.17
年均增长速度(%) Annual Average Growth Rate(%) 21.8 7.6 28.7 22.3 9.9 84.7
“九五”时期 "Ninth Five-year" Period1996 482.89 103.38 379.51 322.12 89.13 87.141997 527.75 109.46 418.29 353.53 91.18 103.591998 580.33 114.60 465.73 390.33 91.93 114.791999 632.56 119.85 512.71 426.89 92.52 120.862000 701.24 124.92 576.32 474.97 93.36 139.88
年均增长速度(%) Annual Average Growth Rate(%) 9.3 4.7 10.5 9.7 1.3 14.2
“十五”时期 "Tenth Five-year" Period2001 724.57 132.04 592.53 491.30 94.88 152.682002 746.62 139.45 607.17 509.74 101.76 166.882003 778.27 150.93 627.34 535.89 108.20 187.722004 800.80 165.13 635.67 562.17 135.88 204.162005 827.75 181.93 645.82 576.26 165.38 210.87
年均增长速度(%) Annual Average Growth Rate(%) 3.4 7.8 2.3 3.9 10.4 8.6
“十一五”时期 "Eleventh Five-year" Period2006 871.10 196.83 674.27 609.76 184.25 250.772007 912.37 212.38 699.99 647.11 193.04 279.832008 954.28 228.07 726.21 682.35 198.35 301.972009 995.01 241.45 753.56 723.61 220.16 326.522010 1 037.20 251.03 786.17 758.14 251.09 376.60
年均增长速度(%) Annual Average Growth Rate(%) 4.6 6.7 4.0 5.6 8.7 12.3
“十二五”时期 "Twelfth Five-year" Period2011 1 046.74 267.90 778.85 764.54 261.43 408.352012 1 054.74 287.62 767.13 771.20 277.90 430.712013 1 062.89 310.47 752.42 899.24 445.84 441.832014 1 077.89 332.21 745.68 899.66 448.93 438.432015 1 137.87 354.99 782.88 906.14 447.41 446.22
年均增长速度(%) Annual Average Growth Rate(%) 1.9 7.2 -0.1 3.6 12.2 3.5
“十三五”时期 "Thirteenth Five-year"Period2016 1 190.84 384.52 806.32 926.38 442.55 470.152017 1 252.83 434.72 818.11 943.29 447.32 477.87
以1979年为基期年 Annual Average Growth Rate 10.2 7.1 25.4 11.7 13.2 20.4平均增长速度(%) from 1979(%)

5
1-3 续表 1 continued
年 份 Year
地区生产 总值(万元)
Gross Domestic Product
(10 000yuan)
人均地区生产总值 (元/人) Gross
Domestic Product Per
Capita (yuan)
固定 资产投资额
(万元) Investment
in Fixed Assets
(10 000yuan)
第一产业 Primary Industry
第二产业 Secondary Industry
第三产业 Tertiary Industry
#房地产 开发投资
Investment in Real Estate
Development
1979 19 638 7 273 4 017 8 348 606 5 9381980 27 012 7 803 7 036 12 173 835 13 801
“六五”时期 "Sixth Five-year" Period1981 49 576 13 343 16 019 20 214 1 417 29 6841982 82 573 18 960 31 439 32 174 2 023 73 7501983 131 212 22 614 55 848 52 750 2 512 108 3201984 234 161 25 932 106 606 101 623 3 504 194 5721985 390 222 26 111 163 586 200 525 4 809 333 235
年均增长速度(%) Average Annual Growth Rate(%) 50.3 13.8 86.9 49.2 25.1 89.0
“七五”时期 "Seventh Five-year" Period1986 416 451 32 907 163 185 220 359 4 584 248 5511987 559 015 46 519 220 463 292 033 5 349 285 1931988 869 807 57 005 359 230 453 572 6 477 436 1911989 1 156 565 68 615 505 361 582 589 6 710 499 9191990 1 716 665 70 220 769 319 877 126 8 724 623 380 112 000
年均增长速度(%) Average Annual Growth Rate(%) 22.4 8.7 33.1 16.2 2.6 13.3
“八五”时期 "Eighth Five-year" Period1991 2 366 630 808 36 1 126 084 1 159 710 11 997 912 324 255 6001992 3 173 194 105 914 1 522 432 1 544 848 12 827 1 782 322 714 9001993 4 531 445 108 615 2 420 214 2 002 616 15 005 2 477 875 1 027 7001994 6 346 711 134 152 3 357 972 2 854 587 16 954 2 819 413 1 304 6001995 8 427 933 124 122 4 223 744 4 080 067 19 558 2 758 243 1 030 368
年均增长速度(%) Average Annual Growth Rate(%) 30.9 -0.6 33.4 29.6 6.7 34.6 55.9
“九五”时期 "Ninth Five-year" Period1996 10 505 121 148 796 5 081 045 5 275 280 22 542 3 275 270 1 248 2511997 13 023 008 147 660 6 209 018 6 666 330 25 772 3 930 657 1 366 5451998 15 449 472 151 764 7 508 019 7 789 689 27 885 4 803 901 1 674 8541999 18 246 876 150 445 9 154 443 8 941 988 30 088 5 695 878 2 152 5412000 22 192 015 155 656 11 087 644 10 948 715 33 276 6 771 205 2 609 694
年均增长速度(%) Average Annual Growth Rate(%) 16.5 2.9 17.2 15.8 6.7 19.7 20.4
“十五”时期 "Tenth Five-year" Period2001 25 229 474 160 413 12 583 983 12 485 078 35 390 6 863 749 3 156 3642002 30 172 384 166 587 14 980 113 15 025 684 41 018 7 881 459 3 884 4452003 36 401 435 142 048 18 562 162 17 697 225 47 743 9 491 016 4 126 6362004 43 502 928 123 264 22 643 124 20 736 540 55 099 10 925 571 4 342 4322005 50 357 678 97 385 27 096 861 23 163 432 61 844 11 823 245 4 236 865
年均增长速度(%) Average Annual Growth Rate(%) 16.4 -9.0 19.2 13.6 11.9 11.8 10.2
“十一五”时期 "Eleventh Five-year" Period2006 59 206 612 68 851 31 449 697 27 688 064 69 702 12 736 693 4 620 9402007 69 252 268 77 374 35 135 153 34 039 741 77 660 13 450 037 4 610 4222008 79 414 328 83 804 39 799 045 39 531 479 85 088 14 676 043 4 404 8972009 84 858 247 69 599 40 095 728 44 692 920 87 066 17 091 514 4 374 5902010 100 022 183 68 391 47 379 750 52 574 042 98 437 19 447 008 4 584 693
年均增长速度(%) Annual Average Growth Rate(%) 13.5 -16.5 13.4 13.6 8.6 10.5 1.6
“十二五”时期 "Twelfth Five-year" Period2011 118 072 348 69 491 56 128 559 61 874 298 113 316 20 609 180 5 147 3622012 133 196 818 68 164 60 559 131 72 569 523 126 765 23 144 319 7 368 4212013 149 794 486 63 504 66 579 909 83 151 073 141 474 24 901 970 8 769 0022014 164 494 770 57 579 72 242 462 92 194 729 153 677 27 174 226 10 694 8552015 180 140 720 72 084 76 780 987 103 287 649 162 599 32 983 076 13 310 333
年均增长速度(%) Average Annual Growth Rate(%) 9.7 -9.4 8.8 10.5 7.8 11.1 23.8
“十三五”时期 "Thirteenth Five-year"Period2016 200 797 043 82 840 83 106 513 117 607 690 172 453 40 781 638 17 565 2092017 224 900 586 195 721 93 180 979 131 523 886 183 544 51 473 152 21 358 565
以1979年为基期 Annual Average Growth Rate 22.4 -0.8 28.3 21.7 11.2 26.9 21.5年平均增长速度(%) from 1979(%)

6
1-3 续表 2 continued
年 份 Year
一般公共预算收入 (万元)
Local Financial Revenue
(10 000yuan)
一般公共预算支出 (万元)
Local Financial Expenditure(10 000yuan)
农业总产 值(万元)
Gross Output Value of
Agriculture(10 000yuan)
工业总产值
(万元) Gross Output
Value of Industry
(10 000yuan)
社会消费品零售总额
(万元) Retail Sales
of Consumer Goods
(10 000yuan)
轻工业 Light
Industry
重工业 Heavy
Industry
1979 1 721 2 971 13 106 7 128 6 307 821 11 2591980 3 043 4 003 16 938 10 632 9 265 1 367 19 615
“六五”时期 "Sixth Five-year" Period1981 8 787 8 411 24 181 26 692 25 172 1 520 34 2291982 9 163 8 815 26 929 38 833 34 453 4 380 54 1851983 15 605 15 025 29 083 75 993 61 513 14 480 123 7941984 29 435 27 954 40 416 172 132 137 698 34 434 201 1071985 62 894 58 651 45 821 246 662 194 108 52 554 265 642
年均增长速度(%) Annual Average Growth Rate(%) 83.3 71.1 9.1 91.3 89.0 104.5 68.4
“七五”时期 "Seventh Five-year" Period1986 74 160 68 073 49 552 340 227 266 318 73 909 273 7121987 87 521 69 688 73 772 558 311 433 738 124 573 324 3641988 146 521 110 992 99 404 1 012 739 779 258 233 481 502 4301989 228 668 173 007 108 015 1 477 470 1 080 785 396 685 545 7411990 217 037 198 073 119 205 2 202 180 1 657 859 544 321 667 580
年均增长速度(%) Annual Average Growth Rate(%) 28.1 27.6 14.9 46.9 43.2 60.3 20.2
“八五”时期 "Eighth Five-year" Period1991 273 291 243 012 143 063 3 153 966 2 233 705 920 261 828 3411992 429 599 420 035 185 297 4 347 007 2 971 348 1 375 659 1 148 9081993 672 507 593 327 192 880 6 896 969 4 655 394 2 241 575 2 641 3331994 743 992 746 181 224 776 11 014 065 6 351 224 4 662 841 3 639 7561995 880 174 934 041 232 653 12 922 075 7 008 231 5 913 844 4 269 434
年均增长速度(%) Annual Average Growth Rate(%) 32.3 36.4 -0.4 36.9 28.3 52.5 31.2
“九五”时期 "Ninth Five-year" Period1996 1 317 490 1 380 376 273 246 15 305 964 8 580 027 6 725 937 4 888 5021997 1 420 557 1 394 181 270 889 18 175 704 10 151 182 8 024 522 5 372 4641998 1 643 884 1 767 714 298 174 21 573 817 11 141 650 10 432 167 5 732 4191999 1 842 085 2 108 978 299 662 24 435 849 12 381 928 12 053 921 6 385 9152000 2 219 184 2 250 441 311 359 30 715 227 13 731 333 16 983 894 7 350 188
年均增长速度(%) Annual Average Growth Rate(%) 20.3 19.2 6.0 20.8 17.1 24.3 11.5
“十五”时期 "Tenth Five-year" Period2001 2 624 944 2 537 019 327 111 37 476 713 13 861 331 23 615 382 8 320 4122002 2 659 287 3 077 761 340 757 46 823 584 15 832 485 30 991 099 9 419 4432003 2 908 370 3 489 526 337 406 67 976 472 21 459 058 46 517 414 10 951 3232004 3 214 680 3 775 720 299 939 85 888 321 24 175 842 61 712 479 12 506 4112005 4 123 785 5 991 560 217 369 101 745 351 27 406 557 74 338 794 14 416 103
年均增长速度(%) Annual Average Growth Rate(%) 13.2 21.6 - 24.7 18.3 27.1 14.6
“十一五”时期 "Eleventh Five-year" Period2006 5 008 827 5 714 231 180 017 122 784 801 29 658 032 93 126 769 16 804 6042007 6 580 555 7 279 677 171 380 143 628 918 35 687 625 107 941 293 19 308 0502008 8 003 603 8 898 555 187 859 162 837 576 44 451 550 118 386 026 22 765 8552009 8 808 168 10 008 394 154 760 158 286 329 39 239 987 119 046 342 25 679 4362010 11 068 166 12 660 668 150 467 188 796 600 46 801 421 141 995 179 30 007 629
年均增长速度(%) Annual Average Growth Rate(%) 21.8 16.1 - 14.8 12.8 15.5 15.6
“十二五”时期 "Twelfth Five-year" Period2011 13 395 728 15 905 599 152 533 212 730 916 53 500 744 159 230 172 35 208 7362012 14 820 800 15 690 071 148 572 223 089 847 58 544 922 164 544 925 40 087 7942013 17 312 618 16 908 280 139 479 240 440 285 64 571 965 175 868 320 45 004 5592014 20 827 326 21 661 841 129 156 258 099 411 67 789 093 190 310 318 49 189 9832015 27 268 543 35 216 708 159 515 266 080 844 60 837 504 205 243 340 50 178 375
年均增长速度(%) Annual Average Growth Rate(%) 19.8 22.7 - 7.8 6.0 8.3 11.3
“十三五”时期 "Thirteenth Five-year"Period2016 31 364 923 42 110 429 167 329 285 477 743 63 626 629 221 851 114 55 127 5562017 33 321 303 45 938 003 388 609 335 504 139 61 190 305 274 313 834 60 161 866
以1979年为基期年 Annual Average Growth Rate 29.8 28.9 - 31.6 27.6 37.7 23.7平均增长速度(%) from 1979(%)
注: 国家统计局从2005年取消农业总产值1990年不变价,故不可比。 Note: From 2005,the National Bureau of Statistics has cancelled the index,Gross Output Value of Agriculture (at 1990 Constant Prices),so it is incomparable with other years.

7
1-3 续表 3 continued
年 份 Year
全社会货运量(万吨)
Freight Traffic
Volume(10 000tons)
全社会客 运量(万人) Passenger Traffic
(10 000person)
港口货物吞 吐量(万吨)
Cargo Handled at Seaport
(10 000tons)
邮电业务总量(万元)
Revenue from Postal and
Telecommunic-ations Services
(10 000yuan)
进出口总额(万美元)
Total Imports
and Exports (USD10 000)
出口总额
Exports
进口总额
Imports
1979 10 138 1 676 930 7461980 30 190 1 751 1 124 627
“六五”时期 "Sixth Five-year" Period1981 70 340 2 807 1 745 1 0621982 91 520 2 534 1 597 9371983 141 567 78 642 6 230 72 4121984 210 923 107 247 26 539 80 7081985 327 1 761 130 632 56 340 74 292
年均增长速度(%) Annual Average Growth Rate(%) 36.1 56.1 136.9 118.8 159.9
“七五”时期 "Seventh Five-year" Period1986 1 521 3 973 302 2 633 184 696 72 552 112 1441987 1 627 4 268 485 4 880 255 784 141 354 114 4301988 1 704 5 858 734 14 826 344 277 184 949 159 3281989 1 383 6 349 956 21 293 375 259 217 428 157 8311990 1 349 8 833 1 292 55 356 1 570 136 815 165 754 971
年均增长速度(%) Annual Average Growth Rate(%) 31.6 78.9 33.2 39.7 27.2
“八五”时期 "Eighth Five-year" Period1991 1 486 6 400 1 563 84 927 1 947 635 986 240 961 3951992 1 801 8 135 1 956 114 492 2 357 562 1 200 019 1 157 5431993 2 050 10 218 2 541 174 045 2 820 392 1 421 776 1 398 6161994 2 604 8 531 3 002 259 432 3 498 281 1 830 921 1 667 3601995 3 542 8 261 3 080 368 945 3 876 960 2 052 736 1 824 224
年均增长速度(%) Annual Average Growth Rate(%) 21.3 -1.3 19.0 46.1 19.8 20.3 19.3
“九五”时期 "Ninth Five-year" Period1996 3 647 8 281 3 021 462 261 3 905 342 2 120 781 1 784 5611997 3 853 8 515 3 357 610 111 4 500 921 2 561 844 1 939 0771998 4 050 8 484 3 444 764 658 4 527 417 2 639 611 1 887 8061999 4 274 8 754 4 663 982 686 5 042 750 2 820 811 2 221 9392000 4 697 9 346 5 697 1 336 000 6 393 982 3 456 333 2 937 649
年均增长速度(%) Annual Average Growth Rate(%) 5.8 2.5 13.1 29.4 10.5 11.0 10.0
“十五”时期 "Tenth Five-year" Period2001 5 147 9 869 6 643 1 419 000 6 861 055 3 747 955 3 113 1002002 5 683 10 632 8 767 1 644 200 8 723 148 4 655 704 4 067 4442003 6 478 10 471 11 220 1 980 300 11 739 941 6 296 201 5 443 7332004 7 168 12 019 13 537 2 660 100 14 728 302 7 784 632 6 943 6702005 8 249 12 602 15 351 3 208 000 18 281 689 10 151 829 8 129 860
年均增长速度(%) Annual Average Growth Rate(%) 15.9 6.2 21.9 26.3 23.4 24.0 22.6
“十一五”时期 "Eleventh Five-year" Period2006 11 429 13 965 17 598 3 795 000 23 738 573 13 609 556 10 129 0172007 13 678 15 056 19 994 5 135 400 28 753 345 16 849 299 11 904 0462008 19 570 154 283 21 125 6 117 500 29 995 499 17 971 995 12 023 5042009 22 367 146 316 19 365 6 765 200 27 016 306 16 197 825 10 818 4812010 26 174 156 203 22 098 2 937 000 34 674 930 20 418 355 14 256 575
年均增长速度(%) Annual Average Growth Rate(%) - - 7.6 20.5 13.5 14.8 10.8
“十二五”时期 "Twelfth Five-year" Period2011 28 901 168 447 22 325 3 562 600 41 409 312 24 551 760 16 857 5522012 28 678 184 982 22 807 5 635 800 46 683 020 27 136 163 19 546 8572013 27 512 12 059 23 398 6 229 900 53 747 437 30 570 191 23 177 2462014 29 382 15 103 22 324 7 619 900 48 774 049 28 436 157 20 337 8922015 32 475 16 511 21 706 10 403 200 44 245 863 26 403 895 17 841 968
年均增长速度(%) Annual Average Growth Rate(%) - - -0.4 - 5.0 5.3 4.5
“十三五”时期 "Thirteenth Five-year"Period2016 31 164 17 009 21 410 17 150 200 39 843 893 23 754 674 16 089 2182017 32 269 18 142 24 136 16 455 500 41 414 596 24 435 790 16 978 806
以1979年为基期年 Annual Average Growth Rate - - 22.7 - 26.9 27.3 26.4平均增长速度(%) from 1979(%)

8
1-3 续表 4 continued
年 份 Year
国内金融机构人民币存款(万元) RMB deposits of domestic financial
institutions(10 000yuan)
国内金融机构人民币贷款(万元) RMB loans of
domestic financial institutions
(10 000yuan)
医院数 (个)
Hospital (unit)
医院病床(张)
Hospital Beds (unit)
卫生技术 人员(人) Medical
Technical Personnel (person)
# 执业 医师(人) Licensed Doctors (person)
1979 10 125 7 523 25 597 988 3641980 20 284 13 422 24 643 1 088 438
“六五”时期 "Sixth Five-year" Period1981 48 713 23 944 24 790 1 270 5181982 63 707 63 013 26 717 1 609 7081983 112 554 119 471 30 1 023 2 343 1 0731984 349 763 451 034 29 1 634 3 064 1 4841985 302 567 537 014 31 1 885 3 857 1 862
年均增长速度(%) Annual Average Growth Rate(%) 71.7 109.1 5.3 24.0 28.8 33.6
“七五”时期 "Seventh Five-year" Period1986 551 112 730 855 32 2 028 4 657 2 2171987 808 545 1 065 176 34 2 225 5 117 2 4081988 1 317 381 1 536 202 35 2 496 5 715 2 7541989 1 376 310 1 789 834 35 2 838 6 451 3 1031990 1 946 923 2 386 157 38 3 108 6 996 3 426
年均增长速度(%) Annual Average Growth Rate(%) 45.1 34.8 4.2 10.5 12.6 13.0
“八五”时期 "Eighth Five-year" Period1991 3 009 164 2 797 500 41 3 498 7 618 3 7371992 5 504 616 3 707 067 45 4 466 8 571 4 2471993 6 573 461 5 015 868 45 5 168 9 888 4 7981994 9 333 699 6 421 390 48 6 040 11 034 5 3471995 12 029 322 7 863 364 63 6 640 12 449 6 050
年均增长速度(%) Annual Average Growth Rate(%) 43.9 26.9 10.6 16.4 12.2 12.0
“九五”时期 "Ninth Five-year" Period1996 15 334 600 9 652 000 65 7 105 14 652 7 2661997 18 227 000 12 025 800 72 7 813 14 932 7 4001998 22 383 700 15 503 700 72 8 353 14 975 7 1911999 25 589 900 18 481 600 71 8 720 15 143 7 0622000 31 690 000 22 921 800 72 9 616 15 720 7 418
年均增长速度(%) Annual Average Growth Rate(%) 21.4 23.9 2.7 7.7 4.8 4.2
“十五”时期 "Tenth Five-year" Period2001 40 925 700 28 607 500 75 10 542 17 135 8 0972002 49 527 300 35 142 800 77 11 808 18 615 7 8532003 60 794 800 45 250 500 85 12 607 21 234 8 9092004 71 007 500 52 427 700 87 14 186 22 895 9 8462005 84 781 600 61 680 400 97 15 577 25 681 10 961
年均增长速度(%) Annual Average Growth Rate(%) 21.8 21.9 6.1 10.1 10.3 8.1
“十一五”时期 "Eleventh Five-year" Period2006 95 404 200 67 553 200 99 16 193 43 266 16 2382007 114 957 900 79 654 500 101 16 766 46 877 17 4502008 130 112 400 90 584 600 100 18 435 50 608 18 8072009 169 381 900 116 463 400 101 19 872 53 778 19 9632010 202 107 500 137 081 600 107 21 166 54 081 20 122
年均增长速度(%) Annual Average Growth Rate(%) 19.0 17.3 2.0 6.3 16.1 12.9
“十二五”时期 "Twelfth Five-year" Period2011 227 823 900 157 149 600 110 22 322 58 059 21 5172012 259 102 400 173 054 700 115 26 124 61 961 22 8312013 298 309 900 198 035 800 117 27 079 65 782 24 2212014 445 892 900 228 053 900 122 28 853 69 936 25 7282015 518 061 800 271 299 900 123 31 425 74 884 27 834
年均增长速度(%) Annual Average Growth Rate(%) - - 2.8 8.2 6.7 6.7
“十三五”时期 "Thirteenth Five-year"Period2016 577 933 000 340 342 900 134 38 124 78 826 29 3002017 627 604 000 399 406 100 135 39 899 85 282 31 838
以1979年为基期年 Annual Average Growth Rate - - 4.5 11.7 12.4 12.5平均增长速度(%) from 1979(%)
注: 2015年起,人民银行调整了金融机构存贷款统计口径,2014年数据相应调整。Note:From 2015,the statistial range of RMB deposits(loans) of domestic financial institutions have been adjusted,the data of 2014 have been adjusted by the same caliber.
9
1-3 续表 5 continued
年 份 Year
在校学生数(人) (person) Students Enrollment
在岗职工工资总额(万元)
Total Wage Bill of Fully
Employed Staff and Workers (10 000yuan)
在岗职工年平均工资(元)
Average Wage of Fully Employed Staff and Workers
(yuan)
城镇居民人 均可支配收入
(元/人) Per Capita Disposable
Income of Urban Residents
(yuan/person)
普通高等 学 校 Institutions of Higher Education
普通中学 Regular
Secondary Schools
小 学 Primary Schools
1979 13 686 47 022 2 952 7691980 12 296 49 168 4 366 979
“六五”时期 "Sixth Five-year" Period1981 13 088 51 560 5 930 1 1321982 17 080 54 538 10 000 1 3661983 216 20 982 56 319 16 142 1 5451984 1 236 27 636 62 021 35 306 2 1791985 3 206 35 334 70 277 51 912 2 418 1 915
年均增长速度(%) Annual Average Growth Rate(%) 23.5 7.4 64.1 19.8
“七五”时期 "Seventh Five-year" Period1986 3 478 40 208 77 884 59 773 2 452 1 8171987 4 330 44 910 84 601 80 013 2 677 2 0911988 4 710 43 267 96 474 134 218 3 388 2 5691989 4 419 45 056 104 041 179 042 3 858 3 6571990 3 964 46 473 111 711 227 392 4 304 4 127
年均增长速度(%) Annual Average Growth Rate(%) 4.3 5.6 9.7 34.4 12.2 16.6
“八五”时期 "Eighth Five-year" Period1991 3 779 50 625 118 460 307 950 5 016 4 5641992 3 653 55 857 127 978 403 790 5 931 5 7831993 3 680 60 337 139 272 619 647 8 145 7 7371994 4 227 66 073 147 186 852 332 10 572 10 5031995 5 291 71 540 157 210 1 076 083 12 276 12 771
年均增长速度(%) Annual Average Growth Rate(%) 5.9 9.0 7.1 36.5 23.3 25.3
“九五”时期 "Ninth Five-year" Period1996 6 493 76 949 170 983 1 284 558 14 507 16 2961997 7 601 82 155 190 192 1 479 515 16 531 18 5791998 8 497 86 009 215 652 1 674 771 18 381 19 2141999 10 568 91 260 256 060 1 890 338 20 714 19 5202000 14 123 106 996 313 852 2 113 366 23 039 20 906
年均增长速度(%) Annual Average Growth Rate(%) 21.7 8.4 14.8 14.6 13.2 10.4
“十五”时期 "Tenth Five-year" Period2001 18 743 126 190 363 657 2 441 713 25 941 22 7602002 26 778 150 654 415 097 2 832 799 28 218 24 9412003 32 106 179 628 469 684 3 259 896 30 611 25 9362004 41 251 211 224 526 419 4 192 834 31 928 27 5962005 45 314 240 508 566 278 5 167 453 32 476 21 494
年均增长速度(%) Annual Average Growth Rate(%) 26.3 17.6 12.5 18.1 7.4 7.5
“十一五”时期 "Eleventh Five-year" Period2006 51 220 256 630 564 891 6 296 568 35 107 22 5672007 58 910 279 180 575 160 7 335 805 38 798 24 3012008 64 675 298 939 585 852 8 674 142 43 454 26 7292009 66 952 316 024 589 481 10 029 764 46 723 29 2452010 67 324 334 752 618 459 12 338 778 50 456 32 381
年均增长速度(%) Annual Average Growth Rate(%) 8.2 6.8 1.8 19.0 9.2 8.5
“十二五”时期 "Twelfth Five-year" Period2011 70 004 346 942 651 307 14 384 948 55 143 36 5052012 75 570 359 643 683 058 16 421 777 59 010 40 7422013 82 401 371 735 730 232 28 135 080 62 619 44 6532014 87 674 378 690 793 178 32 879 754 72 651 40 9482015 90 511 385 221 864 841 36 627 244 81 034 44 633
年均增长速度(%) Annual Average Growth Rate(%) 6.1 2.8 6.9 24.3 9.9 -
“十三五”时期 "Thirteenth Five-year"Period2016 91 883 396 455 910 974 39 940 453 89 757 48 6952017 96 702 417 641 964 510 44 697 603 100 173 52 938
以1979年为基期年 Annual Average Growth Rate 19.7 9.4 8.3 28.6 13.7 -平均增长速度(%) from 1979(%)
注: 普通高等学校在校学生数年平均增长速度以1983年为基期。Note:Annual average growth rate of the student number in institutions of higher education is based on 1983.

10
1-4 主要年份国民经济主要指标比例关系
PERCENTAGE OF MAIN NATIONAL ECONOMIC INDICATORS IN MAIN YEARS
年 份 Year
以就业人员人数为100 Employed Persons=100
以地区生产总值为100 Gross Domestic Product=100
第一产业Primary Industry
第二产业Secondary Industry
第三产业Tertiary Industry
第一产业Primary Industry
第二产业Secondary Industry
第三产业Tertiary Industry
1979 37.0 20.5 42.51980 28.9 26.0 45.11985 6.7 41.9 51.41990 6.1 69.8 24.1 4.1 44.8 51.11995 1.5 66.0 32.5 1.5 50.1 48.4 2000 0.8 57.0 42.2 0.7 50.0 49.3 2001 0.7 55.7 43.6 0.6 49.9 49.5 2002 0.8 55.8 43.5 0.6 49.6 49.8 2003 0.8 57.0 42.2 0.4 51.0 48.6 2004 0.5 57.6 41.9 0.3 52.0 47.7 2005 0.5 57.7 41.8 0.2 53.8 46.0 2006 0.3 57.4 42.3 0.1 53.1 46.8 2007 0.1 54.1 45.8 0.1 50.7 49.2 2008 0.1 54.1 45.8 0.1 50.1 49.8 2009 0.1 53.9 46.0 0.1 47.2 52.7 2010 ... 51.5 48.5 0.1 47.4 52.5 2011 ... 50.1 49.9 0.1 47.5 52.4 2012 ... 52.0 48.0 0.1 45.4 54.5 2013 ... 48.6 51.4 … 44.5 55.5 2014 ... 48.0 52.0 … 43.9 56.1 2015 ... 46.6 53.4 … 42.6 57.4 2016 ... 45.2 54.8 … 41.4 58.6 2017 0.2 44.4 55.4 0.1 41.4 58.5
1-4 续表 1 continued
年 份 Year
以工业总产值为100 Gross Output Value of
Industry=100
以固定资产投资总额为100 Investment in Fixed Assets=100
轻工业 Light Industry
重工业Heavy Industry
非房地产开发项目Non-Real Estate
Development
房地产开发项目Real Estate Development
1979 88.5 11.5 100.01980 87.1 12.9 100.01985 78.7 21.3 100.01990 75.3 24.7 82.0 18.01995 54.2 45.8 62.6 37.42000 44.7 55.3 61.5 38.52001 37.0 63.0 54.0 46.02002 33.8 66.2 50.7 49.32003 31.6 68.4 56.5 43.52004 28.1 71.9 60.3 39.72005 26.9 73.1 64.2 35.82006 24.2 75.8 63.7 36.32007 24.8 75.2 65.7 34.32008 27.3 72.7 70.0 30.02009 24.8 75.2 74.4 25.62010 24.8 75.2 76.4 23.62011 25.1 74.9 75.0 25.02012 26.2 73.8 68.2 31.82013 26.9 73.1 64.8 35.22014 26.3 73.7 60.6 39.42015 22.9 77.1 59.6 40.42016 22.3 77.7 56.9 43.12017 18.2 81.8 58.5 41.5
11
1-4 续表 2 continued
年 份 Year
以货运量为100 Freight Traffic=100 固定资产投资总额相当
于地区生产总值(%) Investment in Fixed
Assets as Percentage of GDP(%)
铁路 Railways
公路 Highways
水运 Waterways
民航 Civil Aviation
1979 30.2
1980 51.1
1985 85.4
1990 10.9 78.2 10.9 36.3
1995 6.2 76.8 16.9 0.1 32.7
1996 5.8 77.1 17.0 0.1 31.2
1997 7.0 76.8 16.1 0.1 30.2
1998 6.4 79.3 14.2 0.1 31.1
1999 6.0 81.5 12.3 0.1 31.2
2000 6.0 81.4 12.5 0.1 30.5
2001 5.7 82.9 11.3 0.1 27.2
2002 4.8 84.8 10.3 0.1 26.1
2003 4.9 83.9 11.1 0.1 26.1
2004 4.9 83.2 11.7 0.2 25.1
2005 4.8 83.4 11.7 0.2 23.5
2006 2.7 69.3 27.8 0.2 21.5
2007 2.4 67.8 29.6 0.2 19.4
2008 2.1 76.6 21.2 0.2 18.5
2009 2.1 78.8 18.8 0.2 20.1
2010 1.5 75.8 22.4 0.3 19.4
2011 1.4 75.0 23.3 0.3 17.5
2012 1.4 76.7 21.7 0.2 17.4
2013 1.3 73.0 25.4 0.2 16.6
2014 0.4 71.4 27.9 0.3 16.5
2015 0.2 76.3 23.3 0.2 18.3
2016 0.3 76.3 23.1 0.3 20.3
2017 0.2 74.2 25.3 0.3 22.9

12
1-5 主要年份国民经济和社会发展主要指标平均每人水平
PER CAPITA MAIN NATIONAL ECONOMIC AND SOCIAL DEVELOPMENT
INDICATORS IN MAIN YEARS单位:元 (yuan)
年 份 Year
地区 生产总值
Gross Domestic Product
农业总产值 Gross
Output Value of
Agriculture
工业总产值 Gross
Output Value of Industry
一般公共预算收入
Local Financial Revenue
社会消费品 零售总额
Retail Sales of
Consumer Goods
在岗职工年平均货币工资
Average Wage of Fully
Employed Staff and Workers
城市居民可支配收入
Per Capita Disposable Income of
Urban Residents
1980 835 524 329 94 606 9791985 4 809 565 3 040 775 3 274 2 418 1 9151990 8 724 606 11 192 1 403 3 393 4 304 4 1271995 19 558 540 29 986 2 042 9 907 12 276 12 7712000 33 276 467 46 057 3 328 11 021 23 039 20 9062001 35 390 459 52 569 3 682 11 671 25 941 22 7602002 41 018 463 63 654 3 615 12 805 28 218 24 9412003 47 743 443 89 156 3 815 14 363 30 611 25 9362004 55 099 380 108 783 4 072 15 840 31 928 27 5962005 61 844 267 124 952 5 064 17 704 32 476 21 4942006 69 702 211 144 550 5 897 19 784 35 107 22 5672007 77 660 192 161 067 7 379 21 652 38 798 24 3012008 85 088 201 174 470 8 575 24 392 43 454 26 7292009 87 066 159 162 404 9 037 26 347 46 723 29 2452010 98 437 148 185 804 10 893 29 532 50 456 32 3812011 113 316 146 204 162 12 856 33 791 55 143 36 5052012 126 765 141 212 317 14 105 38 152 59 010 40 7422013 141 474 132 227 083 16 351 42 504 62 619 44 6532014 153 677 121 241 127 19 458 45 955 72 651 40 9482015 162 599 144 240 171 24 613 45 292 81 034 44 6332016 172 453 144 245 180 26 937 47 346 89 757 48 6952017 183 544 317 273 809 27 194 49 099 100 173 52 938
1-5 续表 continued
年 份 Year
生活用电量 (千瓦时)
Electricity for Residential
Consumption (kwh)
每百人拥有 电话(部)
Number of Telephone
Sets Per 100 Persons
(set)
每万人拥有 Per 10 000 persons *人均公园
绿地面积 (平方米)
Urban Public Green Areas
(sq.m)
医生 (人)
Number of Doctors (person)
医院病床(张) Number of
Beds in Hospital
(bed)
1980 13 19
1985 21 21
1990 302 7 20 19
1995 292 18 13 15 12.7
2000 500 57 11 14 14.2
2001 495 84 11 15 14.7
2002 439 118 11 16 14.9
2003 537 158 12 16 15.1
2004 548 174 13 18 16.0
2005 660 212 14 19 16.1
2006 687 215 20 19 16.1
2007 805 244 21 18 16.1
2008 752 246 21 19 16.2
2009 812 234 21 20 16.3
2010 814 243 20 20 16.4
2011 858 274 22 21 16.5
2012 993 296 23 25 16.6
2013 982 286 24 25 16.7
2014 1 124 362 25 27 16.8
2015 1 127 296 25 28 16.9
2016 1 154 264 26 32 16.5
2017 1 150 254 27 32 16.0注: 2002年以前为特区数,2002年及以后为全市数。 Note: The data before the year 2002 are calculated from special region,the data from 2002 are calculated from the whole city.

13
1-6 主要年份国民经济和社会发展主要指标平均每天水平
AVERAGE DAILY LEVEL OF MAIN NATIONAL ECONOMIC AND SOCIAL
DEVELOPMENT INDICATORS IN MAIN YEARS
年 份 Year
地 区 生产总值
(万元)Gross
Domestic Product
(10 000yuan)
工业总产值(万元)
Gross Output Value of Industry
(10 000yuan)
农业总产值(万元)
Gross Output Value of
Agriculture (10 000yuan)
固定资产投资总额(万元)
Investment in Fixed Assets (10 000yuan)
一般公共预算收入(万元)Local Financial
Revenue (10 000yuan)
货运量 (万吨) Freight Traffic (10 000 tons)
客运量 (万人)
Passengers Traffic (10 000
person-times)
1979 54 20 36 16 51980 74 29 46 38 81985 1 069 676 126 913 1721990 4 703 6 033 327 1 587 595 3.70 24.201995 23 090 35 403 637 7 557 2 411 9.70 22.632000 60 800 84 151 853 16 978 6 080 12.87 25.612001 69 122 102 676 896 18 805 7 192 14.10 27.042002 82 664 128 284 934 21 593 7 286 15.57 29.132003 99 730 186 237 924 26 003 7 968 17.75 28.692004 119 186 235 310 822 29 933 8 807 19.64 32.932005 137 966 278 754 596 32 358 11 298 22.60 34.532006 162 210 336 397 493 34 895 13 723 31.31 38.262007 189 732 393 504 466 36 849 18 029 37.47 41.252008 217 574 446 130 515 40 208 21 928 53.62 422.692009 232 488 433 661 424 46 826 24 132 61.28 400.862010 274 033 517 251 412 53 279 30 324 71.71 427.952011 323 486 582 824 418 56 464 36 701 79.18 461.502012 364 923 611 205 407 60 121 40 605 78.57 506.802013 410 396 658 741 382 65 520 47 432 75.38 33.042014 450 671 707 122 354 74 450 57 061 80.50 41.382015 493 536 728 989 437 90 365 74 708 88.97 45.232016 550 129 782 131 458 111 731 85 931 85.38 46.602017 616 166 919 189 1 065 141 022 91 291 88.41 49.70
1-6 续表 continued
年 份 Year
自来水 供水量 (万吨)
Tap Water Supply
(10 000tons)
用电量 (万千瓦时) Electricity
Consumption (10 000kwh)
公共汽车 客运人数(万人次)
Bus Passengers (10 000
person-times)
社会消费品零售总额(万元)
Retail Sales of
Consumer Goods
(10 000yuan)
出生人数 (人)
Births (person)
死亡人数 (人)
Deaths (person)
结婚 (对)
Marriages (couple)
离婚 (对)
Divorces (couple)
1979 31 22 51980 54 19 5 61985 14.20 728 15 4 181990 985 60.13 1 829 29 5 28 11995 157 2 503 96.96 11 697 35 5 36 32000 252 5 215 117.26 20 138 49 9 39 62001 267 5 816 128.96 22 795 49 6 39 62002 296 7 120 141.60 25 807 62 5 40 62003 336 8 861 139.00 30 004 44 6 53 92004 370 10 693 143.80 34 264 54 6 79 132005 382 12 060 278.40 39 496 66 7 64 152006 398 13 348 337.22 46 040 72 6 112 172007 423 15 557 497.61 52 899 94 7 98 192008 430 15 993 535.44 62 372 101 7 113 192009 411 16 046 585.21 70 355 97 8 134 212010 429 18 179 642.82 82 213 102 17 105 222011 442 19 069 647.61 96 462 114 8 149 272012 439 19 784 625.49 109 830 168 12 146 322013 436 19 994 603.23 123 300 163 9 147 432014 450 21 608 618.46 134 767 185 22 166 432015 465 22 344 566.83 137 475 196 13 165 622016 546 23 317 511.78 151 034 239 14 167 682017 553 24 232 453.22 164 827 319 19 171 70

14
1-7 企业登记发展情况
THE DEVELOPMENT OF ENTERPRISES REGISTRATION
单位:户 (unit)
年份 Year
企业总数Total
Number of Enterprises
按企业登记类型分Grouped By Status of Enterprises
Registration
按产业分 Grouped By Industry
按注册资本分 Grouped By Registered Capital
内资企业Domestic-
funded Enterprises
外资企业Foreign-funded
Enterprises
私营企业Private
Enterprises
第一产业Primary Industry
第二产业Secondary Industry
第三产业Tertiary Industry
100-499万元
(10 000 yuan)
500-999万元
(10 000 yuan)
1000-2999万元
(10 000 yuan)
3000-4999万元
(10 000 yuan)
5000-9999万元
(10 000 yuan)
1亿元以上(Over 100
million yuan)
1979 501 497 4 1 219 281
1980 839 821 18 1 400 438
1981 1 125 1 086 39 2 383 740
1982 1 798 1 710 88 3 713 1 082
1983 2 177 1 940 237 6 710 1 461
1984 4 314 3 761 553 10 1 258 3 046
1985 6 853 5 972 881 14 1 950 4 889
1986 7 958 6 902 1 056 21 2 601 5 336
1987 15 448 14 328 1 120 163 5 718 9 567
1988 16 341 14 387 1 954 175 4 022 12 144
1989 18 596 16 026 2 570 212 4 993 13 391 579 365 566 200 203 212
1990 19 827 15 403 3 895 529 210 5 807 13 810 651 425 646 229 231 232
1991 22 948 16 629 5 295 1 024 227 6 947 15 774 767 497 756 257 259 260
1992 28 676 18 469 7 639 2 568 235 9 166 19 275 1 022 643 994 337 324 318
1993 41 768 25 742 11 802 4 224 295 13 070 28 403 1 820 1 021 1 538 492 448 420
1994 55 867 31 916 14 767 9 184 269 17 249 38 349 2 568 1 326 1 988 601 533 487
1995 70 785 37 860 16 765 16 160 426 21 255 49 104 3 431 1 596 2 416 717 627 557
1996 82 952 44 410 18 011 20 531 456 22 783 59 713 4 418 1 861 2 862 800 714 616
1997 92 244 47 659 17 093 27 492 452 24 216 67 576 5 916 2 179 3 464 924 833 701
1998 92 699 45 027 16 161 31 511 422 23 966 68 311 7 198 2 466 3 904 1 046 918 763
1999 101 942 47 100 17 997 36 845 428 26 453 75 061 8 867 2 818 4 353 1 144 1 013 829
2000 107 457 46 220 18 151 43 086 397 27 769 79 291 10 982 3 239 4 897 1 259 1 107 911
2001 120 391 46 328 19 175 54 888 382 31 114 88 895 14 399 3 780 5 711 1 407 1 262 1 025
2002 123 923 37 519 19 461 66 943 341 32 103 91 479 18 483 4 406 6 518 1 544 1 381 1 134
2003 151 036 39 316 21 883 89 837 359 39 659 111 018 24 219 5 200 7 532 1 715 1 547 1 254
2004 181 314 34 278 22 728 124 308 349 47 695 133 270 31 996 6 317 8 730 1 878 1 696 1 388
2005 209 443 32 998 24 252 152 193 333 55 579 153 531 39 404 7 618 9 824 2 030 1 837 1 483
2006 244 291 25 480 27 055 191 756 347 65 220 178 724 47 121 8 925 10 901 2 169 1 979 1 602
2007 283 734 24 423 32 248 227 063 348 75 381 208 005 53 798 11 055 11 961 2 326 2 111 1 719
2008 281 238 18 473 32 898 229 867 309 74 044 206 885 59 538 12 658 12 781 2 437 2 197 1 802
2009 307 242 16 793 33 386 257 063 302 80 052 226 888 67 746 13 773 13 874 2 585 2 314 1 910
2010 360 912 16 087 35 207 309 618 312 88 870 271 730 78 118 15 220 15 379 2 776 2 483 2 060
2011 417 531 14 278 36 096 367 157 313 92 747 324 471 90 779 18 071 19 513 2 953 3 100 2 690
2012 481 030 12 584 36 969 431 477 344 93 601 387 085 108 436 22 280 24 010 3 461 3 944 3 153
2013 630 060 10 004 38 241 581 815 475 105 257 524 328 154 473 32 900 34 219 4 435 5 841 5 280
2014 843 977 8 250 39 758 795 969 1 340 119 645 722 992 246 435 54 903 53 509 6 967 9 628 9 141
2015 1 133 953 7 873 43 017 1 083 063 1 989 139 431 992 533 361 563 92 836 83 267 10 359 16 040 14 747
2016 1 504 255 8 685 42 621 1 452 949 2 916 166 786 1 334 553 669 393 191 040 114 323 12 034 24 068 19 555
2017 1 769 876 8 602 50 769 1 710 505 3 711 183 071 1 583 094 793 485 208 444 159 248 18 104 31 721 27 997
注: 本表数据来源为市场和质量监督管理委员会信息中心。Note: Data in this table are provided by Market and Quality Supervision Commission of Shenzhen Municipality.

15
1-8 “企业一套表”年报分区分行业调查单位(2017年)
NUMBER OF SURVEY UNIT OF“ENTERPRISE SET OF TABLE”
BY SECTOR BY DISTRICT(2017)单位:个 (unit)
地 区 District
调查单位Survey
unit工业
Industry
建筑业Constru-
ction
批发零售业
Wholesale and Retail
Sales
住宿餐饮业
Hotel and Catering Services
房地产开发经营业Real Estate
服务业Services
全 市 Total 23 559 7 943 990 6 283 924 600 6 819
福田区 Futian 4 379 105 405 1 791 231 142 1 705
罗湖区 Luohu 2 186 116 87 941 188 64 790
盐田区 Yantian 446 69 9 63 27 31 247
南山区 Nanshan 5 260 773 188 1 583 209 94 2 413
宝安区 Baoan 4 346 2 778 77 690 96 64 641
龙岗区 Longgang 3 031 1 544 128 643 61 131 524
龙华区 Longhua 2 087 1 191 51 420 66 34 325
坪山区 Pingshan 659 472 28 67 18 17 57
光明新区 Guangming 992 829 8 67 7 6 75
大鹏新区 Dapeng 149 60 9 15 20 10 35
深汕特别合作区ShenshanSpecial Cooperation Zone
24 6 - 3 1 7 7

16
1-9 规模以上服务业(其他)企业分行业主要财务指标(2017年)
FINANCE INDICATORS OF SERVICE ENTERPRISES (OTHER) ABOVE THE
DESIGNATED SIZE BY SECTOR(2017)
指标名称 Item
企业单位数(个) Number of Enterprises
(unit)
总计 Total 6 378
交通运输、仓储和邮政业 Transport,Storage and Post 1 143
信息传输、软件和信息技术服务业 Information Transmission,Software and Information Technology 1 466
房地产业 Real Estate 889
租赁和商务服务业 Leasing and Business Services 1 425
科学研究和技术服务业 Scientific Research and Technical Services 809
水利、环境和公共设施管理业 Management of Water Conservancy,Enviroment and Public Facilities 82
居民服务、修理和其他服务业 Service to Households,Repair and Other Services 204
教育 Education 138
卫生和社会工作 Health and Social Service 72
文化、体育和娱乐业 Culture,Sports and Entertainment 150
注: 1.本表中“企业单位数”与“企业一套表”中“服务业企业单位数”指标存在口径差异。Note:There is a difference of the indicator “Number of enterprises” between this table and “enterprise set of table”. 2.房地产业不含房地产开发经营。 Real estate development and management is not included in the real estate.

17
资产总计(亿元) Total Assets
(100 million yuan)
营业收入(亿元) Business Revenue
(100 million yuan)
应付职工薪酬(亿元) Benefit Payable of the Employee
(100 million yuan)
从业人员平均人数(人) Average Employed Persons
(person)
47 120 10 107 1 988 1 675 168
8 593 2 427 397 322 636
12 093 3 927 576 301 215
5 952 766 253 319 121
17 016 1 413 363 376 479
1 923 1 076 247 152 883
184 86 15 20 482
120 109 49 101 019
86 69 29 29 671
59 61 18 18 385
1 095 173 42 33 277

18
1-10 规模以上服务业(其他)企业分区主要财务指标(2017年)
FINANCE INDICATORS OF SERVICE ENTERPRISES (OTHER) ABOVE THE
DESIGNATED SIZE BY DISTRICT(2017)
地 区 Region
企业单位数(个)
Number of Enterprises
(unit)
资产总计(亿元)
Total Assets(100 million
yuan)
营业收入(亿元)
Business Revenue
(100 million yuan)
应付职工薪酬(亿元)
Benefit Payable of the Employee(100 million
yuan)
从业人员平均人数(人) Average Employed Persons (person)
全 市 Total 6 378 47 120 10 107 1 988 1 675 168
福田区 Futian 1 571 14 801 2 720 574 542 313
罗湖区 Luohu 735 4 702 971 235 205 684
盐田区 Yantian 226 1 924 217 56 37 549
南山区 Nanshan 2 252 18 521 4 343 690 436 645
宝安区 Baoan 623 3 784 961 209 216 212
龙岗区 Longgang 507 1 691 416 115 135 576
龙华区 Longhua 309 1 007 256 52 66 562
坪山区 Pingshan 47 97 18 4 6 339
光明新区 Guangming 72 183 36 9 13 674
大鹏新区 Dapeng 29 319 165 41 13 980
深汕特别合作区ShenshanSpecial Cooperation Zone
7 92 4 634
19
主要统计指标解释
行政区划 指国家对行政区域的划分。根据有关法规规定,我国的行政区域划分如下:(1)全国分为省、
自治区、直辖市;(2)省、自治区分为自治州、县、自治县、市;(3)自治州分为县、自治县、市;(4)县、自治
县分为乡、民族乡、镇; (5)直辖市和较大的市分为区、县;(6)国家在必要时设立的特别行政区。
平均增长速度 平均增长速度表明社会经济现象在一个较长的时期内逐期平均增长变化的程度,它不能
根据各个环比增长速度直接求得,但与平均发展速度之间存在着一定的数量关系:平均增长速度=平均发展速
度-1。
平均发展速度是一种根据环比发展速度计算的序时平均数,由于各时期对比的基础不同,所以计算平均发
展速度不能采用一般的序时平均数的计算方法,计算方法分为水平法和累计法。水平法,又称几何平均法,即
将环比发展速度按连乘法用几何平均数公式计算。累计法,也称方程法,根据一段时期内各年发展水平总和与
基期水平的关系,列出方程式计算平均发展速度。水平法着重考虑最后一年所达到的发展水平;累计法着重考
虑整个时期累计发展水平的总量。
企业(单位)登记注册类型 是以在工商行政管理机关登记注册的各类企业为划分对象,以工商行政管理
部门对企业登记注册的类型为依据,将企业登记注册类型分为内资企业、港澳台商投资企业和外商投资企业三
大类。内资企业包括国有企业、集体企业、股份合作企业、联营企业、有限责任公司、股份有限公司、私营公
司和其他企业;港澳台商投资企业和外商投资企业分别包括合资经营企业、合作经营企业、独资经营企业和股
份有限公司。对不在工商行政管理部门进行登记注册的行政机关、事业单位和社会团体,主要按其经费来源和
管理方式进行划分。
国有企业 指企业全部资产归国家所有,并按《中华人民共和国企业法人登记管理条例》规定登记注册
的非公司制的经济组织。不包括有限责任公司中的国有独资公司。
集体企业 指企业资产归集体所有,并按《中华人民共和国企业法人登记管理条例》规定登记注册的经
济组织。
股份合作企业 指以合作制为基础,由企业职工共同出资入股,吸收一定比例的社会资产投资组建,实
行自主经营,自负盈亏,共同劳动,民主管理,按劳分配与按股分红相结合的一种集体经济组织。
联营企业 指两个及两个以上相同或不同所有制性质的企业法人或事业单位法人,按自愿、平等、互利
的原则,共同投资组成的经济组织。联营企业包括国有联营企业、集体联营企业、国有与集体联营企业和其他
联营企业。
有限责任公司 指根据《中华人民共和国公司登记管理条例》规定登记注册,由两个以上、五十个以下
的股东共同出资,每个股东以其所认缴的出资额对公司承担有限责任,公司以其全部资产对其债务承担责任的
经济组织。有限责任公司包括国有独资公司以及其他有限责任公司。
股份有限公司 指根据《中华人民共和国公司登记管理条例》规定登记注册,其全部注册资本由等额股
份构成并通过发行股票筹集资本,股东以其认购的股份对公司承担有限责任,公司以其全部资产对其债务承担
责任的经济组织。
私营企业 指由自然人投资设立或由自然人控股,以雇佣劳动为基础的营利性经济组织。包括按照《公
司法》、《合伙企业法》、《私营企业暂行条例》规定登记注册的私营有限责任公司、私营股份有限公司、私

20
营合伙企业和私营独资企业。
其他企业 指上述企业之外的其他内资经济组织。
外资企业 指依照《中华人民共和国外资企业法》及有关法律的规定,在中国内地由外国投资者全额投
资设立的企业。

21
Explanatory Notes on Main Statistical Indicators
Divisions of Administrative Areas refers to the division of administrative areas by the State. The relative laws
stipulate that 1) the whole country is divided into provinces, autonomous regions and municipalities directly under the
Central Government; 2) provinces and autonomous regions are further divided into autonomous prefectures, counties,
autonomous counties and cities; 3) autonomous prefectures are further divided into counties, autonomous counties
and cities; 4) counties and autonomous counties are further divided into townships, ethnic townships and towns; 5)
municipalities directly under the Central Government and large cities are divided into districts and counties, 6) the State
shall, when necessary, establish special administrative regions.
Average Annual Growth Rate shows the average growth rate of social and economic development during a
longer period. It can not be directly calculated by chain based growth rate. The relation is:
Average Annual Growth Rate = Average Speed of Development – 1
Average speed of development is the time series average of speed which calculated by chain based. Because the
reference bases during the different periods are not same, average speed of development can not be calculated by the
general method. Level approach and accumulative approach for calculating average speed of development rate are applied.
The “level approach”, or the method of calculating the geometric average, is derived by the formula of geometric
average of the chain-based speeds of development, or comparing the level of the last year of the interval with that of the
beginning year; the other is called the “accumulative approach” or the “algebraic average”, “equation” method,
which is derived by the summation of the actual figure of each year in the interval divided by the figure in the base
year. The level approach focuses on the level of the last year, while the accumulative approach emphasizes the aggregate
development in the duration.
Registration Status of Enterprises Enterprises are classified into 3 categories, namely domestic-funded
enterprises, enterprises with investment from Hong Kong, Macau and Taiwan, and enterprises with foreign investment,
according to the registration status of an enterprise in industrial and commercial administration agencies. Domestic-
funded enterprises include State-owned enterprises, collective-owned enterprises, cooperative enterprises, joint
ownership enterprises, limited liability corporations, share-holding corporations Ltd., private enterprises and other
enterprises. Included in the enterprises with investment from Hong Kong, Macau and Taiwan and enterprises with
foreign investment are joint-venture enterprises, cooperative enterprises, sole investment enterprises and share-holding
corporations Ltd. For government agencies, institutions and social organizations which are not registered in industrial and
commercial administration agencies, they are classified mainly by their sources of funding and manner of management.
State-owned Enterprises refer to non-corporation economic units where the entire assets are owned by
the State and which have been registered in accordance with the Regulation of the People’s Republic of China on
the Management of Registration of Corporate Enterprises. Not included from this category are solely State-funded
corporations in the limited liability corporations.
Collective-owned Enterprises refer to economic units where the assets are owned collectively and which
have been registered in accordance with the Regulation of the People’s Republic of China on the Management of
Registration of Corporate Enterprises.
Cooperative Enterprises refer to a form of collective economic units (enterprises) where capitals come mainly
from employees as their shares, with certain proportion of capital from the outside, where production is organized on the
22
basis of independent operation, independent accounting for profits and losses, joint work, democratic management, and a
distribution system that integrates remuneration according to work with dividend according to capital share.
Joint Ownership Enterprises refer to economic units established by two or more corporate enterprises or
corporate institutions of the same or different ownership, through joint investment on the basis of voluntary participation,
equality, and mutual benefits. They include State joint ownership enterprises; collective joint ownership enterprises; joint
State-collective enterprises; and other joint ownership enterprises.
Limited Liability Corporations refer to economic units established with investment from 2-50 investors and
registered in accordance with the Regulation of the People’s Republic of China on the Management of Registration
of Corporations, each investor bearing limited liability to the corporation depending on its share of investment, and the
corporation bearing liability to its debt to the maximum of its total assets. Limited liability corporations include solely
State-funded limited liability corporations and other limited liability corporations.
Share-holding Corporations Ltd. refer to economic units registered in accordance with the Regulation of the
People’s Republic of China on the Management of Registration of Corporations, with total registered capital divided
into equal shares and raised through issuing stocks. Each investor bears limited liability to the corporation depending on
the holding of shares, and the corporation bears liability to its debt to the maximum of its total assets.
Private Enterprises refer to profit-making economic units invested and established by natural persons, or
controlled by natural persons using employed labour. Included in this category are private limited liability corporations,
private share-holding corporations Ltd., private partnership enterprises and private-funded enterprises registered in
accordance with the Company Law, the Law on Partnership Business and Interim Regulations on Private Enterprises .
Other Domestic-funded Enterprises refer to domestic-funded economic units other than those mentioned above.
Enterprises with Sole (exclusive) Foreign Investment refer to enterprises established in the mainland of China
with exclusive investment from foreign investors in accordance with the Law of the People’s Republic of China on
Wholly Foreign-owned Enterprises and other relevant laws.
Share-holding Corporations Ltd. with Foreign Investment refer to share-holding corporations Ltd. established with
the approval from the former Ministry of Foreign Trade and Economic Relations in line with relevant State regulations,
where the share of investment from foreign investors exceeds 25% of the total registered capital of the corporation. In case
the share of foreign investment is less than 25% of the total registered capital, the enterprise is to be classified as domestic-
funded share-holding corporation Ltd.

NATIONAL ECONOMIC ACCOUNTING02

24
2-1 国民经济核算主要指标
MAIN INDICATORS OF NATIONAL ECONOMIC ACCOUNTING
项 目Item
2000 2010 2016 2017
地区生产总值 (亿元) Gross Domestic Product (100 million yuan) 2 219.20 10 002.22 20 079.70 22 490.06
第一产业 Primary Industry 15.57 6.84 8.28 19.57
第二产业 Secondary Industry 1 108.76 4 737.98 8 310.65 9 318.10
第三产业 Tertiary Industry 1 094.87 5 257.40 11 760.77 13 152.39
地区生产总值增长速度(%) Growth Rates of Gross Domestic Product (%) 16.3 12.2 9.1 8.8
第一产业 Primary Industry 3.1 -9.2 -0.4 27.0
第二产业 Secondary Industry 18.5 13.8 8.1 9.2
第三产业 Tertiary Industry 13.8 10.5 9.9 8.4
地区生产总值构成 (%) Composition of Grosss Domestic Product (%) 100 100 100 100
第一产业 Primary Industry 0.7 0.1 … 0.1
第二产业 Secondary Industry 50.0 47.4 41.4 41.4
第三产业 Tertiary Industry 49.3 52.5 58.6 58.5
地区生产总值贡献率(%) Share of the Contribution of the Three Strata of Industry (%) 100 100 100 100
第一产业 Primary Industry 0.1 … … 0.2
第二产业 Secondary Industry 62.5 59.8 38.1 44.5
第三产业 Tertiary Industry 37.4 40.2 61.9 55.3
地区生产总值拉动率(%) Contribution of the Three Strata of Industry to GDP Growth (%) 16.3 12.2 9.1 8.8
第一产业 Primary Industry … … … …
第二产业 Secondary Industry 10.2 7.3 3.5 3.9
第三产业 Tertiary Industry 6.1 4.9 5.6 4.9
人均地区生产总值(元) Per Capita Gross Domestic Product (yuan) 33 276 98 437 172 453 183 544
人均地区生产总值增长速度 (%) Growth Rates of Per Capita Gross Domestic Product (%) 5.8 7.7 3.8 3.9
支出法地区生产总值(亿元)Gross Domestic Product by Expenditure Approach (100 million yuan)
2 219.20 10 002.22 20 079.70 22 490.06
最终消费支出 Final Consumption Expenditures 862.55 4 104.02 8 331.16 9 262.78
资本形成总额 Gross Capital Formation 895.61 3 117.82 6 900.54 7 807.09
货物和服务净流出 Net Exports of Goods and Services 461.03 2 780.38 4 848.01 5 420.19
支出法地区生产总值构成(%)Composition of Gross Domestic Product by Expenditure Approach(%)
100 100 100 100
最终消费支出 Final Consumption Expenditures 38.9 41.0 41.5 41.2
资本形成总额 Gross Capital Formation 40.3 31.2 34.4 34.7
货物和服务净流出 Net Exports of Goods and Services 20.8 27.8 24.1 24.1

25
2-2 地区生产总值
GROSS DOMESTIC PRODUCT
单位:万元 (10 000 yuan)
年 份 Year
地区生产总值 Gross
Domestic Product
第一产业 Primary Industry
第二产业 Secondary Industry
第三产业 Tertiary Industry
#工业 Industry
#建筑业 Construction
1979 19 638 7 273 4 017 8 348 2 313 1 704
1980 27 012 7 803 7 036 12 173 3 726 3 310
1981 49 576 13 343 16 019 20 214 8 311 7 708
1982 82 573 18 960 31 439 32 174 9 540 21 899
1983 131 212 22 614 55 848 52 750 22 466 33 382
1984 234 161 25 932 106 606 101 623 51 802 54 804
1985 390 222 26 111 163 586 200 525 102 137 61 449
1986 416 451 32 907 163 185 220 359 106 606 56 579
1987 559 015 46 519 220 463 292 033 164 445 56 018
1988 869 807 57 005 359 230 453 572 274 787 84 443
1989 1 156 565 68 615 505 361 582 589 400 579 104 782
1990 1 716 665 70 220 769 319 877 126 644 947 124 372
1991 2 366 630 80 836 1 126 084 1 159 710 928 846 197 238
1992 3 173 194 105 914 1 522 432 1 544 848 1 176 087 346 345
1993 4 531 445 108 615 2 420 214 2 002 616 1 810 085 610 129
1994 6 346 711 134 152 3 357 972 2 854 587 2 671 299 686 673
1995 8 427 933 124 122 4 223 744 4 080 067 3 372 392 851 352
1996 10 505 121 148 796 5 081 045 5 275 280 4 198 625 882 420
1997 13 023 008 147 660 6 209 018 6 666 330 5 222 504 986 514
1998 15 449 472 151 764 7 508 019 7 789 689 6 377 088 1 130 931
1999 18 246 876 150 445 9 154 443 8 941 988 7 930 052 1 224 391
2000 22 192 015 155 656 11 087 644 10 948 715 9 828 530 1 259 114
2001 25 229 474 160 413 12 583 983 12 485 078 11 310 767 1 273 216
2002 30 172 384 166 587 14 980 113 15 025 684 13 670 904 1 309 209
2003 36 401 435 142 048 18 562 162 17 697 225 17 081 204 1 480 958
2004 43 502 928 123 264 22 643 124 20 736 540 21 092 158 1 550 966
2005 50 357 678 97 385 27 096 861 23 163 432 25 559 271 1 537 590
2006 59 206 612 68 851 31 449 697 27 688 064 29 775 384 1 674 313
2007 69 252 268 77 374 35 135 153 34 039 741 33 338 681 1 796 472
2008 79 414 328 83 804 39 799 045 39 531 479 37 763 311 2 035 734
2009 84 858 247 69 599 40 095 728 44 692 920 37 732 436 2 363 292
2010 100 022 183 68 391 47 379 750 52 574 042 44 455 213 2 924 537
2011 118 072 348 69 491 56 128 559 61 874 298 52 628 102 3 500 457
2012 133 196 818 68 164 60 559 131 72 569 523 56 722 281 3 836 850
2013 149 794 486 63 504 66 579 909 83 151 073 62 226 265 4 531 743
2014 164 494 770 57 579 72 242 462 92 194 729 67 736 986 4 680 969
2015 180 140 720 72 084 76 780 987 103 287 649 72 141 744 4 797 208
2016 200 797 043 82 840 83 106 513 117 607 690 78 002 175 5 265 711
2017 224 900 586 195 721 93 180 979 131 523 886 87 391 366 5 940 681
注:1.本表按当年价格计算。2013年起,开始使用新的《国民经济行业分类》(GB/T 4754-2011)。Note:Data of this table are calculated at curret prices. The new Industrial Classification of the National Economy(GB/T 4754-2011)is introduced starting from 2013 annual statistics. 2、根据研发支出纳入GDP核算及全国第三次农业普查结果,对1995-2016年地区生产总值进行了修订。 According to the new GDP Accounting Methodology and the Third National Agricultural Census,the data of GDP from 1995 to 2016 have been revised.

26
单位:万元 2-2 续表 continued(10 000 yuan)
年 份 Year
人均地区生产总值(元)
Gross Domestic Product Per Capita(yuan)
#交通运输、仓储和邮政业
Transportation,Storage and Post Services
#批发和零售业 Wholesale and
Retail Sales
#住宿和餐饮业 Hotels and Catering
Services
#金融业 Financial
Intermediation
#房地产 Real Estate
1979 1 175 3 111 1 050 1 586 467 606
1980 1 798 4 301 1 452 2 325 688 835
1981 2 908 7 104 2 398 3 883 1 152 1 417
1982 4 890 10 758 3 631 6 274 1 850 2 023
1983 7 715 16 868 5 694 11 183 3 181 2 512
1984 14 866 29 948 10 108 22 865 6 301 3 504
1985 25 519 55 943 18 882 46 522 14 759 4 809
1986 35 475 59 200 21 278 50 620 15 420 4 584
1987 54 144 71 776 30 897 62 962 17 347 5 349
1988 71 317 114 899 41 883 119 543 35 016 6 477
1989 90 993 117 160 42 744 150 856 53 831 6 710
1990 112 692 152 877 51 823 240 157 91 396 8 724
1991 147 651 239 760 59 056 266 849 155 372 11 997
1992 166 595 333 580 84 904 332 492 236 652 12 827
1993 190 248 449 485 144 272 405 899 328 708 15 005
1994 245 271 583 961 288 170 596 275 472 171 16 954
1995 400 843 779 177 405 147 887 865 673 506 19 558
1996 500 073 1 128 234 432 463 1 118 350 842 883 22 542
1997 487 346 1 339 511 478 192 1 562 531 955 661 25 772
1998 546 558 1 532 951 538 158 1 809 703 1 062 525 27 885
1999 629 825 1 822 078 573 446 1 965 044 1 193 283 30 088
2000 788 014 2 271 487 613 559 2 215 391 1 585 464 33 276
2001 857 909 2 618 467 633 105 2 393 224 1 818 950 35 390
2002 1 057 835 3 174 034 728 976 2 487 213 2 348 995 41 018
2003 1 300 797 3 901 304 713 120 2 620 765 3 184 157 47 743
2004 1 893 093 4 601 915 841 186 2 730 844 4 110 367 55 099
2005 2 211 684 5 202 044 971 905 3 056 820 4 449 012 61 844
2006 2 576 875 5 738 239 1 166 653 4 626 637 5 202 637 69 702
2007 2 991 969 6 608 000 1 262 695 7 657 042 6 130 153 77 660
2008 3 077 314 7 729 584 1 655 958 9 693 615 4 900 481 85 088
2009 3 057 686 8 643 036 1 708 693 10 991 122 6 772 994 87 066
2010 3 523 205 10 687 180 2 033 964 13 170 664 7 495 301 98 437
2011 3 859 435 13 230 138 2 344 084 15 649 317 8 579 914 113 316
2012 4 110 301 16 297 209 2 547 355 17 163 650 10 888 097 126 765
2013 4 637 611 18 484 128 2 735 863 19 510 048 12 032 709 141 474
2014 5 008 847 19 621 414 3 179 989 21 949 263 13 238 647 153 677
2015 5 412 684 20 227 552 3 383 971 25 015 717 15 644 076 162 599
2016 6 269 582 21 750 741 3 588 184 28 107 273 17 775 690 172 453
2017 7 012 865 23 674 321 3 941 034 29 242 564 18 943 155 183 544

27
2-3 地区生产总值三次产业构成
COMPOSITION OF GROSS DOMESTIC PRODUCT BY THREE INDUSTRIES
单位:% (%)
年 份 Year
地区生产总值 Gross
Domestic Product
第一产业 Primary Industry
第二产业 Secondary Industry
第三产业 Tertiary Industry
#工业 Industry
#建筑业 Construction
1979 100 37.0 20.5 42.5 11.8 8.7
1980 100 28.9 26.0 45.1 13.8 12.2
1981 100 26.9 32.3 40.8 16.8 15.5
1982 100 22.9 38.1 39.0 11.6 26.5
1983 100 17.2 42.6 40.2 17.1 25.5
1984 100 11.1 45.5 43.4 22.1 23.4
1985 100 6.7 41.9 51.4 26.2 15.7
1986 100 7.9 39.2 52.9 25.6 13.6
1987 100 8.3 39.4 52.3 29.4 10.0
1988 100 6.6 41.3 52.1 31.6 9.7
1989 100 5.9 43.7 50.4 34.6 9.1
1990 100 4.1 44.8 51.1 37.6 7.2
1991 100 3.4 47.6 49.0 39.3 8.3
1992 100 3.3 48.0 48.7 37.1 10.9
1993 100 2.4 53.4 44.2 39.9 13.5
1994 100 2.1 52.9 45.0 42.1 10.8
1995 100 1.5 50.1 48.4 40.0 10.1
1996 100 1.4 48.4 50.2 40.0 8.4
1997 100 1.1 47.7 51.2 40.1 7.6
1998 100 1.0 48.6 50.4 41.3 7.3
1999 100 0.8 50.2 49.0 43.5 6.7
2000 100 0.7 50.0 49.3 44.3 5.7
2001 100 0.6 49.9 49.5 44.8 5.0
2002 100 0.6 49.6 49.8 45.3 4.3
2003 100 0.4 51.0 48.6 46.9 4.1
2004 100 0.3 52.0 47.7 48.5 3.6
2005 100 0.2 53.8 46.0 50.8 3.1
2006 100 0.1 53.1 46.8 50.3 2.8
2007 100 0.1 50.7 49.2 48.1 2.6
2008 100 0.1 50.1 49.8 47.6 2.6
2009 100 0.1 47.2 52.7 44.5 2.8
2010 100 0.1 47.4 52.5 44.4 2.9
2011 100 0.1 47.5 52.4 44.6 3.0
2012 100 0.1 45.4 54.5 42.6 2.9
2013 100 … 44.5 55.5 41.6 3.0
2014 100 … 43.9 56.1 41.2 2.9
2015 100 … 42.6 57.4 40.0 2.7
2016 100 … 41.4 58.6 38.9 2.6
2017 100 0.1 41.4 58.5 38.8 2.7

28
2-4 地区生产总值指数
INDICES OF GROSS DOMESTIC PRODUCT
(以1979年为100) (1979=100)
年 份 Year
地区生产总值 Gross
Domestic Product
人均地区生产总值
Gross Domestic Product Per
Capita
第一产业 Primary Industry
第二产业 Secondary Industry
第三产业TertiaryIndustry
#工业 Industry
#建筑业 Construction
1980 162.7 103.0 175.8 209.5 163.3 197.0 163.0
1981 250.2 132.0 445.6 307.9 406.5 512.1 231.8
1982 396.4 182.2 730.5 504.9 415.5 1 266.1 314.8
1983 627.5 192.8 1 181.7 873.5 869.2 1 713.0 389.3
1984 1 003.3 198.8 2 347.6 1 392.7 2 003.6 2 932.6 486.6
1985 1 249.4 196.8 4 011.2 1 550.9 4 383.4 3 378.4 499.1
1986 1 283.1 231.8 4 269.3 1 537.1 4 825.1 3 324.3 457.7
1987 1 609.0 242.0 5 767.9 1 882.1 7 226.5 3 287.7 524.1
1988 2 186.6 225.1 8 306.0 2 547.1 10 603.7 4 398.9 628.3
1989 2 595.5 280.0 11 472.9 2 678.4 15 030.4 5 423.9 642.8
1990 3 439.1 298.5 16 760.4 3 286.1 22 789.5 6 508.7 720.6
1991 4 677.1 312.8 23 700.4 4 358.6 31 743.9 10 023.4 768.5
1992 6 229.9 313.7 30 607.2 6 090.4 38 297.6 17 530.9 816.2
1993 8 155.5 316.0 42 975.4 7 448.8 52 846.0 26 192.0 875.2
1994 10 677.8 296.3 58 131.1 9 463.8 74 928.7 29 569.3 924.5
1995 13 227.0 289.9 70 891.1 12 018.9 92 702.6 33 803.6 994.8
1996 15 536.5 295.4 82 789.4 14 254.2 110 656.0 35 406.1 1 080.5
1997 18 206.7 295.2 96 546.4 16 844.2 130 287.0 39 175.2 1 167.8
1998 21 083.9 302.6 113 120.0 19 266.0 153 331.2 44 746.7 1 233.4
1999 24 387.9 323.8 132 489.3 21 966.4 181 117.4 49 804.2 1 303.4
2000 28 366.1 333.9 156 948.8 24 995.1 219 191.5 51 114.1 1 378.6
2001 32 492.7 355.7 179 593.2 28 690.2 254 028.8 52 640.8 1 477.3
2002 37 622.4 377.5 211 073.8 32 751.6 302 438.4 54 803.2 1 657.7
2003 44 823.3 321.5 263 911.8 37 150.6 382 601.3 60 414.9 1 905.5
2004 52 624.3 262.5 319 807.6 42 131.5 471 135.1 59 558.7 2 160.3
2005 60 651.6 208.9 376 946.0 47 310.5 561 072.1 59 711.8 2 414.2
2006 70 788.8 145.1 439 342.7 55 400.7 656 927.6 64 324.1 2 701.1
2007 81 271.7 133.7 501 631.7 64 043.1 754 110.7 66 287.1 2 954.0
2008 91 305.9 110.8 562 545.7 72 137.3 849 814.7 67 028.2 3 170.8
2009 101 633.5 93.5 622 274.9 80 897.9 936 417.6 80 562.8 3 379.8
2010 114 072.0 84.8 708 245.7 89 377.1 1 063 883.8 95 063.3 3 638.7
2011 125 518.8 79.6 791 103.3 97 024.2 1 189 760.9 104 264.8 3 904.4
2012 138 278.2 81.8 852 194.7 109 093.0 1 281 761.1 112 149.1 4 265.4
2013 152 962.1 61.0 934 857.5 121 638.7 1 409 826.4 117 307.7 4 682.3
2014 166 448.0 55.2 1 008 238.8 133 398.7 1 525 632.3 119 145.5 5 040.1
2015 181 260.1 57.5 1 083 524.0 146 905.2 1 641 972.8 123 218.5 5 302.9
2016 197 797.6 57.3 1 171 797.1 161 384.8 1 774 362.4 134 579.3 5 506.0
2017 215 105.0 72.7 1 279 741.5 174 924.6 1 942 016.1 141 500.5 5 723.3
年平均增长率 22.4 -0.8 28.3 21.7 29.7 21.0 11.2
Average Annual Growth Rate注: 本表按可比价格计算。 Note: Data in this table are calculated at constant prices.

29
2-5 地区生产总值指数
INDICES OF GROSS DOMESTIC PRODUCT
(以上年为100) (Preceding Year=100)
年 份 Year
地区生产总值 Gross
Domestic Product
人均GDP Gross Domestic
Product Per Capita
第一产业 Primary Industry
第二产业 Secondary Industry
第三产业TertiaryIndustry
#工业 Industry
#建筑业 Construction
1980 162.7 103.0 175.8 209.5 163.3 197.0 163.0
1981 153.8 128.2 253.5 146.9 248.9 259.9 142.2
1982 158.4 138.0 163.9 164.0 102.2 247.2 135.8
1983 158.3 105.8 161.8 173.0 209.2 135.3 123.7
1984 159.9 103.1 198.7 159.4 230.5 171.2 125.0
1985 124.5 99.0 170.9 111.4 218.8 115.2 102.6
1986 102.7 117.8 106.4 99.1 110.1 98.4 91.7
1987 125.4 104.4 135.1 122.4 149.8 98.9 114.5
1988 135.9 93.0 144.0 135.3 146.7 133.8 119.9
1989 118.7 124.4 138.1 105.2 141.7 123.3 102.3
1990 132.5 106.6 146.1 122.7 151.6 120.0 112.1
1991 136.0 104.8 141.4 132.6 139.3 154.0 106.6
1992 133.2 100.3 129.1 139.7 120.6 174.9 106.2
1993 130.9 100.7 140.4 122.3 138.0 149.4 107.2
1994 130.9 93.8 135.3 127.1 141.8 112.9 105.6
1995 123.9 97.9 122.0 127.0 123.7 114.3 107.6
1996 117.5 101.9 116.8 118.6 119.4 104.7 108.6
1997 117.2 99.9 116.6 118.2 117.7 110.6 108.1
1998 115.8 102.5 117.2 114.4 117.7 114.2 105.6
1999 115.7 107.0 117.1 114.0 118.1 111.3 105.7
2000 116.3 103.1 118.5 113.8 121.0 102.6 105.8
2001 114.5 106.5 114.4 114.8 115.9 103.0 107.2
2002 115.8 106.1 117.5 114.2 119.1 104.1 112.2
2003 119.1 85.2 125.0 113.4 126.5 110.2 114.9
2004 117.4 81.7 121.2 113.4 123.1 98.6 113.4
2005 115.3 79.6 117.9 112.3 119.1 100.3 111.8
2006 116.7 69.5 116.6 117.1 117.1 107.7 111.9
2007 114.8 92.1 114.2 115.6 114.8 103.1 109.4
2008 112.3 82.9 112.1 112.6 112.7 101.1 107.3
2009 111.3 84.3 110.6 112.1 110.2 120.2 106.6
2010 112.2 90.8 113.8 110.5 113.6 118.0 107.7
2011 110.0 93.8 111.7 108.6 111.8 109.7 107.3
2012 110.2 102.7 107.7 112.4 107.7 107.6 109.2
2013 110.6 74.6 109.7 111.5 110.0 104.6 109.8
2014 108.8 90.4 107.8 109.7 108.2 101.6 107.6
2015 108.9 104.2 107.5 110.1 107.6 103.4 105.2
2016 109.1 99.6 108.1 109.9 108.1 109.2 103.8
2017 108.8 127.0 109.2 108.4 109.4 105.1 103.9
注: 1、本表按可比价格计算。 Note: Data in this table are calculated at constant prices. 2、2011年由于国家统计局在我市开展房屋租赁业调查试点,涉及核算方法调整,因此本表2011年数据按上年同口径计算。
The data of 2011 in this table are calculated at the same caliber of last year, because of accounting method adjustments by National Bureau of Statistics survey pilot to carry out the rental industry in the city.

30
2-6 三次产业贡献率
SHARE OF THE CONTRIBUTIONS OF THE THREE STRATA OF INDUSTRY
单位:% (%)
年 份Year
地区生产总值 Gross Domestic
Product
第一产业 Primary Industry
第二产业 Secondary Industry
第三产业 Tertiary Industry
#工业 Industry
#建筑业 Construction
1980 100 1.9 12.3 85.8 6.5 5.8
1981 100 13.5 31.4 55.1 17.8 13.6
1982 100 14.0 19.8 66.2 0.4 19.4
1983 100 1.9 19.8 78.3 12.6 7.2
1984 100 0.6 31.6 67.8 19.3 12.3
1985 100 -0.3 68.7 31.6 61.9 6.8
1986 100 42.3 77.8 -20.1 83.9 -6.1
1987 100 1.3 46.7 52.0 47.2 -0.5
1988 100 -1.2 44.7 56.5 37.4 7.3
1989 100 5.5 78.8 15.7 69.3 9.5
1990 100 0.9 63.7 35.4 58.9 4.8
1991 100 0.5 57.0 42.5 46.3 10.7
1992 100 … 45.2 54.8 27.0 18.2
1993 100 0.1 65.3 34.6 48.4 16.9
1994 100 -0.3 61.1 39.2 56.1 5.0
1995 100 -0.1 50.9 49.2 44.7 6.3
1996 100 0.1 52.4 47.5 49.8 2.6
1997 100 … 52.4 47.6 47.1 5.3
1998 100 0.1 58.6 41.3 51.3 7.3
1999 100 0.3 59.6 40.1 53.9 5.8
2000 100 0.1 62.5 37.4 61.3 1.2
2001 100 0.3 49.6 50.1 48.4 1.2
2002 100 0.3 55.4 44.3 54.1 1.3
2003 100 -0.5 66.3 34.2 63.8 2.5
2004 100 -0.5 64.7 35.8 65.0 -0.3
2005 100 -0.4 64.3 36.1 64.2 …
2006 100 -0.4 53.3 47.1 51.9 1.4
2007 100 -0.1 51.5 48.6 50.9 0.6
2008 100 -0.1 52.5 47.6 52.3 0.2
2009 100 -0.1 50.1 50.0 46.0 4.1
2010 100 … 59.8 40.2 56.2 3.6
2011 100 … 55.2 44.8 52.4 2.8
2012 100 … 36.5 63.5 34.4 2.2
2013 100 -0.1 42.7 57.4 41.6 1.2
2014 100 … 41.4 58.6 40.9 0.5
2015 100 … 38.7 61.3 37.4 1.0
2016 100 … 38.1 61.9 35.4 2.7
2017 100 0.2 44.5 55.3 42.8 1.6
注:产业贡献率指各产业增加值增量与GDP增量之比。Note:Industrial contribution rate refers to the proportion of the increment of every industrial value added to the increment of GDP.

31
2-7 三次产业拉动力
CONTRIBUTION OF THE THREE STRATA OF INDUSTRY
单位:百分点 (percentage points)
年 份Year
地区生产总值 Gross Domestic
Product
第一产业 Primary Industry
第二产业 Secondary Industry
第三产业 Tertiary Industry
#工业 Industry
#建筑业 Construction
1980 62.7 1.2 7.7 53.8 4.1 3.6
1981 53.8 7.3 16.9 29.6 9.6 7.3
1982 58.4 8.2 11.5 38.7 0.2 11.3
1983 58.3 1.1 11.5 45.7 7.3 4.2
1984 59.9 0.4 18.9 40.6 11.6 7.3
1985 24.5 -0.1 16.8 7.8 15.2 1.6
1986 2.7 1.1 2.1 -0.5 2.3 -0.2
1987 25.4 0.3 11.9 13.2 12.0 -0.1
1988 35.9 -0.4 16.0 20.3 13.4 2.6
1989 18.7 1.0 14.7 3.0 13.0 1.7
1990 32.5 0.3 20.7 11.5 19.1 1.6
1991 36.0 0.2 20.5 15.3 16.7 3.8
1992 33.2 ... 15.0 18.2 9.0 6.0
1993 30.9 ... 20.2 10.7 15.0 5.2
1994 30.9 -0.1 18.9 12.1 17.4 1.5
1995 23.9 ... 12.2 11.7 10.7 1.5
1996 17.5 ... 9.2 8.3 8.7 0.5
1997 17.2 ... 9.0 8.2 8.1 0.9
1998 15.8 ... 9.3 6.5 8.1 1.2
1999 15.7 ... 9.4 6.3 8.5 0.9
2000 16.3 ... 10.2 6.1 10.0 0.2
2001 14.5 ... 7.2 7.3 7.0 0.2
2002 15.8 ... 8.8 7.0 8.5 0.2
2003 19.1 -0.1 12.7 6.5 12.2 0.5
2004 17.4 -0.1 11.3 6.2 11.3 -0.1
2005 15.3 -0.1 9.9 5.5 9.8 ...
2006 16.7 -0.1 8.9 7.9 8.7 0.2
2007 14.8 ... 7.6 7.2 7.5 ...
2008 12.3 ... 6.5 5.8 6.4 ...
2009 11.3 ... 5.7 5.6 5.2 0.5
2010 12.2 ... 7.3 4.9 6.9 0.4
2011 10.0 ... 5.5 4.5 5.2 0.3
2012 10.2 ... 3.7 6.5 3.5 0.2
2013 10.6 ... 4.5 6.1 4.4 0.1
2014 8.8 ... 3.6 5.2 3.6 ...
2015 8.9 ... 3.4 5.5 3.3 0.1
2016 9.1 ... 3.5 5.6 3.2 0.2
2017 8.8 ... 3.9 4.9 3.8 0.1
注: 1、本表按可比价格计算。Note: The data in this table are calculated at constant prices. 2、产业拉动指GDP增长速度与各产业贡献率之乘积。 Industrial pulling rate is the growth rate of GDP multiplying industrial contribution rate.

32
2-8 各行业增加值
VALUE ADDED BY SECTOR
单位:万元
指标名称 Item
2013
合计 Total 149 794 486
农林牧渔业 Agriculture, Forestry, Animal Husbandry and Fishery 65 499
工 业 Industry 62 226 265
建筑业 Construction 4 531 743
批发和零售业 Wholesale and Retail Sales 18 484 128
交通运输、仓储和邮政业 Transportation,Storage and Post 4 637 611
住宿和餐饮业 Hotels and Catering Services 2 735 863
信息传输、软件和信息技术服务业 Information Transmission, Software and Information Technology 8 144 830
金融业 Financial Intermediation 19 510 048
房地产业 Real Estate 12 032 709
租赁和商务服务业 Leasing and Business Services 4 356 765
科学研究和技术服务业 Scientific Research and Technical Service 3 744 517
水利、环境和公共设施管理业 Management of Water Conservancy, Environment and Public Facilities 620 983
居民服务、修理和其他服务业 Services to Households, Repair and Other Services 1 601 021
教育 Education 2 185 356
卫生和社会工作 Health and Social Work 1 624 419
文化、体育和娱乐业 Culture ,Sports and Entertainment 704 226
公共管理、社会保障和社会组织 Public Management, Social Security and Social Organizations 2 588 503
第一产业 Primary Industry 63 504
第二产业 Secondary Industry 66 579 909
第三产业 Tertiary Industry 83 151 073

33
(10 000 yuan)
2014 2015 2016 2017
164 494 770 180 140 720 200 797 043 224 900 586
59 854 74 991 86 264 203 482
67 736 986 72 141 744 78 002 175 87 391 366
4 680 969 4 797 208 5 265 711 5 940 681
19 621 414 20 227 552 21 750 741 23 674 321
5 008 847 5 412 684 6 269 582 7 012 865
3 179 989 3 383 971 3 588 184 3 941 034
9 315 633 11 057 951 13 978 635 17 670 591
21 949 263 25 015 717 28 107 273 29 242 564
13 238 647 15 644 076 17 775 690 18 943 155
4 786 865 4 998 169 5 289 310 7 010 345
4 250 449 5 003 534 5 446 924 6 993 057
686 581 855 666 997 599 1 213 703
1 842 242 2 077 904 2 324 667 2 249 770
2 585 833 3 056 083 3 884 656 3 957 370
1 866 707 2 159 827 2 786 040 3 005 223
740 815 809 216 1 003 411 1 060 613
2 943 676 3 424 427 4 240 181 5 390 446
57 579 72 084 82 840 195 721
72 242 462 76 780 987 83 106 513 93 180 979
92 194 729 103 287 649 117 607 690 131 523 886

34
2-9 各行业增加值比重
PROPORTION OF VALUE ADDED BY SECTOR
单位:% (%)
指标名称 Item
2013 2014 2015 2016 2017
合计 Total 100 100 100 100 100
农林牧渔业 Agriculture, Forestry, Animal Husbandry and Fishery 0.1
工 业 Industry 41.6 41.2 40.0 38.9 38.8
建筑业 Construction 3.0 2.9 2.7 2.6 2.7
批发和零售业 Wholesale and Retail Sales 12.4 11.9 11.2 10.8 10.5
交通运输、仓储和邮政业 Transportation,Storage and Post 3.1 3.0 3.0 3.1 3.1
住宿和餐饮业 Hotels and Catering Services 1.8 1.9 1.9 1.8 1.8
信息传输、软件和信息技术服务业 Information Transmission, Software and Information Technology 5.4 5.7 6.1 7.0 7.9
金融业 Financial Intermediation 13.0 13.3 13.9 14.0 13.0
房地产业 Real Estate 8.0 8.1 8.7 8.9 8.4
租赁和商务服务业 Leasing and Business Services 2.9 2.9 2.8 2.6 3.1
科学研究和技术服务业 Scientific Research and Technical Service 2.5 2.6 2.8 2.7 3.1
水利、环境和公共设施管理业 Management of Water Conservancy, Environment and Public Facilities 0.4 0.4 0.5 0.5 0.5
居民服务、修理和其他服务业 Services to Households, Repair and Other Services 1.1 1.1 1.2 1.2 1.0
教育 Education 1.5 1.6 1.7 1.9 1.8
卫生和社会工作 Health and Social Work 1.1 1.1 1.2 1.4 1.3
文化、体育和娱乐业 Culture ,Sports and Entertainment 0.5 0.5 0.4 0.5 0.5
公共管理、社会保障和社会组织 Public Management, Social Security and Social Organizations 1.7 1.8 1.9 2.1 2.4
第一产业 Primary Industry 0.1
第二产业 Secondary Industry 44.5 43.9 42.6 41.4 41.4
第三产业 Tertiary Industry 55.5 56.1 57.4 58.6 58.5

35
2-10 各行业增加值增长率
GROWTH RATE OF VALUE ADDED BY INDUSTRIES
单位:% (%)
指标名称 Item
2013 2014 2015 2016 2017
合计 Total 10.6 8.8 8.9 9.1 8.8
农林牧渔业 Agriculture, Forestry, Animal Husbandry and Fishery -30.0 -9.1 4.9 0.3 25.2
工 业 Industry 10.0 8.2 7.6 8.1 9.4
建筑业 Construction 4.6 1.6 3.4 9.2 5.1
批发和零售业 Wholesale and Retail Sales 14.3 6.9 5.0 5.9 5.8
交通运输、仓储和邮政业 Transportation,Storage and Post 10.9 8.1 9.8 10.9 21.5
住宿和餐饮业 Hotels and Catering Services 4.3 11.6 3.8 2.8 5.9
信息传输、软件和信息技术服务业 Information Transmission, Software and Information Technology 15.0 12.3 13.4 25.3 20.5
金融业 Financial Intermediation 11.9 10.3 12.6 11.7 2.0
房地产业 Real Estate 4.7 10.2 13.8 -0.7 3.4
租赁和商务服务业 Leasing and Business Services 13.3 8.2 3.6 4.6 20.5
科学研究和技术服务业 Scientific Research and Technical Service 24.7 9.9 16.0 5.8 17.6
水利、环境和公共设施管理业 Management of Water Conservancy, Environment and Public Facilities 6.5 9.7 16.7 12.0 20.1
居民服务、修理和其他服务业 Services to Households, Repair and Other Services 8.9 14.2 6.7 7.1 -10.0
教育 Education 8.2 15.6 16.5 21.7 6.1
卫生和社会工作 Health and Social Work 15.7 13.8 13.5 22.0 6.3
文化、体育和娱乐业 Culture ,Sports and Entertainment 0.3 3.9 7.8 20.4 3.3
公共管理、社会保障和社会组织 Public Management, Social Security and Social Organizations 8.1 9.8 8.7 18.1 11.0
第一产业 Primary Industry -25.4 -9.6 4.2 -0.4 27.0
第二产业 Secondary Industry 9.7 7.8 7.5 8.1 9.2
第三产业 Tertiary Industry 11.5 9.7 10.1 9.9 8.4

36
2-11 各行业增加值构成项目(2017年)
COMPONENTS OF VALUE ADDED BY SECTOR(2017)
单位:万元 (10 000 yuan)
行 业Sector
地区生产总值 Gross Domestic Product
劳动者报酬 Laborers' Remun- eration
生产税净额 Net Taxes on
Production
固定资产折旧
Depreciation of Fixed Assets
营业盈余 Operating
Surplus
合计 Total 224 900 586 109 120 647 31 029 085 21 326 687 63 424 167
农林牧渔业Agriculture, Forestry, Animal Husbandry and Fishery
203 482 203 482
工 业 Industry 87 391 366 44 108 969 11 197 471 10 468 284 21 616 642
建筑业 Construction 5 940 681 3 430 664 830 231 237 188 1 442 598
批发和零售业 Wholesale and Retail Sales 23 674 321 12 231 090 7 236 905 551 540 3 654 786
交通运输、仓储和邮政业 Transportation,Storage and Post 7 012 865 4 206 102 537 821 1 377 332 891 610
住宿和餐饮业 Hotels and Catering Services 3 941 034 2 877 677 279 190 278 805 505 362
信息传输、软件和信息技 术服务业
Information Transmission, Software and Information Technology
17 670 591 5 968 272 1 418 627 1 170 759 9 112 933
金融业 Financial Intermediation 29 242 564 7 373 304 3 684 615 329 920 17 854 725
房地产业 Real Estate 18 943 155 4 394 963 3 919 223 4 120 070 6 508 899
租赁和商务服务业 Leasing and Business Services 7 010 345 5 212 237 878 272 998 563 - 78 727
科学研究和技术服务业 Scientific Research and Technical Service 6 993 057 4 821 608 571 676 366 905 1 232 868
水利、环境和公共设施管 理业
Management of Water Conservancy, Environment and Public Facilities
1 213 703 575 574 123 004 263 198 251 927
居民服务、修理和其他服 务业
Services to Households, Repair and Other Services
2 249 770 1 880 280 99 718 58 347 211 425
教育 Education 3 957 370 3 462 300 52 097 343 779 99 194
卫生和社会工作 Health and Social Work 3 005 223 2 650 553 27 605 238 711 88 354
文化、体育和娱乐业 Culture ,Sports and Entertainment 1 060 613 716 786 134 220 178 038 31 569
公共管理、社会保障和社 会组织
Public Management, Social Security and Social Organizations
5 390 446 5 006 786 38 410 345 248 2
第一产业 Primary Industry 195 721 195 721
第二产业 Secondary Industry 93 180 979 47 458 316 12 019 281 10 689 694 23 013 688
第三产业 Tertiary Industry 131 523 886 61 466 610 19 009 804 10 636 993 40 410 479
注: 本表按当年价格计算。Note: Data of this table are calculated at current prices。

37
2-11 各行业增加值构成项目(2017年)
COMPONENTS OF VALUE ADDED BY SECTOR(2017)
单位:万元 (10 000 yuan)
行 业Sector
地区生产总值 Gross Domestic Product
劳动者报酬 Laborers' Remun- eration
生产税净额 Net Taxes on
Production
固定资产折旧
Depreciation of Fixed Assets
营业盈余 Operating
Surplus
合计 Total 224 900 586 109 120 647 31 029 085 21 326 687 63 424 167
农林牧渔业Agriculture, Forestry, Animal Husbandry and Fishery
203 482 203 482
工 业 Industry 87 391 366 44 108 969 11 197 471 10 468 284 21 616 642
建筑业 Construction 5 940 681 3 430 664 830 231 237 188 1 442 598
批发和零售业 Wholesale and Retail Sales 23 674 321 12 231 090 7 236 905 551 540 3 654 786
交通运输、仓储和邮政业 Transportation,Storage and Post 7 012 865 4 206 102 537 821 1 377 332 891 610
住宿和餐饮业 Hotels and Catering Services 3 941 034 2 877 677 279 190 278 805 505 362
信息传输、软件和信息技 术服务业
Information Transmission, Software and Information Technology
17 670 591 5 968 272 1 418 627 1 170 759 9 112 933
金融业 Financial Intermediation 29 242 564 7 373 304 3 684 615 329 920 17 854 725
房地产业 Real Estate 18 943 155 4 394 963 3 919 223 4 120 070 6 508 899
租赁和商务服务业 Leasing and Business Services 7 010 345 5 212 237 878 272 998 563 - 78 727
科学研究和技术服务业 Scientific Research and Technical Service 6 993 057 4 821 608 571 676 366 905 1 232 868
水利、环境和公共设施管 理业
Management of Water Conservancy, Environment and Public Facilities
1 213 703 575 574 123 004 263 198 251 927
居民服务、修理和其他服 务业
Services to Households, Repair and Other Services
2 249 770 1 880 280 99 718 58 347 211 425
教育 Education 3 957 370 3 462 300 52 097 343 779 99 194
卫生和社会工作 Health and Social Work 3 005 223 2 650 553 27 605 238 711 88 354
文化、体育和娱乐业 Culture ,Sports and Entertainment 1 060 613 716 786 134 220 178 038 31 569
公共管理、社会保障和社 会组织
Public Management, Social Security and Social Organizations
5 390 446 5 006 786 38 410 345 248 2
第一产业 Primary Industry 195 721 195 721
第二产业 Secondary Industry 93 180 979 47 458 316 12 019 281 10 689 694 23 013 688
第三产业 Tertiary Industry 131 523 886 61 466 610 19 009 804 10 636 993 40 410 479
注: 本表按当年价格计算。Note: Data of this table are calculated at current prices。
2-12 支出法地区生产总值
GROSS DOMESTIC PRODUCT BY EXPENDITURE APPROACH
单位:万元 (10 000 yuan)
年 份Year
支出法地区生产总值 Gross Domestic
Product by Expenditure Approach
最终消费率 (消费率)(%) Final
Consumption Rate (%)
资本形成率 (投资率)(%) Capital
Formation Rate (%)
最终消费Final Consumption Expenditure
资本形成总额Gross Capital
Formation
货物和服务净流出Net Exports of
Goods and Services
1992 3 173 194 1 158 215 1 526 307 488 672 36.5 48.1
1993 4 531 445 1 617 614 2 213 934 699 897 35.7 48.9
1994 6 346 711 2 093 226 3 017 863 1 235 622 33.0 47.6
1995 8 427 933 2 742 791 3 807 527 1 877 615 32.5 45.2
1996 10 505 121 3 508 245 4 660 386 2 336 490 33.4 44.4
1997 13 023 008 4 507 268 5 406 112 3 109 628 34.6 41.5
1998 15 449 472 5 432 212 6 357 560 3 659 700 35.2 41.2
1999 18 246 876 6 478 688 7 569 528 4 198 660 35.5 41.5
2000 22 192 015 8 625 540 8 956 134 4 610 341 38.9 40.3
2001 25 229 474 10 811 876 9 784 206 4 633 392 42.9 38.8
2002 30 172 384 13 772 558 11 425 350 4 974 476 45.6 37.9
2003 36 401 435 17 033 512 13 825 437 5 542 486 46.8 38.0
2004 43 502 928 20 486 914 16 865 205 6 150 809 47.1 38.8
2005 50 357 678 17 984 720 21 489 620 10 883 338 35.7 42.7
2006 59 206 612 21 196 299 23 805 590 14 204 723 35.8 40.2
2007 69 252 268 25 014 503 25 397 333 18 840 432 36.1 36.7
2008 79 414 328 29 261 285 26 939 868 23 213 175 36.8 33.9
2009 84 858 247 34 493 436 27 314 916 23 049 895 40.6 32.2
2010 100 022 183 41 040 155 31 178 180 27 803 848 41.0 31.2
2011 118 072 348 47 296 824 37 352 900 33 422 624 40.1 31.6
2012 133 196 818 55 146 505 39 500 176 38 550 137 41.4 29.7
2013 149 794 486 60 104 622 46 636 489 43 053 375 40.1 31.1
2014 164 494 770 68 825 568 51 675 598 43 993 604 41.8 31.4
2015 180 140 720 75 965 321 56 883 034 47 292 365 42.2 31.6
2016 200 797 043 83 311 563 69 005 378 48 480 102 41.5 34.4
2017 224 900 586 92 627 786 78 070 930 54 201 870 41.2 34.7
注: 本表按当年价格计算。Note: Data of this table are calculated at current prices.

38
2-13 各区生产总值
GROSS DOMESTIC PRODUCT BY DISTRICT
单位:万元
年 份Year
全市Total
福田区Futian
罗湖区Luohu
盐田区Yantian
南山区Nanshan
2000 21 874 515 5 027 506 2 937 569 506 406 5 035 461
2001 24 824 874 5 656 978 3 175 776 609 770 5 710 571
2002 29 695 184 6 688 282 3 717 578 801 778 6 771 890
2003 35 857 235 7 972 713 4 271 370 1 039 501 8 285 677
2004 42 821 428 9 210 878 4 894 426 1 238 610 9 849 216
2005 49 509 078 10 340 815 5 301 055 1 474 060 11 363 967
2006 58 135 624 11 647 097 5 933 161 1 721 439 12 665 819
2007 68 015 706 13 133 597 7 108 138 2 021 615 14 658 195
2008 77 867 920 15 204 504 8 162 693 2 264 261 16 713 631
2009 82 902 842 16 359 674 8 848 615 2 520 353 17 294 987
2010 97 733 062 18 788 014 10 363 416 2 881 114 20 459 279
2011 115 158 598 20 934 837 12 024 593 3 270 442 24 432 827
2012 129 714 672 23 757 257 13 582 520 3 661 787 28 360 020
2013 145 726 689 27 146 439 14 942 336 4 104 196 32 230 645
2014 160 018 207 29 590 406 16 253 301 4 501 469 34 649 427
2015 175 028 634 32 561 471 17 275 004 4 864 379 37 155 228
2016 200 797 043 35 745 612 19 762 459 5 402 693 39 784 758
2017 224 900 586 38 205 692 21 616 969 5 859 975 46 177 993
注: 1、本表按当年价格计算。Note: Data of this table are calculated at current prices。 2、注:2007年以来,深圳陆续设立功能新区及新行政区,表中大宝安区数据2007年及以前为原宝安区数据,2008-2012年包含宝安区和光明新区,2013-2016包 含宝安区、龙华新区和光明新区,2017年包含宝安区和光明新区。大龙岗区数据2008年及以前为原龙岗区数据,2009-2012年包含龙岗区和坪山新区,2013- 2016年包含龙岗区、坪山新区和大鹏新区,2017年包含龙岗区和大鹏新区。 Since 2007, functional zones and new administrative districts have been established in Shenzhen.The data of Original Baoan were the data of Baoan in 2007 and before,included Baoan and Guangming in 2008-2012,included Baoan,Longhua and Guangming in 2013-2016,included Baoan and Guangming in 2017.The data of Original Longgang were the data of Longgang in 2008 and before,included Longgang and Pingshan in 2009-2012,included Longgang,Pingshan and Dapeng in 2013-2016,included Longgang and Dapeng in 2017. 3、分区地区生产总值数据2016年以前未做研发支出纳入修订。 R&D expenditure wasn't included in GDP before 2016 in this table.

39
(10 000 yuan)
大宝安区OriginalBaoan
宝安区Baoan
龙华区Longhua
光明新区Guangming
大龙岗区Original
Longgang
龙岗区Longgang
坪山区Pingshan
大鹏新区Dapeng
深汕特别合作区
ShenshanSpecial Cooperation
Zone
4 681 824 3 685 749
5 309 682 4 362 097
6 484 846 5 230 810
7 847 425 6 440 549
9 775 229 7 853 069
11 736 821 9 292 360
15 252 352 10 915 756
18 240 558 12 853 603
20 868 748 19 007 885 1 860 863 14 654 083
22 321 547 20 097 230 2 224 317 15 557 666 13 875 047 1 682 619
26 910 483 24 039 809 2 870 674 18 330 756 16 054 058 2 276 698
32 882 453 29 023 850 3 858 603 21 613 446 18 834 935 2 778 511
35 078 623 30 032 656 5 045 967 25 274 465 21 821 979 3 452 486
39 435 743 20 442 625 13 157 156 5 835 962 27 867 330 21 532 826 3 871 849 2 462 655
44 982 436 23 681 533 14 980 767 6 320 136 30 041 168 23 210 811 4 237 273 2 593 084
49 480 569 26 416 174 16 355 110 6 709 285 33 691 983 26 366 531 4 580 534 2 744 918
56 978 613 30 712 452 18 845 820 7 420 341 43 122 908 34 704 725 5 307 729 3 110 454
43 054 385 34 531 796 21 394 243 8 522 589 42 023 904 38 711 358 6 079 395 3 312 546 488 030

40
2-14 各区生产总值指数
INDICES OF GROSS DOMESTIC PRODUCT BY DISTRICT
(以上年为100)
年 份Year
全市Total
福田区Futian
罗湖区Luohu
盐田区Yantian
南山区Nanshan
2001 114.3 113.4 111.3 116.5 115.1
2002 115.8 113.7 111.8 126.6 115.6
2003 119.2 116.5 111.5 127.0 121.7
2004 117.3 112.9 111.4 116.5 117.1
2005 115.1 110.9 107.8 118.5 114.8
2006 116.6 114.0 113.4 116.2 112.7
2007 114.8 112.7 112.9 116.0 110.6
2008 112.1 110.3 109.1 110.9 112.1
2009 110.8 110.2 107.7 110.2 111.4
2010 112.4 110.8 108.7 110.5 112.2
2011 110.0 108.5 108.2 110.0 111.6
2012 110.0 109.0 108.6 110.0 111.6
2013 110.5 110.3 109.2 110.1 112.0
2014 108.8 108.9 108.0 108.9 109.0
2015 108.9 109.0 108.0 108.9 109.3
2016 109.1 108.7 109.1 108.8 109.3
2017 108.8 108.2 108.4 108.6 109.1
注: 本表按可比价格计算。 Note: Data in this table are calculated at constant prices.

41
(Preceding Year=100)
大宝安区OriginalBaoan
宝安区Baoan
龙华区Longhua
光明新区Guangming
大龙岗区Original
Longgang
龙岗区Longgang
坪山区Pingshan
大鹏新区Dapeng
深汕特别合作区
ShenshanSpecial Cooperation
Zone
114.3 120.4
118.7 116.9
120.4 122.3
122.9 120.1
119.1 118.6
121.0 119.2
118.2 118.5
113.3 114.2
112.2 110.9
115.1 128.2 113.0 127.7
114.5 128.5 111.8 114.5
108.4 125.1 111.4 115.2
109.0 111.6 104.0 115.5 110.7 111.2 113.1
109.1 109.6 108.0 111.0 108.9 109.5 110.0 103.7
108.6 109.0 108.0 109.4 109.6 110.5 109.4 104.0
108.7 109.0 108.1 109.1 110.2 110.0 113.1 107.0
109.3 109.2 108.8 109.8 109.5 109.8 112.1 106.8 117.9

42
2-15 各区分行业增加值(2017年)
VALUE ADDED OF SECTOR BY DISTRICT (2017)
单位:万元
行 业Sector
福田区Futian
罗湖区Luohu
盐田区Yantian
南山区Nanshan
地区生产总值 Gross Domestic Product 38 205 692 21 616 969 5 859 975 46 177 993
农林牧渔业 Farming,Forestry,Animal Husbandry and Fishery 17 809 11 861 899 17 048
工业 Industry 1 723 976 576 423 640 140 19 871 558
建筑业 Construction 459 750 255 510 244 199 973 243
批发和零售业 Wholesale and Retail Trade 7 634 293 3 778 315 917 935 2 876 132
交通运输、仓储和邮政业 Transport,Storage and Post 1 141 228 862 742 1 328 450 1 180 514
住宿和餐饮业 Hotels and Catering Services 572 111 510 097 84 446 493 303
金融业 Financial Intermediation 12 952 119 7 390 338 680 916 2 868 199
房地产业 Real Estate 2 346 585 2 114 842 476 743 3 779 722
其他服务业 Other Services 11 357 821 6 116 841 1 486 247 14 118 274
第一产业 Primary Industry 17 809 9 894 899 17 048
第二产业 Secondary Industry 2 171 179 828 707 879 351 20 783 129
第三产业 Tertiary Industry 36 016 704 20 778 368 4 979 725 25 377 816
注: 本表按当年价格计算。Note: Date of this table are calculated at curret prices.

43
(10 000 yuan)
大宝安区OriginalBaoan
宝安区Baoan
龙华区Longhua
光明新区Guangming
大龙岗区Original
Longgang
龙岗区Longgang
坪山区Pingshan
大鹏新区Dapeng
深汕特别合作区
ShenshanSpecial Cooperation
Zone
43 054 385 34 531 796 21 394 243 8 522 589 42 023 904 38 711 358 6 079 395 3 312 546 488 030
26 002 11 123 2 705 14 879 17 816 8 215 8 528 9 601 100 814
22 104 089 17 101 867 11 676 906 5 002 222 26 772 905 25 005 861 3 779 046 1 767 044 246 323
1 475 732 940 103 646 593 535 629 1 419 309 1 272 967 441 192 146 342 25 153
3 792 558 3 220 112 1 920 938 572 446 2 359 041 2 160 190 371 341 198 851 23 768
1 670 417 1 547 189 345 381 123 228 409 986 370 904 72 499 39 082 1 648
1 088 070 920 589 456 730 167 481 639 589 588 400 82 008 51 189 14 680
2 505 544 2 196 555 945 767 308 989 1 665 794 1 580 486 225 367 85 308 8 520
3 529 967 2 961 731 2 502 983 568 236 3 855 123 3 732 278 322 812 122 845 14 378
6 862 006 5 632 527 2 896 240 1 229 479 4 884 341 3 992 057 776 602 892 284 52 746
26 002 11 123 2 705 14 879 16 997 8 215 8 528 8 782 95 839
23 518 385 17 980 744 12 321 771 5 537 641 28 187 227 26 273 893 4 219 754 1 913 334 271 476
19 509 998 16 539 929 9 069 767 2 970 069 13 819 680 12 429 250 1 851 113 1 390 430 120 715

44
2-16 各区分行业增加值指数(2017年)
INDICES OF VALUE ADDED OF SECTOR BY DISTRICT(2017)
(以上年为100)
行 业Sector
福田区Futian
罗湖区Luohu
盐田区Yantian
南山区Nanshan
地区生产总值 Gross Domestic Product 108.2 108.4 108.6 109.1
农林牧渔业 Farming,Forestry,Animal Husbandry and Fishery 90.9 85.7 112.4 272.7
工业 Industry 104.4 100.8 101.6 107.4
建筑业 Construction 107.6 107.4 107.6 103.0
批发和零售业 Wholesale and Retail Trade 105.9 106.5 108.3 106.7
交通运输、仓储和邮政业 Transport,Storage and Post 124.1 121.5 125.1 119.5
住宿和餐饮业 Hotels and Catering Services 110.2 106.3 106.2 105.0
金融业 Financial Intermediation 105.5 102.3 101.8 100.1
房地产业 Real Estate 98.8 103.3 87.0 111.1
其他服务业 Other Services 114.5 120.6 109.5 114.0
第一产业 Primary Industry 90.9 87.8 112.4 272.7
第二产业 Secondary Industry 104.9 102.5 103.1 107.3
第三产业 Tertiary Industry 108.4 108.6 109.6 111.0
注: 本表按可比价格计算。 Note: Data in this table are calculated at constant prices.

45
(Preceding Year=100)
大宝安区OriginalBaoan
宝安区Baoan
龙华区Longhua
光明新区Guangming
大龙岗区Original
Longgang
龙岗区Longgang
坪山区Pingshan
大鹏新区Dapeng
深汕特别合作区
ShenshanSpecial Cooperation
Zone
109.3 109.2 108.8 109.8 109.5 109.8 112.1 106.8 117.9
101.5 108.3 100.6 97.1 145.2 219.6 111.7 112.7 134.4
110.1 109.4 110.7 112.4 110.6 111.1 113.9 105.2 112.6
107.2 110.3 98.2 102.2 105.0 105.9 109.2 97.7 107.7
103.5 103.6 111.2 102.9 103.3 102.6 101.8 111.6 107.5
118.9 118.8 119.9 119.5 120.4 120.3 118.7 120.8 115.7
104.4 104.9 106.0 102.0 104.9 104.5 107.8 109.1 105.9
99.4 99.1 100.6 101.7 98.0 97.8 99.9 101.7 103.4
107.5 108.4 99.2 103.7 110.4 110.8 105.3 101.6 116.4
114.8 115.5 112.8 111.8 111.8 112.0 116.0 111.1 135.6
101.5 108.3 100.6 97.1 149.5 221.6 111.7 114.4 136.8
109.9 109.4 109.9 111.4 110.3 110.8 113.4 104.6 112.2
108.6 108.9 107.2 106.7 107.8 107.6 108.7 109.9 118.5

46
2-17 新兴产业增加值
ADDED VALUE OF EMERGING INDUSTRIES
单位:亿元
年 份Year
新兴产业增加值Added Value of
Emerging Industries
新一代信息技术产业
New Generation of Information
Technology Industry
文化创意产业Cultural and Creative
Industriy
互联网产业
Internet Industry
新材料产业New Material
Industry
生物产业Bio Industry
2009 2 265.64 1 144.46 585.50 126.29 120.03 143.79
2010 2 820.51 1 391.41 740.14 163.53 174.72 145.52
2011 3 341.34 1 455.55 944.55 292.84 210.92 176.70
2012 3 982.44 1 696.31 1 185.41 359.16 231.35 207.24
2013 5 137.77 2 300.46 1 393.04 501.92 364.23 231.15
2014 5 855.95 2 661.84 1 595.58 579.91 390.76 246.24
2015 7 205.40 3 289.58 1 801.35 760.22 337.38 258.76
2016 8 091.67 4 215.57 2 007.86 773.22 384.62 227.98
2017 9 187.19 4 594.34 2 244.68 1 023.08 454.30 296.04
注: 1、2009-2015年,新兴产业合计为原战略性新兴产业合计。 Note:From 2009 to 2015,the indicator of added value of emerging industries is named added value of strategic emerging industries. 2、表中各指标之间存在产业交叉情况。2009-2015年产业合计数没有剔除重复,各产业数据之和等于合计数;2016-2017年产业合计数扣除了重复,因此 各产业数据之和大于合计数。 There are industrial cross conditions among the indexes in the table. From 2009 to 2015,the total included duplicate parts of industries,so the sum of the industries was equal to the total;from 2016,the total deducts the industry duplication,so the sum of industries is greater than the total.

47
(100 million yuan)
新能源产业 New energy
industry
节能环保产业 Energy saving and
environmental protection industry
海洋产业Marine industry
航空航天产业Aerospace Industry
机器人、可穿戴设备和智能装备产业Robots, wearable
devices and intelligent equipment industry
生命健康产业Life and health
industry
145.57
205.19
260.78
302.97
346.97
381.62
421.54 336.57
613.83 414.33 385.81 88.07 514.03 74.39
676.62 671.32 401.58 146.69 639.85 98.15
3、新兴产业统计口径以深圳相关产业发展规划为依据,与国家、广东省及内地城市有所不同。The caliber of emerging industries is formulated in accordance with the relevant industrial development plan of Shenzhen,which isdifferent from that of the nation, Guangdong and other cities.4、2009-2017年新兴产业增加值合计及其产业增加值已作研发支出纳入调整。 Added value of emerging industries and the added value of sub sectors included R&D expenditure in 2009-2017.

48
2-18 新兴产业增加值增长率
GROWTH RATE OF ADDED VALUE OF EMERGING INDUSTRIES
单位:%
年 份Year
新兴产业增加值增长率
Growth Rate of Added Value of
Emerging Industries
新一代信息技术产业
New Generation of Information
Technology Industry
文化创意产业Cultural and Creative
Industriy
互联网产业
Internet Industry
新材料产业New Material
Industry
生物产业Bio Industry
2010 24.6 21.9 26.0 29.6 46.1 1.1
2011 18.1 4.1 26.7 79.4 20.5 21.3
2012 19.0 16.5 25.0 22.6 9.4 17.2
2013 20.5 19.6 18.0 20.3 10.2 8.0
2014 13.5 14.0 15.6 15.5 7.1 6.4
2015 16.1 19.1 13.1 19.3 11.3 12.4
2016 10.6 9.6 11.0 15.3 19.6 13.4
2017 13.6 12.5 14.5 23.4 15.1 24.6
注: 1、本表增加值增长率按现价计算。Note:The growth rate of added value are at current prices. 2、因统计口径有所调整,所以表中部分产业增加值与上年同期不可同比。 Due to the adjustment of statistical caliber, Some industrial added value in this table is not comparable with the same period last year.
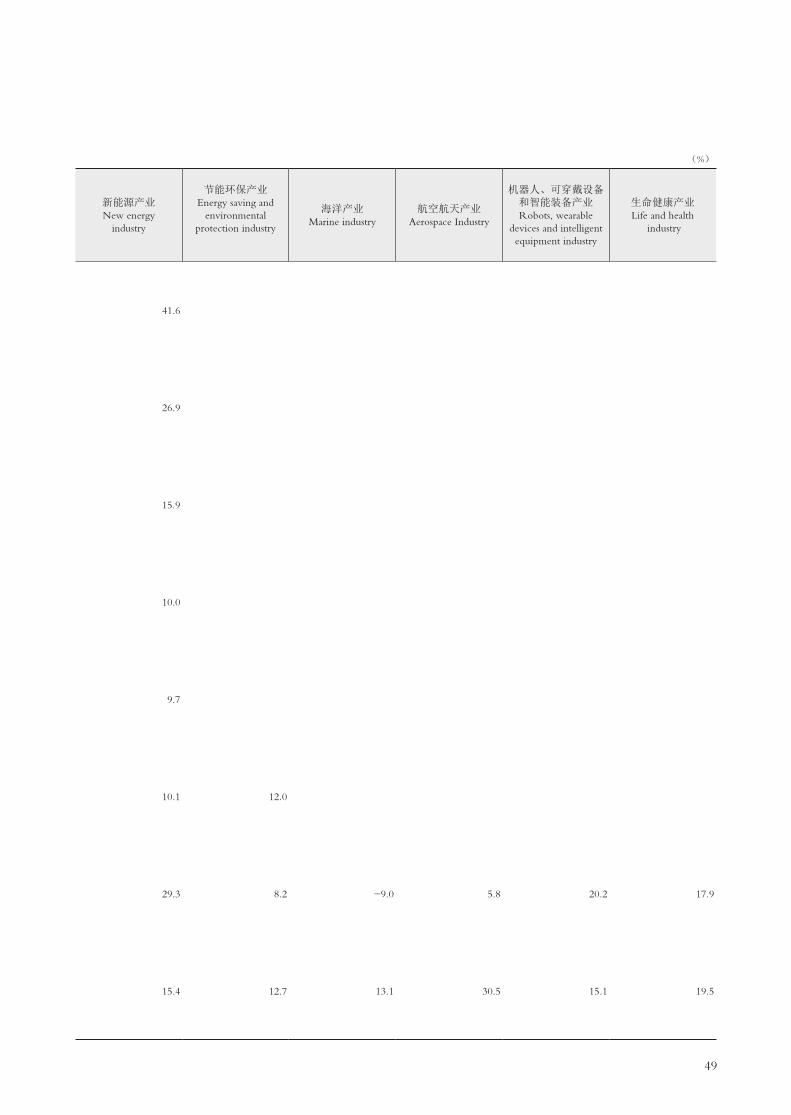
49
(%)
新能源产业 New energy
industry
节能环保产业 Energy saving and
environmental protection industry
海洋产业Marine industry
航空航天产业Aerospace Industry
机器人、可穿戴设备和智能装备产业Robots, wearable
devices and intelligent equipment industry
生命健康产业Life and health
industry
41.6
26.9
15.9
10.0
9.7
10.1 12.0
29.3 8.2 -9.0 5.8 20.2 17.9
15.4 12.7 13.1 30.5 15.1 19.5

50
主要统计指标解释
国内生产总值(GDP) 指按市场价格计算的一个国家(或地区)所有常住单位在一定时期内生产活动的
最终成果。国内生产总值有三种表现形态,即价值形态、收入形态和产品形态。从价值形态看,它是所有常住
单位在一定时期内生产的全部货物和服务价值与同期投入的全部非固定资产货物和服务价值的差额,即所有常
住单位的增加值之和; 从收入形态看,它是所有常住单位在一定时期内创造并分配给常住单位和非常住单位
的初次收入之和; 从产品形态看,它是所有常住单位在一定时期内最终使用的货物和服务价值与货物和服务
净出口价值之和。在实际核算中,国内生产总值有三种计算方法,即生产法、收入法和支出法。三种方法分别
从不同的方面反映国内生产总值及其构成。
对于一个地区来说,称为地区生产总值或地区GDP。
增加值 指常住单位生产过程创造的新增价值和固定资产的转移价值。它可以按生产法计算,也可以按
收入法计算,按生产法计算,它等于总产出减去中间投入;按收入法计算,它等于劳动者报酬、生产税净额、
固定资产折旧和营业盈余之和。
劳动者报酬 指劳动者因从事生产活动所获得的全部报酬。包括劳动者获得的各种形式的工资、奖金和
津贴,既有货币形式的,也有实物形式的,还包括劳动者所享受的公费医疗和医药卫生费、上下班交通补贴、
单位支付的社会保险费、住房公积金等。对于个体经济来说,其所有者所获得的劳动报酬和经营利润不易区
分,这两部分统一作为劳动者报酬处理。
生产税净额 指生产税减生产补贴后的差额。生产税指政府对生产单位从事生产、销售和经营活动以及
因从事生产活动使用某些生产要素(如固定资产、土地、劳动力)所征收的各种税、附加费和规费。生产补贴
与生产税相反,指政府对生产单位的单方面转移支付,因此视为负生产税,包括政策性亏损补贴、价格补贴
等。
固定资产折旧 指一定时期内为弥补固定资产损耗按照规定的固定资产折旧率提取的固定资产折旧,或
按国民经济核算统一规定的折旧率虚拟计算的固定资产折旧。它反映了固定资产在当期生产中的转移价值。各
类企业和企业化管理的事业单位的固定资产折旧是指实际计提的折旧费;不计提折旧的政府机关、非企业化管
理的事业单位和居民住房的固定资产折旧是按照统一规定的折旧率和固定资产原值计算的虚拟折旧。原则上,
固定资产折旧应按固定资产的重置价值计算,但是目前我国尚不具备对全社会固定资产进行重估价的基础,所
以暂时还不能采用这种办法。
营业盈余 指常住单位创造的增加值扣除劳动者报酬、生产税净额和固定资产折旧后的余额。它相当于
企业的营业利润加上生产税补贴,但要扣除从利润中开支的工资和福利等。
支出法国内(地区)生产总值 指一个国家(或地区)所有常住单位在一定时期内用于最终消费、资本
形成总额,以及货物和服务净出口的总额,它反映本期生产的国内生产总值的使用情况。
最终消费 指常住单位在一定时期内对于货物和服务的全部最终消费支出,也就是常住单位为满足物
质、文化和精神生活的需要,从本国经济领土和国外购买的货物和服务的支出,不包括非常住单位在本国经济
领土内的消费支出。最终消费分为居民消费和政府消费。
居民消费 指常住居民对货物和服务的全部最终消费支出。它除了常住居民直接以货币形式购买货物和
服务的消费之外,还包括以其他方式获得的货物和服务的消费,即单位以实物报酬及实物转移的形式提供给劳
动者的货物和服务;居民生产并由居民自己消费的货物和服务,其中的服务仅指居民的自有住房服务和付酬的

51
家庭服务;金融机构提供的金融媒介服务;保险公司提供的保险服务。
政府消费 指政府部门为全社会提供公共服务的消费支出和免费或以较低价格向居民提供的消费货物和
服务净支出。前者等于政府服务的产出价值减去政府单位所获得的经营收入后的价值,政府服务的产出价值等
于它的经常性业务支出加上固定资产折旧;后者等于政府部门免费或以较低价格向住户提供的货物和服务的市
场价值减去向居民收取的价值。
资本形成总额 指常住单位在一定时期内获得的减处置的固定资产加存货的净变动额,包括固定资本形
成总额和存货增加。
固定资本形成总额 指生产者在一定时期内获得的固定资产减处置的固定资产的价值总额。固定资产是
通过生产活动生产出来的,其使用年限在一年以上,单位价值在规定标准以上的资产,不包括自然资产。固定
资本形成总额分有形固定资本形成总额和无形固定资本形成总额。有形固定资本形成总额包括一定时期内完成
的建筑工程、安装工程、设备工器具购置(减处置)价值以及土地改良、新增役、种、奶、毛、娱乐用牲畜和
新增经济林木价值。无形固定资本形成总额包括矿藏的勘探、计算机软件等获得减处置。
存货增加 指常住单位存货实物量变动的市场价值,即期末价值减期初价值的差额,再扣除当期由于价
格变动而产生的持有收益。存货增加可以是正值,也可以是负值;正值表示存货增加,负值表示存货减少。它
包括生产单位购进的原材料、燃料和储备物资等存货,以及生产单位生产的产成品、在制品存货等。
货物和服务净流出 指货物和服务流出减货物和服务流入的差额。流出包括常住单位向非常住单位出售
或无偿转让的各种货物和服务的价值;流入包括常住单位从非常住单位购买或无偿得到的各种货物和服务价
值。由于服务活动的提供与使用同时发生,因此服务的流入流出业务并不发生出入境现象,一般把常住单位从
非常住单位得到的服务作为流入,常住单位向非常住单位提供的服务作为流出。
三次产业 根据社会生产活动历史发展的顺序对产业结构的划分,产品直接取自自然界的部门称为第一
产业,初级产品进行再加工的部门称为第二产业,为生产和消费提供各种服务的部门称为第三产业。它是世界
上通用的产业结构分类,但各国的划分不尽一致。我国的三次产业划分是:
第一产业是指农、林、牧、渔业,不含农、林、牧、渔业中的农、林、牧、渔服务业。
第二产业是指采矿业,制造业,电力、燃气及水的生产和供应业,建筑业,不含采矿业中的开采辅助活
动,制造业中的金属制品、机械和设备修理业。
第三产业是指除第一、第二产业以外的其他行业。包括批发和零售业,交通运输、仓储和邮政业,住宿
和餐饮业,信息传输、软件和信息技术服务业,金融业,房地产业,租赁和商务服务业,科学研究和技术服务
业,水利、环境和公共设施管理业,居民服务、修理和其他服务业,教育,卫生和社会工作,文化、体育和娱
乐业,公共管理、社会保障和社会组织,国际组织,以及农、林、牧、渔业中的农、林、牧、渔服务业,采矿
业中的开采辅助活动,制造业中的金属制品、机械和设备修理业。

52
Explanatory Notes on Main Statistical Indicators
Gross domestic product (GDP) refers to the final products at market prices produced by all resident units in
a country during a certain period of time.Gross domestic product is expressed in three different perspectives,namely
value,income and products respectively.GDP in its value perspective refers to the balance of total value of all goods
and services produced by all resident units during a certain period of time,minus the total value of input of goods and
services of the nature of non-fixed assets;in other words,it is the sum of the value-added of all resident units.GDP
from the perspective of income includes the primary income created by all esident units and distributed to resident and
non-resident units.GDP from the perspective of products refers to the value of all goods and services for final emand
by all resident units plus the net exports of goods and services during a given preriod of time.In the practice of ntaional
accounting,gross domestic product is calculated from three approches,namely production approach,income aproach and
expenditure approach,which reflect gross domestic product and its composition from different angles.
For a region, it is called as Gross Regional Product(GRP) or regional GDP.
Value-added refers to value newly created in the process of production by resident units and the transfer value of
fixed assets. It can be calculated by both production approach and income approach. In terms of production approach, it is
the total output minus intermediate input. In terms of income approach, it is the summation of laborers’ remuneration,
net taxes on production, depreciation of fixed assets and operating surplus.
Laborers’ Remuneration refers to the whole payment of various forms earned by laborers from productive
activities they are engaged in, including wages, bonuses and allowances earned in monetary form and in kind, as well
as free medical services provided to the laborers and the medicine expenses, traffic subsidies, and social insurance fee
and housing fund paid by the laborers’ working units for them. In terms of individual economy, since laborers’
remuneration is not easily distinguished from the operating profit, both are treated as laborers’ remuneration.
Net Taxes on Production refers to taxes on production less subsidies on production.The taxes on production
refers to the various taxes,extra charges and fees levied on the production units on their production,sale and business
activities as well as on the use of some facors of production,such as fixed assets,land and labour in the production activities
they are engaged in.In contrast to taxes on production,subsidies on prodution refer to the unilateral govemment transfer
to the production units and are therefore regarded as negative taxes on production.They include subsidies on the loss due
to implementation of government policies,price subsidies,etc.
Depreciation of Fixed Assets refers to the depreciation of fixed assets of a given period, drawn in accordance
with the stipulated depreciation rate for the purpose of compensating the wear loss of the fixed assets or the depreciation
of fixed assets calculated in a fictitious way in accordance with the stipulated unified depreciation rate in the national
economic accounting system. It reflects the value of transfer of the fixed assets in the production of the current period.
The depreciation of fixed assets in various enterprises and institutions managed as enterprises refers to the depreciation
expenses actually drawn and calculated as part of the cost. In government agencies and institutions not managed as
enterprises which do not draw the depreciation expenses, as well as for the houses of residents, the depreciation of fixed
assets is the imputed depreciation, which is calculated in accordance with the stipulated unified depreciation rate and
the original value of the fixed assets. In principle, the depreciation of fixed assets should be calculated on the basis of
the repurchase value of the fixed assets. However, there is no actual condition to reevaluate all the fixed assets in China.

53
Therefore, the above-mentioned methods are temporarily adopted at present.
Operating Surplus refers to the balance of the value-added created by the resident units deducting the
laborers’ remuneration, net taxes on production and the depreciation of fixed assets. It is equivalent to the business
profit of the enterprises plus subsidies on production, but the wages and welfare expenses paid from the profits should be
deducted.
GDP by Expenditure Approach refers to the method of measuring the final results of production activities of a
country(region) during a given period from the perspective of final uses.It includes final consumption expenditure,gross
capital formation and net export of goods and services.The formula for computation is.:
GDP by expenditure approach = final consumption expenditure + gross capital formation + net export of goods
and services
Final Consumption refers to the total expenditure of resident units on final consumption of goods and services
in a certain period, namely the expenditure of the resident units for purchases of goods and services from domestic
economic territory and abroad to meet the requirements of material, cultural and spiritual life. It excludes the expenditure
of nonresident units on consumption in the economic territory of the country. The final consumption is classified into
household consumption and government consumption.
Resident Consumption refers to the total expenditure of residents on the final consumption of goods and
services. In addition to the consumption of goods and services paid for in monetary form by the residents, the expenditure
on goods and services obtained by the residents in other ways is also included in the resident consumption, which
includes: (a) goods and services provided to the residents by the units in the form of payment in kind and transfer in kind;
(b) goods and services produced and consumed by the residents themselves, where services refer only to services related
to residential buildings owned by the residents and paid services for the households; (c) services of financial intermediary
provided by financial institutions; and (d) insurance services provided by insurance companies.
Government Consumption refers to the expenditure on the consumption of public services provided by
the government to the whole society and the net expenditure on goods and services provided by the government for
residents free of charge or at low prices. The former equals the output value of the government services minus the value
of operating income obtained by the government departments. The latter equals the market value of goods and services
provided by the government free of charge or at low prices for residents minus the value charged by the government on
households.
Total Capital Formation refers to the net value of change within a certain period calculated as fixed assets
acquired minus those disposed plus inventory, which includes total fixed assets formation and increase in inventory.
Total Fixed Capital Formation refers to the value of fixed assets acquired minus the value of fixed assets
disposed within a certain period, where fixed assets refer to assets produced through productive activities with a term of
use of over one year and a unit price above designated standards, excluding natural assets. Total fixed capital formation
can be classified into total tangible assets formation and total intangible assets formation. Total tangible assets formation
includes the value of the construction projects, installation projects completed and the equipment, apparatus and
instruments purchased as well as the value of land improved, the value of draught animals, breeding stock, milk, wool and
recreational animals and newly-increased economic forest in a certain period. Total intangible assets formation includes

54
value acquired through the prospecting of minerals, computer software, and other operations minus the disposal of them.
Increase in Inventory refers to the market value of the change in inventory in resident units, i.e. the difference
in value between the beginning and the end of the period minus benefits aquired through the posession of inventory that
have appreciated during the period. The increase in inventory can be positive or negative. A positive value indicates the
increase in stock while a negative value indicates the decrease in stock. The inventory includes the raw materials, fuels and
reserve materials purchased by the production units as well as the inventory of finished products, semi-finished products
and work in progress, etc.
Net Outflow of Goods and Services refers to the difference between the outflow of goods and services andthe
inflow of goods and services. The outflow includes the value of various goods and services sold or gratuitously transferred
by resident units to nonresident units. The inflow includes the value of various goods and services purchased or
gratuitously acquired by resident units from non-resident units. As the provision of services and the use of them happen
simultaneously, the inflow and outflow of services do not involve border crossing. The acquisition of services by the
resident units from nonresident units is usually treated as inflow while the provision of services by the resident units for
nonresident units is usually treated as outflow.
Three Industries are the classification of industrial structure according to the historical sequence of development
of social production. Primary industry refers to direct extraction of natural resources; secondary industry involves
processing of primary products; and tertiary industry provides services of various kinds for production and consumption.
Such classification is a common practice in the world, though grouping varies to some extent from country to country. In
China the three industries are defined as follows:
Primary industry refers to agriculture, forestry, animal husbandry and fishery, excluding agriculture, forestry, animal
husbandry and fishery services in agriculture,forestry, animal husbandry and fishery.
Secondary industry refers to mining, manufacturing, production and supply of electric power, water and gas, and
construction, excluding mining activities in mining, metal products, machinery and equipment repair in manufacturing.
Tertiary industry refers to all other industries not included in primary or secondary industry.Including wholesale and
retail trades, transport, storage and post, hotels and catering services, information transmission, software and information
technology, financial intermediation, real estate, leasing and business services, scientific research and technical services,
management of water conservancy, environment and public facilities, services to households, repair and other services,
education, health care and social service, culture, sports and recreation, public administration, social security and social
organizations, international organizations, agriculture, forestry, animal husbandry and fishery services in agriculture,
forestry, animal husbandry and fishery, mining activities in mining, metal products, machinery and equipment repair in
manufacturing.

POPULATION AND LABOR FORCE03
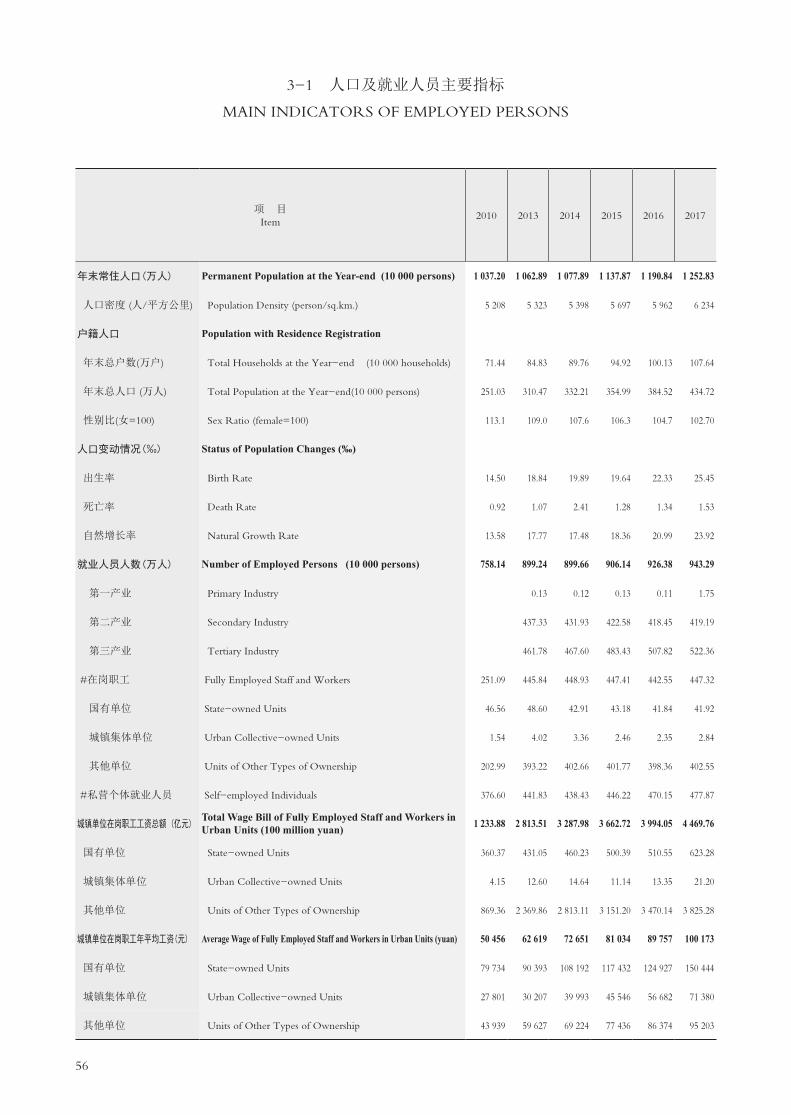
56
3-1 人口及就业人员主要指标
MAIN INDICATORS OF EMPLOYED PERSONS
项 目Item
2010 2013 2014 2015 2016 2017
年末常住人口(万人) Permanent Population at the Year-end (10 000 persons) 1 037.20 1 062.89 1 077.89 1 137.87 1 190.84 1 252.83
人口密度 (人/平方公里) Population Density (person/sq.km.) 5 208 5 323 5 398 5 697 5 962 6 234
户籍人口 Population with Residence Registration
年末总户数(万户) Total Households at the Year-end (10 000 households) 71.44 84.83 89.76 94.92 100.13 107.64
年末总人口 (万人) Total Population at the Year-end(10 000 persons) 251.03 310.47 332.21 354.99 384.52 434.72
性别比(女=100) Sex Ratio (female=100) 113.1 109.0 107.6 106.3 104.7 102.70
人口变动情况(‰) Status of Population Changes (‰)
出生率 Birth Rate 14.50 18.84 19.89 19.64 22.33 25.45
死亡率 Death Rate 0.92 1.07 2.41 1.28 1.34 1.53
自然增长率 Natural Growth Rate 13.58 17.77 17.48 18.36 20.99 23.92
就业人员人数(万人) Number of Employed Persons (10 000 persons) 758.14 899.24 899.66 906.14 926.38 943.29
第一产业 Primary Industry 0.13 0.12 0.13 0.11 1.75
第二产业 Secondary Industry 437.33 431.93 422.58 418.45 419.19
第三产业 Tertiary Industry 461.78 467.60 483.43 507.82 522.36
#在岗职工 Fully Employed Staff and Workers 251.09 445.84 448.93 447.41 442.55 447.32
国有单位 State-owned Units 46.56 48.60 42.91 43.18 41.84 41.92
城镇集体单位 Urban Collective-owned Units 1.54 4.02 3.36 2.46 2.35 2.84
其他单位 Units of Other Types of Ownership 202.99 393.22 402.66 401.77 398.36 402.55
#私营个体就业人员 Self-employed Individuals 376.60 441.83 438.43 446.22 470.15 477.87
城镇单位在岗职工工资总额 (亿元) Total Wage Bill of Fully Employed Staff and Workers in Urban Units (100 million yuan) 1 233.88 2 813.51 3 287.98 3 662.72 3 994.05 4 469.76
国有单位 State-owned Units 360.37 431.05 460.23 500.39 510.55 623.28
城镇集体单位 Urban Collective-owned Units 4.15 12.60 14.64 11.14 13.35 21.20
其他单位 Units of Other Types of Ownership 869.36 2 369.86 2 813.11 3 151.20 3 470.14 3 825.28
城镇单位在岗职工年平均工资(元) Average Wage of Fully Employed Staff and Workers in Urban Units (yuan) 50 456 62 619 72 651 81 034 89 757 100 173
国有单位 State-owned Units 79 734 90 393 108 192 117 432 124 927 150 444
城镇集体单位 Urban Collective-owned Units 27 801 30 207 39 993 45 546 56 682 71 380
其他单位 Units of Other Types of Ownership 43 939 59 627 69 224 77 436 86 374 95 203

57
3-2 户数、人口、出生、死亡及自然增长
HOUSEHOLDS、POPULATION、BIRTH、DEATH AND NATURAL GROWTH
年 份 Year
年末户籍人口 户数(万户)
Registered Households (year-end)
(10 000 households)
年末常住人 口数 (万人)
Year-end Permanent Population
(10 000 persons)
常住户籍人口 Permanent
Registered Population
常住非户籍人口 Permanent
Non-registeredPopulation
1979 7.62 31.41 31.26 0.15
1980 7.82 33.29 32.09 1.20
1981 8.20 36.69 33.39 3.30
1982 8.61 44.95 35.45 9.50
1983 9.25 59.52 40.52 19.00
1984 10.32 74.13 43.52 30.61
1985 11.27 88.15 47.86 40.29
1986 12.41 93.56 51.45 42.11
1987 13.88 105.44 55.60 49.84
1988 15.30 120.14 60.14 60.00
1989 16.51 141.60 64.82 76.78
1990 18.19 167.78 68.65 99.13
1991 19.56 226.76 73.22 153.54
1992 21.81 268.02 80.22 187.80
1993 24.32 335.97 87.69 248.28
1994 26.74 412.71 93.97 318.74
1995 28.67 449.15 99.16 349.99
1996 30.35 482.89 103.38 379.51
1997 32.15 527.75 109.46 418.29
1998 34.07 580.33 114.60 465.73
1999 36.15 632.56 119.85 512.71
2000 38.87 701.24 124.92 576.32
2001 41.14 724.57 132.04 592.53
2002 44.73 746.62 139.45 607.17
2003 47.55 778.27 150.93 627.34
2004 52.04 800.80 165.13 635.67
2005 57.01 827.75 181.93 645.82
2006 61.37 871.10 196.83 674.27
2007 64.88 912.37 212.38 699.99
2008 67.10 954.28 228.07 726.21
2009 69.81 995.01 241.45 753.56
2010 71.44 1 037.20 251.03 786.17
2011 74.54 1 046.74 267.90 778.85
2012 78.29 1 054.74 287.62 767.13
2013 84.83 1 062.89 310.47 752.42
2014 89.76 1 077.89 332.21 745.68
2015 94.92 1 137.87 354.99 782.88
2016 100.13 1 190.84 384.52 806.32
2017 107.64 1 252.83 434.72 818.11
注: 自2004年起,深圳市全面实现农村城市化后,己不存在“农业户”及“农业人口”。 Note: From 2004,the indices,agricultural household and agricultural population have been cancelled because of urbanization in Shenzhen.

58
3-2 续表 1 continued
年 份 Year
在年末常住户籍人口中 Among Permanent Registered Population at the Year-end
户籍户平均 每户人口(人)
Average Persons Per Registered
Household (person)
年平均人口(万人) Average Annual Population
(10 000 persons)
男性(万人) Male
(10 000 persons)
女性(万人)Female
(10 000 persons)
按常住 人口计算 Permanent Population
按常住户籍 人口计算 Permanent
Registered Population
1979 14.26 17.00 4.10
1980 14.69 17.40 4.10 32.35 31.68
1981 15.51 17.88 4.07 34.99 32.74
1982 16.67 18.78 4.12 40.82 34.42
1983 20.50 20.02 4.38 52.24 37.99
1984 22.01 21.51 4.22 66.83 42.02
1985 24.32 23.54 4.25 81.14 45.69
1986 26.13 25.32 4.15 90.86 49.66
1987 28.22 27.38 4.01 99.50 53.53
1988 30.49 29.64 3.93 112.79 57.87
1989 32.89 31.93 3.93 130.87 62.48
1990 34.92 33.73 3.77 154.69 66.74
1991 37.27 35.95 3.74 197.27 70.94
1992 41.19 39.03 3.68 247.39 76.72
1993 45.25 42.44 3.61 302.00 83.96
1994 48.62 45.35 3.51 374.34 90.83
1995 51.37 47.80 3.46 430.93 96.57
1996 53.64 49.75 3.41 466.02 101.27
1997 56.79 52.66 3.40 505.32 106.64
1998 59.73 54.87 3.36 554.04 112.03
1999 62.69 57.16 3.32 606.45 117.22
2000 65.21 59.71 3.21 666.90 122.39
2001 69.47 62.57 3.21 712.91 128.48
2002 73.59 65.86 3.12 735.60 135.75
2003 79.72 71.21 3.17 762.45 145.19
2004 87.58 77.55 3.17 789.54 158.03
2005 96.69 85.24 3.19 814.28 173.53
2006 104.75 92.08 3.21 849.42 189.38
2007 112.98 99.40 3.27 891.74 204.60
2008 121.22 106.85 3.40 933.33 220.22
2009 128.38 113.07 3.46 974.65 234.76
2010 133.21 117.82 3.51 1 016.11 246.24
2011 141.61 126.29 3.59 1 041.97 259.47
2012 151.15 136.47 3.67 1 050.74 277.76
2013 161.93 148.54 3.66 1 058.82 299.04
2014 172.16 160.05 3.70 1 070.39 321.34
2015 182.91 172.08 3.74 1 107.88 343.60
2016 196.64 187.88 3.84 1 164.36 369.76
2017 220.26 214.46 4.04 1 225.32 412.75

59
3-2 续表 2 continued
年 份 Year
出生人口数 (人)
Population of Birth (person)
出生率 (‰)
Birth Rate (‰)
死亡人口数 (人)
Population of Death (person)
死亡率 (‰)
Death Rate (‰)
自然增长 人数(人)
Population of Natural
Growth(person)
自然增长率 (‰)
Natural Growth Rate
(‰)
1979 7 962 24.60 1 856 5.70 6 106 18.90
1980 6 775 21.40 1 773 5.60 5 002 15.80
1981 7 544 23.00 1 732 5.30 5 812 17.80
1982 6 974 20.30 1 707 5.00 5 267 15.30
1983 5 295 13.90 1 793 4.70 3 502 9.20
1984 5 005 11.50 1 606 3.69 3 399 8.09
1985 5 606 12.27 1 533 3.36 4 073 8.91
1986 6 143 12.37 1 794 3.61 4 349 8.76
1987 6 399 11.95 1 822 3.40 4 577 8.55
1988 8 290 14.32 1 720 2.97 6 570 11.35
1989 8 615 13.79 1 713 2.74 6 902 11.05
1990 10 755 16.11 1 859 2.79 8 896 13.33
1991 11 408 16.08 1 607 2.27 9 801 13.81
1992 11 277 14.07 1 840 2.40 9 437 11.67
1993 12 054 14.36 1 619 1.93 10 435 12.43
1994 12 509 13.77 1 590 1.75 10 919 12.02
1995 12 776 13.23 1 719 1.78 11 057 11.45
1996 13 170 13.00 2 116 2.09 11 054 10.91
1997 13 447 12.64 2 268 2.13 11 179 10.51
1998 13 049 11.65 2 341 2.09 10 708 9.56
1999 14 745 12.58 3 479 2.97 11 266 9.61
2000 17 967 14.68 3 120 2.55 14 847 12.13
2001 18 060 14.06 2 223 1.73 15 837 12.33
2002 22 536 16.60 1 978 1.46 20 558 15.14
2003 *15 986 10.63 2 301 1.53 13 685 9.10
2004 19 749 11.58 2 335 1.37 17 414 10.21
2005 24 407 12.64 2 717 1.41 21 690 11.23
2006 26 407 12.53 2 316 1.10 24 091 11.44
2007 34 358 14.54 2 570 1.09 31 788 13.45
2008 36 762 14.12 2 551 0.98 34 211 13.14
2009 37 098 13.70 2 323 0.86 34 775 12.84
2010 40 342 14.50 2 552 0.92 37 790 13.58
2011 41 805 15.42 2 974 1.10 38 831 14.32
2012 61 390 19.38 4 360 1.38 57 030 18.00
2013 59 526 18.84 3 390 1.07 56 136 17.77
2014 67 594 19.89 8 192 2.41 59 402 17.48
2015 71 515 19.64 4 656 1.28 66 859 18.36
2016 87 167 22.33 5 249 1.34 81 918 20.99
2017 116 564 25.45 7 012 1.53 109 552 23.92
注: 自2003年起“出生人口数”、“出生率”、“死亡人口数”、“死亡率”、“自然增长人数”、“自然增长率”按市计生办口径统计。 Note: Since 2003,Population of Birth,Birth Rate,Population of Death,Death Rate,Population of Natural Growth and Natural Growth and Natural Growth Rate are calculated by the statistical coverage from Shenzhen Family Planning Office.

60
3-3 人 口 指 数
INDICES OF POPULATION
单位:% (%)
年 份 Year
以1979年为100 1979=100
以上年为100 Preceding Year=100
年 末 常住人口 Permanent Population (Year-end)
年 末 常住人口 Permanent Population (Year-end)
户籍人口 RegisteredPopulation
非户籍人口 Non-registered
Population
户籍人口 RegisteredPopulation
非户籍人口 Non-registered
Population
1980 106.0 102.7 800.0 106.0 102.7 800.0
1981 116.8 106.8 2 200.0 110.2 104.1 275.0
1982 143.1 113.4 6 333.3 122.5 106.2 287.9
1983 189.5 129.6 12 666.7 132.4 114.3 200.0
1984 236.0 139.2 20 406.7 124.5 107.4 161.1
1985 280.6 153.1 26 860.0 118.9 110.0 131.6
1986 297.9 164.6 28 073.3 106.1 107.5 104.5
1987 335.7 177.9 33 226.7 112.7 108.1 118.4
1988 382.5 192.4 40 000.0 113.9 108.2 120.4
1989 450.8 207.4 51 186.7 117.9 107.8 128.0
1990 534.2 219.6 66 086.7 118.5 105.9 129.1
1991 721.9 234.2 102 360.0 135.2 106.7 154.9
1992 853.3 256.6 125 200.0 118.2 109.6 122.3
1993 1 069.6 280.5 165 520.0 125.4 109.3 132.2
1994 1 313.9 300.6 212 493.3 122.8 107.2 128.4
1995 1 430.0 317.2 233 326.7 108.8 105.5 109.8
1996 1 537.4 330.7 253 006.7 107.5 104.3 108.4
1997 1 680.2 350.2 278 860.0 109.3 105.9 110.2
1998 1 847.6 366.6 310 486.7 110.0 104.7 111.3
1999 2 013.9 383.4 341 806.7 109.0 104.6 110.1
2000 2 232.5 399.6 384 213.3 110.9 104.2 112.4
2001 2 306.8 422.4 395 020.0 103.3 105.7 102.8
2002 2 377.0 446.1 404 780.0 103.0 105.6 102.5
2003 2 477.8 482.8 418 226.7 104.2 108.2 103.3
2004 2 549.5 528.2 423 780.0 102.9 109.4 101.3
2005 2 635.3 582.0 430 546.7 103.4 110.2 101.6
2006 2 772.3 629.7 449 490.8 105.2 108.2 104.4
2007 2 902.6 679.4 466 571.5 104.7 107.9 103.8
2008 3 036.1 729.7 483 834.6 104.6 107.4 103.7
2009 3 166.7 772.8 502 220.3 104.3 105.9 103.8
2010 3 299.7 803.7 523 815.8 104.2 104.0 104.3
2011 3 329.4 857.5 519 101.5 100.9 106.7 99.1
2012 3 356.0 921.0 511 315.0 100.8 107.4 98.5
2013 3 382.8 994.7 501 600.0 100.8 108.0 98.1
2014 3 430.2 1 064.3 497 085.6 101.4 107.0 99.1
2015 3 622.3 1 137.7 521 939.9 105.6 106.9 105.0
2016 3 792.5 1 232.1 537 598.1 104.7 108.3 103.0
2017 3 967.0 1 371.3 545 124.5 104.6 111.3 101.4
年平均增长率 10.2 7.1 25.4
Average Annual Growth Rate

61
3-4 计划生育情况
FAMILY PLANNING
单位:% (%)
指标名称Item
2014 2015 2016 2017
一孩率 1st Birth Rate 78.23 69.60 57.34 42.32
二孩率 2nd Birth Rate 20.45 29.09 40.56 54.60
多孩率 3rd Birth and Above Rate 1.33 1.31 2.10 3.09
政策生育率 Fertility Rate 89.05 88.49 94.95 98.14
出生人口性别比(女性=100) Sex Ratio at Birth 109.22 108.52 108.12 113.35
已婚育龄妇女人数(人) Number of Childbearing Women(person) 919 540 980 487 1 054 689 1 114 817
晚婚率 Late Marriage Rate 95.17 95.92 95.90 95.69
3-5 各区年末常住人口数
PERMANENT POPULATION AT THE YEAR-END BY DISTRICT
单位:万人 (10 000 persons)
区 别District 2013 2014 2015 2016 2017
全市 Total 1 062.89 1 077.89 1 137.87 1 190.84 1 252.83
福田区 Futian 133.95 135.71 144.06 150.17 156.12
罗湖区 Luohu 94.15 95.37 97.56 100.40 102.72
盐田区 Yantian 21.39 21.65 22.12 22.65 23.72
南山区 Nanshan 111.91 113.59 129.12 135.63 142.46
宝安区 New Baoan 270.38 273.65 286.33 301.71 314.90
龙岗区 New Longgang 194.47 197.52 205.24 214.38 227.89
龙华区 Guangming 141.85 143.45 151.15 154.94 160.37
坪山区 Pingshan 31.96 33.15 35.61 40.79 42.80
光明新区 Longhua 49.64 50.42 53.12 56.08 59.68
大鹏新区 Dapeng 13.19 13.37 13.56 14.09 14.61
深汕特别合作区 ShenshanSpecial Cooperation Zone 7.57

62
3-6 按行业分的就业人员人数(2017年末)
NUMBER OF EMPLOYED PERSONS AT YEAR-END GROUPED BY SECTOR(2017)
单位:人 (person)
项 目 Item
年末就业人员合计 Number of Employed
Persons (year-end)
在岗职工 Fully Employed
Staff and Workers
私营个体 就业人员
Self-employed Individuals
其他 就业人员
Others
总 计 Total 9 432 922 4 473 155 4 778 674 181 093
按隶属关系分 By Administrative Relationship
1.中央属 Central Goverment 307 499 272 719 34 780
2.广东省属 Guangdong 49 681 49 214 467
3.深圳市属 Shenzhen 5 807 087 984 720 4 778 674 43 693
4.其 他 Others 3 268 655 3 166 502 102 153
按三次产业分 Grouped by Industry
第一产业 Primary Industry 17 454 485 662 16 307
第二产业 Secondary Industry 4 191 909 2 579 226 1 523 674 89 009
第三产业 Tertiary Industry 5 223 559 1 893 444 3 254 338 75 777
按国民经济行业分 Grouped by Sector
1.农、林、牧、渔业 Agriculture, Forestry, Animal Husbandry and Fishery 17 467 498 662 16 307
2.采矿业 Mining 3 723 3 644 70 9
3.制造业 Manufacturing 3 774 956 2 297 125 1 459 410 18 421
4.电力、热力、燃气及水 Production and Distribution of Eleltricity,Heat, 21 968 21 025 886 57
生产和供应业 Gas and Water
5.建筑业 Construction 393 772 259 937 63 308 70 527
6.批发和零售业 Wholesale and Retail Trades 1 866 941 265 115 1 587 061 14 765
7.交通运输、仓储和邮政业 Transportation, Storage and Post 430 318 244 960 168 139 17 219
8.住宿和餐饮业 Hotels and Catering Services 431 405 93 150 325 096 13 159
9.信息传输、软件和信息 Information Transmission, Software and 416 155 185 320 223 689 7 146
技术服务业 Information Technology
10.金融业 Financial Intermediation 114 846 95 201 17 637 2 008
11.房地产业 Real Estate 407 359 217 450 188 522 1 387
12.租赁和商务服务业 Leasing and Business Services 630 663 303 402 320 276 6 985
13.科学研究和技术服务业 Scientific Research and Technical Service 215 410 100 916 112 326 2 168
14.水利、环境和公共设施 Management of Water Conservancy, 34 278 13 052 21 181 45
管理业 Environment and Public Facilities
15.居民服务、修理和其他 Services to Households, Repair and Other 265 447 23 744 241 224 479
服务业 Services
16.教育 Education 121 550 108 000 10 838 2 712
17.卫生和社会工作 Health and Social Work 91 669 66 014 24 983 672
18.文化、体育和娱乐业 Culture, Sports and Entertainment 42 817 24 352 13 366 5 099
19.公共管理、社会保障和 Public Management, Social Security and 152 178 150 250 1 928
社会组织 Social Organizations
20. 国际组织 International Organizations
注:根据国家劳动统计报表制度的统一规定,从2013年年报起,原属于乡镇企业且符合城镇非私营单位条件的“四上”企业纳入城镇非私营单位就业人员及 工资统计范围。后同。Note: According to the provision of national labor statistics reporting form system, since the year reporting of 2013, the scope of statistics on employed persons in urban corporate unit excluding private units and labor wage covers four above designated size enterprises (refers to industrial enterprises above designated size, construction enterprises by qualification criteria, enterprises above designated size of wholesale trade, retail trade, hotels and catering services), which originally has been included township enterprises and in accordance with the condition of urban corporate unit excluding private units. The same applies to the following tables.
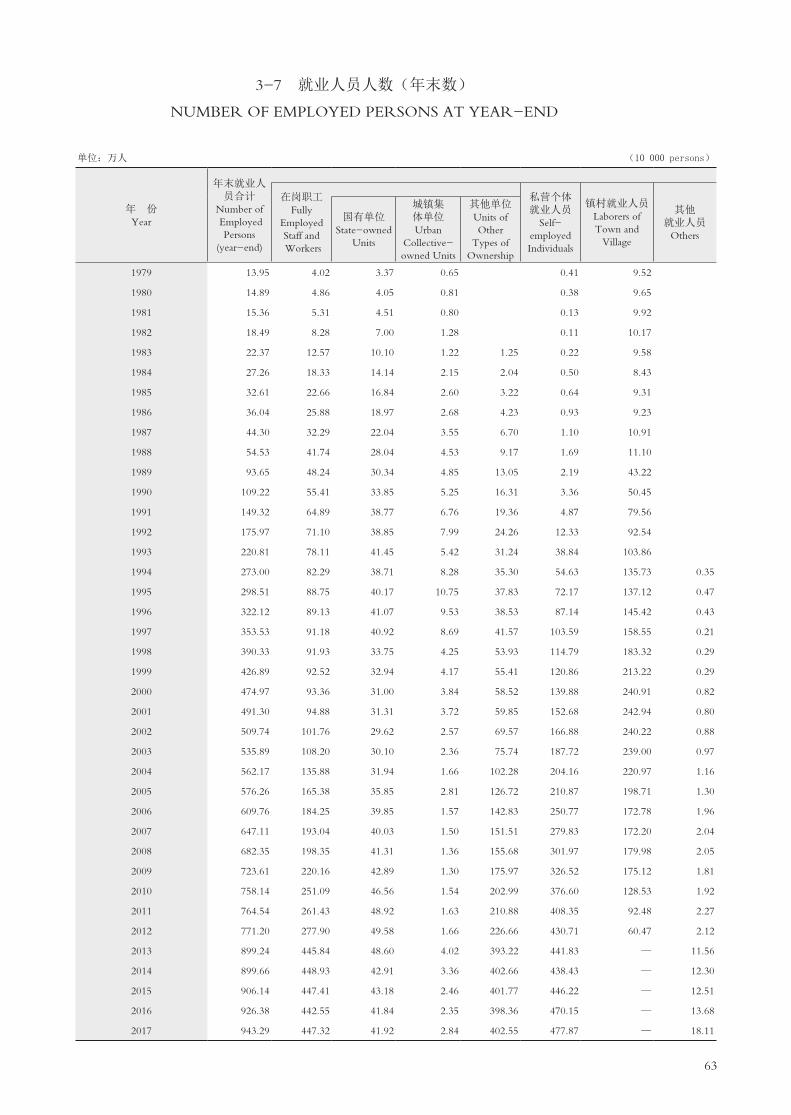
63
3-7 就业人员人数(年末数)
NUMBER OF EMPLOYED PERSONS AT YEAR-END
单位:万人 (10 000 persons)
年 份 Year
年末就业人员合计
Number of Employed
Persons (year-end)
在岗职工 Fully
Employed Staff and Workers
私营个体 就业人员
Self-employed Individuals
镇村就业人员 Laborers of Town and
Village
其他就业人员
Others
国有单位 State-owned
Units
城镇集体单位 Urban
Collective- owned Units
其他单位 Units of Other
Types of Ownership
1979 13.95 4.02 3.37 0.65 0.41 9.52
1980 14.89 4.86 4.05 0.81 0.38 9.65
1981 15.36 5.31 4.51 0.80 0.13 9.92
1982 18.49 8.28 7.00 1.28 0.11 10.17
1983 22.37 12.57 10.10 1.22 1.25 0.22 9.58
1984 27.26 18.33 14.14 2.15 2.04 0.50 8.43
1985 32.61 22.66 16.84 2.60 3.22 0.64 9.31
1986 36.04 25.88 18.97 2.68 4.23 0.93 9.23
1987 44.30 32.29 22.04 3.55 6.70 1.10 10.91
1988 54.53 41.74 28.04 4.53 9.17 1.69 11.10
1989 93.65 48.24 30.34 4.85 13.05 2.19 43.22
1990 109.22 55.41 33.85 5.25 16.31 3.36 50.45
1991 149.32 64.89 38.77 6.76 19.36 4.87 79.56
1992 175.97 71.10 38.85 7.99 24.26 12.33 92.54
1993 220.81 78.11 41.45 5.42 31.24 38.84 103.86
1994 273.00 82.29 38.71 8.28 35.30 54.63 135.73 0.35
1995 298.51 88.75 40.17 10.75 37.83 72.17 137.12 0.47
1996 322.12 89.13 41.07 9.53 38.53 87.14 145.42 0.43
1997 353.53 91.18 40.92 8.69 41.57 103.59 158.55 0.21
1998 390.33 91.93 33.75 4.25 53.93 114.79 183.32 0.29
1999 426.89 92.52 32.94 4.17 55.41 120.86 213.22 0.29
2000 474.97 93.36 31.00 3.84 58.52 139.88 240.91 0.82
2001 491.30 94.88 31.31 3.72 59.85 152.68 242.94 0.80
2002 509.74 101.76 29.62 2.57 69.57 166.88 240.22 0.88
2003 535.89 108.20 30.10 2.36 75.74 187.72 239.00 0.97
2004 562.17 135.88 31.94 1.66 102.28 204.16 220.97 1.16
2005 576.26 165.38 35.85 2.81 126.72 210.87 198.71 1.30
2006 609.76 184.25 39.85 1.57 142.83 250.77 172.78 1.96
2007 647.11 193.04 40.03 1.50 151.51 279.83 172.20 2.04
2008 682.35 198.35 41.31 1.36 155.68 301.97 179.98 2.05
2009 723.61 220.16 42.89 1.30 175.97 326.52 175.12 1.81
2010 758.14 251.09 46.56 1.54 202.99 376.60 128.53 1.92
2011 764.54 261.43 48.92 1.63 210.88 408.35 92.48 2.27
2012 771.20 277.90 49.58 1.66 226.66 430.71 60.47 2.12
2013 899.24 445.84 48.60 4.02 393.22 441.83 — 11.56
2014 899.66 448.93 42.91 3.36 402.66 438.43 — 12.30
2015 906.14 447.41 43.18 2.46 401.77 446.22 — 12.51
2016 926.38 442.55 41.84 2.35 398.36 470.15 — 13.68
2017 943.29 447.32 41.92 2.84 402.55 477.87 — 18.11
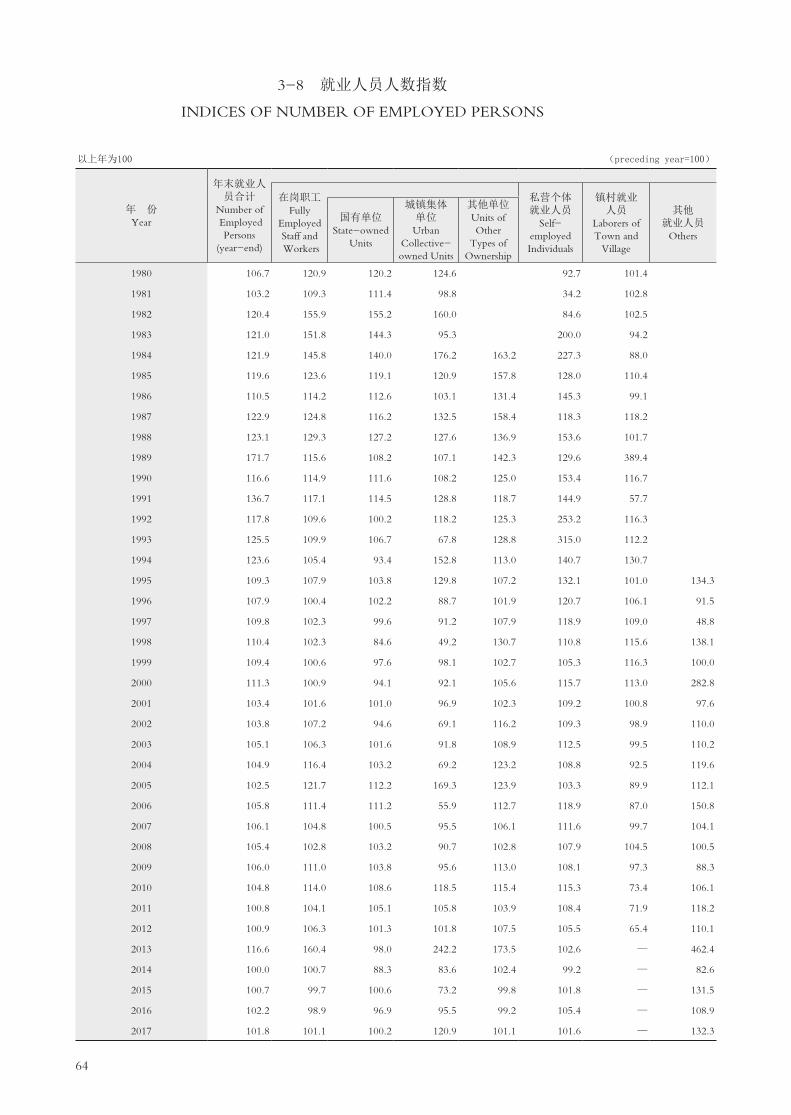
64
3-8 就业人员人数指数
INDICES OF NUMBER OF EMPLOYED PERSONS
以上年为100 (preceding year=100)
年 份 Year
年末就业人员合计
Number of Employed
Persons (year-end)
在岗职工 Fully
Employed Staff and Workers
私营个体 就业人员
Self-employed Individuals
镇村就业人员
Laborers of Town and
Village
其他就业人员
Others
国有单位 State-owned
Units
城镇集体 单位 Urban
Collective- owned Units
其他单位 Units of Other
Types of Ownership
1980 106.7 120.9 120.2 124.6 92.7 101.4
1981 103.2 109.3 111.4 98.8 34.2 102.8
1982 120.4 155.9 155.2 160.0 84.6 102.5
1983 121.0 151.8 144.3 95.3 200.0 94.2
1984 121.9 145.8 140.0 176.2 163.2 227.3 88.0
1985 119.6 123.6 119.1 120.9 157.8 128.0 110.4
1986 110.5 114.2 112.6 103.1 131.4 145.3 99.1
1987 122.9 124.8 116.2 132.5 158.4 118.3 118.2
1988 123.1 129.3 127.2 127.6 136.9 153.6 101.7
1989 171.7 115.6 108.2 107.1 142.3 129.6 389.4
1990 116.6 114.9 111.6 108.2 125.0 153.4 116.7
1991 136.7 117.1 114.5 128.8 118.7 144.9 57.7
1992 117.8 109.6 100.2 118.2 125.3 253.2 116.3
1993 125.5 109.9 106.7 67.8 128.8 315.0 112.2
1994 123.6 105.4 93.4 152.8 113.0 140.7 130.7
1995 109.3 107.9 103.8 129.8 107.2 132.1 101.0 134.3
1996 107.9 100.4 102.2 88.7 101.9 120.7 106.1 91.5
1997 109.8 102.3 99.6 91.2 107.9 118.9 109.0 48.8
1998 110.4 102.3 84.6 49.2 130.7 110.8 115.6 138.1
1999 109.4 100.6 97.6 98.1 102.7 105.3 116.3 100.0
2000 111.3 100.9 94.1 92.1 105.6 115.7 113.0 282.8
2001 103.4 101.6 101.0 96.9 102.3 109.2 100.8 97.6
2002 103.8 107.2 94.6 69.1 116.2 109.3 98.9 110.0
2003 105.1 106.3 101.6 91.8 108.9 112.5 99.5 110.2
2004 104.9 116.4 103.2 69.2 123.2 108.8 92.5 119.6
2005 102.5 121.7 112.2 169.3 123.9 103.3 89.9 112.1
2006 105.8 111.4 111.2 55.9 112.7 118.9 87.0 150.8
2007 106.1 104.8 100.5 95.5 106.1 111.6 99.7 104.1
2008 105.4 102.8 103.2 90.7 102.8 107.9 104.5 100.5
2009 106.0 111.0 103.8 95.6 113.0 108.1 97.3 88.3
2010 104.8 114.0 108.6 118.5 115.4 115.3 73.4 106.1
2011 100.8 104.1 105.1 105.8 103.9 108.4 71.9 118.2
2012 100.9 106.3 101.3 101.8 107.5 105.5 65.4 110.1
2013 116.6 160.4 98.0 242.2 173.5 102.6 — 462.4
2014 100.0 100.7 88.3 83.6 102.4 99.2 — 82.6
2015 100.7 99.7 100.6 73.2 99.8 101.8 — 131.5
2016 102.2 98.9 96.9 95.5 99.2 105.4 — 108.9
2017 101.8 101.1 100.2 120.9 101.1 101.6 — 132.3

65
3-9 分经济类型和行业城镇单位就业人员人数(2017年末)
NUMBER OF EMPLOYED PERSONS IN URBAN UNITS AT YEAR-END BY
OWNERSHIP AND SECTOR(2017)单位:人 (person)
项 目Item
就业人员
Numberof
EmployedPersons
在岗职工Fully
EmployedStaffand
Workers
国有单位
State-ownedUnits
城镇集体单位UrbanColle-ctive-ownedUnits
其他单位
Units of Other
Types of Ownership
国有单位
State-ownedUnits
城镇集体单位UrbanColle-ctive-ownedUnits
其他单位
Units of Other
Types of Ownership
合 计 Total 4 637 941 424 421 28 627 4 184 893 4 473 155 419 234 28 384 4 025 537
按企业、事业和机关分 Grouped by Enterprises,
Institutions and Agencies
企业 Enterprises 4 336 078 133 146 27 657 4 175 275 4 175 805 132 238 27 443 4 016 124
事业 Institutions 154 957 151 273 864 2 820 152 289 148 751 835 2 703
机关 Agencies 138 569 138 569 136 853 136 853
民营非营利组织 Private Non-profit Organizations 1 316 95 1 221 1 308 95 1 213
其他 Others 7 021 1 433 11 5 577 6 900 1 392 11 5 497
按国民经济行业分 Grouped by Economic Sector
1.农、林、牧、渔业 Agriculture, Forestry, Animal 498 314 184 498 314 184
Husbandry and Fishery
2.采矿业 Mining 3 653 3 653 3 644 3 644
3.制造业 Manufacturing 2 315 546 4 126 2 520 2 308 900 2 297 125 4 119 2 520 2 290 486
4.电力、热力、燃气及 Production and Distribution of 21 082 256 15 20 811 21 025 256 15 20 754
水的生产和供应业 Electricity,Heat Gas and Water
5.建筑业 Construction 330 464 13 154 478 316 832 259 937 12 806 478 246 653
6.批发和零售业 Wholesale and Retail Trades 279 880 3 760 370 275 750 265 115 3 699 370 261 046
7.交通运输、仓储和 Transportation, Storage 262 179 9 477 353 252 349 244 960 9 389 353 235 218
邮政业 and Post
8.住宿和餐饮业 Hotels and Catering Services 106 309 2 921 2 304 101 084 93 150 2 911 2 296 87 943
9.信息传输、软件和 Information Transmission, Software 192 466 6 639 1 895 183 932 185 320 6 639 1 869 176 812
信息技术服务业 and Information Technology
10.金融业 Financial Intermediation 97 209 15 475 81 734 95 201 15 445 79 756
11.房地产业 Real Estate 218 837 9 668 710 208 459 217 450 9 641 687 207 122
12.租赁和商务服务业 Leasing and Business Services 310 387 52 892 17 482 240 013 303 402 52 864 17 478 233 060
13.科学研究和技术 Scientific Research and 103 084 5 425 104 97 555 100 916 5 108 104 95 704
服务业 Technical Service
14.水利、环境和公共设 Management of Water Conservancy, 13 097 3 294 304 9 499 13 052 3 280 304 9 468
施管理业 Environment and Public Facilities
15.居民服务、修理和 Services to Households, Repair 24 223 1 823 7 22 393 23 744 1 823 7 21 914
其他服务业 and Other Services
16.教育 Education 110 712 73 545 1 188 35 979 108 000 71 768 1 183 35 049
17.卫生和社会工作 Health and Social Work 66 686 58 234 647 7 805 66 014 57 723 618 7 673
18.文化、体育和娱乐业 Culture, Sports and Entertainment 29 451 11 542 231 17 678 24 352 11 495 83 12 774
19.公共管理、社会保障 Public Management, Social Security 152 178 151 876 19 283 150 250 149 954 19 277
和社会组织 and Social Organizations
按产业分 Grouped by Industry
第一产业 Primary Industry 485 303 182 485 303 182
第二产业 Secondary Industry 2 668 235 17 536 3 013 2 647 686 2 579 226 17 181 3 013 2 559 032
第三产业 Tertiary Industry 1 969 221 406 582 25 614 1 537 025 1 893 444 401 750 25 371 1 466 323

66
3-10 各区城镇单位分行业在岗职工人数(2017年末)
NUMBER OF FULLY EMPLOYED STAFF AND WORKERS IN URBAN UNITS AT
YEAR-END BY SECTOR AND BY DISTRICT (2017)单位:人 ( person)
区 别District 合计
Total
农、林、牧、渔业
Agriculture, Forestry, Animal
Husbandry and Fishery
采矿业Mining
制造业Manufa-cturing
电力、热力、
燃气及水生产
和供应业
Production and Distribution of Eleltricity,Heat, Gas and Water
建筑业Constru-
ction
批发和零售业
Wholesale and Retail
Trades
交通运输、仓储和邮政业
Transportation, Storage
and Post
住宿和餐饮业Hotels
and Catering Services
信息传输、软件和信息技术服务业Information
Transmission, Software and Information Technology
福田区 Futian 862 449 37 377 6 481 137 243 96 805 68 351 39 968 57 347
罗湖区 Luohu 346 723 145 13 582 5 738 49 768 41 904 45 082 19 061 9 717
盐田区 Yantian 62 546 78 19 247 35 1 855 2 574 14 602 1 281 131
南山区 Nanshan 753 175 207 3 644 299 748 2 068 37 840 66 359 27 717 16 751 108 893
宝安区 Baoan 873 332 668 034 2 061 5 056 21 045 60 945 5 172 2 843
龙岗区 Longgang 662 551 19 511 622 2 136 4 644 16 641 18 905 2 556 4 806
龙华区 Longhua 517 701 419 922 948 19 373 13 543 7 326 6 393 1 365
坪山区 Pingshan 156 360 139 650 309 1 003 4 373 548 390 5
光明新区 Guangming 188 258 49 162 767 517 420 1 372 432 339 213
大鹏新区 Dapeng 48 101 25 069 717 2 735 438 1 052 1 239
深汕特别合作区ShenshanSpecial Cooperation Zone
1 959 107 15 61

67
单位:人 3-10 续表 continued ( person)
区 别District
金融业FinancialIntermediation
房地产业RealEstate
租赁和商务服务业Leasing
andBusinessServices
科学研究和技术服务业
Scientific Research and
Technical Service
水利、环境和公共设施管理业Management
of Water Conservancy,
Environment and Public Facilities
居民服务、修理和其他服务业
Services to Households, Repair and
other Services
教育Education
卫生和社会工作Health
and Social Work
文化、体育和娱乐业Culture,
Sports and Ent
ertainment
公共管理、社会保障和社 会组织
Public Management, Solial Security
and Social Organization
福田区 Futian 64 658 96 062 123 360 31 894 3 993 5 943 20 811 18 462 10 394 43 300
罗湖区 Luohu 29 937 33 417 27 793 7 585 1 430 3 834 14 575 12 816 1 150 29 189
盐田区 Yantian 22 2 517 4 577 2 922 715 41 2 885 1 871 2 537 4 656
南山区 Nanshan 323 53 547 43 457 39 509 4 686 4 908 19 863 6 856 5 374 11 425
宝安区 Baoan 11 479 46 988 3 651 418 4 454 20 418 8 085 1 371 11 312
龙岗区 Longgang 11 769 17 466 7 213 1 480 3 348 14 936 12 123 1 171 31 716
龙华区 Longhua 261 6 330 22 182 998 214 209 5 644 451 2 270 10 272
坪山区 Pingshan 559 4 538 39 8 17 3 664 531 726
光明新区 Guangming 429 9 512 507 430 3 991 3 304 3 976
大鹏新区 Dapeng 1 156 3 529 6 598 99 560 607 1 348 85 2 869
深汕特别合作区ShenshanSpecial Cooperation Zone
185 9 606 167 809

68
3-11 各区城镇单位就业人员和在岗职工(2017年末)
NUMBER OF EMPLOYED PERSONS AND OF FULLY EMPLOYED STAFF AND
WORKERS IN URBAN UNITS AT YEAR-END BY DISTRICT(2017)单位:万人 (10 000 persons)
区 别District
就业人员Number of Employed Persons
在岗职工Number of Fully Employed Staff and Workers
合计Total
国有单位
State-ownedUnits
城镇集体单位Urban
Collective-owned Units
其他单位
Units of Other Types of Ownership
合计Total
国有单位
State-ownedUnits
城镇集体单位Urban
Collective-owned Units
其他单位
Units of Other Types of Ownership
年末人数 Year-end Number 463.79 42.44 2.86 418.49 447.32 41.92 2.84 402.55
福田区 Futian 92.41 12.73 0.05 79.62 86.24 12.58 0.05 73.61
罗湖区 Luohu 37.54 7.79 0.14 29.62 34.67 7.72 0.13 26.82
盐田区 Yantian 6.38 1.16 0.01 5.21 6.25 1.15 0.01 5.10
南山区 Nanshan 80.10 6.63 0.59 72.88 75.32 6.52 0.57 68.23
宝安区 Baoan 88.27 3.49 0.12 84.66 87.33 3.48 0.12 83.73
龙岗区 Longgang 66.86 5.76 0.97 60.13 66.26 5.76 0.97 59.53
龙华区 Longhua 52.42 2.78 0.03 49.61 51.77 2.66 0.03 49.08
坪山区 Pingshan 15.78 0.41 0.29 15.08 15.64 0.39 0.29 14.96
光明新区 Guangming 18.88 0.99 0.62 17.27 18.83 0.99 0.62 17.22
大鹏新区 Dapeng 4.95 0.52 0.05 4.38 4.81 0.51 0.05 4.25
深汕特别合作区ShenshanSpecial Cooperation Zone
0.21 0.18 0.03 0.20 0.17 0.03

69
主要统计指标解释
总人口 指一定时点、一定地区范围内有生命的个人的总和。按不同的统计范围可分为常住人口和户籍
人口;统计时点通常为每年12月31日24时。
出生率 指某一人口在一定时期(通常为一年)内活产婴儿数与同期总人口的生存人口数(或同期平均
总人口、年中人口数)之比。通常以千分比表示。本资料中的出生率指年出生率,其计算公式为:
式中:出生人数指活产婴儿,即胎儿脱离母体时(不管怀孕月数),有过呼吸或其他生命现象。年平均人数
指年初、年底人口数的平均数,也可用年中人口数代替。
死亡率 也称粗死亡率。指一定时期(通常为一年)内全部死亡人数与同期平均总人口之比,反映该时
期人口的死亡强度。通常以千分比表示。本资料中的死亡率指年死亡率,其计算公式为:
自然增长率 指一定时期(通常为一年)内人口自然增加数(出生人口减死亡人口)与同期平均总人口
之比。通常以千分比表示。计算公式为:
=人口出生率-人口死亡率
‰1000×=年平均人数
年出生人数出生率
‰1000×=年平均人数
年死亡人数死亡率
‰1000×−
=年平均人数
本年死亡人数本年出生人数人口自然增长率

70
Explanatory Notes on Main Statistical Indicators
Total Population refers to the total number of people alive within a given area at a certain point of time. It can
be divided into the permanent population and the population with residence registration according to different statistical
coverage. The reference time of the statistics on total population is usually taken at midnight of December 31.
Birth Rate (or Crude Birth Rate) refers to the ratio of the number of births to the average population (or mid-
period population) during a certain period of time (usually a year), expressed in ‰. Birth rate in the chapter refers to
annual birth rate. The following formula is used:
Number of births in the formula refers to live births, i.e. when a baby has breathed or showed any vital phenomena
regardless of the length of pregnancy.
Annual average population is the average of the number of population at the beginning of the year and that at the
end of the year. Sometimes it is substituted by the mid-year population.
Death Rate (or Crude Death Rate) refers to the ratio of the number of deaths to the average population (or
mid-period population) during a certain period of time (usually a year), expressed in ‰. Death rate in the chapter refers
to annual death rate. The following formula is used:
Natural Growth Rate of Population refers to the ratio of natural increase in population (number of births minus
number of deaths) in a certain period of time (usually a year) to the average population (or mid-period population) of the
same period, expressed in ‰. The following formula is applied:
Natural Growth Rate of Population = Birth Rate-Death Rate
‰1000Population Average Annual
Births ofNumber RateBirth ×=of
‰1000Population Average AnnualDeaths ofNumber RateDeath ×=
of
‰1000Population Average Annual
Deaths ofNumber -Births ofNumber Population of Rate
Growth Natural×=
ofofof


73
4-1 工业主要指标
MAIN INDICATORS OF INDUSTRY
项 目Item
2010 2013 2014 2015 2016 2017
全部工业 All Industrial Enterprises
工业总产值(亿元) Gross Industrial Output Value (100 million yuan) 18 879.66 24 044.03 25 809.94 26 608.08 28 547.77 33 550.41
规模以上工业 Industrial Enterprises above Designated Size
企业单位数(个) Number of Enterprises (unit) 8 249 6 520 6 355 6 539 6 627 7 943
工业总产值(亿元) Gross Industrial Output Value (100 million yuan) 18 526.82 23 095.21 24 777.59 25 542.44 27 292.29 32 119.15
工业销售产值 (亿元) Sales Output Value of Industy(100 million yuan) 18 181.22 22 296.54 24 131.57 25 055.34 26 606.38 31 162.23
主营业务收入 (亿元) Main Business Revenue (100 million yuan) 18 813.72 22 309.68 23 985.79 25 047.17 26 764.55 30 821.68
主营业务成本(亿元) Prime Operating Cost (100 million yuan) 15 620.81 18 559.47 19 763.56 20 313.06 21 456.65 24 717.61
资产总计 (亿元) Total Assets (100 million yuan) 18 132.47 20 210.17 23 271.57 25 868.63 28 625.32 33 174.65
负债总计 (亿元) Total Liabilities (100 million yuan) 9 439.26 12 450.87 14 608.05 15 830.71 16 779.42 19 641.96
利润总额 (亿元) Total Profits (100 million yuan) 1 599.02 1 277.62 1 496.16 1 831.90 1 769.91 2 101.33
产品销售率(%) Sales Rate of Products (%) 98.13 96.54 97.39 98.09 97.49 97.02
总资产贡献率(%) Ratio of Total Assets to Industrial Output Value(%) 12.32 11.48 11.15 10.75 9.61 9.67
资产负债率(%) Rate of Liabilities to Capital(%) 52.06 61.61 62.77 61.20 58.62 59.21
全员劳动生产率(元/人) Total Labor Productivity(yuan/person) 127 608 176 196 187 367 197 971 229 008 252 660

74
4-2 工业总产值
GROSS OUTPUT VALUE OF INDUSTRY
单位:万元 (10 000 yuan)
年 份 Year
按当年价格计算 Calculated At Current Prices
总 计 Total 轻工业
Light Industry重工业
Heavy Industry
1979 7 128 6 307 821
1980 10 632 9 265 1 367
1981 26 692 25 172 1 520
1982 38 833 34 453 4 380
1983 75 993 61 513 14 480
1984 172 132 137 698 34 434
1985 246 662 194 108 52 554
1986 340 227 266 318 73 909
1987 558 311 433 738 124 573
1988 1 012 739 779 258 233 481
1989 1 477 470 1 080 785 396 685
1990 2 202 180 1 657 859 544 321
1991 3 153 966 2 233 705 920 261
1992 4 347 007 2 971 348 1 375 659
1993 6 896 969 4 655 394 2 241 575
1994 11 014 065 6 351 224 4 662 841
1995 12 922 075 7 008 231 5 913 844
1996 15 305 964 8 580 027 6 725 937
1997 18 175 704 10 151 182 8 024 522
1998 21 573 817 11 141 650 10 432 167
1999 24 435 849 12 381 928 12 053 921
2000 30 715 227 13 731 333 16 983 894
2001 37 476 713 13 861 331 23 615 382
2002 46 823 584 15 832 485 30 991 099
2003 67 976 472 21 459 058 46 517 414
2004 85 888 321 24 175 842 61 712 479
2005 101 745 351 27 406 557 74 338 794
2006 122 784 801 29 658 032 93 126 769
2007 143 647 764 35 687 488 107 960 276
2008 162 837 576 44 451 550 118 386 026
2009 158 286 329 39 239 987 119 046 342
2010 188 796 600 46 801 421 141 995 179
2011 212 730 916 53 500 744 159 230 172
2012 223 089 847 58 544 922 164 544 925
2013 240 440 285 64 571 965 175 868 320
2014 258 099 411 67 789 093 190 310 318
2015 266 080 844 60 837 504 205 243 340
2016 285 477 743 63 626 629 221 851 114
2017 335 504 139 61 190 305 274 313 834

75
4-3 规模以上工业总产值
GROSS OUTPUT VALUE OF INDUSTRY ABOVE DESIGNATED SIZE
单位:万元 (10 000 yuan)
年 份 Year
按当年价格计算 Calculated At Current Prices
总 计 Total 轻工业
Light Industry重工业
Heavy Industry
1979 6 061 5 240 821
1980 8 444 7 077 1 367
1981 24 282 22 762 1 520
1982 36 212 31 832 4 380
1983 72 041 57 561 14 480
1984 166 803 132 369 34 434
1985 241 213 188 659 52 554
1986 330 454 256 545 73 909
1987 547 722 423 150 124 572
1988 993 775 760 294 233 481
1989 1 440 533 1 044 386 396 147
1990 2 104 696 1 570 896 533 800
1991 3 077 749 2 156 668 921 081
1992 4 198 920 2 824 688 1 374 232
1993 6 550 051 4 336 788 2 213 263
1994 9 939 113 5 267 202 4 671 911
1995 11 106 974 5 582 798 5 524 176
1996 12 992 240 6 413 707 6 578 533
1997 15 175 861 7 317 890 7 857 971
1998 20 519 485 10 140 217 10 379 268
1999 23 006 355 11 168 372 11 837 983
2000 29 502 786 13 189 308 16 313 478
2001 36 141 861 12 926 934 23 214 927
2002 43 180 816 14 600 754 28 580 062
2003 63 514 355 19 950 280 43 564 075
2004 80 205 911 23 798 450 56 407 461
2005 98 675 451 26 579 636 72 095 815
2006 119 286 001 28 812 915 90 473 086
2007 139 580 064 34 676 919 104 903 145
2008 158 601 076 43 295 066 115 306 010
2009 154 162 429 38 217 652 115 944 777
2010 185 268 200 45 926 755 139 341 446
2011 204 307 516 51 382 302 152 925 214
2012 213 637 447 56 064 352 157 573 095
2013 230 952 085 62 023 841 168 928 244
2014 247 775 911 65 077 654 182 698 257
2015 255 424 444 58 400 993 197 023 452
2016 272 922 943 60 828 444 212 094 499
2017 321 191 539 58 579 928 262 611 611
注: 1979-1997年为镇及镇以上工业总产值,1998年及以后为规模以上工业总产值。 Note: Data in 1979-1997 are gross output value of industry of town level and above. Data from 1998 are gross output value of industry above designated size.

76
4-4 工业总产值指数
INDICES OF GROSS OUTPUT VALUE OF INDUSTRY
年 份 Year
以1979年为100 1979=100
以上年为100 Preceding Year=100
总 计 Total
总 计 Total轻工业
Light Industry重工业
Heavy Industry轻工业
Light Industry重工业
Heavy Industry
1980 149.1 146.9 166.4 149.1 146.9 166.4
1981 374.5 399.1 185.1 251.1 271.7 111.3
1982 544.8 546.3 533.3 145.5 136.9 288.1
1983 1 066.1 975.3 1 763.0 195.7 178.5 330.6
1984 2 414.8 2 183.3 4 192.3 226.5 223.9 237.8
1985 3 822.9 3 546.2 5 947.9 158.3 162.4 141.9
1986 5 127.8 4 709.1 8 342.4 134.1 132.8 140.3
1987 8 232.7 7 423.6 14 445.2 160.5 157.6 173.2
1988 12 725.1 11 081.7 25 344.1 154.6 149.3 175.5
1989 18 775.8 15 304.8 45 427.3 147.6 138.1 179.2
1990 26 154.7 21 366.8 62 917.8 139.3 139.6 138.5
1991 35 570.3 27 917.5 94 332.5 136.0 130.7 149.9
1992 49 762.9 36 754.6 149 647.1 139.9 131.6 158.6
1993 69 369.5 51 746.5 204 686.9 139.4 140.8 136.8
1994 96 076.8 65 852.8 328 150.6 138.5 127.3 160.3
1995 125 566.2 74 317.5 519 077.6 130.7 112.9 158.2
1996 147 520.2 87 562.1 607 906.0 117.5 117.8 117.1
1997 174 661.2 105 004.8 709 515.2 118.4 119.9 116.7
1998 209 347.8 108 626.3 982 733.9 119.9 103.4 138.5
1999 264 799.8 140 119.8 1 222 150.2 126.5 129.0 124.4
2000 322 447.1 163 856.4 1 540 179.8 121.8 116.9 126.0
2001 379 520.2 177 948.1 1 885 180.1 117.7 108.6 122.4
2002 483 888.3 229 019.2 2 394 178.7 127.5 128.7 127.0
2003 647 442.5 278 487.3 3 349 456.0 133.8 121.6 139.9
2004 808 655.7 330 842.9 4 186 820.0 124.9 118.8 125.0
2005 970 471.9 379 956.2 5 109 350.0 120.0 114.8 122.0
2006 1 192 710.0 418 711.7 6 519 530.6 122.9 110.2 127.6
2007 1 418 132.2 512 084.4 7 680 007.0 118.9 122.3 117.8
2008 1 613 834.4 646 250.5 8 263 687.5 113.8 126.2 107.6
2009 1 646 111.1 590 026.7 8 974 364.6 102.0 91.3 108.6
2010 1 932 534.4 693 871.4 10 508 981.0 117.4 117.6 117.1
2011 2 139 315.6 770 891.1 11 622 933.0 110.7 111.1 110.6
2012 2 246 281.4 850 292.9 11 994 866.9 105.0 110.3 103.2
2013 2 470 909.5 953 178.3 13 098 394.7 110.0 112.1 109.2
2014 2 675 995.0 1 018 947.6 14 264 151.8 108.3 106.9 108.9
2015 2 825 850.7 927 242.3 15 804 680.2 105.6 91.0 110.8
2016 3 054 744.6 961 550.3 17 290 320.1 108.1 103.7 109.4
2017 3 439 642.4 1 067 320.8 19 036 642.4 112.6 111.0 110.1
年平均增长率 31.6 27.6 37.7
Average Annual Growth Rate注: 本表按可比口径计算。Note: Data in this table are calculated at comparable scope.

77
4-5 规模以上工业总产值指数
INDICES OF GROSS OUTPUT VALUE OF INDUSTRY ABOVE DESIGNATED SIZE
年 份 Year
以1979年为1001979=100
以上年为100 Preceding Year=100
总 计 Total
总 计 Total轻工业
Light Industry重工业
Heavy Industry轻工业
Light Industry重工业
Heavy Industry
1980 139.3 135.1 166.4 139.3 135.1 166.4
1981 400.6 434.4 185.1 287.6 321.6 111.3
1982 597.4 607.5 533.3 149.1 139.8 288.1
1983 1 188.5 1 098.5 1 763.0 198.9 180.8 330.6
1984 2 751.8 2 526.0 4 192.3 231.5 230.0 237.8
1985 4 396.3 4 153.2 5 947.9 159.8 164.4 141.9
1986 5 856.9 5 467.4 8 342.4 133.2 131.6 140.3
1987 9 497.8 8 722.3 14 445.2 162.2 159.5 173.2
1988 14 684.2 13 013.3 25 344.1 154.6 149.2 175.5
1989 21 527.8 17 781.8 45 426.6 146.6 136.6 179.2
1990 29 487.0 25 150.3 57 154.3 137.0 141.4 125.8
1991 40 721.5 32 307.8 94 394.4 138.1 128.5 165.2
1992 56 969.4 42 674.4 148 169.0 139.9 132.1 157.0
1993 77 820.2 58 701.0 199 797.4 136.6 137.6 134.8
1994 101 944.5 66 431.7 328 509.6 131.0 113.2 164.4
1995 126 921.1 70 603.5 486 216.8 124.5 106.3 148.0
1996 150 648.1 80 713.1 596 820.2 118.7 114.3 122.7
1997 177 140.0 95 637.7 697 109.7 117.6 118.5 116.8
1998 209 910.9 95 446.4 966 891.2 118.5 99.8 138.7
1999 262 808.4 122 457.7 1 188 309.3 125.2 128.3 122.9
2000 326 933.6 154 051.8 1 463 997.1 124.4 125.8 123.2
2001 384 800.8 167 300.3 1 791 932.5 117.7 108.6 122.4
2002 484 464.2 212 806.0 2 245 291.4 125.9 127.2 125.3
2003 651 604.3 258 559.3 3 165 860.9 134.5 121.5 141.0
2004 813 202.2 304 841.4 3 982 653.0 124.8 117.9 125.8
2005 984 787.9 336 849.7 5 002 212.2 121.1 110.5 125.6
2006 1 187 654.2 374 240.0 6 192 738.7 120.6 111.1 123.8
2007 1 397 869.0 420 271.5 7 394 130.0 117.7 112.3 119.4
2008 1 522 279.3 510 209.6 7 756 442.4 108.9 121.4 104.9
2009 1 537 502.1 521 434.2 7 802 981.1 101.0 102.2 100.6
2010 1 735 839.9 564 713.2 8 926 610.4 112.9 108.3 114.4
2011 1 914 631.4 595 772.4 9 997 803.6 110.3 105.5 112.0
2012 2 063 972.6 685 734.0 10 537 685.0 107.8 115.1 105.4
2013 2 200 194.8 735 792.6 11 201 559.2 106.6 107.3 106.3
2014 2 380 610.8 795 391.8 12 120 087.1 108.2 108.1 108.2
2015 2 475 835.2 717 443.4 13 186 654.8 104.0 90.2 108.8
2016 2 616 957.8 732 509.7 14 083 347.3 105.7 102.1 106.8
2017 2 876 036.6 783 785.4 1 560 4348.8 109.9 107.0 110.8
年平均增长率 31.0 26.6 37.0
Average Annual Growth Rate注: 本表按可比口径计算。Note: Data in this table are calculated at comparable scope.
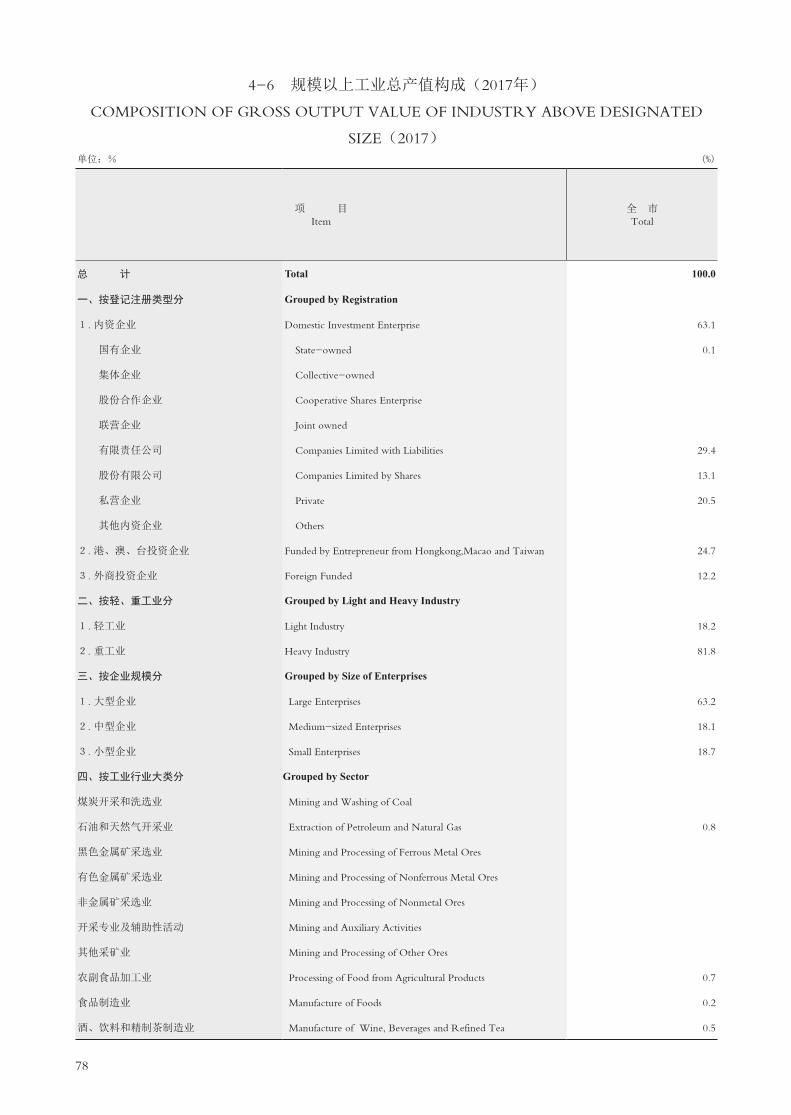
78
4-6 规模以上工业总产值构成(2017年)
COMPOSITION OF GROSS OUTPUT VALUE OF INDUSTRY ABOVE DESIGNATED
SIZE(2017)单位:% (%)
项 目 Item
全 市 Total
总 计 Total 100.0
一、按登记注册类型分 Grouped by Registration
1. 内资企业 Domestic Investment Enterprise 63.1
国有企业 State-owned 0.1
集体企业 Collective-owned
股份合作企业 Cooperative Shares Enterprise
联营企业 Joint owned
有限责任公司 Companies Limited with Liabilities 29.4
股份有限公司 Companies Limited by Shares 13.1
私营企业 Private 20.5
其他内资企业 Others
2. 港、澳、台投资企业 Funded by Entrepreneur from Hongkong,Macao and Taiwan 24.7
3. 外商投资企业 Foreign Funded 12.2
二、按轻、重工业分 Grouped by Light and Heavy Industry
1. 轻工业 Light Industry 18.2
2. 重工业 Heavy Industry 81.8
三、按企业规模分 Grouped by Size of Enterprises
1. 大型企业 Large Enterprises 63.2
2. 中型企业 Medium-sized Enterprises 18.1
3. 小型企业 Small Enterprises 18.7
四、按工业行业大类分 Grouped by Sector
煤炭开采和洗选业 Mining and Washing of Coal
石油和天然气开采业 Extraction of Petroleum and Natural Gas 0.8
黑色金属矿采选业 Mining and Processing of Ferrous Metal Ores
有色金属矿采选业 Mining and Processing of Nonferrous Metal Ores
非金属矿采选业 Mining and Processing of Nonmetal Ores
开采专业及辅助性活动 Mining and Auxiliary Activities
其他采矿业 Mining and Processing of Other Ores
农副食品加工业 Processing of Food from Agricultural Products 0.7
食品制造业 Manufacture of Foods 0.2
酒、饮料和精制茶制造业 Manufacture of Wine, Beverages and Refined Tea 0.5
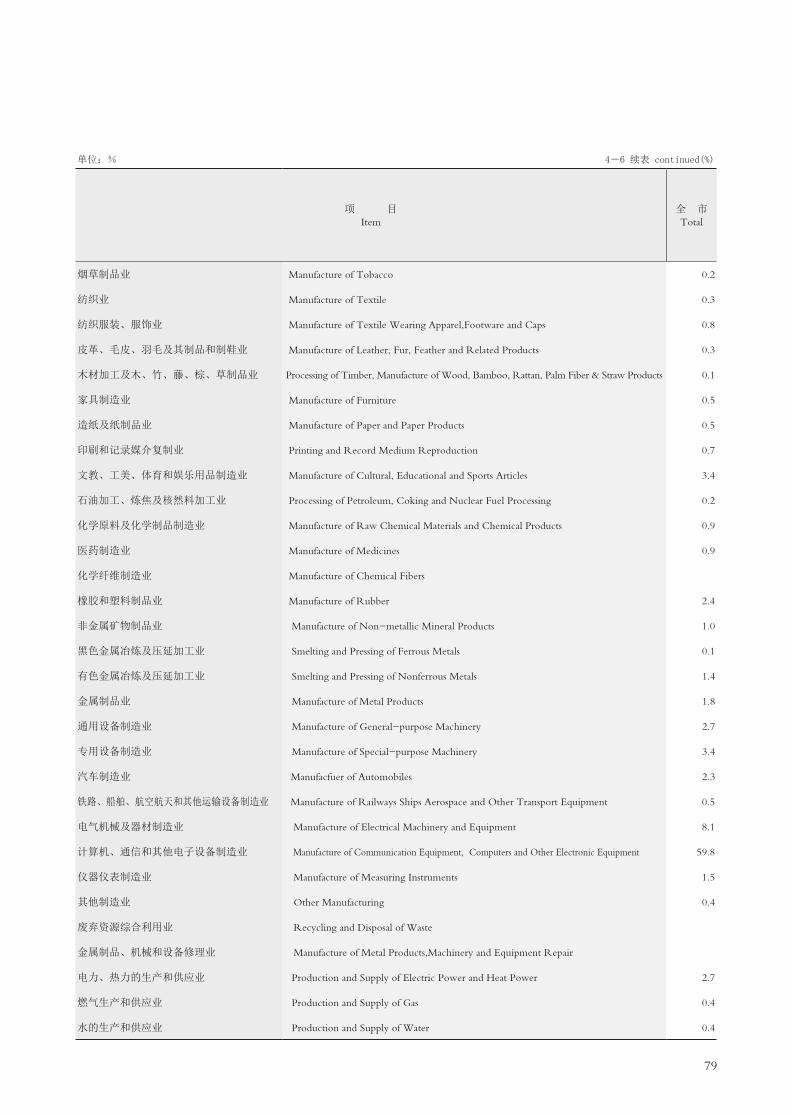
79
单位:% 4-6 续表 continued(%)
项 目 Item
全 市 Total
烟草制品业 Manufacture of Tobacco 0.2
纺织业 Manufacture of Textile 0.3
纺织服装、服饰业 Manufacture of Textile Wearing Apparel,Footware and Caps 0.8
皮革、毛皮、羽毛及其制品和制鞋业 Manufacture of Leather, Fur, Feather and Related Products 0.3
木材加工及木、竹、藤、棕、草制品业 Processing of Timber, Manufacture of Wood, Bamboo, Rattan, Palm Fiber & Straw Products 0.1
家具制造业 Manufacture of Furniture 0.5
造纸及纸制品业 Manufacture of Paper and Paper Products 0.5
印刷和记录媒介复制业 Printing and Record Medium Reproduction 0.7
文教、工美、体育和娱乐用品制造业 Manufacture of Cultural, Educational and Sports Articles 3.4
石油加工、炼焦及核然料加工业 Processing of Petroleum, Coking and Nuclear Fuel Processing 0.2
化学原料及化学制品制造业 Manufacture of Raw Chemical Materials and Chemical Products 0.9
医药制造业 Manufacture of Medicines 0.9
化学纤维制造业 Manufacture of Chemical Fibers
橡胶和塑料制品业 Manufacture of Rubber 2.4
非金属矿物制品业 Manufacture of Non-metallic Mineral Products 1.0
黑色金属冶炼及压延加工业 Smelting and Pressing of Ferrous Metals 0.1
有色金属冶炼及压延加工业 Smelting and Pressing of Nonferrous Metals 1.4
金属制品业 Manufacture of Metal Products 1.8
通用设备制造业 Manufacture of General-purpose Machinery 2.7
专用设备制造业 Manufacture of Special-purpose Machinery 3.4
汽车制造业 Manufacfuer of Automobiles 2.3
铁路、船舶、航空航天和其他运输设备制造业 Manufacture of Railways Ships Aerospace and Other Transport Equipment 0.5
电气机械及器材制造业 Manufacture of Electrical Machinery and Equipment 8.1
计算机、通信和其他电子设备制造业 Manufacture of Communication Equipment, Computers and Other Electronic Equipment 59.8
仪器仪表制造业 Manufacture of Measuring Instruments 1.5
其他制造业 Other Manufacturing 0.4
废弃资源综合利用业 Recycling and Disposal of Waste
金属制品、机械和设备修理业 Manufacture of Metal Products,Machinery and Equipment Repair
电力、热力的生产和供应业 Production and Supply of Electric Power and Heat Power 2.7
燃气生产和供应业 Production and Supply of Gas 0.4
水的生产和供应业 Production and Supply of Water 0.4

80
4-7 规模以上工业企业主要指标(2017年)
MAIN INDICATORS OF INDUSTRIAL ENTERPRISES ABOVE
DESIGNATED SIZE(2017)单位:万元
类 别 Item
企业单位数(个) Number of Enterprises
(unit)
总 计 Total 7 943
一、按登记注册类型分 Grouped by Registration
1. 内资企业 Domestic Investment Enterprise 5 506
国有企业 State-owned 6
集体企业 Collective-owned 2
股份合作企业 Cooperative Shares Enterprise
联营企业 Joint owned 1
有限责任公司 Companies Limited with Liabilities 1 031
股份有限公司 Companies Limited by Shares 361
私营企业 Private 4 104
其他内资企业 Others 1
2. 港、澳、台投资企业 Funded by Entrepreneur from Hongkong,Macao and Taiwan 1 819
3. 外商投资企业 Foreign Funded 618
二、按轻、重工业分 Grouped by Light and Heavy Industry
1. 轻工业 Light Industry 2 796
2. 重工业 Heavy Industry 5 147
三、按企业规模分 Grouped by Size of Enterprises
1. 大型企业 Large Enterprises 401
2. 中型企业 Medium-sized Enterprises 1 605
3. 小型企业 Small Enterprises 5 937
#纯小型企业 #Pure Small Enterprises 5 679
微型企业 Micro Enterprises 258
四、按工业行业大类分 Grouped by Sector
煤炭开采和洗选业 Mining and Washing of Coal
石油和天燃气开采业 Extraction of Petroleum and Natural Gas 2
黑色金属矿采选业 Mining and Processing of Ferrous Metal Ores
有色金属矿采选业 Mining and Processing of Nonferrous Metal Ores
非金属矿采选业 Mining and Processing of Nonmetal Ores
开采专业及辅助性活动 Mining and Auxiliary Activities 2
其他采矿业 Mining and Processing of Other Ores
农副食品加工业 Processing of Food from Agricultural Products 43
食品制造业 Manufacture of Foods 41
酒、饮料和精制茶制造业 Manufacture of Wine, Beverages and Refined Tea 17

81
(10 000 yuan)
工业总产值 (当年价格)
Gross Industrial Output Value
(at current prices)
工业销售产值 (当年价格) Sales Value of Industry
(Current Prices)
资产总计 Total Asset
应收帐款 Value of Debts
Receivable
321 191 539 311 622 334 331 746 468 84 705 838
202 515 304 195 365 113 218 548 593 53 399 437
395 285 397 386 441 297 101 314
5 821 5 658 1 917
9 379 9 379 3 768 2 412
94 433 885 93 314 791 85 217 752 24 259 167
41 949 546 38 405 080 63 332 961 10 843 347
65 716 991 63 228 445 69 549 326 18 191 957
4 397 4 374 1 572 1 240
79 411 208 77 962 139 78 237 561 22 078 680
39 265 027 38 295 082 34 960 314 9 227 721
58 579 928 56 495 060 66 588 057 13 238 102
262 611 611 255 127 274 265 158 411 71 467 736
203 063 219 196 235 288 200 282 033 52 967 135
58 104 922 56 604 329 65 771 659 13 609 656
60 023 398 58 782 717 65 692 776 18 129 047
56 247 369 55 008 935 57 737 012 17 426 881
3 776 029 3 773 782 7 955 764 702 166
2 471 612 2 459 955 3 153 260 20 661
117 821 117 821 558 116 76 240
2 371 630 2 352 061 1 866 275 220 897
573 307 569 356 570 007 91 917
1 724 177 1 710 157 1 092 893 102 532

82
单位:万元
类 别 Item
企业单位数 (个)
Number of Enterprises
(unit)
烟草制品业 Manufacture of Tobacco 1
纺织业 Manufacture of Textile 57
纺织服装、服饰业 Manufacture of Textile Wearing Apparel,Footware and Caps 183
皮革、毛皮、羽毛及其制品和制鞋业 Manufacture of Leather, Fur, Feather and Related Products 103
木材加工及木、竹、藤、棕、草制品业 Processing of Timber, Manufacture of Wood, Bamboo, Rattan, Palm Fiber & Straw Products 20
家具制造业 Manufacture of Furniture 127
造纸及纸制品业 Manufacture of Paper and Paper Products 150
印刷和记录媒介复制业 Printing and Record Medium Reproduction 184
文教、工美、体育和娱乐用品制造业 Manufacture of Cultural, Educational and Sports Articles 335
石油加工、炼焦及核然料加工业 Processing of Petroleum, Coking and Nuclear Fuel Processing 6
化学原料及化学制品制造业 Manufacture of Raw Chemical Materials and Chemical Products 189
医药制造业 Manufacture of Medicines 55
化学纤维制造业 Manufacture of Chemical Fibers 4
橡胶和塑料制品业 Manufacture of Rubber 557
非金属矿物制品业 Manufacture of Non-metallic Mineral Products 144
黑色金属冶炼及压延加工业 Smelting and Pressing of Ferrous Metals 18
有色金属冶炼及压延加工业 Smelting and Pressing of Nonferrous Metals 71
金属制品业 Manufacture of Metal Products 471
通用设备制造业 Manufacture of General-purpose Machinery 421
专用设备制造业 Manufacture of Special-purpose Machinery 566
汽车制造业 Manufacfuer of Automobiles 56
铁路、船舶、航空航天和其他运输设备制造业 Manufacture of Railways Ships Aerospace and Other Transport Equipment 72
电气机械及器材制造业 Manufacture of Electrical Machinery and Equipment 1 202
计算机、通信和其他电子设备制造业 Manufacture of Communication Equipment, Computers and Other Electronic Equipment 2 411
仪器仪表制造业 Manufacture of Measuring Instruments 282
其他制造业 Other Manufacturing 85
废弃资源综合利用业 Recycling and Disposal of Waste 3
金属制品、机械和设备修理业 Manufacture of Metal Products,Machinery and Equipment Repair 11
电力、热力的生产和供应业 Production and Supply of Electric Power and Heat Power 22
燃气生产和供应业 Production and Supply of Gas 4
水的生产和供应业 Production and Supply of Water 28

83
4-7 续表1 continued(10 000 yuan)
工业总产值 (当年价格)
Gross Industrial Output Value
(at current prices)
工业销售产值 (当年价格)
Sales Value of Industry(Current Prices)
资产总计 Total Asset
应收帐款 Value of Debts
Receivable
630 363 626 822 598 230 12 639
986 121 899 679 835 989 169 828
2 664 981 2 449 697 2 732 773 452 447
1 117 979 1 101 748 931 506 297 789
160 762 152 848 161 130 33 011
1 483 458 1 478 156 1 887 662 249 773
1 493 891 1 482 783 1 452 091 431 962
2 407 136 2 303 937 3 435 869 739 111
11 008 604 10 640 327 11 704 359 2 173 142
800 415 736 468 582 143 52 415
3 011 969 3 046 542 4 629 885 858 347
2 754 798 2 427 078 6 613 975 728 407
54 750 53 854 24 827 6 694
7 813 711 7 622 871 6 383 810 2 075 308
3 310 431 3 251 514 4 955 596 1 277 874
301 860 292 017 376 658 66 930
4 516 238 4 620 985 2 872 335 389 501
5 671 684 5 558 461 5 279 452 1 647 878
8 532 778 8 359 613 9 002 026 2 639 068
10 951 623 10 555 013 13 201 883 3 264 664
7 494 609 7 406 267 12 257 400 3 660 188
1 493 829 1 426 556 1 883 771 272 285
26 007 773 25 176 158 32 971 222 7 688 976
191 962 973 185 561 413 173 214 978 52 414 515
4 745 553 4 672 090 6 806 972 1 801 655
1 139 326 1 125 733 929 883 182 421
15 281 15 540 26 518 1 677
154 517 148 025 205 719 88 358
8 757 944 8 752 372 11 923 659 348 434
1 237 252 1 241 746 2 143 858 44 974
1 250 385 1 226 676 4 479 739 123 323

84
单位:万元
类 别 Item
负债合计 Total Liabilities
主营业务收入 Prime Operating Revenue
总 计 Total 196 419 562 308 216 750
一、按登记注册类型分 Grouped by Registration
1. 内资企业 Domestic Investment Enterprise 129 117 410 192 441 280
国有企业 State-owned 302 864 399 980
集体企业 Collective-owned 641 5 377
股份合作企业 Cooperative Shares Enterprise
联营企业 Joint owned 2 956 9 373
有限责任公司 Companies Limited with Liabilities 54 543 196 93 248 346
股份有限公司 Companies Limited by Shares 31 062 889 35 634 582
私营企业 Private 43 203 741 63 139 971
其他内资企业 Others 1 123 3 652
2. 港、澳、台投资企业 Funded by Entrepreneur from Hongkong,Macao and Taiwan 48 374 729 76 678 569
3. 外商投资企业 Foreign Funded 18 927 423 39 096 901
二、按轻、重工业分 Grouped by Light and Heavy Industry
1. 轻工业 Light Industry 36 244 393 56 762 101
2. 重工业 Heavy Industry 160 175 169 251 454 649
三、按企业规模分 Grouped by Size of Enterprises
1. 大型企业 Large Enterprises 120 795 033 190 643 389
2. 中型企业 Medium-sized Enterprises 33 617 832 56 526 711
3. 小型企业 Small Enterprises 42 006 697 61 046 650
#纯小型企业 #Pure Small Enterprises 36 910 388 56 777 413
微型企业 Micro Enterprises 5 096 309 4 269 238
四、按工业行业大类分 Grouped by Sector
煤炭开采和洗选业 Mining and Washing of Coal
石油和天然气开采业 Extraction of Petroleum and Natural Gas 2 320 379 2 581 777
黑色金属矿采选业 Mining and Processing of Ferrous Metal Ores
有色金属矿采选业 Mining and Processing of Nonferrous Metal Ores
非金属矿采选业 Mining and Processing of Nonmetal Ores
开采专业及辅助性活动 Mining and Auxiliary Activities 127 381 117 821
其他采矿业 Mining and Processing of Other Ores
农副食品加工业 Processing of Food from Agricultural Products 919 449 2 620 491
食品制造业 Manufacture of Foods 350 706 600 661
酒、饮料和精制茶制造业 Manufacture of Wine, Beverages and Refined Tea 674 235 1 449 545

85
4-7 续表2 continued(10 000 yuan)
主营业务成本 Prime Operating Cost
销售费用 Prime Operating Expense
管理费用 Management
Expenses
财务费用 Financial Expenses
利润总额 Total Profits
247 176 147 13 413 559 27 417 877 2 253 059 21 013 273
147 068 643 10 272 476 21 515 791 1 636 213 13 192 538
348 702 5 551 20 828 5 563 19 595
4 516 1 610 308
8 644 455 60 2 173
67 898 041 5 652 115 12 853 762 578 096 6 226 746
26 476 020 2 573 173 3 855 230 445 703 3 131 249
52 329 193 2 041 146 4 785 226 606 850 3 814 458
3 527 35 75 - 1 9
66 401 753 2 022 484 3 968 769 370 865 4 901 482
33 705 751 1 118 599 1 933 317 245 981 2 919 253
45 515 849 3 188 761 3 896 363 557 212 3 721 352
201 660 298 10 224 798 23 521 514 1 695 847 17 291 921
149 475 029 9 425 475 18 864 364 1 117 631 14 538 253
45 945 135 2 181 453 4 161 830 525 441 3 574 205
51 755 983 1 806 631 4 391 683 609 987 2 900 815
48 443 227 1 770 942 4 132 948 474 969 2 327 804
3 312 756 35 689 258 735 135 018 573 011
1 306 184 5 030 56 620 25 976 1 038 545
110 385 299 6 490 - 374 4 906
2 346 787 74 828 69 084 6 087 126 743
439 582 83 816 49 663 4 901 21 455
920 001 413 735 45 145 - 9 798 66 066
86
单位:万元
类 别 Item
负债合计 Total
Liabilities
烟草制品业 Manufacture of Tobacco 87 640
纺织业 Manufacture of Textile 382 282
纺织服装、服饰业 Manufacture of Textile Wearing Apparel,Footware and Caps 1 435 807
皮革、毛皮、羽毛及其制品和制鞋业 Manufacture of Leather, Fur, Feather and Related Products 493 679
木材加工及木、竹、藤、棕、草制品业 Processing of Timber, Manufacture of Wood, Bamboo, Rattan, Palm Fiber & Straw Products 117 004
家具制造业 Manufacture of Furniture 1 087 125
造纸及纸制品业 Manufacture of Paper and Paper Products 717 237
印刷和记录媒介复制业 Printing and Record Medium Reproduction 1 581 635
文教、工美、体育和娱乐用品制造业 Manufacture of Cultural, Educational and Sports Articles 8 438 084
石油加工、炼焦及核然料加工业 Processing of Petroleum, Coking and Nuclear Fuel Processing 137 476
化学原料及化学制品制造业 Manufacture of Raw Chemical Materials and Chemical Products 2 292 006
医药制造业 Manufacture of Medicines 2 818 057
化学纤维制造业 Manufacture of Chemical Fibers 10 375
橡胶和塑料制品业 Manufacture of Rubber 3 517 487
非金属矿物制品业 Manufacture of Non-metallic Mineral Products 2 550 685
黑色金属冶炼及压延加工业 Smelting and Pressing of Ferrous Metals 221 498
有色金属冶炼及压延加工业 Smelting and Pressing of Nonferrous Metals 2 488 217
金属制品业 Manufacture of Metal Products 2 858 601
通用设备制造业 Manufacture of General-purpose Machinery 4 826 693
专用设备制造业 Manufacture of Special-purpose Machinery 6 620 993
汽车制造业 Manufacfuer of Automobiles 9 962 049
铁路、船舶、航空航天和其他运输设备制造业 Manufacture of Railways Ships Aerospace and Other Transport Equipment 929 843
电气机械及器材制造业 Manufacture of Electrical Machinery and Equipment 17 204 200
计算机、通信和其他电子设备制造业 Manufacture of Communication Equipment, Computers and Other Electronic Equipment 107 810 197
仪器仪表制造业 Manufacture of Measuring Instruments 3 459 553
其他制造业 Other Manufacturing 461 694
废弃资源综合利用业 Recycling and Disposal of Waste 18 005
金属制品、机械和设备修理业 Manufacture of Metal Products,Machinery and Equipment Repair 103 909
电力、热力的生产和供应业 Production and Supply of Electric Power and Heat Power 6 361 854
燃气生产和供应业 Production and Supply of Gas 944 797
水的生产和供应业 Production and Supply of Water 2 088 730

87
4-7 续表3 continued(10 000 yuan)
主营业务收入 Prime Operating
Revenue
主营业务成本 Prime Operating Cost
销售费用 Prime Operating
Expense
管理费用 Management
Expenses
财务费用 Financial Expenses
利润总额 Total Profits
626 822 184 349 9 722 23 890 - 3 923 66 326
903 544 717 455 70 499 57 773 4 777 62 978
2 431 864 1 661 446 342 812 279 936 14 353 114 981
1 099 161 917 053 23 482 119 720 3 038 49 151
153 465 131 740 4 506 11 332 3 590 2 201
1 530 008 1 260 764 92 338 106 311 12 304 55 997
1 499 573 1 316 387 44 378 92 791 13 408 36 149
2 300 069 1 834 899 85 949 206 195 22 180 225 068
11 272 289 10 239 059 198 626 422 279 146 899 409 714
750 363 389 758 87 171 37 591 791 217 201
3 047 597 2 489 384 149 357 231 299 38 953 175 269
2 508 138 1 039 423 649 712 267 447 48 269 607 712
56 503 48 704 1 067 4 073 347 1 949
7 537 237 6 459 480 164 692 561 131 42 428 309 027
3 256 660 2 790 743 101 264 193 078 42 689 182 476
280 459 255 850 6 408 9 383 5 952 11 637
4 983 584 4 759 371 23 068 144 795 15 185 81 198
5 204 413 4 364 665 136 280 429 170 26 776 301 607
8 280 517 6 720 099 325 959 631 253 32 540 623 404
10 514 430 7 265 977 752 246 1 197 318 110 375 1 306 684
6 935 027 6 016 200 253 396 457 391 125 497 69 793
1 390 677 1 277 537 29 196 88 569 11 249 39 179
25 152 124 21 148 684 778 527 1 835 878 287 934 1 453 807
181 997 300 145 443 952 8 055 468 18 930 722 921 233 10 911 226
4 792 005 3 557 324 315 065 512 294 54 130 503 664
1 122 760 846 290 31 373 82 471 11 698 150 913
15 540 12 076 99 1 154 482 1 621
154 191 113 494 4 584 18 371 2 045 18 723
8 636 272 7 194 036 2 769 121 806 158 898 1 114 809
1 146 640 884 466 53 259 28 722 12 416 236 662
1 267 224 712 543 42 581 86 733 59 755 414 433

88
4-8 规模以上工业企业主要经济效益指标(2017年)
MAIN INDICATORS ON ECONOMIC BENEFIT OF INDUSTRIAL ENTERPRISES
ABOVE DESIGNATED SIZE(2017)
指标名称 Item
效益综合指数(%)Benefit Composite Index
(%)
产品销售率(%) Sales Rate of Products (%)
总 计 Total 251.95 97.02
一、按登记注册类型分 Grouped by Registration
1. 内资企业 Domestic Investment Enterprise 301.44 96.47
国有企业 State-owned 237.15 100.53
集体企业 Collective-owned 202.53 97.19
股份合作企业 Cooperative Shares Enterprise
联营企业 Joint owned 1 051.84 100.00
有限责任公司 Companies Limited with Liabilities 469.74 98.81
股份有限公司 Companies Limited by Shares 333.55 91.55
私营企业 Private 192.25 96.21
其他内资企业 Others 99.45
2. 港、澳、台投资企业 Funded by Entrepreneur from Hongkong,Macao and Taiwan 184.82 98.18
3. 外商投资企业 Foreign Funded 227.38 97.53
二、按轻、重工业分 Grouped by Light and Heavy Industry
1. 轻工业 Light Industry 176.96 96.44
2. 重工业 Heavy Industry 284.08 97.15
三、按企业规模分 Grouped by Size of Enterprises
1. 大型企业 Large Enterprises 324.44 96.64
2. 中型企业 Medium-sized Enterprises 177.71 97.42
3. 小型企业 Small Enterprises 186.49 97.93
#纯小型企业 #Pure Small Enterprises 172.48 97.80
微型企业 Micro Enterprises 1 156.93 99.94
四、按工业行业大类分 Grouped by Sector
煤炭开采和洗选业 Mining and Washing of Coal
石油和天然气开采业 Extraction of Petroleum and Natural Gas 4 801.10 99.53
黑色金属矿采选业 Mining and Processing of Ferrous Metal Ores
有色金属矿采选业 Mining and Processing of Nonferrous Metal Ores
非金属矿采选业 Mining and Processing of Nonmetal Ores
开采专业及辅助性活动 Mining and Auxiliary Activities 240.09 100.00
其他采矿业 Mining and Processing of Other Ores
农副食品加工业 Processing of Food from Agricultural Products 222.12 99.17
食品制造业 Manufacture of Foods 158.43 99.31
酒、饮料和精制茶制造业 Manufacture of Wine, Beverages and Refined Tea 257.10 99.19

89
成本费用利润率(%) After-Tax
Profits/Cost(%)
流动资产周转率(次) Turnover Times of Circulating Funds(time)
资产负债率(%)Assets-Liability Ratio
(%)
总资产贡献率(%)Ratio of Total Assets to Industrial Output Value
(%)
资本保值增值率(%)Ratio of Capital
Appreciation(%)
全员劳动生产率(元/人)Total Labor Productivity
(yuan/person)
7.13 1.36 59.21 9.67 114.65 252 660
7.19 1.28 59.08 9.74 125.08 332 859
5.15 1.11 68.63 8.89 20.77 271 183
6.01 9.12 33.41 16.07 94.37 36 418
1.89 2.75 78.45 12.86 11.33 1 603 828
7.03 1.50 64.00 12.71 115.19 602 432
9.20 0.97 49.05 7.24 126.02 386 972
6.31 1.23 62.12 8.39 141.86 160 566
0.24 2.39 71.43 1.32 190 874
6.65 1.42 61.83 8.72 110.70 148 353
7.76 1.72 54.14 11.35 81.87 204 240
6.84 1.23 54.43 9.10 96.51 138 727
7.19 1.39 60.41 9.81 121.23 303 100
7.98 1.42 60.31 10.69 115.99 362 789
6.70 1.29 51.11 8.93 111.13 136 936
4.91 1.24 63.94 7.29 115.11 169 406
4.21 1.24 63.93 6.99 115.79 151 455
15.08 1.24 64.06 9.45 109.91 1 701 397
74.51 11.73 73.59 47.16 123.59 7 058 932
4.20 0.91 22.82 0.88 101.22 288 053
5.02 2.15 49.27 9.43 108.20 205 390
3.70 1.58 61.53 9.32 100.20 120 625
4.77 1.75 61.69 17.33 155.44 237 249

90
指 标 名 称 Item
效益综合指数(%)Benefit Composite Index
(%)
产品销售率(%) Sales Rate of Products (%)
烟草制品业 Manufacture of Tobacco 5 092.20 99.44
纺织业 Manufacture of Textile 208.87 91.23
纺织服装、服饰业 Manufacture of Textile Wearing Apparel, Footware and Caps 148.88 91.92
皮革、毛皮、羽毛及其制品和制鞋业
Manufacture of Leather, Fur, Feather and Related Products 144.20 98.55
木材加工及木、竹、藤、棕、草制品业
Processing of Timber, Manufacture of Wood, Bamboo, Rattan, Palm Fiber & Straw Products
129.84 95.08
家具制造业 Manufacture of Furniture 142.11 99.64
造纸及纸制品业 Manufacture of Paper and Paper Products 133.10 99.26
印刷和记录媒介复制业 Printing and Record Medium Reproduction 192.96 95.71
文教、工美、体育和娱乐用品制造业
Manufacture of Cultural, Educational and Sports Articles 133.75 96.65
石油加工、炼焦及核然料加工业
Processing of Petroleum, Coking and Nuclear Fuel Processing
2 734.19 92.01
化学原料及化学制品制造业 Manufacture of Raw Chemical Materials and Chemical Products
191.50 101.15
医药制造业 Manufacture of Medicines 533.13 88.10
化学纤维制造业 Manufacture of Chemical Fibers 165.51 98.36
橡胶和塑料制品业 Manufacture of Rubber 152.68 97.56
非金属矿物制品业 Manufacture of Non-metallic Mineral Products 174.38 98.22
黑色金属冶炼及压延加工业 Smelting and Pressing of Ferrous Metals 220.70 96.74
有色金属冶炼及压延加工业 Smelting and Pressing of Nonferrous Metals 116.85 102.32
金属制品业 Manufacture of Metal Products 177.81 98.00
通用设备制造业 Manufacture of General-purpose Machinery 202.06 97.97
专用设备制造业 Manufacture of Special-purpose Machinery 247.91 96.38
汽车制造业 Manufacfuer of Automobiles 143.99 98.82
铁路、船舶、航空航天和其他运输设备制造业
Manufacture of Railways Ships Aerospace and Other Transport Equipment
158.29 95.50
电气机械及器材制造业 Manufacture of Electrical Machinery and Equipment 162.41 96.80
计算机、通信和其他电子设备制造业
Manufacture of Communication Equipment, Computers and Other Electronic Equipment
303.19 96.67
仪器仪表制造业 Manufacture of Measuring Instruments 210.78 98.45
其他制造业 Other Manufacturing 262.88 98.81
废弃资源综合利用业 Recycling and Disposal of Waste 224.66 101.69
金属制品、机械和设备修理业 Manufacture of Metal Products, Machinery and Equipment Repair
287.12 95.80
电力、热力的生产和供应业 Production and Supply of Electric Power and Heat Power
2 241.75 99.94
燃气生产和供应业 Production and Supply of Gas 908.01 100.36
水的生产和供应业 Production and Supply of Water 728.90 98.10

91
4-8 续表 continued
成本费用利润率(%) After-Tax
Profits/Cost(%)
流动资产周转率(次) Turnover Times of Circulating Funds(time)
资产负债率(%)Assets-Liability Ratio
(%)
总资产贡献率(%)Ratio of Total Assets to Industrial Output Value
(%)
资本保值增值率(%)Ratio of Capital
Appreciation(%)
全员劳动生产率(元/人)Total Labor Productivity
(yuan/person)
30.59 1.19 14.65 80.90 103.03 7 878 091
7.40 1.62 45.73 10.21 106.98 176 975
4.95 1.35 52.54 8.70 122.24 98 784
4.55 1.66 53.00 10.10 68.58 94 511
1.46 1.39 72.61 6.48 53.34 115 993
3.79 1.12 57.59 6.42 134.39 101 214
2.46 1.62 49.39 5.30 90.07 99 781
10.37 1.10 46.03 9.01 123.37 139 790
3.67 1.10 72.09 5.50 110.06 103 336
42.06 1.58 23.62 49.68 114.00 4 005 139
5.94 1.04 49.50 6.50 109.41 175 531
30.00 0.72 42.61 13.44 119.01 574 024
3.60 2.83 41.79 10.45 106.93 107 056
4.17 1.62 55.10 8.12 104.90 109 864
5.82 0.94 51.47 5.92 142.44 144 844
4.12 1.26 58.81 5.58 94.10 238 666
1.64 1.92 86.63 4.12 140.67 78 197
6.00 1.35 54.15 9.67 113.69 137 511
7.99 1.17 53.62 9.52 118.41 167 490
13.59 1.12 50.15 13.02 125.36 197 123
1.00 0.81 81.27 2.19 102.31 157 550
2.78 1.20 49.36 3.71 93.09 151 272
5.90 1.17 52.18 6.55 110.43 126 259
6.20 1.45 62.24 9.63 115.46 342 659
11.16 1.00 50.82 10.22 114.04 163 610
15.39 1.64 49.65 19.18 137.92 179 849
11.74 1.71 67.90 10.32 99.00 177 521
13.41 0.99 50.51 11.30 117.19 272 297
14.85 2.54 53.35 13.67 103.53 3 458 002
23.25 2.04 44.07 14.31 283.82 1 171 444
44.97 1.04 46.63 12.53 111.84 800 781

92
4-9 规模以上国有工业企业主要经济指标(2017年)
MAIN ECONOMIC INDICATORS OF STATE-HOLDING INDUSTRIAL ENTERPRISES
ABOVE DESIGNATED SIZE(2017)单位:万元
项 目Item
企业单位数(个)
Number ofEnterprises
(unit)
工业总产值(当年价)
GrossIndustrial OutputValue (at current
prices)
总 计 Total 6 395 285
一、按登记注册类型分 Grouped by Registration
1. 内资企业 Domestic Investment Enterprise 6 395 285
国有企业 State-owned 6 395 285
集体企业 Collective-owned
股份合作企业 Cooperative Shares Enterprise
联营企业 Joint owned
有限责任公司 Companies Limited with Liabilities
股份有限公司 Companies Limited by Shares
私营企业 Private
其他内资企业 Others
2. 港、澳、台投资企业 Funded by Entrepreneur from Hongkong,Macao and Taiwan
3. 外商投资企业 Foreign Funded
二、按轻、重工业分 Grouped by Light and Heavy Industry
1. 轻工业 Light Industry 3 33 029
2. 重工业 Heavy Industry 3 362 256
三、按企业规模分 Grouped by Size of Enterprises
1. 大型企业 Large Enterprises 1 259 575
2. 中型企业 Medium-sized Enterprises 1 23 196
3. 小型企业 Small Enterprises 4 112 514
#纯小型企业 #Pure Small Enterprises 4 112 514
微型企业 Micro Enterprises
四、按工业行业大类分 Grouped by Sector
煤炭开采和洗选业 Mining and Washing of Coal
石油和天然气开采业 Extraction of Petroleum and Natural Gas
黑色金属矿采选业 Mining and Processing of Ferrous Metal Ores
有色金属矿采选业 Mining and Processing of Nonferrous Metal Ores
非金属矿采选业 Mining and Processing of Nonmetal Ores
开采专业及辅助性活动 Mining and Auxiliary Activities
其他采矿业 Mining and Processing of Other Ores
农副食品加工业 Processing of Food from Agricultural Products
食品制造业 Manufacture of Foods
酒、饮料和精制茶制造业 Manufacture of Wine, Beverages and Refined Tea

93
(10 000 yuan)
资产总计Total Assets
流动资产合计
Total CurrentAssets
固定资产净值
Net Valueof FixedAssets
主营业务收入PrincipalBusinessRevenue
利润总额TotalProfits
441 297 361 782 361 644 399 980 19 595
441 297 361 782 361 644 399 980 19 595
441 297 361 782 361 644 399 980 19 595
97 249 85 421 62 833 35 058 5 539
344 048 276 361 298 811 364 922 14 056
200 343 182 687 197 310 261 086 13 294
30 036 28 290 28 539 24 246 462
210 918 150 805 135 795 114 648 5 839
210 918 150 805 135 795 114 648 5 839

94
单位:万元
项 目Item
企业单位数(个)
Number ofEnterprises
(unit)
工业总产值(当年价)
GrossIndustrial OutputValue (at current
prices)
烟草制品业 Manufacture of Tobacco
纺织业 Manufacture of Textile
纺织服装、服饰业 Manufacture of Textile Wearing Apparel,Footware and Caps
皮革、毛皮、羽毛及其制品和制鞋业 Manufacture of Leather, Fur, Feather and Related Products
木材加工及木、竹、藤、棕、草制品业 Processing of Timber, Manufacture of Wood, Bamboo, Rattan, Palm Fiber & Straw Products
家具制造业 Manufacture of Furniture
造纸及纸制品业 Manufacture of Paper and Paper Products
印刷和记录媒介复制业 Printing and Record Medium Reproduction 3 33 029
文教、工美、体育和娱乐用品制造业 Manufacture of Cultural, Educational and Sports Articles
石油加工、炼焦及核然料加工业 Processing of Petroleum, Coking and Nuclear Fuel Processing
化学原料及化学制品制造业 Manufacture of Raw Chemical Materials and Chemical Products
医药制造业 Manufacture of Medicines
化学纤维制造业 Manufacture of Chemical Fibers
橡胶和塑料制品业 Manufacture of Rubber
非金属矿物制品业 Manufacture of Non-metallic Mineral Products
黑色金属冶炼及压延加工业 Smelting and Pressing of Ferrous Metals
有色金属冶炼及压延加工业 Smelting and Pressing of Nonferrous Metals
金属制品业 Manufacture of Metal Products
通用设备制造业 Manufacture of General-purpose Machinery
专用设备制造业 Manufacture of Special-purpose Machinery
汽车制造业 Manufacfuer of Automobiles
铁路、船舶、航空航天和其他运输设备制造业 Manufacture of Railways Ships Aerospace and Other Transport Equipment
电气机械及器材制造业 Manufacture of Electrical Machinery and Equipment
计算机、通信和其他电子设备制造业 Manufacture of Communication Equipment, Computers and Other Electronic Equipment 2 282 771
仪器仪表制造业 Manufacture of Measuring Instruments
其他制造业 Other Manufacturing
废弃资源综合利用业 Recycling and Disposal of Waste
金属制品、机械和设备修理业 Manufacture of Metal Products,Machinery and Equipment Repair
电力、热力的生产和供应业 Production and Supply of Electric Power and Heat Power 1 79 485
燃气生产和供应业 Production and Supply of Gas
水的生产和供应业 Production and Supply of Water

95
4-9 续表 continued(10 000 yuan)
资产总计Total Assets
流动资产合计
Total CurrentAssets
固定资产净值
Net Valueof FixedAssets
主营业务收入PrincipalBusinessRevenue
利润总额TotalProfits
97 249 85 421 62 833 35 058 5 539
230 379 210 976 225 849 285 331 13 756
113 669 65 385 72 962 79 591 300

96
4-10 规模以上集体工业企业主要经济指标(2017年)
MAIN ECONOMIC INDICATORS OF COLLECTIVE-OWNED INDUSTRIAL
ENTERPRISES ABOVE DESIGNATED SIZE (2017)单位:万元
项 目Item
企业单位数(个)
Number ofEnterprises
(unit)
工业总产值(当年价)
GrossIndustrial OutputValue (at current
prices)
总 计 Total 2 5 821
一、按登记注册类型分 Grouped by Registration
1. 内资企业 Domestic Investment Enterprise 2 5 821
国有企业 State-owned
集体企业 Collective-owned 2 5 821
股份合作企业 Cooperative Shares Enterprise
联营企业 Joint owned
有限责任公司 Companies Limited with Liabilities
股份有限公司 Companies Limited by Shares
私营企业 Private
其他内资企业 Others
2. 港、澳、台投资企业 Funded by Entrepreneur from Hongkong,Macao and Taiwan
3. 外商投资企业 Foreign Funded
二、按轻、重工业分 Grouped by Light and Heavy Industry
1. 轻工业 Light Industry 1 3 448
2. 重工业 Heavy Industry 1 2 373
三、按企业规模分 Grouped by Size of Enterprises
1. 大型企业 Large Enterprises
2. 中型企业 Medium-sized Enterprises 1 3 448
3. 小型企业 Small Enterprises 1 2 373
#纯小型企业 #Pure Small Enterprises 1 2 373
微型企业 Micro Enterprises
四、按工业行业大类分 Grouped by Sector
煤炭开采和洗选业 Mining and Washing of Coal
石油和天然气开采业 Extraction of Petroleum and Natural Gas
黑色金属矿采选业 Mining and Processing of Ferrous Metal Ores
有色金属矿采选业 Mining and Processing of Nonferrous Metal Ores
非金属矿采选业 Mining and Processing of Nonmetal Ores
开采专业及辅助性活动 Mining and Auxiliary Activities
其他采矿业 Mining and Processing of Other Ores
农副食品加工业 Processing of Food from Agricultural Products
食品制造业 Manufacture of Foods
酒、饮料和精制茶制造业 Manufacture of Wine, Beverages and Refined Tea
97
(10 000 yuan)
资产总计Total Assets
流动资产合计
Total CurrentAssets
固定资产净值
Net Valueof FixedAssets
主营业务收入PrincipalBusinessRevenue
利润总额TotalProfits
1 917 589 1 902 5 377 308
1 917 589 1 902 5 377 308
1 917 589 1 902 5 377 308
1 836 509 1 821 3 003 255
81 80 81 2 374 53
1 836 509 1 821 3 003 255
81 80 81 2 374 53
81 80 81 2 374 53

98
单位:万元
项 目Item
企业单位数(个)
Number ofEnterprises
(unit)
工业总产值(当年价)
GrossIndustrial OutputValue (at current
prices)
烟草制品业 Manufacture of Tobacco
纺织业 Manufacture of Textile
纺织服装、服饰业 Manufacture of Textile Wearing Apparel,Footware and Caps 1 3 448
皮革、毛皮、羽毛及其制品和制鞋业 Manufacture of Leather, Fur, Feather and Related Products
木材加工及木、竹、藤、棕、草制品业 Processing of Timber, Manufacture of Wood, Bamboo, Rattan, Palm Fiber & Straw Products
家具制造业 Manufacture of Furniture
造纸及纸制品业 Manufacture of Paper and Paper Products
印刷和记录媒介复制业 Printing and Record Medium Reproduction
文教、工美、体育和娱乐用品制造业 Manufacture of Cultural, Educational and Sports Articles
石油加工、炼焦及核然料加工业 Processing of Petroleum, Coking and Nuclear Fuel Processing
化学原料及化学制品制造业 Manufacture of Raw Chemical Materials and Chemical Products
医药制造业 Manufacture of Medicines
化学纤维制造业 Manufacture of Chemical Fibers
橡胶和塑料制品业 Manufacture of Rubber
非金属矿物制品业 Manufacture of Non-metallic Mineral Products
黑色金属冶炼及压延加工业 Smelting and Pressing of Ferrous Metals
有色金属冶炼及压延加工业 Smelting and Pressing of Nonferrous Metals
金属制品业 Manufacture of Metal Products
通用设备制造业 Manufacture of General-purpose Machinery
专用设备制造业 Manufacture of Special-purpose Machinery
汽车制造业 Manufacfuer of Automobiles
铁路、船舶、航空航天和其他运输设备制造业 Manufacture of Railways Ships Aerospace and Other Transport Equipment
电气机械及器材制造业 Manufacture of Electrical Machinery and Equipment
计算机、通信和其他电子设备制造业 Manufacture of Communication Equipment, Computers and Other Electronic Equipment
1 2 373
仪器仪表制造业 Manufacture of Measuring Instruments
其他制造业 Other Manufacturing
废弃资源综合利用业 Recycling and Disposal of Waste
金属制品、机械和设备修理业 Manufacture of Metal Products,Machinery and Equipment Repair
电力、热力的生产和供应业 Production and Supply of Electric Power and Heat Power
燃气生产和供应业 Production and Supply of Gas
水的生产和供应业 Production and Supply of Water
99
4-10 续表 continued(10 000 yuan)
资产总计Total Assets
流动资产合计
Total CurrentAssets
固定资产净值
Net Valueof FixedAssets
主营业务收入PrincipalBusinessRevenue
利润总额TotalProfits
1 836 509 1 821 3 003 255
81 80 81 2 374 53

100
4-11 规模以上股份有限工业企业主要经济指标(2017年)
MAIN ECONOMIC INDICATORS OF SHARE-HOLDING INDUSTRIAL
ENTERPRISES LIMITED ABOVE DESIGNATED SIZE(2017)单位:万元
项 目Item
企业单位数(个)
Number ofEnterprises
(unit)
工业总产值(当年价)
GrossIndustrial OutputValue (at current
prices)
总 计 Total 361 41 949 546
一、按登记注册类型分 Grouped by Registration
1. 内资企业 Domestic Investment Enterprise 361 41 949 546
国有企业 State-owned
集体企业 Collective-owned
股份合作企业 Cooperative Shares Enterprise
联营企业 Joint owned
有限责任公司 Companies Limited with Liabilities
股份有限公司 Companies Limited by Shares 361 41 949 546
私营企业 Private
其他内资企业 Others
2. 港、澳、台投资企业 Funded by Entrepreneur from Hongkong,Macao and Taiwan
3. 外商投资企业 Foreign Funded
二、按轻、重工业分 Grouped by Light and Heavy Industry
1. 轻工业 Light Industry 86 4 312 419
2. 重工业 Heavy Industry 275 37 637 127
三、按企业规模分 Grouped by Size of Enterprises
1. 大型企业 Large Enterprises 62 32 454 065
2. 中型企业 Medium-sized Enterprises 102 6 065 548
3. 小型企业 Small Enterprises 197 3 429 933
#纯小型企业 #Pure Small Enterprises 194 3 405 563
微型企业 Micro Enterprises 3 24 370
四、按工业行业大类分 Grouped by Sector
煤炭开采和洗选业 Mining and Washing of Coal
石油和天然气开采业 Extraction of Petroleum and Natural Gas
黑色金属矿采选业 Mining and Processing of Ferrous Metal Ores
有色金属矿采选业 Mining and Processing of Nonferrous Metal Ores
非金属矿采选业 Mining and Processing of Nonmetal Ores
开采专业及辅助性活动 Mining and Auxiliary Activities
其他采矿业 Mining and Processing of Other Ores
农副食品加工业 Processing of Food from Agricultural Products 3 138 288
食品制造业 Manufacture of Foods
酒、饮料和精制茶制造业 Manufacture of Wine, Beverages and Refined Tea

101
(10 000 yuan)
资产总计Total Assets
流动资产合计
Total CurrentAssets
固定资产净值
Net Valueof FixedAssets
主营业务收入PrincipalBusinessRevenue
利润总额TotalProfits
63 332 961 37 319 761 59 371 995 35 634 582 3 131 249
63 332 961 37 319 761 59 371 995 35 634 582 3 131 249
63 332 961 37 319 761 59 371 995 35 634 582 3 131 249
9 943 181 4 558 529 9 422 182 4 117 850 866 167
53 389 780 32 761 232 49 949 813 31 516 732 2 265 082
41 357 713 25 017 435 38 337 791 26 206 720 2 183 423
15 475 121 8 212 625 14 822 102 5 981 992 630 411
6 500 127 4 089 701 6 212 102 3 445 870 317 415
6 483 703 4 077 046 6 195 927 3 417 257 315 978
16 424 12 655 16 175 28 613 1 437
358 609 82 187 357 225 198 013 17 886

102
单位:万元
项 目Item
企业单位数(个)
Number ofEnterprises
(unit)
工业总产值(当年价)
GrossIndustrial OutputValue (at current
prices)
烟草制品业 Manufacture of Tobacco
纺织业 Manufacture of Textile
纺织服装、服饰业 Manufacture of Textile Wearing Apparel,Footware and Caps 4 354 490
皮革、毛皮、羽毛及其制品和制鞋业 Manufacture of Leather, Fur, Feather and Related Products 1 3 238
木材加工及木、竹、藤、棕、草制品业 Processing of Timber, Manufacture of Wood, Bamboo, Rattan, Palm Fiber & Straw Products 1 27 406
家具制造业 Manufacture of Furniture 2 95 187
造纸及纸制品业 Manufacture of Paper and Paper Products 2 71 540
印刷和记录媒介复制业 Printing and Record Medium Reproduction 2 471 922
文教、工美、体育和娱乐用品制造业 Manufacture of Cultural, Educational and Sports Articles
石油加工、炼焦及核然料加工业 Processing of Petroleum, Coking and Nuclear Fuel Processing 2 47 635
化学原料及化学制品制造业 Manufacture of Raw Chemical Materials and Chemical Products 11 466 479
医药制造业 Manufacture of Medicines 7 529 077
化学纤维制造业 Manufacture of Chemical Fibers
橡胶和塑料制品业 Manufacture of Rubber 16 307 150
非金属矿物制品业 Manufacture of Non-metallic Mineral Products 5 454 284
黑色金属冶炼及压延加工业 Smelting and Pressing of Ferrous Metals
有色金属冶炼及压延加工业 Smelting and Pressing of Nonferrous Metals 1 102 289
金属制品业 Manufacture of Metal Products 18 448 097
通用设备制造业 Manufacture of General-purpose Machinery 19 887 515
专用设备制造业 Manufacture of Special-purpose Machinery 34 3 333 487
汽车制造业 Manufacfuer of Automobiles 6 707 117
铁路、船舶、航空航天和其他运输设备制造业 Manufacture of Railways Ships Aerospace and Other Transport Equipment 1 12 221
电气机械及器材制造业 Manufacture of Electrical Machinery and Equipment 55 2 341 125
计算机、通信和其他电子设备制造业 Manufacture of Communication Equipment, Computers and Other Electronic Equipment 138 29 515 882
仪器仪表制造业 Manufacture of Measuring Instruments 26 861 360
其他制造业 Other Manufacturing 2 105 702
废弃资源综合利用业 Recycling and Disposal of Waste
金属制品、机械和设备修理业 Manufacture of Metal Products,Machinery and Equipment Repair
电力、热力的生产和供应业 Production and Supply of Electric Power and Heat Power 1 79 449
燃气生产和供应业 Production and Supply of Gas 1 558 603
水的生产和供应业 Production and Supply of Water 3 30 005

103
4-11 续表 continued(10 000 yuan)
资产总计Total Assets
流动资产合计
Total CurrentAssets
固定资产净值
Net Valueof FixedAssets
主营业务收入PrincipalBusinessRevenue
利润总额TotalProfits
1 035 637 439 860 1 016 518 292 100 39 804
3 865 3 852 3 862 3 845 125
30 942 13 515 30 599 24 502 878
177 843 122 106 170 882 111 538 15 290
458 545 112 527 447 760 82 354 10 275
1 351 868 551 919 1 294 260 408 546 136 399
64 558 43 809 62 601 41 404 3 927
2 416 522 1 304 740 2 373 718 495 962 46 156
1 957 253 692 541 1 846 184 472 712 153 351
513 570 281 925 440 585 313 426 13 807
710 109 461 522 683 779 428 362 39 900
149 783 100 518 142 372 98 641 12 597
433 719 308 830 343 725 440 620 37 813
1 751 087 1 187 633 1 717 429 770 258 95 298
4 959 061 3 103 722 4 692 326 3 166 245 641 725
1 019 042 726 778 965 300 704 079 10 751
29 233 25 276 29 155 12 221 1 376
6 289 785 2 694 748 6 082 481 2 456 486 238 997
35 414 937 23 189 315 32 701 731 23 435 190 1 371 526
2 389 528 1 274 733 2 329 087 960 131 121 784
227 753 117 228 204 112 92 575 22 101
42 830 26 146 22 376 79 449 10 235
1 477 393 410 697 1 350 933 516 629 83 104
69 489 43 633 62 995 29 292 6 148

104
4-12 规模以上“三资”工业企业主要经济指标 (2017年)
MAIN ECONOMIC INDICATORS OF FOREIGN-FUNDED INDUSTRIAL
ENTERPRISES ABOVE DESIGNATED SIZE(2017)单位:万元
项 目Item
企业单位数(个)
Number ofEnterprises
(unit)
工业总产值(当年价)
GrossIndustrial OutputValue (at current
prices)
总 计 Total 2 437 118 676 234
一、按登记注册类型分 Grouped by Registration
1. 内资企业 Domestic Investment Enterprise
国有企业 State-owned
集体企业 Collective-owned
股份合作企业 Cooperative Shares Enterprise
联营企业 Joint owned
有限责任公司 Companies Limited with Liabilities
股份有限公司 Companies Limited by Shares
私营企业 Private
其他内资企业 Others
2. 港、澳、台投资企业 Funded by Entrepreneur from Hongkong,Macao and Taiwan 1 819 79 411 208
3. 外商投资企业 Foreign Funded 618 39 265 026
二、按轻、重工业分 Grouped by Light and Heavy Industry
1. 轻工业 Light Industry 1 075 27 561 154
2. 重工业 Heavy Industry 1 362 91 115 080
三、按企业规模分 Grouped by Size of Enterprises
1. 大型企业 Large Enterprises 219 77 956 112
2. 中型企业 Medium-sized Enterprises 727 25 200 876
3. 小型企业 Small Enterprises 1 491 15 519 246
#纯小型企业 #Pure Small Enterprises 1 413 13 701 454
微型企业 Micro Enterprises 78 1 817 792
四、按工业行业大类分 Grouped by Sector
煤炭开采和洗选业 Mining and Washing of Coal
石油和天然气开采业 Extraction of Petroleum and Natural Gas 2 2 471 612
黑色金属矿采选业 Mining and Processing of Ferrous Metal Ores
有色金属矿采选业 Mining and Processing of Nonferrous Metal Ores
非金属矿采选业 Mining and Processing of Nonmetal Ores
开采专业及辅助性活动 Mining and Auxiliary Activities 1 19 634
其他采矿业 Mining and Processing of Other Ores
农副食品加工业 Processing of Food from Agricultural Products 18 1 467 022
食品制造业 Manufacture of Foods 14 286 387
酒、饮料和精制茶制造业 Manufacture of Wine, Beverages and Refined Tea 12 1 686 755

105
(10 000 yuan)
资产总计Total Assets
流动资产合计
Total CurrentAssets
固定资产净值
Net Valueof FixedAssets
主营业务收入PrincipalBusinessRevenue
利润总额TotalProfits
113 197 875 78 251 364 87 550 570 115 775 470 7 820 734
78 237 561 55 006 324 60 817 400 76 678 569 4 901 482
34 960 314 23 245 040 26 733 170 39 096 901 2 919 252
27 750 265 19 805 373 23 675 495 26 704 386 1 459 052
85 447 610 58 445 991 63 875 075 89 071 084 6 361 682
75 294 792 50 834 128 59 480 680 75 454 500 5 101 932
22 164 930 15 368 793 17 502 538 24 762 446 1 754 838
15 738 153 12 048 443 10 567 352 15 558 524 963 964
14 203 905 10 905 346 11 756 433 13 725 078 678 699
1 534 248 1 143 097 - 1 189 081 1 833 446 285 265
3 153 260 220 097 - 2 943 615 2 581 777 1 038 545
31 212 20 284 5 120 19 634 3 861
1 025 723 795 278 833 475 1 559 062 76 126
247 323 156 909 178 750 289 348 19 823
1 016 581 784 414 762 927 1 392 941 65 962

106
单位:万元
项 目Item
企业单位数(个)
Number ofEnterprises
(unit)
工业总产值(当年价)
GrossIndustrial OutputValue (at current
prices)
烟草制品业 Manufacture of Tobacco
纺织业 Manufacture of Textile 23 356 195
纺织服装、服饰业 Manufacture of Textile Wearing Apparel,Footware and Caps 84 1 121 732
皮革、毛皮、羽毛及其制品和制鞋业 Manufacture of Leather, Fur, Feather and Related Products 44 750 759
木材加工及木、竹、藤、棕、草制品业 Processing of Timber, Manufacture of Wood, Bamboo, Rattan, Palm Fiber & Straw Products 3 13 756
家具制造业 Manufacture of Furniture 39 602 171
造纸及纸制品业 Manufacture of Paper and Paper Products 58 645 878
印刷和记录媒介复制业 Printing and Record Medium Reproduction 69 1 009 840
文教、工美、体育和娱乐用品制造业 Manufacture of Cultural, Educational and Sports Articles 142 5 105 498
石油加工、炼焦及核然料加工业 Processing of Petroleum, Coking and Nuclear Fuel Processing 1 711 344
化学原料及化学制品制造业 Manufacture of Raw Chemical Materials and Chemical Products 67 1 636 903
医药制造业 Manufacture of Medicines 22 1 380 211
化学纤维制造业 Manufacture of Chemical Fibers 1 18 288
橡胶和塑料制品业 Manufacture of Rubber 260 5 140 447
非金属矿物制品业 Manufacture of Non-metallic Mineral Products 29 1 282 106
黑色金属冶炼及压延加工业 Smelting and Pressing of Ferrous Metals 6 107 246
有色金属冶炼及压延加工业 Smelting and Pressing of Nonferrous Metals 31 1 644 084
金属制品业 Manufacture of Metal Products 155 2 883 302
通用设备制造业 Manufacture of General-purpose Machinery 138 4 425 624
专用设备制造业 Manufacture of Special-purpose Machinery 153 3 505 450
汽车制造业 Manufacfuer of Automobiles 21 6 324 004
铁路、船舶、航空航天和其他运输设备制造业 Manufacture of Railways Ships Aerospace and Other Transport Equipment 36 963 259
电气机械及器材制造业 Manufacture of Electrical Machinery and Equipment 332 9 625 319
计算机、通信和其他电子设备制造业 Manufacture of Communication Equipment, Computers and Other Electronic Equipment 545 58 082 911
仪器仪表制造业 Manufacture of Measuring Instruments 83 1 524 255
其他制造业 Other Manufacturing 32 512 189
废弃资源综合利用业 Recycling and Disposal of Waste
金属制品、机械和设备修理业 Manufacture of Metal Products,Machinery and Equipment Repair 6 134 365
电力、热力的生产和供应业 Production and Supply of Electric Power and Heat Power 6 1 820 912
燃气生产和供应业 Production and Supply of Gas 1 659 819
水的生产和供应业 Production and Supply of Water 3 756 963

107
4-12 续表 continued(10 000 yuan)
资产总计Total Assets
流动资产合计
Total CurrentAssets
固定资产净值
Net Valueof FixedAssets
主营业务收入PrincipalBusinessRevenue
利润总额TotalProfits
271 322 204 898 187 758 352 161 6 147
863 351 648 522 718 452 1 142 648 20 926
688 835 462 643 588 177 745 208 47 465
5 521 4 375 4 496 13 756 -1 006
643 277 483 093 523 219 598 583 25 580
486 026 390 649 364 915 651 588 9 927
1 047 002 790 307 729 964 964 218 55 032
4 936 022 4 346 892 4 626 344 5 107 836 255 310
492 375 406 903 443 700 676 741 213 237
1 236 812 889 478 1 000 642 1 657 635 75 295
1 774 849 1 068 666 1 621 898 1 144 847 291 005
3 853 3 474 3 508 16 656 141
3 832 458 2 884 858 2 882 835 4 918 536 187 970
1 571 921 1 213 895 1 088 810 1 269 202 58 792
82 568 62 967 48 991 98 019 5 643
713 575 625 936 679 655 1 751 589 37 798
2 432 053 1 721 838 1 746 247 2 437 356 199 095
3 493 801 2 929 206 2 872 826 4 494 060 273 853
3 084 053 2 357 503 2 523 465 3 444 017 243 605
10 618 828 7 654 952 9 885 897 5 783 745 30 508
1 503 175 911 947 1 250 728 865 372 10 235
11 407 454 7 419 104 10 367 370 9 505 687 354 287
47 080 973 34 166 430 40 175 076 56 915 198 2 850 911
1 826 648 1 456 552 1 643 052 1 521 123 154 032
329 837 288 227 292 921 511 885 106 683
185 740 142 878 161 726 129 966 18 281
3 074 499 1 757 353 -725 613 1 809 224 609 883
648 779 192 605 303 887 611 181 152 650
3 388 172 788 237 2 702 968 794 675 323 136

108
4-13 规模以上私营工业企业主要经济指标(2017年)
MAIN ECONOMIC INDICATORS OF PRIVATE INDUSTRIAL ENTERPRISES ABOVE
DESIGNATED SIZE(2017)单位:万元
项 目Item
企业单位数(个)
Number ofEnterprises
(unit)
工业总产值(当年价)
GrossIndustrial OutputValue (at current
prices)
总 计 Total 4 104 65 716 991
一、按登记注册类型分 Grouped by Registration
1. 内资企业 Domestic Investment Enterprise 4 104 65 716 991
国有企业 State-owned
集体企业 Collective-owned
股份合作企业 Cooperative Shares Enterprise
联营企业 Joint owned
有限责任公司 Companies Limited with Liabilities
股份有限公司 Companies Limited by Shares
私营企业 Private 4 104 65 716 991
其他内资企业 Others
2. 港、澳、台投资企业 Funded by Entrepreneur from Hongkong,Macao and Taiwan
3. 外商投资企业 Foreign Funded
二、按轻、重工业分 Grouped by Light and Heavy Industry
1. 轻工业 Light Industry 1 342 18 108 302
2. 重工业 Heavy Industry 2 762 47 608 689
三、按企业规模分 Grouped by Size of Enterprises
1. 大型企业 Large Enterprises 75 18 752 305
2. 中型企业 Medium-sized Enterprises 580 17 715 673
3. 小型企业 Small Enterprises 3 449 29 249 013
#纯小型企业 #Pure Small Enterprises 3 316 28 571 453
微型企业 Micro Enterprises 133 677 560
四、按工业行业大类分 Grouped by Sector
煤炭开采和洗选业 Mining and Washing of Coal
石油和天然气开采业 Extraction of Petroleum and Natural Gas
黑色金属矿采选业 Mining and Processing of Ferrous Metal Ores
有色金属矿采选业 Mining and Processing of Nonferrous Metal Ores
非金属矿采选业 Mining and Processing of Nonmetal Ores
开采专业及辅助性活动 Mining and Auxiliary Activities
其他采矿业 Mining and Processing of Other Ores
农副食品加工业 Processing of Food from Agricultural Products 14 213 598
食品制造业 Manufacture of Foods 19 121 106
酒、饮料和精制茶制造业 Manufacture of Wine, Beverages and Refined Tea 4 25 972

109
(10 000 yuan)
资产总计Total Assets
流动资产合计
Total CurrentAssets
固定资产净值
Net Valueof FixedAssets
主营业务收入PrincipalBusinessRevenue
利润总额TotalProfits
69 549 326 51 919 912 64 702 371 63 139 971 3 814 458
69 549 326 51 919 912 64 702 371 63 139 971 3 814 458
69 549 326 51 919 912 64 702 371 63 139 971 3 814 458
20 561 227 16 337 902 19 550 387 17 162 653 857 010
48 988 099 35 582 010 45 151 984 45 977 318 2 957 448
22 529 102 14 189 321 20 164 621 16 893 140 1 769 160
19 383 488 14 628 993 18 295 219 16 913 970 1 120 112
27 636 736 23 101 598 26 242 531 29 332 861 925 186
25 707 147 21 939 952 24 332 745 28 631 913 891 067
1 929 589 1 161 646 1 909 786 700 948 34 119
221 204 181 871 212 117 218 492 9 699
135 250 114 401 124 411 122 384 - 306
59 090 39 077 52 486 44 364 51

110
单位:万元
项 目Item
企业单位数(个)
Number ofEnterprises
(unit)
工业总产值(当年价)
GrossIndustrial OutputValue (at current
prices)
烟草制品业 Manufacture of Tobacco
纺织业 Manufacture of Textile 31 412 875
纺织服装、服饰业 Manufacture of Textile Wearing Apparel,Footware and Caps 77 603 556
皮革、毛皮、羽毛及其制品和制鞋业 Manufacture of Leather, Fur, Feather and Related Products 49 308 135
木材加工及木、竹、藤、棕、草制品业 Processing of Timber, Manufacture of Wood, Bamboo, Rattan, Palm Fiber & Straw Products 15 110 173
家具制造业 Manufacture of Furniture 75 719 666
造纸及纸制品业 Manufacture of Paper and Paper Products 81 677 085
印刷和记录媒介复制业 Printing and Record Medium Reproduction 87 657 819
文教、工美、体育和娱乐用品制造业 Manufacture of Cultural, Educational and Sports Articles 163 4 297 387
石油加工、炼焦及核然料加工业 Processing of Petroleum, Coking and Nuclear Fuel Processing 3 41 436
化学原料及化学制品制造业 Manufacture of Raw Chemical Materials and Chemical Products 91 754 933
医药制造业 Manufacture of Medicines 14 345 041
化学纤维制造业 Manufacture of Chemical Fibers 3 36 463
橡胶和塑料制品业 Manufacture of Rubber 228 1 943 921
非金属矿物制品业 Manufacture of Non-metallic Mineral Products 81 811 202
黑色金属冶炼及压延加工业 Smelting and Pressing of Ferrous Metals 9 183 732
有色金属冶炼及压延加工业 Smelting and Pressing of Nonferrous Metals 32 2 729 734
金属制品业 Manufacture of Metal Products 243 1 813 625
通用设备制造业 Manufacture of General-purpose Machinery 220 2 627 223
专用设备制造业 Manufacture of Special-purpose Machinery 307 3 149 155
汽车制造业 Manufacfuer of Automobiles 22 403 882
铁路、船舶、航空航天和其他运输设备制造业 Manufacture of Railways Ships Aerospace and Other Transport Equipment 27 405 475
电气机械及器材制造业 Manufacture of Electrical Machinery and Equipment 668 9 945 388
计算机、通信和其他电子设备制造业 Manufacture of Communication Equipment, Computers and Other Electronic Equipment 1 367 30 363 934
仪器仪表制造业 Manufacture of Measuring Instruments 125 1 560 962
其他制造业 Other Manufacturing 42 420 222
废弃资源综合利用业 Recycling and Disposal of Waste 2 13 121
金属制品、机械和设备修理业 Manufacture of Metal Products,Machinery and Equipment Repair 4 16 911
电力、热力的生产和供应业 Production and Supply of Electric Power and Heat Power 1 3 265
燃气生产和供应业 Production and Supply of Gas
水的生产和供应业 Production and Supply of Water

111
4-13 续表 continued(10 000 yuan)
资产总计Total Assets
流动资产合计
Total CurrentAssets
固定资产净值
Net Valueof FixedAssets
主营业务收入PrincipalBusinessRevenue
利润总额TotalProfits
484 641 287 336 461 561 384 495 38 927
588 737 519 762 558 914 558 453 15 747
206 303 178 585 193 356 298 096 3 757
122 378 90 700 115 119 105 780 2 295
788 115 596 341 750 707 754 443 16 560
451 142 377 800 398 049 666 443 14 620
612 533 484 289 479 892 661 396 27 314
4 985 688 4 528 082 4 896 391 4 304 362 136 537
25 211 24 756 24 958 32 218 37
824 581 649 626 768 016 739 162 47 476
2 195 190 1 386 292 2 138 301 379 276 66 890
20 974 16 517 17 142 39 847 1 808
1 647 129 1 304 588 1 466 846 1 902 666 97 907
1 821 981 1 082 793 1 720 983 805 383 50 625
272 040 144 375 238 988 169 466 5 937
1 987 138 1 856 329 1 963 552 3 095 459 31 159
1 744 482 1 369 250 1 597 786 1 809 388 55 802
3 179 250 2 586 274 3 044 609 2 431 981 231 245
3 760 582 3 047 278 3 583 636 3 018 170 306 955
504 839 413 564 488 697 377 055 25 443
281 689 203 077 258 438 404 519 24 405
11 124 522 8 585 699 10 641 875 9 114 099 577 559
29 637 446 20 387 327 26 745 558 28 690 270 1 851 479
1 538 151 1 213 348 1 455 864 1 559 401 155 625
276 522 223 464 254 918 415 470 16 139
24 386 7 377 23 460 13 185 1 611
19 068 16 420 16 996 20 983 266
9 069 3 316 8 746 3 265 890

112
4-14 规模以上大中型工业企业主要经济指标(2017年)
MAIN ECONOMIC INDICATORS OF LARGE AND MEDIUM-SIZED
INDUSTRIAL ENTERPRISES ABOVE DESIGNATED SIZE(2017)单位:万元
项 目Item
企业单位数(个)
Number ofEnterprises
(unit)
工业总产值(当年价)
GrossIndustrial OutputValue (at current
prices)
总 计 Total 2 006 261 168 140
一、按登记注册类型分 Grouped by Registration
1. 内资企业 Domestic Investment Enterprise 1 060 158 011 152
国有企业 State-owned 2 282 771
集体企业 Collective-owned 1 3 448
股份合作企业 Cooperative Shares Enterprise
联营企业 Joint owned
有限责任公司 Companies Limited with Liabilities 238 82 737 343
股份有限公司 Companies Limited by Shares 164 38 519 612
私营企业 Private 655 36 467 978
其他内资企业 Others
2. 港、澳、台投资企业 Funded by Entrepreneur from Hongkong,Macao and Taiwan 692 68 865 526
3. 外商投资企业 Foreign Funded 254 34 291 462
二、按轻、重工业分 Grouped by Light and Heavy Industry
1. 轻工业 Light Industry 741 41 606 487
2. 重工业 Heavy Industry 1 265 219 561 653
三、按企业规模分 Grouped by Size of Enterprises
1. 大型企业 Large Enterprises 401 203 063 218
2. 中型企业 Medium-sized Enterprises 1 605 58 104 922
3. 小型企业 Small Enterprises
#纯小型企业 #Pure Small Enterprises
微型企业 Micro Enterprises
四、按工业行业大类分 Grouped by Sector
煤炭开采和洗选业 Mining and Washing of Coal
石油和天然气开采业 Extraction of Petroleum and Natural Gas 1 2 448 969
黑色金属矿采选业 Mining and Processing of Ferrous Metal Ores
有色金属矿采选业 Mining and Processing of Nonferrous Metal Ores
非金属矿采选业 Mining and Processing of Nonmetal Ores
开采专业及辅助性活动 Mining and Auxiliary Activities 1 98 187
其他采矿业 Mining and Processing of Other Ores
农副食品加工业 Processing of Food from Agricultural Products 9 1 472 280
食品制造业 Manufacture of Foods 10 382 149
酒、饮料和精制茶制造业 Manufacture of Wine, Beverages and Refined Tea 6 1 588 182

113
(10 000 yuan)
资产总计Total Assets
流动资产合计
Total CurrentAssets
固定资产净值
Net Valueof FixedAssets
主营业务收入PrincipalBusinessRevenue
利润总额TotalProfits
266 053 692 181 131 974 230 599 599 247 170 099 18 112 458
168 593 970 114 929 054 153 616 382 146 953 153 11 255 688
230 379 210 977 225 849 285 331 13 756
1 837 509 1 821 3 003 255
69 616 330 52 669 194 61 768 978 80 668 997 5 538 571
56 832 834 33 230 060 53 159 894 32 188 712 2 813 834
41 912 590 28 818 314 38 459 840 33 807 110 2 889 272
67 793 326 47 388 059 54 875 192 66 227 393 4 162 294
29 666 396 18 814 861 22 108 025 33 989 553 2 694 476
48 476 365 32 783 684 43 659 554 39 146 186 3 201 779
217 577 327 148 348 290 186 940 045 208 023 913 14 910 679
200 282 033 136 808 804 172 356 078 190 643 389 14 538 253
65 771 659 44 323 170 58 243 521 56 526 710 3 574 205
3 092 112 184 244 - 2 891 431 2 559 134 1 033 083
526 904 109 486 471 242 98 187 1 045
758 791 539 342 661 025 1 526 255 52 427
344 013 220 736 250 363 406 389 18 265
768 047 607 345 602 497 1 312 968 52 970

114
单位:万元
项 目Item
企业单位数(个)
Number ofEnterprises
(unit)
工业总产值(当年价)
GrossIndustrial OutputValue (at current
prices)
烟草制品业 Manufacture of Tobacco 1 630 363
纺织业 Manufacture of Textile 14 768 082
纺织服装、服饰业 Manufacture of Textile Wearing Apparel,Footware and Caps 71 2 101 454
皮革、毛皮、羽毛及其制品和制鞋业 Manufacture of Leather, Fur, Feather and Related Products 24 815 167
木材加工及木、竹、藤、棕、草制品业 Processing of Timber, Manufacture of Wood, Bamboo, Rattan, Palm Fiber & Straw Products 1 21 282
家具制造业 Manufacture of Furniture 37 1 019 976
造纸及纸制品业 Manufacture of Paper and Paper Products 21 562 730
印刷和记录媒介复制业 Printing and Record Medium Reproduction 37 1 536 113
文教、工美、体育和娱乐用品制造业 Manufacture of Cultural, Educational and Sports Articles 114 6 851 400
石油加工、炼焦及核然料加工业 Processing of Petroleum, Coking and Nuclear Fuel Processing 1 711 344
化学原料及化学制品制造业 Manufacture of Raw Chemical Materials and Chemical Products 20 988 710
医药制造业 Manufacture of Medicines 19 2 259 275
化学纤维制造业 Manufacture of Chemical Fibers 2 42 553
橡胶和塑料制品业 Manufacture of Rubber 135 5 188 645
非金属矿物制品业 Manufacture of Non-metallic Mineral Products 24 1 851 041
黑色金属冶炼及压延加工业 Smelting and Pressing of Ferrous Metals 1 96 608
有色金属冶炼及压延加工业 Smelting and Pressing of Nonferrous Metals 5 1 294 471
金属制品业 Manufacture of Metal Products 93 3 124 402
通用设备制造业 Manufacture of General-purpose Machinery 101 6 034 598
专用设备制造业 Manufacture of Special-purpose Machinery 144 7 756 484
汽车制造业 Manufacfuer of Automobiles 22 7 239 385
铁路、船舶、航空航天和其他运输设备制造业 Manufacture of Railways Ships Aerospace and Other Transport Equipment 15 1 040 963
电气机械及器材制造业 Manufacture of Electrical Machinery and Equipment 303 18 922 738
计算机、通信和其他电子设备制造业 Manufacture of Communication Equipment, Computers and Other Electronic Equipment 686 172 574 975
仪器仪表制造业 Manufacture of Measuring Instruments 58 2 795 854
其他制造业 Other Manufacturing 13 639 267
废弃资源综合利用业 Recycling and Disposal of Waste
金属制品、机械和设备修理业 Manufacture of Metal Products,Machinery and Equipment Repair 4 108 289
电力、热力的生产和供应业 Production and Supply of Electric Power and Heat Power 3 5 944 913
燃气生产和供应业 Production and Supply of Gas 2 1 218 422
水的生产和供应业 Production and Supply of Water 8 1 038 872

115
4-14 续表 continued(10 000 yuan)
资产总计Total Assets
流动资产合计
Total CurrentAssets
固定资产净值
Net Valueof FixedAssets
主营业务收入PrincipalBusinessRevenue
利润总额TotalProfits
598 230 529 490 439 809 626 822 66 326
670 843 424 003 590 826 681 075 61 275
2 183 390 1 338 509 2 019 262 1 865 928 109 632
775 882 531 667 666 948 806 023 47 689
20 022 18 211 19 832 21 282 -85
1 378 853 1 001 776 1 232 383 1 046 788 54 364
766 076 354 013 676 950 570 798 20 126
2 482 387 1 388 031 2 116 738 1 420 821 189 080
6 834 429 6 020 915 6 485 811 6 788 679 384 792
492 375 406 903 443 700 676 741 213 237
2 398 763 1 382 708 2 266 515 1 014 441 52 369
5 774 450 2 998 541 5 433 229 2 086 864 521 781
19 941 16 405 16 602 41 801 1 796
4 175 325 3 006 333 3 212 031 4 901 715 221 956
2 395 681 1 803 113 1 897 688 1 798 804 113 428
219 986 102 769 188 944 88 409 14
516 557 449 236 501 825 1 399 642 27 848
3 134 430 2 159 311 2 444 167 2 685 996 237 725
6 296 891 4 838 335 5 640 834 5 837 344 450 285
9 101 546 6 415 152 8 293 365 7 371 387 1 048 505
11 960 769 8 604 653 11 187 955 6 672 334 57 021
1 384 375 834 845 1 136 343 935 530 28 720
26 008 393 16 386 868 24 521 553 17 891 849 1 230 209
154 404 715 111 995 880 139 625 781 162 457 594 10 428 674
4 640 641 3 061 483 4 397 843 2 839 475 319 869
578 645 395 996 523 543 618 220 133 631
129 072 100 600 108 033 104 171 11 777
5 097 776 1 269 898 748 090 5 829 644 321 791
2 126 172 603 302 1 654 819 1 127 810 235 754
3 997 213 1 031 877 3 014 484 1 059 183 365 080

116
4-15 主要工业产品产量
PRODUCTION OF MAIN INDUSTRIAL PRODUCTS
年 份 Year
自来水 生产量
(万立方米) Tap Water
(10 000 cu.m)
发电量 (万千瓦小时)
Electricity (10 000 kwh)
小麦粉 (吨) Flour (ton)
啤 酒 (千升) Beer
(kiloliter)
卷 烟 (万支)
Cigarettes (10 000 pieces)
化学纤维 (吨)
Chemical Fiber (ton)
布 (万米) Cloth
(10 000 m)
1979 609
1980 437
1981 608
1982 1 152
1983 1 322
1984 1 261 27 570
1985 1 012 45 500
1986 7 051 3 130 52 225
1987 8 617 4 408 75 000 3 731 280
1988 13 060 2 508 16 794 252 255 4 190 925
1989 19 962 1 124 17 285 303 825 4 451 380
1990 19 736 31 065 21 155 380 820 5 050 631
1991 24 446 107 727 35 151 430 000 7 694 1 872
1992 23 785 195 007 44 302 57 256 442 500 7 637 30 484
1993 30 335 416 568 72 252 76 715 472 575 14 194 3 907
1994 43 425 1 739 463 75 536 82 128 472 915 19 768 2 674
1995 50 151 1 652 038 92 977 101 425 522 800 22 348 4 413
1996 53 691 1 873 881 219 700 125 302 594 120 17 576 106
1997 60 408 1 960 433 273 300 131 346 629 205 20 243 2 375
1998 62 585 2 150 147 250 000 152 279 756 095 13 271 1 716
1999 66 816 2 380 518 287 400 150 880 943 600 14 543 3 200
2000 75 547 2 618 545 229 000 250 417 1 044 490 14 368 2 356
2001 93 047 2 737 802 360 000 275 180 1 145 465 13 805 1 940
2002 113 315 3 515 696 346 000 334 590 1 175 810 13 821 2 247
2003 123 709 4 846 256 328 200 396 150 1 207 066 14 281 1 317
2004 119 510 5 220 982 313 300 477 766 1 277 700 15 083 2 697
2005 148 221 5 685 750 350 325 581 161 1 373 606 8 497 3 885
2006 141 218 5 472 103 351 289 574 554 1 454 359 4 913 2 210
2007 148 349 5 578 728 360 171 561 371 1 605 650 8 382 2 857
2008 150 221 5 844 154 368 498 473 027 1 656 000 1 115 2 541
2009 137 824 5 677 546 339 457 524 696 1 753 150 2 284 464
2010 153 218 5 778 497 324 406 597 184 1 817 025 7 627 1 904
2011 155 802 6 784 694 306 664 653 279 1 877 085 3 310 716
2012 159 944 7 001 845 442 134 623 503 1 919 220 4 548 775
2013 159 177 6 796 228 457 511 558 856 1 951 555 4 988 1 398
2014 162 415 6 959 097 355 599 513 932 1 937 700 6 037 1 474
2015 148 257 6 819 392 365 403 445 595 1 890 210 5 621 687
2016 171 064 6 942 888 369 579 423 210 1 860 920 4 579 664
2017 176 876 8 415 444 426 107 362 720 1 835 540 6 426 482
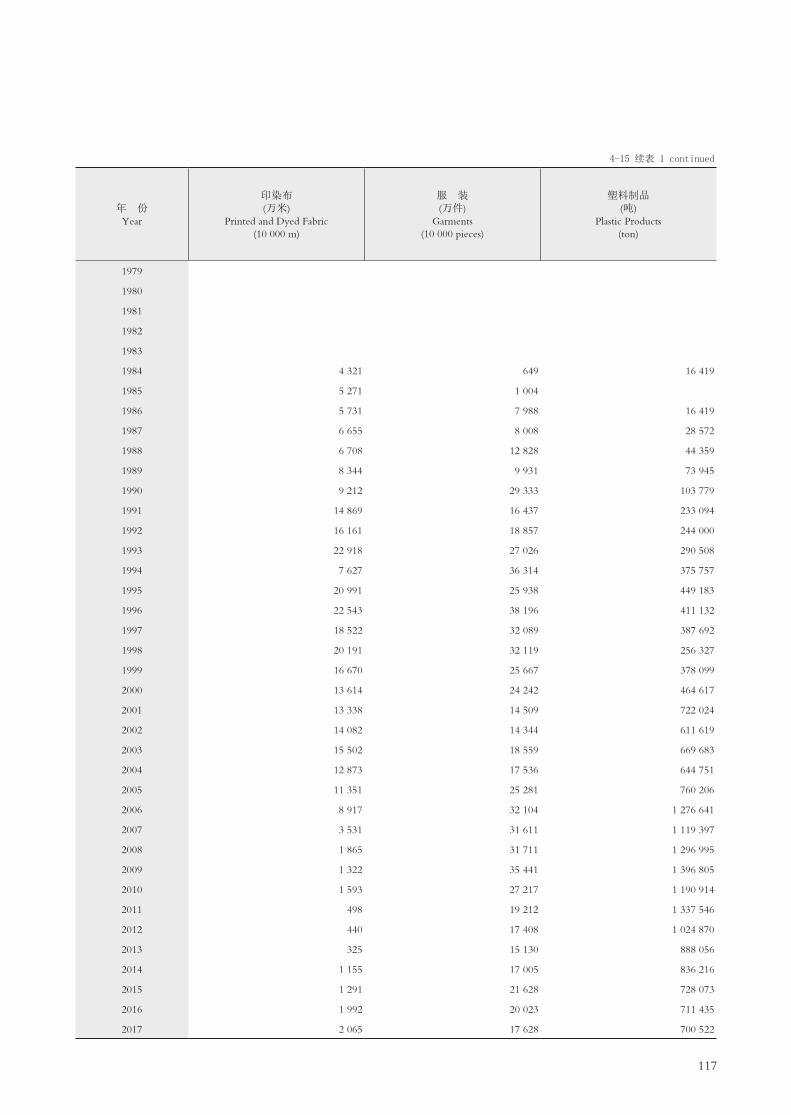
117
4-15 续表 1 continued
年 份 Year
印染布 (万米)
Printed and Dyed Fabric (10 000 m)
服 装 (万件)
Garments (10 000 pieces)
塑料制品 (吨)
Plastic Products (ton)
1979
1980
1981
1982
1983
1984 4 321 649 16 419
1985 5 271 1 004
1986 5 731 7 988 16 419
1987 6 655 8 008 28 572
1988 6 708 12 828 44 359
1989 8 344 9 931 73 945
1990 9 212 29 333 103 779
1991 14 869 16 437 233 094
1992 16 161 18 857 244 000
1993 22 918 27 026 290 508
1994 7 627 36 314 375 757
1995 20 991 25 938 449 183
1996 22 543 38 196 411 132
1997 18 522 32 089 387 692
1998 20 191 32 119 256 327
1999 16 670 25 667 378 099
2000 13 614 24 242 464 617
2001 13 338 14 509 722 024
2002 14 082 14 344 611 619
2003 15 502 18 559 669 683
2004 12 873 17 536 644 751
2005 11 351 25 281 760 206
2006 8 917 32 104 1 276 641
2007 3 531 31 611 1 119 397
2008 1 865 31 711 1 296 995
2009 1 322 35 441 1 396 805
2010 1 593 27 217 1 190 914
2011 498 19 212 1 337 546
2012 440 17 408 1 024 870
2013 325 15 130 888 056
2014 1 155 17 005 836 216
2015 1 291 21 628 728 073
2016 1 992 20 023 711 435
2017 2 065 17 628 700 522

118
4-15 续表 2 continued
年 份 Year
平板玻璃 (万重量箱) Plate Glass
(10 000 wt.cases)
铝材 (吨)
Aluminium (ton)
两轮脚踏自行车(万辆)
Bicycles (10 000 sets)
表 (万只)
Watches (10 000 units)
照相机 (万台)
Cameras (10 000 sets)
家用电风扇(万台)
Electric Fans (10 000 sets)
电话单机(万部)
Telephone Sets (10 000 units)
1979
1980
1981
1982
1983
1984 2.03 339.68 0.57 9.77
1985 4.31 3 447.58 40.87 123.22
1986 5 566 14.13 11 020.66 160.15 66.60 144.75
1987 58 6 805 41.29 11 688.16 44.24 248.01 498.94
1988 186 6 808 60.39 11 014.49 348.25 368.60 815.76
1989 230 7 399 82.01 8 318.00 159.96 323.31 926.10
1990 207 10 799 128.20 10 060.00 519.95 379.30 1 019.21
1991 238 14 361 257.78 9 646.00 423.12 407.58 1 360.80
1992 269 18 985 272.08 17 593.65 813.76 152.73 1 461.59
1993 265 21 540 288.41 22 875.39 1 247.89 433.59 2 292.50
1994 259 19 618 238.94 27 344.89 1 277.61 1 132.43 2 592.38
1995 272 19 633 215.56 24 542.05 252.57 907.35 3 902.49
1996 272 25 356 140.52 28 667.91 1 636.74 818.76 4 080.80
1997 385 23 874 123.38 16 629.66 1 531.48 845.18 4 506.65
1998 238 19 632 156.96 12 665.44 2 346.95 650.48 2 741.97
1999 273 24 408 210.99 11 593.89 1 551.80 544.74 2 711.82
2000 288 27 271 239.60 9 126.00 942.83 901.04 2 809.58
2001 217 29 379 172.66 7 908.37 642.03 753.09 2 965.67
2002 317 46 746 319.67 7 575.78 312.83 1 129.22 4 091.29
2003 322 56 805 636.70 7 100.70 428.95 1 202.76 4 947.64
2004 367 43 274 586.47 5 790.44 341.25 1 127.19 4 894.31
2005 725 43 823 665.75 7 183.60 1 207.88 958.54 6 579.87
2006 634 61 578 742.84 8 021.58 1 082.41 1 425.82 7 444.34
2007 940 6 1606 593.53 7 003.35 880.47 1 403.87 7 055.94
2008 1 009 7 7847 615.28 6 438.34 887.06 1 559.63 6 283.11
2009 759 48 087 398.60 7 991.26 793.86 1 457.34 5 312.90
2010 349 53 653 486.50 8 515.91 785.71 1 393.28 5 559.25
2011 669 35 014 438.43 7 155.89 631.57 1 975.53 3 229.52
2012 718 13 930 379.08 6 557.43 493.35 1 771.45 3 382.70
2013 658 8 580 347.82 6 399.28 404.51 1 809.56 3 139.46
2014 10 10 454 310.95 7 953.13 317.91 1 790.29 2 711.63
2015 5 6 292 279.77 7 659.11 223.61 1 639.74 2 362.04
2016 4 171 224.41 6 819.88 220.00 1 469.59 1 801.72
2017 4 382 258.41 6 208.91 180.33 1 248.95 1 372.17

119
4-15 续表 3 continued
年 份 Year
微型计算机设备 (台)
Micro Computers
(unit)
打印机 (万部) Printers
(10 000 units)
彩色电视机(万台) Color TV Sets(10 000 sets)
1979
1980
1981 0.70
1982 0.62
1983 71.00 1.23
1984 4 357 18.25
1985 1 575 48.10
1986 6 617 61.39
1987 2 728 101.64
1988 2 788 155.90
1989 15 955 137.38
1990 17 622 228.67
1991 62 440 288.08
1992 31 357 272.12
1993 27 836 269.33
1994 51 877 251.42
1995 194 131 194.84 373.50
1996 312 687 193.06 540.62
1997 568 681 433.50 519.63
1998 464 614 584.76 491.85
1999 834 476 315.68 834.13
2000 1 074 486 507.62 753.97
2001 1 642 151 695.00 659.50
2002 3 076 052 469.20 1 297.35
2003 4 866 723 570.30 1 820.33
2004 7 350 491 592.73 1 857.02
2005 11 435 877 984.50 1 964.43
2006 13 633 633 835.33 2 071.14
2007 8 947 600 1 041.78 1 803.85
2008 9 662 828 1 452.97 2 003.47
2009 18 023 372 1 493.84 1 910.03
2010 34 032 969 1 973.98 2 043.61
2011 41 718 350 1 810.97 2 203.07
2012 52 285 567 2 266.73 3 237.51
2013 19 100 994 1 721.10 3 320.12
2014 26 073 252 1 607.62 3 714.14
2015 27 793 649 1 304.84 3 545.93
2016 29 567 574 1 203.61 3 883.49
2017 27 067 302 874.06 3 695.43

120
4-15 续表 4 continued
年 份 Year
电子元件 (万只)
Electronic Units
(10 000 units)
硬盘存储器(万部)
Hard Drives (10 000 units)
集成电路(万块)
Semiconductor Integrated
Circuit(10 000 units)
程控交换机 (万线)
Telephone Exchanges
(10 000 lines)
1979
1980
1981
1982
1983
1984
1985
1986 15 584
1987 7 823
1988 73 316
1989 112 921 513
1990 309 649 998
1991 332 657 1 357
1992 522 291 1 164
1993 708 147 1 520 105.30
1994 1 561 900 2 263 209.70
1995 9 681 839 199.47 14 558 269.13
1996 1 403 557 440.86 22 471 331.74
1997 1 491 620 841.39 14 346 647.35
1998 1 390 107 770.54 23 976 1 515.69
1999 262 057 699.36 64 232 1 962.38
2000 527 216 867.07 87 598 3 535.33
2001 746 630 1 116.60 96 122 2 994.30
2002 1 334 537 480.04 134 966 1 856.47
2003 1 294 335 766.60 182 340 2 919.57
2004 549 722 831.71 255 504 1 976.65
2005 2 600 991 2 267.05 268 006 2 644.04
2006 10 104 734 2 035.33 604 302 1 625.75
2007 11 445 606 3 746.12 619 532 1 747.76
2008 9 138 530 5 225.41 828 381 1 960.98
2009 10 557 452 5 509.84 737 265 1 745.46
2010 21 862 763 6 866.21 1 240 820 1 526.23
2011 21 382 825 7 149.85 1 589 988 2 155.78
2012 17 486 985 8 218.81 1 424 912 1 213.55
2013 17 415 795 6 850.58 1 455 794 1 645.30
2014 14 921 810 6 264.78 1 481 497 1 527.43
2015 11 191 275 4 440.19 1 311 268 1 179.82
2016 12 516 547 4 194.02 1 810 728 1 030.74
2017 14 055 332 2 146.46 2 185 951 752.01

121
4-16 全社会能耗水平
ENERGY CONSUMPTION LEVEL OF THE WHOLE SOCIETY
年 份 Year
单位GDP能耗 Energy Consumption per Unit of GDP
单位工业增加值能耗 Energy Consumption per Unit of
Value-added of Industry
单位GDP电耗 Electricity Consumption per Unit of GDP
指标值(吨标准煤/万元)
Equivalent value (ton of SCE/ 10 000 yuan)
增长速度 Growth Rate
(%)
指标值(吨标准煤/万元)
Equivalent value (ton of SCE/ 10 000 yuan)
增长速度 Growth Rate
(%)
指标值(千瓦时/万元)Equivalent value
(Kwh/10 000 yuan)
增长速度 Growth Rate
(%)
2005 0.593 0.598 889.10
2006 0.576 -2.81 0.572 -3.04 844.10 -5.06
2007 0.560 -2.76 0.551 -3.76 848.80 0.54
2008 0.544 -2.90 0.530 -4.46 785.50 -7.46
2009 0.529 -2.76 0.511 -3.59 712.37 -9.33
2010 0.513 -2.94 0.492 -3.72 720.33 1.12
2011 0.472 -4.39 -24.02 -4.69
2012 0.451 -4.51 -12.68 -3.28
2013 0.428 -5.12 -9.49 -8.30
2014 -4.35 -8.45 -0.65
2015 -3.26 -11.07 -5.01
2016 -4.21 -4.98 -4.17
2017 -4.23 -0.75 -4.82
注:单位GDP能耗数据2005-2009年采用的GDP为2005年可比价,2010-2015年采用的是2010年可比价,2016年及以后采用的是2015年可比价。Note:The data of Energy Consumption per Unit of GDP from 2005 to 2009 are calculated at 2005 constant prices of GDP,from 2010 to 2015 at 2010 constant prices of GDP,2016 at 2015 constant prices of GDP,from 2016 at 2015 constant prices of GDP.

122
4-17 主要能源按工业行业分组消费量(2017年)
CONSUMPTION OF ENERGY BY SECTOR(2017)
单位:吨 (ton)
项 目 Item
原 煤 Coal
原 油 Crude Oil
汽 油 Gasoline
煤 油 Kerosene
全部规模以上工业企业 Total Consumption 9 142 427.38 175 986.30 71 996.72 466.94
一、按轻、重工业分 Grouped by Light and Heavy Industry
1. 轻工业 Light Industry 2 000.00 21 222.84 290.20
2. 重工业 Heavy Industry 9 140 427.38 175 986.30 50 773.88 176.74
二、按工业行业大类分 Grouped by Sector
(一)采矿业 Mining and Quarrying 175 986.30 25.39
煤炭开采和洗选业 Mining and Washing of Coal
石油和天然气开采业 Extraction of Petroleum and Natural Gas 175 986.30 2.93
黑色金属矿采选业 Mining and Processing of Ferrous Metal Ores
有色金属矿采选业 Mining and Processing of Nonferrous Metal Ores
非金属矿采选业 Mining and Processing of Nonmetal Ores
开采专业及辅助性活动 Mining and Auxiliary Activities 22.46
其他采矿业 Mining and Processing of Other Ores
(二)制造业 Manufacturing 4 459.85 70 058.10 466.94
农副食品加工业 Processing of Food from Agricultural Products 1 615.00 314.12
食品制造业 Manufacture of Foods 113.64
酒、饮料和精制茶制造业 Manufacture of Wine, Beverages and Refined Tea 134.24
烟草制品业 Manufacture of Tobacco 108.61
纺织业 Manufacture of Textile 315.77
纺织服装、服饰业 Manufacture of Textile Wearing Apparel,Footware and Caps
1 202.43
皮革、毛皮、羽毛及其制品和制鞋业 Manufacture of Leather, Fur, Feather and Related Products
565.89
木材加工及木、竹、藤、棕、草制品业 Processing of Timber, Manufacture of Wood, Bamboo, Rattan, Palm Fiber & Straw Products
162.95
家具制造业 Manufacture of Furniture 1 165.15
造纸及纸制品业 Manufacture of Paper and Paper Products 385.00 1 172.78
印刷和记录媒介复制业 Printing and Record Medium Reproduction 2 017.94
注: 本表使用新的《国民经济行业分类》(GB/T 4754-2017)Note:Data in this table are classified according to the new Industry Classification for National Economic Activities(GB/T 4754-2017).

123
单位:吨 4-17 续表 1 continued(ton)
项 目 Item
原 煤 Coal
原 油 Crude
Oil
汽 油 Gasoline
煤 油 Kerosene
文教、工美、体育和娱乐用品制造业 Manufacture of Cultural, Educational and Sports Articles 2 573.19
石油、煤炭及其他燃料加工业 Petroleum, Coal and Other Fuel Processing Industry 205.18
化学原料及化学制品制造业 Manufacture of Raw Chemical Materials and Chemical Products 2 236.15 1 985.41 284.00
医药制造业 Manufacture of Medicines 342.31
化学纤维制造业 Manufacture of Chemical Fibers 8.55
橡胶和塑料制品业 Manufacture of Rubber 5 484.35 1.40
非金属矿物制品业 Manufacture of Non-metallic Mineral Products 1 028.47
黑色金属冶炼及压延加工业 Smelting and Pressing of Ferrous Metals 131.34
有色金属冶炼及压延加工业 Smelting and Pressing of Nonferrous Metals 759.32
金属制品业 Manufacture of Metal Products 215.20 3 253.36 38.32
通用设备制造业 Manufacture of General-purpose Machinery 6 463.05 70.99
专用设备制造业 Manufacture of Special-purpose Machinery 8.50 7 114.02 0.30
汽车制造业 Manufacfuer of Automobiles 1 651.72 8.85
铁路、船舶、航空航天和其他运输设备制造业Manufacture of Railways Ships Aerospace and Other Transport Equipment
328.25 2.40
电气机械及器材制造业 Manufacture of Electrical Machinery and Equipment 9 413.48
计算机、通信和其他电子设备制造业 Manufacture of Communication Equipment, Computers and Other Electronic Equipment
19 467.38 58.28
仪器仪表制造业 Manufacture of Measuring Instruments 2 052.37 2.40
其他制造业 Other Manufacturing 449.55
废弃资源综合利用业 Recycling and Disposal of Waste
金属制品、机械和设备修理业 Manufacture of Metal Products,Machinery and Equipment Repair
73.28
(三)电力、燃气及水的生产和供应业 Production and Distribution of Electricity Heat,Gas and Water 9 137 967.53 1 913.23
电力、热力的生产和供应业 Production and Supply of Electric Power and Heat Power 9 137 967.53 821.32
燃气生产和供应业 Production and Supply of Gas 136.46
水的生产和供应业 Production and Supply of Water 955.45

124
单位:吨 4-17 续表 2 continued(ton)
项 目 Item
柴 油 Diesel Oil
燃料油 Fuel Oil
液化石 油气
Liquefied Petroleum
Gas
天然气 (万立方米) Natural Gas
(10 000 cu.m)
电 力 (万千瓦时)
Electricity (10 000 Kwh)
全部规模以上工业企业 Total Consumption 160 560.28 2 272.40 10 852.55 320 219.19 3 252 827.87
一、按轻、重工业分Grouped by Light and Heavy Industry
1. 轻工业 Light Industry 26 427.32 173.18 6 454.81 9 832.57 768 276.39
2. 重工业 Heavy Industry 134 132.96 2 099.22 4 397.74 310 386.62 2 484 551.48
二、按工业行业大类分 Grouped by Sector
(一)采矿业 Mining and Quarrying 59 177.06 823.00 14 786.32 702.62
煤炭开采和洗选业 Mining and Washing of Coal
石油和天然气开采业 Extraction of Petroleum and Natural Gas 57 247.00 823.00 14 786.32 672.48
黑色金属矿采选业 Mining and Processing of Ferrous Metal Ores
有色金属矿采选业 Mining and Processing of Nonferrous Metal Ores
非金属矿采选业 Mining and Processing of Nonmetal Ores
开采专业及辅助性活动 Mining and Auxiliary Activities 1 930.06 30.14
其他采矿业 Mining and Processing of Other Ores
(二)制造业 Manufacturing 99 317.17 1 449.40 10 840.45 19 817.77 2 728 775.00
农副食品加工业 Processing of Food from Agricultural Products
870.64 218.56 653.98 17 288.10
食品制造业 Manufacture of Foods 408.43 249.07 962.55 11 832.58
酒、饮料和精制茶制造业 Manufacture of Wine, Beverages and Refined Tea
124.65 84.30 1 624.88 10 975.05
烟草制品业 Manufacture of Tobacco 5.17 133.51 1 593.07
纺织业 Manufacture of Textile 548.98 5.60 1.76 624.52 19 428.02
纺织服装、服饰业 Manufacture of Textile Wearing Apparel,Footware and Caps
1 304.43 0.60 310.07 27 611.48
皮革、毛皮、羽毛及其制品和制鞋业 Manufacture of Leather, Fur, Feather and Related Products
347.91 12.42 96.11 12 890.00
木材加工及木、竹、藤、棕、草制品业 Processing of Timber, Manufacture of Wood, Bamboo, Rattan, Palm Fiber & Straw Products
391.06 369.09 30.61 2 711.58
家具制造业 Manufacture of Furniture 1 066.44 605.84 13.24 20 381.32
造纸及纸制品业 Manufacture of Paper and Paper Products 4 397.87 452.80 558.33 27 882.51
印刷和记录媒介复制业 Printing and Record Medium Reproduction
1 670.55 19.71 192.80 46 971.74

125
单位:吨 4-17 续表 3 continued(ton)
项 目 Item
柴 油 Oiesel Oil
燃料油 Fuel Oil
液化石 油气
Liquefied Petroleum
Gas
天然气(万立方米)Natural Gas (10 000 cu.m)
电 力 (万千瓦时)
Electricity (10 000 Kwh)
文教、工美、体育和娱乐用品制造业 Manufacture of Cultural, Educational and Sports Articles 2 056.39 55.44 201.40 517.43 58 727.47
石油、煤炭及其他燃料加工业 Petroleum, Coal and Other Fuel Processing Industry 55.17 18.10 187.75
化学原料及化学制品制造业 Manufacture of Raw Chemical Materials and Chemical Products
3 745.71 46.42 134.39 45 720.51
医药制造业 Manufacture of Medicines 415.69 1 557.05 24 523.68
化学纤维制造业 Manufacture of Chemical Fibers 224.44 105.00 2 639.22
橡胶和塑料制品业 Manufacture of Rubber 8 488.34 1 129.90 2 255.47 254 003.61
非金属矿物制品业 Manufacture of Non-metallic Mineral Products
34 656.06 26.54 100.80 735.08 96 340.13
黑色金属冶炼及压延加工业 Smelting and Pressing of Ferrous Metals 48.89 858.23 7 640.88
有色金属冶炼及压延加工业 Smelting and Pressing of Nonferrous Metals 1 581.64 600.13 1.94 851.04 15 999.44
金属制品业 Manufacture of Metal Products 5 360.80 91.08 1 284.51 1 721.16 136 785.56
通用设备制造业 Manufacture of General-purpose Machinery 4 478.37 773.47 306.19 73 076.63
专用设备制造业 Manufacture of Special-purpose Machinery 2 927.93 124.94 284.01 199.79 98 354.55
汽车制造业 Manufacfuer of Automobiles 781.78 127.34 850.26 53 351.76
铁路、船舶、航空航天和其他运输设备制造业
Manufacture of Railways Ships Aerospace and Other Transport Equipment
7 109.56 2 945.38 996.14 28 940.30
电气机械及器材制造业 Manufacture of Electrical Machinery and Equipment
5 350.22 1.70 594.39 637.86 338 722.45
计算机、通信和其他电子设备制造业 Manufacture of Communication Equipment, Computers and Other Electronic Equipment
9 739.53 543.37 1 079.26 2 814.64 1 233 465.39
仪器仪表制造业 Manufacture of Measuring Instruments 553.25 2.40 18.95 45 667.13
其他制造业 Other Manufacturing 346.38 31.24 40.40 9 094.24
废弃资源综合利用业 Recycling and Disposal of Waste 295.00
金属制品、机械和设备修理业 Manufacture of Metal Products,Machinery and Equipment Repair
485.33 5 673.85
(三)电力、燃气及水的生产和供应业 Production and Distribution of Electricity Heat,Gas and Water
2 066.05 12.10 285 615.10 523 350.25
电力、热力的生产和供应业 Production and Supply of Electric Power and Heat Power
1 435.22 283 302.35 406 532.77
燃气生产和供应业 Production and Supply of Gas 298.35 2 036.75 9 939.92
水的生产和供应业 Production and Supply of Water 332.48 12.10 276.00 106 877.56

126
4-18 综合能源平衡表
OVERALL ENERGY BALANCE SHEET
单位:万吨标准煤 (10 000 tons of SCE)
项 目 Item
2011 2012 2013 2014 2015 2016 2017
可供本地区消费的能源量 Total Energy Available for Consumption by Locality 3415.15 3507.01 3594.42 3711.72 3 909.91 4 080.91 4 272.64
年初库存量 Stock at the Year-beginning 189.71 187.37 188.61 172.85 189.17 183.55 148.19
一次能源生产量 Primary Energy Output 2769.58 2541.63 2669.65 2761.70 3 007.01 2 999.29 2 919.57
外省调入量 Allocation from Other Provinces 3334.15 3486.23 3523.55 3685.25 3 515.37 3 575.25 3 728.24
进口量 Imports 161.36 132.19 129.83 134.79 400.47 350.08 426.57
境内轮船和飞机在境外加油量 Petroleum Consumed by Chinese Airplanes and Ships Abroad
2.73 2.97 3.17 2.54 3.10 12.01 15.12
本省调出量(-) Allocation over Other Provinces(-) -2770.67 -2543.19 -2637.41 -2756.28 -2 928.88 -2 829.85 -2 785.17
出口量(-) Exports(-) -63.30 -91.22 -89.31 -80.49 -76.41 -35.91 -29.16
境外轮船和飞机在境内加油量(-) Petroleum Consumed by Foreign Airplanes and Ships in China(-)
-21.02 -20.38 -20.82 -19.48 -16.36 -24.80 -15.05
年末库存量(-) Stock at the Year-end(-) -187.37 -188.61 -172.85 -189.17 -183.55 -148.72 -135.67
加工转换投入(-)产出(+)量 Input Output in Processing and Transformation -0.11 -0.03 -0.13 -0.18 -0.22
火力发电 Thermal Power
供热 Heating -0.11 -0.03 -0.13 -0.18 -0.22
洗选煤 Coal Washing
炼焦 Coking
炼油 Petroleum Refining
制气 Gas Production
回收能 Recovery of Energy

127
单位:万吨标准煤 4-18 续表 (10 000 tons of SCE)
项 目 Item
2011 2012 2013 2014 2015 2016 2017
损失量 Losses 59.94 93.74 96.01 95.19 73.08 84.29 99.70
#运输和输配损失 Losses in Transmission 59.94 93.74 96.01 95.19 73.08 84.29 99.70
终端消费量 End-use 3355.10 3413.24 3498.41 3616.53 3836.70 3 996.43 4 172.72
第一产业 Primary Industry 7.17 6.48 0.92 11.13 10.86 15.08 8.11
农、林、牧、渔业 Farming, Forestry, Animal Husbandry and Fishery
7.17 6.48 0.92 11.13 10.86 15.08 8.11
第二产业 Secondary Industry 1411.16 1410.34 1487.16 1685.27 1697.91 1 632.88 1 603.45
工业 Industry 1375.95 1375.03 1442.67 1640.22 1651.18 1 580.90 1 567.96
#用作原材料、燃料 As Raw Materials and Fuel 8.16 1.64 1.64 0.99 1.08 0.94 0.23
建筑业 Construction 35.22 35.31 44.49 45.06 46.73 51.99 35.50
第三产业 Tertiary Industry 1473.70 1469.17 1440.91 1337.70 1512.50 1 662.84 1 817.08
交通运输仓储及邮电通信业 Transport, Storage, Postal and Telecommunication Services
740.47 708.14 713.11 629.76 732.83 808.80 881.62
批发和零售贸易业、餐饮业 Wholesale and Retail Trade and Catering
402.67 404.37 387.89 373.27 420.53 456.94 468.50
其他 ServicesOthers 330.56 356.66 339.92 334.67 359.14 397.10 466.96
生活消费 Residential Consumption 463.07 527.25 569.42 582.42 615.43 685.63 744.09
城镇 Urban Areas 463.07 527.25 569.42 582.42 615.43 685.63 742.80
乡村 Rural Areas 1.29
消费量合计 Total Energy Consumption 3415.15 3507.01 3594.42 3711.72 3909.91 4 080.91 4 272.64
128
4-19 各区单位GDP能耗增长速度
GROWTH RATE OF ENERGY CONSUMPTION PER UNIT OF GDP BY DISTRICT
单位:% (%)
地 区 Region
2009 2010 2011 2012 2013 2014 2015 2016 2017
全 市 Total -2.76 -2.94 -4.39 -4.51 -5.12 -4.35 -3.26 -4.21 -4.23
福田区 Futian -2.76 -2.82 -3.45 -3.75 -4.24 -3.54 -2.50 -3.73 -3.80
罗湖区 Luohu -2.56 -2.93 -3.21 -3.43 -3.81 -3.30 -2.49 -3.73 -3.80
盐田区 Yantian -2.58 -4.05 -4.37 -4.62 -5.27 -4.51 -3.47 -4.37 -4.48
南山区 Nanshan -2.76 -2.67 -4.36 -4.62 -5.27 -4.51 -3.42 -4.37 -4.48
宝安区 Baoan -2.98 -3.93 -4.61 -4.76 -6.02 -5.10 -3.83 -4.45 -4.45
龙岗区 Longgang -2.98 -3.33 -4.61 -4.79 -5.71 -4.81 -3.88 -4.45 -4.40
龙华区 Longhua -4.97 -4.30 -3.23 -4.44 -4.40
坪山区 Pingshan -4.28 -4.46 -5.09 -4.38 -3.35 -4.20 -4.30
光明新区 Guangming -4.41 -4.42 -5.19 -4.39 -3.21 -4.20 -4.30
大鹏新区 Dapeng -5.08 -4.32 -3.15 -4.32 -4.40
深汕特别合作区ShenshanSpecial Cooperation Zone
-8.32
注: 1、2009、2010年宝安区数据含光明、龙华新区,龙岗区数据含坪山、大鹏新区。 Note:The data of Guangming and Longhua are included in Baoan;The data of Pingshan and Dapeng are included in Longgang in 2009-2010. 2、2011、2012年宝安区数据含龙华新区,龙岗区数据含大鹏新区。 The data of Longhua are included in Baoan;The data of Dapeng are included in Longgang in 2011-2012.
129
4-20 能源加工转换效率
EFFICIENCY OF ENERGY CONVERSION
单位:% (%)
年 份 Year
火力发电Thermal Power Generation
供热Heating
2005 40.23
2006 40.16
2007 39.74
2008 40.26
2009 41.78
2010 43.54
2011 43.26 69.18
2012 42.54 70.22
2013 41.53
2014 42.18
2015 42.30 69.53
2016 43.10 63.90
2017 43.50 68.00

130
4-21 能源消费弹性系数
ELASTICITY RATIO OF ENERGY CONSUMPTION
年 份 Year
能源消费比上年增长 (%)Growth Rate of
Energy Consumption over Preceding
Year(%)
电力消费比上年增长(%)Growth Rate of Electricity
Consumption over Preceding Year(%)
地区生产总值比上年增长(%)Growth Rate of Gross Domestic
Product(GDP) over Preceding Year(%)
能源消费弹性系数Elasticity Ratio
of Energy Consumption
电力消费弹性系数Elasticity Ratio of Electricity Consumption
2005 9.8 12.8 15.3 0.64 0.84
2006 13.3 10.7 16.7 0.80 0.64
2007 11.6 16.5 14.8 0.79 1.12
2008 8.8 2.8 12.3 0.72 0.23
2009 7.8 0.3 11.3 0.69 0.03
2010 9.1 13.3 12.2 0.74 1.09
2011 4.5 4.9 10.0 0.45 0.49
2012 2.7 3.7 10.2 0.26 0.37
2013 2.5 1.1 10.6 0.24 0.10
2014 3.3 8.1 8.8 0.37 0.92
2015 5.3 2.3 8.9 0.60 0.26
2016 4.4 4.4 9.1 0.48 0.49
2017 4.2 3.6 8.8 0.48 0.40
131
主要统计指标解释
工业 指从事自然资源的开采,对采掘品和农产品进行加工和再加工的物质生产部门。具体包括:(1)对
自然资源的开采,如采矿、晒盐、森林采伐等(但不包括禽兽捕猎和水产捕捞);(2)对农副产品的加工、再加
工,如粮油加工、食品加工、轧花、缫丝、纺织、制革等;(3)对采掘品的加工、再加工,如炼铁、炼钢、化工
生产、石油加工、机器制造、木材加工等,以及电力、自来水、煤气的生产和供应等;(4)对工业品的修理、翻
新,如机器设备的修理、交通运输工具(包括小卧车)的修理等。
1984年以前农村的村及村以下办工业归属农业,1984年以后划归工业。
轻工业 指主要提供生活消费品和制作手工工具的工业。按其所使用的原料不同,可分为两大类:(1)以
农产品为原料的轻工业,是指直接或间接以农产品为基本原料的轻工业。主要包括食品制造、饮料制造、烟草
加工、纺织、缝纫、皮革和毛皮制作、造纸以及印刷等工业;(2)以非农产品为原料的轻工业,是指以工业品为
原料的轻工业。主要包括文教体育用品、化学药品制造、合成纤维制造、日用化学制品、日用玻璃制品、日用
金属制品、手工工具制造、医疗器械制造、文化和办公用机械制造等工业。
重工业 是指为国民经济各部门提供物质技术基础的主要生产资料的工业。按其生产性质和产品用途,
可分为下列三类:(1)采掘(伐)工业,是指对自然资源的开采,包括石油开采、煤炭开采、金属矿开采、非金
属矿开采和木材采伐等工业;(2)原材料工业,指向国民经济各部门提供基本材料、动力和燃料的工业。包括金
属冶炼及加工、炼焦及焦炭化学、化工原料、水泥、人造板以及电力、石油和煤炭加工等工业;(3)加工工业,
是指对工业原材料进行再加工制造的工业。包括装备国民经济各部门的机械设备制造工业、金属结构、水泥制
品等工业,以及为农业提供的生产资料如化肥、农药等工业。 根据上述划分原则,修理业中以重工业产品
为修理作业对象的划为重工业,反之划为轻工业。
工业总产值 是以货币表现的工业企业在一定时期内生产的已出售或可供出售工业产品总量,它反映一
定时间内工业生产的总规模和总水平。它包括:在本企业内不再进行加工,经检验、包装入库(规定不需包装
的产品除外)的成品价值,对外加工费收入,自制半成品、在产品期末期初差额价值。工业总产值采用“工厂
法”计算,即以工业企业作为一个整体,按企业工业生产活动的最终成果来计算,企业内部不允许重复计算,
不能把企业内部各个车间(分厂)生产的成果相加。但在企业之间、行业之间、地区之间存在着重复计算。
轻重工业总产值的划分也是按“工厂法”计算的,即一个工业企业在正常情况下生产的主要产品的性质
属于轻工业,则该企业的全部总产值作为轻工业总产值;一个工业企业生产的主要产品的性质属于重工业,则
该企业的全部总产值作为重工业总产值。
工业销售产值(当年价格) 是以货币形式表现的,工业企业在本年内销售的本企业生产的工业产品或
提供工业性劳务价值的总价值量。工业销售产值包括的内容为:
1. 销售成品价值:指企业在报告期内实际销售(包括本期生产和非本期生产)的全部成品、半成品的
总价值,即按报告期产品的实际销售数量乘以不含增值税(销项税额)的产品实际销售平均单价计算。销
售成品价值中包括企业生产的自制设备及提供给本企业在建工程、其他非工业部门和生活福利部门等单位
使用的成品价值,但不包括用订货者来料加工,并且只收取加工费的成品(半成品)价值。
2. 对外加工费收入:指企业在报告期内完成的对外承接的工业品加工(包括用定货者来料加工的产品)
的加工费收入;对外工业品修理作业可收取的加工费收入和对内非工业部门提供的加工修理、设备安装等收
入。对外加工费收入按不含增值税(销项税额)的价格计算。

132
对于以对外加工生产为主,对外加工费收入所占比重较大的企业,如果对外加工费收入出现跨年度支付
的情况,为保证总产值生产口径计算的准确性,则应将对外加工费收入按实际情况调整,记录本年应实际收取
的对外加工费收入。
工业增加值 是指工业行业在报告期内以货币表现的工业生产活动的最终成果,是企业全部生产活动的
总成果扣除了在生产过程中消耗或转移的物质产品和劳务价值后的余额,是企业生产过程中新增加的价值。
计算工业增加值通常采用两种方法。
一是“生产法”,即从工业生产过程中产品和劳务价值形成的角度入手,剔除生产环节中间投入的价
值,从而得到新增价值的方法。公式为:
工业增加值=工业总产值-工业中间投入+本期应交增值税
二是“收入法”,即从工业生产过程中创造的原始收入初次分配的角度,对工业生产活动最终成果进行
核算的一种方法,其计算公式为:
工业增加值=固定资产折旧+劳动者报酬+生产税净额+营业盈余
应收账款净额 指企业因销售商品、产品、提供劳务等,应向购货单位或接受劳务单位收取款项。该指
标根据会计“资产负债表”中“应收账款”项的年末数填报。
资产合计 指企业拥有或控制的能以货币计量的经济资源,包括各种财产、债权和其他权利。资产按其
流动性(即资产的变现能力和支付能力)划分为:流动资产、长期投资、固定资产、无形资产、递延资产和其
他资产。
负债合计 指企业所承担的能以货币计量,将以资产或劳务偿付的债务,偿还形式包括货币、资产或提
供劳务。负债一般按偿还期长短分为流动负债和长期负债。
主营业务收入 是企业销售产品的销售收入和提供劳务等经营业务取得的业务收入。
主营业务成本 是指企业销售产品和提供劳务等主要经济业务的实际成本。
营业费用 指企业在销售商品过程中发生的各项费用以及为销售本企业商品而专设的销售机构(含销售
网点、售后服务网点等)的经营费用。包括运输费、装卸费、包装费、保险费、广告费、业务费、差旅费、招
待费、社保费等。
主营业务税金及附加 是指企业销售产品和提供劳务等主要经营业务应负担的城市维护建设税、消费
税、资源税和教育费附加。
管理费用 指企业为组织和管理企业生产经营所发生的管理费用,包括企业的董事会和行政管理部门在
企业经营管理中发生的,或者应当由企业统一负担的各项管理费用。包括行政管理部门职工工资、福利费、差
旅费、办公费、会议费、印刷费、水电费、社保费、招待费、技术转让费等。
财务费用 指企业为筹集生产经营所需资金而发生的费用,包括企业生产经营期间发生的利息支出(减
利息收入)、汇兑损失(减汇兑收益)以及相关的手续费等。
利润总额 指企业在生产经营过程中各种收入扣除各种耗费后的盈余,反映企业在报告期内实现的亏盈
总额,包括营业利润、补贴收入、投资净收益和营业外收支净额。
利税总额 指企业利润总额、产品销售税金及附加和应交增值税之和。

133
成本费用利润率 是指工业企业投入生产成本及费用的经济效益,同时也反映企业降低成本所取得的经
济效益。计算公式为:
成本费用总额为主营业务成本和营业费用、管理费用、财务费用三项期间费用。
流动资金周转率 是指一定时期内流动资产完成的周转次数,反映投入工业企业流动资金的周转速度,
一般以一年时间内周转多少次表示。计算公式为:
全员劳动生产率 是指反映企业的生产效率和劳动投入的经济效益。一般用平均每人一年创造的工业增
加值表示。计算公式为:
全部职工平均人数为企业在报告期内全部从业人员的平均人数,计算公式为:
或:
资产负债率 是指反映企业经营风险的大小,反映企业利用债权人提供的资金从事经营活动的能力。计
算公式为:
资产及负债均为报告期末数。
总资产贡献率 是指企业一定时期内全部资产获利能力,是企业经营业绩和管理水平的集中体现,是评
价和考核企业盈利能力的核心指标。计算公式为:
税金总额为产品销售税金及附加与应交增值税之和,平均资产总额为期初、期末资产总计的算术平均值 。
资本保值增值率 是反映企业净资产变动状况的一个重要指标,是企业发展能力的集中体现。它是指期
末所有者权益总额与上年同期期末所有者权益总额的比率。计算公式为:
所有者权益等于资产总计减负债总计。
100%% ×=成本费用总额
利润总额)成本费用利润率(
流动资产平均余额
主营业务收入流动资产周转率(次)=
100%/ ×=全部职工平均人数
工业增加值人)全员劳动生产率(元
12121 数之和月全部从业人员平均人至
数全部从业人员年平均人 =
100%24
121×=
从业人员之和月各月月初、月末全部至数全部从业人员年平均人
100%% ×=资产总计
负债总计)资产负债率(
100%% ×++
=平均资产总额
利息支出税金利润总额)总资产贡献率(
100%% ×=益上年同期期末所有者权
报告期期末所有者权益)资本保值增值率(
100%% ×=成本费用总额
利润总额)成本费用利润率(
流动资产平均余额
主营业务收入流动资产周转率(次)=
100%/ ×=全部职工平均人数
工业增加值人)全员劳动生产率(元
12121 数之和月全部从业人员平均人至
数全部从业人员年平均人 =
100%24
121×=
从业人员之和月各月月初、月末全部至数全部从业人员年平均人
100%% ×=资产总计
负债总计)资产负债率(
100%% ×++
=平均资产总额
利息支出税金利润总额)总资产贡献率(
100%% ×=益上年同期期末所有者权
报告期期末所有者权益)资本保值增值率(
100%% ×=成本费用总额
利润总额)成本费用利润率(
流动资产平均余额
主营业务收入流动资产周转率(次)=
100%/ ×=全部职工平均人数
工业增加值人)全员劳动生产率(元
12121 数之和月全部从业人员平均人至
数全部从业人员年平均人 =
100%24
121×=
从业人员之和月各月月初、月末全部至数全部从业人员年平均人
100%% ×=资产总计
负债总计)资产负债率(
100%% ×++
=平均资产总额
利息支出税金利润总额)总资产贡献率(
100%% ×=益上年同期期末所有者权
报告期期末所有者权益)资本保值增值率(
100%% ×=成本费用总额
利润总额)成本费用利润率(
流动资产平均余额
主营业务收入流动资产周转率(次)=
100%/ ×=全部职工平均人数
工业增加值人)全员劳动生产率(元
12121 数之和月全部从业人员平均人至
数全部从业人员年平均人 =
100%24
121×=
从业人员之和月各月月初、月末全部至数全部从业人员年平均人
100%% ×=资产总计
负债总计)资产负债率(
100%% ×++
=平均资产总额
利息支出税金利润总额)总资产贡献率(
100%% ×=益上年同期期末所有者权
报告期期末所有者权益)资本保值增值率(
100%% ×=成本费用总额
利润总额)成本费用利润率(
流动资产平均余额
主营业务收入流动资产周转率(次)=
100%/ ×=全部职工平均人数
工业增加值人)全员劳动生产率(元
12121 数之和月全部从业人员平均人至
数全部从业人员年平均人 =
100%24
121×=
从业人员之和月各月月初、月末全部至数全部从业人员年平均人
100%% ×=资产总计
负债总计)资产负债率(
100%% ×++
=平均资产总额
利息支出税金利润总额)总资产贡献率(
100%% ×=益上年同期期末所有者权
报告期期末所有者权益)资本保值增值率(
100%% ×=成本费用总额
利润总额)成本费用利润率(
流动资产平均余额
主营业务收入流动资产周转率(次)=
100%/ ×=全部职工平均人数
工业增加值人)全员劳动生产率(元
12121 数之和月全部从业人员平均人至
数全部从业人员年平均人 =
100%24
121×=
从业人员之和月各月月初、月末全部至数全部从业人员年平均人
100%% ×=资产总计
负债总计)资产负债率(
100%% ×++
=平均资产总额
利息支出税金利润总额)总资产贡献率(
100%% ×=益上年同期期末所有者权
报告期期末所有者权益)资本保值增值率(
100%% ×=成本费用总额
利润总额)成本费用利润率(
流动资产平均余额
主营业务收入流动资产周转率(次)=
100%/ ×=全部职工平均人数
工业增加值人)全员劳动生产率(元
12121 数之和月全部从业人员平均人至
数全部从业人员年平均人 =
100%24
121×=
从业人员之和月各月月初、月末全部至数全部从业人员年平均人
100%% ×=资产总计
负债总计)资产负债率(
100%% ×++
=平均资产总额
利息支出税金利润总额)总资产贡献率(
100%% ×=益上年同期期末所有者权
报告期期末所有者权益)资本保值增值率(
100%% ×=成本费用总额
利润总额)成本费用利润率(
流动资产平均余额
主营业务收入流动资产周转率(次)=
100%/ ×=全部职工平均人数
工业增加值人)全员劳动生产率(元
12121 数之和月全部从业人员平均人至
数全部从业人员年平均人 =
100%24
121×=
从业人员之和月各月月初、月末全部至数全部从业人员年平均人
100%% ×=资产总计
负债总计)资产负债率(
100%% ×++
=平均资产总额
利息支出税金利润总额)总资产贡献率(
100%% ×=益上年同期期末所有者权
报告期期末所有者权益)资本保值增值率(
单位国内生产总值能耗 指一定时期内,一个国家或地区每生产一个单位的国内生产总值所消耗的能
源。计算公式为:
单位国内生产总值电耗 指一定时期内,一个国家或地区每生产一个单位的国内生产总值所消耗的电
力。计算公式为:
单位工业增加值能耗 指一定时期内,一个国家或地区每生产一个单位的工业增加值所消耗的能源。计
算公式为:
国内生产总值
能源消费总量单位国内生产总值能耗 =
国内生产总值
全社会用电量单位国内生产总值电耗 =
工业增加值
工业能源消费量单位工业增加值能耗 =

134
能源消费总量 指一定时期内全国(地区)生产和生活消费的各种能源的总和,是观察能源消费水平、
构成和增长速度的总量指标,能源消费总量包括原煤和原油及其制品、天然气、电力。不包括低热值燃料、生
物质能和太阳能等的利用。能源消费总量分为三部分,即终端能源消费量、能源加工转换损失量和损失量。
(1) 终端能源消费量 指一定时期内全国(地区)生产和生活消费的各种能源在扣除了用于加工转换二次
能源消费量和损失量以后的数量。
(2) 能源加工转换损失量 指一定时期内全国(地区)投入加工转换的各种能源数量之和与产出各种能源
产品之和的差额。它是观察能源在加工转换过程中损失量变化的指标。
(3)能源损失量 指一定时期内能源在输送、分配、储存过程中发生的损失和由客观原因造成的各种损失量。
不包括各种气体能源放空、放散量。
能源消费弹性系数 是反映能源消费增长速度与国民经济增长速度之间比例关系的指标。计算公式:
电力消费弹性系数 是反映电力消费增长速度与国民经济增长速度之间比例关系的指标。计算公式:
能源加工转换效率 指一定时期内能源经过加工、转换后,产出的各种能源产品的数量与同期内投入加
工转换的各种能源数量的比率。它是观察能源加工转换装置和生产工艺先进与落后、管理水平高低等的重要指
标。计算公式:

135
Explanatory Notes on Main Statistical Indicators
Industry refers to the material production sector which is engaged in extraction of natural resources and
processing and reprocessing of minerals and agricultural products, including (1) extraction of natural resources, such as
mining, salt production, and logging (but excluding hunting and fishing); (2) processing and reprocessing of farm and
sideline produces, such as rice husking, flour milling, wine making, oil pressing, cotton ginning, silk reeling, spinning
and weaving, and leather making; (3) manufacture of industrial products, such as steel making, iron smelting, chemicals
manufacturing, petroleum processing, machine building, timber processing; and production and supply of electricity,
water and gas; (4) repair and renovation of industrial products, such as the repair of machinery and means of transport
(including cars).
Prior to 1984, industrial enterprises run by villages and cooperative organizations under village were classified into
agriculture. Since 1984, these enterprises have been grouped into industry.
Light Industry refers to the industry that produces consumer goods and hand tools. It consists of two categories,
depending on the materials used:
(1) Industries using farm products as raw materials. These are branches of light industry which directly or indirectly
use farm products as basic raw materials, including the manufacture of food and beverages, tobacco processing, textile,
clothing, fur and leather manufacturing, paper making, printing, etc.
(2) Industries using non-farm products as raw materials. These are branches of light industry which use
manufactured goods as raw materials, including the manufacture of cultural, educational and sports articles, chemicals,
synthetic fiber, chemical products for daily use, glass products for daily use, metal products for daily use, hand tools,
medical apparatus and instruments, and the manufacture of cultural and clerical machinery.
Heavy Industry refers to the industry which produces capital goods and provides various sectors of the national
economy with necessary material and technical basis. It consists of the following three branches according to the purpose
of production or the use of products:
(1) Mining, quarrying and logging industry refers to the industry that extracts natural resources, including extraction
of petroleum, coal, metal and non-metal ores, and logging.
(2) Raw materials industry refers to the industry that provides various sectors of the national economy with raw
materials, fuels and power. It includes smelting and processing of metals, coking and coke chemistry, chemical materials
and building materials such as cement, plywood, and power, petroleum refining and coal dressing.
(3) Manufacturing industry refers to the industry that processes raw materials. It includes machine-building industry
which equips sectors of the national economy, industries of metal structure and cement products, industries producing
means of agricultural production, such as chemical fertilizers and pesticides.
According to the above principle of classification, repairing trades engaged primarily in repairing products of heavy
industry are classified into heavy industry, while those engaged in repairing products of light industry are classified into
light industry.
Gross Industrial Output Value refers to the total volume of industrial products sold or available for sale in
monetary terms during a given period, which reflects the total achievements and overall scale of industrial production
during a given period. It includes the value of the finished products in the enterprises, which are not to be further

136
processed and have been inspected, packed and put in storage (where applicable), the income from external processing
and the value gain of semi-finished products at the end of the reference period over the beginning. The gross
industrial output value is calculated by the factory approach, i.e. the whole industrial enterprise is regarded as the
basic accounting unit in calculating the gross industrial output value. No double calculations are to be made within
the same enterprise and the output value of different workshops (branch factories) should not be added. However,
this approach does not exclude the possibility of double calculations between enterprises, sectors and regions.
Output value of light and heavy industries is also classified by the factory approach. Under normal conditions, if the
major products of an industrial enterprise belong to light industry products, the gross output value of that enterprise is
classified wholly into light industry; the same principle applies to heavy industry.
Sales Value of Industry (Current Price) refers to the total value of industrial products sold or industrial services
provided in monetary terms within the current year. It includes:
(1) Sales Value of Finished Products. Sale value of finished products refers to the total value of finished and semi-
finished products sold within the reporting period (including those produced within and outside the period). It equals
the actual sales volume of products sold within the reporting period timing the actual average sales price (excluding value
added or sales tax). It includes the equipment made by the enterprise itself, as well as the finished products provided to
the projects under construction, non-industrial departments and welfare department, and excludes the value of finished
or semi-finished products of external processing with supplied materials that produces only processing charges.
(2) Income from External Processing refers to income from contracted external processing of industrial
products (including processing of industrial products using materials from the clients), and the income from
industrial repairing work provided to other units. Income from external processing is calculated using information
from the item “products sales income” in the enterprise accounting at the prices excluding value-added tax.
For an enterprise whose main business is external processing and the charges of external processing constitute a large
proportion of its income, in case of cross-year payment, the income of external processing charges shall be adjusted
and the actual income of external processing charges of the current year shall be recorded to ensure the accuracy of the
coverage of gross industrial output.
Value-added of Industry refers to the final results of industrial production of industrial enterprises in monetary
terms during the reference period. It equals to the total achievements of all industrial production minus the goods and
services consumed or transferred during the industrial production of enterprises, in other terms the newly added value
during the industrial production of enterprises. It is calculated by the following two approaches:
a) The production approach. The value added is calculated by taking the value of industrial intermediate input out
of the final value of products and labor services that comes from industrial production. The formula used is:
Value-added of industry = gross industrial output-industrial intermediate input + value-added tax
b) The income approach. It is calculation of the final value of industrial activities by approaching the primary
distribution of the primary income of industrial production. The formula used is:
Value-added of industry = depreciation of fixed assets + remuneration of laborers + net production tax+ operating
surplus
Account Receivable refers to accounts receivable from purchasers or receivers due to the delivery of goods,
products or services. The index is recorded in accordance with the year-end figure of Account Receivable of the balance
sheet.

137
%100Costs TotalProfits TotalCosts(%) Industrial toProfits of Ratio ×⎟
⎠⎞
⎜⎝⎛=
⎟⎠⎞
⎜⎝⎛×
⎟⎟⎟⎟
⎠
⎞
⎜⎜⎜⎜
⎝
⎛
=Months ofber Num Cumulative
12%
Funds ating Circul ofTurnover of TimesofNumber Total of Balance Average
Products of Revenue SslesFund gCirculatin ofTurnover
of Times ofNumber
⎟⎠⎞
⎜⎝⎛×⎟⎟
⎠
⎞⎜⎜⎝
⎛=
Months ofber Num Cumulative12
refers Workersand Staff ofNumber AveragetyProductiviLabor added-Value
on)(yuan/perstyProductiviLabor added-Value
⎟⎠⎞
⎜⎝⎛=
12December January to from NmbersMonthly Average of Sumrefers Workersand Staff ofNumber Average
⎟⎠⎞
⎜⎝⎛=
24December January to fromMonth End of End and Beginning at the Numbers Average of Sumrefers Workersand Staff ofNumber Average
%100Assets TotalProfits TotalRatio(%)Liability -Assets ×⎟
⎠⎞
⎜⎝⎛=
⎟⎠⎞
⎜⎝⎛××⎟⎟
⎠
⎞⎜⎜⎝
⎛ ++=
Months ofber Num Cumulative12%100
Assets AverageeExpenditurInterest Taxes Total Profits Total
ue(%)Output val Industrial toAssets Total of Ratio
Total Assets refer to all economic resources, in monetary terms that is owned or controlled by enterprises
including properties, creditors’ equity and other economic rights of all forms. Classified by the degree of equitability,
total assets include circulating assets, long-term investment, fixed assets, intangible assets and deferred assets, and other
assets.
Total Liabilities refer to payable liabilities of enterprises that have to be repaid in terms of money, assets or labor
services. In terms of payment, it can be classified as liquid liabilities, long-term liabilities and deferred taxes,etc.
Prime Operating Revenue refers to the revenue from the principal business, including the sales of products and
from rendering of industrial services by industrial enterprises.
Prime Operating Cost refers to the actual cost of products sold and industrial services provided by industrial
enterprises.
Business Cost refers to the costs from sales of commodities and the operational costs of sales agencies (including
sales stores and service centers, etc.), including the costs of transport, loading, packaging, advertising, business operation,
travelling, reception, social security, etc.
Tax and Extra Charges on Principal Business refer to the tax on city maintenance and construction,
consumption tax, resources tax and extra charges for education, which should be borne by the enterprises in selling
products and providing industrial services.
Management Cost refers to the costs of organizing and managing enterprise operation, including the operational
cost of the board of directors and the executive body in management that shall be borne by the enterprise. Management
costs include staff wages, welfare, the costs of administration, meeting, printing, water and electricity, social security,
reception, technology transfer, etc.
Financial Cost refers to the cost from raising fund for production and operation, including expenditure of
interests, loss of momentary exchange and related charges.
Total Profits refer to the profits gained by the enterprises.
Total Pre-Tax Profits refers to the sum of total profits, sales tax as well as additional and payable value-added
taxes.
Ratio of Profits to Industrial Costs refers to the ratio of profits realized in a given period to the total production
costs of industrial enterprises in the same period, which also reflects the economic benefit attained by the enterprises from
reduced costs. This ratio is calculated as follows:
where Total costs are the sum of cost of products sold, marketing cost, management cost and financial cost.
Number of Times of Turnover of Circulating Funds refers to the number of times in which turnover of
circulating funds is completed in a given period of time, which reflects the speed of the turnover of circulating funds. It is
expressed as times of turnover within a year and is calculated as follows:
)Months ofNumber Cumulative
%12()
Funds gCirculatin ofTurnover of TimesofNumber Total of Balance Average
Products of Revenue Sales(Funds gCirculatin ofTurnover
of Times ofNumber ×=
)Months ofNumber Cumulative
12() Workersand Staff ofNumber AverageIndustry of added-Value(
on)(yuan/perstyProductiviLabor added-Value
×=
12December January to from NumbersMonthly Average of Sum Workersand Staff ofNumber verage =
24December January to fromMonth Each of End and Beginning at the Numbers Average of Sum
Workersand Staffverage ofNumber
=
100%)Assets TotalDebts Total(Ratio(%)Liability -Assets ×=
)month ofnumber cumulative
12(%100)Assets Average
eExpenditurInterstTaxes TotalProfits Total(YalueOutput Industrial
toAssets Total of Ratio××
++=
100%)AssetsTotalDebts Total(Ratio(%)Liability -Assets ×=
%100Costs TotalProfits TotalCosts(%) Industrial toProfits of Ratio ×⎟
⎠⎞
⎜⎝⎛=
⎟⎠⎞
⎜⎝⎛×
⎟⎟⎟⎟
⎠
⎞
⎜⎜⎜⎜
⎝
⎛
=Months ofber Num Cumulative
12%
Funds ating Circul ofTurnover of TimesofNumber Total of Balance Average
Products of Revenue SslesFund gCirculatin ofTurnover
of Times ofNumber
⎟⎠⎞
⎜⎝⎛×⎟⎟
⎠
⎞⎜⎜⎝
⎛=
Months ofber Num Cumulative12
refers Workersand Staff ofNumber AveragetyProductiviLabor added-Value
on)(yuan/perstyProductiviLabor added-Value
⎟⎠⎞
⎜⎝⎛=
12December January to from NmbersMonthly Average of Sumrefers Workersand Staff ofNumber Average
⎟⎠⎞
⎜⎝⎛=
24December January to fromMonth End of End and Beginning at the Numbers Average of Sumrefers Workersand Staff ofNumber Average
%100Assets TotalProfits TotalRatio(%)Liability -Assets ×⎟
⎠⎞
⎜⎝⎛=
⎟⎠⎞
⎜⎝⎛××⎟⎟
⎠
⎞⎜⎜⎝
⎛ ++=
Months ofber Num Cumulative12%100
Assets AverageeExpenditurInterest Taxes Total Profits Total
ue(%)Output val Industrial toAssets Total of Ratio
138
Value-added Labor Productivity reflects the production efficiency of the enterprise and economic benefit of its
labor input. It is usually expressed as the industrial value-added created by an average member of an industrial enterprise
in a year. The formula used is:
Average Number of Staff and Workers refers to the average number of all employed persons by an industrial
enterprise within the reference period. The formula used is:
Or
Assets-Liability Ratio reflects both the operation risk and the capability of the enterprise in making use of the
capital from the creditors. It is calculated as follows: where both assets and debts are figures at the end of the reference
period.
Ratio of Total Assets to Industrial Output Value refers to the profit-making capability of all assets of the
enterprise. As a core indicator for the evaluation and assessment of the profit-making potential of the enterprise, it is a
focused reflection of the performance and management efficiency of the enterprise. This ratio is calculated as follows:
where Total Taxes are the sum of tax and extra charges on the sales of products and value-added tax payable; and
Average Assets are the arithmetic mean of beginning assets and ending assets.
Assets-Liability Ratio reflects both the operation risk and the capability of the enterprise in making use of the
capital from the creditors. It is calculated as follows: where both assets and debts are figures at the end of the reference
period.
Ratio of Capital Maintenance and Appreciation is an important indicator of the changes of net assets of an
enterprise and a focused reflection of the development capability of enterprises. It is the ratio of total creditors’ equity at
the end of the reference period to that of the same period of the previous year, calculated as follows:
where Creditors’equity is equal to the total assets of the enterprise minus its total l iabil it ies.
Energy Consumption per Unit of GDP refers to the energy consumption per unit of Gross Domestic Product in
a country or the Gross Regional Product in a region in the same reference period. The formula is:
Electricity Consumption per Unit of GDP refers to the electricity consumption per unit of Gross Domestic
Product in a country or the Gross Regional Product in a region in the same reference period. The formula is:
)Months ofNumber Cumulative
%12()
Funds gCirculatin ofTurnover of TimesofNumber Total of Balance Average
Products of Revenue Sales(Funds gCirculatin ofTurnover
of Times ofNumber ×=
)Months ofNumber Cumulative
12() Workersand Staff ofNumber AverageIndustry of added-Value(
on)(yuan/perstyProductiviLabor added-Value
×=
12December January to from NumbersMonthly Average of Sum Workersand Staff ofNumber verage =
24December January to fromMonth Each of End and Beginning at the Numbers Average of Sum
Workersand Staffverage ofNumber
=
100%)Assets TotalDebts Total(Ratio(%)Liability -Assets ×=
)month ofnumber cumulative
12(%100)Assets Average
eExpenditurInterstTaxes TotalProfits Total(YalueOutput Industrial
toAssets Total of Ratio××
++=
100%)AssetsTotalDebts Total(Ratio(%)Liability -Assets ×=
)Months ofNumber Cumulative
%12()
Funds gCirculatin ofTurnover of TimesofNumber Total of Balance Average
Products of Revenue Sales(Funds gCirculatin ofTurnover
of Times ofNumber ×=
)Months ofNumber Cumulative
12() Workersand Staff ofNumber AverageIndustry of added-Value(
on)(yuan/perstyProductiviLabor added-Value
×=
12December January to from NumbersMonthly Average of Sum Workersand Staff ofNumber verage =
24December January to fromMonth Each of End and Beginning at the Numbers Average of Sum
Workersand Staffverage ofNumber
=
100%)Assets TotalDebts Total(Ratio(%)Liability -Assets ×=
)month ofnumber cumulative
12(%100)Assets Average
eExpenditurInterstTaxes TotalProfits Total(YalueOutput Industrial
toAssets Total of Ratio××
++=
100%)AssetsTotalDebts Total(Ratio(%)Liability -Assets ×=
%100)Year Previous theof Period Same oftheEquity Creditors' Total
Period Reference theof End at theEquity Creditors' Total(onAppreciati and
eMaintenanc Capital of Ratio×=
of of
of
Product Domestic CrossnConsumptioEnergy Total
GDP ofper Unit nConsumptioEnergy =
of
Product Domestic CrossnConsumptioy Electricit Total
GDP ofper Unit nConsumptioy Electricit=
of
)Months ofNumber Cumulative
%12()
Funds gCirculatin ofTurnover of TimesofNumber Total of Balance Average
Products of Revenue Sales(Funds gCirculatin ofTurnover
of Times ofNumber ×=
)Months ofNumber Cumulative
12() Workersand Staff ofNumber AverageIndustry of added-Value(
on)(yuan/perstyProductiviLabor added-Value
×=
12December January to from NumbersMonthly Average of Sum Workersand Staff ofNumber verage =
24December January to fromMonth Each of End and Beginning at the Numbers Average of Sum
Workersand Staffverage ofNumber
=
100%)Assets TotalDebts Total(Ratio(%)Liability -Assets ×=
)month ofnumber cumulative
12(%100)Assets Average
eExpenditurInterstTaxes TotalProfits Total(YalueOutput Industrial
toAssets Total of Ratio××
++=
100%)AssetsTotalDebts Total(Ratio(%)Liability -Assets ×=
%100Costs TotalProfits TotalCosts(%) Industrial toProfits of Ratio ×⎟
⎠⎞
⎜⎝⎛=
⎟⎠⎞
⎜⎝⎛×
⎟⎟⎟⎟
⎠
⎞
⎜⎜⎜⎜
⎝
⎛
=Months ofber Num Cumulative
12%
Funds ating Circul ofTurnover of TimesofNumber Total of Balance Average
Products of Revenue SslesFund gCirculatin ofTurnover
of Times ofNumber
⎟⎠⎞
⎜⎝⎛×⎟⎟
⎠
⎞⎜⎜⎝
⎛=
Months ofber Num Cumulative12
refers Workersand Staff ofNumber AveragetyProductiviLabor added-Value
on)(yuan/perstyProductiviLabor added-Value
⎟⎠⎞
⎜⎝⎛=
12December January to from NmbersMonthly Average of Sumrefers Workersand Staff ofNumber Average
⎟⎠⎞
⎜⎝⎛=
24December January to fromMonth End of End and Beginning at the Numbers Average of Sumrefers Workersand Staff ofNumber Average
%100Assets TotalProfits TotalRatio(%)Liability -Assets ×⎟
⎠⎞
⎜⎝⎛=
⎟⎠⎞
⎜⎝⎛××⎟⎟
⎠
⎞⎜⎜⎝
⎛ ++=
Months ofber Num Cumulative12%100
Assets AverageeExpenditurInterest Taxes Total Profits Total
ue(%)Output val Industrial toAssets Total of Ratio

139
Energy Consumption per Unit of Industrial Value-added refers to the energy consumption per unit of
industrial value-added in a country or region in the same reference period. The formula is:
Total Domestic Energy Consumption refers to the total consumption of energy of various kinds by production
sectors and households in the country (region) in a given period of time. It is a comprehensive indicator of the scale,
composition and development speed of energy consumption. The total energy consumption includes that of coal, crude
oil and their products, natural gas and electricity, but excludes the consumption of fuel of low calorific value, bioenergy
and solar energy. Total domestic energy consumption can be divided into three parts:
(1) Final Energy Consumption: This refers to the total energy consumption by production sectors and households
in the country (region) in a given period of time, excluding primary energy consumption and loss in the process of
conversion into secondary energy.
(2)Loss During the Process of Energy Conversion: This refers to the total input of various kinds of energy for
conversion minus the total output of various kinds of energy in the country (region) in a given period of time. It is an
indicator of the loss that occurs during the process of energy conversion.
(3)Loss: This refers to the total loss of energy during the course of energy transmission, distribution and storage and
the loss caused by any objective reason in a given period of time, excluding the loss of various kinds of gas due to gas
discharges and stocktaking.
Elasticity Ratio of Energy Consumption is an indicator of the relationship between the growth rate of energy
consumption and the growth rate of the national economy. The formula is:
Elasticity Ratio of Electricity Consumption is an indicator of the relationship between the growth rate of
electricity consumption and the growth rate of the national economy. The formula is:
Efficiency of Energy Processing and Conversion refers to the ratio of the total output of energy products of
various kinds after processing and conversion to the total input of energy of various kinds for processing and conversion
in the same reference period. It is an important indicator of the current conditions of energy processing and conversion
equipment, production technique and management. The formula is:
added-Value IndustrialnConsumptioEnergy Total
added-Value Industrial ofUnit nConsumptioEnergy
=of


143
5-1 建筑企业主要经济指标
MAIN ECONOMIC INDICATORS ON CONSTRUCTION ENTERPRISES
指 标 Indicators
2013 2014 2015 2016 2017
建筑业企业个数(个) Number of Construction Enterprises(unit) 862 778 817 849 931
年末从业人员(万人) Number of Year-end Employed Persons(10 000persons) 53.99 45.47 60.32 60.62 65.64
资产合计(亿元) Total Assets(100 million yuan) 2 194.62 2 475.79 2 849.27 3 435.09 4 478.55
固定资产原价(亿元) Original Value of Fixed Assets(100 million yuan) 175.40 183.02 180.29 189.13 200.28
自有机械设备台数(万台) Number of Machinery and Equipment Owned(10 000 sets) 6.42 4.19 4.16 5.11
自有机械净值(亿元) Net value of Machinery and Equipment Owned(100 million yuan) 38.58 16.34 30.05 29.03
自有机械设备总功率(万千瓦) Total Power of Machiner and Equipment Owned(10 000 kw) 130.45 134.82 104.77 143.30
建筑业总产值(亿元) Gross Output Value of Construction (100 million yuan) 2 430.60 2 194.74 2 237.99 2 346.95 2 797.38
# 建筑工程产值(亿元) Output Value of Construction(100 million yuan) 2 106.54 1 869.74 1 905.58 1 878.48 2 234.17
安装工程产值(亿元) Output Value of Installation(100 million yuan) 260.23 249.39 237.87 345.99 428.06
其他产值(亿元) Others(100 million yuan) 63.83 75.61 94.54 122.48 135.16
本年固定资产折旧(亿元) Depreciation of Fixed Assets in the year (100 million yuan) 12.69 12.01 10.57 13.10 11.03
本年应付工资总额(亿元) Total Wages in the Year(100 million yuan) 353.79 346.32 348.90 389.87 403.14
工程结算税金及附加(亿元) Taxes and Extra Charges on Project Settle Accounts(100 million yuan) 79.23 77.48 78.36 40.35 14.89
管理费用中的税金(亿元) Taxes in Management Expenses(100 million yuan) 1.67 1.51 2.24 2.50
营业利润(亿元) Operating Profit(100 million yuan) 100.39 99.91 110.82 100.95 112.29
房屋建筑施工面积(万平方米) Floor Space of Buildings Under Construction (10 000 sq.m) 11 502.80 7 015.83 7 682.65 8 501.07 9 240.74
房屋建筑竣工面积(万平方米) Floor Space of Buildings Completed(10 000 sq.m) 2 009.86 1 141.54 1 260.81 1 212.85 1 673.39
利润总额(亿元) Total Profits(100 million yuan) 101.74 101.13 115.08 110.39 118.27
按总产值计算劳动生产率(元/人) In Terms of Gross Output ValueOverall Labor Productivity(yuan/person) 353 144 354 576 353 004 375 253 386 146
产值利润率(%) Ration of Profit to Gross Output Value(%) 4.19 4.61 5.14 5.88 4.01

144
5-2 建筑业总产值
GROSS OUTPUT VALUE OF CONSTRUCTION
单位:万元 (10 000 yuan)
指 标Indicators
2013 2014 2015 2016 2017
总 计 Total 24 306 003 21 947 367 22 379 924 23 469 541 27 973 830
按登记注册类型分组 Grouped by Type of Registration
1、内资企业 Domestic Funded Enterprises 23 917 914 21 482 097 21 966 435 23 003 775 27 471 478
国有企业 State-owned Enterprises 1 840 246 1 005 111 894 502 592 366 1 390 035
集体企业 Collective-owned Enterprises 12 272 7 505 10 391 11 091 20 613
股份合作企业 Cooperative Operation with Share Holding 680
联营企业 Joint Enterprises 62 110 2 395
国有联营企业 State-owned Joint 3 707 2 395
集体联营企业 Collective-owned Joint 9 092
国有与集体联营 State-owned and Collective-owned Joint 49 311
其他联营企业 Others
有限责任公司 Limited Liability Companies 11 780 473 10 045 076 10 946 351 10 513 452 11 544 453
国有独资公司 State Exclusively Funded Companies 3 593 489 1 674 397 1 710 399 2 084 146 2 269 198
其他有限责任公司 Others 8 186 984 8 370 678 9 235 953 8 429 306 9 275 255
股份有限公司 Limited Share-holding Companies 4 371 574 4 321 020 4 327 705 4 843 194 6 018 791
私营企业 Private Enterprises 5 851 239 6 100 991 5 787 485 7 037 470 8 493 752
私营独资企业 Private Exclusively Funded Enterprises 25 125 138 7 502 3 504 5 289
私营合作企业 Private Partnership Enterprises 1 361 1 405 17 923 2 031 3 233
私营有限责任公司 Private Limited Liability Companies 5 448 715 5 647 762 5 396 571 6 566 512 7 594 978
私营股份有限公司 Private Limited Share-holding Companies 376 038 451 686 365 489 465 423 890 251
其他企业 Others 6 204 3 154
2、港、澳、台商投资企业 Enterprises Funded by Entrepreneurs from 347 722 446 070 336 242 367 364 405 396
Hong Kong, Macao and Taiwan
3、外商投资企业 Foreign Funded Enterprises 40 368 19 199 77 247 98 402 96 956

145
5-3 分行业建筑业生产情况(2017年)
STATISTICS ON CONSTRUCTION BY SECTOR(2017)
单位:万元、万平方米 (10 000 yuan,10 000 sq.m)
指 标Indicators
总 计 Total
房屋建筑业 Building
土木工程建筑业 Civil
Engineering
建筑安装业Construction installation
建筑装饰和其他建筑业Construction Decoration and Other
Construction
企业个数(个) Number of Enterprise(unit) 931 209 200 236 286
签订的合同额 Contractual Value 78 636 397 26 485 674 22 649 227 8 044 573 21 456 923
建筑业总产值 Gross Output Value of Construction 27 973 830 9 349 357 3 990 071 3 693 940 10 940 462
#装饰装修产值 Decorate and Materials Construction 9 965 061 640 526 283 067 382 357 8 659 112
#在外省完成的产值 Output Value of buildings Completed 10 403 920 2 546 771 1 080 602 920 559 5 855 989
outside of Guangdong province
#建筑工程产值 Output Value of Contraction 22 341 675 8 207 599 2 990 370 2 048 906 9 094 800
安装工程产值 Output Value of Installation 4 280 585 627 612 493 771 1 573 415 1 585 787
其他产值 Others 1 351 571 514 147 505 930 71 619 259 875
竣工产值 Output Value of buildings Completed 13 430 714 4 250 893 2 430 212 1 297 365 5 452 244
房屋建筑施工面积 Floor Space of Buildings Under 9 241 8 901 99 240 1
Construction
#本年新开工面积 Floor Space of Newly-started Buildings 3 142 2 955 44 142 1
in this Year
自有施工机械设备年末总台数(台) Number of Machinery and Equipment 51 128 7 195 10 353 5 967 27 613
Owned(10 000 sets)
自有施工机械设备年末总功率(万千瓦) Total Power of Machiner and Equipment 143 31 69 10 34
Owned(10 000 kw)
自有施工机械设备年末净值 Net value of Machinery and Equipment 290 279 91 823 120 172 25 620 52 664
Owned
计算劳动生产率的平均人数(人) Average Number of Employed 724 436 227 942 128 451 75 599 292 444
Persons in Calculation of Labor
Productivity(person)
全员劳动生产率(万元/人) Overall Labor Productivity 39 41 31 49 37
(10 000 yuan/person)

146
5-4 分登记注册类型建筑业生产情况(2017年)
STATISTICS ON CONSTRUCTION BY TYPE OF REGISTRATION(2017)
单位:万元、万平方米 (10 000 yuan,10 000 sq.m)
指 标Indicators
总 计 Total
内资企业Domestic Funded
港澳台商投资企业Hong
Kong,Macao and Taiwan
Funded
外商投资企业股份有限公司Foreign Funded Share-holding Corporations
Ltd.
#国有 State-owned
#集体Collctive Owned
企业个数(个) Number of Enterprises(unit) 931 908 9 2 20 3
#有工作量的企业个数 Number of Enterprises with 931 908 9 2 20 3
Workload
签订的合同额 Contractual Value 78 636 397 74 802 038 3 659 874 14 210 3 670 492 163 867
建筑业总产值 Gross Output Value of 27 973 830 27 471 478 1 390 035 20 613 405 396 96 956
Construction
#装饰装修产值 Decorate and Materials 9 965 061 9 720 743 48 827 220 624 23 694
Construction
#在外省完成的产值 Output Value of buildings 10 403 920 10 174 571 114 797 159 096 70 254
Completed outside of
Guangdong province
#建筑工程产值 Output Value of Contraction 22 341 675 22 021 980 1 389 647 9 389 296 001 23 694
安装工程产值 Output Value of Installation 4 280 585 4 098 424 388 108 936 73 224
其他产值 Others 1 351 571 1 351 074 11 224 459 38
竣工产值 Output Value of buildings 13 430 714 12 805 357 355 831 556 020 69 337
Completed
房屋建筑施工面积 Floor Space of Buildings Under 9 240.74 8 624.71 2 234.92 616.03
Construction
#本年新开工面积 Floor Space of Newly-started 3 141.98 3 088.98 1 183.00 53.00
Buildings in this Year
房屋建筑竣工面积 Floor Space of Buildings 1 673.39 1 585.49 55.19 87.90
Completed
自有施工机械设备年末总台数(台)
Number of Machinery and 51 128 50 654 539 80 412 62
Equipment(year-end)(unit)
自有施工机械设备年末总功率(万千瓦)
Total Power of Machinery and 143.30 141.35 2.63 0.01 1.88 0.03
Equipment(10 000 kw)
自有施工机械设备年末净值 Net value of Machinery and 290 279 288 501 11 089 1 989 1 504 274
Equipment Owned
计算劳动生产率的平均人数(人)
Average Number of Employed 724 436 709 290 61 412 212 11 993 3 153
Persons in Calculation of Labor
Productivity(person)
全员劳动生产率 Overall Labor Productivity 39 39 23 97 34 31
(万元/人) (10 000 yuan/person)
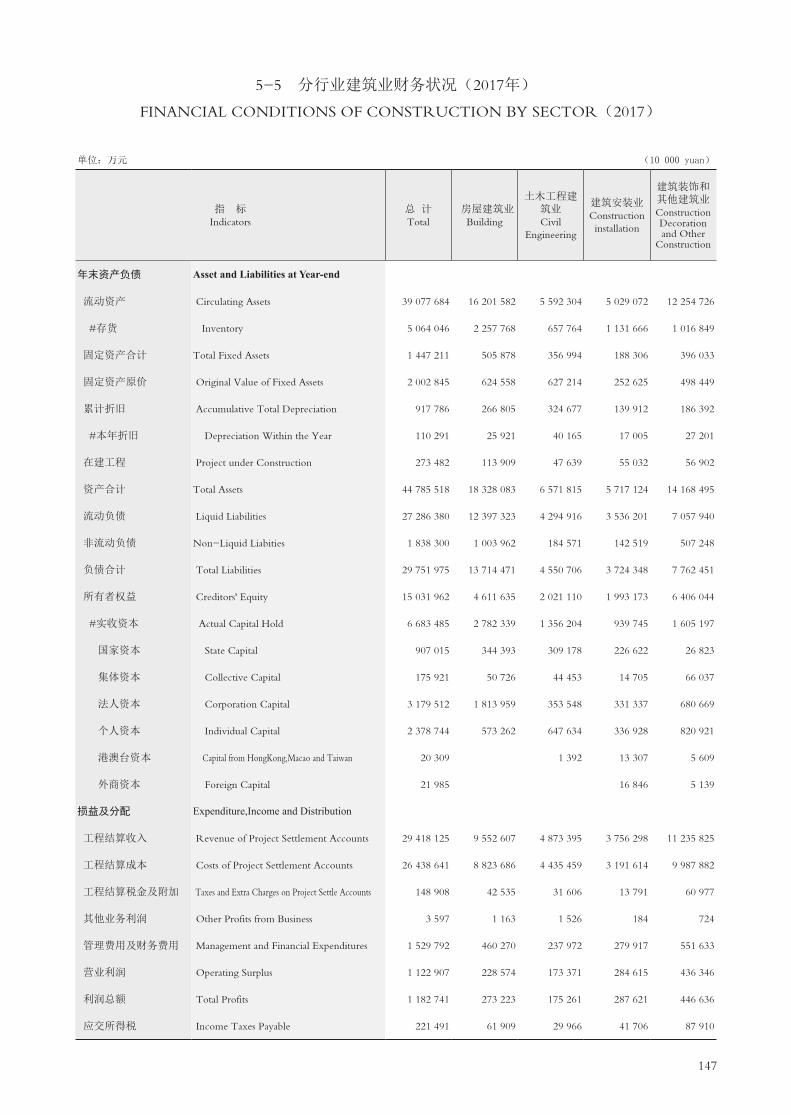
147
5-5 分行业建筑业财务状况(2017年)
FINANCIAL CONDITIONS OF CONSTRUCTION BY SECTOR(2017)
单位:万元 (10 000 yuan)
指 标Indicators
总 计Total
房屋建筑业 Building
土木工程建筑业 Civil
Engineering
建筑安装业Construction installation
建筑装饰和其他建筑业Construction Decoration and Other
Construction
年末资产负债 Asset and Liabilities at Year-end
流动资产 Circulating Assets 39 077 684 16 201 582 5 592 304 5 029 072 12 254 726
#存货 Inventory 5 064 046 2 257 768 657 764 1 131 666 1 016 849
固定资产合计 Total Fixed Assets 1 447 211 505 878 356 994 188 306 396 033
固定资产原价 Original Value of Fixed Assets 2 002 845 624 558 627 214 252 625 498 449
累计折旧 Accumulative Total Depreciation 917 786 266 805 324 677 139 912 186 392
#本年折旧 Depreciation Within the Year 110 291 25 921 40 165 17 005 27 201
在建工程 Project under Construction 273 482 113 909 47 639 55 032 56 902
资产合计 Total Assets 44 785 518 18 328 083 6 571 815 5 717 124 14 168 495
流动负债 Liquid Liabilities 27 286 380 12 397 323 4 294 916 3 536 201 7 057 940
非流动负债 Non-Liquid Liabities 1 838 300 1 003 962 184 571 142 519 507 248
负债合计 Total Liabilities 29 751 975 13 714 471 4 550 706 3 724 348 7 762 451
所有者权益 Creditors' Equity 15 031 962 4 611 635 2 021 110 1 993 173 6 406 044
#实收资本 Actual Capital Hold 6 683 485 2 782 339 1 356 204 939 745 1 605 197
国家资本 State Capital 907 015 344 393 309 178 226 622 26 823
集体资本 Collective Capital 175 921 50 726 44 453 14 705 66 037
法人资本 Corporation Capital 3 179 512 1 813 959 353 548 331 337 680 669
个人资本 Individual Capital 2 378 744 573 262 647 634 336 928 820 921
港澳台资本 Capital from HongKong,Macao and Taiwan 20 309 1 392 13 307 5 609
外商资本 Foreign Capital 21 985 16 846 5 139
损益及分配 Expenditure,Income and Distribution
工程结算收入 Revenue of Project Settlement Accounts 29 418 125 9 552 607 4 873 395 3 756 298 11 235 825
工程结算成本 Costs of Project Settlement Accounts 26 438 641 8 823 686 4 435 459 3 191 614 9 987 882
工程结算税金及附加 Taxes and Extra Charges on Project Settle Accounts 148 908 42 535 31 606 13 791 60 977
其他业务利润 Other Profits from Business 3 597 1 163 1 526 184 724
管理费用及财务费用 Management and Financial Expenditures 1 529 792 460 270 237 972 279 917 551 633
营业利润 Operating Surplus 1 122 907 228 574 173 371 284 615 436 346
利润总额 Total Profits 1 182 741 273 223 175 261 287 621 446 636
应交所得税 Income Taxes Payable 221 491 61 909 29 966 41 706 87 910

148
5-6 分登记注册类型建筑业财务状况(2017年)
FINANCIAL CONDITIONS OF CONSTRUCTION BY TYPE
OF REGISTRATION(2017)单位:万元 (10 000 yuan)
指 标Indicators
总 计 Total
内资企业Domestic Funded
港澳台商投资企业Hong
Kong,Macao and Taiwan
Funded
外商投资企业 Foreign Funded
#国有 State-owned
#集体Collctive Owned
年末资产负债 Asset and Liabilities at Year-end
流动资产 Circulating Assets 39 077 684 36 309 403 1 053 163 2 648 1 918 099 850 182
#存货 Inventory 5 064 046 4 839 198 238 221 221 854 2 994
固定资产合计 Total Fixed Assets 1 447 211 1 413 141 75 247 299 25 014 9 056
固定资产原价 Original Value of Fixed Assets 2 002 845 1 951 124 71 760 1 068 38 576 13 145
累计折旧 Accumulative Total Depreciation 917 786 899 770 47 348 768 13 796 4 220
#本年折旧 Depreciation Within the Year 110 291 109 147 5 077 380 765
在建工程 Project Under Construction 273 482 273 278 50 835 74 131
资产合计 Total Assets 44 785 518 41 843 360 1 265 239 2 987 2 054 587 887 572
流动负债 Liquid Liabilities 27 286 380 25 115 231 862 013 65 1 649 497 521 652
非流动负债 Non-Liquid Liabities 1 838 300 1 719 140 10 312 118 300 860
负债合计 Total Liabilities 29 751 975 27 455 579 957 730 65 1 773 885 522 511
所有者权益 Creditors'Equity 15 031 962 14 386 200 307 508 2 922 280 702 365 060
#实收资本 Actual Capital Hold 6 683 485 6 537 471 147 610 200 69 265 76 749
国家资本 State Capital 907 015 865 177 147 610 41 839
集体资本 Collective Capital 175 921 175 921 200
法人资本 Corporation Capital 3 179 512 3 124 701 7 142 47 668
个人资本 Individual Capital 2 378 744 2 370 359 8 385
港澳台资本 Capital from HongKong,Macao and Taiwan 20 309 893 11 435 7 981
外商资本 Foreign Capital 21 985 421 464 21 100
损益及分配 Expenditure,Income and Distribution
工程结算收入 Revenue of Project Settlement Accounts 29 418 125 28 771 386 726 343 11 289 518 435 128 304
工程结算成本 Costs of Project Settlement Accounts 26 438 641 25 919 713 680 664 9 235 441 642 77 286
工程结算税金及附加 Taxes and Extra Charges on Project Settle Accounts 148 908 145 094 2 305 53 3 133 682
其他业务利润 Other Profits from Business 33 655 33 376 843 -10 257 21
管理费用及财务费用 Management and Financial Expenditures 1 529 792 1 450 194 14 150 562 42 661 36 937
营业利润 Operating Profits 1 122 907 1 024 146 36 693 1 439 27 980 70 782
利润总额 Total Profits 1 182 741 1 083 374 36 507 1 439 28 240 71 127
应交所得税 Income Taxes Payable 221 491 215 018 6 212 374 3 782 2 691
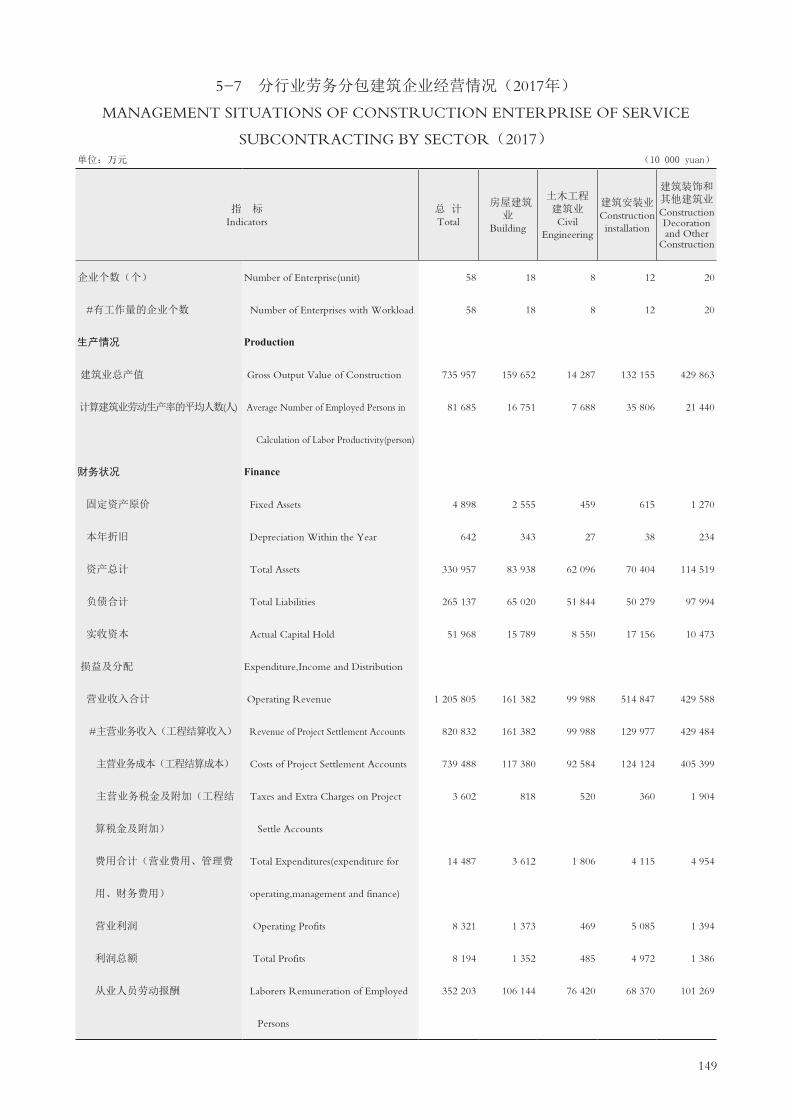
149
5-7 分行业劳务分包建筑企业经营情况(2017年)
MANAGEMENT SITUATIONS OF CONSTRUCTION ENTERPRISE OF SERVICE
SUBCONTRACTING BY SECTOR(2017)单位:万元 (10 000 yuan)
指 标Indicators
总 计 Total
房屋建筑业
Building
土木工程建筑业 Civil
Engineering
建筑安装业Construction installation
建筑装饰和其他建筑业Construction Decoration and Other
Construction
企业个数(个) Number of Enterprise(unit) 58 18 8 12 20
#有工作量的企业个数 Number of Enterprises with Workload 58 18 8 12 20
生产情况 Production
建筑业总产值 Gross Output Value of Construction 735 957 159 652 14 287 132 155 429 863
计算建筑业劳动生产率的平均人数(人) Average Number of Employed Persons in 81 685 16 751 7 688 35 806 21 440
Calculation of Labor Productivity(person)
财务状况 Finance
固定资产原价 Fixed Assets 4 898 2 555 459 615 1 270
本年折旧 Depreciation Within the Year 642 343 27 38 234
资产总计 Total Assets 330 957 83 938 62 096 70 404 114 519
负债合计 Total Liabilities 265 137 65 020 51 844 50 279 97 994
实收资本 Actual Capital Hold 51 968 15 789 8 550 17 156 10 473
损益及分配 Expenditure,Income and Distribution
营业收入合计 Operating Revenue 1 205 805 161 382 99 988 514 847 429 588
#主营业务收入(工程结算收入) Revenue of Project Settlement Accounts 820 832 161 382 99 988 129 977 429 484
主营业务成本(工程结算成本) Costs of Project Settlement Accounts 739 488 117 380 92 584 124 124 405 399
主营业务税金及附加(工程结 Taxes and Extra Charges on Project 3 602 818 520 360 1 904
算税金及附加) Settle Accounts
费用合计(营业费用、管理费 Total Expenditures(expenditure for 14 487 3 612 1 806 4 115 4 954
用、财务费用) operating,management and finance)
营业利润 Operating Profits 8 321 1 373 469 5 085 1 394
利润总额 Total Profits 8 194 1 352 485 4 972 1 386
从业人员劳动报酬 Laborers Remuneration of Employed 352 203 106 144 76 420 68 370 101 269
Persons

150
5-8 总承包和专业承包建筑业企业生产情况
PRODUCTION SITUATIONS OF GENERAL AND SPECIALIZED CONTRACTTING
CONSTRUCTION ENTERPRISE
指 标Indicators
2013 2014 2015 2016 2017
企业个数(个) Number of Enterprise(unit) 862 778 734 804 931
#有工作量的企业个数 Number of Enterprises in Work 815 735 732 803 931
签订的合同额(万元) Contractual Value(10 000 yuan) 51 037 712 44 661 836 51 548 765 73 088 157 78 636 397
建筑业总产值 (万元) Gross Output Value of Construction 24 306 003 21 947 367 22 379 924 23 469 541 27 973 830
(10 000 yuan)
#装饰装修产值 Decorate and Materials Construction 9 126 191 9 322 131 8 549 706 8 916 677 9 965 061
#在外省完成的产值 Output Value of Buildings Completed outside of 9 557 089 10 125 983 9 805 416 9 157 373 10 403 920
Guangdong province
#建筑工程产值 Output Value of Contraction 21 065 426 18 697 375 19 055 814 18 784 835 22 341 675
安装工程产值 Output Value of Installation 2 602 278 2 493 923 2 378 744 3 459 952 4 280 585
其他产值 Others 638 300 756 068 945 367 1 224 754 1 351 571
竣工产值(万元) Output Value of buildings Completed 11 527 589 9 046 153 12 860 541 9 115 042 13 430 714
(10 000 yuan)
房屋建筑施工面积(万平方米) Floor Space of Buildings Under Construction 11 503 7 016 7 683 8 501 9 241
(10 000 sq.m)
#本年新开工面积 Floor Space of Newly-started Buildings in this Year 4 016 2 172 1 833 2 696 3 142
#实行投标承包面积 Floor Space of Contracted Projects through Biddimg 7 602 5 791 6 292 5 744
#本年新开工面积 Floor Space of Newly-started Buildings in this Year 3 185 1 604
房屋建筑竣工面积(万平方米) Floor Space of Buildings Completed 2 010 1 142 1 261 1 213 1 673
(10 000 sq.m)
自有施工机械设备年末总台数(台) Number of Machinery and Equipment 64 194 41 888 41 603 51 128
(year-end)(unit)
自有施工机械设备年末总功率 Total Power of Machinery and Equipment 131 165 105 143
(万千瓦) (10 000 kw)
自有施工机械设备年末净值(万元) Net Value of Machinery and Equipment 385 751 300 578 290 279
(10 000 yuan)
计算劳动生产率的平均人数(人) Average Number of Employed Persons in 688 275 618 975 633 913 625 433 724 436
Calculation of Labor Productivity(person)
全员劳动生产率(万元/人) Overall Labor Productivity(10 000 yuan/person) 35 35 35 38 39

151
5-9 总承包和专业承包建筑业企业财务状况
FINANCIAL SITUATIONS OF GENERAL AND SPECIALIZED CONTRACTTING
CONSTRUCTION ENTERPRISE单位:万元 (10 000 yuan)
指 标Indicators
2013 2014 2015 2016 2017
年末资产负债 Asset and Liabilities at Year-end
流动资产 Circulating Assets 18 799 457 20 780 810 24 253 968 29 234 932 39 077 684
#存货 Inventory 3 494 291 4 060 250 4 828 482 4 842 875 5 064 046
固定资产合计 Total Fixed Assets 1 222 584 1 414 850 1 347 074 1 375 273 1 447 211
固定资产原价 Original Value of Fixed Assets 1 753 975 1 830 211 1 802 916 1 891 265 2 002 845
累计折旧 Accumulative Total Depreciation 800 126 816 045 827 036 928 994 917 786
#本年折旧 Depreciation Within the Year 126 884 120 099 105 671 130 973 110 291
在建工程 Project Under Construction 126 106 167 454 239 179 299 894 273 482
资产合计 Total Assets 21 946 239 24 757 915 28 492 725 34 350 892 44 785 518
流动负债 Liquid Liabilities 13 784 765 15 029 638 16 796 161 19 557 260 27 286 380
非流动负债 Non-Liquid Liabities 587 419 1 128 102 1 159 424 1 560 451 1 838 300
负债合计 Total Liabilities 14 737 794 16 456 114 19 246 842 21 618 648 29 751 975
所有者权益 Creditors' Equity 7 208 444 8 301 801 10 099 663 12 731 928 15 031 962
#实收资本 Actual Capital Hold 3 766 766 4 652 044 5 294 095 5 531 962 6 683 485
国家资本 State Capital 408 608 470 877 356 124 573 223 907 015
集体资本 Collective Capital 113 871 134 594 104 793 96 063 175 921
法人资本 Corporation Capital 1 745 741 2 325 493 2 972 897 2 863 098 3 179 512
个人资本 Individual Capital 1 449 211 1 673 343 1 815 655 1 953 899 2 378 744
港澳台资本 Capital from HongKong,Macao and Taiwan 45 523 43 068 38 286 39 319 20 309
外商资本 Foreign Capital 3 813 4 670 6 340 6 359 21 985
损益及分配 Expenditure,Income and Distribution
工程结算收入 Revenue of Project Settlement Accounts 25 430 460 23 970 082 24 278 977 26 639 202 29 418 125
工程结算成本 Costs of Project Settlement Accounts 22 431 465 20 970 275 21 200 088 23 838 557 26 438 641
工程结算税金及附加 Taxes and Extra Charges on Project Settle Accounts 792 254 774 805 939 890 403 543 148 908
其他业务利润 Other Profits from Business 59 483 55 419 50 841 38 396 33 655
管理费用及财务费用 Management and Financial Expenditures 1 025 062 1 127 625 1 165 745 1 389 578 1 529 792
营业利润 Operating Surplus 1 003 889 999 104 1 108 194 1 009 543 1 122 907
利润总额 Total Profits 1 017 423 1 011 331 1 150 755 1 103 947 1 182 741
应交所得税 Income Taxes Payable 217 706 230 688 285 417 223 102 221 491

152
5-10 劳务分包建筑企业经营情况
MANAGEMENT SITUATIONS OF CONSTRUCTION ENTERPRISE OF SERVICE
SUBCONTRACTING单位:万元 (10 000 yuan)
指 标Indicators
2012 2013 2014 2015 2016 2017
企业个数(个) Number of Enterprise(unit) 26 36 39 41 45 58
#有工作量的企业个数 Number of Enterprises in Work 21 30 34 41 45 58
生产情况 Production
建筑业总产值 Gross Output Value of Construction 160 790 311 489 226 201 372 066 458 769 735 957
计算建筑业劳动生产率的平均人数(人) Average Number of Employed Persons in 6 108 22 953 25 022 23 995 61 869 81 685
Calculation of Labor Productivity(person)
财务状况 Finance
固定资产原价 Original Value of Fixed Assets 3 009 52 780 2 430 4 439 3 794 4 898
本年折旧 Depreciation Within the Year 865 612 450 279 348 642
资产总计 Total Assets 152 363 196 233 102 074 137 387 19 714 330 957
负债合计 Total Liabilities 135 538 176 079 70 309 106 770 160 693 265 137
实收资本 Actual Capital Hold 8 168 16 734 14 726 19 643 27 924 51 968
损益及分配 Expenditure,Income and Distribution
营业收入合计 Operating Revenue 168 479 359 674 243 285 347 864 894 817 1 205 805
#主营业务收入(工程结算收入) Revenue of Project Settlement Accounts 168 475 359 673 243 285 347 545 526 170 820 832
主营业务成本(工程结算成本) Costs of Project Settlement Accounts 165 939 335 943 220 066 320 293 493 106 739 488
主营业务税金及附加(工程结 Taxes and Extra Charges on Project Settle Accounts 5 501 12 240 8 223 11 225 8 326 3 602
算税金及附加)
费用合计(营业费用、管理费 Total Expenditures(expenditure for operating, 5 167 8 378 4 945 9 213 10 748 14 487
用、财务费用) management and finance)
营业利润 Operating Surplus 2 368 2 084 5 649 4 302 8 608 8 321
利润总额 Total Profits 2 212 2 063 5 336 4 361 6 668 8 194

153
主要统计指标解释
建筑业总产值 是以货币表现的建筑业企业在一定时期内生产的建筑业产品和服务的总和。建筑业总产
值包括三部分内容:
⑴建筑工程产值:指列入建筑工程预算内的各种工程价值。
⑵设备安装工程产值:指设备安装工程价值,但不包括设备本身的价值。
⑶其他产值:建筑业总产值中除建筑工程、安装工程以外的产值。包括房屋构筑物修理产值、非标准设
备制造产值、总包企业向分包企业收取的管理费以及不能明确划分的施工活动所完成的产值。
①房屋构筑物修理产值:指房屋和构筑物的修理所完成的价值,但不包括被修理房屋构筑物的本身价值
和生产设备的修理价值。
②非标准设备制造产值:指加工制造没有定型的非标准生产设备的加工费和原材料价值以及附属加工厂
为本企业承建工程制作的非标准设备的价值。
管理费用中税金 指企业按规定从管理费用中支付的各种税金,包括房产税、土地使用税、车船使用税、
印花税等。
利税总额=工程结算税金及附加+管理费用中税金+利润总额
建筑业全员劳动生产率=建筑业总产值÷计算建筑业劳动生产率的平均人数
房屋施工面积 指在报告期内施工的全部房屋建筑面积,它包括本期新开工的房屋面积、上期跨入本期
继续施工的房屋面积、上期停缓建在本期恢复施工的房屋面积、本期竣工的房屋面积以及本期施工后又停缓建
的房屋面积。
计算建筑业劳动生产率的平均人数 指建筑业企业(或单位)报告期实际拥有的、与建筑施工活动有关的人
员的平均人数,包括参加本企业(或单位)建筑施工活动的非本企业(或单位)人员,但不包括企业内部社会服务
性机构的人员以及由本企业支付工资但所从事的工作与本企业生产基本无关的人员。
工程结算税金及附加 指因从事建筑业生产活动,取得工程价款结算收入而按规定应该交纳的营业税、城
市维护建设税等以及随同营业税金一并计算交纳的教育费附加等。
利润总额 指企业在生产经营过程中各种收入扣除各种耗费后的盈余,反映企业在报告期内实现的亏盈
总额,包括营业利润、补贴收入、投资净收益和营业外收支净额。

154
Explanatory Notes on Main Statistical Indicators
Gross Output Value of Construction refers to the sum in monetary terms of construction products and services
completed by construction enterprises during a given period of time. It includes:
(1) Output value of construction projects, which is the value of various projects covered by the project budgets;
(2)Output value of equipment installation projects refers to the value of the installation of equipment. It does not
include the value of the equipment itself.
(3) Other output values, which are output values other than output value of construction projects and output value
of installation projects, including output value of house and building repair, output value of non-standard equipment
manufacture, management expenses received by overall contractor enterprises from subcontractor enterprises and output
value completed in unclassified construction activities.
①Output value of house and building repair is the value created through the repairs of houses and buildings,
excluding the value of houses or buildings being repaired and the value of the repair of production equipment.
②Output value of non-standard equipment manufacture is the value of non-standard production equipment
with unique specifications (including raw materials and manufacturing costs), and equipment manufactured by subsidiary
workshops for construction projects contracted by construction enterprises.
Taxes from Management Expenses refer to the taxes which should be borne by the enterprises
from management expenses, including property tax, land use tax, vehicle and vessel use tax, and stamp tax.
Total Pre-tax Profits = Taxes and Extra Charges on Project Settlement Accounts + Taxes from Management
Expenses + Total Profits
Overall Labor Productivity of Construction = Gross Output Value of Construction ÷ Average Number of Persons
for Labor Productivity Calculation
Floor Space of Buildings under Construction refers to the floor space of buildings under construction during
the reference period, including newly started buildings, buildings started earlier and continued into the reference period,
buildings suspended in preceding periods but resumed during the reference period, buildings completed during the
reference period, and buildings started and then suspended during the reference period.
Average Number of Persons for Labor Productivity Calculation of the Construction Industry refers to
the average number of persons actually employed in the construction enterprises (units) and engaged in related activities
of construction in the reference period, including non-staff personnel engaged in the construction activities of the
enterprises (units), but excluding personnel employed in social service institutions of the enterprises and those receiving
remunerations therefrom but engaged in activities basically irrelevant to the production of the enterprises.
Taxes and Extra Charges on Project Settlement Accounts refer to business tax, city maintenance and
construction tax and extra charges for education calculated and paid with business tax, which should be borne by the
enterprises obtaining project settlement incomes from the production activities of construction.
Total Profits refer to the surplus of various incomes in the production and operation of the enterprises after
deducting all expenses. This reflects the total profits or losses realized by the enterprises in the reference period, including
profits from operation, income from subsidies, net investment earnings and net income from activities other than
operations.


157
6-1 全社会客货运输(吞吐)量
PASSENGER AND FREIGHT TRAFFIC
项 目 Item
2013 2014 2015 2016 2017
一、货运量 (万吨) Freight Traffic (10 000 tons) 27 512 29 382 32 475 31 164 32 269
1. 铁路 Railways 389 124 67 72 71
2. 公路 Highways 20 071 20 990 24 774 23 787 23 953
3. 水运 Waterways 6 984 8 193 7 557 7 211 8 147
4. 民航 Civil Aviation 69 75 77 94 99
二、机场货物吞吐量 (万吨) Cargo Handled at Airport (10 000 tons) 91 96 101 113 116
三、货物周转量(亿吨公里) Turnover Volume of Freight Traffic 1 999.07 2386.35 2253.07 2246.86 2302.53
(100 million ton-km)
1. 铁路 Railways 2.07 1.10 0.67 0.67 0.74
2. 公路 Highways 284.80 301.93 324.91 368.05 383.07
3. 水运 Waterways 1 702.17 2 072.33 1 916.20 1 864.06 1 903.75
4. 民航 Civil Aviation 10.03 10.99 11.29 14.08 14.97
四、客运量(万人) Passenger Traffic (10 000 persons) 12 059 15 103 16 511 17 009 18 142
1. 铁路 Railways 2 543 4 740 5 532 6 616 7 042
2. 公路 Highways 5 986 6 370 6 574 5 585 6 001
3. 水运 Waterways 401 461 466 454 466
4. 民航 Civil Aviation 3 129 3 532 3 939 4 354 4 633
五、机场旅客吞吐量(万人) Passenger Departing at Airport (10 000 persons) 3 227 3 627 3 972 4 198 4 561
六、旅客周转量(亿人公里) Turnover Volume of Passenger Traffic 632.02 805.55 953.21 1 026.99 1 092.39
(100 million person-km)
1. 铁路 Railways 34.61 138.76 177.51 201.51 210.16
2. 公路 Highways 127.96 135.80 142.28 116.60 123.63
3. 水运 Waterways 1.74 2.05 2.03 2.00 2.14
4. 民航 Civil Aviation 467.71 528.94 631.39 706.88 756.46
七、港口 Harbor
1. 泊位数(个) Berths (unit) 159 153 156 152 155
#万吨级 10 000 Ton Class 67 67 67 72 74
2. 货物吞吐量(万吨) Cargo Handled at Seaports (10 000 tons) 23 398 22 324 21 706 21 410 24 136
#蛇口港区 Shekou Seaport 7 234 6 380 5 975 5 825 7 913
赤湾港区 Chiwan Seaport 5 984 5 340 5 483 5 555 5 648
妈湾港区 Mawan Seaport 1 801 1 435 1 011 983 771
盐田港区 Yantian Seaport 6 156 6 686 6 740 6 421 7 108
内河港区 Neihe Seaport 22 23 14 12 165
注:2007年、2009年、2012年、2014年货运量、货物周转量、客运量、旅客周转量分别有口径调整。Note: The statistical ranges of Freight Traffic,Turnover Volume of Freight Traffic,Passenger Traffic and Turnover Volume of Traffic are changed in 2007,2009,2012 and 2014, the data in the same period last year have been adjusted by the same caliber.

158
6-2 全社会客货运输和邮电业务量(一)
PASSENGER AND FREIGHT TRAFFIC,REVENUE FROM POSTAL AND
TELECOMMUNICATIONS SERVICES
年 份 Year
机场货邮行吞吐量(万吨)
Cargo Handled at Airport
(10 000 tons)
机场旅客吞吐量 (万人)
Passenger Departing at Airport
(10 000 persons)
货运量 (万吨) Freight Traffic
(10 000 tons)
货物周转量 (亿吨公里) Turnover Volume of
Freight Traffic (100 million ton-km)
客运量 (万人)
Passenger Traffic
(10 000 persons)
1986 1 521 15 3 973
1987 1 627 14 4 268
1988 1 704 22 5 858
1989 1 383 36 6 349
1990 1 349 26 8 833
1991 2 1 486 44 6 400
1992 2 166 1 801 55 8 153
1993 4 255 2 050 74 10 218
1994 6 319 2 604 78 8 531
1995 8 412 3 542 223 8 261
1996 9 435 3 647 233 8 281
1997 10 444 3 853 232 8 515
1998 11 515 4 050 213 8 484
1999 16 525 4 274 197 8 754
2000 21 642 4 697 206 9 346
2001 25 777 5 147 204 9 869
2002 33 935 5 683 211 10 632
2003 41 1 084 6 478 244 10 471
2004 50 1 424 7 168 283 12 019
2005 55 1 574 8 249 322 12 602
2006 56 1 836 11 429 731 13 965
2007 62 2 062 13 678 794 15 056
2008 60 2 140 19 570 1 094 154 283
2009 61 2 449 22 367 1 137 146 316
2010 81 2 671 26 174 1 654 156 203
2011 83 2 825 28 901 1 956 168 447
2012 85 2 957 28 678 1 981 184 982
2013 91 3 227 27 512 1 999 12 059
2014 96 3 627 29 382 2 386 15 103
2015 101 3 972 32 475 2 253 16 511
2016 113 4 198 31 164 2 247 17 009
2017 116 4 561 32 269 2 303 18 142

159
6-2 全社会客货运输和邮电业务量(二)
PASSENGER AND FREIGHT TRAFFIC,REVENUE FROM POSTAL AND
TELECOMMUNICATIONS SERVICES
年 份 Year
旅客周转量 (亿人公里) Turnover Volume of Passenger
Traffic (100 million person-km)
港口货物吞吐量 (万吨)
Cargo Handled at Seaports
(10 000 tons)
港口集装箱吞吐量 (万标箱)
Cargo Handled at Seaports
(10 000 TEU)
邮电业务总量 (万元)
Revenue from Postal and
Telecommunications Services
(10 000 yuan)
# 出口 Exports
1979 10 138
1980 30 190
1981 70 340
1982 91 420
1983 141 567
1984 210 923
1985 327 1 761
1986 9 302 2 633
1987 14 485 4 880
1988 19 734 1 14 826
1989 22 956 2 21 293
1990 27 1 292 2 55 356
1991 19 1 563 5 84 927
1992 41 1 956 11 114 492
1993 48 2 541 13 174 045
1994 79 3 002 18 11 259 432
1995 82 3 080 28 16 368 945
1996 83 3 021 59 32 462 261
1997 83 3 357 115 63 610 111
1998 82 3 444 195 104 764 658
1999 87 4 663 299 158 982 686
2000 99 5 697 400 210 1 336 000
2001 112 6 643 508 266 1 419 000
2002 131 8 767 762 396 1 644 200
2003 145 11 220 1 065 552 1 980 300
2004 186 13 537 1 366 713 2 660 100
2005 226 15 351 1 620 841 3 208 000
2006 268 17 598 1 847 961 3 795 000
2007 311 19 994 2 110 1 101 5 135 400
2008 485 21 125 2 142 1 087 6 117 500
2009 544 19 365 1 825 937 6 765 200
2010 635 22 098 2 251 1 154 2 937 000
2011 693 22 325 2 257 1 169 3 562 600
2012 802 22 807 2 294 1 173 5 635 800
2013 632 23 398 2 328 1 208 6 229 900
2014 806 22 324 2 404 1 247 7 619 900
2015 953 21 706 2 420 1 236 10 403 200
2016 1 027 21 410 2 398 1 239 17 150 200
2017 1 092 24 136 2 521 1 278 16 455 500
注: 邮电业务总量1989年以前按1980年不变价格计算,1990-2000年按1990年不变价格计算;2001-2009年按2000年不变价格计算;2011-2016年按2010年不变价计算, 2010年数据相应调整;2017年起,电信业务量按2015年不变价计算,邮政业务量仍按2010年不变价计算。Note: Revenue from Postal and Telecommunications Services in 1989, calculated at 1980 constant prices; from 1990 to 2000 at 1990 constant prices; 2001-2009 at 2000 constant prices; 2011-2016 calculated at 2010 constant prices, 2010 data has adjusted;from 2017,Business Volume of Telecommunication Services is calculated at 2015 constant prices,Business Volume of Postal Services is calculated at 2010 constant prices.
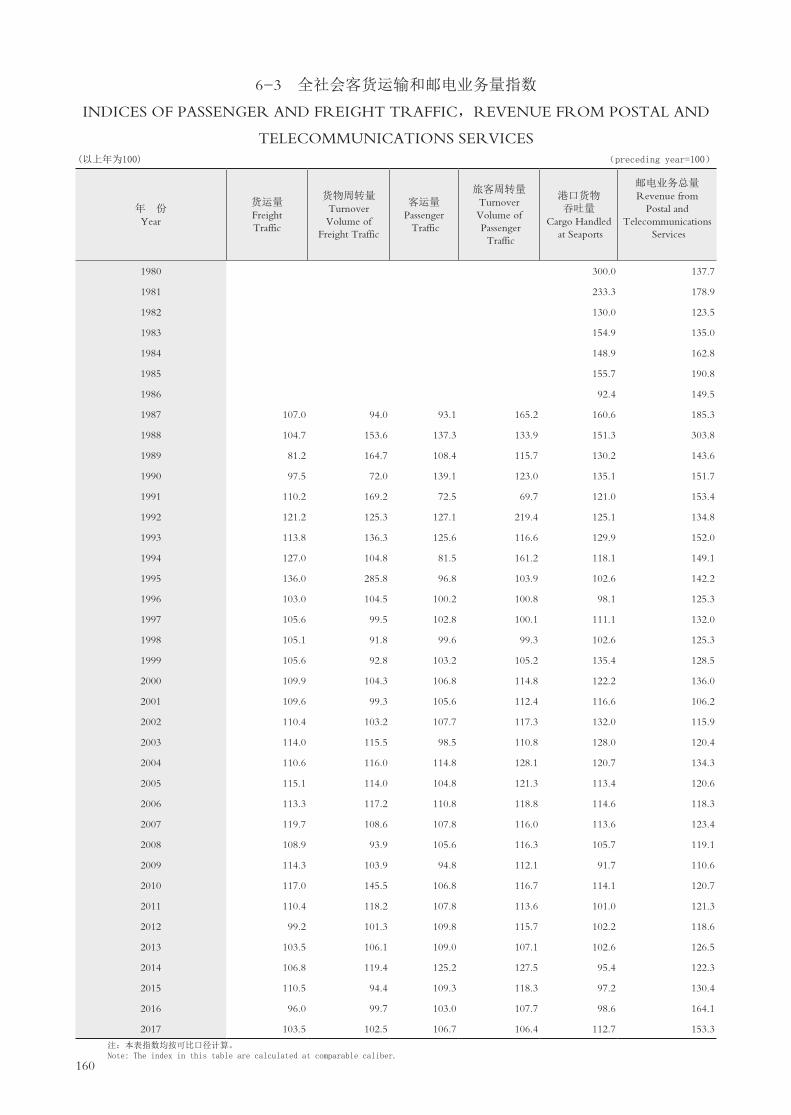
160
6-3 全社会客货运输和邮电业务量指数
INDICES OF PASSENGER AND FREIGHT TRAFFIC,REVENUE FROM POSTAL AND
TELECOMMUNICATIONS SERVICES (以上年为100) (preceding year=100)
年 份 Year
货运量 Freight Traffic
货物周转量 Turnover Volume of
Freight Traffic
客运量 Passenger Traffic
旅客周转量 Turnover Volume of Passenger
Traffic
港口货物 吞吐量
Cargo Handled at Seaports
邮电业务总量 Revenue from
Postal and Telecommunications
Services
1980 300.0 137.7
1981 233.3 178.9
1982 130.0 123.5
1983 154.9 135.0
1984 148.9 162.8
1985 155.7 190.8
1986 92.4 149.5
1987 107.0 94.0 93.1 165.2 160.6 185.3
1988 104.7 153.6 137.3 133.9 151.3 303.8
1989 81.2 164.7 108.4 115.7 130.2 143.6
1990 97.5 72.0 139.1 123.0 135.1 151.7
1991 110.2 169.2 72.5 69.7 121.0 153.4
1992 121.2 125.3 127.1 219.4 125.1 134.8
1993 113.8 136.3 125.6 116.6 129.9 152.0
1994 127.0 104.8 81.5 161.2 118.1 149.1
1995 136.0 285.8 96.8 103.9 102.6 142.2
1996 103.0 104.5 100.2 100.8 98.1 125.3
1997 105.6 99.5 102.8 100.1 111.1 132.0
1998 105.1 91.8 99.6 99.3 102.6 125.3
1999 105.6 92.8 103.2 105.2 135.4 128.5
2000 109.9 104.3 106.8 114.8 122.2 136.0
2001 109.6 99.3 105.6 112.4 116.6 106.2
2002 110.4 103.2 107.7 117.3 132.0 115.9
2003 114.0 115.5 98.5 110.8 128.0 120.4
2004 110.6 116.0 114.8 128.1 120.7 134.3
2005 115.1 114.0 104.8 121.3 113.4 120.6
2006 113.3 117.2 110.8 118.8 114.6 118.3
2007 119.7 108.6 107.8 116.0 113.6 123.4
2008 108.9 93.9 105.6 116.3 105.7 119.1
2009 114.3 103.9 94.8 112.1 91.7 110.6
2010 117.0 145.5 106.8 116.7 114.1 120.7
2011 110.4 118.2 107.8 113.6 101.0 121.3
2012 99.2 101.3 109.8 115.7 102.2 118.6
2013 103.5 106.1 109.0 107.1 102.6 126.5
2014 106.8 119.4 125.2 127.5 95.4 122.3
2015 110.5 94.4 109.3 118.3 97.2 130.4
2016 96.0 99.7 103.0 107.7 98.6 164.1
2017 103.5 102.5 106.7 106.4 112.7 153.3
注:本表指数均按可比口径计算。 Note: The index in this table are calculated at comparable caliber.

161
6-4 全社会民用车辆和运输船舶拥有量
NUMBER OF CIVIL MOTOR VEHICLES AND TRANSPORT VESSELS OWNED
项 目 Item
2012 2013 2014 2015 2016 2017
民用车辆总计(辆) Total Civil Motor Vehicles (unit) 2 249 216 2 622 873 3 153 902 3 193 498 3 225 879 3 265 998
一、民用汽车(辆) Civil Automobile (unit) 2 210 821 2 583 869 3 111 488 3 147 043 3 178 832 3 214 434
1. 载客汽车(辆) Buses and Cars (unit) 1 901 268 2 254 157 2 776 710 2 817 908 2 828 974 2 827 106
载客量(客位) Number of Seats in Buses and Cars(seat) 15 037 055 17 828 640 21 973 631 16 612 523 16 606 573 17 088 098
#大型(辆) Large Scales (unit) 37 486 36 167 35 109 33 764 38 329 44 571
载客量(客位) Number of Seats(seat) 1 465 603 1 414 036 1 376 671 1 635 274 1 851 291 2 312 149
2. 普通载货汽车(辆) Ordinary Trucks (unit) 296 849 316 104 320 778 314 730 335 476 372 024
载重量(吨位) Capacity(ton) 1 788 999 1 905 102 1 945 272 1 785 759 1 905 504 915 073
#大型(辆) Heavy (unit) 52 699 61 711 68 851 71 165 80 366 91 887
载重量(吨位) Capacity (ton) 573 689 671 695 750 612 411 299 875 186 583 366
3. 其他专用汽车(辆) Other Special Motor Vehicles (unit) 12 704 13 608 14 000 14 405 14 382 15 304
4. 特种汽车(辆) Particular Motor Vehicles 235 235 235 14 382
二、摩托车(辆) Motorcycle(unit) 5 589 6 018 6 752 7 535 6 221 6 814
三、货挂车(辆) Trailer Trucks(unit) 32 802 32 982 35 658 38 916 40 826 44 750
四、其他(辆) Other (unit) 4 4 4 4
民用运输船舶总计(艘) Total Civil Transport Vessels (unit) 245 252 265 269 277 295
一、机动船艘数(艘) Motor Vessels (unit) 241 245 261 265 273 291
载客量(客位) Number of Seats (seat) 3 993 5 912 4 533 4 892 5 431 5 942
净载重量(吨位) Dead Weight Tonnage (ton) 3 659 336 3 836 423 3 802 578 3 781 309 3 801 680 3 780 781
总功率(千瓦) Total Power (kw) 810 554 858 502 880 739 887 538 908 786 964 226
1. 客船艘数(艘) Passenger Transport Vessels (unit) 18 21 22 24 26 29
载客量(客位) Number of Seats (seat) 3 993 5 912 4 533 4 892 5 431 5 942
2. 货船艘数(艘) Freight Transport Vessels (unit) 218 221 228 232 238 253
净载重量(吨位) Dead Weight Tonnage (ton) 3 659 336 3 836 044 3 802 164 3 780 844 3 801 175 3 780 204
3. 拖船艘数(艘) Tugboats (unit) 5 10 11 9 9 9
二、驳船艘数(艘) Barges (unit) 4 7 4 4 4 4
净载重量(吨位) Dead Weight Tonnage(ton) 10 000 15 456 10 000 10 000 10 000 10 000

162
6-5 邮电业务量及邮电通讯设施
BUSINESS VOLUME OF POSTAL AND TELECOMMUNICATIONS SERVICES,
FACILITIES OF POST AND TELECOMMUNICATIONS
项 目 Item
2013 2014 2015 2016 2017
邮电业务总量(亿元)Business Volume of Post and Telecommunications (100 million yuan)
622.99 761.99 1040.32 1 715.02 1645.55
# 邮政(快递)业务量(亿元) Business Volume of Post(100 million yuan) 429.52 666.67 375.49
函件(万件) Mail (10 000 pcs) 14 612 14 734 17 623 21 179 22 134
包件(万件) Parcels (10 000 pcs) 190 133 28 12 10
订销报纸期发数(万份) Number of Newspapers Circulation (10 000pcs) 38 32 34 32 33
订销报纸累计份数(万份) Total Copy of Newspapers (10 000 pcs) 11 024 10 051 9 023 8 709 8 847
订销杂志期发数(万份) Number of Magazines Circulation (10 000 pcs) 49 38 44 37 38
订销杂志累计份数(万份) Total Copy of Magazines (10 000 pcs) 785 735 710 642 651
固定电话用户(万户)Number of Installed Telephone Subscribers (subscribers)
532.42 529.51 754.12 644.18 478.30
移动电话用户(万户)Number of Mobile Telephones Subscribers (10 000 subscribers)
2 766 3 377 2 621 2 505 2 679
互联网宽带网用户(万户)Internet Subscribers Nunber of Wide Band(10 000 subscriders)
584 630 674 632 483
邮政.电信局、所(处)Number of Post and Telecommunications Offices(Unit)
797 679 678 745 541
邮运邮路总条数(条) Total Number of Mail Routes (route) 73 96 105 157 242
邮路长度(单程)(公里) Length of Postal Routes (km) 10 194 10 522 10 538 12 583 32 964
城市投递段道长度(单程)(公里) Length of City Delivery Routes (km) 21 650 22 115 23 075 33 306 41 700
全市固定电话交换机总容量(万门)
Total Capacity of Telephone Exchanges (10 000 lines)
570 570 570 570 286
全市移动电话交换机容量(万门)Total Capacity of Mobile Telephone Exchanges (10 000 lines)
2 812 2 812 2 812 2 812 4 929

163
6-6 年末公路通车里程到达数(按技术等级)
LENGTHS OF OPERATION MILEAGE AT YEAR-END(GROUPED BY GRADE)
单位:公里 (km)
年 份 Year
公路里程总计 OperationMileage
高速公路 Express Way
一级公路 First ClassHighways
二级公路 Second Class
Highwsys
三级公路 Third Class Highwsys
四级公路 Fourth Class Highwsys
1980 746 3 120 508
1981 736 14 103 504
1982 743 17 111 501
1983 745 17 152 461
1984 786 17 173 482
1985 791 19 194 463
1986 810 19 202 515
1987 803 19 267 454
1988 835 16 286 476
1989 837 13 14 279 475
1990 832 13 12 276 496
1991 827 56 12 236 488
1992 907 58 11 235 567
1993 917 81 11 221 568
1994 972 28 121 39 210 538
1995 1 103 110 202 68 185 503
1996 1 169 110 246 84 174 519
1997 1 214 133 267 88 177 514
1998 1 258 155 355 178 216 352
1999 1 344 176 401 195 214 355
2000 1 357 176 420 197 196 365
2001 1 361 186 525 257 180 213
2002 1 510 196 575 282 255 202
2003 1 540 203 590 282 255 210
2004 1 540 203 588 280 260 210
2005 1 580 245 588 280 258 210
2006 1 930 268 860 366 274 162
2007 1 938 269 867 351 284 167
2008 1 619 340 703 259 217 100
2009 1 619 340 703 259 217 100
2010 1 617 340 691 270 217 100
2011 1 618 340 691 270 217 100
2012 1 659 390 686 270 209 105
2013 1 680 420 685 270 209 96
2014 1 647 421 665 256 209 96
2015 1 644 421 665 256 207 96
2016 1 638 420 664 255 203 96
2017 1 634 420 677 239 202 96
注: 从2008年开始,公路里程统计口径有调整。Note: From 2008,the statistical coverage of operaton mileage have been adjusted.

164
主要统计指标解释
铁路营业里程 又称营业长度(包括正式营业和临时营业里程),指办理客货运输业务的铁路正线总长度。
凡是全线或部分建成双线及以上的线路,以第一线的实际长度计算;复线、站线、段管线、岔线和特殊用途线
以及不计算运费的联络线都不计算营业里程。该指标可以反映铁路运输业基础设施的发展水平,也是计算客货
周转量、运输密度和机车车辆运用效率等指标的基础资料。
公路通车里程 指在一定时期内实际达到《公路工程[WTBZ]技术标准JTJ01-88》规定的等级公路,并经
公路主管部门正式验收交付使用的公路里程数。包括大中城市的郊区公路以及通过小城镇街道部分的公路里程
和桥梁、渡口的长度,不包括大中城市的街道、厂矿、林区生产用道和农业生产用道的里程。两条或多条公路
共同经由同一路段,只计算一次,不得重复计算里程长度。该指标可以反映公路建设的发展规模,也是计算运
输网密度等指标的基础资料。
内河航道里程 也称内河通航里程,指在一定时期内,能通航运输船舶及排筏的天然河流、湖泊水库、
运河及通航渠道的长度。包括全年季节性通航累计三个月以上的航道,不包括仅供零散流放竹、木排的河道。
该指标可以反映内河水运网的规模、水平和发展情况。
民用航空航线里程 指民航运输定期班机飞行的航线长度的总和。航线长度按机场之间的距离计算,通
常有两种计算方法:一是将每条航线长度相加称为重复计算航线里程;一是将两线或两条以上航线经过同一区
段里程,只计算一次航线长度称为不重复计算航线里程。一般常用的是后者,该指标可以确切反映民航运输网
的规模,是表明民航事业为国民经济服务和方便人民生活程度的主要指标。
货(客)运量 指在一定时期内,各种运输工具实际运送的货物(旅客)数量。该指标是反映运输业为国民经
济和人民生活服务的数量指标,也是制定和检查运输生产计划、研究运输发展规模和速度的重要指标。货运按
吨计算,客运按人计算。货物不论运输距离长短、货物类别,均按实际重量统计。旅客不论行程远近或票价多
少,均按一人一次客运量统计;半价票、小孩票也按一人统计。
货物(旅客)周转量 指在一定时期内,由各种运输工具运送的货物(旅客)数量与其相应运输距离的乘积之
总和。该指标可以反映运输业生产的总成果,也是编制和检查运输生产计划,计算运输效率、劳动生产率以及
核算运输单位成本的主要基础资料。计算货物(旅客)周转量通常按发出站与到达站之间的最短距离,也就是计
费距离计算。计算公式为:
货物(旅客)周转量=∑(货物(旅客)运输量×运输距离)
港口货物吞吐量 指经水运进出港区范围,并经过装卸的货物数量,包括邮件及办理托运手续的行李、
包裹以及补给运输船舶的燃料、物料和淡水。货物吞吐量按货物流向分为进口、出口吞吐量,按货物交流性质
分为外贸货物吞吐量和国内贸易货物吞吐量。货物吞吐量的货类构成及其流向,是衡量港口生产能力大小的重
要指标。
民用汽车 指报告期末,在公安交通管理部门按照《机动车注册登记工作规范》,已注册登记领有民用
车辆牌照的全部汽车数量。汽车统计的主要分类:根据汽车结构分为载客汽车、载货汽车及其他汽车;根据汽
车所有者不同分为个人(私人)汽车、单位汽车;根据汽车的使用性质分为营运汽车、非营运汽车;根据汽车大
小规格不同载客汽车分为大型、中型、小型和微型,载货汽车分为重型、中型、轻型和微型。
邮电业务总量 指以价值量形式表现的邮电通信企业为社会提供各类邮电通信服务的总数量。邮电业务

165
量按专业分类包括函件、包件、汇票、报刊发行、邮政快件、特快专递、邮政储蓄、集邮、公众电报、用户电
报、传真、长途电话、出租电路、无线寻呼、移动电话、分组交换数据通信、出租代维等。计算方法为各类产
品乘以相应的平均单价(不变价)之和,再加上出租电路和设备、代用户维护电话交换机和线路等的服务收入。
该指标综合反映了一定时期邮电业务发展的总成果,是研究邮电业务量构成和发展趋势的重要指标。计算公式
为:
邮电业务总量=∑(各类邮电业务量×不变单价)+出租代维及其他业务收入 =邮政业务总量+通信业务
总量
移动电话用户 指通过移动电话交换机进入移动电话网、占用移动电话号码的各类电话用户。包括签约
用户和智能网预付费用户。一个移动电话号码统计为一户。
本地电话用户 指接入本地电信运营商固定电话网上的电话用户。包括:住宅用户、单位用户、公用
电话用户等。按电话用户位置又分为城市电话用户和乡村电话用户。按通信手段又分为固定电话用户和无线
市话用户。1997年以前,“城市(内)电话用户”是指接入县城及县以上城市的电话网上的电话用户; “乡
(农)村电话用户”是指接入县邮电局农话台及县以下农村电话交换点,以县城为中心(除市话用户外)联通
县、乡(镇)、行政村、村民小组的用户。从1997年起,电话用户数分组调整为以用户所在区域划分为“城市电
话用户”和“乡村电话用户”,与过去的按市内电话和农村电话划分方法不同。
国际互联网总用户 包括互联网窄带拨号用户和互联网宽带接入用户。互联网窄带拨号用户又分为互联
网注册拨号用户、互联网主叫电话记费用户、互联网上网卡用户等几种。互联网注册拨号用户指由基础电信运
营商用户提供的,使用固定帐号上网的一种方式,由用户到运营商的营业厅或业务代理商处申请办理,获得拨
号上网帐号及密码,用户根据该帐号及密码拨叫上网特服号,通过认证获得动态IP地址接入宽带互联网。互联
网主叫电话记费用户指用户不需要到运营商的营业厅或业务代理商处申请办理,只需要拨打某一运营商已经开
通的主叫特服号码即可上网,上网费用随主叫电话收取。互联网上网卡用户指使用上网卡上的帐号和密码认
证,通过PSTN、N-ISDN等方式接入宽带互联网的用户。互联网宽带接入用户指采用分组交换网、DDN网、
帧中继/ATM网以及模拟专线、数字专线等方式,不经过基础电信运营商的宽带IP城域网,直接接入宽带互联
网节点的用户,不含XDSL、专线和LAN专线用户。
本地交换设备容量 指安装在电信运营企业内用于接续本地固定电话的电话交换机容量,包括现用和备
用的人工或自动交换机的全部容量。包括局用交换机容量、接入网设备容量(含无线市话)和用户交换机容
量。
移动电话交换机容量 指移动电话交换机根据一定话务模型和交换机处理能力计算出来的最大同时服务
用户的数量。

166
Explanatory Notes on Main Statistical Indicators
Length of Railways in Operation refers to the total length of the trunk line under passenger and freight
transportation (including both regular operations and temporary operations). In the case of wholly or partially double- or
multi-track railways, calculation is based on the actual length of the first track, regardless of other tracks, station sidings,
tracks under the charge of stations, branch lines, special-purpose lines and connecting lines. The length of railways in
operation is an important indicator of the development of infrastructure for railway transport, as well as the foundation for
the calculation of passenger-kilometers and freight ton-kilometers, traffic density and utilization efficiency of locomotives
and carriages.
Length of Highways refers to the length of highways built in conformity with the grades specified by the
Technical Standards JTJ01-88 for Highway Engineering, formally checked and accepted by highway authorities and
put into use. The length of highways includes that of suburban highways at large and medium-sized cities and highways
passing through streets at small cities and towns, as well as the span of bridges and ferries. However, it does not include
the length of streets in large and medium-sized cities and highways built for production purposes at factories, mines,
forest areas and agricultural areas. If two or more highways share the same segment, the length of the shared segment is
only calculated for once and no duplication is allowed. The length of highways is an important indicator of the scale of
development of highway construction, as well as the foundation for the calculation of transport network density and other
indicators.
Length of Navigable Inland Waterways refers to the length of natural rivers, lakes, reservoirs, canals, and ditches
open to navigation during a given period, which enables the transport by ships and rafts. This includes channels open to
seasonal navigation for an accumulative period of over 3 months in a year, but excludes river courses used exclusively for
wood or bamboo rafts on an irregular basis. This indicator reflects the scale, level and development situation of the inland
waterway network.
Length of Civil Aviation Routes refers to the length of all routes for regular civil aviation flights. Calculation of
route lengths is based on the distance between airports, usually in either of the following ways: duplicated calculation of
route lengths, which directly sums up the length of every single air route; or singular calculation of route lengths, which
calculates the same segments of aviation routes shared by two or more routes only once. In general practice, the latter is
used, as it can precisely reflect the size of the civil aviation network and indicate the extent to which civil aviation serves
the national economy and the needs of the people.
Freight (Passenger) Traffic refers to the volume of freight (passengers) transported with various means. This
indicator provides a quantitative measure of how the transport industry serves the national economy and the needs of
the people, as well as an important reference for drafting and checking production plans in the transport industry and for
studying the scale and speed of development in the transport industry. Freight transport is calculated in tons and passenger
traffic is calculated in the number of persons. Freight transport is calculated in the actual weight of goods regardless of
traveling distances and types of freight; while passenger traffic is calculated as the number of individuals traveling once,
regardless of traveling distances, ticket prices, whether the passengers are traveling with half-price tickets or child tickets.
Freight Ton-kilometers (Passenger-kilometers) refer to the sum of the products of the volume of transported
cargo (passengers) multiplied by the transport distance. These are important indicators of the total achievements of

167
the transport industry, as well as the major foundation for drafting and checking production plans in the transport
industry and for calculating the efficiency, labor productivity and the cost of transport enterprises. Normally, the
shortest distance between the departure station and the destination station (i.e. the payable distance) is the basis
to calculate the freight ton-kilometers and passenger-kilometers on. These indicators are calculated as follows:
Freight Ton-kilometers (Passenger-kilometers) = ∑(Freight (Passenger) Traffic ×Transport Distance)
Volume of Freight Handled in Ports refers to the volume of cargo passing in and out of the harbor area that
undergoes the loading and unloading processes, including mails, checked baggage and bales, as well as fuel, material and
fresh water supplies to ships. The volume of freight handled may be classified by direction of flow as import volume and
export volume, or by nature of cargo as volume of freight for domestic trade and volume of freight for foreign trade. The
classification of volume of freight handled and its direction of flow are important indicators of the production capacity of
ports.
Possession of Civil Motor Vehicles refers to the total number of vehicles that are registered at transport
management offices under the public security authorities and provided with civil vehicle licenses and tags according to
the Work Standard for Motor Vehicles Registration at the end of the reference period. Major categories of vehicle are:
passenger vehicles, freight vehicles and other vehicles in terms of structure; private vehicles and organization-owned
vehicles in terms of ownership; commercial vehicles and non-commercial vehicles in terms of use; large, medium, small
and mini passenger vehicles, and heavy, medium, light and mini trucks in terms of size.
Business Volume of Postal and Telecommunication Services refers to the total amount of postal and
telecommunication services, expressed in value terms, provided by postal and telecommunication enterprises for the
society. Postal and telecommunication services can be classified as letters, parcels, remittance, delivery of newspapers
and magazines, fast mail service, express mail service, savings deposits, stamps for collection, public and individual
telegraph service, facsimiles, long-distance telephone service, leasing of telephone lines, urban paging service, mobile
telephone service, data communication through packet networks, network elements lease and maintenance, etc. To
calculate the volume, the business volume of each product is multiplied by its average unit price (at constant prices),
summed, and added to income from other services such as leasing of telephone lines and equipment, maintenance of
telephone switchboards and lines on behalf of customers. This indicator reflects the overall achievements of postal and
telecommunication services during a given period, and is an important reference for studying the composition of business
volume and the development trend of postal and telecommunication services. This volume is calculated as follows:
Business Volume of Postal and Telecommunication Services = ∑(Business Volume of Each Product×Constant
Unit Price) + Income from Leasing, Maintenance, and Other Services = Business Volume of Postal Services + Business
Volume of Telecommunication Services
Mobile Telephone Subscribers refer to persons who own mobile telephone numbers and are connected with
the mobile telephone communication network through mobile telephone switchboards, including contracted subscribers
and pre-paid subscribers for intelligent network. One mobile telephone number is calculated as one subscriber.
Local Telephone Subscribers refer to subscribers that are connected to the local telecommunication service
provider through fix line network, including household subscribers, institutional subscribers and public telephones. They
are also classified as urban subscribers and rural subscribers according to locations, or fixed-line subscribers and wireless
subscribers according to the means of telecommunication. Before 1997, urban subscribers referred to those connected
to urban telephone networks in county towns and cities, while rural subscribers referred to those connected to rural

168
telephone stations at or below the county level, clustered around the county town (excluding urban subscribers), and
further connected to the county, towns and townships, administrative villages and villagers’ groups. Since 1997, the
classification of telephone subscribers into urban telephone subscribers and rural telephone subscribers was modified
on the basis of geographical location of the subscribers, which is different from the previous distinction between urban
telephones and rural telephones.
Number of Internet Subscribers include both narrow-band dial-up users and broad-band access users of
the internet. Narrow-band dial-up users are further classified into registered dial-up users, pay-per-calling users,
and pre-pay card users. Registered dial-up service enables internet access through fixed accounts provided by basic
telecommunication operators. Users of this service apply to the operators or their agents for accounts and passwords, with
which they dial special numbers for internet connection and acquire dynamic IP addresses through authentification to
gain access to the broad-band internet. Pay-per-calling service implies that instead of applying to the operators or their
agents, users only need to dial a certain operator’s special numbers to gain access to the internet and pay internet fees
together with their calling fees. Pre-pay card users refer to those connected to the broad-band internet through PSTN
and N-ISDN networks with accounts and passwords provided by the pre-pay cards. Broad-band access users (exclusive
of XDSL and LAN users) refer to users directly connected to broad-band internet nodes through packet networks, DDN
networks, frame relay/ATM networks, and special analog or digital lines, bypassing the broad-band IP MAN provided
by basic telecommunication operators.
Capacity of Local Telephone Exchanges refers to the capacity of telephone exchanges installed in the offices
of telecommunication service providers for communication between fixed telephones. It includes the capacity of
both manual and automatic exchanges in use and for stand-by purpose. It consists of the capacity of office telephone
exchanges, access network equipment (including wireless city call) and subscriber exchanges.
Capacity of Mobile Telephone Exchanges refers to the maximum number of subscribers that can be served
simultaneously, calculated according to a certain calling model and the handling capacity of the mobile telephone
exchanges.

AGRICULTURE07

170
7-1 农业总产值
GROSS OUTPUT VALUE OF AGRICULTURE
单位:万元 (10 000 yuan)
年 份 Year
农业总产值 Gross Output
Value of Agriculture
种植业 Planting
林 业 Forestry
牧 业 Animal
Husbandry
渔 业 Fishery
农林牧渔服务业 Services of
Farming,Forestry,Animal Husbandry and Fishery
1979 13 106 6 494 85 1 598 433 4 496
1980 16 938 6 913 69 2 186 1 084 6 686
1981 24 181 8 515 153 5 677 1 869 7 967
1982 26 929 9 402 281 7 540 2 744 6 962
1983 29 083 10 930 207 7 832 3 400 6 714
1984 40 416 13 931 912 10 346 7 895 7 332
1985 45 821 15 641 1 371 14 444 7 875 6 490
1986 49 552 18 947 1 259 17 132 10 956 1 258
1987 73 772 26 631 1 678 28 869 14 339 2 255
1988 99 404 32 296 1 315 42 202 19 852 3 739
1989 108 015 31 412 1 253 54 389 19 010 1 951
1990 119 205 37 622 1 716 52 550 24 043 3 274
1991 143 063 40 697 4 097 63 117 31 025 4 127
1992 185 297 57 458 5 637 81 532 36 334 4 335
1993 192 880 49 977 3 519 94 969 38 506 5 909
1994 224 776 54 363 2 334 110 150 52 322 5 607
1995 232 653 58 407 2 207 125 623 43 173 3 243
1996 273 246 70 642 2 989 141 464 52 080 6 071
1997 270 889 73 030 3 792 124 140 64 676 5 250
1998 298 174 79 738 6 773 139 244 65 967 6 452
1999 299 662 91 560 5 312 126 799 68 401 7 590
2000 311 359 95 289 5 560 128 417 72 522 9 571
2001 327 111 105 153 5 060 127 565 76 213 13 120
2002 340 757 115 021 4 790 135 377 76 279 9 290
2003 337 406 111 989 6 557 135 940 76 935 5 985
2004 299 939 96 930 6 409 102 689 88 516 5 395
2005 217 369 53 152 4 861 75 334 76 831 7 191
2006 180 017 38 280 3 930 66 538 59 615 11 654
2007 171 380 43 415 6 682 64 678 42 875 13 730
2008 187 859 45 786 5 474 69 383 53 131 14 084
2009 154 760 42 590 2 062 55 992 39 550 14 564
2010 150 467 48 707 1 606 43 734 38 918 17 502
2011 152 533 46 535 2 159 48 691 37 855 17 293
2012 148 572 45 024 1 298 43 669 42 291 16 290
2013 139 479 53 307 757 36 547 44 149 4 719
2014 129 156 37 842 1 307 26 292 58 352 5 363
2015 159 515 32 799 1 975 22 422 95 487 6 831
2016 167 329 51 853 3 222 18 319 85 918 8 017
2017 388 609 123 414 2 379 29 013 214 992 18 811
注: 本表按当年价格计算 Note:The data in this table are calculated at current prices.

171
7-2 农业总产值构成
COMPOSITION OF GROSS OUTPUT VALUE OF AGRICULTURE
单位:% (%)
年 份 Year
总 计 Total 种植业
Planting林 业 Forestry
牧 业 Animal
Husbandry
渔 业 Fishery
农林牧渔服务业 Services of
Farming,Forestry,Animal Husbandry and Fishery
1979 100.0 49.6 0.6 12.2 3.3 34.3
1980 100.0 40.8 0.4 12.9 6.4 39.5
1981 100.0 35.2 0.6 23.5 7.7 33.0
1982 100.0 34.9 1.0 28.0 10.2 25.9
1983 100.0 37.6 0.7 26.9 11.7 23.1
1984 100.0 34.5 2.3 25.6 19.5 18.1
1985 100.0 34.1 3.0 31.5 17.2 14.2
1986 100.0 38.2 2.6 34.6 22.1 2.5
1987 100.0 36.1 2.3 39.1 19.4 3.1
1988 100.0 32.5 1.3 42.5 20.0 3.7
1989 100.0 29.1 1.2 50.3 17.6 1.8
1990 100.0 31.6 1.4 44.1 20.2 2.7
1991 100.0 28.4 2.9 44.1 21.7 2.9
1992 100.0 31.0 3.0 44.0 19.6 2.4
1993 100.0 25.9 1.8 49.2 20.0 3.1
1994 100.0 24.2 1.0 49.0 23.3 2.5
1995 100.0 25.1 0.9 54.0 18.6 1.4
1996 100.0 25.9 1.1 51.8 19.0 2.2
1997 100.0 27.0 1.4 45.8 23.9 1.9
1998 100.0 26.7 2.3 46.7 22.1 2.2
1999 100.0 30.6 1.8 42.3 22.8 2.5
2000 100.0 30.6 1.8 41.2 23.3 3.1
2001 100.0 32.1 1.6 39.0 23.3 4.0
2002 100.0 33.8 1.4 39.7 22.4 2.7
2003 100.0 33.2 1.9 40.3 22.8 1.8
2004 100.0 32.3 2.1 34.2 29.5 1.8
2005 100.0 24.5 2.2 34.7 35.3 3.3
2006 100.0 21.3 2.2 37.0 33.1 6.5
2007 100.0 25.3 3.9 37.7 25.0 8.0
2008 100.0 24.4 2.9 36.9 28.3 7.5
2009 100.0 27.5 1.3 36.2 25.6 9.4
2010 100.0 32.4 1.1 29.1 25.9 11.5
2011 100.0 30.5 1.4 31.9 24.8 11.4
2012 100.0 30.3 0.9 29.4 28.5 11.0
2013 100.0 38.2 0.5 26.2 31.7 3.4
2014 100.0 29.3 1.0 20.4 45.2 4.2
2015 100.0 20.6 1.2 14.1 59.9 4.3
2016 100.0 31.0 1.9 10.9 51.3 4.8
2017 100.0 31.8 0.6 7.5 55.3 4.8

172
7-3 农业总产值及其指数
GROSS OUTPUT VALUE OF AGRICULTURE AND ITS INDICES
年 份 Year
农业总产值(万元)当年价格
Gross Output Value of Agriculture (10 000yuan)At Current Prices
以上年为100 Preceding Year=100
1979 13 106
1980 16 938 85.4
1981 24 181 119.1
1982 26 929 108.1
1983 29 083 98.4
1984 40 416 102.3
1985 45 821 119.2
1986 49 552 116.5
1987 73 772 111.8
1988 99 404 119.4
1989 108 015 112.1
1990 119 205 115.2
1991 143 063 109.3
1992 185 297 99.2
1993 192 880 92.9
1994 224 776 96.1
1995 232 653 101.0
1996 273 246 114.2
1997 270 889 101.7
1998 298 174 104.3
1999 299 662 107.9
2000 311 359 102.4
2001 327 111 103.7
2002 340 757 107.0
2003 337 406 109.8
2004 299 939 111.7
2005 217 369 87.8
2006 180 017 75.3
2007 171 380 89.2
2008 187 859 84.0
2009 154 760 87.1
2010 150 467 92.2
2011 152 533 94.0
2012 148 572 103.1
2013 139 479 70.8
2014 129 156 92.2
2015 159 515 108.6
2016 167 329 96.3
2017 388 609 122.7
注: 2005年起国家统计报表制度中取消1990年不变价,增长速度按可比口径计算。 Note: Since 2005, the national statistical reporting system has cancelled the index, Gross Output Value of Agriculture (at 1990 constant prices),the growth rates are calculated at comparable coverage.
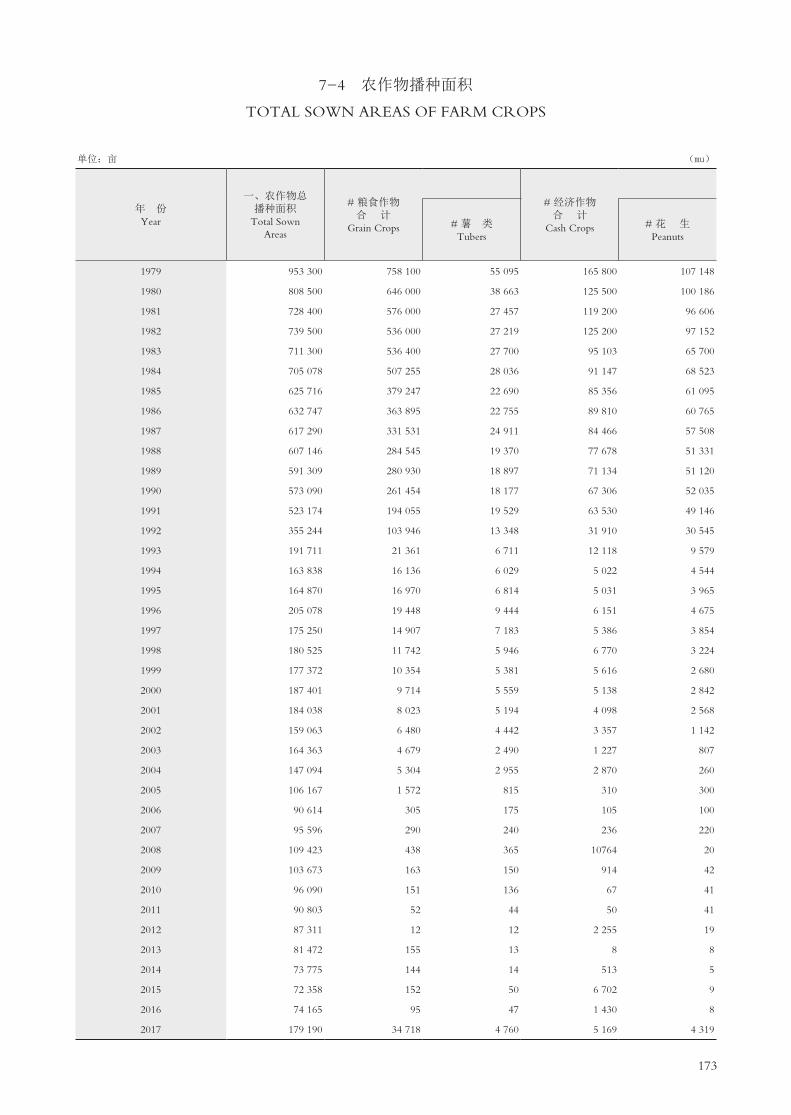
173
7-4 农作物播种面积
TOTAL SOWN AREAS OF FARM CROPS
单位:亩 (mu)
年 份 Year
一、农作物总 播种面积
Total Sown Areas
# 粮食作物 合 计
Grain Crops
# 经济作物 合 计
Cash Crops# 薯 类 Tubers
# 花 生 Peanuts
1979 953 300 758 100 55 095 165 800 107 148
1980 808 500 646 000 38 663 125 500 100 186
1981 728 400 576 000 27 457 119 200 96 606
1982 739 500 536 000 27 219 125 200 97 152
1983 711 300 536 400 27 700 95 103 65 700
1984 705 078 507 255 28 036 91 147 68 523
1985 625 716 379 247 22 690 85 356 61 095
1986 632 747 363 895 22 755 89 810 60 765
1987 617 290 331 531 24 911 84 466 57 508
1988 607 146 284 545 19 370 77 678 51 331
1989 591 309 280 930 18 897 71 134 51 120
1990 573 090 261 454 18 177 67 306 52 035
1991 523 174 194 055 19 529 63 530 49 146
1992 355 244 103 946 13 348 31 910 30 545
1993 191 711 21 361 6 711 12 118 9 579
1994 163 838 16 136 6 029 5 022 4 544
1995 164 870 16 970 6 814 5 031 3 965
1996 205 078 19 448 9 444 6 151 4 675
1997 175 250 14 907 7 183 5 386 3 854
1998 180 525 11 742 5 946 6 770 3 224
1999 177 372 10 354 5 381 5 616 2 680
2000 187 401 9 714 5 559 5 138 2 842
2001 184 038 8 023 5 194 4 098 2 568
2002 159 063 6 480 4 442 3 357 1 142
2003 164 363 4 679 2 490 1 227 807
2004 147 094 5 304 2 955 2 870 260
2005 106 167 1 572 815 310 300
2006 90 614 305 175 105 100
2007 95 596 290 240 236 220
2008 109 423 438 365 10764 20
2009 103 673 163 150 914 42
2010 96 090 151 136 67 41
2011 90 803 52 44 50 41
2012 87 311 12 12 2 255 19
2013 81 472 155 13 8 8
2014 73 775 144 14 513 5
2015 72 358 152 50 6 702 9
2016 74 165 95 47 1 430 8
2017 179 190 34 718 4 760 5 169 4 319
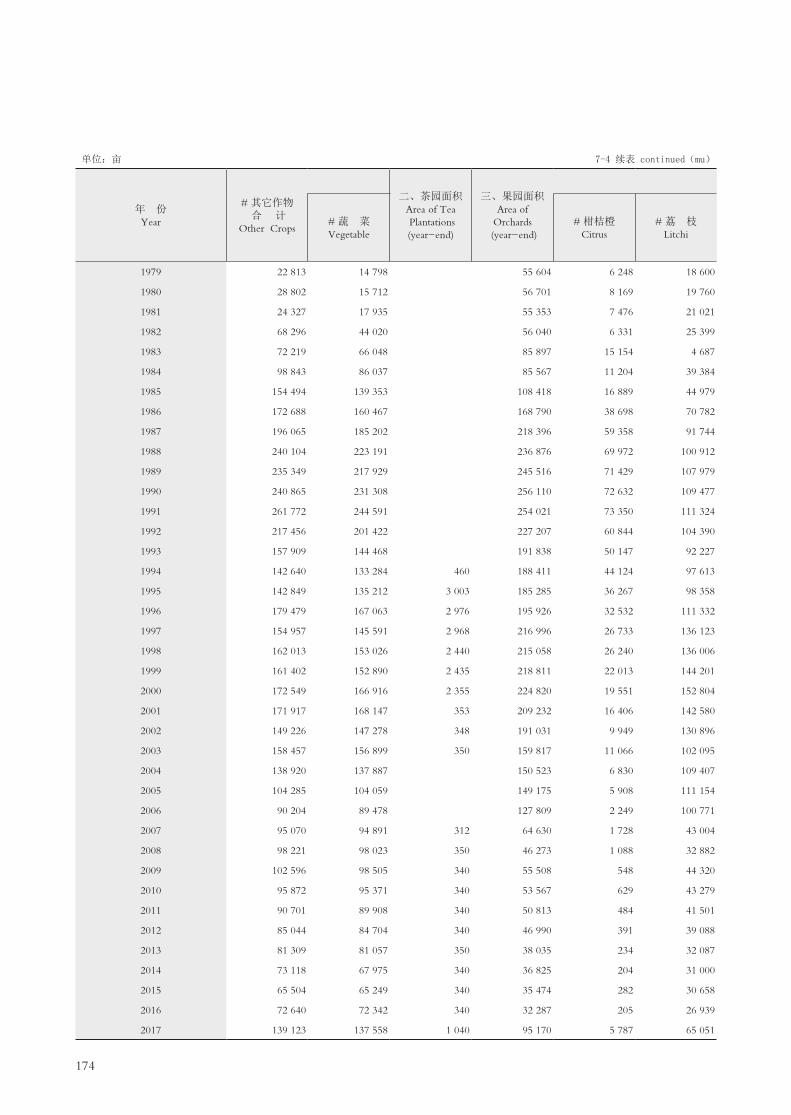
174
单位:亩 7-4 续表 continued(mu)
年 份 Year
# 其它作物 合 计
Other Crops
二、茶园面积 Area of Tea Plantations (year-end)
三、果园面积 Area of
Orchards (year-end)
# 蔬 菜 Vegetable
# 柑桔橙 Citrus
# 荔 枝 Litchi
1979 22 813 14 798 55 604 6 248 18 600
1980 28 802 15 712 56 701 8 169 19 760
1981 24 327 17 935 55 353 7 476 21 021
1982 68 296 44 020 56 040 6 331 25 399
1983 72 219 66 048 85 897 15 154 4 687
1984 98 843 86 037 85 567 11 204 39 384
1985 154 494 139 353 108 418 16 889 44 979
1986 172 688 160 467 168 790 38 698 70 782
1987 196 065 185 202 218 396 59 358 91 744
1988 240 104 223 191 236 876 69 972 100 912
1989 235 349 217 929 245 516 71 429 107 979
1990 240 865 231 308 256 110 72 632 109 477
1991 261 772 244 591 254 021 73 350 111 324
1992 217 456 201 422 227 207 60 844 104 390
1993 157 909 144 468 191 838 50 147 92 227
1994 142 640 133 284 460 188 411 44 124 97 613
1995 142 849 135 212 3 003 185 285 36 267 98 358
1996 179 479 167 063 2 976 195 926 32 532 111 332
1997 154 957 145 591 2 968 216 996 26 733 136 123
1998 162 013 153 026 2 440 215 058 26 240 136 006
1999 161 402 152 890 2 435 218 811 22 013 144 201
2000 172 549 166 916 2 355 224 820 19 551 152 804
2001 171 917 168 147 353 209 232 16 406 142 580
2002 149 226 147 278 348 191 031 9 949 130 896
2003 158 457 156 899 350 159 817 11 066 102 095
2004 138 920 137 887 150 523 6 830 109 407
2005 104 285 104 059 149 175 5 908 111 154
2006 90 204 89 478 127 809 2 249 100 771
2007 95 070 94 891 312 64 630 1 728 43 004
2008 98 221 98 023 350 46 273 1 088 32 882
2009 102 596 98 505 340 55 508 548 44 320
2010 95 872 95 371 340 53 567 629 43 279
2011 90 701 89 908 340 50 813 484 41 501
2012 85 044 84 704 340 46 990 391 39 088
2013 81 309 81 057 350 38 035 234 32 087
2014 73 118 67 975 340 36 825 204 31 000
2015 65 504 65 249 340 35 474 282 30 658
2016 72 640 72 342 340 32 287 205 26 939
2017 139 123 137 558 1 040 95 170 5 787 65 051
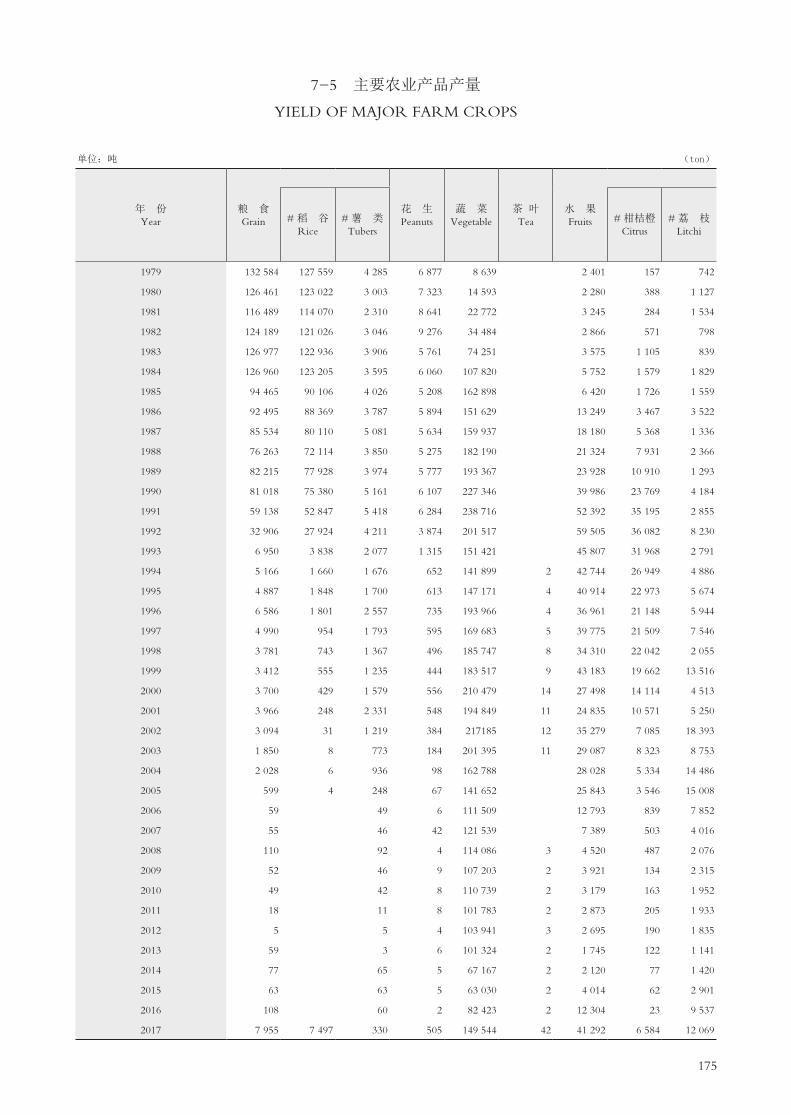
175
7-5 主要农业产品产量
YIELD OF MAJOR FARM CROPS
单位:吨 (ton)
年 份 Year
粮 食 Grain
花 生 Peanuts
蔬 菜 Vegetable
茶 叶 Tea
水 果 Fruits# 稻 谷
Rice# 薯 类
Tubers# 柑桔橙
Citrus# 荔 枝
Litchi
1979 132 584 127 559 4 285 6 877 8 639 2 401 157 742
1980 126 461 123 022 3 003 7 323 14 593 2 280 388 1 127
1981 116 489 114 070 2 310 8 641 22 772 3 245 284 1 534
1982 124 189 121 026 3 046 9 276 34 484 2 866 571 798
1983 126 977 122 936 3 906 5 761 74 251 3 575 1 105 839
1984 126 960 123 205 3 595 6 060 107 820 5 752 1 579 1 829
1985 94 465 90 106 4 026 5 208 162 898 6 420 1 726 1 559
1986 92 495 88 369 3 787 5 894 151 629 13 249 3 467 3 522
1987 85 534 80 110 5 081 5 634 159 937 18 180 5 368 1 336
1988 76 263 72 114 3 850 5 275 182 190 21 324 7 931 2 366
1989 82 215 77 928 3 974 5 777 193 367 23 928 10 910 1 293
1990 81 018 75 380 5 161 6 107 227 346 39 986 23 769 4 184
1991 59 138 52 847 5 418 6 284 238 716 52 392 35 195 2 855
1992 32 906 27 924 4 211 3 874 201 517 59 505 36 082 8 230
1993 6 950 3 838 2 077 1 315 151 421 45 807 31 968 2 791
1994 5 166 1 660 1 676 652 141 899 2 42 744 26 949 4 886
1995 4 887 1 848 1 700 613 147 171 4 40 914 22 973 5 674
1996 6 586 1 801 2 557 735 193 966 4 36 961 21 148 5 944
1997 4 990 954 1 793 595 169 683 5 39 775 21 509 7 546
1998 3 781 743 1 367 496 185 747 8 34 310 22 042 2 055
1999 3 412 555 1 235 444 183 517 9 43 183 19 662 13 516
2000 3 700 429 1 579 556 210 479 14 27 498 14 114 4 513
2001 3 966 248 2 331 548 194 849 11 24 835 10 571 5 250
2002 3 094 31 1 219 384 217185 12 35 279 7 085 18 393
2003 1 850 8 773 184 201 395 11 29 087 8 323 8 753
2004 2 028 6 936 98 162 788 28 028 5 334 14 486
2005 599 4 248 67 141 652 25 843 3 546 15 008
2006 59 49 6 111 509 12 793 839 7 852
2007 55 46 42 121 539 7 389 503 4 016
2008 110 92 4 114 086 3 4 520 487 2 076
2009 52 46 9 107 203 2 3 921 134 2 315
2010 49 42 8 110 739 2 3 179 163 1 952
2011 18 11 8 101 783 2 2 873 205 1 933
2012 5 5 4 103 941 3 2 695 190 1 835
2013 59 3 6 101 324 2 1 745 122 1 141
2014 77 65 5 67 167 2 2 120 77 1 420
2015 63 63 5 63 030 2 4 014 62 2 901
2016 108 60 2 82 423 2 12 304 23 9 537
2017 7 955 7 497 330 505 149 544 42 41 292 6 584 12 069
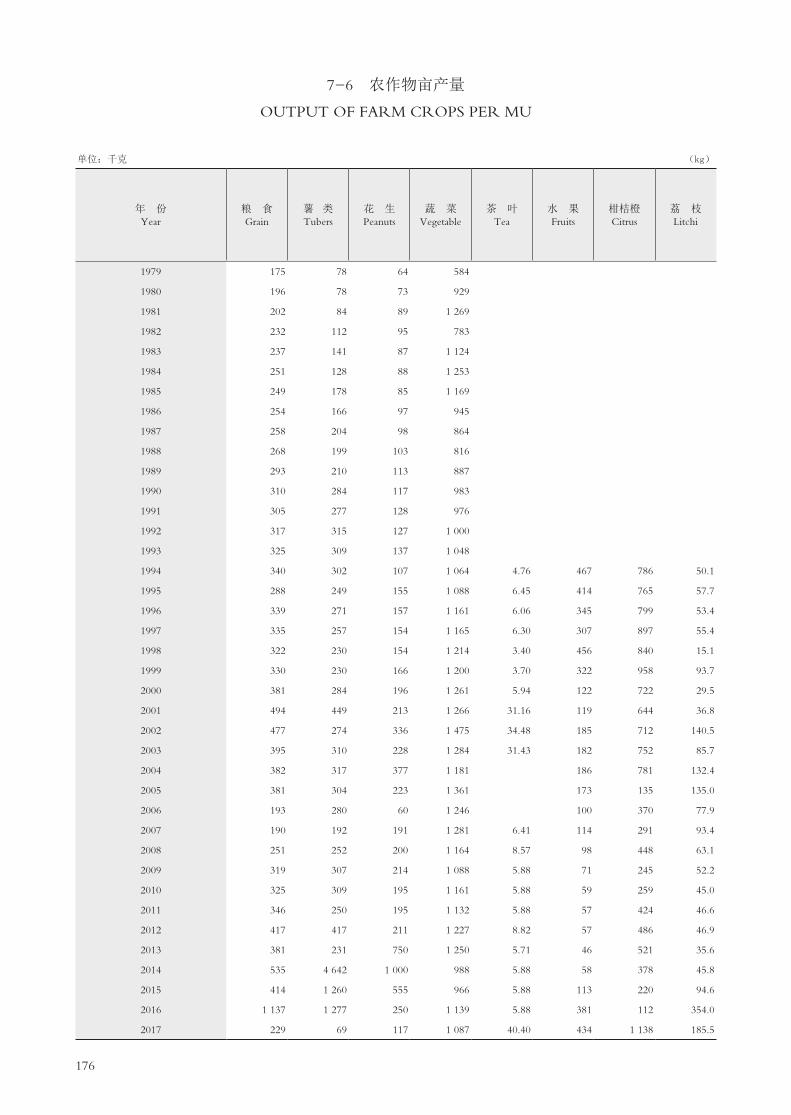
176
7-6 农作物亩产量
OUTPUT OF FARM CROPS PER MU
单位:千克 (kg)
年 份 Year
粮 食 Grain
薯 类Tubers
花 生 Peanuts
蔬 菜 Vegetable
茶 叶 Tea
水 果 Fruits
柑桔橙 Citrus
荔 枝Litchi
1979 175 78 64 584
1980 196 78 73 929
1981 202 84 89 1 269
1982 232 112 95 783
1983 237 141 87 1 124
1984 251 128 88 1 253
1985 249 178 85 1 169
1986 254 166 97 945
1987 258 204 98 864
1988 268 199 103 816
1989 293 210 113 887
1990 310 284 117 983
1991 305 277 128 976
1992 317 315 127 1 000
1993 325 309 137 1 048
1994 340 302 107 1 064 4.76 467 786 50.1
1995 288 249 155 1 088 6.45 414 765 57.7
1996 339 271 157 1 161 6.06 345 799 53.4
1997 335 257 154 1 165 6.30 307 897 55.4
1998 322 230 154 1 214 3.40 456 840 15.1
1999 330 230 166 1 200 3.70 322 958 93.7
2000 381 284 196 1 261 5.94 122 722 29.5
2001 494 449 213 1 266 31.16 119 644 36.8
2002 477 274 336 1 475 34.48 185 712 140.5
2003 395 310 228 1 284 31.43 182 752 85.7
2004 382 317 377 1 181 186 781 132.4
2005 381 304 223 1 361 173 135 135.0
2006 193 280 60 1 246 100 370 77.9
2007 190 192 191 1 281 6.41 114 291 93.4
2008 251 252 200 1 164 8.57 98 448 63.1
2009 319 307 214 1 088 5.88 71 245 52.2
2010 325 309 195 1 161 5.88 59 259 45.0
2011 346 250 195 1 132 5.88 57 424 46.6
2012 417 417 211 1 227 8.82 57 486 46.9
2013 381 231 750 1 250 5.71 46 521 35.6
2014 535 4 642 1 000 988 5.88 58 378 45.8
2015 414 1 260 555 966 5.88 113 220 94.6
2016 1 137 1 277 250 1 139 5.88 381 112 354.0
2017 229 69 117 1 087 40.40 434 1 138 185.5

177
7-7 畜牧业、林业和渔业
ANIMAL HUSBANDRY, FORESTRY AND FISHERY
年 份 Year
畜 牧 业 Animal Husbandry
牛年末头数(头) Year-end Number of
Cattle (head)
牛奶产量 (吨)
Milk Output (ton)
生猪饲养量 (万头)
Raised Hogs (the whole year) (10 000 heads)
生猪年末 存栏量(万头) Raised Hogs (Year-end)
(10 000 heads)
# 奶 牛 Milk Cows
1979 25 633 465 1 622 22.90 11.69
1980 24 451 2 365 2 876 15.58 8.42
1981 28 917 3 066 5 214 10.69 6.06
1982 31 301 3 233 6 852 15.61 8.51
1983 31 200 3 642 7 411 17.60 9.40
1984 30 716 4 506 9 830 18.59 8.89
1985 28 474 5 352 10 815 20.34 9.58
1986 27 685 6 204 12 837 25.41 12.29
1987 26 587 6 460 14 237 36.02 16.94
1988 24 759 6 764 13 720 52.20 21.90
1989 24 618 7 384 16 729 65.28 24.45
1990 24 105 7 715 18 887 59.37 22.58
1991 20 660 7 380 20 566 64.23 22.07
1992 16 451 7 059 20 592 61.36 20.89
1993 11 460 7 107 20 255 62.39 20.77
1994 9 780 7 235 20 080 64.49 23.38
1995 9 960 7 955 19 475 68.09 25.76
1996 9 509 8 152 20 420 75.61 27.35
1997 8 900 7 478 18 857 80.26 30.52
1998 8 625 7 575 19 851 89.36 30.09
1999 8 881 7 990 22 480 85.98 28.16
2000 9 808 9 094 24 926 93.02 26.88
2001 9 661 8 883 22 176 92.23 27.08
2002 9 740 9 285 22 802 96.11 31.42
2003 8 196 6 780 24 128 79.31 18.56
2004 8 579 8 511 22 018 63.17 12.49
2005 7 857 7 832 19 567 68.69 17.15
2006 8 009 7 980 18 727 60.66 13.73
2007 7 625 7 585 18 130 53.19 16.25
2008 6 772 5 681 16 150 48.36 15.92
2009 5 035 5 035 10 699 41.04 11.21
2010 6 487 6 479 15 000 29.37 6.93
2011 6 610 6 580 14 310 27.39 6.98
2012 5 671 5 671 13 322 24.96 6.49
2013 5 523 5 523 13 759 18.06 5.88
2014 4 211 4 211 11 805 10.06 3.09
2015 3 656 3 656 12 973 6.71 1.56
2016 2 110 2 110 8 485 4.25 1.35
2017 2 688 2 120 8 364 10.72 3.71

178
7-7 续表 1 continued
年 份 Year
畜 牧 业 Animal Husbandry造林面积
(万亩) Areas of
Forestation (10 000 mu)
肉猪全年 出栏量(万头) Slaughtered Fattened
Hogs of the Year (10 000 heads)
家禽饲养量 (万只)
Raised Poultry (10 000 heads)
鲜蛋(吨) Fresh eggs
(ton)
当年出售肉 类总产量(吨) Total Output of Meat Sold
(ton)
# 出栏量 Slaughtered
Fattened Poultry
1979 11.21 99.59 69.71 57 6 726 1.84
1980 7.16 160.90 112.63 88 4 296 1.65
1981 4.63 321.84 257.42 119 2 778 1.38
1982 7.10 578.61 506.31 265 4 260 2.62
1983 8.20 786.79 586.40 1 352 4 920 2.37
1984 9.70 857.31 686.27 1 137 12 648 1.78
1985 10.76 1 305.20 944.32 1 085 22 932 16.85
1986 13.12 1 548.94 1 115.77 1 169 25 323 4.01
1987 19.08 1 955.78 1 371.76 805 33 935 15.38
1988 30.30 2 634.80 1 892.70 1 335 47 449 13.32
1989 40.83 3 101.80 2 291.00 1 212 65 300 5.33
1990 36.79 3 330.80 2 445.20 1 895 62 513 5.92
1991 42.16 3 522.27 2 964.39 3 462 79 022 13.10
1992 40.47 4 063.21 2 911.96 4 172 74 081 0.62
1993 41.62 3 534.32 2 668.70 2 472 77 254 0.15
1994 41.11 2 988.07 2 280.63 2 100 67 043 1.10
1995 42.33 2 635.46 2 015.59 2 120 70 277 1.85
1996 48.26 2 111.72 1 633.59 1 351 64 280 3.74
1997 49.74 2 142.36 2 142.36 1 333 65 911 6.27
1998 59.27 2 900.24 2 462.97 1 421 82 947 4.93
1999 57.82 3 090.74 2 616.25 1 130 77 608 3.44
2000 66.14 2 340.20 1 953.85 1 546 79 893 3.30
2001 65.15 2 503.53 1 871.64 922 73 495 2.63
2002 64.68 2 158.62 1 803.00 380 75 531 2.47
2003 60.74 1 698.14 1 515.24 289 66 730 4.96
2004 50.68 1 329.01 1 159.61 292 55 810 3.41
2005 51.55 1 156.99 999.48 110 46 846 3.05
2006 46.93 934.53 811.00 20 42 478 2.45
2007 37.94 866.48 679.75 1 176 32 016 7.35
2008 32.44 903.06 764.50 838 27 458
2009 29.83 913.76 732.78 282 25 525 1.85
2010 22.44 703.03 568.39 406 18 992 1.87
2011 20.40 582.74 456.06 654 17 142 1.55
2012 18.47 509.96 438.10 902 15 066 1.30
2013 12.18 264.01 184.47 304 11 149 0.81
2014 6.97 287.86 247.71 242 6 422 0.29
2015 5.15 260.64 225.18 27 4 597 0.34
2016 2.90 178.46 151.59 3 278 0.01
2017 7.01 168.47 127.90 0.1 8 019 0.61

179
7-7 续表 2 continued
年 份 Year
渔 业 Fishery
水产品生产总量(吨)
Total Output of Aquatic
Products(ton)
1、海水产品 Seawater Aquatic
Products
2、淡水产品 Freshwater
Aquatic Products
养殖面积 (万亩)
Cultured Areas of Aquatic
(10 000 mu)
# 鱼 类 Fish
# 鱼 类 Fish
1、海水面积 Seawater
2、淡水面积 Freshwater
1979 7 039 6 068 971 1.13
1980 7 667 5 315 2 352 3.27
1981 7 410 5 048 2 362 3.54
1982 10 406 6 128 4 278 4.24
1983 12 303
1984 16 086 4.68
1985 16 762 4 485 12 277 8.84
1986 23 654 5 595 3 716 18 059 19.33 7.88 11.45
1987 26 889 17 363 9 526 21.16 13.40 7.76
1988 31 535 20 923 16 515 10 612 6 860 20.92 7.53 13.39
1989 32 148 20 153 16 454 11 995 11 995 21.36 14.18 7.18
1990 38 587 24 239 18 420 14 348 13 793 21.88 14.73 7.15
1991 41 740 12 076 8 402 29 664 29 664 16.91 7.81 9.10
1992 44 349 27 558 18 488 16 791 15 836 18.77 13.64 5.13
1993 31 104 11 527 8 423 19 577 19 577 11.77 5.90 5.87
1994 28 196 10 661 6 733 17 535 17 535
1995 37 394 30 041 26 438 7 353 7 353
1996 41 183 21 957 17 718 19 226 19 188 16.00 13.60 2.40
1997 55 569 47 687 32 229 7 882 7 773 13.47 10.82 2.65
1998 58 315 50 352 32 371 7 963 7 962 13.61 10.52 3.09
1999 59 764 52 410 34 888 7 354 7 334 11.19 8.16 3.03
2000 59 881 51 191 31 649 8 690 8 690 11.41 8.50 2.91
2001 65 784 56 566 32 850 9 218 9 218 10.84 7.20 3.64
2002 64 059 54 757 22 248 9 302 9 116 9.31 6.59 2.72
2003 85 324 77 506 50 446 7 818 7 610 8.81 6.89 1.92
2004 96 682 88 718 67 553 7 964 6 899 7.33 5.61 1.71
2005 81 764 74 560 55 435 7 204 7 038 7.19 5.84 1.35
2006 56 126 51 411 33 443 4 715 4 697 6.91 5.86 1.05
2007 34 068 31 173 21 708 2 895 2 765 4.67 3.93 0.74
2008 38 468 37 126 27 547 1 342 1 232 3.76 3.07 0.69
2009 30 329 28 544 17 391 1 785 1 714 3.03 2.62 0.41
2010 27 230 25 302 13 010 1 928 1 838 2.92 2.51 0.41
2011 24 929 23 488 13 795 1 441 1 306 2.92 2.51 0.41
2012 28 738 27 430 17 784 1 308 1 253 1.75 1.50 0.25
2013 19 107 18 062 14 287 1 045 990 1.71 1.50 0.21
2014 27 205 26 285 17 867 920 865 0.57 0.41 0.16
2015 39 777 38 796 30 407 981 918 0.46 0.39 0.07
2016 39 855 39 525 31 138 330 330 0.45 0.40 0.05
2017 82 905 80 164 54 335 2 741 2 683 0.31 0.31

180
主要统计指标解释
农林牧渔业总产值 是以货币表现的农林牧渔业的全部产品总量和对农林牧渔业生产活动进行的各种支
持性服务活动的价值。它反映一定时期内农林牧渔业生产总规模和总成果,是观察农林牧渔业生产水平和发展
速度,研究农林牧渔业内部比例关系、农林牧渔业与工业、农林牧渔业与国家建设、人民生活比例关系的重要
指标,同时也是计算农林牧渔业劳动生产率和农林牧渔业增加值的基础资料。
农林牧渔业总产值的计算,一般采用“产品法”,即凡有产品产量的,都按单位产品价格乘产量的办法
求得每种产品产量的产值,然后相加求得各业的产值,最后各业相加求出农林牧渔业总产值。
农作物播种面积 是指一定生产季节结束时实际播种或移植有农作物的面积。播种面积的大小,反映农
作物的生产规模和耕地的利用程度。正确地核算播种面积,对于组织农业生产活动,计算农作物产量,研究农
作物的种植结构和分布情况以及制定各项增产技术措施,都是非常必要的。
播种面积的统计年度,凡是能在本日历年度内(自1月1日至12月31日)收获的农作物(包括上年秋冬播
和本年春播、夏播以及南方地区的晚秋播而在本年收获的全部作物)播种面积,都包括在内。
粮食产量 指全社会的产量。包括国有经济经营的、集体统一经营的和农民家庭经营的粮食产量,还包
括工矿企业办的农场和其他生产单位的产量。粮食除包括稻谷、小麦、玉米、高粱、谷子及其他杂粮外,还
包括薯类和豆类。其产量计算方法,豆类按去豆荚后的干豆计算;薯类(包括甘薯和马铃薯,不包括芋头和木
薯)1963年以前按每4公斤鲜薯折1公斤粮食计算,从1964年开始改为按5公斤鲜薯折1公斤粮食计算。城市郊区作
为蔬菜的薯类(如马铃薯等)按鲜品计算,并且不作粮食统计。其他粮食一律按脱粒后的原粮计算。1989年以前
全国粮食产量数据主要靠全面报表取得,1989年开始使用抽样调查数据。
水产品产量 指人工养殖的水产品和天然生长的水产品的捕捞量。包括海水的鱼类、虾蟹类、贝类和藻
类以及内陆水域的鱼类、虾蟹类和贝类,不包括淡水生植物。水产品产量是通过各级水产和统计部门逐级上报
取得数据。1995年及以前,贝类中牡蛎按鲜肉计算;蚶、蛤、蛙按5斤鲜品折1斤计算。1996年以后则统一按
鲜品计算。
耕地面积 年初可以用来种植农作物、经常进行耕锄的田地,除包括熟地、当年新开荒地、连续撂荒未
满三年的耕地和当年的休闲地(轮歇地)外,还包括以种植农作物为主并附带种植桑树、茶树、果树和其他林
木的土地,以及沿海、沿湖地区已围垦利用的“海涂”、“湖田”等面积。但不包括属于专业性的桑园、茶
园、果木苗圃、林地、芦苇地、天然或人工草地面积。

181
Explanatory Notes on Main Statistical Indicators
Gross Output Value of Agriculture refers to the total volume of products of farming, forestry, animal husbandry,
and fishery and the value of various services supporting the production of farming, forestry, animal husbandry and fishery
in monetary terms, which reflects the total scale and total results of farming, forestry, animal husbandry and fishery
production during a given period of time. It is an important indicator to observe the production level and development
speed of farming, forestry, animal husbandry and fishery, to study the internal structure of farming, forestry, animal
husbandry and fishery, and to review the proportionate relationship of farming, forestry, animal husbandry and fishery to
industry, to national construction and to people’s life. It is also the foundation for calculating the labor productivity and
value-added of farming, forestry, animal husbandry and fishery.
Generally, the gross output value of farming, forestry, animal husbandry and fishery is calculated with the
production approach. Where applicable, the gross output value of each single product is obtained by multiplying the
output of each product by its price. These values are then summed up to obtain the output value of each sector. The sum
of output values of all sectors is the gross output value of farming, forestry, animal husbandry and fishery.
Area of Regularly Cultivated Land refers to farmland among the total land resources which is exclusively used
for farming and is under regular cultivation with harvest in normal years. Included are currently cultivated land, land
that has been abandoned or put in idle for less than 3 years and is available for recultivation at any time, newly-claimed
land that has been put into cultivation for more than 3 years, and ditches, trenches, roads, and ridges with a width of less
than 1 meter. Excluded under this category are steep slope land over 25 degrees under temporary cultivation, stretches
or scattered plots temporarily claimed along river bends, lake sides or banks of reservoirs, as well as land that has been
designated under the “Green for Grain” programmes of the state and provincial governments but is still temporarily
under cultivation. Regularly cultivated land is classified into basic farmland and odd pieces of land used for cultivation.
Grain Output refers to the total output in the whole country including grains produced by State farms, collective
units, rural households, as well as by farms affiliated to industrial and mining enterprises and other production units. Grain
includes rice, wheat, corn, sorghum, millet and other miscellaneous grains as well as tubers and beans. Output of beans
refers to dry beans without pods. The output of tubers (sweet potatoes and potatoes, not including taros and cassava)
are converted into that of grain at the ratio 4:1, i.e. 4 kilograms of fresh tubers were equivalent to 1 kilogram of grain
up to 1963. Since 1964 the ratio for conversion has been 5:1. Tubers supplied as vegetables (such as potatoes) in cities
and suburbs are calculated as fresh vegetables and their output is not included in the output of grain. Output of all other
grains refers to husked grain. Data on grain production before 1989 were obtained through the Comprehensive Statistical
Reporting System. Since 1989, data from sample surveys are used.
Output of Aquatic Products refers to catches of both artificially cultured and naturally grown aquatic products,
including fish, shrimps, crabs and shellfish in sea and inland water as well as seaweed. Freshwater plants are not included.
Data on output of aquatic products are reported by aquatic product and statistical agencies level by level. Before 1995,
among the shellfish, oyster was counted as fresh meat; 5 kilograms of ark shell, clams and frogs are equivalent to 1
kilogram of fresh aquatic products; they have all been counted as fresh aquatic products since 1996.
Cultivated Area (Area under cultivation) refers to farmland which is plowed constantly for growing crops,
including cultivated land, newly cultivated land in the current year, farmland left without cultivation for less than three
years and fallow land in the current year, rotation land, farmland with some mulberry trees, tea trees, fruit trees, and other
trees and cultivated seashore land, lake land, and etc.. The land of mulberry plantation, tea plantation, orchards, nurseries
of young plants, forest land, reed land, natural and man-made grassland are not included in cultivated land.


INVESTMENT IN FIXED ASSETS08

184
8-1 固定资产投资主要指标
MAIN INDICATORS OF INVESTMENT IN FIXED ASSETS
项 目Item
2000 2010 2014 2015 2016 2017
投资完成额(亿元) Investment (100 million yuan) 677.12 1 944.70 2 717.42 3 298.31 4 078.16 5 147.32
#房地产开发 Real Estate Development 260.97 458.47 1 069.49 1 331.03 1 756.52 2 135.86
按登记注册类型分 Grouped by Status of Registration
内资 Domestic 367.20 1 615.49 2 435.24 2 707.40 3 385.83 4 464.60
国有 State-owned 216.77 819.70 757.85 800.47 931.74 1 355.83
集体 Collective-owned 44.21 44.24 98.48 30.94 17.15 19.16
其他 Others 106.21 751.55 1 578.92 1 875.98 2 436.94 3 089.61
港澳台投资 Funds from Hong Kong, Macao and Taiwan 194.69 237.61 163.49 350.98 475.70 513.45
外商投资 Foreign Funded 115.23 91.60 118.69 239.96 216.64 169.27
按构成分 Grouped by Use of Funds
建筑工程 Construction 1 149.37 1 704.29 1 842.10 2 248.22 2 680.94
安装工程 Installation 141.95 188.15 287.08 301.93 319.14
设备工具器具购置 Purchase of Equipments and Instruments 375.36 401.75 439.31 488.36 656.19
其他费用 Others 278.02 423.23 729.81 1 039.66 1 491.05
按三次产业分 Grouped by Three Strata of Industry
第一产业 Primary Industry 0.64 0.39 0.62 0.13 0.21
第二产业 Secondary Industry 480.86 521.22 591.05 695.47 911.23
第三产业 Tertiary Industry 1 463.21 2 195.81 2 706.64 3 382.56 4 235.88
按财务拨款合计(亿元) Grouped by Source of Funds (100 million yuan) 267.36 2 339.36 3 498.04 5 396.20 5 645.43 2 627.83
国家预算资金 State and Local Budget 2.36 9.14 415.26 434.24 452.49 783.97
国内贷款 Domestic Loans 21.27 539.62 702.88 1 021.69 1 159.09 392.98
债券 Securities 1.08 0.03 4.90 1.67
利用外资 Foreign Investment 18.25 46.48 27.01 10.72 1.18 13.25
自筹资金 Self-raising Funds 213.72 1 293.40 1 796.44 2 478.02 2 397.14 1 334.91
其他资金 Others 11.75 449.64 556.45 1 451.50 1 630.62 101.05
房屋建筑面积(万平方米) Floor Space of Buildings (10 000 sq.m)
施工面积 Floor Space under Construction 3 591.22 5 178.84 6 249.70 7 010.06 6 677.50 7 560.49
竣工面积 Floor Space Completed 1 287.21 692.70 954.77 818.86 587.81 351.23
商品房屋销售面积(万平方米) Floor Space of Commercial Buildings(10 000 sq.m) 611.37 465.59 532.57 831.46 736.19 671.03
#住宅 Residential Buildings 556.82 413.80 474.81 747.83 660.08 520.97

185
8-2 固定资产投资额
INVESTMENT IN FIXED ASSETS
单位:万元 (10 000 yuan)
年 份 Year
固定资产投资额 Investment in Fixed Assets 非房地产开发项目
Non-Real Estate Development房地产开发项目
Real Estate Development
1979 5 938 5 938
1980 13 801 13 801
1981 29 684 29 684
1982 73 750 73 750
1983 108 320 108 320
1984 194 572 194 572
1985 333 235 333 235
1986 248 551 248 551
1987 285 193 285 193
1988 436 191 436 191
1989 499 919 499 919
1990 623 380 511 380 112 000
1991 912 324 656 724 255 600
1992 1 782 322 1 067 422 714 900
1993 2 477 875 1 450 175 1 027 700
1994 2 819 413 1 514 813 1 304 600
1995 2 758 243 1 727 875 1 030 368
1996 3 275 270 2 027 019 1 248 251
1997 3 930 657 2 564 112 1 366 545
1998 4 803 901 3 129 047 1 674 854
1999 5 695 878 3 543 337 2 152 541
2000 6 771 205 4 161 511 2 609 694
2001 6 863 749 3 707 385 3 156 364
2002 7 881 459 3 997 014 3 884 445
2003 9 491 016 5 364 380 4 126 636
2004 10 925 571 6 583 139 4 342 432
2005 11 823 245 7 586 380 4 236 865
2006 12 736 693 8 115 753 4 620 940
2007 13 450 037 8 839 615 4 610 422
2008 14 676 043 10 271 146 4 404 897
2009 17 091 514 12 716 924 4 374 590
2010 19 447 008 14 862 315 4 584 693
2011 20 609 180 15 461 818 5 147 362
2012 23 144 319 15 775 898 7 368 421
2013 24 901 970 16 132 968 8 769 002
2014 27 174 226 16 479 371 10 694 855
2015 32 983 076 19 672 743 13 310 333
2016 40 781 638 23 216 429 17 565 209
2017 51 473 152 30 114 587 21 358 565

186
8-3 固定资产投资额指数
INDICES OF INVESTMENT IN FIXED ASSETS
(以上年为100) (preceding year=100)
年 份 Year
固定资产投资额 Investment in Fixed Assets 非房地产开发项目
Non-Real Estate Development房地产开发项目
Real Estate Development
1980 232.4 232.4
1981 215.1 215.1
1982 248.5 248.5
1983 146.9 146.9
1984 179.6 179.6
1985 171.3 171.3
1986 74.6 74.6
1987 114.7 114.7
1988 152.9 152.9
1989 114.6 114.6
1990 124.7 124.7
1991 146.4 128.4 228.2
1992 195.4 162.5 279.7
1993 139.0 135.9 143.8
1994 113.8 104.5 126.9
1995 97.8 114.1 79.0
1996 118.7 117.3 121.1
1997 120.0 126.5 109.5
1998 122.2 122.0 122.6
1999 118.6 113.2 128.5
2000 118.9 117.4 121.2
2001 101.4 89.1 120.9
2002 114.8 107.8 123.1
2003 120.4 134.2 106.2
2004 115.1 122.7 105.2
2005 108.2 115.2 97.6
2006 107.7 107.0 109.1
2007 105.6 108.9 99.8
2008 109.1 116.2 95.5
2009 116.5 123.8 99.3
2010 113.8 116.9 104.8
2011 106.0 104.0 112.3
2012 112.3 102.0 143.1
2013 107.6 102.3 119.0
2014 109.1 102.1 122.0
2015 121.4 119.4 124.5
2016 123.6 118.0 132.0
2017 123.8 125.4 121.6

187
8-4 新增固定资产
NEWLY INCREASED FIXED ASSETS
单位:万元 (10 000 yuan)
年 份 Year
固定资产投资额 Investment in Fixed Assets 非房地产开发项目
Non-Real Estate Development房地产开发项目
Real Estate Development
1979 3 201 3 201
1980 7 753 7 753
1981 19 032 19 032
1982 42 369 42 369
1983 81 902 81 902
1984 149 020 149 020
1985 190 359 190 359
1986 192 016 192 016
1987 185 758 185 758
1988 269 475 269 475
1989 384 183 384 183
1990 379 167 310 915 68 252
1991 573 793 490 199 83 594
1992 682 768 556 594 126 174
1993 1 010 590 798 022 212 568
1994 1 542 090 1 199 729 342 361
1995 1 634 350 981 780 652 570
1996 2 549 663 1 302 786 1 246 877
1997 2 997 015 1 952 308 1 044 707
1998 3 865 634 2 189 077 1 676 557
1999 4 556 303 2 661 567 1 894 736
2000 5 474 627 2 981 399 2 493 228
2001 5 378 592 2 651 070 2 727 522
2002 6 153 318 2 720 727 3 432 591
2003 5 527 718 2 454 025 3 073 693
2004 6 863 722 3 905 969 2 957 753
2005 8 870 417 4 610 708 4 259 709
2006 7 476 770 3 913 902 3 562 868
2007 7 644 448 5 176 711 2 467 737
2008 6 827 922 3 897 679 2 930 243
2009 6 424 221 4 032 767 2 391 454
2010 8 258 270 5 950 452 2 307 818
2011 13 103 117 11 304 379 1 798 738
2012 16 695 671 13 076 993 3 618 678
2013 23 742 351 19 783 173 3 959 178
2014 23 740 961 19 606 539 4 134 422
2015 14 785 593 10 792 355 3 993 238
2016 19 150 135 15 035 087 4 115 048
2017 10 390 404 7 504 016 2 886 388
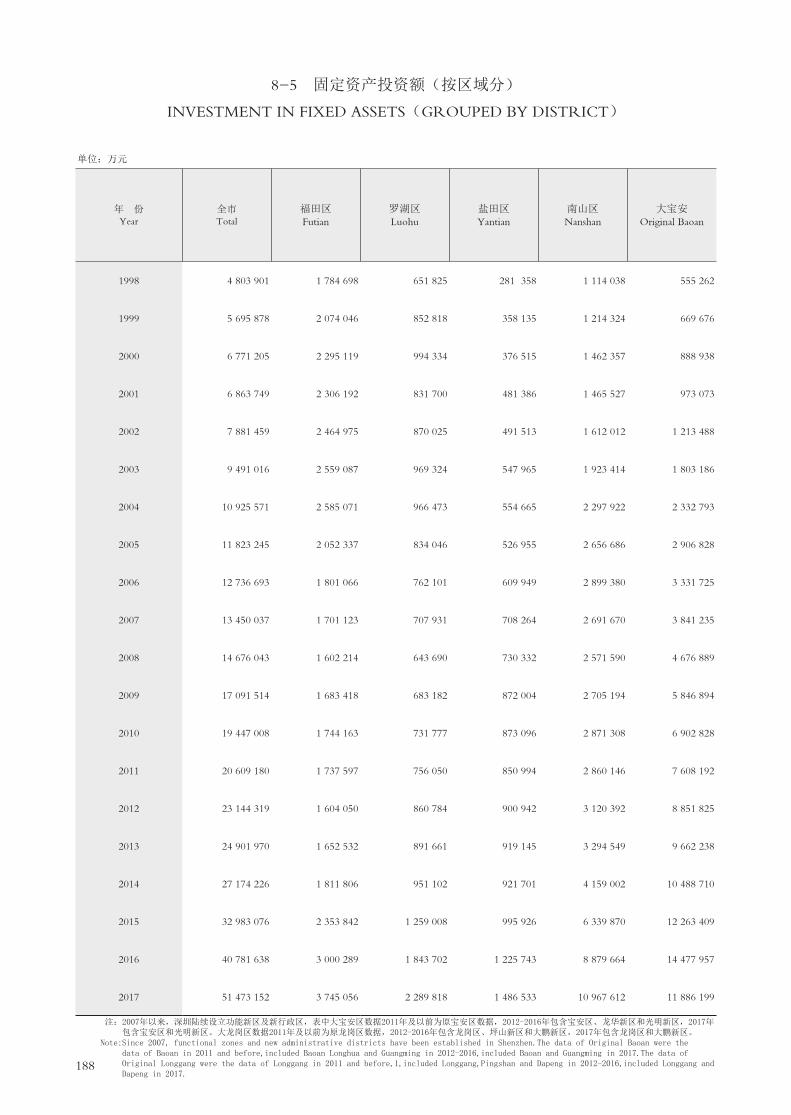
188
8-5 固定资产投资额(按区域分)
INVESTMENT IN FIXED ASSETS(GROUPED BY DISTRICT)
单位:万元
年 份Year
全市Total
福田区Futian
罗湖区Luohu
盐田区Yantian
南山区Nanshan
大宝安Original Baoan
1998 4 803 901 1 784 698 651 825 281 358 1 114 038 555 262
1999 5 695 878 2 074 046 852 818 358 135 1 214 324 669 676
2000 6 771 205 2 295 119 994 334 376 515 1 462 357 888 938
2001 6 863 749 2 306 192 831 700 481 386 1 465 527 973 073
2002 7 881 459 2 464 975 870 025 491 513 1 612 012 1 213 488
2003 9 491 016 2 559 087 969 324 547 965 1 923 414 1 803 186
2004 10 925 571 2 585 071 966 473 554 665 2 297 922 2 332 793
2005 11 823 245 2 052 337 834 046 526 955 2 656 686 2 906 828
2006 12 736 693 1 801 066 762 101 609 949 2 899 380 3 331 725
2007 13 450 037 1 701 123 707 931 708 264 2 691 670 3 841 235
2008 14 676 043 1 602 214 643 690 730 332 2 571 590 4 676 889
2009 17 091 514 1 683 418 683 182 872 004 2 705 194 5 846 894
2010 19 447 008 1 744 163 731 777 873 096 2 871 308 6 902 828
2011 20 609 180 1 737 597 756 050 850 994 2 860 146 7 608 192
2012 23 144 319 1 604 050 860 784 900 942 3 120 392 8 851 825
2013 24 901 970 1 652 532 891 661 919 145 3 294 549 9 662 238
2014 27 174 226 1 811 806 951 102 921 701 4 159 002 10 488 710
2015 32 983 076 2 353 842 1 259 008 995 926 6 339 870 12 263 409
2016 40 781 638 3 000 289 1 843 702 1 225 743 8 879 664 14 477 957
2017 51 473 152 3 745 056 2 289 818 1 486 533 10 967 612 11 886 199
注:2007年以来,深圳陆续设立功能新区及新行政区,表中大宝安区数据2011年及以前为原宝安区数据,2012-2016年包含宝安区、龙华新区和光明新区,2017年 包含宝安区和光明新区。大龙岗区数据2011年及以前为原龙岗区数据,2012-2016年包含龙岗区、坪山新区和大鹏新区,2017年包含龙岗区和大鹏新区。 Note:Since 2007, functional zones and new administrative districts have been established in Shenzhen.The data of Original Baoan were the data of Baoan in 2011 and before,included Baoan Longhua and Guangming in 2012-2016,included Baoan and Guangming in 2017.The data of Original Longgang were the data of Longgang in 2011 and before,1,included Longgang,Pingshan and Dapeng in 2012-2016,included Longgang and Dapeng in 2017.

189
(10 000 yuan)
宝安区Baoan
光明新区Guangming
龙华区Longhua
大龙岗Original
Longgang
龙岗区Longgang
坪山区Pingshan
大鹏新区Dapeng
深汕特别合作区ShenshanSpecial
Cooperation Zone
416 720
526 879
753 943
805 871
1 229 446
1 688 040
2 188 647
2 846 392
3 332 472
3 799 814
4 451 328
5 300 822
6 323 836
6 796 201
3 715 334 2 046 433 3 090 057 7 806 327 5 234 668 1 882 445 689 215
4 289 041 2 212 184 3 161 012 8 481 845 5 763 807 2 016 046 701 991
4 606 802 2 311 908 3 570 000 8 841 905 6 020 000 2 141 905 680 000
5 457 214 2 692 767 4 113 428 9 771 021 6 580 947 2 468 152 721 922
6 504 842 3 024 869 4 948 246 11 354 283 7 636 984 2 978 899 738 400
8 170 568 3 715 631 6 182 721 10 243 457 9 466 863 3 776 637 776 594 895 119

190
8-6 固定资产投资额指数(按区域分)
INVESTMENT IN FIXED ASSETS(GROUPED BY DISTRICT)
以上年为100
年 份Year
全市Total
福田区Futian
罗湖区Luohu
盐田区Yantian
南山区Nanshan
大宝安Original Baoan
1999 118.6 116.2 130.8 127.3 109.0 120.6
2000 118.9 110.7 116.6 105.1 120.4 132.7
2001 101.4 100.5 83.6 127.9 100.2 109.5
2002 114.8 106.9 104.6 102.1 110.0 124.7
2003 120.4 103.8 111.4 111.5 119.3 148.6
2004 115.1 101.0 99.7 101.2 119.5 129.4
2005 108.2 79.4 86.3 95.0 115.6 124.6
2006 107.7 87.8 91.4 115.7 109.1 114.6
2007 105.6 94.5 92.9 116.1 92.8 115.3
2008 109.1 94.2 90.9 103.1 95.5 121.8
2009 116.5 105.1 106.1 119.4 105.2 125.0
2010 113.8 103.6 107.1 100.1 106.1 118.1
2011 106.0 99.6 103.3 97.5 99.6 110.2
2012 112.3 92.3 113.9 105.9 109.1 116.3
2013 107.6 103.0 103.6 102.0 105.6 109.2
2014 109.1 109.6 106.7 100.3 126.2 108.6
2015 121.4 129.9 132.4 108.1 152.4 116.9
2016 123.6 127.5 146.4 123.1 140.1 118.1
2017 123.8 124.8 124.2 121.3 123.5 82.1
191
(Preceding Year=100)
宝安区Baoan
光明新区Guangming
龙华区Longhua
大龙岗Original
Longgang
龙岗区Longgang
坪山区Pingshan
大鹏新区Dapeng
深汕特别合作区ShenshanSpecial
Cooperation Zone
126.4
143.1
106.9
152.6
137.3
129.7
130.1
117.1
114.0
117.1
119.1
119.3
107.5
114.9
115.4 108.1 102.3 108.7 110.1 107.1 101.9
107.4 104.5 112.9 104.2 104.4 106.2 96.9
118.5 116.5 115.2 110.5 109.3 115.2 106.2
119.2 112.3 120.3 116.2 116.0 120.7 102.3
125.6 122.8 124.9 90.2 124.0 126.8 105.2 111.5

192
8-7 固定资产投资额比重(按区域分)
INVESTMENT IN FIXED ASSETS(GROUPED BY DISTRICT)
单位:%
年 份Year
全市Total
福田区Futian
罗湖区Luohu
盐田区Yantian
南山区Nanshan
大宝安Original Baoan
1998 100 37.2 13.6 5.9 23.2 11.6
1999 100 36.4 15.0 6.3 21.3 11.8
2000 100 33.9 14.7 5.6 21.6 13.1
2001 100 33.6 12.1 7.0 21.4 14.2
2002 100 31.3 11.0 6.2 20.5 15.4
2003 100 27.0 10.2 5.8 20.3 19.0
2004 100 23.7 8.8 5.1 21.0 21.4
2005 100 17.4 7.1 4.5 22.5 24.4
2006 100 14.1 6.0 4.8 22.8 26.2
2007 100 12.6 5.3 5.3 20.0 28.6
2008 100 10.9 4.4 5.0 17.5 31.9
2009 100 9.9 4.0 5.1 15.8 34.2
2010 100 9.0 3.8 4.5 14.8 35.5
2011 100 8.4 3.7 4.1 13.9 36.9
2012 100 6.9 3.7 3.9 13.5 38.2
2013 100 6.6 3.6 3.7 13.2 38.8
2014 100 6.7 3.5 3.4 15.3 38.6
2015 100 7.1 3.8 3.0 19.2 37.2
2016 100 7.4 4.5 3.0 21.8 35.5
2017 100 7.3 4.4 2.9 21.3 23.1

193
(%)
宝安区Baoan
光明新区Guangming
龙华区Longhua
大龙岗Original
Longgang
龙岗区Longgang
坪山区Pingshan
大鹏新区Dapeng
深汕特别合作区ShenshanSpecial
Cooperation Zone
8.5
9.2
11.1
11.7
15.6
17.7
20.0
24.1
26.1
28.2
30.3
31.0
32.5
33.0
16.1 8.8 13.4 33.7 22.6 8.1 3.0
17.2 8.9 12.7 34.1 23.1 8.1 2.8
17.0 8.5 13.1 32.5 22.2 7.9 2.5
16.5 8.2 12.5 29.6 20.0 7.5 2.2
16.0 7.4 12.1 27.8 18.7 7.3 1.8
15.9 7.2 12.0 19.9 18.4 7.3 1.5 1.7

194
8-8 固定资产投资额(按注册登记类型分)
INVESTMENT IN FIXED ASSETS(GROUPED BY REGISTRATION)
单位:万元 (10 000 yuan)
年 份 Year
固定资产投资额
Investment in fixed Assets
一、内资 Domestic Funded
二、港奥台商 投资
Hong Kong Macao and
Taiwan Funded
三、外商投资 Foreign Funded
1、国有 State-Owned
2、集体 Collective-
Owned
3、其他 Others
1979 5 938 5 391 4 110 860 421 248 299
1980 13 801 8 409 6 845 924 640 3 579 1 813
1981 29 684 16 151 14 258 1 137 756 11 015 2 518
1982 73 750 54 612 51 482 2 709 421 16 323 2 815
1983 108 320 86 108 75 816 8 474 1 818 17 694 4 518
1984 194 572 168 074 140 588 23 696 3 790 17 340 9 158
1985 333 235 297 170 245 842 39 015 12 313 20 915 15 150
1986 248 551 125 166 72 584 32 840 19 742 98 200 25 185
1987 285 193 250 537 165 487 47 277 37 773 22 575 12 081
1988 436 191 401 717 294 817 49 678 57 222 23 514 10 960
1989 499 919 447 840 287 180 30 465 130 195 31 542 20 537
1990 623 380 487 758 301 877 25 914 159 967 83 548 52 074
1991 912 324 735 836 418 180 59 741 257 915 94 825 81 663
1992 1 782 322 1 349 003 568 761 223 405 556 837 254 846 178 473
1993 2 477 875 1 703 516 881 874 151 916 669 726 458 878 315 481
1994 2 819 413 1 846 715 1 087 544 119 369 639 802 556 818 415 880
1995 2 758 243 1 558 671 918 745 185 967 453 959 681 384 518 188
1996 3 275 270 1 901 137 1 187 634 262 762 450 741 758 385 615 748
1997 3 930 657 2 259 954 1 388 745 279 365 591 844 954 855 715 848
1998 4 803 901 3 036 128 1 684 184 381 675 970 269 951 888 815 885
1999 5 695 878 3 330 187 1 873 574 397 505 1 059 108 1 413 844 951 847
2000 6 771 205 3 671 964 2 167 704 442 142 1 062 119 1 946 939 1 152 302
2001 6 863 749 3 893 984 2 518 731 431 227 944 026 1 813 885 1 155 880
2002 7 881 459 4 365 422 2 618 368 482 987 1 264 067 2 158 160 1 357 877
2003 9 491 016 5 984 381 3 418 138 571 194 1 995 049 2 054 818 1 451 817
2004 10 925 571 7 305 407 3 838 617 415 432 3 051 358 1 983 450 1 636 714
2005 11 823 245 6 675 211 3 598 150 341 891 2 735 170 3 543 523 1 604 511
2006 12 736 693 7 785 744 3 596 112 235 900 3 953 732 3 439 316 1 511 633
2007 13 450 037 10 215 553 4 092 695 252 854 5 870 004 2 519 847 714 637
2008 14 676 043 11 960 565 4 895 884 350 265 6 714 416 1 863 138 852 340
2009 17 091 514 14 633 903 7 237 030 427 378 6 969 495 1 795 818 661 793
2010 19 447 008 16 154 888 8 197 032 442 385 7 515 471 2 376 101 916 019
2011 20 609 180 17 763 827 7 764 961 540 611 9 458 255 1 895 709 949 644
2012 23 144 319 19 824 400 7 857 353 1 021 661 10 945 387 1 695 817 1 624 102
2013 24 901 970 22 154 182 8 158 149 768 788 13 227 244 1 608 089 1 139 699
2014 27 174 226 24 352 413 7 578 465 984 780 15 789 168 1 634 875 1 186 938
2015 32 983 076 27 073 984 8 004 729 309 416 18 759 839 3 509 511 2 399 581
2016 40 781 638 33 858 250 9 317 375 171 476 24 369 399 4 756 995 2 166 393
2017 51 473 152 44 645 966 13 558 291 191 608 30 896 067 5 134 531 1 692 655

195
8-9 固定资产投资额(按国民经济行业分)INVESTMENT IN FIXED ASSETS
(GROUPED BY NATIONAL ECONOMIC INDUSTRIES)
单位:万元 (10 000 yuan)
年 份 Year
合 计 Total
农、林、牧、渔业Agriculture,
Forestry,Animal Husbandry and Fishery
采矿业 Mining
制造业 Manufacturing
电力、热力、燃气及水的生产和供应业
Production and Distribution of
Electricity,Gas and Water
建筑业
Construction
交通运输、仓储和邮政业
Transportation,Storage and Post
Services
1979 5 938 976 914 768 125 210
1980 13 801 657 5 502 267 248 1 300
1981 29 684 717 6 270 311 107 314
1982 73 750 2 006 6 979 327 373 2 421
1983 108 320 642 1 350 12 721 520 1 261 5 627
1984 194 572 1 666 381 19 019 10 937 3 979 8 136
1985 333 235 3 740 1 140 44 108 15 702 9 682 17 730
1986 248 551 2 361 1 472 53 675 4 423 2 962 12 436
1987 285 193 3 153 51 266 7 568 1 827 13 871
1988 436 191 3 956 110 542 16 243 3 771 26 629
1989 499 919 3 507 117 117 16 081 27 549 51 206
1990 623 380 2 406 174 876 89 188 8 907 61 162
1991 912 324 3 441 1 218 143 202 92 008 3 334 93 946
1992 1 782 322 6 797 750 215 431 113 037 8 758 154 369
1993 2 477 875 10 015 400 185 472 173 144 41 103 187 473
1994 2 819 413 9 807 210 708 139 951 76 569 299 651
1995 2 758 243 5 853 220 538 172 412 41 884 249 416
1996 3 275 270 9 780 301 243 225 157 11 608 294 605
1997 3 930 657 13 981 499 175 199 653 23 626 398 958
1998 4 803 901 16 010 514 783 97 153 49 719 417 028
1999 5 695 878 27 308 827 523 62 005 59 999 282 095
2000 6 771 205 50 262 1 073 096 96 709 66 014 402 068
2001 6 863 749 18 961 18 232 921 987 225 730 1 860 308 935
2002 7 881 459 12 555 28 302 1 155 888 255 944 8 628 261 890
2003 9 491 016 39 351 14 200 1 322 534 300 911 142 764 823 019
2004 10 925 571 7 360 14 500 2 217 311 584 674 129 666 734 274
2005 11 823 245 2 202 25 507 2 576 414 1 146 860 1 266 531
2006 12 736 693 18 800 3 076 921 1 177 081 1 674 594
2007 13 450 037 4 128 3 299 384 867 973 2 477 602
2008 14 676 043 972 2 922 701 937 328 2 819 570
2009 17 091 514 612 2 585 970 1 270 305 3 936 762
2010 19 447 008 6 355 3 713 345 1 095 246 3 650 747
2011 20 609 180 560 89 697 3 735 060 874 776 35 300 3 362 286
2012 23 144 319 40 586 11 450 4 235 209 881 840 8 705 2 531 346
2013 24 901 970 30 554 3 216 092 471 980 28 394 4 232 213
2014 27 174 226 3 915 4 559 359 646 350 6 500 3 458 632
2015 32 983 076 6 177 4 800 5 130 386 772 856 2 450 3 975 359
2016 40 781 638 2 645 1 120 6 173 043 741 557 45 903 4 471 867
2017 51 473 152 2 058 7 959 371 1 199 530 5 087 547

196
单位:万元
年 份 Year
信息传输、软件和信息技术服务业
Information Transmission,
Software and Information
Technology
批发和零售业 Wholesale and Retail Trades
住宿和餐饮业 Hotels and Catering
Services
金融业 Financial
Intermediation
房地产业 Real Estate
租赁和 商务服务业 Leasing and
Business Services
1979 76 293 196 36 860
1980 200 706 470 77 924 198
1981 273 1 315 876 142 4 976 2 163
1982 374 4 538 3 025 263 14 171 3 898
1983 1 304 6 916 4 610 492 23 283 5 573
1984 1 885 14 521 9 680 1 728 68 750 3 601
1985 4 108 24 720 16 480 4 955 111 786 6 739
1986 2 881 11 747 7 831 7 178 72 621 4 135
1987 3 213 6 888 4 592 5 205 125 492 2 211
1988 6 169 13 451 8 967 245 159 157 6 771
1989 11 863 9 744 6 496 3 824 129 225 4 995
1990 14 169 4 956 3 304 227 183 965 3 952
1991 21 764 10 011 4 290 602 360 664 15 451
1992 35 763 15 894 6 812 510 1 015 721 15 009
1993 43 432 11 570 4 958 7 228 1 349 517 70 612
1994 69 421 16 283 6 979 8 335 1 549 057 56 036
1995 57 783 52 302 22 415 18 831 1 372 717 59 129
1996 68 252 86 951 21 738 25 269 1 684 223 50 300
1997 92 427 31 722 21 148 5 521 1 868 125 83 618
1998 96 613 45 386 13 590 2 700 2 456 547 85 012
1999 65 353 44 934 13 290 4 300 2 892 745 73 386
2000 93 148 102 111 13 442 3 535 104 68 517
2001 71 572 68 760 12 467 3 804 223 53 577
2002 60 672 72 290 6 534 12 201 4 767 812 34 236
2003 190 670 41 454 390 7 405 5 476 471 12 035
2004 274 577 113 253 25 358 8 368 5 333 539 20 958
2005 208 685 191 398 29 677 35 221 4 727 520 80 171
2006 130 074 122 476 68 756 16 012 5 081 415 97 864
2007 143 341 158 903 35 388 20 353 5 065 939 20 232
2008 102 947 158 967 79 945 87 431 5 332 191 25 067
2009 185 047 93 534 69 205 125 028 5 576 991 124 738
2010 399 191 97 562 56 945 268 366 5 683 900 129 478
2011 439 977 232 832 159 983 134 437 6 921 631 194 986
2012 485 930 252 711 264 720 576 335 9 772 924 546 415
2013 334 227 232 424 151 749 418 977 12 493 426 434 174
2014 296 324 302 970 229 376 424 268 13 740 589 218 605
2015 450 733 304 935 152 984 706 695 16 626 711 835 531
2016 1 002 031 229 429 69 131 738 313 20 957 492 735 698
2017 918 338 306 643 78 312 571 835 26 024 012 1 354 934
197
8-9 续表 continued(10 000 yuan)
科学研究和技术服务业
Scientific Researchand Technical Services
水利、环境和公共设施管理业
Management of Water Conservancy,
Environment and Public Facilities
居民服务、修理和其他服务业
Services to Househdds, Repair and Other Services
教育 Education
卫生和社会工作 Health and Social
Work
文化、体育 和娱乐业
Culture,Sports and Entertainment
公共管理、社会保障和社会组织
Public Management, Social Security
and Social Organizations
115 451 918
163 742 49 178 152 520 1 448
335 8 112 541 346 179 1 018 1 689
473 14 788 975 889 430 9 070 8 750
632 21 185 1 393 800 909 9 202 11 250
1 611 13 566 900 6 550 1 845 11 447 14 751
1 623 25 416 1 685 6 476 5 135 14 250 17 550
1 994 15 778 1 034 8 417 2 400 18 028 18 269
3 210 18 945 553 4 555 2 124 13 033 16 347
4 095 25 516 1 693 4 660 3 072 10 442 29 340
4 196 19 649 1 249 10 501 3 746 46 549 32 422
4 197 19 119 988 7 284 2 978 25 935 15 767
8 100 61 600 3 863 10 378 15 133 41 972 22 565
7 413 64 934 3 752 11 543 11 175 61 041 34 363
8 265 269 784 17 653 11 164 17 390 45 541 22 336
9 486 219 584 14 009 15 189 17 801 45 443 54 354
10 585 244 839 14 782 25 420 25 368 66 758 96 811
14 605 215 867 12 575 36 422 26 595 73 602 116 478
11 696 369 717 10 905 69 645 34 224 80 337 116 179
12 603 642 082 8 253 84 941 59 412 75 140 126 929
18 361 914 870 3 346 93 427 59 706 119 484 133 746
28 030 734 979 2 925 103 635 63 372 101 472 236 320
42 027 812 146 1 394 101 440 53 614 161 057 185 767
25 896 702 155 1 559 115 296 39 970 144 006 175 625
18 851 511 305 797 128 813 27 734 245 927 186 385
35 088 805 325 440 143 475 67 599 222 613 187 193
23 372 882 529 122 331 77 008 170 238 257 580
20 124 816 526 233 117 027 43 507 163 889 111 394
23 591 525 399 5 025 82 554 70 585 166 525 483 115
183 067 1 242 672 17 890 64 773 88 256 309 706 302 560
165 492 1 630 780 21 466 114 297 216 342 408 172 566 773
314 390 2 624 514 1 679 297 274 220 735 536 523 350 758
166 843 2 953 149 7 515 441 901 205 028 418 773 234 446
132 214 2 107 159 14 252 448 928 251 958 243 331 338 306
186 457 1 777 870 16 101 249 662 248 246 241 180 138 245
303 053 2 266 448 18 648 290 175 175 951 135 385 97 678
564 827 2 357 466 40 359 397 416 438 386 181 139 33 866
650 858 3 367 794 32 555 712 437 381 306 341 224 127 235
833 938 5 130 943 29 337 915 137 566 308 214 746 280 163

198
8-10 固定资产投资额指数(按注册登记类型分)
INVESTMENT IN FIXED ASSETS(GROUPED BY REGISTRATION)
以上年为100 (Preceding Year=100)
年 份 Year
固定资产投资额
Investment in fixed Assets
一、内资 Domestic Funded
二、港澳台商投资
Hongkong Macao and
Taiwan Funded
三、外商投资 Foreign Funded
1、国有 State-Owned
2、集体 Collective-
Owned
3、其他 Others
1980 232.4 156.0 166.5 107.4 152.0 1 443.1 606.4
1981 215.1 192.1 208.3 123.1 118.1 307.8 138.9
1982 248.5 338.1 361.1 238.3 55.7 148.2 111.8
1983 146.9 157.7 147.3 312.8 431.8 108.4 160.5
1984 179.6 195.2 185.4 279.6 208.5 98.0 202.7
1985 171.3 176.8 174.9 164.6 324.9 120.6 165.4
1986 74.6 42.1 29.5 84.2 160.3 469.5 166.2
1987 114.7 200.2 228.0 144.0 191.3 23.0 48.0
1988 152.9 160.3 178.2 105.1 151.5 104.2 90.7
1989 114.6 111.5 97.4 61.3 227.5 134.1 187.4
1990 124.7 108.9 105.1 85.1 122.9 264.9 253.6
1991 146.4 150.9 138.5 230.5 161.2 113.5 156.8
1992 195.4 183.3 136.0 374.0 215.9 268.8 218.5
1993 139.0 126.3 155.1 68.0 120.3 180.1 176.8
1994 113.8 108.4 123.3 78.6 95.5 121.3 131.8
1995 97.8 84.4 84.5 155.8 71.0 122.4 124.6
1996 118.7 122.0 129.3 141.3 99.3 111.3 118.8
1997 120.0 118.9 116.9 106.3 131.3 125.9 116.3
1998 122.2 134.3 121.3 136.6 163.9 99.7 114.0
1999 118.6 109.7 111.2 104.1 109.2 148.5 116.7
2000 118.9 110.3 115.7 111.2 100.3 137.7 121.1
2001 101.4 106.0 116.2 97.5 88.9 93.2 100.3
2002 114.8 112.1 104.0 112.0 133.9 119.0 117.5
2003 120.4 137.1 130.5 118.3 157.8 95.2 106.9
2004 115.1 122.1 112.3 72.7 152.9 96.5 112.7
2005 108.2 91.4 93.7 82.3 89.6 178.7 98.0
2006 107.7 116.6 99.9 69.0 144.6 97.1 94.2
2007 105.6 131.2 113.8 107.2 148.5 73.3 47.3
2008 109.1 117.1 119.6 138.5 114.4 73.9 119.3
2009 116.5 122.4 147.8 122.0 103.8 96.4 77.6
2010 113.8 110.4 113.3 103.5 107.8 132.3 138.4
2011 106.0 110.0 94.7 122.2 125.9 79.8 103.7
2012 112.3 111.6 101.2 189.0 115.7 89.5 171.0
2013 107.6 111.8 103.8 75.2 120.8 94.8 70.2
2014 109.1 109.9 92.9 128.1 119.4 101.7 104.1
2015 121.4 111.5 135.1 97.2 101.1 232.4 170.7
2016 123.6 125.1 116.4 55.4 129.9 135.5 90.3
2017 123.8 129.3 142.4 82.3 124.7 105.6 77.7

199
8-11 固定资产投资额比重(按注册登记类型分)
INVESTMENT IN FIXED ASSETS(GROUPED BY REGISTRATION)
以上年为100 (Preceding Year=100)
年 份 Year
固定资产投资额
Investment in Fixed Assets
一、内资 Domestic Funded
二、港澳台商 投资
Hongkong Macao and
Taiwan Funded
三、外商投资 Foreign Funded
1、国有 State-owned
2、集体 Collective-
owned
3、其他 Others
1979 100 90.8 69.2 14.5 7.1 4.2 5.0
1980 100 60.9 49.6 6.7 4.6 25.9 13.1
1981 100 54.4 48.0 3.8 2.5 37.1 8.5
1982 100 74.1 69.8 3.7 0.6 22.1 3.8
1983 100 79.5 70.0 7.8 1.7 16.3 4.2
1984 100 86.4 72.3 12.2 1.9 8.9 4.7
1985 100 89.2 73.8 11.7 3.7 6.3 4.5
1986 100 50.4 29.2 13.2 7.9 39.5 10.1
1987 100 87.8 58.0 16.6 13.2 7.9 4.2
1988 100 92.1 67.6 11.4 13.1 5.4 2.5
1989 100 89.6 57.4 6.1 26.0 6.3 4.1
1990 100 78.2 48.4 4.2 25.7 13.4 8.4
1991 100 80.7 45.8 6.5 28.3 10.4 9.0
1992 100 75.7 31.9 12.5 31.2 14.3 10.0
1993 100 68.7 35.6 6.1 27.0 18.5 12.7
1994 100 65.5 38.6 4.2 22.7 19.7 14.8
1995 100 56.5 33.3 6.7 16.5 24.7 18.8
1996 100 58.0 36.3 8.0 13.8 23.2 18.8
1997 100 57.5 35.3 7.1 15.1 24.3 18.2
1998 100 63.2 35.1 7.9 20.2 19.8 17.0
1999 100 58.5 32.9 7.0 18.6 24.8 16.7
2000 100 54.2 32.0 6.5 15.7 28.8 17.0
2001 100 56.7 36.7 6.3 13.8 26.4 16.8
2002 100 55.4 33.2 6.1 16.0 27.4 17.2
2003 100 63.1 36.0 6.0 21.0 21.7 15.3
2004 100 66.9 35.1 3.8 27.9 18.2 15.0
2005 100 56.5 30.4 2.9 23.1 30.0 13.6
2006 100 61.1 28.2 1.9 31.0 27.0 11.9
2007 100 76.0 30.4 1.9 43.6 18.7 5.3
2008 100 81.5 33.4 2.4 45.6 12.7 5.8
2009 100 85.6 42.3 2.5 40.8 10.5 3.9
2010 100 83.1 42.2 2.3 38.6 12.2 4.7
2011 100 86.2 37.7 2.6 45.9 9.2 4.6
2012 100 85.7 33.9 4.4 47.3 7.3 7.0
2013 100 89.0 32.8 3.1 53.1 6.5 4.6
2014 100 89.6 27.9 3.6 58.1 6.0 4.4
2015 100 82.3 31.0 2.9 48.4 11.5 6.1
2016 100 83.0 22.8 0.4 59.8 11.7 5.3
2017 100 86.7 26.3 0.4 60.0 10.0 3.3

200
8-12 固定资产投资财务拨款额
FINANCIAL APPROPRIATION OF INVESTMENT IN INVESTMENT IN FIXED ASSETS
单位:万元 (10 000 yuan)
年 份 Year
财务拨款额 Financial
Appropriation
国家预算 内资金
State Budgetary Appropriations
国内贷款 Domestic
Loans
债券 Securities
利用外资 Foreign
Investment
自筹资金 Self-Raising
其他资金 Others
1990 499 843 2 635 115 044 164 068 181 413 36 683
1991 586 178 2 000 192 603 123 358 211 958 56 259
1992 768 887 500 230 860 87 252 370 673 79 602
1993 1 239 162 246 153 21 049 156 054 673 895 142 011
1994 1 326 714 175 767 10 339 174 809 830 151 135 648
1995 1 390 619 167 510 230 560 909 593 82 956
1996 1 524 924 190 060 324 436 931 551 78 877
1997 2 029 449 157 498 522 576 1 287 817 61 558
1998 2 144 748 4 730 192 894 128 538 1 737 315 81 271
1999 2 543 350 48 750 294 627 224 075 1 847 630 128 268
2000 2 673 582 23 649 212 704 182 471 2 137 226 117 532
2001 2 792 446 65 777 361 639 1 003 133 277 2 176 172 54 578
2002 2 923 151 7 155 382 960 275 091 2 221 310 36 635
2003 4 106 574 5 758 575 824 12 679 304 191 3 122 514 85 608
2004 5 461 589 29 969 836 874 8 372 466 319 3 854 633 265 422
2005 6 523 298 122 562 1 168 344 723 298 4 365 455 143 639
2006 7 699 392 39 406 1 742 102 3 147 1 068 750 4 748 365 97 622
2007 7 625 452 75 661 2 260 603 6 224 1 147 060 3 767 578 368 326
2008 19 604 290 7 529 5 169 912 8 530 898 838 10 453 339 3 066 142
2009 22 228 999 103 243 5 859 884 11 700 575 875 11 314 575 4 363 722
2010 23 393 550 91 371 5 396 249 10 791 464 782 12 933 971 4 496 386
2011 25 475 927 46 837 5 696 200 285 628 15 724 903 3 722 359
2012 28 588 964 3 591 502 4 969 891 425 251 15 217 060 4 385 260
2013 35 634 881 3 405 535 6 742 394 464 653 16 668 724 8 353 575
2014 34 980 412 4 152 602 7 028 834 270 135 17 964 386 5 564 455
2015 53 961 984 4 342 426 10 216 861 271 107 242 24 780 179 14 515 005
2016 56 454 255 4 524 896 11 590 897 48 999 11 848 23 971 413 16 306 202
2017 58 608 832 7 839 661 15 899 111 16 700 211 672 21 273 460 13 368 228

201
8-13 各区按登记注册类型分固定资产投资(2017年)
INVESTMENT IN FIXED ASSETS BY STATUS OF REGISTRATION
AND DISTRICT(2017)单位:万元 (10 000 yuan)
地 区District
总计Total
一、内资Funded
二、港澳台商 投资
Hongkong Macao and
Taiwan Funded
三、外商投资 Foreign Funded
1、国有State-owned
2、集体Collective-
owned
3、其他Others
全市总计 Total 51 473 152 44 645 966 13 558 291 191 608 30 896 067 5 134 531 1 692 655
福田区 Futian 3 745 056 3 583 232 1 602 396 6 000 1 974 836 154 032 7 792
罗湖区 Luohu 2 289 818 1 894 890 550 286 8 832 1 335 772 341 103 53 825
盐田区 Yantian 1 486 533 1 245 676 500 135 10 168 735 373 210 463 30 394
南山区 Nanshan 10 967 612 8 150 672 2 673 467 19 967 5 457 238 2 048 656 768 284
宝安区 Baoan 8 170 568 7 208 237 2 855 405 55 311 4 297 521 626 114 336 217
龙岗区 Longgang 9 466 863 8 627 428 2 169 134 41 184 6 417 110 773 290 66 145
龙华区 Longhua 6 182 721 5 850 868 992 605 19 586 4 838 677 200 162 131 691
坪山区 Pingshan 3 776 637 3 546 501 607 256 1 200 2 938 045 212 792 17 344
光明新区 Guangming 3 715 631 2 910 377 852 868 9 943 2 047 566 530 980 274 274
大鹏新区 Dapeng 776 594 762 546 400 654 1 348 360 544 7 359 6 689
深汕特别合作区ShenshanSpecial Cooperation Zone
895 119 865 539 354 085 18 069 493 385 29 580

202
8-14 各区按主要行业分固定资产投资(2017年)
INVESTMENT IN FIXED ASSETS IN BY DISTRICT AND SECTOR(2017)
单位:万元 (10 000 yuan)
地 区District
合计Total
农、林、牧、渔业
Agriculture, Forestry, Animal
Husbandry and Fishery
采矿业Mining
制造业Manufa- cturing
电力、燃气及水的
生产和供应业Production
and Supply of Electricity, Gas
and Water
建筑业Construction
交通运输、仓储和邮政业Transport, Storage and
Post
全市总计 Total 51 473 152 2 058 7 959 371 1 199 530 5 087 547
福田区 Futian 3 745 056 65 159 38 894 546 237
罗湖区 Luohu 2 289 818 7 453 62 448 214 059
盐田区 Yantian 1 486 533 355 528 85 503 71 148
南山区 Nanshan 10 967 612 43 615 88 429 857 743
宝安区 Baoan 8 170 568 1 138 378 179 782 1 527 405
龙岗区 Longgang 9 466 863 1 537 810 201 794 1 115 609
龙华区 Longhua 6 182 721 1 326 140 60 974 491 883
坪山区 Pingshan 3 776 637 1 364 623 59 181 52 849
光明新区 Guangming 3 715 631 1 772 956 312 895 41 729
大鹏新区 Dapeng 776 594 2 058 91 834 80 391 51 900
深汕特别合作区ShenshanSpecial Cooperation Zone
895 119 255 875 29 239 116 985

203
单位:万元 8-14 续表1 continued(10 000 yuan)
地 区District
信息传输、软件和信息技术服务业Information
Transmission, Software and Information Technology
批发和零售业
Wholesale and Retail Trades
住宿和餐饮业Hotels and Catering Services
金融业Financial Interme- diation
房地产业Real Estate
租赁和商务服务业
Leasing and Business Services
科学研究和技术服务业Scientific Research
and Technical Services
全市总计 Total 918 338 306 643 78 312 571 835 26 024 012 1 354 934 833 938
福田区 Futian 10 123 215 462 2 407 858 137 316 94 030
罗湖区 Luohu 1 85 884 1 604 618 11 550 1 900
盐田区 Yantian 217 152 4 740 515 866 13 200 94 015
南山区 Nanshan 343 451 48 330 332 982 7 415 844 365 360 216 017
宝安区 Baoan 73 511 26 699 5 689 11 270 3 177 556 481 092 110 544
龙岗区 Longgang 101 638 65 364 30 231 12 121 4 662 834 58 902 105 063
龙华区 Longhua 63 920 65 879 12 493 3 470 393 6 624 34 195
坪山区 Pingshan 1 471 107 218 895 4 704
光明新区 Guangming 57 181 14 487 8 861 946 336 507 84 896
大鹏新区 Dapeng 1 113 10 467 263 447 1 100 18 192
深汕特别合作区ShenshanSpecial Cooperation Zone
50 248 5 831 88 153 60 388 70 382

204
单位:万元 8-14 续表2 continued(10 000 yuan)
地 区District
水利、环境和公共设施管理业
Management of Water Conservancy,
Environment and Public Facilities
居民服务、修理和其他服务业
Services to Househdds, Repair and
Other Services
教育Education
卫生和社会工作Health and
Social Work
文化、体育和娱乐业
Culture, Sports and Entert-
ainment
公共管理、社会保障和社会组织
Public Management, Social Security
and Social Organizations
全市总计 Total 5 130 943 29 337 915 137 566 308 214 746 280 163
福田区 Futian 126 812 25 646 70 345 3 587 3 587
罗湖区 Luohu 184 832 49 289 24 798 6 026 36 960
盐田区 Yantian 81 146 26 448 10 128 4 022 7 637
南山区 Nanshan 803 975 329 315 84 721 37 830
宝安区 Baoan 1 297 134 95 026 17 873 13 864 14 745
龙岗区 Longgang 1 018 916 23 952 200 528 166 651 44 445 121 005
龙华区 Longhua 453 969 78 458 65 205 11 107 41 481
坪山区 Pingshan 445 120 40 483 44 691 55 732 19 252
光明新区 Guangming 303 982 56 950 72 486 30 181 12 184
大鹏新区 Dapeng 227 451 12 994 9 410 922 5 315
深汕特别合作区ShenshanSpecial Cooperation Zone
187 606 5 385 7 030 17 997

205
8-15 国有经济固定资产投资主要指标
MAIN INDICATORS OF INVESTMENT IN FIXED ASSETS OF STATE-OWNED
ECONOMY单位:亿元 (100 million yuan)
项 目Item
2013 2014 2015 2016 2017
建设项目个数(个) Number of Projects(unit)
施工项目 Projects under Construction 858 846 1 042 975 2 019
全部建成投产项目 Projects Completed and Put into Use 352 410 550 512 557
投资总额 Total Investment 815.81 757.85 800.47 931.74 1 355.83
#住宅 Residential Buildings 32.80 29.65 43.02 10.32 21.93
按构成分 Grouped by Structure of Investment
建筑安装工程 Construction and Installation 580.85 576.85 700.74 723.18 1 044.63
设备工具器具购置 Purchase of Equipment and Instruments 60.68 72.58 150.98 73.55 96.25
其他费用 Others 140.01 108.42 172.21 135.01 214.95
按建设性质分 Grouped by Type of Construction
#新建 New Construction 686.28 658.58 990.08 787.24 1 164.93
#扩建 Expansion 15.88 20.52 27.70 33.94 43.38
#改建 Reconstruction 79.38 78.75 6.15 55.29 62.17
按资金来源分 Grouped by Source of Funds 1 040.74 953.58 1 187.33 868.52 1 228.24
国家预算内资金 State Budget 330.50 315.05 405.32 410.32 758.76
国内贷款 Domestic Loans 123.86 138.52 187.92 115.85 247.52
利用外资 Foreign Investment 0.05 1.55
自筹资金 Self-raising Funds 400.45 386.85 502.29 223.22 316.75
其他资金 Others 185.93 113.16 91.80 119.08 36.91
新增固定资产 Newly Increased Fixed Assets 580.96 412.25 600.54 186.93 393.12
房屋建筑面积(万平方米) Floor Space of Buildings(10 000 sq.m)
施工面积 Floor Space under Construction 952.52 758.58 924.38 636.22 1 146.82
竣工面积 Floor Space Completed 250.80 240.04 304.05 41.02 28.71
#住宅 Residential Buildings 6.18 5.87 8.00 5.16 11.42
注: 建设项目个数不含房地产开发部分。Note: Number of projects exclude real estate development.

206
8-16 基础产业和基础设施完成投资额
COMPLETED INVESTMENT IN BASIC INDUSTRIES AND NFRASTRUCTURE
单位:亿元 (100 million yuan)
项 目Item
2014 2015 2016 2017
基础产业投资完成额 Completed Investment in Basic Industries 597.73 725.52 869.62 1 173.31
#基础设施投资 Investment in Infrastructure 589.08 713.50 864.95 1 163.45
(一)电力、燃气及水的生产和供应业 Production and Supply of Electric Power,Gas and Water 64.64 77.29 74.16 119.95
(二)交通运输、仓储和邮政业 Transport , Storage and Postal Services 345.86 397.54 447.19 508.75
#交通运输业 Transport Service 326.76 386.42 390.15 473.30
1、铁路运输业 Railway Transport 21.35 12.58 8.04 10.32
2、道路运输业 Road Transport 230.75 280.52 296.61 352.96
# 城市公共交通业 Urban Public Transport 171.53 213.42 229.71 265.86
3、水上运输业 Waterway Trarsport 3.83 2.50 32.32 31.24
4、航空运输业 Air Transport 70.83 90.82 53.18 78.79
5、管道运输业 Pipeline Transport
(三)信息传输、计算机服务和软件业 Information Trarismission,Computer Services and Software 29.63 45.07 100.20 91.83
(四)水利、环境和公共设施管理业 Management of Water Conservarcy,Environment and Public Facilities 226.64 235.75 336.78 513.09
#水利管理投资 Investment of Water Conservancy 15.05 16.00 55.51 79.21
1、防洪管理 Flood Prevention Management 10.88 9.88 10.30 19.92
2、水资源管理 Water Resources Management 2.07 2.87 4.00 2.82
3、其他水利管理 Other Water Conservacy 2.10 3.25 38.21 55.87
#能源产业投资 Investment of Energy Industry 61.51 66.19 99.93
1、煤炭开采和洗选业 Mining and Washing of Coal
2、石油和天然气开采业 Extraction of Petroleum and Natual Gas 0.01
3、石油加工炼焦及核燃料加工业 Processing of Petroleum, Coking and Nuclear Fuel Processing 0.17
4、电力、热力的生产和供应业 Production and Supply of Electric Power and Heat Power 36.76 45.18 51.12 91.25
5、燃气的生产和供应业 Production and Supply of Gas 17.91 16.33 14.90 8.67

207
8-17 各区固定资产投资财务拨款资金来源主要指标(2017年)
MAIN INDICATORS OF SOURCES OF FUNDS FOR INVESTMENT
BY DISTRICT(2017)单位:万元 (10 000 yuan)
地 区District
本年资金来源小计Source of Sub-total
Funds
国家预算内资金
State Budget
国内贷款Domestic
Loans
债券Bonds
利用外资Foreign
Investment
自筹资金Self-raising
Fund
其他资金Others
全市总计 Total 58 608 832 7 839 661 15 899 111 16 700 211 672 21 273 460 13 368 228
福田区 Futian 8 306 516 667 092 3 616 006 39 070 1 637 020 2 347 328
罗湖区 Luohu 3 548 428 1 342 535 939 208 482 053 784 632
盐田区 Yantian 1 934 285 231 189 370 554 3 000 692 542 637 000
南山区 Nanshan 10 474 564 662 407 2 027 662 1 500 80 091 5 814 234 1 888 670
宝安区 Baoan 10 074 239 1 975 061 2 214 330 36 131 3 277 790 2 570 927
龙岗区 Longgang 11 168 601 1 409 065 3 149 572 15 200 6 260 3 762 157 2 826 347
龙华区 Longhua 5 440 206 636 607 1 553 451 42 120 2 245 739 962 289
坪山区 Pingshan 3 027 512 270 184 741 384 1 471 688 544 256
光明新区 Guangming 3 164 134 543 966 994 736 1 038 145 587 287
大鹏新区 Dapeng 619 620 101 555 122 541 215 898 174 626
深汕特别合作区ShenshanSpecial Cooperation Zone
850 727 169 667 636 194 44 866

208
8-18 各区按构成和建设性质分城镇固定资产投资(2017年)
INVESTMENT IN FIXED ASSETS IN URBAN AREA BY COMPOSITION OF FUNDS,
TYPE OF CONSTRUCTION AND DISTRICT(2017)单位:万元 (10 000 yuan)
地 区District
投资额Total
Investment
按构成分By Composition of Funds
按建设性质分By Type of Construction
建筑安装工程Construction
andInstallation
设备、工器具购置Purchase of Equipment
and Instruments
其他费用Others
#新建New
Construction
#扩建Expansion
#改建、技术改造Reconstruction and
Technological Transformation
全市总计 Total 51 473 152 30 000 795 6 561 907 14 910 450 45 989 355 1 412 859 2 932 537
福田区 Futian 3 745 056 2 441 821 316 925 986 310 4 116 394 6 320 73 626
罗湖区 Luohu 2 289 818 1 169 432 38 132 1 082 254 2 137 444 6 386 86 417
盐田区 Yantian 1 486 533 937 581 267 124 281 828 1 094 827 21 279 238 676
南山区 Nanshan 10 967 612 6 017 316 187 202 4 763 094 10 145 708 244 653 447 977
宝安区 Baoan 8 170 568 5 475 445 1 377 163 1 317 960 7 049 059 212 032 574 795
龙岗区 Longgang 9 466 863 6 320 326 1 477 869 1 668 668 8 948 307 306 322 387 299
龙华区 Longhua 6 182 721 3 067 802 1 197 615 1 917 304 5 777 130 109 988 327 988
坪山区 Pingshan 3 776 637 1 564 838 673 125 1 538 674 2 720 248 149 161 224 676
光明新区 Guangming 3 715 631 1 864 050 800 249 1 051 332 2 491 179 291 347 514 553
大鹏新区 Dapeng 776 594 510 421 111 870 154 303 711 268 22 720 48 330
深汕特别合作区ShenshanSpecial Cooperation Zone
895 119 631 763 114 633 148 723 797 791 42 651 8 200

209
8-19 房屋施工建筑面积
FLOOR SPACE OF BUILDINGS UNDER CONSTRUCTION
单位:万平方米 (10 000 sq.m)
年 份 Year
合 计 Total 非房地产开发项目
Non-Real Estate Development房地产开发项目
Real Estate Development
1979 29.26 29.26
1980 52.36 52.36
1981 96.88 96.88
1982 250.71 250.71
1983 368.40 368.40
1984 644.59 644.59
1985 1 030.94 1 030.94
1986 940.39 771.29
1987 887.21 642.48
1988 1 161.77 888.29
1989 1 088.02 926.36
1990 848.65 408.71 304.62
1991 1 257.19 533.66 467.82
1992 1 813.80 532.45 950.06
1993 2 319.40 566.70 1 396.44
1994 2 733.59 704.15 1 298.82
1995 2 733.59 951.68 1 371.06
1996 2 878.53 965.41 1 495.27
1997 2 775.82 847.14 1 454.17
1998 3 218.81 862.96 1 656.65
1999 3 369.43 829.19 1 834.13
2000 3 591.22 790.57 2 134.95
2001 4 137.47 977.07 2 392.77
2002 4 467.16 861.88 2 776.29
2003 5 567.66 1 277.01 2 838.22
2004 5 856.65 2 177.17 3 120.25
2005 4 841.55 1 624.60 3 058.90
2006 4 512.66 1 204.30 3 122.10
2007 4 184.86 920.16 3 149.56
2008 4 619.53 1 116.83 3 276.30
2009 5 257.21 2 144.85 3 112.36
2010 5 178.84 2 238.90 2 939.94
2011 5 162.10 2 286.12 2 875.98
2012 5 259.50 2 042.81 3 216.69
2013 6 308.89 2 305.40 4 003.49
2014 6 249.70 1 757.52 4 492.18
2015 7 010.06 2 031.65 4 978.41
2016 6 677.50 1 503.51 5 173.99
2017 7 560.49 1 851.16 5 709.34
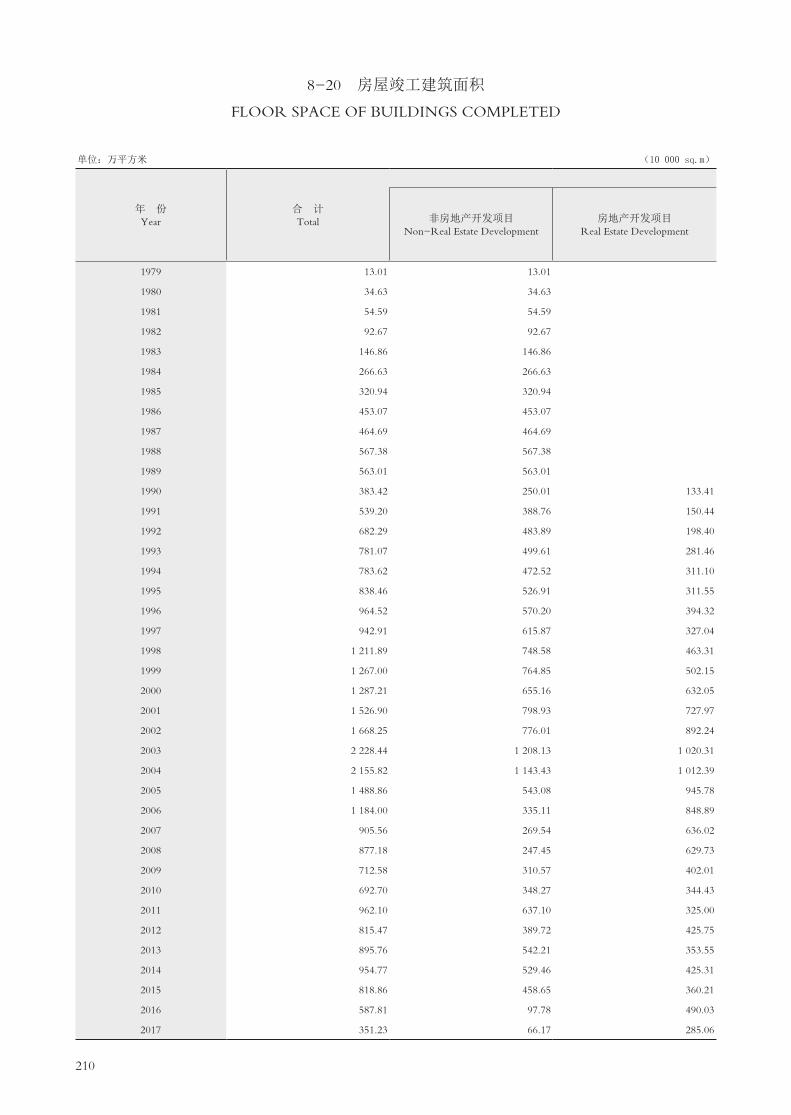
210
8-20 房屋竣工建筑面积
FLOOR SPACE OF BUILDINGS COMPLETED
单位:万平方米 (10 000 sq.m)
年 份 Year
合 计 Total 非房地产开发项目
Non-Real Estate Development房地产开发项目
Real Estate Development
1979 13.01 13.01
1980 34.63 34.63
1981 54.59 54.59
1982 92.67 92.67
1983 146.86 146.86
1984 266.63 266.63
1985 320.94 320.94
1986 453.07 453.07
1987 464.69 464.69
1988 567.38 567.38
1989 563.01 563.01
1990 383.42 250.01 133.41
1991 539.20 388.76 150.44
1992 682.29 483.89 198.40
1993 781.07 499.61 281.46
1994 783.62 472.52 311.10
1995 838.46 526.91 311.55
1996 964.52 570.20 394.32
1997 942.91 615.87 327.04
1998 1 211.89 748.58 463.31
1999 1 267.00 764.85 502.15
2000 1 287.21 655.16 632.05
2001 1 526.90 798.93 727.97
2002 1 668.25 776.01 892.24
2003 2 228.44 1 208.13 1 020.31
2004 2 155.82 1 143.43 1 012.39
2005 1 488.86 543.08 945.78
2006 1 184.00 335.11 848.89
2007 905.56 269.54 636.02
2008 877.18 247.45 629.73
2009 712.58 310.57 402.01
2010 692.70 348.27 344.43
2011 962.10 637.10 325.00
2012 815.47 389.72 425.75
2013 895.76 542.21 353.55
2014 954.77 529.46 425.31
2015 818.86 458.65 360.21
2016 587.81 97.78 490.03
2017 351.23 66.17 285.06

211
8-21 竣工房屋价值
VALUE OF BUILDINGS COMPLETED
单位:万元 (10 000 yuan)
年 份 Year
合 计 Total 非房地产开发项目
Non-Real Estate Development房地产开发项目
Real Estate Development
1979 1 207 1 207
1980 4 607 4 607
1981 9 189 9 189
1982 20 865 20 865
1983 37 164 37 164
1984 79 318 79 318
1985 103 970 103 970
1986 157 701 157 701
1987 151 670 151 670
1988 348 453 348 453
1989 276 535 276 535
1990 210 323 143 647 66 676
1991 308 940 209 291 99 649
1992 601 150 441 123 160 027
1993 640 545 402 632 237 913
1994 784 100 450 155 333 945
1995 1 343 491 589 564 753 927
1996 1 825 063 689 196 1 135 867
1997 1 745 964 831 798 914 166
1998 2 416 223 951 213 1 465 010
1999 2 670 993 1 196 580 1 474 413
2000 2 955 291 895 867 2 059 424
2001 2 795 702 1 029 008 1 766 694
2002 3 601 624 992 766 2 608 858
2003 4 260 940 1 578 186 2 682 754
2004 3 421 757 1 121 432 2 300 325
2005 3 632 843 673 980 2 958 863
2006 3 594 969 419 621 3 175 348
2007 2 933 541 523 025 2 410 516
2008 2 862 722 206 362 2 656 360
2009 2 993 216 585 173 2 408 043
2010 2 663 742 573 198 2 090 544
2011 3 340 401 1 731 089 1 609 312
2012 3 384 230 788 002 2 596 228
2013 4 851 340 2 101 465 2 749 875
2014 3 858 122 1 110 096 2 748 026
2015 4 238 203 1 222 205 3 015 998
2016 4 166 251 546 280 3 619 971
2017 3 040 094 255 529 2 784 565

212
8-22 住宅投资
INVESTMENT IN RESIDENTIAL HOUSING
单位:万元 (10 000 yuan)
年 份 Year
合 计 Total 非房地产开发项目
Non-Real Estate Development房地产开发项目
Real Estate Development
1979 914 914
1980 2 838 2 838
1981 6 428 6 428
1982 19 021 19 021
1983 27 640 27 640
1984 38 406 38 406
1985 64 863 64 863
1986 46 940 46 940
1987 54 629 54 629
1988 114 993 114 993
1989 123 617 123 617
1990 184 564 113 964 70 600
1991 368 786 215 386 153 400
1992 886 272 435 872 450 400
1993 913 193 245 193 668 000
1994 1 131 517 257 417 874 100
1995 937 427 308 927 628 500
1996 1 101 662 315 262 786 400
1997 1 135 054 280 005 855 049
1998 1 500 548 501 698 998 850
1999 1 874 853 461 747 1 413 106
2000 2 185 195 398 406 1 786 789
2001 2 471 512 374 412 2 097 100
2002 3 046 579 337 379 2 709 200
2003 2 987 720 485 806 2 501 914
2004 3 018 249 459 849 2 558 400
2005 2 785 401 130 001 2 655 400
2006 3 384 498 134 044 3 250 454
2007 3 468 913 151 346 3 317 567
2008 3 494 643 344 854 3 149 789
2009 3 456 595 558 747 2 897 848
2010 3 601 242 552 364 3 048 878
2011 4 055 301 523 183 3 532 118
2012 5 422 058 676 077 4 745 981
2013 6 544 510 603 463 5 941 047
2014 7 779 946 477 182 7 302 764
2015 9 239 015 267 684 8 971 331
2016 10 612 596 167 234 10 445 362
2017 23 970 296 68 430 23 901 866

213
8-23 住宅施工建筑面积
FLOOR SPACE OF RESIDENTIAL HOUSING UNDER CONSTRUCTION
单位:万平方米 (10 000 sq.m)
年 份 Year
合 计 Total 非房地产开发项目
Non-Real Estate Development房地产开发项目
Real Estate Development
1979 13.41 13.41
1980 27.81 27.81
1981 43.34 43.34
1982 128.3 128.3
1983 156.68 156.68
1984 258.52 258.52
1985 362.7 362.7
1986 366.59 366.59
1987 339.69 339.69
1988 447.03 447.03
1989 434.43 434.43
1990 393.02 200.87 192.15
1991 630.97 351.97 279
1992 1 040.81 439.71 601.1
1993 1 302.24 392.73 909.51
1994 1 344.78 475.92 868.86
1995 1 443.75 599.55 844.2
1996 1 474.14 533.53 940.61
1997 1 365.44 399.26 966.18
1998 1 866.76 719.79 1 146.97
1999 1 944.88 589.26 1 355.62
2000 2 059.39 482.5 1 576.89
2001 2 261.63 471.14 1 790.49
2002 2 575.33 450.47 2 124.86
2003 2 824.41 751.52 2 072.89
2004 2 944.42 686.74 2 257.68
2005 2 343.55 190.97 2 152.58
2006 2 292.72 135.33 2 157.39
2007 2 302.93 125.15 2 177.78
2008 2 487.73 277.37 2 210.36
2009 2 490.16 402.69 2 087.47
2010 2 510.02 484.88 2 025.14
2011 2 252.60 286.97 1 965.63
2012 2 547.67 440.08 2 107.59
2013 3 067.52 459.23 2 608.29
2014 3 165.22 295.22 2 870.00
2015 3 343.16 186.17 3 156.99
2016 3 195.56 116.28 3 079.28
2017 3 076.68 87.26 2 989.42

214
8-24 住宅竣工建筑面积
FLOOR SPACE OF RESIDENTIAL HOUSING COMPLETED
单位:万平方米 (10 000 sq.m)
年 份 Year
合 计 Total 非房地产开发项目
Non-Real Estate Development房地产开发项目
Real Estate Development
1979 5.26 5.26
1980 17.85 17.85
1981 23.41 23.41
1982 45.57 45.57
1983 62.42 62.42
1984 123.76 123.76
1985 139.31 139.31
1986 197.15 197.15
1987 199.09 199.09
1988 245.10 245.10
1989 236.98 236.98
1990 204.77 120.37 84.40
1991 305.17 213.95 91.22
1992 416.31 285.41 130.90
1993 440.36 243.61 196.75
1994 438.83 232.33 206.50
1995 485.23 268.85 216.38
1996 565.86 315.35 250.51
1997 512.24 269.05 243.19
1998 729.48 373.18 356.30
1999 800.60 388.14 412.46
2000 755.59 231.04 524.55
2001 852.58 279.37 573.21
2002 1 000.19 301.87 698.32
2003 1 290.61 473.99 816.62
2004 1 245.59 473.39 772.20
2005 781.54 77.10 704.44
2006 627.31 45.44 581.87
2007 507.71 70.57 437.14
2008 519.72 75.95 443.77
2009 415.18 145.64 269.54
2010 376.03 124.92 251.11
2011 283.34 50.68 232.66
2012 310.85 21.45 289.40
2013 229.38 33.05 196.33
2014 336.24 66.98 269.26
2015 206.60 4.23 202.37
2016 302.26 21.62 280.64
2017 183.89 0.10 183.79

215
8-25 住宅竣工价值
VALUE OF RESIDENTIAL HOUSING COMPLETED
单位:万元 (10 000 yuan)
年 份 Year
合 计 Total 非房地产开发项目
Non-Real Estate Development房地产开发项目
Real Estate Development
1979 449 449
1980 2 440 2 440
1981 4 322 4 322
1982 9 873 9 873
1983 15 043 15 043
1984 37 418 37 418
1985 38 341 38 341
1986 54 880 54 880
1987 46 707 46 707
1988 88 625 88 625
1989 109 242 109 242
1990 105 056 54 141 50 915
1991 180 594 97 555 83 039
1992 256 111 126 101 130 010
1993 351 941 183 002 168 939
1994 432 365 197 797 234 568
1995 754 577 256 370 498 207
1996 918 088 320 698 597 390
1997 879 347 280 726 598 621
1998 1 426 708 381 849 1 044 859
1999 1 604 378 413 281 1 191 097
2000 2 023 916 295 545 1 728 371
2001 1 768 793 360 468 1 408 325
2002 2 317 417 256 691 2 060 726
2003 2 718 868 573 862 2 145 006
2004 2 140 997 349 310 1 791 687
2005 2 249 795 105 330 2 144 465
2006 2 166 187 35 346 2 130 841
2007 1 782 456 126 881 1 655 575
2008 2 859 458 403 511 2 455 947
2009 1 954 702 174 664 1 780 038
2010 1 809 542 145 208 1 664 334
2011 1 304 387 140 743 1 163 644
2012 1 731 885 41 786 1 690 099
2013 1 624 371 112 366 1 512 005
2014 2 098 830 182 101 1 916 729
2015 1 710 751 12 941 1 697 810
2016 2 240 657 44 430 2 196 227
2017 1 707 425 180 1 707 245

216
8-26 固定资产投资完成情况主要指标
MAIN INDICATORS OF INVESTMENT IN FIXED ASSETS
单位:亿元 (100 million yuan)
指 标Indicators
2014 2015 2016 2017
一、计划总投资及项目个数 Total Planned Investment and Project Number
1、计划总投资 Total Planned Investment 14 165.50 15 150.63 19 722.11 30 509.75
其中:本年新开工项目 New Projects under Construction in Current Year 3 381.77 3 611.23 4 195.35 2 047.08
2、施工项目个数(个) Number of Projects under Construction(unit) 2 928 2 984 3 090 3 840
其中:本年新开工(个) Newly Started Projects of the Year(unit) 1 522 1 576 1 724 1 942
本年投产项目个数(个) Number of Projects Put into Use in Current Year 1 895 1 381 1 447 1 329
二、本年完成投资 Investment Completed in Current Year 2 717.42 3 298.31 4 078.16 5147.31
(一)按登记注册类型分组 Grouped by Registration Status
1、内资 Domestic-funded 2 435.24 2 715.84 3 385.83 4 464.60
国有经济 State-owned 757.85 1 023.93 530.63 1 355.83
集体经济 Collective-owned 98.48 95.70 0.19 19.16
其他内资经济 Others 1 578.91 1 596.22 2 855.00 3 089.61
2、港澳台商投资 Funds from Hong Kong,Macao and Taiwan 163.49 379.89 475.70 513.45
3、外商投资 Foreign-funded 118.69 202.58 216.64 169.27
(二)按建设性质分 Grouped by Type of Construction
#新建 New Construction 2 392.52 2 521.82 3 557.04 4 598.94
#扩建 Expansion 53.81 431.22 112.54 141.29
#改建和技术改造 Reconstruction and Technical Reconstruction 271.09 345.27 321.10 293.25
(三)按构成分 Grouped by Use of Funds
1、建筑工程 Construction 1 704.29 1 842.10 2 248.22 2 680.94
2、安装工程 Installation 188.15 287.08 301.93 319.14
3、设备工器具购置 Purchase of Equipment and Instruments 401.75 439.31 488.36 656.19
4、其他费用 Other Expenses 423.23 729.81 1 039.66 1 491.05
(四)按主要产业分 Grouped by Major Industries
#文化产业 Culture and Arts 96.06 109.09 155.44 178.21
新闻服务 Press Service
出版发行和版权服务 Publication and Copyright Service 0.73 3.82
广播、电视、电影服务 Radio, Television and Film Service 0.93 1.10 21.03 5.29
文化艺术服务 Culture and Art Service 6.84 15.62 13.62 10.93
网络文化服务 Internet Service 4.10 13.99 5.60 9.88
文化休闲娱乐服务 Cultural and Entertaining Service 5.71 4.54 20.41 24.32
其他文化服务 Other Cultural Services 5.75 7.83 54.45 82.70
文化用品、设备相关文化产品生产 Production of Related Cultural Products and Equipments 46.00 31.20 40.32 41.28
#信息产业 Information Industry 209.40 311.32 448.48 568.07
电子信息设备制造 Manufacture of Electronic Information Equipment 167.73 261.14 324.89 469.63
电子信息设备销售和租赁 Sales and Leasing of Electronic Information Equipment 0.66 0.36 1.30 0.11
注: 计划总投资及项目个数不含房地产开发部分。Note: The data of total planned investment and project number exclude the data of real estate development.

217
单位:亿元 8-26 续表1 (100 million yuan)
指 标Indicators
2014 2015 2016 2017
电子信息传输服务 Information Transmission Services 27.02 31.86 51.33 53.85
计算机服务和软件业 Computer Services and Software 12.61 14.16 49.17 37.98
其他信息相关服务 Other Information Related Service 1.38 3.80 21.79 6.50
1、第一产业 Primary Industry 0.39 0.62 0.13 0.21
2、第二产业 Secondary Industry 521.22 591.05 695.47 911.23
#工业合计 Total Industries 520.57 590.80 691.57 915.89
#工业九大产业 Nine Main Industrial Sectors 416.10 475.39 554.85 688.60
电子信息业 Electronic Information 198.10 261.14 294.43 455.72
电气机械及专用设备 Electrical Machinery and Special- Equipment 80.06 90.72 177.11 157.62
石油及化学 Petroleum and Chemistry 6.44 14.51 9.69 14.01
纺织及服装 Textile and Garments 18.83 6.58 1.58 6.19
食品饮料 Food and Beverage 5.06 2.54 4.14 4.60
建筑材料 Construction Materials 11.43 7.23 2.54 8.26
森工造纸 Paper Manufacturing 6.70 1.18 0.55
医药 Medicine 20.17 22.15 14.48 18.23
汽车 Automobile 69.32 70.52 49.71 23.42
3、第三产业 Tertiary Industry 2195.81 2 706.64 3 382.56 4 235.88
(五)按国民经济行业分 Grouped by Economic Sector
农、林、牧、渔业 Agriculture,Forestry,Animal Husbandry and Fishery 0.39 0.62 0.26 0.21
采矿业 Mining 0.48 0.11
制造业 Manufacturing 455.94 513.04 617.30 795.94
电力、燃气及水的生产和供应业 Production and Supply of Electric Power,Gas and Water 64.64 77.29 74.16 119.95
建筑业 Construction 0.65 0.25 4.59
交通运输、仓储和邮政业 Transport,Storage and Postal Services 345.86 397.54 447.19 508.75
信息传输、软件和信息技术服务业 Information Transmission, Software and Information Technology 29.63 45.07 100.20 91.83
批发和零售业 Wholesale and Retail Trades 30.30 30.49 22.94 30.66
住宿与饮食业 Hotels and Catering Services 22.94 15.30 6.91 7.83
金融业 Financial Intermediation 42.43 70.67 73.83 57.18
房地产业 Real Estate 1374.06 1 662.67 2 095.75 2 602.40
租赁和商务服务业 Leasing and Business Services 21.86 83.55 73.57 135.49
科学研究和技术服务业 Scientific Research and Technical Services 30.30 56.48 65.09 83.39
水利、环境和公共设施管理业 Management of Water Consercancy,Environment and Public Facilities 226.64 235.75 336.78 513.09
居民服务、修理和其他服务业 Services to Househdds, Repair and Other Services 1.86 4.04 3.26 2.93
教育 Education 29.02 39.74 71.24 91.51
卫生和社会工作 Health and Social Work 17.60 43.84 38.13 56.63
文化、体育和娱乐业 Culture,Sports and Recreation 13.54 18.11 34.12 21.47
公共管理、社会保障和社会组织 Public Management,Social Security and Social Organizations 9.76 3.39 12.72 28.02
国际组织 International Organizations

218
单位:亿元 8-26 续表2 (100 million yuan)
指 标Indicators
2014 2015 2016 2017
三、本年新增固定资产 Newly Increased Fixed Assets in Current Year 2 374.10 1 478.56 1 915.01 1 039.04
四、房屋面积 Floor Space
本年施工房屋面积(万平方米) Floor Space of Buildings Under Construction in Current 6 249.70 7 010.06 6 677.50 7 560.49
Year(10 000sq.m)
其中:住宅(万平方米) Residential Buildings(10 000sq.m) 3 165.22 3 343.16 3 195.56 3 076.68
本年竣工房屋面积(万平方米) Floor Space of Buildings Completed in Current Year(10 000sq.m) 954.77 818.86 587.81 351.23
其中:住宅(万平方米) Residential Buildings(10 000sq.m) 336.24 206.60 302.26 183.89
本年竣工房屋价值 Value of Buildings Completed in Current Year 385.81 423.82 416.63 304.01
其中:住宅 Residential Buildings 209.88 171.08 224.07 170.74
五、资金来源情况 Source of Funds
(一)本年资金来源合计 Source of Total Funds This Year 4 370.12 6 283.52 6 827.12 3 026.66
上年末结余资金 Surplur Funds From the Year-end of Proceding Year 872.08 887.32 1 181.69 398.83
本年资金来源小计 Source of Sub-total Funds This Year 3 498.04 5 396.20 5 645.43 2 627.83
国家预算内资金 State Budget 415.26 434.24 452.49 783.97
国内贷款 Domestic Loans 702.88 1 021.69 1 159.09 392.98
债券 Bond 0.03 4.90 1.67
利用外资 Foreign Investment 27.01 10.72 1.18 13.25
其中:外商直接投资 Foreign Direct Investment 4.45 3.20 1.18
自筹资金 Self-raising Funds 1 796.44 2 478.02 2 397.14 1 334.91
其他资金来源 Other Sources of Funds 556.45 1 451.50 1 630.62 101.05
(二)各项应付款合计 Total Payment Of This Year 511.53 678.68 765.95 493.82

219
8-27 各区固定资产投资
FIXED ASSET INVESTMENT BY DISTRICT
单位:万元 (10 000 yuan)
地 区District
2014 2015 2016 20172017年
增长率(%)Growth Rate
全市总计 Total 27 174 226 32 983 076 40 781 638 51 473 152 23.8
福田区 Futian 1 811 806 2 353 842 3 000 289 3 745 056 24.8
罗湖区 Luohu 951 102 1 259 008 1 843 702 2 289 818 24.2
盐田区 Yantian 921 701 995 926 1 225 743 1 486 533 21.3
南山区 Nanshan 4 159 002 6 339 870 8 879 664 10 967 612 23.5
宝安区 Baoan 4 606 802 5 457 214 6 504 842 8 170 568 25.6
龙岗区 Longgang 6 020 000 6 580 947 7 636 984 9 466 863 24.0
龙华区 Longhua 3 570 000 4 113 428 4 948 246 6 182 721 24.9
坪山区 Pingshan 2 141 905 2 468 152 2 978 899 3 776 637 26.8
光明新区 Guangming 2 311 908 2 692 767 3 024 869 3 715 631 22.8
大鹏新区 Dapeng 680 000 721 922 738 400 776 594 5.2
深汕特别合作区ShenshanSpecial Cooperation Zone 895 119 11.5

220
主要统计指标解释
固定资产投资额 是以货币形式表现的在一定时期内建造和购置固定资产的工作量以及与此有关的费用
的总称。它是反映固定资产投资规模、结构和发展速度的综合性指标,又是观察工程进度和考核投资效果的重
要依据。固定资产投资包括国有经济单位投资、城乡集体及其他各种登记注册类型的单位投资和城乡居民个人
投资。按照国家统计制度规定,固定资产投资统计范围包括:城镇和农村投资两大部分。城乡集体经济单位投
资包括城镇集体所有制单位投资和农村集体所有制单位投资;其它各种经济类型单位投资包括联营经济、股份
制经济、中外合资经济、中外合作经济、外资、与大陆合资经营、与大陆合作经营、港澳台独资及其它经济的
单位投资;城乡居民个人投资包括城市、县城、镇、工矿区所辖范围内的个人建房和农村个人建房及购买生产
性固定资产的投资。
1.城镇和农村建设项目投资月报统计范围为:城镇和农村各种登记注册类型的企业、事业、行政单位及个
体户进行的计划总投资500万元及500万元以上的建设项目,包括城镇各种经济类型的建设项目和工矿区私人建
房项目,以及农村非农户投资项目、农村农户建房和购置生产性设备投资。年报统计范围中的城镇和工矿区私
人建房为市、县城、镇、工矿区所辖范围内的全部私人建房(不论其房主是否系本地的常住户口均应包括),
其他部分与月报统计范围一致。年报统计范围中的农户固定资产投资为所辖范围内的全部私人建房和其他购置
生产性设备等投资。
2.城镇建设项目投资在城乡分组中:“城镇”、农村非农户建设项目投资在城乡分组中“农村”,农村农
户在城乡分组中填“农户”,汇总表中“农村”包含“农户”。
房地产开发投资 各种登记注册类型的房地产开发公司 、商品房建设公司及其他房地产开发单位统一开
发的包括统代建、拆迁还建的住宅、厂房、仓库、饭店、宾馆、度假村、写字楼、办公楼等房屋建筑物和配套
的服务设施、土地开发工程,如道路、给水、排水、供电 、供热、通讯、平整场地等基础设施工程的投资。
包括实际从事房地产开发或经营活动的附营房地产开发单位。不包括单纯的土地交易活动。
新增生产能力(或工程效益) 指通过固定资产投资活动而增加的设计能力(或工程效益),是以实物
形态表示的固定资产投资成果的指标,也是考核投资经济效果的重要依据之一。
住宅建筑面积 指施工和竣工房屋建筑面积中供居住用的房屋建筑面积。
房屋施工面积 指在报告期内施工的全部房屋建筑面积。包括本期新开工的面积和上期开工跨入本期继
续施工的面积,以及上期已停建在本期恢复施工的房屋面积。本期竣工和本期施工后又停缓建的房屋,其建筑
面积仍计入本期房屋施工面积中。
房屋竣工面积 指在报告期内房屋建筑按照设计要求已经全部完工,达到住人和使用条件,经验收鉴定
合格(或达到竣工验收标准),正式移交使用的各栋房屋建筑面积的总和。
房屋建筑面积竣工率 是指一定时期内房屋竣工面积与施工面积的比率。它是从房屋建筑施工速度的角
度反映投资效果的指标。
新增固定资产 指已经完成建造和购置过程,并已交付生产或使用单位的固定资产的价值。它是表示固
定资产投资成果的价值指标,也是反映建设进度,计算固定资产投资效果的重要依据。
建设项目投产率 是建设周期的逆指标,是指一定时期内全部建成投产项目个数与同期施工项目个数的
比率。它是从建设速度的角度反映投资效果的指标。

221
Explanatory Notes on Main Statistical Indicators
Amount of Investment in Fixed Assets refers to the sum in monetary terms of the volume of activities in the
construction and purchase of fixed assets as well as related expenses. It is not only a comprehensive indicator of the
size, proportional relations and developmental pace of investment in fixed assets, but also an important basis to follow
the progress of projects and check the result of investment on. Total investment in fixed assets includes investment by
state-owned units, urban and rural collective units, units of other types of ownership and individuals in urban and rural
areas. According to China's current statistics system, investment in fixed assets is classified into two parts: urban and
rural. Investment by urban and rural collective units includes investment by urban collective units and investment by
rural collective units. Investment by units of other types of ownership includes investment by units of joint ownership
economy, shareholding economy, Sino-foreign joint economy, Sino-foreign cooperative economy, economy
exclusively funded by foreign investors, joint economy with the mainland, cooperative economy with the mainland,
economy exclusively funded by compatriots from Hong Kong, Macao and Taiwan and units of other types of ownership.
Investment by individuals in urban and rural areas includes investment in personal housing in areas under the jurisdiction
of the city, county, town and special industrial and mining areas as well as investment in personal housing and purchase of
productive fixed assets in rural areas.
Investment in Real Estate Development includes investment by real estate developers, commercial builders
and other units of real estate development of various statuses of registration in the construction of house buildings,
such as residential buildings, factory buildings, warehouses, restaurants, hotels, holiday resorts, office buildings, and
complementary service facilities and land development projects, such as roads, water supply, water drainage, power
supply, heating, telecommunications, land leveling and other projects of infrastructure. This indicator covers the activities
of non-real estate companies engaged in real estate development or management, but excludes simple land transactions.
Newly Increased Production Capacity (or Project Efficiency) refers to the increase of designed capacity or
project efficiency through investment in fixed assets, which is not only an indicator of the accomplishment in kind of
investment in fixed assets but also an important basis to check the economic result of investment on..
Floor Space of Residential Buildings refers to the floor space of the residential buildings among the total space
of buildings under construction or completed.
Floor Space under Construction refers to total floor space of all buildings under construction during the
reference period, including floor space of newly started buildings during the reference period, floor space of construction
extended from the previous period to the current period, and floor space of construction suspended during the previous
period but resumed in the current period. Floor space of construction completed in the current period and floor space of
construction started and then suspended in the current period are also included in floor space under construction.
Floor Space of Buildings Completed refers to total floor space of all buildings completed in the reference period,
which have come up to the designed standards with proper conditions of residence and use, and have been examined and
accepted (or met the standards for completion), and put into use.
Completion Rate of Floor Space of Buildings refers to the ratio of the floor space of buildings completed in a
certain period of time to the floor space of buildings under construction in the same period, which reflects the investment

222
result of the construction industry from the perspective of the speed of project construction.
Newly Increased Fixed Assets refer to the value of fixed assets which have been completed and transfered to
production units or users. It is a value indicator of the achievements of investment in fixed assets as well as an important
basis to evaluate the result of investment in fixed assets on.
Rate of Construction Projects Completed and Put into Use is the inverse indicator of construction period,
referring to the ratio of the number of construction projects completed and put into use in certain period of time to the
number of projects under construction in the same period. This reflects the investment efficiency from the perspective of
the speed of project construction.


225
9-1 房地产开发投资额(按投资去向分)
INVESTMENT IN REAL ESTATE DEVELOPMENT(GROUPED BY INVESTMENT
DESTINATION)单位:亿元 (100 million yuan)
年 份 Year
本年完成投资Investment Completed This Year
土地购置费Total Value ofLand Purchased
1993 102.77 19.691994 130.46 20.281995 103.04 3.901996 124.83 5.721997 136.65 13.521998 167.49 24.181999 215.25 32.882000 260.97 36.872001 315.64 70.992002 388.44 71.012003 412.66 75.822004 434.24 71.802005 423.69 64.052006 462.09 43.862007 461.04 62.222008 440.49 65.982009 437.46 45.252010 458.46 60.982011 514.74 89.012012 736.84 129.772013 876.90 98.882014 1 069.49 195.67 2015 1 331.03 316.762016 1 756.52 416.812017 2 135.86 723.33
9-1 房地产开发投资额(按用途分)
INVESTMENT IN REAL ESTATE DEVELOPMENT( GROUPED BY USE )
单位:亿元 (100 million yuan)
年 份 Year
本年完成投资 Investment Completed
This Year
住 宅 Residential Buildings
办公楼 Office
Buildings
商业用房 Houses for Business Use
其 他 Others
1993 102.77 66.80 11.30 14.39 10.281994 130.46 87.41 13.05 18.26 11.741995 103.04 62.85 16.49 14.43 9.271996 124.83 78.64 19.97 16.23 9.991997 136.65 85.50 18.18 14.78 18.191998 167.49 99.89 12.10 19.97 35.531999 215.25 141.31 13.57 17.95 42.422000 260.97 178.68 13.62 22.90 45.772001 315.64 209.71 9.32 28.21 68.402002 388.44 270.92 13.00 35.26 69.262003 412.66 250.19 15.05 47.29 100.132004 434.24 255.84 24.51 57.43 96.462005 423.69 265.54 28.04 53.07 77.042006 462.09 325.05 30.63 67.40 39.012007 461.04 331.76 30.08 53.48 45.722008 440.49 314.98 26.12 51.96 47.432009 437.46 289.78 35.34 53.22 59.122010 458.46 304.88 37.98 59.35 56.322011 514.74 353.21 36.78 64.61 60.142012 736.84 474.60 27.00 90.11 145.132013 876.90 583.29 64.63 90.22 138.762014 1 069.49 730.28 104.22 118.22 116.772015 1 331.03 897.13 158.84 142.72 132.342016 1 756.52 1 044.54 310.44 246.45 155.092017 2 135.86 1 014.05 535.82 340.06 245.92

226
9-2 房地产开发投资额(按构成分)
INVESTMENT IN REAL ESTATE DEVELOPMENT(GROUPED BY COMPOSITION)
单位:亿元 (100 million yuan)
年 份 Year
本年完成投资 Investment Completed
This Year
建筑安装工程 Constructional
Project
设备购置 Purchase of Equipment
其 他
Others
1993 102.77 93.06 4.77 4.941994 130.46 104.23 8.75 17.481995 103.04 79.32 6.75 16.971996 124.83 92.22 12.38 20.231997 136.65 98.41 6.36 31.891998 167.49 115.79 7.35 44.351999 215.25 150.26 10.47 54.532000 260.97 187.90 9.59 63.472001 315.64 217.69 6.39 91.562002 388.44 281.11 11.35 95.992003 412.66 298.08 12.63 101.952004 434.24 315.44 15.06 103.742005 423.69 314.11 11.40 98.172006 462.09 380.02 10.93 71.142007 461.04 356.66 6.61 97.772008 440.49 327.83 10.53 102.132009 437.46 352.79 8.87 75.802010 458.46 347.15 8.67 102.662011 514.74 358.98 10.08 145.682012 736.84 488.33 8.58 239.942013 876.90 684.81 10.39 181.702014 1 069.49 794.76 17.85 256.882015 1 331.03 892.03 26.75 412.252016 1 756.52 1 200.97 18.76 536.792017 2 135.86 1 193.23 32.54 910.09
9-2 房地产开发投资额(按区域分)
INVESTMENT IN REAL ESTATE DEVELOPMENT(GROUPED BY DISTRICT)
单位:亿元 (100 million yuan)
年 份 Year
本年完成投资
Investment Completed This Year
福田区Futian
罗湖区Luohu
盐田区Yantian
南山区Nanshan
大宝安区
OriginalBaoan
宝安区Baoan
龙华区Longhua
光明新区
Guangming
大龙岗区
OriginalLonggang
龙岗区Longgang
坪山区Pingshan
大鹏新区
Dapeng
深汕特别合作区
ShenshanSpecial Cooperation
Zone
1997 136.65 42.36 41.00 20.50 15.03 17.761998 167.49 50.25 48.57 1.67 31.82 16.75 18.421999 215.25 73.19 53.81 2.15 38.75 15.07 32.292000 260.97 83.51 65.24 5.22 49.58 26.10 31.322001 315.64 107.32 66.28 3.16 72.60 31.56 34.722002 388.44 116.53 69.80 7.77 89.34 54.38 46.612003 412.66 118.23 66.18 11.07 101.93 61.75 53.502004 434.24 115.68 67.90 16.59 96.45 79.57 58.052005 423.69 104.13 53.21 9.83 86.26 107.38 62.882006 462.09 89.84 50.83 13.21 93.59 126.52 88.102007 461.04 54.35 36.11 19.70 82.73 139.68 128.472008 440.49 41.93 32.71 30.04 101.47 130.51 103.832009 437.46 40.82 36.50 41.68 99.12 96.36 122.982010 458.46 48.13 38.32 32.67 72.51 126.41 140.422011 514.74 44.50 37.11 26.97 69.33 160.00 176.832012 736.84 85.22 45.05 34.54 82.26 233.88 125.99 91.36 16.53 255.90 215.28 25.95 14.672013 876.90 114.38 41.80 38.16 94.74 250.75 116.96 112.03 21.76 337.08 277.98 46.62 12.482014 1 069.49 126.60 40.00 37.30 149.22 360.22 169.66 161.21 29.35 356.16 296.32 45.39 14.44 2015 1 331.03 156.09 35.57 42.39 228.86 460.56 213.55 185.57 61.45 407.56 347.28 49.55 10.73 2016 1 756.52 180.57 92.91 41.67 350.35 618.32 292.54 248.25 77.53 472.70 374.18 84.51 14.02 2017 2 135.86 239.40 98.80 47.10 457.94 371.63 280.45 331.70 91.18 449.81 428.99 134.48 20.82 4.99
注:2007年以来,深圳陆续设立功能新区及新行政区,表中大宝安区数据2011年及以前为原宝安区数据,2012-2016年包含宝安区、龙华新区和光明新区,2017年 包含宝安区和光明新区。大龙岗区数据2011年及以前为原龙岗区数据,2012-2016年包含龙岗区、坪山新区和大鹏新区,2017年包含龙岗区和大鹏新区。Note:Since 2007, functional zones and new administrative districts have been established in Shenzhen.The data of Original Baoan were the data of Baoan in 2011 and before,included Baoan Longhua and Guangming in 2012-2016,included Baoan and Guangming in 2017.The data of Original Longgang were the data of Longgang in 2011 and before,1,included Longgang,Pingshan and Dapeng in 2012-2016,included Longgang and Dapeng in 2017.

227
9-3 房地产开发投资额(按注册登记类型分)
INVESTMENT IN REAL ESTATE DEVELOPMENT(GROUPED BY REGISTRATION)
单位:亿元 (100 million yuan)
年 份 Year
2009 2010 2011 2012 2013 2014 2015 2016 2017
合计 Total 437.46 458.46 514.74 736.84 887.71 1 069.49 1 331.03 1 756.52 2 135.86
1、内资企业 Domestic Investment Enterprises 316.06 331.23 418.35 599.72 739.96 892.77 1 096.32 1 494.14 1 852.08
国有企业 State-Owned 28.79 30.17 33.64 50.35 57.57 47.39 15.47 2.58 14.22
集体企业 Collective-Owned 1.70 1.78 0.77 0.00 3.11 6.66 1.66
股份合作企业 Shareholding 1.71 1.79 3.26 5.16 5.48 2.44 1.80 5.99
联营企业 Joint Owned 0.13 0.04
国有联营企业 State-Joint Owned 0.60 0.63
集体联营企业 Collective-Joint Owned
国有与集体联营企业 State Collective Joint Owned
其他联营企业 Other Joint Owned 0.01 0.01 0.04
有限责任公司 Limited-Liability Corporations 158.53 166.14 176.01 256.23 297.84 395.06 502.76 797.15 1 039.33
国有独资公司 Enterprises Solely Funded by the State 7.60 7.96 14.52 27.28 30.82 49.60
其他有限责任公司 Others 150.93 158.15 241.71 475.48 766.32 989.73
股份有限公司 Shareholding 46.85 49.10 45.80 66.67 54.35 66.74 87.65 61.17 53.09
私营企业 Private 73.10 76.61 149.58 218.97 314.90 374.44 456.59 625.43 740.82
其他内资 Others 0.98 1.03 9.16 2.31 6.71 0.04 32.05 1.82 2.96
2、港、澳、台商投资企业Enterprises with Funds from Hong Kong,Macao and Taiwan
96.52 101.15 88.45 101.12 121.72 136.76 197.34 234.82 245.39
3、外商投资企业 Foreign Funded 24.88 26.07 7.94 36.00 26.03 39.96 37.38 27.56 38.38
9-4 房地产开发投资资金来源及构成
TOTAL CAPITAL SOURCE AND COMPOSITION OF REAL ESTATE DEVELOPMENT
单位:亿元 (100 million yuan)
年 份 Year
本年资金来源小计 Sud-total Capital
Source of this Year国内贷款
Domestic Loans
利用外资 Foreign
Capital Utilized
自筹资金 Self-raising
Capital
其他资金 Other Capital
1994 189.90 40.01 63.56 86.331995 147.83 31.43 28.14 49.41 38.851996 149.10 29.46 28.30 45.49 45.851997 168.11 30.91 20.14 61.20 55.861998 223.04 55.03 9.31 80.32 78.381999 252.88 59.59 4.64 83.31 105.342000 333.36 89.06 6.68 96.11 141.522001 391.47 102.64 8.93 131.38 148.522002 516.40 127.01 9.24 138.96 241.192003 644.70 166.37 8.02 179.19 291.122004 663.35 149.33 7.04 197.98 309.002005 694.01 159.87 2.38 216.49 315.272006 837.85 229.39 8.94 174.78 424.742007 847.90 169.83 11.78 241.42 424.872008 396.35 124.78 0.45 97.90 173.222009 881.76 258.83 1.39 171.95 449.592010 773.08 199.88 10.33 203.97 358.902011 818.81 199.85 2.06 294.03 322.872012 1 190.97 302.88 0.00 473.24 414.842013 1 686.91 441.09 0.12 456.97 788.732014 1 631.90 538.02 20.46 545.65 527.772015 2 938.53 730.79 3.21 783.13 1 421.412016 3 400.48 812.56 1 081.80 1 506.11 2017 3 233.05 1 196.93 7.91 792.43 1 235.77

228
9-5 商品房施工面积(按用途分)
TOTAL FLOOR SPACE UNDER CONSTRUCTION OF COMMODITY HOUSING
(GROUPED BY USE)单位:万平方米 (10 000 sq.m)
年 份 Year
施工面积Floor Space
Under Construction住 宅
Residential Buiding办公楼
Office Building
商业用房 Houses For Business Use
其 他
Others
1991 467.82 279.00 47.72 73.62 67.48
1992 950.06 601.10 101.91 139.21 107.84
1993 1 396.44 909.51 152.43 199.92 134.58
1994 1 298.82 868.86 132.75 176.36 120.85
1995 1 371.06 844.20 214.51 187.71 124.64
1996 1 495.27 940.61 238.93 193.68 122.05
1997 1 454.17 966.18 181.76 185.17 121.06
1998 1 656.65 1 146.97 175.09 208.97 125.62
1999 1 834.13 1 355.62 137.58 201.34 139.59
2000 2 134.95 1 576.89 146.62 225.46 185.98
2001 2 392.77 1 790.49 115.10 255.38 231.80
2002 2 776.29 2 124.86 120.83 279.14 251.46
2003 2 838.22 2 072.89 134.29 317.74 313.30
2004 3 120.25 2 257.68 147.78 379.15 335.64
2005 3 058.90 2 152.58 155.67 370.34 380.31
2006 3 122.10 2 157.39 171.88 385.71 407.12
2007 3 149.56 2 177.78 189.65 335.98 446.15
2008 3 276.30 2 210.36 201.55 346.45 517.94
2009 3 112.36 2 087.47 189.09 328.27 507.53
2010 2 939.94 2 025.13 182.36 298.62 433.83
2011 2 875.98 1 965.63 171.46 298.47 440.42
2012 3 216.69 2 107.59 156.93 339.25 612.92
2013 4 003.49 2 608.29 261.51 383.62 750.06
2014 4 492.18 2 870.00 337.32 481.78 803.09
2015 4 978.41 3 156.99 467.48 614.59 739.35
2016 5 173.99 3 079.28 562.84 705.77 826.09
2017 5 709.34 2 989.42 911.54 821.27 987.11

229
9-5 商品房施工面积(按区域分)
TOTAL FLOOR SPACE UNDER CONSTRUCTION OF COMMODITY HOUSING
(GROUPED BY DISTRICT)单位:万平方米 (10 000 sq.m)
年 份 Year
施工面积Floor Space
Under Construction
福田区Futian
罗湖区Luohu
盐田区Yantian
南山区Nanshan
大宝安区
OriginalBaoan
宝安区Baoan
龙华区Longhua
光明新区
Guangming
大龙岗区
OriginalLonggang
龙岗区Longgang
坪山区Pingshan
大鹏新区
Dapeng
深汕特别合作区
ShenshanSpecial Cooperation
Zone
1996 1 495.27 403.72 613.06 254.20 119.62 104.67
1997 1 454.17 445.27 435.48 214.29 163.51 195.62
1998 1 656.65 493.49 483.06 10.29 321.63 171.62 176.56
1999 1 834.13 622.47 459.35 16.77 334.98 125.71 274.85
2000 2 134.95 691.02 523.64 41.69 415.09 212.04 251.47
2001 2 392.77 807.12 510.52 29.91 554.37 228.69 262.16
2002 2 776.29 830.24 511.82 57.08 631.89 397.97 347.29
2003 2 838.22 812.15 472.85 56.07 717.41 436.46 343.28
2004 3 120.25 789.79 437.61 76.11 743.36 639.07 434.31
2005 3 058.90 667.26 333.72 76.90 513.84 865.27 601.91
2006 3 122.10 517.48 329.37 94.44 586.94 859.65 734.22
2007 3 149.56 397.80 192.14 97.66 603.23 891.86 966.87
2008 3 276.30 314.50 251.52 125.13 689.71 880.39 1 015.05
2009 3 112.36 315.12 236.45 138.35 547.83 823.30 1 051.31
2010 2 939.94 252.00 208.68 147.83 503.31 777.89 1 050.23
2011 2 875.98 257.07 227.71 136.45 377.74 871.40 1 005.61
2012 3 216.69 261.24 199.69 151.13 369.77 948.14 459.12 440.63 48.39 1 286.72 1 170.81 81.51 34.41
2013 4 003.49 404.18 311.03 145.12 341.04 1 136.80 521.22 552.22 53.36 1 665.32 1 438.74 186.86 39.71
2014 4 492.18 522.37 247.94 168.10 558.18 1 307.34 578.95 618.05 110.34 1 688.26 1 457.18 169.95 61.13
2015 4 978.41 574.92 227.63 136.88 688.22 1 617.08 666.82 691.75 258.50 1 733.69 1 483.34 173.94 76.40
2016 5 173.99 568.95 217.03 140.27 804.18 1 771.70 851.98 683.63 236.09 1 671.85 1 419.71 197.00 55.14
2017 5 709.34 575.56 235.56 145.95 1 225.74 1 110.92 951.18 695.97 159.74 1 538.46 1 462.54 147.91 75.92 33.26

230
9-6 商品房新开工面积(按用途分)
FLOOR SPACE OF NEWLY STARTED OF COMMODITY HOUSING
(GROUPED BY USE)单位:万平方米 (10 000 sq.m)
年 份 Year
新开工面积 Floor Space of Newly
Started Buildings
住 宅 Residential Buildings
办公楼 Office Buildings
商业用房 Houses For Business Use
其 他 Others
1998 414.14 333.27 25.62 33.19 22.061999 580.56 492.81 6.98 31.94 48.832000 646.41 487.48 26.10 64.72 68.122001 999.71 792.24 26.96 83.74 96.772002 959.32 747.50 41.71 101.12 68.992003 932.86 645.18 35.89 119.88 131.912004 1 025.55 766.91 25.32 123.24 110.082005 1 054.19 753.90 39.89 127.15 133.252006 798.12 609.46 19.91 69.98 98.772007 876.40 621.91 40.06 72.94 141.492008 752.60 471.80 46.61 84.91 149.282009 489.18 328.04 29.82 60.70 70.622010 470.96 355.17 15.25 38.69 61.842011 537.99 367.32 18.54 54.76 97.372012 905.24 561.89 50.69 103.47 189.182013 1 366.40 910.13 114.88 120.68 220.702014 932.68 549.50 91.30 118.00 173.882015 1 208.27 777.32 126.79 153.91 150.242016 975.33 472.09 165.80 154.75 182.692017 1 001.53 446.31 261.28 138.09 155.86
9-6 商品房新开工面积(按区域分)
FLOOR SPACE OF NEWLY STARTED OF COMMODITY HOUSING
(GROUPED BY DISTRICT)单位:万平方米 (10 000 sq.m)
新开工面积
Floor Spaceof NewlyStarted
Buildings
福田区Futian
罗湖区Luohu
盐田区Yantian
南山区Nanshan
大宝安区
OriginalBaoan
宝安区Baoan
龙华区Longhua
光明新区
Guangming
大龙岗区
OriginalLonggang
龙岗区Longgang
坪山区Pingshan
大鹏新区
Dapeng
深汕特别合作区
ShenshanSpecial Cooperation
Zone
1998 414.14 114.77 101.25 0.56 82.98 47.37 67.211999 580.56 201.65 119.44 2.84 114.81 47.33 94.492000 646.41 169.62 103.02 26.03 168.21 96.96 82.572001 999.71 299.01 132.88 6.74 305.10 140.30 115.682002 959.32 238.00 136.41 25.56 242.46 175.92 140.972003 932.86 220.77 158.89 24.30 210.84 199.54 118.522004 1 025.55 152.62 112.05 34.14 201.34 307.07 218.332005 1 054.19 208.29 24.81 37.99 205.98 319.96 257.162006 798.12 69.00 15.49 42.61 123.74 271.85 275.432007 876.40 38.69 36.93 25.03 211.70 203.18 360.872008 752.60 52.23 87.76 57.60 153.94 195.60 205.472009 489.18 24.29 44.61 34.27 144.97 126.67 114.362010 470.96 25.97 4.10 10.04 70.63 225.06 135.162011 537.99 33.69 13.98 35.46 42.06 230.90 181.902012 905.24 93.28 58.61 61.27 88.03 195.98 103.76 69.48 22.74 408.07 379.06 12.23 16.792013 1 366.40 187.83 103.63 16.11 83.63 312.42 120.91 168.74 22.77 662.77 559.84 97.35 5.572014 932.68 91.01 28.91 24.91 227.56 364.18 145.68 161.34 57.16 196.11 178.28 9.64 8.182015 1 208.27 159.92 14.33 11.25 176.85 468.83 221.40 163.39 84.04 377.10 343.42 25.48 8.20 2016 975.33 32.51 61.48 39.07 179.27 383.80 236.73 139.81 7.26 279.20 214.70 56.33 8.16 2017 1 001.53 135.77 23.60 19.76 214.32 210.53 206.34 64.36 4.19 226.51 205.73 75.97 20.78 30.70

231
9-7 商品房竣工面积(按用途分)
TOTAL FLOOR SPACE OF COMMERCIAL HOUSES COMPLETED
(GROUPED BY USE)单位:万平方米 (10 000 sq.m)
年 份 Year
竣工面积 Floor Space Completed 住 宅
Residential Buildings办公楼
Office Buildings
商业用房 Houses For Business Use
其 他 Others
1991 150.44 91.22 7.93 11.21 40.081992 198.40 130.90 9.20 14.70 43.601993 281.46 196.75 11.51 21.32 51.881994 311.10 206.50 10.01 39.90 54.691995 311.55 216.38 34.24 36.98 23.951996 394.32 250.51 42.50 48.58 52.731997 327.04 243.19 34.22 29.57 20.061998 463.31 356.30 42.26 41.05 23.701999 502.15 412.46 16.89 37.05 35.752000 632.05 524.55 12.94 53.92 40.642001 727.97 573.21 27.74 53.84 73.182002 892.24 698.32 25.07 79.15 89.702003 1 020.31 816.62 24.43 95.63 83.632004 1 012.39 772.20 35.66 105.54 98.992005 945.78 704.44 18.70 96.67 125.972006 848.89 581.87 36.83 126.63 103.562007 636.02 437.14 32.38 73.99 92.512008 629.73 443.77 27.55 59.79 98.622009 402.01 269.54 25.05 32.20 75.222010 344.43 251.10 32.05 25.26 36.022011 325.00 232.66 20.97 35.89 35.482012 425.75 289.40 12.30 39.75 84.312013 353.55 196.33 30.84 53.35 73.032014 425.31 269.26 10.97 39.22 105.86 2015 360.21 202.37 47.48 31.69 78.67 2016 490.03 280.64 51.33 39.09 118.97 2017 285.06 183.79 34.41 31.96 34.90
9-7 商品房竣工面积(按区域分)
TOTAL FLOOR SPACE OF COMMERCIAL HOUSES COMPLETED(GROUPED BY
DISTRICT)单位:万平方米 (10 000 sq.m)
年 份 Year
竣工面积Floor SpaceCompleted
福田区Futian
罗湖区Luohu
盐田区Yantian
南山区Nanshan
大宝安区
OriginalBaoan
宝安区Baoan
龙华区Longhua
光明新区
Guangming
大龙岗区
OriginalLonggang
龙岗区Longgang
坪山区Pingshan
大鹏新区
Dapeng
深汕特别合作区
ShenshanSpecial Cooperation
Zone
1997 327.04 109.89 81.31 68.72 30.75 36.371998 463.31 137.29 105.53 2.67 103.33 58.96 55.531999 502.15 159.44 100.38 5.09 75.99 46.81 114.442000 632.05 161.53 142.36 13.09 113.69 96.68 104.702001 727.97 225.65 215.53 2.61 152.54 42.44 89.202002 892.24 208.95 186.66 21.10 234.61 117.81 123.112003 1 020.31 275.96 155.56 17.25 278.90 155.27 137.372004 1 012.39 258.59 106.41 21.20 343.98 173.98 108.232005 945.78 203.91 149.96 37.16 157.39 213.12 184.242006 848.89 176.37 91.89 27.36 159.17 228.39 165.712007 636.02 110.74 15.15 26.01 126.68 245.68 111.762008 629.73 32.97 59.61 8.51 214.86 179.03 134.752009 402.01 58.69 0.57 26.98 93.58 100.63 121.562010 344.43 20.12 0.24 9.87 70.60 120.97 122.632011 325.00 24.12 65.63 16.00 21.76 57.36 140.132012 425.75 50.32 8.28 6.41 73.97 151.25 72.29 78.97 135.52 121.16 14.362013 353.55 53.21 68.79 35.39 98.08 67.56 30.52 98.08 66.98 27.90 3.202014 425.31 14.47 24.65 35.91 73.03 161.65 25.03 109.16 27.46 115.60 110.29 5.312015 360.21 80.07 24.73 19.02 47.81 120.36 14.36 106.00 68.22 52.60 1.00 14.622016 490.03 141.19 3.03 11.41 113.32 151.61 89.15 38.17 24.29 69.48 69.482017 285.06 44.29 19.48 55.43 114.15 114.15 0.18 51.52 51.52

232
9-8 商品房销售面积(按用途分)
TOTAL FLOOR SPACE OF BUILDINGS SOLD(GROUPED BY USE)
单位:万平方米 (10 000 sq.m)
年 份 Year
销售面积 Floor Space of Buildings Sold
住 宅 Residential Buildings
办公楼 Office Buildings
商业用房 Houses For Business Use
其 他 Others
1991 112.54 97.13 2.10 0.63 12.681992 151.46 96.00 9.00 10.00 36.461993 180.17 140.89 5.85 9.58 23.851994 246.93 183.28 13.29 17.14 33.221995 274.59 209.07 17.37 16.89 31.261996 324.92 261.13 32.33 21.23 10.231997 405.44 336.70 28.88 27.40 12.461998 432.22 372.38 22.06 19.85 17.931999 541.84 492.51 15.02 26.20 8.112000 611.37 556.82 12.19 26.32 16.042001 643.47 593.72 11.01 27.40 11.342002 791.70 724.41 17.94 46.36 2.992003 877.85 811.90 19.54 39.37 7.042004 908.62 802.58 26.90 58.09 21.052005 993.20 901.13 28.49 53.48 10.102006 797.66 704.89 37.64 46.89 8.242007 555.11 500.35 20.87 30.64 3.252008 466.71 413.65 5.59 33.58 13.892009 762.16 717.40 19.63 18.07 7.072010 465.59 413.80 15.00 21.88 14.912011 496.89 469.43 9.90 16.96 0.602012 525.83 488.44 5.98 21.00 10.412013 588.58 527.16 21.31 19.05 21.062014 532.57 474.81 23.17 23.59 11.002015 831.46 747.83 56.54 19.84 7.252016 736.19 660.08 50.57 23.49 2.052017 671.03 520.97 98.56 27.22 24.29
9-8 商品房销售面积(按区域分)
TOTAL FLOOR SPACE OF BUILDINGS SOLD(GROUPED BY DISTRICT)
单位:万平方米 (10 000 sq.m)
年 份 Year
销售面积Floor
Space ofBuildings
Sold
福田区Futian
罗湖区Luohu
盐田区Yantian
南山区Nanshan
大宝安区
OriginalBaoan
宝安区Baoan
龙华区Longhua
光明新区
Guangming
大龙岗区
OriginalLonggang
龙岗区Longgang
坪山区Pingshan
大鹏新区
Dapeng
深汕特别合作区
ShenshanSpecial Cooperation
Zone
1997 405.44 126.57 95.18 70.27 54.48 58.941998 432.22 135.99 90.89 7.69 75.68 54.63 67.341999 541.84 162.69 118.53 12.10 94.89 71.62 82.012000 611.37 200.59 86.13 7.57 125.39 78.65 113.042001 643.47 165.28 110.75 9.01 140.62 95.21 122.602002 791.70 206.81 129.45 9.67 182.60 127.22 135.952003 877.85 206.30 120.49 25.45 236.85 149.76 139.022004 908.62 164.74 83.90 17.32 285.04 186.40 171.222005 993.20 210.36 103.11 22.85 171.05 283.84 201.992006 797.66 122.22 53.56 18.63 130.60 260.36 212.292007 555.11 69.29 35.26 17.92 72.60 189.08 170.972008 466.71 35.47 37.27 15.55 71.11 161.66 145.652009 762.16 52.49 34.86 30.95 171.33 217.20 255.332010 465.59 18.74 17.10 14.37 81.76 122.11 211.512011 496.89 153.60 7.07 10.38 53.35 106.07 166.422012 525.83 22.53 9.36 7.47 61.84 214.73 104.16 102.56 8.01 209.90 184.54 25.01 0.362013 588.58 61.27 11.18 14.31 53.94 218.56 98.38 106.60 13.58 229.32 197.57 30.59 1.152014 532.57 39.06 8.42 22.06 58.42 204.45 107.52 89.4 7.53 200.16 163.32 35.01 1.842015 831.46 73.72 17.75 27.94 101.72 296.37 120.86 117.61 57.90 313.96 240.47 54.97 18.51 2016 736.19 46.75 42.17 21.92 129.04 245.83 78.64 120.29 46.89 250.49 222.63 18.38 9.48 2017 671.03 25.71 36.75 5.15 127.06 125.35 86.02 87.44 39.34 237.98 231.89 25.59 6.09

233
9-9 商品住宅销售面积(按区域分)
TOTAL FLOOR SPACE OF RESIDENTIAL BUILDINGS SOLD
(GROUPED BY DISTRICT)单位:万平方米 (10 000 sq.m)
年 份 Year
销售面积Floor
Space ofBuildings
Sold
福田区Futian
罗湖区Luohu
盐田区Yantian
南山区Nanshan
大宝安区
OriginalBaoan
宝安区Baoan
龙华区Longhua
光明新区
Guangming
大龙岗区
OriginalLonggang
龙岗区Longgang
坪山区Pingshan
大鹏新区
Dapeng
深汕特别合作区
ShenshanSpecial Cooperation
Zone
1996 261.13 82.35 71.87 43.19 21.26 42.461997 336.70 106.75 71.23 61.63 43.31 53.781998 372.38 111.06 75.29 3.80 70.61 50.07 61.551999 492.51 147.54 109.57 6.36 88.59 64.24 76.212000 556.82 181.94 77.17 6.80 114.95 69.70 106.262001 593.72 155.44 97.85 7.97 135.20 86.75 110.512002 724.41 186.29 119.80 9.38 173.18 111.31 124.452003 811.90 186.59 111.08 24.29 222.60 142.53 124.822004 802.58 125.29 83.78 17.26 270.81 167.84 137.602005 901.13 172.73 100.15 21.77 157.76 266.25 182.492006 704.89 77.58 52.72 17.28 119.41 244.08 193.822007 500.35 49.22 31.36 17.50 63.95 176.32 162.002008 413.65 31.77 21.36 15.04 64.33 146.68 134.472009 717.40 37.11 34.46 30.27 167.42 205.59 242.552010 413.80 7.2 10.21 18.36 69.30 114.91 193.822011 469.43 148.36 5.25 10.03 46.44 101.80 157.552012 488.43 11.39 7.74 7.16 54.22 207.17 98.03 101.13 8.01 200.75 176.46 23.96 0.332013 527.16 36.20 10.54 9.46 49.61 213.02 93.83 105.61 13.58 208.32 178.51 29.11 0.702014 474.81 19.52 7.97 17.11 56.22 190.19 99.10 83.60 7.49 183.80 149.36 33.71 0.732015 747.83 44.43 17.61 24.49 94.53 281.34 109.50 114.71 57.12 285.43 214.14 52.78 18.512016 660.08 15.32 42.05 17.33 125.18 232.07 73.55 115.34 43.18 228.14 203.51 15.45 9.172017 520.97 17.93 21.77 4.11 97.34 94.00 71.11 52.09 22.89 219.50 213.54 14.24 5.96
9-10 办公楼销售面积(按区域分)
TOTAL FLOOR SPACE OF OFFICE BUILDINGS SOLD(GROUPED BY DISTRICT)
单位:万平方米 (10 000 sq.m)
年 份 Year
销售面积Floor
Space ofBuildings
Sold
福田区Futian
罗湖区Luohu
盐田区Yantian
南山区Nanshan
大宝安区
OriginalBaoan
宝安区Baoan
龙华区Longhua
光明新区
Guangming
大龙岗区
OriginalLonggang
龙岗区Longgang
坪山区Pingshan
大鹏新区
Dapeng
深汕特别合作区
ShenshanSpecial Cooperation
Zone
1996 32.33 8.80 14.35 9.181997 28.88 9.34 13.06 3.59 1.39 1.501998 22.06 12.11 7.60 0.31 0.94 1.101999 15.02 9.30 3.70 1.33 0.63 0.062000 12.19 6.15 3.95 0.05 1.50 0.13 0.412001 11.01 2.91 5.77 0.14 0.66 0.01 1.522002 17.94 12.63 3.39 0.29 1.37 0.02 0.242003 19.54 13.72 2.16 1.68 1.45 0.532004 26.90 23.11 26.90 3.66 0.01 0.122005 28.49 22.19 5.04 0.54 0.722006 37.64 31.85 0.06 5.22 0.512007 20.87 15.51 0.61 3.80 0.87 0.082008 5.59 2.27 1.65 1.672009 19.63 12.65 2.24 4.46 0.282010 15.00 5.80 4.19 0.27 3.21 1.532011 9.90 4.68 0.37 4.51 0.342012 5.98 1.68 3.60 0.51 0.51 0.19 0.192013 21.31 13.70 0.64 1.39 3.63 0.36 0.36 1.59 1.59
2014 23.17 9.69 0.46 2.10 2.06 6.03 2.53 3.50 2.84 2.84
2015 56.54 23.19 0.14 3.21 5.92 7.39 7.02 0.37 16.69 16.69
2016 50.57 30.30 2.37 2.52 5.69 4.16 1.53 9.68 8.95 0.732017 98.56 7.50 12.20 1.03 16.48 16.52 10.12 27.56 6.40 5.96 5.96 11.30

234
9-12 商品房屋待售面积(按用途分)
TOTAL FLOOR SPACE OF COMMERCIALIZED BUILDINGS FOR SALE
(GROUPED BY USE)单位:万平方米 (10 000 sq.m)
年 份 Year
待售面积 Floor space of
Commercialized Buildings
住 宅 Residential Buildings
办公楼 Office Buildings
商业用房 Houses For Business Use
其 他 Others
1996 328.68 191.94 40.31 55.20 41.231997 258.69 137.34 48.69 48.66 24.001998 296.94 158.88 55.96 56.73 25.371999 249.60 139.67 42.49 52.90 14.542000 272.62 170.92 47.17 48.49 6.042001 241.35 142.72 29.53 51.69 17.412002 311.03 206.50 23.03 59.99 21.512003 319.94 190.88 26.23 81.12 21.712004 251.53 138.15 21.62 68.45 23.312005 191.51 90.24 14.38 63.44 23.452006 185.41 69.63 23.98 66.41 25.392007 152.36 58.92 15.81 55.30 22.332008 231.58 121.17 15.02 69.22 26.172009 141.64 63.60 15.41 49.56 13.072010 134.36 53.15 9.00 51.82 20.392011 257.69 148.13 5.15 84.49 19.922012 310.05 188.94 16.89 80.14 24.092013 351.66 203.06 14.08 103.06 31.472014 319.85 191.95 16.09 96.27 15.542015 336.51 231.66 14.72 65.56 24.572016 272.98 140.17 29.86 77.44 25.522017 261.30 147.20 28.83 72.74 12.53
9-11 商业用房销售面积(按区域分)
TOTAL FLOOR SPACE OF COMMERCIAL BUILDINGS SOLD
(GROUPED BY DISTRICT)单位:万平方米 (10 000 sq.m)
年 份 Year
销售面积Floor
Space ofBuildings
Sold
福田区Futian
罗湖区Luohu
盐田区Yantian
南山区Nanshan
大宝安区
OriginalBaoan
宝安区Baoan
龙华区Longhua
光明新区
Guangming
大龙岗区
OriginalLonggang
龙岗区Longgang
坪山区Pingshan
大鹏新区
Dapeng
深汕特别合作区
ShenshanSpecial Cooperation
Zone
1996 21.23 2.66 11.49 1.32 4.38 1.381997 27.40 4.48 8.75 2.48 9.54 2.151998 19.85 3.70 5.34 0.08 2.00 4.04 4.691999 26.20 2.15 5.26 4.43 2.91 5.85 5.602000 26.32 3.88 3.21 0.72 4.64 7.57 6.302001 27.40 3.42 4.92 0.28 2.59 8.23 7.962002 46.36 6.52 6.15 6.53 15.89 11.272003 39.37 4.81 6.61 1.16 7.62 5.51 13.662004 58.09 8.16 0.94 0.15 9.66 17.79 21.392005 53.48 9.20 2.93 1.17 8.55 16.77 14.862006 46.89 7.72 0.69 1.36 5.96 16.25 14.912007 30.64 1.64 3.28 0.41 4.85 11.89 8.572008 33.58 1.43 15.91 0.51 2.20 4.85 8.682009 18.07 0.40 0.22 0.67 1.67 7.15 7.962010 21.88 0.35 1.79 0.07 1.79 4.70 13.182011 16.95 0.70 1.36 0.34 2.22 3.78 8.552012 21.00 0.68 1.62 0.30 4.01 7.06 5.62 1.43 7.33 6.25 1.05 0.022013 19.05 2.67 3.46 0.70 5.17 4.55 0.63 7.04 5.11 1.48 0.452014 23.59 3.70 2.85 0.14 4.02 2.94 1.04 0.04 12.88 10.49 1.29 1.102015 19.84 3.89 0.24 1.26 4.77 2.28 1.70 0.78 9.67 7.48 2.19 2016 23.49 0.92 0.12 2.21 0.57 7.83 0.92 3.27 3.64 11.84 9.77 2.04 0.03 2017 27.22 0.06 2.25 0.01 1.22 5.63 1.90 7.76 3.74 10.29 10.16 0.13

235
9-13 商品房屋待售面积(按区域分)
TOTAL FLOOR SPACE OF VACANT BUILDINGS(GROUPED BY DISTRICT)
单位:万平方米 (10 000 sq.m)
年 份 Year
待售面积Floor spaceof Comm-ercializedBuildings
福田区Futian
罗湖区Luohu
盐田区Yantian
南山区Nanshan
大宝安区
OriginalBaoan
宝安区Baoan
龙华区Longhua
光明新区
Guangming
大龙岗区
OriginalLonggang
龙岗区Longgang
坪山区Pingshan
大鹏新区
Dapeng
深汕特别合作区
ShenshanSpecial Cooperation
Zone
1996 328.68 92.03 105.18 55.88 49.30 26.291997 258.69 55.41 78.56 59.13 37.47 28.121998 296.94 74.08 82.92 2.59 76.22 39.61 21.521999 249.60 60.46 82.32 4.03 45.21 25.51 32.072000 272.62 61.38 98.36 2.82 50.22 29.99 29.852001 241.35 72.12 81.50 1.81 34.59 24.00 27.332002 311.03 89.77 75.29 9.04 69.26 30.38 37.292003 319.94 103.76 74.54 8.20 67.50 34.87 31.072004 251.53 81.49 61.37 12.38 38.04 22.46 35.792005 191.51 56.42 46.46 11.26 21.81 30.27 25.292006 185.41 57.02 48.47 7.40 26.31 12.79 33.422007 152.36 42.48 32.39 3.50 21.38 16.29 36.322008 231.58 36.14 33.45 6.88 43.75 46.79 64.572009 141.64 34.65 28.45 3.57 29.30 19.38 26.292010 134.36 31.51 23.00 8.75 16.51 33.34 21.252011 257.69 37.28 22.64 13.67 10.72 106.12 67.262012 310.05 45.64 20.36 16.51 18.02 93.40 56.75 36.33 0.33 116.12 114.21 0.63 1.282013 351.66 34.72 37.87 18.44 40.92 104.67 50.04 54.31 0.33 115.05 100.16 6.16 8.73 2014 319.85 18.49 27.68 25.48 45.92 98.76 49.01 42.87 6.87 103.52 84.76 10.63 8.12 2015 336.51 22.26 31.32 15.26 33.23 138.06 57.42 69.32 11.32 96.38 69.93 8.14 18.31 2016 272.98 12.87 14.78 15.90 65.51 96.29 49.95 35.29 11.06 67.63 52.25 15.38 2017 261.30 15.22 16.13 11.59 56.50 68.58 66.49 30.56 2.09 55.61 46.31 7.11 9.30
9-14 商品房二级市场平均交易价格(按用途分)
AVERAGE SELLING PRICE OF COMMERCIAL HOUSES IN SECONDARY MARKET
(GROUPED BY USE)单位:元/平方米 (yuan/ sq.m)
年 份 Year
商品房二级市场 平均交易价格
Average Selling Price of Commercial Houses in Secondary Market
住 宅 Residential Buildings
办公楼 Office Buildings
商业用房 Houses For Business Use
其 他 Others
1998 5 927 5 191 11 995 10 241 3 4681999 5 503 5 004 10 504 11 195 3 7432000 5 718 5 275 10 954 10 306 3 1862001 5 779 5 517 13 717 11 916 4 1262002 6 074 5 641 8 145 12 175 5 0002003 6 215 5 879 8 678 11 624 2 8042004 6 771 6 419 9 670 12 764 5 6722005 7 582 6 996 12 374 15 083 6 8692006 10 039 9 190 15 762 18 257 9 7142007 14 050 13 370 23 535 19 103 10 2032008 12 665 12 823 19 071 11 469 8 2862009 15 214 14 858 23 919 20 826 12 7682010 20 850 20 297 24 797 23 346 24 7872011 20 674 19 038 39 481 31 654 28 6032012 20 035 18 848 37 814 29 859 27 4722013 23 776 21 808 36 402 18 059 28 337 2014 25 700 23 955 32 926 34 911 30 1652015 35 071 33 406 46 327 42 552 26 273 2016 52 777 53 455 52 529 53 090 43 2102017 54 430 54 455 49 977 60 365 35 514
注: 本表数据取自深圳市规划和国土资源委员会。Note: The data of this table adopts from the records of Shenzhen Municipal Bureau of Planning and Land Resources.
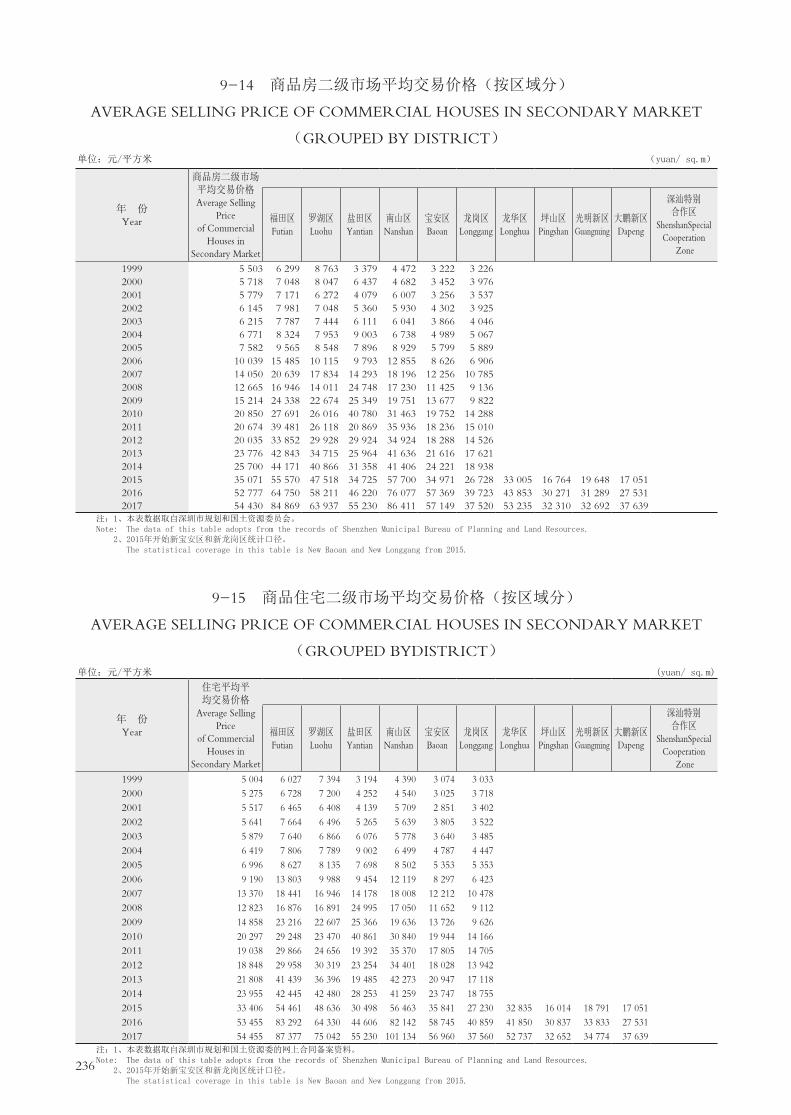
236
9-14 商品房二级市场平均交易价格(按区域分)
AVERAGE SELLING PRICE OF COMMERCIAL HOUSES IN SECONDARY MARKET
(GROUPED BY DISTRICT)单位:元/平方米 (yuan/ sq.m)
年 份 Year
商品房二级市场 平均交易价格 Average Selling
Price of Commercial
Houses in Secondary Market
福田区Futian
罗湖区Luohu
盐田区Yantian
南山区Nanshan
宝安区Baoan
龙岗区Longgang
龙华区Longhua
坪山区Pingshan
光明新区Guangming
大鹏新区Dapeng
深汕特别合作区
ShenshanSpecial Cooperation
Zone
1999 5 503 6 299 8 763 3 379 4 472 3 222 3 2262000 5 718 7 048 8 047 6 437 4 682 3 452 3 9762001 5 779 7 171 6 272 4 079 6 007 3 256 3 5372002 6 145 7 981 7 048 5 360 5 930 4 302 3 9252003 6 215 7 787 7 444 6 111 6 041 3 866 4 0462004 6 771 8 324 7 953 9 003 6 738 4 989 5 0672005 7 582 9 565 8 548 7 896 8 929 5 799 5 8892006 10 039 15 485 10 115 9 793 12 855 8 626 6 9062007 14 050 20 639 17 834 14 293 18 196 12 256 10 7852008 12 665 16 946 14 011 24 748 17 230 11 425 9 1362009 15 214 24 338 22 674 25 349 19 751 13 677 9 8222010 20 850 27 691 26 016 40 780 31 463 19 752 14 2882011 20 674 39 481 26 118 20 869 35 936 18 236 15 0102012 20 035 33 852 29 928 29 924 34 924 18 288 14 5262013 23 776 42 843 34 715 25 964 41 636 21 616 17 6212014 25 700 44 171 40 866 31 358 41 406 24 221 18 9382015 35 071 55 570 47 518 34 725 57 700 34 971 26 728 33 005 16 764 19 648 17 0512016 52 777 64 750 58 211 46 220 76 077 57 369 39 723 43 853 30 271 31 289 27 5312017 54 430 84 869 63 937 55 230 86 411 57 149 37 520 53 235 32 310 32 692 37 639
注:1、本表数据取自深圳市规划和国土资源委员会。Note: The data of this table adopts from the records of Shenzhen Municipal Bureau of Planning and Land Resources. 2、2015年开始新宝安区和新龙岗区统计口径。 The statistical coverage in this table is New Baoan and New Longgang from 2015.
9-15 商品住宅二级市场平均交易价格(按区域分)
AVERAGE SELLING PRICE OF COMMERCIAL HOUSES IN SECONDARY MARKET
(GROUPED BYDISTRICT)单位:元/平方米 (yuan/ sq.m)
年 份 Year
住宅平均平 均交易价格
Average Selling Price
of Commercial Houses in
Secondary Market
福田区Futian
罗湖区Luohu
盐田区Yantian
南山区Nanshan
宝安区Baoan
龙岗区Longgang
龙华区Longhua
坪山区Pingshan
光明新区Guangming
大鹏新区Dapeng
深汕特别合作区
ShenshanSpecial Cooperation
Zone
1999 5 004 6 027 7 394 3 194 4 390 3 074 3 0332000 5 275 6 728 7 200 4 252 4 540 3 025 3 7182001 5 517 6 465 6 408 4 139 5 709 2 851 3 4022002 5 641 7 664 6 496 5 265 5 639 3 805 3 5222003 5 879 7 640 6 866 6 076 5 778 3 640 3 4852004 6 419 7 806 7 789 9 002 6 499 4 787 4 4472005 6 996 8 627 8 135 7 698 8 502 5 353 5 3532006 9 190 13 803 9 988 9 454 12 119 8 297 6 4232007 13 370 18 441 16 946 14 178 18 008 12 212 10 4782008 12 823 16 876 16 891 24 995 17 050 11 652 9 1122009 14 858 23 216 22 607 25 366 19 636 13 726 9 6262010 20 297 29 248 23 470 40 861 30 840 19 944 14 1662011 19 038 29 866 24 656 19 392 35 370 17 805 14 7052012 18 848 29 958 30 319 23 254 34 401 18 028 13 9422013 21 808 41 439 36 396 19 485 42 273 20 947 17 1182014 23 955 42 445 42 480 28 253 41 259 23 747 18 7552015 33 406 54 461 48 636 30 498 56 463 35 841 27 230 32 835 16 014 18 791 17 0512016 53 455 83 292 64 330 44 606 82 142 58 745 40 859 41 850 30 837 33 833 27 5312017 54 455 87 377 75 042 55 230 101 134 56 960 37 560 52 737 32 652 34 774 37 639
注:1、本表数据取自深圳市规划和国土资源委的网上合同备案资料。 Note: The data of this table adopts from the records of Shenzhen Municipal Bureau of Planning and Land Resources. 2、2015年开始新宝安区和新龙岗区统计口径。 The statistical coverage in this table is New Baoan and New Longgang from 2015.

237
9-16 房地产开发企业主要财务指标
FINANCIAL INDICATORS OF REAL ESTATE COMPANIES
年 份 Year
2012 2013 2014 2015 2016 2017
一、年末资产负债(亿元) Total Assets and Liabilities at the year end (100 million yuan)
资产总计 Total Capital 7 721.12 9 851.81 10 048.95 12 775.46 16433.75 20 196.64
负债合计 Total liabilities 5 562.67 7 304.97 7 743.89 9 816.21 12405.27 15 350.48
所有者权益合计 Creditors’Equity 2 158.45 2 546.83 2 305.06 2 959.26 4028.48 4 846.15
二、损益及分配(亿元) Profit,loss and distribution(100 million yuan)
1、主营业务收入 Business Revenue 1 029.48 1 181.42 1 320.40 1 864.36 2406.26 2 570.31
#土地转让收入 Land Sales Revenue 2.17 0.22 0.02 0.80
商品房屋销售收入 Sales Revenue of Commodity 922.51 1 071.24 1 211.01 1 767.06 2236.99 2 407.45
房屋出租收入 Revenue Leased 66.31 66.27 67.04 83.13 130.76 114.09
其他收入 Other Revenues 38.49 43.68 42.33 14.17 38.51 41.10
2、主营业务成本、主营业务税金及附加 Business Cost,Taxes and Extra Charge 694.90 820.76 855.77 1 301.68 1525.90 1 569.84
主营业务成本 Business cost 528.71 644.11 703.72 1 055.32 1172.91 1 207.13
主营业务税金及附加 Business Taxes and Extra Charge 166.19 176.65 152.05 246.37 353.00 362.71
3、费用合计 Total Expenses 150.84 177.22 178.26 222.45 249.28 297.31
销售费用 Sales Expenses 36.72 50.65 47.58 60.75 71.11 72.65
管理费用 Management Expenses 65.26 73.21 70.45 78.92 97.57 112.78
财务费用 Financial Expenses 48.86 53.36 60.23 82.78 80.61 111.88
4、其他业务利润 Other Profits 6.62 11.70 5.18 7.25 4.25 1.79
5、投资收益 Investment Revenue 117.02 202.94 122.73 149.00 131.58 92.37
6、营业外收入 Nonbusiness Revenue 5.19 4.81 3.72 7.11 10.81 6.89
7、营业外支出 Nonbusiness Expenses 4.23 5.84 10.65 7.57 15.28 39.04
8、利润总额 Total Profits 314.03 482.21 363.38 519.57 772.44 824.73
三、工资总额(亿元) Total Payable Salaries(100 million yuan) 42.41 29.86 31.21 38.40 47.49 52.91
四、从业人员年平均人数(人) Average Number of Employed Persons(person) 26 697 26 660 24 638 26 681 29 143 30 856
五、企业数(个) Number of Enterprises(unit) 459 461 453 498 566 599

238
主要统计指标解释
房地产开发投资 指各种登记注册类型的房地产开发公司、商品房建设公司及其他房地产开发法人单位
和附属于其他法人单位实际从事房地产开发或经营活动的单位统一开发的包括统代建、拆迁还建的住宅、厂
房、仓库、饭店、宾馆、度假村、写字楼、办公楼等房屋建筑物和配套的服务设施,土地开发工程(如道路、
给水、排水、供电、供热、通讯、平整场地等基础设施工程)的投资;不包括单纯的土地交易活动。
施工面积 指报告期内施工的全部房屋建筑面积。包括本期新开工的面积和上期开工跨入本期继续施工
的房屋面积,以及上期已停建在本期恢复施工的房屋面积。本期竣工和本期施工后又停缓建的房屋,其建筑面
积仍计入本期房屋施工面积中。
竣工面积 指在报告期内房屋建筑按照设计要求已经全部完工,达到住人和使用条件,经验收鉴定合格
(或达到竣工验收标准),正式移交使用单位的各栋房屋建筑面积的总和。

239
Explanatory Notes on Main Statistical Indicators
Investment in Real Estate Development It includes the investment by the real estate development companies,
commercial buildings construction companies and other real estate development units of various types of ownership in the
construction of house buildings, such as residential buildings, factory buildings, warehouses, hotels, guesthouses, holiday
villages, office buildings, and the complementary service facilities and land development projects, such as roads, water
supply, water drainage, power supply, heating, telecommunications, land leveling and other projects of infrastructure. It
excludes the activities in simple land transactions.
Floor Space under Construction refers to total floor space of all buildings under construction during the
reference period, including floor space of newly started buildings during the reference period, floor space of construction
extended from the previous period to the current period, and floor space of construction suspended during the previous
period and resumed in the current period. Floor space of construction completed in the current period, and floor space of
construction started and then suspended in the current period are also included in the floor space under construction of
the current year.
Floor Space of Building Completed refers to the floor space of all buildings completed in the reference period,
which have been appraised and accepted (or come up to the designed standards) and have been transferred to the owners
for use.


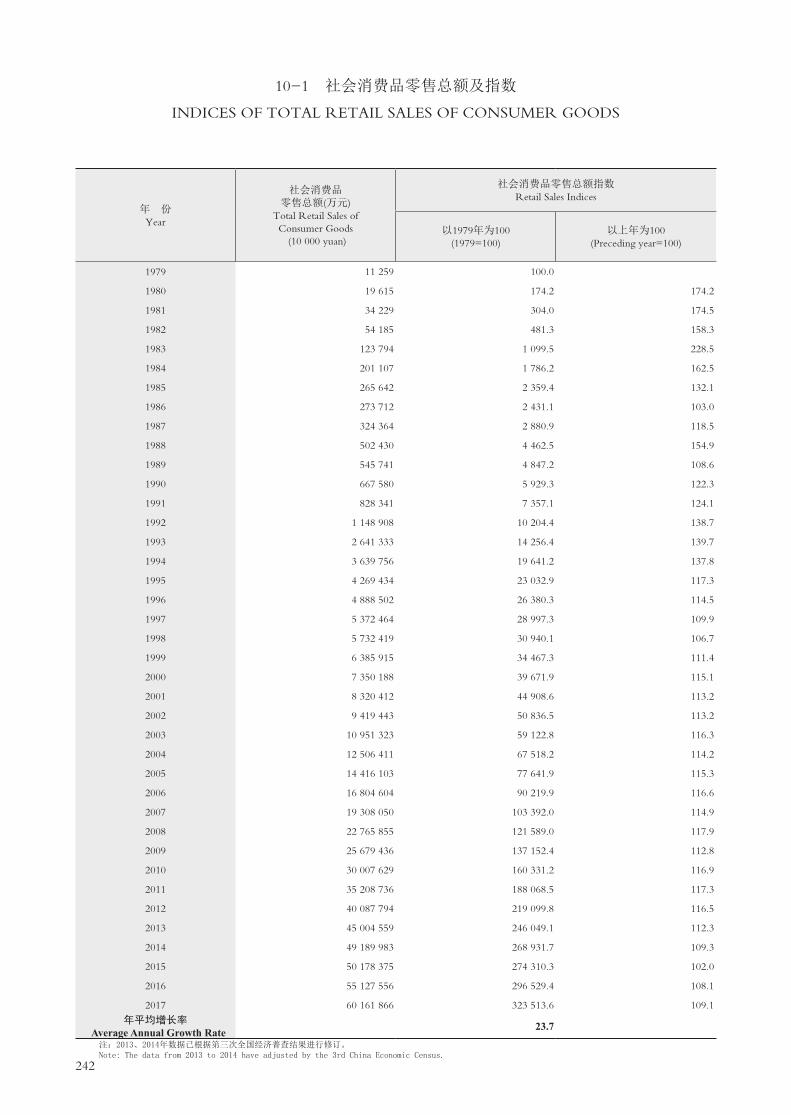
242
10-1 社会消费品零售总额及指数
INDICES OF TOTAL RETAIL SALES OF CONSUMER GOODS
年 份 Year
社会消费品 零售总额(万元)
Total Retail Sales of Consumer Goods
(10 000 yuan)
社会消费品零售总额指数 Retail Sales Indices
以1979年为100 (1979=100)
以上年为100 (Preceding year=100)
1979 11 259 100.0
1980 19 615 174.2 174.2
1981 34 229 304.0 174.5
1982 54 185 481.3 158.3
1983 123 794 1 099.5 228.5
1984 201 107 1 786.2 162.5
1985 265 642 2 359.4 132.1
1986 273 712 2 431.1 103.0
1987 324 364 2 880.9 118.5
1988 502 430 4 462.5 154.9
1989 545 741 4 847.2 108.6
1990 667 580 5 929.3 122.3
1991 828 341 7 357.1 124.1
1992 1 148 908 10 204.4 138.7
1993 2 641 333 14 256.4 139.7
1994 3 639 756 19 641.2 137.8
1995 4 269 434 23 032.9 117.3
1996 4 888 502 26 380.3 114.5
1997 5 372 464 28 997.3 109.9
1998 5 732 419 30 940.1 106.7
1999 6 385 915 34 467.3 111.4
2000 7 350 188 39 671.9 115.1
2001 8 320 412 44 908.6 113.2
2002 9 419 443 50 836.5 113.2
2003 10 951 323 59 122.8 116.3
2004 12 506 411 67 518.2 114.2
2005 14 416 103 77 641.9 115.3
2006 16 804 604 90 219.9 116.6
2007 19 308 050 103 392.0 114.9
2008 22 765 855 121 589.0 117.9
2009 25 679 436 137 152.4 112.8
2010 30 007 629 160 331.2 116.9
2011 35 208 736 188 068.5 117.3
2012 40 087 794 219 099.8 116.5
2013 45 004 559 246 049.1 112.3
2014 49 189 983 268 931.7 109.3
2015 50 178 375 274 310.3 102.0
2016 55 127 556 296 529.4 108.1
2017 60 161 866 323 513.6 109.1
年平均增长率 Average Annual Growth Rate 23.7
注:2013、2014年数据已根据第三次全国经济普查结果进行修订。 Note: The data from 2013 to 2014 have adjusted by the 3rd China Economic Census.

243
10-2 限额以上批发零售贸易业商品分类销售(2017年)
TOTAL SALES OF ENTERPRISES OVER LEVELS IN WHOLESALE AND RETAIL SALE
TRADES GROUPED BY CATEGORY OF COMMODITIES(2017)单位:万元 (10 000 yuan)
项 目 Item
批发额 Value in
Wholesale Trade
零售额 Value in
Retail Sale Trade
总 计 Total 246 003 358 36 797 596
食品、饮料、烟酒类 Food,Beverage,Tobacco and Liquor 24 621 189 3 957 626
针、纺织品类 Knitwear and Textiles 1 182 118 403 073
服装、鞋帽类 Garments,Footwear and Headgear 5 001 432 4 716 797
化妆品类 Cosmetics 680 376 341 243
日用品类 Articles for Daily Use 8 163 253 2 977 258
五金、电料类 Hardwares and Electric Appliances 2 459 864 221 665
家用电器及音像器材类 Household Appliances and Video Appliances 5 919 691 1 738 415
电子出版类及音像制品类 E-journals and Video Products 38 656 60 114
体育、娱乐用品类 Sports and Recreational Articles 317 243 174 567
文化、办公用品类 Articles For Culture and Office Use 30 948 540 1 848 470
金银珠宝类 Gold, Silver and Jewelry 12 025 504 1 031 787
家具类 Furniture 777 317 838 661
中西药品类 Traditional Chinese and Western Medicines 4 860 387 392 734
书报杂志类 Newspapers and Magazines 221 046 108 207
通讯器材类 Communications Appliances 27 427 870 2 137 388
建筑材料类 Building Materials 2 522 910 140 988
木材及制品类 Timber and Related Products 545 004
化工材料及制品类 Chemical Materials and Products 11 162 356
金属材料类 Metal Materials 32 076 150
机电设备及零件类 Mechanical and Electrical Products and Accessories 26 234 932 661 831
煤炭及制品类 Coal and Related Products 1 919 610
石油及制品类 Petroleum and Related Products 13 740 663 2 966 943
种子饲料类 Seeds and Feedstuff 285 676
棉麻类 Cotton and Hemp 289 254
汔车类 Motor Vehicles 6 859 328 8 697 755
其他类 Others 25 722 991 3 382 076

244
10-3 限额以上批发和零售业法人企业商品购销存综合表(2017年)
TOTAL PURCHASES SALES AND INVENTORY OF ENTERPRISES ABOVE THE
DESIGNATED SIZE IN WHOLESALE AND RETAIL TRADE(2017)单位:万元
项 目 Item
法人企业(个)
Number of Corporative Enterprises
(unit)
从业人员期末人数(人)Number of Employeesat the Year
-end (person)
总 计 Total 6 283 507 841
一、批发业 Wholesale Trade 5 158 308 555
1.按批发行业分组 Grouped by Sector
农畜产品批发 Wholesale of Farm and Livestock Products 68 3 515
食品、饮料及烟草制品批发 Wholesale of Foods, Beverages&Tobaccos 459 54 687
纺织、服装及日用品批发 Wholesale of Textiles, Garments and Daily-use Products 638 42 289
文化、体育用品及器材批发 Wholesale of Cultural and Sports Articles and Appliances 412 25 173
医药及医疗器材批发 Wholesale of Medicine and Medical Appliances 229 25 548
矿产品、建材及化工产品批发 Wholesale of Mineral Products, Building Material and Chemical Products 1 104 38 037
机械设备、五金交电及电子产品批发 Wholesale of Mechanical Equipment,Hardware and Electronic Products 1 951 103 754
贸易经纪与代理 Trade Broker and Agent 191 9 122
其他批发 Other Wholesales 106 6 430
2.按登记注册类型分组 Grouped by Registration Status
内资企业 Domestic-funded 4 492 252 026
国有企业 State-owned 17 1 315
集体企业 Collective-owned
股份合作企业 Share-holding Cooperative Enterprises
联营企业 Joint Ownership
有限责任公司 Limited Liabilities Companies 874 60 685
股份有限公司 Share-holding Limited Companies 111 29 068
私营企业 Private-owned 3 485 160 791
港、澳、台商投资企业 Funded by Entrepreneur from Hong Kong,Macao and Taiwan 453 35 535
合资经营企业(港或澳、台资) Joint-venture(Hong Kong,Macao and Taiwan) 34 3 796
合作经营企业(港或澳、台资) Cooperative(Hong Kong,Macao and Taiwan) 1 79
港、澳、台商独资经营企业 Enterprises with Sole Funds(Hong Kong,Macao and Taiwan) 398 30 409
港、澳、台商投资股份有限公司 Share-holding Corporations Ltd(Hong Kong,Macao and Taiwan) 12 770
外商投资企业 Foreign-funded 213 20 994
中外合资经营企业 Jointly-owned 30 5 442
中外合作经营企业 Cooperatively-owned 3 82
外资企业 Exclusively Foreign-owned 164 14 438
外商投资股份有限公司 Foreign-funded Investment Companies Limited 6 580
3.按控股情况分组 Grouped by Holding Condition
国有控股 State-controlled 137 21 351
集体控股 Collective-controlled 27 1 913
私人控股 Private-controlled 4 053 198 967
港澳台商控股 Controlled by Entrepreneur from Hong Kong,Macao and Taiwan 445 34 676
外商控股 Foreign-funded-controlled 185 15 668
其他 Others 311 35 980
4.按经营形式分组 Grouped by Business Forms
独立门店 Independent Stores 896 52 381

245
商品购进总额
Total Purchase
商品销售总额
Total Sales
年末商品库存总额Inventory
(Year-end)
年末零售营业面积(平方米)
Retail Business Area at the
Year-end(sq.m)
进口额Imports
批发额Whosales Trade
零售额Retail Trade出口额
Exports
232 771 437 29 504 446 250 019 970 214 713 195 17 164 254 35 306 775 20 364 482 7 976 000
206 275 267 27 990 615 219 601 143 210 771 775 17 125 540 8 829 369 14 694 455 1 873 112
3 553 764 192 525 3 866 208 3 820 230 28 351 45 978 267 777 8 569
19 149 986 1 027 937 22 401 318 21 647 099 435 252 754 219 1 650 300 227 402
8 437 914 522 383 9 872 546 8 945 204 1 790 017 927 342 1 248 584 268 070
9 907 548 257 289 10 805 206 10 440 586 174 599 364 620 2 623 505 142 752
4 557 066 503 483 5 516 294 5 350 628 88 460 165 665 493 443 82 854
75 987 744 4 583 917 78 019 526 75 070 485 2 875 559 2 949 041 2 687 611 507 732
61 278 887 14 282 809 64 362 349 62 288 838 8 896 539 2 073 511 4 857 327 534 893
22 254 220 6 374 073 23 394 017 22 102 976 2 665 145 1 291 041 724 356 62 531
1 148 140 246 198 1 363 680 1 105 729 171 618 257 951 141 555 38 309
178 934 159 24 349 826 188 122 571 180 558 205 16 089 938 7 564 366 12 396 255 1 640 946
1 955 416 46 025 2 356 750 2 339 442 29 920 17 308 63 640 9 385
61 330 570 4 383 464 64 706 269 62 293 931 2 317 468 2 412 338 3 813 508 309 280
23 620 983 3 329 985 24 540 833 22 249 046 4 359 239 2 291 787 1 403 088 303 217
91 981 791 16 586 538 96 469 118 93 631 421 9 383 311 2 837 698 7 114 519 1 017 753
11 653 717 2 388 649 13 100 788 12 078 909 359 725 1 021 880 1 092 922 147 109
1 237 912 104 170 1 443 135 1 324 935 33 715 118 201 63 784 17 967
6 816 9 291 9 291 9 291 183 230
10 134 561 2 213 645 11 269 842 10 400 383 311 670 869 459 1 004 588 126 946
111 303 44 899 167 182 149 206 4 747 17 976 17 835 1 300
15 687 392 1 252 140 18 377 784 18 134 661 675 878 243 123 1 205 279 85 057
3 314 887 16 577 5 336 983 5 292 019 31 323 44 963 241 930 21 616
67 858 6 135 72 589 72 428 94 161 3 478 2 028
11 093 044 1 210 837 11 654 350 11 462 912 638 159 191 438 944 624 58 308
55 270 1 544 139 894 133 342 1 894 6 551 7 023 1 000
25 313 811 1 080 846 26 730 675 24 843 889 1 854 529 1 886 786 1 277 834 279 953
5 262 244 62 020 5 655 049 5 619 240 13 071 35 809 193 160 22 014
123 242 438 21 099 531 129 409 092 124 889 998 12 669 986 4 519 094 9 311 103 1 216 320
11 344 688 2 338 545 12 691 228 11 708 272 334 654 982 956 1 078 565 140 765
12 486 507 1 242 476 13 176 187 12 973 740 652 381 202 446 975 155 65 426
28 625 579 2 167 198 31 938 913 30 736 636 1 600 919 1 202 277 1 858 639 148 634
26 841 775 1 684 103 28 504 528 27 280 272 574 006 1 224 256 2 590 045 398 102
(10 000 yuan)

246
单位:万元
项 目 Item
法人企业(个)
Number of Corporative Enterprises
(unit)
从业人员期末人数(人)Number of Employeesat the Year
-end (person)
连锁总店 General Chain Stores 22 6 436
连锁门店 Chain Stores 21 5 754
其他 Others 4 219 243 984
二、零售业 Retail Trade Sector 1 125 199 286
1.按零售行业分组 Grouped by Sector
综合零售 Integrated Retail 97 58 391
食品、饮料及烟草制品专门零售 Special Retail of Foods, Beverages&Tobaccos 51 7 876
纺织、服装及日用品专门零售 Special Retail of Textile, Garments and Daily-use Articles 168 54 078
文化、体育用品及器材专门零售 Special Retail of Cultural and Sports Goods and Appliances 64 10 155
医药及医疗器材专门零售 Special Retail of Medicine and Medical Appliances 33 7 517
汽车、摩托车、燃料及零配件专门零售 Special Retail of Automobiles, Motorcycles, Fuels and Related Accessories 481 36 004
家用电器及电子产品专门零售 Special Retail of Household Electrical Appliances and Electronic Products 120 10 937
五金、家具及室内装修材料专门零售 Special Retail of Hardware, Furniture and lndoor Decoration Materials 48 3 346
无店铺及其他零售 Retail without Shops and Other 63 10 982
2.按登记注册类型分组 Grouped by Registration
内资企业 Civil Funded 1 017 128 487
国有企业 State-owned 6 2 079
集体企业 Collective-owned 3 104
股份合作企业 Share-holding Cooperative Enterprise
联营企业 Joint Ownership 3 1 297
有限责任公司 Limited Liabilities Companies 329 52 683
股份有限公司 Share-holding Limited Companies 24 8 110
私营企业 Private-owned 652 64 214
港、澳、台商投资企业 Funded by Entrepreneur from Hong Kong, Macao and Taiwan 74 34 595
外商投资企业 Foreign-funded 34 36 204
3.按控股情况分组 Grouped by Holding Condition
国有控股 State-controlled 65 35 215
集体控股 Collective-controlled 9 552
私人控股 Private-controlled 828 96 916
港澳台商控股 Controlled by Entrepreneur from Hong Kong,Macao and Taiwan 69 24 800
外商控股 Foreign-funded-controlled 24 19 533
其他 Others 130 22 270
4.按经营形式分组 Grouped by Business Forms
独立门店 Independent Stores 564 61 060
连锁总店 General Chain Stores 72 38 611
连锁门店 Chain Stores 36 40 202
其他 Other 453 59 413
5.按零售业态分组 Grouped by Retail Format
有店铺零售 Store-based Retailing 928 180 175
无店铺零售 Non-Store Retailing 197 19 111

247
商品购进总额
Total Purchase
商品销售总额
Total Sales
年末商品库存总额Inventory
(Year-end)
年末零售营业面积(平方米)
Retail Business area at the
Year-end(sq.m)
进口额Imports
批发额Whosales Trade
零售额Retail Trade出口额
Exports
4 695 932.9 14 152.9 5 099 749.2 3 709 342.7 4 636.3 1 390 406.5 145 764.5 274 869
337 511.3 3 766.7 436 490.8 205 819.6 8.1 230 671.2 139 129.8 95 661
174 400 048.4 26 288 592.6 185 560 375.4 179 576 340.6 16 546 890.3 5 984 034.8 11 819 516.4 1 104 480
26 496 170.0 1 513 831.1 30 418 826.7 3 941 420.1 38 714.1 26 477 406.6 5 670 026.5 6 102 888
7 183 621.5 10 769.6 7 459 985.3 711 695.1 6 748 290.2 1 066 198.5 3 019 304
391 616.1 99 068.4 550 863.0 121 059.9 429 803.1 112 771.4 58 743
1 773 715.2 110 630.2 3 098 332.2 424 114.6 13 963.0 2 674 217.6 947 505.8 753 164
501 372.0 3 955.5 675 356.4 180 324.6 758.0 495 031.8 222 900.3 160 482
439 286.9 6 440.0 487 539.2 36 675.6 450 863.6 116 229.8 143 872
11 639 450.8 1 101 416.1 12 394 733.5 1 400 761.4 10 993 972.1 1 704 106.9 1 366 994
2 611 205.2 36 970.9 2 987 159.9 734 767.2 64.5 2 252 392.7 986 706.5 328 222
560 505.7 4 576.2 710 312.0 61 129.5 560.5 649 182.5 95 460.4 215 747
1 395 396.6 140 004.2 2 054 545.2 270 892.2 23 368.1 1 783 653.0 418 146.9 56 360
18 017 839.1 1 271 662.6 21 130 612.3 2 933 926.2 38 654.5 18 196 686.1 3 857 803.0 3 599 505
59 974.9 44 240.4 24 975.3 19 265.1 34 374.1 11 089
18 106.7 19 280.6 19 280.6 309.9 2 551
16 791.8 37 804.9 37 804.9 2 409.7 3 900
9 655 605.6 741 242.7 11 060 380.9 1 656 836.6 1 459.2 9 403 544.3 1 628 068.9 1 916 081
562 097.7 8 526.6 922 347.9 42 899.8 64.5 879 448.1 860 163.4 50 106
7 705 262.4 521 893.3 9 046 557.6 1 209 214.5 37 130.8 7 837 343.1 1 332 477.0 1 615 778
4 030 223.8 237 824.9 4 551 695.1 255 732.4 59.6 4 295 962.7 1 435 917.7 1 307 160
4 448 107.1 4 343.6 4 736 519.3 751 761.5 3 984 757.8 376 305.8 1 196 223
5 565 783.2 133 751.2 5 835 109.5 1 486 604.7 4 348 504.8 1 013 056.4 1 356 298
318 698.8 5 062.4 338 857.2 12 370.7 326 486.5 16 876.2 44 513
12 806 124.0 1 038 030.3 15 267 657.8 1 865 110.6 38 654.4 13 402 547.2 3 110 009.0 2 498 468
2 568 298.0 222 505.8 3 001 470.4 245 921.9 59.7 2 755 548.5 755 196.4 723 045
1 955 908.4 1 670.1 2 252 594.5 43 123.0 2 209 471.5 268 828.2 606 239
3 281 357.6 112 811.3 3 723 137.3 288 289.2 3 434 848.1 506 060.3 874 325
10 361 722.8 1 137 100.3 11 705 763.0 708 355.3 22 052.0 10 997 407.7 1 761 008.8 1 931 046
3 804 063.4 72 742.3 4 231 093.8 509 375.4 3 721 718.4 1 276 186.0 1 319 267
4 104 955.0 342.1 4 401 732.7 732 329.0 3 669 403.7 1 156 196.5 1 364 435
8 225 428.8 303 646.4 10 080 237.2 1 991 360.4 16 662.1 8 088 876.8 1 476 635.2 1 488 140
23 560 803.8 1 336 128.2 26 398 041.5 3 319 951.5 1 281.0 23 078 090.0 5 049 121.2 5 965 162
2 935 366.2 177 702.9 4 020 785.2 621 468.6 37 433.1 3 399 316.6 620 905.3 137 726
10-3 续表 continued(10 000 yuan)
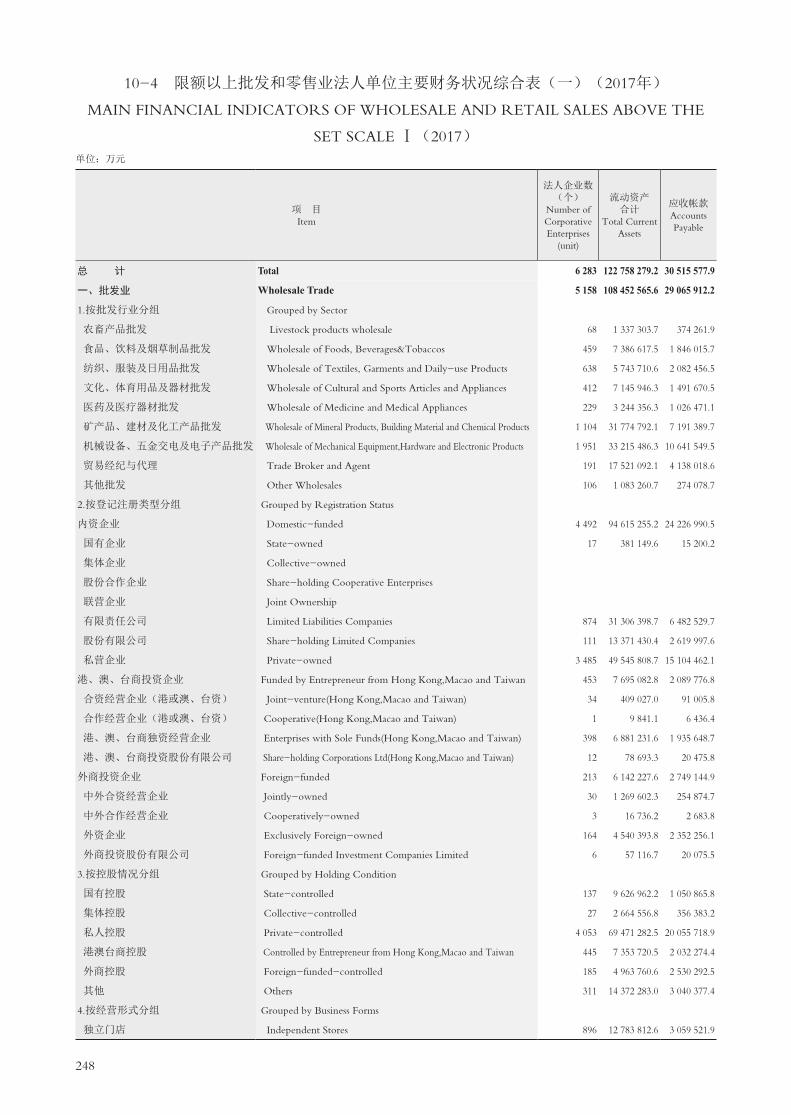
248
项 目 Item
法人企业数(个)
Number of Corporative Enterprises
(unit)
流动资产合计
Total Current Assets
应收帐款Accounts Payable
总 计 Total 6 283 122 758 279.2 30 515 577.9
一、批发业 Wholesale Trade 5 158 108 452 565.6 29 065 912.2
1.按批发行业分组 Grouped by Sector
农畜产品批发 Livestock products wholesale 68 1 337 303.7 374 261.9
食品、饮料及烟草制品批发 Wholesale of Foods, Beverages&Tobaccos 459 7 386 617.5 1 846 015.7
纺织、服装及日用品批发 Wholesale of Textiles, Garments and Daily-use Products 638 5 743 710.6 2 082 456.5
文化、体育用品及器材批发 Wholesale of Cultural and Sports Articles and Appliances 412 7 145 946.3 1 491 670.5
医药及医疗器材批发 Wholesale of Medicine and Medical Appliances 229 3 244 356.3 1 026 471.1
矿产品、建材及化工产品批发 Wholesale of Mineral Products, Building Material and Chemical Products 1 104 31 774 792.1 7 191 389.7
机械设备、五金交电及电子产品批发 Wholesale of Mechanical Equipment,Hardware and Electronic Products 1 951 33 215 486.3 10 641 549.5
贸易经纪与代理 Trade Broker and Agent 191 17 521 092.1 4 138 018.6
其他批发 Other Wholesales 106 1 083 260.7 274 078.7
2.按登记注册类型分组 Grouped by Registration Status
内资企业 Domestic-funded 4 492 94 615 255.2 24 226 990.5
国有企业 State-owned 17 381 149.6 15 200.2
集体企业 Collective-owned
股份合作企业 Share-holding Cooperative Enterprises
联营企业 Joint Ownership
有限责任公司 Limited Liabilities Companies 874 31 306 398.7 6 482 529.7
股份有限公司 Share-holding Limited Companies 111 13 371 430.4 2 619 997.6
私营企业 Private-owned 3 485 49 545 808.7 15 104 462.1
港、澳、台商投资企业 Funded by Entrepreneur from Hong Kong,Macao and Taiwan 453 7 695 082.8 2 089 776.8
合资经营企业(港或澳、台资) Joint-venture(Hong Kong,Macao and Taiwan) 34 409 027.0 91 005.8
合作经营企业(港或澳、台资) Cooperative(Hong Kong,Macao and Taiwan) 1 9 841.1 6 436.4
港、澳、台商独资经营企业 Enterprises with Sole Funds(Hong Kong,Macao and Taiwan) 398 6 881 231.6 1 935 648.7
港、澳、台商投资股份有限公司 Share-holding Corporations Ltd(Hong Kong,Macao and Taiwan) 12 78 693.3 20 475.8
外商投资企业 Foreign-funded 213 6 142 227.6 2 749 144.9
中外合资经营企业 Jointly-owned 30 1 269 602.3 254 874.7
中外合作经营企业 Cooperatively-owned 3 16 736.2 2 683.8
外资企业 Exclusively Foreign-owned 164 4 540 393.8 2 352 256.1
外商投资股份有限公司 Foreign-funded Investment Companies Limited 6 57 116.7 20 075.5
3.按控股情况分组 Grouped by Holding Condition
国有控股 State-controlled 137 9 626 962.2 1 050 865.8
集体控股 Collective-controlled 27 2 664 556.8 356 383.2
私人控股 Private-controlled 4 053 69 471 282.5 20 055 718.9
港澳台商控股 Controlled by Entrepreneur from Hong Kong,Macao and Taiwan 445 7 353 720.5 2 032 274.4
外商控股 Foreign-funded-controlled 185 4 963 760.6 2 530 292.5
其他 Others 311 14 372 283.0 3 040 377.4
4.按经营形式分组 Grouped by Business Forms
独立门店 Independent Stores 896 12 783 812.6 3 059 521.9
10-4 限额以上批发和零售业法人单位主要财务状况综合表(一)(2017年)
MAIN FINANCIAL INDICATORS OF WHOLESALE AND RETAIL SALES ABOVE THE
SET SCALE Ⅰ(2017)单位:万元

249
存货Inventory
固定资产合计
Total Fixed Assets
固定资产原价Original Value of
Fixed Assets
累计折旧Accumulative Depreciation
资产总计Total Assets
流动负债合计Total Current
Liabilities
应付帐款Accounts Payable
本年折旧Depreciation of the
Year
16 671 058.1 3 477 871.7 5 754 745.0 2 547 301.0 393 862.8 149 472 871.4 107 314 808.2 26 762 789.7
13 142 805.8 2 569 522.7 4 135 070.0 1 748 900.4 268 548.6 130 486 169.4 96 991 841.7 23 918 194.3
252 663.0 53 525.0 60 142.0 18 007.0 1 952.2 2 245 524.4 896 111.6 145 700.8
1 527 364.0 339 382.0 576 121.3 253 352.9 38 690.2 9 554 203.2 5 627 121.7 1 717 330.5
1 024 753.2 145 918.6 240 152.7 110 292.8 23 172.9 6 431 242.9 4 754 619.0 1 694 671.7
2 562 573.7 162 718.2 233 276.4 76 248.4 13 322.4 8 128 539.9 5 856 904.9 932 452.8
452 001.4 111 945.2 185 443.4 76 658.8 17 290.5 4 739 491.1 2 547 203.1 824 292.1
2 080 833.7 846 062.5 1 519 470.2 728 238.9 73 147.7 39 693 545.9 30 964 600.9 5 787 764.4
4 438 383.9 655 945.3 1 001 392.2 400 945.9 86 370.4 38 842 094.0 28 741 000.9 9 711 502.6
663 146.4 194 398.2 236 186.4 57 931.3 10 611.0 19 306 129.9 16 441 884.2 2 841 971.3
141 086.5 59 627.7 82 885.4 27 224.4 3 991.3 1 545 398.1 1 162 395.4 262 508.1
11 008 415.3 2 129 547.6 3 406 820.2 1 431 326.4 211 173.2 111 496 168.5 84 849 526.0 18 830 394.0
55 790.3 39 456.8 71 503.5 32 341.4 1 828.6 467 669.5 168 330.3 30 089.6
3 402 268.2 507 801.5 839 156.8 361 731.3 50 142.3 38 719 915.1 29 148 212.6 5 750 856.7
1 501 140.7 711 825.1 1 281 348.5 586 801.1 51 709.6 18 014 659.3 11 322 505.6 1 495 994.6
6 047 715.8 869 879.1 1 213 428.5 449 654.8 107 368.4 54 267 174.7 44 198 767.4 11 550 620.9
984 070.2 223 555.8 345 382.7 141 984.2 27 027.2 10 521 076.6 6 427 560.2 2 231 595.8
67 140.1 20 263.7 36 664.9 18 061.7 2 228.0 551 449.3 373 237.7 127 584.9
183.1 16.9 54.8 37.9 1.8 10 560.4 966.2 747.9
893 310.1 196 109.5 282 897.8 104 970.8 23 023.3 9 197 049.3 5 741 462.3 2 058 319.1
20 214.1 576.8 1 178.4 657.1 155.7 84 300.3 64 495.1 28 081.7
1 150 320.3 216 419.3 382 867.1 175 589.8 30 348.2 8 468 924.3 5 714 755.5 2 856 204.5
239 685.7 87 289.2 124 815.7 39 828.0 8 349.3 2 034 737.9 1 341 759.8 224 211.8
3 109.6 534.5 1 758.2 1 223.7 79.4 17 314.9 12 368.7 3 374.1
891 742.4 115 079.8 235 263.4 126 773.7 20 993.9 5 962 815.3 4 098 694.7 2 462 589.0
7 643.0 588.5 1 051.2 552.0 124.3 57 857.9 37 292.1 26 689.3
1 306 810.4 730 753.2 1 432 497.9 716 161.3 60 729.6 14 545 144.7 7 342 059.9 1 192 377.7
200 707.4 24 230.7 48 352.4 24 417.0 456.7 3 114 958.8 2 332 811.0 229 569.4
8 274 848.2 1 161 166.9 1 594 547.3 568 816.6 133 409.8 78 762 652.6 63 704 178.2 14 575 818.2
970 004.7 216 996.5 317 907.4 121 126.6 25 463.6 9 724 528.0 6 139 579.5 2 226 724.8
923 062.1 132 626.1 264 014.2 138 146.8 22 100.8 6 549 031.8 4 453 528.5 2 673 276.3
1 467 373.0 303 749.3 477 750.8 180 232.1 26 388.1 17 789 853.5 13 019 684.6 3 020 427.9
1 829 428.8 366 871.7 489 657.5 183 480.3 37 270.7 14 249 115.0 11 310 500.4 3 413 435.7
(10 000 yuan)
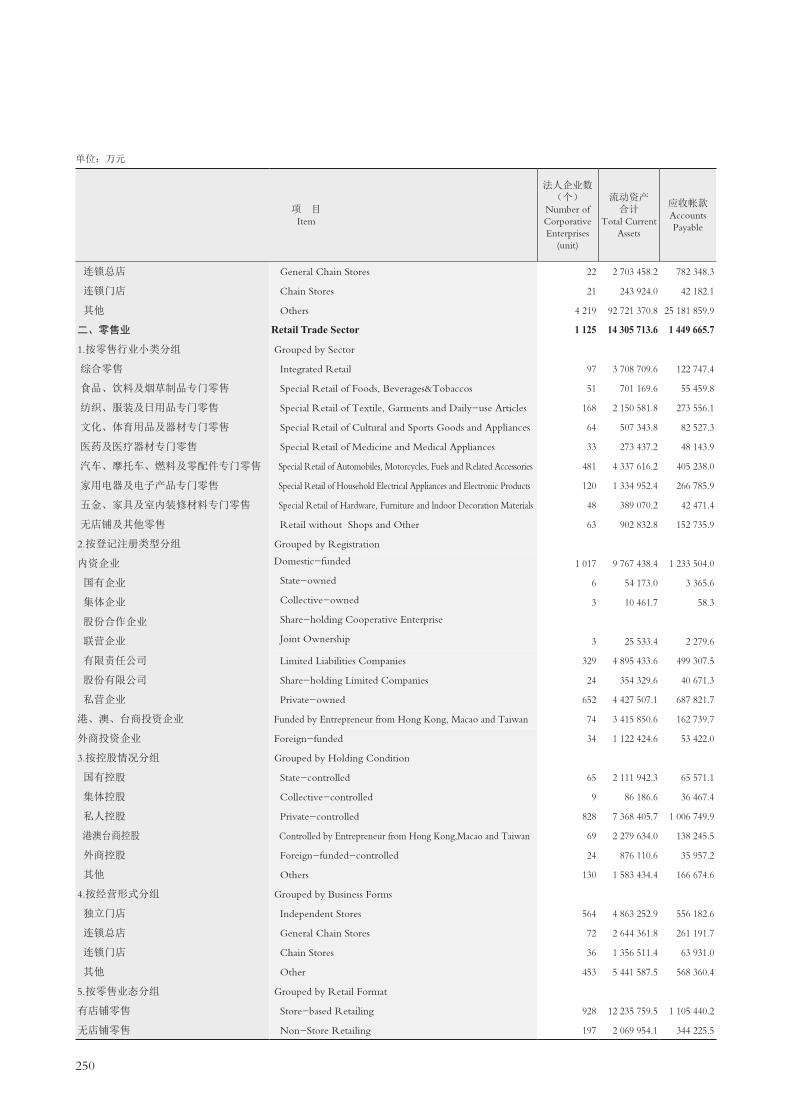
250
单位:万元
项 目 Item
法人企业数(个)
Number of Corporative Enterprises
(unit)
流动资产合计
Total Current Assets
应收帐款Accounts Payable
连锁总店 General Chain Stores 22 2 703 458.2 782 348.3
连锁门店 Chain Stores 21 243 924.0 42 182.1
其他 Others 4 219 92 721 370.8 25 181 859.9
二、零售业 Retail Trade Sector 1 125 14 305 713.6 1 449 665.7
1.按零售行业小类分组 Grouped by Sector
综合零售 Integrated Retail 97 3 708 709.6 122 747.4
食品、饮料及烟草制品专门零售 Special Retail of Foods, Beverages&Tobaccos 51 701 169.6 55 459.8
纺织、服装及日用品专门零售 Special Retail of Textile, Garments and Daily-use Articles 168 2 150 581.8 273 556.1
文化、体育用品及器材专门零售 Special Retail of Cultural and Sports Goods and Appliances 64 507 343.8 82 527.3
医药及医疗器材专门零售 Special Retail of Medicine and Medical Appliances 33 273 437.2 48 143.9
汽车、摩托车、燃料及零配件专门零售 Special Retail of Automobiles, Motorcycles, Fuels and Related Accessories 481 4 337 616.2 405 238.0
家用电器及电子产品专门零售 Special Retail of Household Electrical Appliances and Electronic Products 120 1 334 952.4 266 785.9
五金、家具及室内装修材料专门零售 Special Retail of Hardware, Furniture and lndoor Decoration Materials 48 389 070.2 42 471.4
无店铺及其他零售 Retail without Shops and Other 63 902 832.8 152 735.9
2.按登记注册类型分组 Grouped by Registration
内资企业 Domestic-funded 1 017 9 767 438.4 1 233 504.0
国有企业 State-owned 6 54 173.0 3 365.6
集体企业 Collective-owned 3 10 461.7 58.3
股份合作企业 Share-holding Cooperative Enterprise
联营企业 Joint Ownership 3 25 533.4 2 279.6
有限责任公司 Limited Liabilities Companies 329 4 895 433.6 499 307.5
股份有限公司 Share-holding Limited Companies 24 354 329.6 40 671.3
私营企业 Private-owned 652 4 427 507.1 687 821.7
港、澳、台商投资企业 Funded by Entrepreneur from Hong Kong, Macao and Taiwan 74 3 415 850.6 162 739.7
外商投资企业 Foreign-funded 34 1 122 424.6 53 422.0
3.按控股情况分组 Grouped by Holding Condition
国有控股 State-controlled 65 2 111 942.3 65 571.1
集体控股 Collective-controlled 9 86 186.6 36 467.4
私人控股 Private-controlled 828 7 368 405.7 1 006 749.9
港澳台商控股 Controlled by Entrepreneur from Hong Kong,Macao and Taiwan 69 2 279 634.0 138 245.5
外商控股 Foreign-funded-controlled 24 876 110.6 35 957.2
其他 Others 130 1 583 434.4 166 674.6
4.按经营形式分组 Grouped by Business Forms
独立门店 Independent Stores 564 4 863 252.9 556 182.6
连锁总店 General Chain Stores 72 2 644 361.8 261 191.7
连锁门店 Chain Stores 36 1 356 511.4 63 931.0
其他 Other 453 5 441 587.5 568 360.4
5.按零售业态分组 Grouped by Retail Format
有店铺零售 Store-based Retailing 928 12 235 759.5 1 105 440.2
无店铺零售 Non-Store Retailing 197 2 069 954.1 344 225.5

251
10-4 (一)续表 (10 000 yuan)
存货Inventory
固定资产合计
Total Fixed Assets
固定资产原价Original Value of
Fixed Assets
累计折旧Accumulative Depreciation
资产总计Total Assets
流动负债合计Total Current
Liabilities
应付帐款Accounts Payable
本年折旧Depreciation of the
Year
137 170.1 71 503.8 159 360.3 91 023.3 6 151.0 3 025 474.0 2 217 662.8 555 154.5
127 392.1 7 049.2 14 074.9 7 053.2 1 028.1 264 352.4 168 915.3 65 986.0
11 048 814.8 2 124 098.0 3 471 977.3 1 467 343.6 224 098.8 112 947 228.0 83 294 763.2 19 883 618.1
3 528 252.3 908 349.0 1 619 675.0 798 400.6 125 314.2 18 986 702.0 10 322 966.5 2 844 595.4
359 482.7 273 907.1 617 733.1 346 394.8 28 772.2 6 169 565.4 2 386 063.3 1 052 985.3
115 356.3 23 566.4 39 545.5 20 377.9 3 370.4 992 638.9 477 593.0 62 044.1
970 096.6 106 474.8 167 463.1 70 435.0 21 062.8 2 500 379.9 1 424 601.3 433 232.1
179 187.1 51 452.9 115 826.5 65 069.1 5 400.1 714 593.0 406 544.3 164 196.7
104 064.6 15 605.5 9 946.1 5 049.3 782.4 320 256.8 293 743.5 136 191.4
1 107 720.4 321 604.2 503 447.4 216 447.2 43 715.4 5 267 488.6 3 505 245.7 492 072.0
233 002.7 51 101.8 80 231.7 36 034.6 3 538.5 1 561 368.3 1 124 223.3 291 036.0
38 744.7 41 452.1 47 241.2 20 649.6 15 213.5 469 307.4 235 890.1 40 856.9
420 597.2 23 184.2 38 240.4 17 943.1 3 458.9 991 103.7 469 062.0 171 980.9
2 726 940.1 587 998.4 927 213.1 423 403.2 62 993.9 11 914 742.0 7 464 926.1 1 726 784.8
3 812.9 34 318.3 80 219.6 45 901.3 2 345.2 195 467.2 52 105.0 5 568.8
1 307.4 83.5 229.2 145.7 0.5 10 773.1 8 700.8 151.4
2 147.3 798.3 4 016.0 3 220.7 319.0 26 997.4 7 830.0 92.5
1 385 601.5 317 759.8 484 349.0 211 731.3 29 984.0 6 029 298.4 3 621 287.4 900 820.9
124 945.0 16 058.4 29 744.4 19 586.7 1 530.6 517 087.5 204 509.3 59 151.9
1 209 126.0 218 980.1 328 654.9 142 817.5 28 814.6 5 135 118.4 3 570 493.6 760 999.3
508 859.4 159 217.7 288 287.0 138 059.0 28 629.9 5 375 689.0 2 062 454.6 502 726.8
292 452.8 161 132.9 404 174.9 236 938.4 33 690.4 1 696 271.0 795 585.8 615 083.8
393 813.7 215 621.7 388 618.6 183 076.6 18 349.5 3 522 628.2 924 456.7 673 555.3
17 873.2 2 174.1 9 590.1 7 497.6 298.6 89 877.8 58 669.9 27 914.4
2 210 224.2 421 620.9 598 003.4 244 268.1 43 204.4 8 693 872.5 5 715 236.0 1 197 636.6
401 829.2 71 959.2 128 887.0 65 502.0 21 333.0 3 672 929.2 1 423 631.5 255 797.4
184 331.1 82 324.6 256 083.2 167 506.4 27 394.6 1 062 880.6 888 238.5 223 751.4
320 180.9 114 648.5 238 492.7 130 549.9 14 734.1 1 944 513.7 1 312 733.9 465 940.3
1 326 099.8 437 882.3 755 324.5 369 788.5 71 723.8 6 248 733.0 3 753 359.9 681 685.2
582 365.2 131 817.0 176 071.8 66 080.6 15 748.1 3 424 722.3 2 010 707.3 509 426.0
393 055.4 146 773.4 278 822.6 132 136.3 11 340.9 2 104 337.3 777 941.3 715 242.8
1 226 731.9 191 876.3 409 456.1 230 395.2 26 501.4 7 208 909.4 3 780 958.0 938 241.4
2 916 424.1 810 052.1 1 502 391.5 764 359.8 118 005.1 16 566 046.7 8 950 752.0 2 449 263.4
611 828.2 98 296.9 117 283.5 34 040.8 7 309.1 2 420 655.3 1 372 214.5 395 332.0

252
项 目 Item
非流动负债合计Total Non-
working Liabilities
负债合计Total
Liabilities
所有者权益合计
Total Owner'sEguities
总 计 Total 6 891 142.5 114 382 541.7 35 106 967.1
一、批发业 Wholesale Trade 5 458 592.9 102 607 805.3 27 895 001.5
1.按批发行业分组 Grouped by Sector
农畜产品批发 Livestock products wholesale 17 113.4 913 225.0 1 332 299.4
食品、饮料及烟草制品批发 Wholesale of Foods, Beverages&Tobaccos 105 788.1 5 916 914.1 3 637 289.1
纺织、服装及日用品批发 Wholesale of Textiles, Garments and Daily-use Products 156 766.8 4 894 987.3 1 536 255.6
文化、体育用品及器材批发 Wholesale of Cultural and Sports Articles and Appliances 271 684.1 6 166 221.5 1 962 318.4
医药及医疗器材批发 Wholesale of Medicine and Medical Appliances 171 664.4 2 720 333.1 2 019 158.0
矿产品、建材及化工产品批发 Wholesale of Mineral Products, Building Material and Chemical Products 1 597 381.0 32 497 965.6 7 199 105.0
机械设备、五金交电及电子产品批发 Wholesale of Mechanical Equipment,Hardware and Electronic Products 2 301 051.2 31 052 713.7 7 802 493.0
贸易经纪与代理 Trade Broker and Agent 814 479.2 17 256 854.1 2 049 275.8
其他批发 Other Wholesales 22 664.7 1 188 590.9 356 807.2
2.按登记注册类型分组 Grouped by Registration Status
内资企业 Domestic-funded 4 716 896.1 89 710 077.3 21 789 615.9
国有企业 State-owned 1 697.0 170 027.4 297 642.1
集体企业 Collective-owned
股份合作企业 Share-holding Cooperative Enterprises
联营企业 Joint Ownership
有限责任公司 Limited Liabilities Companies 2 331 888.5 31 585 263.4 7 134 651.7
股份有限公司 Share-holding Limited Companies 995 675.5 12 317 859.3 5 696 800.0
私营企业 Private-owned 1 387 635.1 45 625 217.1 8 645 482.3
港、澳、台商投资企业 Funded by Entrepreneur from Hong Kong,Macao and Taiwan 382 690.1 6 823 798.1 3 710 391.2
合资经营企业(港或澳、台资) Joint-venture(Hong Kong,Macao and Taiwan) - 1 142.5 372 095.1 179 354.2
合作经营企业(港或澳、台资) Cooperative(Hong Kong,Macao and Taiwan) 966.2 9 594.2
港、澳、台商独资经营企业 Enterprises with Sole Funds(Hong Kong,Macao and Taiwan) 252 727.6 6 007 737.8 3 202 424.2
港、澳、台商投资股份有限公司 Share-holding Corporations Ltd(Hong Kong,Macao and Taiwan) 2 285.2 66 780.3 17 520.0
外商投资企业 Foreign-funded 359 006.7 6 073 929.9 2 394 994.4
中外合资经营企业 Jointly-owned 155 678.7 1 497 438.5 537 299.4
中外合作经营企业 Cooperatively-owned 434.7 12 803.4 4 511.5
外资企业 Exclusively Foreign-owned 198 390.1 4 297 252.5 1 665 562.8
外商投资股份有限公司 Foreign-funded Investment Companies Limited 4 413.8 41 705.9 16 152.0
3.按控股情况分组 Grouped by Holding Condition
国有控股 State-controlled 1 258 643.9 8 786 698.1 5 758 446.6
集体控股 Collective-controlled 175 511.2 2 508 321.1 606 637.7
私人控股 Private-controlled 2 643 177.4 66 308 375.0 12 457 802.3
港澳台商控股 Controlled by Entrepreneur from Hong Kong,Macao and Taiwan 260 383.4 6 413 510.8 3 324 129.9
外商控股 Foreign-funded-controlled 203 837.9 4 657 534.1 1 891 497.7
其他 Others 917 039.1 13 933 366.2 3 856 487.3
4.按经营形式分组 Grouped by Business Forms
独立门店 Independent Stores 382 468.6 11 743 168.5 2 505 946.5
10-4 限额以上批发和零售业法人单位主要财务状况综合表(二)(2017年)
MAIN FINANCIAL INDICATORS OF WHOLESALE AND RETAIL SALES ABOVE THE
SET SCALE Ⅱ(2017)单位:万元

253
(10 000 yuan)
实收资本Paid-in Capital
主营业务收入Prime
Operating Revenues
主营业务成本Operating
Losts
主营业务税金及附加
Sales Taxes and Extra Charges
1.国家资本State Capital
2.集体资本Collective-owned
Capital
3.法人资本Capital of Juridical Person
4.个人资本Private Capital
5.港澳台资本Hong Kong, Macao and
Taiwan Capital
6.外商资本Foreign Capital
20 066 802.4 1 594 810.6 260 635.7 10 493 097.1 3 415 576.6 2 774 083.5 1 528 598.9 223 654 416.9 208 362 565.3 530 821.0
16 470 108.7 961 195.0 238 593.7 8 373 560.2 2 982 943.7 2 569 578.1 1 344 238.0 196 649 927.3 186 112 184.4 437 475.4
1 176 980.7 49 102.0 75.0 1 086 169.9 37 636.0 2 566.5 1 431.3 3 548 179.5 3 420 813.7 2 358.1
1 320 023.5 57 257.3 26 745.0 643 183.7 230 627.8 44 810.0 317 399.7 19 106 859.3 17 359 654.7 258 833.8
929 011.7 5 720.5 5 420.0 480 786.2 244 307.2 148 588.1 44 189.7 9 041 645.9 7 831 846.2 19 964.6
2 184 440.2 10 412.8 9 871.2 756 977.4 320 893.1 1 070 592.6 15 693.1 9 522 088.8 8 809 741.5 15 907.3
548 794.6 53 182.3 14 275.0 269 155.8 152 742.1 27 937.1 31 502.3 5 015 517.6 4 071 368.2 17 946.5
4 444 671.2 500 855.4 166 346.8 2 278 183.9 649 624.0 792 087.7 57 573.4 69 512 159.1 67 768 551.4 50 509.3
4 579 531.3 211 160.9 11 170.7 2 090 593.6 942 573.9 451 320.9 872 711.3 58 908 720.0 55 596 903.7 62 808.7
1 123 925.0 21 103.8 2 550.0 690 516.2 380 705.4 25 713.1 3 336.5 20 771 656.4 20 273 614.2 6 403.5
162 730.5 52 400.0 2 140.0 77 993.5 23 834.2 5 962.1 400.7 1 223 100.7 979 690.8 2 743.6
11 905 397.8 930 197.3 209 300.7 7 857 062.7 2 886 899.4 7 655.5 14 282.2 169 288 185.7 160 899 121.3 395 714.1
79 378.0 35 672.0 43 706.0 2 061 787.5 1 752 038.3 216 946.0
4 171 174.1 748 684.8 19 161.5 2 966 696.4 419 446.9 5 314.5 11 870.0 57 860 399.8 55 141 530.4 74 654.5
1 729 041.1 144 979.5 166 676.6 902 078.5 515 306.5 22 896 827.5 21 635 545.0 30 003.8
5 916 624.6 861.0 23 462.6 3 936 341.8 1 951 206.0 2 341.0 2 412.2 86 422 130.4 82 328 186.3 74 032.2
2 908 023.7 3 047.6 254 142.6 91 993.2 2 549 051.0 9 789.3 12 024 735.1 10 709 515.7 26 556.8
54 038.3 3 047.6 20 527.3 7 599.0 15 953.6 6 910.8 1 239 579.8 1 108 467.6 2 387.8
1 543.8 1 257.9 285.9 9 290.7 6 815.9
2 674 095.1 158 823.8 2 514 952.5 318.8 10 442 817.1 9 342 998.7 22 305.1
16 036.8 16 036.8 148 433.6 112 462.8 730.2
1 656 687.2 27 950.1 29 293.0 262 354.9 4 051.1 12 871.6 1 320 166.5 15 337 006.5 14 503 547.4 15 204.5
506 963.3 27 950.1 29 293.0 222 361.1 3 510.2 10 900.2 212 948.7 3 580 565.3 3 423 351.2 2 934.3
2 635.9 2 000.0 540.9 66.5 28.5 72 570.2 68 864.1 114.3
1 128 492.0 31 988.7 1 020.0 1 095 483.3 10 317 682.2 9 671 313.1 11 204.4
9 496.1 2 300.1 7 196.0 130 655.4 118 674.3 186.3
1 673 462.9 894 899.0 163 226.8 594 390.9 15 032.9 5 913.3 23 941 667.9 22 669 415.3 271 870.5
429 923.1 2 000.0 13 380.0 357 000.1 55 793.0 1 750.0 4 783 137.0 4 665 477.9 2 489.3
8 013 626.9 4 305.0 31 165.4 5 339 998.4 2 624 057.6 4 634.2 9 466.3 116 726 644.7 110 931 745.1 100 737.5
2 730 301.8 2 175.0 173 436.4 910.0 2 547 281.3 6 499.1 11 704 865.5 10 446 987.8 25 230.0
1 194 570.7 70 891.3 1 778.9 1 121 900.5 11 870 631.1 11 189 719.0 12 440.7
2 428 223.3 57 816.0 30 821.5 1 837 843.1 287 150.2 14 133.7 200 458.8 27 622 981.1 26 208 839.3 24 707.4
1 413 669.0 141 087.5 18 673.5 781 418.0 382 571.0 58 688.4 31 230.6 25 119 744.8 23 368 987.5 164 420.9

254
项 目 Item
非流动负债合计Total Non-
working Liabilities
负债合计Total
Liabilities
所有者权益合计Total
Owner'sEguities
连锁总店 General Chain Stores 26 510.4 2 243 859.0 781 615.0
连锁门店 Chain Stores 168 915.3 95 437.1
其他 Others 5 049 613.9 88 451 862.5 24 512 002.9
二、零售业 Retail Trade Sector 1 432 549.6 11 774 736.4 7 211 965.6
1.按零售行业小类分组 Grouped by Sector
综合零售 Integrated Retail 961 451.1 3 347 514.5 2 822 050.9
食品、饮料及烟草制品专门零售 Special Retail of Foods, Beverages&Tobaccos 3 533.8 481 126.8 511 512.1
纺织、服装及日用品专门零售 Special Retail of Textile, Garments and Daily-use Articles 101 960.4 1 532 303.5 968 076.4
文化、体育用品及器材专门零售 Special Retail of Cultural and Sports Goods and Appliances 56 733.4 463 083.9 251 509.1
医药及医疗器材专门零售 Special Retail of Medicine and Medical Appliances 14 102.6 307 846.1 12 410.7
汽车、摩托车、燃料及零配件专门零售 Special Retail of Automobiles, Motorcycles, Fuels and Related Accessories 78 900.0 3 599 462.3 1 668 026.3
家用电器及电子产品专门零售 Special Retail of Household Electrical Appliances and Electronic Products 133 341.1 1 256 486.6 304 881.7
五金、家具及室内装修材料专门零售 Special Retail of Hardware, Furniture and lndoor Decoration Materials 77 972.0 313 295.5 156 011.9
无店铺及其他零售 Retail without Shops and Other 4 555.2 473 617.2 517 486.5
2.按登记注册类型分组 Grouped by Registration
内资企业 Civil Funded 442 772.5 7 926 919.0 3 987 823.0
国有企业 State-owned 32 230.4 84 335.4 111 131.8
集体企业 Collective-owned 106.5 8 807.3 1 965.8
股份合作企业 Share-holding Cooperative Enterprise
联营企业 Joint Ownership 18 915.0 26 745.0 252.4
有限责任公司 Limited Liabilities Companies 109 661.1 3 750 481.1 2 278 817.3
股份有限公司 Share-holding Limited Companies 5 745.6 210 254.9 306 832.6
私营企业 Private-owned 276 113.9 3 846 295.3 1 288 823.1
港、澳、台商投资企业 Funded by Entrepreneur from Hong Kong, Macao and Taiwan 802 926.9 2 865 381.4 2 510 307.6
外商投资企业 Foreign-funded 186 850.2 982 436.0 713 835.0
3.按控股情况分组 Grouped by Holding Condition
国有控股 State-controlled 220 710.4 1 145 167.1 2 377 461.1
集体控股 Collective-controlled 58 669.9 31 207.9
私人控股 Private-controlled 379 908.7 6 114 558.9 2 579 313.6
港澳台商控股 Controlled by Entrepreneur from Hong Kong,Macao and Taiwan 613 025.0 2 036 656.4 1 636 272.8
外商控股 Foreign-funded-controlled 23 078.9 911 317.4 151 563.2
其他 Others 195 826.6 1 508 366.7 436 147.0
4.按经营形式分组 Grouped by Business Forms
独立门店 Independent Stores 388 572.3 4 156 935.7 2 091 797.3
连锁总店 General Chain Stores 30 410.3 2 041 117.6 1 383 604.7
连锁门店 Chain Stores 182 579.1 960 520.4 1 143 816.9
其他 Other 830 987.9 4 616 162.7 2 592 746.7
5.按零售业态分组 Grouped by Retail Format
有店铺零售 Store-based Retailing 1 223 982.9 10 194 299.2 6 371 747.5
无店铺零售 Non-Store Retailing 208 566.7 1 580 437.2 840 218.1
单位:万元
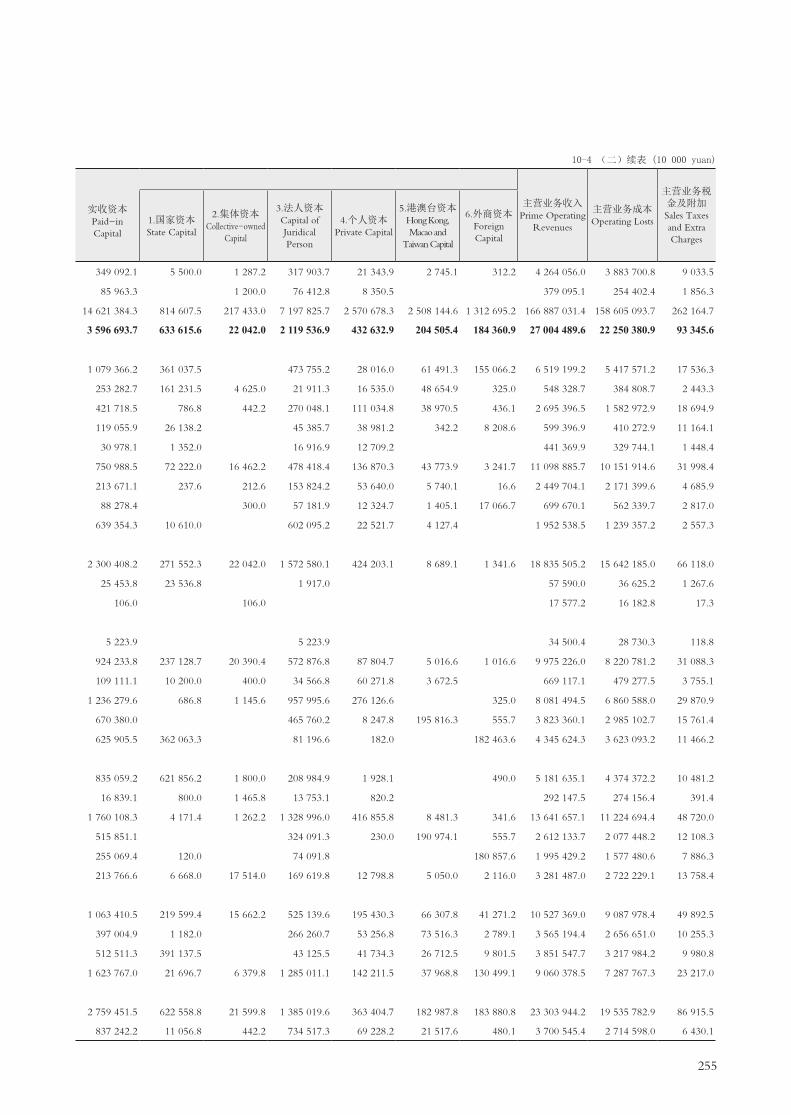
255
10-4 (二)续表 (10 000 yuan)
实收资本Paid-in Capital
主营业务收入Prime Operating
Revenues
主营业务成本Operating Losts
主营业务税金及附加Sales Taxes and Extra Charges
1.国家资本State Capital
2.集体资本Collective-owned
Capital
3.法人资本Capital of Juridical Person
4.个人资本Private Capital
5.港澳台资本Hong Kong, Macao and
Taiwan Capital
6.外商资本Foreign Capital
349 092.1 5 500.0 1 287.2 317 903.7 21 343.9 2 745.1 312.2 4 264 056.0 3 883 700.8 9 033.5
85 963.3 1 200.0 76 412.8 8 350.5 379 095.1 254 402.4 1 856.3
14 621 384.3 814 607.5 217 433.0 7 197 825.7 2 570 678.3 2 508 144.6 1 312 695.2 166 887 031.4 158 605 093.7 262 164.7
3 596 693.7 633 615.6 22 042.0 2 119 536.9 432 632.9 204 505.4 184 360.9 27 004 489.6 22 250 380.9 93 345.6
1 079 366.2 361 037.5 473 755.2 28 016.0 61 491.3 155 066.2 6 519 199.2 5 417 571.2 17 536.3
253 282.7 161 231.5 4 625.0 21 911.3 16 535.0 48 654.9 325.0 548 328.7 384 808.7 2 443.3
421 718.5 786.8 442.2 270 048.1 111 034.8 38 970.5 436.1 2 695 396.5 1 582 972.9 18 694.9
119 055.9 26 138.2 45 385.7 38 981.2 342.2 8 208.6 599 396.9 410 272.9 11 164.1
30 978.1 1 352.0 16 916.9 12 709.2 441 369.9 329 744.1 1 448.4
750 988.5 72 222.0 16 462.2 478 418.4 136 870.3 43 773.9 3 241.7 11 098 885.7 10 151 914.6 31 998.4
213 671.1 237.6 212.6 153 824.2 53 640.0 5 740.1 16.6 2 449 704.1 2 171 399.6 4 685.9
88 278.4 300.0 57 181.9 12 324.7 1 405.1 17 066.7 699 670.1 562 339.7 2 817.0
639 354.3 10 610.0 602 095.2 22 521.7 4 127.4 1 952 538.5 1 239 357.2 2 557.3
2 300 408.2 271 552.3 22 042.0 1 572 580.1 424 203.1 8 689.1 1 341.6 18 835 505.2 15 642 185.0 66 118.0
25 453.8 23 536.8 1 917.0 57 590.0 36 625.2 1 267.6
106.0 106.0 17 577.2 16 182.8 17.3
5 223.9 5 223.9 34 500.4 28 730.3 118.8
924 233.8 237 128.7 20 390.4 572 876.8 87 804.7 5 016.6 1 016.6 9 975 226.0 8 220 781.2 31 088.3
109 111.1 10 200.0 400.0 34 566.8 60 271.8 3 672.5 669 117.1 479 277.5 3 755.1
1 236 279.6 686.8 1 145.6 957 995.6 276 126.6 325.0 8 081 494.5 6 860 588.0 29 870.9
670 380.0 465 760.2 8 247.8 195 816.3 555.7 3 823 360.1 2 985 102.7 15 761.4
625 905.5 362 063.3 81 196.6 182.0 182 463.6 4 345 624.3 3 623 093.2 11 466.2
835 059.2 621 856.2 1 800.0 208 984.9 1 928.1 490.0 5 181 635.1 4 374 372.2 10 481.2
16 839.1 800.0 1 465.8 13 753.1 820.2 292 147.5 274 156.4 391.4
1 760 108.3 4 171.4 1 262.2 1 328 996.0 416 855.8 8 481.3 341.6 13 641 657.1 11 224 694.4 48 720.0
515 851.1 324 091.3 230.0 190 974.1 555.7 2 612 133.7 2 077 448.2 12 108.3
255 069.4 120.0 74 091.8 180 857.6 1 995 429.2 1 577 480.6 7 886.3
213 766.6 6 668.0 17 514.0 169 619.8 12 798.8 5 050.0 2 116.0 3 281 487.0 2 722 229.1 13 758.4
1 063 410.5 219 599.4 15 662.2 525 139.6 195 430.3 66 307.8 41 271.2 10 527 369.0 9 087 978.4 49 892.5
397 004.9 1 182.0 266 260.7 53 256.8 73 516.3 2 789.1 3 565 194.4 2 656 651.0 10 255.3
512 511.3 391 137.5 43 125.5 41 734.3 26 712.5 9 801.5 3 851 547.7 3 217 984.2 9 980.8
1 623 767.0 21 696.7 6 379.8 1 285 011.1 142 211.5 37 968.8 130 499.1 9 060 378.5 7 287 767.3 23 217.0
2 759 451.5 622 558.8 21 599.8 1 385 019.6 363 404.7 182 987.8 183 880.8 23 303 944.2 19 535 782.9 86 915.5
837 242.2 11 056.8 442.2 734 517.3 69 228.2 21 517.6 480.1 3 700 545.4 2 714 598.0 6 430.1

256
单位:万元
10-4 限额以上批发和零售业法人单位主要财务状况综合表(三)(2017年)
MAIN FINANCIAL INDICATORS OF WHOLESALE AND RETAIL SALES ABOVE THE
SET SCALE III(2017)
项 目 Item
其他业务利润Profits
from Other Business
销售费用Sale
Expenses
管理费用Management
Expenses
总 计 Total 993 835.6 7 951 292.4 4 431 115.6
一、批发业 Wholesale Trade 625 747.7 4 832 261.8 3 348 200.5
1.按批发行业分组 Grouped by Sector
农畜产品批发 Livestock products wholesale 3 186.4 57 781.3 29 478.4
食品、饮料及烟草制品批发 Wholesale of Foods, Beverages&Tobaccos 19 510.9 857 727.1 500 879.9
纺织、服装及日用品批发 Wholesale of Textiles, Garments and Daily-use Products 10 768.2 635 359.4 342 461.5
文化、体育用品及器材批发 Wholesale of Cultural and Sports Articles and Appliances 10 493.8 256 097.4 214 634.5
医药及医疗器材批发 Wholesale of Medicine and Medical Appliances 21 947.7 655 325.3 184 857.2
矿产品、建材及化工产品批发 Wholesale of Mineral Products, Building Material and Chemical Products 34 743.7 581 728.0 527 223.6
机械设备、五金交电及电子产品批发 Wholesale of Mechanical Equipment,Hardware and Electronic Products 513 671.2 1 537 567.6 1 322 222.4
贸易经纪与代理 Trade Broker and Agent 8 104.7 104 071.6 162 233.4
其他批发 Other Wholesales 3 321.1 146 604.1 64 209.6
2.按登记注册类型分组 Grouped by Registration Status
内资企业 Domestic-funded 371 327.0 3 663 043.3 2 405 660.2
国有企业 State-owned 1 630.7 23 384.6 40 033.7
集体企业 Collective-owned
股份合作企业 Share-holding Cooperative Enterprises
联营企业 Joint Ownership
有限责任公司 Limited Liabilities Companies 143 420.9 1 370 986.3 571 458.7
股份有限公司 Share-holding Limited Companies 10 666.1 408 209.4 327 446.3
私营企业 Private-owned 215 609.3 1 856 626.1 1 465 578.5
港、澳、台商投资企业 Funded by Entrepreneur from Hong Kong,Macao and Taiwan 24 731.9 693 528.4 446 459.5
合资经营企业(港或澳、台资) Joint-venture(Hong Kong,Macao and Taiwan) 3 494.8 78 186.6 46 136.0
合作经营企业(港或澳、台资) Cooperative(Hong Kong,Macao and Taiwan) 1 507.5 1 042.5
港、澳、台商独资经营企业 Enterprises with Sole Funds(Hong Kong,Macao and Taiwan) 20 665.2 577 708.7 377 255.7
港、澳、台商投资股份有限公司 Share-holding Corporations Ltd(Hong Kong,Macao and Taiwan) 344.3 21 340.7 14 380.4
外商投资企业 Foreign-funded 229 688.8 475 690.1 496 080.8
中外合资经营企业 Jointly-owned 8 502.3 83 091.7 50 281.5
中外合作经营企业 Cooperatively-owned - 13.3 400.2 2 109.5
外资企业 Exclusively Foreign-owned 217 388.3 378 166.0 431 796.8
外商投资股份有限公司 Foreign-funded Investment Companies Limited 934.2 5 101.9 3 965.1
3.按控股情况分组 Grouped by Holding Condition
国有控股 State-controlled 7 854.4 321 072.1 263 049.3
集体控股 Collective-controlled 4 569.3 51 818.3 32 128.1
私人控股 Private-controlled 244 542.4 2 530 361.4 1 919 644.2
港澳台商控股 Controlled by Entrepreneur from Hong Kong,Macao and Taiwan 23 497.5 673 700.3 428 651.3
外商控股 Foreign-funded-controlled 219 068.1 394 937.4 446 078.6
其他 Others 126 216.0 860 372.3 258 649.0
4.按经营形式分组 Grouped by Business Forms
独立门店 Independent Stores 64 012.3 884 889.5 439 492.9

257
(10 000 yuan)
财务费用Financial Expenses
营业利润Operating
profits
投资收益Profits of
Investment
营业外收入
Non-operating Income
利润总额Total Profits
应交所得税
Total Payable Tax
应付职工薪酬Total Wages
Payable
本年应交增值税
Total Value-added Payable
从业人员期末人数(人)
Average EmployedPersons
(Persons)
利息支出Interest Expense
1 189 197.3 1 024 603.0 3 147 925.9 867 703.9 287 749.6 3 443 215.3 756 657.2 4 517 772.0 2 194 684.0 507 841
1 066 481.7 930 268.5 2 074 638.4 712 127.2 212 321.9 2 171 222.8 496 553.0 3 084 048.7 1 507 585.3 308 555
24 207.3 22 537.6 46 723.4 9 993.8 1 353.2 47 859.1 6 738.1 24 367.1 15 338.8 3 515
17 109.4 30 276.5 359 344.2 124 237.3 49 135.7 410 647.5 86 652.2 480 503.6 187 684.2 54 687
39 119.7 21 058.9 176 589.2 273.3 23 725.6 186 537.7 44 087.0 401 650.6 130 474.1 42 289
84 406.6 59 429.9 156 017.1 - 3 719.2 15 600.2 159 315.4 44 676.5 189 579.3 91 611.9 25 173
18 546.7 26 814.4 266 447.3 128 208.1 4 949.9 258 823.5 37 415.3 224 669.4 132 541.8 25 548
310 953.7 337 939.7 343 129.5 125 702.7 25 951.3 360 670.9 99 340.2 560 813.8 577 190.9 38 037
319 822.6 231 130.4 599 886.7 198 319.9 75 334.4 591 041.3 139 813.9 1 058 021.1 315 566.7 103 754
233 090.8 166 722.5 101 493.6 122 038.6 10 705.7 126 565.6 29 438.5 84 513.6 34 377.1 9 122
19 224.9 34 358.6 25 007.4 7 072.7 5 565.9 29 761.8 8 391.3 59 930.2 22 799.8 6 430
1 008 457.1 819 211.8 1 599 769.9 493 026.2 149 607.8 1 641 049.0 366 868.0 2 114 269.0 1 234 314.8 252 026
- 3 654.1 1 053.8 36 806.3 4 156.0 4 470.1 34 917.2 9 172.2 37 409.5 45 433.2 1 315
332 401.3 344 433.3 478 474.6 171 696.3 48 162.9 507 703.7 146 028.2 574 933.7 486 976.6 60 685
220 804.2 121 600.2 418 504.6 148 287.7 26 896.4 456 999.5 58 302.9 327 568.7 108 076.4 29 068
458 756.9 352 087.9 661 144.0 164 386.2 70 057.6 636 571.7 153 291.8 1 173 007.6 593 340.9 160 791
13 545.6 68 389.1 279 211.9 50 581.0 30 833.9 295 670.9 79 256.3 447 807.7 214 773.8 35 535
5 268.0 5 546.0 9 560.8 1 318.3 9 531.4 16 207.2 6 778.6 57 001.4 19 016.4 3 796
2.2 - 77.4 4.4 - 78.8 1 229.8 79
- 2 861.9 48 999.3 232 845.7 16 696.3 21 090.8 242 625.4 71 167.9 376 081.7 183 809.9 30 409
- 362.1 126.5 1 936.3 12.2 187.7 2 030.5 1 092.0 8 434.9 5 941.0 770
44 479.0 42 667.6 195 656.6 168 520.0 31 880.2 234 502.9 50 428.7 521 972.0 58 496.7 20 994
27 393.2 24 788.2 91 622.9 13 851.9 2 682.8 94 418.6 16 400.5 214 541.9 - 1 902.1 5 442
- 11.4 15.6 1 071.7 44.7 1 115.9 420.7 1 110.4 265.2 82
18 021.6 15 225.6 99 998.7 154 662.2 28 428.4 134 567.9 32 338.3 294 508.9 57 948.3 14 438
288.7 11.4 138.7 53.5 763.9 247.9 3 056.9 1 580.6 580
65 328.7 145 992.2 470 064.6 213 220.3 19 044.5 481 980.1 114 434.4 469 775.5 201 061.2 21 351
13 719.1 22 760.3 37 381.3 12 179.4 624.1 38 752.5 6 144.9 23 588.3 11 656.4 1 913
802 669.4 551 004.0 959 456.6 216 724.3 92 687.5 930 543.4 220 362.7 1 540 565.5 747 409.5 198 967
- 573.3 50 198.6 238 815.3 17 141.1 30 771.0 263 259.9 77 531.5 438 461.0 207 664.5 34 676
18 087.9 18 087.6 99 344.9 152 308.2 34 895.2 138 884.9 33 543.5 306 178.1 61 017.5 15 668
167 249.9 142 225.8 269 575.7 100 553.9 34 299.6 317 802.0 44 536.0 305 480.3 278 776.2 35 980
90 365.3 82 903.2 243 282.5 30 308.6 19 381.7 258 097.4 69 732.7 412 682.8 442 051.1 52 381

258
项 目 Item
其他业务利润Profits
from Other Business
销售费用Sale Expenses
管理费用Management
Expenses
连锁总店 General Chain Stores 6 317.1 268 270.9 55 887.3
连锁门店 Chain Stores 2 021.9 96 546.4 22 308.8
其他 Others 553 396.4 3 582 555.0 2 830 511.5
二、零售业 Retail Trade Sector 368 087.9 3 119 030.6 1 082 915.1
1.按零售行业小类分组 Grouped by Sector
综合零售 Integrated Retail 231 977.9 871 974.0 189 802.4
食品、饮料及烟草制品专门零售 Special Retail of Foods, Beverages&Tobaccos 2 400.7 88 924.5 37 989.5
纺织、服装及日用品专门零售 Special Retail of Textile, Garments and Daily-use Articles 25 097.1 716 298.0 212 745.6
文化、体育用品及器材专门零售 Special Retail of Cultural and Sports Goods and Appliances 1 838.3 91 435.1 55 392.5
医药及医疗器材专门零售 Special Retail of Medicine and Medical Appliances 3 681.6 98 198.4 18 951.3
汽车、摩托车、燃料及零配件专门零售 Special Retail of Automobiles, Motorcycles, Fuels and Related Accessories 74 784.3 453 981.8 262 767.5
家用电器及电子产品专门零售 Special Retail of Household Electrical Appliances and Electronic Products 18 084.2 216 901.3 198 598.1
五金、家具及室内装修材料专门零售 Special Retail of Hardware, Furniture and lndoor Decoration Materials 4 716.3 56 150.7 32 716.3
无店铺及其他零售 Retail without Shops and Other 5 507.5 525 166.8 73 951.9
2.按登记注册类型分组 Grouped by Registration
内资企业 Civil Funded 164 949.5 2 039 991.0 797 469.6
国有企业 State-owned 1 597.3 1 497.4 14 869.1
集体企业 Collective-owned 852.1 12.1
股份合作企业 Share-holding Cooperative Enterprise
联营企业 Joint Ownership 599.0 2 081.7
有限责任公司 Limited Liabilities Companies 85 716.5 1 142 379.3 289 158.4
股份有限公司 Share-holding Limited Companies 12 664.0 140 119.4 33 915.6
私营企业 Private-owned 64 971.7 754 543.8 457 432.7
港、澳、台商投资企业 Funded by Entrepreneur from Hong Kong, Macao and Taiwan 77 843.6 603 245.6 169 504.3
外商投资企业 Foreign-funded 125 294.8 475 794.0 115 941.2
3.按控股情况分组 Grouped by Holding Condition
国有控股 State-controlled 25 991.7 490 701.6 135 969.6
集体控股 Collective-controlled 1 273.3 8 004.3 2 699.8
私人控股 Private-controlled 112 463.7 1 621 354.4 649 185.3
港澳台商控股 Controlled by Entrepreneur from Hong Kong,Macao and Taiwan 46 843.5 406 515.1 126 130.3
外商控股 Foreign-funded-controlled 120 217.8 284 760.8 61 826.8
其他 Others 61 297.9 307 694.4 107 103.3
4.按经营形式分组 Grouped by Business Forms
独立门店 Independent Stores 117 965.7 752 771.6 352 191.7
连锁总店 General Chain Stores 71 514.1 668 643.6 172 503.5
连锁门店 Chain Stores 7 369.8 481 058.3 120 314.9
其他 Other 171 238.3 1 216 557.1 437 905.0
5.按零售业态分组 Grouped by Retail Format
有店铺零售 Store-based Retailing 360 350.5 2 421 119.0 806 557.8
无店铺零售 Non-Store Retailing 7 737.4 697 911.6 276 357.3
单位:万元

259
10-4 (三)续表 (10 000 yuan)
财务费用Financial Expenses
营业利润Operating
profits
投资收益Profits of
Investment
营业外收入
Non-operating Income
利润总额Total Profits
应交所得税
Total Payable Tax
应付职工薪酬Total Wages
Payable
本年应交增值税
Total Value-added Payable
从业人员期末人数(人)
Average EmployedPersons
(Persons)
利息支出Interest Expense
11 154.5 10 013.0 89 220.0 33 922.1 3 557.8 110 618.1 19 655.1 69 644.7 62 583.4 6 436
1 257.2 537.6 2 803.4 - 615.5 1 101.5 3 661.4 363.6 44 476.5 8 277.1 5 754
963 704.7 836 814.7 1 739 332.5 648 512.0 188 280.9 1 798 845.9 406 801.6 2 557 244.7 994 673.7 243 984
122 715.6 94 334.5 1 073 287.5 155 576.7 75 427.7 1 271 992.5 260 104.2 1 433 723.3 687 098.7 199 286
28 272.2 43 244.0 286 041.1 47 924.9 19 707.2 296 111.8 80 092.3 385 279.9 83 230.9 58 391
1 036.5 46.7 61 640.1 13 341.9 2 560.1 66 867.4 15 993.4 43 912.3 9 437.1 7 876
11 123.9 7 969.6 153 967.0 7 716.5 11 694.4 155 171.6 36 062.4 358 865.2 131 898.3 54 078
2 145.9 1 276.0 50 784.1 9 010.6 3 497.3 53 241.0 10 697.4 61 988.8 12 990.5 10 155
2 162.0 442.1 - 5 429.5 - 62.8 1 408.2 20 418.9 3 848.2 42 736.6 11 497.0 7 517
54 135.2 29 250.3 349 631.8 78 856.1 25 579.3 358 297.0 71 423.0 319 397.6 389 417.2 36 004
14 065.5 5 184.7 32 538.4 - 1 453.5 5 816.8 37 153.2 10 093.3 94 633.4 30 596.6 10 937
- 179.8 1 331.9 43 470.5 - 810.2 853.8 180 541.2 7 733.4 30 159.5 10 610.7 3 346
9 954.2 5 589.2 100 644.0 1 053.2 4 310.6 104 190.4 24 160.8 96 750.0 7 420.4 10 982
94 807.1 51 214.7 699 071.3 103 771.5 50 498.6 765 223.0 171 930.7 934 153.0 399 994.8 128 487
- 756.6 8.1 12 724.1 8 789.7 1 583.2 14 030.9 285.6 9 708.0 938.4 2 079
36.4 476.4 461.7 25.3 408.7 267.0 104
12.9 21.7 3 006.3 50.1 3 036.5 929.7 12 325.4 800.2 1 297
47 561.7 25 626.2 441 697.8 68 764.0 16 196.3 477 012.0 106 053.6 408 225.2 205 855.6 52 683
101.2 937.7 37 183.7 12 626.7 2 734.2 38 786.3 6 647.6 72 621.3 8 651.0 8 110
47 851.5 24 621.0 203 983.0 13 591.1 29 934.8 231 895.6 57 988.9 430 864.4 183 482.6 64 214
7 325.6 33 186.0 222 382.5 51 674.3 12 633.9 213 084.3 48 245.9 283 593.9 120 970.1 34 595
20 582.9 9 933.8 151 833.7 130.9 12 295.2 293 685.2 39 927.6 215 976.4 166 133.8 36 204
17 374.0 13 002.2 293 352.6 108 070.1 15 304.1 302 224.0 49 984.1 281 568.6 71 179.1 35 215
384.3 137.8 7 796.1 300.0 8 072.1 2 224.9 4 363.3 2 024.5 552
81 252.0 43 740.6 368 751.4 24 257.5 42 061.3 409 481.3 100 733.2 701 606.8 263 613.3 96 916
11 719.0 20 781.7 98 895.5 21 919.4 7 890.5 87 851.1 22 461.8 177 758.4 102 886.1 24 800
705.5 603.5 112 016.6 123.7 3 362.8 246 734.0 32 026.0 116 896.0 50 308.6 19 533
11 280.8 16 068.7 192 475.3 1 206.0 6 509.0 217 630.0 52 674.2 151 530.2 197 087.1 22 270
43 478.3 39 543.6 487 236.2 50 234.8 29 993.0 643 156.8 109 133.1 459 736.0 360 524.1 61 060
12 201.6 9 768.3 149 875.7 30 764.6 13 929.8 168 312.2 32 875.8 302 109.5 80 311.5 38 611
22 686.2 10 143.8 89 186.2 45 552.8 12 556.6 98 344.4 14 034.4 233 254.2 60 686.9 40 202
44 349.5 34 878.8 346 989.4 29 024.5 18 948.3 362 179.1 104 060.9 438 623.6 185 576.2 59 413
99 180.1 84 645.3 934 181.4 157 622.8 68 619.1 1 121 997.5 224 296.2 1 264 240.9 647 793.7 180 175
23 535.5 9 689.2 139 106.1 - 2 046.1 6 808.6 149 995.0 35 808.0 169 482.4 39 305.0 19 111

260
项 目 Item
法人企业数(个)
Number of Corporative Enterprises
(unit)
流动资产合计
Total Current Assets
应收帐款Accounts Payable
总 计 Total 924 3 447 913.8 203 287.0
一、住宿业 Hotels 337 2 346 017.6 95 363.8
1.按住宿行业分组 Grouped by Sector
旅游饭店 Tour Restaurant 208 1 933 495.8 64 239.0
一般旅馆 General Restaurant 113 288 309.4 30 257.1
其他住宿服务 Other Hotel Services 16 124 212.4 867.7
2.按登记注册类型分组 Grouped by Registration Status
内资企业 Domestic-funded 290 1 727 396.7 72 167.7
国有企业 State-owned 11 55 499.8 7 679.2
集体企业 Collective-owned 3 2 878.7 157.1
股份合作企业 Share-holding Cooperative Enterprise
联营企业 Joint Ownership 2 6 505.2 558.9
有限责任公司 Limited Liabilities Companies 120 1 198 269.3 25 432.9
股份有限公司 Share-holding Limited Companies 11 130 150.3 3 774.0
私营企业 Private-owned 142 334 023.4 34 559.6
港、澳、台商投资企业 Funded by Entrepreneur from Hong Kong,Macao and Taiwan 29 237 902.2 16 649.1
合资经营企业(港或澳、台资) Joint-venture(Hong Kong,Macao and Taiwan) 6 40 754.7 4 015.7
合作经营企业(港或澳、台资) Cooperative(Hong Kong,Macao and Taiwan) 5 71 295.6 1 683.8
港、澳、台商独资经营企业 Enterprises with Sole Funds(Hong Kong,Macao and Taiwan) 17 104 893.5 10 947.7
港、澳、台商投资股份有限公司 Share-holding Corporations Ltd(Hong Kong,Macao and Taiwan) 1 20 958.4 1.9
外商投资企业 Foreign-funded 18 380 718.7 6 547.0
中外合资经营企业 Jointly-owned 10 315 605.1 3 958.1
中外合作经营企业 Cooperatively-owned 2 21 570.1 494.6
外资企业 Exclusively Foreign-owned 5 40 049.2 1 431.8
外商投资股份有限公司 Foreign-funded Investment Companies Limited
3.按控股情况分组 Grouped by Holding Condition
国有控股 State-controlled 51 261 478.8 17 626.1
集体控股 Collective-controlled 6 3 432.2 217.9
私人控股 Private-controlled 185 1 061 659.1 43 168.1
港澳台商控股 Controlled by Entrepreneur from Hong Kong,Macao and Taiwan 28 363 587.4 18 411.9
外商控股 Foreign-funded-controlled 9 173 200.3 1 139.1
其他 Others 58 482 659.8 14 800.7
4.按经营形式分组 Grouped by Business Forms
独立门店 Independent Stores 271 2 019 220.6 81 972.0
连锁总店 General Chain Stores 4 50 090.1 851.3
连锁门店 Chain Stores 23 164 774.5 3 353.5
其他 Other 39 111 932.4 9 187.0
5.按星级分组 Grouped by Star Rating
五星 Five Star 26 982 005.8 21 159.3
四星 Four Star 40 310 654.1 23 983.5
三星 Three Star 54 128 834.2 17 388.1
10-5 限额以上住宿和餐饮业法人企业主要财务状况综合表 (一)(2017年)
MAIN FINANCIAL INDICAFORS OF ENTERPRISE ABOVE DESIGNATED SIZE OF
HOTELS AND CATERING SERVICESⅠ(2017)单位:万元

261
存货Inventory
固定资产合计
Total Fixed Assets
固定资产原价Original Value of
Fixed Assets
累计折旧Accumulative Depreciation
资产总计Total Assets
流动负债合计Total Current
Liabilities
应付帐款Accounts Payable
本年折旧Depreciation of the
Year
166 847.5 1 355 147.1 2 586 449.3 1 296 464.0 94 136.5 5 732 216.6 2 833 704.8 361 424.4
117 037.2 1 078 077.4 2 020 080.1 993 679.9 63 671.7 4 080 146.4 1 814 923.3 177 164.9
113 799.1 961 335.2 1 803 475.5 891 483.6 54 960.1 3 430 160.1 1 532 289.6 157 671.1
2 482.3 70 802.1 155 584.8 86 932.6 5 813.1 469 020.0 255 029.9 16 997.5
755.8 45 940.1 61 019.8 15 263.7 2 898.5 180 966.3 27 603.8 2 496.3
111 293.8 800 941.9 1 345 427.9 595 911.0 45 847.3 2 987 523.5 1 367 805.0 129 839.8
2 554.9 76 062.6 170 243.6 94 181.0 5 158.3 159 718.2 64 696.6 4 395.9
57.8 201.3 347.6 223.1 -28.7 3 104.2 2 701.9
146.6 807.7 807.7 584.8 78.3 10 211.5 1 371.7 15.2
5 631.3 551 318.4 824 715.0 321 156.7 26 824.0 2 052 357.8 916 816.1 102 156.1
97 733.3 19 036.7 43 584.8 24 664.0 2 311.6 178 753.0 32 529.9 5 875.7
5 149.9 153 365.2 305 529.2 155 051.4 11 453.8 583 148.8 349 686.8 17 394.9
3 784.1 208 849.3 461 463.7 252 865.8 12 780.5 524 707.2 207 732.3 24 415.9
455.9 17 867.2 107 119.8 89 243.0 2 967.2 67 656.1 11 760.5 2 970.8
1 062.3 81 111.9 156 440.1 75 328.3 3 993.5 189 381.3 89 894.7 11 700.7
2 179.0 109 828.9 197 858.4 88 290.4 5 816.7 246 467.3 102 004.3 9 636.5
86.9 41.3 45.4 4.1 3.1 21 202.5 4 072.8 107.9
1 959.3 68 286.2 213 188.5 144 903.1 5 043.9 567 915.7 239 386.0 22 909.2
1 448.7 31 916.0 103 679.1 71 763.9 2 422.3 386 919.2 221 009.6 14 562.6
280.6 9 598.2 37 655.8 28 057.6 882.8 54 344.0 16 895.6 1 247.0
230.0 26 772.0 71 853.6 45 081.6 1 738.8 123 158.2 66 140.4 4 309.0
6 655.8 384 087.2 669 791.5 332 321.0 16 864.7 795 209.8 328 204.8 38 658.8
67.0 593.1 1 200.5 684.2 42.3 6 275.9 4 042.7 399.7
104 027.9 325 271.7 600 758.0 279 191.8 22 371.4 1 607 669.1 905 087.7 52 018.1
3 167.9 135 554.8 335 272.8 199 969.4 9 519.0 583 071.9 324 748.7 23 640.6
1 229.4 46 244.2 140 937.6 94 693.4 3 481.0 278 072.6 109 501.4 6 903.2
1 889.2 186 326.4 272 119.7 86 820.1 11 393.3 809 847.1 143 338.0 55 544.5
113 999.4 768 772.6 1 634 727.5 870 091.6 48 993.2 3 247 339.7 1 321 481.7 145 877.0
398.1 9 168.8 16 383.1 7 358.5 614.2 150 475.4 41 496.1 2 521.2
306.5 3 832.6 14 106.6 10 344.9 527.1 200 747.1 151 666.5 4 308.2
2 333.2 296 303.4 354 862.9 105 884.9 13 537.2 481 584.2 300 279.0 24 458.5
5 688.4 395 031.6 804 881.0 455 881.1 19 684.0 1 576 063.9 658 254.1 75 480.8
2 523.3 169 999.7 301 817.0 132 601.5 4 484.7 629 646.5 275 727.4 37 241.8
2 671.7 38 993.3 141 729.0 103 437.1 3 805.6 214 561.7 104 222.9 10 776.3
(10 000 yuan)
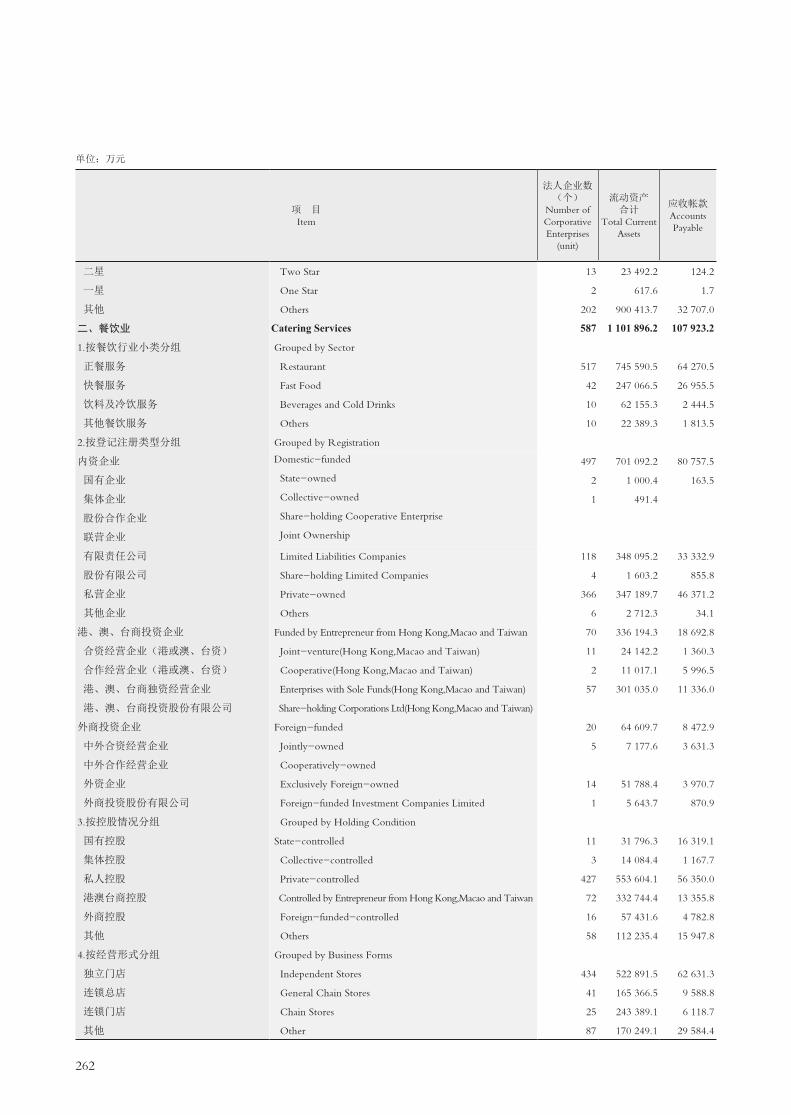
262
项 目 Item
法人企业数(个)
Number of Corporative Enterprises
(unit)
流动资产合计
Total Current Assets
应收帐款Accounts Payable
二星 Two Star 13 23 492.2 124.2
一星 One Star 2 617.6 1.7
其他 Others 202 900 413.7 32 707.0
二、餐饮业 Catering Services 587 1 101 896.2 107 923.2
1.按餐饮行业小类分组 Grouped by Sector
正餐服务 Restaurant 517 745 590.5 64 270.5
快餐服务 Fast Food 42 247 066.5 26 955.5
饮料及冷饮服务 Beverages and Cold Drinks 10 62 155.3 2 444.5
其他餐饮服务 Others 10 22 389.3 1 813.5
2.按登记注册类型分组 Grouped by Registration
内资企业 Domestic-funded 497 701 092.2 80 757.5
国有企业 State-owned 2 1 000.4 163.5
集体企业 Collective-owned 1 491.4
股份合作企业 Share-holding Cooperative Enterprise
联营企业 Joint Ownership
有限责任公司 Limited Liabilities Companies 118 348 095.2 33 332.9
股份有限公司 Share-holding Limited Companies 4 1 603.2 855.8
私营企业 Private-owned 366 347 189.7 46 371.2
其他企业 Others 6 2 712.3 34.1
港、澳、台商投资企业 Funded by Entrepreneur from Hong Kong,Macao and Taiwan 70 336 194.3 18 692.8
合资经营企业(港或澳、台资) Joint-venture(Hong Kong,Macao and Taiwan) 11 24 142.2 1 360.3
合作经营企业(港或澳、台资) Cooperative(Hong Kong,Macao and Taiwan) 2 11 017.1 5 996.5
港、澳、台商独资经营企业 Enterprises with Sole Funds(Hong Kong,Macao and Taiwan) 57 301 035.0 11 336.0
港、澳、台商投资股份有限公司 Share-holding Corporations Ltd(Hong Kong,Macao and Taiwan)
外商投资企业 Foreign-funded 20 64 609.7 8 472.9
中外合资经营企业 Jointly-owned 5 7 177.6 3 631.3
中外合作经营企业 Cooperatively-owned
外资企业 Exclusively Foreign-owned 14 51 788.4 3 970.7
外商投资股份有限公司 Foreign-funded Investment Companies Limited 1 5 643.7 870.9
3.按控股情况分组 Grouped by Holding Condition
国有控股 State-controlled 11 31 796.3 16 319.1
集体控股 Collective-controlled 3 14 084.4 1 167.7
私人控股 Private-controlled 427 553 604.1 56 350.0
港澳台商控股 Controlled by Entrepreneur from Hong Kong,Macao and Taiwan 72 332 744.4 13 355.8
外商控股 Foreign-funded-controlled 16 57 431.6 4 782.8
其他 Others 58 112 235.4 15 947.8
4.按经营形式分组 Grouped by Business Forms
独立门店 Independent Stores 434 522 891.5 62 631.3
连锁总店 General Chain Stores 41 165 366.5 9 588.8
连锁门店 Chain Stores 25 243 389.1 6 118.7
其他 Other 87 170 249.1 29 584.4
单位:万元

263
10-5 (一)续表 (10 000 yuan)
存货Inventory
固定资产合计
Total Fixed Assets
固定资产原价Original Value of
Fixed Assets
累计折旧Accumulative Depreciation
资产总计Total Assets
流动负债合计Total Current
Liabilities
应付帐款Accounts Payable
本年折旧Depreciation of the
Year
219.6 5 287.0 13 659.6 8 372.5 222.9 31 179.0 11 118.8 1 332.0
30.3 58.6 28.3 765.2 539.4 128.0
105 934.2 468 735.5 757 934.9 293 359.4 35 474.5 1 627 930.1 765 060.7 52 206.0
49 810.3 277 069.7 566 369.2 302 784.1 30 464.8 1 652 070.2 1 018 781.5 184 259.5
33 539.5 135 249.0 302 669.3 179 029.0 21 086.3 998 532.9 647 790.2 111 336.9
10 789.6 122 042.4 222 254.4 102 123.9 5 418.8 488 238.2 311 296.7 55 056.0
3 821.0 9 391.2 16 587.1 7 196.5 1 490.1 98 770.3 31 439.9 11 891.0
640.8 7 805.0 14 982.7 7 118.9 1 660.2 38 243.7 15 977.1 1 139.8
33 584.5 171 987.9 314 814.8 155 663.6 23 705.1 1 001 079.9 742 477.4 124 388.3
121.7 166.8 608.9 442.1 54.2 1 529.2 1 416.7 474.8
1.1 503.7 503.7 491.4 187.3 185.5
11 026.9 84 071.0 145 326.1 66 120.5 11 285.0 491 059.1 361 169.3 56 512.7
20.5 76.0 55.5 16.4 1 685.8 1 731.7 290.4
22 385.0 87 053.2 166 823.6 87 741.7 12 196.3 502 925.7 377 134.9 66 670.4
49.8 676.4 1 476.5 800.1 153.2 3 388.7 837.5 254.5
9 920.7 73 323.6 184 365.0 111 600.8 6 038.6 478 163.3 179 242.4 29 756.2
1 410.3 5 214.6 8 697.2 3 525.4 331.4 32 353.6 17 513.7 3 519.8
304.6 1 533.1 5 283.4 3 750.3 269.7 13 066.6 7 378.6 2 569.4
8 205.8 66 575.9 170 384.4 104 325.1 5 437.5 432 743.1 154 350.1 23 667.0
6 305.1 31 758.2 67 189.4 35 519.7 721.1 172 827.0 97 061.7 30 115.0
375.0 631.7 1 157.7 528.1 295.0 10 409.5 5 635.2 257.0
5 265.7 30 857.8 65 484.0 34 712.6 426.1 156 489.8 88 111.6 27 274.7
664.4 268.7 547.7 279.0 5 927.7 3 314.9 2 583.3
897.5 2 710.1 12 774.7 10 068.2 3 924.3 35 421.9 24 112.4 11 144.6
2 389.8 4 707.7 6 912.6 2 247.7 792.1 30 442.1 6 495.5 4 891.5
28 128.7 147 869.6 263 395.6 124 017.9 17 065.5 800 033.6 597 651.8 91 849.1
9 825.7 72 095.7 180 442.8 108 931.6 6 074.3 473 084.9 180 201.0 27 651.8
5 988.4 31 190.7 66 121.9 35 017.6 442.9 162 481.2 91 524.7 29 858.0
2 580.2 18 495.9 36 721.6 22 501.1 2 165.7 150 606.5 118 796.1 18 864.5
27 405.8 127 472.9 289 295.2 170 811.9 17 903.2 770 373.8 487 368.8 87 703.4
8 312.9 89 656.0 142 729.1 54 601.0 6 353.5 332 914.7 170 657.3 43 202.0
6 019.2 39 848.0 98 339.8 58 511.3 2 712.9 342 759.9 196 815.7 16 703.5
8 072.4 20 092.8 36 005.1 18 859.9 3 495.2 206 021.8 163 939.7 36 650.6

264
10-5 限额以上住宿和餐饮业法人企业主要财务状况综合表 (二)(2017年)
MAIN FINANCIAL INDICAFORS OF ENTERPRISE ABOVE DESIGNATED SIZE OF
HOTELS AND CATERING SERVICESⅡ(2017)单位:万元
项 目 Item
非流动负债合计
Total Non-working Liabilities
负债合计Total Liabilities
所有者权益合计
Total Owner'sEguities
总 计 Total 1 370 321.6 4 210 155.8 1 529 561.9
一、住宿业 Hotels 1 264 709.6 3 086 274.0 993 872.4
1.按住宿行业分组 Grouped by Sector
旅游饭店 Tour Restaurant 1 045 301.1 2 584 430.3 845 729.8
一般旅馆 General Restaurant 109 434.4 364 265.8 104 754.2
其他住宿服务 Other Hotel Services 109 974.1 137 577.9 43 388.4
2.按登记注册类型分组 Grouped by Registration Status
内资企业 Domestic-funded 1 065 981.9 2 440 428.0 547 095.5
国有企业 State-owned 2 058.2 66 754.8 92 963.4
集体企业 Collective-owned 2 701.9 402.3
股份合作企业 Share-holding Cooperative Enterprise
联营企业 Joint Ownership 1 371.8 8 839.7
有限责任公司 Limited Liabilities Companies 859 924.5 1 777 340.6 275 017.2
股份有限公司 Share-holding Limited Companies 26 911.3 59 441.2 119 311.8
私营企业 Private-owned 177 083.9 532 811.7 50 337.1
港、澳、台商投资企业 Funded by Entrepreneur from Hong Kong,Macao and Taiwan 73 259.5 280 991.8 243 715.4
合资经营企业(港或澳、台资) Joint-venture(Hong Kong,Macao and Taiwan) 8 200.0 19 960.5 47 695.6
合作经营企业(港或澳、台资) Cooperative(Hong Kong,Macao and Taiwan) 6 184.2 96 078.9 93 302.4
港、澳、台商独资经营企业 Enterprises with Sole Funds(Hong Kong,Macao and Taiwan) 40 917.7 142 922.0 103 545.3
港、澳、台商投资股份有限公司 Share-holding Corporations Ltd(Hong Kong,Macao and Taiwan) 17 957.6 22 030.4 - 827.9
外商投资企业 Foreign-funded 125 468.2 364 854.2 203 061.5
中外合资经营企业 Jointly-owned 106 880.1 327 889.7 59 029.5
中外合作经营企业 Cooperatively-owned 10 760.0 27 655.6 26 688.4
外资企业 Exclusively Foreign-owned 7 828.1 73 968.5 49 189.7
外商投资股份有限公司 Foreign-funded Investment Companies Limited
3.按控股情况分组 Grouped by Holding Condition
国有控股 State-controlled 59 574.5 388 379.4 406 830.4
集体控股 Collective-controlled 4 042.7 2 233.2
私人控股 Private-controlled 595 982.3 1 507 111.0 100 558.1
港澳台商控股 Controlled by Entrepreneur from Hong Kong,Macao and Taiwan 74 450.8 399 199.5 183 872.4
外商控股 Foreign-funded-controlled 104 553.3 214 054.7 64 017.9
其他 Others 430 148.7 573 486.7 236 360.4
4.按经营形式分组 Grouped by Business Forms
独立门店 Independent Stores 1 144 115.9 2 472 238.7 775 101.0
连锁总店 General Chain Stores 96 046.6 137 542.7 12 932.7
连锁门店 Chain Stores 3 831.5 155 498.0 45 249.1
其他 Other 20 715.6 320 994.6 160 589.6
5.按星级分组 Grouped by Star Rating
五星 Five Star 423 107.2 1 081 361.3 494 702.6
四星 Four Star 309 215.3 585 542.7 44 103.8
三星 Three Star 16 121.3 126 649.1 87 912.6

265
(10 000 yuan)
实收资本Paid-in Capital
主营业务收入Prime
Operating Revenues
主营业务成本Operating
Losts
主营业务税金及附加
Sales Taxes and Extra Charges
1.国家资本State Capital
2.集体资本Collective-owned
Capital
3.法人资本Capital of Juridical Person
4.个人资本Private Capital
5.港澳台资本Hong Kong, Macao and
Taiwan Capital
6.外商资本Foreign Capital
4 412 261.2 290 199.6 7 238.0 566 184.8 3 200 543.2 262 617.9 85 477.7 3 666 066.2 1 515 064.9 24 693.2
4 060 214.3 282 675.5 4 101.4 443 552.7 3 101 725.1 175 389.2 52 770.4 1 266 886.9 428 076.4 13 871.1
3 866 303.8 278 896.6 3 501.4 323 071.1 3 078 046.7 167 635.1 15 152.9 1 057 472.7 349 346.6 11 786.6
173 521.3 3 778.9 102 656.0 21 714.8 7 754.1 37 617.5 166 582.4 67 845.9 1 560.0
20 389.2 600.0 17 825.6 1 963.6 42 831.8 10 883.9 524.5
3 662 298.4 185 857.8 3 334.9 371 316.6 3 101 700.1 89.0 830 776.9 278 004.1 9 698.9
49 121.4 46 900.0 2 221.4 49 874.4 17 066.7 710.1
50.1 50.1 3 065.7 1 586.6 63.0
8 000.0 6 000.0 2 000.0 2 297.0 139.4 21.8
336 402.1 127 857.8 1 254.8 154 504.9 52 695.6 89.0 446 346.2 145 795.2 6 238.8
122 689.0 5 100.0 112 566.2 5 022.8 41 804.4 10 326.8 278.7
3 146 035.8 30.0 102 024.1 3 043 981.7 287 093.7 102 889.4 2 384.1
258 579.8 67 057.4 766.5 15 520.7 25.0 175 210.2 225 557.3 92 350.8 2 620.0
39 575.7 6 047.0 9 870.2 23 658.5 31 130.3 16 384.5 553.1
81 182.7 61 010.4 766.5 4 629.5 14 776.3 56 524.0 26 777.0 669.1
94 849.4 1 021.0 25.0 93 803.4 131 559.6 45 048.1 1 386.3
42 972.0 42 972.0 6 343.4 4 141.2 11.5
139 336.1 29 760.3 56 715.4 90.0 52 770.4 210 552.7 57 721.5 1 552.2
69 395.3 430.3 56 715.4 90.0 12 159.6 105 018.9 23 620.6 715.0
31 757.0 29 330.0 2 427.0 16 862.0 3 015.0 355.9
38 183.8 38 183.8 46 830.6 6 857.7 416.8
316 621.0 279 370.0 30 661.0 4 900.0 1 690.0 304 434.7 123 338.5 4 733.6
2 292.1 2 050.1 235.0 7.0 4 493.2 2 383.7 73.8
3 312 986.1 30.0 254 844.3 3 058 022.8 89.0 439 705.8 142 387.7 3 672.3
220 597.9 2 043.0 766.5 45 483.2 25.0 172 280.2 214 560.0 72 944.0 2 283.1
61 997.7 20 663.9 41 333.8 91 550.0 12 593.4 787.5
145 719.5 1 262.5 1 254.8 91 665.3 38 770.3 1 330.0 11 436.6 212 143.2 74 429.1 2 320.8
3 825 191.5 140 265.1 4 101.4 368 827.0 3 083 851.2 175 376.4 52 770.4 941 379.6 323 643.9 10 202.3
11 900.0 5 700.0 1 300.0 4 900.0 29 633.8 11 560.3 167.9
56 837.6 52 650.4 4 174.4 12.8 67 926.4 10 972.9 536.1
166 285.2 136 710.4 20 775.3 8 799.5 227 947.1 81 899.3 2 964.8
428 714.2 160 340.4 105 340.2 30 000.0 96 699.8 36 333.8 464 322.4 151 110.4 5 020.9
143 789.2 19 348.1 600.0 50 525.0 22 921.8 50 394.3 159 857.4 54 062.7 2 385.2
72 204.9 25 757.1 1 321.3 21 943.6 6 173.5 17 009.4 104 991.6 32 543.9 896.6
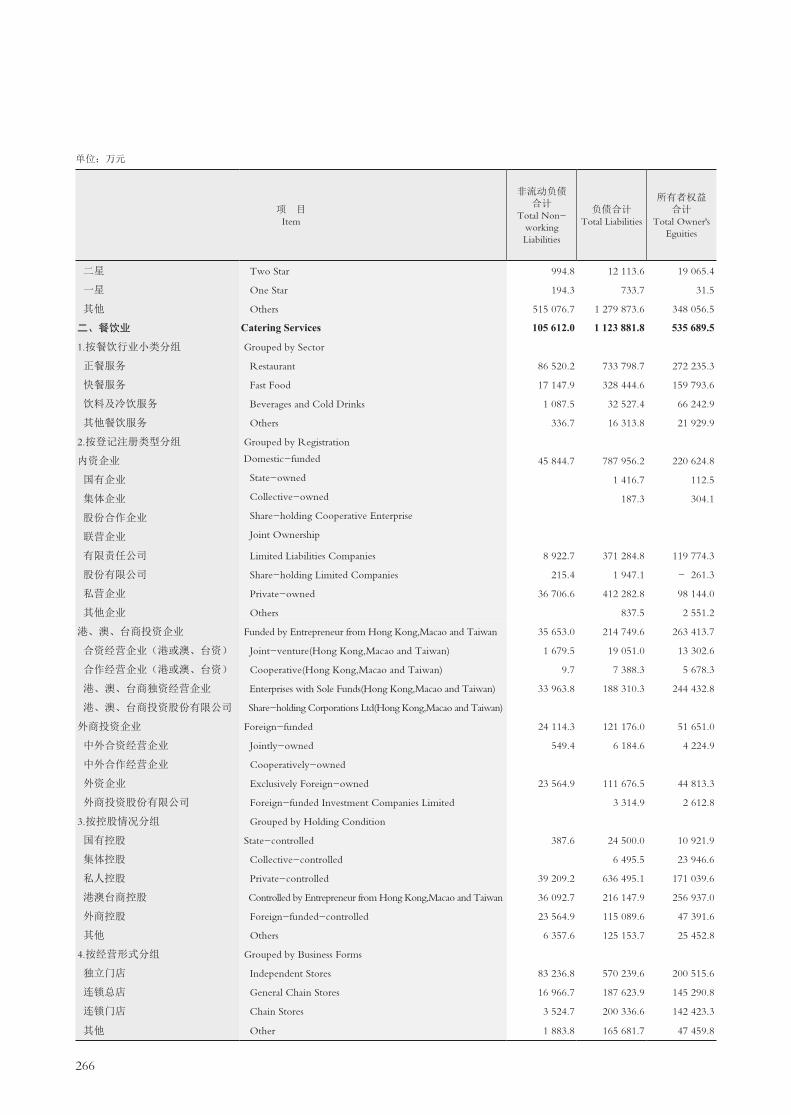
266
项 目 Item
非流动负债合计
Total Non-working Liabilities
负债合计Total Liabilities
所有者权益合计
Total Owner'sEguities
二星 Two Star 994.8 12 113.6 19 065.4
一星 One Star 194.3 733.7 31.5
其他 Others 515 076.7 1 279 873.6 348 056.5
二、餐饮业 Catering Services 105 612.0 1 123 881.8 535 689.5
1.按餐饮行业小类分组 Grouped by Sector
正餐服务 Restaurant 86 520.2 733 798.7 272 235.3
快餐服务 Fast Food 17 147.9 328 444.6 159 793.6
饮料及冷饮服务 Beverages and Cold Drinks 1 087.5 32 527.4 66 242.9
其他餐饮服务 Others 336.7 16 313.8 21 929.9
2.按登记注册类型分组 Grouped by Registration
内资企业 Domestic-funded 45 844.7 787 956.2 220 624.8
国有企业 State-owned 1 416.7 112.5
集体企业 Collective-owned 187.3 304.1
股份合作企业 Share-holding Cooperative Enterprise
联营企业 Joint Ownership
有限责任公司 Limited Liabilities Companies 8 922.7 371 284.8 119 774.3
股份有限公司 Share-holding Limited Companies 215.4 1 947.1 - 261.3
私营企业 Private-owned 36 706.6 412 282.8 98 144.0
其他企业 Others 837.5 2 551.2
港、澳、台商投资企业 Funded by Entrepreneur from Hong Kong,Macao and Taiwan 35 653.0 214 749.6 263 413.7
合资经营企业(港或澳、台资) Joint-venture(Hong Kong,Macao and Taiwan) 1 679.5 19 051.0 13 302.6
合作经营企业(港或澳、台资) Cooperative(Hong Kong,Macao and Taiwan) 9.7 7 388.3 5 678.3
港、澳、台商独资经营企业 Enterprises with Sole Funds(Hong Kong,Macao and Taiwan) 33 963.8 188 310.3 244 432.8
港、澳、台商投资股份有限公司 Share-holding Corporations Ltd(Hong Kong,Macao and Taiwan)
外商投资企业 Foreign-funded 24 114.3 121 176.0 51 651.0
中外合资经营企业 Jointly-owned 549.4 6 184.6 4 224.9
中外合作经营企业 Cooperatively-owned
外资企业 Exclusively Foreign-owned 23 564.9 111 676.5 44 813.3
外商投资股份有限公司 Foreign-funded Investment Companies Limited 3 314.9 2 612.8
3.按控股情况分组 Grouped by Holding Condition
国有控股 State-controlled 387.6 24 500.0 10 921.9
集体控股 Collective-controlled 6 495.5 23 946.6
私人控股 Private-controlled 39 209.2 636 495.1 171 039.6
港澳台商控股 Controlled by Entrepreneur from Hong Kong,Macao and Taiwan 36 092.7 216 147.9 256 937.0
外商控股 Foreign-funded-controlled 23 564.9 115 089.6 47 391.6
其他 Others 6 357.6 125 153.7 25 452.8
4.按经营形式分组 Grouped by Business Forms
独立门店 Independent Stores 83 236.8 570 239.6 200 515.6
连锁总店 General Chain Stores 16 966.7 187 623.9 145 290.8
连锁门店 Chain Stores 3 524.7 200 336.6 142 423.3
其他 Other 1 883.8 165 681.7 47 459.8
单位:万元
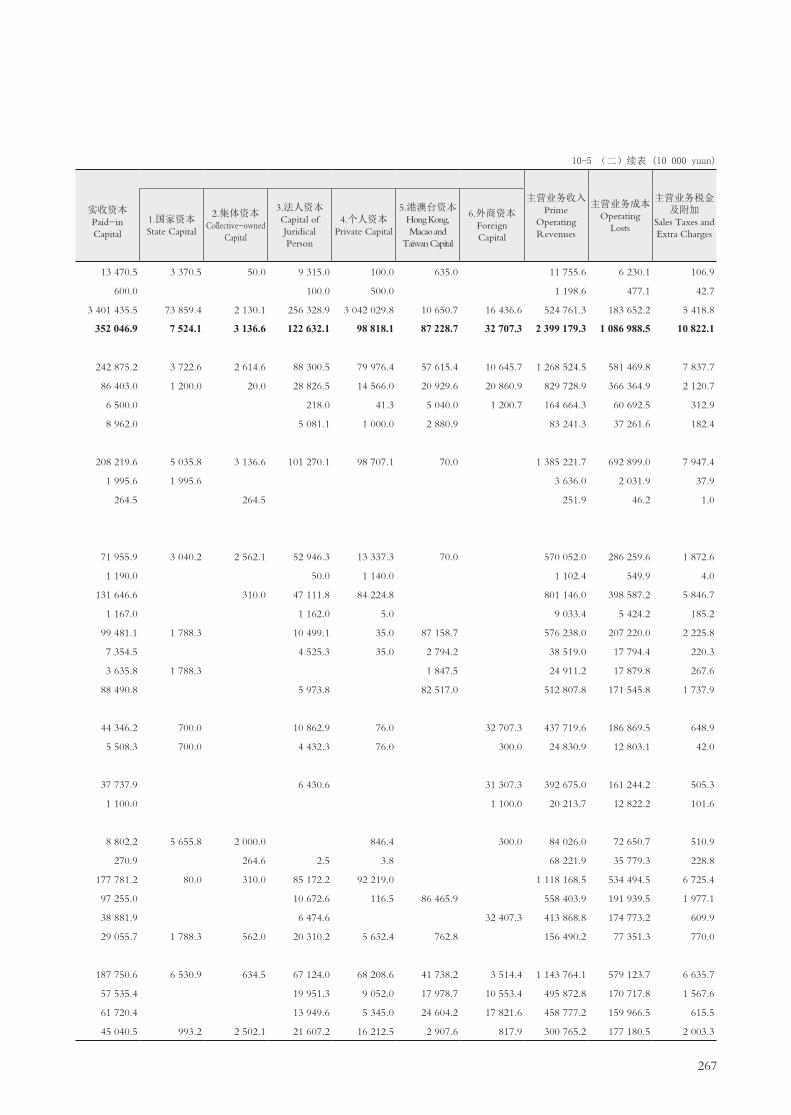
267
实收资本Paid-in Capital
主营业务收入Prime
Operating Revenues
主营业务成本Operating
Losts
主营业务税金及附加
Sales Taxes and Extra Charges
1.国家资本State Capital
2.集体资本Collective-owned
Capital
3.法人资本Capital of Juridical Person
4.个人资本Private Capital
5.港澳台资本Hong Kong, Macao and
Taiwan Capital
6.外商资本Foreign Capital
13 470.5 3 370.5 50.0 9 315.0 100.0 635.0 11 755.6 6 230.1 106.9
600.0 100.0 500.0 1 198.6 477.1 42.7
3 401 435.5 73 859.4 2 130.1 256 328.9 3 042 029.8 10 650.7 16 436.6 524 761.3 183 652.2 5 418.8
352 046.9 7 524.1 3 136.6 122 632.1 98 818.1 87 228.7 32 707.3 2 399 179.3 1 086 988.5 10 822.1
242 875.2 3 722.6 2 614.6 88 300.5 79 976.4 57 615.4 10 645.7 1 268 524.5 581 469.8 7 837.7
86 403.0 1 200.0 20.0 28 826.5 14 566.0 20 929.6 20 860.9 829 728.9 366 364.9 2 120.7
6 500.0 218.0 41.3 5 040.0 1 200.7 164 664.3 60 692.5 312.9
8 962.0 5 081.1 1 000.0 2 880.9 83 241.3 37 261.6 182.4
208 219.6 5 035.8 3 136.6 101 270.1 98 707.1 70.0 1 385 221.7 692 899.0 7 947.4
1 995.6 1 995.6 3 636.0 2 031.9 37.9
264.5 264.5 251.9 46.2 1.0
71 955.9 3 040.2 2 562.1 52 946.3 13 337.3 70.0 570 052.0 286 259.6 1 872.6
1 190.0 50.0 1 140.0 1 102.4 549.9 4.0
131 646.6 310.0 47 111.8 84 224.8 801 146.0 398 587.2 5 846.7
1 167.0 1 162.0 5.0 9 033.4 5 424.2 185.2
99 481.1 1 788.3 10 499.1 35.0 87 158.7 576 238.0 207 220.0 2 225.8
7 354.5 4 525.3 35.0 2 794.2 38 519.0 17 794.4 220.3
3 635.8 1 788.3 1 847.5 24 911.2 17 879.8 267.6
88 490.8 5 973.8 82 517.0 512 807.8 171 545.8 1 737.9
44 346.2 700.0 10 862.9 76.0 32 707.3 437 719.6 186 869.5 648.9
5 508.3 700.0 4 432.3 76.0 300.0 24 830.9 12 803.1 42.0
37 737.9 6 430.6 31 307.3 392 675.0 161 244.2 505.3
1 100.0 1 100.0 20 213.7 12 822.2 101.6
8 802.2 5 655.8 2 000.0 846.4 300.0 84 026.0 72 650.7 510.9
270.9 264.6 2.5 3.8 68 221.9 35 779.3 228.8
177 781.2 80.0 310.0 85 172.2 92 219.0 1 118 168.5 534 494.5 6 725.4
97 255.0 10 672.6 116.5 86 465.9 558 403.9 191 939.5 1 977.1
38 881.9 6 474.6 32 407.3 413 868.8 174 773.2 609.9
29 055.7 1 788.3 562.0 20 310.2 5 632.4 762.8 156 490.2 77 351.3 770.0
187 750.6 6 530.9 634.5 67 124.0 68 208.6 41 738.2 3 514.4 1 143 764.1 579 123.7 6 635.7
57 535.4 19 951.3 9 052.0 17 978.7 10 553.4 495 872.8 170 717.8 1 567.6
61 720.4 13 949.6 5 345.0 24 604.2 17 821.6 458 777.2 159 966.5 615.5
45 040.5 993.2 2 502.1 21 607.2 16 212.5 2 907.6 817.9 300 765.2 177 180.5 2 003.3
10-5 (二)续表 (10 000 yuan)
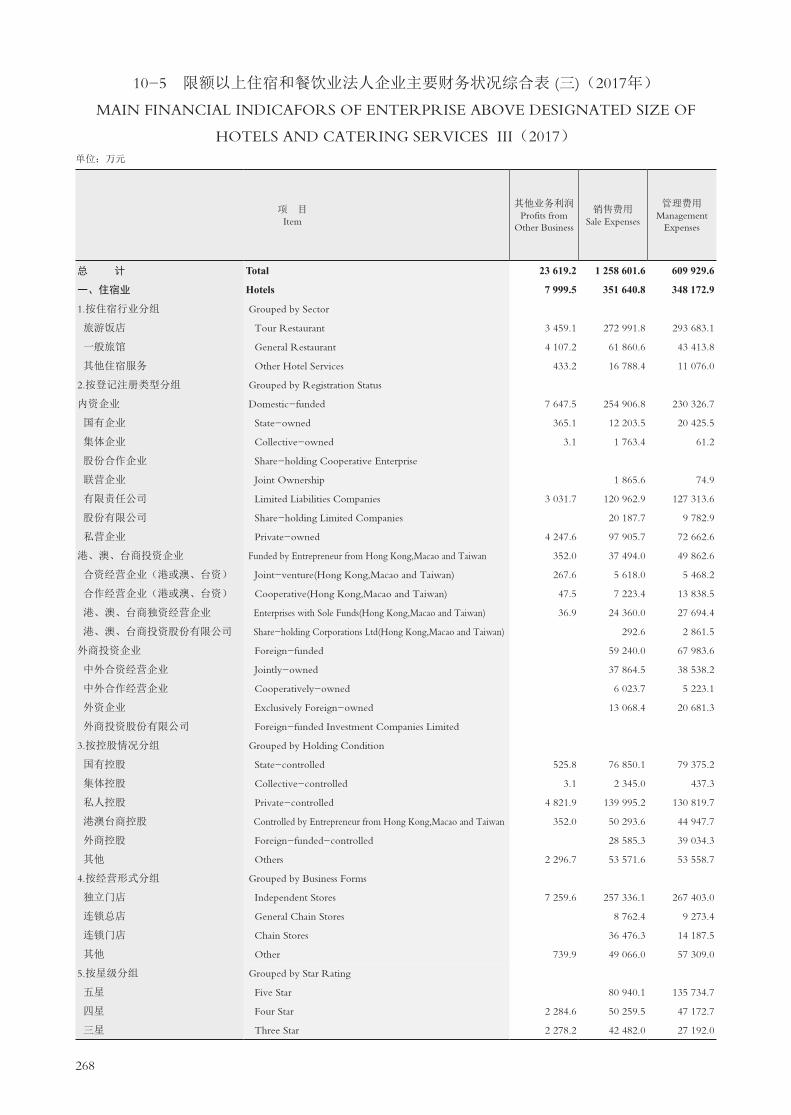
268
10-5 限额以上住宿和餐饮业法人企业主要财务状况综合表 (三)(2017年)
MAIN FINANCIAL INDICAFORS OF ENTERPRISE ABOVE DESIGNATED SIZE OF
HOTELS AND CATERING SERVICES III(2017)
项 目 Item
其他业务利润Profits from
Other Business
销售费用Sale Expenses
管理费用Management
Expenses
总 计 Total 23 619.2 1 258 601.6 609 929.6
一、住宿业 Hotels 7 999.5 351 640.8 348 172.9
1.按住宿行业分组 Grouped by Sector
旅游饭店 Tour Restaurant 3 459.1 272 991.8 293 683.1
一般旅馆 General Restaurant 4 107.2 61 860.6 43 413.8
其他住宿服务 Other Hotel Services 433.2 16 788.4 11 076.0
2.按登记注册类型分组 Grouped by Registration Status
内资企业 Domestic-funded 7 647.5 254 906.8 230 326.7
国有企业 State-owned 365.1 12 203.5 20 425.5
集体企业 Collective-owned 3.1 1 763.4 61.2
股份合作企业 Share-holding Cooperative Enterprise
联营企业 Joint Ownership 1 865.6 74.9
有限责任公司 Limited Liabilities Companies 3 031.7 120 962.9 127 313.6
股份有限公司 Share-holding Limited Companies 20 187.7 9 782.9
私营企业 Private-owned 4 247.6 97 905.7 72 662.6
港、澳、台商投资企业 Funded by Entrepreneur from Hong Kong,Macao and Taiwan 352.0 37 494.0 49 862.6
合资经营企业(港或澳、台资) Joint-venture(Hong Kong,Macao and Taiwan) 267.6 5 618.0 5 468.2
合作经营企业(港或澳、台资) Cooperative(Hong Kong,Macao and Taiwan) 47.5 7 223.4 13 838.5
港、澳、台商独资经营企业 Enterprises with Sole Funds(Hong Kong,Macao and Taiwan) 36.9 24 360.0 27 694.4
港、澳、台商投资股份有限公司 Share-holding Corporations Ltd(Hong Kong,Macao and Taiwan) 292.6 2 861.5
外商投资企业 Foreign-funded 59 240.0 67 983.6
中外合资经营企业 Jointly-owned 37 864.5 38 538.2
中外合作经营企业 Cooperatively-owned 6 023.7 5 223.1
外资企业 Exclusively Foreign-owned 13 068.4 20 681.3
外商投资股份有限公司 Foreign-funded Investment Companies Limited
3.按控股情况分组 Grouped by Holding Condition
国有控股 State-controlled 525.8 76 850.1 79 375.2
集体控股 Collective-controlled 3.1 2 345.0 437.3
私人控股 Private-controlled 4 821.9 139 995.2 130 819.7
港澳台商控股 Controlled by Entrepreneur from Hong Kong,Macao and Taiwan 352.0 50 293.6 44 947.7
外商控股 Foreign-funded-controlled 28 585.3 39 034.3
其他 Others 2 296.7 53 571.6 53 558.7
4.按经营形式分组 Grouped by Business Forms
独立门店 Independent Stores 7 259.6 257 336.1 267 403.0
连锁总店 General Chain Stores 8 762.4 9 273.4
连锁门店 Chain Stores 36 476.3 14 187.5
其他 Other 739.9 49 066.0 57 309.0
5.按星级分组 Grouped by Star Rating
五星 Five Star 80 940.1 135 734.7
四星 Four Star 2 284.6 50 259.5 47 172.7
三星 Three Star 2 278.2 42 482.0 27 192.0
单位:万元

269
财务费用Financial Expenses
营业利润Operating profits
投资收益Profits of
Investment
营业外收入
Non-operating Income
利润总额Total Profits
应交所得税
Total Payable Tax
应付职工薪酬Total Wages
Payable
从业人员期末人数(人)
Average EmployedPersons
(Persons)
利息支出Interest Expense
71 341.6 48 960.6 196 540.2 3 459.3 25 204.5 225 814.4 55 846.3 842 716.5 162 629
59 110.3 43 965.6 86 060.7 1 912.9 14 182.3 102 420.7 22 243.4 309 113.1 44 608
52 565.1 38 069.7 93 141.9 1 908.8 11 198.7 105 622.0 20 445.8 260 457.8 34 913
2 762.1 3 022.5 -6 905.8 4.1 2 803.5 -3 530.4 1 386.4 39 204.9 7 847
3 783.1 2 873.4 -175.4 180.1 329.1 411.2 9 450.4 1 848
56 255.5 39 623.8 18 548.4 1 331.1 10 025.2 31 553.4 10 812.8 219 890.4 32 800
82.3 8.9 -68.3 40.0 7 011.2 6 827.6 2 027.3 19 721.1 1 905
-0.6 0.7 -123.6 66.5 -60.7 3.3 763.4 125
10.4 184.9 1.8 227.9 59.4 773.9 150
41 532.5 30 286.4 8 489.5 45.7 1 596.1 17 265.7 6 070.5 113 821.0 16 039
1 446.9 1 278.1 1 034.6 1 256.3 109.2 1 096.2 137.1 12 259.2 1 850
13 182.8 8 049.5 9 024.5 -10.9 1 240.4 6 196.7 2 515.2 72 473.8 12 714
1 748.9 2 523.4 42 858.1 32.3 3 573.1 46 041.9 8 153.0 46 129.3 6 483
396.2 1.1 2 951.5 69.8 3 272.8 854.1 10 282.9 1 214
245.9 343.2 8 350.2 2 656.7 10 877.2 2 422.2 13 555.5 1 487
1 094.2 2 179.1 32 526.8 32.3 648.6 32 721.7 4 876.7 20 608.4 3 594
12.6 -970.4 198.0 - 829.8 1 682.5 188
1 105.9 1 818.4 24 654.2 549.5 584.0 24 825.4 3 277.6 43 093.4 5 325
1 227.0 1 179.2 3 391.3 295.2 3 317.3 2 447.4 16 676.7 2 518
50.6 3 006.1 231.8 3 217.6 731.5 4 824.4 758
-449.5 639.2 6 810.5 549.5 57.0 6 844.2 98.7 10 369.2 1 324
620.7 815.1 24 576.6 1 330.2 8 462.4 30 937.2 8 325.2 97 259.8 10 510
-0.2 0.7 -402.6 7.7 66.5 - 339.7 7.1 1 195.1 237
37 930.9 30 083.5 -5 962.1 -10.9 1 568.8 7 905.4 2 782.7 109 489.4 18 749
1 364.2 2 522.2 44 337.5 32.3 1 081.5 45 087.5 8 012.9 39 925.8 5 580
889.6 1 828.1 10 425.6 549.5 143.1 10 491.6 283.5 13 721.2 2 488
18 305.1 8 716.0 13 085.7 4.1 2 860.0 8 338.7 2 832.0 47 521.8 7 044
57 120.0 42 688.4 41 815.3 631.1 13 783.5 65 336.7 15 512.4 245 636.3 36 122
572.6 265.6 512.0 1 248.6 80.4 562.8 94.1 7 758.7 1 136
-176.4 18.2 8 050.8 181.6 8 024.4 2 575.1 9 559.0 1 458
1 594.1 993.4 35 682.6 33.2 136.8 28 496.8 4 061.8 46 159.1 5 892
17 408.2 7 137.6 81 878.2 549.5 1 644.2 77 213.3 10 596.3 95 268.0 11 407
22 769.3 20 929.6 -13 754.9 24.4 748.6 1 458.7 1 937.3 42 354.5 7 317
2 118.4 1 502.3 3 184.0 169.4 9 780.1 13 386.4 3 458.8 36 977.9 5 632
(10 000 yuan)

270
项 目 Item
其他业务利润Profits from
Other Business
销售费用Sale Expenses
管理费用Management
Expenses
二星 Two Star 3.1 1 667.7 1 701.4
一星 One Star 26.7 784.7
其他 Others 3 433.6 176 264.8 135 587.4
二、餐饮业 Catering Services 15 619.7 906 960.8 261 756.7
1.按餐饮行业小类分组 Grouped by Sector
正餐服务 Restaurant 10 545.8 472 921.4 170 867.2
快餐服务 Fast Food 5 073.9 327 393.1 66 184.8
饮料及冷饮服务 Beverages and Cold Drinks 67 077.0 14 385.9
其他餐饮服务 Others 35 580.2 5 778.1
2.按登记注册类型分组 Grouped by Registration
内资企业 Domestic-funded 10 795.8 470 896.0 174 114.6
国有企业 State-owned 493.9 1 285.2
集体企业 Collective-owned 337.7 0.1
股份合作企业 Share-holding Cooperative Enterprise
联营企业 Joint Ownership
有限责任公司 Limited Liabilities Companies 462.6 196 707.0 55 806.4
股份有限公司 Share-holding Limited Companies 699.2 162.9
私营企业 Private-owned 9 956.1 271 207.7 115 088.5
其他企业 Others 377.1 1 450.5 1 771.5
港、澳、台商投资企业 Funded by Entrepreneur from Hong Kong,Macao and Taiwan 2 637.7 269 887.7 49 697.3
合资经营企业(港或澳、台资) Joint-venture(Hong Kong,Macao and Taiwan) 11 258.9 6 868.2
合作经营企业(港或澳、台资) Cooperative(Hong Kong,Macao and Taiwan) 1 968.0 2 334.2
港、澳、台商独资经营企业 Enterprises with Sole Funds(Hong Kong,Macao and Taiwan) 2 637.7 256 660.8 40 494.9
港、澳、台商投资股份有限公司 Share-holding Corporations Ltd(Hong Kong,Macao and Taiwan)
外商投资企业 Foreign-funded 2 186.2 166 177.1 37 944.8
中外合资经营企业 Jointly-owned 8 974.0 1 589.5
中外合作经营企业 Cooperatively-owned
外资企业 Exclusively Foreign-owned 2 186.2 154 776.3 33 237.8
外商投资股份有限公司 Foreign-funded Investment Companies Limited 2 426.8 3 117.5
3.按控股情况分组 Grouped by Holding Condition
国有控股 State-controlled 92.1 3 348.6 3 989.0
集体控股 Collective-controlled 21 486.4 6 670.3
私人控股 Private-controlled 10 232.2 402 979.9 147 670.6
港澳台商控股 Controlled by Entrepreneur from Hong Kong,Macao and Taiwan 2 637.7 271 056.6 47 969.4
外商控股 Foreign-funded-controlled 2 186.2 157 203.1 36 691.7
其他 Others 471.5 50 886.2 18 765.7
4.按经营形式分组 Grouped by Business Forms
独立门店 Independent Stores 9 715.7 361 299.4 155 354.7
连锁总店 General Chain Stores 728.8 224 764.0 39 154.0
连锁门店 Chain Stores 4 686.0 237 053.6 32 557.3
其他 Other 489.2 83 843.8 34 690.7
单位:万元

271
10-5 (三)续表 (10 000 yuan)
财务费用Financial Expenses
营业利润Operating profits
投资收益Profits of
Investment
营业外收入
Non-operating Income
利润总额Total Profits
应交所得税
Total Payable Tax
应付职工薪酬Total Wages
Payable
从业人员期末人数(人)
Average EmployedPersons
(Persons)
利息支出Interest Expense
101.8 2.0 1 848.5 66.8 1 862.1 249.6 3 657.2 576
-70.6 0.2 76.7 437.6 110
16 712.6 14 394.1 12 975.5 1 169.6 1 942.6 8 500.0 5 924.7 130 417.9 19 566
12 231.3 4 995.0 110 479.5 1 546.4 11 022.2 123 393.7 33 602.9 533 603.4 118 021
8 745.3 2 988.8 30 501.7 1 260.6 6 506.5 42 326.3 13 568.0 315 812.4 63 523
3 674.8 1 863.6 50 957.4 232.6 3 405.2 52 061.4 12 160.8 158 527.6 44 427
-387.5 28.9 21 738.2 759.3 21 998.5 6 058.9 31 248.3 4 974
71.0 -27.7 4 616.8 53.2 245.3 4 538.8 1 191.0 13 231.2 3 030
10 954.7 4 064.9 32 664.7 1 110.4 6 517.0 42 012.8 12 858.2 334 456.5 69 339
8.4 4.3 -221.3 9.7 -211.6 1 116.9 234
-133.1 -133.1 137.1 47
3 624.0 1 717.1 26 003.6 270.4 2 132.9 33 578.0 7 390.9 142 612.9 26 314
1.2 0.1 -314.9 0.5 -314.4 0.4 300.5 113
7 319.7 2 343.4 7 116.6 840.0 4 373.9 8 886.2 5 437.0 187 426.7 42 137
1.4 213.8 207.7 29.9 2 862.4 494
155.4 272.9 48 648.3 68.4 2 858.4 49 894.2 13 741.7 112 234.8 25 391
166.4 306.9 1 911.7 -27.3 207.5 2 926.8 748.6 8 772.1 1 683
15.6 2 336.6 17.0 10.5 2 046.3 514.6 8 192.1 865
-26.6 -34.0 44 400.0 78.7 2 640.4 44 921.1 12 478.5 95 270.6 22 843
1 121.2 657.2 29 166.5 367.6 1 646.8 31 486.7 7 003.0 86 912.1 23 291
6.4 2.2 1 300.7 30.9 1 288.1 231.4 3 699.3 723
1 151.7 653.5 26 084.5 367.6 1 611.9 28 424.0 6 162.8 81 556.1 22 290
-36.9 1.5 1 781.3 4.0 1 774.6 608.8 1 656.7 278
118.1 113.6 3 668.0 542.9 4 156.4 923.9 29 521.1 2 542
195.1 -20.3 4 098.2 162.0 41.0 4 140.0 1 166.4 16 830.5 2 593
9 804.5 3 620.0 21 018.3 913.8 5 583.8 28 882.1 9 693.6 258 407.3 58 214
197.8 275.1 46 897.7 68.4 2 849.9 48 186.1 13 231.0 105 821.3 24 790
1 115.1 655.0 27 849.8 367.6 1 615.9 30 182.6 6 771.6 83 473.7 22 628
800.7 351.6 6 947.5 34.6 388.7 7 846.5 1 816.4 39 549.5 7 254
6 814.3 2 152.6 35 308.9 928.2 3 512.4 42 157.9 13 236.4 263 889.1 57 949
1 877.9 1 571.4 41 078.4 219.7 3 991.5 40 694.7 11 301.7 105 159.7 20 103
1 499.9 400.0 31 249.2 235.7 2 104.3 31 780.9 6 919.2 79 643.1 23 825
2 039.2 871.0 2 843.0 162.8 1 414.0 8 760.2 2 145.6 84 911.5 16 144

272
项 目 Item
法人企业数(个)
Number of Corporative Enterprises
(unit)
从业人员期末人数(人)Average
EmployedPersons
(Persons)
营业额Business Revenue
总 计 Total 924 162 629 3 844 564.9一、住宿业 Hotels 337 44 608 1 326 023.11.按住宿行业小类分组 Grouped by sector
旅游饭店 Tour Restaurant 208 34 913 1 106 709.8
一般旅馆 General Restaurant 113 7 847 175 026.2
其他住宿服务 Other Hotel Services 16 1 848 44 287.1
2.按登记注册类型分组 Grouped by Registration
内资企业 Domestic-funded 290 32 800 877 846.5
国有企业 State-owned 11 1 905 52 965.9
集体企业 Collective-owned 3 125 3 498.4
股份合作企业 Share-holding Cooperative Enterprise
联营企业 Joint Ownership 2 150 2 609.5
国有联营企业 State-owned Joint Ownership 1 119 2 414.0
集体联营企业 Collective Joint Ownership 1 31 195.5
国有与集体联营企业 State & Collective Joint Ownership
其他联营企业 Other Jonit Ownership
有限责任公司 Limited Liabilities Companies 120 16 039 472 575.4
国有独资公司 State-owned Companies Limited 13 3 359 94 569.1
其他有限责任公司 Other Companies Limited 107 12 680 378 006.3
股份有限公司 Share-holding Limited Companies 11 1 850 43 319.8
私营企业 Private-owned 142 12 714 302 582.0
私营独资企业 Exclusively Private-owned Companies 4 137 2 415.9
私营合伙企业 Joint Private-owned Companies 1 8 503.7
私营有限责任公司 Private-owned Companies Limited 132 12 057 291 331.8
私营股份有限公司 Share-holding Private-owned Companies 5 512 8 330.6
其他企业 Others 1 17 295.5
港、澳、台商投资企业 Funded by Entrepreneur from Hong Kong,Macao and Taiwan 29 6 483 234 254.0
合资经营企业(港或澳、台资) Joint-venture(Hong Kong,Macao and Taiwan) 6 1 214 33 206.1
合作经营企业(港或澳、台资) Cooperative(Hong Kong,Macao and Taiwan) 5 1 487 59 926.4
港、澳、台商独资经营企业 Enterprises with Sole Funds(Hong Kong,Macao and Taiwan) 17 3 594 134 397.7
港、澳、台商投资股份有限公司 Share-holding Corporations Ltd(Hong Kong,Macao and Taiwan) 1 188 6 723.8
外商投资企业 Foreign-funded 18 5 325 213 922.6
中外合资经营企业 Jointly-owned 10 2 518 107 390.5
中外合作经营企业 Cooperatively-owned 2 758 18 740.9
外资企业 Exclusively Foreign-owned 5 1 324 45 950.0
外商投资股份有限公司 Foreign-funded Investment Companies Limited
3.按控股情况分组 Grouped by Holding Condition
国有控股 State-controlled 51 10 510 324 787.2
集体控股 Collective-controlled 6 237 5 066.6
私人控股 Private-controlled 185 18 749 463 052.8
港澳台商控股 Controlled by Entrepreneur from Hong Kong,Macao and Taiwan 28 5 580 220 744.5
外商控股 Foreign-funded-controlled 9 2 488 92 315.1
其他 Others 58 7 044 220 056.9
4.按经营形式分组 Grouped by Business Forms
独立门店 Independent Stores 271 36 122 988 119.2
连锁总店 General Chain Stores 4 1 136 30 650.1
连锁门店 Chain Stores 23 1 458 70 874.6
其他 Other 39 5 892 236 379.2
5.按星级分组 Grouped by Star
五星 Five Star 26 11 407 477 992.6
四星 Four Star 40 7 317 170 679.0
10-6 限额以上住宿和餐饮业法人企业经营情况综合表(2017年)
CONSOLIDATED TABLE OF ENTERPRISES ABOVE DESIGNATED SIZE OF HOTELS
AND CATERING SERVICES (2017)单位:万元

273
客房间数(间)Number of Rooms
(room)
床位数(张)Number of Beds
(bed)
餐位数(位)Numder of
Dining-seats(seat)
年末餐饮营业面积(平方米)
Operating Area Catering(sq.m)
客房收入Revenue of
Rooms
餐费收入Total Revenue of
Meals
商品销售收入Total Sales of Commodities
其他收入Others
832 320.3 2 729 989.3 92 117.4 190 137.9 134 211 175 986 46 628 966 1 872 745 783 709.4 395 631.9 8 583.0 138 098.8 120 103 154 924 85 062 659 623
624 014.8 352 134.7 7 384.8 123 175.5 95 358 116 453 67 518 424 673
126 309.3 35 524.0 1 197.1 11 995.8 21 639 33 994 14 950 202 492
33 385.3 7 973.2 1.1 2 927.5 3 106 4 477 2 594 32 458
550 110.1 234 282.1 2 242.5 91 211.8 103 777 130 821 59 861 516 091
26 205.7 17 531.5 141.7 9 087.0 2 097 3 400 4 297 19 221
814.0 2 329.2 355.2 218 426 520 760
2 031.2 149.5 312.5 116.3 308 418 200 2 000
1 952.0 149.5 312.5 243 300 200 2 000
79.2 116.3 65 118
288 128.7 138 258.9 1 067.5 45 120.3 24 752 38 249 32 625 245 299
45 394.3 36 109.9 380.4 12 684.5 3 537 6 040 8 515 55 856
242 734.4 102 149.0 687.1 32 435.8 21 215 32 209 24 110 189 443
26 919.9 8 324.7 107.9 7 967.3 51 180 52 785 3 126 14 958
205 715.1 67 688.3 612.9 28 565.7 25 159 35 436 19 093 233 853
2 039.9 376.0 538 812 170 470
489.0 14.7 105 145
197 358.1 64 913.2 598.2 28 462.3 23 610 32 956 18 447 232 575
5 828.1 2 399.1 103.4 906 1 523 476 808
295.5 63 107
113 263.2 90 459.3 5 221.7 25 309.8 7 216 10 272 13 821 87 597
17 730.8 9 092.6 811.2 5 571.5 1 691 2 422 1 792 7 508
30 527.2 24 268.9 1 034.5 4 095.8 1 515 2 126 2 725 19 452
61 101.2 56 409.4 1 258.4 15 628.7 3 610 5 137 9 203 59 736
3 904.0 688.4 2 117.6 13.8 400 587 101 901
120 336.1 70 890.5 1 118.8 21 577.2 9 110 13 831 11 380 55 935
69 429.1 30 647.2 777.5 6 536.7 6 750 10 719 5 366 34 867
7 048.7 5 576.7 6 115.5 471 576 1 618 3 207
25 752.4 12 220.4 5.6 7 971.6 1 418 1 909 3 150 10 261
177 637.0 102 069.6 1 019.4 44 061.2 14 527 24 033 23 218 124 455
2 004.0 2 329.2 733.4 532 939 520 916
293 095.1 126 145.6 1 767.6 42 044.5 80 402 93 615 30 845 325 623
123 093.6 69 997.9 4 284.7 23 368.3 8 601 11 698 11 982 78 023
49 898.9 30 606.3 21.8 11 788.1 2 619 3 606 6 792 32 917
137 980.8 64 483.3 1 489.5 16 103.3 13 422 21 033 11 705 97 689
553 558.0 306 830.2 7 852.9 119 878.1 100 128 125 223 71 386 530 151
23 209.1 1 692.9 3.9 5 744.2 3 322 4 773 1 526 3 809
66 270.6 635.5 30.6 3 937.9 8 017 13 043 979 29 195
140 671.7 86 473.3 695.6 8 538.6 8 636 11 885 11 171 96 468
240 203.0 186 366.8 3 285.4 48 137.4 9 821 13 593 24 424 110 124
98 564.8 49 663.7 2 663.6 19 786.9 9 392 13 531 15 063 91 512
(10 000 yuan)
274
项 目 Item
法人企业数(个)
Number of Corporative Enterprises
(unit)
从业人员期末人数(人)Average
EmployedPersons
(Persons)
营业额Business Revenue
三星 Three Star 54 5 632 112 325.8
二星 Two Star 13 576 11 989.9
一星 One Star 2 110 1 417.8
其他 Other 202 19 566 551 618.0
二、餐饮业 Catering Services 587 118 021 2 518 541.81.按餐饮行业小类分组 Grouped by sector
正餐服务 Restaurant 517 63 523 1 319 529.7
快餐服务 Fast Food 42 44 427 881 040.8
饮料及冷饮服务 Beverages and lold Drinrs 10 4 974 170 529.1
其他餐饮服务 Others 10 3 030 89 483.6
2.按登记注册类型分组 Grouped by Registration
内资企业 Domestic-funded 497 69 339 1 441 043.1
国有企业 State-owned 2 234 3 636.0
集体企业 Collective-owned 1 47 259.4
股份合作企业 Share-holding Cooperative Enterprise
联营企业 Joint Ownership
国有联营企业 State-owned Joint Ownership
集体联营企业 Collective Joint Ownership
国有与集体联营企业 State & Collective Joint Ownership
其他联营企业 Other Jonit Ownership
有限责任公司 Limited Liabilities Companies 118 26 314 593 077.3
国有独资公司 State-owned Companies Limited 2 915 24 204.8
其他有限责任公司 Other Companies Limited 116 25 399 568 872.5
股份有限公司 Share-holding Limited Companies 4 113 1 109.8
私营企业 Private-owned 366 42 137 833 565.6
私营独资企业 Exclusively Private-owned Companies 28 1 536 26 724.4
私营合伙企业 Joint Private-owned Companies 1 39 434.3
私营有限责任公司 Private-owned Companies Limited 331 40 062 797 253.0
私营股份有限公司 Share-holding Private-owned Companies 6 500 9 153.9
其他企业 Others 6 494 9 395.0
港、澳、台商投资企业 Funded by Entrepreneur from Hong Kong,Macao and Taiwan 70 25 391 611 995.2
合资经营企业(港或澳、台资) Joint-venture(Hong Kong,Macao and Taiwan) 11 1 683 44 576.8
合作经营企业(港或澳、台资) Cooperative(Hong Kong,Macao and Taiwan) 2 865 28 636.4
港、澳、台商独资经营企业 Enterprises with Sole Funds(Hong Kong,Macao and Taiwan) 57 22 843 538 782.0
港、澳、台商投资股份有限公司 Share-holding Corporations Ltd(Hong Kong,Macao and Taiwan)
外商投资企业 Foreign-funded 20 23 291 465 503.5
中外合资经营企业 Jointly-owned 5 723 26 477.6
中外合作经营企业 Cooperatively-owned
外资企业 Exclusively Foreign-owned 14 22 290 415 706.2
外商投资股份有限公司 Foreign-funded Investment Companies Limited 1 278 23 319.7
3.按控股情况分组 Grouped by Holding Condition
国有控股 State-controlled 11 2 542 87 670.7
集体控股 Collective-controlled 3 2 593 68 317.1
私人控股 Private-controlled 427 58 214 1 165 817.5
港澳台商控股 Controlled by Entrepreneur from Hong Kong,Macao and Taiwan 72 24 790 590 739.2
外商控股 Foreign-funded-controlled 16 22 628 440 056.4
其他 Others 58 7 254 165 940.9
4.按经营形式分组 Grouped by Business Forms
独立门店 Independent Stores 434 57 949 1 194 915.6
连锁总店 General Chain Stores 41 20 103 526 776.8
连锁门店 Chain Stores 25 23 825 483 379.7
其他 Other 87 16 144 313 469.7
单位:万元

275
客房间数(间)Number of Rooms
(room)
床位数(张)Number of Beds
(bed)
餐位数(位)Numder of
Dining-seats(seat)
年末餐饮营业面积(平方米)
Operating Area Catering(sq.m)
客房收入Revenue of
Rooms
餐费收入Total Revenue of
Meals
商品销售收入Total Sales of Commodities
其他收入Others
62 969.7 27 084.6 1 447.4 20 824.1 8 781 12 885 11 609 103 313
6 330.3 4 004.0 14.3 1 641.3 1 290 2 152 1 020 12 365
1 173.3 234.0 10.5 272 359 452 1 850
374 468.3 128 278.8 1 161.8 47 709.1 90 547 112 404 32 494 340 459
48 610.9 2 334 357.4 83 534.4 52 039.1 14 108 21 062 46 543 904 1 213 122
48 610.9 1 224 254.1 8 026.2 38 638.5 14 108 21 062 3 400 453 963 314
853 602.1 18 589.7 8 849.0 43 078 153 221 767
140 393.3 30 135.8 7 513 8 410
70 134.9 19 063.8 284.9 33 607 9 935
44 825.9 1 329 170.1 23 313.4 43 733.7 13 761 20 456 46 405 291 1 001 167
344.0 3 292.0 65 112 1 280 4 508
67.8 191.6 33 61 600 1 532
8 905.5 555 046.3 11 618.6 17 506.9 995 1 546 43 098 542 299 566
17 058.0 1 949.5 5 197.3 640 7 400
8 905.5 537 988.3 9 669.1 12 309.6 995 1 546 43 097 902 292 166
35.3 1 074.5 42 54 352 3 555
35 115.4 760 528.6 11 694.8 26 226.8 12 487 18 533 3 302 137 685 770
303.9 26 414.5 6.0 84 138 131 636 35 872
434.3 220 600
31 481.8 728 088.7 11 688.8 25 993.7 12 118 18 003 3 168 871 643 038
3 329.7 5 591.1 233.1 285 392 1 410 6 260
357.9 9 037.1 139 150 2 380 6 236
3 785.0 574 912.8 32 077.3 1 220.1 347 606 66 222 158 510
37 118.3 7 458.5 6 637 29 433
28 187.4 449.0 292 1 942
3 785.0 509 607.1 24 618.8 771.1 347 606 59 293 127 135
430 274.5 28 143.7 7 085.3 72 391 53 445
26 477.6 14 330 10 546
400 690.4 7 930.5 7 085.3 57 911 42 209
3 106.5 20 213.2 150 690
424.0 75 142.3 2 942.4 9 162.0 115 202 18 790 30 629
2 822.5 56 617.0 5 312.0 3 565.6 159 284 2 930 4 355
35 508.6 1 089 847.6 12 842.2 27 619.1 12 668 18 737 46 320 465 876 922
3 785.0 553 568.3 32 165.8 1 220.1 347 606 66 416 160 465
404 827.4 28 143.7 7 085.3 58 097 43 049
6 070.8 154 354.8 2 128.3 3 387.0 819 1 233 77 206 97 702
42 084.6 1 107 009.3 14 646.0 31 175.7 4 863 7 166 1 009 093 746 165
473 717.0 49 968.2 3 091.6 56 907 167 080
470 738.9 9 631.0 3 009.8 67 853 122 882
6 526.3 282 892.2 9 289.2 14 762.0 9 245 13 896 45 410 051 176 995
10-6 续表 (10 000 yuan)
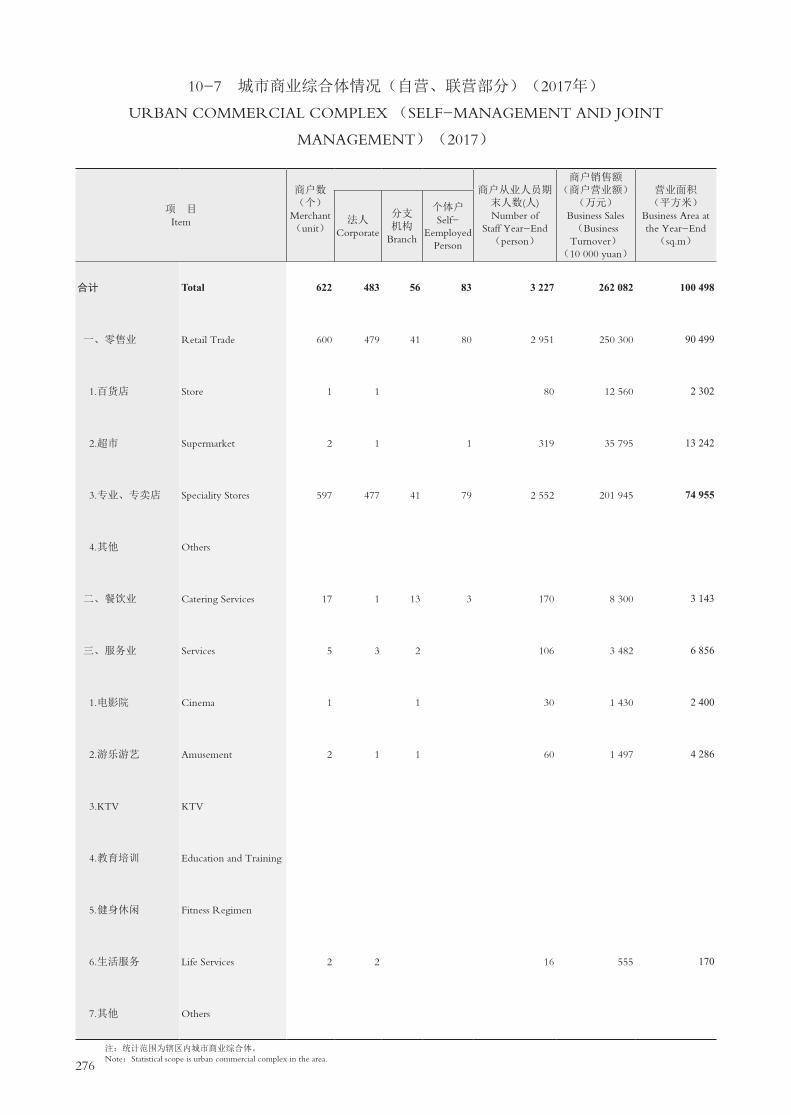
276
10-7 城市商业综合体情况(自营、联营部分)(2017年)
URBAN COMMERCIAL COMPLEX (SELF-MANAGEMENT AND JOINT
MANAGEMENT)(2017)
项 目 Item
商户数(个)
Merchant(unit)
商户从业人员期末人数(人)Number of
Staff Year-End(person)
商户销售额(商户营业额)
(万元)Business Sales(Business Turnover)
(10 000 yuan)
营业面积(平方米)
Business Area at the Year-End(sq.m)
法人Corporate
分支机构
Branch
个体户Self-
Eemployed Person
合计 Total 622 483 56 83 3 227 262 082 100 498
一、零售业 Retail Trade 600 479 41 80 2 951 250 300 90 499
1.百货店 Store 1 1 80 12 560 2 302
2.超市 Supermarket 2 1 1 319 35 795 13 242
3.专业、专卖店 Speciality Stores 597 477 41 79 2 552 201 945 74 955
4.其他 Others
二、餐饮业 Catering Services 17 1 13 3 170 8 300 3 143
三、服务业 Services 5 3 2 106 3 482 6 856
1.电影院 Cinema 1 1 30 1 430 2 400
2.游乐游艺 Amusement 2 1 1 60 1 497 4 286
3.KTV KTV
4.教育培训 Education and Training
5.健身休闲 Fitness Regimen
6.生活服务 Life Services 2 2 16 555 170
7.其他 Others
注:统计范围为辖区内城市商业综合体。Note:Statistical scope is urban commercial complex in the area.

277
10-8 城市商业综合体情况(租赁部分)(2017年)
URBAN COMMERCIAL COMPLEX (LEASED)(2017)
项 目 Item
商户数(个)
Merchant(unit)
商户从业人员期末人数(人)Number of Staff
Year-End(person)
租金总额(万元)
Rent Amount
商户销售额(商户营业额)(万元)Business Sales(Business Turnover)
(10 000 yuan)
营业面积(平方米)Business Area at the Year-End(sq.m)
法人Corporate
分支机构
Branch
个体户Self-
Employed Person
合计 Total 6 314 2 672 1 764 1 878 61 822 288 363 3 194 314 1 952 706
一、零售业 Retail Trade 3 741 1 536 1 023 1 182 25 175 159 988 2 024 387 977 903
二、餐饮业 Catering Services 1 652 671 521 460 27 254 79 391 783 347 515 525
三、服务业 Services 921 465 220 236 9 393 48 984 386 580 459 278
1.电影院 Cinema 26 15 10 1 970 6 696 64 350 110 932
2.游乐游艺 Amusement 125 66 27 32 1 327 4 639 36 838 88 146
3.KTV KTV 4 1 3 165 817 4 272 18 084
4.教育培训 Education and training 144 86 32 26 1 795 4 254 66 005 62 586
5.健身休闲 Fitness regimen 93 33 33 27 1 241 6 178 46 254 69 880
6.生活服务 Life Services 370 205 69 96 2 478 17 086 109 739 75 239
7.其他 Others 159 59 49 51 1 417 9 314 59 122 34 411

278
10-9 居民消费价格总指数
CONSUMER PRICE INDICES
年 份 Year
以上年价格为100 Preceding Year=100
以1979年价格为100 1979=100
居民消费 价格总指数 Consumer
Price Index
居民消费 价格总指数 Consumer
Price Index# 食品类
Food# 服务项目
Services# 食品类
Food# 服务项目
Services
1979 100.0 100.0 100.0 100.0 100.0 100.0
1980 105.0 108.3 100.7 105.0 108.3 100.7
1981 110.7 117.9 101.6 116.2 127.7 102.3
1982 107.8 116.6 108.7 125.3 148.9 111.2
1983 102.0 105.9 100.9 127.8 157.7 112.2
1984 106.8 106.6 119.3 136.5 168.1 133.9
1985 122.5 128.5 117.2 167.2 216.0 156.9
1986 106.1 108.1 106.9 177.4 233.5 167.7
1987 114.4 118.7 107.4 203.0 277.1 180.1
1988 128.1 133.7 112.2 260.0 370.5 202.1
1989 125.4 126.6 125.7 326.0 469.1 254.1
1990 101.6 95.4 127.7 331.2 447.5 324.4
1991 103.0 99.2 115.4 341.2 443.9 374.4
1992 107.3 109.2 109.4 366.1 484.8 409.6
1993 120.1 122.6 120.9 439.7 594.3 495.2
1994 118.2 120.2 118.1 519.7 714.4 584.8
1995 112.4 116.7 118.1 584.1 833.7 690.6
1996 107.7 105.2 110.7 629.1 877.1 764.5
1997 103.3 100.2 118.2 649.9 878.9 903.6
1998 99.3 97.2 105.3 645.4 854.3 951.5
1999 99.3 94.5 107.7 640.9 807.3 1 024.8
2000 102.8 100.2 114.0 658.8 808.9 1 168.3
2001 97.8 97.5 99.3 644.3 788.7 1 160.1
2002 101.2 100.5 106.5 652.0 792.6 1 235.5
2003 100.7 101.2 101.6 656.6 802.1 1 255.3
2004 101.3 106.1 99.7 665.1 851.0 1 251.5
2005 101.6 104.5 100.8 675.7 889.3 1 261.5
2006 102.2 104.2 101.4 690.6 926.7 1 279.2
2007 104.1 108.6 103.4 718.9 1 006.4 1 322.7
2008 105.9 113.5 102.1 761.3 1 142.3 1 350.5
2009 98.7 98.5 99.5 751.4 1 125.2 1 343.7
2010 103.5 107.7 102.6 777.7 1 211.8 1 378.6
2011 105.4 111.9 103.0 819.7 1 356.0 1 420.0
2012 102.8 104.5 101.9 842.7 1 417.0 1 447.0
2013 102.7 102.9 105.2 865.5 1 458.1 1 522.2
2014 102.0 103.5 101.9 882.8 1 509.1 1 551.1
2015 102.2 103.2 103.8 902.2 1 557.4 1 610.0
2016 102.4 105.5 102.6 923.9 1 643.1 1 651.9
2017 101.4 98.4 101.9 936.8 1 616.8 1 683.3
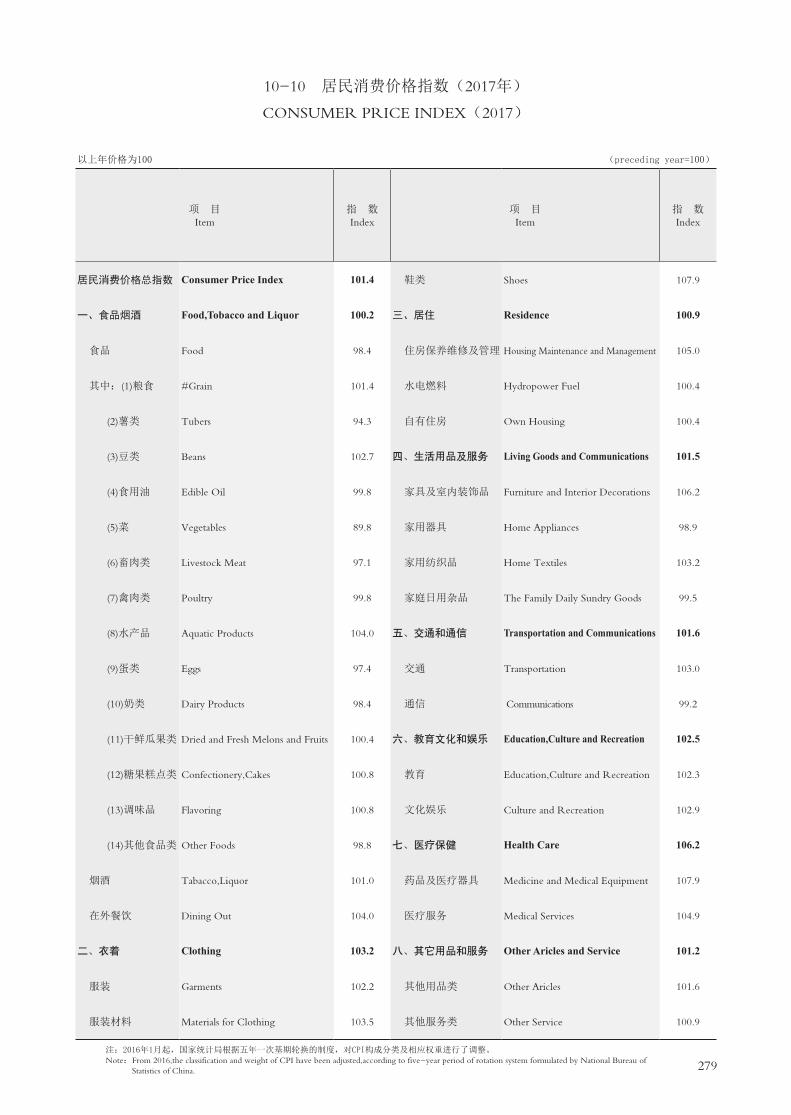
279
10-10 居民消费价格指数(2017年)
CONSUMER PRICE INDEX(2017)
以上年价格为100 (preceding year=100)
项 目 Item
指 数 Index
项 目 Item
指 数 Index
居民消费价格总指数 Consumer Price Index 101.4 鞋类 Shoes 107.9
一、食品烟酒 Food,Tobacco and Liquor 100.2 三、居住 Residence 100.9
食品 Food 98.4 住房保养维修及管理 Housing Maintenance and Management 105.0
其中:(1)粮食 #Grain 101.4 水电燃料 Hydropower Fuel 100.4
(2)薯类 Tubers 94.3 自有住房 Own Housing 100.4
(3)豆类 Beans 102.7 四、生活用品及服务 Living Goods and Communications 101.5
(4)食用油 Edible Oil 99.8 家具及室内装饰品 Furniture and Interior Decorations 106.2
(5)菜 Vegetables 89.8 家用器具 Home Appliances 98.9
(6)畜肉类 Livestock Meat 97.1 家用纺织品 Home Textiles 103.2
(7)禽肉类 Poultry 99.8 家庭日用杂品 The Family Daily Sundry Goods 99.5
(8)水产品 Aquatic Products 104.0 五、交通和通信 Transportation and Communications 101.6
(9)蛋类 Eggs 97.4 交通 Transportation 103.0
(10)奶类 Dairy Products 98.4 通信 Communications 99.2
(11)干鲜瓜果类 Dried and Fresh Melons and Fruits 100.4 六、教育文化和娱乐 Education,Culture and Recreation 102.5
(12)糖果糕点类 Confectionery,Cakes 100.8 教育 Education,Culture and Recreation 102.3
(13)调味品 Flavoring 100.8 文化娱乐 Culture and Recreation 102.9
(14)其他食品类 Other Foods 98.8 七、医疗保健 Health Care 106.2
烟酒 Tabacco,Liquor 101.0 药品及医疗器具 Medicine and Medical Equipment 107.9
在外餐饮 Dining Out 104.0 医疗服务 Medical Services 104.9
二、衣着 Clothing 103.2 八、其它用品和服务 Other Aricles and Service 101.2
服装 Garments 102.2 其他用品类 Other Aricles 101.6
服装材料 Materials for Clothing 103.5 其他服务类 Other Service 100.9
注:2016年1月起,国家统计局根据五年一次基期轮换的制度,对CPI构成分类及相应权重进行了调整。Note:From 2016,the classification and weight of CPI have been adjusted,according to five-year period of rotation system formulated by National Bureau of Statistics of China.
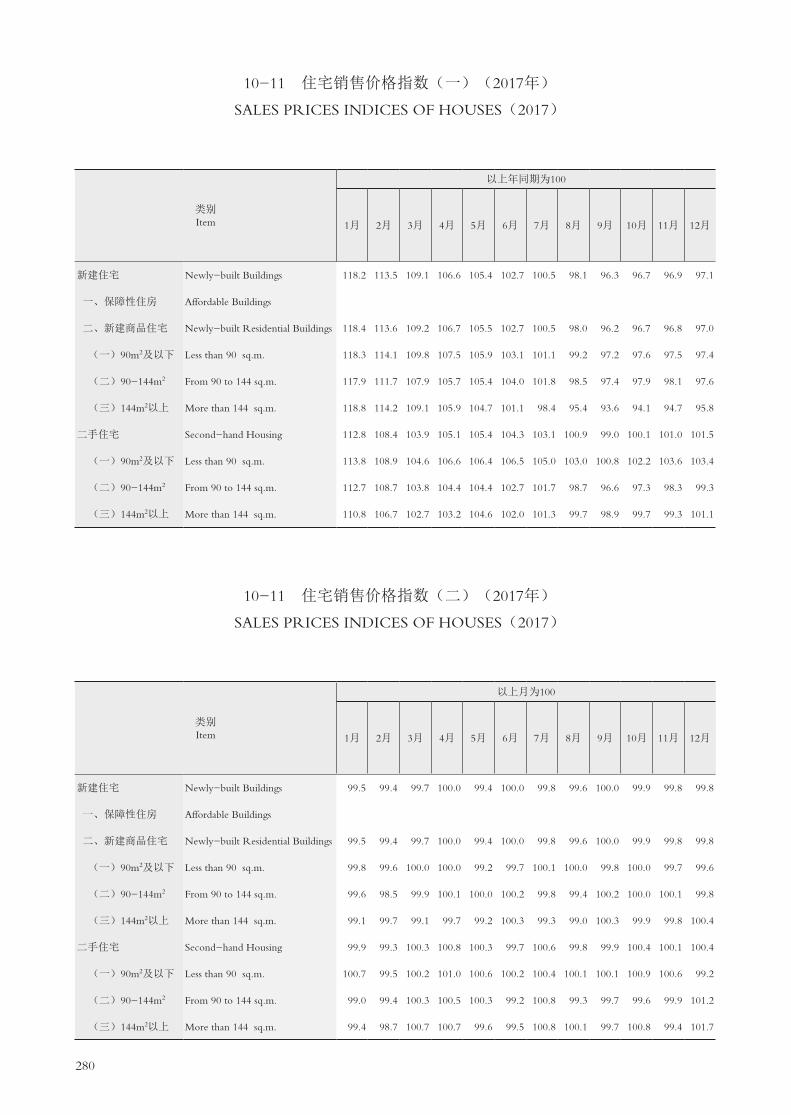
280
类别Item
以上年同期为100
1月 2月 3月 4月 5月 6月 7月 8月 9月 10月 11月 12月
新建住宅 Newly-built Buildings 118.2 113.5 109.1 106.6 105.4 102.7 100.5 98.1 96.3 96.7 96.9 97.1
一、保障性住房 Affordable Buildings
二、新建商品住宅 Newly-built Residential Buildings 118.4 113.6 109.2 106.7 105.5 102.7 100.5 98.0 96.2 96.7 96.8 97.0
(一)90m2及以下 Less than 90 sq.m. 118.3 114.1 109.8 107.5 105.9 103.1 101.1 99.2 97.2 97.6 97.5 97.4
(二)90-144m2 From 90 to 144 sq.m. 117.9 111.7 107.9 105.7 105.4 104.0 101.8 98.5 97.4 97.9 98.1 97.6
(三)144m2以上 More than 144 sq.m. 118.8 114.2 109.1 105.9 104.7 101.1 98.4 95.4 93.6 94.1 94.7 95.8
二手住宅 Second-hand Housing 112.8 108.4 103.9 105.1 105.4 104.3 103.1 100.9 99.0 100.1 101.0 101.5
(一)90m2及以下 Less than 90 sq.m. 113.8 108.9 104.6 106.6 106.4 106.5 105.0 103.0 100.8 102.2 103.6 103.4
(二)90-144m2 From 90 to 144 sq.m. 112.7 108.7 103.8 104.4 104.4 102.7 101.7 98.7 96.6 97.3 98.3 99.3
(三)144m2以上 More than 144 sq.m. 110.8 106.7 102.7 103.2 104.6 102.0 101.3 99.7 98.9 99.7 99.3 101.1
类别Item
以上月为100
1月 2月 3月 4月 5月 6月 7月 8月 9月 10月 11月 12月
新建住宅 Newly-built Buildings 99.5 99.4 99.7 100.0 99.4 100.0 99.8 99.6 100.0 99.9 99.8 99.8
一、保障性住房 Affordable Buildings
二、新建商品住宅 Newly-built Residential Buildings 99.5 99.4 99.7 100.0 99.4 100.0 99.8 99.6 100.0 99.9 99.8 99.8
(一)90m2及以下 Less than 90 sq.m. 99.8 99.6 100.0 100.0 99.2 99.7 100.1 100.0 99.8 100.0 99.7 99.6
(二)90-144m2 From 90 to 144 sq.m. 99.6 98.5 99.9 100.1 100.0 100.2 99.8 99.4 100.2 100.0 100.1 99.8
(三)144m2以上 More than 144 sq.m. 99.1 99.7 99.1 99.7 99.2 100.3 99.3 99.0 100.3 99.9 99.8 100.4
二手住宅 Second-hand Housing 99.9 99.3 100.3 100.8 100.3 99.7 100.6 99.8 99.9 100.4 100.1 100.4
(一)90m2及以下 Less than 90 sq.m. 100.7 99.5 100.2 101.0 100.6 100.2 100.4 100.1 100.1 100.9 100.6 99.2
(二)90-144m2 From 90 to 144 sq.m. 99.0 99.4 100.3 100.5 100.3 99.2 100.8 99.3 99.7 99.6 99.9 101.2
(三)144m2以上 More than 144 sq.m. 99.4 98.7 100.7 100.7 99.6 99.5 100.8 100.1 99.7 100.8 99.4 101.7
10-11 住宅销售价格指数(一)(2017年)
SALES PRICES INDICES OF HOUSES(2017)
10-11 住宅销售价格指数(二)(2017年)
SALES PRICES INDICES OF HOUSES(2017)

281
10-12 工业生产者出厂价格指数
INDUSTRIAL PRODUCER PRICE INDEX
以上年价格为100 (Preceding year=100)
类 别 Item
2006 2007 2008 2009 2010 2011 2012 2013 2014 2015 2016 2017
全部工业品 General Index 98.2 98.4 99.6 95.3 101.6 101.8 99.9 98.0 99.1 97.6 99.3 101.8
按轻重工业分 Grouped by industries
轻工业 Light Industry 97.0 97.8 98.7 96.7 101.4 102.9 99.2 98.4 98.2 98.6 100.8 101.4
重工业 Heavy Industry 101.5 99.8 101.9 92.6 101.9 101.4 100.1 97.9 99.4 97.3 98.8 102.0
按生产、生活资料分 Grouped by Means of Production
and Consumer Goods
生产资料 Means of Production 97.9 97.9 99.1 94.4 100.7 101.3 100.3 98.0 99.5 97.4 98.7 102.2
生活资料 Consumer Goods 99.0 100.2 101.9 99.3 104.5 103.5 98.7 98.1 97.7 98.4 100.8 100.9
按工业部门分 Grouped by Industrial Department
冶金工业 Metallurgical Industry 97.7 103.4 102.2 95.6 108.4 106.7 100.7 100.2 98.6 98.0 102.1 115.5
电力工业 Power Industry 100.0 100.2 100.8 98.4 99.3 99.6 100.5 100.5 99.7 99.3 99.4 98.9
石油工业 Petroleum Industry 130.0 104.1 130.8 62.4 136.8 126.9 101.7 92.4 95.2 64.2 86.7 123.2
化学工业 Chemical Industry 103.4 102.5 102.9 98.4 101.2 102.3 101.2 99.4 100.0 99.2 98.9 102.5
机械工业 Engineering Industry 96.1 96.9 97.4 95.9 99.0 99.8 99.6 97.7 99.1 98.5 99.0 100.9
建筑材料工业 Building Materials Industry 89.6 103.8 97.5 90.1 104.2 101.1 93.9 102.5 102.9 98.8 99.7 101.8
森林工业 Timber Industry 100.2 102.2 105.6 102.6 107.4 106.0 102.8 103.6 100.6 100.4 99.3 98.2
食品工业 Food Industry 99.6 104.7 109.1 92.4 102.7 106.1 107.0 102.3 100.2 100.4 102.8 101.6
纺织工业 Textile Industry 99.5 101.3 100.9 100.2 100.3 106.1 101.2 99.6 101.6 100.4 100.2 100.3
缝纫工业 Needlework Industry 105.7 108.4 103.2 104.6 103.9 107.5 102.5 104.3 104.8 102.9 104.8 102.5
皮革工业 Leather Industry 99.9 99.4 110.9 110.3 102.2 107.4 104.9 103.1 103.0 100.9 100.4 100.1
造纸工业 Paper Industry 96.2 101.2 108.5 100.2 101.1 104.1 102.2 99.3 100.4 101.4 104.3 104.3
文教艺术用品工业 Cultural, Educational & Handicrafts 98.8 101.0 105.0 103.2 101.9 101.5 101.4 100.6 99.8 99.0 100.7 100.8
Articles
其它工业 Others 102.7 102.4 105.9 108.0 119.0 113.5 95.8 91.6 94.8 91.6 103.2 101.4
10-13 工业生产者购进价格指数
INDUSTRIAL PURCHASING PRICE INDEX
以上年价格为100 (Preceding year=100)
类 别 Item
2008 2009 2010 2011 2012 2013 2014 2015 2016 2017
总指数 General Index 105.3 96.3 104.7 105.9 100.0 98.3 99.6 96.5 98.3 103.4
燃料、动力类 Fuels and Power 107.5 97.8 105.1 105.9 102.5 95.1 99.1 92.8 97.2 101.7
黑色金属材料类 Ferrous Materials 105.9 94.7 102.7 106.5 95.1 95.4 96.4 95.7 99.7 111.5
其中: 钢材 Steel 107.9 96.0 104.0 106.7 92.8 92.8 94.7 93.7 99.4 110.1
其它 Others 101.6 91.9 100.2 105.9 99.9 100.4 99.9 99.9 100.2 113.9
有色金属材料及电线类 Nonferrous Metal and Electris Wire 101.3 89.9 115.0 108.3 97.9 96.5 95.8 92.8 99.8 109.1
化工原料类 Chemical Raw Materials 103.8 91.9 105.5 107.2 97.5 99.2 99.0 95.6 98.7 104.1
木材及纸浆类 Wood and Paper Pulps 104.7 94.5 103.9 107.7 100.5 99.9 100.7 98.1 96.8 106.0
建筑材料及非金属类 Building Materials and Nonmetal Minerals 111.3 90.1 114.0 105.4 97.9 102.7 107.8 91.0 95.4 113.3
其它工业原材料及半成品类 Other Industrial Raw and Processed Materials 103.8 97.1 101.8 105.0 100.8 99.1 99.4 98.3 98.8 101.9
农副产品类 Farm and Sideline Products 109.6 104.3 107.9 104.3 100.5 103.4 103.7 99.1 94.9 100.5
纺织原料类 Textile Raw Material 105.6 100.8 105.1 106.4 100.4 99.3 100.8 102.5 100.3 101.3

282
主要统计指标解释
社会消费品零售总额 指各种经济类型的批发零售业、住宿餐饮业和其他行业的企业(单位)或个体
户,售予城乡居民用于生活消费和社会集团用于公共消费的商品金额的总和。
批发零售业商品购进总额 指从本企业以外的单位和个人购进(包括从国外直接进口)作为转卖或加工
后转卖的商品金额。本指标由“从生产者购进额”、“从批发零售业购进额”、“进口额”和“其他购进”组
成。 这个指标反映批发零售企业从国内、国外市场上购进商品的总量。
批发零售业商品销售总额 指售予本企业以外的单位和个人的商品金额(包括对国(境)外直接出口及
售给本单位消费用的商品)。本指标由“对生产经营单位批发额”、“对批发零售业批发额”、“出口额”和
“对居民和社会集团商品零售额”项目组成。这个指标反映批发零售业在国内市场上销售商品以及出口商品的
总量。
批发 指除零售以外的一切商品销售活动。包括对生产经营单位批发、对批发零售业批发和出口。
零售 指出售城乡居民用于生活消费商品和社会集团直接用于公用消费商品的活动。
批发零售业年末库存总额 指批发零售企业已取得所有权的全部商品。这个指标反映批发零售贸易企业
的商品库存情况,对市场商品供应的保证程度。
批发零售业住宿餐饮业法人单位 指各种经济类型独立核算法人批发零售企业、住宿餐饮企业的单位个
数。法人单位应同时具备以下条件:1. 依法成立,有自己的名称、组织机构和场所,能够独立承担民事责任;
2. 独立拥有和使用资产,承担负债,有权与其他单位签订合同;3. 独立核算盈亏,并能够编制资产负债表。
批发业 是指从工农业生产者或从商品流通企业单位和个体户购进商品,转卖给工业、农业、建筑业、
运输邮电业、住宿餐饮业、服务业等生产经营单位作为生产经营用,以及将商品转卖给其他批发企业或零售企
业的商品流通企业(单位)和个体户。
零售业 是指从工农业生产者、批发业或居民购进商品,转卖给城乡居民作为生活消费和售给社会集团
作为公共消费的商品流通企业(单位)和个体户。
住宿业 是指为顾客提供临时住宿服务的企业(单位)和个体户。
餐饮业 是指从事食品的烹饪、调制并直接售给居民和社会集团的企业(单位)和个体户。
居民消费价格指数 是度量消费商品及服务项目价格水平随着时间而变动的相对数,反映居民家庭购买
的消费品及服务价格水平的变动情况。它是宏观经济分析、决策、调控和价格总水平监测以及国民经济核算的
重要指标。其按年度计算的变动率通常被用来作为反映通货膨胀(或紧缩)程度的指标。
工业生产者出厂价格指数 反映工业企业产品第一次出售时的出厂价格的变化趋势和变动幅度。
工业生产者购进价格指数 反映工业企业作为中间投入产品的购进价格的变化趋势和变动幅度。
新建商品住宅 指新建的专供居住用的商品住房,本方案主要包括:90平方米及以下、90—144平方米、
144平方米以上等。不包括新建的国家政策性住房;不包括住宅楼中作为人防用、不住人的地下室、车库等,
也不包括托儿所、病房、疗养院、旅馆等具有专门用途的房屋。

283
二手住宅 指进入房屋市场进行交易,第二次及以上进行产权登记的住宅,包括二手商品住宅、允许上市
交易的已售公房等。本方案主要包括90平方米及以下、90—144平方米、144平方米以上等分类。
90平方米及以下住宅 指住宅中套型建筑面积不大于90平方米的住宅。套型建筑面积由套内使用面积和
分摊的共有建筑面积组成,报表时以销售合同中实际测绘的建筑面积为准,若销售合同为套内使用面积则需折
算成建筑面积。
90平方米—144平方米住宅 指套型建筑面积大于90平方米,不超过144平方米的住宅。
144平方米以上住宅 指套型建筑面积在144平方米以上的住宅。
保障性住房 指享受国家相关优惠政策、出售给城镇中低收入居民家庭的新建住房,包括经济适用住房、
限价商品住房等保障性、政策性住房。

284
Explanatory Notes on Main Statistical Indicators
Total Retail Sales of Consumer Goods refer to the sum of retail sales of consumer goods sold by enterprises
(establishments) or individuals in wholesale,retail trade,accommodations, catering services and other industries of
various types of ownership to urban and rural households for living consumption and to social institutions for public
consumption.
Total Purchases of Commodities by Wholesale and Retail Trades refer to the purchases of commodities
from other establishments or individuals (including direct import from abroad) for the purpose of reselling,either with
or without further processing of the commodities purchased This indicator includes the purchases from producers,the
purchases from wholesale and retail trades,imports and other purchases
It is used to show the total value of purchases of commodities by wholesale and retail establishments from domestic
and overseas markets.
Total Sales of Commodities by Wholesale and Retail Trades refer to the value of commodities sold to other
establishments and individuals (including direct export and commodities sold to the sellers themselves for consumption).
This indicator includes the value of wholesale to production and operation units,the value of wholesale to wholesale
and retail trades,exports and retail sales to urban and rural households and social institutions It is an indicator of the total
value of sales of commodities at domestic markets and export.
Wholesale refers to all selling activities of commodities except retail trade,including wholesale to production and
operation units,wholesale to wholesale and retail trades and export.
Retail Sale refers to the selling of commodities to urban and rural households for living consumption and to
social institutions for direct public consumption.
Total Inventory of Wholesale and Retail Trades at the Year-end refers to the total commodities possessed by
wholesale and retail enterprises,which reflects the commodity stock level of various wholesale and retail enterprises and
the potential for market supply.
Corporate Units in Wholesale and Retail Trades, Accommodations and Catering Services refer to the
number of corporate enterprises of various types of ownership in the wholesale and retail trades, accommodations and
catering services with independent accounting systems An enterprise can be called a corporate enterprise only when it
simultaneously meets the following requirements:(1)It is established according to law, with its own name,organization
and location for business operation, as well as the capability to independently assume civil responsibility (2)It owns and
uses its assets independently, assumes liabilities and is entitled to sign contracts with other units (3)It has an independent
accounting system and is able to compile balance sheets.
Wholesale Trade refers to the commodity circulation enterprises (establishments) and individuals which purchase
commodities from producers in industry and agriculture or from commodity circulation enterprises and individuals
for the purpose of reselling them to establishments in industry,agriculture,construction,transportation,postal
and telecommunications services,accommodations and catering services and other services for their production and
operation as well as reselling them to other wholesale or retail enterprises.

285
Retail Trade refers to the commodity circulation enterprises (establishments) and individuals which purchase
commodities from producers in industry and agriculture,wholesale trade or residents for the purpose of reselling them to
urban and rural households for living consumption and to social institutions for public consumption.
Hotel Services refers to the enterprises (establishments) and individuals engaged in providing temporary
accommodation to customers.
Catering Services refer to the enterprises (establishments) and individuals engaged in food cooking,seasoning
and selling food directly to households and social institutions.
Consumer Price Indices measure the relative change with time in prices of consumer goods and services,
reflecting the rates of change in consumer goods and services purchased by households. It is an important indicator for
macroeconomic analysis, decision-making, regularization and control, supervision of general price level and national
economic accounting. The annualized rates of change are generally considered as an indicator of inflation or deflation.
EX-factory Price Indices of Industrial Producers reflect the trends and degree of changes in prices of industrial
products to sell the first time.
Purchasing Price Indices of Industrial Producers reflect the trends and degree of changes in prices of products
as intermediate inputs.
Newly-built Houses refer to newly-built houses for residential use. The program includes: 90 square meters and
below, 90-144 square meters, 144 square meters and above. Excluding new national policy-related houses, houses used
as civil defense, basements, garages, nursery, wards, nursing homes, hotels and other houses used for special purposes.
Second-hand Houses refer to houses transacted for twice and above in the market, and the property registrations
have been changed twice and above, including second-hand commercial houses and public houses been sold and allowed
for second transaction. The program includes 90 square meters and below, 90-144 square meters, 144 square meters and
above.
90 Square Meters and Below Houses refer to houses with a residential dwelling size of not more than 90 square
meters. Dwelling size of the building area is composed by private usable area and public shared construction area. The
program subjects to the actual construction area recorded in sales contracts.
90 Square Meters -144 Square Meters Houses refer to houses with the residential dwelling size of more than 90
square meters and no more than 144 square meters.
144 Square Meters Houses refer to houses with the residential dwelling size of more than 144 square meters.
Indemnificatory houses refer to new houses sold to urban low-income families according to national preferential
policies, including supportable and policy-related apartments such as affordable and price-limited houses.


FISCAL REVENUE AND EXPENDITURE11


289
11-1 地方财政收支
LOCAL GOVERNMENT BUDGETARY REVENUE AND EXPENDITURE
单位:万元 (10 000 yuan)
项目Item
2013 2014 2015 2016 2017
一般公共预算收入 Local government General Budgetary 17 312 618 20 827 326 27 268 543 31 364 923 33 321 303
Revenue
税收收入 Taxes 14 989 200 17 548 398 22 722 315 24 888 827 26 548 905
#增值税 Value-added Tax 2 740 958 3 156 076 3 362 040 6 509 463 9 912 775
营业税 Business Tax 4 232 223 4 798 432 6 846 839 3 639 382 -
企业所得税 Corporate Income Tax 2 884 159 3 450 200 4 649 574 5 695 240 6 678 536
个人所得税 Individual Income Tax 1 384 659 1 684 918 2 239 807 3 047 503 3 343 287
非税收入 Non-Tax Revenue 2 323 418 3 278 928 4 546 228 6 476 096 6 772 398
#专项收入 Special Program Receipts 444 215 487 301 1 562 019 3 823 354 3 721 265
行政事业性收费收入 Charge of Administrative and Units 546 072 910 550 438 659 279 760 267 919
罚没收入 Penalty Receipts 177 672 267 880 303 057 249 007 339 210
政府性基金收入 Government Fund Revenue 4 999 482 6 870 751 9 640 067 9 663 957 10 299 480
一般公共预算支出 Local Government General Budgetary 16 908 280 21 661 841 35 216 708 42 110 429 45 938 003
Expenditure
#教育 Expenditure for Education 2 877 280 3 294 137 2 885 520 4 147 269 5 090 971
科学技术 Expenditure for Science and Technology 1 329 814 945 707 2 143 182 4 035 240 3 518 252
文化体育与传媒 Expenditure for Culture, Sport and Media 329 433 580 070 527 260 547 941 571 218
社会保障与就业 Expenditure for Social Safety Net and 784 985 738 828 845 801 1 054 524 2 397 159
Employment Effort
医疗卫生 Expenditure for Medical and Health Care 1 069 185 1 576 028 1 505 974 2 012 739 2 442 264
节能环保 Expenditure for Energy Saving 1 419 861 1 352 999 1 083 493 1 402 415 2 130 427
城乡社区事务 Expenditure for Urban and Rural 2 217 321 2 458 768 4 656 457 5 584 938 9 829 642
Community Affairs
农林水事务 Expenditure for Agriculture, Forestry and 614 196 566 042 441 526 612 541 763 260
Water Conservancy
交通运输 Expenditure for Transportation 1 116 493 2 938 739 10 445 932 4 508 921 3 182 690
政府性基金支出 Expenditure for Government Funds 3 613 114 4 621 312 3 427 517 4 137 502 5 370 357
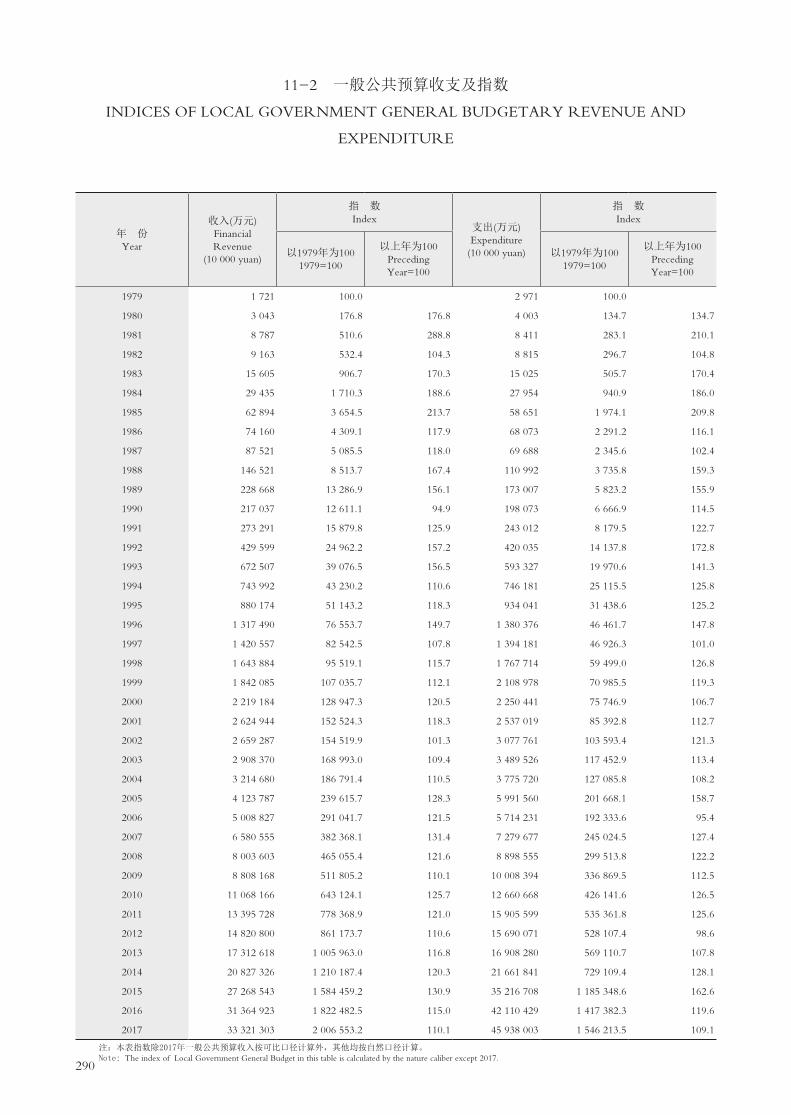
290
11-2 一般公共预算收支及指数
INDICES OF LOCAL GOVERNMENT GENERAL BUDGETARY REVENUE AND
EXPENDITURE
年 份 Year
收入(万元) Financial Revenue
(10 000 yuan)
指 数 Index
支出(万元) Expenditure
(10 000 yuan)
指 数 Index
以1979年为100 1979=100
以上年为100 Preceding Year=100
以1979年为100 1979=100
以上年为100 Preceding Year=100
1979 1 721 100.0 2 971 100.0
1980 3 043 176.8 176.8 4 003 134.7 134.7
1981 8 787 510.6 288.8 8 411 283.1 210.1
1982 9 163 532.4 104.3 8 815 296.7 104.8
1983 15 605 906.7 170.3 15 025 505.7 170.4
1984 29 435 1 710.3 188.6 27 954 940.9 186.0
1985 62 894 3 654.5 213.7 58 651 1 974.1 209.8
1986 74 160 4 309.1 117.9 68 073 2 291.2 116.1
1987 87 521 5 085.5 118.0 69 688 2 345.6 102.4
1988 146 521 8 513.7 167.4 110 992 3 735.8 159.3
1989 228 668 13 286.9 156.1 173 007 5 823.2 155.9
1990 217 037 12 611.1 94.9 198 073 6 666.9 114.5
1991 273 291 15 879.8 125.9 243 012 8 179.5 122.7
1992 429 599 24 962.2 157.2 420 035 14 137.8 172.8
1993 672 507 39 076.5 156.5 593 327 19 970.6 141.3
1994 743 992 43 230.2 110.6 746 181 25 115.5 125.8
1995 880 174 51 143.2 118.3 934 041 31 438.6 125.2
1996 1 317 490 76 553.7 149.7 1 380 376 46 461.7 147.8
1997 1 420 557 82 542.5 107.8 1 394 181 46 926.3 101.0
1998 1 643 884 95 519.1 115.7 1 767 714 59 499.0 126.8
1999 1 842 085 107 035.7 112.1 2 108 978 70 985.5 119.3
2000 2 219 184 128 947.3 120.5 2 250 441 75 746.9 106.7
2001 2 624 944 152 524.3 118.3 2 537 019 85 392.8 112.7
2002 2 659 287 154 519.9 101.3 3 077 761 103 593.4 121.3
2003 2 908 370 168 993.0 109.4 3 489 526 117 452.9 113.4
2004 3 214 680 186 791.4 110.5 3 775 720 127 085.8 108.2
2005 4 123 787 239 615.7 128.3 5 991 560 201 668.1 158.7
2006 5 008 827 291 041.7 121.5 5 714 231 192 333.6 95.4
2007 6 580 555 382 368.1 131.4 7 279 677 245 024.5 127.4
2008 8 003 603 465 055.4 121.6 8 898 555 299 513.8 122.2
2009 8 808 168 511 805.2 110.1 10 008 394 336 869.5 112.5
2010 11 068 166 643 124.1 125.7 12 660 668 426 141.6 126.5
2011 13 395 728 778 368.9 121.0 15 905 599 535 361.8 125.6
2012 14 820 800 861 173.7 110.6 15 690 071 528 107.4 98.6
2013 17 312 618 1 005 963.0 116.8 16 908 280 569 110.7 107.8
2014 20 827 326 1 210 187.4 120.3 21 661 841 729 109.4 128.1
2015 27 268 543 1 584 459.2 130.9 35 216 708 1 185 348.6 162.6
2016 31 364 923 1 822 482.5 115.0 42 110 429 1 417 382.3 119.6
2017 33 321 303 2 006 553.2 110.1 45 938 003 1 546 213.5 109.1
注:本表指数除2017年一般公共预算收入按可比口径计算外,其他均按自然口径计算。Note: The index of Local Government General Budget in this table is calculated by the nature caliber except 2017.

291
11-3 财政收支分级情况
BUDGETARY REVENUE AND EXPENDITURE BY LEVEL
单位:万元 (10 000 yuan)
项目Item
2013 2014 2015 2016 2017
一般公共预算收入合计 Total General Budgetary Revenue 17 312 618 20 827 326 27 268 543 31 364 923 33 321 303
市本级 City 10 483 258 12 760 545 17 445 184 19 959 464 20 867 601
福田区 Futian 970 300 1 205 797 1 424 709 1 471 267 1 637 062
罗湖区 Luohu 600 833 653 430 850 233 938 218 976 259
盐田区 Yantian 233 528 264 146 364 911 323 957 336 725
南山区 Nanshan 1 000 528 1 139 321 1 447 647 1 863 735 2 378 174
大宝安区 Original Baoan 2 424 920 2 842 746 3 220 950 3 814 192 4 061 860
#龙华区 Longhua 974 827 1 140 313 1 207 981
光明新区 Guangming 259 447 460 630 372 872 497 347 497 476
大龙岗区 Original Longgang 1 599 251 1 961 341 2 514 909 2 994 090 3 063 622
#坪山区 Pingshan 191 911 218 786 295 665 363 142 454 656
大鹏新区 Dapeng 175 987 229 519 241 202
一般公共预算支出合计 Total General Budgetary 16 908 280 21 661 841 35 216 708 42 110 429 45 938 003
Expenditure
市本级 City 9 393 365 12 666 435 22 340 358 22 765 872 23 614 624
福田区 Futian 1 056 306 1 256 272 1 554 492 2 291 063 2 055 398
罗湖区 Luohu 684 949 775 071 1 034 456 1 695 761 2 780 283
盐田区 Yantian 251 951 269 327 454 892 678 758 682 924
南山区 Nanshan 1 142 749 1 295 858 2 147 951 2 739 555 2 806 726
大宝安区 Original Baoan 2 505 390 3 034 325 5 036 850 6 836 632 8 311 108
#龙华区 Longhua 1 701 351 2 606 123 2 673 273
光明新区 Guangming 263 624 487 386 491 190 993 636 1 383 617
大龙岗区 Original Longgang 1 873 570 2 364 553 2 647 709 5 102 788 5 686 940
#坪山区 Pingshan 204 113 262 017 406 422 1 054 961 1 380 415
大鹏新区 Dapeng 291 222 695 790 597 981
注: 大宝安区包含龙华区和光明新区,大龙岗区包含坪山区和大鹏新区。Note: In this table,data of Longhua and Guangming are included in original Baoan and data of Pingshan and Dapeng are included in original Longgang.
292
主要统计指标解释
财政收入 是国家财政参与社会产品分配所取得的收入,是实现国家职能的财力保证。财政收入所包括
的内容几经变化,目前主要包括:
各项税收:包括国内增值税、营业税、土地增值税、城市维护建设税、资源税、城市土地使用税、印花
税、个人所得税、企业所得税、关税、农牧业税和耕地占用税等。
专项收入:包括征收排污费收入、征收城市水资源费收入、教育费附加收入等。
财政支出 国家财政将筹集起来的资金进行分配使用,以满足经济建设和各项事业的需要,主要包括一
般公共服务、公共安全、教育、科学技术、文化教育与传媒、社会保障和就业、医疗卫生、节能环保、城乡社
区事务等支出科目。

293
Explanatory Notes on Main Statistical Indicators
Government Revenue refers to income for the government finance through participating in the distribution of
social products. It is the financial guarantee to ensure government functioning.The contents of government revenue have
undergone constant changes. Currently they mainly include the following items:
Various tax revenues, including domestic value added tax, business tax, land value added tax, city maintenance and
construction tax, resources tax, tax on use of urban land, stamp tax, individual income tax, corporate income tax, tariff,
tax on agriculture and animal husbandry and tax on occupancy of cultivated land, etc.
Special program receipts, including receipts of pollutant discharge fee, urban water resource charge, education
surtax, etc.
Government Expenditure refers to the distribution and use of the funds which the government finance has
raised, so as to meet the needs of economic construction and various causes. It mainly includes the following items:
expenditure for general public services, expenditure for public security, expenditure for education, expenditure for
science and technology, expenditure for culture, sport and media, expenditure for social safety net and employment effort,
expenditure for medical and health care, expenditure for energy saving, expenditure for urban and rural community
affairs, etc.


FINANCE AND INSURANCE12


297
12-1 国内金融机构人民币存贷款
DEPOSITS AND LOANS IN RENMINBI OF DOMESTIC FINANCIAL INSTITUTIONS
单位:亿元 (100 million yuan)
项目Item
2014 2015 2016 2017
各项存款 Total Deposits 44 589.29 51 806.18 57 793.30 62 760.40
境内存款 Domestic Deposits 39 151.75 49 384.45 55 977.08 60 476.89
其中:住户存款 Household Deposits 8 916.82 9 429.42 10 361.19 10 807.45
#活期存款 Demand Deposits 5 150.78 5 792.67 6 539.70 6 856.52
定期及其他存款 Time and Other Deposits 3 766.04 3 636.75 3 821.48 3 950.93
非金融企业存款 Non-financial Corporations Deposits 12 688.99 16 451.54 22 949.35 27 779.15
#活期存款 Current Deposits 4 106.20 5 879.10 7 285.44 8 194.04
定期及其他存款 Time and Other Deposits 8 582.79 10 572.43 15 663.92 19 585.11
广义政府存款 Generalized Government Deposits 7 688.88 8 012.34 8 444.90 8 774.22
非银行业金融机构存款 Non-bank Financial Deposits 9 857.06 15 491.16 14 221.65 13 116.08
境外存款 Overseas Deposits 5 437.54 2 421.73 1 816.21 2 283.51
各项贷款 Total Deposits 22 805.39 27 129.99 34 034.29 39 940.61
境内贷款 Domestic Loans 22 568.57 26 852.40 33 674.96 39 545.69
其中:住户贷款 Household Loans 7 884.51 10 832.66 15 022.07 17 541.78
# 短期贷款 Short-term Loans 1 222.19 1 554.06 2 095.32 2 460.45
中长期贷款 Medium&Long-term Loans 6 662.32 9 278.60 12 926.75 15 081.33
非金融企业及机关团体贷款Non-financial Corporations,Government and Organizations Loans
14 549.76 15 979.83 18 639.54 21 968.76
# 短期贷款 Short-term Loans 4 989.32 5 635.10 6 443.81 8 027.14
中长期贷款 Medium&Long-term Loans 7 996.01 8 412.34 9 900.05 11 972.29
票据融资 Bill Financing 732.45 1 034.33 1 391.26 952.48
融资租赁 Finance Lease 806.67 849.75 847.94 977.18
各项垫款 All Advances Money 25.32 48.31 56.49 39.67
非银行业金融机构贷款 Non-bank Financial Loans 134.29 39.91 13.35 35.15
境外贷款 Oveeseas Loans 236.82 277.59 359.33 394.92
注: 2015年起,人民银行调整了金融机构存贷款统计口径,2014年数据相应作了回溯调整,后同。Note:From 2015, the statistical caliber of deposit and loan of financial institutions have been adjusted by the People's Bank of China, the date of 2014 have been adjusted by the same caliber,the same applied to the following tables.

298
12-2 金融机构(含外资)本外币信贷情况
SOURCES AND USES OF CREDIT FUNDS OF FINANCIAL INSTITUTIONS
(INCLUDE FOREIGN FUNDS) 单位:亿元 (100 million yuan)
年 份 Year
各项存款余额 All Deposits
各项贷款余额 All Loans
1990 360.65 373.98
1991 517.95 491.44
1992 801.51 643.24
1993 977.06 820.13
1994 1 413.81 1 244.87
1995 1 705.94 1 501.84
1996 2 144.28 1 861.97
1997 2 455.25 2 275.51
1998 2 881.83 2 483.84
1999 3 235.66 2 621.85
2000 3 974.12 2 955.37
2001 4 988.20 3 543.11
2002 5 941.29 4 308.43
2003 7 071.94 5 411.96
2004 8 136.21 6 571.56
2005 9 486.71 7 596.75
2006 10 616.01 8 353.82
2007 12 729.68 10 121.37
2008 14 260.94 11 234.05
2009 18 357.47 14 783.39
2010 21 937.89 16 808.12
2011 25 095.78 19 244.68
2012 29 662.40 21 808.34
2013 33 943.15 24 680.07
2014 49 969.99 28 114.22
2015 57 778.90 32 449.04
2016 64 407.81 40 526.90
2017 69 668.31 46 329.33

299
12-3 金融机构(含外资)本外币分类存贷款
SOURCES AND USES OF CREDIT FUNDS OF FINANCIAL INSTITUTIONS
(INCLUDE FOREIGN FUNDS)单位:亿元 (100 million yuan)
项目Item
2015 2016 2017
各项存款 Total Deposits 57 778.90 64 407.81 69 668.31
境内存款 Domestic Deposits 54 534.63 62 033.75 66 324.93
其中:住户存款 Household Deposits 9 680.24 10 755.66 11 159.78
#活期存款 Demand Deposits 5 956.70 6 823.79 7 096.70
定期及其他存款 Time and Other Deposits 3 723.54 3 931.86 4 063.08
非金融企业存款 Non-financial Corporations Deposits 20 831.23 28 237.21 33 014.86
#活期存款 Current Deposits 6 540.94 8 118.16 9 117.29
定期及其他存款 Time and Other Deposits 14 290.29 20 119.05 23 897.57
广义政府存款 Generalized Government Deposits 8 015.31 8 454.18 8 777.32
非银行业金融机构存款 Non-bank Financial Deposits 16 007.85 14 586.70 13 372.97
境外存款 Overseas Deposits 3 244.27 2 374.07 3 343.38
各项贷款 Total Deposits 32 449.04 40 526.90 46 329.33
境内贷款 Domestic Loans 30 598.39 38 252.95 43 972.02
其中:住户贷款 Household Loans 10 941.51 15 135.44 17 647.27
# 短期贷款 Short-term Loans 1 556.97 2 100.45 2 464.89
中长期贷款 Medium&Long-term Loans 9 384.54 13 034.99 15 182.38
非金融企业及机关团体贷款Non-financial Corporations,Government and Organizations Loans
19 557.46 23 058.16 26 238.60
# 短期贷款 Short-term Loans 7 895.32 9 600.88 11 190.06
中长期贷款 Medium&Long-term Loans 9 443.81 10 838.32 12 866.16
票据融资 Bill Financing 1 190.49 1 583.05 1 021.24
融资租赁 Finance Lease 970.44 975.17 1 113.17
各项垫款 All Advances Money 57.41 60.74 47.97
非银行业金融机构贷款 Non-bank Financial Loans 99.41 59.35 86.15
境外贷款 Oveeseas Loans 1 850.65 2 273.95 2 357.31
注: 2015年起,人民银行调整了金融机构存贷款统计口径,2014年数据相应作了回溯调整。Note:

300
12-4 深圳证券交易所投资者开户情况
ACCOUNT-OPENING BY INVESTORS IN SHENZHEN STOCK EXCHANGE
单位:万户 (10 000 accounts)
指 标 Indicators
2011 2012 2013 2014 2015 2016 2017
年末开户总数 Total Accounts Year-end 10 124.57 10 573.30 11 085.55 12 036.87 16 888.92 20 897.12 24 545.09
个人 Private 10 091.17 10 537.82 11 047.51 11 995.30 16 839.71 20 841.00 24 482.57
机构 Institution 33.40 35.48 37.34 40.66 49.22 56.12 62.52
A股合计 A Shares Accounts 10 025.14 10 473.43 10 985.15 11 935.93 16 783.70 20 791.27 24 438.57
个人 Private 9 993.08 10 439.34 10 948.55 11 895.86 16 736.06 20 736.72 24 377.63
机构 Institution 32.06 34.09 36.61 40.08 47.65 54.55 60.94
B股合计 B Shares Accounts 99.43 99.87 100.40 100.94 105.22 105.85 106.52
个人 Private 98.10 98.47 98.96 99.44 103.65 104.28 104.94
机构 Institution 1.33 1.39 0.73 0.58 1.57 1.57 1.58
新开户总数 Newly Opened Accounts During the Year 714.96 464.76 531.09 984.74 4 914.84 4 018.31 3 598.69
个人 Private 712.08 462.25 528.08 980.76 4 906.60 4 010.15 3 590.60
机构 Institution 2.88 2.51 3.00 3.93 8.24 8.16 8.09
A股合计 Newly Opened Accounts of A Shares 713.87 464.15 530.38 984.02 4 910.29 4 017.37 3 597.71
个人 Private 711.12 461.75 527.46 980.14 4 902.15 4 009.29 3 589.70
机构 Institution 2.75 2.41 2.91 3.89 8.14 8.08 8.01
B股合计 Newly Opened Accounts of B Shares 1.09 0.61 0.71 0.72 4.55 0.94 0.98
个人 Private 0.96 0.50 0.62 0.62 4.45 0.86 0.90
机构 Institution 0.13 0.10 0.09 0.04 0.10 0.08 0.08

301
12-5 深圳证券交易所有价证券成交总额
TOTAL VOLUME OF PRICE SECURITIES TRADING IN SHENZHEN
单位:亿元 (100 million yuan)
指 标 Indicators
2009 2010 2011 2012 2013 2014 2015 2016 2017
合计 Total 198 733.87 247 426.62 193 188.33 178 659.69 296 671.46 444 708.19 1 361 051.31 934 425.86 814 333.31
股票 Stocks 189 474.86 241 321.53 184 089.28 150 122.41 238 462.58 366 750.87 1 224 950.00 775 979.90 616 855.01
# A股证券 A Shares 188 446.14 240 249.99 183 530.07 149 667.80 237 713.21 366 228.12 1 223 606.57 775 478.37 616 433.07
B股证券 B Shares 1 028.72 1 071.54 559.21 454.65 749.38 522.74 1 343.43 501.53 421.94
基金 Funds 3 790.96 4 224.73 3 464.40 4 952.49 5 796.68 9 753.40 48 884.71 22 085.09 19 882.32
债券 Bonds 828.71 1 291.60 5 634.65 23 584.79 52 412.20 68 203.92 87 216.59 136 344.37 177 595.98
# 国债现货 State Treasury Bond 30.20 71.61 10.02 8.62 32.65
12-6 深证综合指数
SHENZHEN COMPOSITE INDEX
日历日期 Date
开市指数 Open
收市指数 Close
最高指数 High
交易日期 Exchange Date
最低指数 Low
交易日期 Exchange Date
2001-12-31 636.62 475.94 665.57 2001-06-14 438.00 2002-10-22
2002-12-31 475.14 388.76 523.38 2002-06-25 366.84 2002-01-23
2003-12-31 386.61 378.63 453.45 2003-04-16 349.86 2003-11-19
2004-12-31 377.93 315.81 472.18 2004-04-07 314.98 2004-09-13
2005-12-30 313.81 278.75 334.14 2005-03-09 235.64 2005-07-19
2006-12-29 541.07 550.59 552.93 2006-12-29 278.99 2006-01-04
2007-12-28 1 455.60 1 447.02 1 567.74 2007-10-08 547.89 2007-01-05
2008-12-31 560.17 553.30 1 576.50 2008-01-15 456.97 2008-11-04
2009-12-31 1 193.32 1 201.34 1 234.17 2009-12-03 571.13 2009-01-05
2010-12-31 1 262.19 1 290.87 1 412.64 2010-11-11 890.24 2010-07-02
2011-12-30 852.43 866.65 1 316.19 2011-01-06 828.83 2011-12-28
2012-12-31 874.56 881.17 1 020.29 2012-03-04 724.97 2012-12-04
2013-12-31 887.36 1 057.67 1 106.27 2013-10-22 815.89 2013-06-25
2014-12-31 1 055.88 1 415.19 1 504.48 2014-12-16 1 004.93 2014-04-29
2015-12-31 1 419.44 2 308.91 3 156.96 2015-06-12 1 408.99 2015-01-05
2016-12-31 2 304.48 1 969.11 2 304.49 2016-01-04 1 618.12 2016-01-27
2017-12-31 1 972.55 1 899.34 2 046.74 2017-03-24 1 773.61 2017-06-01

302
12-7 社会保险费实际征收收入和支出
PREMIUMS INCOME AND PAYMENT
单位:万元 (10 000 yuan)
年 份 Year
社会保险费实际征收收入 Premium Income
社会保险基金支出 Social Insurance Fund Expenditure
1998 203 014 82 8181999 241 680 109 3062000 315 636 136 4542001 508 777 200 6382002 569 878 246 5872003 741 343 316 2012004 1 092 084 446 9432005 1 335 261 563 9252006 1 724 096 701 0872007 2 053 206 777 2182008 2 637 923 926 9752009 2 768 988 1 154 7852010 3 401 499 1 437 7362011 4 462 180 1 807 1632012 5 499 183 2 021 8712013 7 114 222 2 459 5422014 7 993 834 2 921 4212015 9 301 966 3 290 3372016 10 151 440 4 109 4012017 13 308 764 5 414 739
12-8 保险费收入和赔款及给付
PREMIUMS INCOME, INDEMNITY EXPENDITURE AND PAYMENT
单位:亿元 (100 million yuan)
年 份 Year
保险费收入 Premium Income
赔款及给付支出 Indemnity Expenditure
and Payment
赔款率(%) Indemnity and Payment Ratio
(%)
1997 34.64 9.44 27.30
1998 34.94 9.06 25.90
1999 35.79 9.96 27.80
2000 40.66 9.64 23.70
2001 54.22 14.26 26.30
2002 65.84 18.40 28.00
2003 78.75 23.86 30.30
2004 91.77 24.44 26.60
2005 106.39 28.63 26.90
2006 134.69 35.15 26.10
2007 183.70 56.87 31.00
2008 240.82 67.94 28.20
2009 271.59 73.34 27.00
2010 361.49 73.94 20.45
2011 359.90 85.77 23.83
2012 401.27 107.71 26.84
2013 468.76 125.19 26.71
2014 548.66 155.76 28.39
2015 647.55 176.74 27.29
2016 834.45 218.55 26.19
2017 1 029.75 257.13 24.97
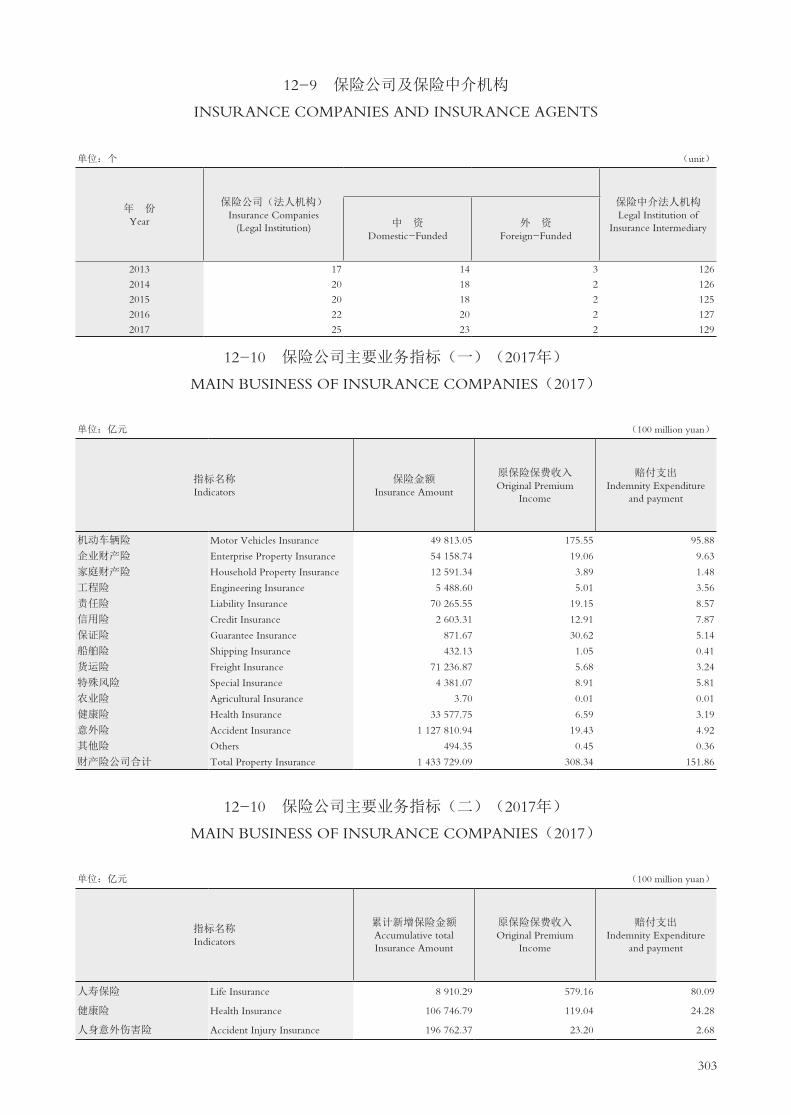
303
12-9 保险公司及保险中介机构
INSURANCE COMPANIES AND INSURANCE AGENTS
单位:个 (unit)
年 份 Year
保险公司(法人机构)Insurance Companies
(Legal Institution)
保险中介法人机构 Legal Institution of
Insurance Intermediary中 资 Domestic-Funded
外 资 Foreign-Funded
2013 17 14 3 126
2014 20 18 2 126
2015 20 18 2 125
2016 22 20 2 127
2017 25 23 2 129
12-10 保险公司主要业务指标(一)(2017年)
MAIN BUSINESS OF INSURANCE COMPANIES(2017)
单位:亿元 (100 million yuan)
指标名称 Indicators
保险金额Insurance Amount
原保险保费收入Original Premium
Income
赔付支出Indemnity Expenditure
and payment
机动车辆险 Motor Vehicles Insurance 49 813.05 175.55 95.88
企业财产险 Enterprise Property Insurance 54 158.74 19.06 9.63
家庭财产险 Household Property Insurance 12 591.34 3.89 1.48
工程险 Engineering Insurance 5 488.60 5.01 3.56
责任险 Liability Insurance 70 265.55 19.15 8.57
信用险 Credit Insurance 2 603.31 12.91 7.87
保证险 Guarantee Insurance 871.67 30.62 5.14
船舶险 Shipping Insurance 432.13 1.05 0.41
货运险 Freight Insurance 71 236.87 5.68 3.24
特殊风险 Special Insurance 4 381.07 8.91 5.81
农业险 Agricultural Insurance 3.70 0.01 0.01
健康险 Health Insurance 33 577.75 6.59 3.19
意外险 Accident Insurance 1 127 810.94 19.43 4.92
其他险 Others 494.35 0.45 0.36
财产险公司合计 Total Property Insurance 1 433 729.09 308.34 151.86
12-10 保险公司主要业务指标(二)(2017年)
MAIN BUSINESS OF INSURANCE COMPANIES(2017)
单位:亿元 (100 million yuan)
指标名称 Indicators
累计新增保险金额Accumulative total Insurance Amount
原保险保费收入Original Premium
Income
赔付支出Indemnity Expenditure
and payment
人寿保险 Life Insurance 8 910.29 579.16 80.09
健康险 Health Insurance 106 746.79 119.04 24.28
人身意外伤害险 Accident Injury Insurance 196 762.37 23.20 2.68

304
主要统计指标解释
存款 指企业、机关、团体或居民根据必须收回的原则,把货币资金存入银行或其他信用机构保管并取
得一定利息的一种信用活动形式。根据存款对象的不同可划分为企业存款、财政存款、机关团体存款、基本建
设存款、城镇居民储蓄、农村存款等科目。它是银行信贷资金的主要来源。
贷款 指银行或其他信用机构根据资金必须归还的原则,按一定利率,为企业、个人等提供资金的一种信
用活动形式。我国银行贷款分流动资金贷款、固定资产贷款、城乡个体工商户贷款以及农业贷款等科目。
城乡居民储蓄存款余额 指某一时点城乡居民存入银行及农村信用社的储蓄金额,包括城镇居民储蓄存
款和农民个人储蓄存款,不包括居民的手存现金和工矿企业、部队、机关、团体等单位存款。
保险金额 指保险人承担赔偿或者给付保险金责任的最高限额。
保费 指投保人为取得保险人在约定范围内所承担赔偿责任而支付给保险人的费用。
赔款 指保险人根据保险合同的规定,向被保险人支付的赔偿保险责任损失的金额。
给付 包括死伤医疗给付和满期给付。死伤医疗给付是指保险人根据人寿保险及长期健康保险合同的规
定,因被保险人在保险期内发生保险责任范围内的保险事故支付给被保险人(或受益人)的金额。满期给付是
指被保险人生存期满,保险人按人寿保险合同规定支付给被保险人的满期保险金额。
305
Explanatory Notes on Main Statistical Indicators
Deposit is a form of credit by which enterprises, institutions, organizations or residents can put money into banks
and other credit institutions for safekeeping and interest earning under the principle of free withdrawal. According to the
different depositors, deposits are divided into enterprise deposits, treasury deposits, deposits of government agencies and
organizations, capital construction deposits, urban savings deposits, rural deposits and other deposits. Deposits are major
sources of the credit funds of banks.
Loan is a form of credit by which banks and other credit institutions provide funds at certain interest rates to
enterprises and individuals in the light of the principle of unconditional repayment. Loans from Chinese banks include
circulating capital loans, fixed assets loans, loans to urban and rural individuals engaged in industrial and commercial
business and agricultural loans.
Savings Deposits by Urban and Rural Residents refer to the total value of savings deposits of urban and
rural households in banks and rural credit cooperatives at a given point of time, including the savings deposit of urban
residents and the savings deposit of rural residents. The cash in hand by residents and the deposits of organizations such as
enterprises, military units, government agencies, institutions and others are not included.
Amount Insured refers to the maximum that the insurant will get for the claim of the case insured.
Premium is the fee paid by the insurant to the insurer to obtain the obligation of compensation from the
insurance within the agreed terms. is the compensation paid by the insurer to the insurant in accordance with the
insurance contract.
Settled Claim is the compensation paid by the insurer to the insurant in accordance with the insurance contract.
Payment includes payment for death, injury or medical treatment and payment at maturity. Payment for death,
injury or medical treatment refers to the money paid to the insurant (or the beneficiary) in accordance with the life or
health insurance contract when the insurant encounters accidents within the insured period covered in the contract.
Payment at maturity refers to the payment to the insurant in accordance with the life insurance contract at the end of the
insured period.


309
13-1 对外经济主要指标
MAIN INDICATORS OF FOREIGN TRADE AND ECONOMIC COOPERATION
项 目Item
2000 2010 2014 2015 2016 2017
进出口总额(亿美元)Total Value of Imports and Exports (USD 100 million) 639.40 3 467.49 4 877.40 4 424.59 3 984.39 4 141.46
出口总额 Total Exports 345.63 2 041.84 2 843.62 2 640.39 2 375.47 2 443.58
进口总额 Total Imports 293.76 1 425.66 2 033.79 1 784.20 1 608.92 1 697.88
签订利用外商直接投资协 Number of Projects with Contracted Foreign 1 130 1 929 2 490 3 359 4 132 6 757
议(合同)项目(个) Capital (unit)
签订利用外商直接投资协 Amount of Contracted Foreign Capital 17.38 56.52 108.95 255.95 521.93 368.40
议(合同)金额(亿美元) (USD 100 million)
实际利用外商直接投资额 Amount of Foreign Capital Actually Utilized 19.61 42.97 58.05 64.97 67.32 74.01
(亿美元) (USD 100 million)
外商投资企业年底工商登 Number of Registered Enterprises with Foreign 29 364 34 135 37 529 42 621 50 769
记数(户) Investment at the Year-end(unit)
投资总额(亿美元) Total Investment (USD 100 million) 933.32 1 341.53 1 694.92 2 630.15 3 606.52
注册资本(亿美元) Registered Capital(USD 100 million) 546.62 825.51 1 107.25 1 984.17 2 835.10
外商投资企业本期工商登 Number of Registered Enterprises with Foreign 2 585 3 117 4 343 6 024 11 162
记数(户) Investment at the Year-end(unit)
本期投资总额(亿美元) Total Investment(USD 100 million) 27.25 116.31 249.15 809.98 569.82
本期注册资本(亿美元) Registered Capital(USD 100 million) 17.49 98.21 222.51 772.11 538.09

310
13-2 利用外资签订协议(合同)项目
NUMBER OF THE SIGNED AGREEMENTS AND CONTRACTS FOR UTILIZATION OF
FOREIGN CAPITAL单位:项 (unit)
年 份 Year
总 计 Total
一、按投资方式分 Grouped by Investment Mode
对外借款 Foreign Loans
外商直接投资 Direct Foreign
Investments
外商其他投资 Other
Foreign Investments
# 合资经营 Joint
Ventures
# 合作经营 Cooperative Operation
# 外商独资 Soly-Funded
Foreign Enterprises
1979 169 37 7 30 132
1980 303 33 4 24 5 270
1981 578 70 13 39 18 508
1982 577 66 11 47 8 511
1983 878 253 92 149 12 625
1984 988 5 334 188 134 12 649
1985 1 203 40 282 192 73 17 881
1986 454 31 224 152 64 8 199
1987 334 13 310 231 62 17 11
1988 694 4 591 443 93 55 99
1989 711 5 647 473 94 80 59
1990 796 6 757 434 100 223 33
1991 986 6 951 534 122 295 29
1992 1 561 1 1 553 822 227 504 7
1993 3 257 2 3 255 1 735 358 1 162
1994 2 223 2 2 221 1 049 208 964
1995 1 638 5 1 633 764 109 760
1996 999 999 491 38 470
1997 1 786 957 454 30 471 829
1998 1 915 1 391 513 31 844 524
1999 1 558 797 321 15 461 761
2000 1 835 1 130 339 24 766 705
2001 1 860 1 501 396 18 1 087 359
2002 2 191 1 917 361 8 1 544 274
2003 2 573 2 254 333 6 1 913 319
2004 2 718 356 9 2 352 2 36
2005 2 797 308 12 2 469 141
2006 3 105 269 7 2 827 62
2007 4 200 215 8 3 975 25
2008 3 046 139 11 2 896 6
2009 1 498 114 1 1 382 11
2010 1 929 124 1 1 800
2011 2 513 149 2 2 360
2012 2 428 134 2 289
2013 2 056 180 5 1 870
2014 2 490 266 2 222
2015 3 359 488 2 2 861 8
2016 4 132 877 6 3 241 8
2017 6 757 1 261 2 5 485 9
注: 1.根据《商务部、国家统计局关于印发〈外商投资统计制度〉的通知》从2004年开始外商投资统计制度发生变化:一是不再包括“对外借款”,且外商直接 投资的统计口径缩小;二是对外公布的数据为经商务部核准的外商直接投资数据。 Note: There are two changes among the newly statistical system of foreign investment in 2004:1.The index was not include Foreign Loans and statistical scope of Direct Foreign Investments was reduced.2.The released data of Direct Foreign Investments have been verified by State Commercial Department. 2.本表数据来源为深圳市经济贸易和信息化委员会。 Data in this table are provided by Economy,Trade and Information Commission of Shenzhen Municipality.

311
单位:项 13-2 续表 1 continued (unit)
年 份 Year
二、按国民经济行业分 Grouped by Sector
农、林、牧、渔业Agriculture,
Forestry, Animal Husbandry and
Fishery
工 业 Industry
建筑业 Construction
交通运输、仓储和邮政业 Transportation,Storage,Postal and Telecommunications
Services
批发和零售业、住宿 和餐饮业
Wholesale and Retail Sales ,Accommodation and
Catering Services
房地产业 Real Estate
1979 6 112 3 5 3
1980 8 243 4 10 14
1981 9 321 5 5 28
1982 3 457 1 25 8
1983 19 714 15 87 21
1984 14 148 15 117 31
1985 10 164 8 84 15
1986 6 172 3 1 20 14
1987 7 303 1 10
1988 5 646 4 5 12 11
1989 5 666 3 12 10
1990 3 766 2 3 6 3
1991 5 908 3 6 22 30
1992 6 1 464 2 8 20 51
1993 10 2 836 18 23 115 205
1994 6 1 815 20 16 168 135
1995 5 1 377 10 15 104 59
1996 10 858 7 8 53 30
1997 8 1 526 4 13 89 138
1998 5 1 401 3 12 65 286
1999 3 1 351 3 7 28 157
2000 4 1 450 1 23 34 307
2001 3 1 397 1 22 43 315
2002 3 1 616 4 33 103 394
2003 1 660 2 48 100 439
2004 2 1 513 6 53 188 57
2005 1 1 344 9 38 357 77
2006 1 896 11 55 1 238 101
2007 2 860 4 127 1 828 49
2008 350 5 83 1 187 4
2009 1 388 3 28 737 15
2010 1 434 7 29 1 000 11
2011 1 030 6 23 924 19
2012 1 1 027 6 26 865 8
2013 1 335 6 27 971 14
2014 181 7 28 1 089 18
2015 7 163 16 43 1 406 25
2016 7 110 17 53 1 288 32
2017 6 202 41 109 3 036 38

312
单位:项 13-2 续表 2 continued (unit)
年 份 Year
二、按国民经济行业分 Grouped by Sector
卫生和社会工作
Health and Social Work
教育、文化、体育和娱乐业
Education,Culture Sports and
Entertainment
科学研究和技术服务业
Scientific Research,and Technical
Services
金融业 Financial
Intermediation
信息传输、软件和信息技术服务业
Information Transmission, Software and
Information Technology
租赁和商务服务业Leasing and
Business Services
其他行业 Others
1979 40
1980 24
1981 210
1982 83
1983 22
1984 663
1985 922
1986 1 2 1 1 233
1987 7 6
1988 4 7
1989 4 4 7
1990 1 5 7
1991 2 2 6 2
1992 4 4 1 1
1993 6 1 5 1 33
1994 5 8 33 1 15
1995 19 4 31 1 13
1996 8 3 11 2 9
1997 1 7
1998 1 1 138 3
1999 9
2000 1 2 13
2001 1 77 1
2002 1 26 5 5
2003 1 2 298 6 17
2004 4 178 2 715
2005 1 2 348 6 614
2006 7 373 5 418
2007 1 8 947 2 372
2008 3 1 134 2 62 215 1
2009 6 95 3 30 191 1
2010 2 142 4 35 264
2011 138 6 54 313
2012 3 3 105 13 37 334
2013 9 114 73 43 463
2014 8 165 222 81 687 4
2015 2 20 209 405 253 808 2
2016 2 46 295 1 144 327 809 2
2017 4 63 623 741 784 1108 2

313
单位:项 13-2 续表 3 continued (unit)
年 份 Year
三、按国别(地区)分 Grouped by Country (Territory)
中国香港、澳门
HongKong China, Macao
China
中国台湾 Taiwan China
新加坡 Singapore
韩 国 Korea Rep
日 本 Japan
泰 国 Thailand
澳大利亚 Australia
马来西亚 Malaysia
1990 699 45 5 12 2 2 11991 885 36 8 3 17 3 11992 1 330 88 20 5 16 8 6 31993 2 834 154 24 8 27 15 14 51994 1 885 124 29 8 25 8 7 31995 1 288 100 26 14 36 11 9 61996 760 85 15 11 15 4 6 61997 1 576 85 14 9 13 3 5 51998 1 614 119 19 7 12 1 4 21999 1 355 45 14 7 8 22000 1 474 67 19 12 9 1 7 22001 1 288 179 28 22 25 3 10 62002 1 498 239 34 25 35 3 13 112003 1 852 260 25 35 33 3 14 62004 1 959 122 44 42 51 14 102005 1 974 144 51 43 45 3 9 62006 2 233 152 48 42 38 2 28 172007 3 427 165 48 50 46 6 19 102008 2 582 82 27 34 41 2 10 152009 1 142 85 17 25 24 4 9 112010 1 472 112 23 24 34 3 5 152011 1 985 125 29 37 27 2 10 122012 1 988 76 25 40 25 3 10 122013 1 611 110 29 38 22 2 12 112014 2 011 119 41 55 21 2 9 122015 2 673 164 48 91 16 2 17 262016 3 365 186 43 66 12 7 17 442017 5 717 234 54 59 27 6 26 53
单位:项 13-2 续表 4 continued (unit)
年 份 Year
三、按国别(地区)分 Grouped by Country (Territory)
美 国 The United
States
加拿大 Canada
德 国 Germany
法 国 France
英 国 The United Kingdom
瑞 士 Switzerland
荷 兰 Netherlands
其 他 Others
1990 16 2 1 2 3 61991 18 2 2 3 2 1 1 41992 57 8 1 2 5 1 111993 104 22 2 4 16 2 3 231994 74 10 5 3 19 1 221995 71 9 3 1 18 2 4 401996 42 7 3 4 14 1 2 241997 35 8 2 3 5 3 201998 58 4 5 1 4 1 3 611999 37 12 3 4 1 702000 52 17 4 1 3 2 1652001 72 14 2 2 2 2 2 2032002 77 12 4 3 9 1 7 2202003 72 23 2 3 7 4 2342004 84 22 12 5 15 1 6 3312005 100 16 14 4 24 7 9 3482006 110 19 11 5 21 5 7 3672007 78 15 12 3 15 2 5 2992008 62 13 4 3 9 6 3 1532009 49 10 7 7 5 1 1022010 46 7 7 9 6 2 3 1612011 51 8 15 9 7 1 2 1932012 30 11 7 5 6 3 1 1862013 36 12 8 9 10 4 5 1372014 38 13 5 3 14 2 6 1392015 65 22 10 4 14 1 6 2002016 80 29 14 11 25 4 4 2252017 101 32 20 17 34 4 3 370
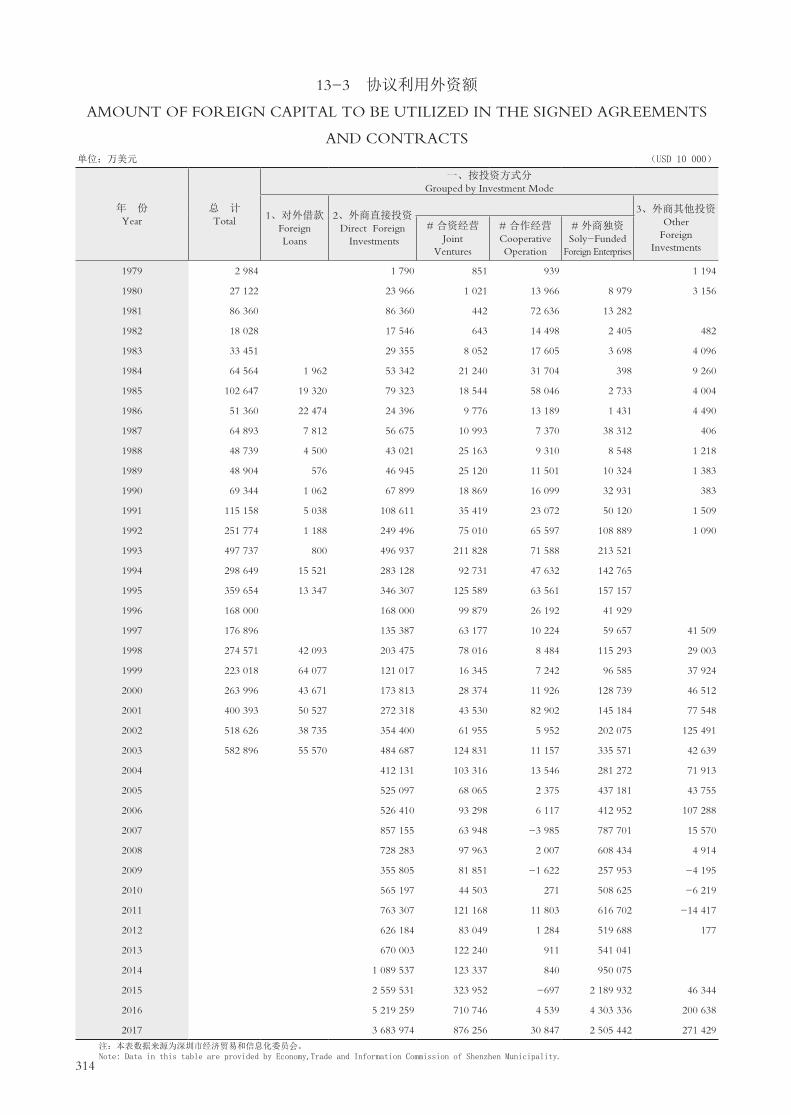
314
13-3 协议利用外资额
AMOUNT OF FOREIGN CAPITAL TO BE UTILIZED IN THE SIGNED AGREEMENTS
AND CONTRACTS单位:万美元 (USD 10 000)
年 份 Year
总 计 Total
一、按投资方式分 Grouped by Investment Mode
1、对外借款 Foreign Loans
2、外商直接投资 Direct Foreign
Investments
3、外商其他投资 Other
Foreign Investments
# 合资经营 Joint
Ventures
# 合作经营 Cooperative Operation
# 外商独资 Soly-Funded
Foreign Enterprises
1979 2 984 1 790 851 939 1 194
1980 27 122 23 966 1 021 13 966 8 979 3 156
1981 86 360 86 360 442 72 636 13 282
1982 18 028 17 546 643 14 498 2 405 482
1983 33 451 29 355 8 052 17 605 3 698 4 096
1984 64 564 1 962 53 342 21 240 31 704 398 9 260
1985 102 647 19 320 79 323 18 544 58 046 2 733 4 004
1986 51 360 22 474 24 396 9 776 13 189 1 431 4 490
1987 64 893 7 812 56 675 10 993 7 370 38 312 406
1988 48 739 4 500 43 021 25 163 9 310 8 548 1 218
1989 48 904 576 46 945 25 120 11 501 10 324 1 383
1990 69 344 1 062 67 899 18 869 16 099 32 931 383
1991 115 158 5 038 108 611 35 419 23 072 50 120 1 509
1992 251 774 1 188 249 496 75 010 65 597 108 889 1 090
1993 497 737 800 496 937 211 828 71 588 213 521
1994 298 649 15 521 283 128 92 731 47 632 142 765
1995 359 654 13 347 346 307 125 589 63 561 157 157
1996 168 000 168 000 99 879 26 192 41 929
1997 176 896 135 387 63 177 10 224 59 657 41 509
1998 274 571 42 093 203 475 78 016 8 484 115 293 29 003
1999 223 018 64 077 121 017 16 345 7 242 96 585 37 924
2000 263 996 43 671 173 813 28 374 11 926 128 739 46 512
2001 400 393 50 527 272 318 43 530 82 902 145 184 77 548
2002 518 626 38 735 354 400 61 955 5 952 202 075 125 491
2003 582 896 55 570 484 687 124 831 11 157 335 571 42 639
2004 412 131 103 316 13 546 281 272 71 913
2005 525 097 68 065 2 375 437 181 43 755
2006 526 410 93 298 6 117 412 952 107 288
2007 857 155 63 948 -3 985 787 701 15 570
2008 728 283 97 963 2 007 608 434 4 914
2009 355 805 81 851 -1 622 257 953 -4 195
2010 565 197 44 503 271 508 625 -6 219
2011 763 307 121 168 11 803 616 702 -14 417
2012 626 184 83 049 1 284 519 688 177
2013 670 003 122 240 911 541 041
2014 1 089 537 123 337 840 950 075
2015 2 559 531 323 952 -697 2 189 932 46 344
2016 5 219 259 710 746 4 539 4 303 336 200 638
2017 3 683 974 876 256 30 847 2 505 442 271 429
注:本表数据来源为深圳市经济贸易和信息化委员会。 Note: Data in this table are provided by Economy,Trade and Information Commission of Shenzhen Municipality.

315
单位:万美元 13-3 续表 1 continued (USD 10 000)
年 份 Year
二、按国民经济行业分 Grouped by Sector
农、林、牧、渔业Agriculture,
Forestry, Animal Husbandry and
Fishery
工 业 Industry
建筑业 Construction
交通运输、仓储和邮政业
Transportation, Storage, Postal and
Telecommunications Services
批发和零售业、住宿和餐饮业
Wholesale and Retail Sales, Accommodation and Catering Services
房地产业Real Estate
1979 119 1 163 537 179 538
1980 1 085 10 577 4 883 1 628 4 883
1981 3 454 33 680 15 545 5 182 15 675
1982 213 6 269 3 245 1 082 3 245
1983 1 345 13 145 5 978 2 085 6 042
1984 214 16 936 1 933 27 152 6 349
1985 439 56 558 3 935 13 510 4 928
1986 187 12 197 3 849 102 3 773 4 075
1987 359 54 644 13 2 065
1988 273 36 686 149 899 2 403 3 568
1989 120 37 885 643 3 499 4 939
1990 99 55 931 138 378 5 197 3 802
1991 888 77 756 3 839 1 665 5 742 17 197
1992 2 878 176 536 1 180 8 321 4 724 51 153
1993 378 292 842 3 646 37 086 48 641 77 660
1994 263 177 967 1 264 1 585 37 774 59 615
1995 438 243 725 4 468 21 376 21 903 51 630
1996 763 123 973 11 905 1 827 12 443 9 200
1997 481 129 826 2 671 4 864 7 977 29 839
1998 1 417 184 011 3 678 16 008 11 323 44 075
1999 89 207 778 225 -2 439 2 359 16 108
2000 94 216 845 -913 2 990 7 795 36 672
2001 -202 343 834 445 6 299 5 936 38 853
2002 98 357 927 650 29 752 15 303 43 677
2003 699 362 144 466 40 517 18 346 89 112
2004 1 040 246 824 525 8 923 12 230 29 502
2005 184 227 994 20 041 41 960 42 019 61 235
2006 84 215 287 490 39 107 78 194 80 598
2007 -561 250 677 -24 16 890 197 432 109 325
2008 -95 230 858 3 928 13 374 192 763 70 910
2009 52 90 645 682 51 452 64 715 56 192
2010 314 105 151 1 162 17 878 155 857 130 934
2011 262 143 1 222 20 028 144 719 95 492
2012 243 452 1 183 28 754 89 786 47 192
2013 524 122 170 594 2 490 141 389 34 874
2014 393 98 963 396 16 413 185 828 17 278
2015 1 627 112 971 6 149 36 982 292 058 286 294
2016 2 582 344 909 18 605 4 232 413 607 281 796
2017 72 941 183 512 8 733 42 376 565 083 106 256

316
单位:万美元 13-3 续表 2 continued (USD 10 000)
年 份 Year
二、按国民经济行业分 Grouped by Sector
卫生和社会工作
Health and Social Work
教育、文化、体育和娱乐业
Education,Culture Sports and
Entertainment
科学研究和技术服务业
Scientific Research,and Technical Services
金融业 Financial
Intermediation
信息传输、软件和信息技术服务业
Information Transmission, Software and
Information Technology
租赁和商务服务业Leasing and
Business Services
其他行业 Others
1979 448
1980 4 066
1981 12 824
1982 3 974
1983 4 856
1984 11 980
1985 23 277
1986 19 16 4 129 27 009
1987 6 000 1 812
1988 4 500 261
1989 300 108 1 410
1990 2 574 123 1 102
1991 669 240 5 038 2 124
1992 3 239 97 1 188 2 458
1993 991 2 900 94 2 100 31 106
1994 628 6 552 1 393 29 11 572
1995 625 1 250 1 103 2 170 2 966
1996 2 664 1 750 487 2 301 687
1997 161 426 651
1998 1 584 36 8 043 4 911 -515
1999 -5 037 579 3 356
2000 -460 158 486 27 302
2001 120 793 5 886 1 000 -2 571
2002 707 38 2 396 60 980 7 098
2003 779 2 071 21 947 13 654 28 054
2004 1 563 13 697 144 97 683
2005 993 1 371 36 825 8 813 83 662
2006 -132 4 288 38 188 3 085 67 221
2007 2 190 371 115 229 1 250 164 376
2008 1 351 135 320 594 32 517 45 135 1 628
2009 783 17 549 38 750 2 367 32 584 34
2010 2 902 52 828 4 004 17 687 76 480
2011 1 866 52 673 -22 595 16 848 190 892 19
2012 665 17 005 29 983 30 563 17 235 120 366
2013 3 235 28 016 160 495 8 517 167 699
2014 -20 185 59 796 505 875 45 131 157 885 1 414
2015 -187 -3 589 66 585 1 171 149 189 865 398 707 920
2016 227 21 077 145 886 3 337 411 68 199 580 578 150
2017 783 5 862 197 858 1 400 925 367 195 732 402 48

317
单位:万美元 13-3 续表 3 continued (USD 10 000)
年 份 Year
三、按国别(地区)分 Grouped by Country (Territory)
中国香港、澳门
HongKong China, Macao
China
中国台湾 Taiwan China
新加坡 Singapore
韩 国 Korea Rep.
日 本 Japan
泰 国 Thailand
澳大利亚 Australia
马来西亚 Malaysia
1987 16 431 427 10 336 112 85
1988 33 363 1 407 1 735 6 762 41
1989 40 214 986 328 1 131 2 585 48
1990 54 729 4 839 3 134 1 058 1 092 550 17
1991 54 729 4 839 3 134 1 058 1 092 550 17
1992 206 231 10 814 2 151 1 174 5 843 416 3 198 1 679
1993 411 673 21 908 2 132 665 7 491 5 284 7 934 392
1994 260 535 12 075 6 996 384 2 692 1 421 184 114
1995 274 815 7 344 7 940 1 926 20 914 978 227 2 024
1996 80 115 3 376 1 847 50 895 1 120 347 340 210
1997 98 839 4 951 1 874 2 517 59 293
1998 153 002 6 375 10 002 343 15 184 1 030
1999 111 587 2 965 6 569 7 15 842 32 -154
2000 141 259 3 976 5 359 628 1 677 7 511 300
2001 180 030 19 328 6 371 888 8 379 115 920 56
2002 205 225 26 226 5 879 1 543 1 998 -939 2 381 1 570
2003 340 288 18 290 9 916 2 608 10 027 1 165 340 96
2004 198 695 9 276 6 479 4 506 6 025 400 745 3 838
2005 265 109 1 802 13 508 861 8 802 171 -139 -237
2006 362 411 3 883 8 107 486 8 866 26 1 822 3 568
2007 667 020 4 837 5 989 2 407 4 110 242 -1 190 133
2008 618 340 -1 030 1 618 804 4 138 17 -585 678
2009 323 420 245 4 974 239 -3 251 198 -283 672
2010 449 569 980 8 180 316 3 730 61 24 517
2011 536 353 9 961 22 437 23 771 15 026 8 -67 -771
2012 508 831 6 997 2 666 939 23 173 164 -308 1 001
2013 497 375 771 24 819 3 763 7 022 179 194 -2 534
2014 961 581 4 044 9 940 1 016 11 468 28 2 741 1 757
2015 2 287 102 26 580 5 846 3 320 6 322 84 710 850
2016 4 871 076 17 212 279 12 945 6 512 560 765 11 696
2017 3 250 763 21 323 128 550 3 896 490 516 1 539 5 044

318
单位:万美元 13-3 续表 4 continued (USD 10 000)
年 份 Year
三、按国别(地区)分 Grouped by Country (Territory)
美 国 The United
States
加拿大 Canada
德 国 Germany
法 国 France
英 国 The United Kingdom
瑞 士 Switzerland
荷 兰 Netherlands
其 他 Others
1987 779 300 23 36 400
1988 3 441 100 1 162 22 603 103
1989 2 290 63 48 249 562 400
1990 1 253 115 8 772 809 968
1991 981 34 210 392 1 700 83 819 320
1992 4 764 4 067 31 111 5 373 5 5 917
1993 18 289 7 245 368 534 7 352 500 175 5 795
1994 8 010 921 222 78 2 421 25 2 571
1995 17 020 426 1 995 3 900 3 641 6 6 315 10 183
1996 3 876 368 357 227 2 493 15 2 659 19 755
1997 2 177 553 1 365 182 128 1 061 62 897
1998 10 759 215 3 077 21 270 7 489 4 142 41 683
1999 22 954 144 2 367 23 561 8 543 -17 2 853 25 765
2000 11 611 987 3 214 26 698 11 894 1 388 54 487
2001 5 239 997 1 224 33 920 5 987 683 -1 383 137 639
2002 79 346 -32 492 24 533 65 794 1 565 -199 103 244
2003 17 082 907 399 3 753 10 540 83 7 219 160 183
2004 14 007 434 2 379 2 317 11 263 140 7 154 144 473
2005 5 532 121 1 857 177 3 710 537 3 264 220 022
2006 4 974 196 911 482 1 748 299 7 136 121 495
2007 7 946 572 612 751 2 267 439 3 772 157 248
2008 11 773 2 385 1 357 4 445 636 922 756 82 029
2009 4 223 198 152 -946 2 398 381 401 22 784
2010 12 622 -2 011 -262 2 040 -1 162 -35 -1 158 91 786
2011 34 899 204 782 31 436 -9 -70 89 347
2012 1 600 -120 -355 -86 69 451 -5 078 86 240
2013 3 849 -185 317 77 1 830 84 1 843 130 599
2014 9 196 199 85 -1 121 1 143 -7 390 87 077
2015-803 6 820 1 055 79 2 664 227 1 745 216 930
2016 7 804 17 471 2912 223 93 199 7 829 1 265 263 845
2017 1 495 2 645 1 638 1 060 12 278 213 5 261 247 263

319
13-4 实际利用外资额
AMOUNT OF FOREIGN CAPITAL ACTUALLY USED
单位:万美元 (USD 10 000)
年 份 Year
总 计 Total
一、按投资方式分 Grouped by Investment Mode
对外借款 Foreign Loans
外商直接投资 Direct Foreign
Investments
外商其他投资 Other
Foreign Investments
# 合资经营 Joint
Ventures
# 合作经营 Cooperative Operation
# 外商独资 Soly-Funded
Foreign Enterprises
1979 1 537 548 192 356 989
1980 3 264 2 755 252 1 891 612 509
1981 11 282 8 618 1 073 5 427 2 118 2 664
1982 7 379 5 771 1 114 3 823 834 1 608
1983 14 394 11 316 1 906 6 077 3 333 3 078
1984 23 013 1 962 18 640 8 008 5 990 4 642 2 411
1985 32 925 13 585 17 989 6 993 10 316 680 1 351
1986 48 933 10 860 36 450 5 124 30 241 1 085 1 623
1987 40 449 12 436 27 379 8 489 17 826 1 064 634
1988 44 429 14 430 28 716 9 644 10 085 8 987 1 283
1989 45 809 15 563 29 252 16 852 7 182 5 218 994
1990 51 857 12 360 38 994 26 849 4 917 7 228 503
1991 57 988 17 184 39 875 27 330 5 185 7 360 929
1992 71 539 25 808 44 879 20 554 8 716 15 609 852
1993 143 217 43 762 98 900 48 165 15 097 35 638 555
1994 172 959 47 367 125 046 49 312 21 388 54 346 546
1995 173 545 42 556 130 989 33 120 28 003 69 866
1996 242 242 37 177 205 065 89 228 26 776 89 061
1997 287 168 57 095 166 112 53 271 20 771 92 070 63 961
1998 255 222 55 717 166 357 73 762 22 354 67 561 33 148
1999 275 422 64 077 177 839 74 848 18 954 82 556 33 506
2000 296 839 43 671 196 145 71 789 19 102 103 061 57 023
2001 360 277 44 527 259 080 59 076 56 621 139 157 56 670
2002 490 220 49 511 319 101 79 480 39 550 149 642 121 608
2003 504 213 57 928 362 344 115 245 20 850 193 915 83 941
2004 234 994 48 868 6 281 169 650 126 232
2005 296 872 50 807 8 299 230 996 104 841
2006 326 852 56 623 2 609 252 313 158 419
2007 366 220 64 843 1 334 295 550 99 277
2008 403 018 43 441 2 038 354 971 75 827
2009 416 001 54 993 551 342 234 12 242
2010 429 724 63 281 1 292 341 964 17 218
2011 459 921 48 409 1 367 397 391 23 696
2012 522 944 81 675 3 949 418 054 2 768
2013 546 789 79 900 1 340 461 585 403
2014 580 469 80 834 163 484 416
2015 649 733 57 037 1 719 581 450 9 527
2016 673 227 92 018 115 574 622 6 472
2017 740 126 194 084 501 601 44 441
注:本表数据来源为深圳市经济贸易和信息化委员会。
Note: Data in this table are provided by Economy,Trade and Information Commission of Shenzhen Municipality.
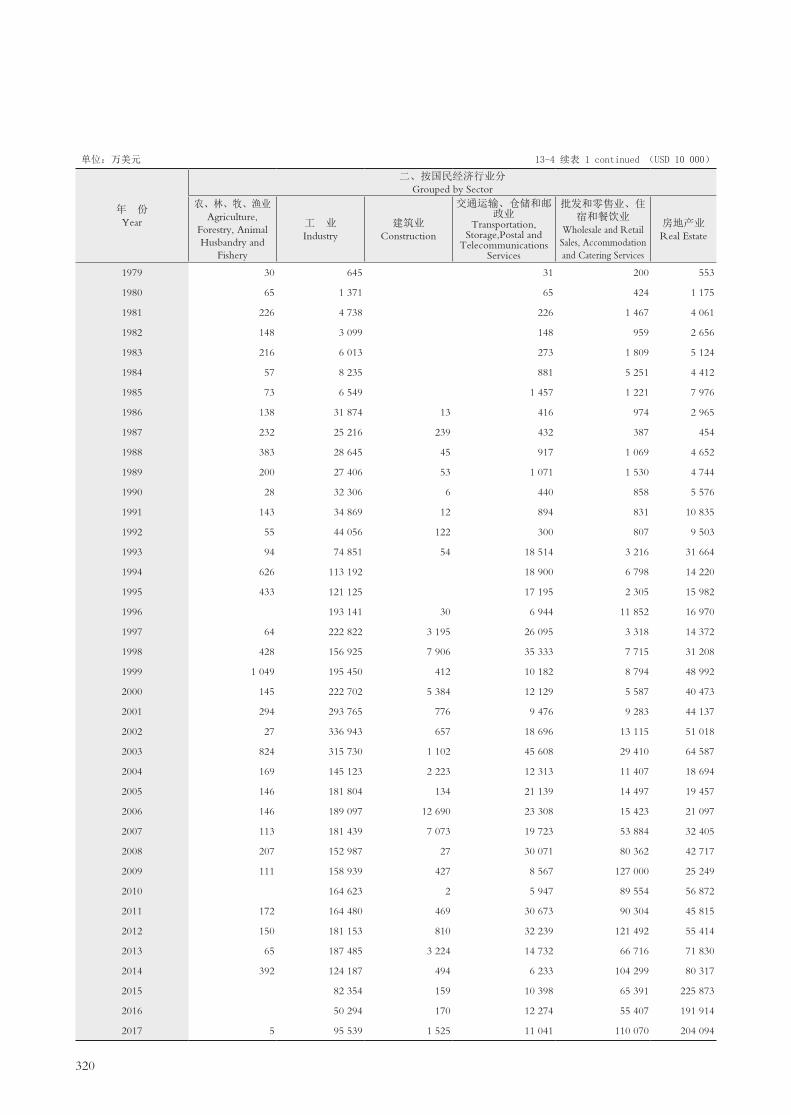
320
单位:万美元 13-4 续表 1 continued (USD 10 000)
年 份 Year
二、按国民经济行业分 Grouped by Sector
农、林、牧、渔业Agriculture,
Forestry, Animal Husbandry and
Fishery
工 业 Industry
建筑业 Construction
交通运输、仓储和邮政业
Transportation, Storage,Postal and
Telecommunications Services
批发和零售业、住宿和餐饮业
Wholesale and Retail Sales, Accommodation and Catering Services
房地产业Real Estate
1979 30 645 31 200 553
1980 65 1 371 65 424 1 175
1981 226 4 738 226 1 467 4 061
1982 148 3 099 148 959 2 656
1983 216 6 013 273 1 809 5 124
1984 57 8 235 881 5 251 4 412
1985 73 6 549 1 457 1 221 7 976
1986 138 31 874 13 416 974 2 965
1987 232 25 216 239 432 387 454
1988 383 28 645 45 917 1 069 4 652
1989 200 27 406 53 1 071 1 530 4 744
1990 28 32 306 6 440 858 5 576
1991 143 34 869 12 894 831 10 835
1992 55 44 056 122 300 807 9 503
1993 94 74 851 54 18 514 3 216 31 664
1994 626 113 192 18 900 6 798 14 220
1995 433 121 125 17 195 2 305 15 982
1996 193 141 30 6 944 11 852 16 970
1997 64 222 822 3 195 26 095 3 318 14 372
1998 428 156 925 7 906 35 333 7 715 31 208
1999 1 049 195 450 412 10 182 8 794 48 992
2000 145 222 702 5 384 12 129 5 587 40 473
2001 294 293 765 776 9 476 9 283 44 137
2002 27 336 943 657 18 696 13 115 51 018
2003 824 315 730 1 102 45 608 29 410 64 587
2004 169 145 123 2 223 12 313 11 407 18 694
2005 146 181 804 134 21 139 14 497 19 457
2006 146 189 097 12 690 23 308 15 423 21 097
2007 113 181 439 7 073 19 723 53 884 32 405
2008 207 152 987 27 30 071 80 362 42 717
2009 111 158 939 427 8 567 127 000 25 249
2010 164 623 2 5 947 89 554 56 872
2011 172 164 480 469 30 673 90 304 45 815
2012 150 181 153 810 32 239 121 492 55 414
2013 65 187 485 3 224 14 732 66 716 71 830
2014 392 124 187 494 6 233 104 299 80 317
2015 82 354 159 10 398 65 391 225 873
2016 50 294 170 12 274 55 407 191 914
2017 5 95 539 1 525 11 041 110 070 204 094

321
单位:万美元 13-4 续表 2 continued (USD 10 000)
年 份 Year
二、按国民经济行业分 Grouped by Sector
卫生和社会工作
Health and Social Work
教育、文化、体育和娱乐业
Education,Culture Sports and
Entertainment
科学研究和技术服务业
Scientific Research,and Technical
Services
金融业 Financial
Intermediation
信息传输、软件和信息技术服务业
Information Transmission, Software and
Information Technology
租赁和商务服务业Leasing and
Business Services
其他行业
Others
1979 78
1980 164
1981 564
1982 369
1983 959
1984 4 177
1985 15 649
1986 6 8 948 3 599
1987 6 39 10 247 3 197
1988 161 30 20 4 168 4 339
1989 33 10 666 106
1990 34 5 913 6 696
1991 35 9 837 532
1992 13 17 14 008 2 658
1993 500 254 14 070
1994 234 1 445 132 5 751 11 661
1995 10 921 625 4 327 632
1996 1 236 68 550 9 339 2 112
1997 1 750 470 17 6 638 8 427
1998 831 548 234 12 021 2 073
1999 4 659 441 3 383 2 060
2000 1 600 377 379 1 579 6 484
2001 758 18 501 1 000 269
2002 1 514 63 2 846 58 734 6 607
2003 220 626 2 809 18 587 19 586
2004 100 6 384 1 285 37 196
2005 120 346 9 366 20 49 843
2006 597 12 841 7 266 44 387
2007 439 334 22 843 1 566 46 401
2008 372 675 27 852 15 161 52 587
2009 2 005 57 935 9 134 26 634
2010 373 37 460 1 591 23 705 49 597
2011 1 678 39 164 7 072 25 697 54 331 66
2012 186 8 758 39 668 1 338 5 135 76 601
2013 5 867 39 518 19 972 7 258 130 122
2014 556 928 34 870 67 505 22 184 138 504
2015 2 395 25 079 71 649 30 007 136 267 161
2016 1 10 810 106 958 35 793 209 606
2017 121 13 48 787 88 726 19 727 160 434 44

322
单位:万美元 13-4 续表 3 continued (USD 10 000)
年 份 Year
三、按国别(地区)分 Grouped by Country (Territory)
中国香港、澳门
HongKong China, Macao
China
中国台湾 Taiwan China
新加坡 Singapore
韩 国 Korea Rep.
日 本 Japan
泰 国 Thailand
澳大利亚 Australia
马来西亚 Malaysia
1987 25 632 247 9 291 32 29
1988 28 198 316 146 14 567 10
1989 28 729 1 006 1 177 10 004 166
1990 26 291 371 897 17 257 723
1991 32 375 216 339 125 14 265 700
1992 46 134 475 475 15 806 914 323 117
1993 92 455 4 532 1 197 170 20 822 1 577 155
1994 125 890 10 671 1 270 18 740 102 645
1995 105 172 6 954 845 32 067 520
1996 150 126 13 665 7 525 7 094 29 860 3 381 340 2 024
1997 203 035 6 732 2 502 309 17 616 1 133 19 750
1998 182 956 3 479 1 089 352 8 959 257 56 45
1999 144 214 3 842 9 855 11 133 18 666 1 047 145 64
2000 184 531 3 940 6 023 8 136 5 113 219 1 724
2001 194 212 12 518 7 521 162 8 183 6 365 263
2002 216 516 28 876 8 449 541 10 498 1 307 687 245
2003 318 337 28 479 10 471 4 489 12 154 69 172 348
2004 125 379 4 002 4 576 411 3 215 200 345 1 394
2005 157 487 5 328 5 368 1 507 6 590 148 848 888
2006 167 338 3 044 11 352 484 4 660 31 422 587
2007 223 877 3 278 7 348 322 4 319 261 1 643 253
2008 256 893 4 565 4 280 1 339 2 887 35 264 540
2009 275 819 2 186 6 297 489 3 942 13 54 1 127
2010 310 221 1 737 9 393 472 2 774 136 148 398
2011 326 079 1 852 11 395 4 674 10 745 65 180 94
2012 379 918 4 484 6 112 19 729 5 235 51 46 1 320
2013 418 654 3 541 9 285 451 7 167 88 17 28
2014 438 748 5 635 7 143 3 708 7 027 43 25 123
2015 561 412 797 8 304 496 4 330 10 167 88
2016 599 055 761 4 004 427 7 070 30 12 168
2017 657 404 494 4 714 29 317 1 483 6

323
单位:万美元 13-4 续表 4 continued (USD 10 000)
年 份 Year
三、按国别(地区)分 Grouped by Country (Territory)
美 国 The United
States
加拿大 Canada
德 国 Germany
法 国 France
英 国 The United Kingdom
瑞 士 Switzerland
荷 兰 Netherlands
其 他 Others
1987 3 101 899 18 1 194 6
1988 294 150 201 501 5 41
1989 1 143 16 3 399 112 57
1990 4 011 35 1 112 235 500 337 88
1991 6 963 5 1 668 457 819 56
1992 2 029 3 225 1 109 84 633 155
1993 14 531 450 3 153 64 510 3 511 90
1994 3 371 628 130 2 206 6 662 2 520 124
1995 14 145 194 250 8 963 1 099 2 623 713
1996 10 576 162 911 2 985 1 820 794 125 10 854
1997 24 306 215 1 365 182 3 888 6 25 110
1998 4 326 364 505 24 610 9 002 188 1 601 17 433
1999 688 22 111 650 23 933 9 291 170 5 721 23 892
2000 11 498 739 3 477 26 613 11 498 1 080 3 677 28 571
2001 5 929 668 1 339 27 912 8 238 1 551 497 90 913
2002 63 310 632 1 811 24 814 49 112 1 142 2 783 79 506
2003 10 540 907 289 3 759 9 417 1 006 1 686 102 090
2004 8 189 436 517 23 3 014 200 2 266 80 827
2005 9 066 594 347 1 449 8 517 21 3 251 95 463
2006 7 129 189 2 274 186 1 536 253 2 164 125 203
2007 4 052 181 1 437 931 1 555 137 6 227 110 399
2008 7 613 244 142 870 923 30 3 037 119 356
2009 5 071 263 626 1 721 1 328 202 1 282 115 581
2010 8 960 91 381 4 1 065 558 1 805 91 581
2011 8 188 196 890 1 109 116 133 12 94 193
2012 28 437 145 395 550 84 16 669 75 753
2013 4 705 70 842 22 026 995 1 077 77 843
2014 2 875 82 168 9 365 44 440 1 462 103 581
2015 1 108 21 34 213 3 12 72 738
2016 1 424 34 37 8 6 334 391 53 472
2017 1 238 257 1 313 283 121 620 42 876

324
13-5 实际外商直接投资
DIRECT FOREIGN INVESTMENTS ACTUALLY USED
单位:亿美元 (USD 100 million)
年 份 Year
实际利用外资金额 Direct Foreign Investments
Actually Used
指 数(%) Indices(%)
以1979年为100 1979=100
以上年为100 Preceding Year=100
1979 0.05 100.0
1980 0.28 502.7 502.7
1981 0.86 1 572.6 312.8
1982 0.58 1 053.1 67.0
1983 1.13 2 065.0 196.1
1984 1.86 3 401.5 164.7
1985 1.80 3 282.7 96.5
1986 3.65 6 651.5 202.6
1987 2.74 4 996.2 75.1
1988 2.87 5 240.1 104.9
1989 2.93 5 338.0 101.9
1990 3.90 7 115.7 133.3
1991 3.99 7 276.5 102.3
1992 4.49 8 189.6 112.5
1993 9.89 18 047.4 220.4
1994 12.50 22 818.6 126.4
1995 13.10 23 903.1 104.8
1996 20.51 37 420.6 156.6
1997 16.61 30 312.4 81.0
1998 16.64 30 357.1 100.1
1999 17.78 32 452.4 106.9
2000 19.61 35 792.9 110.3
2001 25.91 47 277.4 132.1
2002 31.91 58 230.1 123.2
2003 36.23 66 121.2 113.6
2004 23.50 72 997.8 110.4
2005 29.69 92 196.2 126.3
2006 32.69 101 508.0 110.1
2007 36.62 113 689.0 112.0
2008 40.30 125 171.6 110.1
2009 41.60 129 177.1 103.2
2010 42.97 133 439.9 103.3
2011 45.99 142 780.7 107.0
2012 52.29 162 341.7 113.7
2013 54.68 169 809.4 104.6
2014 58.05 180 337.6 106.2
2015 64.97 201 797.8 111.9
2016 67.32 209 062.5 103.6
2017 74.01 229 759.7 109.9
年平均增长率 22.6
Average Annual Growth Rate注:1.本表指数按可比口径计算。 Note: Data in this table are calculated at comparable scope.
2.本表数据来源为深圳市经济贸易和信息化委员会。
Data in this table are provided by Economy,Trade and Information Commission of Shenzhen Municipality.

325
13-6 外商投资企业工商登记情况(按企业类别分)(2017年末)
BUSINESS REGISTRATION OF FOREIGN INVESTED ENTERPRISES AT YEAR-END
(GROUPED BY REGISTRATION STATUS) (2017)单位:万美元 ( USD 10 000)
项目Item
期末实有Final Actual Amount
户数(户)Enterprises
(Unit)
投资总额Total
Investment
注册资本(认缴出资金额)(Subscribed Capital Contribution)
小计Subtotal
#外方Foreign Side
合计 Total 50 769 36 065 183 28 351 022 18 996 031
中外合资 Sino-foreign Joint Ventures 4 618 12 321 240 9 918 538 2 488 263
中外合作(法人)Sino-foreign Cooperative Enterprises(Juridical Person)
293 739 011 326 464 142 410
中外合作(非法人)Sino-foreign Cooperative Enterprises(Unincorporated)
109
外资企业 Foreign-funded Enterprises 36 005 20 890 262 15 522 843 15 522 843
外商投资股份有限公司Companies Limited by Shares with Foreign Investment
176 2 114 575 2 045 100 546 966
其他外商投资企业 Other Foreign-invested Enterprises 264 538 077 295 548
合伙企业 Partnership Enterprises 261 537 982 295 492
普通合伙 General Partnership Enterprises 18 877 216
#特殊的普通合伙 Special General Partnership Enterprises 4
有限合伙 Limited Partership Enterprises 243 537 105 295 276
其他企业 Other Enterprises 3 95 95 56
外商投资企业分支机构 Foregin-invested Enterprises Branches 9 304
注: 本表数据来源为深圳市市场和质量监督管理委员会信息中心。Note: Data in this table are provided by Market and Quality Supervision Commission of Shenzhen Municipality.

326
单位:万美元 13-6 续表1 continued(USD 10 000)
项目Item
本期登记Registration of the Current Period
户数(户)Enterprises
(Unit)
投资总额Total
Investment
注册资本(认缴出资金额)(Subscribed Capital Contribution)
小计Subtotal
#外方Foreign Side
合计 Total 11 162 5 698 238 5 380 896 2 997 847
中外合资 Sino-foreign Joint Ventures 1 155 2 760 728 2 687 615 414 836
中外合作(法人)Sino-foreign Cooperative Enterprises(Juridical Person)
5 33 044 33 044 30 745
中外合作(非法人)Sino-foreign Cooperative Enterprises(Unincorporated)
外资企业 Foreign-funded Enterprises 8 824 2 900 242 2 542 980 2 542 980
外商投资股份有限公司Companies Limited by Shares with Foreign Investment
7 4 129 4 129 1 698
其他外商投资企业 Other Foreign-invested Enterprises 90 95 113 129 7 588
合伙企业 Partnership Enterprises 87 113 034 7 532
普通合伙 General Partnership Enterprises 3 475 10
#特殊的普通合伙 Special General Partnership Enterprises
有限合伙 Limited Partership Enterprises 84 112 559 7 521
其他企业 Other Enterprises 3 95 95 56
外商投资企业分支机构 Foregin-invested Enterprises Branches 1 081

327
单位:万美元 13-6 续表2 continued(USD 10 000)
项目Item
注销(户)Logouted Enterprises(unit)
吊销(户)Revoked Enterprises(unit)
本期注销Logouted
Enterprises of the current period
累计注销Total Number of Logouted Enterprises
本期吊销Revoked
Enterprises of the current period
累计吊销Total Number of Revoked Enterprises
合计 Total 1 209 12 451 1 777 25 700
中外合资 Sino-foreign Joint Ventures 71 969 58 1 308
中外合作(法人)Sino-foreign Cooperative Enterprises(Juridical Person)
8 170 12 1 172
中外合作(非法人)Sino-foreign Cooperative Enterprises(Unincorporated)
10 285 132 381
外资企业 Foreign-funded Enterprises 610 5 104 543 19 135
外商投资股份有限公司 Companies Limited by Shares with Foreign Investment
1 7 4 32
其他外商投资企业 Other Foreign-invested Enterprises 4 10 1 1
合伙企业 Partnership Enterprises 4 10 1 1
普通合伙 General Partnership Enterprises 1 4
#特殊的普通合伙 Special General Partnership Enterprises
有限合伙 Limited Partership Enterprises 3 6 1 1
其他企业 Other Enterprises
外商投资企业分支机构 Foregin-invested Enterprises Branches 505 5 906 1 027 3 671

328
13-7 外商投资企业工商登记情况(按行业类别分)(2017年末)
BUSINESS REGISTRATION OF FOREIGN INVESTED ENTERPRISES AT YEAR-END
(GROUPED BY SECTOR)(2017)单位:万美元 (USD 10 000)
项目Item
期末实有Final Actual Amount
户数(户)Enterprises
(Unit)
投资总额Total
Investment
注册资本(认缴出资金额)(Subscribed Capital Contribution)
小计Subtotal
#外方Foreign Side
合计 Total 50 769 36 065 183 28 351 022 18 996 031
农、林、牧、渔业 Agriculture,Forestry,Animal Husbandry 57 33 332 30 987 28 014
and Fishery
农、林、牧、渔服务业 Agriculture,Forestry,Animal Husbandry 16 5 938 4 593 2 535
and Fishery Services
采矿业 Mining 7 16 994 6 052 2 158
开采辅助活动 Mining Auxiliary Activities 1 140 100 100
制造业 Manufacturing 11 298 7 171 948 4 712 368 3 277 462
金属制品、机械和设备修理业 Metal Products Machinery And Equipmet 75 50 631 28 840 27 931
Repair Services
电力、热力、燃气及水生产和供应业
Production and Supply of Electric 218 2 010 230 1 132 666 351 100
Power,Gas and Water
建筑业 Construction 355 359 387 300 455 171 693
批发和零售业 Wholesale and Retail Trade 17 156 3 066 436 2 391 576 2 039 893
交通运输、仓储和邮政业 Transport,Storage and Postal Services 1 319 850 450 473 683 348 603
住宿和餐饮业 Hotels and Catering Services 2 001 156 559 104 702 79 632
信息传输、软件和信息技术服务业 Information Transmission,Computer 3 456 2 093 113 1 279 038 1 177 519
Services and Software
金融业 Financial Intermediation 2 870 10 238 947 10 192 717 5 796 834
房地产业 Real Estate 1 733 2 894 951 1 516 044 1 352 376
租赁和商务服务业 Leasing and Business Services 6 388 5 499 182 4 987 686 3 365 837
科学研究和技术服务业 Scientific Research and Technical Services 2 442 1 030 816 763 678 629 880
水利、环境和公共设施管理业 Management of Water Consercancy, 44 18 025 16 967 15 035
Environment and Public facilities
居民服务、修理和其他服务业 Resident Services,Repair and Other Servies 972 445 769 331 902 259 366
教育 Education 76 5 352 5 900 5 134
卫生和社会工作 Health Care and Social Work 16 6 655 4 770 2 836
文化、体育和娱乐业 Culture,Sports and Recreation 351 166 650 99 476 92 302
其他 Others 10 386 356 356
注: 本表数据来源为深圳市市场和质量监督管理委员会信息中心。Note: Data in this table are provided by Market and Quality Supervision Commission of Shenzhen Municipality.

329
单位:万美元 13-7 续表1 continued(USD 10 000)
项目Item
本期登记Registration of the Current Period
户数(户)Enterprises
(Unit)
投资总额Total
Investment
注册资本(认缴出资金额)(Subscribed Capital Contribution)
小计Subtotal
#外方Foreign Side
合计 Total 11 162 5 698 238 5 380 896 2 997 847
农、林、牧、渔业 Agriculture,Forestry,Animal Husbandry 15 1 991 1 801 1 534
and Fishery
农、林、牧、渔服务业 Agriculture,Forestry,Animal Husbandry 6 1 252 1 061 989
and Fishery Services
采矿业 Mining 1 144 144
开采辅助活动 Mining Auxiliary Activities
制造业 Manufacturing 190 99 605 46 383 38 249
金属制品、机械和设备修理业 Metal Products Machinery And Equipmet 3 107 107 107
Repair Services
电力、热力、燃气及水生产和供应业
Production and Supply of Electric 17 3 744 3 744 3 024
Power,Gas and Water
建筑业 Construction 142 16 720 116 691 16 267
批发和零售业 Wholesale and Retail Trade 5 546 507 658 415 598 376 986
交通运输、仓储和邮政业 Transport,Storage and Postal Services 180 14 176 14 357 13 557
住宿和餐饮业 Hotels and Catering Services 356 14 282 11 327 10 935
信息传输、软件和信息技术服务业 Information Transmission,Computer 1 202 277 840 245 228 232 319
Services and Software
金融业 Financial Intermediation 742 2 634 071 2 564 487 1 040 021
房地产业 Real Estate 39 139 398 73 853 73 766
租赁和商务服务业 Leasing and Business Services 1 585 1 577 413 1 579 806 923 577
科学研究和技术服务业 Scientific Research and Technical Services 625 222 593 179 926 164 061
水利、环境和公共设施管理业 Management of Water Consercancy, 9 3 791 3 791 3 705
Environment and Public facilities
居民服务、修理和其他服务业 Resident Services,Repair and Other Servies 332 171 196 110 848 89 435
教育 Education 36 1 693 1 765 1 653
卫生和社会工作 Health Care and Social Work 7 2 385 2 010 930
文化、体育和娱乐业 Culture,Sports and Recreation 133 9 241 8 846 7 532
其他 Others 5 295 293 293
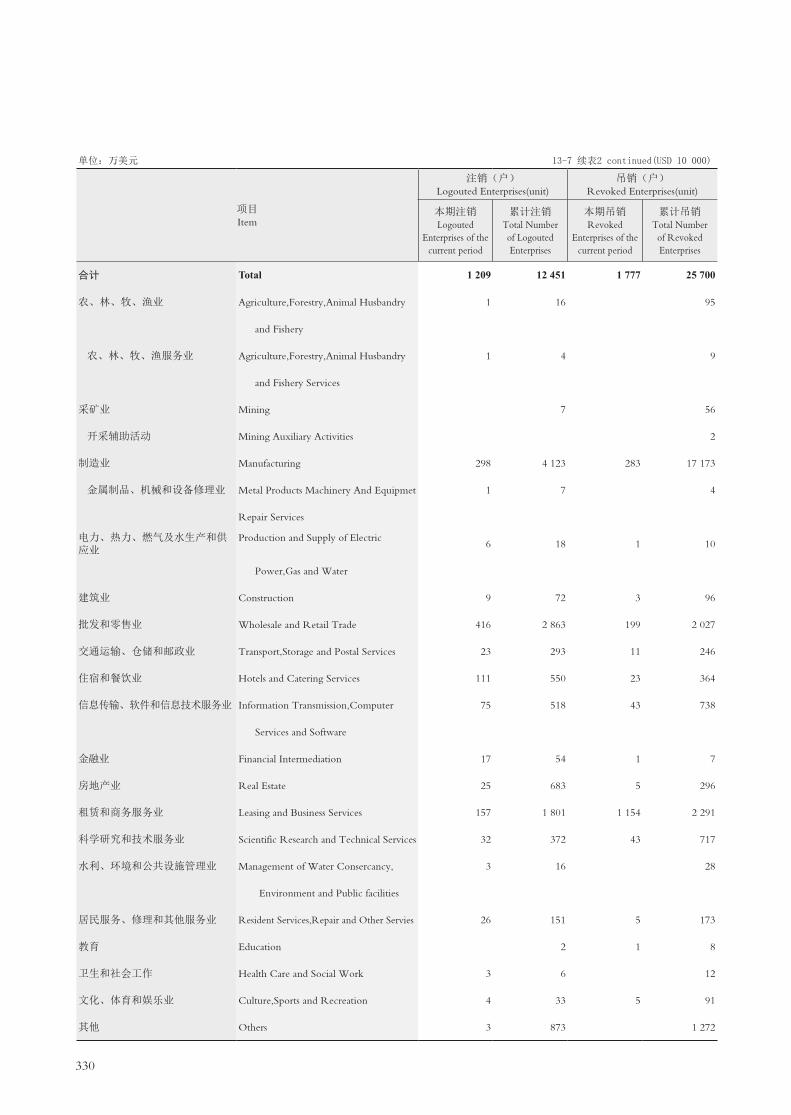
330
单位:万美元 13-7 续表2 continued(USD 10 000)
项目Item
注销(户)Logouted Enterprises(unit)
吊销(户)Revoked Enterprises(unit)
本期注销Logouted
Enterprises of the current period
累计注销Total Number of Logouted Enterprises
本期吊销Revoked
Enterprises of the current period
累计吊销Total Number of Revoked Enterprises
合计 Total 1 209 12 451 1 777 25 700
农、林、牧、渔业 Agriculture,Forestry,Animal Husbandry 1 16 95
and Fishery
农、林、牧、渔服务业 Agriculture,Forestry,Animal Husbandry 1 4 9
and Fishery Services
采矿业 Mining 7 56
开采辅助活动 Mining Auxiliary Activities 2
制造业 Manufacturing 298 4 123 283 17 173
金属制品、机械和设备修理业 Metal Products Machinery And Equipmet 1 7 4
Repair Services
电力、热力、燃气及水生产和供应业
Production and Supply of Electric 6 18 1 10
Power,Gas and Water
建筑业 Construction 9 72 3 96
批发和零售业 Wholesale and Retail Trade 416 2 863 199 2 027
交通运输、仓储和邮政业 Transport,Storage and Postal Services 23 293 11 246
住宿和餐饮业 Hotels and Catering Services 111 550 23 364
信息传输、软件和信息技术服务业 Information Transmission,Computer 75 518 43 738
Services and Software
金融业 Financial Intermediation 17 54 1 7
房地产业 Real Estate 25 683 5 296
租赁和商务服务业 Leasing and Business Services 157 1 801 1 154 2 291
科学研究和技术服务业 Scientific Research and Technical Services 32 372 43 717
水利、环境和公共设施管理业 Management of Water Consercancy, 3 16 28
Environment and Public facilities
居民服务、修理和其他服务业 Resident Services,Repair and Other Servies 26 151 5 173
教育 Education 2 1 8
卫生和社会工作 Health Care and Social Work 3 6 12
文化、体育和娱乐业 Culture,Sports and Recreation 4 33 5 91
其他 Others 3 873 1 272

331
13-8 外商投资企业工商登记情况(按国别、地区分)(2017年末)
BUSINESS REGISTRATION OF FOREIGN INVESTED ENTERPRISES AT YEAR-END
(GROUPEDBY COUNTRIES AND REGIONS)(2017)单位:万美元 (USD 10 000)
项目Item
期末实有Final Actual Amount
户数(户)Enterprises
(Unit)
投资总额Total
Investment
注册资本(认缴出资金额)(Subscribed Capital Contribution)
小计Subtotal
#外方Foreign Side
合 计 Total 41 092 36 065 088 27 812 945 18 700 482
一、亚洲 Asia 32 625 29 903 302 23 488 070 15 647 898
日本 Japan 365 288 271 144 050 131 404
韩国 Korea 433 43 319 27 229 23 072
中国香港 Hongkong China 24 491 17 575 454 12 608 681 9 608 584
中国澳门 Macao China 161 130 512 120 220 112 705
中国台湾 Taiwan China 1 446 173 133 142 595 130 695
亚洲其他国家(地区) Other Asian Countries(Regions) 5 729 11 692 612 10 445 294 5 641 439
二、非洲 Africa 289 109 994 71 455 62 790
埃及 Egypt 20 825 825 825
南非 South Africa 6 8 992 8 988 8 988
毛里求斯 Mauritius 86 81 811 46 913 38 604
塞舌尔 Seychelles 125 15 328 11 746 11 430
非洲其他国家(地区) Other African Countries(Regions) 52 3 038 2 983 2 942
三、欧洲 Europe 738 525 624 218 518 150 995
英国 Britain 139 158 278 57 644 24 576
德国 Germany 118 42 660 23 383 15 726
法国 France 76 126 756 46 145 31 809
俄罗斯联邦 Russian Federation 63 2 917 2 475 2 301
欧洲其他国家(地区) Other European Countries(Regions) 342 195 012 88 870 76 582
四、拉丁美洲 Latin America 1 039 2 480 760 1 401 993 1 190 006
巴西 Brazil 12 736 736 126
开曼群岛 Cayman Islands 90 722 777 352 224 272 787
英属维尔京群岛 British Virgin Islands 874 1 715 704 1 025 720 897 192
拉丁美洲其他国家(地区) Other Latin American Countries(Regions) 63 41 544 23 313 19 901
五、北美洲 North America 847 352 384 282 183 196 363
加拿大 Canda 167 40 173 34 402 23 739
美国 America 669 263 662 205 251 132 862
百慕大群岛 Bermuda 11 48 550 42 530 39 761
北美洲其他国家(地区) Other North American Countries(Regions)
六、大洋洲 Oceania 584 370 319 184 272 174 427
澳大利亚 Australia 139 25 364 17 772 11 777
新西兰 Newzealand 23 1 449 1 102 582
萨摩亚 Samoa 32 14 428 11 228 11 185
大洋洲其他国家(地区) Other Oceanian Countries(Regions) 390 329 078 154 170 150 884
七、其他 Others 4 970 2 322 704 2 166 455 1 278 005注: 本表数据来源为深圳市市场和质量监督管理委员会信息中心。Note: Data in this table are provided by Market and Quality Supervision Commission of Shenzhen Municipality.

332
单位:万美元 13-8 续表1 continued(USD 10 000)
项目Item
本期登记Registration of the Current Period
户数(户)Enterprises
(Unit)
投资总额Total
Investment
注册资本(认缴出资金额)(Subscribed Capital Contribution)
小计Subtotal
#外方Foreign Side
合 计 Total 9 991 5 698 143 5 267 767 2 990 259
一、亚洲 Asia 5 027 3 443 186 3 154 159 1 739 026
日本 Japan 17 27 922 9 590 6 789
韩国 Korea 47 2 349 2 254 1 684
中国香港 Hongkong China 3 169 1 093 552 980 220 636 317
中国澳门 Macao China 11 879 879 759
中国台湾 Taiwan China 145 8 337 8 292 7 839
亚洲其他国家(地区) Other Asian Countries(Regions) 1 638 2 310 148 2 152 924 1 085 639
二、非洲 Africa 22 1 649 1 202 1 163
埃及 Egypt 6 329 329 329
南非 South Africa 3 58 58 58
毛里求斯 Mauritius 1 144 144 144
塞舌尔 Seychelles 7 1 027 580 580
非洲其他国家(地区) Other African Countries(Regions) 5 91 91 52
三、欧洲 Europe 96 4 660 4 536 4 445
英国 Britain 16 520 479 453
德国 Germany 14 475 447 440
法国 France 9 573 573 566
俄罗斯联邦 Russian Federation 17 557 554 554
欧洲其他国家(地区) Other European Countries(Regions) 40 2 536 2 482 2 432
四、拉丁美洲 Latin America 20 9 674 9 237 8 926
巴西 Brazil 2 16 16 16
开曼群岛 Cayman Islands 2 171 171 155
英属维尔京群岛 British Virgin Islands 10 6 497 6 066 5 771
拉丁美洲其他国家(地区) Other Latin American Countries(Regions) 6 2 990 2 984 2 984
五、北美洲 North America 92 14 269 12 643 10 605
加拿大 Canda 28 2 740 2 718 1 972
美国 America 64 11 529 9 925 8 633
百慕大群岛 Bermuda
北美洲其他国家(地区) Other North American Countries(Regions)
六、大洋洲 Oceania 34 2 331 1 954 1 776
澳大利亚 Australia 19 1 503 1 150 1 086
新西兰 Newzealand 5 291 291 220
萨摩亚 Samoa 8 474 449 406
大洋洲其他国家(地区) Other Oceanian Countries(Regions) 2 64 64 64
七、其他 Others 4 700 2 222 374 2 084 036 1 224 319
333
单位:万美元 13-8 续表2 continued(USD 10 000)
项目Item
注销(户)Logouted Enterprises(unit)
吊销(户)Revoked Enterprises(unit)
本期注销Logouted
Enterprises of the current period
累计注销Total Number of Logouted Enterprises
本期吊销Revoked
Enterprises of the current period
累计吊销Total Number of Revoked Enterprises
合 计 Total 690 6 250 617 21 647
一、亚洲 Asia 606 5 293 537 19 866
日本 Japan 12 97 4 177
韩国 Korea 21 70 14 223
中国香港 Hongkong China 446 4 456 445 17 686
中国澳门 Macao China 2 14 3 111
中国台湾 Taiwan China 49 309 37 1 163
亚洲其他国家(地区) Other Asian Countries(Regions) 76 347 34 506
二、非洲 Africa 4 61 8 50
埃及 Egypt 1 6
南非 South Africa 3
毛里求斯 Mauritius 1 32 2 19
塞舌尔 Seychelles 3 26 3 7
非洲其他国家(地区) Other African Countries(Regions) 3 2 15
三、欧洲 Europe 16 119 15 222
英国 Britain 2 27 4 65
德国 Germany 1 17 3 36
法国 France 2 12 1 21
俄罗斯联邦 Russian Federation 1 3 12
欧洲其他国家(地区) Other European Countries(Regions) 10 60 7 88
四、拉丁美洲 Latin America 23 342 24 476
巴西 Brazil 2 3 1 3
开曼群岛 Cayman Islands 37 30
英属维尔京群岛 British Virgin Islands 20 287 22 403
拉丁美洲其他国家(地区) Other Latin American Countries(Regions) 1 15 1 40
五、北美洲 North America 20 230 21 800
加拿大 Canda 2 26 5 117
美国 America 18 201 16 681
百慕大群岛 Bermuda 3 2
北美洲其他国家(地区) Other North American Countries(Regions)
六、大洋洲 Oceania 17 188 11 207
澳大利亚 Australia 2 19 2 96
新西兰 Newzealand 3 8
萨摩亚 Samoa 22 1 20
大洋洲其他国家(地区) Other Oceanian Countries(Regions) 15 144 8 83
七、其他 Others 4 17 1 26

334
13-9 进出口总额
TOTAL IMPORTS AND EXPORTS
单位:万美元 (USD 10 000)
年 份 Year
进出口总额 Total Imports and Exports
进出口差额 Balance出口总额
Total Exports进口总额
Total Imports
1979 1 676 930 746 184
1980 1 751 1 124 627 497
1981 2 807 1 745 1 062 683
1982 2 534 1 597 937 660
1983 78 642 6 230 72 412 -66 182
1984 107 247 26 539 80 708 -54 169
1985 130 632 56 340 74 292 -17 952
1986 184 696 72 552 112 144 -39 592
1987 255 784 141 354 114 430 26 924
1988 344 277 184 949 159 328 25 621
1989 375 259 217 428 157 831 59 597
1990 1 570 136 815 165 754 971 60 194
1991 1 947 635 986 240 961 395 24 845
1992 2 357 562 1 200 019 1 157 543 42 476
1993 2 820 392 1 421 776 1 398 616 23 160
1994 3 498 281 1 830 921 1 667 360 163 561
1995 3 876 960 2 052 736 1 824 224 228 512
1996 3 905 342 2 120 781 1 784 561 336 220
1997 4 500 921 2 561 844 1 939 077 622 767
1998 4 527 417 2 639 611 1 887 806 751 805
1999 5 042 750 2 820 811 2 221 939 598 872
2000 6 393 982 3 456 333 2 937 649 518 684
2001 6 861 055 3 747 955 3 113 100 634 855
2002 8 723 148 4 655 704 4 067 444 588 260
2003 11 739 941 6 296 208 5 443 733 852 475
2004 14 728 302 7 784 632 6 943 670 840 962
2005 18 281 689 10 151 829 8 129 860 2 021 969
2006 23 738 573 13 609 556 10 129 017 3 480 539
2007 28 753 345 16 849 299 11 904 046 4 945 253
2008 29 995 499 17 971 995 12 023 504 5 948 491
2009 27 016 306 16 197 825 10 818 481 5 379 344
2010 34 674 930 20 418 355 14 256 575 6 161 780
2011 41 409 312 24 551 760 16 857 552 7 694 208
2012 46 683 020 27 136 163 19 546 857 7 589 306
2013 53 747 437 30 570 191 23 177 246 7 392 945
2014 48 774 049 28 436 157 20 337 892 8 098 265
2015 44 245 863 26 403 895 17 841 968 8 561 927
2016 39 843 893 23 754 674 16 089 218 7 665 456
2017 41 414 596 24 435 790 16 978 806 7 456 984
注: 本表1992年以前为深圳市贸工局口径数;1993年以后为深圳海关口径数,按现行统计方法计算。 Note: The figures adopted from Shenzhen Bureau of Trade and Industry before 1992 and calculated from Shenzhen CIQ after 1993 by current statistical method.

335
13-10 进出口总额指数
INDICES OF TOTAL IMPORTS AND EXPORTS
单位:% (%)
年 份 Year
以上年为100 Preceding Year=100
以1979年为100 1979=100
进出口总额 Total Imports and Exports
进出口总额 Total Imports and Exports
出口总额 Total Exports
进口总额 Total Imports
出口总额 Total Exports
进口总额 Total Imports
1980 104.5 120.9 84.0 104.5 120.9 84.0
1981 160.3 155.2 169.4 167.5 187.6 142.4
1982 90.3 91.5 88.2 151.2 171.7 125.6
1983 3 103.5 390.1 7 728.1 4 692.2 669.9 9 706.7
1984 136.4 426.0 111.5 6 399.0 2 853.7 10 818.8
1985 121.8 212.3 92.1 7 794.3 6 058.1 9 958.7
1986 141.4 128.8 151.0 11 020.0 7 801.3 15 032.7
1987 138.5 194.8 102.0 15 261.6 15 199.4 15 339.1
1988 134.6 130.8 139.2 20 541.6 19 887.0 21 357.6
1989 109.0 117.6 99.1 22 390.2 23 379.4 21 157.0
1990 145.8 137.8 156.8 32 643.8 32 213.0 33 180.8
1991 124.0 121.0 127.3 40 478.3 38 977.7 42 239.2
1992 121.0 121.7 120.4 48 978.8 47 435.9 50 856.0
1993 119.6 118.5 120.8 58 578.6 56 211.5 61 434.0
1994 124.0 128.8 119.2 72 637.5 72 400.5 73 229.3
1995 110.8 112.1 109.4 80 482.3 81 160.9 80 112.9
1996 100.7 103.3 97.8 81 045.7 83 839.2 78 350.4
1997 115.3 120.8 108.7 93 445.7 101 277.8 85 166.9
1998 100.6 103.0 97.4 94 006.4 104 316.1 82 952.6
1999 111.4 106.9 117.7 104 706.7 111 477.0 97 634.8
2000 126.8 122.5 132.2 132 763.4 136 592.5 129 084.0
2001 107.3 108.4 106.0 142 455.1 148 066.3 136 829.0
2002 127.1 124.2 130.7 181 060.4 183 898.3 178 835.5
2003 134.6 135.2 133.8 243 707.3 248 630.5 239 281.9
2004 125.5 123.6 127.6 305 852.7 307 307.3 305 323.7
2005 124.1 130.4 117.1 379 563.2 400 728.7 357 534.1
2006 129.8 134.1 124.6 493 052.6 537 377.2 445 487.5
2007 121.1 123.8 117.5 597 086.7 665 273.0 523 447.8
2008 104.3 106.6 101.0 622 761.4 709 181.0 528 682.3
2009 89.6 89.4 89.9 557 994.2 634 007.8 475 285.4
2010 128.4 126.1 131.8 716 464.6 799 483.8 626 426.2
2011 119.4 120.2 118.2 855 458.7 960 979.5 740 435.8
2012 112.7 110.5 115.9 964 102.0 1 061 882.3 858 165.1
2013 115.1 112.7 118.5 1 109 681.4 1 196 741.4 1 016 925.6
2014 90.7 93.0 87.7 1 006 480.9 1 112 969.5 891 843.8
2015 90.7 92.9 87.7 912 878.2 1 033 948.7 782 147.0
2016 90.1 90.0 90.2 822 503.3 930 553.8 705 496.6
2017 103.9 102.9 105.5 854 580.9 957 539.9 744 298.9
年平均增长率Average Annual Growth Rate 26.9 27.3 26.4

336
13-11 进出口总额分类
TOTAL IMPORTS AND EXPORTS
单位:万美元 (USD 10 000)
项 目 Item
2013 2014 2015 2016 2017
进出口总额 Total Imports and Exports 53 747 437 48 774 049 44 245 863 39 843 893 41 414 596
一、出口总额 Total Exports 30 570 191 28 436 157 26 403 895 23 754 674 24 435 790
1.按隶属关系分类: Grouped by Administrative
Relationship
①国有企业 State-owned Enterprises 2 652 352 2 616 552 2 608 362 2 233 973 2 235 801
②民营、集体企业 Collective-owned 13 333 696 11 678 654 10 881 274 10 870 609 11 978 768
③"三资"企业 Foreign Investment Enterprises 14 584 143 14 140 951 12 914 259 10 650 092 10 221 221
2.按贸易方式分类: Grouped by Form of Trade
①一般贸易 Original Trade 8 095 275 9 885 448 10 551 181 9 815 084 10 565 089
②补偿贸易 Compensation Trade
③来料加工贸易 Processing and Assembly Trade 755 030 468 194 233 592 168 839 90 098
④进料加工贸易 Processing Trade for Imported Material 12 846 772 12 630 380 10 262 573 8 231 619 8 424 123
⑤出料加工贸易 Processing Trade for Exported Material 1 619
⑥易货贸易 Barter Trade 3
⑦其他 Others 8 873 114 5 452 135 5 356 549 5 539 133 5 354 858
二、进口总额 Total Imports 23 177 246 20 337 892 17 841 968 16 089 218 16 978 806
1.按隶属关系分类: Grouped by Administrative Relationship
①国有企业 State-owned Enterprises 1 183 452 1 019 885 932 560 840 447 802 121
②民营、集体企业 Collective-owned 12 553 756 9 758 673 8 138 504 7 868 097 9 132 535
③"三资"企业 Foreign Investment Enterprises 9 440 038 9 559 334 8 770 904 7 380 674 7 044 150
2.按贸易方式分类: Grouped by Form of Trade
①一般贸易 Original Trade 6 639 333 7 626 027 7 826 137 8 009 658 8 797 624
②补偿贸易 Compensation Trade
③来料加工贸易 Processing and Assembly Trade 281 265 255 778 255 449 180 505 96 454
④进料加工贸易 Processing Trade for Imported Material 8 662 863 8 680 131 5 915 696 4 635 584 5 021 803
⑤以工缴费补偿期进口的设备 Imported Equipment by Processing
Fee during Compensation Period
⑥租赁贸易 Leasing Trade 31 340 31 992 30 508 19 128 1 153
⑦外商投资企业作为投资进口 Imported Equipment and Materials as 23 173 26 064 9 403 9 404 9 531
的设备 Investment of Foreign Investment
Enterprises
⑧外商投资企业进口供加工内 Imported Materials and Parts of Foreign
销产品的料、件 Investment Enterprises for Processing
and Selling on Domestic Market
⑨易货贸易 Barter Trade
⑩其 他 Others 7 539 272 3 717 900 3 804 775 3 234 938 3 052 241
337
13-12 深圳市与主要国家(地区)进出口总额
SHENZHEN’ S FOREIGN TRADE WITH MAIN RELATED COUNTRIES AND
TERRITORIES单位:万美元 (USD 10 000)
国家(地区) Country(territory)
2015 2016 2017
合 计 Total
Imports and Exports
出口总额 Exports
进口总额 Imports
合 计 Total
Imports and Exports
出口总额 Exports
进口总额 Imports
合 计 Total
Imports and Exports
出口总额 Exports
进口总额 Imports
中国香港 Hongkong China 12 424 675 12 282 854 141 822 10 538 883 10 432 380 106 502 9 687 902 9 607 709 80 193
日 本 Japan 2 262 826 787 149 1 475 678 2 015 455 673 200 1 342 255 2 047 836 716 914 1 330 922
美 国 The United States 4 017 346 3 333 653 683 694 3 800 970 3 182 220 618 750 4 314 663 3 738 114 576 549
法 国 France 416 357 271 882 144 475 394 832 248 607 146 225 403 484 254 877 148 607
德 国 Germany 801 539 544 027 257 512 785 013 516 091 268 922 828 943 550 077 278 866
泰 国 Thailand 895 121 320 726 574 395 896 725 312 552 584 173 892 083 308 630 583 453
新加坡 Singapore 914 699 589 409 325 289 965 058 658 146 306 912 1 013 395 643 579 369 816
韩 国 Korea Rep. 1 998 638 329 105 1 669 534 1 841 770 336 913 1 504 857 2 085 774 427 564 1 658 210
中国台湾 Taiwan China 3 250 475 212 001 3 038 474 3 150 124 190 459 2 959 665 3 341 347 195 314 3 146 033
澳大利亚 Australia 528 935 301 835 227 100 488 754 299 579 189 176 550 609 330 602 220 007
印度尼西亚 Indonesia 287 707 206 313 81 394 297 650 219 666 77 985 369 736 256 902 112 834
马来西亚 Malaysia 1 238 491 264 365 974 126 1 322 528 239 533 1 082 995 1 265 026 387 930 877 096
英 国 The United Kingdom 641 608 580 973 60 635 617 982 563 979 54 003 666 748 599 773 66 975
意大利 Italy 278 215 202 079 76 135 268 247 193 294 74 953 308 576 218 177 90 399
巴 西 Brazil 236 816 189 158 47 658 223 827 163 840 59 987 283 947 216 165 67 782
加拿大 Canada 334 802 245 261 89 541 308 460 225 834 82 626 341 316 278 938 62 378
其 它 Others 13 717 611 5 743 105 7 974 506 11 927 614 5 298 382 6 629 232 13 013 211 5 704 525 7 308 686

338
13-13 进口主要商品金额
TOTAL VALUE OF FOREIGN IMPORTS OF MAJOR COMMODITIES
单位:万美元 (USD 10 000)
项 目 Item
2014 2015 2016 2017
集成电路 Semiconductor lntegrated Circuit 4 973 433 5 616 764 5 524 075 5 828 447
自动数据处理设备及其部件 Automatic Data Processing Equipment and Parts 1 015 632 830 050 843 012 812 569
液晶显示板 LCD Monitor 858 559 713 869 587 474 517 533
农产品 Farm Produce 560 683 644 619 713 743 731 993
钢材 Steel 98 443 67 250 53 696 57 725
纺织纱线、织物及制品 Spinning, Textile and Related Products 108 139 101 873 91 276 89 626
电视、收音机及无线电讯设备的零附件 TV, Radio and Telecommunication Equipments 171 327 121 149 163 065 214 860
成品油 Oil 79 194 43 946 34 717 35 998
电线和电缆 Wire and Cable 100 732 96 801 77 006 76 442
粮食 Food 70 474 82 051 76 153 91 088
13-14 出口主要商品金额
TOTAL VALUE OF FOREIGN EXPORTS OF MAJOR COMMODITIES
单位:万美元 (USD 10 000)
项 目 Item
2014 2015 2016 2017
自动数据处理设备及其部件 Automatic Data Processing Equipment and Parts 3 205 094 2 905 194 2 653 546 2 417 171
电话机 Telephone Sets 2 824 149 3 016 768 2 255 422 2 143 236
服装及衣着附件 Clothing and Dresses 801 419 807 558 788 057 769 493
打印机(包括多功能一体机) Printer(include MFP) 432 142 375 634 323 898 305 531
录、放像机 Radio Cassette Players 187 614 234 474 129 587 137 696
鞋类 Shoes 432 052 372 902 347 821 383 639
家具及其零件 Furniture and Dresses 487 953 434 917 449 257 432 842
纺织纱线、织物及制品 Spinning, Textile and Related Products 307 584 312 662 272 702 282 343
塑料制品 Plastic Products 383 481 344 483 345 222 424 071
液晶显示板 LCD Monitor 510 463 484 821 366 389 314 099

339
13-15 旅游业基本情况
BASIC CONDITIONS OF TOURISM
年 份 Year
过夜入境游客 (万人)
Overnight International
Tourists (10 000 persons)
外国人 Foreigners
华 侨 Overseas Chinese
港澳同胞 Compatriots
from Hongkong and Macao
台 胞 Compatriots
Form Taiwan
1994 186.39 31.07 2.58 139.75 12.991995 185.37 35.32 1.10 131.41 17.541996 151.47 30.91 1.37 101.48 17.711997 140.41 32.00 0.75 89.49 18.171998 148.47 30.83 0.72 97.52 19.411999 158.08 35.49 1.45 101.03 20.112000 397.34 61.09 287.62 48.632001 423.87 67.95 307.33 48.592002 449.35 80.59 319.87 48.892003 435.13 69.89 331.45 33.792004 559.79 105.19 406.99 47.612005 616.45 120.24 445.31 50.902006 712.74 139.16 520.40 53.182007 831.30 161.64 615.24 54.422008 869.57 151.42 671.98 46.172009 896.36 146.38 706.15 43.832010 1 020.61 167.58 806.57 46.452011 1 104.55 171.20 886.87 46.482012 1 206.43 169.10 991.81 45.522013 1 214.89 166.82 1 004.88 43.192014 1 182.18 161.12 979.37 41.692015 1 218.70 164.65 1 011.74 42.312016 1 171.18 168.32 963.20 39.662017 1 207.01 177.56 988.20 41.25
注: 1.1990-1999年过夜国际游客为宾馆、酒店部分,2000年后为旅游全口径,包括:宾馆、酒店、饭店、招待所、居民家住等各种住宿设施所接待的国际游客。 Note: The figures of overnight international tourists from 1990 to 1999 have been collected from hotels and guesthouses, and from 2000, it include hotels,guesthouses, public houses and residential houses. 2.本表数据来源为深圳市文体旅游局。 Data in this table are provided by Shenzhen Municipal Bureau of Culture Sport and Tourism.
13-15 续表 continued
年 份 Year
过夜国内游客 (万人)
Overnight Domestic Tourists
(10 000 persons)
旅游外汇收入 (万美元)
Total Foreign Exchange Earnings from International
Tourism (USD 10 000)
宾馆、酒店、度 假村开房率(%)
Room Occupancy Rate of Hotels and Holiday
Countries (%)
商品性收入 Commody Income
劳务性收入 Service Income
1994 373.32 48 821 17 483 31 338 63.01995 357.27 63 633 20 574 43 059 58.91996 360.55 58 384 21 489 36 895 56.31997 341.11 53 225 17 176 36 049 57.61998 340.33 59 025 18 413 40 612 55.51999 346.81 62 186 19 743 42 443 57.92000 927.71 141 100 62.52001 1 031.70 151 054 95 037 56 017 64.32002 1 073.54 172 342 98 904 73 438 64.12003 1 013.69 130 097 77 703 52 394 55.22004 1 383.14 178 723 111 496 67 227 60.62005 1 526.38 200 900 129 334 71 519 61.92006 1 604.54 226 515 147 496 79 019 62.52007 1 728.98 262 330 172 187 90 143 62.72008 1 789.73 270 865 174 835 96 030 61.52009 1 943.95 276 029 179 629 96 400 59.32010 2 264.71 317 976 204 895 113 081 62.42011 2 627.98 374 563 241 845 132 718 64.92012 2 941.29 432 879 288 947 143 932 63.0 2013 3 351.91 453 114 289 833 163 281 64.1
2014 3 808.88 456 568 309 473 147 095 67.22015 4 156.50 496 830 331 928 164 902 68.2 2016 4 524.56 477 100 320 700 156 400 67.6 2017 4 814.98 498 420 335 400 163 020 69.44
注:1990-1999年过夜国内游客为宾馆、酒店部分,2000年后为旅游全口径,包括:宾馆、酒店、饭店、招待所、居民家住等各种住宿设施所接待的国内游客。 Note: The figures of overnight domestic tourists before from 1990 to 1999 have been collected from hotels and guesthouses,and from 2000 it include hotels ,guesthouses ,public houses and residential houses.

340
13-16 按国别分的外国旅游者人数(过夜)
NUMBER OF FOREIGN TOURISTS BY COUNTRY(Over night)
单位:人 (person)
国 别 Country
1996 1997 1998 1999 2000 2001 2002 2003 2004 2005 2006
合 计 Total 309 126 320 076 308 279 354 911 610 900 679 464 805 937 698 867 1 051 896 1 202 373 1 391 612
日 本 Japan 83 203 78 264 74 275 93 172 150 479 197 853 245 265 221 780 319 817 315 128 355 401
菲律宾 Philippines 3 134 3 338 4 266 5 042 9 158 12 461 15 204 7 161 7 913 10 640 12 272
新加坡 Singapore 19 024 19 266 24 264 29 337 42 264 53 788 59 668 37 391 66 303 76 569 81 658
泰 国 Thailand 8 550 6 176 4 536 4 613 6 531 18 344 29 367 24 451 66 857 87 239 99 970
印度尼西亚 Indonesia 12 688 14 329 5 779 6 217 29 010 33 909 40 714 33 322 49 781 53 026 72 637
英 国 The United Kingdom 10 820 9 043 10 007 12 242 17 728 20 916 23 925 23 915 32 959 33 137 40 595
法 国 France 4 265 4 826 6 524 6 765 10 529 15 722 15 331 13 316 19 333 23 542 27 305
德 国 Germany 5 234 4 720 6 549 7 842 9 015 11 337 13 848 14 859 21 495 26 092 30 658
意大利 Italy 2 163 2 399 3 043 3 636 3 627 4 108 6 722 7 133 12 264 16 411 18 359
美 国 The United States 39 173 32 771 39 490 49 130 64 083 75 328 104 130 92 608 131 996 146 959 176 378
加拿大 Canada 6 939 6 208 8 476 9 217 11 431 14 092 16 356 14 183 21 293 26 325 30 440
澳大利亚 Australia 6 205 5 441 6 851 10 124 10 985 12 796 15 219 14 413 19 783 25 534 29 249
新西兰 New Zealand 993 804 1 397 1 642 1 702 2 292 2 937 2 888 4 342 4 682 4 445
俄罗斯 Russia 656 2 084 874 893 2 102 4 018 3 514 3 539 4 090 6 911 8 051
韩 国 Korea Rep. 32 015 30 885 18 696 20 133 27 612 45 172 65 443 69 068 90 640 108 688 116 976
马来西亚 Malaysia 24 430 23 269 43 931 50 554 50 537 42 186 50 516 32 075 46 536 61 256 68 624
其他 Others 49 634 76 253 49 321 44 352 164 107 115 142 97 778 86 765 136 494 180 234 218 594
注:本表数据来源为深圳市文体旅游局。 Note:Data in this table are provided by Shenzhen Municipal Bureau of Culture Sport and Tourism.
341
单位:人 13-16 续表 continued(person)
国 别 Country
2007 2008 2009 2010 2011 2012 2013 2014 2015 2016 2017
合 计 Total 1 616 415 1 514 186 1 463 809 1 675 798 1 712016 1 691 045 1 668 230 1 611 200 1 646 515 1 683 168 1 775 639
日 本 Japan 393 176 352 516 345 864 372 023 366 266 371 557 316 669 302 349 296 431 274 232 272 360
菲律宾 Philippines 12 783 10 422 15 455 13 447 15 741 15 570 21 063 25 515 12 662 13 213 14 576
新加坡 Singapore 90 997 79 829 83 411 89 400 95 785 92 840 87 256 80 735 86 402 85 421 89 383
泰 国 Thailand 93 170 65 665 45 988 40 338 35 623 37 507 38 065 24 843 30 361 30 474 36 439
印度尼西亚 Indonesia 79 389 68 286 58 338 70 727 94 257 89 292 70 707 39 286 31 369 39 497 46 316
英 国 The United Kingdom 49 637 47 898 45 590 47 749 44 486 45 172 44 752 45 530 43 303 46 974 55 415
法 国 France 36 301 37 191 39 099 40 338 40 607 38 493 43 265 43 150 42 039 43 523 43 618
德 国 Germany 35 706 33 822 34 714 41 430 41 993 40 197 40 401 42 133 41 775 41 748 46 856
意大利 Italy 22 968 21 010 22 512 22 298 23 238 20 958 21 269 21 357 22 994 24 270 24 530
美 国 The United States 226 468 212 532 197 168 246 880 242 128 252 622 248 450 261 736 305 909 302 872 311 866
加拿大 Canada 36 893 36 391 34 547 39 184 38 306 36 651 35 841 35 398 39 517 43 332 41 221
澳大利亚 Australia 40 326 41 853 40 949 46 871 46 667 42 795 41 405 36 606 38 117 40 202 41 596
新西兰 New Zealand 5 743 6 066 6 425 6 291 6 128 6 271 6 864 6 198 6 934 7 070 9 496
俄罗斯 Russia 10 358 11 048 13 585 17 449 20 772 19 379 20 168 17 558 14 426 15 895 21 550
韩 国 Korea Rep. 152 234 134 340 108 389 142 505 141 365 141 952 173 537 160 301 169 690 218 886 225 018
马来西亚 Malaysia 81 513 88 265 84 052 105 664 112 675 106 889 95 042 78 475 73 094 78 121 85 345
其他 Others 248 753 267 052 287 723 333 204 345 979 332 900 363 476 390 030 391 492 377 438 410 054
342
13-17 旅游部门主要财务指标(2017年)
MAIN FINANCIAL INDICATORS OF TOURISM(2017)
单位:万元 (10 000 yuan)
指 标 Item
合 计 Total
宾馆、酒店 Hotels
旅行社 Travel Agencies
景 点Scenic Spots
营业收入 Business Revenue 4 130 232 886 703 2 918 195 325 335
营业成本 Business Cost 3 168 043 292 227 2 722 562 153 255
营业费用 Business Expenses 344 569 239 572 74 961 30 037
营业税金及附加 Business Taxes and Extra 25 947 10 077 4 315 11 555
Charges
经营利润 Operating Profits 930 552 584 811 185 217 160 525
管理费用 Management Expenses 384 210 233 005 82 422 68 783
财务费用 Financial Expenses 52 209 35 885 1 240 15 083
营业利润 Business Profits 409 180 63 438 185 217 160 525
投资收益 Earnings of Investment 10 696 1 021 2 267 7 409
营业外收支差 Non-operating Net Revenue 4 179 2 482 1 696
or Expenditure
利润总额 Total Profits 209 141 69 496 13 728 125 918
年末固定资产原值 Original Value of Fixed 2 182 872 1 362 410 18 932 801 530
Assets(year-end)
年末固定资产净值 Net Value of Fixed Assets 980 741 568 230 9 826 402 685
(year-end)
年末职工人数(人) Number of Staff and Workers 54 488 27 945 18 284 8 259
(year-end)(person)

343
13-18 星级酒店基本情况(2017年末)
STATISTICS ON STAR-RATED HOTELS AT YEAR-END(2017)
单位:家 (unit)
项 目 Item
合 计 Total
五 星 Five-star
四 星 Four-star
三 星 Three-star
二 星 Two-star
一 星 One-star
出租率(%) Room
Occupancy Rate
平均房价 (元/间天) Average Price
(yuan/pre room)
合计 Total 114 25 24 51 14 69.4 461.45
福田区 Futian 23 6 2 9 6 79.3 513.28
罗湖区 Luohu 38 5 3 23 7 66.7 491.37
盐田区 Yantian 5 1 3 1 53.5 604.84
南山区 Nanshan 12 3 6 2 1 74.2 539.93
宝安区 Baoan 16 2 6 8 62.6 344.68
龙岗区 Longgang 13 6 3 4 57.7 352.97
龙华区 Longhua 3 2 1 74.6 403.8
坪山区 Pingshan 2 1 1 63.1 290.99
光明新区 Guangming 77.5 315.22
大鹏新区 Dapeng 2 2 28.7 266.22
注:本表数据来源为深圳市文体旅游局。 Note:Data in this table are provided by Shenzhen Municipal Bureau of Culture Sport and Tourism.
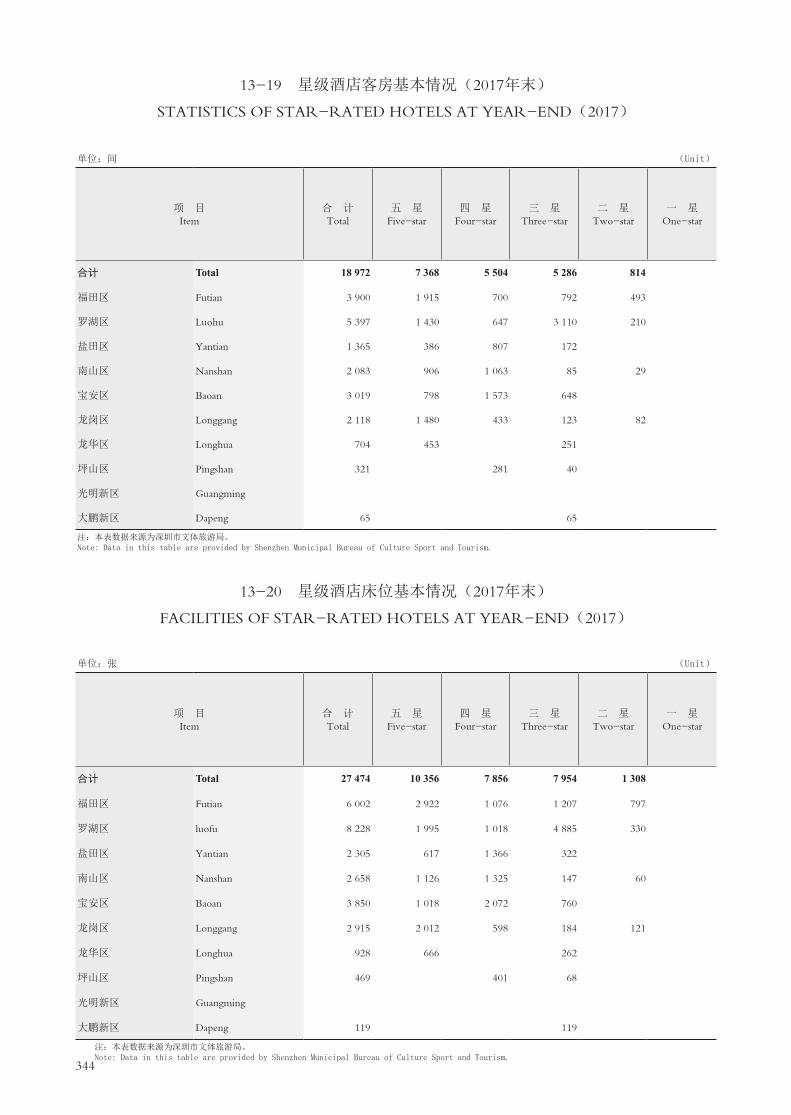
344
13-19 星级酒店客房基本情况(2017年末)
STATISTICS OF STAR-RATED HOTELS AT YEAR-END(2017)
单位:间 (Unit)
项 目 Item
合 计 Total
五 星 Five-star
四 星 Four-star
三 星 Three-star
二 星 Two-star
一 星 One-star
合计 Total 18 972 7 368 5 504 5 286 814
福田区 Futian 3 900 1 915 700 792 493
罗湖区 Luohu 5 397 1 430 647 3 110 210
盐田区 Yantian 1 365 386 807 172
南山区 Nanshan 2 083 906 1 063 85 29
宝安区 Baoan 3 019 798 1 573 648
龙岗区 Longgang 2 118 1 480 433 123 82
龙华区 Longhua 704 453 251
坪山区 Pingshan 321 281 40
光明新区 Guangming
大鹏新区 Dapeng 65 65
注:本表数据来源为深圳市文体旅游局。Note: Data in this table are provided by Shenzhen Municipal Bureau of Culture Sport and Tourism.
13-20 星级酒店床位基本情况(2017年末)
FACILITIES OF STAR-RATED HOTELS AT YEAR-END(2017)
单位:张 (Unit)
项 目 Item
合 计 Total
五 星 Five-star
四 星 Four-star
三 星 Three-star
二 星 Two-star
一 星 One-star
合计 Total 27 474 10 356 7 856 7 954 1 308
福田区 Futian 6 002 2 922 1 076 1 207 797
罗湖区 luofu 8 228 1 995 1 018 4 885 330
盐田区 Yantian 2 305 617 1 366 322
南山区 Nanshan 2 658 1 126 1 325 147 60
宝安区 Baoan 3 850 1 018 2 072 760
龙岗区 Longgang 2 915 2 012 598 184 121
龙华区 Longhua 928 666 262
坪山区 Pingshan 469 401 68
光明新区 Guangming
大鹏新区 Dapeng 119 119
注:本表数据来源为深圳市文体旅游局。 Note: Data in this table are provided by Shenzhen Municipal Bureau of Culture Sport and Tourism.

345
主要统计指标解释
进出口总额 指实际进出我国国境的货物(包括贸易和非贸易)的价值总和。主要包括对外贸易实际进
出口货物,来料加工装配、补偿贸易、进料加工进出口货物,国家间及国际组织无偿援助物资和赠送品,华
侨、港澳台同胞和外籍华人捐赠品,租赁期满归承租人所有的租赁货物,边境地方贸易及边境地区小额贸易进
出口货物(边民互市贸易除外),中外合资、合作经营企业、外商独资经营企业进出口货物和公用物品,到、
离岸价格在规定限额以上的进出口货样和广告品(无商业价值、无使用价值和免费提供出口的除外),从保税
仓库提取在中国境内销售的进出口货物,以及其他进出口货物。进出口总额反映一个国家在对外经济贸易方面
实际进出口货物的总规模。
利用外资 指我国政府、部门、企业和其他经济组织通过对外借款、吸收外商直接投资以及向境外发行
债券、股票等方式筹借的境外资金。
外资的形式可以是现汇、实物、工业产权或专有技术等有形资本和无形资本。
我国自有外汇和中国银行自有外汇资金发放的外汇贷款购置国外设备和材料,华侨、港澳同胞的捐赠,
联合国或其他国际组织的无偿赠送资金、无偿援建的项目均不属于外资范围 。
利用外资的方式有:对外借款,外国(或港澳地区)企业和经济组织或个人在我国境内开办独资企业、
与我国境内的企业或组织共同开办合资企业、合作经营(企业)项目或合作开发资源,以及补偿贸易、国际租赁
等。
对外借款 指我国政府、部门、企业和中国银行等单位向国际金融组织 、外国政府、企业等借用的长
期、短期资本,到期需还本付息。借款按不同渠道划分为:①外国政府贷款; ②国际金融组织贷款;③外国
银行贷款;④出口信贷;⑤发行债券。
外商直接投资 指外国企业和经济组织或个人(包括华侨、港澳同胞以及我在境外注册的企业)按我国
有关政策、法规,在我国境内开办外商独资企业,与我国境内的企业或经济组织共同举办中外合资企业、合作
经营企业或合作开发资源的投资,以及外商从企业得到收益的再投资。2002年起“外商直接投资”统计口径调
整,“企业投资总额内的境外借款”只包括“企业投资总额内直接投资者对企业的贷款,即外方股东贷款”,
不包括“直接投资者提供担保的第三方对企业的贷款即外方股东担保贷款”和“其他方式的企业境外借款即其
他境外借款。
旅游人数 (1)入境旅游人数:指报告期内来我国观光、度假、探亲访友、就医疗养、购物、参加会议或
从事经济、文化、体育、宗教活动的外国人、港澳台同胞等入境游客。统计时,外国人、港澳台同胞每入境一
次统计1人次。
(2)出境人数:指中国(大陆)居民因公或因私出境前往其他国家、中国香港特别行政区、澳门特别行政
区和台湾省观光、度假、探亲访友、就医疗养、购物、参加会议或从事经济、文化、体育、宗教活动的人数,
即出境游客。统计时,按每出境一次统计1人次。
(3)国内旅游人数:指在报告期内在中国(大陆)观光游览、度假、探亲访友、就医疗养、购物、参加会
议或从事经济、文化、体育、宗教活动的中国(大陆)居民人数,其出游的目的不是通过所从事的活动谋取报
酬。统计时,国内游客按每出游一次统计1人次。
国际旅游(外汇)收入 指入境游客在中国(大陆)境内旅行、游览过程中用于交通、参观游览、住宿、

346
餐饮、购物、娱乐等全部花费。
国内旅游收入 又称旅游总花费,指国内游客在国内旅行、游览过程中用于交通、参观游览、住宿、餐
饮、购物、娱乐等全部花费。
国际旅行社 指经营业务范围包括入境旅游业务、出境旅游业务和国内旅游业务的旅行社。
国内旅行社 指经营范围仅限于国内旅游业务的旅行社。
星级饭店 指设备、设施、服务符合《旅游饭店星级的划分与评定》(GB/T14308-2003),通过相关旅
游管理部门评定,并取得星级饭店称号的饭店(含预备星级饭店)。
347
Explanatory Notes on Main Statistical Indicators
Total Imports and Exports refer to the real value of commodities (both trade and non-trade) imported and
exported across the border of China. They mainly include actual imports and exports through foreign trade, imported and
exported goods in the categories of processing and assembling of customer's materials, compensation trade, and processing
of import materials, supplies and gifts as aid given gratis between governments and by international organizations,
donations by overseas Chinese, compatriots in Hong Kong, Macao and Taiwan and Chinese with foreign citizenship,
leasing commodities owned by tenants at the expiration of leasing period, local trade and Small-amount trade in border
areas (excluding exchange trade between border residents), imported and exported commodities and articles for public
use of Sino-foreign joint ventures, cooperative enterprises and ventures with sole foreign investment. Also included are
import or export of samples and advertising articles above designated CIF or FOB prices (excluding goods of no trading
or use value and free commodities for export), import and export goods sold in China from bonded warehouse and other
import and export goods. Total imports and exports is an indicator of the total size of actual imported and exported goods
of a country in foreign trade and economic cooperation.
Utilization of Foreign Capital refers to funds financed from abroad by means of loans, foreign direct investment,
and issuing bonds and shares undertaken by the Chinese governments at all levels, various departments, enterprises and
other economic units.
The types of foreign capital include tangible capital and intangible capital, such as remittance, goods, industrial
property rights and know-how.
Those excluded are the purchases of foreign equipment and materials with loans from state-owned foreign
exchange and foreign exchange owned by the Bank of China, donations by overseas Chinese, compatriots in Hong
Kong and Macao, and funds and projects as aid given gratis by the United Nations and other international organizations.
Utilization of foreign capital takes the forms of loans from abroad, sole investment in enterprises in the boundary of
China by foreign (or Hong Kong and Macao) enterprises, economic organizations or individuals, investment in Sino-
foreign joint ventures, cooperative projects (enterprises), cooperative exploitation of natural resources with enterprises or
organizations in China, compensation trade and international lease, etc.
Foreign Loans refer to long-term capital and short-term capital borrowed from international financial
organizations, foreign governments and enterprises by the Chinese governments at all levels, by various departments,
enterprises and the Bank of China, etc, and repaid with interest at maturity. Foreign loans can be divided according to
channels into: ①loans from foreign governments; ②loans from international financial organizations; ③loans from foreign
banks; ④export credit; ⑤bonds and shares issued abroad.
Foreign Direct Investment refers to investment inside China by foreign enterprises and economic organizations
or individuals (including overseas Chinese, compatriots from Hong Kong and Macao, and Chinese enterprises registered
abroad), following the relevant policies and laws of China, for the establishment of foreign sole investment enterprises,
Sino-foreign joint ventures and cooperative enterprises or for cooperative exploitation of resources with enterprises
or economic organizations in China, and re-investment of foreign entrepreneurs with the profits gained from such
enterprises and corporations. Starting from 2002, the foreign direct investment statistic has been adjusted such that the
overseas borrowings in total investment of enterprises only include loans to the enterprises by direct investors or, in other

348
terms, loans by foreign shareholders, but exclude loans from the third party guaranteed by the direct investors or, in other
terms, loans guaranteed by the foreign shareholders, and overseas borrowings by enterprises in other manners or, in other
terms, other overseas borrowings.
Number of Tourists (1) Visitor arrivals refer to the number of foreigners, Chinese compatriots from Hong Kong,
Macao and Taiwan Chinese (mainland) who come to China (mainland) for sight-seeing, vacation, visiting relatives,
medical treatment, shopping, attending conference, or to engage in economic, cultural, sports and religious activities. In
compiling statistics, each time of entering China is counted as one person-time.
(2) Number of Chinese residents going abroad refer to the number of Chinese (mainland) residents going to other
countries, Hong Kong Special Administrative region, Macao Special Administrative region and Taiwan for on official or
private purposes, for sight-seeing, vacation, visiting relatives, medical treatment, shopping, attending conference, or to
engage in economic, cultural, sports and religious activities. In compiling statistics, each time of leaving is counted as one
person-time.
(3) Number of domestic tourists refers to the number of Chinese (mainland) residents who travel within China
(mainland) for sight-seeing, vacation, visiting relatives, medical treatment, shopping, attending conference, or to engage
in economic, cultural, sports and religious activities. In compiling statistics, each time of travelling is counted as one
person-time.
Foreign Exchange Earnings from International Tourism refer to the total expenditure of foreigners, overseas
Chinese, Chinese compatriots from Hong Kong, Macao and Taiwan during their stay in the mainland of China on
transportation, sighting, accommodation, food, shopping and entertainment.
Income from Domestic Tourism refer to expenditure of domestic tourists on transportation, sighting,
accommodation, food, shopping and entertainment while they travel.
International Travel Agencies refer to travel agencies engaged in tourism entering China, Chinese residents
going abroad and domestic tourism.
Domestic Travel Agencies refer to travel agencies only engaged in domestic tourism.
Star-rated Hotels refer to hotels rated with stars as assessed by the relevant tourism authorities according to GB/
T14308-2003 standard with reference to their infrastructure, facilities and service levels.

LABOR FORCE AND WAGE14
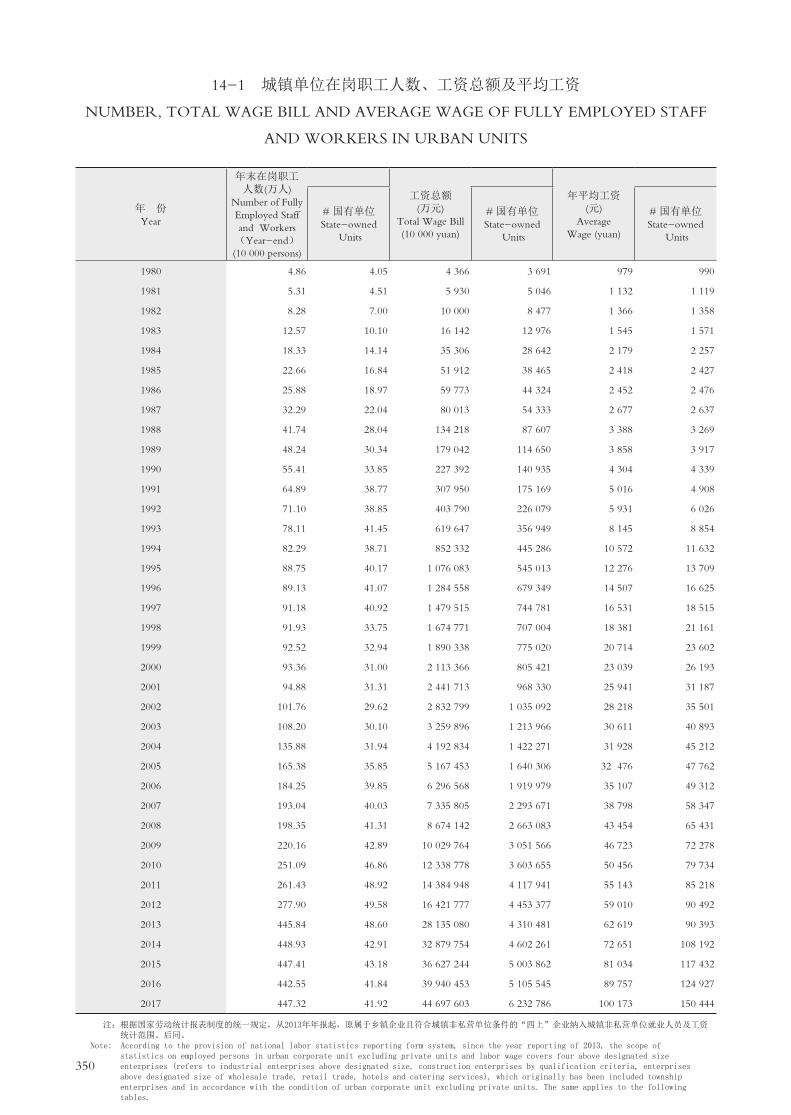
350
14-1 城镇单位在岗职工人数、工资总额及平均工资
NUMBER, TOTAL WAGE BILL AND AVERAGE WAGE OF FULLY EMPLOYED STAFF
AND WORKERS IN URBAN UNITS
年 份 Year
年末在岗职工人数(万人)
Number of Fully Employed Staff and Workers (Year-end) (10 000 persons)
工资总额 (万元)
Total Wage Bill (10 000 yuan)
年平均工资 (元)
Average Wage (yuan)
# 国有单位 State-owned
Units
# 国有单位 State-owned
Units
# 国有单位 State-owned
Units
1980 4.86 4.05 4 366 3 691 979 990
1981 5.31 4.51 5 930 5 046 1 132 1 119
1982 8.28 7.00 10 000 8 477 1 366 1 358
1983 12.57 10.10 16 142 12 976 1 545 1 571
1984 18.33 14.14 35 306 28 642 2 179 2 257
1985 22.66 16.84 51 912 38 465 2 418 2 427
1986 25.88 18.97 59 773 44 324 2 452 2 476
1987 32.29 22.04 80 013 54 333 2 677 2 637
1988 41.74 28.04 134 218 87 607 3 388 3 269
1989 48.24 30.34 179 042 114 650 3 858 3 917
1990 55.41 33.85 227 392 140 935 4 304 4 339
1991 64.89 38.77 307 950 175 169 5 016 4 908
1992 71.10 38.85 403 790 226 079 5 931 6 026
1993 78.11 41.45 619 647 356 949 8 145 8 854
1994 82.29 38.71 852 332 445 286 10 572 11 632
1995 88.75 40.17 1 076 083 545 013 12 276 13 709
1996 89.13 41.07 1 284 558 679 349 14 507 16 625
1997 91.18 40.92 1 479 515 744 781 16 531 18 515
1998 91.93 33.75 1 674 771 707 004 18 381 21 161
1999 92.52 32.94 1 890 338 775 020 20 714 23 602
2000 93.36 31.00 2 113 366 805 421 23 039 26 193
2001 94.88 31.31 2 441 713 968 330 25 941 31 187
2002 101.76 29.62 2 832 799 1 035 092 28 218 35 501
2003 108.20 30.10 3 259 896 1 213 966 30 611 40 893
2004 135.88 31.94 4 192 834 1 422 271 31 928 45 212
2005 165.38 35.85 5 167 453 1 640 306 32 476 47 762
2006 184.25 39.85 6 296 568 1 919 979 35 107 49 312
2007 193.04 40.03 7 335 805 2 293 671 38 798 58 347
2008 198.35 41.31 8 674 142 2 663 083 43 454 65 431
2009 220.16 42.89 10 029 764 3 051 566 46 723 72 278
2010 251.09 46.86 12 338 778 3 603 655 50 456 79 734
2011 261.43 48.92 14 384 948 4 117 941 55 143 85 218
2012 277.90 49.58 16 421 777 4 453 377 59 010 90 492
2013 445.84 48.60 28 135 080 4 310 481 62 619 90 393
2014 448.93 42.91 32 879 754 4 602 261 72 651 108 192
2015 447.41 43.18 36 627 244 5 003 862 81 034 117 432
2016 442.55 41.84 39 940 453 5 105 545 89 757 124 927
2017 447.32 41.92 44 697 603 6 232 786 100 173 150 444
注:根据国家劳动统计报表制度的统一规定,从2013年年报起,原属于乡镇企业且符合城镇非私营单位条件的“四上”企业纳入城镇非私营单位就业人员及工资 统计范围。后同。Note: According to the provision of national labor statistics reporting form system, since the year reporting of 2013, the scope of statistics on employed persons in urban corporate unit excluding private units and labor wage covers four above designated size enterprises (refers to industrial enterprises above designated size, construction enterprises by qualification criteria, enterprises above designated size of wholesale trade, retail trade, hotels and catering services), which originally has been included township enterprises and in accordance with the condition of urban corporate unit excluding private units. The same applies to the following tables.

351
14-2 城镇单位在岗职工工资总额指数和年平均工资指数
RELATED INDICES OF TOTAL WAGE BILL AND AVERAGE WAGE OF FULLY
EMPLOYED STAFF AND WORKERS IN URBAN UNITS以上年为100 (preceding year=100)
年 份 Year
工资总额指数 Related Indices
Bill of TotalWage Bill
在岗职工年平均货币工资指数 Related Indices
of Average Money Wage
在岗职工年平均实际工资指数 Related Indices
of Average Real Wage
# 国有单位 State-owned
Units
# 国有单位 State-owned
Units
# 国有单位 State-owned
Units
1980 147.9 147.3 127.3 126.1 121.2 120.1
1981 135.8 136.7 115.6 113.0 104.4 102.1
1982 168.6 168.0 120.8 121.4 112.1 112.6
1983 161.4 153.1 113.1 115.7 110.9 113.4
1984 218.7 220.7 141.0 143.7 132.0 134.6
1985 147.0 134.3 111.0 107.5 90.6 87.8
1986 115.1 115.2 101.4 102.0 95.6 96.1
1987 133.9 122.6 109.2 106.5 95.5 93.1
1988 167.7 161.2 126.6 124.0 98.8 96.8
1989 133.4 130.9 113.9 119.8 90.8 95.5
1990 127.0 122.9 111.6 110.8 109.8 109.1
1991 135.4 124.3 116.5 113.1 113.1 109.8
1992 131.1 129.1 118.2 122.8 110.2 114.4
1993 153.5 157.9 137.3 146.9 114.3 122.3
1994 137.6 124.7 129.8 131.4 109.8 111.2
1995 126.3 122.4 116.1 117.9 103.3 104.9
1996 119.4 124.6 118.2 121.3 109.7 112.6
1997 115.2 109.6 114.0 111.4 110.3 107.8
1998 113.8 95.7 110.2 112.3 111.0 113.1
1999 112.9 109.6 112.7 111.5 113.5 112.3
2000 111.8 103.9 111.2 111.0 108.2 108.0
2001 115.5 120.2 112.6 119.1 115.1 121.8
2002 116.0 106.9 108.8 113.8 107.5 112.5
2003 115.1 117.3 108.5 115.2 107.7 114.4
2004 120.7 114.1 105.6 110.6 104.2 109.1
2005 123.2 115.3 101.7 105.6 100.1 104.0
2006 121.9 117.1 108.1 103.2 105.8 101.0
2007 116.5 119.5 110.5 118.3 106.2 113.6
2008 118.2 116.1 112.0 112.1 105.8 105.9
2009 115.6 114.6 107.5 110.5 108.9 111.9
2010 123.0 118.1 108.0 110.3 104.3 106.6
2011 116.6 114.3 109.3 106.9 103.7 101.4
2012 114.2 108.1 107.0 106.2 104.1 103.3
2013 171.3 96.8 106.1 99.9 103.3 97.3
2014 116.9 106.8 116.0 119.7 113.7 117.4
2015 111.4 108.7 111.5 108.5 109.1 106.2
2016 109.0 102.0 110.8 106.4 108.2 103.9
2017 111.9 122.1 111.6 120.4 110.1 118.8

352
14-3 城镇单位在岗职工工资总额指数和年平均工资指数
RELATED INDICES OF TOTAL WAGE BILL AND AVERAGE WAGE OF FULLY
EMPLOYED STAFF AND WORKERS IN URBAN UNITS以1979年为100 (1979=100)
年 份 Year
工资总额指数 Related Indices
Bill of TotalWage Bill
在岗职工年平均货币工资指数 Related Indices
of Average Money Wage
在岗职工年平均实际工资指数 Related Indices
of Average Real Wage
# 国有单位 State-owned
Units
# 国有单位 State-owned
Units
# 国有单位 State-owned
Units
1980 147.9 147.3 127.3 126.1 121.2 120.1
1981 200.9 201.4 147.2 142.5 126.5 122.6
1982 338.8 338.4 177.6 173.0 141.8 138.0
1983 546.8 518.0 200.9 200.1 157.3 156.5
1984 1 196.0 1 143.4 283.4 287.5 207.6 210.6
1985 1 758.5 1 535.5 314.4 309.2 188.1 184.9
1986 2 024.8 1 769.4 318.9 315.4 179.8 177.7
1987 2 710.5 2 169.0 348.1 335.9 171.7 165.4
1988 4 546.7 3 497.3 440.6 416.4 169.6 160.1
1989 6 065.1 4 576.8 501.7 499.0 154.0 152.9
1990 7 703.0 5 626.1 559.7 552.7 169.1 166.8
1991 10 431.9 6 992.8 652.3 625.2 191.3 183.1
1992 13 678.5 9 025.1 771.3 767.6 210.8 209.5
1993 20 990.8 14 249.5 1 059.2 1 127.9 240.9 256.2
1994 28 873.0 17 775.9 1 374.8 1 481.8 264.5 284.9
1995 36 452.7 21 757.0 1 596.4 1 746.4 273.2 298.9
1996 43 514.8 27 119.7 1 886.5 2 117.8 299.7 336.6
1997 50 119.1 29 731.8 2 149.7 2 358.6 330.6 362.9
1998 57 035.5 28 453.3 2 369.0 2 648.7 367.0 410.4
1999 64 393.1 31 184.8 2 669.9 2 953.3 416.5 460.9
2000 71 991.5 32 401.0 2 968.9 3 278.2 450.7 497.8
2001 83 150.2 38 946.0 3 343.0 3 904.3 518.8 606.3
2002 96 454.2 41 633.3 3 637.2 4 443.1 557.7 682.1
2003 111 018.8 48 835.9 3 946.4 5 118.5 600.6 780.3
2004 133 999.7 55 721.8 4 167.4 5 661.1 625.8 851.3
2005 165 087.6 64 247.2 4 238.2 5 978.1 626.4 885.4
2006 201 241.8 75 233.5 4 581.5 6 169.4 662.7 894.3
2007 234 446.7 89 904.0 5 062.6 7 298.4 703.8 1 015.9
2008 277 116.0 104 378.5 5 670.1 8 181.5 743.9 1 075.8
2009 320 346.1 119 617.8 6 095.4 9 040.6 810.1 1 203.8
2010 394 025.7 141 268.6 6 583.0 9 971.8 844.9 1 283.3
2011 459 039.9 161 470.0 7 195.2 10 659.9 876.2 1 301.3
2012 524 223.6 174 549.1 7 698.9 11 320.8 912.1 1 344.2
2013 897 995.0 168 963.5 8 168.5 11 309.5 942.2 1 307.9
2014 1 049 756.2 180 453.0 9 475.5 13 537.5 1 071.3 1 535.5
2015 1 169 428.4 196 152.4 10 565.2 14 688.2 1 168.8 1 630.7
2016 1 274 677.0 200 075.4 11 706.2 15 628.2 1 264.6 1 694.3
2017 1 426 363.6 244 292.1 13 064.1 18 816.4 1 392.3 2 012.8
年平均增长率(%) 28.6 22.8 13.7 14.8 7.2 8.2
Average Annual Growth Rate(%)

353
14-4 城镇单位在岗职工工资总额和年平均工资
TOTAL WAGE BILL AND AVERAGE WAGE OF FULLY EMPLOYED STAFF
AND WORKERS IN URBAN UNITS
年份Year
工资总额(亿元)Total Wage Bill (100 million yuan)
年平均工资(元)Average Wage (yuan)
合计Total
国有单位State-ownedUnits
城镇集体单位Urban
Collective-owned Units
其他单位Units of Other
Types of Ownership
合计Total
国有单位State-ownedUnits
城镇集体单位Urban
Collective-owned Units
其他单位Units of Other
Types of Ownership
1998 167.48 70.70 4.72 92.05 18 381 21 161 11 260 17 204
1999 189.03 77.50 5.38 106.15 20 714 23 602 13 228 19 530
2000 211.34 80.54 4.85 125.94 23 039 26 193 13 234 21 974
2001 244.17 96.83 5.00 142.34 25 941 31 187 13 427 23 981
2002 283.28 103.51 4.32 175.45 28 218 35 501 16 969 25 544
2003 325.99 121.40 4.02 200.58 30 611 40 893 17 061 26 940
2004 419.28 142.23 3.29 273.77 31 928 45 212 20 256 27 868
2005 516.75 164.03 4.72 348.00 32 476 47 762 17 112 28 521
2006 629.66 192.00 3.20 434.46 35 107 49 312 20 591 31 286
2007 733.58 229.37 3.26 500.95 38 798 58 347 21 793 33 787
2008 867.41 266.31 3.43 597.68 43 454 65 431 25 291 37 933
2009 1 002.98 305.16 3.11 694.71 46 723 72 278 24 715 40 582
2010 1 233.88 360.37 4.15 869.36 50 456 79 734 27 801 43 939
2011 1 438.49 411.79 4.78 1 021.92 55 143 85 218 31 830 48 422
2012 1 642.18 445.34 5.59 1 191.25 59 010 90 492 34 444 52 374
2013 2 813.51 431.05 12.60 2 369.86 62 619 90 393 30 207 59 627
2014 3 287.98 460.23 14.64 2 813.11 72 651 108 192 39 993 69 224
2015 3 662.72 500.39 11.14 3 151.20 81 034 117 432 45 546 77 436
2016 3 994.05 510.55 13.35 3 470.14 89 757 124 927 56 682 86 374
2017 4 469.76 623.28 21.20 3 825.28 100 173 150 444 71 380 95 203
注: 从2000年起统计口径为在岗职工。Note: Since 2000, statistical coverage refers to the fully employed staff and workers.

354
14-5 城镇单位就业人员和在岗职工人数(2017年末)
NUMBER OF EMPLOYED PERSONS AND FULLY EMPLOYED STAFF AND WORKERS
IN URBAN UNITS AT YEAR-END (2017)
项 目 Item
单位就业人员年末人数(人)
Number of Employed
Persons (Year-end) (Person)
# 女 性 Female
# 在 岗 职 工 年末人数
Number of Fully Employed Staff and Workers (Year-end)
总 计 Total 4 637 941 1 814 306 4 473 155一、按登记注册类型分 Grouped by Registration
1. 内资单位 Domestic Funded Units 2 643 384 887 618 2 520 202
①国有单位 State-owned Units 424 421 172 184 419 234
②集体单位 Collective-owned Units 28 627 7 864 28 384
③股份合作单位 Cooperative Units 24 359 7 686 22 865
④联营单位 Joint ownership Units 6 896 2 389 6 829
⑤有限责任公司 Limited Liability Corporations 1 427 659 451 819 1 335 005
⑥股份有限公司 Share-holding Corporations Ltd. 687 456 219 019 665 243
⑦其他内资单位 Others 43 966 26 657 42 642
2. 港澳台商投资单位 Units with Funded from Hongkong,Macao and Taiwan 1 395 577 657 182 1 369 490
3. 外商投资单位 Foreign Funded Units 598 980 269 506 583 463
二、按企业、事业、机关分 Grouped by Enterprises, Institutions and Agencies
1. 企业 Enterprises 4 336 078 1 676 089 4 175 805
2. 事业 Institutions 154 957 85 624 152 289
3. 机关 Agencies & Organizations 138 569 46 833 136 853
4.民间非营利组织 Private non-protit organization 1 316 1 071 1 308
5.其他 Others 7 021 4 689 6 900
三、按国民经济行业分 Grouped by Sector
1. 农、林、牧、渔业 Agriculture, Forestry, Animal Husbandry and Fishery 498 136 498
①农业 Agriculture 356 105 356
②林业 Forestry 78 19 78
③畜牧业 Animal Husbandry 36 6 36
④渔业 Fishery 15 3 15
⑤农、林、牧、渔服务业 Services of Agriculture, Forestry,Animal Husbandry and Fishery 13 3 13
2. 采矿业 Mining 3 653 489 3 644
3. 制造业 Manufacturing 2 315 546 978 944 2 297 125
4. 电力、热力、燃气及水生产和供应业 Production and Distribution of Electricity,Heat,Gas and Water 21 082 5 167 21 025
5. 建筑业 Construction 330 464 36 162 259 937
①房屋建筑业 Building 125 968 9 120 102 847
②土木工程建筑业 Civil Engineering 40 770 3 827 24 043
③建筑安装业 Construction installation 42 437 6 453 33 909
④建筑装饰和其他建筑业 Construction Decoration and Other Construction 121 289 16 762 99 138
6. 批发和零售业 Wholesale and Retail Trades 279 880 146 365 265 115
①批发业 Wholesale 142 800 66 938 137 944
②零售业 Retail Sales 137 080 79 427 127 171
7. 交通运输、仓储和邮政业 Transportation, Storage and Post Services 262 179 73 095 244 960
①铁路运输业 Railway Transportation 44 094 10 705 35 929
②道路运输业 Road Transportation 111 508 26 248 107 422
③水上运输业 Water Transportation 8 591 1 138 8 574
④航空运输业 Air Transportation 40 078 13 429 39 501
⑤管道运输业 Petroleum and Gas Pipelines Transportation 19 4 15
⑥装卸搬运和运输代理业 Loading Unloading and Other Transport Services 26 847 11 413 26 608
⑦仓储业 Storage 11 783 4 056 11 640
⑧邮政业 Post Services 19 259 6 102 15 271
8. 住宿和餐饮业 Hotels and Catering Services 106 309 55 622 93 150
①住宿业 Hotels 31 437 15 199 30 968

355
14-5 续表 continued
项 目 Item
单位就业人员年末人数(人)
Number of Employed
Persons (Year-end) (Person)
# 女 性 Female
# 在 岗 职 工 年末人数
Number of Fully Employed Staff and Workers (Year-end)
②餐饮业 Catering Services 74 872 40 423 62 182
9. 信息传输、软件和信息技术服务业 Information Transmission, Computer Services and Software 192 466 72 582 185 320
①电信、广播电视和卫星传输服务 Tele communications,broadcast and satellite transmission services 37 066 16 478 31 006
②互联网和相关服务 Internet and related services 24 921 7 806 24 886
③软件和信息技术服务业 Software and IT Services 130 479 48 298 129 428
10. 金融业 Financial Intermediation 97 209 50 119 95 201
①货币金融服务业 Monetary and Financial Services 48 892 26 927 48 325
②资本市场服务业 Capital market Services 29 198 13 327 27 993
③保险业 Insurance 16 242 8 198 16 020
④其他金融业 Other Financial Actioities 2 877 1 667 2 863
11. 房地产业 Real Estate 218 837 69 237 217 450
其中:①房地产开发经营 Real Estate Development and Operation 22 023 8 034 21 935
②物业管理 Real Estate Management 154 524 46 463 153 868
③房地产中介服务 Real Estate Services 17 818 6 984 17 750
12. 租赁和商务服务业 Leasing and Business Services 310 387 107 373 303 402
①租赁业 Leasing 2 826 544 2 441
②商务服务业 Business Services 307 561 106 829 300 961
13. 科学研究和技术服务业 Scientific Research and Technical Services 103 084 31 139 100 916
①研究和试验发展 Research and Experiment Development 11 617 4 399 11 156
②专业技术服务业 Professional Technology Services 82 408 23 472 80 748
③科技推广和应用服务业 Services of Science and Technology Exchanges and Promotion 9 059 3 268 9 012
14. 水利、环境和公共设施管理业 Management of Water Consercancy,Environment and Public Facilities 13 097 4 234 13 052
①水利管理业 Water Conservancy Administration 1 173 248 1 162
②生态保护和环境治理业 Ecological Protection and Environmental management 2 632 605 2 628
③公共设施管理业 Management of Public Facilities 9 292 3 381 9 262
15. 居民服务、修理和其他服务业 Services to Households and Other Services 24 223 10 034 23 744
①居民服务业 Services to Households 5 145 2 404 4 783
②机动车、电子产品和日用产品修理业 Repair Industry of motor Vehicles,Electronics and Household Goods.
3 273 968 3 211
③其他服务业 Other Services 15 805 6 662 15 750
16. 教育 Education 110 712 63 345 108 000
其中:①初等教育 Primary Schools 36 168 20 694 35 521
②中等教育 Regular Secondary Schools 39 793 20 500 38 961
③高等教育 Regular Institution of Higher Education 10 788 4 680 10 276
17. 卫生和社会工作 Health and Social Work 66 686 45 791 66 014
①卫生 Health Care 63 785 43 955 63 158
②社会工作 Social Work 2 901 1 836 2 856
18. 文化、体育和娱乐业 Culture,sports and Entertainment 29 451 12 448 24 352
①新闻和出版业 Journalism and Publishing Activities 5 341 1 910 5 323
②广播、电视、电影和影视录音制作业 Culture, Sports and Entertainment 9 665 2 791 5 089
③文化艺术业 Cultural and Art Activies 3 388 1 555 3 236
④体育 Sports 5 040 3 447 4 993
⑤娱乐业 Entertainment 6 017 2 745 5 711
19. 公共管理、社会保障和社会组织 Publich Management,Securities and Social Organization 152 178 52 024 150 250
其中:①中国共产党机关 Organs of Communist Party of China 2 225 590 2 198
②国家机构 Government Agencies 140 818 48 153 138 959
③人民政协、民主党派 People's Political Consultative Conference and Democratic Parties
256 75 256
④社会保障 Social Securities
⑤群众社团、社会团体和其他 成员组织
Non-Government Institutions, Social Organizations and Other member Organizations
8 879 3 206 8 837

356
14-6 分经济类型和行业城镇单位就业人员工资总额、平均人数和年平均工资(2017年)
TOTAL WAGE BILL, AVERAGE NUMBER AND AVERAGE WAGE OF EMPLOYED
PERSONS BY OWNERSHIP AND SECTOR IN URBAN UNITS(2017)
项 目 Item
单位就业人员 工资总额(万元)
Total Wage Bill of Employed
Persons(10 000 yuan)
单位就业人员 年平均人数
(人) Average Number
of Employed Persons
(Person)
年平均工资(元)
Average Wage(yuan)
总 计 Total 45 844 846 4 624 313 99 139一、按登记注册类型分 Grouped by Registration
1. 内资单位 Domestic Funded Units 29 716 082 2 593 257 114 590
①国有单位 State-owned Units 6 285 988 419 824 149 729
②集体单位 Collective-owned Units 212 839 29 842 71 322
③股份合作单位 Cooperative Units 135 949 24 468 55 562
④联营单位 Joint ownership Units 66 129 6 841 96 666
⑤有限责任公司 Limited Liability Corporations 14 886 333 1 411 284 105 481
⑥股份有限公司 Share-holding Corporations Ltd. 7 782 293 657 296 118 399
⑦其他内资单位 Others 346 551 43 702 79 299
2. 港澳台商投资单位 Units with Funded from Hongkong,Macao and Taiwan 10 904 609 1 426 325 76 452
3. 外商投资单位 Foreign Funded Units 5 224 154 604 731 86 388
二、按企业、事业、机关分 Grouped by Enterprises, Institutions and Agencies
1. 企业 Enterprises 40 965 999 4 325 133 94 716
2. 事业 Institutions 2 682 215 152 964 175 349
3. 机关 Agencies & Organizations 2 139 662 137 902 155 158
4.民间非营利组织 Private non-protit organization 8 272 1 339 61 777
5.其他 Others 48 698 6 975 69 817
三、按国民经济行业分 Grouped by Sector
1. 农、林、牧、渔业 Agriculture, Forestry, Animal Husbandry and Fishery 3 988 505 78 964
①农业 Agriculture 2 794 363 76 975
②林业 Forestry 722 78 92 564
③畜牧业 Animal Husbandry 216 36 59 861
④渔业 Fishery 81 15 53 733
⑤农、林、牧、渔服务业 Services of Agriculture, Forestry,Animal Husbandry and Fishery 175 13 134 923
2. 采矿业 Mining 80 364 3 653 219 995
3. 制造业 Manufacturing 19 525 333 2 338 697 83 488
4. 电力、热力、燃气及水生产和供应业 Production and Distribution of Electricity,Heat,Gas and Water 392 968 20 847 188 501
5. 建筑业 Construction 2 159 017 309 492 69 760
①房屋建筑业 Building 772 785 109 750 70 413
②土木工程建筑业 Civil Engineering 270 411 40 053 67 513
③建筑安装业 Construction installation 308 486 42 007 73 437
④建筑装饰和其他建筑业 Construction Decoration and Other Construction 807 335 117 682 68 603
6. 批发和零售业 Wholesale and Retail Trades 2 409 175 276 641 87 087
①批发业 Wholesale 1 487 488 140 953 105 531
②零售业 Retail Sales 921 686 135 688 67 927
7. 交通运输、仓储和邮政业 Transportation, Storage and Post Services 2 722 193 259 156 105 041
①铁路运输业 Railway Transportation 490 899 44 638 109 973
②道路运输业 Road Transportation 928 548 109 011 85 179
③水上运输业 Water Transportation 153 908 8 660 177 723
④航空运输业 Air Transportation 536 304 38 284 140 086
⑤管道运输业 Petroleum and Gas Pipelines Transportation 931 19 489 895
⑥装卸搬运和运输代理业 Loading Unloading and Other Transport Services 244 155 26 764 91 225
⑦仓储业 Storage 100 523 11 572 86 868
⑧邮政业 Post Services 266 925 20 208 132 089
8. 住宿和餐饮业 Hotels and Catering Services 530 196 107 435 49 350
①住宿业 Hotels 203 390 31 473 64 624

357
14-6 续表 continued
项 目 Item
单位就业人员 工资总额(万元)
Total Wage Bill of Employed
Persons(10 000 yuan)
单位就业人员 年平均人数
(人) Average Number
of Employed Persons
(Person)
年平均工资(元)
Average Wage(yuan)
②餐饮业 Catering Services 326 806 75 962 43 022
9. 信息传输、软件和信息技术服务业 Information Transmission, Computer Services and Software 3 610 910 192 552 187 529
①电信、广播电视和卫星传输服务 Tele communications,broadcast and satellite transmission services 502 372 37 086 135 461
②互联网和相关服务 Internet and related services 1 002 031 24 853 403 183
③软件和信息技术服务业 Software and IT Services 2 106 508 130 613 161 279
10. 金融业 Financial Intermediation 2 663 848 97 054 274 471
①货币金融服务业 Monetary and Financial Services 1 143 975 48 575 235 507
②资本市场服务业 Capital market Services 1 035 539 29 468 351 411
③保险业 Insurance 315 140 16 031 196 582
④其他金融业 Other Financial Actioities 169 194 2 980 567 765
11. 房地产业 Real Estate 1 863 629 220 408 84 554
其中:①房地产开发经营 Real Estate Development and Operation 403 563 21 693 186 034
②物业管理 Real Estate Management 1 012 536 154 623 65 484
③房地产中介服务 Real Estate Services 163 953 19 691 83 263
12. 租赁和商务服务业 Leasing and Business Services 2 639 820 304 394 86 724
①租赁业 Leasing 25 567 3 227 79 227
②商务服务业 Business Services 2 614 253 301 167 86 804
13. 科学研究和技术服务业 Scientific Research and Technical Services 1 588 252 100 673 157 763
①研究和试验发展 Research and Experiment Development 208 151 11 192 185 982
②专业技术服务业 Professional Technology Services 1 293 355 80 730 160 207
③科技推广和应用服务业 Services of Science and Technology Exchanges and Promotion 86 747 8 751 99 128
14. 水利、环境和公共设施管理业 Management of Water Consercancy,Environment and Public Facilities 132 893 13 331 99 687
①水利管理业 Water Conservancy Administration 12 838 1 156 111 051
②生态保护和环境治理业 Ecological Protection and Environmental management 29 102 2 617 111 202
③公共设施管理业 Management of Public Facilities 90 954 9 558 95 160
15. 居民服务、修理和其他服务业 Services to Households and Other Services 145 503 23 825 61 072
①居民服务业 Services to Households 36 156 5 035 71 809
②机动车、电子产品和日用产品修理业 Repair Industry of motor Vehicles,Electronics and Household Goods.
31 200 3 304 94 432
③其他服务业 Other Services 78 147 15 486 50 463
16. 教育 Education 1 557 521 109 374 142 403
其中:①初等教育 Primary Schools 482 921 35 699 135 276
②中等教育 Regular Secondary Schools 623 570 39 380 158 347
③高等教育 Regular Institution of Higher Education 243 440 10 403 234 009
17. 卫生和社会工作 Health and Social Work 1 157 879 65 651 176 369
①卫生 Health Care 1 130 132 62 737 180 138
②社会工作 Social Work 27 747 2 914 95 219
18. 文化、体育和娱乐业 Culture,sports and Entertainment 345 736 29 389 117 641
①新闻和出版业 Journalism and Publishing Activities 88 087 5 501 160 129
②广播、电视、电影和影视录音制作业 Culture, Sports and Entertainment 95 460 9 469 100 813
③文化艺术业 Cultural and Art Activies 51 190 3 255 157 267
④体育 Sports 72 857 5 078 143 475
⑤娱乐业 Entertainment 38 142 6 086 62 671
19. 公共管理、社会保障和社会组织 Publich Management,Securities and Social Organization 2 315 622 151 236 153 113
其中:①中国共产党机关 Organs of Communist Party of China 42 705 2 181 195 804
②国家机构 Government Agencies 2 114 207 139 810 151 220
③人民政协、民主党派 People's Political Consultative Conference and Democratic Parties
5 242 254 206 386
④社会保障 Social Securities
⑤群众社团、社会团体和其他 成员组织
Non-Government Institutions, Social Organizations and Other member Organizations
153 469 8 991 170 691
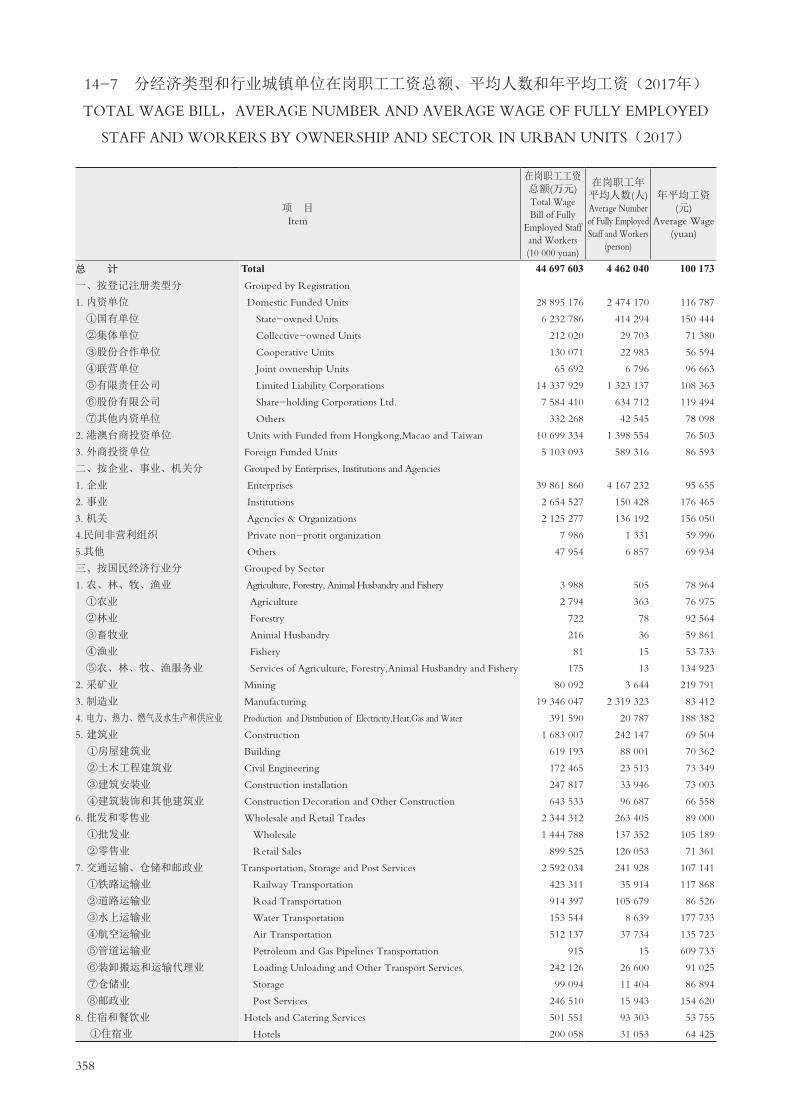
358
14-7 分经济类型和行业城镇单位在岗职工工资总额、平均人数和年平均工资(2017年)
TOTAL WAGE BILL,AVERAGE NUMBER AND AVERAGE WAGE OF FULLY EMPLOYED
STAFF AND WORKERS BY OWNERSHIP AND SECTOR IN URBAN UNITS(2017)
项 目 Item
在岗职工工资 总额(万元) Total Wage Bill of Fully
Employed Staff and Workers (10 000 yuan)
在岗职工年 平均人数(人) Average Number of Fully Employed Staff and Workers
(person)
年平均工资 (元)
Average Wage(yuan)
总 计 Total 44 697 603 4 462 040 100 173一、按登记注册类型分 Grouped by Registration
1. 内资单位 Domestic Funded Units 28 895 176 2 474 170 116 787
①国有单位 State-owned Units 6 232 786 414 294 150 444
②集体单位 Collective-owned Units 212 020 29 703 71 380
③股份合作单位 Cooperative Units 130 071 22 983 56 594
④联营单位 Joint ownership Units 65 692 6 796 96 663
⑤有限责任公司 Limited Liability Corporations 14 337 929 1 323 137 108 363
⑥股份有限公司 Share-holding Corporations Ltd. 7 584 410 634 712 119 494
⑦其他内资单位 Others 332 268 42 545 78 098
2. 港澳台商投资单位 Units with Funded from Hongkong,Macao and Taiwan 10 699 334 1 398 554 76 503
3. 外商投资单位 Foreign Funded Units 5 103 093 589 316 86 593
二、按企业、事业、机关分 Grouped by Enterprises, Institutions and Agencies
1. 企业 Enterprises 39 861 860 4 167 232 95 655
2. 事业 Institutions 2 654 527 150 428 176 465
3. 机关 Agencies & Organizations 2 125 277 136 192 156 050
4.民间非营利组织 Private non-protit organization 7 986 1 331 59 996
5.其他 Others 47 954 6 857 69 934
三、按国民经济行业分 Grouped by Sector
1. 农、林、牧、渔业 Agriculture, Forestry, Animal Husbandry and Fishery 3 988 505 78 964
①农业 Agriculture 2 794 363 76 975
②林业 Forestry 722 78 92 564
③畜牧业 Animal Husbandry 216 36 59 861
④渔业 Fishery 81 15 53 733
⑤农、林、牧、渔服务业 Services of Agriculture, Forestry,Animal Husbandry and Fishery 175 13 134 923
2. 采矿业 Mining 80 092 3 644 219 791
3. 制造业 Manufacturing 19 346 047 2 319 323 83 412
4. 电力、热力、燃气及水生产和供应业 Production and Distribution of Electricity,Heat,Gas and Water 391 590 20 787 188 382
5. 建筑业 Construction 1 683 007 242 147 69 504
①房屋建筑业 Building 619 193 88 001 70 362
②土木工程建筑业 Civil Engineering 172 465 23 513 73 349
③建筑安装业 Construction installation 247 817 33 946 73 003
④建筑装饰和其他建筑业 Construction Decoration and Other Construction 643 533 96 687 66 558
6. 批发和零售业 Wholesale and Retail Trades 2 344 312 263 405 89 000
①批发业 Wholesale 1 444 788 137 352 105 189
②零售业 Retail Sales 899 525 126 053 71 361
7. 交通运输、仓储和邮政业 Transportation, Storage and Post Services 2 592 034 241 928 107 141
①铁路运输业 Railway Transportation 423 311 35 914 117 868
②道路运输业 Road Transportation 914 397 105 679 86 526
③水上运输业 Water Transportation 153 544 8 639 177 733
④航空运输业 Air Transportation 512 137 37 734 135 723
⑤管道运输业 Petroleum and Gas Pipelines Transportation 915 15 609 733
⑥装卸搬运和运输代理业 Loading Unloading and Other Transport Services 242 126 26 600 91 025
⑦仓储业 Storage 99 094 11 404 86 894
⑧邮政业 Post Services 246 510 15 943 154 620
8. 住宿和餐饮业 Hotels and Catering Services 501 551 93 303 53 755
①住宿业 Hotels 200 058 31 053 64 425

359
14-7 续表 continued
项 目 Item
在岗职工工资 总额(万元) Total Wage Bill of Fully
Employed Staff and Workers (10 000 yuan)
在岗职工年 平均人数(人) Average Number of Fully Employed Staff and Workers
(person)
年平均工资 (元)
Average Wage(yuan)
②餐饮业 Catering Services 301 493 62 250 48 433
9. 信息传输、软件和信息技术服务业 Information Transmission, Computer Services and Software 3 555 449 185 668 191 495
①电信、广播电视和卫星传输服务 Tele communications,broadcast and satellite transmission services 460 073 31 355 146 730
②互联网和相关服务 Internet and related services 1 001 559 24 831 403 350
③软件和信息技术服务业 Software and IT Services 2 093 818 129 482 161 707
10. 金融业 Financial Intermediation 2 621 447 94 786 276 565
①货币金融服务业 Monetary and Financial Services 1 127 812 48 001 234 956
②资本市场服务业 Capital market Services 1 018 350 27 984 363 904
③保险业 Insurance 309 094 15 836 195 184
④其他金融业 Other Financial Actioities 166 191 2 965 560 510
11. 房地产业 Real Estate 1 854 752 218 954 84 710
其中:①房地产开发经营 Real Estate Development and Operation 402 429 21 593 186 370
②物业管理 Real Estate Management 1 008 879 153 914 65 548
③房地产中介服务 Real Estate Services 162 886 19 630 82 978
12. 租赁和商务服务业 Leasing and Business Services 2 594 582 297 424 87 235
①租赁业 Leasing 24 389 2 822 86 425
②商务服务业 Business Services 2 570 193 294 602 87 243
13. 科学研究和技术服务业 Scientific Research and Technical Services 1 565 146 98 455 158 971
①研究和试验发展 Research and Experiment Development 205 285 10 712 191 640
②专业技术服务业 Professional Technology Services 1 273 635 79 032 161 154
③科技推广和应用服务业 Services of Science and Technology Exchanges and Promotion 86 226 8 711 98 985
14. 水利、环境和公共设施管理业 Management of Water Consercancy,Environment and Public Facilities 132 338 13 172 100 469
①水利管理业 Water Conservancy Administration 12 783 1 145 111 640
②生态保护和环境治理业 Ecological Protection and Environmental management 29 078 2 613 111 282
③公共设施管理业 Management of Public Facilities 90 478 9 414 96 110
15. 居民服务、修理和其他服务业 Services to Households and Other Services 143 473 23 354 61 434
①居民服务业 Services to Households 34 723 4 672 74 321
②机动车、电子产品和日用产品修理业 Repair Industry of motor Vehicles,Electronics and Household Goods.
30 978 3 242 95 552
③其他服务业 Other Services 77 773 15 440 50 371
16. 教育 Education 1 527 246 106 722 143 105
其中:①初等教育 Primary Schools 477 344 35 113 135 945
②中等教育 Regular Secondary Schools 613 774 38 574 159 116
③高等教育 Regular Institution of Higher Education 237 949 9 914 240 013
17. 卫生和社会工作 Health and Social Work 1 149 235 65 022 176 746
①卫生 Health Care 1 121 631 62 135 180 515
②社会工作 Social Work 27 604 2 887 95 614
18. 文化、体育和娱乐业 Culture,sports and Entertainment 311 646 24 125 129 180
①新闻和出版业 Journalism and Publishing Activities 83 644 5 108 163 751
②广播、电视、电影和影视录音制作业 Culture, Sports and Entertainment 67 940 5 012 135 555
③文化艺术业 Cultural and Art Activies 50 770 3 204 158 458
④体育 Sports 72 764 5 034 144 544
⑤娱乐业 Entertainment 36 529 5 767 63 341
19. 公共管理、社会保障和社会组织 Publich Management,Securities and Social Organization 2 299 668 149 316 154 013
其中:①中国共产党机关 Organs of Communist Party of China 42 382 2 154 196 757
②国家机构 Government Agencies 2 098 818 137 957 152 136
③人民政协、民主党派 People's Political Consultative Conference and Democratic Parties
5 242 254 206 386
④社会保障 Social Securities
⑤群众社团、社会团体和其他 成员组织
Non-Government Institutions, Social Organizations and Other member Organizations
153 226 8 951 171 183
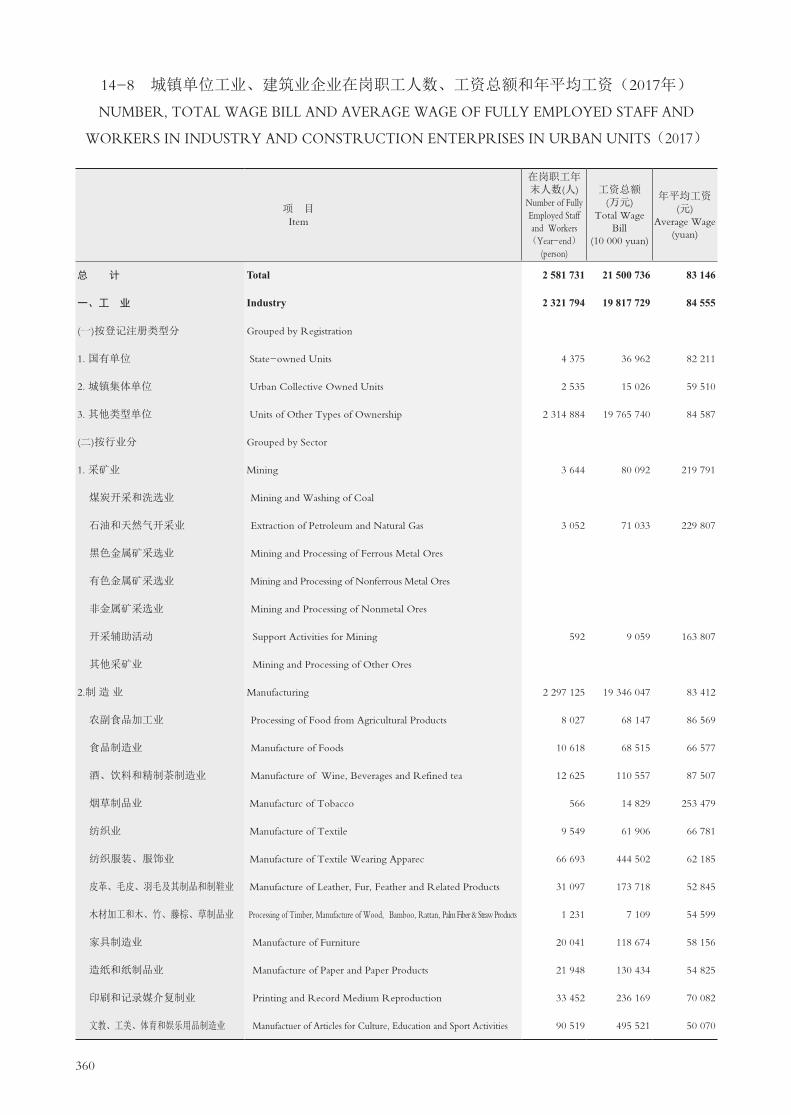
360
14-8 城镇单位工业、建筑业企业在岗职工人数、工资总额和年平均工资(2017年)
NUMBER, TOTAL WAGE BILL AND AVERAGE WAGE OF FULLY EMPLOYED STAFF AND
WORKERS IN INDUSTRY AND CONSTRUCTION ENTERPRISES IN URBAN UNITS(2017)
项 目 Item
在岗职工年末人数(人)
Number of Fully Employed Staff and Workers (Year-end)
(person)
工资总额 (万元)
Total Wage Bill
(10 000 yuan)
年平均工资(元)
Average Wage (yuan)
总 计 Total 2 581 731 21 500 736 83 146
一、工 业 Industry 2 321 794 19 817 729 84 555
(一)按登记注册类型分 Grouped by Registration
1. 国有单位 State-owned Units 4 375 36 962 82 211
2. 城镇集体单位 Urban Collective Owned Units 2 535 15 026 59 510
3. 其他类型单位 Units of Other Types of Ownership 2 314 884 19 765 740 84 587
(二)按行业分 Grouped by Sector
1. 采矿业 Mining 3 644 80 092 219 791
煤炭开采和洗选业 Mining and Washing of Coal
石油和天然气开采业 Extraction of Petroleum and Natural Gas 3 052 71 033 229 807
黑色金属矿采选业 Mining and Processing of Ferrous Metal Ores
有色金属矿采选业 Mining and Processing of Nonferrous Metal Ores
非金属矿采选业 Mining and Processing of Nonmetal Ores
开采辅助活动 Support Activities for Mining 592 9 059 163 807
其他采矿业 Mining and Processing of Other Ores
2.制 造 业 Manufacturing 2 297 125 19 346 047 83 412
农副食品加工业 Processing of Food from Agricultural Products 8 027 68 147 86 569
食品制造业 Manufacture of Foods 10 618 68 515 66 577
酒、饮料和精制茶制造业 Manufacture of Wine, Beverages and Refined tea 12 625 110 557 87 507
烟草制品业 Manufacturc of Tobacco 566 14 829 253 479
纺织业 Manufacture of Textile 9 549 61 906 66 781
纺织服装、服饰业 Manufacture of Textile Wearing Apparec 66 693 444 502 62 185
皮革、毛皮、羽毛及其制品和制鞋业 Manufacture of Leather, Fur, Feather and Related Products 31 097 173 718 52 845
木材加工和木、竹、藤棕、草制品业 Processing of Timber, Manufacture of Wood, Bamboo, Rattan, Palm Fiber & Straw Products 1 231 7 109 54 599
家具制造业 Manufacture of Furniture 20 041 118 674 58 156
造纸和纸制品业 Manufacture of Paper and Paper Products 21 948 130 434 54 825
印刷和记录媒介复制业 Printing and Record Medium Reproduction 33 452 236 169 70 082
文教、工美、体育和娱乐用品制造业 Manufactuer of Articles for Culture, Education and Sport Activities 90 519 495 521 50 070

361
14-8 续表 continued
项 目 Item
在岗职工年末人数(人)
Number of Fully Employed Staff and Workers (Year-end)
(person)
工资总额 (万元)
Total Wage Bill
(10 000 yuan)
年平均工资(元)
Average Wage (yuan)
石油加工、炼焦和核燃料加工业 Processing of Petroleurn, Coking and Nuclear Fuel Processing 758 24 695 328 822
化学原料和化学制品制造业 Manufacture of Raw Chemical Materials and Chemical Products 17 350 143 657 77 896
医药制造业 Manufacture of Medicines 17 348 199 954 117 365
化学纤维制造业 Manufacture of Chemical Fibers 363 2 377 64 582
橡胶和塑料制品业 Manufacture of Rubber and Plastics 143 946 878 457 60 859
非金属矿物制品业 Manufacture of Non-metallic Mineral Products 37 686 302 226 72 270
黑色金属冶炼和压延加工业 Smelting and Pressing of Ferrous Metals 1 873 16 147 87 565
有色金属冶炼和压延加工业 Smelting and Pressing of Nonferrous Metals 4 479 35 652 71 922
金属制品业 Manufacture of Metal Products 74 094 513 859 67 128
通用设备制造业 Manufacture of General-purpose Machinery 81 516 561 032 68 324
专用设备制造业 Manufacture of Special-purpose Machinery 107 542 1 080 511 99 766
汽车制造业 Manufactuer of Automobiles 62 133 515 553 86 338
铁路、船舶航空航天和其他运输设备制造业 Manufacture of Railways,Ships, Aerospace and Other Transport Equipment
25 778 242 017 96 733
电气机械和器材制造业 Manufacture of Electrical Machinery and Equipment 292 175 1 987 562 65 675
计算机、通信和其他电子设备制造业 Manufacture of Communication Equipment, Computers and Other Electronic Equipment 1 051 946 10 357 721 99 997
仪器仪表制造业 Manufacture of Measuring Instruments 60 000 473 134 73 606
其他制造业 Other Manufacturing 9 809 56 786 55 618
废弃资源综合利用业 Recycling and Disposal of Waste 50 209 41 800
金属制品、机械和设备修理业 Manufacture of Metal Products,Machinery and Eguipment Repair 1 913 24 421 127 124
3.电力、热力、燃气及水生产和供应业 Production and Distribution of Electricity,Heat,Gas and Water 21 025 391 590 188 382
电力、热力生产和供应业 Production and Supply of Electric Power and Heat Power 8 401 216 102 259 489
燃气生产和供应业 Production and Supply of Gas 3 972 66 606 167 689
水的生产和供应业 Production and Supply of Water 8 652 108 881 128 292
二、建筑业 Construction 259 937 1 683 007 69 504
按登记注册类型分 Grouped by Registration
1.国有单位 State-owned Units 12 806 100 131 77 802
2.城镇集体单位 Urban Collective Owned Units 478 6 280 131 385
3.其他单位 Units of Other Types of Ownership 246 653 1 576 596 68 907

362
主要统计指标解释
就业人员 指在16周岁及以上,从事一定社会劳动并取得劳动报酬或经营收入的人员。这一指标反映了
一定时期内全部劳动力资源的实际利用情况,是研究我国基本国情国力的重要指标。
单位就业人员 指报告期末最后一日24时在本单位中工作,并取得工资或其他形式劳动报酬的人员数。
该指标为时点指标,不包括最后一日当天及以前已经与单位解除劳动合同关系的人员,是在岗职工、劳务派遣
人员及其他就业人员之和。就业人员不包括:
(1)离开本单位仍保留劳动关系,并定期领取生活费的人员;
(2)在本单位实习的各类在校学生;
(3)本单位因劳务外包而使用的人员。
城镇私营和个体就业人员 城镇私营就业人员指在工商管理部门注册登记,其经营地址设在县城关镇(含
县城关镇)以上的私营企业就业人员,包括私营企业投资者和雇工。城镇个体就业人员指在工商管理部门注册
登记,并持有城镇户口或在城镇长期居住,经批准从事个体工商经营的就业人员,包括个体经营者和在个体工
商户劳动的家庭帮工和雇工。
在岗职工 指在本单位工作且与本单位签订劳动合同,并由单位支付各项工资和社会保险、住房公积金
的人员,以及上述人员中由于学习、病伤、产假等原因暂未工作仍由单位支付工资的人员。在岗职工还包括:
(1)应订立劳动合同而未订立劳动合同人员(如使用的农村户籍人员);
(2)处于试用期人员;
(3)编制外招用的人员;
(4)派往外单位工作,但工资仍由本单位发放的人员(如挂职锻炼、外派工作等情况)。
工资总额 指根据《关于工资总额组成的规定》(1990年1月1日国家统计局发布的一号令)进行修订,在报
告期内(季度或年度)直接支付给本单位全部就业人员的劳动报酬总额。包括计时工资、计件工资、奖金、津贴
和补贴、加班加点工资、特殊情况下支付的工资,是在岗职工工资总额、劳务派遣人员工资总额和其他就业人
员工资总额之和。
工资总额是税前工资,包括单位从个人工资中直接为其代扣或代缴的房费、水费、电费、住房公积金和
社会保险基金个人缴纳部分等。
工资总额不论是计入成本的还是不计入成本的,不论是以货币形式支付的还是以实物形式支付的,均应
列入工资总额的计算范围。
平均工资 是指在报告期内单位发放工资的人均水平。计算公式为:

363
Explanatory Notes on Main Statistical Indicators
Employed Persons refer to persons aged 16 and over who are engaged in gainful employment and thus receive
remuneration payment or earn business income. This indicator reflects the actual utilization of total labour force during a
certain period of time and is often used for the research on China's economic situation and national power.
Persons Employed in Various Units refer to the total number of employees who work at his unit and obtain
wages or other forms of payment at the end of the reporting period. This indicator is a kind of time point index and it
equals to the sum of the number of employed staff and workers, labor dispatch personnel and other employed persons.
Employed persons do not include:
1)persons who have left their working units while keeping their labour contract (employment relation) unchanged
and receiving regular alimony;
2) all kinds of enrolled students who do internship in various units;
3)persons employed due to labor outsourcing;
4)persons who dissolve labor contracts with their units on the last day of reporting period or before.
Persons Employed in Private Enterprises and Self-Employed Individuals in Urban Areas Persons
employed in private enterprises refer to the persons employed in the private enterprises which have been registered at
the departments of industrial and commercial administration for which the business operation are situated at a county
town (i.e. a town where the county government is located), or at urban areas with administrative hierarchy higher than
a county town. The self-employed individuals in urban areas refer to persons who hold the certificates of residence in
urban areas or have resided in the urban areas for a long time and have been registered at the departments of industrial
and commercial administration and approved to be engaged in individual industrial or commercial business, including
self-employed persons as well as helpers and hired laborers who work in individual households.
Fully Employed Staff and Workers refer to persons who signed labor contracts with working units and
working units would pay wages, social insurance and housing funds for them. Persons who have their work posts but are
temporarily absent from work for reasons of study or on sick, injury or maternal leave and still receive wages from their
working units are also included. Employed staff and workers also include:
1)Persons who should have signed the labor contracts but not (like people with rural household registration);
2)Employees on probation;
3)Employees beyond the staffing quota;
4)Employees who are sent to other working units but still obtain wages from their original units (situations like on-
the-job placement, expatriated assignment, etc. )
Total Wage Bill It is revised according to the "Provision of Composition of Total Wages" (Order No.1 by
National Bureau of Statistics on January, 1st, ,1990), total wage bill refers to the total remuneration payment to all
employed persons in various units during the reporting period (by quarter or by year), including hourly-paid wages,
piece-rate wages, bonuses, allowance and subsidies, overtime wages and wages paid under special circumstances. It equals
364
to the sum of total wages of employed staff and workers, dispatch labors and other employed persons.
Total wage bill is pre-tax wages, including the room charges, utility bills, housing funds and social insurance paid
or withheld by employee's units.
Total wage bill, whether or not included in cost, whether or not paid in money or in kind, shall be included in the
calculation of total wage.
Average Wage refers to the average per capita wage in money terms during a certain period of time for employed
persons. It shows the general level of wage income of staff and worker during a certain period of time, one major
indicator to reflect the wage level. It is calculated as follows:
Average WageTotal Wage Bill of Employed Persons at Reference Time
Average Number of Persons Employed at Reference Time

15 SCIENCE AND TECHNOLOGY

366
15-1 高新技术产品进出口情况
TOTAL IMPORTS AND EXPORTS OF HIGH TECHNOLOGY INDUSTRY
单位:万美元 (USD 10 000)
年 份 Year
高新技术产品进出口总额 Total Imports and Exports of High Technology Industry
进 口 Imports
出 口 Exports
2001 2 335 757 1 198 796 1 136 961
2002 3 344 119 1 775 195 1 568 924
2003 5 158 146 2 643 846 2 514 300
2004 6 928 262 3 422 565 3 505 697
2005 8 868 653 4 159 435 4 709 218
2006 11 536 580 5 401 421 6 135 159
2007 13 463 800 6 209 300 7 254 500
2008 14 099 495 6 162 273 7 937 222
2009 15 345 520 6 843 409 8 502 111
2010 19 770 075 8 897 407 10 872 668
2011 22 416 000 9 936 000 12 480 000
2012 25 206 532 11 084 532 14 122 000
2013 30 784 842 13 884 285 16 900 557
2014 24 762 288 11 088 208 13 674 080
2015 25 424 844 11 391 071 14 033 773
2016 22 764 476 10 610 185 12 154 291
2017 22 775 570 11 355 379 11 420 191

367
15-2 专利申请授权概况
PATENT APPLICATIONS EXAMINED AND GRANTED
单位:件 (piece)
年 份 Year
申请总量Number of Patent
Applications
授权总量Number of Patents
Certified
PCT国际专利申请量
Number of PCT International Patent
Applications
发明专利Invention Patent
发明专利Invention Patent
1991 261 49 160 1
1992 507 73 174 5
1993 696 82 427 10
1994 1 009 160 414 9
1995 1 104 124 721 7
1996 1 405 116 923 18
1997 1 440 165 1 260 13
1998 2 093 233 1 364 16
1999 3 314 490 2 116 31
2000 4 431 669 2 401 1
2001 6 033 1 033 3 506 7
2002 7 917 1 846 4 486 91
2003 12 361 3 526 4 937 276
2004 14 918 4 751 7 737 864 331
2005 20 940 8 327 8 983 917 789
2006 29 728 14 576 11 494 1 361 1 661
2007 35 808 19 198 15 552 2 257 2 170
2008 36 249 18 757 18 805 5 409 2 709
2009 42 279 20 520 25 894 8 132 3 800
2010 49 430 23 956 34 951 9 615 5 584
2011 63 522 28 823 39 363 11 826 7 933
2012 73 130 31 075 48 662 13 068 8 024
2013 80 657 32 208 49 756 10 987 10 049
2014 82 254 31 077 53 687 12 040 11 639
2015 105 481 40 028 72 120 16 957 13 308
2016 145 294 56 336 75 043 17 666 19 648
2017 177 103 60 258 94 250 18 926 20 457

368
15-3 R&D经费支出和人员情况
EXPENDITURES ON R&D AND R&D PERSONNEL
项目Item
2009
一、R&D经费支出(万元) Expenditures on R&D(10 000 yuan) 2 797 112
按活动类型分 Grouped by Type of Activity
基础研究 Basic Research 6 833
应用研究 Applied Research 29 436
试验发展 Experimental Development 2 760 843
按单位类型分 Grouped by Type of Unit
科研院所 Scientific Research and Technological Development Institutions 15 772
高等院校 Institutions Of Higher Education 18 321
规模以上工业企业 Industrial Enterprises above Designated Size 2 590 000
规模以上服务业企业 Service Enterprises above Designated Size
建筑业 Construction
其他 Others 173 019
按资金来源分 Grouped by Sources of Funds
政府资金 Government Appropriation Funds 130 380
企业资金 Self-raise Funds by Enterprise 2 633 795
境外资金 Overseas Funds 20 449
其他资金 Other Funds 12 488
二、R&D人员(人)R&D Personnel(person) 145 923
#全时人员 Full-time Personnel 125 053
#研究人员 Researcher 83 212
三、R&D人员折合全时当量(人年) Full-time Equivalent of R&D Personnel(man-year) 123 651
#研究人员 Researcher 74 599
基础研究 Basic Research 590
应用研究 Applied Research 2 788
试验发展 Experimental Development 120 273
注: R&D的中文名称是科学研究与试验发展。Note:R&D refers to research and development.
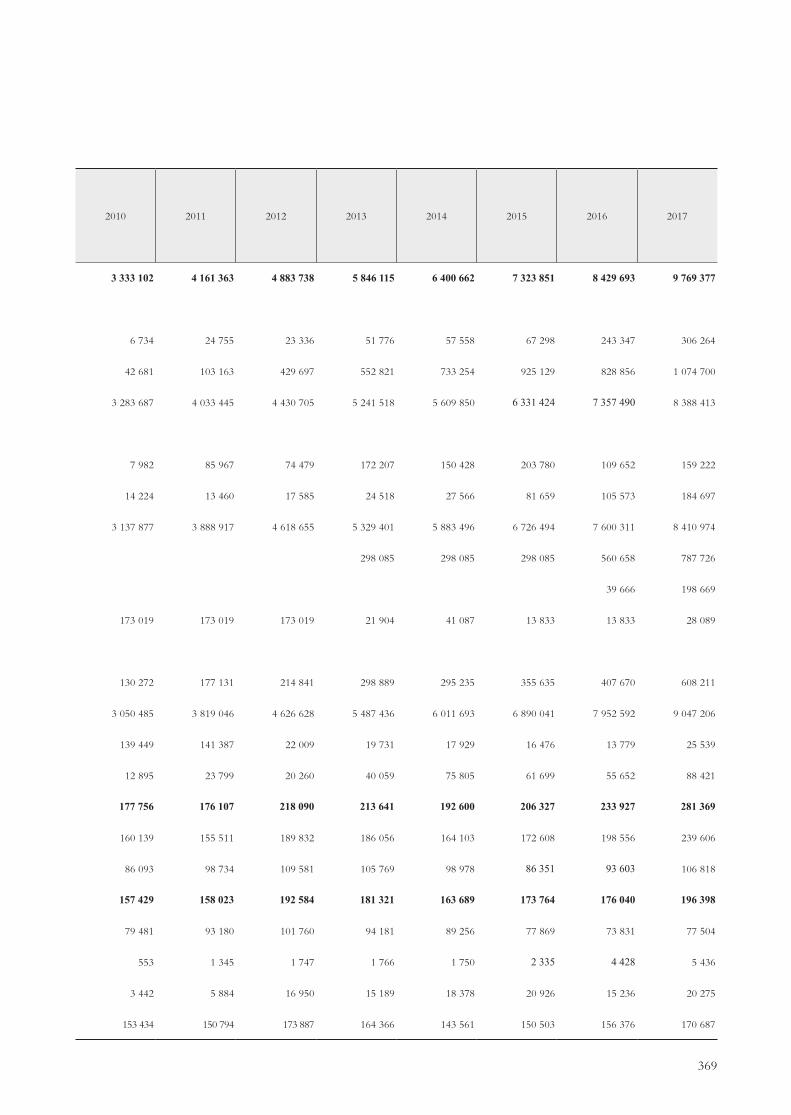
369
2010 2011 2012 2013 2014 2015 2016 2017
3 333 102 4 161 363 4 883 738 5 846 115 6 400 662 7 323 851 8 429 693 9 769 377
6 734 24 755 23 336 51 776 57 558 67 298 243 347 306 264
42 681 103 163 429 697 552 821 733 254 925 129 828 856 1 074 700
3 283 687 4 033 445 4 430 705 5 241 518 5 609 850 6 331 424 7 357 490 8 388 413
7 982 85 967 74 479 172 207 150 428 203 780 109 652 159 222
14 224 13 460 17 585 24 518 27 566 81 659 105 573 184 697
3 137 877 3 888 917 4 618 655 5 329 401 5 883 496 6 726 494 7 600 311 8 410 974
298 085 298 085 298 085 560 658 787 726
39 666 198 669
173 019 173 019 173 019 21 904 41 087 13 833 13 833 28 089
130 272 177 131 214 841 298 889 295 235 355 635 407 670 608 211
3 050 485 3 819 046 4 626 628 5 487 436 6 011 693 6 890 041 7 952 592 9 047 206
139 449 141 387 22 009 19 731 17 929 16 476 13 779 25 539
12 895 23 799 20 260 40 059 75 805 61 699 55 652 88 421
177 756 176 107 218 090 213 641 192 600 206 327 233 927 281 369
160 139 155 511 189 832 186 056 164 103 172 608 198 556 239 606
86 093 98 734 109 581 105 769 98 978 86 351 93 603 106 818
157 429 158 023 192 584 181 321 163 689 173 764 176 040 196 398
79 481 93 180 101 760 94 181 89 256 77 869 73 831 77 504
553 1 345 1 747 1 766 1 750 2 335 4 428 5 436
3 442 5 884 16 950 15 189 18 378 20 926 15 236 20 275
153 434 150 794 173 887 164 366 143 561 150 503 156 376 170 687

370
15-4 规模以上工业企业科技活动情况
SCIENTIFIC AND TECHNOLOGICAL ACTIVITIES OF INDUSTRIAL
ENTERPRISES ABOVE DESIGNATED SIZE
项目Item
2009
一、企业单位数(个) Number of Enterprises(unit) 8 412
#有R&D活动 Number of Enterprises Having R&D Activities 1 018
#有研发机构 Number of Enterprises Having R&D Institutions 630
二、科技经费支出(万元) Expenditure on Science and Technology Funds (10 000 yuan) 4 046 336
#R&D经费支出 Expenditure on R&D 2 590 000
基础研究 Basic Research
应用研究 Applied Research
试验发展 Experimental Development 2 590 000
三、R&D经费支出占主营业务收入的比重(%) Percentage of Expenditure on R&D to Sales Revenue(%) 1.77
四、科技活动人员(人) 186 607
#R&D人员 128 208
#全时人员 113 665
#研究人员 76 638
#R&D人员折合全时当量(人年) 110 944
基础研究
应用研究
试验发展 110 944
五、科技项目情况
参加项目人员(人) 148 619
#R&D项目人员(人) 106 655
科技项目经费支出(万元) 3 356 235
#R&D项目经费支出(万元) 2 458 682
六、新产品开发经费支出(万元) 2 936 794
七、新产品产值(万元)
Scientists and Engineers(person)
R&D Personnel(person)
Full-time Personnel
Researcher
Full-time Equivalent of R&D Personnel(man-year)
Basic Research
Applied Research
Experimental Development
Situation on Science and Technology Project
Participants (person)
R&D Project Personnel (person)
Expenditure on Science and Technology Project(10 000 yuan)
Expenditure on R&D Project (10 000 yuan)
Expenditure on New Products Development(10 000 yuan)
New Product Output Value(10 000 yuan) 27 946 838

371
2010 2011 2012 2013 2014 2015 2016 2017
8 248 5 692 5 835 6 523 6 355 6 539 6 629 7 938
798 841 928 1 009 1 181 1 304 2 117 3 507
586 673 482 457 542 830 2 147 3 562
4 849 681 6 228 277 6 892 046 7 854 503 9 940 538 11 707 641 12 346 417 15 090 782
3 137 877 3 888 917 4 618 655 5 329 402 5 883 496 6 726 494 7 600 311 8 410 974
2 695 90 5 268 10 246 4 998 125 145 139 379
18 127 39 357 361 002 475 848 647 365 820 614 720 810 877 169
3 119 750 3 846 865 4 257 563 4 848 286 5 225 885 5 900 882 6 754 356 7 394 426
1.70 1.93 2.20 2.39 2.45 2.69 2.84 2.73
246 797 239 929 283 887 267 527 293 258 293 416 345 387 414 923
160 148 155 912 196 202 187 045 176 345 174 953 202 684 232 421
148 550 141 577 175 321 168 063 154 456 150 739 175 916 203 288
79 876 90 605 99 979 90 736 89 349 70 759 78 060 82 797
144 588 142 605 176 354 162 497 150 803 149 748 155 780 164 381
91 17 250 180 83 1 794 1 822
622 1 379 12 312 10 393 12 336 13 797 12 425 14 037
143 966 141 135 164 025 151 854 138 287 135 868 141 561 148 522
206 997 197 260 235 832 223 942 244 154 242 848 309 598 384 189
146 905 141 089 178 556 171 028 159 782 160 300 194 192 225 881
4 197 838 4 905 302 5 646 650 6 484 263 8 432 529 9 823 032 12 029 250 14 242 106
3 113 550 3 768 019 4 463 613 5 108 052 5 657 289 6 566 820 7 516 607 8 403 844
2 104 077 4 780 146 5 082 580 5 849 360 7 329 189 8 722 544 10 902 729 13 402 850
52 649 725 57 555 275 62 226 474 65 858 037 69 415 715 88 719 507 104 986 925 128 017 918

372
15-5 创新载体情况
INNOVATION CARRIER
单位:个
项目Item
2010
总计 Total 419
国家级 National Level 41
国家级重点实验室 National Key Laboratory 8
国家工程实验室 National Engineering Laboratory 5
国家工程(技术)研究中心 National Engineering(technology) Research Center 2
国家认定企业技术中心 National Enterprise Technology Center 13
国家地方联合工程研究中心(工程实验室) National and Local Union Engineering Research Cente(Engineering Laboratory)
国家基因库 National Gene Bank
深圳超级计算中心 Super Computing Center in Shenzhen 1
国家级孵化器 National incubator 10
国家级平台 National platform 2
省级 Provincial Level 20
省级重点实验室 Provincial Key Laboratory 7
省级工程实验室 Provincial Engineering Laboratory
省级工程(技术)研究中心 Provincial Engineering( technology) Research Center 13
省级企业技术中心 Provincial Enterprise Technology Center
市级 Municipal Level 358
市级重点实验室 Municipal Key Laboratory 88
市级工程实验室 Municipal Engineering Laboratory 34
市级工程(技术)研究中心 Municipal Engineering( technology) Research Center 102
市级企业技术中心 Municipal Enterprise Technology Center 74
市级公共技术服务平台 Municipal Public Technical Service Platform 52
市级孵化器 Municipal incubator 8
注: 数据为累计数。Note:Data in this table is Cumulative data.

373
(unit)
2011 2012 2013 2014 2015 2016 2017
563 760 966 1107 1283 1 493 1 688
57 61 72 73 80 94 103
11 11 12 12 14 14 14
5 5 7 7 7 7 11
5 5 7 7 7 7 7
16 17 19 20 20 24 26
5 8 11 11 16 26 26
1 1 1 1 1 1 1
1 1 1 1 1 1 1
11 11 12 12 12 12 15
2 2 2 2 2 2 2
32 45 73 76 129 165 253
13 17 17 18 22 24 24
2 5 5 7 10 10 10
17 23 51 51 96 130 218
1 1 1
474 654 821 958 1074 1 234 1 332
112 142 164 191 206 221 238
75 153 212 247 298 394 419
111 135 154 166 183 186 197
96 119 143 172 193 211 211
71 96 112 124 136 144 166
9 9 36 58 58 78 101

374
主要统计指标解释
科技活动 是指在所有科学技术领域内,即自然科学、农业科学、医学科学、工程与技术科学、人文科
学与社会科学中,与科技知识的产生、发展、传播和应用密切相关的全部的、有组织的、系统的科技活动。所
谓有组织的、系统的科技活动,是指在一个机构的范围之内,并列入这一机构的工作计划,由这一机构的人员
有计划地进行的科技活动。科技活动包括三类:(1)研究与试验发展活动(简称R&D,包括基础研究、应用研究
和实验发展);(2)科学研究与试验发展成果应用活动;(3)科技服务活动。我们的统计调查只包括前两类活动。
科技活动统计单位 指制度调查范围内的调查单位个数,对于自然科学领域、社会与人文科学领域的科
学研究与技术开发机构(含县属研究与开发机构)、科学技术情报与文献机构是以一个机构为一个调查单位;
对于高等学校,是以一个学校为一个调查单位;对于企业是以一个企业为一个调查单位。
科技活动人员 指直接从事科技活动、以及专门从事科技活动管理和为科技活动提供直接服务累计从事科
技活动的实际工作时间占全年制度工作时间l0%及以上的人员。(1)直接从事科技活动的人员包括:在独立
核算的科学研究与技术开发机构、高等学校、各类企业及其他事业单位内设的研究室、实验室、技术开发中心
及中试车间(基地)等机构中从事科技活动的研究人员、工程技术人员、技术工人及其它人员;虽不在上述机
构工作,但编入科技活动项目(课题)组的人员;科技信息与文献机构中的专业技术人员;从事论文设计的研
究生等。(2)专门从事科技活动管理和为科技活动提供直接服务的人员包括:独立核算的科学研究与技术开
发机构、科技信息与文献机构、高等学校、各类企业及其他事业单位主管科技工作的负责人,专门从事科技活
动的计划、行政、人事、财务、物资供应、设备维护、图书资料管理等工作的各类人员,但不包括保卫、医疗
保健人员、司机、食堂人员、茶炉工、水暖工、清洁工等为科技活动提供间接服务的人员。
科技项目经费内部支出 指统计单位内部在报告期进行科技项目研究和试制等的实际支出。包括劳务
费、原材料费、设备购置费、其他日常支出、外协加工费等;不包括委托或与外单位合作进行项目研究而拨付
给对方使用的经费、企业科技活动管理部门的费用、用于科技活动目的的基建支出以及为科技活动提供间接服
务人员的费用等。
科技机构内课题(项目)个数 指调查单位列入科研计划或已为本单位科研管理部门认可,可作为本单位
科研工作任务,并在当年开展活动的研究与发展、研究与发展成果应用、科技服务课题(项目)数。包括当年
新开课题和上年尚未完成,在统计年度内继续进行的课题。
研究与试验发展(R&D) 是指在科学技术领域,为增加知识总量、以及运用这些知识去创造新的应用进
行的系统的创造性的活动,包括基础研究、应用研究、试验发展三类活动。
基础研究 是指为了获得关于现象和可观察事实的基本原理的新知识(揭示客观事物的本质、运动规
律,获得新发现、新学说)而进行的实验性或理论性研究,它不以任何专门或特定的应用或使用为目的。其成
果以科学论文和科学著作为主要形式。
应用研究 是指为获得新知识而进行的创造性研究,主要针对某一特定的目的或目标。应用研究是为了
确定基础研究成果可能的用途,或是为达到预定的目标探索应采取的新方法(原理性)或新途径。其成果形式
以科学论文、专著、原理性模型或发明专利为主。
试验发展 是指利用从基础研究、应用研究和实际经验所获得的现有知识,为产生新的产品、材料和装
置,建立新的工艺、系统和服务,以及对已产生和建立的上述各项作实质性的改进而进行的系统性工作。其成
果形式主要是专利、专有技术、具有新产品基本特征的产品原型或具有新装置基本特征的原始样机等。在社会
科学领域,试验发展是指把通过基础研究、应用研究获得的知识转变成可以实施的计划(包括为进行检验和评

375
估实施示范项目)的过程。人文科学领域没有对应的试验发展活动。
研究与试验发展人员 指参与研究与试验发展项目研究、管理和辅助工作的人员,包括项目(课题)组人
员,企业科技行政管理人员和直接为项目(课题)活动提供服务的辅助人员。
全时人员 指报告年内从事R&D活动的时间占全年工作时间90%及以上的人员。
全时当量 指全时人员数加非全时人员按工作量折算为全时人员数的总和。例如:有两个全时人员和三个
非全时人员(工作时间分别为20%、30%和70%,则全时当量为2+0.2+0.3+0.7=3.2人年。
政府资金 指从各级政府部门获得的计划用于科技活动的经费,包括科学事业费、科技三项费、科研基建
费、科学基金、教育等部门事业费中计划用于科技活动的经费以及政府部门预算外资金中计划用于科技活动的
经费等。
企业资金 指从自有资金中提取或接受其他企业委托的、科研院所和高校等事业单位接受企业委托获得
的,计划用于科研和技术开发的经费。不包括来自政府、金融机构及国外的计划用于科技活动的资金。
新产品 指采用新技术原理、新设计构思研制、生产的全新产品,或在结构、材质、工艺等某一方面比原
有产品有明显改进,从而显著提高了产品性能或扩大了使用功能的产品。既包括政府有关部门认定并在有效期
内的新产品,也包括企业自行研制开发,未经政府有关部门认定,从投产之日起一年之内的新产品。
376
Explanatory Notes on Main Statistical Indicators
Scientific and Technological Activities refer to all those organized and systematic activities of science and
technology which are closely connected with the emergence, development, diffusion and application of scientific and
technological knowledge in all scientific and technological fields, such as natural sciences, agricultural science, medical
science, engineering and technical science, humanities and social sciences. Organized and systematic activities refer to
activities within the range of an institution, regarded as regular work of the institution and organized in a planned way
by the personnel of the institution. Scientific and technological activities classified into three categories: (1) activities of
research and development (R&D, it includes basic research, applied research and experiments and development); (2)
applied activities of research and development; (3) service activities of science and technology. Our survey only included
the first two activities.
Surveyed Units of Scientific and Technological Activities refer to the number of survey units within the
survey coverage. As for research and development institutions (including those under county administration) and scientific
and technological information and literature institutions in natural sciences, social sciences and humanities, one institution
constitutes a survey unit; as for institutions of higher education, one university or college accounts for a survey unit; as for
enterprises, one enterprise is a survey unit.
Personnel Engaged in S&T Activities refer to personnel directly engaged in S&T activities, in the management
of S&T activities, and in providing direct service to S&T activities, who spend over 10% of the total working hours in
a year in S&T activities. (1) Personnel directly engaged in S&T activities include researchers, engineers, technicians and
other related personnel engaged in S&T activities in independent-accounting R&D institutions, institutions of higher
learning, and in research institutes, laboratories, technology development centers and central experiment workshops under
enterprises and institutions. Also included people are working in S&T research project teams, professional and technical
personnel working in S&T information archiving institutes, and graduate students working on the design of their thesis.
(2) Personnel engaged in the management of S&T activities and in providing direct service to S&T activities include
senior management people responsible for S&T activities in independent-accounting R&D institutions, S&T information
archiving institutes, institutions of higher learning, and in enterprises and institutions where S&T activities are undertaken.
Also included are people responsible for the planning, administration, personnel management, financial management,
logistics supply, equipment maintenance, information and library management that are related with S&T activities. People
providing indirect services are excluded, such as security, medical service, drivers, plumbers, cleaners and those providing
catering and related service.
Internal Expenditure of Funds on Science and Technology Projects refers to actual expenditure of internal
funds of the surveyed units on research and test of R&D projects at the reference period, including service fee, material
expenditure, equipment purchase cost, other daily expenditure, cost of external process; excluding expenditure of funds
transferred to other cooperated and entrusted units of the projects, expenditure of management department for enterprise
science and technology activities, capital construction expenditure for science and technology activities, cost of indirect
service for science and technology activities and etc.
Number of Research Tasks (Projects) of Scientific and Technological Institutions refers to the number of
research tasks (projects) on R&D, application of R&D and scientific and technological services, which are listed in the

377
plans of scientific research or approved by administrative departments of the survey units and launched in the current year.
It includes those newly started and those uncompleted in the preceding year but continued into the current statistical
year.
Research and Development (R&D) refers to systematic and creative activities in the field of science and
technology aiming at increasing the knowledge and using the knowledge for new application. R&D includes 3 categories
of activities: basic research, applied research and experiments and development.
Basic Research refers to empirical or theoretical research aiming at obtaining new knowledge on the fundamental
principles of phenomena of observable facts to reveal the nature and law of movement of objects and to acquire new
discoveries or new theories. Basic research takes no specific or designated application as the aim of the research. Results of
basic research are mainly released or disseminated in the form of scientific papers or monographs.
Applied Research refers to creative research aiming at obtaining new knowledge on a specific objective or target.
Purpose of the applied research is to identify the possible use of results from basic research, or to explore new (fundamental)
methods or new approaches. Results of applied research are expressed in the form of scientific papers, monographs,
fundamental models or invention patents.
Experimental Development refers to systematic activities aiming at using the knowledge from basic and applied
researches or from practical experience to develop new products, materials and equipment, to establish new production
process, systems and services, or to make substantial improvement on the existing products, process or services. Results
of experiment and development activities are embodied in patents, exclusive technology, and monotype of new products
or equipment. In social sciences, experiment and development activities refer to the process of converting the knowledge
from basic or applied researches into feasible programs (including conduct of demonstration projects for assessment and
evaluation). There are no experiment and development activities in the science of humanities.
R&D Personnel refer to persons engaged in research, management and supporting activities of R&D, including
persons in the project teams, persons engaged in the management of S&T activities of enterprises and supporting staff
providing direct service to the research projects.
Full-time Personnel refer to the persons who spend over 90% of the total working hours in a year on R&D
activities.
Full-time Equivalent of R&D Personnel refers to the sum of the full-time persons and the full-time equivalent
of part-time persons converted by workload. For instance, if there are 2 full-time persons and 3 part-time workers (20%,
30% and 70% of working hours respectively on R&D activities), the full-time equivalent is 2+0.2+0.3+0.7=3.2 person-
year.
Government Funds refer to funds obtained from government agencies at all levels to be used for S&T activities,
including funds for scientific undertakings, 3 kinds of funds for S&T activities, funds for capital construction for scientific
researches, science funds, funds from education expenditures by education departments for S&T activities, and extra-
budget funds from government agencies for S&T activities.
Enterprise Funds refer to funds raised by enterprises from their own expenditures or from other enterprises and
funds received by universities or research institutions from enterprises for scientific research or technical development
projects. Excluded in this category are funds from government agencies, financial institutions or from foreign institutions.

New Products refer to products produced with new technology and new design, or products that represent
noticeable improvement in terms of structure, material, or production process so as to improve significantly the character
or function of the older versions. They include new products certified by relevant government agencies within the period
of certification, as well as new products designed and produced by enterprises within a year without certification by
government agencies.


381
16-1 各级各类学校数
NUMBER OF SCHOOL BY LEVEL AND TYPE
单位:所 (unit)
年 份 Year
普通高等学校 Institutions of Higher Education
中等职业 学校
Vocational Secondary Schools
普通中学 Regular
Secondary Schools
小 学 Primary Schools
幼儿园 Kindergartens
1979 24 226 90
1980 24 238 52
1981 26 244 32
1982 28 246 50
1983 1 30 248 69
1984 2 35 260 87
1985 2 38 258 79
1986 2 40 257 273
1987 2 43 255 187
1988 2 47 257 195
1989 2 47 264 207
1990 2 49 263 228
1991 2 51 260 257
1992 2 53 261 282
1993 3 51 267 281
1994 3 56 269 333
1995 2 62 274 349
1996 2 71 274 380
1997 2 73 275 446
1998 2 78 286 488
1999 2 83 325 560
2000 2 94 353 562
2001 3 107 377 588
2002 9 132 395 634
2003 9 25 179 376 656
2004 9 16 216 378 699
2005 9 16 245 358 744
2006 9 13 260 357 758
2007 8 13 273 347 819
2008 8 13 277 342 865
2009 8 13 285 346 974
2010 8 13 295 340 1 040
2011 9 13 299 334 1 093
2012 10 15 302 333 1 186
2013 10 15 314 335 1 313
2014 10 16 325 331 1 402
2015 12 15 335 334 1 489
2016 12 15 352 337 1 579
2017 12 15 368 342 1 683
注: 根据教育部的统一要求及深圳实际,将普通中专、成人中专和职业高中合并统称为中等职业教育。该指标由于深圳市布局调整的原因产生了波动。 Note: According to unified requirements of the Ministry of Education and the actual situation of Shenzhen,the index,vocational secondary educa-tion was mergered by technical secondary school, specialized secondary schools for adults and vocational senior secondary schools. This index was fluctuated by layout adjusting in shenzhen.

382
16-2 各级各类学校教职工数
STAFF AND WORKERS BY LEVEL AND TYPE OF SCHOOL
单位:人 (person)
年 份 Year
普通高等学校 Institutions of Higher Education
中等职业 学校
Vocational Secondary Schools
普通中学 Regular
Secondary Schools
小 学 Primary Schools
幼儿园 Kindergartens
1986 816 2 871 3 632
1987 972 3 182 3 959 1 616
1988 1 034 3 455 4 302 1 558
1989 1 393 3 758 4 596 1 969
1990 1 348 3 920 5 061 2 267
1991 1 381 4 308 5 388 2 716
1992 1 405 4 650 5 768 3 113
1993 1 536 5 106 6 337 4 154
1994 2 753 5 589 7 129 5 294
1995 1 187 6 063 7 666 5 929
1996 1 331 6 669 8 702 6 817
1997 1 430 7 079 9 148 8 328
1998 1 649 7 369 9 786 9 761
1999 1 819 7 886 11 449 11 605
2000 1 902 8 739 14 697 12 787
2001 2 165 9 763 17 370 14 515
2002 3 369 11 662 20 621 16 483
2003 3 820 2 029 13 379 23 382 17 778
2004 4 421 1 758 15 401 25 460 19 345
2005 5 025 1 733 18 713 30 194 21 376
2006 4 995 1 712 20 500 31 748 23 167
2007 5 458 1 711 23 191 33 985 25 711
2008 5 796 1 791 26 044 35 816 28 483
2009 6 149 1 868 27 577 36 203 33 156
2010 6 042 2 077 28 874 37 167 38 693
2011 6 260 2 184 45 293 23 624 42 837
2012 6 823 2 739 47 733 24 805 46 617
2013 7 603 2 790 50 332 25 476 52 400
2014 8 057 3 023 53 254 26 792 57 021
2015 9 061 3 136 57 146 28 157 62 813
2016 9 741 3 296 62 164 29 842 68 017
2017 11 242 3 447 67 423 31 098 74 366
注:根据全国教育事业统计口径,2014年九年一贯制学校教职工纳入初中阶段学校统计;十二年一贯制学校、完全中学学校教职工纳入普通高中阶段学校统计。 Note:According to the statistical scope of national education, in 2014, the numbers of 9-Year Schools’ educational personnel is included in senior secondary education; the numbers of 12-Year Schools and their educational personnel are included in senior secondary education.
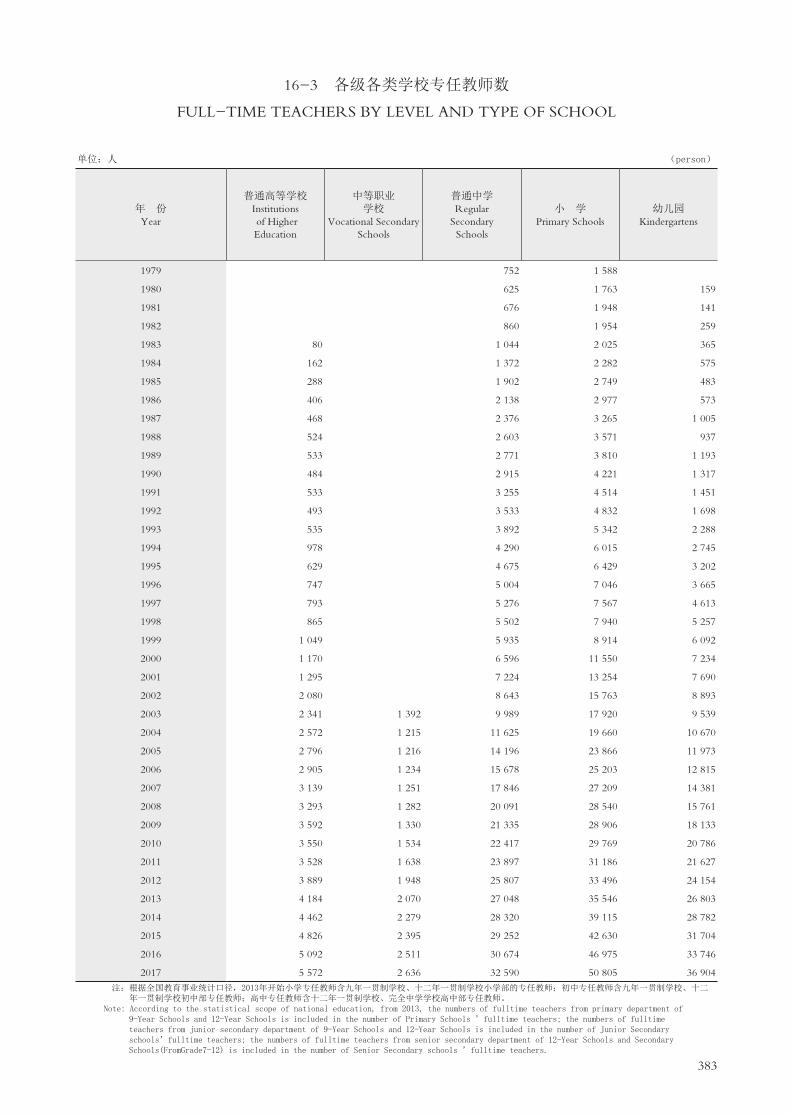
383
16-3 各级各类学校专任教师数
FULL-TIME TEACHERS BY LEVEL AND TYPE OF SCHOOL
单位:人 (person)
年 份 Year
普通高等学校 Institutions of Higher Education
中等职业 学校
Vocational Secondary Schools
普通中学 Regular
Secondary Schools
小 学 Primary Schools
幼儿园 Kindergartens
1979 752 1 588
1980 625 1 763 159
1981 676 1 948 141
1982 860 1 954 259
1983 80 1 044 2 025 365
1984 162 1 372 2 282 575
1985 288 1 902 2 749 483
1986 406 2 138 2 977 573
1987 468 2 376 3 265 1 005
1988 524 2 603 3 571 937
1989 533 2 771 3 810 1 193
1990 484 2 915 4 221 1 317
1991 533 3 255 4 514 1 451
1992 493 3 533 4 832 1 698
1993 535 3 892 5 342 2 288
1994 978 4 290 6 015 2 745
1995 629 4 675 6 429 3 202
1996 747 5 004 7 046 3 665
1997 793 5 276 7 567 4 613
1998 865 5 502 7 940 5 257
1999 1 049 5 935 8 914 6 092
2000 1 170 6 596 11 550 7 234
2001 1 295 7 224 13 254 7 690
2002 2 080 8 643 15 763 8 893
2003 2 341 1 392 9 989 17 920 9 539
2004 2 572 1 215 11 625 19 660 10 670
2005 2 796 1 216 14 196 23 866 11 973
2006 2 905 1 234 15 678 25 203 12 815
2007 3 139 1 251 17 846 27 209 14 381
2008 3 293 1 282 20 091 28 540 15 761
2009 3 592 1 330 21 335 28 906 18 133
2010 3 550 1 534 22 417 29 769 20 786
2011 3 528 1 638 23 897 31 186 21 627
2012 3 889 1 948 25 807 33 496 24 154
2013 4 184 2 070 27 048 35 546 26 803
2014 4 462 2 279 28 320 39 115 28 782
2015 4 826 2 395 29 252 42 630 31 704
2016 5 092 2 511 30 674 46 975 33 746
2017 5 572 2 636 32 590 50 805 36 904
注:根据全国教育事业统计口径,2013年开始小学专任教师含九年一贯制学校、十二年一贯制学校小学部的专任教师;初中专任教师含九年一贯制学校、十二 年一贯制学校初中部专任教师;高中专任教师含十二年一贯制学校、完全中学学校高中部专任教师。Note: According to the statistical scope of national education, from 2013, the numbers of fulltime teachers from primary department of 9-Year Schools and 12-Year Schools is included in the number of Primary Schools ’fulltime teachers; the numbers of fulltime teachers from junior secondary department of 9-Year Schools and 12-Year Schools is included in the number of Junior Secondary schools’fulltime teachers; the numbers of fulltime teachers from senior secondary department of 12-Year Schools and Secondary Schools(FromGrade7-12) is included in the number of Senior Secondary schools ’fulltime teachers.
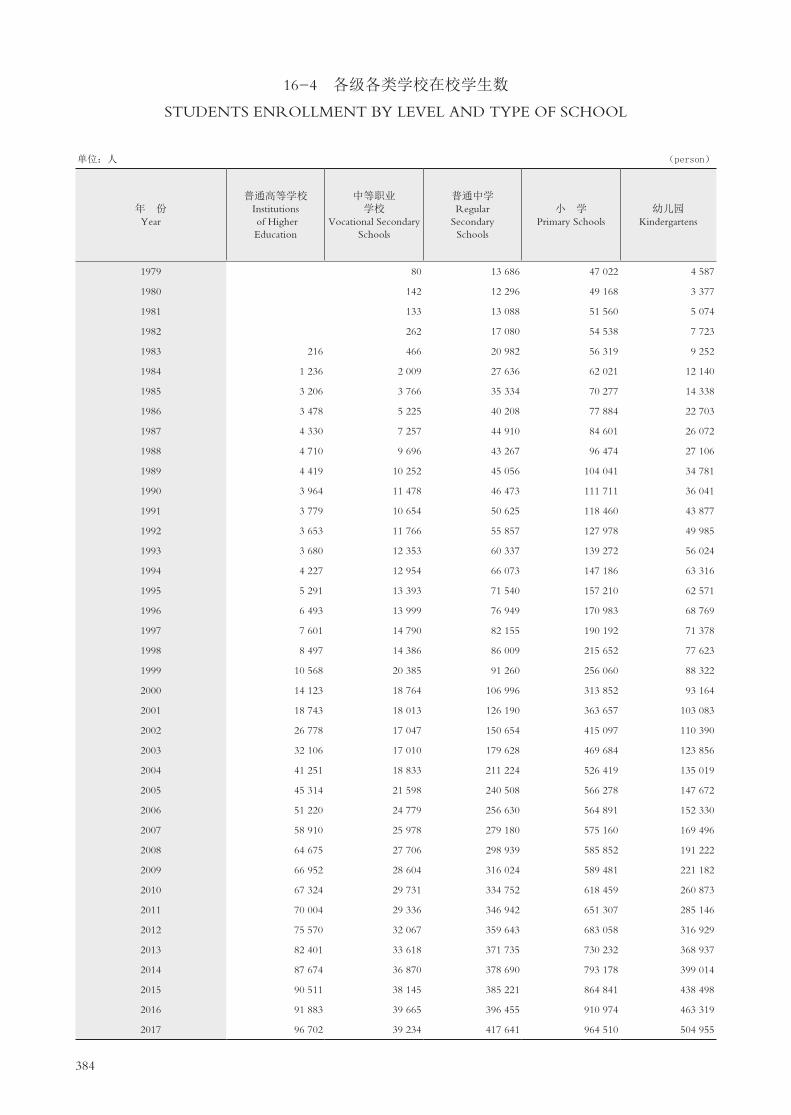
384
16-4 各级各类学校在校学生数
STUDENTS ENROLLMENT BY LEVEL AND TYPE OF SCHOOL
单位:人 (person)
年 份 Year
普通高等学校 Institutions of Higher Education
中等职业 学校
Vocational Secondary Schools
普通中学 Regular
Secondary Schools
小 学 Primary Schools
幼儿园 Kindergartens
1979 80 13 686 47 022 4 587
1980 142 12 296 49 168 3 377
1981 133 13 088 51 560 5 074
1982 262 17 080 54 538 7 723
1983 216 466 20 982 56 319 9 252
1984 1 236 2 009 27 636 62 021 12 140
1985 3 206 3 766 35 334 70 277 14 338
1986 3 478 5 225 40 208 77 884 22 703
1987 4 330 7 257 44 910 84 601 26 072
1988 4 710 9 696 43 267 96 474 27 106
1989 4 419 10 252 45 056 104 041 34 781
1990 3 964 11 478 46 473 111 711 36 041
1991 3 779 10 654 50 625 118 460 43 877
1992 3 653 11 766 55 857 127 978 49 985
1993 3 680 12 353 60 337 139 272 56 024
1994 4 227 12 954 66 073 147 186 63 316
1995 5 291 13 393 71 540 157 210 62 571
1996 6 493 13 999 76 949 170 983 68 769
1997 7 601 14 790 82 155 190 192 71 378
1998 8 497 14 386 86 009 215 652 77 623
1999 10 568 20 385 91 260 256 060 88 322
2000 14 123 18 764 106 996 313 852 93 164
2001 18 743 18 013 126 190 363 657 103 083
2002 26 778 17 047 150 654 415 097 110 390
2003 32 106 17 010 179 628 469 684 123 856
2004 41 251 18 833 211 224 526 419 135 019
2005 45 314 21 598 240 508 566 278 147 672
2006 51 220 24 779 256 630 564 891 152 330
2007 58 910 25 978 279 180 575 160 169 496
2008 64 675 27 706 298 939 585 852 191 222
2009 66 952 28 604 316 024 589 481 221 182
2010 67 324 29 731 334 752 618 459 260 873
2011 70 004 29 336 346 942 651 307 285 146
2012 75 570 32 067 359 643 683 058 316 929
2013 82 401 33 618 371 735 730 232 368 937
2014 87 674 36 870 378 690 793 178 399 014
2015 90 511 38 145 385 221 864 841 438 498
2016 91 883 39 665 396 455 910 974 463 319
2017 96 702 39 234 417 641 964 510 504 955

385
16-5 各级各类学校招生数
NEW STUDENTS ENROLLMENT BY LEVEL AND TYPE OF SCHOOL
单位:人 (person)
年 份 Year
普通高等学校 Institutions of Higher Education
中等职业学校 Vocational Secondry
Schools
普通中学 Regular
Secondary Schools
小 学 Primary Schools
幼儿园 Kindergartens
1979 5 612 8 978
1980 5 344 9 064
1981 5 046 9 978
1982 7 401 9 561
1983 216 8 142 8 936
1984 473 10 053 9 700 8 734
1985 1 482 12 954 11 876 10 148
1986 1 173 12 826 14 269 10 932
1987 1 573 15 121 15 191 9 344
1988 1 378 12 583 17 235 8 369
1989 1 228 16 654 18 525 15 273
1990 1 041 17 034 19 122 17 494
1991 1 126 17 956 19 634 28 493
1992 1 070 21 242 22 129 32 847
1993 1 309 22 417 26 333 37 035
1994 1 664 24 286 27 860 26 213
1995 2 134 26 463 31 198 35 630
1996 2 470 27 752 33 692 37 869
1997 2 580 29 773 37 306 33 906
1998 3 078 31 286 41 824 32 822
1999 4 211 34 380 55 876 39 019
2000 6 522 41 980 64 265 39 392
2001 7 239 48 533 72 220 50 354
2002 10 210 58 847 81 107 40 523
2003 11 915 6 108 69 711 88 203 51 989
2004 14 455 7 430 79 359 96 554 54 735
2005 15 044 8 913 92 305 101 274 58 658
2006 17 916 9 071 94 866 95 359 57 007
2007 19 396 8 439 102 093 98 106 63 442
2008 20 578 10 198 111 454 98 525 71 062
2009 20 488 10 051 113 516 103 166 87 747
2010 20 330 9 610 120 335 118 028 110 977
2011 22 914 10 223 123 382 128 091 118 843
2012 25 794 12 233 127 983 137 276 122 138
2013 27 613 12 076 131 160 147 097 143 792
2014 28 062 13 628 130 769 162 498 174 195
2015 27 653 13 691 135 326 172 097 159 728
2016 28 523 13 964 143 681 173 804 173 978
2017 31 390 13 005 152 395 181 516 202 474

386
16-6 各级各类学校毕业生数
GRADUATES BY LEVEL AND TYPE OF SCHOOL
单位:人 (person)
年 份 Year
普通高等学校 Institutions of Higher Education
中等职业 学校
Vocational Secondary Schools
普通中学 Regular
Secondary Schools
小 学 Primary Schools
幼儿园 Kindergartens
1984 4 677 8 505 6 710
1985 7 468 10 669 7 824
1986 9 169 11 481 9 892
1987 1 028 11 401 14 411 7 529
1988 828 14 305 8 821 7 741
1989 1 491 13 388 12 947 13 090
1990 1 334 13 914 13 363 13 848
1991 1 191 11 885 14 428 23 140
1992 1 187 14 035 16 555 27 126
1993 1 203 14 739 17 685 30 000
1994 1 064 15 345 19 010 17 749
1995 1 143 17 617 20 876 33 187
1996 1 210 18 891 21 030 25 889
1997 1 474 20 215 22 095 32 459
1998 2 126 23 651 23 871 26 560
1999 2 146 23 179 27 040 35 545
2000 2 382 24 874 33 219 39 917
2001 2 779 28 424 38 987 44 157
2002 3 927 32 503 47 025 43 912
2003 4 740 5 141 40 200 55 017 48 797
2004 6 282 5 680 48 061 62 032 49 575
2005 9 007 5 429 58 363 75 517 54 204
2006 12 413 5 325 66 047 81 554 58 421
2007 13 568 6 836 71 162 84 734 59 134
2008 13 635 8 227 80 616 88 805 65 231
2009 17 230 8 659 85 599 91 176 72 451
2010 18 003 8 083 92 053 91 909 76 909
2011 18 311 9 075 100 845 92 979 78 547
2012 18 327 9 519 105 384 99 359 100 648
2013 18 618 8 937 109 616 98 650 118 688
2014 21 187 9 593 112 233 97 928 131 220
2015 23 397 11 413 118 481 100 181 149 862
2016 25 473 11 449 121 304 111 008 154 655
2017 25 279 12 205 119 643 119 948 168 600
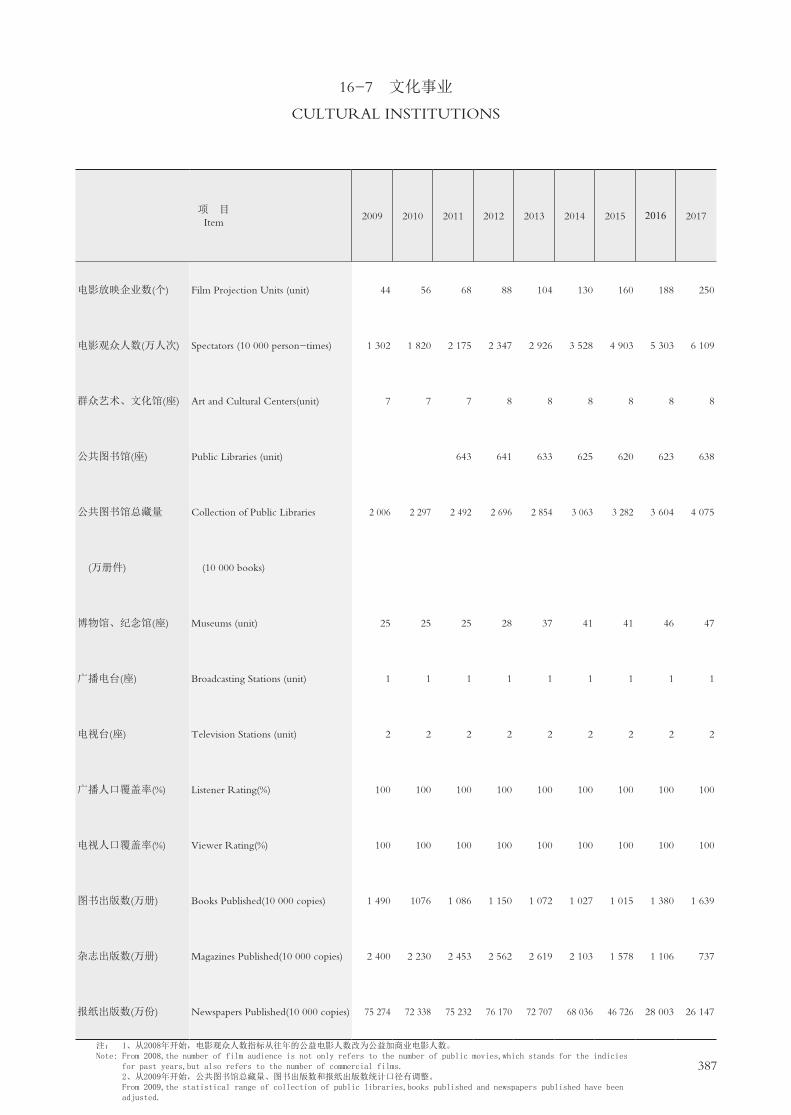
387
16-7 文化事业
CULTURAL INSTITUTIONS
项 目 Item
2009 2010 2011 2012 2013 2014 2015 2016 2017
电影放映企业数(个) Film Projection Units (unit) 44 56 68 88 104 130 160 188 250
电影观众人数(万人次) Spectators (10 000 person-times) 1 302 1 820 2 175 2 347 2 926 3 528 4 903 5 303 6 109
群众艺术、文化馆(座) Art and Cultural Centers(unit) 7 7 7 8 8 8 8 8 8
公共图书馆(座) Public Libraries (unit) 643 641 633 625 620 623 638
公共图书馆总藏量 Collection of Public Libraries 2 006 2 297 2 492 2 696 2 854 3 063 3 282 3 604 4 075
(万册件) (10 000 books)
博物馆、纪念馆(座) Museums (unit) 25 25 25 28 37 41 41 46 47
广播电台(座) Broadcasting Stations (unit) 1 1 1 1 1 1 1 1 1
电视台(座) Television Stations (unit) 2 2 2 2 2 2 2 2 2
广播人口覆盖率(%) Listener Rating(%) 100 100 100 100 100 100 100 100 100
电视人口覆盖率(%) Viewer Rating(%) 100 100 100 100 100 100 100 100 100
图书出版数(万册) Books Published(10 000 copies) 1 490 1076 1 086 1 150 1 072 1 027 1 015 1 380 1 639
杂志出版数(万册) Magazines Published(10 000 copies) 2 400 2 230 2 453 2 562 2 619 2 103 1 578 1 106 737
报纸出版数(万份) Newspapers Published(10 000 copies) 75 274 72 338 75 232 76 170 72 707 68 036 46 726 28 003 26 147
注: 1、从2008年开始,电影观众人数指标从往年的公益电影人数改为公益加商业电影人数。Note: From 2008,the number of film audience is not only refers to the number of public movies,which stands for the indicies for past years,but also refers to the number of commercial films. 2、从2009年开始,公共图书馆总藏量、图书出版数和报纸出版数统计口径有调整。 From 2009,the statistical range of collection of public libraries,books published and newspapers published have been adjusted.

388
主要统计指标解释
普通高等学校 指按照国家规定的设置标准和审批程序批准举办,通过全国普通高等教育统一招生考
试,招收高中毕业生为主要培养对象,实施高等学历教育的全日制大学、独立设置的学院和高等专科学校、高
等职业学校和其他机构。
电影放映企业数 指具有放映机器设备、固定或不固定的放映场所与专职或兼职的放映技术人员,经有
关部门登记批准,经常为一定的观众对象放映电影的机构。包括经批准对外开放进行营业,并与电影发行放映
管理机构分帐的专用放映单位和军委系统租片单位。

389
Explanatory Notes on Main Statistical Indicators
Regular Institutions of Higher Education refer to educational establishments set up according to government
standards and evaluation and approval procedures, mainly enrolling graduates from senior secondary schools through
uniform national matriculation examinations and providing higher education. Such institutions include full-time
universities, independent colleges, technical colleges, professional colleges, and other institutions.
Film Projection Units refer to units with film projection equipment, full or part-time projectionists, permanent
or non-permanent cinemas, approved by and registered with related administrative departments to show films regularly
for certain groups of audience, including film projection units which have been approved to give commercial shows and
share profits with administrative agencies of film circulation and projection, as well as film renting units of the military
system.


17 PUBLIC HEALTH,SOCIAL SECURITY AND SOCIAL WELFARE


393
17-1 卫 生 事 业(一)
PUBLIC HEALTH(Ⅰ)
年 份 Year
一、医疗卫生机构数合计(个)
Health Care Institutions
(unit)
1. 医院合计 Total
Hospitals
2. 疗养院 Sanatoriums
3. 门诊部、私人诊所、企事业内部
医务室 Outpatient
Departments, Private Clinic and Clinic in
Enterprises
4. 专科疾病防治院
Specialized Prevention
& Treatment Stations
5. 疾病预防控制中心(卫生防疫站)
Disease Prevention and Control Centers
(Antiepidemic Stations)
# 综合医院 General Hospitals
1979 62 25 25 31 1 1
1980 74 24 24 44 1 1
1981 77 24 24 47 1 1
1982 121 26 26 87 1 2
1983 128 30 28 91 1 2
1984 150 29 26 109 2 6
1985 215 31 27 169 2 6
1986 297 32 28 1 243 2 7
1987 311 34 30 1 253 2 7
1988 308 35 30 1 249 4 6
1989 332 35 29 1 271 5 6
1990 354 38 32 1 291 4 6
1991 360 41 35 1 293 4 6
1992 397 45 37 1 326 4 6
1993 400 45 37 1 324 3 8
1994 496 48 38 1 416 3 8
1995 506 63 53 1 407 6 8
1996 1 422 65 54 1 1 314 7 8
1997 1 126 72 59 1 1 011 7 8
1998 899 72 59 1 784 7 8
1999 687 71 58 1 574 7 7
2000 683 72 59 1 568 4 7
2001 723 75 62 1 600 4 7
2002 761 77 62 1 638 5 7
2003 893 85 68 1 759 5 7
2004 856 87 71 1 706 6 7
2005 1 063 97 78 1 902 7 7
2006 1 692 99 80 1 1 529 7 7
2007 1 781 101 81 1 1 615 7 7
2008 1 806 100 79 1 1 638 7 7
2009 1 963 101 79 1 1 794 7 7
2010 1 827 107 79 1 1 651 7 7
2011 1 854 110 78 1 1 676 7 8
2012 2 008 115 80 1 1 823 7 9
2013 2 228 117 79 1 2 038 8 10
2014 2 532 122 80 1 2 338 8 11
2015 2 946 123 77 1 2 751 8 11
2016 3 339 134 78 1 3 114 8 11
2017 3 492 135 77 1 3 238 8 10
注: 自2002年开始计划生育指导中心、药检所等不记入卫生事业机构中;医生仅统计执业医师与执业助理医师,护士仅统计注册护士,未取得执业证的医师 和未注册的护士计入其他卫生技术人员,不得从事医护工作。 Note: The number of health care institutions since 2002 does not include the number of birth-control centers and medicines and chemical reagent test labs. The numder of doctors just include licensed doctors and licensed assistant doctors, the number of nurses include registered nurses only.
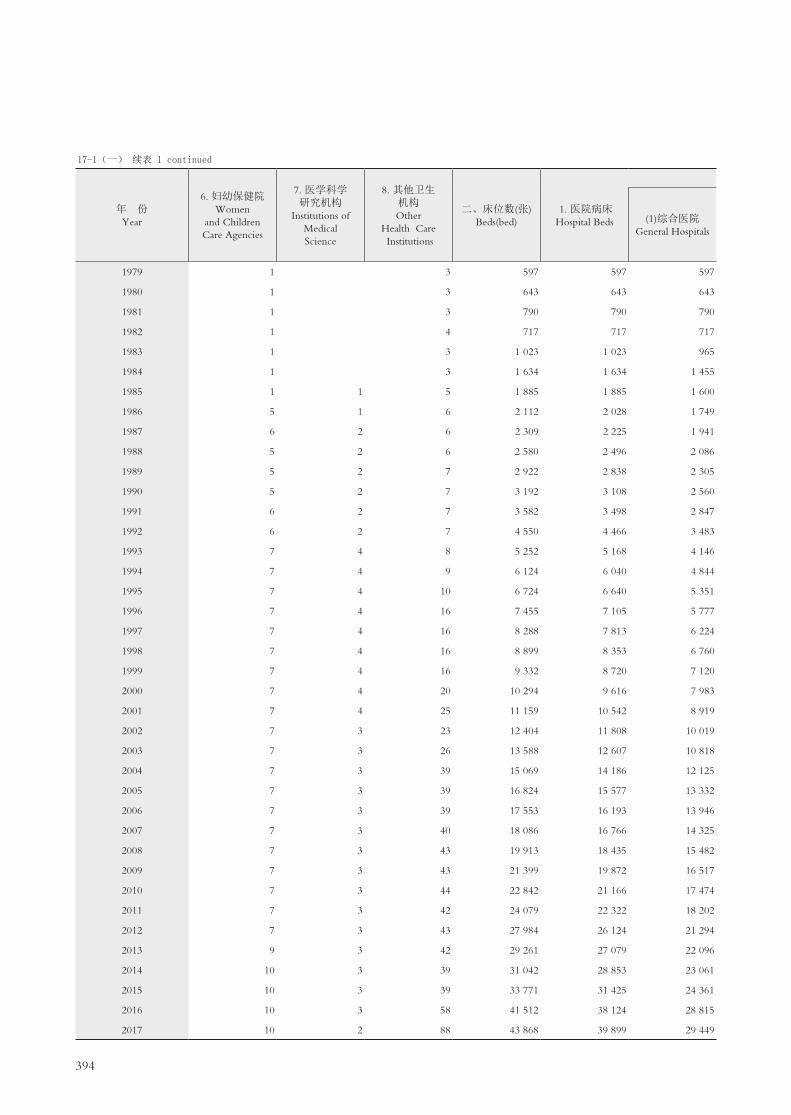
394
17-1(一) 续表 1 continued
年 份 Year
6. 妇幼保健院 Women
and Children Care Agencies
7. 医学科学 研究机构
Institutions of Medical Science
8. 其他卫生 机构 Other
Health Care Institutions
二、床位数(张) Beds(bed)
1. 医院病床 Hospital Beds (1)综合医院
General Hospitals
1979 1 3 597 597 597
1980 1 3 643 643 643
1981 1 3 790 790 790
1982 1 4 717 717 717
1983 1 3 1 023 1 023 965
1984 1 3 1 634 1 634 1 455
1985 1 1 5 1 885 1 885 1 600
1986 5 1 6 2 112 2 028 1 749
1987 6 2 6 2 309 2 225 1 941
1988 5 2 6 2 580 2 496 2 086
1989 5 2 7 2 922 2 838 2 305
1990 5 2 7 3 192 3 108 2 560
1991 6 2 7 3 582 3 498 2 847
1992 6 2 7 4 550 4 466 3 483
1993 7 4 8 5 252 5 168 4 146
1994 7 4 9 6 124 6 040 4 844
1995 7 4 10 6 724 6 640 5 351
1996 7 4 16 7 455 7 105 5 777
1997 7 4 16 8 288 7 813 6 224
1998 7 4 16 8 899 8 353 6 760
1999 7 4 16 9 332 8 720 7 120
2000 7 4 20 10 294 9 616 7 983
2001 7 4 25 11 159 10 542 8 919
2002 7 3 23 12 404 11 808 10 019
2003 7 3 26 13 588 12 607 10 818
2004 7 3 39 15 069 14 186 12 125
2005 7 3 39 16 824 15 577 13 332
2006 7 3 39 17 553 16 193 13 946
2007 7 3 40 18 086 16 766 14 325
2008 7 3 43 19 913 18 435 15 482
2009 7 3 43 21 399 19 872 16 517
2010 7 3 44 22 842 21 166 17 474
2011 7 3 42 24 079 22 322 18 202
2012 7 3 43 27 984 26 124 21 294
2013 9 3 42 29 261 27 079 22 096
2014 10 3 39 31 042 28 853 23 061
2015 10 3 39 33 771 31 425 24 361
2016 10 3 58 41 512 38 124 28 815
2017 10 2 88 43 868 39 899 29 449

395
17-1(一) 续表 2 continued
年 份 Year
2.其他医疗卫生机构 Other Health Care
Institutions
三、卫生工作人员数(人)
Medical Personnel (person)
1. 卫生技术 人员
Medical Technical Personnel
(2) 专科医院 Specialized Hospitals
(1)执业医师 Licensed Doctors
1979 1 214 988 364
1980 1 335 1 088 438
1981 1 514 1 270 518
1982 1 967 1 609 708
1983 58 2 910 2 343 1 073
1984 179 3 869 3 064 1 484
1985 285 4 861 3 857 1 862
1986 279 84 5 800 4 657 2 217
1987 284 84 6 354 5 117 2 408
1988 410 84 7 115 5 715 2 754
1989 533 84 7 923 6 451 3 103
1990 548 84 8 619 6 996 3 426
1991 651 84 9 405 7 618 3 737
1992 983 84 10 643 8 571 4 247
1993 1 022 84 12 261 9 888 4 798
1994 1 196 84 13 853 11 034 5 347
1995 1 289 84 15 591 12 449 6 050
1996 1 328 350 17 925 14 652 7 266
1997 1 589 475 18 553 14 932 7 400
1998 1 593 546 18 707 14 975 7 191
1999 1 600 612 18 841 15 143 7 062
2000 1 633 678 19 691 15 720 7 418
2001 1 623 617 21 362 17 135 8 097
2002 1 789 596 23 100 18 615 7 853
2003 1 789 981 26 178 21 234 8 909
2004 2 061 883 28 593 22 895 9 846
2005 2 245 1 247 31 577 25 681 10 961
2006 2 247 1 360 53 441 43 266 16 238
2007 2 441 1 320 59 170 46 877 17 450
2008 2 953 1 478 63 488 50 608 18 807
2009 3 355 1 527 67 028 53 778 19 963
2010 3 692 1 676 67 678 54 081 20 122
2011 4 120 1 757 71 969 58 059 21 517
2012 4 830 1 860 76 684 61 961 22 831
2013 4 983 2 182 82 105 65 782 24 221
2014 5 792 2 189 86 535 69 936 25 728
2015 7 064 2 346 92 682 74 884 27 834
2016 9 309 3 388 96 955 78 826 29 300
2017 10 450 3 969 104 363 85 282 31 838
注: 由于卫生工作人员统计口径的变化,而使该类人数指标产生了较大的增幅。 Note: Because of changing of statistics range,the data of medical personnel increased substantially.

396
17-1(一) 续表 3 continued
年 份 Year
2.其他技术人员 Other
Technical Personnel
(2)执业助理医师 Licensed Assistant Doctors
(3)注册护士 Registered
Nurses
(4)药剂人员 Pharmacists
(5)检验人员 Laboratory Technicians
(6)其它 Others
执业中医师 Licensed
Doctors of Chinese Medicine
中医执业助理医师 Licensed Assistant
Doctors of Traditional
Chinese Medicine
1979 96 138 22 32 432
1980 88 186 31 41 392 13
1981 98 237 46 48 421 15
1982 116 323 76 60 442 5
1983 141 551 121 91 507 21
1984 171 716 173 125 566 41
1985 243 997 222 158 618 29
1986 304 1 246 260 211 723 44
1987 341 1 450 292 257 710 48
1988 374 1 734 409 283 535 86
1989 433 1 971 431 321 625 85
1990 463 2 145 475 355 595 118
1991 503 2 372 539 365 605 156
1992 579 2 705 630 375 614 183
1993 650 3 225 744 464 657 169
1994 739 3 625 823 538 701 318
1995 823 4 034 906 612 847 386
1996 1 292 4 654 1 005 664 1 063 427
1997 1 122 4 828 1 063 708 933 519
1998 928 5 025 1 111 760 888 502
1999 879 5 230 1 108 812 931 614
2000 919 5 425 1 130 847 900 689
2001 958 5 945 1 194 871 1 028 605
2002 865 407 28 6 635 1 292 965 1 463 800
2003 939 530 41 7 321 1 499 1 085 1 890 1 056
2004 1 015 521 42 7 975 1 569 1 219 1 765 1 243
2005 1 134 658 45 8 981 1 710 1 362 2 009 1 191
2006 1 548 1 347 110 16 583 2 796 2 340 3 962 2 117
2007 1 625 1 335 121 17 869 2 876 2 190 5 157 1 974
2008 1 873 1 366 93 19 339 2 979 2 382 5 735 2 072
2009 2 017 1 425 155 21 008 3 046 2 578 5 758 2 171
2010 2 151 1 109 85 21 866 2 896 2 486 5 602 2 213
2011 2 230 1 140 89 23 987 3 021 2 615 5 779 2 232
2012 2 649 1 111 124 25 931 3 143 2 652 6 293 2 192
2013 2 911 1 137 284 28 035 3 343 3 022 6 024 2 592
2014 3 069 1 130 103 29 723 3 469 3 086 6 800 2 779
2015 3 452 1 173 119 31 717 3 607 3 216 7 337 2 933
2016 3 616 1 259 115 34 065 3 644 3 364 7 194 3 998
2017 4 079 1 460 148 36 389 3 842 3 517 8 236 4 514

397
17-1(一) 续表 4 continued
年 份 Year
3.管理人员 Managerial Personnel
4.工勤人员 Logistics Workers
四、医疗机构总诊疗人次 (万人次)
Total Patients Treated
五、入院人次(万人次)
Total Inpatients (10 000 persons)
六、病床 使用率(%) Utilization Rate of Beds (%)
七、病床 周转次数
(次) Turnover of Beds(time)
1979 123 103
1980 112 122
1981 120 109 148 1.41
1982 168 185 169 1.97
1983 193 353 212 3.44
1984 221 543 280 4.11
1985 354 621 345 4.88
1986 394 705 389 4.68 66.2 24.4
1987 411 778 461 5.84 73.6 22.2
1988 465 849 563 6.97 75.6 28.8
1989 517 870 607 7.87 78.4 29.0
1990 463 1 042 729 8.73 81.4 29.0
1991 514 1 117 840 10.08 85.2 30.3
1992 645 1 244 976 11.40 81.9 28.0
1993 965 1 239 1 050 12.59 80.3 26.6
1994 1 108 1 393 1 057 12.81 70.8 23.2
1995 1 195 1 561 1 202 13.07 65.0 20.8
1996 1 252 1 594 1 168 14.63 64.3 21.5
1997 1 426 1 676 1 231 16.15 67.4 21.9
1998 1 381 1 849 1 386 19.05 68.6 24.1
1999 1 386 1 698 1 520 21.12 69.3 24.5
2000 1 479 1 803 1 699 26.61 75.4 28.3
2001 1 729 1 893 1 912 30.23 77.3 29.4
2002 1 753 1 932 2 062 35.74 80.0 30.6
2003 1 807 2 081 3 052 41.57 84.0 33.5
2004 2 100 2 355 3 514 49.00 82.4 34.9
2005 2 367 2 338 4 055 54.68 79.9 34.6
2006 3 058 5 000 5 170 59.24 81.6 35.6
2007 3 450 6 869 5 954 68.09 87.5 38.6
2008 3 867 6 941 6 842 75.34 89.1 37.9
2009 3 925 7 154 7 549 79.70 86.1 38.4
2010 4 060 7 324 8 127 89.1 89.2 40.1
2011 3 638 8 040 8 878 96.2 90.5 41.4
2012 3 557 8 974 8 638 105.4 85.8 40.1
2013 3 620 10 111 9 112 109.4 84.2 38.4
2014 3 590 10 230 8 853 119.4 85.5 39.4
2015 4 092 10 773 8 901 124.1 84.0 38.1
2016 4 182 9 949 9 598 138.4 85.2 39.0
2017 4 447 10 120 8 705 150.7 84.8 39.2
注: 根据最新国家卫生统计调查制度,从2012年开始总诊疗人次变更统计口径,不包括健康体检和计划免疫人次。Note: According to the latest national health system,from 2012,the statistics range of Total Patients Treated has changed,not including health examination and planned immunization personnel.

398
17-1 卫生事业(二)
PUBLIC HEALTH(Ⅱ)
项目Item
2011 2012 2013 2014 2015 2016 2017
总诊疗人次(万人次)Total Patients Treated(10000 person-times)
8 878.0 8 638.0 9 112.1 8 852.6 8 900.6 9 598.3 8 705.4
#门诊人次(万人次)#Outpatient Visits(10000 person-times)
7 034.8 7 326.1 7 629.3 7 685.6 7 834.3 8 417.0 7 584.4
急诊人次(万人次) Emergency Visits(10000 person-times)
683.5 686.8 747.3 724.5 708.2 789.1 746.4
出院人次(人次)Number of Discharged
960 190 1 050 687 1 092 137 1 193 257 1 238 808 1 381 748 1 507 250
Patients(person-time)
出院病人平均住院日(日) Average Stay Days in 7.9 7.8 7.9 7.7 7.9 7.8 7.7
Hospital(day)
门诊病人次均医疗费用(元)The Average Medical Expenses Of Outpatient Every Time(yuan)
142.3 157.4 170.1 201.7 218.4 230.4 246.6
住院病人次均医疗费用(元)The Average Medical Expenses Of Discharged Patients Every Time(yuan)
6 650.6 6 979.7 7 745.4 8 243.3 9 117.2 9 547.0 10 139.5
注:2013年起,“急诊人次”口径有调整。 Note: From 2013,the statistical coverage of “Emergency Visits” has been adjusted.
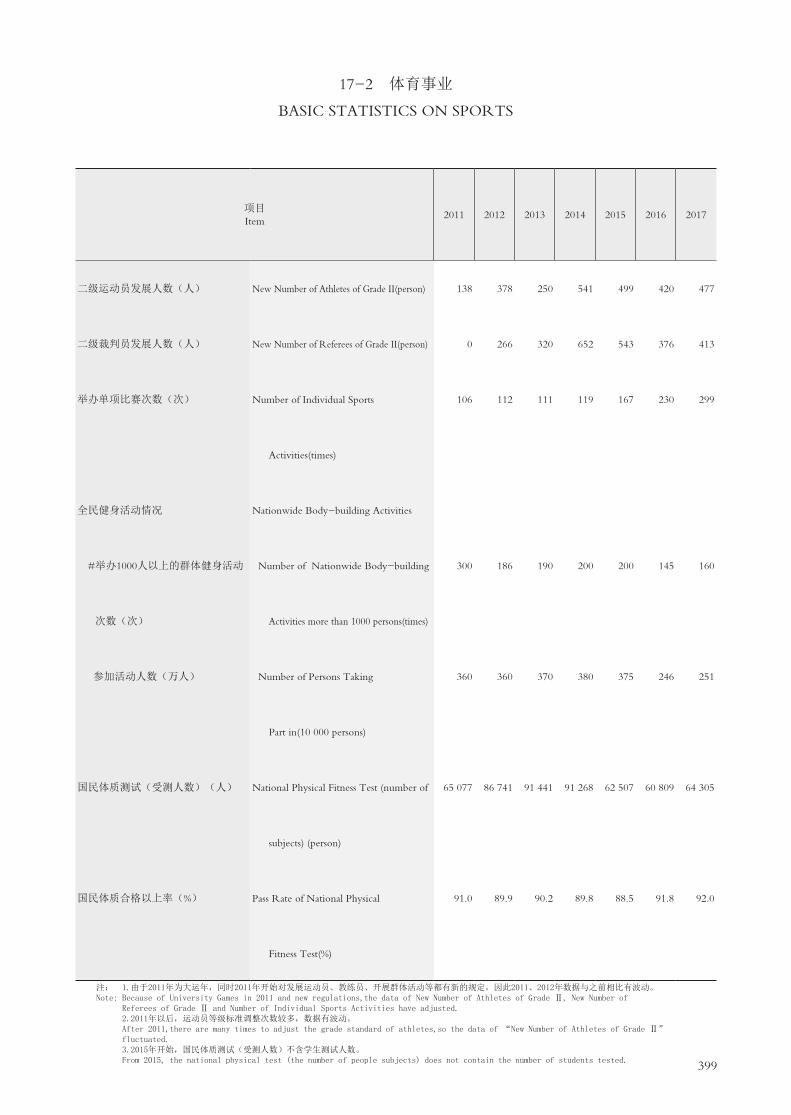
399
17-2 体育事业
BASIC STATISTICS ON SPORTS
项目Item
2011 2012 2013 2014 2015 2016 2017
二级运动员发展人数(人) New Number of Athletes of Grade II(person) 138 378 250 541 499 420 477
二级裁判员发展人数(人) New Number of Referees of Grade II(person) 0 266 320 652 543 376 413
举办单项比赛次数(次) Number of Individual Sports 106 112 111 119 167 230 299
Activities(times)
全民健身活动情况 Nationwide Body-building Activities
#举办1000人以上的群体健身活动 Number of Nationwide Body-building 300 186 190 200 200 145 160
次数(次) Activities more than 1000 persons(times)
参加活动人数(万人) Number of Persons Taking 360 360 370 380 375 246 251
Part in(10 000 persons)
国民体质测试(受测人数)(人) National Physical Fitness Test (number of 65 077 86 741 91 441 91 268 62 507 60 809 64 305
subjects) (person)
国民体质合格以上率(%) Pass Rate of National Physical 91.0 89.9 90.2 89.8 88.5 91.8 92.0
Fitness Test(%)
注: 1.由于2011年为大运年,同时2011年开始对发展运动员、教练员、开展群体活动等都有新的规定,因此2011、2012年数据与之前相比有波动。Note: Because of University Games in 2011 and new regulations,the data of New Number of Athletes of Grade Ⅱ, New Number of Referees of Grade Ⅱ and Number of Individual Sports Activities have adjusted. 2.2011年以后,运动员等级标准调整次数较多,数据有波动。 After 2011,there are many times to adjust the grade standard of athletes,so the data of “New Number of Athletes of Grade Ⅱ” fluctuated. 3.2015年开始,国民体质测试(受测人数)不含学生测试人数。 From 2015, the national physical test (the number of people subjects) does not contain the number of students tested.

400
17-3 建立最低生活保障制度以来历年低保情况
LIST OF MINIMUM STANDARD OF LIVING SECURITY
年 份 Year
户 数(户) Households (Household)
人 数(人) Persons (Person)
金 额(万元) Total Funds
(10 000 yuan)
1998 771 2 014 2121999 1 150 3 145 3752000 1 372 3 783 5592001 1 796 4 978 7302002 2 783 8 478 1 2882003 3 718 11 203 1 9722004 4 467 13 364 2 4272005 4 887 14 602 3 5232006 5 103 15 026 3 7002007 5 105 14 833 4 0492008 4 962 14 214 4 5132009 4 885 13 601 5 5222010 4 470 12 220 4 1222011 4 009 10 716 4 7522012 3 320 8 598 5 3582013 2 866 7 095 3 658 2014 2 787 6 729 3 6882015 2 653 6 309 4 7152016 2 550 5 916 4 3012017 2 280 5 126 4 464
17-4 最低生活保障标准调整表
ADJUSTMENT DATA OF MINIMUM STANDARD OF LIVING SECURITY单位:元/ 人 .月 (yuan/person . month)
年 份 Year
特区居民 Residents in Special Region
宝安、龙岗城镇居民 Residents in Baoan and Longgang
农村居民 Rural Residents
1998年1月 245 210 150
1999年7月 319 273 195
2002年1月 344 290 205
2005年1月 344 344 344
2006年10月 361 361 361
2007年10月 361 361
2008年7月 415 415
2010年7月 450 450
2011年8月 510 510
2012 560 560
2013 560 560
2014 620 620
2015 800 800
2016 800 800
2017 900 900

401
17-5 社会养老机构、救助管理站基本情况
BASIC STATISTICS ON SOCIAL PENSION INSTITUTIONS AND
RELIEF MANAGEMENT STATIONS
年 份 Year
社会养老机构 Social Pension Institutions 救助管理站 Relief Management Stations
单位(个) Units(unit)
床位数(张) Beds(bed)
年末收养人数(人)
Year-end Population Housed
(person)
单位(个) Units(unit)
床位数(张) Beds(bed)
年度累计救助人数(人次)
Number of Rescued Persons Yearly
(person-time)
2003 26 2 919 3 700 1 322
2004 26 2 919 3 700 12 075
2005 26 2 919 2 340 3 700 15 948
2006 27 3 419 2 457 3 700 19 440
2007 27 2 288 1 316 3 700 26 980
2008 29 2 797 1 530 3 700 38 976
2009 30 3 597 1 760 3 740 35 292
2010 30 3 597 1 742 3 810 51 375
2011 30 4 597 1 869 3 830 21 721
2012 31 5 194 2 063 3 830 23 815
2013 31 4 908 2 554 3 820 25 109
2014 31 5 996 2 448 3 820 23 024
2015 31 6 662 2 745 3 850 22 116
2016 34 7 116 3 213 3 600 25 238
2017 35 8 247 3 384 3 600 30 322
注: 救助管理站2003年人数为2003年8月至2003年12月。 Note: Number of relief management stations in 2003 is from Aug 2003 to Dec 2003.
402
主要统计指标解释
卫生技术人员 指从事卫生技术工作并在卫生事业机构领取劳动报酬的专业人员。包括中医师、西医
师、中西医结合高级医师、护师、中药师、西药师、检验师、其他技师、中医士、西医士、护士、助产士、中
药剂士、西药剂士、检验士、其他技士、其他中医、护理员、中药剂员、西药剂员、检验员以及其他初级卫生
技术人员。
医生 指经卫生部门审查合格,具有执业资格的医疗专业人员。
执业医师 指具有《医师执业证》及其“级别”为“执业医师”且实际从事医疗、预防保健工作的人
员,不包括实际从事管理工作的执业医师。执业医师类别分为临床、中医、口腔和公共卫生。
执业助理医师 指具有《医师执业证》及其“级别”为“执业助理医师”且实际从事医疗、预防保健工
作的人员,不包括实际从事管理工作的执业助理医师。执业助理医师类别同样分为临床、中医、口腔和公共卫
生四类。

403
Explanatory Notes on Main Statistical Indicators
Medical Technical Personnel refer to all permanent and contract medical staff and workers employed by medical
institutions,including doctors of Chinese and Western medicine,senior doctors who integrate traditional Chinese
therapeutics with Western therapeutics in practice,senior nurses,pharmacists of Chinese and Western medicine,
laboratory specialists,other specialists,paramedics of Chinese and Western medicine,nurses,midwives,druggists in
Chinese and Western medicine,laboratory technicians,other technicians,other practitioners of Chinese medicine,
nursing attendants,pharmacological workers of Chinese and Western medicine,laboratory workers,and other primary
medical personnel.
Doctors refer to qualified medical professionals approved to practice by public health departments.
Licensed Doctors refer to the medical workers who have obtained the licenses of qualified doctors and are
employed in medical treatment, disease prevention or healthcare institutions, excluding the licensed doctors engaged in
management job. The classification of licensed doctors is clinician, Chinese medicine, dentist and public health.
Licensed Assistant Doctors refer to the medical workers who have obtained the licenses of qualified assistant
doctors and are employed in medical treatment, disease prevention or healthcare institutions, excluding the licensed
assistant doctors engaged in management job. The classification of licensed assistant doctors is clinician, Chinese medicine,
dentist and public health.


URBAN CONSTRUCTION AND ENVIRONMENTAL PROTECTION18


407
18-1 城市建设及公用设施
URBAN CONSTRUCTIONS AND PUBLIC UTILITY
指 标 名 称 Indicators
2012 2013 2014 2015 2016 2017
一、城市园林绿化 Parks,Gardens and Green Areas in
UrbanDistricts
绿化覆盖面积(公顷) Coverage Area of Afforestation (hectare) 97 670 98 635 98 805 99 841 99 841 101 860
其中:建成区(公顷) Developed Areas(hectare) 38 906 39 267 40 123 40 590 41 638 41 726
建成区绿化覆盖率(%) Green Coverage Rate in Developed Areas(%) 45 45 45 45 45 45
园林绿地面积(公顷) Area of Gardens and Green Areas(hectare) 96 382 96 697 97 442 97 850 97 870 97 889
其中:建成区(公顷) Developed Areas(hectare) 33 820 34 136 34 881 35 289 36 191 36 267
建成区绿地率(%) Rate of Green Areas in Developed Areas(%) 39.2 39.2 39.2 39.2 39.2 39.2
公园绿地面积(公顷) Public Green Areas(hectare) 17 508 17 750 18 152 19 241 19 588 19 980
人均公园绿地面积(按常住人口计算) Per Capita Public Green Areas(sq.m) 16.6 16.7 16.8 16.9 16.5 16.0
(平方米)
公园数(个) Number of Parks(unit) 841 869 889 911 921 942
公园面积(公顷) Area of Parks(hectare) 21 948 21 950 21 953 21 955 21 958 21 968
二、市政及环卫设施 Public Facilities and Environmental
Sanitation in urban Districts
道路长度(公里) Length of Roads(1000 m) 6 015 6 364 6 375 6 447 6 556 6 668
道路面积(万平方米) Area of Roads(10 000 sq.m) 10 629 11 496 11 633 11 838 11 920 12 151
人均道路面积(平方米) Per Capita Area of Roads(sq.m) 10.1 10.8 10.8 10.4 10.0 9.8
城市排水管道总长度(公里) Total Length of Sewer Pipelines(1000 m) 11 472 10 420 11 634 12 331 13 507 13 815
污水处理厂设计规模(万吨/日) Design Scale of Sewage Disposal(10 000 tons/day) 421 445 480 480 520 520
道路照明灯(盏) Number of Street Lights(unit) 240 718 250 771 275 768 305 062 405 500 406 566
生活垃圾转运站座数(座) Waste Transfer Stations(set) 733 733 853 895 895 965
公共厕所数量(座) Public Toilets(set) 2 590 2 590 2 590 2 610 3 343 3 343
市容环卫专用车辆(辆) Special Vehicle for Municipal Sanitation(set) 1 104 1 848 1 325 1 724 2 456 2 825
注: 1.道路长度、道路面识、市政城市排水管道总长度自2011年开始统计口径有变化。Note: From 2011,the statistical scope of Length of Roads,Area of Roads,Toads and total Length of Sewer Pipelines have been adjusted. 2.路灯数统计口径自2012年开始有变化。 From 2012,the statistical Scope of Number of Street Lights has been adjusted.
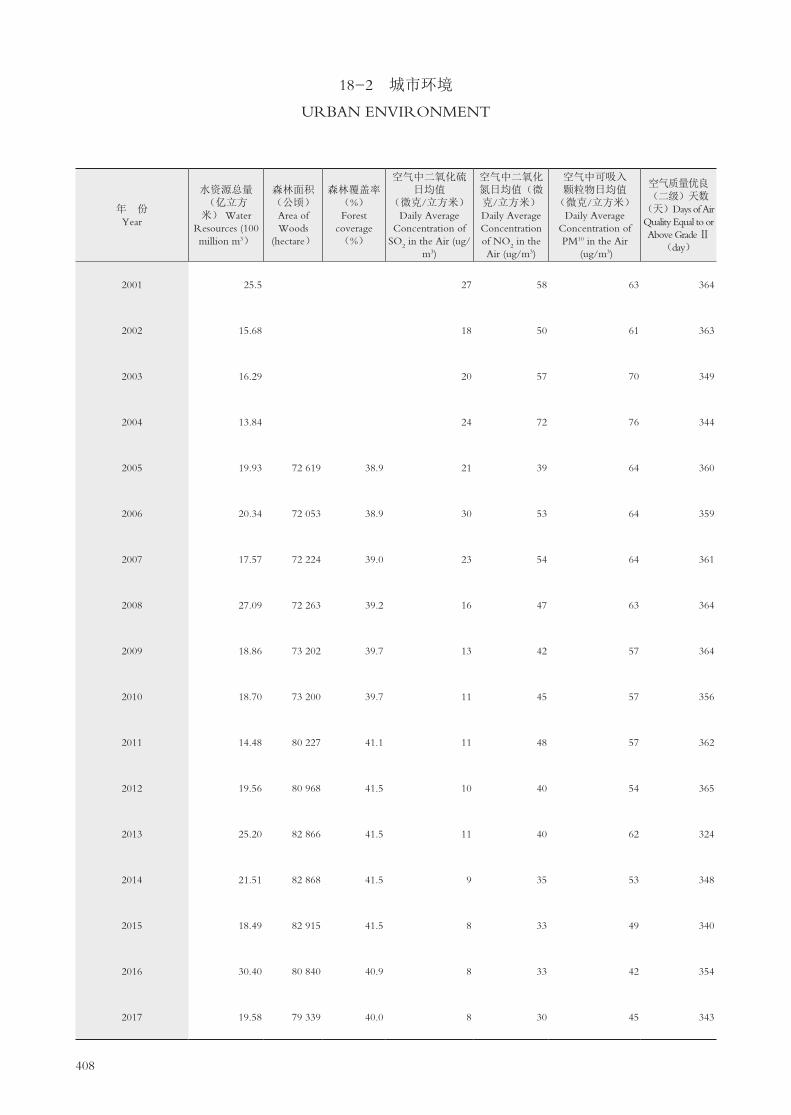
408
18-2 城市环境
URBAN ENVIRONMENT
年 份 Year
水资源总量(亿立方米) Water
Resources (100 million m3)
森林面积(公顷) Area of Woods
(hectare)
森林覆盖率(%) Forest
coverage(%)
空气中二氧化硫日均值
(微克/立方米) Daily Average
Concentration of SO
2 in the Air (ug/
m3)
空气中二氧化氮日均值(微克/立方米)Daily Average Concentration of NO
2 in the
Air (ug/m3)
空气中可吸入颗粒物日均值
(微克/立方米)Daily Average
Concentration of PM10 in the Air
(ug/m3)
空气质量优良(二级)天数
(天)Days of Air Quality Equal to or Above Grade Ⅱ
(day)
2001 25.5 27 58 63 364
2002 15.68 18 50 61 363
2003 16.29 20 57 70 349
2004 13.84 24 72 76 344
2005 19.93 72 619 38.9 21 39 64 360
2006 20.34 72 053 38.9 30 53 64 359
2007 17.57 72 224 39.0 23 54 64 361
2008 27.09 72 263 39.2 16 47 63 364
2009 18.86 73 202 39.7 13 42 57 364
2010 18.70 73 200 39.7 11 45 57 356
2011 14.48 80 227 41.1 11 48 57 362
2012 19.56 80 968 41.5 10 40 54 365
2013 25.20 82 866 41.5 11 40 62 324
2014 21.51 82 868 41.5 9 35 53 348
2015 18.49 82 915 41.5 8 33 49 340
2016 30.40 80 840 40.9 8 33 42 354
2017 19.58 79 339 40.0 8 30 45 343

409
18-2 续表 1 continued
年 份 Year
灰霾日(天)Days of Haze
(day)
城市饮用水源水质达标率(%) Rate of Urban
Drinking Water Quality
Reaching Standard(%)
城市生活污水处理率(%)
Rate of Treatment of City Living
Waste Water (%)
生活垃圾清运量(万吨)Consumption
Wastes Collected and Transported
(10 000 tons)
生活垃圾无害化处理量(万吨)
Consumption Wastes Harmless
Disposal(10 000 tons)
生活垃圾无害化处理率(%)
Treatment Rate of
Consumption Wastes(%)
工业废气排放量(亿标立方米)Volume of Industrial
Waste Gas Emission(100 million standard cubic
meters)
2001 95 93.45 20.2 122 122 100 4 683.98
2002 104 96.11 27.8 129 129 100 7 313.37
2003 147 97.13 31.7 325 225 69.2 820.64
2004 187 96.71 38.1 325 263 81.0 1 082.42
2005 161 98.11 38.7 333 300 90.0 1 389.74
2006 147 98.07 38.9 360 337 93.7 1 264.02
2007 153 98.86 65.9 407 383 94.1 1 917.96
2008 154 99.87 70.8 441 415 94.2 1 631.61
2009 115 100 80.0 476 449 94.3 1 740.67
2010 115 100 81.3 479 453 94.6 1 683.53
2011 112 100 90.1 482 458 95.0 1 871.46
2012 77 100 95.6 490 466 95.1 2 136.96
2013 98 100 96.2 522 513 98.4 2 181.63
2014 68 100 96.5 541 541 100 2 214.89
2015 35 100 96.6 575 575 100 2 312.25
2016 27 100 96.7 572 572 100 2 779.52
2017 22 100 96.8 604 604 100 3 005.02
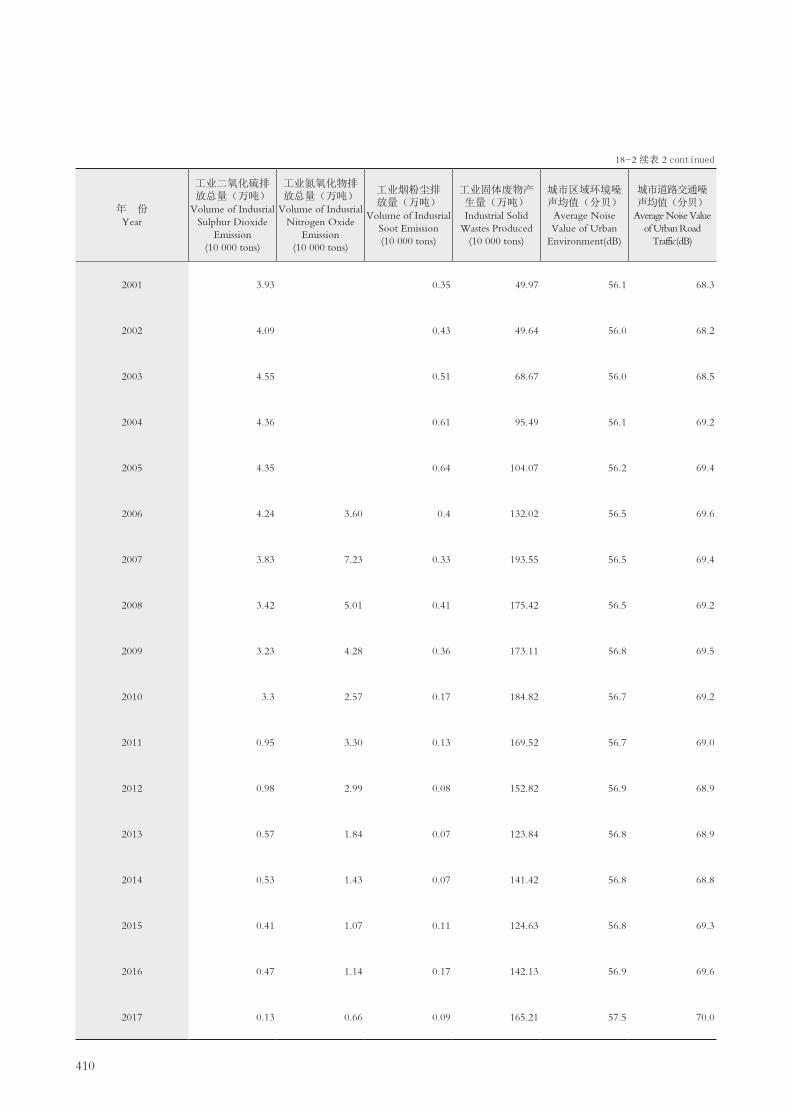
410
18-2 续表 2 continued
年 份 Year
工业二氧化硫排放总量(万吨)
Volume of Indusrial Sulphur Dioxide
Emission(10 000 tons)
工业氮氧化物排放总量(万吨)
Volume of Indusrial Nitrogen Oxide
Emission(10 000 tons)
工业烟粉尘排放量(万吨)
Volume of Indusrial Soot Emission(10 000 tons)
工业固体废物产生量(万吨)Industrial Solid
Wastes Produced(10 000 tons)
城市区域环境噪声均值(分贝)
Average Noise Value of Urban
Environment(dB)
城市道路交通噪声均值(分贝)
Average Noise Value of Urban Road
Traffic(dB)
2001 3.93 0.35 49.97 56.1 68.3
2002 4.09 0.43 49.64 56.0 68.2
2003 4.55 0.51 68.67 56.0 68.5
2004 4.36 0.61 95.49 56.1 69.2
2005 4.35 0.64 104.07 56.2 69.4
2006 4.24 3.60 0.4 132.02 56.5 69.6
2007 3.83 7.23 0.33 193.55 56.5 69.4
2008 3.42 5.01 0.41 175.42 56.5 69.2
2009 3.23 4.28 0.36 173.11 56.8 69.5
2010 3.3 2.57 0.17 184.82 56.7 69.2
2011 0.95 3.30 0.13 169.52 56.7 69.0
2012 0.98 2.99 0.08 152.82 56.9 68.9
2013 0.57 1.84 0.07 123.84 56.8 68.9
2014 0.53 1.43 0.07 141.42 56.8 68.8
2015 0.41 1.07 0.11 124.63 56.8 69.3
2016 0.47 1.14 0.17 142.13 56.9 69.6
2017 0.13 0.66 0.09 165.21 57.5 70.0

411
18-3 用电量、供水量
ELECTRICITY CONSUMPTION AND TAP WATER SUPPLY
年 份 Year
用电总量 (万千瓦小时)
Total Electricity Consumption (10 000 kwh)
农、林、牧、 渔业
Farming, Forestry Animal Husbandry
and Fishery
工 业 Industry
建筑业 Construction
交通运输、 仓储、邮政业 Transportation, Storage and Post
Services
信息传输、软件和信息技术服务业
Information Transmission, Software
and Information Technology
1994 879 100 11 609 503 780 26 502 14 2291995 913 600 11 258 499 757 27 081 15 8771996 1 014 427 13 041 547 085 26 138 22 3641997 1 125 781 14 558 617 016 23 974 20 5711998 1 294 332 16 225 644 973 25 805 21 9821999 1 498 759 22 045 749 834 36 735 28 2152000 1 903 494 34 659 1 018 794 42 482 24 3292001 2 122 871 48 247 1 168 146 50 425 28 5842002 2 599 161 114 324 1 472 361 60 653 36 4772003 3 234 299 172 253 1 793 262 57 644 37 9042004 3 903 060 228 808 2 234 774 62 493 41 7222005 4 402 089 252 793 2 462 690 81 1482006 4 872 038 245 405 2 790 275 85 968 41 541 91 9252007 5 678 193 241 447 3 331 541 94 212 54 364 94 4002008 5 837 586 225 570 3 462 946 96 540 58 013 102 8072009 5 856 808 113 898 3 237 528 75 192 84 721 114 6742010 6 635 475 29 049 4 161 345 63 880 108 383 59 2862011 6 960 198 24 658 4 186 359 62 642 151 177 70 3152012 7 221 044 22 116 4 232 405 62 331 176 093 83 1412013 7 297 680 22 003 4 393 588 72 041 182 803 84 4252014 7 886 841 24 325 4 731 235 90 222 208 186 87 9002015 8 155 442 24 601 4 795 635 96 380 226 320 103 0322016 8 510 789 25 184 4 839 234 104 212 265 857 119 8022017 8 844 861 25 787 4 872 227 112 545 349 749 151 986
18-3 续表 continued
年 份 Year
自来水生产 能力(万吨/日)
Tap Water Production Capacity
(10 000 tons/day)
自来水供水 总量(万吨)
Volume of Tap Water Supply (10 000 tons)
批发和零售业、住宿和餐饮业Wholesale and
Retail Trades,Hotels and Catering Services
金融、房地产、商务及居民服务业Banking,Real Estate Trade, Business and
Residential Services
公共事业及管理组织Public Service
and Management Organizations
城乡居民 生活用电 Residential Electricity
Consumption
1994 102 166 125 292 95 447 244 52 3081995 105 512 128 134 125 834 268 57 4081996 121 650 132 108 151 795 328 64 7431997 150 755 124 155 174 576 328 70 1941998 168 155 150 517 266 520 339 79 5961999 176 589 195 198 289 927 364 86 5602000 218 196 231 113 333 585 380 92 0682001 226 547 248 025 352 722 390 97 3342002 347 290 245 553 322 334 412 108 0702003 374 271 389 140 409 616 442 122 7952004 428 738 445 363 460 985 508 135 0262005 380 550 687 479 537 429 534 139 4872006 400 936 472 581 149 949 583 485 591 145 2272007 430 487 529 424 182 882 717 521 638 154 2302008 431 764 558 283 197 898 702 181 670 156 9562009 466 208 717 667 254 082 791 322 670 150 0942010 475 271 706 670 263 752 766 538 692 156 4702011 501 705 774 252 293 417 894 161 692 161 4802012 526 599 758 050 315 756 1 043 007 692 160 3602013 588 761 680 041 317 648 1 039 391 674 159 1392014 521 487 682 603 335 878 1 203 653 675 164 1322015 559 474 755 442 368 900 1 248 873 674 169 6982016 579 285 830 797 402 706 1 343 218 709 199 3422017 600 755 891 335 429 257 1 409 230 709 201 697

412
18-4 公共交通
PUBLIC TRANSPORTATION
年 份 Year
年末实有公共 汽车(辆)
Number of Buses
(year-end)
的士(辆) Taxi
(unit)
年末公共汽车营
运线路条数(条) Number of
Operating Bus Lines
(year-end)
公共汽车客 运总人数 (万人次) Number of
Passengers Carried of Bus Lines
(10 000 person-times)
轨道交通线路长度(公里)Length of Operation Lines(km)
轨道交通客运总量(万人次)Volume of
Pussenger Traffic of Operation Lines(10 000 person-times)
轨道交通线路条数(条)
Number of Operation Lines(line)
1979 12 10 2
1980 38 160 3
1981 44 199 6
1982 52 233 7
1983 88 860 9 1 399
1984 132 1 226 19 2 974
1985 153 1 700 27 5 184
1986 171 1 794 29 5 827
1987 205 1 896 32 9 068
1988 248 2 305 37 16 399
1989 305 2 365 38 16 747
1990 403 2 394 42 21 947
1991 501 3 152 51 19 821
1992 507 6 083 55 27 248
1993 851 6 212 61 30 600
1994 1 144 7 400 68 31 020
1995 1 468 8 255 80 35 390
1996 1 784 8 505 89 35 495
1997 2 128 8 505 125 36 202
1998 2 461 8 505 137 37 250
1999 2 772 8 505 145 40 600
2000 2 920 8 505 131 42 800
2001 3 495 8 505 138 47 072
2002 3 495 9 705 138 51 714
2003 4 885 10 255 185 50 719
2004 5 376 10 305 208 100 820
2005 6 091 10 305 227 101 621 22 5 766 2
2006 7 305 10 305 277 123 084 23 8 990 2
2007 8 188 11 205 316 135 668 24 11 765 2
2008 8 396 12 991 340 145 701 25 13 550 2
2009 11 928 13 411 578 213 603 25 13 823 2
2010 12 456 14 340 758 228 058 64 16 271 4
2011 15 365 14 735 825 223 735 177 45 985 5
2012 14 546 15 300 854 228 305 177 78 129 5
2013 14 617 15 973 881 220 178 177 91 715 5
2014 15 074 16 275 886 225 739 177 103 675 5
2015 15 120 16 596 903 206 892 177 112 188 5
2016 15 483 17 842 976 186 799 285 129 713 8
2017 17 430 18 379 992 165 425 297 165 545 9
注: 由于指标调整,本表中指标口径2009年以前为“公共大巴”口径,2009年及以后为“公共汽车”口径,包括原大巴、中巴、小巴。Note: After the adjustment in 2009,the statistical scope of Buses include Large-sized buses,medium-sized buses and small-sized buses,while it just refters to large-sized buses before.

413
18-5 气象情况
CLIMATE
年 份 Year
平均气温(摄氏度) Mean Air Temperature
(℃)
降水量(毫米) Precipitation
(mm)
日照时数(小时) Sunshine Duration
(hour)
平均相对湿度(%) Mean Relative Humidity
(%)
1990 23.0 1 396.9 1 842.1 76
1995 22.5 2 309.8 1 858.2 74
2000 23.4 2 533.6 1 939.5 75
2001 23.6 2 747.3 1 811.3 74
2002 23.7 1 608.1 1 975.0 72
2003 23.9 1 833.4 1 655.3 74
2004 23.6 1 299.4 1 921.5 71
2005 23.2 2 143.6 1 574.3 70
2006 23.4 1 936.5 1 624.3 73
2007 23.5 1 581.5 1 937.1 70
2008 22.8 2 710.0 1 907.6 69
2009 23.2 1 611.0 1 987.3 70
2010 23.0 1 634.0 1 775.6 73
2011 22.6 1 269.7 2 054.4 71
2012 23.1 1 554.8 1 781.5 79
2013 23.1 2 203.6 1 906.6 75
2014 23.2 1 725.5 2 034.6 73
2015 23.9 1 500.8 1 964.3 72
2016 23.2 2 490.6 1 759.3 79
2017 23.6 1 967.1 1 919.1 77
414
主要统计指标解释
废水排放总量 包括生产废水和生活污水。生产废水指企、事业单位在生产、科研过程中所有排放口向
外环境排放的废水量总和。生活污水指城镇居民区和企、事业单位职工集中居住区排放的污水量。
工业废水排放总量 指经过工业企业厂区所有排放口排到企业外部的工业废水量。包括外排的直接冷却
水、超标排放的矿井地下水和与工业废水混排的厂区生活污水,不包括外排的间接冷却水(清污不分流的间接
冷却水应计算在内)。
工业粉尘排放量 指工业企业在生产工艺过程中排入的固体微粒总重量。如钢铁企业的耐火材料粉尘、
焦化企业的筛焦系统粉尘、烧结机的粉尘、石灰窑的粉尘、建材企业的水泥粉尘等。不包括电厂排入大气的烟
尘。
工业固体废物产生量 指工业企业在生产过程中产生的固体状、半固体状和高浓度液体状废弃物的总
量,包括冶炼废渣、粉煤灰、炉渣、煤矸石、化工废渣、尾矿、放射性废渣和其它废渣等;不包括矿山开采的
剥离废石和掘进废石(煤矸石和呈酸性或碱性的废石除外)。酸性或碱性废石是指采掘的废石其流经水、雨淋
水PH值小于4或PH值大于10.5者。
工业固体废物综合利用量 指已用作农业肥料、造田、生产建筑材料、筑路以及其它方式综合利用的固
体废物量(包括当年利用往年的工业固体废物堆存量)。综合利用量由原产固体废物的单位统计。

415
Explanatory Notes on Main Statistical Indicators
Total Volume of Waste Water Discharged includes the volume of production waste water and domestic sewage.
Production waste water refers to the total waste water discharged in the process of production and scientific research by
enterprises and institutions,through all outlets to the outside environment.Domestic sewage refers to the sewage volume
discharged in the urban residential areas and the residential areas of staff and workers of enterprises and institutions.
Total Volume of Industrial Waste Water Discharged refers to the volume of industrial waste water
discharged,through all outlets to the outside of industrial enterprises,including direct cooling water,underground
water from mines that does not meet the discharge standards,and domestic sewage mixed up with industrial waste water
when discharged,but excluding indirect cooling water discharged (except unclassified discharge of indirect cooling
water).
Industrial Dust Discharged refers to the total weight of solid dust discharged by industrial enterprises in the
production process,such as dust of refractory materials from iron plants,dust from coke screening system or from
sintering machines of coking plants,dust from lime kilns,cement dust from building material enterprises,etc,but
excluding smoke and dust discharged by power plants.
Volume of Industrial Solid Wastes Produced refers to the total volume of solid,semi solid or high
concentration liquid residues produced by industrial enterprises in their production process,including residues from
melting,slag,powdered coal ash,gangue,chemical residues,tailings,radioactive residues and other residues,but
excluding stripped or dug stones in mining (except gangue and acid or alkali waste stones, which are waste stones washed
or soaked by water with a PH value smaller than 4 or larger than 10.5).
Volume of Industrial Solid Wastes Utilized in a Comprehensive Way refers to the volume of solid wastes
utilized in a comprehensive way,such as the solid wastes utilized as fertilizers,building materials,for building up fields
and making roads or for other purposes (including the volume of industrial solid wastes stored up in previous years and
utilized in the current year). Statistical data on utilization of industrial solid wastes are collected by solid wastes producing
units.


PEOPLE'S LIVELIHOOD19


419
19-1 城镇单位在岗职工年平均工资
AVERAGE WAGE OF FULLY EMPLOYED STAFF AND WORKERS
IN URBAN UNITS
年 份 Year
在岗职工年平均 工资(元)
Average Wage of Fully Employed Staff and
Workers(yuan)
国有单位 State-owned
Units
城镇集体单位 Urban Collective-
owned Units
其他单位 Units of Other Types
of Ownership
1979 769 785 688
1980 979 990 922 687
1981 1 132 1 119 1 211 1 156
1982 1 366 1 358 1 410 1 363
1983 1 545 1 571 1 470 1 528
1984 2 179 2 257 1 805 2 023
1985 2 418 2 427 1 932 2 753
1986 2 452 2 476 2 048 2 637
1987 2 677 2 637 3 223 3 021
1988 3 388 3 267 2 737 3 615
1989 3 858 3 917 2 855 3 733
1990 4 304 4 339 3 348 4 203
1991 5 016 4 908 3 984 5 240
1992 5 931 6 026 4 435 6 270
1993 8 145 8 854 5 681 7 633
1994 10 572 11 632 7 076 10 208
1995 12 276 13 709 7 229 12 184
1996 14 507 16 625 8 668 13 685
1997 16 531 18 515 10 320 15 872
1998 18 381 21 161 11 260 17 204
1999 20 714 23 602 13 228 19 530
2000 23 039 26 193 13 234 21 974
2001 25 941 31 187 13 427 23 981
2002 28 218 35 501 16 969 25 544
2003 30 611 40 893 17 061 26 940
2004 31 928 45 212 20 256 27 868
2005 32 476 47 762 17 112 28 521
2006 35 107 49 312 20 591 31 286
2007 38 798 58 347 21 793 33 787
2008 43 454 65 431 25 291 37 933
2009 46 723 72 278 24 715 40 582
2010 50 456 79 734 27 801 43 939
2011 55 143 85 218 31 830 48 422
2012 59 010 90 492 34 444 52 374
2013 62 619 90 393 30 207 59 627
2014 72 651 108 192 39 993 69 224
2015 81 034 117 432 45 546 77 436
2016 89 757 124 927 56 682 86 374
2017 100 173 150 444 71 380 95 203

420
19-2 居民家庭生活基本情况
BASIC CONDITIONS OF PERMANENT HOUSEHOLDS
年 份 Year
平均每户家 庭人口 (人)
Average Persons per Household
(person)
平均每户就 业人口 (人)
Average Employees per Household
(person)
平均每一就业 者负担人口 (人) Persons Supported by Each Employee
(person)
平均每人每月 可支配收入(元)
Per Capita Monthly Disposable
Income(yuan)
平均每人每月 消费性支出(元)
Per Capita Monthly Consumption
Expenditures(yuan)
1988 3.90 2.17 1.80 214.10 195.45
1989 3.92 2.16 1.82 304.71 256.59
1990 3.81 2.16 1.76 343.95 305.92
1991 3.78 2.21 1.71 380.31 347.98
1992 3.73 2.23 1.67 481.94 419.54
1993 3.59 2.14 1.68 644.72 515.97
1994 3.60 2.10 1.72 875.27 789.43
1995 3.61 2.06 1.75 1 064.22 919.86
1996 3.50 2.06 1.70 1 357.97 1 087.00
1997 3.46 2.03 1.70 1 548.23 1 217.53
1998 3.48 1.96 1.78 1 601.16 1 230.35
1999 3.41 1.89 1.80 1 626.70 1 169.48
2000 3.42 1.86 1.84 1 742.14 1 358.89
2001 3.43 1.82 1.88 1 896.66 1 418.73
2002 3.32 1.86 1.79 2 078.39 1 577.16
2003 3.38 1.80 1.88 2 161.32 1 663.36
2004 3.34 1.68 1.99 2 299.70 1 630.80
2005 3.35 1.73 1.94 1 791.20 1 325.99
2006 3.33 1.80 1.85 1 880.59 1 385.68
2007 3.29 1.83 1.80 2 025.12 1 539.54
2008 3.25 1.59 2.04 2 227.44 1 648.26
2009 3.24 1.66 1.95 2 437.04 1 793.84
2010 3.22 1.68 1.92 2 698.41 1 900.55
2011 3.15 1.67 1.89 3 042.09 2 006.67
2012 3.21 1.70 1.89 3 395.16 2 227.31
2013 3.19 1.68 1.90 3 721.09 2 401.04
2014 2.20 1.40 1.57 3 412.33 2 404.40
2015 2.24 1.39 1.61 3 719.44 2 696.60
2016 2.26 1.40 1.61 4 057.92 3 040.05
2017 2.31 1.43 1.62 4 411.50 3 193.34
注:从2014年起,国家统计局开展了城乡一体化住户收支与生活状况调查,19-2至19-6表数据来源于此调查样本,与2013年及之前住户调查的调查范围、调查方 法、指标口径有所不同。Note:The NBS started an integrated household income and expenditure survey in 2014, including both urban and rural households. The data shown in Tables 19-2 to 19-6 are compiled on the basis of the survey. The coverage, methodology and definitions used in the survey are different from those used for the separate urban and rural household surveys prior to 2014.

421
19-3 一体化住户调查样本调查户基本情况(2017年)
ASIC CONDITIONS OF INTEGRATED HOUSEHOLD AND
EXPENDITURE SURVEY(2017)单位:人 (person)
指标名称Item
2017
样本量(宅) Sample Size(household) 1 338
户均常住成员 Average Resident per Household 2.31
户均常住从业人数 Employed Resident Persons per Household 1.43
每一从业人员负担人口 Average Number of Dependents per Employed Person 1.62
恩格尔系数(%) Engel Coefficient(%) 30.0
人均住房建筑面积(平方米/人)Per Capita Floor Space of Residential Building(sq.m/person)
19.70
19-4 居民人均可支配收入(2017年)
PER CAPITA DISPOSABLE INCOME OF PERMANENT HOUSEHOLDS(2017)
单位:元 (yuan)
指标名称Item
2017
可支配收入 Per Capita Disposable Income 52 938.00
一、工资性收入 Income from Wages and Salaries 43 906.08
(一)工资 Wages 41 044.09
(二)实物福利 Welfare 837.65
(三)其他 Others 2 024.36
二、经营净收入 Net Business Income 6 450.06
(一)第一产业净收入 Net Income of Primary Industry
(二)第二产业净收入 Net Income of Secondary Industry 802.77
(三)第三产业净收入 Net Income of Tertiary Industry 5 647.28
三、财产净收入 Net Income from Properties 5 739.34
其中:出租房屋净收入 Net Income from Rent 1 785.88
四、转移净收入 Net Income from Transfer -3 157.48
(一)转移性收入 Income from Transfer 3 067.94
#养老金或离退休金 Old-age Pension or Retired Pay 2 608.66
(二)转移性支出 Expenses on Transfer 6 225.42
#外来从业人员寄给家人的支出 Expenture for Sending to Their Families 1 120.97
赡养支出 Expenditure for Support 917.56

422
19-5 居民人均消费支出(2017年)
PER CAPITA CONSUMPTION EXPENDITURE OF PERMANENT
HOUSEHOLDS(2017)单位:元 (yuan)
指标名称Item
2017
居民生活消费支出 Daily Consumption Expenditure 38 320.12
一、食品烟酒 Food,Tobacco and Liquor 11 480.71
(一)食品 Food 7 162.93
(二)烟酒 Tobacco and Liquor 735.06
(三)饮料 Drink 265.08
(四)饮食服务 Catering 3 317.63
二、衣着 Clothing 2 093.18
(一)衣类 Clothes 1 697.89
(二)鞋类 Shoes 395.30
三、居住 Residence 11 780.22
其中:租赁房房租 Rent 3 207.88
四、生活用品及服务 Household Facilities, Articles and Services 2 102.63
(一)家具及室内装饰品 Furniture and Interior Decoration 184.23
(二)家用器具 Household Appliances 386.45
(三)家用纺织品 Home Textiles 151.86
(四)家庭日用杂品 Family Daily Groceries 702.96
(五)个人用品 personal Belongings 507.34
(六)家庭服务 Domestic Service 169.80
五、交通通信 Transport and Communications 5 067.26
(一)交通 Transport 3 589.57
(二)通信 Communications 1 477.69
六、教育文化娱乐 Education, Cultural and Recreation 3 559.81
(一)教育 Education 2 028.91
(二)文化娱乐 Cultural and Recreation 1 530.90
七、医疗保健 Health Care and Medical Services 1 154.25
(一)医疗器具及药品 Medical Apparatus and Medicine 491.68
(二)医疗服务 Medical Services 662.57
八、其他用品及服务 Miscellaneous Goods and Services 1 082.06
(一)其他用品 Miscellaneous Goods 503.57
(二)其他服务 Miscellaneous Services 578.49

423
19-6 居民物质文化生活提高情况
IMPROVEMENT IN RESIDENTS' MATRIAL AND CULTURAL LIFE
项 目 Item
2011 2012 2013 2014 2015 2016 2017
就业 Employment
城镇登记失业率(%) Urban Unemployment Rate(%) 2.20 2.42 2.35 2.26 2.34 2.33 2.20
收入 Income
可支配收入(元/人) Per Capita Disposable Income (yuan) 36 505 40 742 44 653 40 948 44 633 48 695 52 938
支出 Expenditure
消费性支出(元/人) Per Capita Consumption Expenditure (yuan) 24 080 26 728 28 812 28 853 32 359 36 481 38 320
居住 Residence
人均住房建筑面积(平方米) Per Capita Building Space (sq.m) 27.94 27.91 27.58 21.1 20.6 19.6 19.7
通讯 Telecommunication
每百人拥有电话(部) Number of Telephone Sets per 100 Persons 274 296 286 362 296 264 254
城市公用业 Public Utilities in Urban Areas
人均生活用电量(度) Per Capita Residential Electicity 858 993 982 1 124 1 127 1 154 1 150
Consumption(kwh)
自来水普及率(%) Rate of Access to Tap Water(%) 100 100 100 100 100 100 100
教育娱乐 Education and Recreation
教育文化娱乐支出(元) Expenditures of education, Recreation and 2 890.26 2 960.13 3 015.14 2 559.83 2 678.62 3 092.27 3 559.81
Cultural Service (yuan)
#文化娱乐 Cultural Recreational Articles and 752.93 546.78 1 394.09 1 456.79 1 570.45 1 530.90
教育 Education 1 225.94 1 406.47 1 165.74 1 221.83 1 521.82 2 028.91
卫生 Public Health
每万人拥有医生数(人) Number of Doctors per 10 000 Persons (person) 22 23 24 25 25 26 27
每万人拥有医院病床(张) Number of Hospital Beds per 10 000 Persons(bed) 21 25 25 27 28 32 32

424
主要统计指标解释
可支配收入 指调查户在调查期内获得的、可用于最终消费支出和储蓄的总和,即调查户可以用来自由支
配的收入。可支配收入既包括现金,也包括实物收入。按照收入的来源,可支配收入包含四项,分别为:工资
性收入、经营净收入、财产净收入和转移净收入。计算公式为:
可支配收入 = 工资性收入 + 经营净收入 + 财产净收入 + 转移净收入
其中:经营净收入 = 经营收入 – 经营费用 – 生产性固定资产折旧 – 生产税
财产净收入 = 财产性收入 – 财产性支出
转移净收入 = 转移性收入 – 转移性支出
消费支出 指住户用于满足家庭日常生活消费需要的全部支出,包括用于消费品的支出和用于服务性消
费的支出。根据用途不同,消费支出可划分为食品烟酒、衣着、居住、生活用品及服务、交通通信、教育文化
娱乐、医疗保健、其他用品及服务八大类。根据来源不同,消费支出可划分为现金消费支出、实物消费支出
(含自产自用、来自单位、来自政府和其他社会组织)。

425
Explanatory Notes on Main Statistical Indicators
Disposable Income of Households Disposable Income of Households refers to the income of households for
purpose of final expenditure and savings. It includes income both in cash and in kind. By sources of income, disposable
income includes four categories: income from wages and salaries, net business income, net income from properties and
net income from transfer.
Consumption Expenditure of Households Consumption Expenditure of Households refers to all expenditure
of households for living expenditure to satisfy family daily living. It includes expenditure in cash and in kind. It includes
eight categories: food, tobacco and liquor; clothing; residence; household facilities, articles and services; transport and
communications; education, cultural and recreational activities; health care and medical services, and miscellaneous goods
and services.

中国统计出版社最新图书简目
(仅供参考,以实际出版为准)
统计资料 中国统计年鉴 中国统计摘要 中国第三产业统计年鉴
中国第三次全国农业普查综合资料 国际统计年鉴 金砖国家联合统计手册
中国-东盟国家统计手册 中国农村统计年鉴 中国县域统计年鉴
中国农产品价格调查年鉴 中国城市统计年鉴 中国价格统计年鉴
中国贸易外经统计年鉴 中国零售和餐饮连锁企业统计年鉴 中国商品交易市场统计年鉴
大中型批发零售和住宿餐饮企业统计年鉴 中国住户调查年鉴 中国工业统计年鉴
中国环境统计年鉴 中国能源统计年鉴 中国建筑业统计年鉴
中国房地产统计年鉴 中国固定资产投资统计年鉴 中国对外直接投资统计公报
中国人口和就业统计年鉴 中国劳动统计年鉴 中国社会统计年鉴
中国科技统计年鉴 中国高技术产业统计年鉴 全国企业创新调查年鉴
中国文化及相关产业统计年鉴 2018年时间利用调查资料 中国妇女儿童状况统计资料
中国基本单位统计年鉴 中国教育统计年鉴 中国教育经费统计年鉴
中国民族统计年鉴 中国残疾人事业统计年鉴
省级综合统计年鉴系列 北京 天津 河北 山西 内蒙古 辽宁 吉林 黑龙江 上海 江苏 浙江 安徽 福建 江西 山东
河南 湖北 湖南 广东 广西 海南 重庆 四川 贵州 云南 西藏 陕西 甘肃 青海 宁夏
新疆 新疆生产建设兵团
市(县)级综合统计年鉴系列 滨海新区 石家庄 唐山 邯郸 保定 沧州 邢台 廊坊 承德 衡水 秦皇岛 张家口 太原 大同 阳泉
长治 晋城 朔州 晋中 运城 忻州 临汾 吕梁 呼和浩特 呼和浩特新城区 鄂尔多斯 包头 沈阳 大连
长春 吉林 延吉 四平 通化 松原 哈尔滨 齐齐哈尔 黑龙江垦区 上海浦东新区 南京 无锡 徐州
常州 苏州 南通 连云港 淮安 盐城 扬州 镇江 泰州 宿迁 江阴 丹阳 海门 杭州 宁波
温州 嘉兴 湖州 绍兴 金华 衢州 舟山 台州 丽水 合肥 安庆 马鞍山 福州 厦门 宁德
漳州 龙岩 南昌 九江 上饶 新余 抚州 萍乡 赣州 吉安 景德镇 济南 青岛 潍坊 枣庄
日照 滕州 郑州 洛阳 平顶山 三门峡 商丘 信阳 济源 汝州 武汉 十堰 荆州 宜昌 荆门
咸宁 长沙 广州 深圳 惠州 东莞 汕尾 南宁 柳州 桂林 梧州 来宾 河池 防城港 海口
三亚 成都 贵阳 黔南 毕节 昆明 西安 咸阳 延安 宝鸡 安康 铜川 汉中 榆林 兰州
庆阳 银川 乌鲁木齐 兵团一师 兵团十师
调查年鉴系列
天津 内蒙古 上海 浙江 福建 河南 湖北 湖南 广东 广西 重庆 四川 云南 甘肃 宁夏
统计方法应用/实用手册 实用SAS统计分析教程 Python数据分析基础 统计公文知识问答
领导干部统计知识问答 乡镇统计人员岗位知识培训系列教材: 辅助调查员岗位基础知识
乡镇统计人员岗位基础知识 县级统计人员岗位知识培训系列教材: Excel在统计工作中的应用
简明统计分析 地市级统计人员岗位知识培训系列教材: 统计报告与演示
中国国民经济核算体系(2016)基础知识 全国统计专业技术资格考试系列考试用书: 统计业务知识(第四版)
统计业务知识学习指导与习题 全国统计专业技术资格考试系列考试用书: 统计相关知识(第四版)
统计相关知识学习指导与习题
统计通俗读物/统计科普图书
我国20个统计指标的历史变迁 联合国工业发展组织:2016年工业发展报告 中国古代统计发展史
理解国民账户
重点图书
波澜壮阔四十年 砥砺奋进铸就辉煌——改革开放40年与时俱进的中国统计
新编英汉汉英统计大词典 中国国民经济核算体系2016 国民经济行业分类注释
挑大学选专业2019—考研择校指南 挑大学选专业2019—高考志愿填报指南 中华医学统计百科全书
中国统计出版社发行部电话:(010)63376907 63376908 同楫行书店电话:68783171 68783172地址:北京市丰台区西三环南路甲6号 邮政编码:100073 网址:http://www.zgtjcbs.com

○c中国统计出版社 2018
版权所有。未经许可,本书的任何部分不得以任何方式在世界任何地区以任何文字翻印、拷贝、仿制或转载。
○c 2018 China Statistics Press
All rights reserved. No part of the publication may be reproduced or transmitted in any form or by any means, electronic or mechanical, including
photocopying, recording, or any information storage and retrieval system, without written permission from the publisher.
图书在版编目(CIP)数据
深圳统计年鉴. 2018 / 深圳市统计局, 国家统计局
深圳调查队编. -- 北京 : 中国统计出版社, 2018.10
ISBN 978-7-5037-8633-4
Ⅰ. ①深… Ⅱ. ①深… ②国… Ⅲ. ①统计资料-深
圳-2018-年鉴 Ⅳ. ①C832.653-54
中国版本图书馆CIP数据核字(2018)第201769号
深圳统计年鉴-2018
作 者/ 深圳市统计局 国家统计局深圳调查队
责任编辑/ 陈越月
执行编辑/李立红
出版发行/ 中国统计出版社
地 址/ 北京市丰台区西三环南路甲6号
邮 编/ 100073
电 话/ 邮购(010)63376909 书店(010)68783171
网 址 / http://csp.stats.gov.cn
印 刷/ 深圳市美嘉美印刷有限公司
经 销/ 新华书店
开 本/ 890×1240毫米 1/16
字 数/ 750千字
印 张/ 25印张
版 别/ 2018 年 12 月第 1 版
版 次/ 2018 年 12 月第 1 次印刷
定 价/ 320.00元
如有印装错误,本社发行部负责调换。