shifting tides? - aacrao
TRANSCRIPT

The Power of International Education
Shifting Tides?Understanding International Student Yield for Fall 2017
IIE Center for Academic Mobility Research and Impact
In Cooperation with:
Christine Farrugia, Ph.D.Natalya Andrejko
July 2017

1
Introduction
Uncertainty plays a large role in the admission cycle as the start of the 2017/18 academic year draws near. Recent
debates over visa and immigration policy have raised concerns among U.S. higher education institutions regarding
the desire and ability of international students to travel to the United States for their education. This report
presents findings from a national survey of U.S. higher education institutions to gauge whether shifts have
occurred in the admissions yield of international students who have been accepted to academic programs starting
in Fall 2017. In the admissions field, yield refers to the enrollment rates of admitted students. Calculations of yield
serve as a useful tool for higher education institutions to track the progress of their admissions recruitment and
enrollment processes.
The survey findings described in this report build upon a similar joint international applications survey conducted
in March 2017 to gauge shifts in applications received from international students at U.S. higher education
institutions. That study – led by the American Association of Collegiate Registrars and Admission Officers
(AACRAO) in partnership with four U.S. higher education associations – found a mixed picture, with 38 percent of
surveyed institutions indicating a decrease in international student applications, 36 percent seeing an increase,
and 26 percent seeing no change compared to the prior year (AACRAO, 2017).
As a follow up to the previous joint survey, in May 2017 IIE again partnered with AACRAO, the Council of Graduate
Schools, the National Association for College Admission Counseling (NACAC), and NAFSA: Association of
International Educators to conduct a survey of U.S. higher education institution that focused on the next steps in
the admissions process – offers of admission and yield rates. Information was also collected on the concerns of
institutions regarding international student enrollment for Fall 2017 and their strategies for maximizing
international enrollments. The findings of this survey provide information for U.S. higher education institutions to
benchmark their own international student admissions patterns and to inform their ongoing outreach and
recruitment strategies.
Key Findings Despite fears of a potential large drop in new international students’ willingness to enter U.S. higher education
institutions in Fall 2017, the findings of the survey, based on responses received from 165 colleges and universities,
suggest that interest among international students remains steady overall, with no single trend evident across the
broad range of U.S. colleges and universities. Modest drops in yield at some institutions may be offset by steady or
increased yield at other institutions. Following are the key findings that emerged from the study:
International and Domestic Undergraduate Yield: Overall, international undergraduate yield appears to
have dipped slightly from 26 to 24 percent from Fall 2016 to Fall 2017. The 2 percentage point decline is
comparable to shifts in the domestic (U.S.) student yield reported by institutional respondents, which fell
from 30 to 28 percent over the same time period. Among domestic students, today’s yield is lower than it
was fifteen years ago as students apply and are accepted to more institutions than in previous years.
While there is no definitive national data on the factors impacting international student yield, it may be
the case that international student yield trends are driven by similar application patterns as domestic
students.
Variations in Yield by U.S. Study Destinations: The U.S. higher education landscape is extremely diverse,
with multiple institution types, academic programs, and locations, each with a range of factors playing
into potential shifts in student enrollment interest. The findings of this survey suggest that variations in
international undergraduate yield are being felt by some institutions more than others. Admissions and

2
yield patterns in the top four host states – California, New York, Texas, and Massachusetts – appear to
compare favorably to national patterns, with the exception of Texas. Yield rates in New York and
Massachusetts remained steady from the prior year at 22 percent and 31 percent, respectively. California
institutions reported a slight increase in yield, which grew from 23 percent to 25 percent in Fall 2016 to
Fall 2107.
In contrast to the other three top host states, respondents from Texas reported a sizeable decrease in
yield from 44 percent to 35 percent. While Texas institutions reported large declines in yield, their yield
remains notably higher than the national average.
Graduate Student Yield: According to an independent survey conducted separately by the Council of
Graduate Schools in May 2017 (Okahana, 2017), graduate yield is showing evidence of similar shifts
among international master’s students. Overall, yield among international master’s students are showing
declines at 46 percent of responding institutions. Given that the large majority of international graduate
students are offered admission into master’s degree programs, this may have implications for first-time
enrollment of international graduate students for Fall 2017.
Institutional and Student Concerns: Concern about international student yield is widespread and varies by
students’ countries or regions of origin, several of which have seen substantial fluctuations in admission
offers and yield. Institutions are most highly concerned about whether admitted students from the
Middle East will arrive on campus in the fall. In light of the recent June 2017 Supreme Court opinion
about temporarily upholding the President’s executive order to bar foreign nationals from six Muslim
majority countries unless they have a bona fide relationship with a person or entity in the United States,
the path to U.S. study appears to remain open for all international students to enter higher education
institutions this fall. Nevertheless, broad concerns still remain, including uncertainty about the outcome
of the Supreme Court’s review of the travel ban case, which is scheduled to commence in October 2017,
and extreme vetting processes of visa applicants. This uncertainty raises valid concerns as to whether
students from the Middle East may be deterred from U.S. study. Securing and maintaining a visa is
reported as the top concern among these students and was reported by 46 percent of institutions, while
feeling welcome in the United States was an almost equal concern, with 41 percent of institutions noting
so from their conversations with students.
Survey findings suggest that Indian students have a high level of concern about potential study in the
United States, with 80 percent of institutions responding that physical safety is the most pronounced
concern for Indian students, while 31 percent of institutions indicated that feeling unwelcome is also a
concern.
The survey findings indicate that Chinese and other Asian students (not including students from India,
who are described above) are mainly concerned with post-graduation employment opportunities and
program affordability. Thirty percent of institutions reported that Asian students are concerned about
obtaining a visa, with lower concern reported among Chinese students.
Methodology This survey was intended to capture a snapshot of international student yield rates as of May 15, 2017. Yield is
defined as the percentage of students that attend a college or university from the admitted student population.
For purposes of this survey, yield is calculated by dividing the number of admissions deposits received by the
number of offers of admissions made by the institution. Because not all academic programs require financial
deposits from students to secure their enrollment spots, institutions were also permitted to include counts of
students who have officially accepted offers of admissions without submitting deposits. For the purposes of
calculating the admissions yield in this report, students who submitted official acceptances were combined with
3
the number of deposits received to compute the admissions yield. Final admission yield can only be determined
once students enroll on campus in the fall, so the yield figures in this report reflect a snapshot of expected yield as
of May 15, 2017.
All five partnering higher education associations distributed the survey to their member institutions in the United
States in May and June 2017. Survey respondents were asked to provide the number of admissions offers made to
international students and the number of deposits received/admissions offers accepted for both Fall 2016 and Fall
2017, to enable a comparison over one year. Data on domestic student admissions and deposits were also
collected to provide context about overall admissions patterns. Survey respondents’ data were merged with
selected data from Open Doors®1 and the U.S. Department of Education to conduct in-depth analyses by
institutional characteristics and international student profiles.
The survey captured 165 valid responses from institutions in 33 states, reflecting both undergraduate and
graduate respondents. Not all respondents provided complete data, so valid item response rates are lower for
some questions. Complete undergraduate data were provided by 112 respondents reported and 54 respondents
reported full graduate data. Complete country level data were provided by 88 institutions. With a low response
rate, country level data should be interpreted with caution.
Due to a low response rate for graduate data in this survey, this report covers joint survey findings pertaining just
to undergraduate admissions and institutional perceptions. In order to provide a picture of yield of international
graduate students, this report incorporates information from a survey conducted independently by the Council of
Graduate Schools (CGS) in May 2017 (See Okahana, 2017). The CGS survey collected similar, but not directly
comparable, information on substantial change in admission yield from 2016 to 2017 by graduate degree level and
place of origin. Responses to the CGS survey were received from 176 CGS members in the United States2.
To allow for comparability with related surveys, throughout this report the description of “no change” is defined as
a rate of change within 2 percentage points. This definition was also used in the joint international applications
survey (AACRAO, 2017) and the Admission Yields of Prospective International Graduate Students Survey (Okahana,
2017).
Respondent Profile
The 112 institutions that provided valid responses on undergraduate admissions reflect a broad range of
institutional types and locations. Public institutions accounted for 32 percent of survey respondents, private not-
for-profit institutions accounted for 66 percent, and the remaining 2 percent were private for-profit institutions.
Institutional respondents were distributed around the United States, with slightly lower proportions of colleges
and universities from the West represented: Northeast (28 percent), South (22 percent), Midwest (33 percent),
and West (17 percent).
1 Open Doors® is conducted by IIE with support from the U.S. Department of State, Bureau of Educational and Cultural Affairs. For more information, visit www.iie.org/opendoors. 2 Of the respondents, 38 percent were Doctoral Universities - Highest research activity (R1), 33 percent were Doctoral Universities - Higher or Moderate research (R2, R3), and 29 percent were Master’s Colleges and Universities and other institution types.

4
Figure 1. Respondents by Carnegie Classification3 Figure 2. Respondents by Institution Size
The survey respondents accounted for about 16 percent of the new undergraduate international student
population reported in Open Doors 2016 (Farrugia & Bhandari, 2016). It is important to note that about 15 percent
of survey respondents indicated their data were an incomplete account of yield. At the time the data were
collected, the admission and deposit cycle was not complete and fluctuations were expected throughout the
summer due to ongoing rolling admission, transfer students, and “summer melt”, an industry term used to
describe incoming students that accept offers of admission in the spring but who do not ultimately enroll in the fall
for a variety of reasons.
Understanding Yield within the Full Admissions Cycle While the bulk of this report focuses on changes in international student yield, it is important to frame those
changes within the larger context of shifts in the numbers of applications received from international students, as
well as the number of offers of admissions extended to them. Survey respondents reported a 2 percent decrease
in the number of admissions offers given to international undergraduate students for Fall 2017 compared to the
Fall 2016 admissions cycle. Forty percent of institutions reported decreased admissions offered to international
undergraduates, while 51 percent of institutions increased international admissions offers and 9 percent indicated
a flat level of admissions offers.
These patterns in international student offers of admission are roughly comparable with the increases and
decreases found in the earlier joint international applications survey (AACRAO, 2017). In that survey, 38 percent of
higher education institutions reported a decline in the number of applications from international students while 36
percent of institutions reported an increase and 26 percent reported stable number of international applicants.
3 Based on the 2015 Carnegie Classification of Institutions of Higher Education. For more information, see http://carnegieclassifications.iu.edu/index.php.
Figure 3. Proportion of Institutions Reporting Changes in International Undergraduate Applications and Admissions Offers Note: Statistics on international applications are drawn from AACRAO (2017).

5
Because students typically apply and are accepted to many institutions, modest shifts in these numbers do not
necessarily portend an eventual drop in enrollment, which can only be measured once the students arrive on
campus.
Undergraduate Yield
As the absolute numbers of admissions offers made and accepted have declined among international
undergraduates, their admission yield rates have also appeared to drop slightly from Fall 2016 to Fall 2017. For Fall
2016 admissions, institutions saw an average 26 percent yield among admitted students, compared to 24 percent
yield in 2017.
The domestic student yield among survey respondents also had a comparable decline of two percentage points,
falling from 30 percent to 28 percent, which was lower than the national average domestic yield rate of 36 percent
in fall 2015 (NACAC, 2016). Among all first-time U.S. students, yield rates experienced a steady decline over many
years, falling from 49 percent in 2002 to 37 percent in 2015 (NACAC, 2016). This is attributed to students applying
to many more schools than in the past. Although undergraduate yield has begun to tick back upward since 2013,
the overall pattern of students applying to a large number of schools remains. While there is no national data
specifically on international student yield it may be possible that this survey’s drops in international student yield
are driven by similar factors as those among domestic students.
Yield by Institutional Characteristics
The survey findings suggest that shifts in international student yield vary by institution, with a portion of
institutions reporting declines and others indicating steady or increasing yield. Decreases in international yield
were reported by 48 percent of institutions, while 31 percent saw an increase in international yield, and 21 percent
of institutions maintained a steady international yield. The remainder of this section describes in further detail the
notable variations in international student yield by institutional characteristics and location.
The U.S. higher education landscape is extremely diverse, with multiple institution types, academic programs, and
locations, each with a range of factors playing into potential shifts in student enrollment interest. The findings of
this survey suggest that variations in international student yield are being felt by some institutions more than
others. For example, reported admission and yield patterns at public and private institutions varied. Private not-
Figure 4. Change in International Student Yield by Institutional Characteristics
6
for-profit institutions saw a 5 percent growth in admissions offers to international students and yield slightly
decreased from 26 percent to 25 percent compared to last year, while public institutions reported a 6 percent
decline in offers of admissions and a drop in yield from 26 percent to 23 percent from Fall 2016 to Fall 2017.
International yield also varied by respondents’ institutional type4. Doctoral-granting institutions saw the largest
drop in admission offers to international undergraduates, with a 3 percent decline. At the same time, doctoral-
granting institutions’ international yield rates dropped only slightly from Fall 2016 to Fall 2017, shifting from 26
percent to 24 percent. Master’s colleges and universities reported a steady number of international admissions
offers, but saw a relatively large drop in international student yield from 26 percent to 19 percent.
Yield by U.S. Region
The survey results indicate different trends in the top host states as well as U.S. regions. According to Open
Doors®, the largest host states of international students are California, New York, Texas, and Massachusetts
(Farrugia & Bhandari, 2016). Admissions and yield patterns in most of these top host states compared favorably to
the national average, with the exception of Texas. Admissions offers increased in both New York and
Massachusetts and yield rates remained steady. Respondents in New York reported an 8 percent increase in
admissions offers to international students, with yield remaining consistent at 22 percent in both years.
Massachusetts institutions reported a 4 percent increase in admissions offers made to international students and a
consistent 31 percent yield in both years. California saw a minimal 1 percent increase in admissions offers to
international students from Fall 2016 to Fall 2017, with yield increasing slightly from 23 percent to 25 percent.
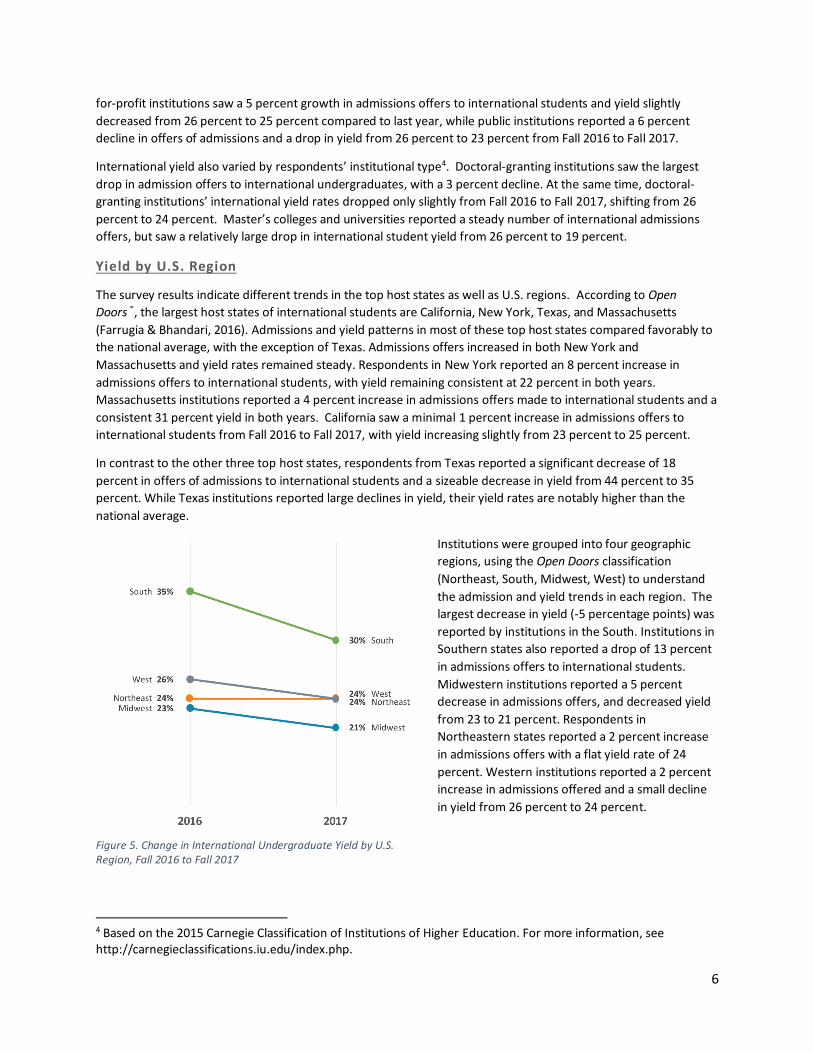
In contrast to the other three top host states, respondents from Texas reported a significant decrease of 18
percent in offers of admissions to international students and a sizeable decrease in yield from 44 percent to 35
percent. While Texas institutions reported large declines in yield, their yield rates are notably higher than the
national average.
Institutions were grouped into four geographic
regions, using the Open Doors classification
(Northeast, South, Midwest, West) to understand
the admission and yield trends in each region. The
largest decrease in yield (-5 percentage points) was
reported by institutions in the South. Institutions in
Southern states also reported a drop of 13 percent
in admissions offers to international students.
Midwestern institutions reported a 5 percent
decrease in admissions offers, and decreased yield
from 23 to 21 percent. Respondents in
Northeastern states reported a 2 percent increase
in admissions offers with a flat yield rate of 24
percent. Western institutions reported a 2 percent
increase in admissions offered and a small decline
in yield from 26 percent to 24 percent.
4 Based on the 2015 Carnegie Classification of Institutions of Higher Education. For more information, see http://carnegieclassifications.iu.edu/index.php.
Figure 5. Change in International Undergraduate Yield by U.S. Region, Fall 2016 to Fall 2017

7
Undergraduate Yield by Students’ Places of Origin International students’ decisions about where to study are based on a wide range of factors, but distinct patterns
emerged in yield depending on students’ places of origin.
Students from Asia made up 60 percent of all international undergraduates in the United States in 2015/16
(Farrugia & Bhandari, 2016). Given their large representation among international undergraduates, shifts in Asian
students’ interests in U.S. study can have a potentially large impact on an institution’s international enrollment.
Overall, surveyed institutions reported an 8 percent increase in the number of admissions offered to Asian
undergraduate students (other than China and India), but a modest drop in yield from 27 percent to 24 percent.
Looking specifically at Chinese students, there was a 2 percent decline in admissions offers made to Chinese
students and a slight drop in yield from 25 percent to 23 percent. Institutions reported a substantial increase of 12
percent in admissions offers made to Indian students, while yield declined from 27 percent to 23 percent.
Latin American and Caribbean students received 4 percent fewer offers of admission for Fall 2017, while yield
declined two percentage points from 30 to 28 percent. Respondents reported a 2 percent increase in admissions
offers to European students, but a drop in yield, from 35 percent to 30 percent. Due to small response rates about
admissions offers and deposits from students from the Middle East, it is not possible to identify potential patterns
in yield among students from this region.
Student Concerns
Responses from institutions
about the concerns they are
observing among admitted
international students
demonstrate that students’
concerns vary by their regions of
origin. The survey findings
indicate that Chinese and other
Asian students (not including
students from India, who are
described below) are mainly
concerned with post-graduation
employment opportunities and
program affordability, rather
than safety and a feeling on
being unwelcome in the United
States. Thirty percent of
institutions reported that Asian
students are concerned about
obtaining a visa, with lower
concern reported among
Chinese students. Survey
findings suggest that Indian
students have a high level of
concern about potential study in
the United States, 80 percent of
institutions responded that
physical safety was the most pronounced concern for Indian students, while 31 percent of institutions indicated
that feeling welcome was also a concern.
Figure 6. Concerns of International Students by World Region

8
Middle Eastern students expressed many concerns to international admissions professionals at U.S. higher
education institutions. Securing and maintaining a visa is reported as the top concern among these students and
was reported by 46 percent of institutions, while feeling welcome in the United States was almost an equal
concern, with 41 institutions noting so from their conversations with students. According to respondents,
European and Latin American students had minimal concerns about study in the United States compared to
students from other regions, with affordability as their main concern.
Institutional Concerns
Survey participants were also asked to report on their level of concern about students’ arrival on campus in the
fall. Survey results indicate the highest level of institutional concern regarding enrollment of students from the
Middle East, followed by India. Thirty-one percent of institutions are very concerned that Middle Eastern students
who have accepted offers of admissions may not arrive on campus in the fall, and 20 percent are very concerned
that Indian students may not arrive on campus. There is little concern about students from Europe and Canada
arriving on campus in the fall and only modest concern about students’ arrival from China and Latin America, with
relatively even proportions of institutions reporting some or no concern. There is also concern about students
from Sub-Saharan Africa and students from Asia apart from China and India.
Figure 7. Proportion of Institutions Reporting Concerns About Admitted Students' Fall 2017 Enrollment, by Students' Place of Origin
With large applicant pools in past years and minimal concerns raised by Chinese students over safety or visa
processing, stability within the Asian student market appears to persist, barring any possible changes to
immigration policy that impact employment opportunity, since that issue is of most concern to Asian students
according to the survey. Although application totals appearing to largely remain stable, yield rates and a concern
about personal safety suggest the possibility that Indian students may not continue to grow as the second largest
international group in U.S. higher education. Their concerns may lead some Indian students to accept admissions
offers from other leading host countries, especially from those that issue student visas more quickly.
The Middle East student population may be the most concerning. Middle Eastern and North African students
accounted for 12 percent of international undergraduates in 2015/16 (Farrugia & Bhandari, 2016), but a decrease
in applications coupled with substantial and valid concerns from students and admissions professionals suggests
possible declines in the number of students traveling to the United States from the Middle East and North Africa
for their education.

9
Graduate Admissions Yield: Highlights from the CGS Graduate Survey A similar survey conducted by the Council of Graduate Schools (CGS) (Okahana, 2017), targeting the graduate
education community found comparable findings to the joint international yield survey described in the bulk of
this report. The CGS survey also found that U.S. graduate schools are seeing greater decline in admissions yield of
prospective international master’s students than for domestic students; 46 percent of graduate deans indicated a
substantial decline in admission yield for international graduate students, while only 24 percent reported a similar
decline in domestic student applications. The most noticeable declines were observed by graduate deans in
Doctoral Universities with High or Moderate research activity (R2 and R3 institutions) where 55 percent of
graduate deans reported a significant decrease in admissions yield. Given that the large majority of international
graduate students are offered admission into master’s degree programs, this may have substantial implications for
first-time enrollment of international graduate students for Fall 2017.
As with the undergraduate students, declines in admissions yield for admitted international graduate students
varied by region of origin. Fifty-two percent of deans reported declines in admission yield for students from the
Middle East and North Africa. Most notably at institutions with the highest research activity (R1 institutions), 60
percent of deans observed a decline in admission yield for students from this region. Forty-two percent of
graduate deans reported declines in yield for students from Asia. Over half (55 percent) of deans at R2 and R3
institutions indicated a substantial decline in admission yield rates of admitted Asian graduate students. Other
regions remained consistent with few deans reporting declines.
Conclusion It is difficult to draw a definitive conclusion about a 2 percent average yield decrease nationally, when there is
wide variation across institutions. In preparation for possible declines, many institutions have adjusted their
recruitment and admission strategies in an effort to minimize the impact of possible declines in international and
domestic student applications, more aggressively following up with accepted students and mobilizing alumni and
current students, among other strategies to increase yield. Many institutions also make strategic decisions based
on the number of applications they receive and they calibrate their admissions offers to generate the desired class
size and profile based on expected yield rates.
The worry in U.S. higher education is whether the overall 2 percentage point decrease in international student
yield may signal a potential slowdown of international student interest in U.S. education. However, the strong
number of international applications at many institutions and the relatively healthy yield rates among survey
respondents suggest that international student interest in U.S. higher education remains strong. While the results
of this survey provide a partial picture of the current plans of international students to study in the United States
this fall, these data points do not constitute a trend nor are they predictive of future enrollments over a longer
term. Many students applying for Fall 2017 entry have been aspiring and planning for U.S. higher education
starting several years ago. Some respondents have indicated that they are more worried about possible declines in
the 2018/19 incoming cohort and beyond.
Considerable efforts have been made by U.S. colleges and universities to maximize their international enrollments
for the upcoming Fall 2017 academic year. Targeted efforts are being made by international admissions
professionals to connect with potential students in their home countries, online, and in a variety of formats.
Almost 20 percent of survey respondents indicated increased personal communication with international students
during this admissions cycle. Social media has also played a large role with many institutions participating in the
#YouAreWelcomeHere campaign. Recruitment efforts and events in the students’ home countries or regions are
also part of a strategy to stabilize student yield, according to 10 percent of survey respondents. Respondents
indicated that once students arrive on campus they provide airport pickups, meet-and-greets, seminars regarding
visa policy changes, and partner students with peers and mentors to make them feel welcome. While such efforts

10
have been shown to be effective in motivating students to enroll in the past, we can only gauge the success of
these additional efforts when students arrive on campus this fall.
International students contribute greatly to their host campuses across the nation, academically as well as
financially. Some institutions may be feeling the pinch as they try to diversify their international student
population while others see no change in enthusiasm among incoming students. A number of survey respondents
indicated they were bracing for a large drop that never came and feel optimistic, while some institutions are
discouraged by fewer deposits and more students withdrawing their applications before a decision is even
reached. The results of this survey, along with the related surveys conducted by AACRAO and Council of Graduate
Schools, provide evidence of uneven patterns in applications, admissions, and potential enrollments for the fall
semester. This mixed picture makes it difficult to speculate about what shifts may occur in international
enrollments at U.S. higher education institutions this fall. What is clear is that campuses are making significant
efforts to attract and retain their international students and that, overall, colleges and universities will continue to
welcome international students to the United States in Fall 2017.
References AACRAO (2017). Trending Topics Survey: International Applicants for Fall 2017- Institutional & Applicant
Perceptions. Washington, D.C.: AACRAO.
Farrugia, C. & R. Bhandari (2016). Open Doors 2016 Report on International Educational Exchange. New York:
Institute of International Education.
NACAC (2015). State of College Admission. Washington, D.C.: NACAC.
Okahana, H. (2017). Data Sources: Admission Yields of Prospective International Graduate Students: A First Look.
Washington, D.C.: Council of Graduate Schools. Retrieved from: http://cgsnet.org/data-sources-admission-yields-
prospective-international-graduate-students-first-look.