signals of circulation trends at high latitudes · introduction high latitude circulation subject...
TRANSCRIPT

Signals of Circulation Trends at High Latitudes
Paul J. KushnerDept. of Physics, University of Toronto
Laurent TerrayCERFACS, Toulouse

Outline
Introduction
Perspectives from . . .
• CCSM Large Ensemble
• NAM Dynamics
Conclusion

Introduction
High latitude circulation subject to climate noise and observational uncertainty, making D&A of human influence difficult.
Circa 2003: Detectable human influence on SLP detectable but model trends too weak.
Presently: Only lower latitude SLP trends attributable to human influence (Gillett and Stott).
D&A of 20c SLP Trends (Gillett et al. 2003) AO Index 1950-2010

High Latitude Circulation Signals: Hard to Detect
21st Century DJF Response, CCSM3 “Large” Ensemble
SLP
Precip
Ts
Signal # Realizations to Detect Signal
Deser et al. 2011

Today’s Questions
Which changes in high latitude circulation from surface to stratosphere can be attributed, or will be attributable, to human influence?
Are there dynamical insights that constrain the problem?
Seek insights from:
• Large ensemble
• Dynamical ideas on stationary wave/NAM interactions
Primary focus on Northern Hemisphere, with comments on Southern Hemisphere

Perspective from the CCSM3 Large Ensemble

CCSM3 Large Ensemble Results
In this plot, response is calculated as epochal differences.
Thermal response in free troposphere quite robust, in stratosphere not so robust.
Surface and stratospheric circulation responses are not.
60N-90N Response (2005-2065)
Temperature Geopotential
Mean
Standard Deviation
Extremes

Comparing Surface and Free Troposphere
In this plot, response is calculated as 2005-2065 trends.
Mid tropospheric signal thermally dominated and therefore more robust than surface response.
• Time to detection (Deser et al.) will be shorter.
DJF Response, NCAR CCSM3 “Large” Ensemble
SLP
Z500
Signal # Realizations to Detect Signal

Pinpointing Controls on DetectabilitySH includes strong warming from ozone recovery.
• SH response is much more robust than NH response.
CAM3/SST/RAD:
• AMIP with ensemble mean SST driving.
• Mean and spread similar even without air-sea coupling.
Zonal Mean Geopotential Response, DJF
CCSM3
CAM3/SST/RAD
Signal# Realizations to
Detect Signal

Pinpointing Controls on Detectability
Ozone forcing controls SH signal.
GHG warming controls NH signal.
CAM3/SST/RAD
CAM3/SST/NORAD CAM3/NOSST/RAD

Perspective from NAM Dynamics
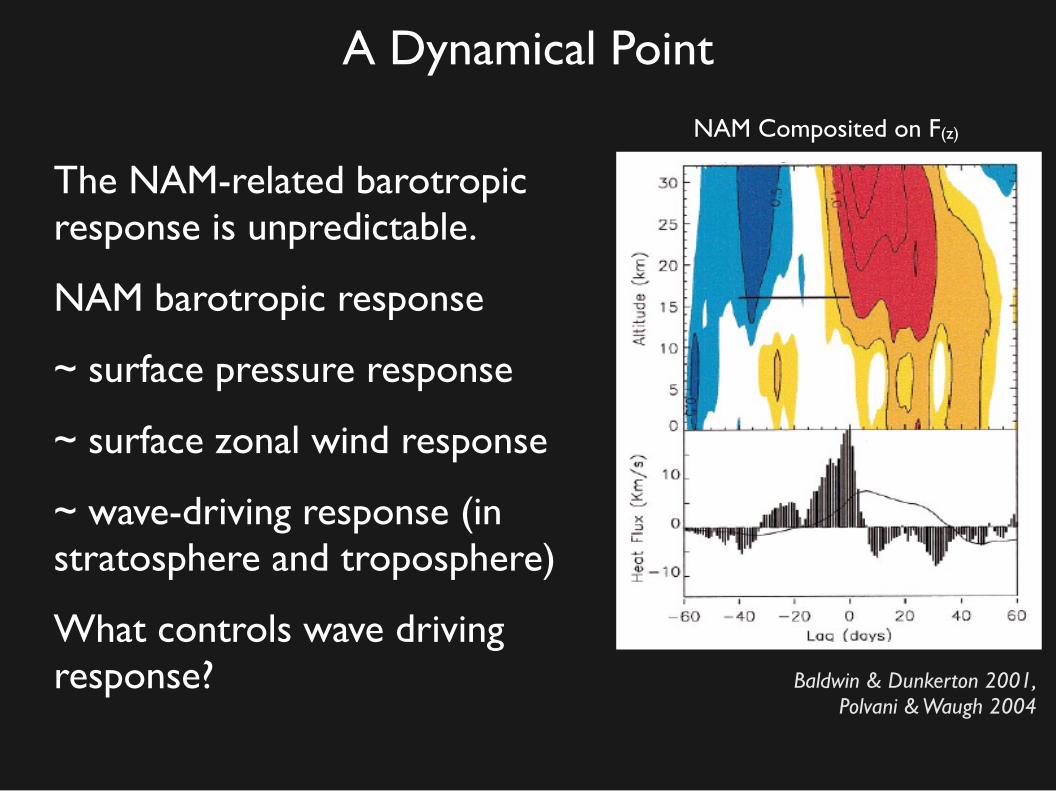
A Dynamical Point
The NAM-related barotropic response is unpredictable.
NAM barotropic response
~ surface pressure response
~ surface zonal wind response
~ wave-driving response (in stratosphere and troposphere)
What controls wave driving response?
NAM Composited on F(z)
Baldwin & Dunkerton 2001,Polvani & Waugh 2004

[Z] Response
Wave-1 Z* Climatology (shaded) & Response (contours)
Indian Warming
Wave-2 Z* Climatology (shaded) & Response (contours)
Fletcher and Kushner impose warming separately in Tropical Indian Ocean and Tropical Pacific Ocean.
•Linear interference effect controls response.•Is this kind of mechanism at work in the large ensemble?
A Clue from the Tropical SST ProblemPacific Warming
Flet
cher
& K
ushn
er 2
010

[Z] Response
Wave-1 Z* Climatology (shaded) & Response (contours)
Indian WarmingPositive NAM
Negative NAM
Wave-2 Z* Climatology (shaded) & Response (contours)
Fletcher and Kushner impose warming separately in Tropical Indian Ocean and Tropical Pacific Ocean.
•Linear interference effect controls response.•Is this kind of mechanism at work in the large ensemble?
A Clue from the Tropical SST ProblemPacific Warming
Flet
cher
& K
ushn
er 2
010
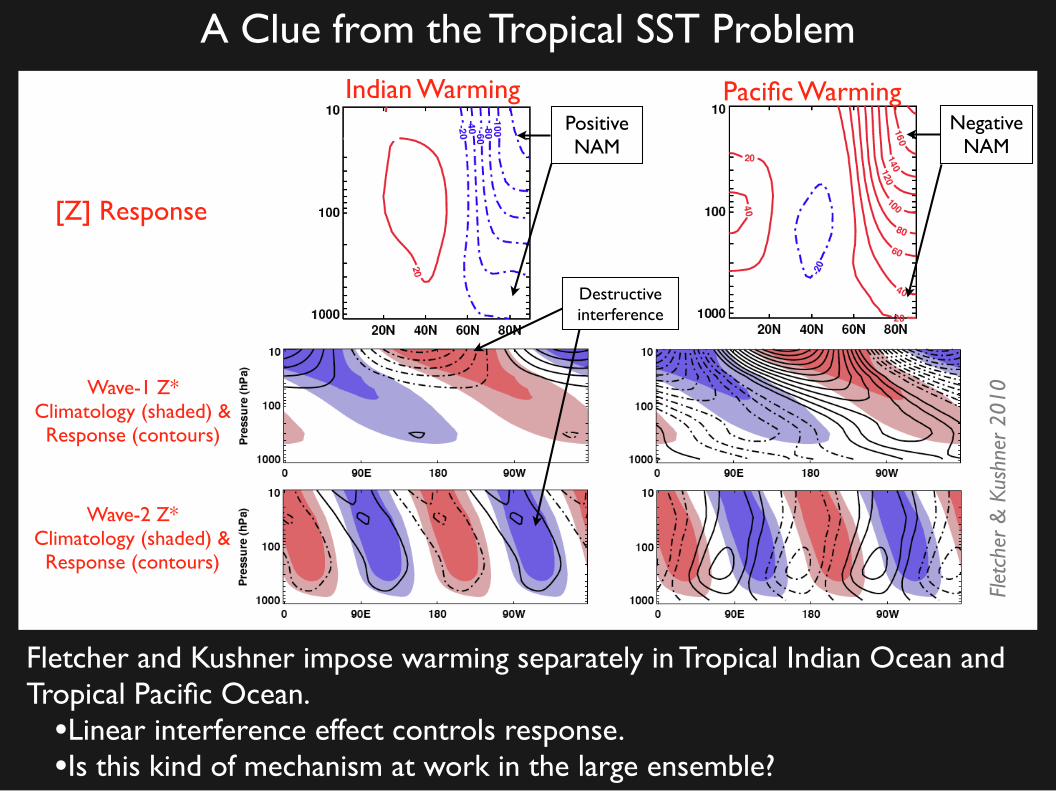
[Z] Response
Wave-1 Z* Climatology (shaded) & Response (contours)
Indian WarmingPositive NAM
Negative NAM
Wave-2 Z* Climatology (shaded) & Response (contours)
Fletcher and Kushner impose warming separately in Tropical Indian Ocean and Tropical Pacific Ocean.
•Linear interference effect controls response.•Is this kind of mechanism at work in the large ensemble?
Destructive interference
A Clue from the Tropical SST ProblemPacific Warming
Flet
cher
& K
ushn
er 2
010

[Z] Response
Wave-1 Z* Climatology (shaded) & Response (contours)
Indian WarmingPositive NAM
Negative NAM
Wave-2 Z* Climatology (shaded) & Response (contours)
Fletcher and Kushner impose warming separately in Tropical Indian Ocean and Tropical Pacific Ocean.
•Linear interference effect controls response.•Is this kind of mechanism at work in the large ensemble?
Constructive interference
Destructive interference
A Clue from the Tropical SST ProblemPacific Warming
Flet
cher
& K
ushn
er 2
010

Linear Interference in the Large EnsembleDefine index of vertical wave activity flux response in Northern Hemisphere lower stratosphere: TOTAL
Its linear interference component is LIN.
Correlate index with Z response across the ensemble.
Significant fraction of the response associated with interference with planetary waves.
• Need to attribute to specific surface processes (SST, snow,etc.).
TOTAL wave
activity response versus Z response
LINm=1
LIN m=2
Correlations X 10

Summary
Robust high latitude circulation response is baroclinic (thermal).
Non-robust barotropic part is related to NAM and reflects changes to wave driving.
Linear interference between forced and climatological waves controls a fraction of this.

Conclusion
Linear interference mechanism:
• NAM response sensitive to spatial coherence of wave response and stationary wave.
• Different mechanisms might be at play for different waves.
Large ensemble can be used to
• Quantify sources of spread and frame expectations for which climate signals are attributable.
• Explore dynamics underlying spread in circulation responses (see Deser et al. 2011).
• Can imagine using perfect model approach to rigorously test D&A methods. Has this been done?

Zonal Mean Geopotential Trends for Recent Period
Global circulation trend estimates also subject to observational uncertainty.
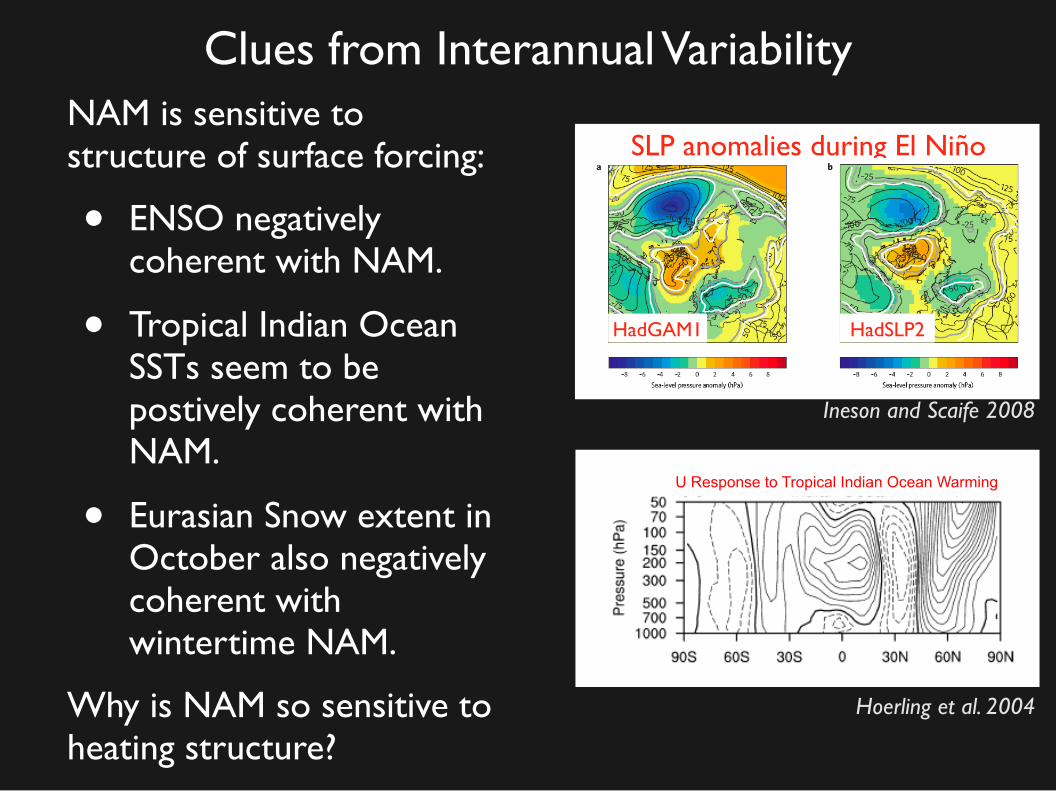
Clues from Interannual VariabilityNAM is sensitive to structure of surface forcing:
• ENSO negatively coherent with NAM.
• Tropical Indian Ocean SSTs seem to be postively coherent with NAM.
• Eurasian Snow extent in October also negatively coherent with wintertime NAM.
Why is NAM so sensitive to heating structure?
SLP anomalies during El Niño
Ineson and Scaife 2008
HadGAM1 HadSLP2
U Response
Hoerling et al. 2004
U Response to Tropical Indian Ocean Warming

Interference with Stationary Wave Field
ENSO+ (obs) Climo (obs)Z*500-wave1 (NDJ)
Ineson and Scaife 2009
Wave Response to El Niño Forcing in HadGAM1
Garfinkel and Hartmann 2009
Wave activity flux enhanced when planetary wave anomalies align with the stationary wave field.
This drives stratospheric warming(negative NAM), which couples to the troposphere.
Examples:
• ENSO
• Response to Siberian snow
• West Pacific driving of NAM
• Blocking and stratospheric sudden warmings(Garfinkel & Hartmann, Ineson & Scaife, Smith et al., Martius & Polvani, Nishii et al.).

Tuning the Linear Interference Effect
We move the forcing around the latitude circle.
• This gives both positive and negative NAM responses.
• The dynamics is dominated by linear interference effects.
Shifting the position of the cooling
20

Tuning the Linear Interference Effect
We vary the strength of the forcing:
• EM-LIN scales linearly and EM-NONLIN scales quadratically with the forcing.
• For large forcing, EM-NONLIN dominates and the NAM response switches from positive to negative.
• We are fairly close the boundary for nonlinear behaviour to kick in.
Changing the strength of the cooling
21

Why Does the NAM Response Change Sign?
TIOResponse to Tropical SST Forcing in GFDL AM2
Wave-1 Z* Climatology (shaded) & Response (contours)
Wave-2 Z* Climatology (shaded) & Response (contours)
Zonal MeanZ Response
TPO

Why Does the NAM Response Change Sign?
TIOResponse to Tropical SST Forcing in GFDL AM2
Wave-1 Z* Climatology (shaded) & Response (contours)
Positive NAM
Wave-2 Z* Climatology (shaded) & Response (contours)
Zonal MeanZ Response
TPO

Why Does the NAM Response Change Sign?
TIOResponse to Tropical SST Forcing in GFDL AM2
Wave-1 Z* Climatology (shaded) & Response (contours)
Positive NAM
Negative NAM
Wave-2 Z* Climatology (shaded) & Response (contours)
Zonal MeanZ Response
TPO

Why Does the NAM Response Change Sign?
TIOResponse to Tropical SST Forcing in GFDL AM2
Wave-1 Z* Climatology (shaded) & Response (contours)
Positive NAM
Negative NAM
Wave-2 Z* Climatology (shaded) & Response (contours)
Destructive interference
Zonal MeanZ Response
TPO

Why Does the NAM Response Change Sign?
TIOResponse to Tropical SST Forcing in GFDL AM2
Wave-1 Z* Climatology (shaded) & Response (contours)
Positive NAM
Negative NAM
Wave-2 Z* Climatology (shaded) & Response (contours)
Constructive interference
Destructive interference
Zonal MeanZ Response
TPO

Why Does the NAM Response Change Sign?
TIOResponse to Tropical SST Forcing in GFDL AM2
Wave-1 Z* Climatology (shaded) & Response (contours)
Positive NAM
Negative NAM
Wave-2 Z* Climatology (shaded) & Response (contours)
• NAM response to TIO is surprisingly large.• TIO weakens and TPO strengthens wave activity flux.• TIO dominated by Wave-2, TPO by Wave-1.
Constructive interference
Destructive interference
Zonal MeanZ Response
TPO

Summary
Interference between wave anomaly and climatological wave accounts for much of sensitivity of NAM to tropical SST forcing.
Given . . .
• A large amplitude climatological wave,
• A prediction of a wave response,
• Strong constructive/destructive interference,
. . . one can predict the high latitude zonal mean response.
This a linear effect, but calculating the response to SST forcing is still inherently nonlinear.

Implications & Generalizations
The sensitivity to longitudal phase might lead to spread in simulated NAM responses to tropical forcing.
Many aspects of the responses are similar between GFDL AM2 and CCSM CAM.
We see similar effects and sensitivities in the simulated NAM response to snow variability in models and obs (Smith et al. 2010, J. Climate and submitted).

Indian Ocean Forced NAM Variability
SST anomalies composited on ENSO events 1950-2001.

Summary of GFDL Simulations
Tropospheric NAM Response v. LIN Component
Trop
osph
eric
NA
M
EM-LIN
Linear interference effect can be tuned by tuning background wave or forcing.

Fletcher & Kushner 2010 & in prep
|ΔΧ*250|
|ΔOLR*| |ΔΧ*250|
|ΔZ250*|
|ΔZPCAP|
|ΔZ250*|
ΔZPCAP
EM-LIN