skoog –chapter 7 - faculty server contactfaculty.uml.edu/david_ryan/84.314/gang wang...
TRANSCRIPT
Skoog – Chapter 7Components of Optical Instruments
General Design of Optical InstrumentsSources of RadiationWavelength SelectorsSample ContainersRadiation Transducers (Detectors)Signal Processors and ReadoutsFiber Optics
Optical spectroscopic based on 6 phenomena:
AdsorptionFluorescencePhosphorescrenceScatteringEmissionChemiluminscrence
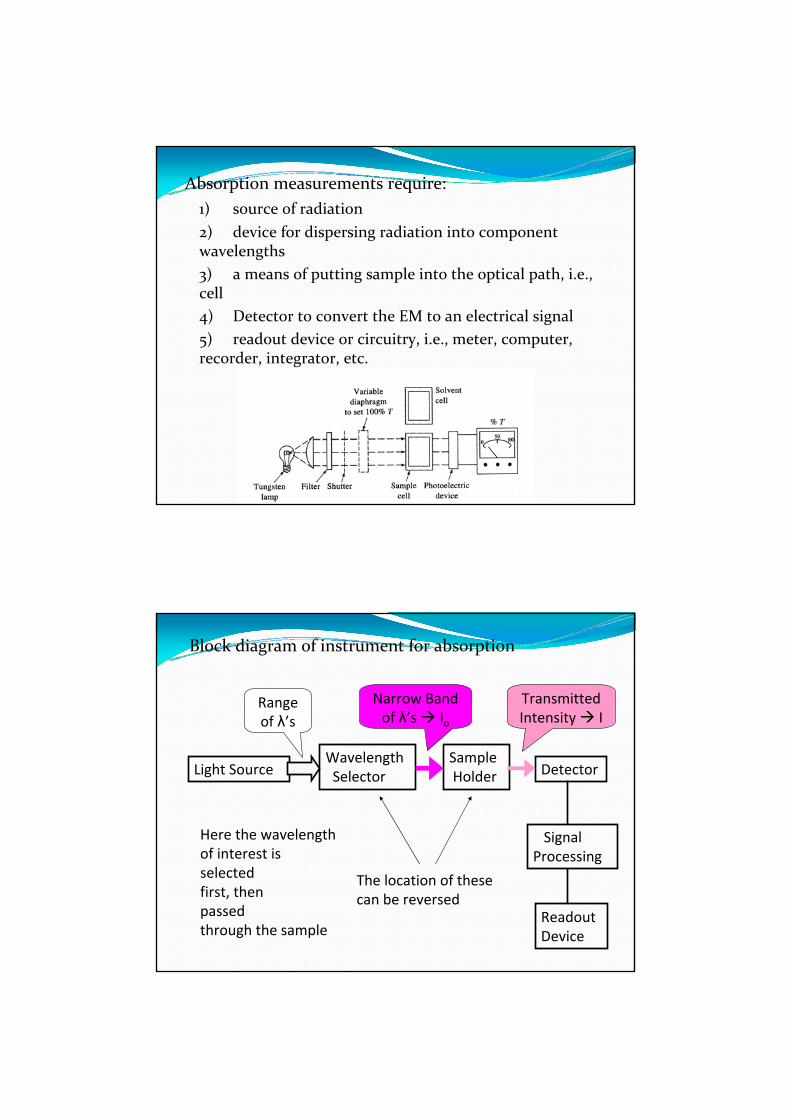
Absorption measurements require:1) source of radiation2) device for dispersing radiation into component wavelengths3) a means of putting sample into the optical path, i.e., cell4) Detector to convert the EM to an electrical signal5) readout device or circuitry, i.e., meter, computer, recorder, integrator, etc.
Block diagram of instrument for absorption
Light SourceWavelengthSelector
SampleHolder Detector
SignalProcessing
ReadoutDevice
The location of thesecan be reversed
Range of λ’s
Narrow Band of λ’s Io
Transmitted Intensity I
Here the wavelengthof interest isselectedfirst, thenpassedthrough the sample
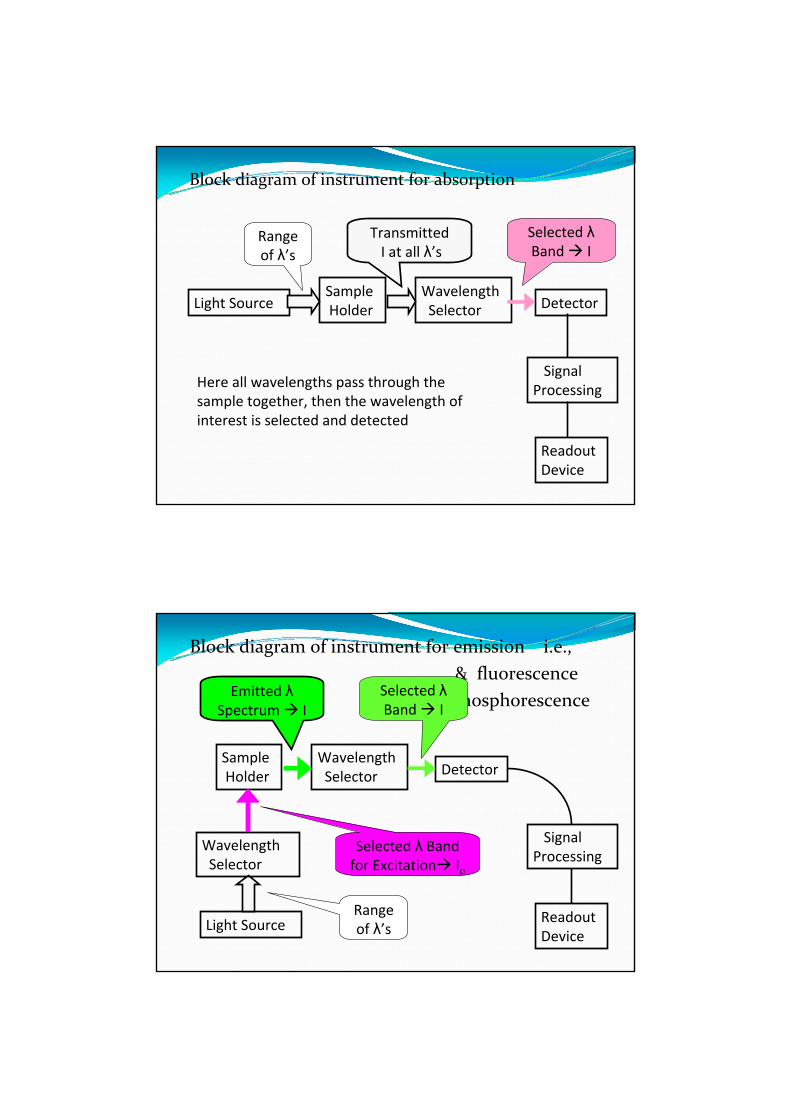
Block diagram of instrument for absorption
Light SourceWavelengthSelector
SampleHolder Detector
SignalProcessing
ReadoutDevice
Range of λ’s
TransmittedI at all λ’s
Selected λBand I
Here all wavelengths pass through thesample together, then the wavelength ofinterest is selected and detected
Block diagram of instrument for emission i.e.,& fluorescencephosphorescence
Light Source
WavelengthSelector
SampleHolder Detector
SignalProcessing
ReadoutDevice
Range of λ’s
Emitted λSpectrum I
Selected λBand I
WavelengthSelector
Selected λ Band for Excitation Io

Emission measurements require:1) means of exciting emission i.e., way of populating upper energy level which spontaneously emits2) device for dispersing radiation into component wavelengths3) a means of putting sample into the optical path, i.e., cell4) Detector to convert the EM to an electrical signal5) readout device or circuitry, i.e., meter, computer, recorder, integrator, etc.
The requirements for the various components used in different instruments change with the type of spectroscopy as well as for different kinds of measurements within a type of spectroscopy
We will consider the components separately then combine them to make the overall instrument
And finally look at the measurements with regard to theory and practice
Radiation SourceSufficient energy for easy detection and measurementStable for a reasonable period Regulated power source (radiant power source varies with voltage power supply)
Double beam design, detection intensity of two beams simultaneously
Sources – important characteristics1) Spectral distribution i.e., intensity vs. λ
(continuum vs. line sources)2) Intensity3) Stability – short term fluctuations
(noise), long term drift4) Cost5) Lifetime6) Geometry – match to dispersion device
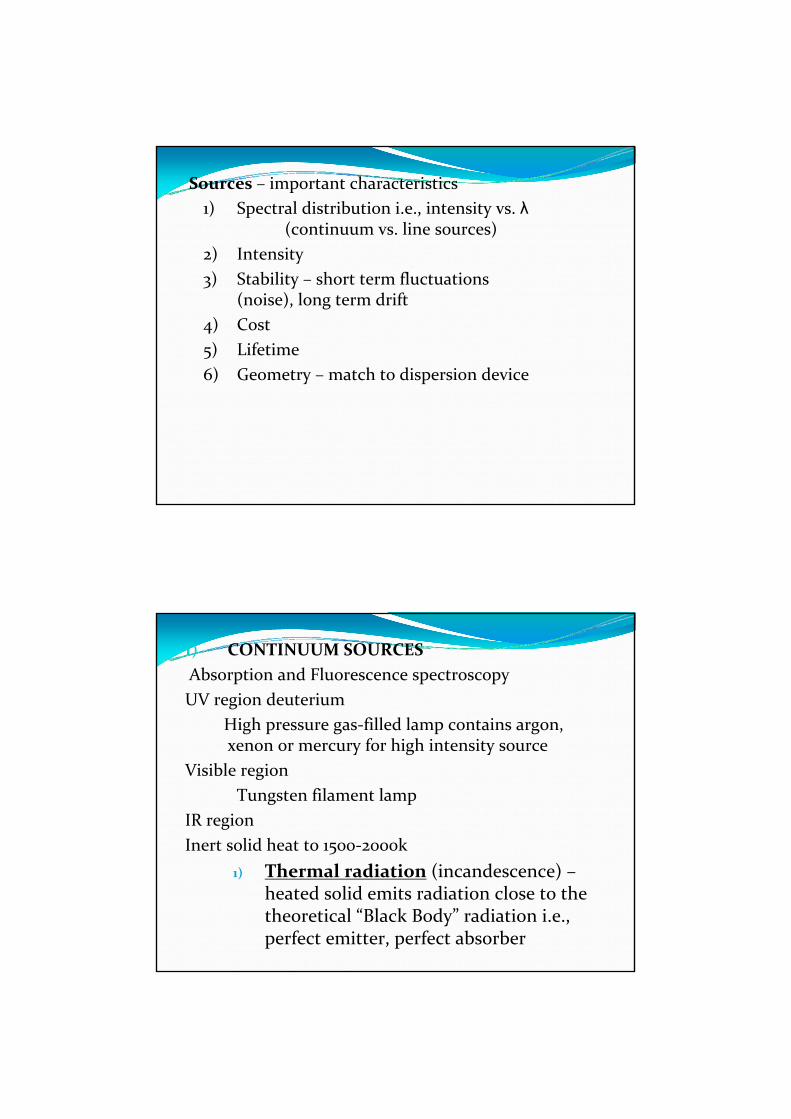
I) CONTINUUM SOURCESAbsorption and Fluorescence spectroscopyUV region deuterium
High pressure gas‐filled lamp contains argon, xenon or mercury for high intensity source
Visible regionTungsten filament lamp
IR regionInert solid heat to 1500‐2000k
1) Thermal radiation (incandescence) –heated solid emits radiation close to the theoretical “Black Body” radiation i.e., perfect emitter, perfect absorber
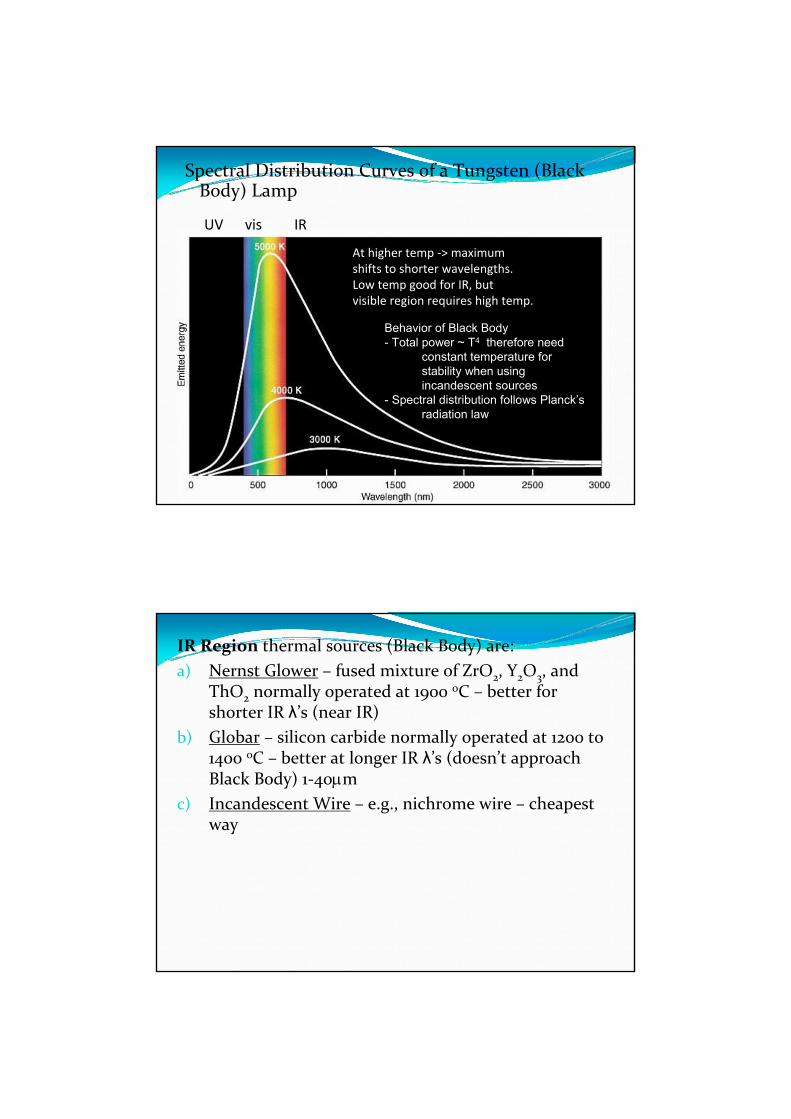
Spectral Distribution Curves of a Tungsten (Black Body) Lamp
At higher temp ‐> maximumshifts to shorter wavelengths.Low temp good for IR, butvisible region requires high temp.
UV vis IR
Behavior of Black Body- Total power ~ T4 therefore need
constant temperature for stability when using incandescent sources
- Spectral distribution follows Planck’s radiation law
IR Region thermal sources (Black Body) are:a) Nernst Glower – fused mixture of ZrO2, Y2O3, and
ThO2 normally operated at 1900 oC – better for shorter IR λ’s (near IR)
b) Globar – silicon carbide normally operated at 1200 to 1400 oC – better at longer IR λ’s (doesn’t approach Black Body) 1‐40μm
c) Incandescent Wire – e.g., nichrome wire – cheapest way
All operated at relatively low temperature.Good for IR and give some visible emission.Operated in air so will burn up if temp goes too high
AdvantagesNernst Glower – low power consumption, operates in air, long lifetimeGlobar – more stable than Nernst Glower, requires more power & must be cooled. Long lifetime, but resistance changes with use
Visible Region sources are:a) Glass enclosed Tungsten (W) filament ‐ normally
operated at ~3000 oK with inert atmosphere to prevent oxidation. Useful from 350 nm to 2000 nm, below 350 nm glass envelope absorbs & emission weak
b) Tungsten‐Halogen lamps ‐ can be operated as high as 3500 oK. More intense (high flux). Function of halogen is to form volatile tungsten‐halide which redeposits W on filament, i.e., keeps filament from burning out. Requires quartz envelope to withstand high temps (which also transmits down to shorter wavelengths). Fingerprints are a problem – also car headlights
2) Gas Discharge Lamps – two electrodes with a current between them in a gas filled tube. Excitation results from electrons moving through gas. Electrons collide with gas excitation emission
At high pressure “smearing” of energy levels spectrum approaches continuum
The higher the pressure, the greater the probability that any given molecule or atom will be perturbed by its neighbor at the moment of emission.
D2 +E electrical ‐‐ D2* ‐‐ D(KE1) + D(KE2) +hυKE1 +KE2 + hυ = E electrical –BDE
bond dissociation energy
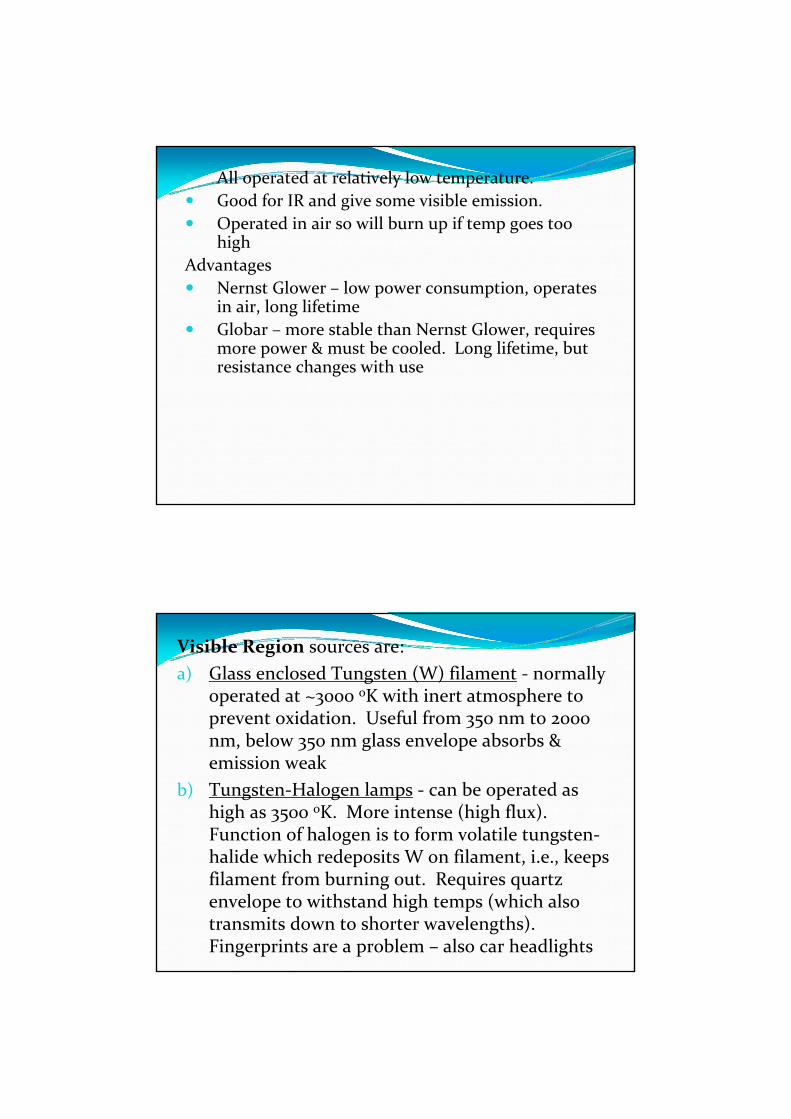
a) Hydrogen Lamp‐most common source for UV absorption measurements
H2 emission is from180 nm to 370 nmlimited by jacket
Line spectrum from 100 watt HydrogenLamp at low pressure inPyrex
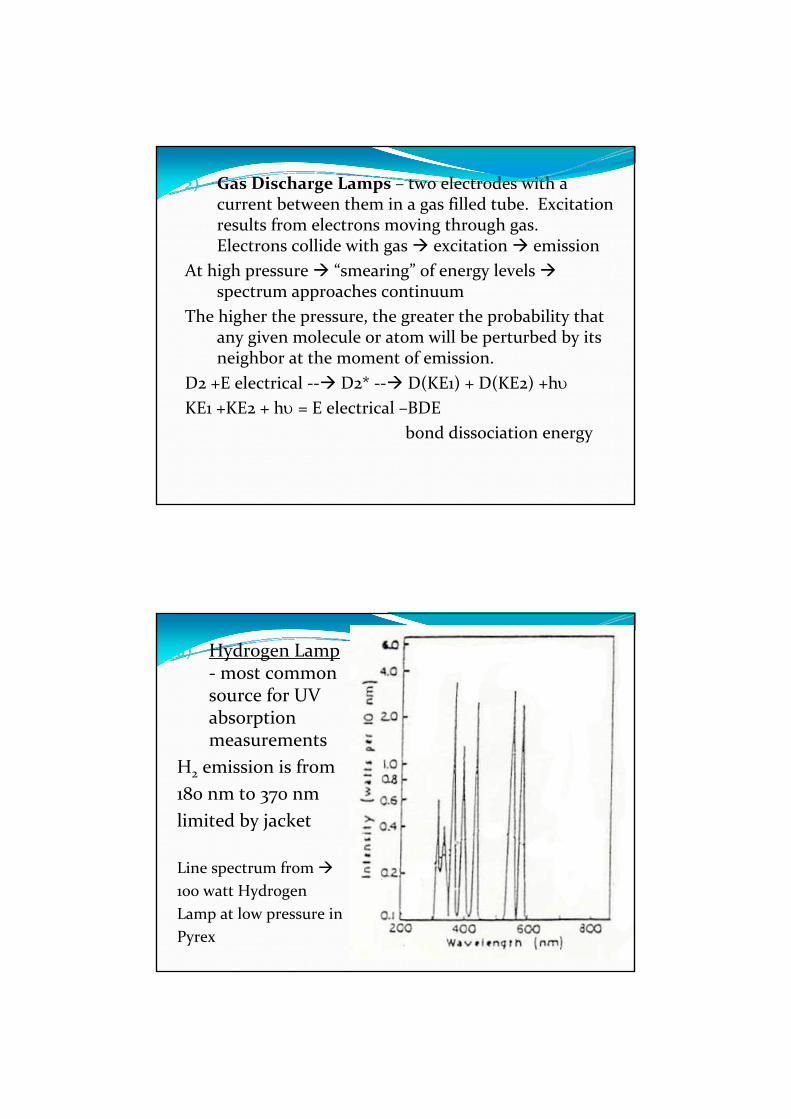
b) Deuterium Lamp – same λdistribution as H2 but with higher intensity (3 to 5 times) ‐
D2 is a heaviermolecule & movesslower so there isless loss of energyby collisions
High pressure D2 with quartz jacket
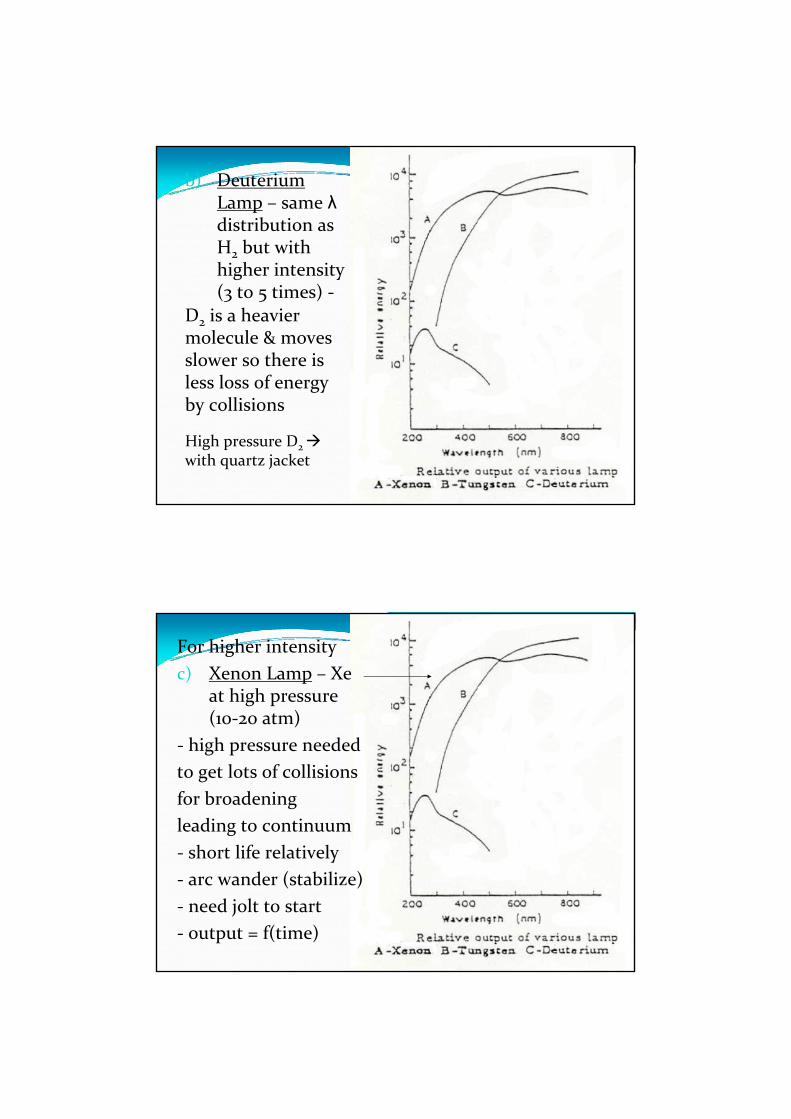
For higher intensityc) Xenon Lamp – Xe
at high pressure (10‐20 atm)
‐ high pressure neededto get lots of collisionsfor broadeningleading to continuum‐ short life relatively‐ arc wander (stabilize)‐ need jolt to start‐ output = f(time)
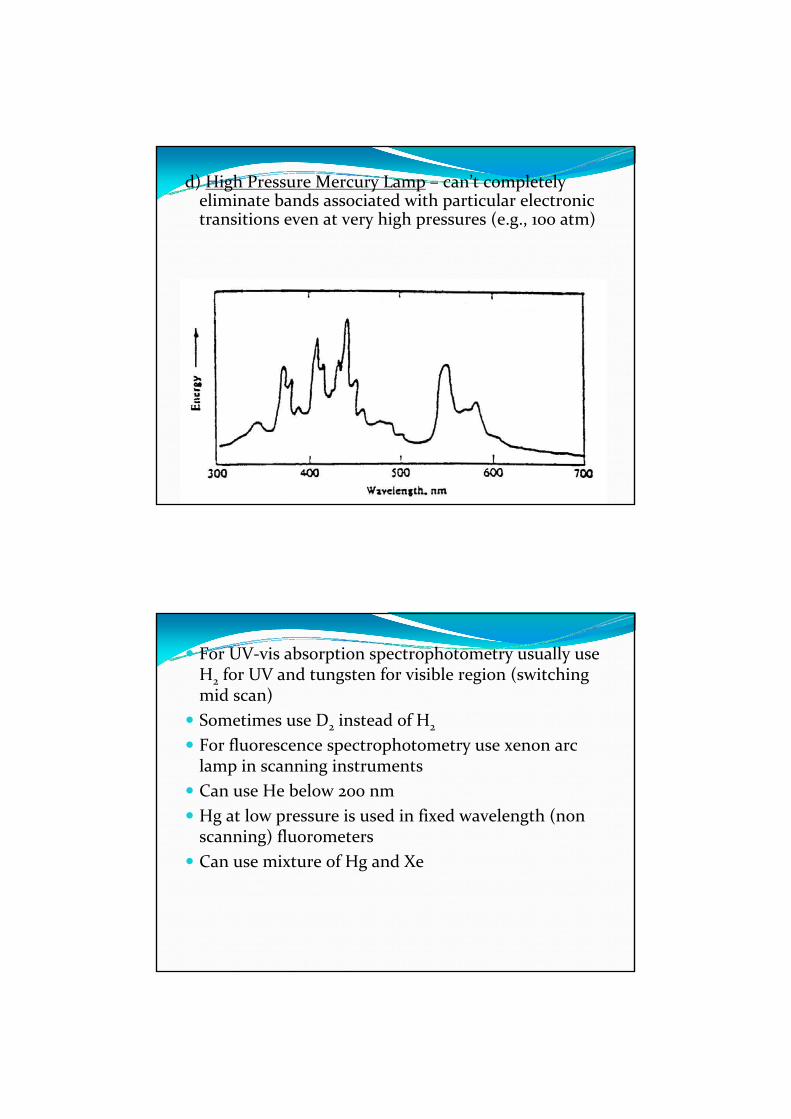
d) High Pressure Mercury Lamp – can’t completely eliminate bands associated with particular electronic transitions even at very high pressures (e.g., 100 atm)
For UV‐vis absorption spectrophotometry usually use H2 for UV and tungsten for visible region (switching mid scan)Sometimes use D2 instead of H2
For fluorescence spectrophotometry use xenon arc lamp in scanning instrumentsCan use He below 200 nmHg at low pressure is used in fixed wavelength (non scanning) fluorometersCan use mixture of Hg and Xe

II) LINE SOURCES1) Gas (Vapor) Discharge Lamps at low pressure (i.e.,
few torr) – minimize collisional interaction so get line spectrum‐most common are Hg and Na‐ often used for λ calibration‐ Hg pen lamp‐ fluorescent lights are another example‐ also used UV detectors for HPLC
2) Hollow Cathode Lamps (HCL) – for AA
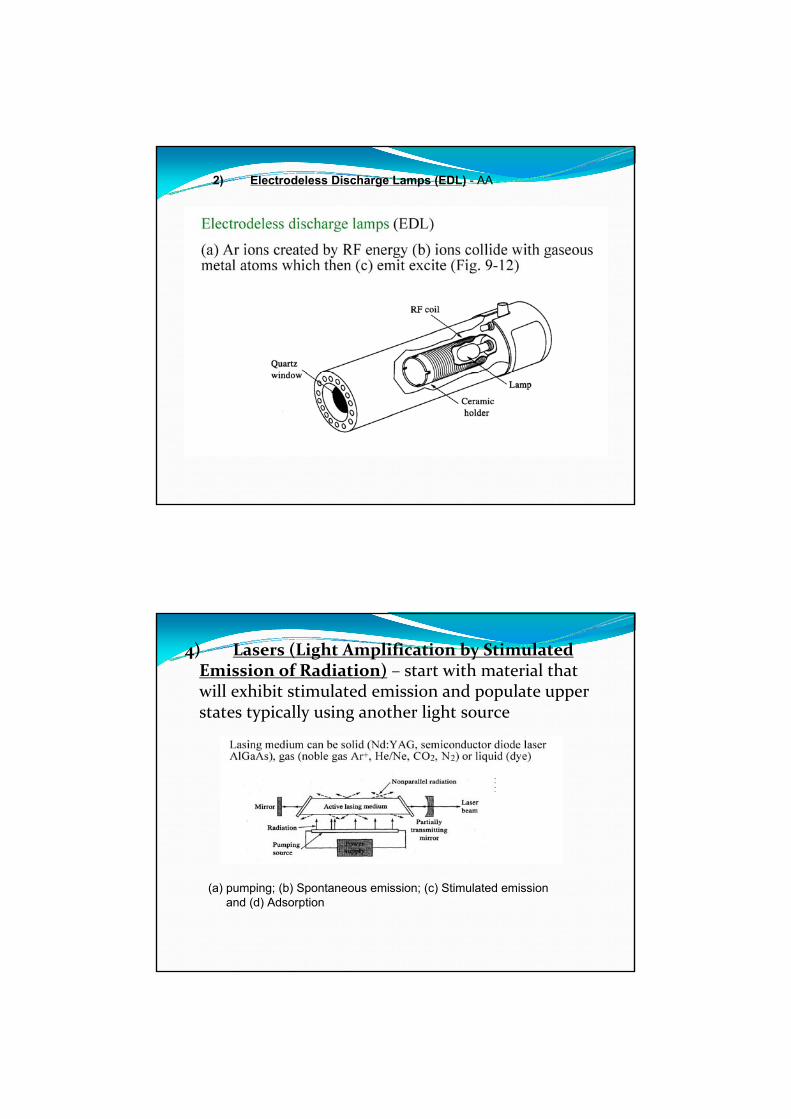
2) Electrodeless Discharge Lamps (EDL) - AA
4) Lasers (Light Amplification by Stimulated Emission of Radiation) – start with material that will exhibit stimulated emission and populate upper states typically using another light source
(a) pumping; (b) Spontaneous emission; (c) Stimulated emission and (d) Adsorption
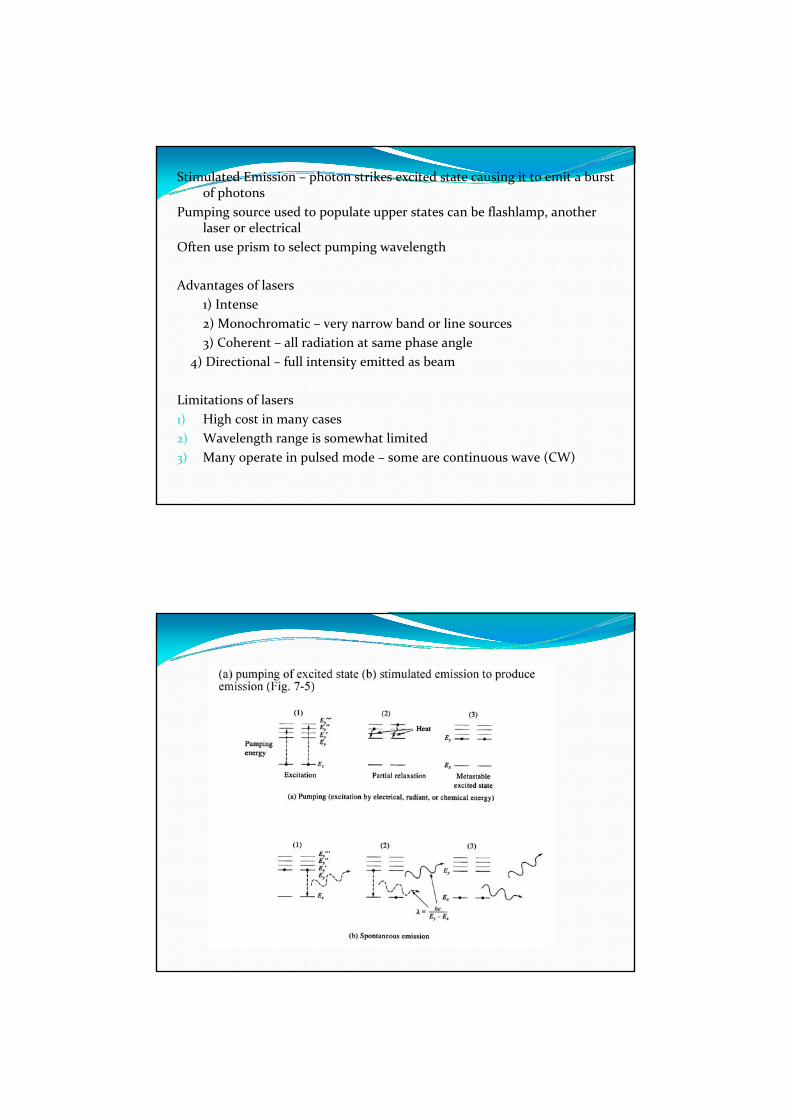
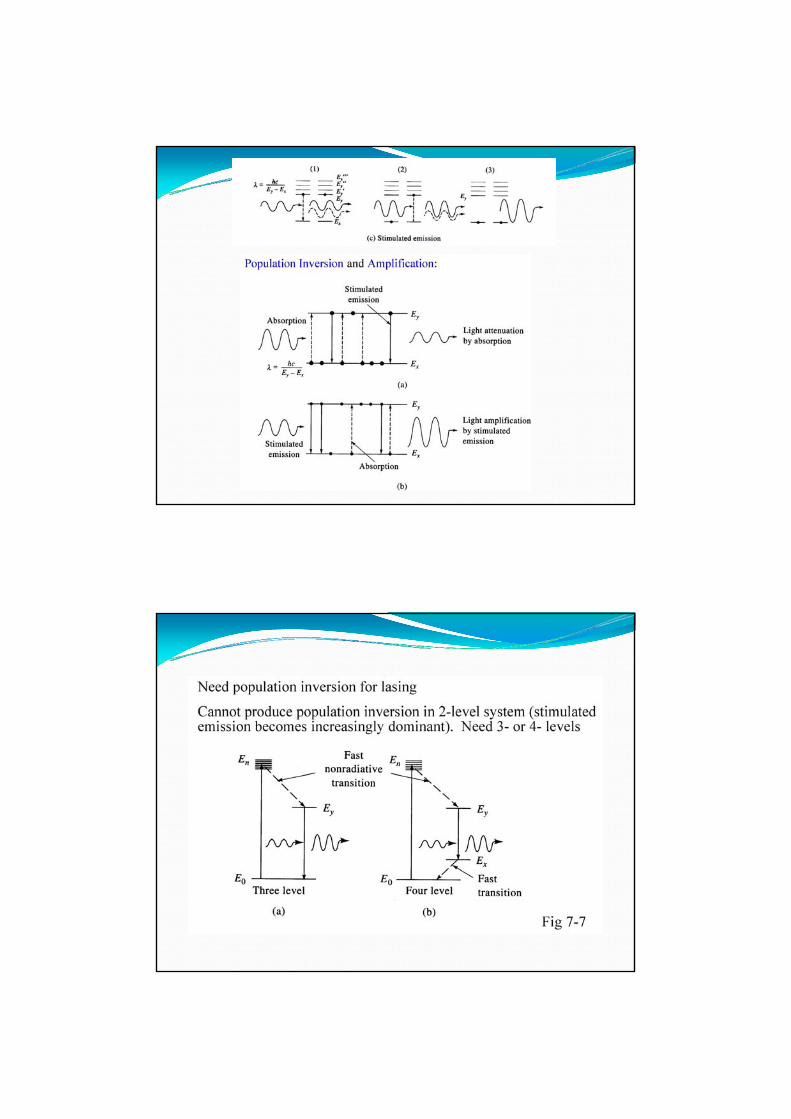
Stimulated Emission – photon strikes excited state causing it to emit a burst of photons
Pumping source used to populate upper states can be flashlamp, another laser or electrical
Often use prism to select pumping wavelength
Advantages of lasers1) Intense2) Monochromatic – very narrow band or line sources3) Coherent – all radiation at same phase angle
4) Directional – full intensity emitted as beam
Limitations of lasers1) High cost in many cases2) Wavelength range is somewhat limited3) Many operate in pulsed mode – some are continuous wave (CW)
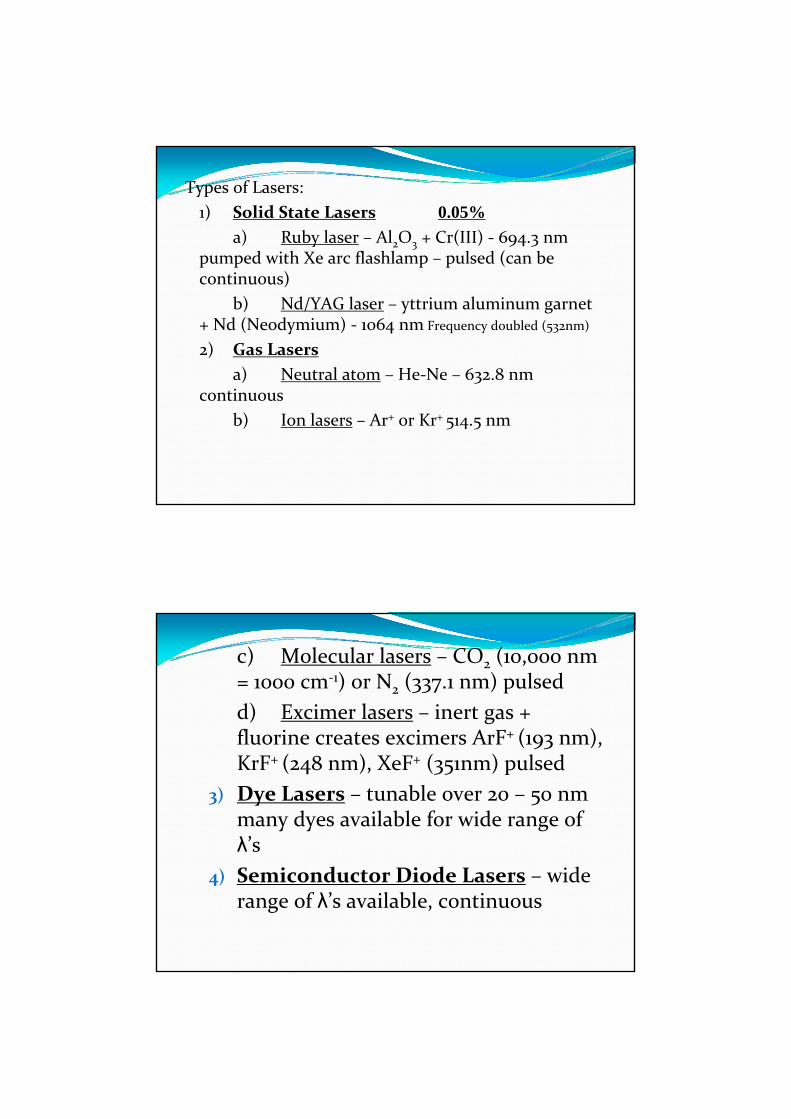
Types of Lasers:1) Solid State Lasers 0.05%
a) Ruby laser – Al2O3 + Cr(III) ‐ 694.3 nm pumped with Xe arc flashlamp – pulsed (can be continuous)
b) Nd/YAG laser – yttrium aluminum garnet + Nd (Neodymium) ‐ 1064 nm Frequency doubled (532nm)
2) Gas Lasersa) Neutral atom – He‐Ne – 632.8 nm
continuousb) Ion lasers – Ar+ or Kr+ 514.5 nm
c) Molecular lasers – CO2 (10,000 nm = 1000 cm‐1) or N2 (337.1 nm) pulsedd) Excimer lasers – inert gas + fluorine creates excimers ArF+ (193 nm), KrF+ (248 nm), XeF+ (351nm) pulsed
3) Dye Lasers – tunable over 20 – 50 nm many dyes available for wide range of λ’s
4) Semiconductor Diode Lasers – wide range of λ’s available, continuous

Wavelength SelectionThree main approaches:
1) Block off unwanted radiation – optical filters2) Disperse radiation & select desired band –monochromator (prism)3) Modulate wavelengths at different frequencies ‐ interferometer
FILTERS1) Absorption – colored glass, colored film, colored solutions – cheapest way
Assortment of Glass & Quartz Optical Filters
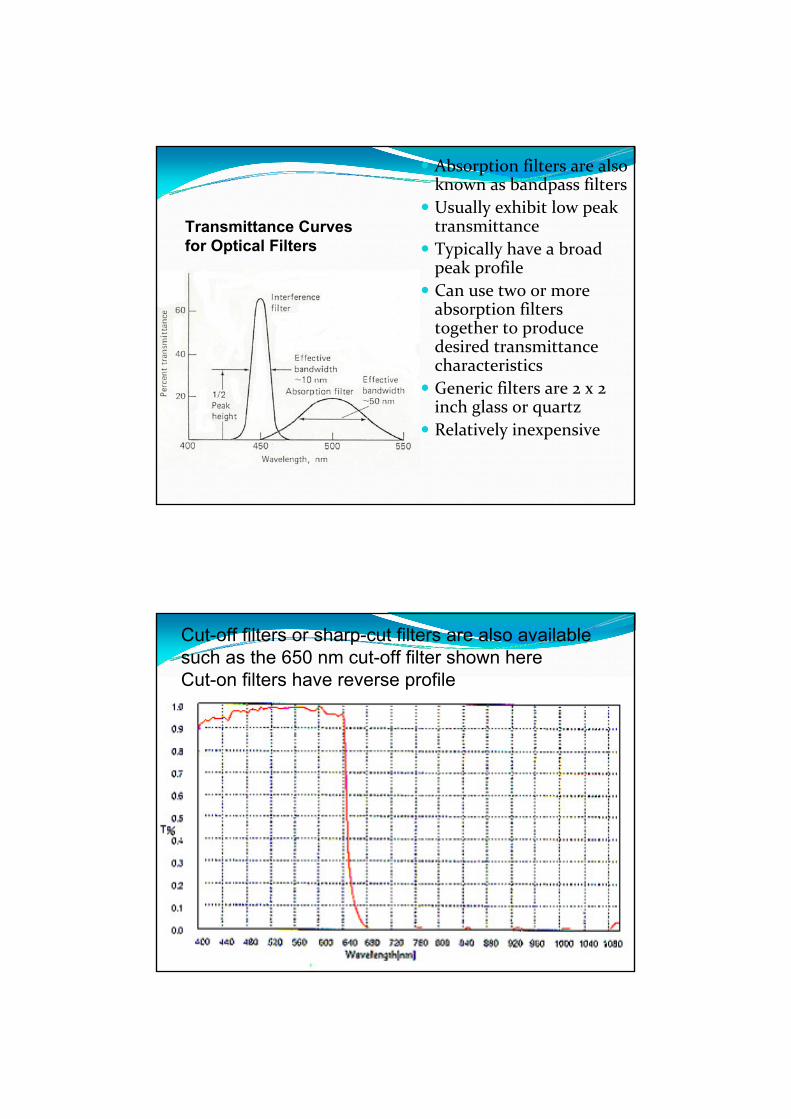
Transmittance Curves for Optical Filters
Absorption filters are also known as bandpass filtersUsually exhibit low peak transmittanceTypically have a broad peak profileCan use two or more absorption filters together to produce desired transmittance characteristicsGeneric filters are 2 x 2 inch glass or quartzRelatively inexpensive
Cut-off filters or sharp-cut filters are also available such as the 650 nm cut-off filter shown hereCut-on filters have reverse profile
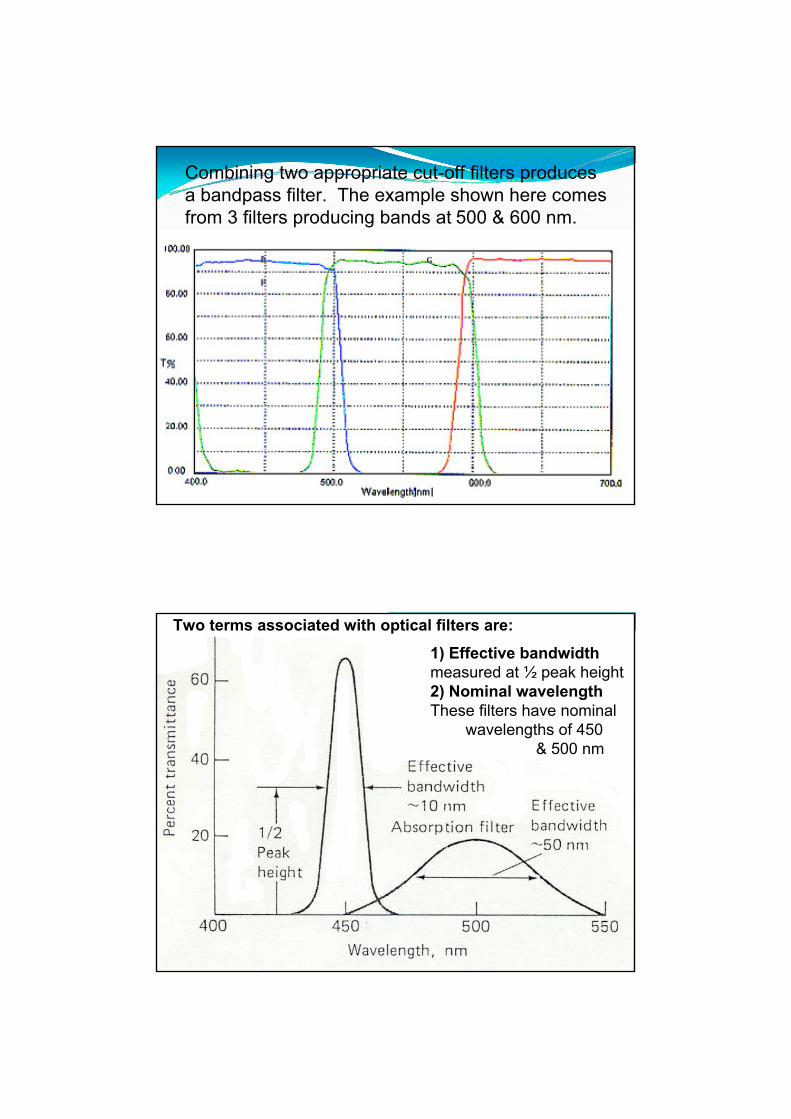
Combining two appropriate cut-off filters producesa bandpass filter. The example shown here comesfrom 3 filters producing bands at 500 & 600 nm.
Two terms associated with optical filters are:
1) Effective bandwidthmeasured at ½ peak height2) Nominal wavelengthThese filters have nominal
wavelengths of 450& 500 nm
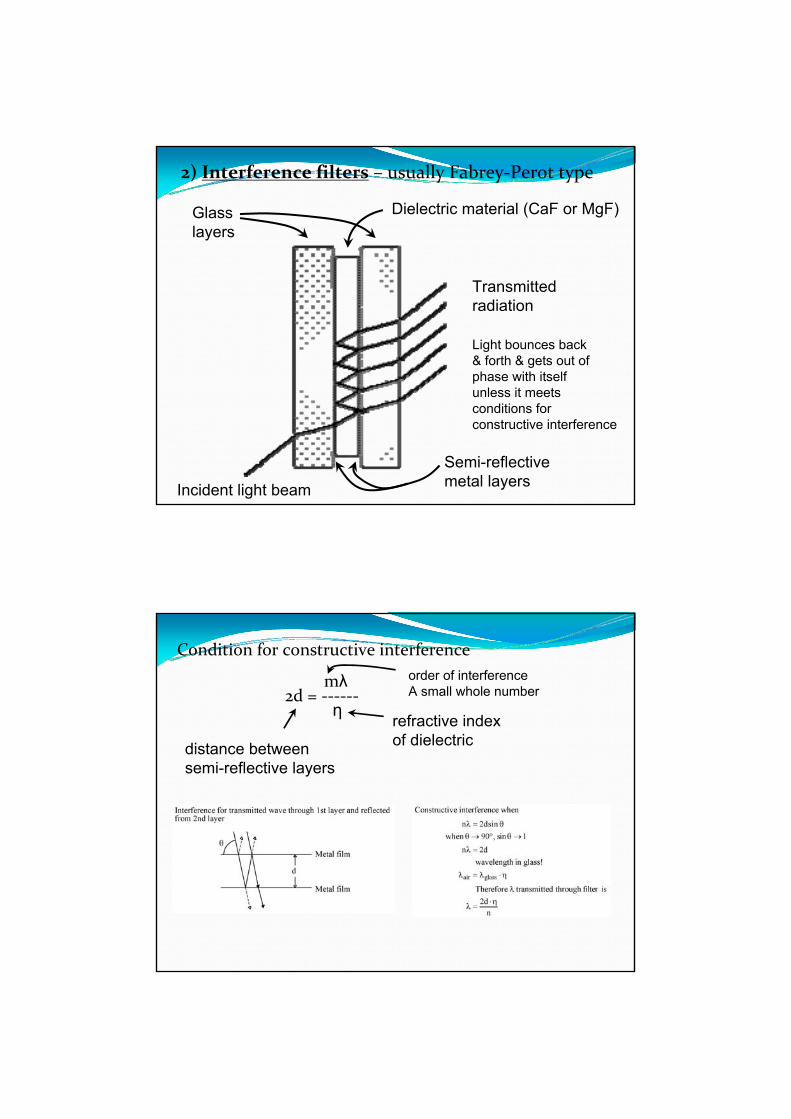
2) Interference filters – usually Fabrey‐Perot type
Incident light beam
Transmittedradiation
Glasslayers
Dielectric material (CaF or MgF)
Semi-reflectivemetal layers
Light bounces back& forth & gets out ofphase with itselfunless it meetsconditions forconstructive interference
Condition for constructive interference
mλ2d = ‐‐‐‐‐‐
η
order of interferenceA small whole number
refractive indexof dielectricdistance between
semi-reflective layers
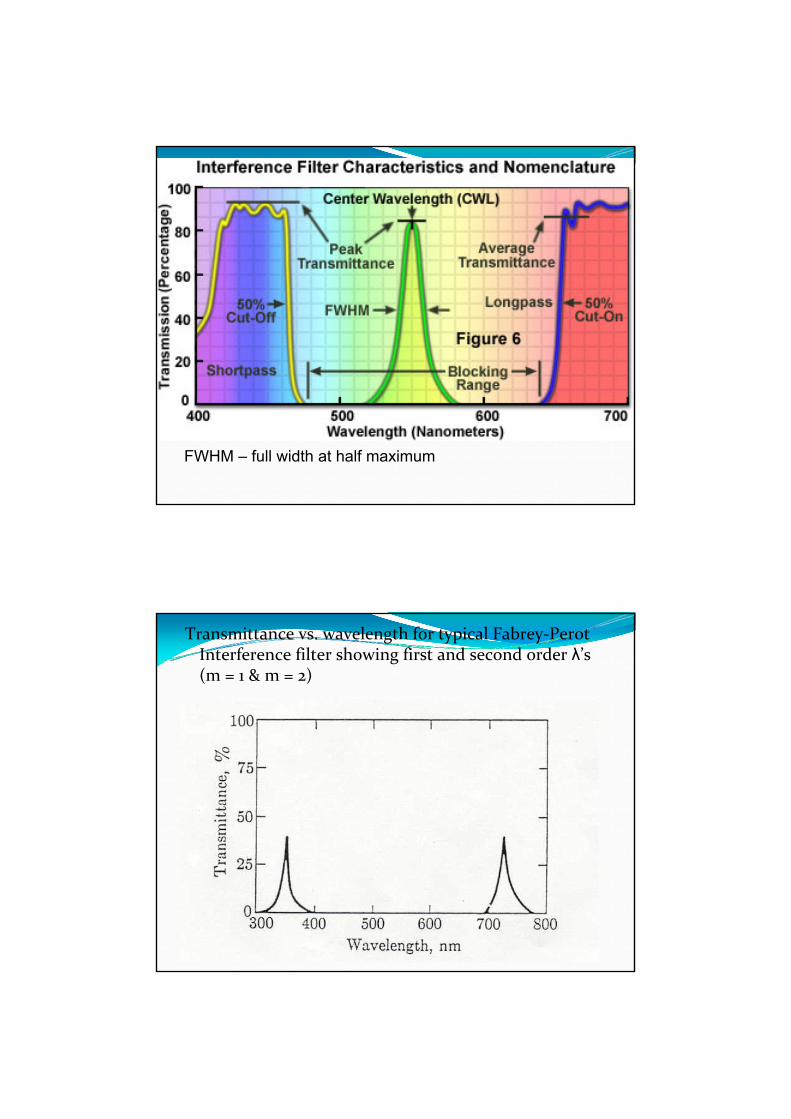
FWHM – full width at half maximum
Transmittance vs. wavelength for typical Fabrey‐Perot Interference filter showing first and second order λ’s (m = 1 & m = 2)
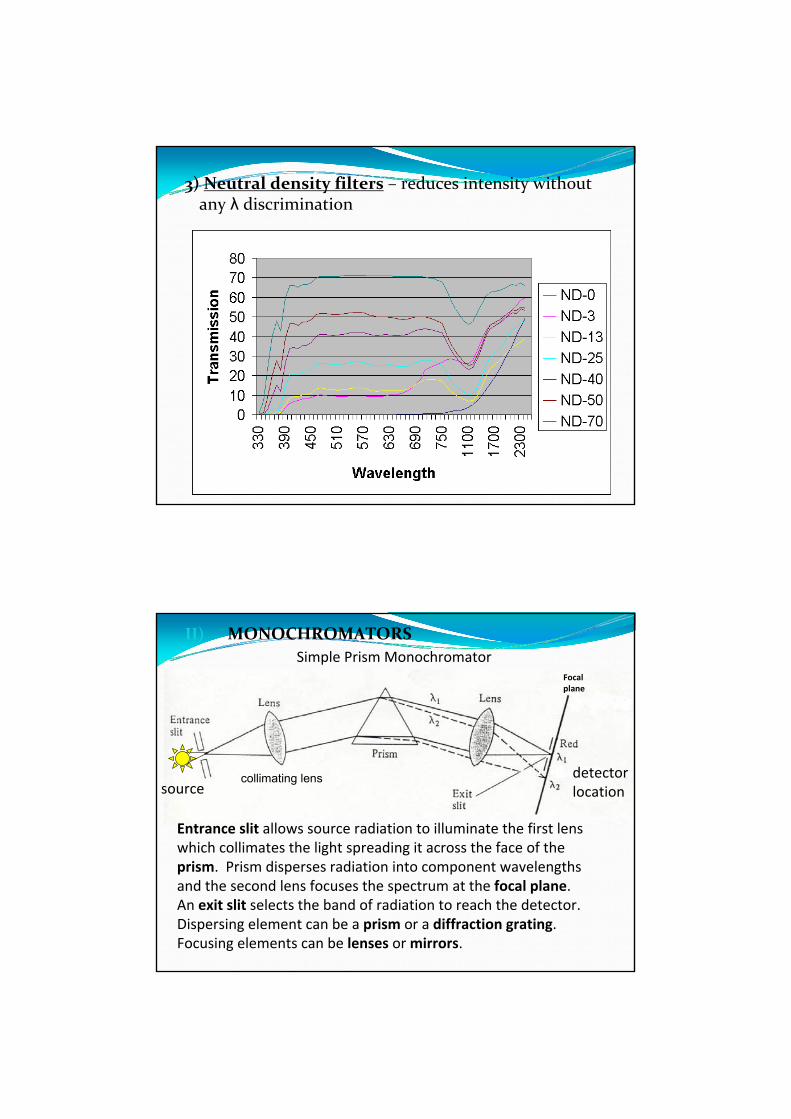
3) Neutral density filters – reduces intensity without any λ discrimination
II) MONOCHROMATORS
sourcedetectorlocation
Simple Prism Monochromator
Entrance slit allows source radiation to illuminate the first lenswhich collimates the light spreading it across the face of theprism. Prism disperses radiation into component wavelengthsand the second lens focuses the spectrum at the focal plane.An exit slit selects the band of radiation to reach the detector.Dispersing element can be a prism or a diffraction grating.Focusing elements can be lenses or mirrors.
Focalplane
collimating lens
Optical Materials – need optically transparent materials for lenses, prisms & sample cellsIn visible region – can use glass down to 350 nmIn the UV region – quartz is material of choiceIn the IR region – NaCl, KBr, etc. The heavier the atoms of the salt, the farther into the IR region (i.e., longer λ) before significant absorption occurs
Problem – sensitivity to moisture
Resolution – ability to distinguish as separate, nearly identical frequencies; measured in terms of closest frequencies Δν in a spectrum that are distinguishable
ν λR = ‐‐‐‐‐ or ‐‐‐‐‐ (both dimensionless)
Δν Δ λFor a benchtop UV it should be 103 to 104
Dispersion – spread of wavelengths in space
Angular Dispersion – angular range dθ over
which waveband dλ is spread dθ rad‐‐‐‐‐ in ‐‐‐‐‐‐dλ nm
Average wavelength of images
Difference of 2 images
Linear Dispersion – distance dx over which a waveband dλ is spread in the focal plane of a monochromator dx mm
‐‐‐‐‐ in ‐‐‐‐‐‐‐‐dλ nm
Linear Reciprocal Dispersion – range of λ’s spread over a unit distance in the plane of a monochromator dλ nm
‐‐‐‐‐ in ‐‐‐‐‐‐dx mm
Related terms spectral slit width or bandwidth or bandpass = range of λ’s included in a beam of radiation measured at half max intensity
f/ of a monochromator is important if have a weak source. For lenses in series, the smallest f/ sets the overall f/ for the system.
Lens Summary:1) rugged, easy to use, inexpensive2) can have chromatic aberrations = focal length depends on η which varies with λ – solution is to fabricate lenses out of a composite glasses so η is constant with λ. This increases cost3) Each lens results in some light loss due to reflection
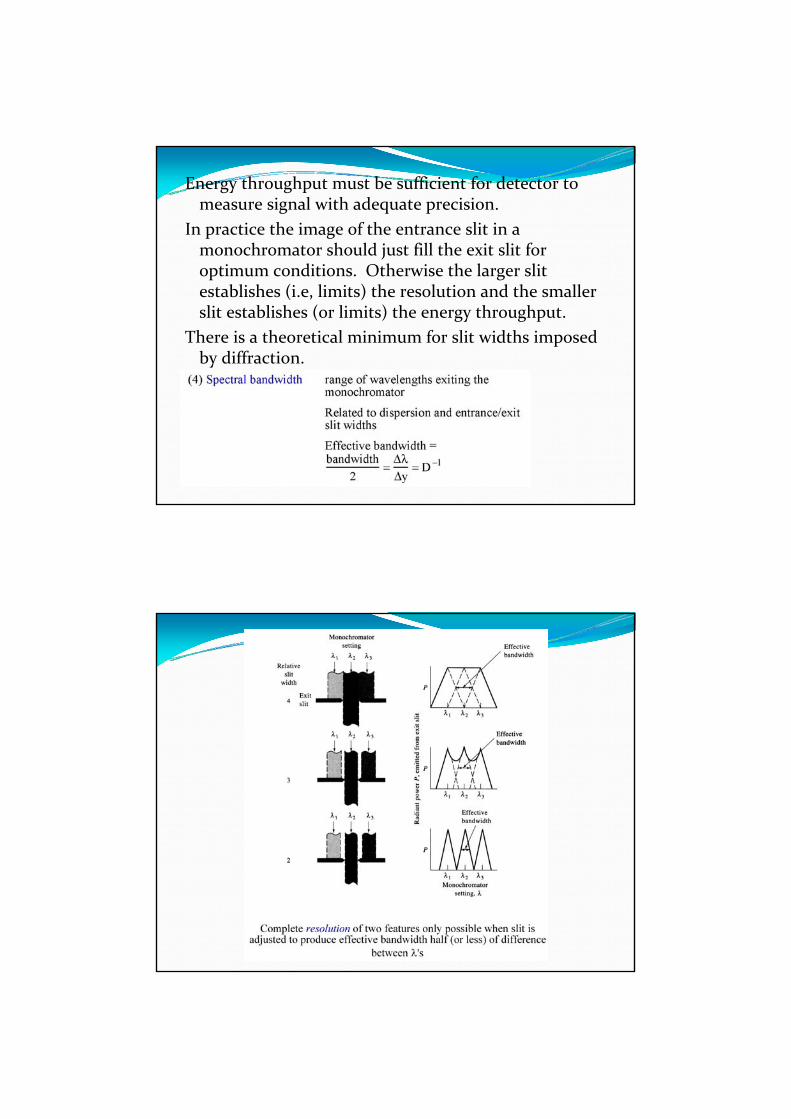
Energy throughput must be sufficient for detector to measure signal with adequate precision.
In practice the image of the entrance slit in a monochromator should just fill the exit slit for optimum conditions. Otherwise the larger slit establishes (i.e, limits) the resolution and the smaller slit establishes (or limits) the energy throughput.
There is a theoretical minimum for slit widths imposed by diffraction.
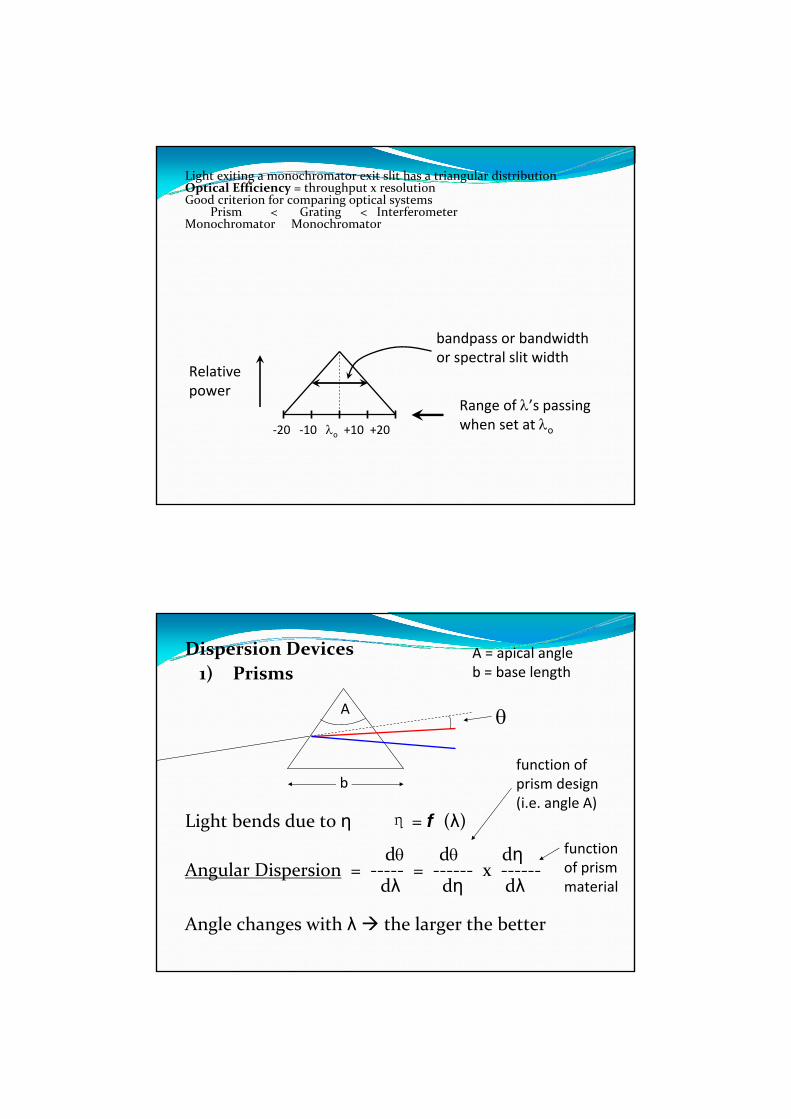
Light exiting a monochromator exit slit has a triangular distribution Optical Efficiency = throughput x resolutionGood criterion for comparing optical systems
Prism < Grating < InterferometerMonochromator Monochromator
bandpass or bandwidthor spectral slit width
Relativepower
‐20 ‐10 λo +10 +20
Range of λ’s passingwhen set at λo
Dispersion Devices1) Prisms
Light bends due to η η = f (λ)
dθ dθ dηAngular Dispersion = ‐‐‐‐‐ = ‐‐‐‐‐‐ x ‐‐‐‐‐‐
dλ dη dλ
Angle changes with λ the larger the better
b
A θ
A = apical angleb = base length
function of prism design(i.e. angle A)
functionof prismmaterial
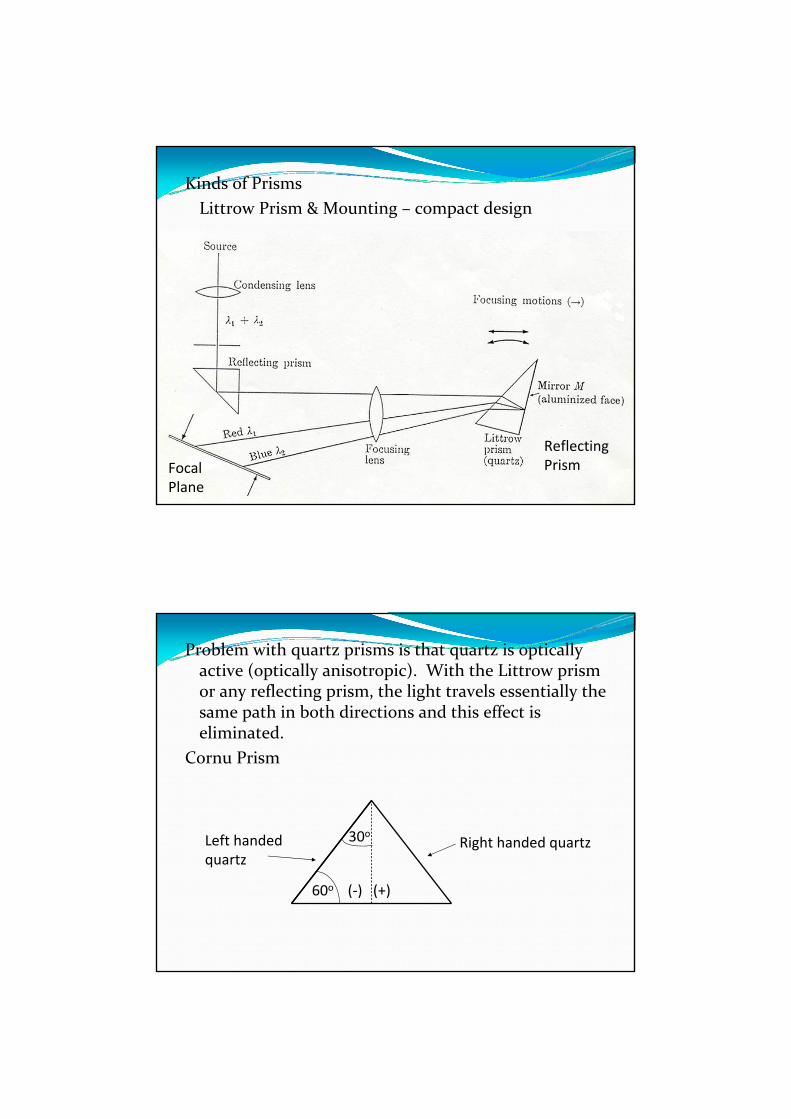
Kinds of PrismsLittrow Prism & Mounting – compact design
FocalPlane
ReflectingPrism
Problem with quartz prisms is that quartz is optically active (optically anisotropic). With the Littrow prism or any reflecting prism, the light travels essentially the same path in both directions and this effect is eliminated.
Cornu Prism
Right handed quartzLeft handedquartz
60o
30o
(‐) (+)
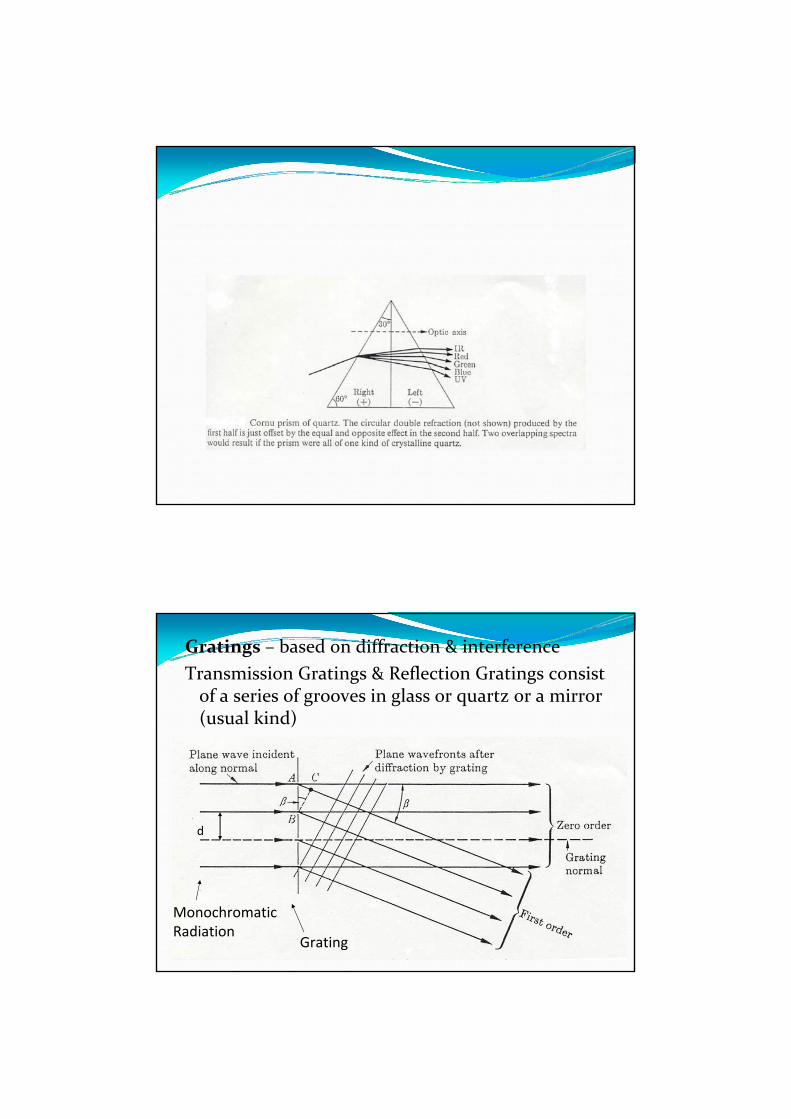
Gratings – based on diffraction & interferenceTransmission Gratings & Reflection Gratings consist of a series of grooves in glass or quartz or a mirror (usual kind)
MonochromaticRadiation
Grating
d
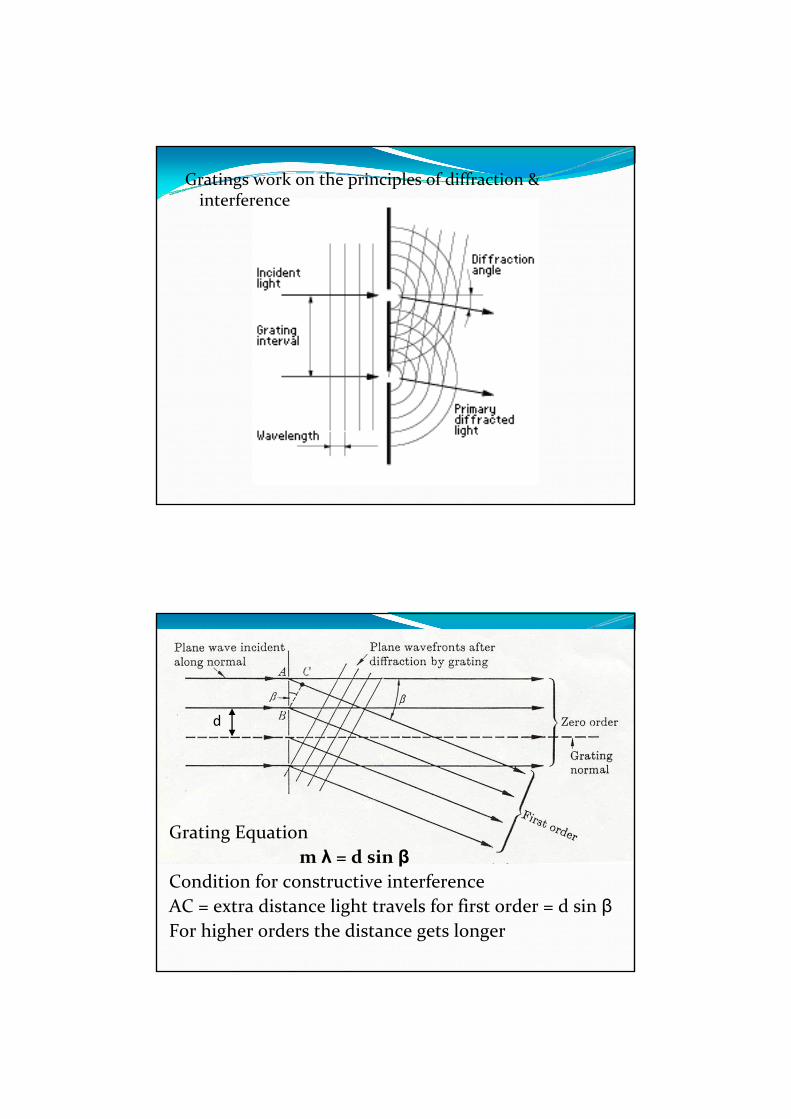
Gratings work on the principles of diffraction & interference
Grating Equationm λ = d sin β
Condition for constructive interferenceAC = extra distance light travels for first order = d sin βFor higher orders the distance gets longer
d
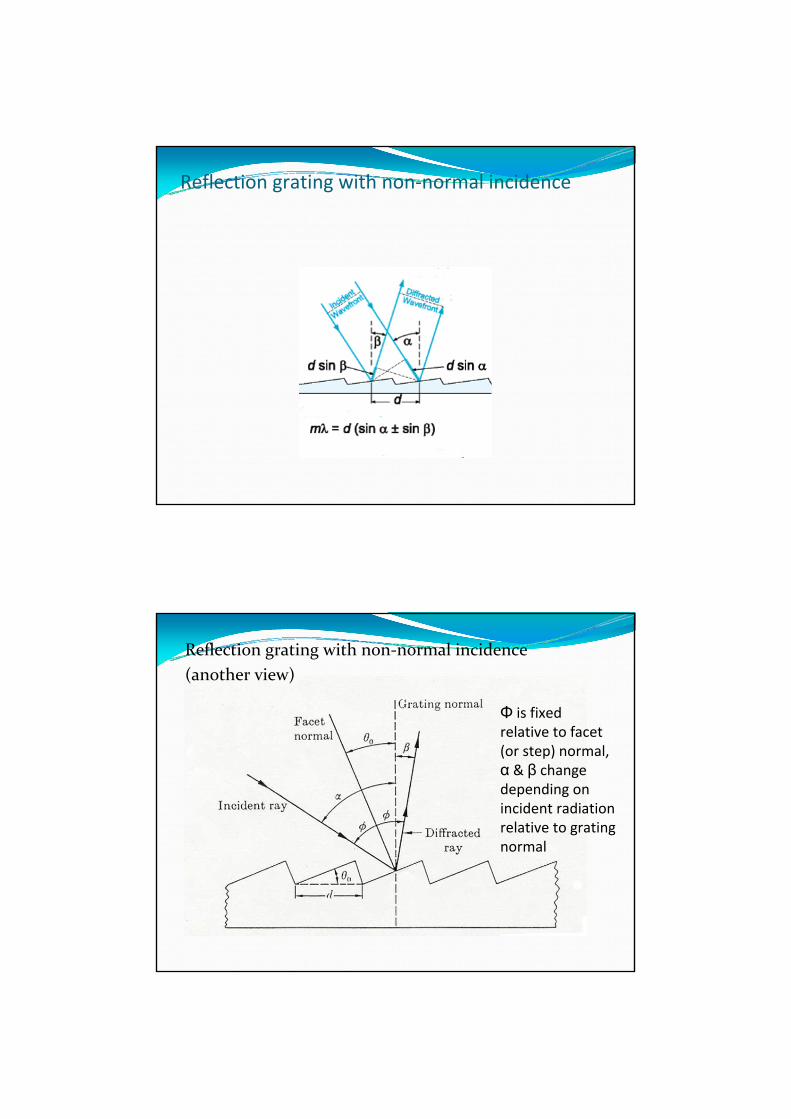
Reflection grating with non‐normal incidence
Reflection grating with non‐normal incidence(another view)
Φ is fixedrelative to facet(or step) normal,α & β changedepending onincident radiationrelative to gratingnormal
Preparation of reflection gratings – a master grating is prepared by ruling grooves in a reflective aluminum surface on glass (from 20 – 3000 grooves/mm or 10,000 lines/inch)
Replicate gratings can be prepared from master grating which brings down the cost
fraction of monochromatic lightdiffracted in a particular order
Grating Efficiency = ‐‐‐‐‐‐‐‐‐‐‐‐‐‐‐‐‐‐‐‐‐‐‐‐‐‐‐‐‐‐‐‐‐‐‐‐‐‐‐‐‐‐fraction specularly reflected
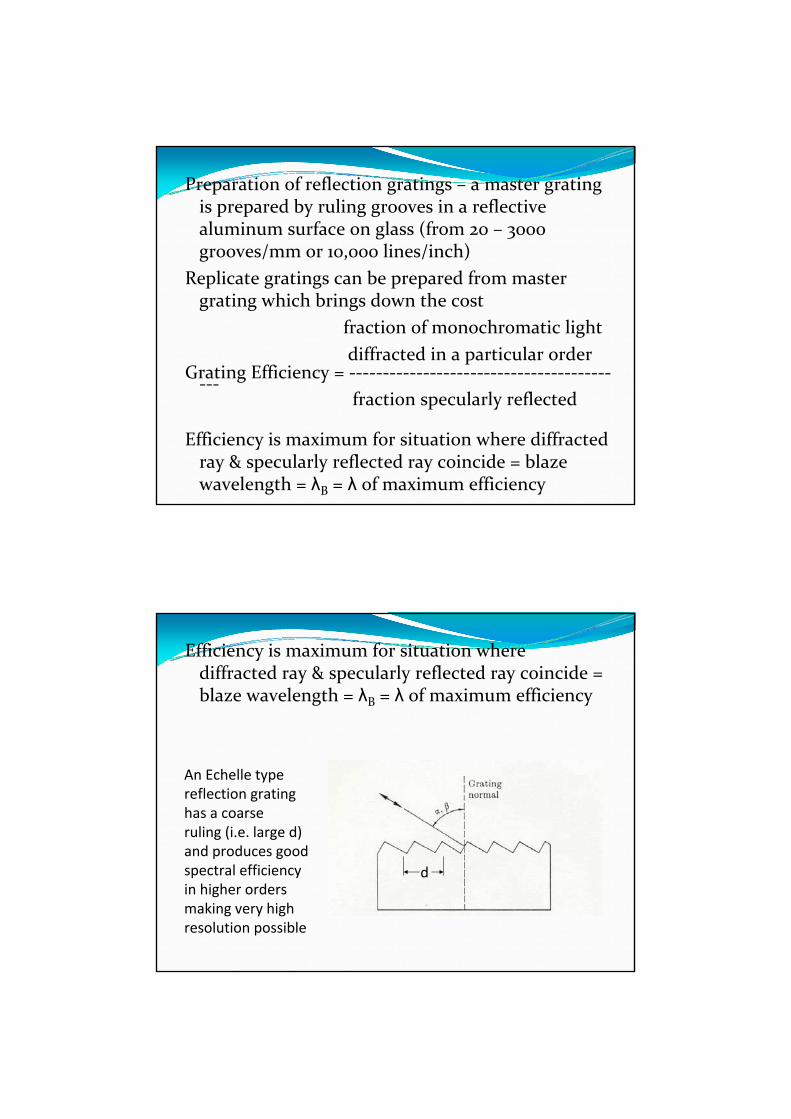
Efficiency is maximum for situation where diffracted ray & specularly reflected ray coincide = blaze wavelength = λB = λ of maximum efficiency
Efficiency is maximum for situation where diffracted ray & specularly reflected ray coincide = blaze wavelength = λB = λ of maximum efficiency
An Echelle typereflection gratinghas a coarseruling (i.e. large d)and produces goodspectral efficiencyin higher ordersmaking very highresolution possible
d
The echellette grating concentrates most of the intensity in the first few ordersFirst order efficiency at λB is 60 ‐ 70 % and typically falls off by about half at 2/3 λB and 2λBChoose angle for λ region of interestEchellette is the normal grating for UV, vis, IREchelle grating used for atomic emission
Concentrates intensity in higher ordersUses steeper steps
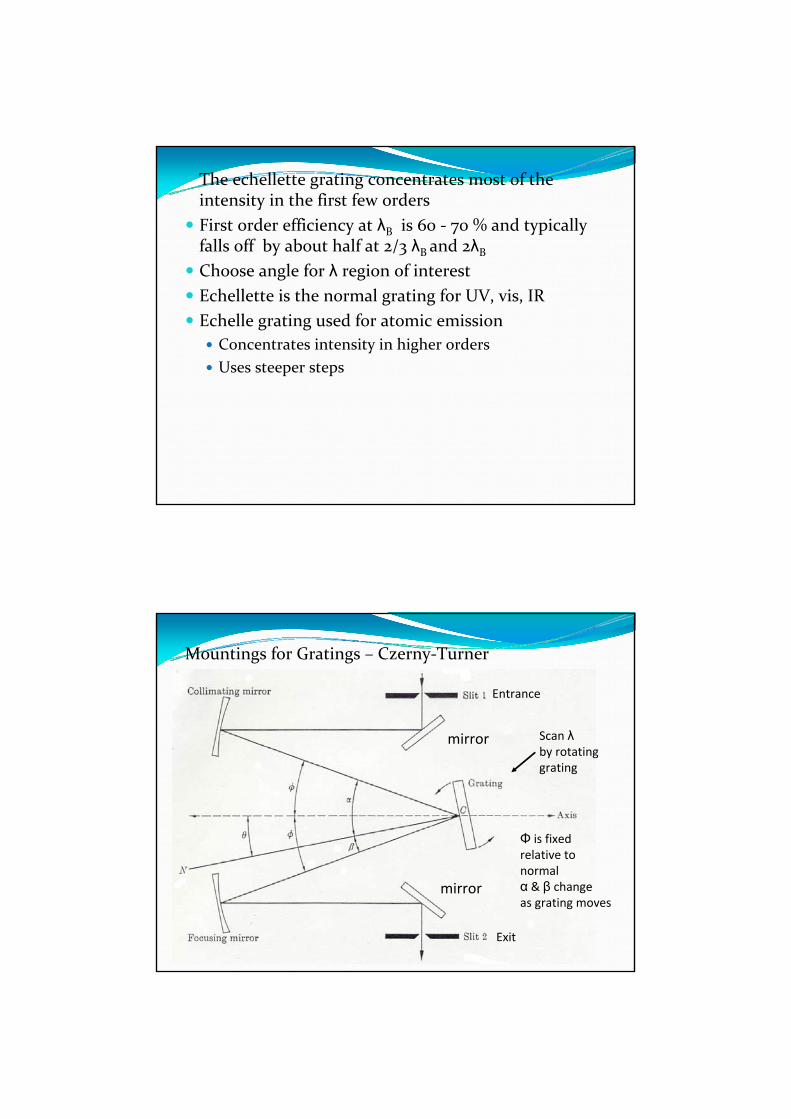
Mountings for Gratings – Czerny‐Turner
Entrance
Exit
mirror
mirror
Scan λby rotatinggrating
Φ is fixedrelative tonormalα & β changeas grating moves
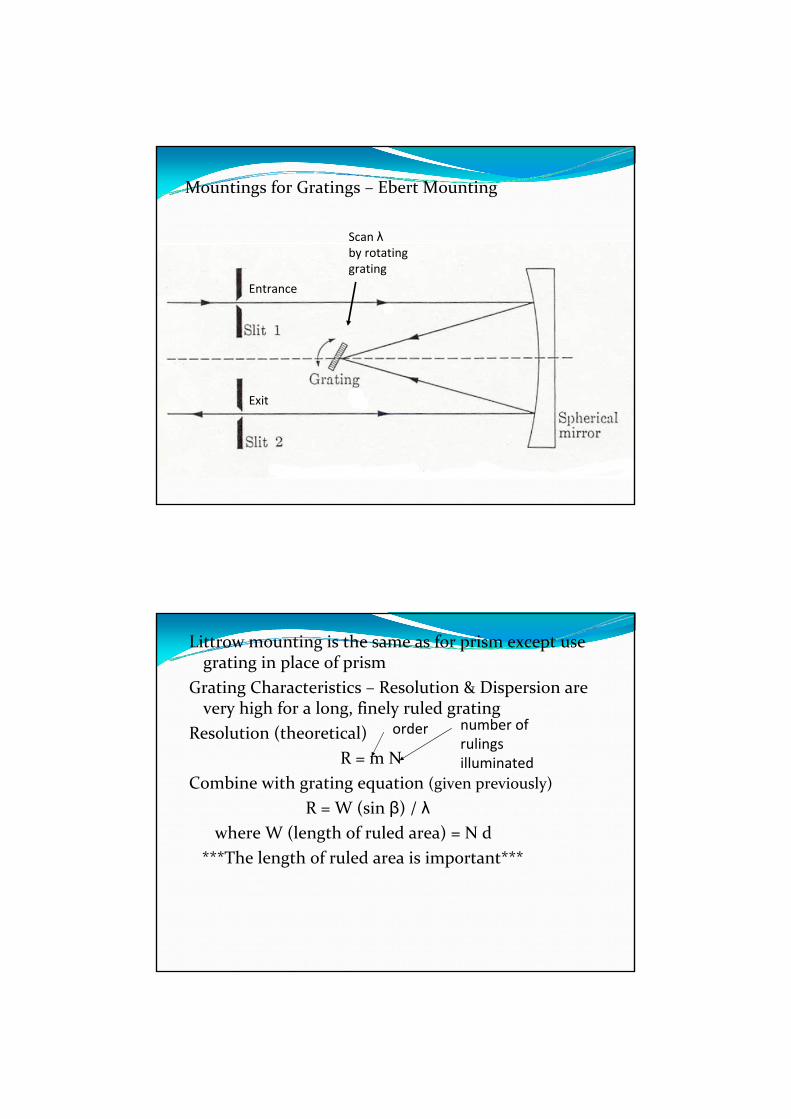
Mountings for Gratings – Ebert Mounting
Entrance
Exit
Scan λby rotatinggrating
Littrow mounting is the same as for prism except use grating in place of prism
Grating Characteristics – Resolution & Dispersion are very high for a long, finely ruled grating
Resolution (theoretical)R = m N
Combine with grating equation (given previously)R = W (sin β) / λ
where W (length of ruled area) = N d***The length of ruled area is important***
order number ofrulingsilluminated
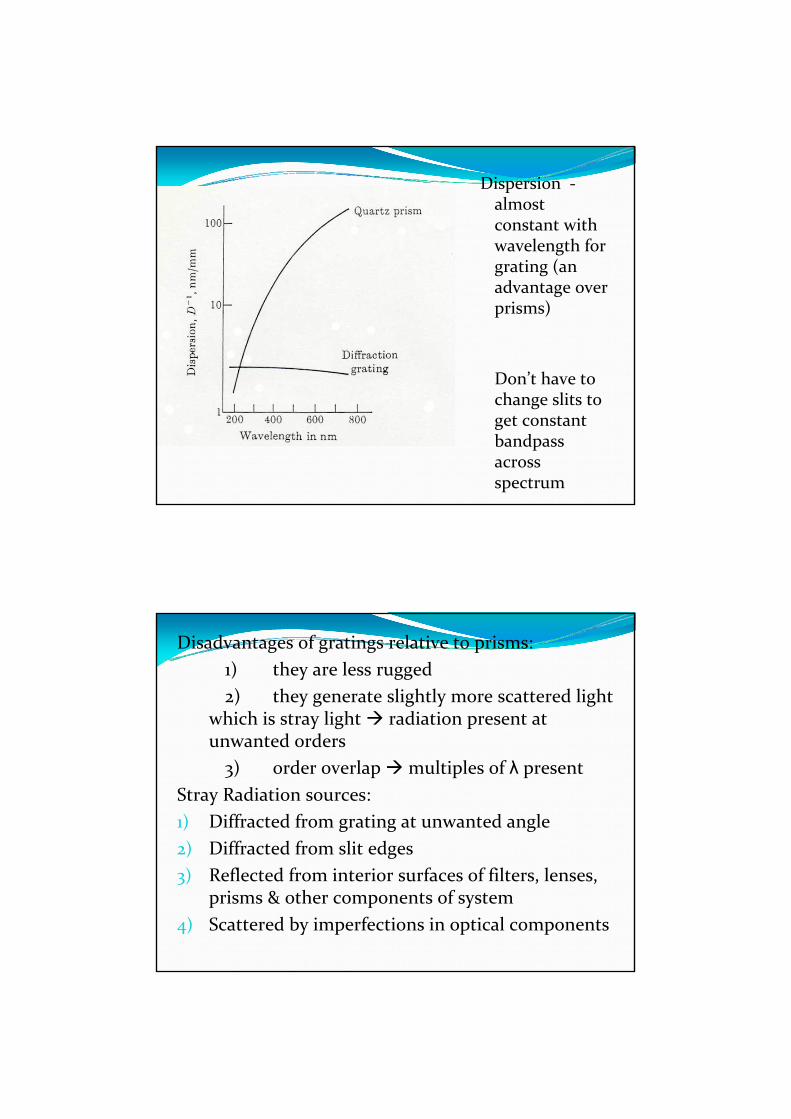
Dispersion ‐almost constant with wavelength for grating (an advantage over prisms)
Don’t have to change slits to get constant bandpass across spectrum
Disadvantages of gratings relative to prisms:1) they are less rugged2) they generate slightly more scattered light
which is stray light radiation present at unwanted orders3) order overlap multiples of λ present
Stray Radiation sources:1) Diffracted from grating at unwanted angle2) Diffracted from slit edges3) Reflected from interior surfaces of filters, lenses,
prisms & other components of system4) Scattered by imperfections in optical components
Methods of reducing stray light:1) Paint interior black2) Use baffles to obstruct stray radiation3) Use high quality components4) Keep out dust and fumes5) Can also use double
monochromator
Cary 14 & 17 UV‐vismonochromator withvery high stray lightrejection
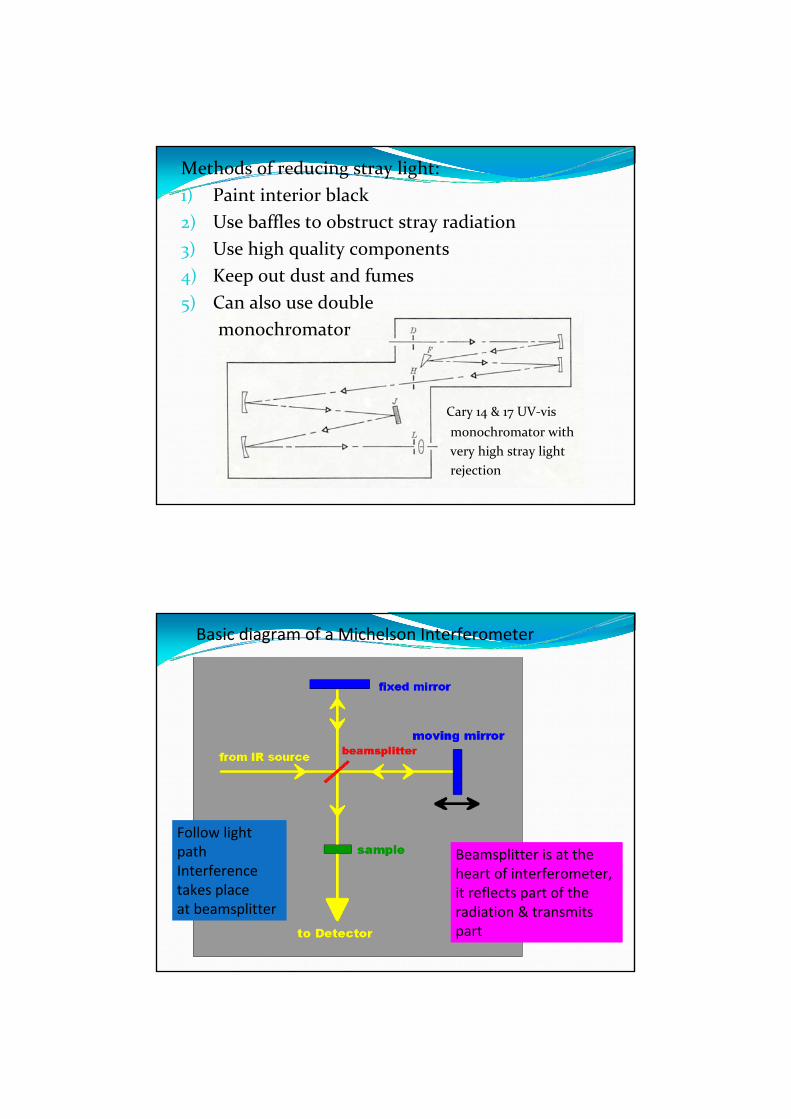
Basic diagram of a Michelson Interferometer
Beamsplitter is at the heart of interferometer,it reflects part of the radiation & transmitspart
Follow lightpathInterferencetakes placeat beamsplitter
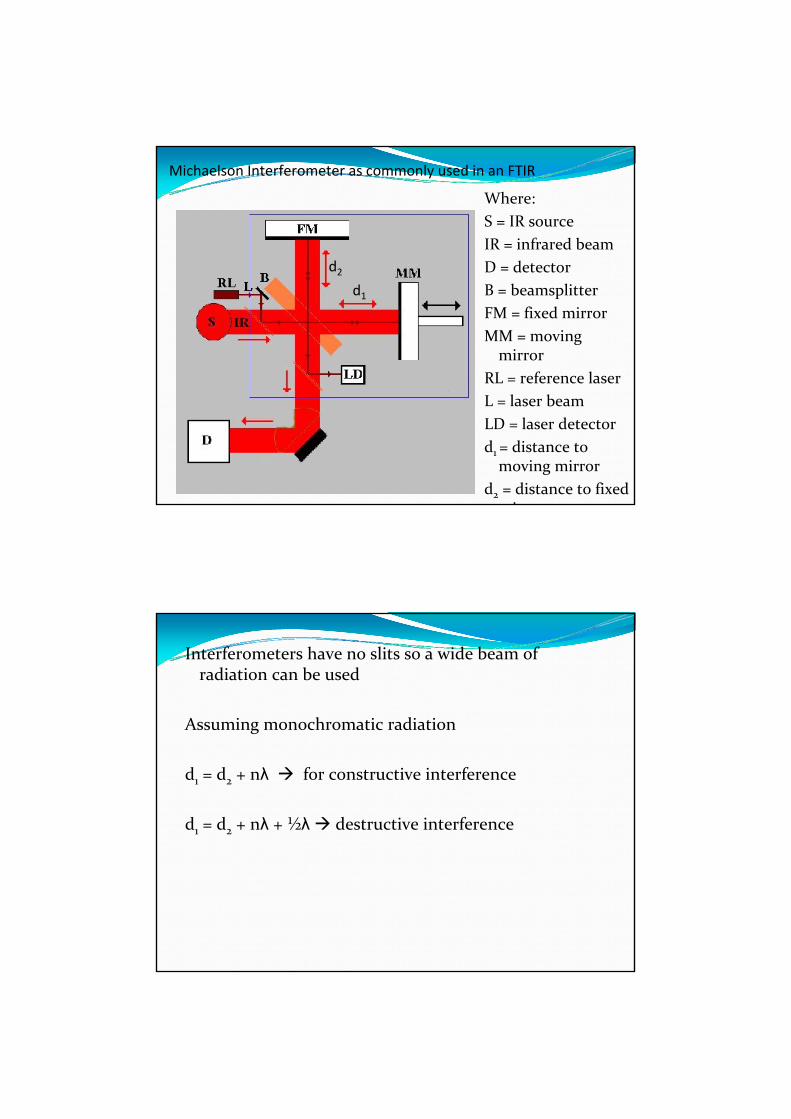
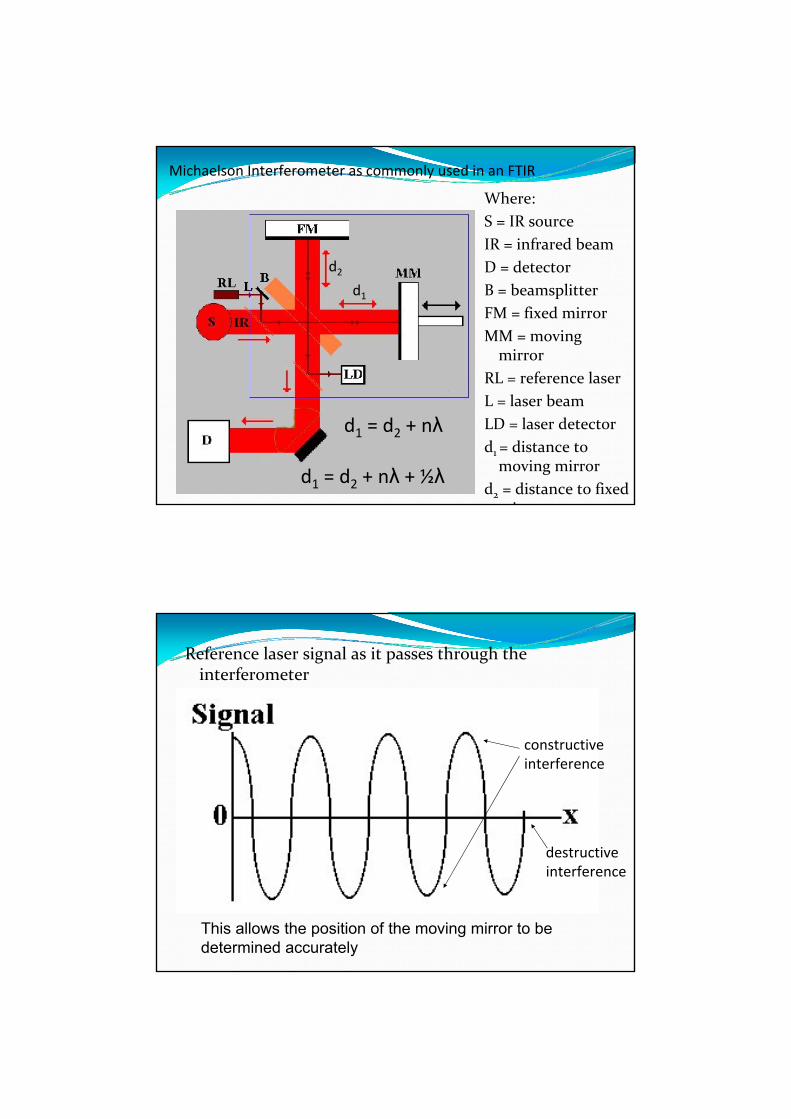
Where:S = IR sourceIR = infrared beamD = detectorB = beamsplitterFM = fixed mirrorMM = moving mirror
RL = reference laserL = laser beamLD = laser detector d1 = distance to moving mirror
d2 = distance to fixed i
Michaelson Interferometer as commonly used in an FTIR
d1
d2
Interferometers have no slits so a wide beam of radiation can be used
Assuming monochromatic radiation
d1 = d2 + nλ for constructive interference
d1 = d2 + nλ + ½λ destructive interference
Where:S = IR sourceIR = infrared beamD = detectorB = beamsplitterFM = fixed mirrorMM = moving mirror
RL = reference laserL = laser beamLD = laser detector d1 = distance to moving mirror
d2 = distance to fixed i
Michaelson Interferometer as commonly used in an FTIR
d1
d2
d1 = d2 + nλ
d1 = d2 + nλ + ½λ
Reference laser signal as it passes through the interferometer
constructiveinterference
destructiveinterference
This allows the position of the moving mirror to be determined accurately
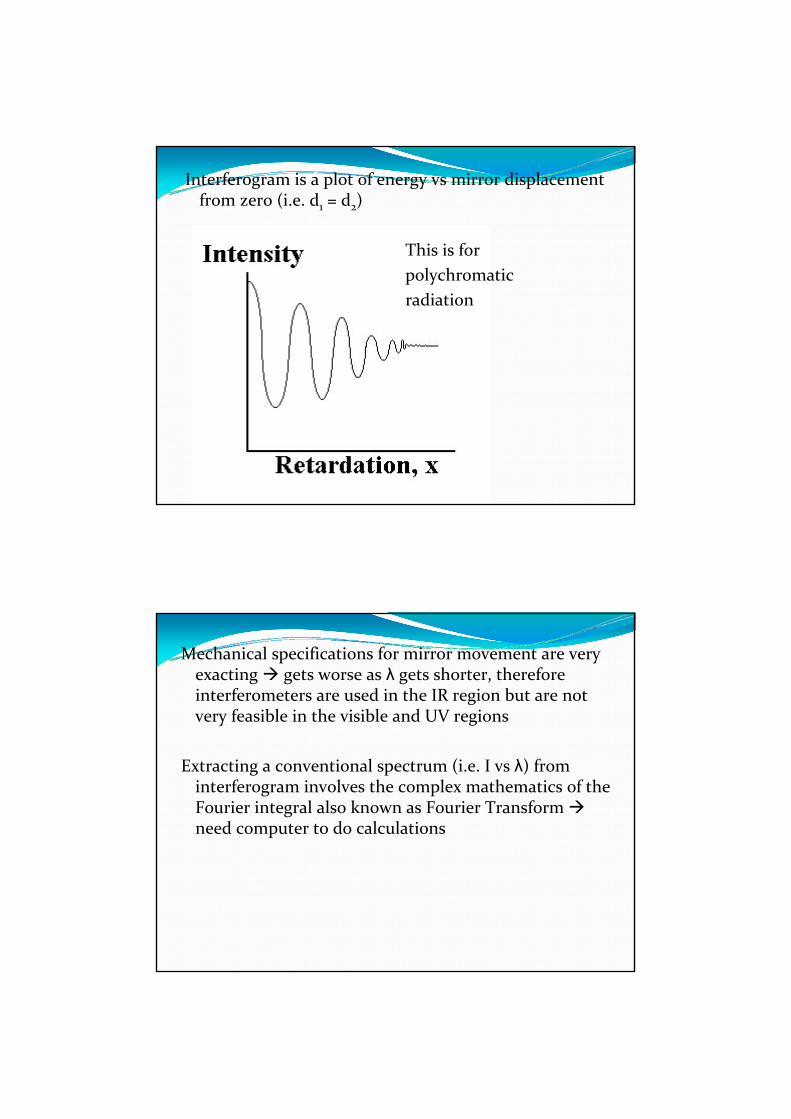
Interferogram is a plot of energy vs mirror displacement from zero (i.e. d1 = d2)
This is for polychromaticradiation
Mechanical specifications for mirror movement are very exacting gets worse as λ gets shorter, therefore interferometers are used in the IR region but are not very feasible in the visible and UV regions
Extracting a conventional spectrum (i.e. I vs λ) from interferogram involves the complex mathematics of the Fourier integral also known as Fourier Transform need computer to do calculations
Advantages of Interferometers:1) Energy throughput is much grater than for
monochromators better signal to noise ratio because there are no slits – this is particularly important in IR where the sources are relatively weak
2) High resolution3) Multiplex Advantage – all signals are viewed
simultaneously, obtain data in 1s or lessDisadvantage: Mechanical tolerance for mirror
movement is severe – can’t do interferometry in the UV‐vis region, λ too short
DETECTORSImportant characteristics:1) Wavelength response2) Quantum response – how light is detected3) Sensitivity4) Frequency of response (response time)5) Stability6) Cost7) convenience
Photoelectric detectors – main detectors in visible and UV
Based on the photoelectric effect
photon Eelectron = hν ‐W
e-energy ofelectron
impingingradiationenergy
work functionof surface,lower W easier toeject electron
electron
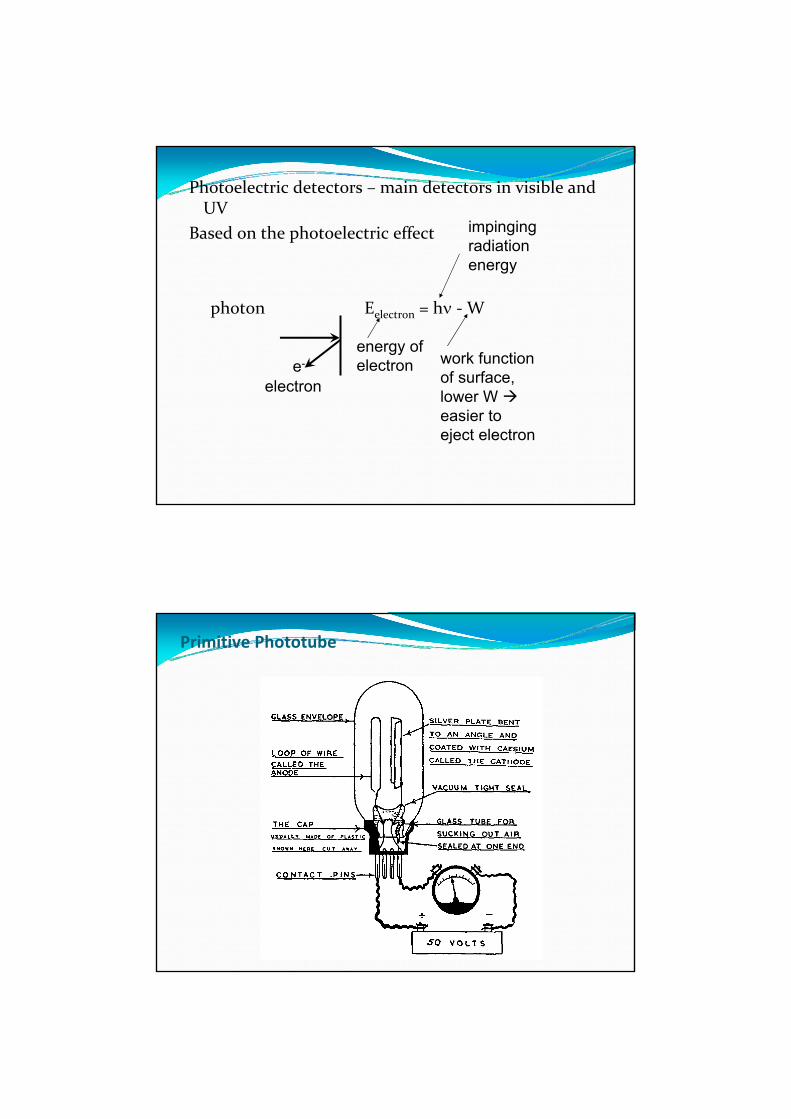
Primitive Phototube
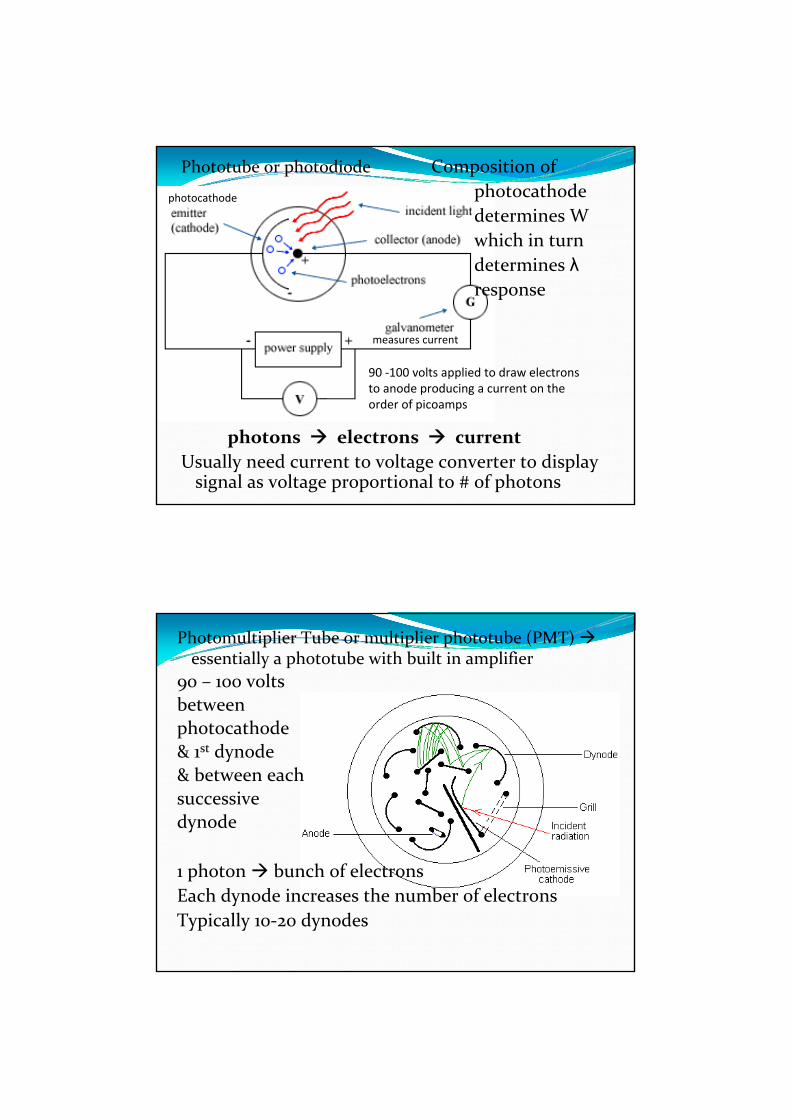
Phototube or photodiode Composition ofphotocathodedetermines Wwhich in turndetermines λresponse
photons electrons currentUsually need current to voltage converter to display signal as voltage proportional to # of photons
photocathode
measures current
90 ‐100 volts applied to draw electronsto anode producing a current on theorder of picoamps
Photomultiplier Tube or multiplier phototube (PMT) essentially a phototube with built in amplifier
90 – 100 voltsbetween photocathode& 1st dynode& between eachsuccessivedynode
1 photon bunch of electronsEach dynode increases the number of electronsTypically 10‐20 dynodes

Photomultiplier Tubes (PMTs)
Standard PMTNormal device forUV‐vis absorption
End‐On PMTTypically used where required byspace or geometry constraints
Characteristic Parameters of PMTs:(typically specified by manufacturers)a) Quantum efficiency = f(λ)
photoelectrons ejected= ‐‐‐‐‐‐‐‐‐‐‐‐‐‐‐‐‐‐‐‐‐‐‐‐‐‐‐‐‐‐‐‐‐‐‐‐‐‐‐‐‐‐
photons striking photocathode
b) Cathode sensitivity = μA/lumen or μA/watthave to specify λ and use a standard source at known
temperaturec) Gain = f (g δ)n Typical gain 106
electrons/photon ing δ = 4.5 collector
efficiencytransfer efficiencydynode to dynode
number ofdynodes
# of electrons emitted‐‐‐‐‐‐‐‐‐‐‐‐‐‐‐‐‐‐‐‐‐‐‐‐‐‐‐‐‐‐‐‐electron striking dynode
d) Spectral response – depends on photocathode work function (sensitivity as a function of wavelength) *Very Important*‐must be corrected for when scanning e.g. in fluorescence spectrum
e) Dark current – current when photomultiplier is operated in complete darkness. Lower limit to the current that can be measured dark current needs to be minimized if low intensities are to be measured
Thermionic emission is an important source of dark current this thermal dark current is temperature dependent
Therefore, cooling the photomultiplier tube reduces dark current (‐40 oC is sufficient to eliminate the thermal component of dark current for most photocathodes
Smaller w higher dark current (smaller W’s are associated with photocathodes that respond at longer λ’s i.e. red sensitive cathodes) low energy photons
If photocathode is exposed to bright daylight without power, it traps energy and it takes 24 – 48 hrs in the dark with high voltage on in order for dark current to go back to equilibrium value
Long term exposures to bright light leads to sensitivity loss particularly at longer λ
Noise – due to random fluctuations in:1) Electron current (shot noise)2) Thermal motion of conducting electrons in the load
resistor (Johnson noise)3) Incident photon flux (quantum noise) – flux of
photons varies statistically
Advantages of PMTs1) Stable except after exposure to high light levels2) Sensitive3) Linear over several orders of magnitude4) Reasonable cost
1) Simple PMT for visible region = $2002) Quartz jacketed PMT for UV & red sensitive tubes for
near IR can be more expensive5) Long lifetime6) Rapid response (on the order of nanoseconds)IR detectors not nearly as good as PMTs
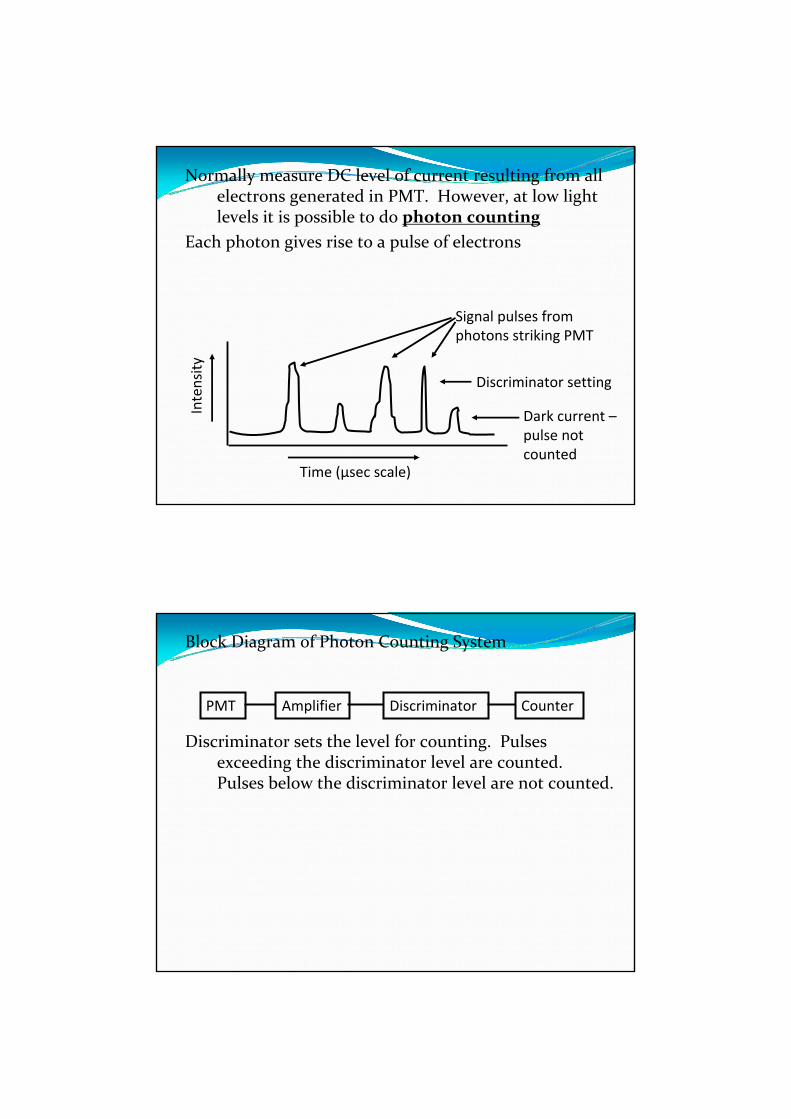
Normally measure DC level of current resulting from all electrons generated in PMT. However, at low light levels it is possible to do photon counting
Each photon gives rise to a pulse of electrons
Intensity
Time (µsec scale)
Discriminator setting
Dark current –pulse notcounted
Signal pulses fromphotons striking PMT
Block Diagram of Photon Counting System
Discriminator sets the level for counting. Pulses exceeding the discriminator level are counted. Pulses below the discriminator level are not counted.
PMT Amplifier Discriminator Counter
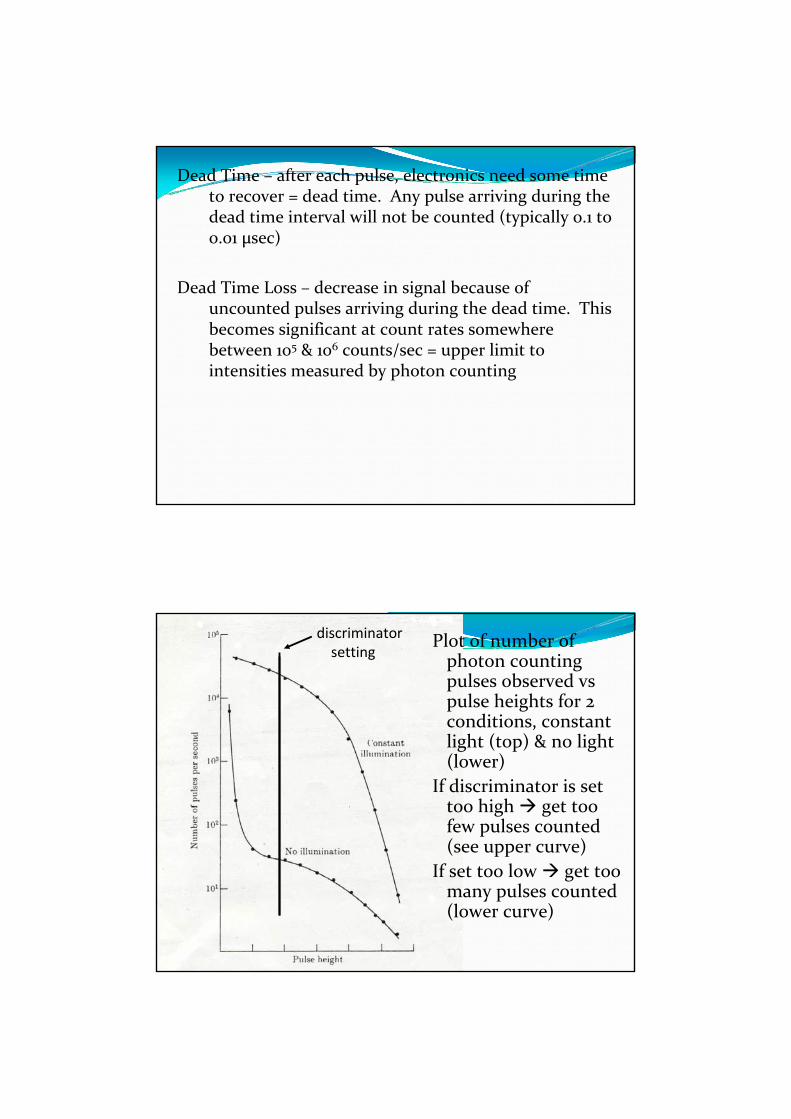
Dead Time – after each pulse, electronics need some time to recover = dead time. Any pulse arriving during the dead time interval will not be counted (typically 0.1 to 0.01 µsec)
Dead Time Loss – decrease in signal because of uncounted pulses arriving during the dead time. This becomes significant at count rates somewhere between 105 & 106 counts/sec = upper limit to intensities measured by photon counting
Plot of number of photon counting pulses observed vs pulse heights for 2 conditions, constant light (top) & no light (lower)
If discriminator is set too high get too few pulses counted (see upper curve)
If set too low get too many pulses counted (lower curve)
discriminatorsetting
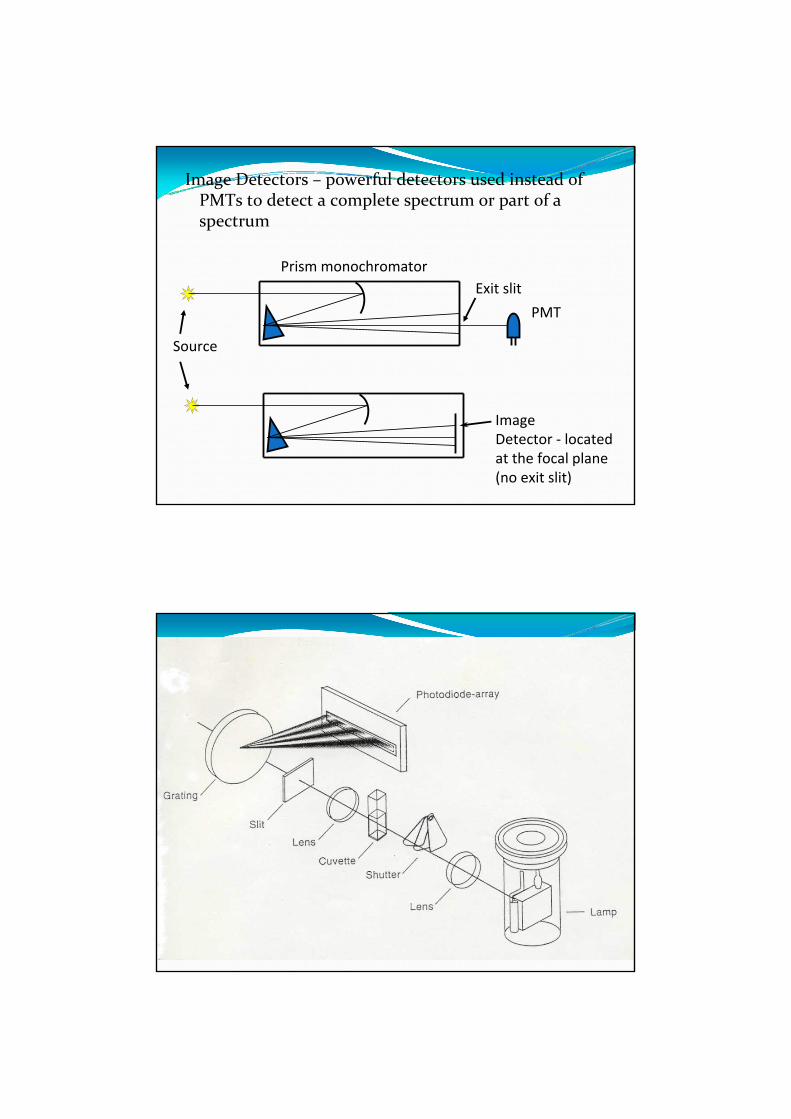
Image Detectors – powerful detectors used instead of PMTs to detect a complete spectrum or part of a spectrum
PMT
Source
Prism monochromator
ImageDetector ‐ locatedat the focal plane(no exit slit)
Exit slit
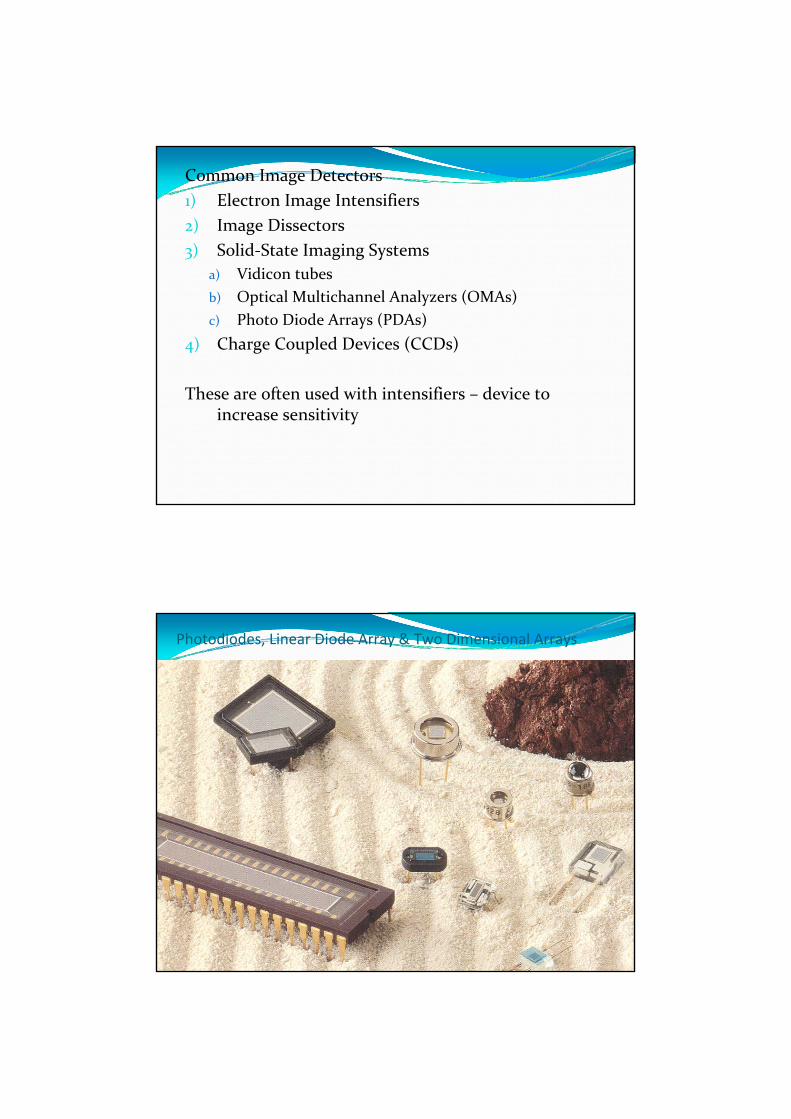
Common Image Detectors1) Electron Image Intensifiers2) Image Dissectors3) Solid‐State Imaging Systems
a) Vidicon tubesb) Optical Multichannel Analyzers (OMAs)c) Photo Diode Arrays (PDAs)
4) Charge Coupled Devices (CCDs)
These are often used with intensifiers – device to increase sensitivity
Photodiodes, Linear Diode Array & Two Dimensional Arrays
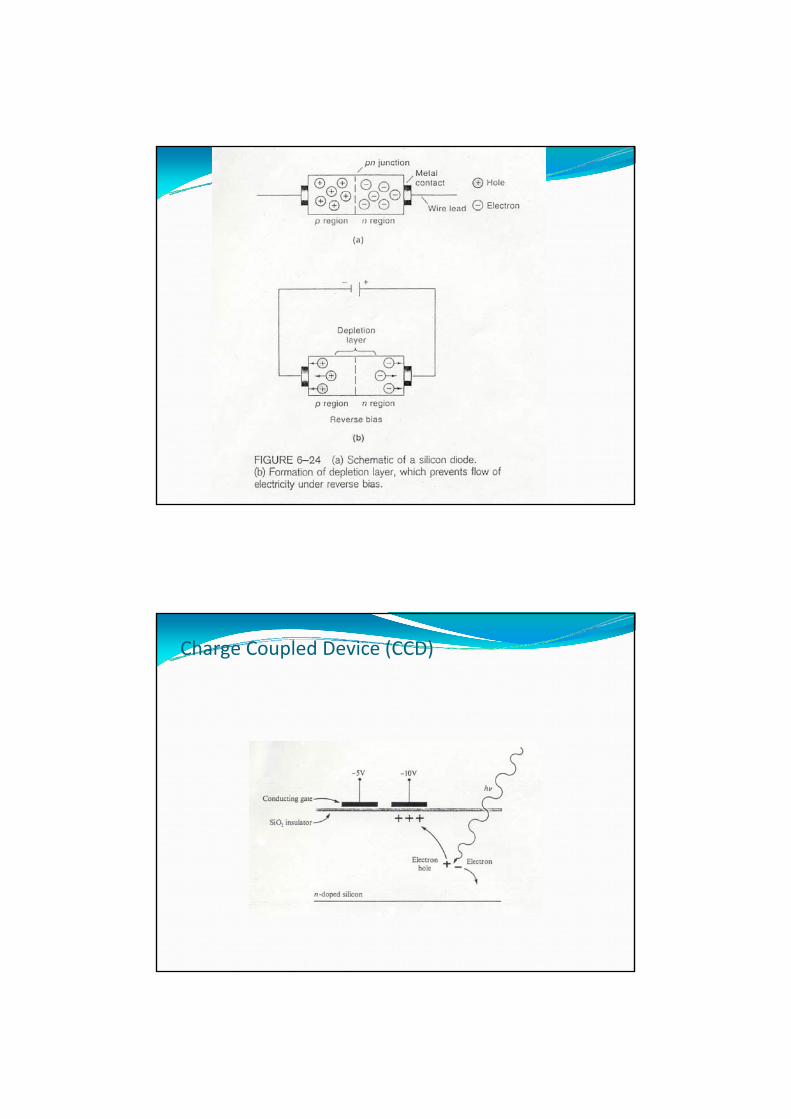
Charge Coupled Device (CCD)

Photovoltaic Cell
Light excites electrons in Se at Se‐Ag interface into “conduction band” and to metal conductor current
Good only for high light levelsSubject to fatigue effects
A
thin layer of Ag
seleniumsemiconductoriron or copper
hν
ammeter
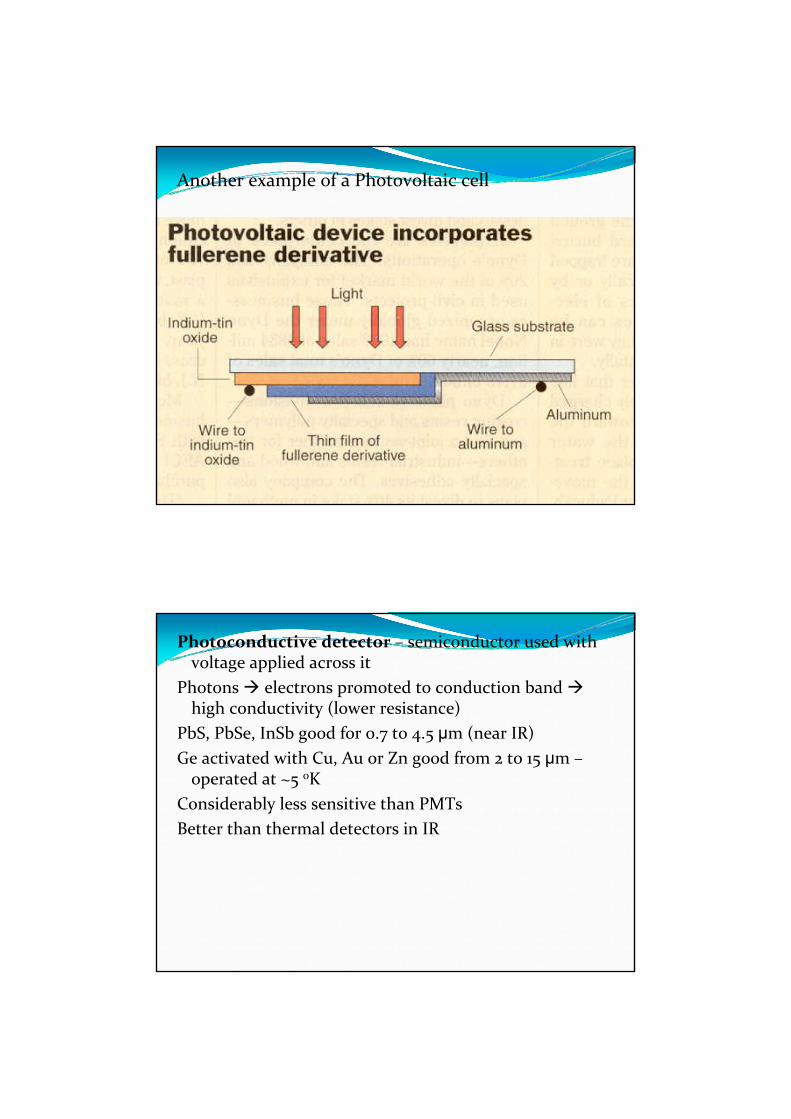
Another example of a Photovoltaic cell
Photoconductive detector – semiconductor used with voltage applied across it
Photons electrons promoted to conduction band high conductivity (lower resistance)
PbS, PbSe, InSb good for 0.7 to 4.5 μm (near IR)Ge activated with Cu, Au or Zn good from 2 to 15 μm –operated at ~5 oK
Considerably less sensitive than PMTsBetter than thermal detectors in IR
Photographic detection – place film at focal plane and expose (integrating detector)
Advantages:1) good resolution2) fairly sensitive3) covers entire spectral region
Disadvantages:1) very old technique2) quantitatively very bad (can use densitometer)
Thermal Detectors for IR – in IR region photons have lower energies necessary to resort to thermal detectors – radiation absorbed and temperature change is detected
Response time is limited by rate of heat transfer slowSensitivity is also much poorer
Three types of thermal detectors:1) Thermocouples (most common) – junction
between dissimilar metals often covered with black substance to increase absorption
Voltage difference across junction is a function of temperature
Amplify signal and detectResponse time ~60 msec (i.e. slow)Sensitivity is greater using a thermopile = a bundle of
many thermocouples
2) Bolometer (thermistor) – resistance is a function of temperature
Different kinds Ni or Pt metal or oxides like NiO, CoO or MnO
Many have black coating on side toward source and a heat shield around them
Typically connected to a bridge circuit Johnson noise is importantRequires stable power supply
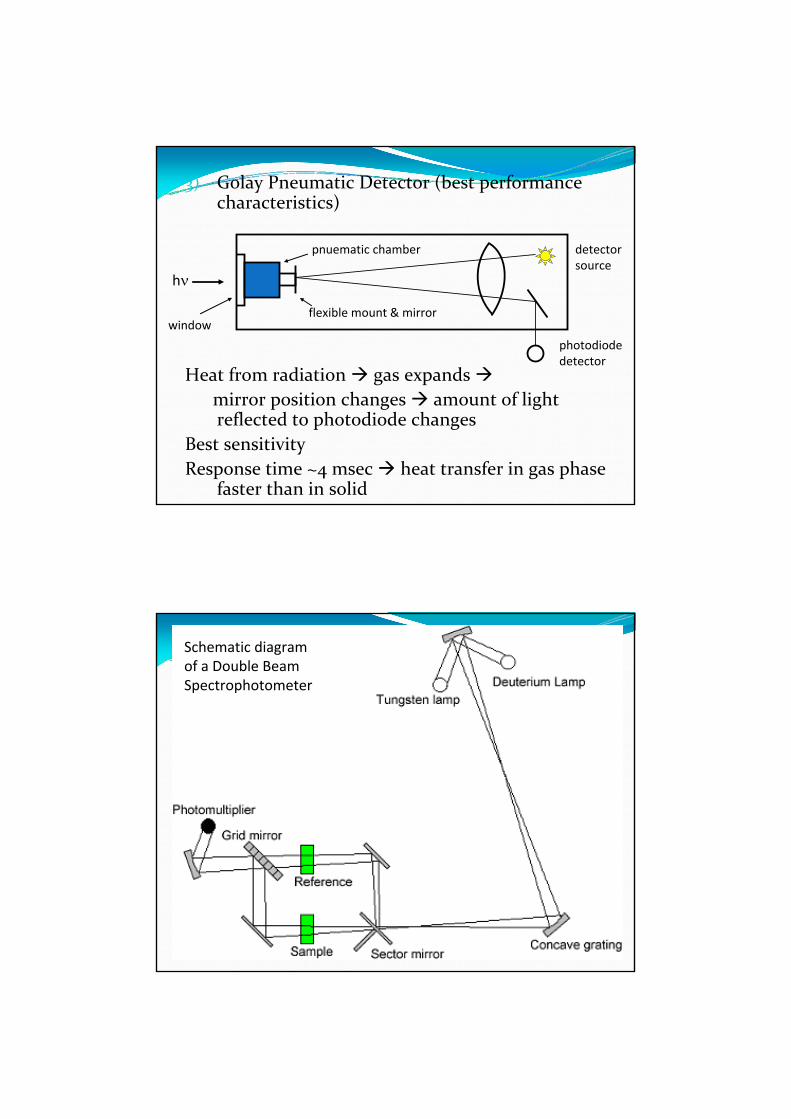
3) Golay Pneumatic Detector (best performance characteristics)
Heat from radiation gas expands mirror position changes amount of light reflected to photodiode changes
Best sensitivityResponse time ~4 msec heat transfer in gas phase
faster than in solid
hν
window
pnuematic chamber
flexible mount & mirror
photodiodedetector
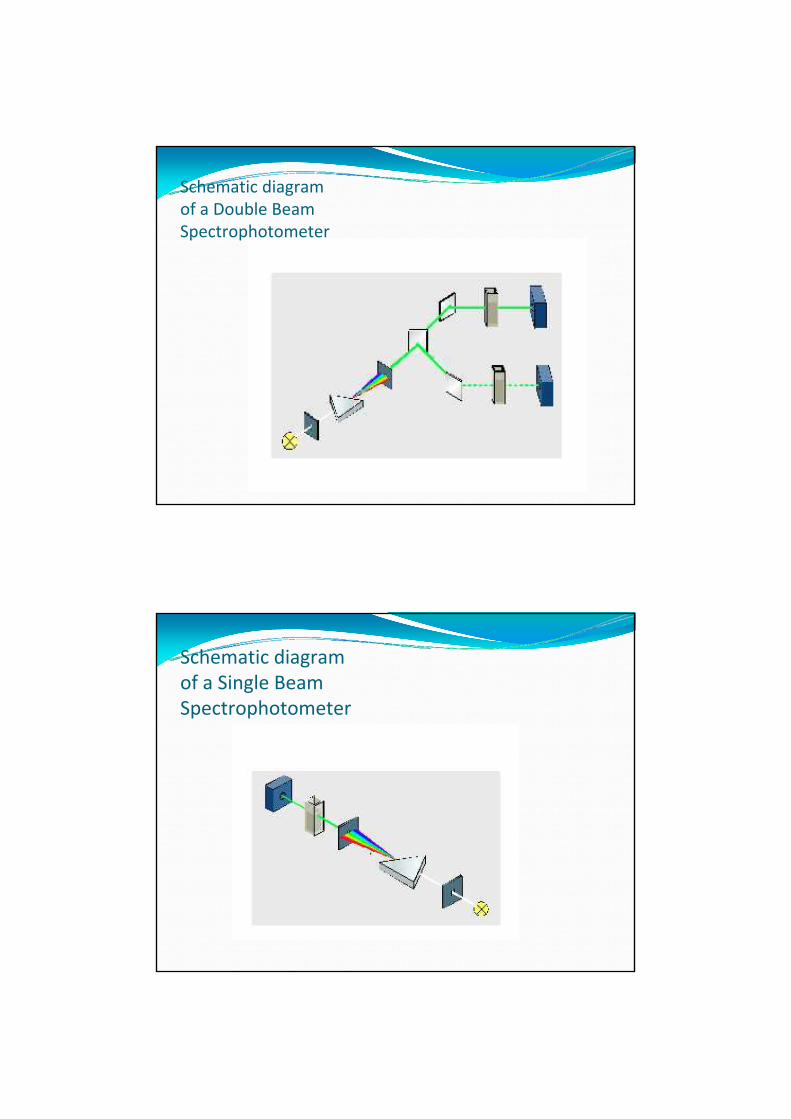
detectorsource
Schematic diagramof a Double BeamSpectrophotometer
Schematic diagramof a Double BeamSpectrophotometer
Schematic diagramof a Single BeamSpectrophotometer
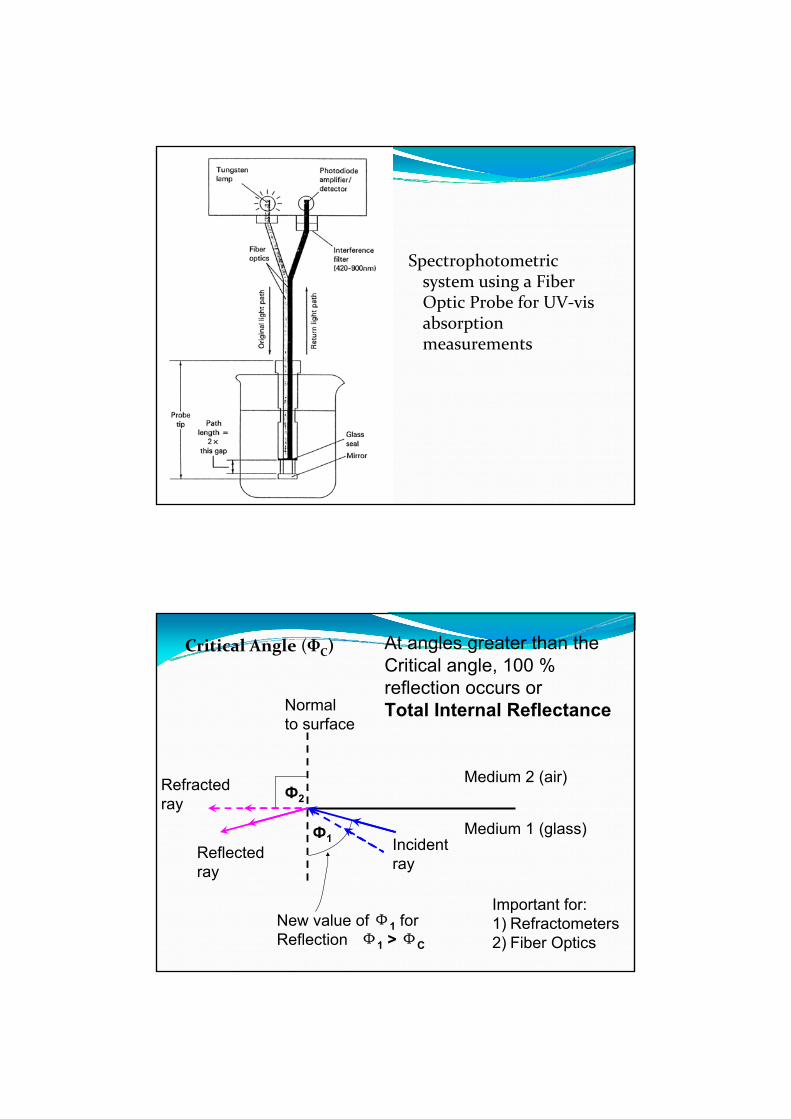
Spectrophotometric system using a Fiber Optic Probe for UV‐vis absorption measurements
Critical Angle (ФC)
Normalto surface
Medium 2 (air)
Medium 1 (glass)
Ф2
Ф1 Incidentray
New value of Ф1 forReflection Ф1 > ФC
At angles greater than the Critical angle, 100 % reflection occurs orTotal Internal Reflectance
Important for:1) Refractometers2) Fiber Optics
Refractedray
Reflectedray
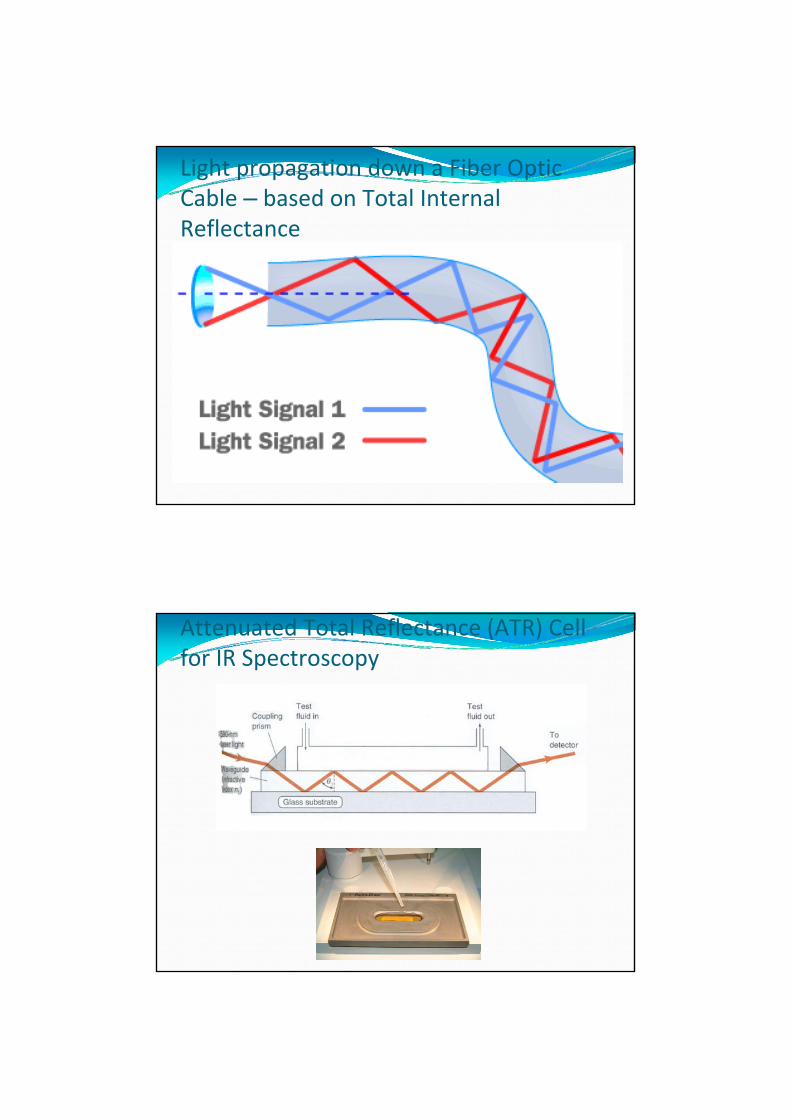
Light propagation down a Fiber Optic Cable – based on Total Internal Reflectance
Attenuated Total Reflectance (ATR) Cell for IR Spectroscopy
HW37-97-127-137-167-177-187-227-23