banwell and mccash chapter 4 skoog, holler nieman …be/ps415/raman-04.pdf · raman spectroscopy...
TRANSCRIPT
Raman SpectroscopyRaman Spectroscopy
Applied Spectroscopy
Recommended Reading:Banwell and McCash Chapter 4
Skoog, Holler Nieman Chapter 18
Atkins, Chapter 16
Inelastic scattering of light is sometimes called the Raman effect, named after its discoverer, the
Indian scientist
C V Raman
Raman won the Nobel prize in 1930 for his discovery, accomplished using filtered sunlight as a monochromatic source of photons, a coloredfilter as a monochromator, and a human eye as detector. The technique became widely used after the invention of the laser.
http://www.fact-index.com/r/ra/raman_spectroscopy.html
Raman SpectroscopyRaman SpectroscopyWhat is it? Raman Spectroscopy determines vibrational and rotational level spacings from the energy (wavenumber) shifts of scattered light.
How do we do it it? Molecular transition energies are observed by measuring the shifts in frequency of light scattered when a molecule is subjected to an intense beam of monochromatic light.
Why we do it it? Previously we noted that molecules with no permanent dipole moment would have no pure rotational spectrum, and that molecular vibrational motion for which there was no oscillation dipole would have no IR absorption or emission spectra. Raman spectroscopy allows us to determine rotational and vibrational level spacings for such systems, and hence to determine bond lengths and force constants for such molecules. That is we can use Raman spectroscopy to study H2, O2, N2 ….
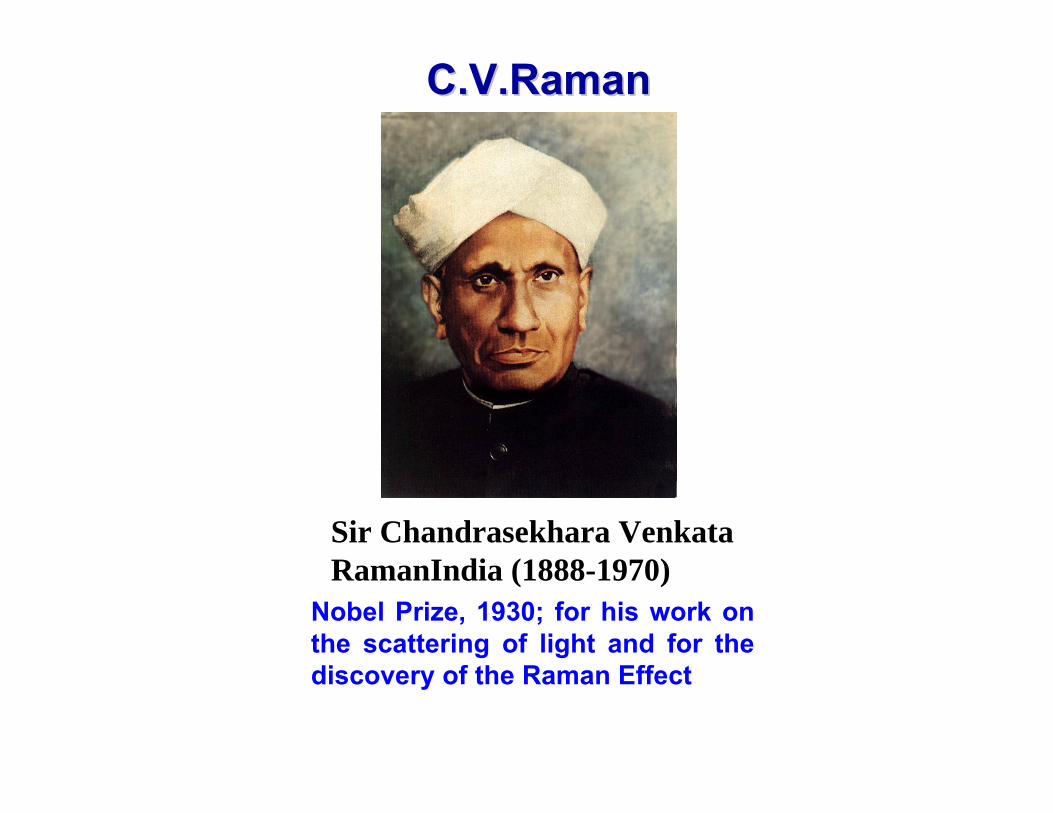
C.V.RamanC.V.Raman
Sir Chandrasekhara Venkata RamanIndia (1888-1970)
Nobel Prize, 1930; for his work on the scattering of light and for the discovery of the Raman Effect
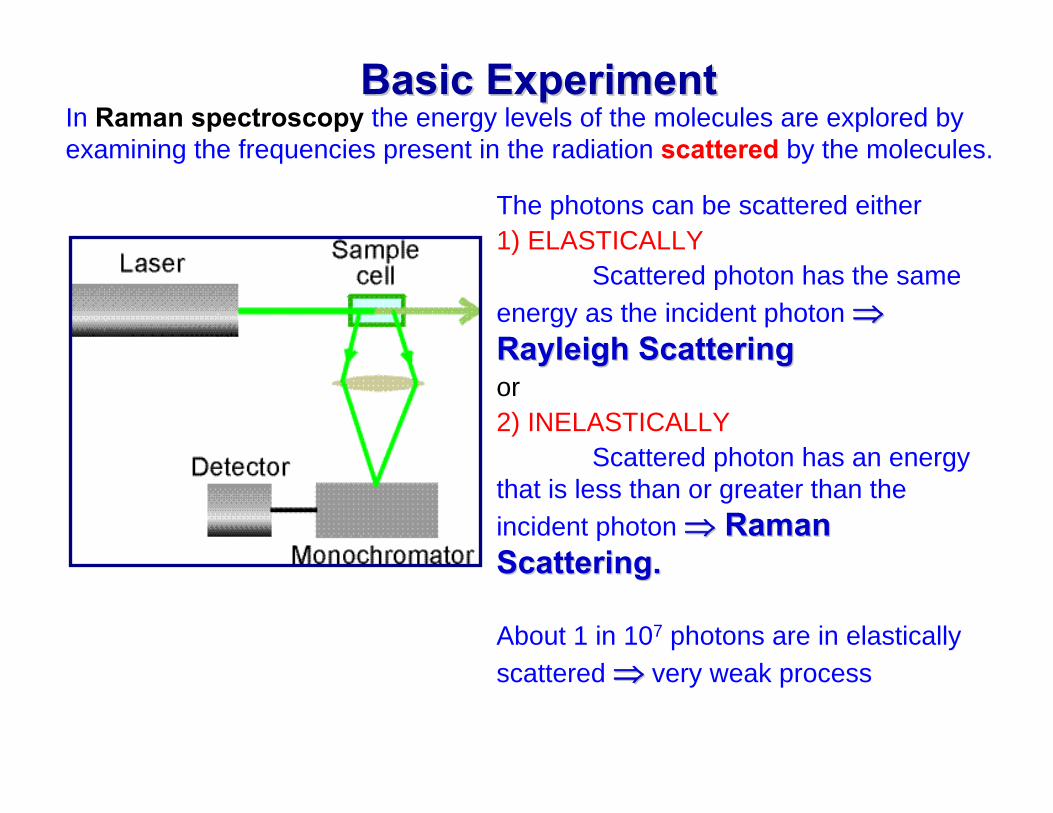
Basic ExperimentBasic ExperimentIn Raman spectroscopy the energy levels of the molecules are explored by examining the frequencies present in the radiation scattered by the molecules.
The photons can be scattered either1) ELASTICALLY
Scattered photon has the same energy as the incident photon ⇒⇒Rayleigh Rayleigh ScatteringScatteringor2) INELASTICALLY
Scattered photon has an energy that is less than or greater than the incident photon ⇒⇒ Raman Raman Scattering.Scattering.
About 1 in 107 photons are in elastically scattered ⇒⇒ very weak process
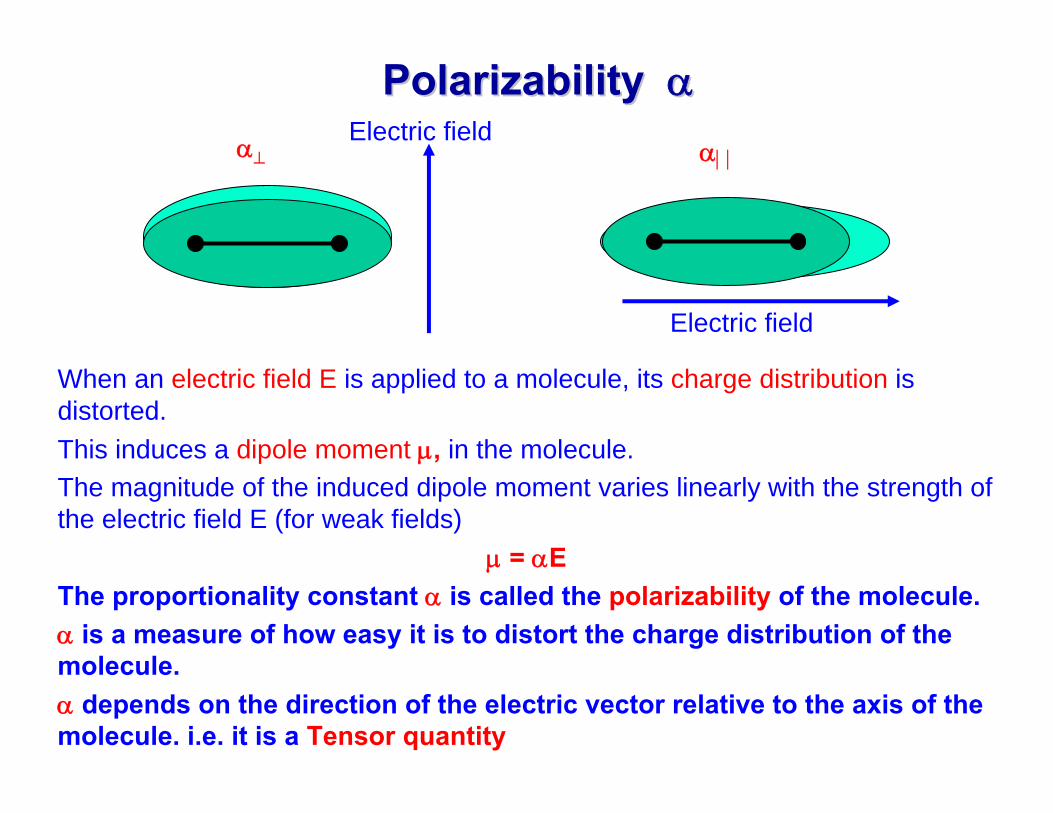
Polarizability Polarizability ααElectric field
Electric field
When an electric field E is applied to a molecule, its charge distribution is distorted. This induces a dipole moment μ, in the molecule. The magnitude of the induced dipole moment varies linearly with the strength of the electric field E (for weak fields)
μ = αEThe proportionality constant α is called the polarizability of the molecule.α is a measure of how easy it is to distort the charge distribution of the molecule.α depends on the direction of the electric vector relative to the axis of the molecule. i.e. it is a Tensor quantity
α⊥ α⏐⏐
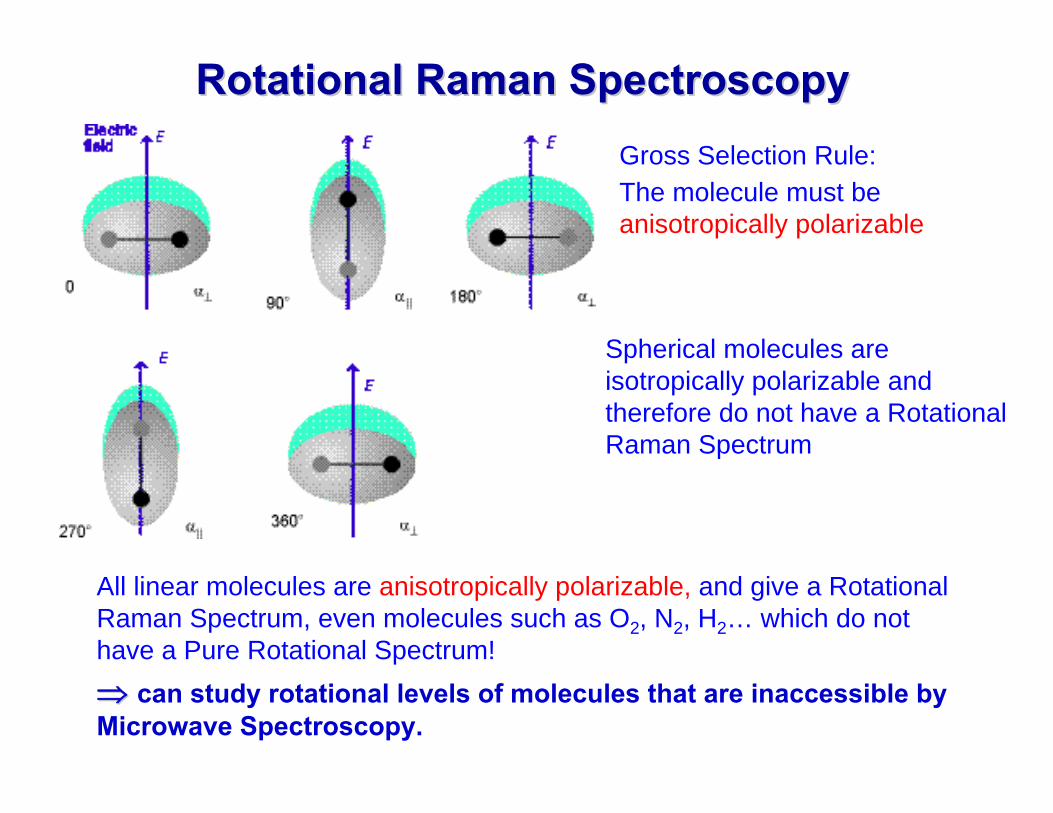
Rotational Raman SpectroscopyRotational Raman SpectroscopyGross Selection Rule: The molecule must be anisotropically polarizable
Spherical molecules are isotropically polarizable and therefore do not have a RotationalRaman Spectrum
All linear molecules are anisotropically polarizable, and give a Rotational Raman Spectrum, even molecules such as O2, N2, H2… which do not have a Pure Rotational Spectrum!
⇒⇒ can study rotational levels of molecules that are inaccessible by Microwave Spectroscopy.
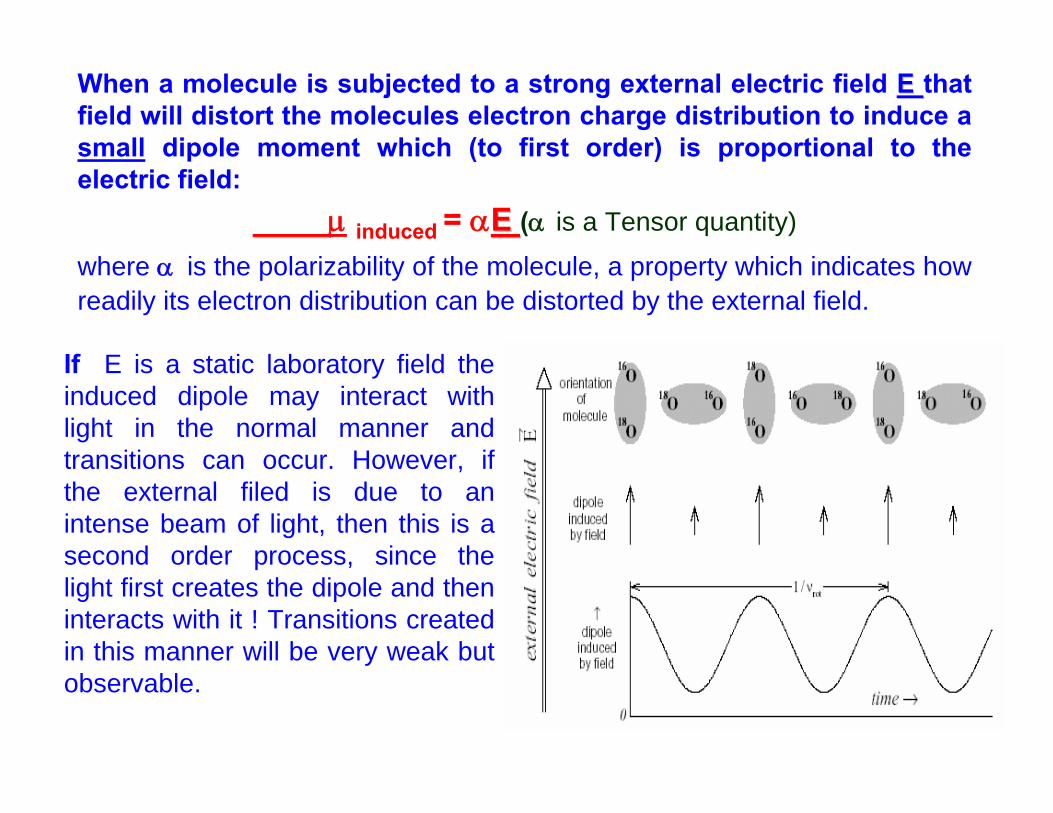
When a molecule is subjected to a strong external electric field E E that field will distort the molecules electron charge distribution to induce a small dipole moment which (to first order) is proportional to the electric field:
μ induced = αEE (α is a Tensor quantity)
where α is the polarizability of the molecule, a property which indicates how readily its electron distribution can be distorted by the external field.
If E is a static laboratory field the induced dipole may interact with light in the normal manner and transitions can occur. However, if the external filed is due to an intense beam of light, then this is a second order process, since the light first creates the dipole and then interacts with it ! Transitions created in this manner will be very weak but observable.
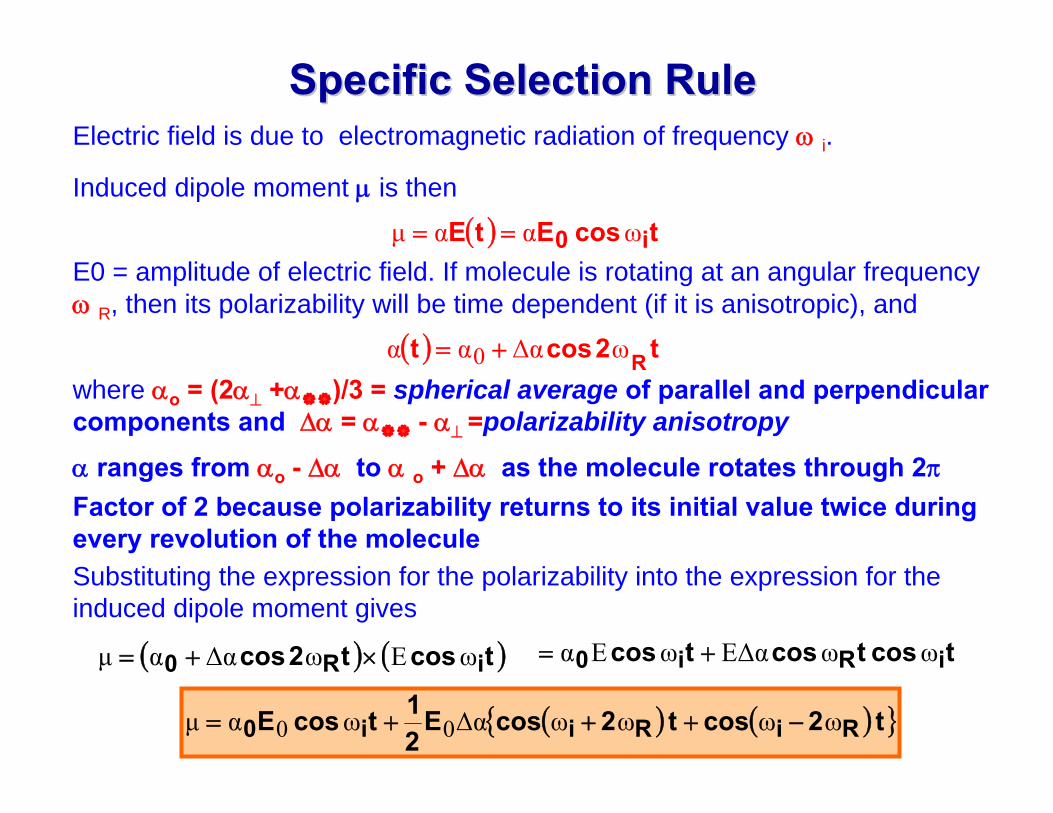
Electric field is due to electromagnetic radiation of frequency ω i.
Specific Selection RuleSpecific Selection Rule
Induced dipole moment μ is then
( ) tcosEtE i0 ωααμ ==E0 = amplitude of electric field. If molecule is rotating at an angular frequency ω R, then its polarizability will be time dependent (if it is anisotropic), and
( ) t2cost RωΔααα 0 +=
where αo = (2α⊥ +α )/3 = spherical average of parallel and perpendicular components and Δα = α - α⊥ =polarizability anisotropy
α ranges from αo - Δα to α o + Δα as the molecule rotates through 2πFactor of 2 because polarizability returns to its initial value twice during every revolution of the moleculeSubstituting the expression for the polarizability into the expression for the induced dipole moment gives
( ) ( )tcost2cos iR0 ωΕωΔααμ ×+= tcostcostcos iRi0 ωωΕΔαωΕα +=
( ) ( ){ }t 2cost 2cosE21tcosE RiRii0 ωωωωΔαωαμ 00 −+++=
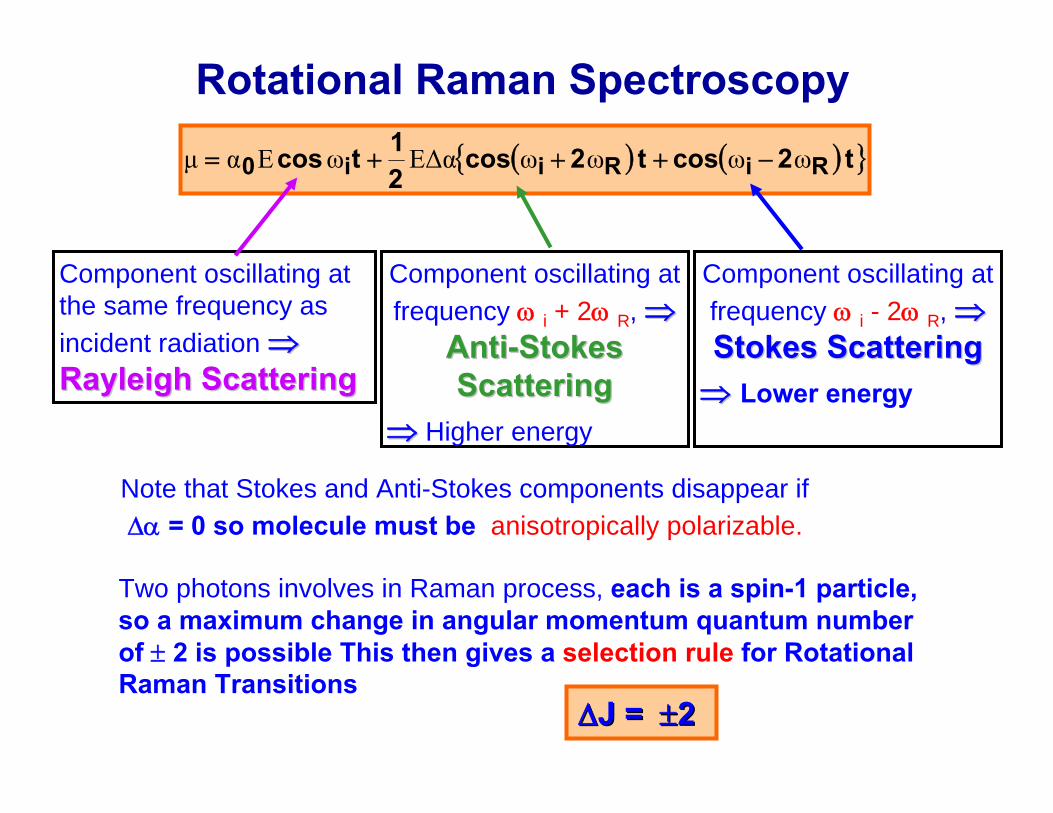
Component oscillating at the same frequency as incident radiation ⇒⇒Rayleigh Rayleigh ScatteringScattering
Rotational Raman Spectroscopy( ) ( ){ }t 2cost 2cos
21tcos RiRii0 ωωωωΕΔαωΕαμ −+++=
Note that Stokes and Anti-Stokes components disappear if Δα = 0 so molecule must be anisotropically polarizable.
Component oscillating at frequency ω i + 2ω R, ⇒⇒
AntiAnti--Stokes Stokes ScatteringScattering
⇒⇒ Higher energy
Component oscillating at frequency ω i - 2ω R, ⇒⇒Stokes ScatteringStokes Scattering
⇒⇒ Lower energy
Two photons involves in Raman process, each is a spin-1 particle, so a maximum change in angular momentum quantum number of ± 2 is possible This then gives a selection rule for Rotational Raman Transitions
ΔΔJ = J = ± ±22
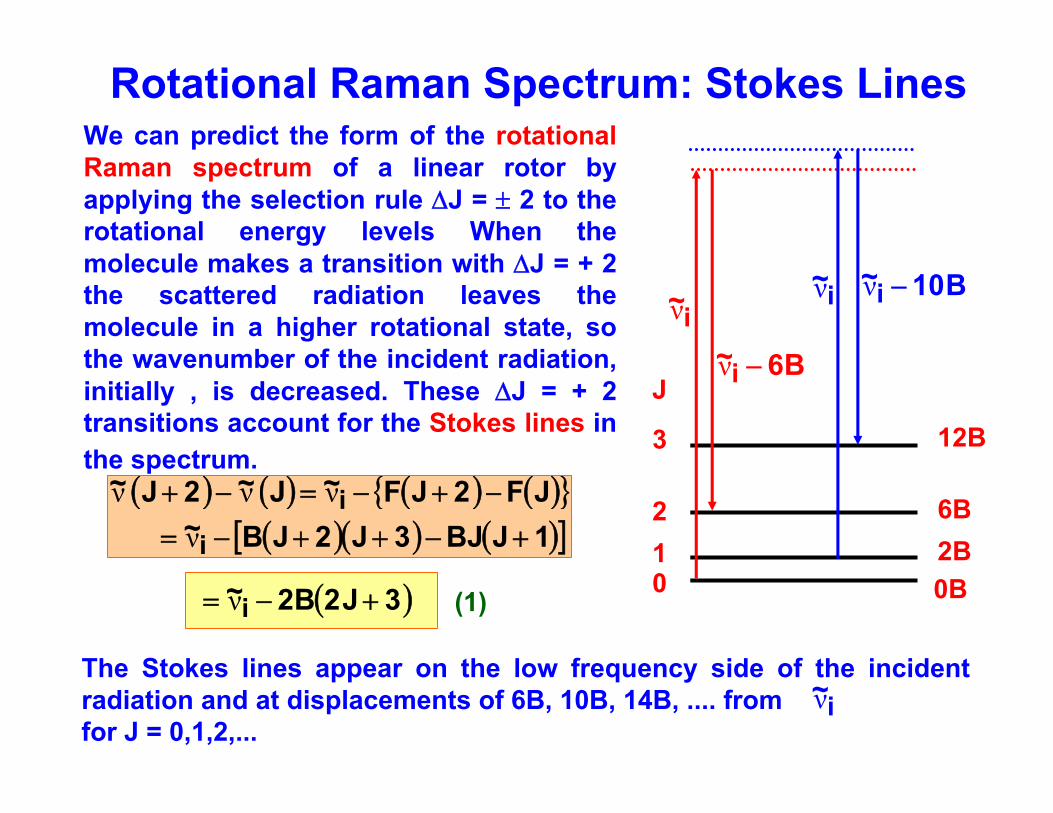
We can predict the form of the rotational Raman spectrum of a linear rotor by applying the selection rule ΔJ = ± 2 to the rotational energy levels When the molecule makes a transition with ΔJ = + 2 the scattered radiation leaves the molecule in a higher rotational state, so the wavenumber of the incident radiation, initially , is decreased. These ΔJ = + 2 transitions account for the Stokes lines in the spectrum.
Rotational Raman Spectrum: Stokes Lines
( ) ( ) ( ) ( ){ }( )( ) ( )[ ]1JBJ3J2JB~
JF2JF~J ~2J ~
ii
+−++−=
−+−=−+
νννν
( ) 3J2B2~i +−= ν
3
210
12B
6B2B
J
0B
~iν
B6~i −ν
~iν B10~i −ν
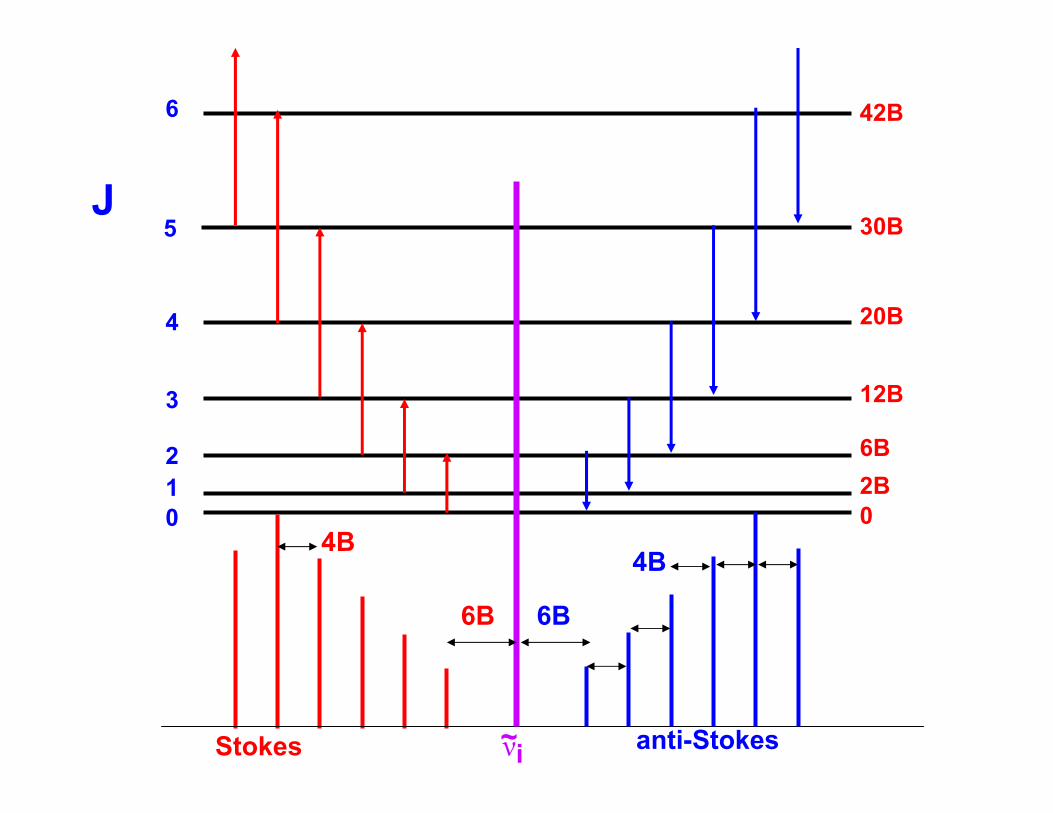
The Stokes lines appear on the low frequency side of the incident radiation and at displacements of 6B, 10B, 14B, .... from for J = 0,1,2,...
~iν
(1)
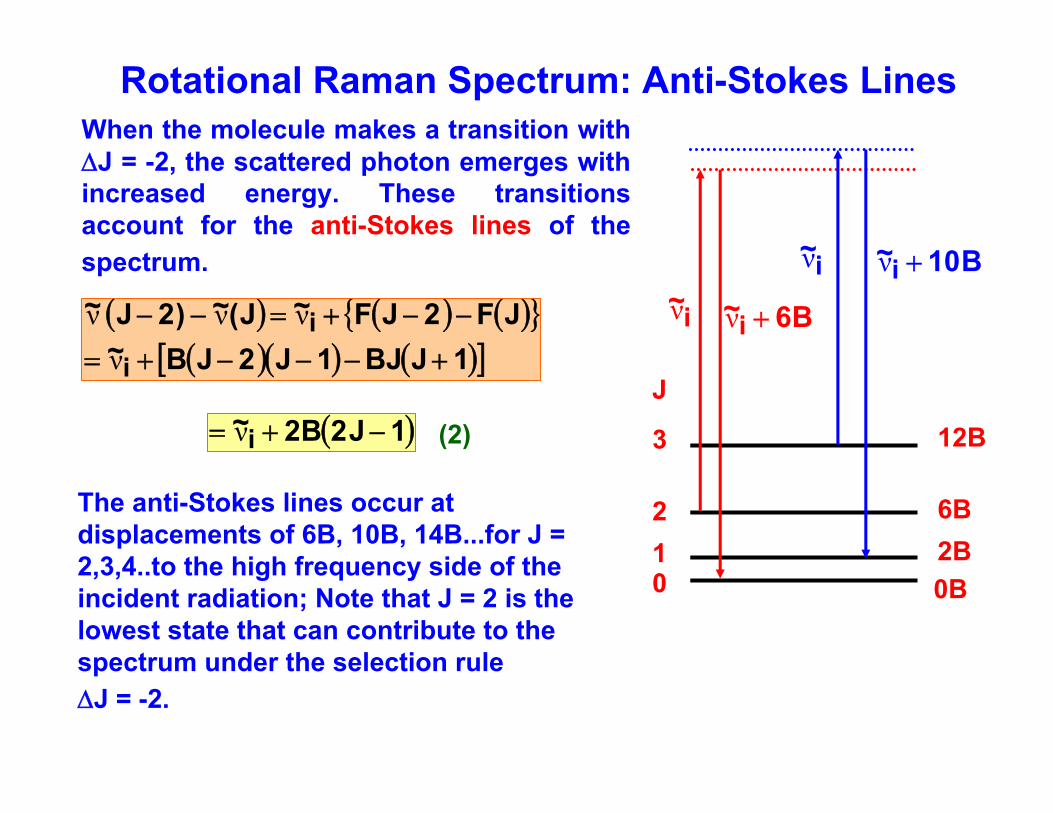
When the molecule makes a transition with ΔJ = -2, the scattered photon emerges with increased energy. These transitions account for the anti-Stokes lines of the spectrum.
Rotational Raman Spectrum: Anti-Stokes Lines
( ) ( ) ( ){ }( )( ) ( )[ ]1JBJ1J2JB~
JF2JF~J(~)2J ~
ii
+−−−+=
−−+=−−
νννν
( )1J2B2~i −+= ν 3
210
12B
6B2B
J
0B
~iν B6~i +ν
~iν B10~i +ν
The anti-Stokes lines occur at displacements of 6B, 10B, 14B...for J = 2,3,4..to the high frequency side of the incident radiation; Note that J = 2 is the lowest state that can contribute to the spectrum under the selection rule ΔJ = -2.
(2)
5
4
3
210
6
30B
20B
12B
6B2B0
42B
J
~iν anti-StokesStokes
6B 6B
4B4B
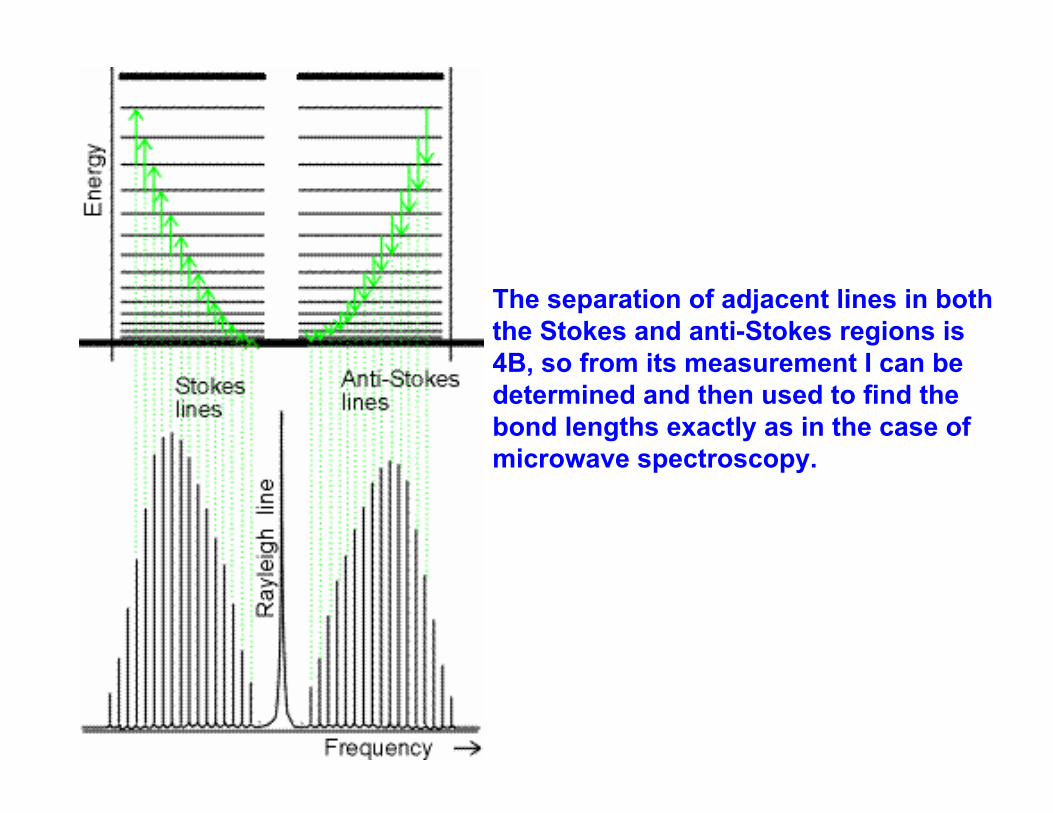
The separation of adjacent lines in both the Stokes and anti-Stokes regions is 4B, so from its measurement I can be determined and then used to find the bond lengths exactly as in the case of microwave spectroscopy.
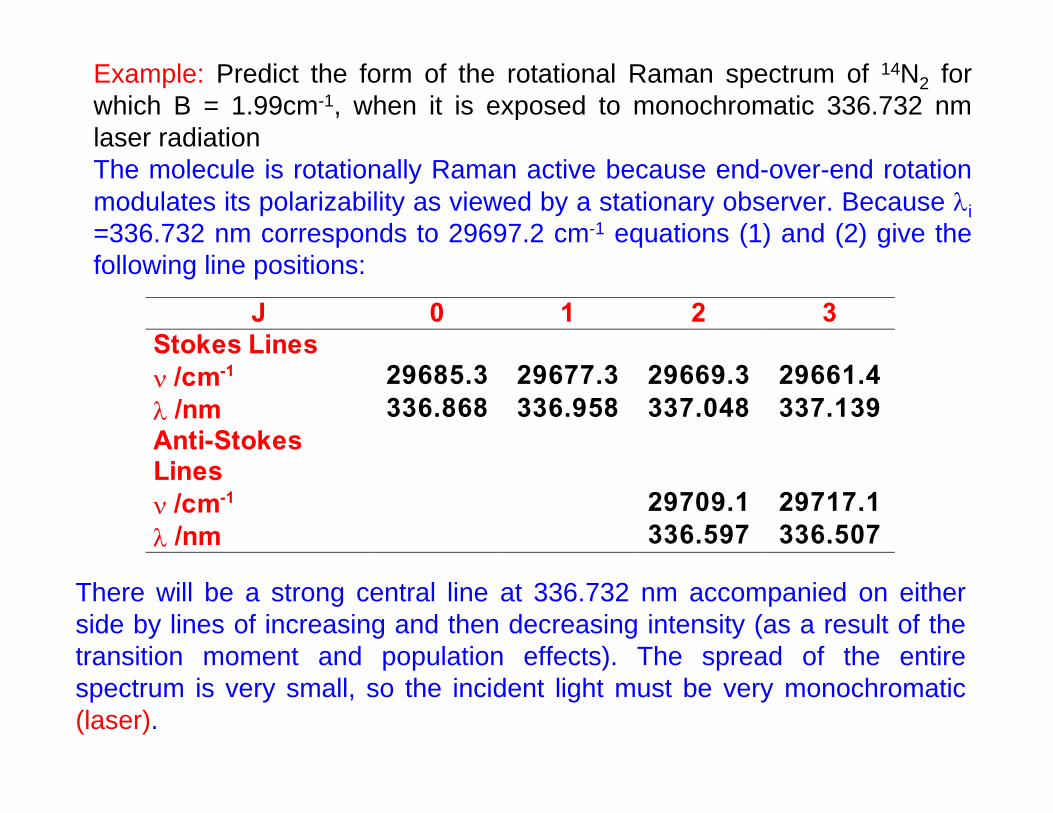
J 0 1 2 3Stokes Linesν /cm-1 29685.3 29677.3 29669.3 29661.4λ /nm 336.868 336.958 337.048 337.139Anti-StokesLinesν /cm-1 29709.1 29717.1λ /nm 336.597 336.507
Example: Predict the form of the rotational Raman spectrum of 14N2 for which B = 1.99cm-1, when it is exposed to monochromatic 336.732 nm laser radiation The molecule is rotationally Raman active because end-over-end rotation modulates its polarizability as viewed by a stationary observer. Because λi=336.732 nm corresponds to 29697.2 cm-1 equations (1) and (2) give the following line positions:
There will be a strong central line at 336.732 nm accompanied on either side by lines of increasing and then decreasing intensity (as a result of the transition moment and population effects). The spread of the entire spectrum is very small, so the incident light must be very monochromatic (laser).
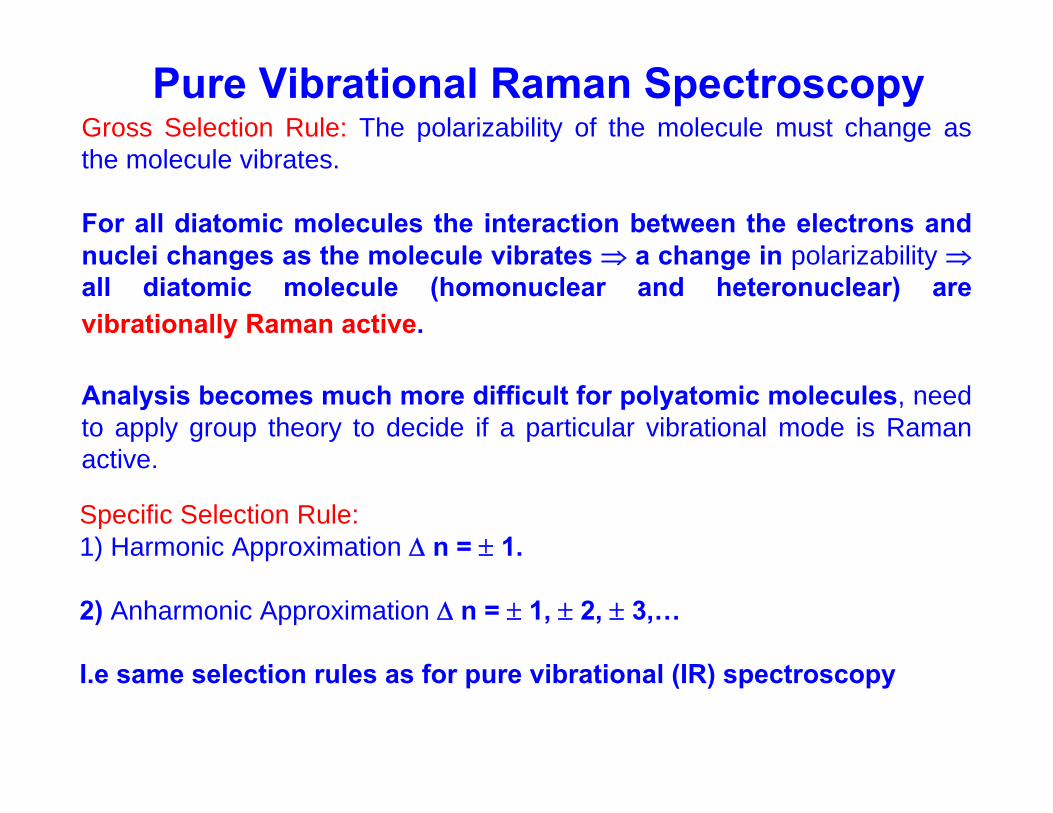
Pure Vibrational Raman SpectroscopyGross Selection Rule: The polarizability of the molecule must change as the molecule vibrates.
For all diatomic molecules the interaction between the electrons and nuclei changes as the molecule vibrates ⇒ a change in polarizability ⇒all diatomic molecule (homonuclear and heteronuclear) are vibrationally Raman active.
Analysis becomes much more difficult for polyatomic molecules, need to apply group theory to decide if a particular vibrational mode is Raman active.
Specific Selection Rule:1) Harmonic Approximation Δ n = ± 1.
2) Anharmonic Approximation Δ n = ± 1, ± 2, ± 3,…
I.e same selection rules as for pure vibrational (IR) spectroscopy
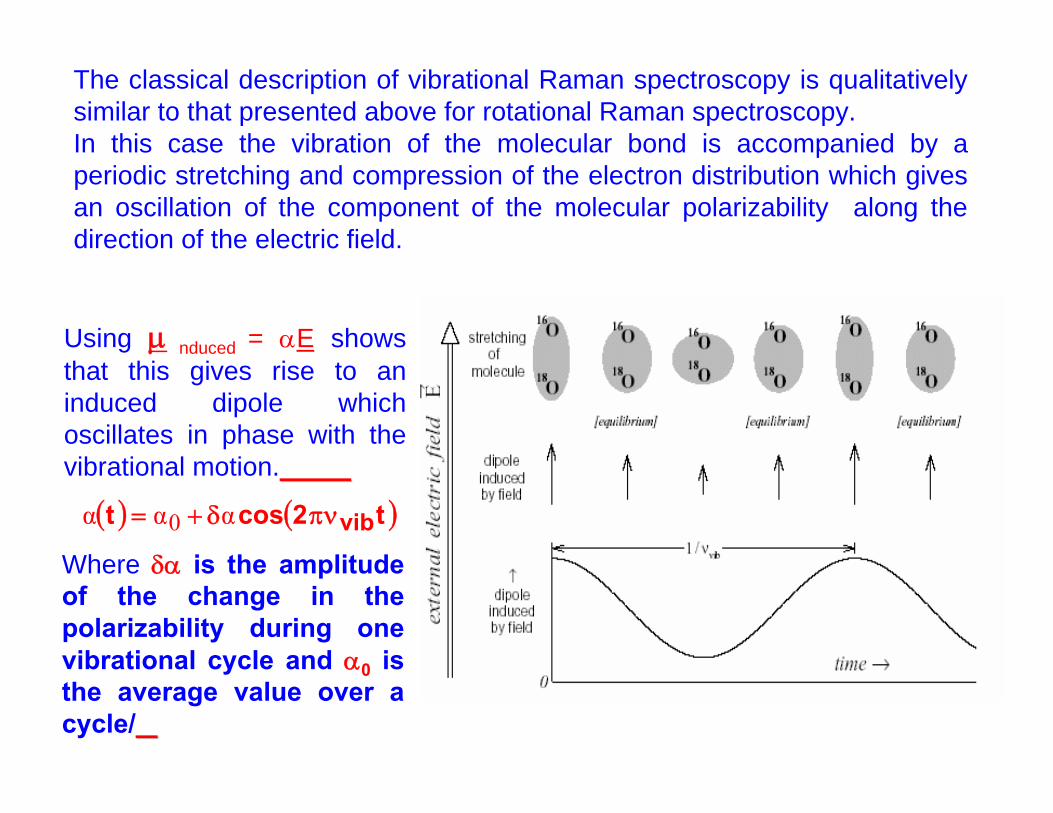
The classical description of vibrational Raman spectroscopy is qualitatively similar to that presented above for rotational Raman spectroscopy. In this case the vibration of the molecular bond is accompanied by a periodic stretching and compression of the electron distribution which gives an oscillation of the component of the molecular polarizability along the direction of the electric field.
Using μ nduced = αE shows that this gives rise to an induced dipole which oscillates in phase with the vibrational motion.
( ) ( )t2cost vibπνδ+= ααα 0
Where δα is the amplitude of the change in the polarizability during one vibrational cycle and α0 is the average value over a cycle/
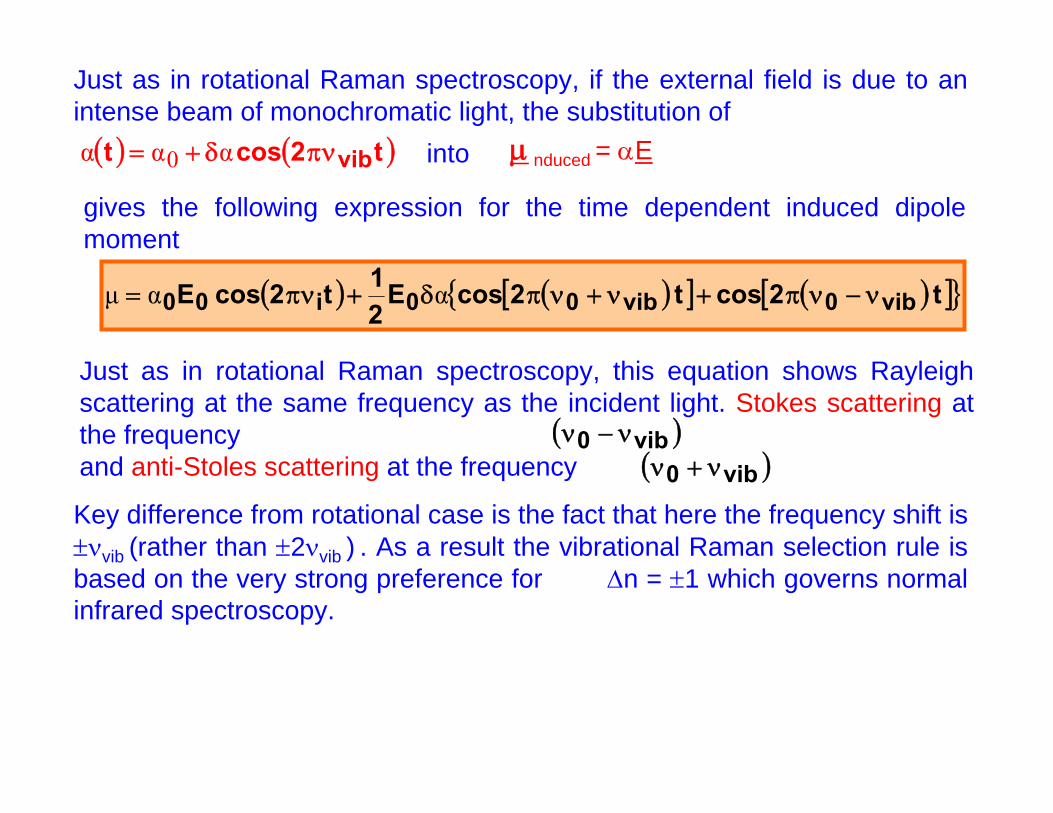
Just as in rotational Raman spectroscopy, if the external field is due to an intense beam of monochromatic light, the substitution of
( ) ( )t2cost vibπνδ+= ααα 0 into μ nduced = αE
gives the following expression for the time dependent induced dipole moment
( ) ( )[ ] ( )[ ]{ }t 2cost 2cosE21t2cosE vib0vib00i00 ν−νπ+ν+νπδ+πν= ααμ
Just as in rotational Raman spectroscopy, this equation shows Rayleigh scattering at the same frequency as the incident light. Stokes scattering at the frequencyand anti-Stoles scattering at the frequency ( )vib0 ν+ν
( )vib0 ν−ν
Key difference from rotational case is the fact that here the frequency shift is ±νvib (rather than ±2νvib ) . As a result the vibrational Raman selection rule is based on the very strong preference for Δn = ±1 which governs normal infrared spectroscopy.
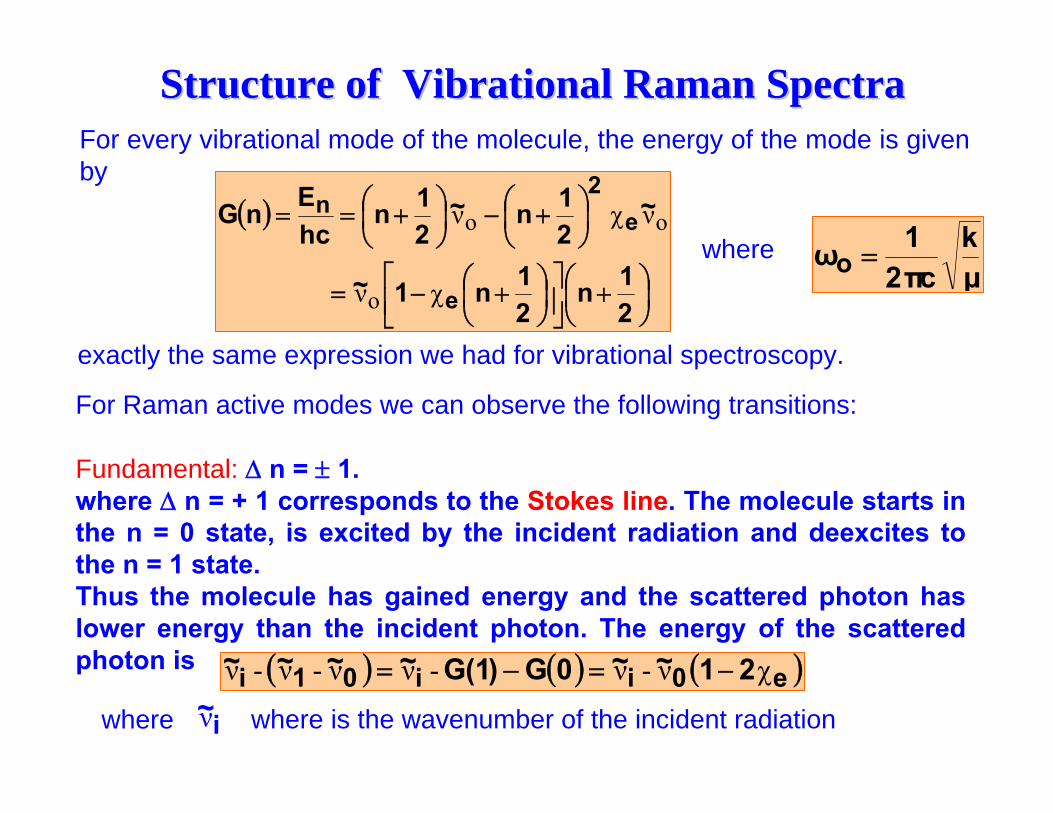
Structure of Structure of VibrationalVibrational Raman SpectraRaman SpectraFor every vibrational mode of the molecule, the energy of the mode is given by
( )
21n
21n1~
~ 21n~
21n
hcEnG
e
e2
n
⎟⎠⎞
⎜⎝⎛ +⎥⎦
⎤⎢⎣⎡
⎟⎠⎞
⎜⎝⎛ +−=
⎟⎠⎞
⎜⎝⎛ +−⎟
⎠⎞
⎜⎝⎛ +==
χν
νχν
o
oowhere
μk
cπ21ωo =
exactly the same expression we had for vibrational spectroscopy.
For Raman active modes we can observe the following transitions:
Fundamental: Δ n = ± 1.where Δ n = + 1 corresponds to the Stokes line. The molecule starts in the n = 0 state, is excited by the incident radiation and deexcites to the n = 1 state. Thus the molecule has gained energy and the scattered photon haslower energy than the incident photon. The energy of the scattered photon is ( ) ( ) ( )e0ii01i 21~~0G)1(G~~~~ χν-ν-νν-ν-ν −=−=
where ~iν where is the wavenumber of the incident radiation
Δ n = - 1 corresponds to the Anti-Stokes line. The molecule starts in the n = 1 vibrational state, is excited by the incident radiation and deexcites to the n = 0 vibrational state. Thus the molecule has lost energy and the scattered photon has higher energy than the incident photon. The energy of the scattered photon is ( ) ( ) ( )e0ii10i 21~~1G)0(G~~~~ χνννν-νν −+=−+=+
However, recall that at room temperature very few molecules are in the n = 1 vibrational state (Boltzmann Distribution). So the Stokes line will be very weak compared to the Anti-Stokes line (often the Stokes line is not observed).
It is possible to determine the temperature of the system from the ratio of the intensity of the Stokes line to the intensity of the AntiStokes line.
Pure Vibrational Raman spectrum is very simple, A series of intense lines to the low wavenumber (frequency, energy) side of the exciting (laser) line with a weaker mirror image series of lines on the high wavenumber side.
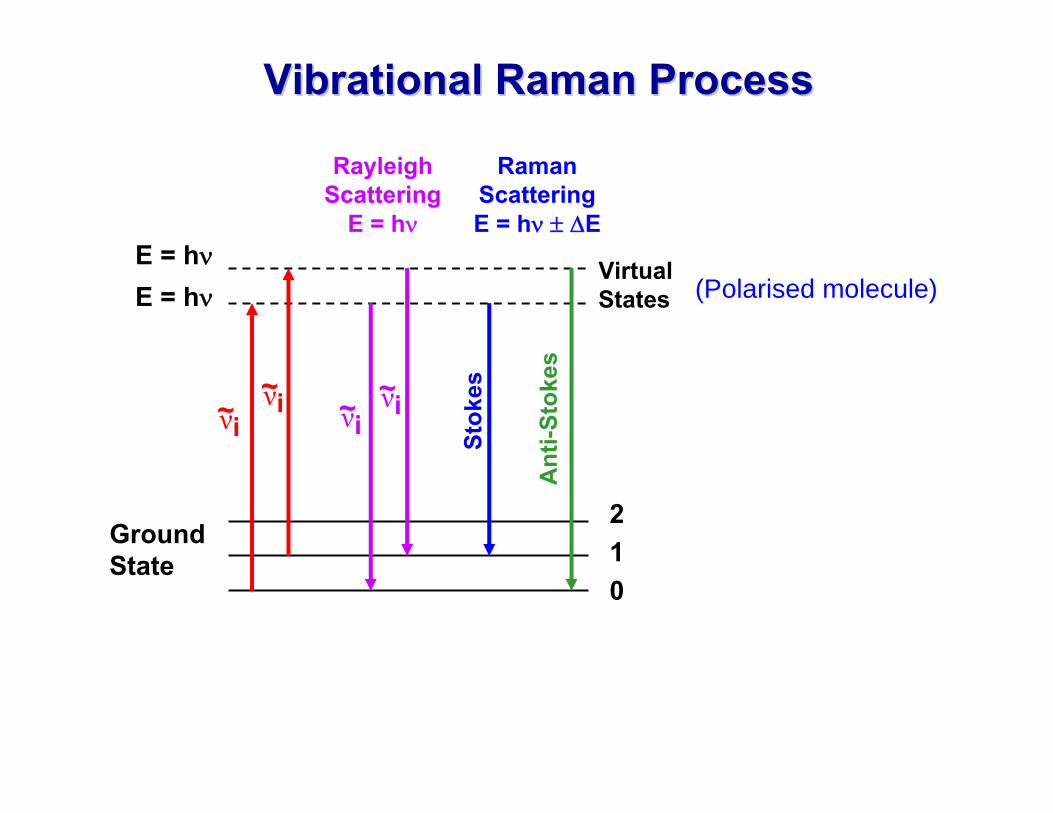
VibrationalVibrational Raman ProcessRaman Process
Ground State
Virtual States
E = hν
012
E = hν
Rayleigh Scattering
E = hν
Raman Scattering E = hν ± ΔE
Stok
es
Ant
i-Sto
kes
(Polarised molecule)
~iν ~iν ~iν ~iν
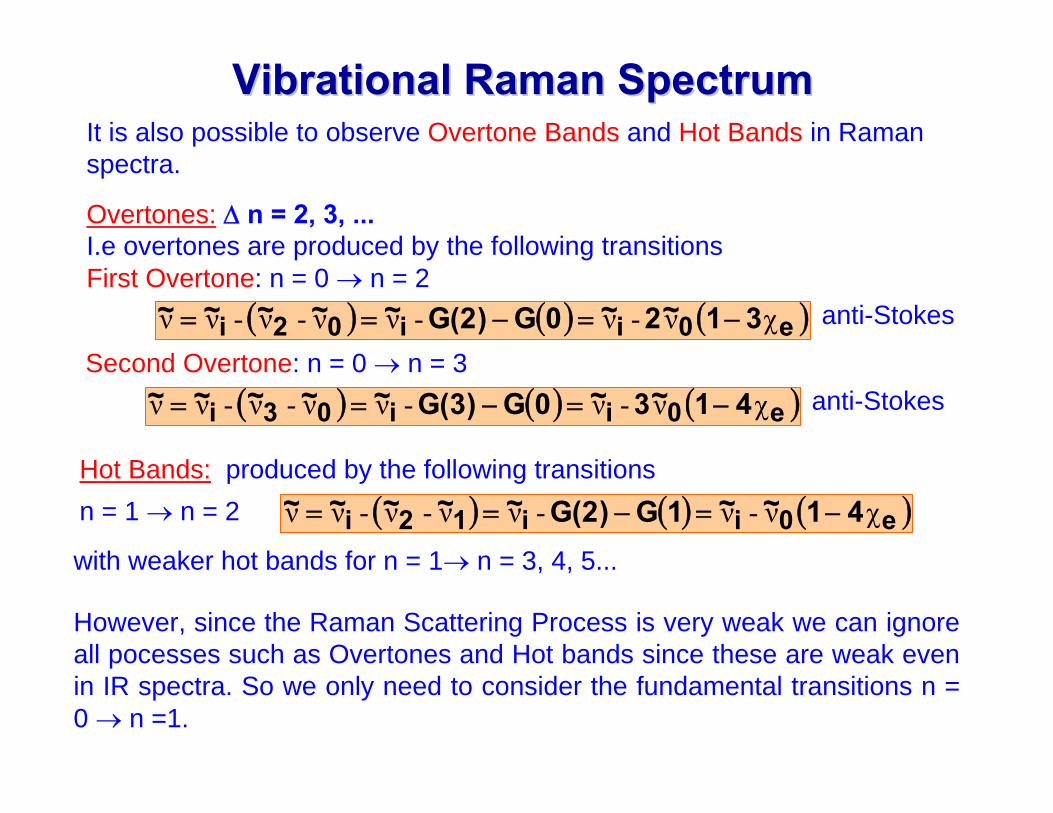
It is also possible to observe Overtone Bands and Hot Bands in Raman spectra.
VibrationalVibrational Raman SpectrumRaman Spectrum
Overtones: Δ n = 2, 3, ...I.e overtones are produced by the following transitionsFirst Overtone: n = 0 → n = 2
( ) ( ) ( )e0ii02i 31~2~0G)2(G~~~~~ χν-ν-νν-ν-νν −=−== anti-Stokes
Second Overtone: n = 0 → n = 3( ) ( ) ( )e0ii03i 41~3~0G)3(G~~~~~ χν-ν-νν-ν-νν −=−== anti-Stokes
Hot Bands: produced by the following transitionsn = 1 → n = 2 ( ) ( ) ( )e0ii12i 41~~1G)2(G~~~~~ χν-ν-νν-ν-νν −=−==
with weaker hot bands for n = 1→ n = 3, 4, 5...
However, since the Raman Scattering Process is very weak we can ignore all pocesses such as Overtones and Hot bands since these are weak even in IR spectra. So we only need to consider the fundamental transitions n = 0 → n =1.
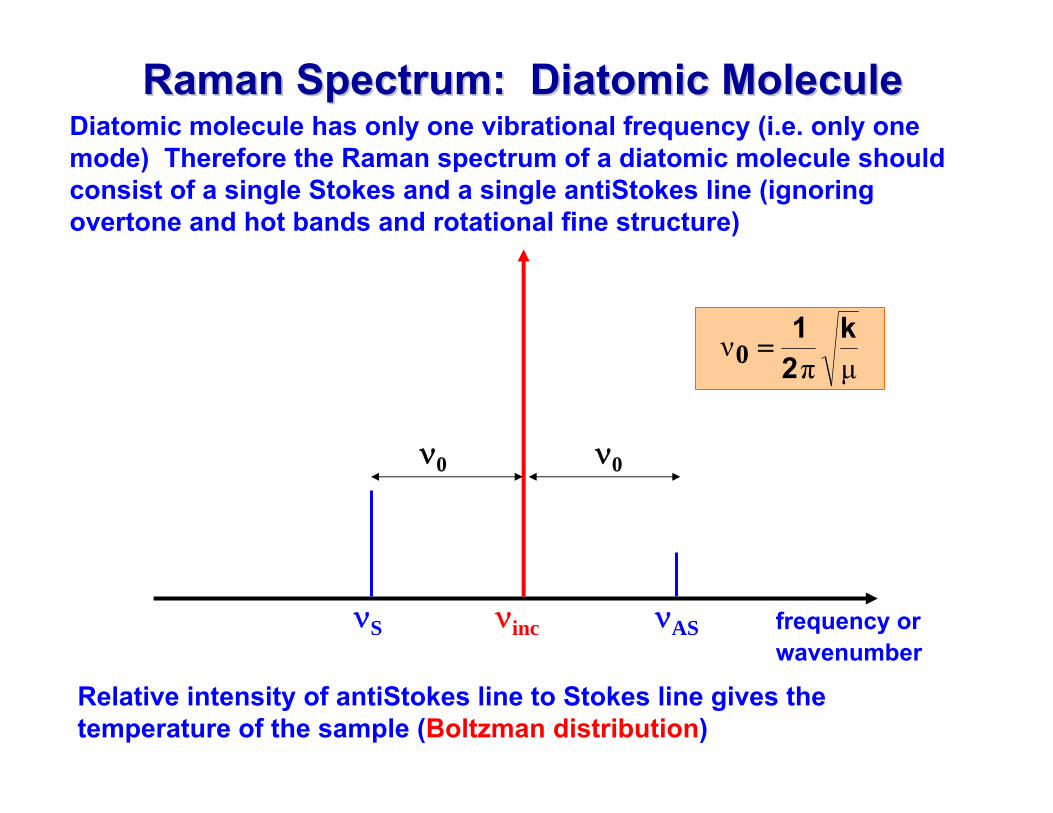
Raman Spectrum: Diatomic MoleculeRaman Spectrum: Diatomic MoleculeDiatomic molecule has only one vibrational frequency (i.e. only one mode) Therefore the Raman spectrum of a diatomic molecule should consist of a single Stokes and a single antiStokes line (ignoring overtone and hot bands and rotational fine structure)
ν0 ν0
νincνS νAS frequency or wavenumber
0 μπν k
21
=
Relative intensity of antiStokes line to Stokes line gives the temperature of the sample (Boltzman distribution)
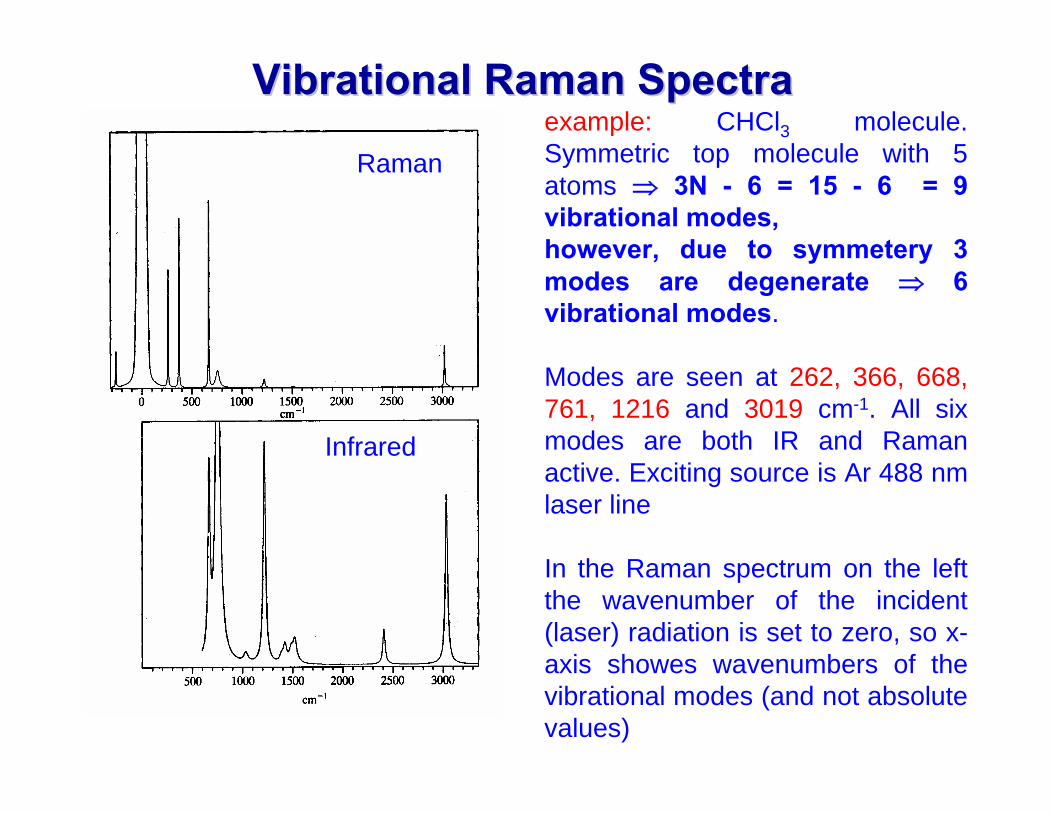
VibrationalVibrational Raman Spectra Raman Spectra example: CHCl3 molecule. Symmetric top molecule with 5 atoms ⇒ 3N - 6 = 15 - 6 = 9 vibrational modes, however, due to symmetery 3 modes are degenerate ⇒ 6 vibrational modes.
Modes are seen at 262, 366, 668, 761, 1216 and 3019 cm-1. All six modes are both IR and Raman active. Exciting source is Ar 488 nm laser line
In the Raman spectrum on the left the wavenumber of the incident (laser) radiation is set to zero, so x-axis showes wavenumbers of the vibrational modes (and not absolute values)
Raman
Infrared
Raman Activity in Raman Activity in PolyatomicsPolyatomicsIn general for polyatomic molecules it is usually necessary to apply Group Theory in order to decide whether a particular vibration of the molecule is Raman active or not. But some general rules apply:
If the molecule has no symmetry (e.g. HCN) then usually all of its vibrational modes are Raman active
In molecules that possess symmetry (e.g. CO2, H2O) thenSymmetric vibrations give rise to intense Raman lines, non symmetric vibrations are usually weak and sometimes unobservable. In particular bending modes usually yield a very weak Raman line.
Rule of Mutual Exclusion:If the molecule has a centre of symmetry, then Raman active vibrations are infrared inactive and vice versa. If there is no centr of symmetry in the molecule then some or all of the vibrations may be both Raman and IR active.
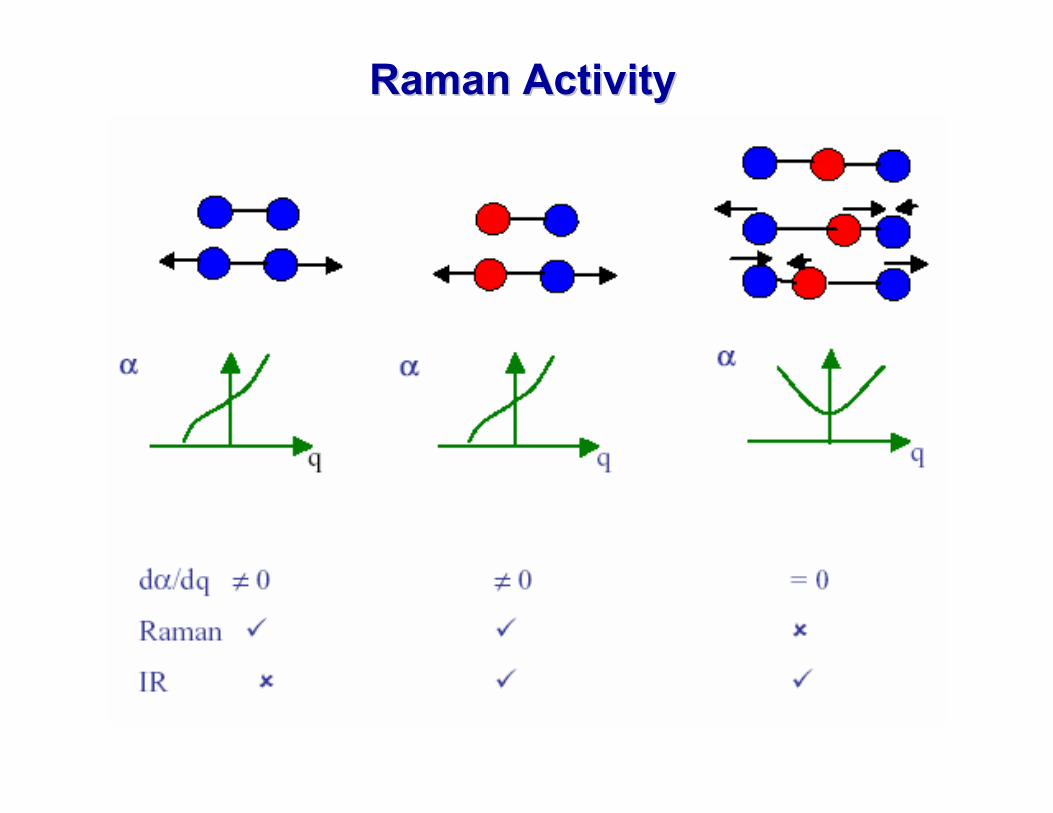
Raman ActivityRaman Activity
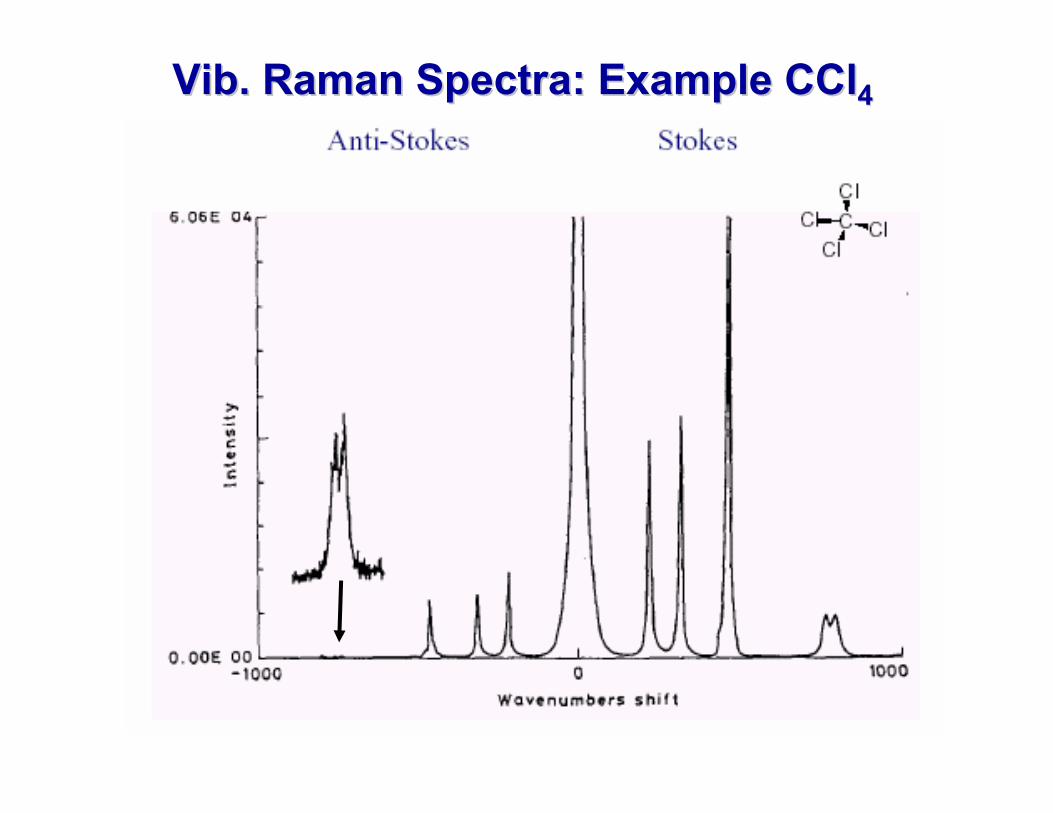
VibVib. Raman Spectra: Example CCl. Raman Spectra: Example CCl44
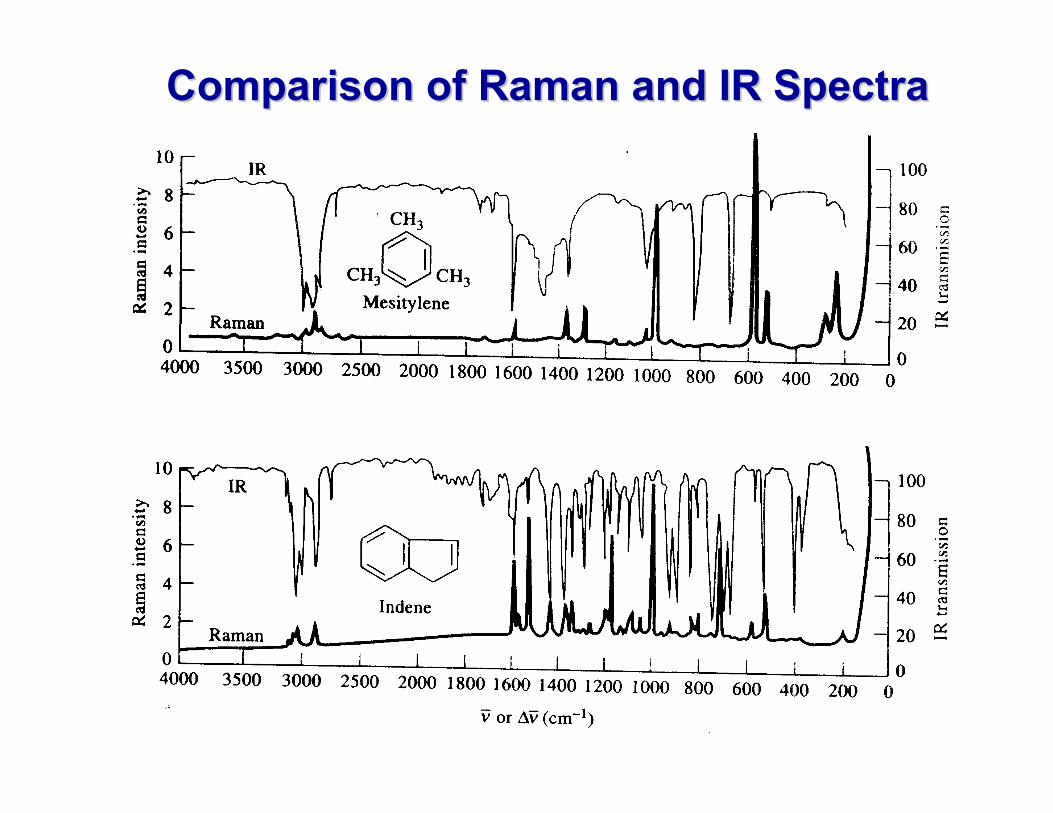
Comparison of Raman and IR Spectra Comparison of Raman and IR Spectra
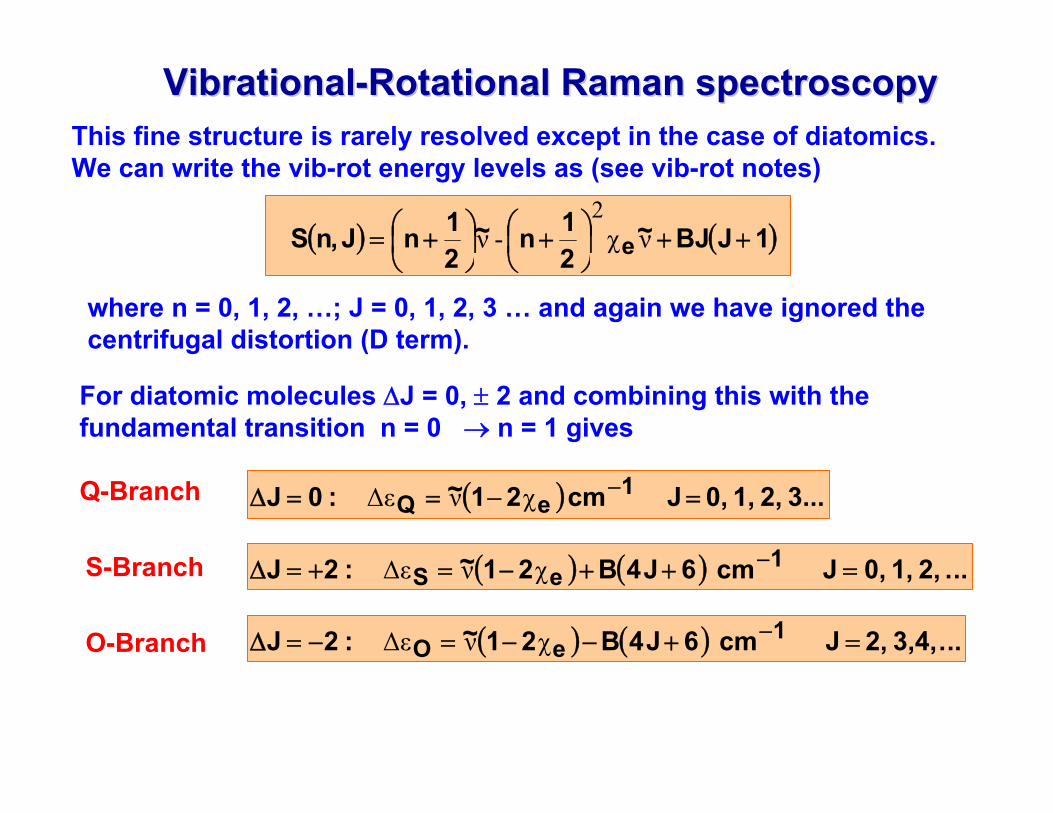
VibrationalVibrational--Rotational Raman spectroscopyRotational Raman spectroscopyThis fine structure is rarely resolved except in the case of diatomics. We can write the vib-rot energy levels as (see vib-rot notes)
( ) ( )1JBJ~21n~
21nJ,nS e ++⎟
⎠⎞
⎜⎝⎛ +⎟
⎠⎞
⎜⎝⎛ += νχ-ν
2
where n = 0, 1, 2, …; J = 0, 1, 2, 3 … and again we have ignored the centrifugal distortion (D term).
For diatomic molecules ΔJ = 0, ± 2 and combining this with the fundamental transition n = 0 → n = 1 gives
Q-Branch
S-Branch
( ) 3... 2, 1, 0, J cm 21~ :0J 1eQ =−==Δ −χνΔε
( ) ( ) ... 2, 1, 0,J cm 6J4B21~ :2J 1eS =++−=+=Δ −χνΔε
( ) ( ) ...3,4, 2, J cm 6J4B21~ :2J 1eO =+−−=−=Δ −χνΔεO-Branch
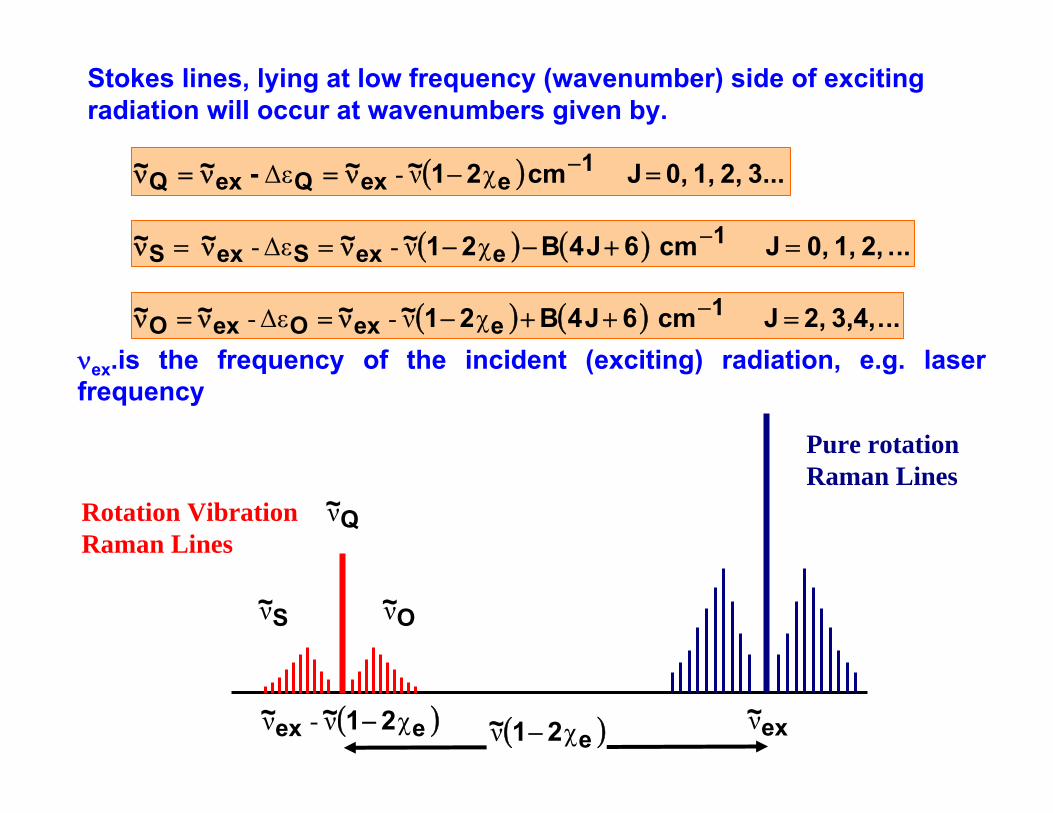
Stokes lines, lying at low frequency (wavenumber) side of exciting radiation will occur at wavenumbers given by.
( ) 3... 2, 1, 0, J cm 21~~ -~~ 1eexQexQ =−ν=ν=ν −χν-Δε
( ) ( ) ... 2, 1, 0,J cm 6J4B21~~~ ~ 1eexSexS =+−−ν=ν=ν −χν-Δε-
( ) ( ) ...3,4, 2, J cm 6J4B21~~ ~ ~ 1eexOexO =++−ν=ν=ν −χν-Δε-
Pure rotation Raman Lines
Rotation Vibration Raman Lines
( )e21~ χν − ex~ν( )eex 21~~ χν-ν −
S~ν
Q~ν
O~ν
νex.is the frequency of the incident (exciting) radiation, e.g. laser frequency
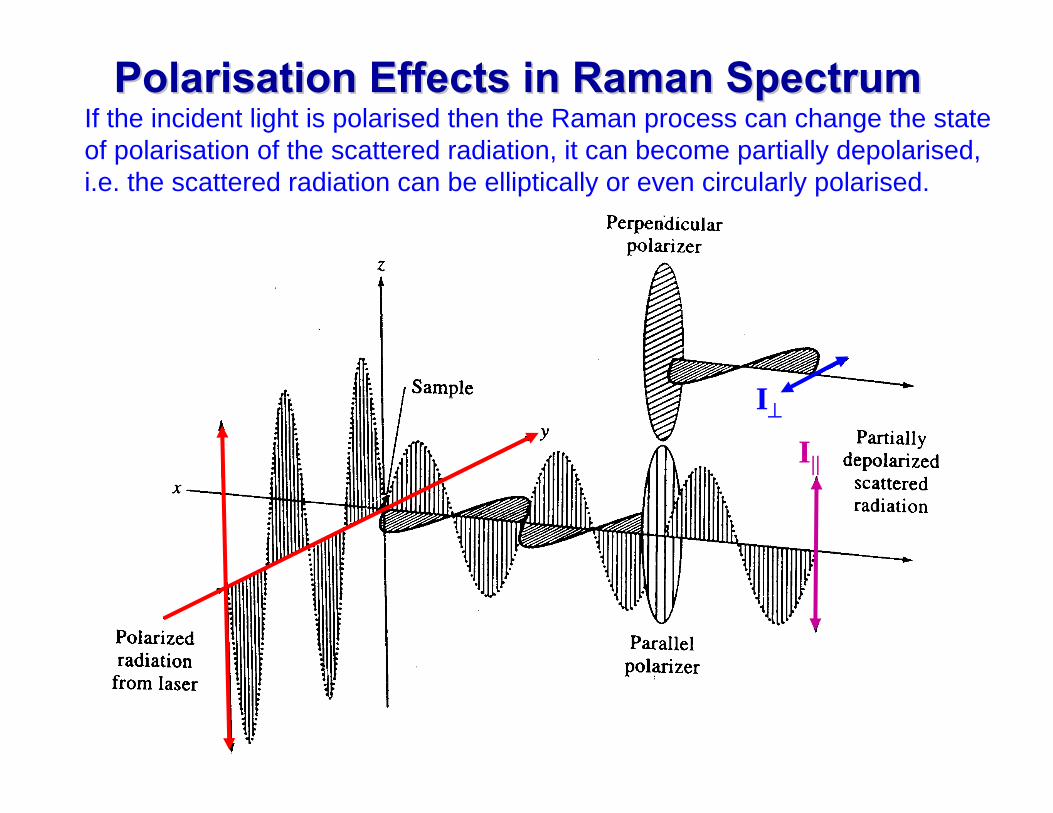
Polarisation Polarisation Effects in Raman SpectrumEffects in Raman Spectrum
I⊥
I||
If the incident light is polarised then the Raman process can change the state of polarisation of the scattered radiation, it can become partially depolarised, i.e. the scattered radiation can be elliptically or even circularly polarised.
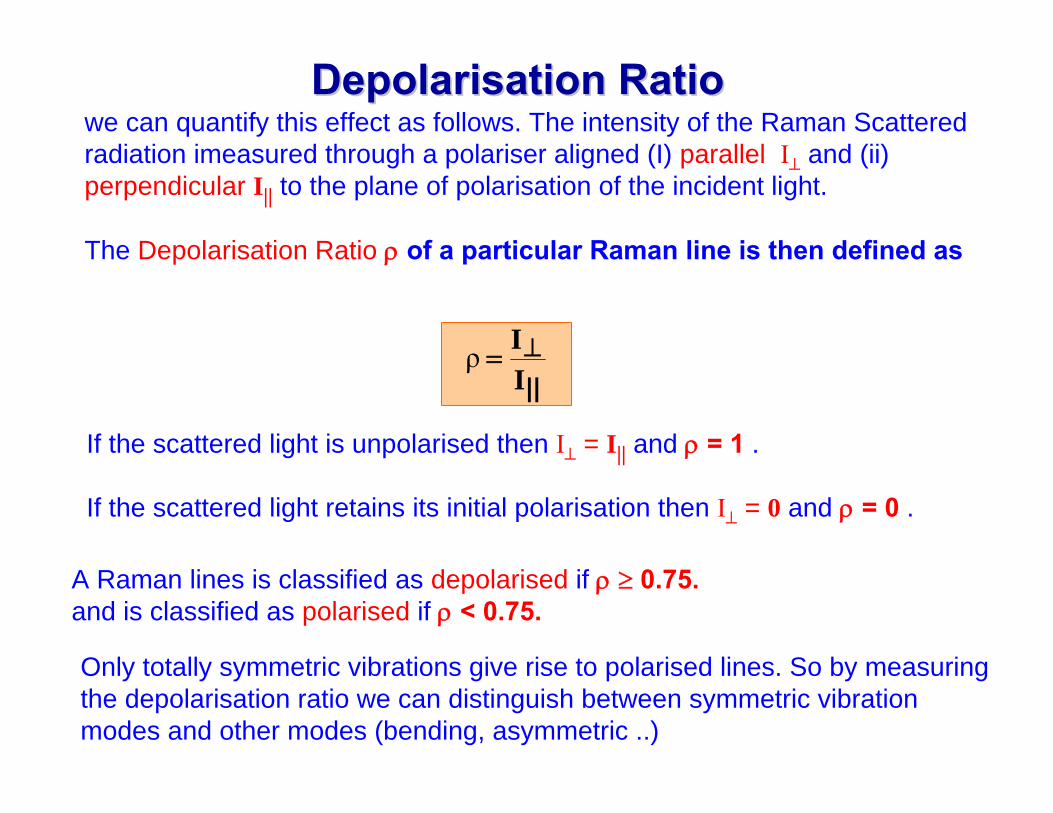
Depolarisation Depolarisation RatioRatiowe can quantify this effect as follows. The intensity of the Raman Scattered radiation imeasured through a polariser aligned (I) parallel I⊥ and (ii) perpendicular I|| to the plane of polarisation of the incident light.
The Depolarisation Ratio ρ of a particular Raman line is then defined as
II
||⊥=ρ
If the scattered light is unpolarised then I⊥ = I|| and ρ = 1 .
If the scattered light retains its initial polarisation then I⊥ = 0 and ρ = 0 .
A Raman lines is classified as depolarised if ρ ≥ 0.75. and is classified as polarised if ρ < 0.75.
Only totally symmetric vibrations give rise to polarised lines. So by measuring the depolarisation ratio we can distinguish between symmetric vibration modes and other modes (bending, asymmetric ..)
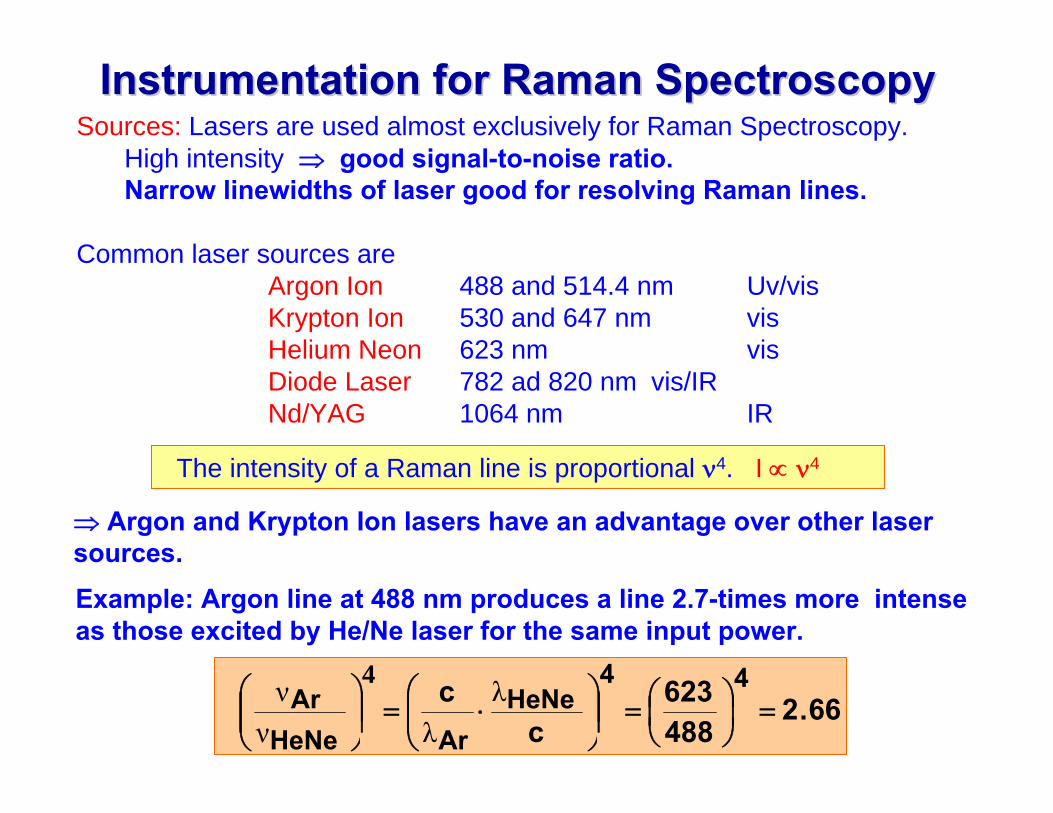
Instrumentation for Raman SpectroscopyInstrumentation for Raman SpectroscopySources: Lasers are used almost exclusively for Raman Spectroscopy.
High intensity ⇒ good signal-to-noise ratio.Narrow linewidths of laser good for resolving Raman lines.
Common laser sources areArgon Ion 488 and 514.4 nm Uv/visKrypton Ion 530 and 647 nm visHelium Neon 623 nm visDiode Laser 782 ad 820 nm vis/IRNd/YAG 1064 nm IR
The intensity of a Raman line is proportional ν4. I ∝ ν4
⇒ Argon and Krypton Ion lasers have an advantage over other lasersources. Example: Argon line at 488 nm produces a line 2.7-times more intense as those excited by He/Ne laser for the same input power.
66.2488623
cc 44
HeNeArHeNe
Ar =⎟⎠⎞
⎜⎝⎛=⎟⎟
⎠
⎞⎜⎜⎝
⎛⋅=⎟⎟
⎠
⎞⎜⎜⎝
⎛ λλν
ν 4
However, the diode laser and Nd/YAG also have advantages. They operate in the near infrared ⇒
1) They can be operated at much higher power without causing photodissociation of the sample (up to 50 W).
2) These photons are not energetic enough to excite electronic states in the molecule so there is little or no fluorescence radiation to swamp the Raman signal. (see figure on next overhead)
Sample Illumination: Much easier than IR spectroscopy, since Raman signal is usually in the visible/ near IR region this means that special windows, mirrors, lenses are not required, ordinaryglass may be used.
Easier to focus laser to a small spot size (microRaman) ⇒small samples may be investigated.
See Banwell and McCash Section 4.7 AND Skoog, Nieman and Holler Section 18 B For details on Instrumentation
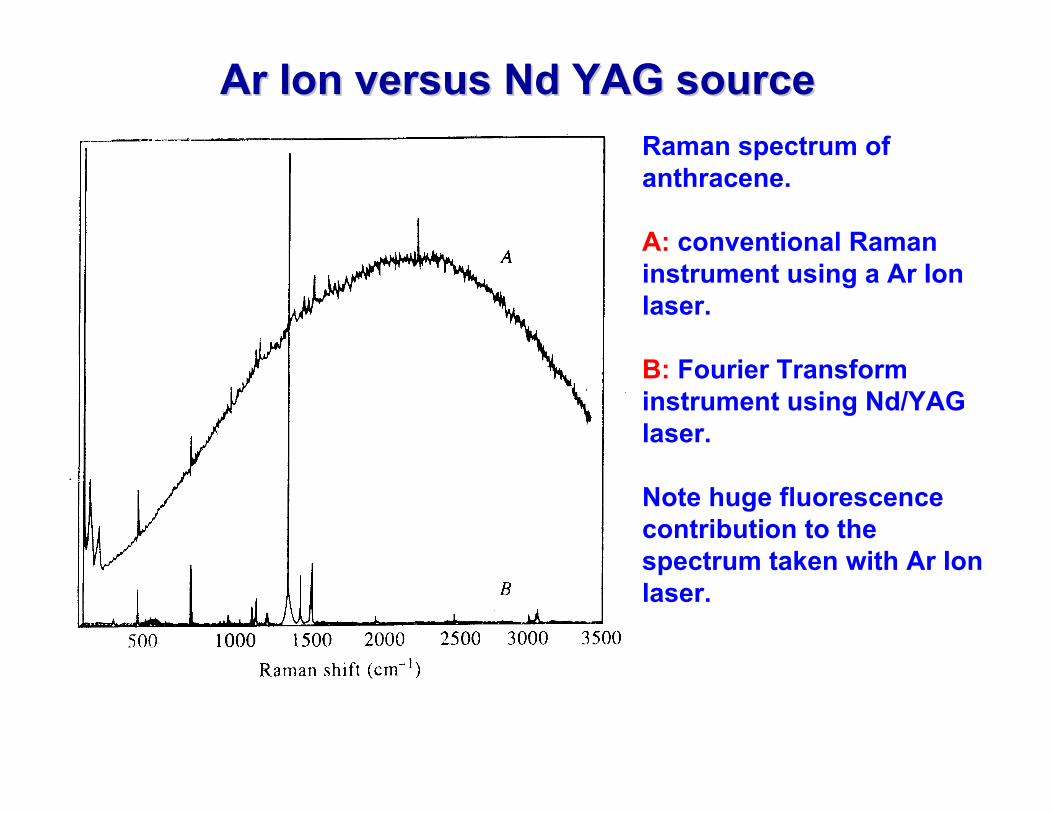
Ar Ar Ion versus Ion versus Nd Nd YAG sourceYAG sourceRaman spectrum of anthracene.
A: conventional Raman instrument using a Ar Ion laser.
B: Fourier Transform instrument using Nd/YAG laser.
Note huge fluorescence contribution to the spectrum taken with Ar Ion laser.
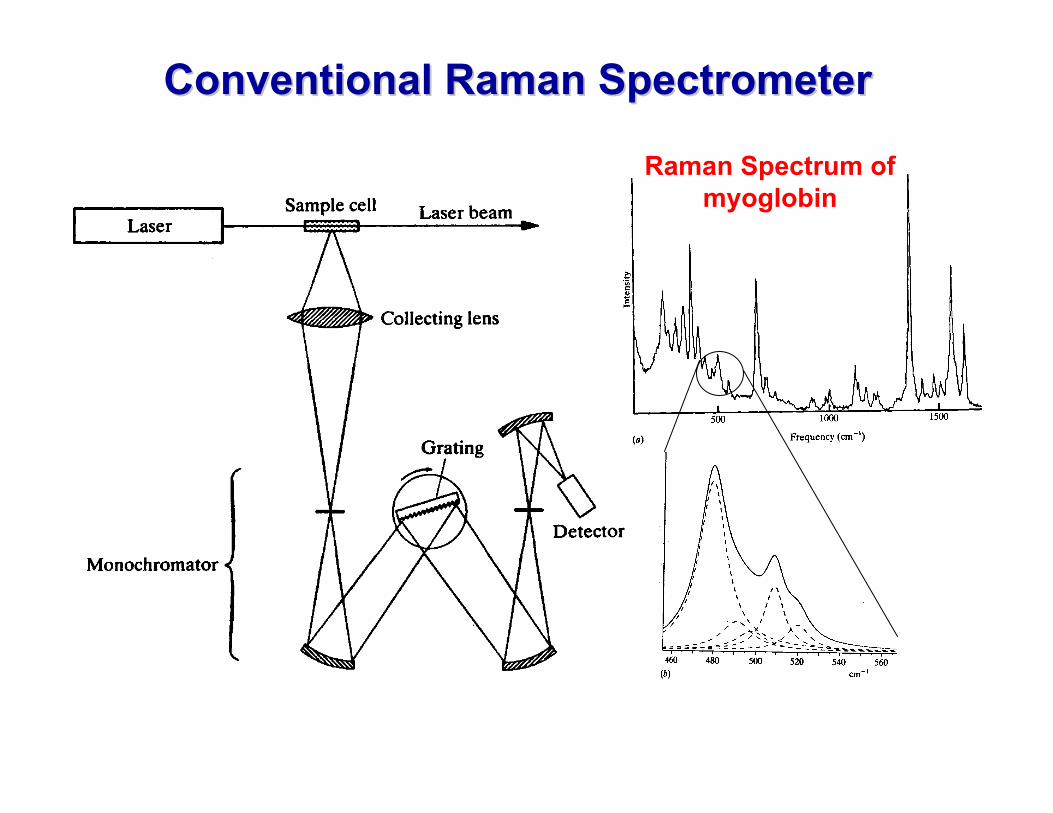
Conventional Raman SpectrometerConventional Raman Spectrometer
Raman Spectrum of myoglobin
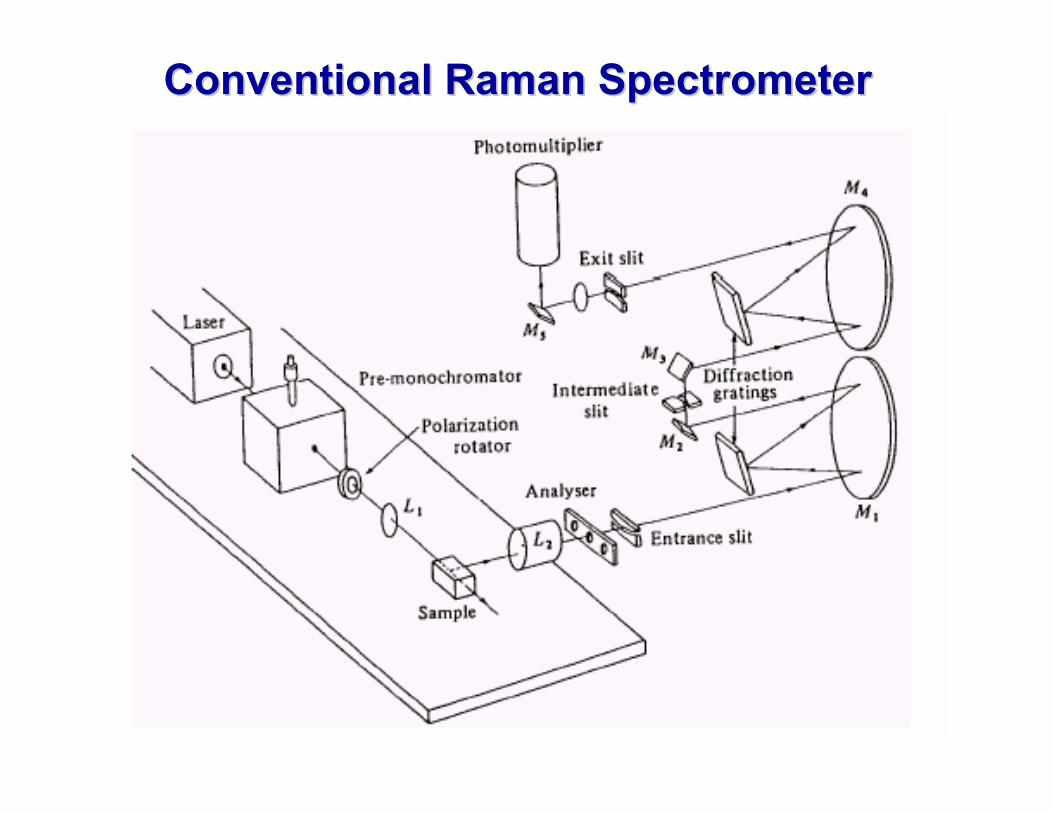
Conventional Raman SpectrometerConventional Raman Spectrometer
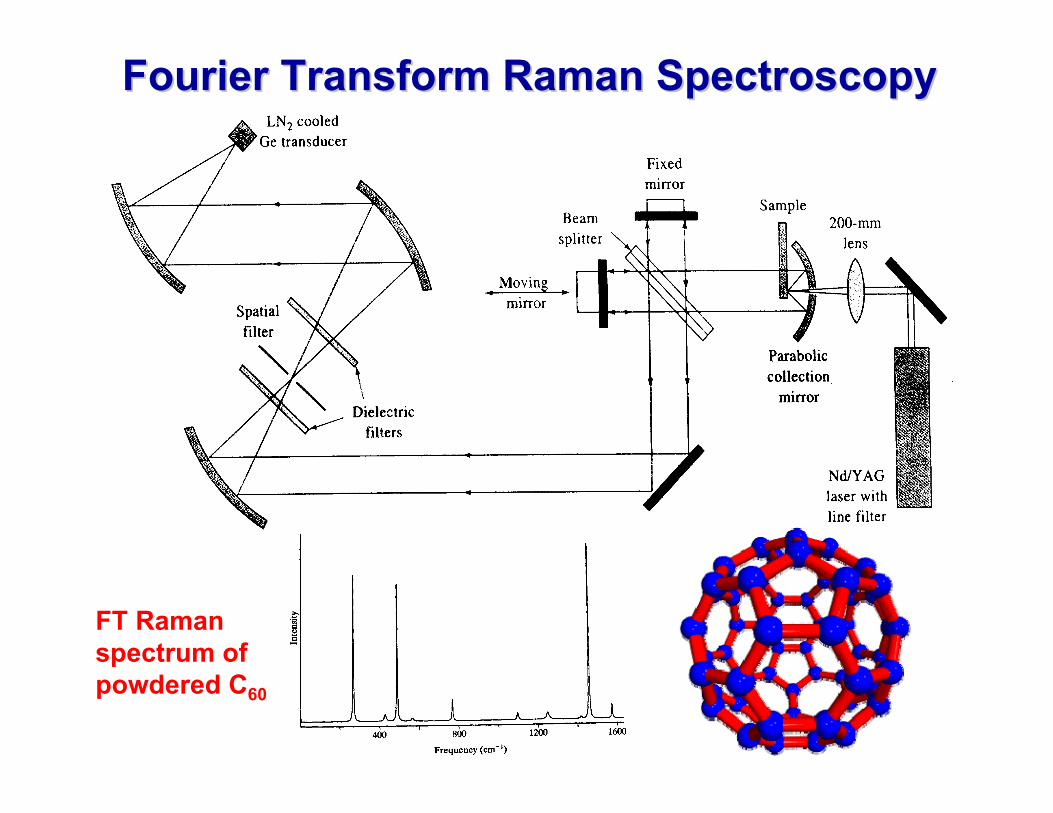
Fourier Transform Raman SpectroscopyFourier Transform Raman Spectroscopy
FT Raman spectrum of powdered C60
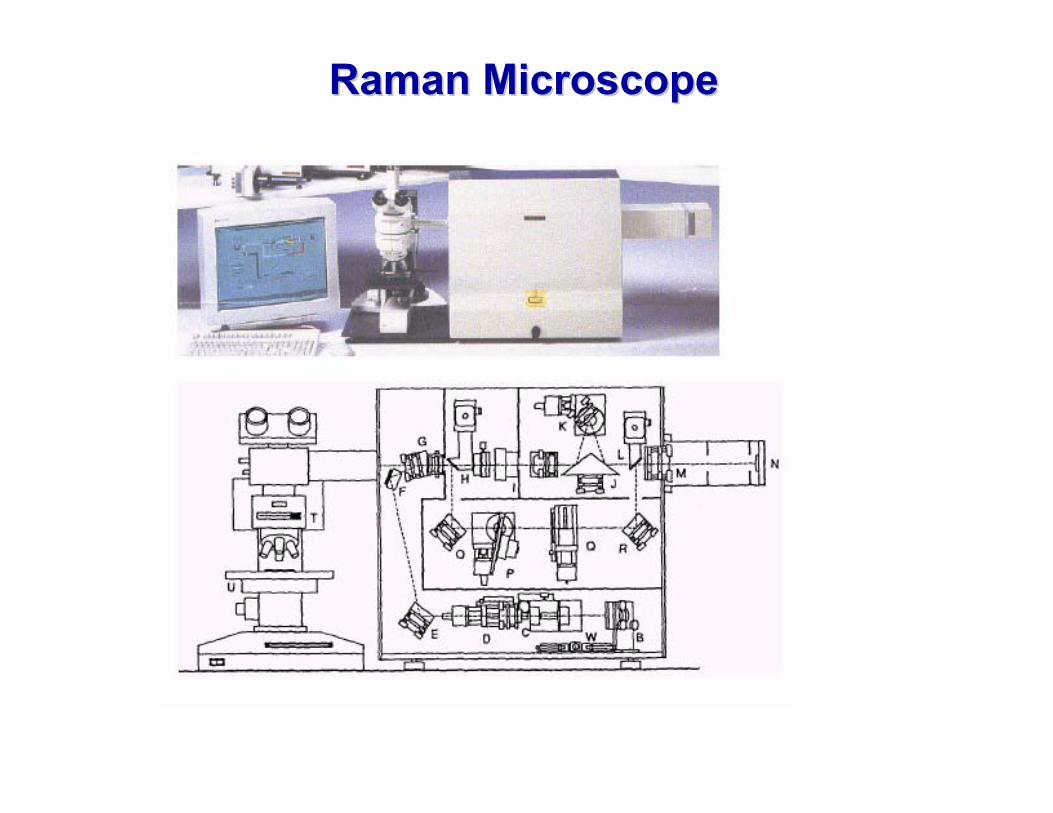
Raman MicroscopeRaman Microscope
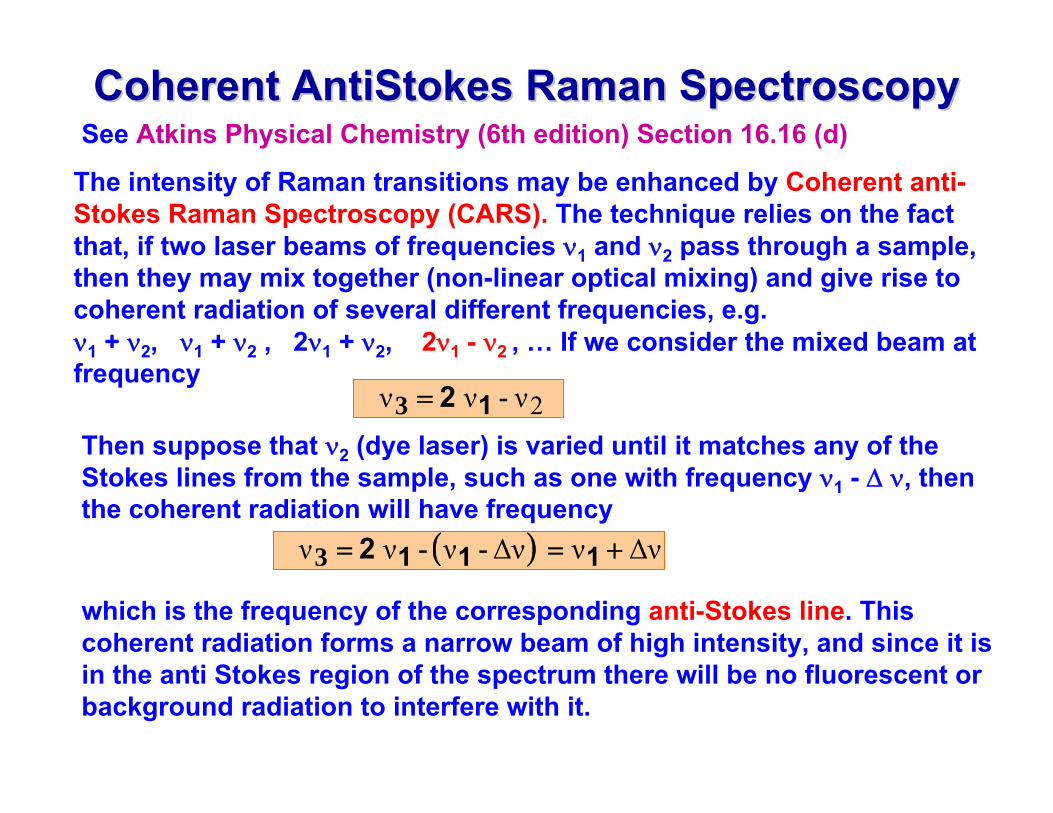
Coherent Coherent AntiStokesAntiStokes Raman SpectroscopyRaman SpectroscopySee Atkins Physical Chemistry (6th edition) Section 16.16 (d)
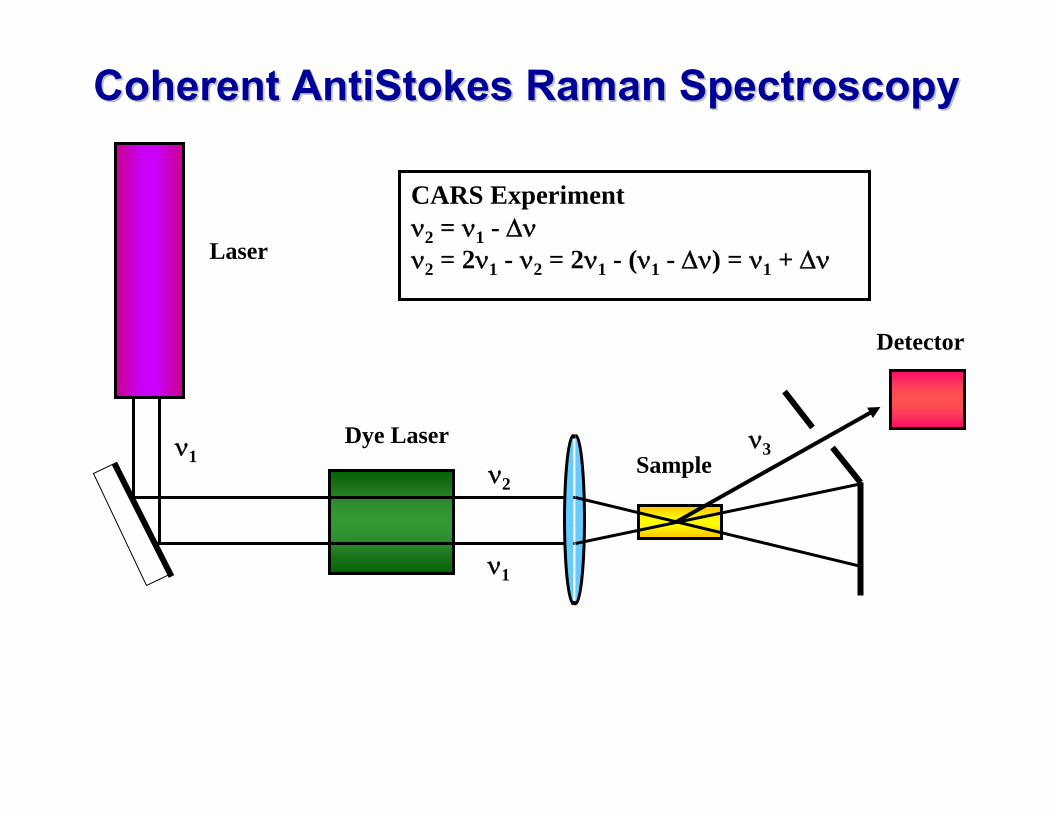
The intensity of Raman transitions may be enhanced by Coherent anti-Stokes Raman Spectroscopy (CARS). The technique relies on the fact that, if two laser beams of frequencies ν1 and ν2 pass through a sample, then they may mix together (non-linear optical mixing) and give rise to coherent radiation of several different frequencies, e.g. ν1 + ν2, ν1 + ν2 , 2ν1 + ν2, 2ν1 - ν2 , … If we consider the mixed beam at frequency
- 3 2ννν 12=
Then suppose that ν2 (dye laser) is varied until it matches any of the Stokes lines from the sample, such as one with frequency ν1 - Δ ν, then the coherent radiation will have frequency
( ) ΔννΔνννν +== - - 3 1112
which is the frequency of the corresponding anti-Stokes line. This coherent radiation forms a narrow beam of high intensity, and since it is in the anti Stokes region of the spectrum there will be no fluorescent or background radiation to interfere with it.
ν1
ν2
ν3
Coherent Coherent AntiStokesAntiStokes Raman SpectroscopyRaman Spectroscopy
Detector
Laser
Dye LaserSample
CARS Experimentν2 = ν1 - Δνν2 = 2ν1 - ν2 = 2ν1 - (ν1 - Δν) = ν1 + Δν
ν1
ν1
ν3
ν2
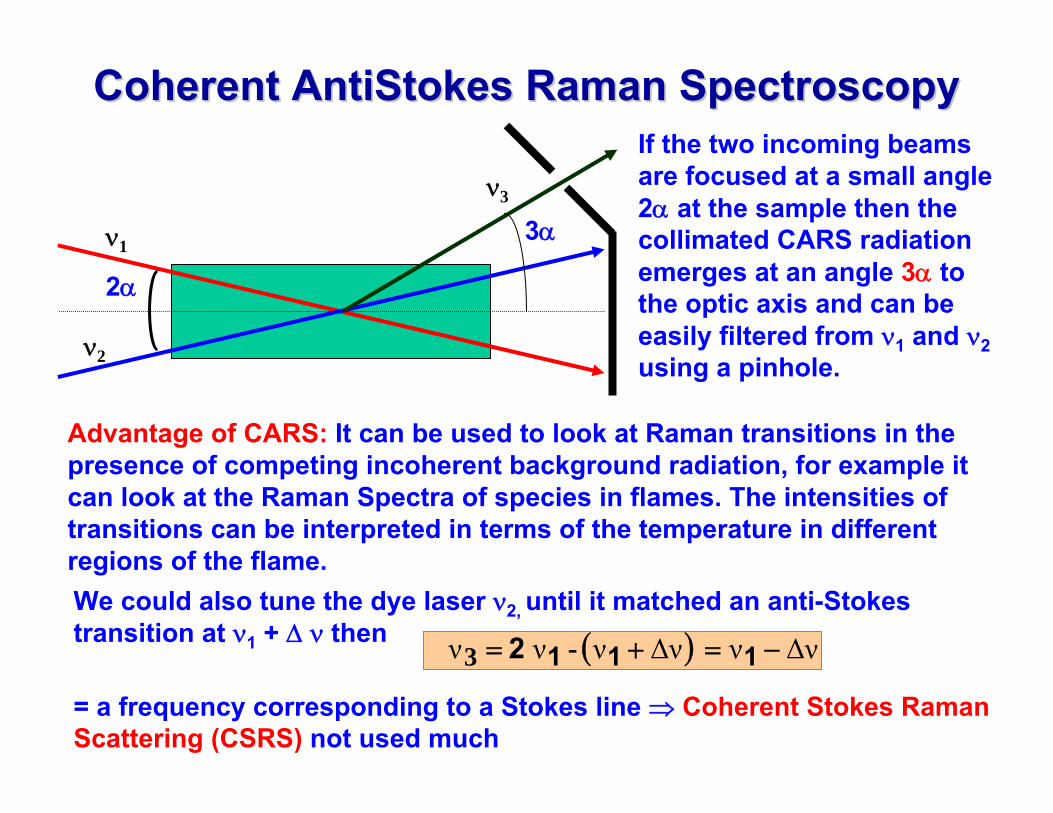
Coherent Coherent AntiStokesAntiStokes Raman SpectroscopyRaman Spectroscopy
2α
3α
If the two incoming beams are focused at a small angle 2α at the sample then the collimated CARS radiation emerges at an angle 3α to the optic axis and can be easily filtered from ν1 and ν2using a pinhole.
Advantage of CARS: It can be used to look at Raman transitions in the presence of competing incoherent background radiation, for example it can look at the Raman Spectra of species in flames. The intensities of transitions can be interpreted in terms of the temperature in different regions of the flame. We could also tune the dye laser ν2, until it matched an anti-Stokes transition at ν1 + Δ ν then ( ) ΔννΔνννν −=+= - 3 1112
= a frequency corresponding to a Stokes line ⇒ Coherent Stokes Raman Scattering (CSRS) not used much
Raman vs. IR Spectroscopy Raman vs. IR Spectroscopy Advantages:1) The incident and scattered radiation is in the visible or UV ⇒conventional optics, monochromators and sample cells can be used2) Can focus the laser beam to very small spot size (difficult to focus IR)⇒ can use small samples3) Water absorbs strongly in the IR (see vib notes, double beam spectrometer) but water is a very weak Raman scatterer ⇒ can use aqueous solutions for Raman Spectroscopy (not possible for IR where other solvents are required for liquid samples. ⇒ can examine biological samples.4) Using Pulsed laser sources we can look at time dependence of Raman Intensities ⇒ can observe transient species in reactions.
Disadvantages:1) Sample heating when lasers are used2) fluorescence in sample can swamp Raman signal