smv design report - final
TRANSCRIPT
Table of ContentsMission Statement...............................................................................................................................2
1) Basic Vehicle Configuration........................................................................................................2
2) Engine.................................................................................................................................................4
3) Powertrain Configuration............................................................................................................7
4) Brake System....................................................................................................................................8
5) Suspension and Running Gear...................................................................................................9
6) Body/Aerodynamic Shell............................................................................................................13
6.1 Manufacturing....................................................................................................................13
6.2 Performance Analysis.......................................................................................................15
7) Performance....................................................................................................................................18
7.1 Speed Calculations............................................................................................................18
7.2 Fuel Economy Calculations............................................................................................19
8) Cost Estimate and Manufacturing Methods.......................................................................20
9) Driver Safety Features................................................................................................................21
9.1 Roll Hoop Design...............................................................................................................22
10) References....................................................................................................................................24
Appendix A – CAD Drawings........................................................................................................A-1
Appendix B – Calculations.............................................................................................................B-1
Appendix C – Vehicle Cost Considerations..............................................................................C-1
UNR Supermileage® Team P a g e | 1 Gasbusters’ Design Report
Mission Statement
Modern society depends too heavily on unsustainable resources like fossil fuels. Decreasing consumption of fossil fuels increases economic stability and offers a prolonged life of the planet for generations to come. In order to promote innovation in vehicle efficiency, the Society of Automotive Engineers (SAE) holds an annual competition held June 4th, 2015 in Marshall, Michigan. The Supermileage competition provides engineering and technology students with a challenging design project that involves the development and construction of a single-person, fuel-efficient vehicle powered by a small four-cycle engine. The overall goal is to build the most efficient vehicle possible and increase public awareness of fuel economy. Team Gasbusters, the University of Nevada Supermileage Vehicle Club, will be tasked with this challenge. Team Gasbusters will be constructing an entire Supermileage vehicle from the ground up. The vehicle will be designed within specified SAE standards with a goal of achieving over 800 miles per gallon [12].
1) Basic Vehicle Configuration
The University of Nevada, Reno is returning in 2015 to compete in the SAE Supermileage® competition with an entirely new team. As such the vehicle will be a completely new design. The vehicle will be a three-wheeled recumbent bicycle design with two wheels at the front for steering and one located in the center at the rear that is to be powered. This configuration was chosen because only powering one wheel means no differential is needed, which increases overall mechanical efficiency by simplifying the powertrain. The general layout of the vehicle also lends its self to an aerodynamically optimized “teardrop” shape.
Table 1 - General vehicle dimensions and statistics
Description
Value Description Value
Length: 2.53 mFront Track Width:
.93 m
Width: .65 m Wheelbase: 1.62 m
Height: .91 mGround Clearance:
.24 m
Chassis Weight:
6.5 kgChassis Material:
Thin-walled, Square 6061 Al
UNR Supermileage® Team P a g e | 2 Gasbusters’ Design Report
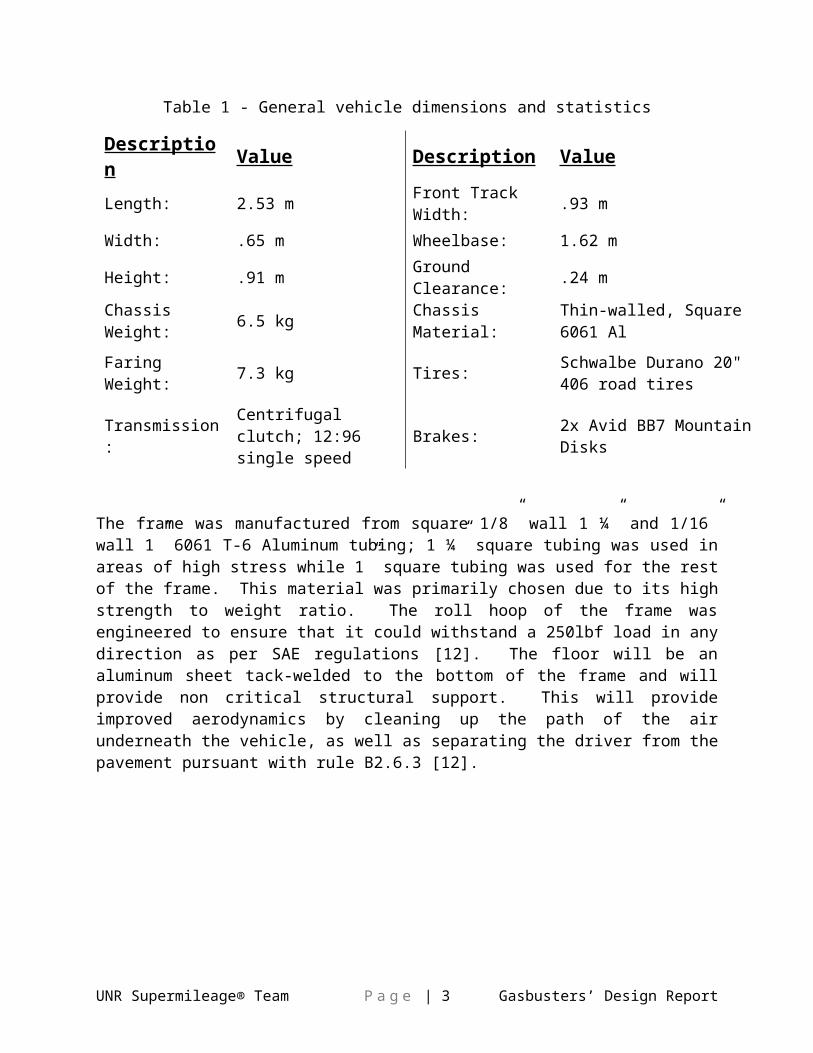
Faring Weight:
7.3 kg Tires:Schwalbe Durano 20" 406 road tires
Transmission:Centrifugal clutch; 12:96 single speed
Brakes:2x Avid BB7 Mountain Disks
The frame was manufactured from square 1/8” wall 1 ¼” and 1/16” wall 1” 6061 T-6 Aluminum tubing; 1 ¼” square tubing was used in areas of high stress while 1” square tubing was used for the rest of the frame. This material was primarily chosen due to its high strength to weight ratio. The roll hoop of the frame was engineered to ensure that it could withstand a 250lbf load in any direction as per SAE regulations [12]. The floor will be an aluminum sheet tack-welded to the bottom of the frame and will provide non critical structural support. This will provide improved aerodynamics by cleaning up the path of the air underneath the vehicle, as well as separating the driver from the pavement pursuant with rule B2.6.3 [12].
Figure 1: 3 view drawing of our vehicle with dimensions shown in meters.
The front wheels will be supported by lefty hubs, manufactured by Cannondale mountain bikes. These hubs are intended to be mounted on one side, and we do not expect to experience any problems with the wheels during operation. In addition to this, lefty hubs are designed to accept disk
UNR Supermileage® Team P a g e | 3 Gasbusters’ Design Report
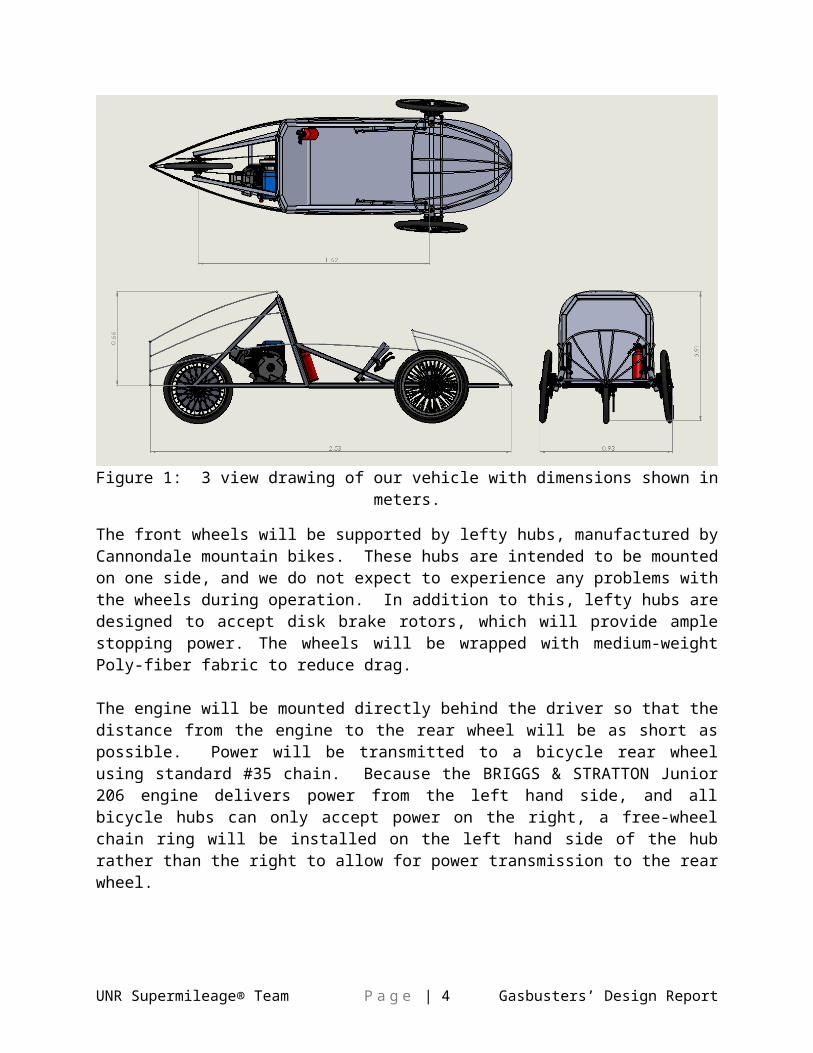
brake rotors, which will provide ample stopping power. The wheels will be wrapped with medium-weight Poly-fiber fabric to reduce drag.
The engine will be mounted directly behind the driver so that the distance from the engine to the rear wheel will be as short as possible. Power will be transmitted to a bicycle rear wheel using standard #35 chain. Because the BRIGGS & STRATTON Junior 206 engine delivers power from the left hand side, and all bicycle hubs can only accept power on the right, a free-wheel chain ring will be installed on the left hand side of the hub rather than the right to allow for power transmission to the rear wheel.
For the shell, 3/8” aluminum rod will be bent to desired angles and TIG welded to the frame. The intuitively designed aerodynamic skeleton can be seen above in Figure 1. It has been decided that the wheels will not be encompassed in the aerodynamic shell as the team feels the drag associated with the wheels is small enough to be neglected. After the aluminum shell skeleton has been fixed to the frame, Poly-fiber medium-weight fabric will be laid over the shell members to create a surface for the air to flow over. In order to properly fix the fabric to the frame a special glue will be applied to the surfaces where the frame contacts the fabric to promote adhesion. After the fabric is glued to the members, a heat source is used to shrink the fabric to a tight fit around the skeleton. Two openings will be placed on either side of the shell in the front to allow for headset clearance, steering, and braking components. For visibility, a clear Lexan polycarbonate wind screen will be placed on the front half of the shell and will conform to all line-of-sight requirements.
2) Engine
Do to time and budget constraints, engine modifications will be kept to a minimum for this year’s competition. The standard Briggs and Stratton engine that is supplied with entrance to the competition is 205cc OHV and is rated at 14 ft-lbs torque max at 4100 RPM. The motor has a max power output of 8 HP at 5000 RPM [1]. Team Gasbuster’s primarily wanted to focus on tuning the carburetor due to the fact that our budget and time constraints wouldn’t allow the team to do any head work or electronic fuel injection.
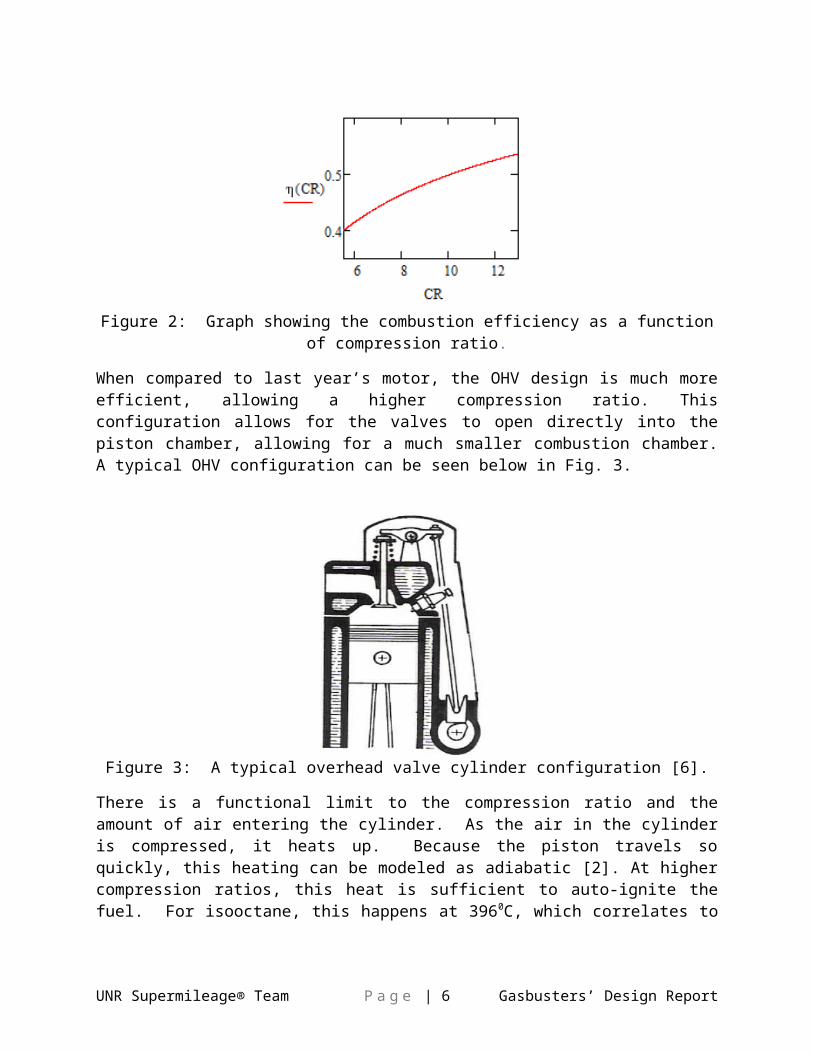
The compression ratio determines the overall efficiency of the motor because as the compression ratio increases, the expansion ratio increases. This allows the motor to extract more of the thermal energy from the gas. Figure 2 shows the combustion efficiency as a function of compression ratio over the ratios relevant to the design.
UNR Supermileage® Team P a g e | 4 Gasbusters’ Design Report
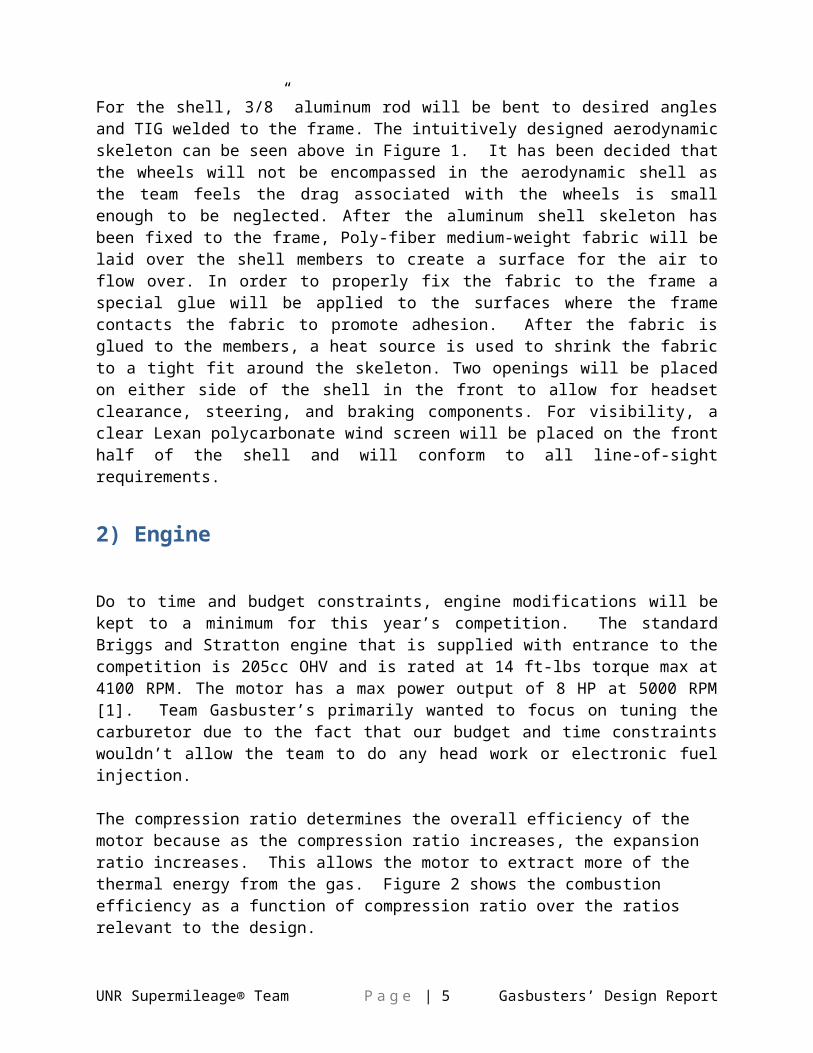
Figure 2: Graph showing the combustion efficiency as a function of compression ratio.
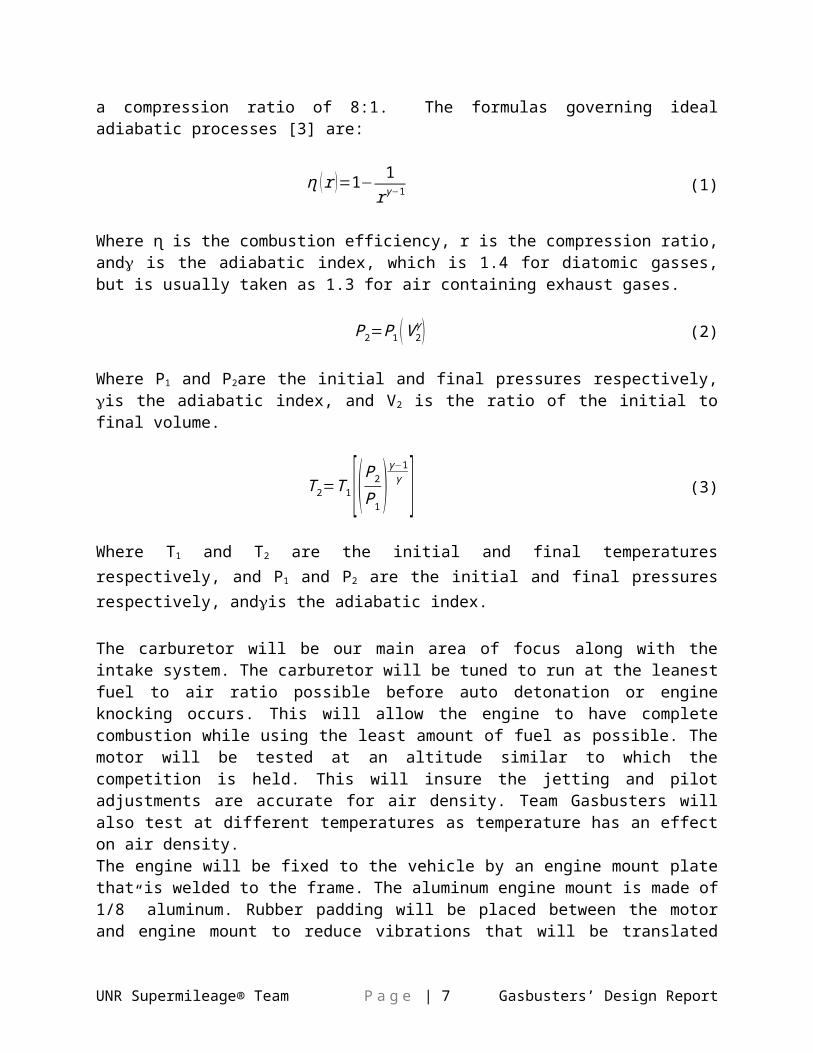
When compared to last year’s motor, the OHV design is much more efficient, allowing a higher compression ratio. This configuration allows for the valves to open directly into the piston chamber, allowing for a much smaller combustion chamber. A typical OHV configuration can be seen below in Fig. 3.
Figure 3: A typical overhead valve cylinder configuration [6].
There is a functional limit to the compression ratio and the amount of air entering the cylinder. As the air in the cylinder is compressed, it heats up. Because the piston travels so quickly, this heating can be modeled as adiabatic [2]. At higher compression ratios, this heat is sufficient to auto-ignite the fuel. For isooctane, this happens at 3960C, which correlates to a compression ratio of 8:1. The formulas governing ideal adiabatic processes [3] are:
ɳ (r )=1− 1
r γ−1 (1)
UNR Supermileage® Team P a g e | 5 Gasbusters’ Design Report
Where ɳ is the combustion efficiency, r is the compression ratio, and is the adiabatic index, which is 1.4 for diatomic gasses, but is usually taken as 1.3 for air containing exhaust gases.
P2=P1 (V 2γ ) (2)
Where P1 and P2are the initial and final pressures respectively, is the adiabatic index, and V2 is the ratio of the initial to final volume.
T 2=T1 [(P2P1 )γ−1γ ] (3)
Where T1 and T2 are the initial and final temperatures respectively, and P1
and P2 are the initial and final pressures respectively, andis the adiabatic index.
The carburetor will be our main area of focus along with the intake system. The carburetor will be tuned to run at the leanest fuel to air ratio possible before auto detonation or engine knocking occurs. This will allow the engine to have complete combustion while using the least amount of fuel as possible. The motor will be tested at an altitude similar to which the competition is held. This will insure the jetting and pilot adjustments are accurate for air density. Team Gasbusters will also test at different temperatures as temperature has an effect on air density.The engine will be fixed to the vehicle by an engine mount plate that is welded to the frame. The aluminum engine mount is made of 1/8” aluminum. Rubber padding will be placed between the motor and engine mount to reduce vibrations that will be translated throughout the vehicle. The engine is fastened to the mounting plate using four 5/16” grade 8 bolts with nuts and washers. The exhaust, intake, and centrifugal clutch assembly will all be mounted on the engine. The engine will be insulated to keep it at operating temperature when it is shutoff, allowing for more efficient restarts. Also the insulation will help the driver stay cooler in the cockpit of the vehicle.
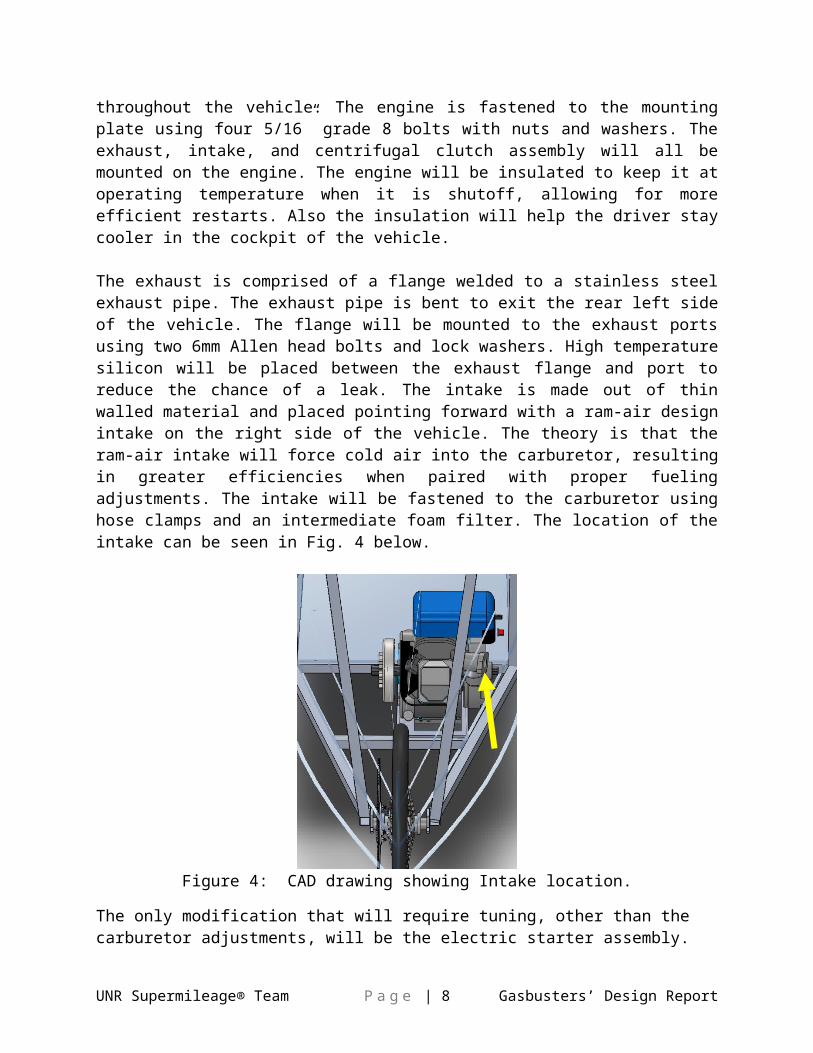
The exhaust is comprised of a flange welded to a stainless steel exhaust pipe. The exhaust pipe is bent to exit the rear left side of the vehicle. The flange will be mounted to the exhaust ports using two 6mm Allen head bolts and lock washers. High temperature silicon will be placed between the exhaust flange and port to reduce the chance of a leak. The intake is made out of thin walled material and placed pointing forward with a ram-air design intake on the right side of the vehicle. The theory is that the ram-air intake will force cold air into the carburetor, resulting in greater
UNR Supermileage® Team P a g e | 6 Gasbusters’ Design Report
efficiencies when paired with proper fueling adjustments. The intake will be fastened to the carburetor using hose clamps and an intermediate foam filter. The location of the intake can be seen in Fig. 4 below.
Figure 4: CAD drawing showing Intake location.
The only modification that will require tuning, other than the carburetor adjustments, will be the electric starter assembly. This will allow the driver to start the vehicle from inside and allow the engine to be switched off while coasting to preserve fuel. The electric starter will be used in conjunction with the free-wheel hub to insure minimal friction to promote maximum coasting distance while the motor is not running.
3) Powertrain Configuration
In order to allow the engine to idle while the vehicle is stationary, a centrifugal clutch designed for use in go-karts will be used. This is the easiest solution to comply with the rules outlined in section B2.4 that requires no input from the operator beyond throttle control [12]. The centrifugal clutch is used to engage the rear wheel of the vehicle at specific RPM. The high performance adjustable clutch is attached to the crankshaft using a Belleville washer, key, and bolt that threads into the crankshaft. Mounted to the clutch, there is a 12 tooth front sprocket that is connected to a #35 chain that connects to the 104 tooth rear sprocket. The rear
UNR Supermileage® Team P a g e | 7 Gasbusters’ Design Report
sprocket is connected to a free-wheel using 4 bolts. The free-wheel threads into the hub and is locked in place by a system of keys.
Power will be transmitted from the clutch to the rear sprocket using a #35 roller chain. Roller chains offer high efficiencies, are readily available, and easy to work with. The rear sprocket is bolted to an adapter plate which is then bolted to the free-wheel.
Because the operating rotational speed of the engine is approximately 45 times greater than a cyclist [5], a large gear ratio must be used in order to maintain reasonable speeds. Consequently, a small sprocket will be used at the engine side, and a large sprocket will be used at the rear wheel. The loss between the engine and drive wheel is minimized by using larger sprockets. Due to the small size of the rear wheel, the largest rear sprocket available for #35 chain is 104 tooth. This coupled to a 12 tooth front sprocket provides a reasonable range of vehicle speeds.
Finally, the rear wheel will be a 20” rim (ISO 406mm), the small diameter will keep the wheel from protruding above the height of the vehicle in addition to lowering the overall effective gearing. The clutch will be able to disengage power from the engine as outlined in the SAE regulations and will provide variable force to the rear wheel depending on its internal rotational velocity [12]. Having a free-wheel on the hub will allow for coasting with minimal friction and improved efficiency. A view of the overall drive train is outlined in Fig. 5.
Figure 2: CAD drawing showing drive train configuration.
4) Brake System
UNR Supermileage® Team P a g e | 8 Gasbusters’ Design Report
Braking on the SMV will be achieved through two mechanical disc brakes fitted to the front wheels. These brakes will be actuated by one lever controlling both brakes at the same time. Because the majority of the vehicle’s weight will shift toward the front during the braking process, fitting the disc brakes to the two front wheels will provide more traction between the wheels and the ground due to the greater weight acting on that area. Taking into account the estimated weight of the vehicle (including the driver) and the coefficient of rolling friction between a bicycle tire and the race track, the braking system was calculated using Eqs. 4 and 5 to have the necessary braking power to stop the vehicle within 13.12 feet while traveling at 15 mph as outlined by SAE [12]. Expecting approximately 75% of the vehicle’s weight to transfer to the front tires, it was calculated that the frictional force, once the brakes have been applied, was sufficient enough to stop within the parameters specified by section B7.1 in competition rules [12].
.75mgμ=331.9N (4)
ma=317.0N (5)
Where m is the vehicle’s mass in kg, g is the acceleration due to gravity, μ is the coefficient of rolling friction, and is the calculated acceleration of the vehicle as it slows.
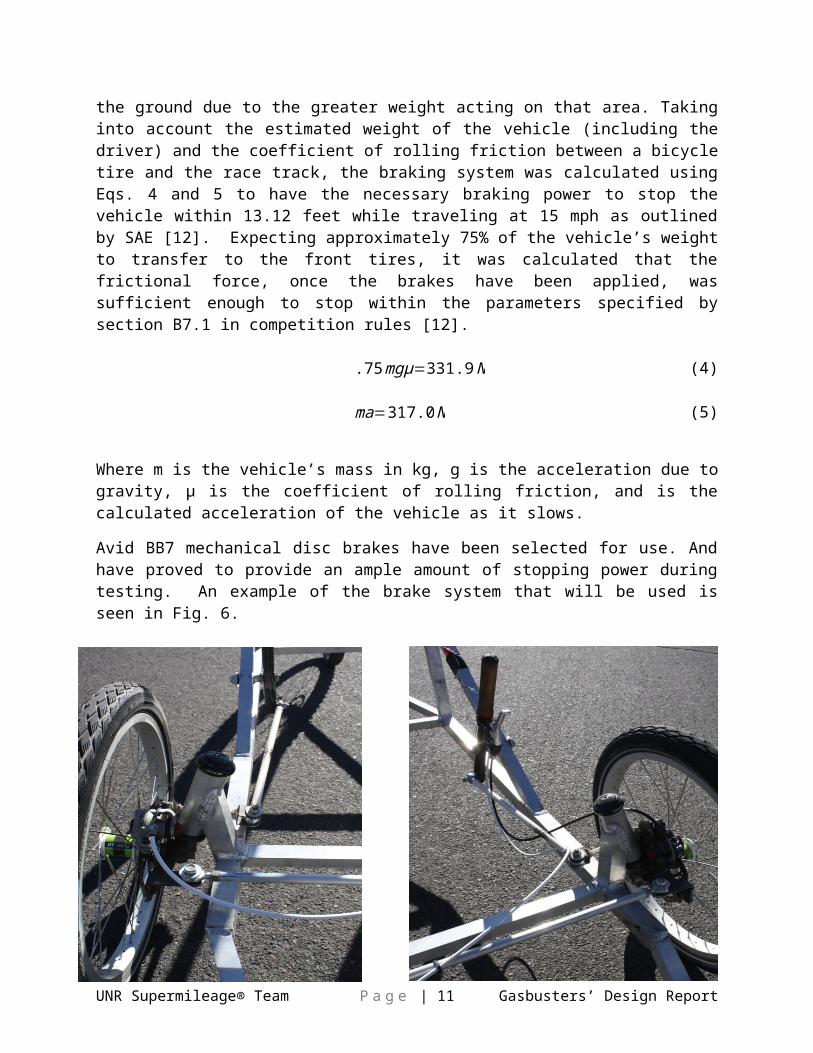
Avid BB7 mechanical disc brakes have been selected for use. And have proved to provide an ample amount of stopping power during testing. An example of the brake system that will be used is seen in Fig. 6.
UNR Supermileage® Team P a g e | 9 Gasbusters’ Design Report
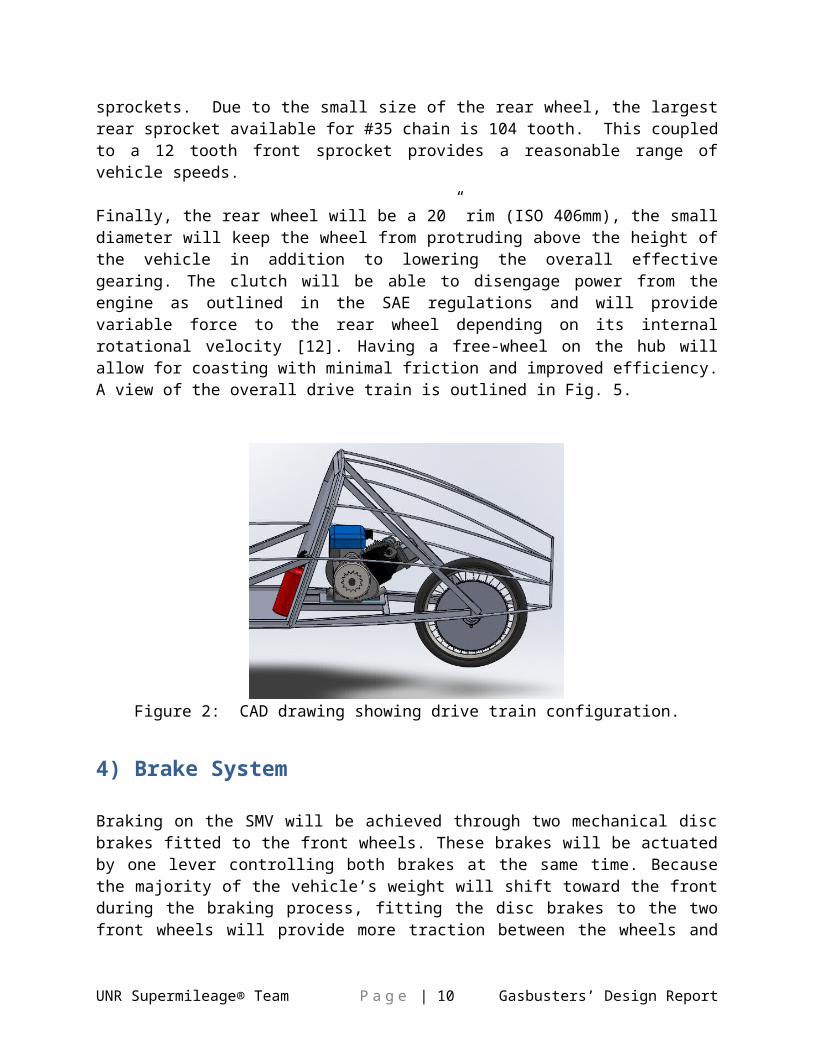
Figure 6: SMV chassis outfitted with disc brake set.
5) Suspension and Running Gear
When a vehicle turns, the inside wheel must follow a tighter curve than the outside wheel. To achieve this, the geometry of the steering must be arranged to turn the inside wheel through a larger angle than the outside wheel as seen below in Fig. 7. Ackerman steering geometry provides a simple solution to this problem [9]. With the steering design selected for the vehicle, a parallelogram shape is made with the steering assembly. Trigonometric evaluation of the dynamic parallelogram can be used to design a steering assembly with ideal turning characteristics following Ackerman geometry.
Figure 7: Example of front-wheel-steering vehicle with Ackerman geometry showing the
difference in angle between the inside and outside wheel.
When the vehicle is moving slowly, there is a kinematic condition between inner and outer wheels that allows them to turn slip-free. This condition is called the Ackerman condition and is expressed by Eq. 6 below where:
cot δ o−cot δi=wl
(6)
UNR Supermileage® Team P a g e | 10 Gasbusters’ Design Report
Full Ackerman geometry requires steering angles, inner wheel and outer wheel, as per Fig. 8 below. The angles are a function of turn center radius, wheel base, and track described by Eqs. (7) and (8).
δ o= tan−1 l
R+w /2 (7)
δ i=tan−1 l
R−w /2 (8)
To achieve ideal Ackerman geometry, the vehicle will be built with a symmetric four-bar linkage system, called a trapezoidal steering mechanism, similar to the one below in Fig. 9. Because the SMV will be traveling at relatively low speeds, slip conditions of the tires will be minimized so the Ackerman geometry will be valid.
Figure 8: Example of trapezoidal steering mechanism used in SMV with ideal Ackerman geometry design orientation.
UNR Supermileage® Team P a g e | 11 Gasbusters’ Design Report
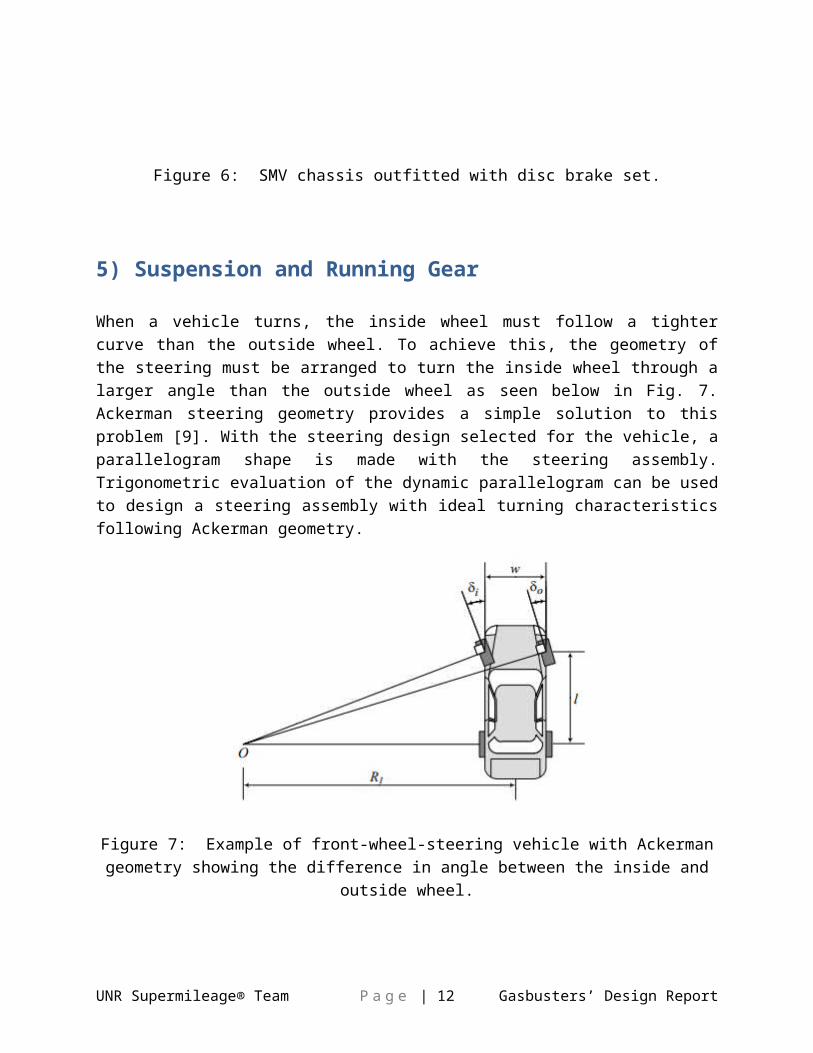
Figure 9: Illustration of how Ackerman geometry will be achieved on the SMV. The red line lies from rear axle center to the steering pivot center. To achieve ideal Ackerman geometry the attach point of the track rod must lie
on this red line.
Using the above equations and concepts, the angle of the wheels can be predicted to achieve a desired turning radius. This will be valuable when designing the fairing of the vehicle to predict tire clearance demands. By understanding Ackerman geometry and applying it to the SMV, it will have ideal turning characteristics, leading to more efficient kinematics. This geometry results in the inside wheel turning through a smaller radius than the outside wheel allowing the vehicle to travel around a curve without scrubbing the tires.
Steering will be actuated by a tank-style steering system that allows ease of use as well as easy access in and out of the vehicle. The brakes will be controlled with the left hand and throttle control on the right hand. An example of the steering system used in the SMV can be seen below in Fig. 10.
UNR Supermileage® Team P a g e | 12 Gasbusters’ Design Report
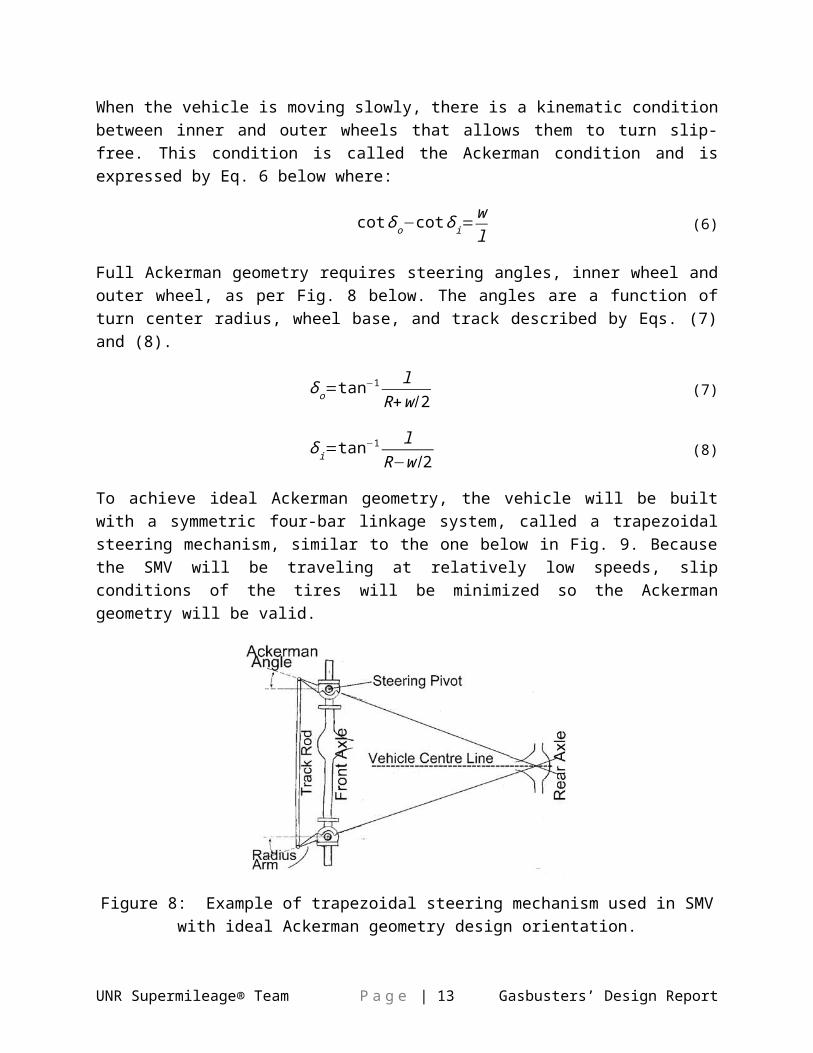
Figure 10: Solidworks assembly model of the steering system.
Due to the relatively smooth conditions at the Eaton Proving Grounds, a very limited suspension system will be required and therefore will be provided through pneumatic tires. Pneumatic tires have a contact patch with the ground proportional to the load on the tire and inversely proportional to the tire pressure. As the tire rolls over imperfections in the road, it deforms around the imperfection and provides the required suspension action. Optimizing the system will be a simple task as it will only require that the tire pressure be adjusted.
Rolling resistance is also heavily effected by tire pressure. When the tire pressure is low, it will deform, allowing for increased suspension; however rolling resistance also increases due to the larger contact patch. Inversely, as the tire pressure increases, the tire will deform less, decreasing the suspension but reducing the rolling resistance. It is important to find the equilibrium that will optimize suspension versus resistance.
Another aspect that contributes to the tire’s deformation is the tire width. Figure 11 below shows how the contact patch shape, as well as the total deformation, changes with tire width. In general, a wider tire will roll more efficiently than a narrow one. In the SMV, the increased pneumatic suspension and decreased rolling resistance of the smaller and wider tire offers the greater benefit.
UNR Supermileage® Team P a g e | 13 Gasbusters’ Design Report
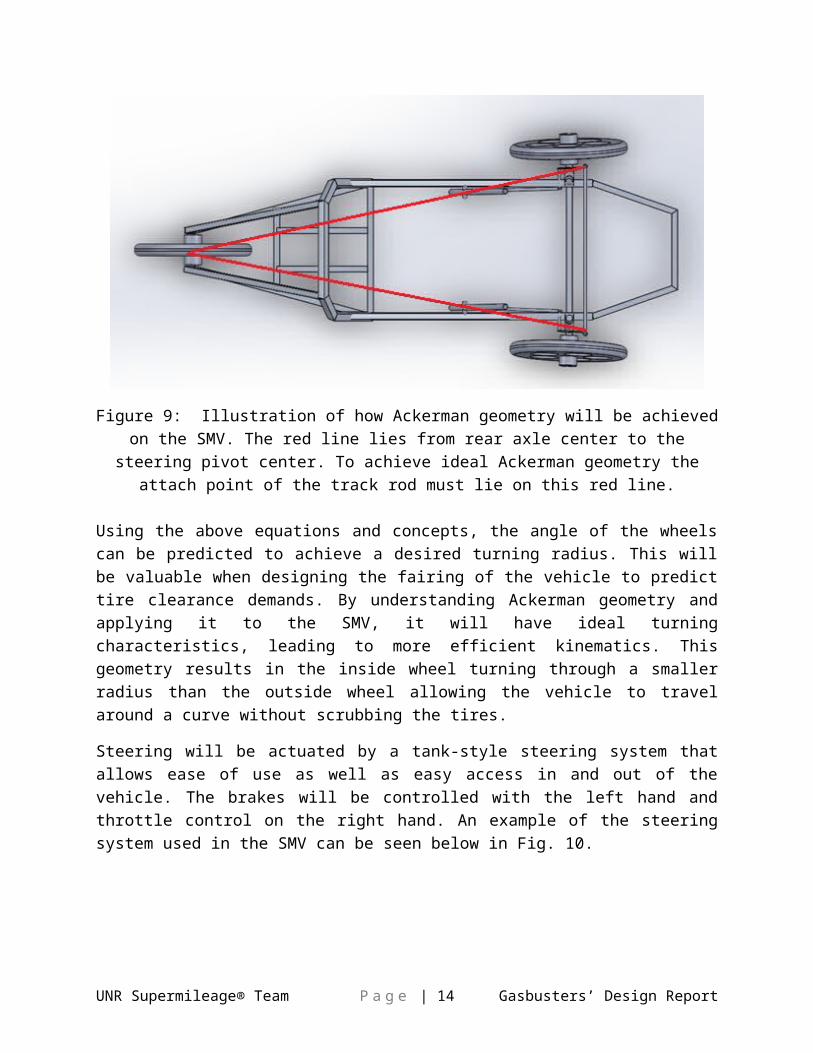
Figure 11: A comparison of wide and narrow tire contact patches, and their effects on rolling resistance (“Tire Rolling Resistance”).
Team Gasbusters was inspired by the efficiency of road bikes when designing the geometry of the front tires. Standard road bikes normally use a front head tube angle of 72°-73° from horizontal on large 700C tires. This is a good starting point, but because we will be using much smaller 20” wheels in the front the vehicle, a shallower rake will be used to maintain similar trail numbers. Figure 12 shows the rake angle of a road bike tire (72°), its subsequent trail, and the rake required to produce the same trail in a 20” wheel, which is about 66.3°. Generally, a larger amount of trail increases the wheel’s effective caster angle.
UNR Supermileage® Team P a g e | 14 Gasbusters’ Design Report
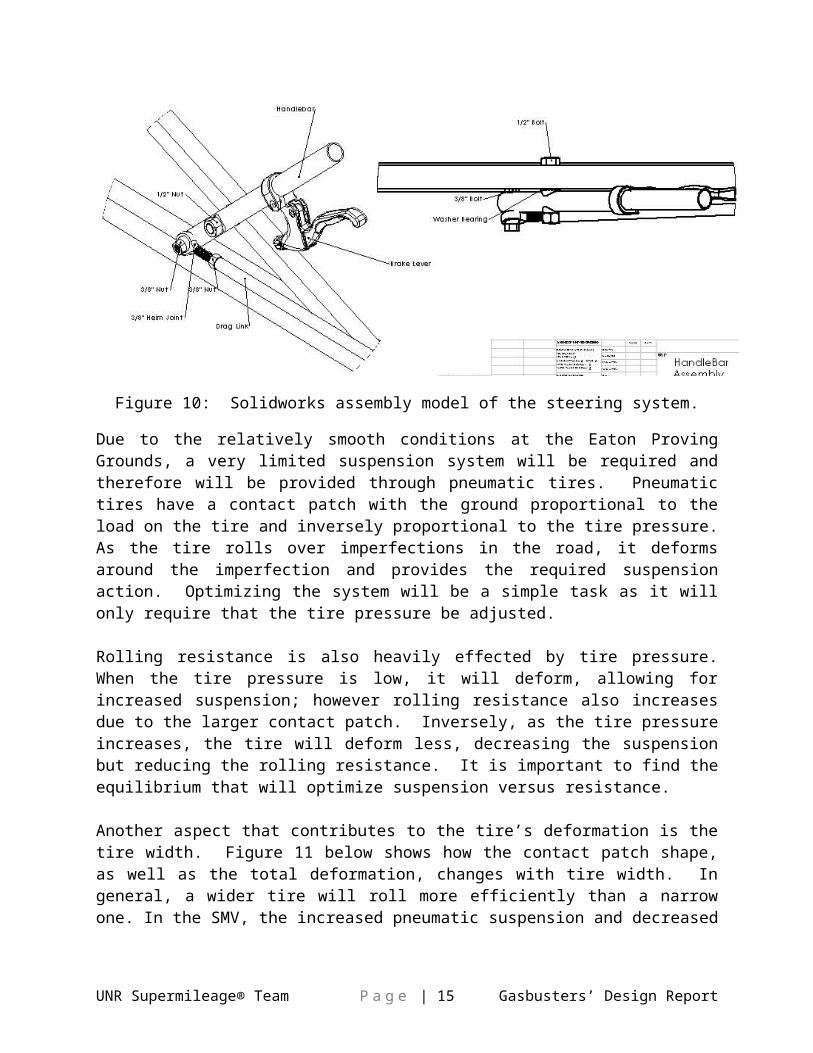
Figure 12: Rake representation. Angles are not shown, but the large wheel rake is at 72° and the smaller wheel rake is 66.3°.All measurements
displayed are in inches.
6) Body/Aerodynamic Shell
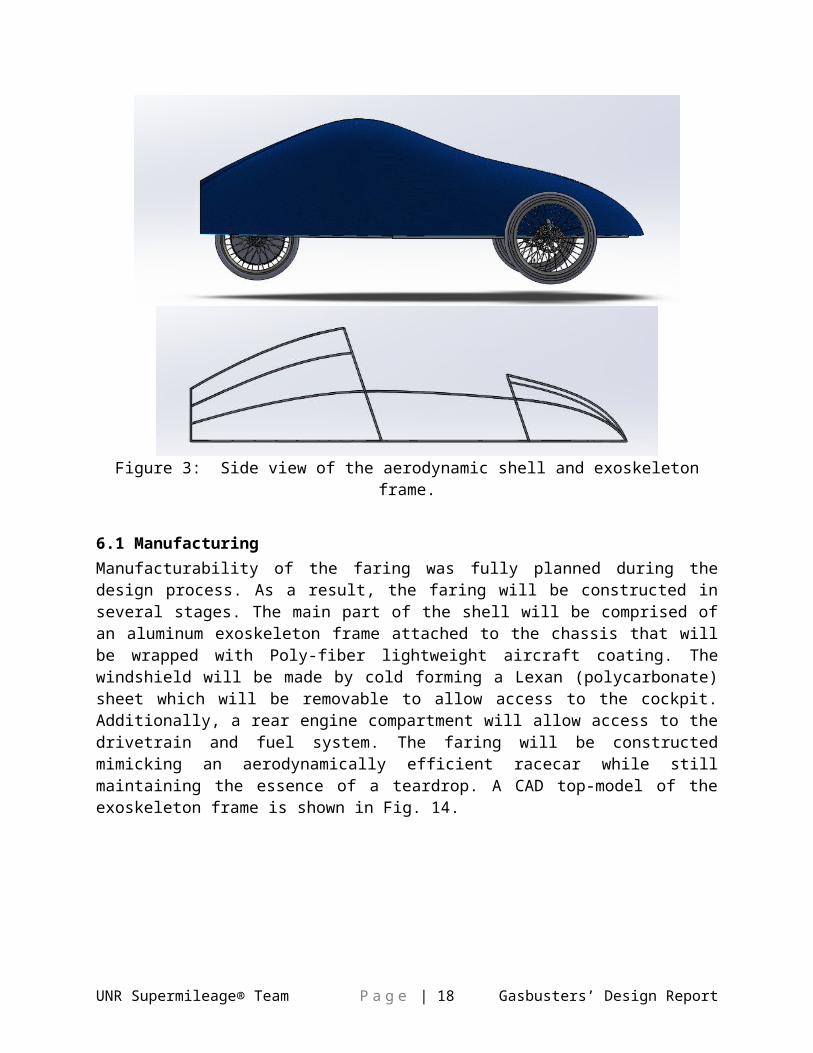
The aerodynamic shell of the vehicle was designed with manufacturability, functionality, and cost in mind. Importance can also be ranked in that order. The vehicle will be fully encompassed in the faring with the exception of the front wheels which are placed outside for functionality purposes. Faring design was executed with the goal of creating a simplistic, low drag shape. A simple aerodynamic racecar design was emulated and is most prominent when viewing the vehicle from the side as is shown in Fig. 13.
UNR Supermileage® Team P a g e | 15 Gasbusters’ Design Report
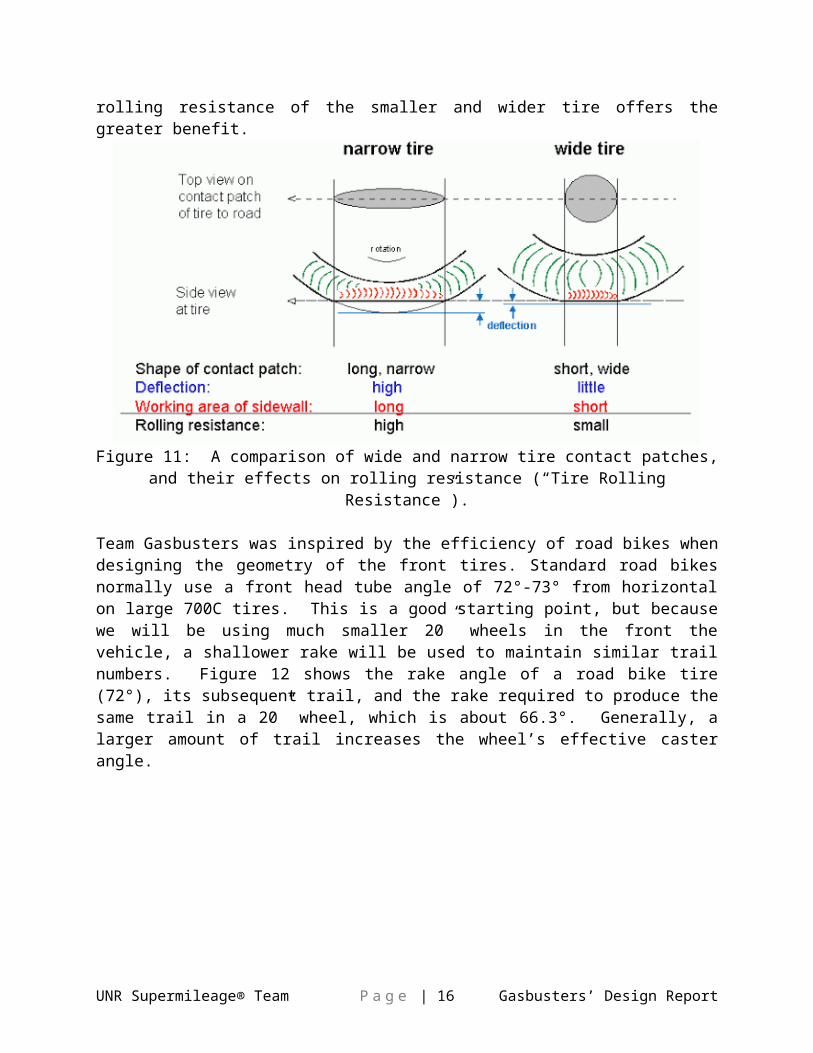
Figure 3: Side view of the aerodynamic shell and exoskeleton frame.
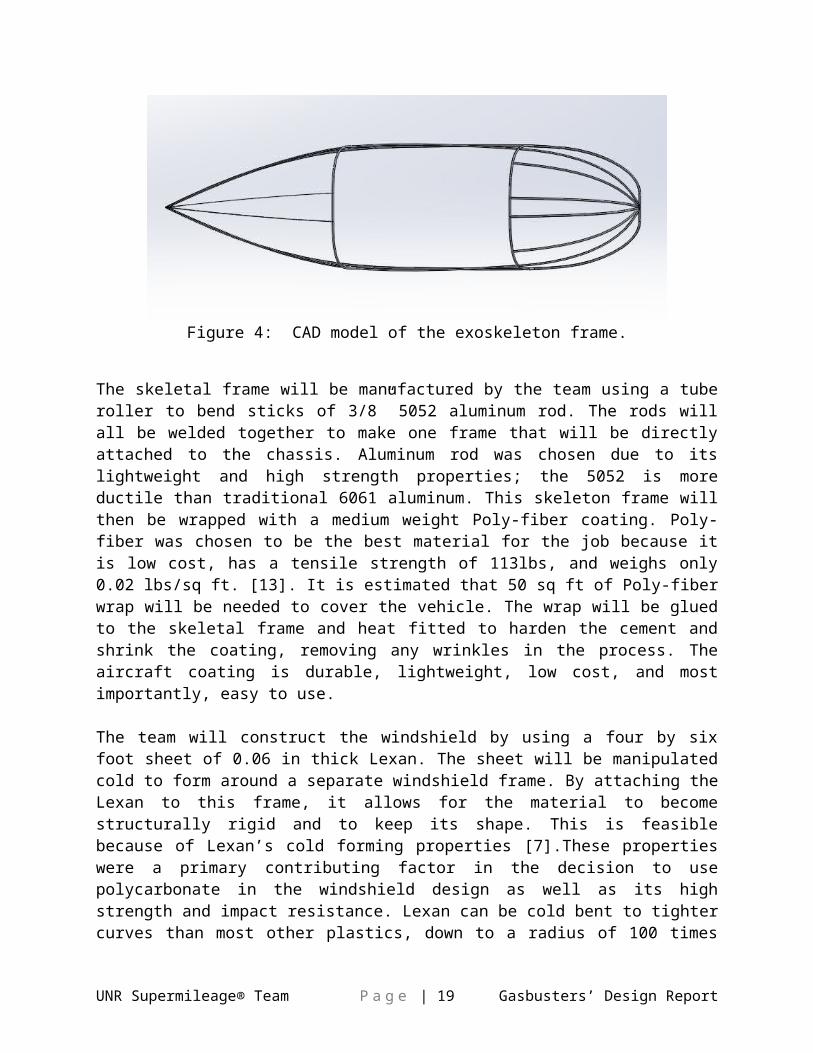
6.1 ManufacturingManufacturability of the faring was fully planned during the design process. As a result, the faring will be constructed in several stages. The main part of the shell will be comprised of an aluminum exoskeleton frame attached to the chassis that will be wrapped with Poly-fiber lightweight aircraft coating. The windshield will be made by cold forming a Lexan (polycarbonate) sheet which will be removable to allow access to the cockpit. Additionally, a rear engine compartment will allow access to the drivetrain and fuel system. The faring will be constructed mimicking an aerodynamically efficient racecar while still maintaining the essence of a teardrop. A CAD top-model of the exoskeleton frame is shown in Fig. 14.
UNR Supermileage® Team P a g e | 16 Gasbusters’ Design Report
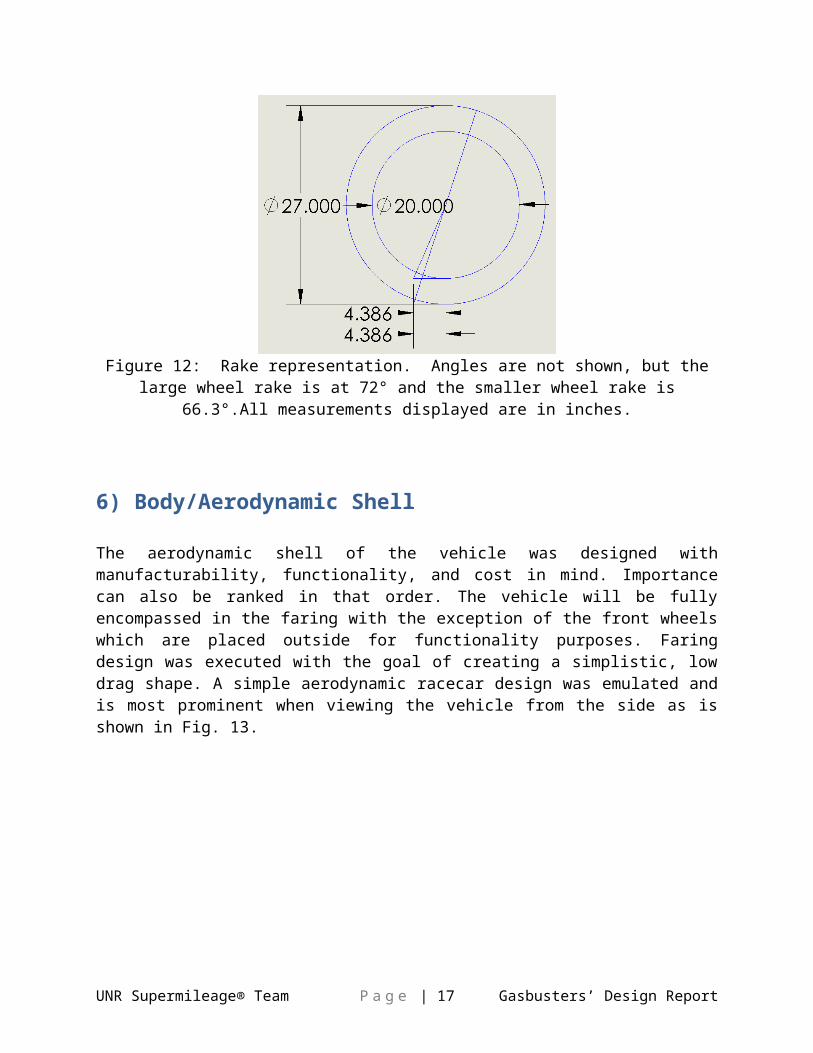
Figure 4: CAD model of the exoskeleton frame.
The skeletal frame will be manufactured by the team using a tube roller to bend sticks of 3/8” 5052 aluminum rod. The rods will all be welded together to make one frame that will be directly attached to the chassis. Aluminum rod was chosen due to its lightweight and high strength properties; the 5052 is more ductile than traditional 6061 aluminum. This skeleton frame will then be wrapped with a medium weight Poly-fiber coating. Poly-fiber was chosen to be the best material for the job because it is low cost, has a tensile strength of 113lbs, and weighs only 0.02 lbs/sq ft. [13]. It is estimated that 50 sq ft of Poly-fiber wrap will be needed to cover the vehicle. The wrap will be glued to the skeletal frame and heat fitted to harden the cement and shrink the coating, removing any wrinkles in the process. The aircraft coating is durable, lightweight, low cost, and most importantly, easy to use.
The team will construct the windshield by using a four by six foot sheet of 0.06 in thick Lexan. The sheet will be manipulated cold to form around a separate windshield frame. By attaching the Lexan to this frame, it allows for the material to become structurally rigid and to keep its shape. This is feasible because of Lexan’s cold forming properties [7].These properties were a primary contributing factor in the decision to use polycarbonate in the windshield design as well as its high strength and impact resistance. Lexan can be cold bent to tighter curves than most other plastics, down to a radius of 100 times the thickness. In this specific case the Lexan can be bent around a six inch radius curve which is more than enough to make a smooth streamline windshield for the vehicle. The windshield will be removable by lifting it vertically from the vehicle and will provide sufficient visibility.
Figure 15 shows the idealized drawing of the aerodynamic shell; a detailed drawing of the aerodynamic shell can be found in Appendix A. The windshield is not shown in these drawings because its exact shape is not
UNR Supermileage® Team P a g e | 17 Gasbusters’ Design Report
finalized. The blue portion of the faring represents the Poly-fiber coating and the skeletal frame can be seen extruding slightly out of the fabric. This drawing is an ideal representation of what will be constructed and is not an exact representation. The belly of the vehicle will be completely covered using very thin aluminum sheeting, sealing the cockpit from outside air and protecting the driver from any hazards on the ground.
Figure 5: CAD model of the idealized aerodynamic shell.
As demonstrated, manufacturability without sacrificing performance was at the forefront of the design. As a result, UNR’s team has designed an aerodynamic shell that will perform well while keeping costs low.
6.2 Performance AnalysisAnalysis of the design prior to building is crucial. To do so, the idealized aerodynamic shell was fully modeled in Solidworks using computational fluid dynamics (CFD) in the built in flow simulator. The goal for this analysis was to determine that the drag coefficient of the vehicle under specified conditions was acceptable. The drag coefficient was calculated by obtaining the total drag force using CFD and applying Eq. 9; where Cd is the drag coefficient, Fd is the resultant drag force, V is the set airspeed velocity, is the density of air at standard temperature and pressure, and A is the total frontal area of the vehicle.
UNR Supermileage® Team P a g e | 18 Gasbusters’ Design Report
Cd=Fd
12ρV 2 A
(9)
The CFD simulation was executed using three different scenarios. First, the ideal situation was tested. A head on wind speed of 18 mph was applied to the simulation. This value was chosen because it is the determined target speed for maximum efficiency for the vehicle. Included in the simulation was the aerodynamic shell, the belly pan of the vehicle, and the exposed portion of the wheels. The resultant pressure distribution about the vehicle and velocity following the fluid path lines around the vehicle surface is shown in Figs. 16 and 17 respectively.
Figure 6: Pressure distribution about faring with a head on wind speed of 18 mph; ideal situation.
UNR Supermileage® Team P a g e | 19 Gasbusters’ Design Report
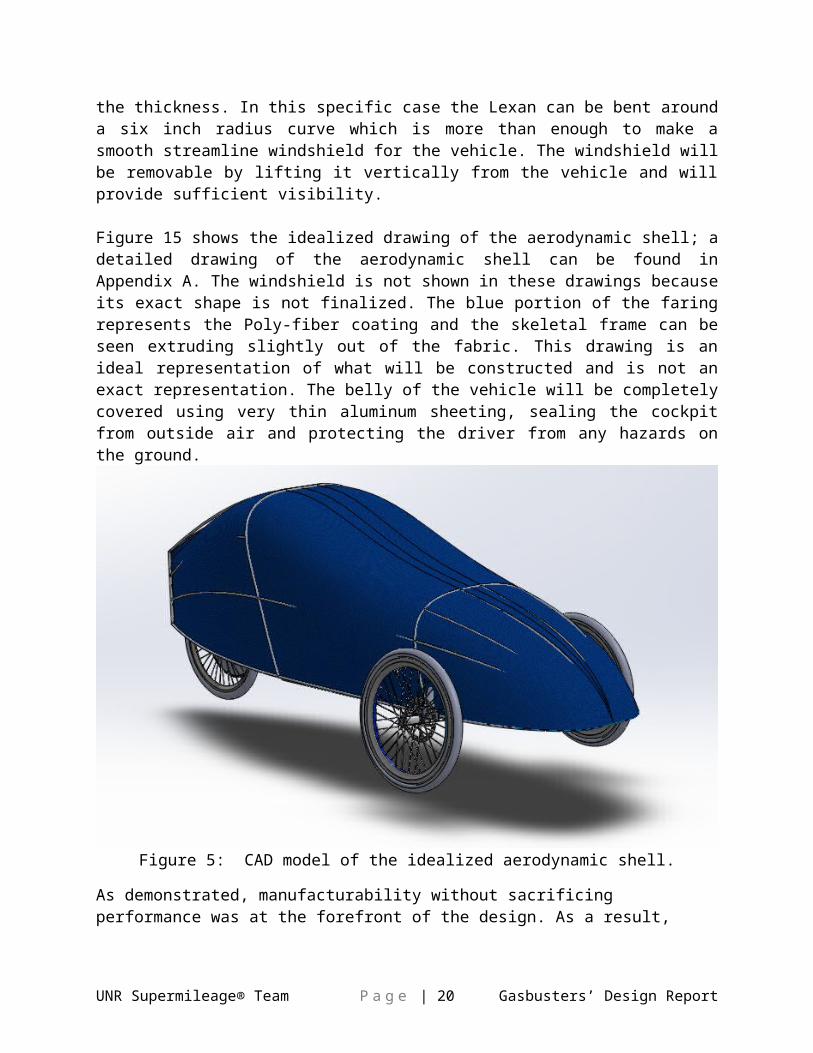
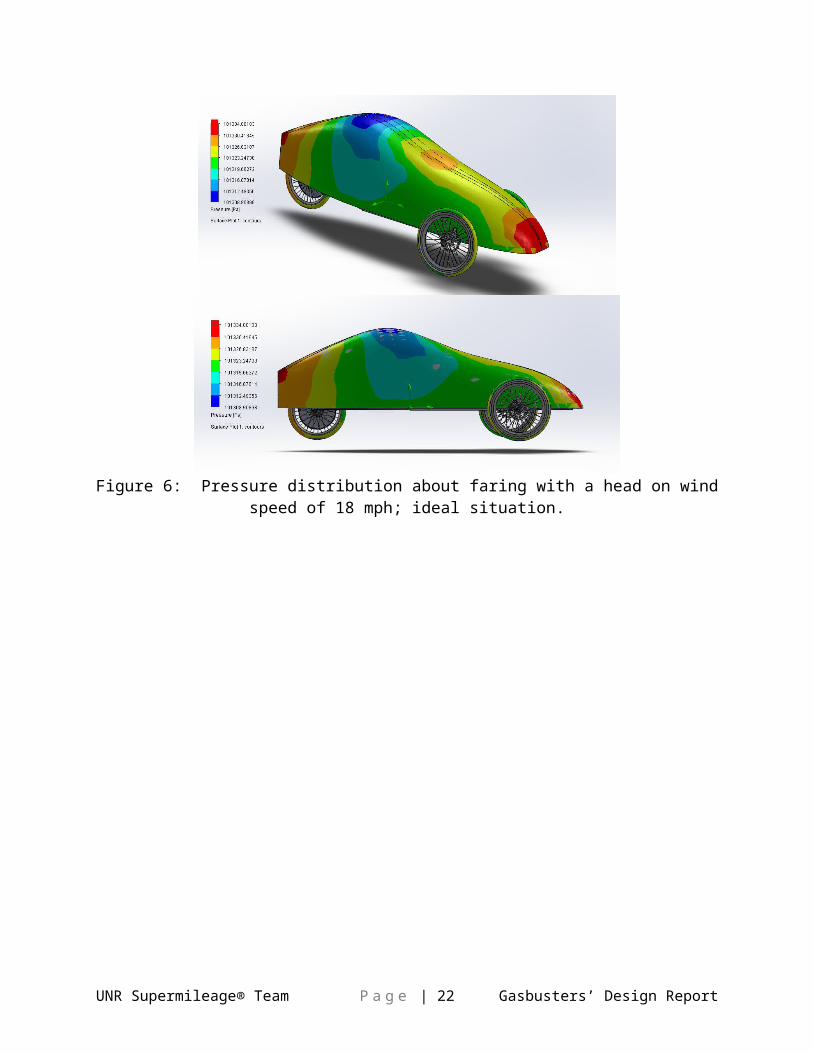
Figure 7: Velocity in the direction of travel following fluid particle path lines around the vehicle with a head on wind speed of 18 mph.
The resultant drag force on the vehicle in the direction of travel was 3.4 N. With a frontal area of 0.474 m2, the resultant coefficient of drag is 0.18. This is the peak aerodynamic performance of our faring in an ideal situation.
The second scenario takes into consideration a head wind. The average wind speed in Marshall, MI in June is approximately 7 mph [4]. As a result, the simulation was conducted assuming a total air speed of 25 mph. The resultant drag force was found to be 10.3 N which yields a drag coefficient of 0.28. This is a more realistic performance measure of our aerodynamic shell.
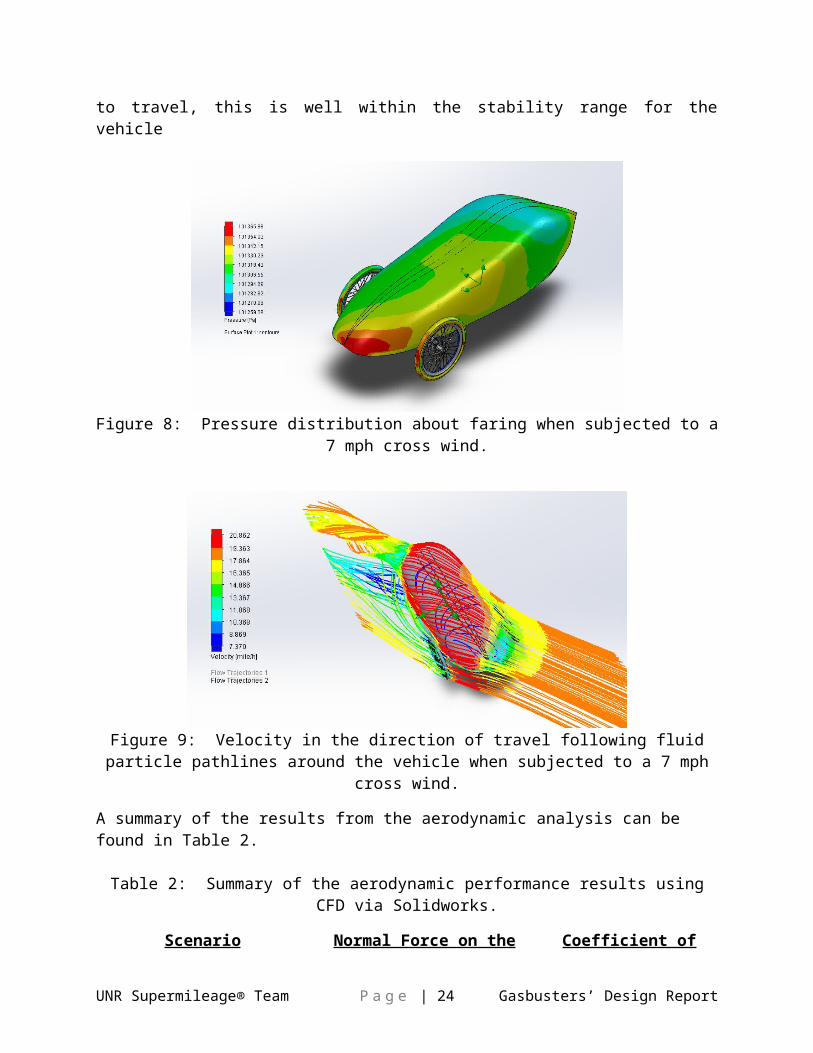
The last scenario to be taken into consideration was a crosswind perpendicular to the vehicle. Again the average wind speed in Marshall, MI in June was applied. The resultant pressure distribution and airflow around the vehicle is shown in Figs. 18 and 19 respectively. The resultant force on the vehicle in the direction parallel to that of travel is approximately 7.8 N which yields a drag coefficient of 0.41. Additionally this cross wind gives a force of 12.43 N (2.8 lbs) in the direction perpendicular to travel, this is well within the stability range for the vehicle
UNR Supermileage® Team P a g e | 20 Gasbusters’ Design Report
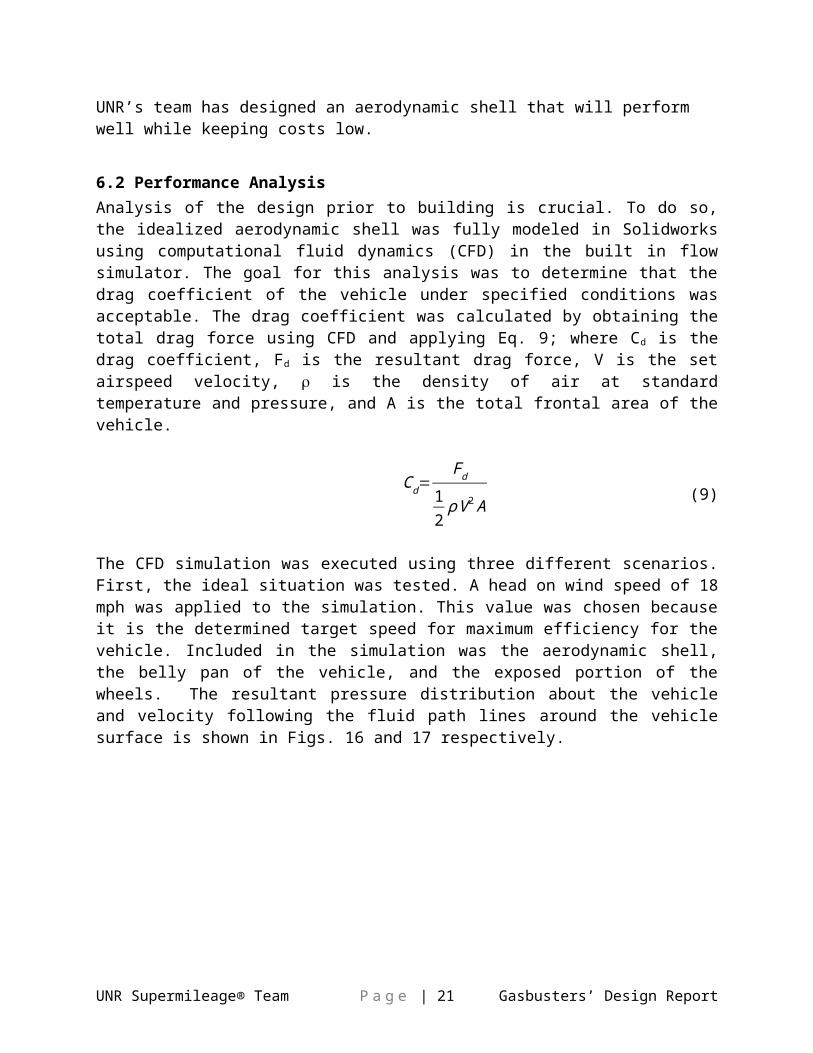
Figure 8: Pressure distribution about faring when subjected to a 7 mph cross wind.
Figure 9: Velocity in the direction of travel following fluid particle pathlines around the vehicle when subjected to a 7 mph cross wind.
A summary of the results from the aerodynamic analysis can be found in Table 2.
Table 2: Summary of the aerodynamic performance results using CFD via Solidworks.
Scenario Normal Force on the Vehicle
Coefficient of Drag
Head on wind, 18 mph
3.4 N parallel to travel 0.18
Head on wind, 25 mph
10.3 N parallel to travel 0.28
Head on wind, 18 7.8 N parallel to travel 0.41
UNR Supermileage® Team P a g e | 21 Gasbusters’ Design Report
mph90° crosswind, 7 mph
7) Performance
7.1 Speed CalculationsThe Briggs and Stratton Junior 206 model is capable of producing 8 HP at 4500 RPM. A centrifugal clutch generally engages at approximately 2000 RPM, but will be adjusted to engage at as low as 1000 RPM. These give the effective bounds on the engine operation. Calculations were made given the clutch has a 12 tooth sprocket, and a rear has a 104 tooth sprocket.
Table 3: Excel calculations of vehicle speed based on RPM.
Diameter(in)
Circumference(in)
Circumference(miles)
18 56.55 0.000892
Engine Speed(RPM)
Front Sprocket
(# of teeth)
Rear Sprocket
(# of teeth)
Wheel Speed(RPM)
Vehicle Speed(mph)
4500 12 104 562.5 30.1223600 12 104 450 24.0972700 12 104 337.5 18.0731000 12 104 125 6.6937
This gives a theoretical low speed of 6.69 mph when the clutch fully engages, and a top speed of 30.12 mph. The highest efficiency should be near the engines peak torque. From Fig. 20 below, peak torque should be around 2700-3000 RPM, which correlates to a speed of 18-20 mph. This is ideal because the lower speed will lead to lower rolling resistance and aerodynamic drag. Team Gasbusters plans to run the engine long enough to reach this target speed, kill the engine, and coast for as long as possible before restarting the engine while maintaining an average speed of 15 mph.
UNR Supermileage® Team P a g e | 22 Gasbusters’ Design Report
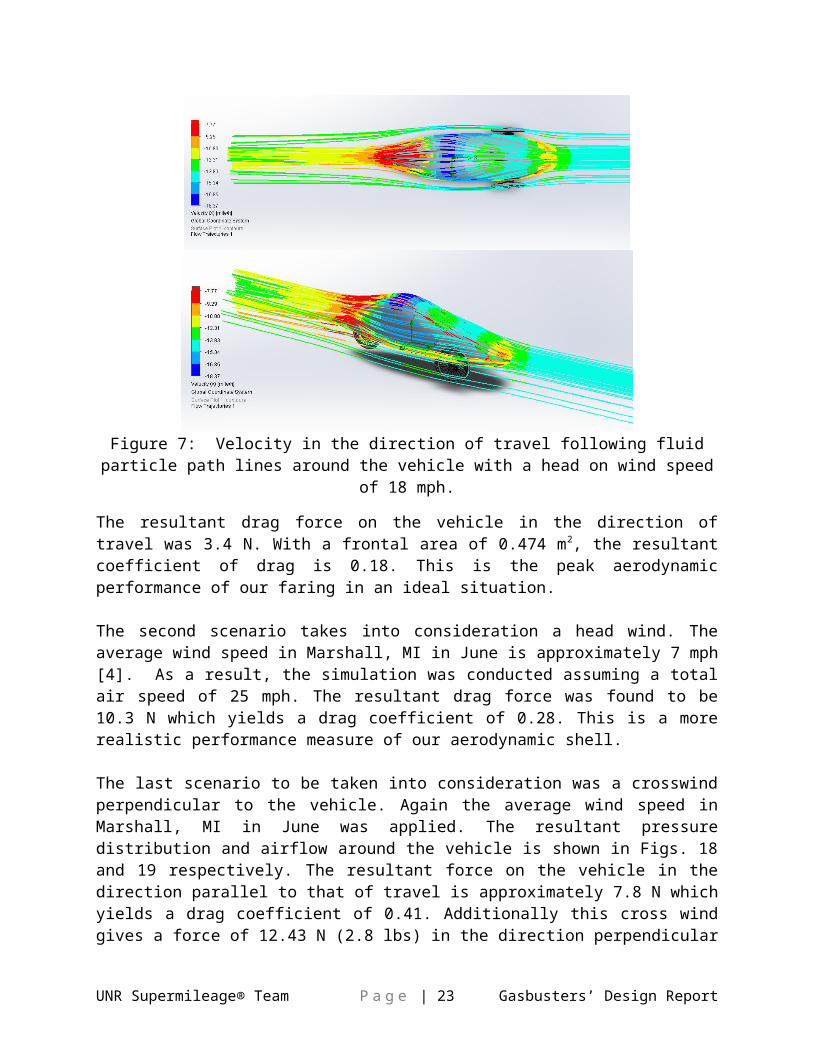
Figure 10: HP and Torque curves of a Briggs and Stratton Junior 206 motor [1].
7.2 Fuel Economy CalculationsIn order to calculate the fuel economy of the vehicle, we first had to determine the amount of force required to maintain a certain vehicle speed. The two primary components of drag on a vehicle are rolling resistance from the tires and aerodynamic drag. The rolling resistance is a function of vehicle weight, and the coefficient of rolling resistance. The coefficient of rolling resistance is dependent on tire pressure and vehicle velocity. The coefficient of rolling resistance and the force due to rolling resistance were approximated using Eqs. 10 and 11 [10].
C r (p , v )=.005+1 ¿̄P [ .01+.0095( v
100kph )2]¿ (10)
F r (p , v ,m )=C r ( p , v )mg (11)
Where P represents tire pressure, v represents the vehicle’s velocity, and m is the vehicle’s mass.
The force due to aerodynamic drag is calculated using a similar equation which uses the velocity, area, and coefficient of drag and is shown in Eq. 12.
Fd (v , A ,Cd )=.5 ρ v2Cd A (12)
Where v is again the vehicle velocity, A is the frontal area of the vehicle, and Cd is the coefficient of drag. The frontal area was estimated using the Solidworks model. The coefficient of drag was also determined through
UNR Supermileage® Team P a g e | 23 Gasbusters’ Design Report
Solidworks’ CFD analysis as is referenced in Section 6 (Body/Aerodynamic Shell) of this report.
The sum of these two forces is the total force required to maintain the vehicle’s speed. Multiplying the force by the speed gives the power required. Because the energy content of isooctane is known, the rate of fuel required to maintain a speed is easily calculated.
Power (P ,v ,m , A ,Cd )=Fd (v , A ,Cd )+F r (P ,v ,m )
ɳ t
∙ v (13)
econ ( p , v ,m , A ,Cd )=[Power (P ,v ,m, A ,Cd )(5460 kJmol )
−1
∙h r20mi ]
−1
∙mol
114.23 g∙692
mgmL
(14)
Where P, v, m, and A are the same as listed previously and h is representative of the engine’s efficiency.
When these equations are applied to our best estimates of our vehicle’s dimensions, we can obtain an estimate of our projected power and fuel economy shown in Eqs. 15 and 16.
Power (80 psi ,20mph ,260 lbm ,.474m2 , .28 )=0.928HP (15)
econ (80 psi ,20mph ,260 lbm ,.474m2 , .28 )=1.006×10³MPG (16)
Because our vehicle is not fully built yet, we had no way of testing these equations. In order to see if these equations would work, they were applied to one of the team member’s cars, a 2001 Audi S4 Avant (wagon). The team member reported an average highway fuel economy of between 20 and 21 MPG over the Sierra Nevada range at 70 mph. Eqs. 13 and 14 were again applied and the results are shown in Eqs. 17 and 18.
Power (28 psi ,70mph ,3904 lbm ,.474m2, .32 )=158.985HP (17)
econ (28 psi ,70mph ,3904 lbm ,2.03m2 , .32 )=20.536MPG (18)
The result is surprisingly close to real world with the error being less than variations due to factors such as wind conditions. These calculations assume the drive train has a similar efficiency to what we estimate our vehicle to have. Still, we expect this model to be within 10% accuracy for the fuel economy at the competition. Detailed calculations on the vehicle’s power output and fuel economy can be found in Appendix B.
UNR Supermileage® Team P a g e | 24 Gasbusters’ Design Report

8) Cost Estimate and Manufacturing Methods
No professional services will be or have been employed in the manufacturing of the vehicle. The University of Nevada, Reno has a full machine shop with lathes, mills, band saws, belt sanders, and a new 5-axis CNC. The team utilized manufacturing techniques such as TIG welding, MIG welding, grinding, milling, turning, drilling, and tapping. These techniques were performed by the team in order to complete the vehicle to the time of this report. Team Gasbusters will have to utilize tube rolling and fabric molding in the future to finish the construction of the shell and windscreen.
Costs were kept as low as possible in constructing the vehicle due to inadequate funds from the university. The team has fundraised and requested funds in order to supplement the cost of the build. However, there is still a very limited budget. Table 1 in Appendix C shows the total cost of the Supermileage vehicle. As shown in the table, Team Gasbusters reduced the As-Built Cost by reusing parts from previous club generations as well as utilizing a sponsorship from MSM Sheet Metal located in Sparks Nevada.
The total costs and savings of the vehicle construction are summarized below in Table 4. The estimated total cost of the 2015 Nevada SMV Supermileage vehicle is $989.73, which is significantly less than the As-Built Cost. The cost of competing and of the trip to Michigan is negated form this report because Nevada SMV does not consider it to be within the scope of vehicle considerations.
Table 4: Cost analysis of the 2014 – 2015 Nevada SMV vehicle including the difference between Actual Cost to the club and As-Built Cost.
As-Built Cost Actual Cost Difference$2,855.93 $989.73 $1,866.20
9) Driver Safety Features
UNR Supermileage® Team P a g e | 25 Gasbusters’ Design Report

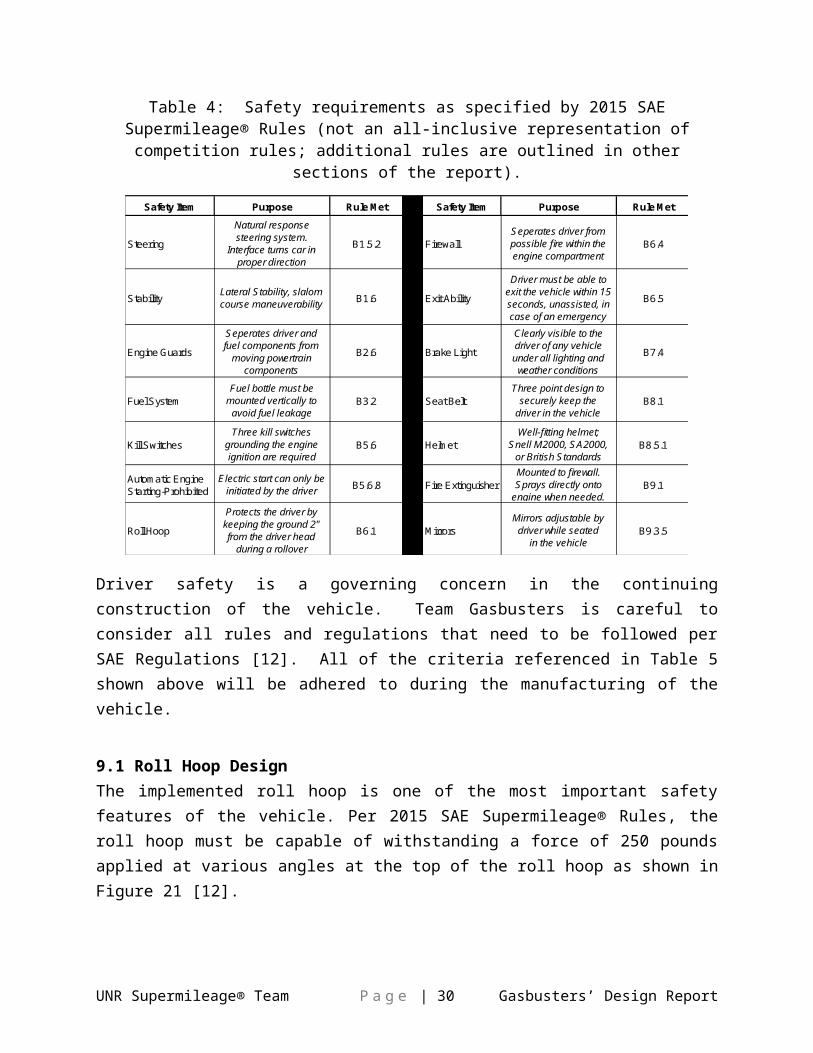
Table 4: Safety requirements as specified by 2015 SAE Supermileage® Rules (not an all-inclusive representation of competition rules; additional
rules are outlined in other sections of the report).
Safety Item Purpose Rule Met Safety Item Purpose Rule Met
Steering
Natural response steering system.
Interface turns car in proper direction
B1.5.2 FirewallSeperates driver from possible fire within the engine compartment
B6.4
StabilityLateral Stability, slalom course maneuverability B1.6 Exit Ability
Driver must be able to exit the vehicle within 15 seconds, unassisted, in case of an emergency
B6.5
Engine Guards
Seperates driver and fuel components from
moving powertrain components
B2.6 Brake Light
Clearly visible to the driver of any vehicle under all lighting and weather conditions
B7.4
Fuel SystemFuel bottle must be
mounted vertically to avoid fuel leakage
B3.2 Seat BeltThree point design to
securely keep the driver in the vehicle
B8.1
Kill SwitchesThree kill switches
grounding the engine ignition are required
B5.6 HelmetWell-fitting helmet;
Snell M2000, SA2000, or British Standards
B8.5.1
Automatic Engine Starting-Prohibited
Electric start can only be initiated by the driver B5.6.8 Fire Extinguisher
Mounted to firewall. Sprays directly onto
engine when needed.B9.1
Roll Hoop
Protects the driver by keeping the ground 2" from the driver head
during a rollover
B6.1 MirrorsMirrors adjustable by driver while seated
in the vehicleB9.3.5
Driver safety is a governing concern in the continuing construction of the vehicle. Team Gasbusters is careful to consider all rules and regulations that need to be followed per SAE Regulations [12]. All of the criteria referenced in Table 5 shown above will be adhered to during the manufacturing of the vehicle.
9.1 Roll Hoop DesignThe implemented roll hoop is one of the most important safety features of the vehicle. Per 2015 SAE Supermileage® Rules, the roll hoop must be capable of withstanding a force of 250 pounds applied at various angles at the top of the roll hoop as shown in Figure 21 [12].
UNR Supermileage® Team P a g e | 26 Gasbusters’ Design Report
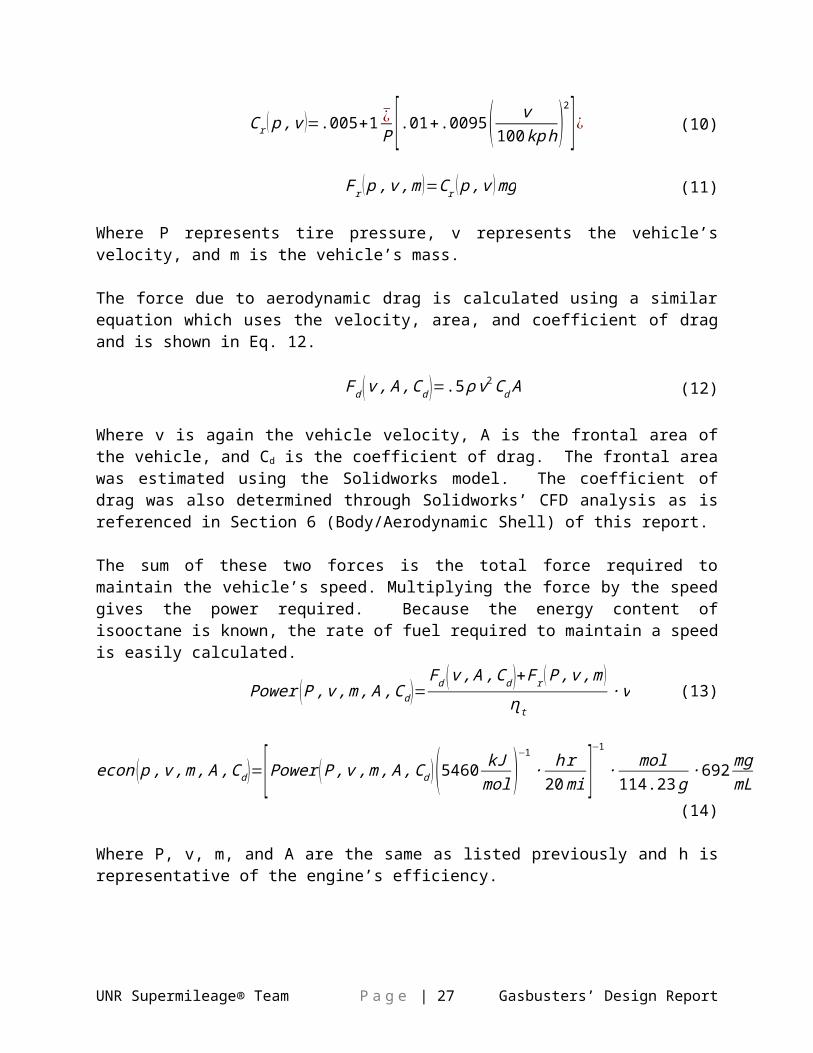
Figure 11: Indicates the necessary angles and magnitude of applied force the vehicle’s roll hoop must be able to withstand as well as the necessary
dimensions between the driver and roll hoop [12].
Finite element analysis (FEA) via Solidworks was utilized to evaluate the structural integrity of the roll hoop. To more realistically simulate the integrity of the roll hoop, analysis was done on the entire frame with the rear hub fixed and the front on a roller support. The roller support allows the frame to deform more naturally as it would in real life. This set up allows for deflection, giving realistic force and deflection values.
The material being used for the frame is 1 x 1 x 1/16" 6061 T6 and 1-1/4 x 1-1/4 x 1/8" 6061 T6 aluminum square tubing. The roll hoop as well as the main support members are the larger and thicker 1-1/4” 1/8” wall tubing. The rest of the frame is constructed from the smaller and thinner 1” 1/16” wall tubing. The team used the smaller size in order to maximize strength and minimize weight. When welding aluminum you can safely assume that the metal loses the heat treating properties. For this reason the frame was modeled in its entirety using T0 6061 aluminum. This was done as a worst case scenario. At a distance away from the welds the heat treatment is not lost. Table 6 below is a comparison of the yield strengths of 6061 T6 and 6061 T0 aluminum. Team Gasbusters’ factor of safety is in actuality between those listed on the table. The stress value in Fig. 23 was used to complete the values in this table.
Table 6: Factor of safety for 6061 T6 and 6061 T0 aluminum.
Heat Treatment T0 T6
Yield Strength 55 MPa 241MPaFactor of Safety 1.45 6.34
Figures 22 and 23 demonstrate the graphical results of applying a 250 lbf load in vertical and horizontal directions respectively on the roll hoop. The plots have been displayed at the same scale to make the stress distribution as a result of different loadings apparent.
UNR Supermileage® Team P a g e | 27 Gasbusters’ Design Report
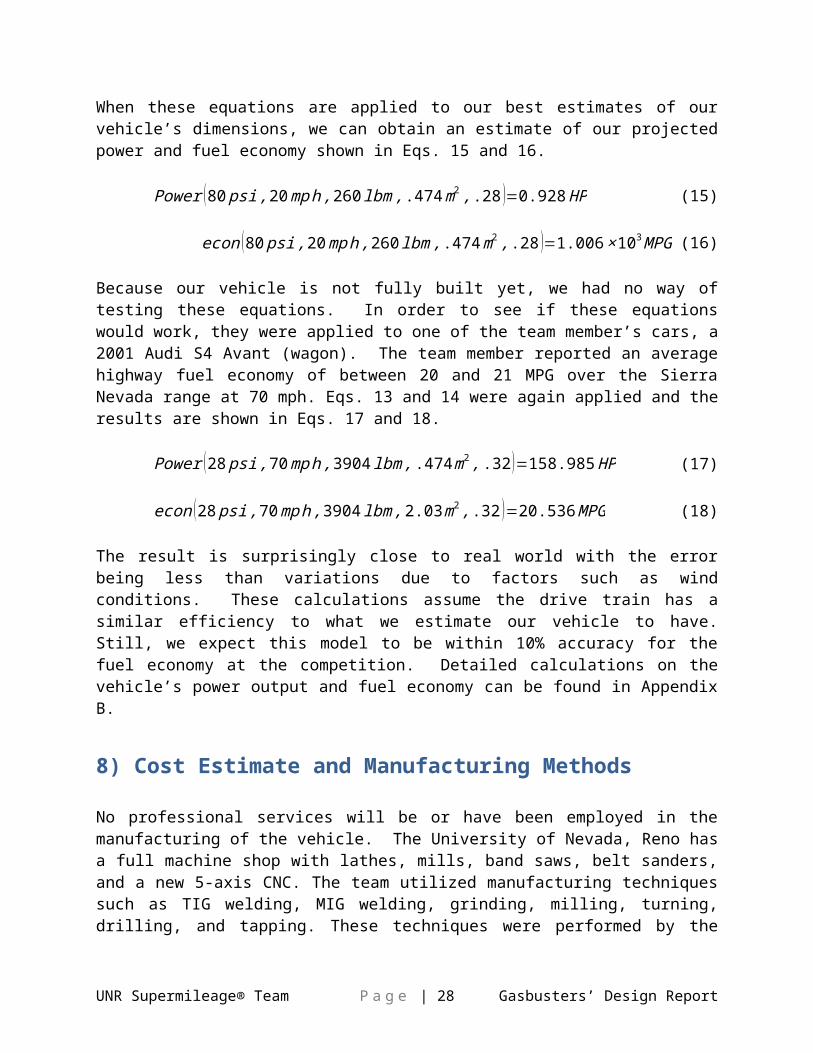
Figure 22: FEA results for a vertical load applied to the top member of the roll hoop.
.
Figure 23: FEA results for a horizontal load applied on the top member of the roll hoop.
As shown in the figures above, the force does not exceed the yield strength of 6061 T0 aluminum. For this reason, the roll hoop complies with the SAE regulations for roll hoop strength. Table 6 below summarizes the factor of safety for the loads in each direction. The table has both heat treated and non-heat treated factor of safety values.
Table 7: Summary of the FEA results with an applied load of 250 lbf on the top member of the roll hoop in different directions along with their factors
of safety.
Force Direction
Resultant Force (Mpa)
T0 Factor of Safety
T6 Factor of Safety
Downward 38.5 1.42 6.26
Positive X-axis 34.96 1.57 6.89
Negative X-axis 41.14 1.33 5.86
UNR Supermileage® Team P a g e | 28 Gasbusters’ Design Report
45 Degree Xaxis
51.09 1.07 4.17
45 Degree -X-axis
16.97 3.24 14.2
Average 36.532 1.726 7.476
10) References1. "About Briggs & Stratton." Lawn Mower Parts & Small Engine Parts
by Briggs & Stratton. N.p., n.d. Web. 29 Mar. 2015.
< https://www.briggsandstratton.com/us/en/engines/racing-
engines/~/media
/Racing/ms5701.ashx >.
2. "Adiabatic Process." Encyclopedia 2. N.p., n.d. Web. 29 Mar. 2015.
<http://encyclopedia2.thefreedictionary.com/Adiabatic+heating>.
3. "Adiabatic Process." Adiabatic Process. N.p., n.d. Web. 29
Mar. 2015.
<http://www.princeton.edu/~achaney/tmve/wiki100k/Adiabatic_proce
ss>.
4. "Average Weather For Marshall, Michigan, USA." WeatherSpark Beta.
N.p., n.d. Web. 29 Mar. 2015.
<http://weatherspark.com/averages/31484/Marshall-Michigan-
United-States>.
5. "Cadence." Sheldon Brown's Bicycle Glossary. N.p., n.d. Web. 29 Mar.
2015. <http://sheldonbrown.com/gloss_ca-g.html>.
6. "Flatheads - History." Flatheads - History. N.p., n.d. Web. 29 Mar.
2015.
<http://midstateantiquestockcarclub.com/flat_heads1.html>.
UNR Supermileage® Team P a g e | 29 Gasbusters’ Design Report
7. "How to Form, Fabricate, and Finish Lexan Sheet." Mulford Plastics.
N.p., n.d. Web. 29 Mar. 2015.
<http://www.mulfordplastics.com/LiteratureRetrieve.aspx?
ID=77007 >.
8. “Ackerman? Or not? Does it matter?” Dale Thompson, n.d. Web 29
Mar. 2015.
<http://web.archive.org/web/20130718010927/http://www.me.ua.edu/
me364/P
DF/Steering_Ackerman.pdf>
9. “Steering Geometry Ackerman Angle” N.p., n.d. Web 29 Mar. 2015
<http://teflonmike.craywiki.co.uk/0_Lo_050_Theory_B_016_Steering01
.htm>
10. "Tire Rolling Resistance." Roues Artisanales. N.p., n.d. Web. 29
Mar. 2015. <http://www.rouesartisanales.com/article-1503651.html>.
11. "Rolling Resistance." Engineering Toolbox. N.p., n.d. Web. 29
Mar. 2015. <http://www.engineeringtoolbox.com/rolling-friction-
resistance-d_1303.html>.
12. "2015 SAE Supermileage Rules." SAE International. N.p., n.d.
Web. 29 Mar. 2015.
<http://students.sae.org/cds/supermileage/rules/2015supermileage_ru
les.pdf >.
13. “Poly-fiber Aircraft Coating.” N.p., n.d. Web. 29 Mar. 2015.
<http:// www.polyfiber.com/>.
UNR Supermileage® Team P a g e | 30 Gasbusters’ Design Report