sparta township environmental asbestos study
TRANSCRIPT

1
Sparta Township Environmental Asbestos
Study
Final Report of the Results of Air and House Dust Sampling
Final Report
Prepared by:
Paul Lioy, Ph.D. - EOHSI Junfeng Zhang, Ph.D. . - EOHSI
Natalie Freeman, Ph.D. . - EOHSI Lih-Ming Yiin, Ph.D. . - EOHSI
Robert Hague, Ph.D., C.I.H. . - EOHSI
Laboratory Analyses conducted by R.J. Lee Group Investigator: Robert J. Lee, Ph.D.
Additional analyses conducted by EMS Laboratories
Statistical Analysis conducted by Wayne Berman, Ph.D. – Areolas Inc.
Project Manager:
Alan H. Stern, Dr.P.H. NJ Department of Environmental Protection
October 4, 2002

2
Table of Contents
EXECUTIVE SUMMARY .........................................................................................................................................3
INTRODUCTION .......................................................................................................................................................8
APPROACHES TO ASBESTOS RISK ASSESSMENT .......................................................................................12
METHOD AND MATERIALS ................................................................................................................................13
RECRUITMENT, DATA COLLECTION AND MEASUREMENT .......................................................................................13 Dust Collection ..................................................................................................................................................13 Air Sampling ......................................................................................................................................................14
SAMPLING PROCEDURES..........................................................................................................................................17 Chain of Custody................................................................................................................................................17 Air Sampling ......................................................................................................................................................17 Dust Sampling....................................................................................................................................................19
METEOROLOGICAL DATA COLLECTION...................................................................................................................19 ANALYTICAL PROCEDURE .......................................................................................................................................20
Air Samples ........................................................................................................................................................20 Dust Samples......................................................................................................................................................20
QUALITY CONTROL PROCEDURES .................................................................................................................21
QUALITY CONTROL FOR QUESTIONNAIRE SURVEY OPERATIONS ............................................................................21 QUALITY CONTROL FOR FIELD ACTIVITIES .............................................................................................................21 FIELD AUDIT............................................................................................................................................................22 INTER AND INTRA LABORATORY QUALITY ASSURANCE (QC).................................................................................22
RESULTS...................................................................................................................................................................24
AIR SAMPLES...........................................................................................................................................................24 Air Sample QC Results.......................................................................................................................................25 Quarry Activity in Relation to Air Sampling ......................................................................................................26 Statistical Analysis and Risk Characterization of Air Sampling Data ...............................................................26
DUST SAMPLES........................................................................................................................................................36 Statistical Analysis of Dust Sampling Data........................................................................................................37 Dust Sample QC Results ....................................................................................................................................39
SUMMARY OF AIR AND DUST SAMPLING RESULTS AND FINDINGS ....................................................40
REFERENCES ..........................................................................................................................................................41
APPENDIX ................................................................................................................................................................43
APPENDIX 1. REPORT OF AND RESPONSE TO NJDEP AUDIT....................................................................................44 APPENDIX 2. INDOOR AND OUTDOOR AIR SAMPLE DATA ......................................................................................57 APPENDIX 3. METEOROLOGICAL DATA (WINDROSES, WIND SPEEDS AND DIRECTIONS) ........................................69 APPENDIX 4. DUST SAMPLE DATA. .........................................................................................................................81 APPENDIX 5. AIR AND DUST QC DATA ...................................................................................................................83

3
Executive Summary This study was conducted in response to concerns raised by residents of Sparta, New Jersey (Sussex County) that the nearby Southdown Quarry (later purchased by another company and re-named Cemex Quarry) was emitting asbestos structures into the air, and that these structures were reaching residential areas where they could result in an increased cancer risk. To address these concerns, the New Jersey Department of Environmental Protection (NJDEP) in conjunction with Region 2 of the U.S. EPA convened a panel of experts from the NJDEP, the New Jersey Department of Health and Senior Services (NJDHSS), academia and the scientific community, to aid in the design and oversight of a project to estimate the health risk from asbestos and to investigate whether emissions from the quarry were associated with any health risk detected. The work was carried out under contract with the Environmental and Occupational Health Sciences Institute (Rutgers University/University of Medicine and Dentistry of NJ), and under a separate contract from the U.S. EPA-Region 2 to Areolas Inc. This general questions formulated in the design of this study are summarized by the three following questions: Question 1 Are levels of biologically relevant asbestos structures in air present at a level which can case a significant cancer risk with long-term exposure?
Question 2 If elevated levels of biologically relevant structures are detected in air downwind of the quarry, is there evidence that the quarry is the source of those structures?
Question 3 If residents are being exposed to levels of biologically relevant asbestos structures emitted from the quarry which pose a significant health risk, what actions may be necessary to adequately control such exposure?
The Southdown/Cemex study was designed to address these questions, using the principles of exposure assessment and risk assessment in a three pronged approach (NJDEP, 2000; EOHSI, 2001)
1. Indoor and outdoor air sampling for biologically relevant asbestos structures at residential locations located in the closest downwind area to the quarry to provide an estimate of long-term average airborne concentrations.
2. Household dust sampling for biologically relevant asbestos structures at residential locations at varying downwind distances from the quarry (at upwind and remote control locations) to investigate whether long-term patterns of asbestos structure deposition are consistent with the hypothesis that the quarry is the source of those structures.
3. Sampling and analysis of rock cores from the quarry, and source/dispersion modeling of quarry emissions to estimate future exposure and risk.
This report presents results and conclusions from the first two parts of the overall study design. Results and conclusions from the third part of this design will be presented in a subsequent report.

4
There is currently ongoing debate in the scientific community as to the appropriate health-based definition of asbestos. To address the resulting scientific and regulatory uncertainty, this study utilized two different approaches to asbestos risk assessment the current U.S. EPA approach,(asbestos defined by NIOSH method 7402, and cancer risk calculated as set forth in EPA’s IRIS file for asbestos (http://www.epa.gov/iris/subst/0371.htm)), and the “Protocol Structure” approach. These approaches differ in the size of asbestos structures considered and the cancer potency assigned to different sizes. Risks are reported using both methods. For household dust sampling a total of 28 homes were recruited in three zones of distance from the quarry (0.5-1.0 miles; 1.0-1.25 miles; and >1.5 miles). Dust samples were collected from undisturbed locations within each house. For air sampling, samples were collected both indoors and outdoors at four houses downwind and 0.5-1.0 miles from the quarry. Air sampling was carried out during a four week period encompassing two separate periods at each house, with each air sampling period lasting 7 consecutive days. Air sampling was also carried out over the entire four week period at two remote locations unlikely to be impacted by quarry emissions. Meteorologic data was collected concurrently with the air samples. The laboratories were NVLAP accredited for TEM analysis Air samples were analyzed using ISO counting rules (Method 10312), and dust samples were analyzed using ASTM Methods D-5755 and D-5756. Quality control (QC) procedures were specified in a separate Quality Assurance Project Plan (EOHSI, 2001), and included quality control procedures for study design, survey operations, field activities, sample handling, laboratory analysis, data handling, and data analysis. In addition, a separate field audit was conducted by the NJDEP Office of Quality Assurance. Intra-and inter-laboratory quality assurance was addressed by re-analysis of 15% of air samples and 14% of dust samples, as well as field-blank samples. QC samples were selected randomly, prior to analysis. A total of 168 air samples were collected from the four residential, and two background sites. Asbestos-related structures were found in a total of four air samples from the residential sites. All were found in outdoor samples. No indoor samples were positive for asbestos-related structures. The positive residential samples were from three of the four residential locations. In three of the four positive samples, a total of one structure was found. In the remaining positive sample, two structures were found. In each case the structure was identified as tremolite. Two of these structures were identified as Protocol Structures only, two of these structures were identified as 7402 structures only, and one structure was identified as both a protocol and 7402 structure. In addition, two (outdoor) samples from the NJ Department of Transportation remote background locations were positive for asbestos-related structures. In one of these samples, two chrysotile structures were detected, and in the other a single tremolite structure was detected. No positive samples were obtained from the other remote background location (Kittatinny Valley State Park).

5
For the randomly selected QC air samples intra- and inter-laboratory analyses were in agreement in identifying each as negative. In addition, one sample identified as positive in primary analysis was non-randomly selected for blind QC re-analysis. Both laboratories identified this sample as positive for tremolite, and calculated nearly identical airborne concentrations of asbestos based on that sample. Quarry activity during the air sampling period was assessed by NJDEP based on analysis of production records. Quarry production during the air sampling periods appears typical of quarry production during the five month period including and extending beyond the sampling period Statistical analysis was carried out based on the air sampling results, the recorded wind directions and wind velocities to investigate whether the results were consistent with the hypothesis that the quarry was the source of the air samples which were positive for asbestos. Although the analyses were limited by the small number of positive samples, several statistical approaches were investigated. The statistical analysis did not provide an indication that the quarry was the source of the positive samples. Using the current U.S.EPA approach to asbestos risk assessment, the lifetime cancer risk from exposure to the concentrations of asbestos detected in the outdoor air is calculated to be 2 x 10⁻⁶ . That is, two excess cancers per one million people exposed for 70 years. Using the Protocol Structure approach, the corresponding risk is 3 x 10⁻⁵. That is, three excess cancers per one-hundred-thousand people exposed for 70 years. Both of these risk estimates fall within the range generally considered by the NJDEP to be consistent with permitting of air emissions sources with possible consideration of source modification. A total of 54 dust samples were collected from undisturbed locations in 28 houses located to the southeast of the Quarry. Only two samples were found to contain asbestos structures. One structure was found in each of two samples from separate houses. Each structure met the definition of both Protocol Structures and 7402 structures. Neither of the samples was from a house in the zone located closest to the quarry. The two houses with positive samples were both more than 40 years old. This raises the possibility that these samples represent historical deposition of asbestos.
In the QC analysis of the dust samples, one sample identified as positive in the primary analysis was identified as negative in intra-laboratory re-analysis, and one sample identified as negative in the primary analysis was identified as positive in intra-laboratory re-analysis (The sample identified as positive in the re-analysis was utilized in the overall analysis of the dust sampling results). No positive samples were identified in the inter-laboratory analyses. Given that a total of only two asbestos structures were detected among all the analyses of dust samples, and given the variability inherent in analysis of structures distributed across the face of a filter, the difference between the detection of zero structures and one structure in these analyses is not statistical significant..
The usefulness of statistical analysis based on the detection of a total of only two structures on two samples is very limited. Within these constraints, however, given that no structures were detected in the dust in the zone closest to the quarry the dust sampling data provide no indication that the quarry is the source of the asbestos detected in the positive samples.

6
Summary of Air and Dust Sampling Results
• At the two closest air sampling sites, Site 1 and Site 2, a small concentration of asbestos structures were detected in ambient air samples on three dates. • No asbestos structures were detected in indoor samples. • In general, quarry production during the air sampling periods appears to have been typical of quarry production both before and after the air sampling. • Statistical analysis of the wind directions on days when asbestos structures were detected in air samples provides no direct support for the hypothesis that quarry was the source of the structures. • Depending on the risk assessment approach employed, the lifetime cancer risk associated with the measured concentration of asbestos structures is in the range of 2 x 10⁻⁶ to 3 x 10⁻⁵ (two-in-a-million to three in a hundred thousand). These risk estimates are based on the assumption of continuous 70 year exposures. • A total of two asbestos structures were detected in settled dust in two of 28 houses sampled. These houses were located between one and two miles from the quarry. No asbestos structures were detected in the house dust in the zone closest to the quarry. • The results of the house dust sampling provide no evidence that the quarry is the source of the asbestos structures detected. Based on the results, we can provide the following answers to the three questions posed in the introduction to this report:
Question 1 Are levels of biologically relevant asbestos structures in air present at a level which can case a significant cancer risk with long-term exposure?
The estimated lifetime cancer risk associated with the measured concentration of asbestos structures in outdoor air in this study is 2 x 10⁻⁶ to 3 x 10⁻⁵ (two-in-a-million to three in a hundred thousand) depending on the specific risk assessment approach which is employed. While these values represent a non-zero lifetime risk, they are in a range which is generally considered low in environmental risk management.
No asbestos structures were detected in any of the indoor air samples. This suggests that there is no significant additional risk resulting from long-term accumulation of asbestos structures indoors which are available to be re-suspended in air with normal household activities. Given the fact that people generally spend considerably more time indoors than outdoors, these results have important and positive public health implications.
Question 2 If elevated levels of biologically relevant structures are detected in air downwind of the quarry, is there evidence that the quarry is the source of those structures?
Neither the air samples nor the settled house dust samples provide clear support for the hypothesis that the quarry is the source of the asbestos structures which were detected. The overall estimate of risk would not likely change substantially if additional air and test sampling were done. This does not necessarily imply that the quarry does not emit, or has not emitted asbestos structures. The second phase of this project involving the analysis of core samples from the quarry, modeling of quarry emissions, and their dispersion in the local environment will

7
provide an estimate of the future potential for risk from quarry emissions. This analysis, which will also supplement the current report, is being completed. Results from that portion of the study should provide information about the extent to which any asbestos emission from the quarry may contribute to the overall level of asbestos in the local environment. Question 3 If residents are being exposed to levels of biologically relevant asbestos structures emitted from the quarry which pose a significant health risk, what actions may be necessary to adequately control such exposure? Given both the relatively low cancer risk which can be estimated from this study, and the lack of evidence linking the quarry to the measured asbestos structures in the local environment, this study provides no basis for identifying additional actions at this time which would be necessary or useful for the control of exposures. However, it should be emphasized that the New Jersey Department of Environmental Protection has required increased controls on the emission of overall dust and particulates from the quarry. Measures which have been required to reduce general dust emissions will necessarily also reduce asbestos emissions.

8
Introduction In the summer of 1999 local citizens raised concerns that asbestos was being emitted from Southdown (currently Cemex) Quarry in Sparta, NJ (Figure 1). Southdown subsequently conducted stack tests, under the supervision of the New Jersey Department of Environmental Protection (DEP), which detected some tremolite and actinolite amphibole structures (some of which may be asbestos). DEP then used the stack test and other data to predict ground level tremolite concentrations at various locations. The modeling predicted an increased cancer risk of 3 to 7 in a million at nearby residences. While this estimate was considered uncertain for a variety of reasons, the indication of a potential for elevated long-term health risk was deemed sufficient to warrant a more accurate and in-depth assessment of asbestos exposure and risk. DEP, conjunction with Region 2 of the U.S. Environmental Protection Agency (EPA) convened a team of experts from DEP, EPA, the New Jersey Department of Health and Senior Services (NJDHSS), academia (i.e. the Environmental and Occupational Health Sciences Institute (EOHSI)), and the scientific community to develop a more refined risk assessment. This group is referred to as the Southdown Study Expert Group.
In addition to the results of the DEP mandated stack test, operations at the Southdown Quarry attracted attention due to (1) the observed presence of tremolite mineral in the marble that is mined at the quarry, (2) a private report that tremolite asbestos structures were detected on an air conditioner filter at a residence that is located downwind of the quarry, and (3) the accepted premise that inhalation of tremolite fibers can lead to cancer in humans. These concerns raise a general question as to whether protocol structures and other biologically relevant structures are released from the quarry in sufficient quantities to pose a threat to the health of neighboring residents who might inhale them.
This general questions formulated in the design of this study are summarized by the three following questions:
Question 1 Are levels of biologically relevant asbestos structures in air present at a level which can case a significant cancer risk with long-term exposure?
Question 2 If elevated levels of biologically relevant structures are detected in air downwind of the quarry, is there evidence that the quarry is the source of those structures?
Question 3 If residents are being exposed to levels of biologically relevant asbestos structures emitted from the quarry which pose a significant health risk, what actions may be necessary to adequately control such exposure?
The Southdown/Cemex study was designed to address these questions, using the principles of exposure assessment and risk assessment in a three pronged approach (NJDEP, 2000; EOHSI, 2001)
9
1. Indoor and outdoor air sampling for biologically relevant asbestos structures at residential locations located in the closest downwind area to the quarry to provide an estimate of long-term average airborne concentrations.
2. Household dust sampling for biologically relevant asbestos structures at residential locations at varying downwind distances from the quarry (at upwind and remote control locations) to investigate whether long-term patterns of asbestos structure deposition are consistent with the hypothesis that the quarry is the source of those structures.
3. Sampling and analysis of rock cores from the quarry, and source/dispersion modeling of quarry emissions to estimate future exposure and risk.
This report presents results and conclusions from the first two parts of the overall study design. Results and conclusions from the third part of this design will be presented in a subsequent report.
The first step of a risk assessment is to identify the potential hazard and exposures. In this case, tremolite mineral is present in the marble mined at the quarry. Tremolite is a mineral which can occur in either a fibrous or (most commonly) a non-fibrous form, referred to as the massive form. Thus, the presence of tremolite mineral does not necessarily indicate the presence of asbestos. From the standpoint of hazard identification, ”asbestos” is an ambiguous term. It does not describe a specific chemical or mineral, but rather the commercially useful form of a variety of naturally occurring mineral structures with a fibrous aspect. It is therefore, more useful and accurate to consider exposure and risk in the context of those “asbestos” structures which pose a risk of adverse health effects. Therefore, this report refers to “biologically relevant asbestos structures,” which, by at least one of two somewhat different definitions (NIOSH 7402 structures, or “protocol structures”) is considered to have the potential to pose an adverse health risk. These definitions are clarified below. In this case, the adverse health risk considered relevant is cancer. Non-cancer health effects associated with asbestos exposure (i.e., asbestosis) have been observed only in very heavily exposed occupational groups, and are not considered relevant at levels of exposure likely to be encountered in the environment.

10
Figure 1.

11
Figure 2. Map of the Study Area
QUARRY
State Park
NJ DOT 1
Residential Area
QUARRY
State Park
NJ DOT 1
Residential Area
12
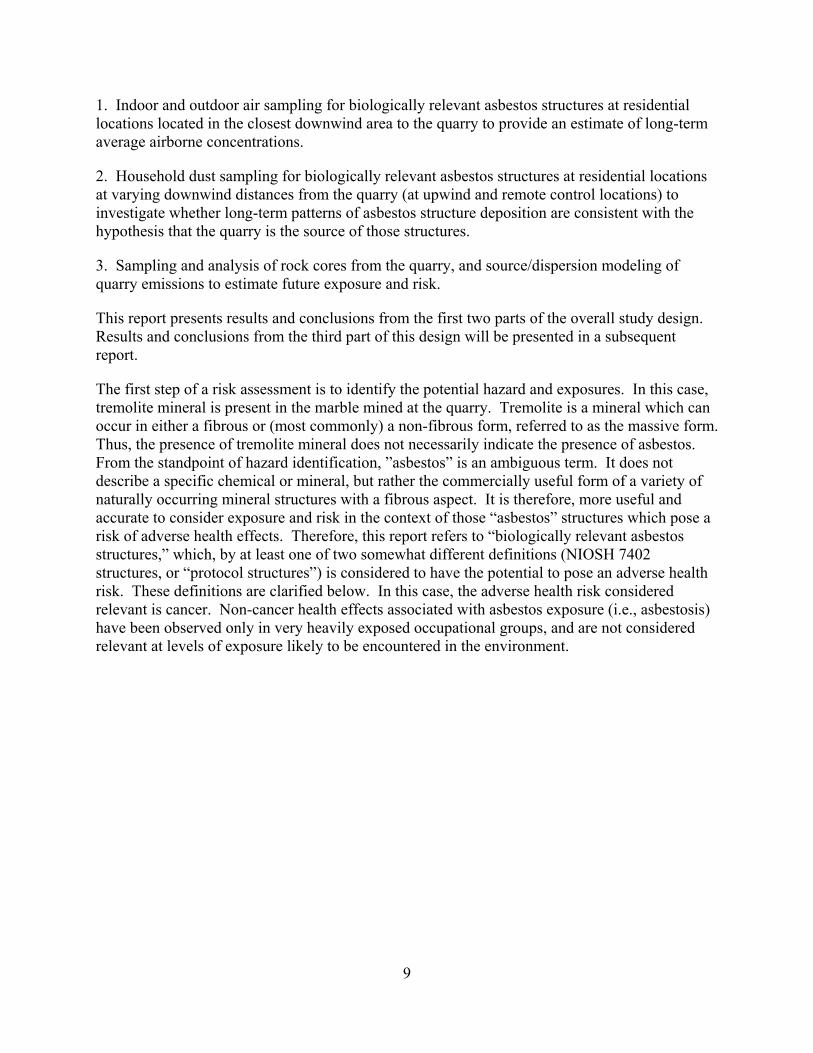
Approaches to Asbestos Risk Assessment The toxicity of an asbestos-like dust is a strong function of the mineralogy and geometry of structures within the dust. An appropriate “index of exposure” must be defined for reporting structure measurements so that such measurements can be used to support the assessment of risk. The index of exposure proposed for this study is the concentration of structures that fall within a specific range of dimensions. Two indices of exposure were used in parallel in this study. One index of exposure was the “protocol structure” approach as set forth in the “Framework” (NJDEP, 2000). Structures meeting this definition are referred to as the “protocol structures.” In this study, “protocol structures” are defined as all structures of an asbestos producing mineral which are narrower than 0.5 µm in width, and greater than 5 µm in length, with structures longer than 10 µm in length weighted proportionally greater in terms of cancer potency (Berman and Crump, 1999a,b). This approach is based on the identification of structures using the transmission electron microscope (TEM). The other index of exposure was the index as set forth in the NIOSH Method 7402 http://www.cdc.gov/niosh/nmam/pdfs/7402.pdf), and employed in the U.S.EPA’s IRIS database file for asbestos (http://www.epa.gov/iris/subst/0371.htm), and in the U.S.EPA’s 1986 Airborne Asbestos Health Assessment Update. In this approach, only those asbestos structures wider than 0.25 µm, and longer than 5 µm in length, having an aspect ratio (i.e., length/width) greater than 3:1 are considered to contribute to cancer risk. This approach is based on the identification of structures using the phase contrast light microscope (PCM). The differences between these two approaches are illustrated in Figure 3.
Figure 3. Relationship Between Protocol Structures and EPA/NIOSH Asbestos Fibers
TEM detectable structures
Protocol StructuresPCM
detectable structures
Structures counted under NIOSH/EPA method
Length - >5 um
Width - <0.5 umLength - >5 um
Width - >0.2 um
Width>0.2 um, but<0.5 um
Relationship Between Protocol Structures and EPA/NIOSH Asbestos Fibers
TEM detectable structures
Protocol StructuresPCM
detectable structures
Structures counted under NIOSH/EPA method
Length - >5 um
Width - <0.5 umLength - >5 um
Width - >0.2 um
Width>0.2 um, but<0.5 um

13
These two approaches may differ significantly in the estimates of risk derived from the same sample. These differences stem largely from the fact that the NIOSH 7402 method is an older approach, created before the use of electron microscopes to assess asbestos exposure and to investigate the links between exposure and health effects. It is thus based on assessing only those structures visible in the light microscope. To simplify the analytical procedures involved in applying these two separate approaches, and to allow for comparison of the results from each approach, the NIOSH 7402 method was carried out using PCM-equivalent TEM, counting of structures. This method uses TEM rather than PCM to identify and count structures, but limits the counting to those structures which would otherwise have been identified using PCM. Based on discussions with EPA’s Office of Research and Development (ORD), National Center for Environmental Assessment (NCEA), EPA interprets the cancer potency estimates for asbestos provided in it IRIS database as referring only to true asbestos fibers rather than to all asbestos structures meeting the size definitions under the NIOSH 7402 method. This definition specifically excludes asbestos cleavage fragments (i.e., those structures consisting of asbestos parent minerals having the dimensions of fibers, but consisting of minerals created by breaking or weathering of non-fibrous material). Thus, PCM-equivalent-TEM was employed so as to exclude non-asbestos fibers, and non-fibrous asbestos from the fiber count. All measurements completed on samples collected in this study were reported separately as appropriate for each of these respective approaches.
Method and Materials
Recruitment, Data Collection and Measurement
Dust Collection After a public meeting in Sparta held on April 27, 2000,most residents in the area were familiar with the nature of the project. EOHSI mailed out more than 200 letters to residents in selected areas of the township soliciting participation and received responses from approximately 40 families indicating a willingness to participate in the study. The EOHSI team started household dust sampling in February 2001. One or two household dust composite samples were collected from undisturbed locations in each sampled house, and analyzed for protocol structures and other biologically relevant structures. One composite included dust from all accessible window troughs, and the other included dust from other undisturbed location (e.g. tops of refrigerator and bookshelves). Details of dust sampling are described in the next section. The initial goal as set forth in the Quality Assurance Project Plan (QAPP) (EOHSI, 2001) was to have a total of 27 homes for dust sampling with nine in each of the three concentric zones extending outward from the quarry. However, because of non-uniform housing density in each of these areas, and differences in recruitment efficiency; 10 homes were available for the near zone, 15 homes for the intermediate zone, and 3 homes for the distant zone. See Figure 4.

14
Figure 4. Locations of Dust Sampling Regions
SiteQUARRYNEAR MIDDLE
FAR
4 4 7
82
3
SiteQUARRYNEAR MIDDLE
FAR
4 4 7
82
3
While dust sampling was being conducted in a home, an interviewer from the field team administered a questionnaire to the participant and obtained data of daily activities, household characteristics, and other relevant information. The interviewer then asked about the willingness to participate in air sampling. Approximately eight families expressed a willingness to participate in the air sampling. EOHSI then selected four optimal households located in the near and intermediate dust sampling zones and two remote sites as background locations.
Air Sampling One of the goals of outdoor air sampling was to obtain data on asbestos structures in air that would be linked to concurrent activities at the quarry. During the sampling periods, activity at the quarry was monitored and characterized by DEP field staff based on observation as well as review of the quarry’s activity to determine the extent to which activities during air sampling periods was typical of long-term activity at the quarry. The purpose of indoor air sampling was to provide data on the indoor concentrations within the homes near the quarry during the time of

15
outdoor sampling. Since in general, people spend more time inside their homes than outside, indoor air concentration of asbestos structures could provide a more realistic estimate of risk than outdoor concentration. Indoor and outdoor sampling were conducted in tandem at each sampling location.
Air sampling was conducted during a four-week period in the area determined to be immediately downwind of the quarry based on prevailing wind direction . In each week, air sampling took place in two of the four selected homes, and the two background sites. See Figures 5 and 6.
Figure 5. Residential Air Sampling Locations
Southdown Quarry
Site 1
Site 4
Site 3
Site 2
Southdown Quarry
Site 1
Site 4
Site 3
Site 2

16
Figure 6. Residential and Background Air Sampling Locations
QUARRY
State Park
NJ DOT 1
Residential Area
QUARRY
State Park
NJ DOT 1
Residential Area
The latter were located at a vehicle maintenance yard of the NJ Department of Transportation (DOT) in Lafayette (2.38 miles north northeast of the quarry) and in Kittatinny Valley State Park in Andover (3.75 miles southwest of the quarry). Each residential home was sampled indoors and outdoors for two separate periods, each consisting of seven consecutive days. The two background sites were only sampled outdoors but for the entire four weeks. A portable weather station was set up in the backyard of one of the two homes sampled each week to collect meteorological data over the sampling period. During each sampling week, the EOHSI field team changed air filters at all six sampling sites (indoor and outdoor sites at two selected homes and two background sites) and downloaded meteorological data from the weather station every 24 hours. The air sampling was conducted and completed from April 16 through June 14, 2001.
Surface soil samples were collected at the six air sampling sites (four homes and two background sites) in the last air sampling week to provide an indication of whether or not there were protocol

17
structures deposited from the air in the area between the quarry and the residences in each zone. These samples were originally intended to provide information on possible sources of asbestos structures which might be found in the house dust samples. Given the nature of the results presented below, in the house dust portion of the study, however, the soil samples were not analyzed (see below).
Sampling Procedures
Chain of Custody All types of samples were accompanied with chain of custody forms from sample preparation through laboratory analysis and storage. Each sample had its individual chain of custody form, and those who processed the sample at any step of preparation, sampling, transportation, post-sampling handling, shipping, or analysis had to sign and date on the form accordingly. The chain of custody form served as a track record of sample process, and helped resolve questions of sample status.
Air Sampling Outdoor Air Sampling
The purpose of outdoor air sampling was to provide data for an assessment of outdoor air concentration of protocol structures and other biologically relevant structures. PCM-equivalent-TEM measurements of protocol structures and other biologically relevant structures resulting from current activities at the quarry. Outdoor air concentration could be subject to variability in meteorology and production activity at the quarry. The time frame selected for sampling would not capture the entire range of variability in concentration. Outdoor air sampling program was therefore specifically designed to provide an estimate of the typical air concentration due to quarry activity during the sampling periods.
During the sampling periods, activities at the quarry were monitored and characterized by DEP field inspectors. This was done to allow a determination of the extent to which activities leading to emissions of protocol structures and other biologically relevant structures during those periods is typical of long-term activity at the quarry.
Monitoring of activity at the quarry was made during unscheduled visits to the quarry approximately three times during each 24-hour period during the outdoor sampling. The types and levels of activity underway at the quarry were recorded, as well as information recorded by the quarry over the elapsed period in the quarry’s operation logs and quarry production records.
At the residential sites, participants were requested not to lime their lawn during the air sampling period as the lime could have originated from the quarry and might therefore have directly introduced asbestos structures to the immediate environment. Residents were also encouraged to ask neighbors to likewise refrain from liming during those periods.

18
To ensure that air sampling filters did not become overloaded with overall particulates, two separate air samplers operated at each outdoor location. One sampler operated at 2 L/min and another at 1 L/min. The intent was to analyze only the sample collected at the higher flow rate unless overloading occurred. In all cases the higher flow rate sample was analyzed and results are reported based on analysis of that sample.
Outdoor Sampling at Background Locations
The DOT maintenance yard and State Park were selected as locations that were unlikely to be influenced by emissions from the quarry, because both sites were more than 2 miles away from the quarry. The State Park was to the Southwest of the quarry and the DOT site was to the northeast of the quarry. The prevailing downwind direction is from the northwest (toward the southeast). At each background location, the specific sampling sites were public or government buildings in secure areas where samplers could be located in elevated locations out of casual reach. As with the residential locations, two samples were collected at different flow rates. In each case results are reported based on the sample collected at the higher flow rate
Indoor Air Sampling
The purpose of indoor air sampling was to provide an estimate of typical indoor concentrations of asbestos structures within the homes near the quarry. However, indoor air concentrations could be subject to variability in household activities, which would result in re-entrainment of protocol structures and other biologically relevant structures from accumulated indoor dust (e.g., vacuuming, cleaning, ventilation and heating). Indoor air concentration would also be subject to the variability in outdoor air concentration. As with outdoor air sampling, the duration of indoor sampling study might not be sufficient to capture the full variability in indoor air dust concentration.
For the indoor sampling program, one sampler was set up at a central location in each of the four houses identified for inclusion in the sampling regimen. Samples were collected over continuous 24-hour periods to maximize the chance of capturing contributions from longer term variation in the routines of house residents. The samplers were operated at the same flow rates described above for the outdoor samples.
Indoor/Outdoor Sample Acquisition
Air samples were taken for approximately 24 hours using constant-flow personal sampling pumps calibrated versus a NIST-traceable primary flow standard before and after each sampling run. All air samples were obtained at breathing height (approximately 4 ft. above the ground or floor surface), and all sampling trains were tested for leaks prior to sampling and after each sampling episode. The pumps and leak checking train were kept in locked weather-proof enclosures at all times except when sampling personnel were on site. The enclosures were protected from overheating during warm weather by a detachable aluminized Mylar screen. The pumps were connected to the filter cassettes by plastic tubing and the sample cassettes were protected from tampering during sampling by locked wire enclosures. The sampling protocol used complied with ISO 10312 (ISO, 1995). Pre-loaded filter cartridges (25 mm in diameter, 0.45 µm pore size, mixed-cellulose ester membrane on a cellulose pad) with electrically

19
conductive 50 mm cowls (Zefon Inc.) were used. Sampling was done using an open-face air filter cassette with an electrically conductive extension cowl at the inlet of air stream. The extension cowl assisted in the uniform distribution of materials on the filter face. A log was maintained of pre- and post- sample flows for each individual pump. Results from each pump were examined by field supervisory personnel for systematic variations in flow over the sample period.
Indoor side-by-side samples were placed in a common living area inside the house. Filter cassettes were placed at least 1 foot away from any walls, at least 5 feet away from vents, windows and doors, and 4 feet above floors to avoid any possible interference. A tripod was used to lift the sampler 4 feet above the ground. Outdoor samplers were placed at least 10 ft from any permanent structure, including house, fence, outbuilding, and away from trees. For residential outdoor air sampling and remote background air sampling sites, upwind obstructions was minimized, e.g. avoiding placement of samplers near objects or features that would block wind flow from the direction of the quarry. The samplers were also located as far as possible from driveways and public roadways. In general, the criteria for selection of both indoor and outdoor sampling locations was to avoid sites where there was extraneous soil and dust around in order to limit the possibility of heavy loading on filters.
Dust Sampling Dwellings were identified in three general and distinct zones of distance from the quarry; with the most distant located so as to approximate background concentrations of protocol structures and other biologically relevant structures in ambient air. Accumulated samples of household dust were collected using dry dust collection techniques. Samples were collected in locations likely to be relatively undisturbed. These included 1) eaves in the attic, 2) elevated locations in rooms with windows (e.g., bookcase tops), 3) undisturbed areas near windows, and 4) the window wells. Based on the goals as set forth in the study design to detect a difference as small as 10-fold between these locations with 95% confidence, conservative assumptions were applied, in the estimate a minimum of 15-20 samples in each zone were sufficient (NJDEP, 2000, EOHSI, 2001).
Sample Acquisition
A sweep sampling method was applied to collect undisturbed dust on the surfaces inside the home. To have the maximum amount of dust for laboratory analysis, two composite samples were collected from each household. One dust sample was collected from window wells in the home, and the other from other undisturbed locations, as described above.. Each dust sample was expected to be as much as 10 grams; however, the average of dust amount was approximately 1.5 grams, due to the generally small volume of available house dust.
Meteorological Data Collection The acquisition of data from the weather station involves the use of an onsite computer. The software used was Weather Link® 4.0 for Windows. The weather station was the Wireless Weather Monitor II® (Davis Instruments, Hayward CA). This weather station monitored wind

20
speed and direction, barometric pressure, precipitation, indoors and outdoors temperatures, and relative humidities. Data were transmitted remotely to the data logging device and into computer memory a SensorLink™ transmitter and receiver.
The location on the property where we set-up the weather station was near to the sampling set-up, and chosen based upon how unobstructed the open area was. The position on the property relative to the weather monitor of any structures, such as trees, tree lines or buildings, could influence the main environmental conditions, such as wind direction and speed, and was therefore taken into consideration when we chose the location of the weather station. The location was at least 10 feet away from any such structure. .
Analytical Procedure Each sample collected for this project was analyzed for protocol structures and 7402 structures (see the section of this report entitled, Approaches to Asbestos Risk Assessment for definition of these terms). Each structure was evaluated to determine whether it was a true fiber or a cleavage fragment. Cleavage fragments meeting the appropriate dimensional criteria were counted as protocol structures. Although such structures are, by definition, not fibers, they were counted included in the count of 7402 structures in order to conservatively address concerns about their correct identification and contribution to health risk.
The primary laboratory, the RJ Lee Group is accredited by NVLAP for TEM analysis. All samples of bulk dust, air sampling filters were analyzed by this laboratory. Quality assurance (QA) samples were analyzed by the secondary/QA laboratory, EMS Laboratory, which monitored the accuracy and precision of the samples analyzed by the RJ Lee Group.
Air Samples Air samples evaluated for protocol structures were analyzed using ISO counting rules (Method 10312). Reported structures were limited to those structures that meet the definition of protocol structures. ISO-method TEM scans, which are limited to protocol structures, can be performed at a 10,000x magnification. Samples initially collected on air sampling filters were prepared by direct transfer methods. To increase the power of the analyses to detect an elevated risk, risk calculations were based on protocol structure counts statistically aggregated across contiguous sampling locations. In general, the target sensitivity for individual samples is 2 x 10⁻⁴ structures/cm3 of air corresponding to 5 x 10⁻⁶ structures/cm3 group aggregate sensitivity. Under the assumption that approximately 10% of protocol structures were expected to be longer than 10 µm, the analytical sensitivity corresponded to a minimum detectable group aggregate cancer risk of approximately 5 x 10⁻⁶ (i.e., five excess cancer per million exposed individuals). All samples were also analyzed for 7402 structures. Further details of the analytical methodology can be found in the Quality Assurance Project Plan (QAPP) document (EOHSI, 2001).
Dust Samples Dust samples were prepared as described in the QAPP using ASTM Methods D-5755 and D-5756, and were analyzed using the same procedures as the air samples to count protocol
21
structures and 7402 structures, and to determine their concentration in the bulk dust. Each sample incorporated an indirect preparation procedure to transfer the collected sample onto a filter suitable for preparation and analysis in a TEM. The primary difference in the sample preparation procedures between D-5755 and D-5756 was D-5756 utilizes a plasma asher to remove organic materials from the sample prior to analysis. Both methods use an ultrasonic bath to help break up and suspend the collected sample. The ultrasonic bath does not affect the mass of asbestos structures in a sample, but may affect the number distribution of asbestos fibers. .
Quality Control Procedures Quality control procedures for study design, survey operations, field activities, sample handling, laboratory analysis, data handling, and data analysis were developed and specified in the Quality Assurance Project Plan (QAPP) (EOHSI, 2001). This document was thoroughly reviewed by the Expert Group prior to field work.
Quality Control for Questionnaire Survey Operations There were two questionnaires used in this study: the first questionnaire dealt with household characteristics, and the second was a daily questionnaire administered after sample collection.
During the household screening process, the interviewer maintained regular contact with the supervisory faculty staff. For a percentage of those potential air sampling locations described by the field staff as ineligible (due to e.g., liming in the yard or neighborhood or any other activities potentially generating asbestos fibers, as well as those not willing to participate), the supervisory study staff then reviewed the decisions of ineligibility. The completed study documents were scanned for completeness, legibility and obvious problems. The field team upon arrival at the participants’ home verified appointment schedule, correct address, etc. As questionnaires were returned to EOHSI each was subject to an additional scan edit. All data entry was verified by re-key or percentage re-key procedures. The data were entered on Excel spreadsheets. All data were printed on a hard copy and electronic file both in the hard drive and external electronic media compatible with the size of the stored the files.
Quality Control for Field Activities Quality Control in the field consisted of two main activities, (1) quality control for maintaining the integrity of survey instruments and other field documents, and (2) quality control for maintaining the integrity of environmental samples. However, the field supervisor monitored the sampling routine established for the air and dust collection at least once during each week of sampling. The field supervisor, at a minimum, observed the action of removing and replacing filter samples, pump calibration checks, pump leak checks, and recorded keeping for the indoor and outdoor air measurements. For the dust sampling the field activities to be monitored were questionnaire completion and the approach to and location of the dust sample collection. The sample handling activities and the approaches to the prevention of contamination of the field samples during processing were part of this quality control review. Variance with normal activities or operator mistakes were noted and corrective action was taken on the spot.

22
During routine sampling all field personnel had available spare parts and filters, and sampling tools. This was to ensure that repairs or replacements for faulty equipment could be made immediately. All broken or poorly operating pumps were returned to the laboratory for repairs.
The issue of sample contamination by inadvertent events or tampering was a major concern during the design of this study. Clearly, the most vulnerable samples were the air samples. All pumps were taped to ensure that no one tampered with the flow rates. All samplers had a Polaroid picture taken before sampling commenced and before each filter change. This could be used to compare the location and orientation of the sampler before and after completion of each sampling period. It should be noted, however, that for outdoor sampling, the orientation could have changed because of wind. During the sample changing activities the field personnel looked for localized additions of extraneous soil or dust (e.g. lime) around the indoor or outdoor sampling site. Further, the field personnel visually inspected all filters for unusual loadings of material in conjunction with the observations for extraneous dust etc. Unusually loaded filters would be noted on the sampling record sheet prior to shipment for analysis. The loadings were compared between the 1-liter and 2 liter per minute samples. A contaminated set of filters, which had normally operated sampling times, did not conform to a sample loading (µg/m3) comparison of differences < 20%.
Field blank samples were taken during the course of dust or air sampling to provide the background level of asbestos fibers on sampling media. For air sampling, a blank filter sample was collected at each sampling site for a 7-day period. Blanks were taken following the same procedures as air sampling but without air flow passing through. For dust sampling, blanks were taken as sample bags were opened and sealed in the field, since dust was not collected on any media but swept into sample bags.
Field Audit Field work, including sample collection, sampling locations and sample setup and handling, was audited by the NJDEP Office of Quality Assurance (OQA) on May 14th, 2001. This was to ensure that all the fieldwork was performed as stated in the QAPP. There was one minor deviation from the QAPP reported by the NJDEP OQA, and it was corrected in a timely manner by the EOHSI staff (NJDEP OQA audit reports and EOHSI’s response are in Appendix 1).
Inter and Intra Laboratory Quality Assurance (QC) The unique features of asbestos that need to be addressed when designing a quality control program for an asbestos investigation are:
Inability to create true standards for asbestos. This is because there are no independent
methods for verifying the asbestos content of a sample that can be correlated with other methods;

23
The resulting need to rely on “consensus” standards or (for specific projects) within and between laboratory duplicate analyses to establish within and between laboratory precision;
A need to allow multiple laboratories working on the project to “calibrate” their respective interpretations of the rules applied under the methods to be employed in the study.
NVLAP certification of the participating laboratories ensuring their participation in regular round-robin exchanges and comparisons of analysis.
One of the goals of the proposed QC program was to employ a re-analysis procedure that simultaneously encompass as many of the important sources of analytical uncertainty as reasonably possible. It is also important to recognize that the largest sources of uncertainty are not necessarily associated with laboratory variation, but may also be associated with sampling variation and even, spatial or temporal variation within the matrices to be sampled.
Before analyzing the samples collected in the field, EMS and RJ Lee conducted a preliminary analysis for a positive filter, prepared by EMS, to reduce any possible laboratory discrepancy. Both laboratories compared Fiber counts, grid openings and cleavage fragment rules used after the preliminary analyses. Based on the results, both laboratories reached an agreement for the analysis method to obtain data as close as possible for field samples.
A summary of QC samples included in the program is presented in Table 1.
Table 1. Numbers of QC Analyses within and between RJ Lee and EMS
Within Between Within Type RJ Lee RJ Lee & EMS EMS Total QC Dust Samples 4 2 2 8 Air Samples 16 8 4 28 Each filter was split to three parts in RJ Lee. One was sent back to EOHSI for storage, the second one was used for analysis in RJ Lee, and the third one was used for QC analysis within and between RJ Lee and EMS. The samples which were re-analyzed for QC purposes were selected by EOHSI prior to receipt of any results using a random number selection process. In all cases, the QC analysis is a re-analysis of a sample which had already undergone primary analysis by RJ Lee. “Within RJ Lee” (first column) means that a filter, one third of which had already been analyzed by RJ Lee, was re-analyzed by RJ Lee using a separate third of the filter designated for QC analysis. “Between RJ Lee and EMS” (second column) means that a filter, one third of which had already been analyzed by RJ Lee, was re-analyzed by RJ Lee using the QC third of the filter, the remainder of which was then sent to EMS for a separate analysis. These samples, therefore, underwent three separate analyses. “Within EMS” (third column) means that a filter, one third of which had already been analyzed by RJ Lee, was re-analyzed by EMS using the QC third of the filter. The total number of QC analyses for air represents 15% of the total number of air samples collected. The total number of QC analyses for dust represents

24
14% of the total number of dust samples collected. Each third of each filter was assigned a separate and random laboratory sample number. The relationship among corresponding filter thirds was known to only one person in each laboratory (and to EOHSI). The laboratory personnel conducting the analyses in both laboratories were unaware of which laboratory samples originated from which filter, and, in the case of RJ Lee, which analyses were primary analyses of a sample, and which were QC re-analyses. In the case of EMS, all analyses were (by design) QC analyses. Filter segments sent to EMS from RJ Lee for QC re-analyses were assigned new sample numbers before transfer. EMS was unaware of the results of RJ Lee’s analysis of filter segments they received from RJ Lee. EOHSI retained the master list of all corresponding filter segments and their sample codes.
Data Quality Assurance
Sample data sheets and chain of custody forms were reviewed by the sampling technician at the end of each sampling day. The review included sample ID number check, data fill-in, signatures, and the number of collected samples. Data were entered into a computer database with care by the field technicians. After the data entry, the EOHSI Project Manager validated the completeness and integrity of data, including number of samples, any unreasonable key-ins, and missing values, and randomly selected and compared the entered data with the original forms. When data were shipped from the laboratories to EOHSI, the laboratory databases were validated in a manner similar to the field data validation, especially verifying all ID numbers that were assigned to a sample for intra- and inter-laboratory analyses.
Before working in the field, a Quality Assurance Project Plan was developed which was approved by USEPA and the Expert Group (EOHSI, 2001). On May 14th 2001, the NJDEP Office of Quality Assurance audited air sampling in the field to ensure that the fieldwork was performed as stated in the QAPP. NJDEP OQA officers reviewed the QAPP and inspected every detail of the air sampling process, including sampler setup, sampling procedures, sample storage and documentation. One minor deviation was found and was corrected on-site (Appendix 1).
Results
Air Samples A total of 168 air sample pairs were collected from the four residential sites (Figure 5) and the two background sites (Figure 6) during two separate seven consecutive-day sampling rounds at each site. In addition, 24 field blank samples were generated. One of the blanks was lost, and therefore only 23 blanks were available for analysis. No asbestos or related structures were detected on any of the field blank filters. Given the uniform lack of structures detected on the remaining filters, it is unlikely that useful information was lost with the loss of that filter.
Samples generated at the higher (2 L/min) flow rate were found to be useable for analysis and were used exclusively in each case. Asbestos-related structures were found in a total of four samples from the residential sites. All were found in outdoor samples. No indoor samples were positive for asbestos-related structures. The positive residential samples were from three of the four residential locations. In three of the four positive samples, a total of one structure was
25
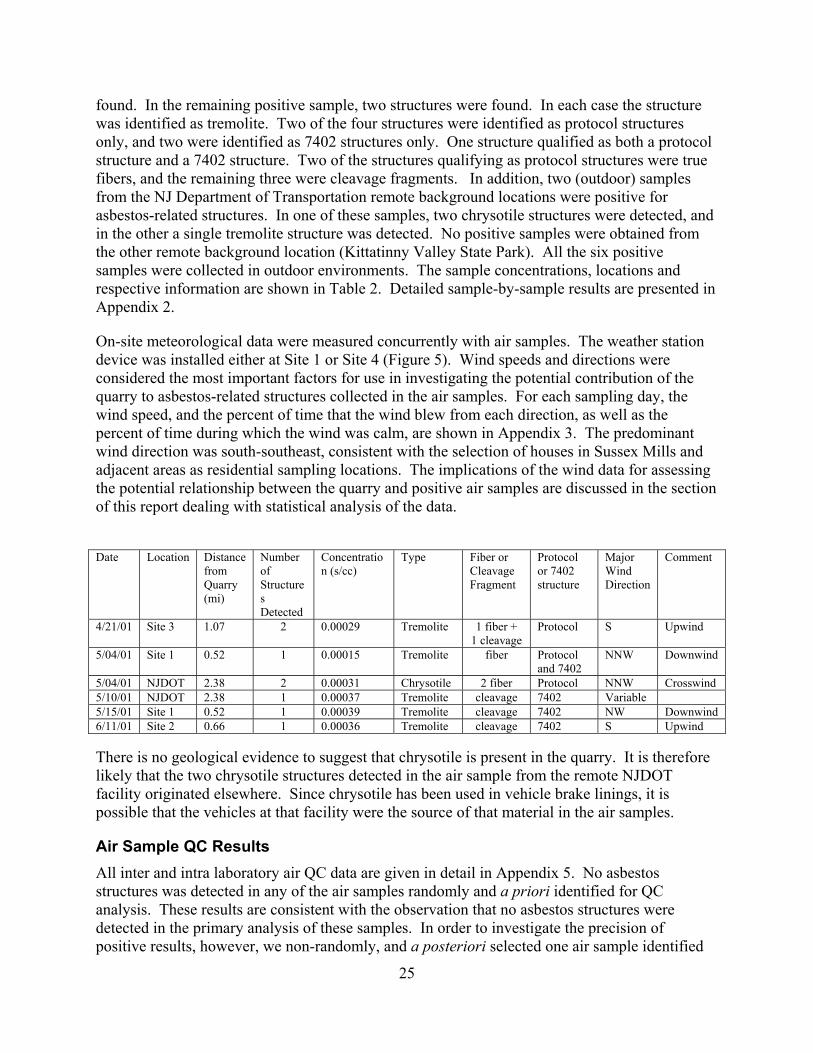
found. In the remaining positive sample, two structures were found. In each case the structure was identified as tremolite. Two of the four structures were identified as protocol structures only, and two were identified as 7402 structures only. One structure qualified as both a protocol structure and a 7402 structure. Two of the structures qualifying as protocol structures were true fibers, and the remaining three were cleavage fragments. In addition, two (outdoor) samples from the NJ Department of Transportation remote background locations were positive for asbestos-related structures. In one of these samples, two chrysotile structures were detected, and in the other a single tremolite structure was detected. No positive samples were obtained from the other remote background location (Kittatinny Valley State Park). All the six positive samples were collected in outdoor environments. The sample concentrations, locations and respective information are shown in Table 2. Detailed sample-by-sample results are presented in Appendix 2.
On-site meteorological data were measured concurrently with air samples. The weather station device was installed either at Site 1 or Site 4 (Figure 5). Wind speeds and directions were considered the most important factors for use in investigating the potential contribution of the quarry to asbestos-related structures collected in the air samples. For each sampling day, the wind speed, and the percent of time that the wind blew from each direction, as well as the percent of time during which the wind was calm, are shown in Appendix 3. The predominant wind direction was south-southeast, consistent with the selection of houses in Sussex Mills and adjacent areas as residential sampling locations. The implications of the wind data for assessing the potential relationship between the quarry and positive air samples are discussed in the section of this report dealing with statistical analysis of the data.
Date Location Distance
from Quarry (mi)
Number of Structures Detected
Concentration (s/cc)
Type Fiber or Cleavage Fragment
Protocol or 7402 structure
Major Wind Direction
Comment
4/21/01 Site 3 1.07 2 0.00029 Tremolite 1 fiber + 1 cleavage
Protocol S Upwind
5/04/01 Site 1 0.52 1 0.00015 Tremolite fiber Protocol and 7402
NNW Downwind
5/04/01 NJDOT 2.38 2 0.00031 Chrysotile 2 fiber Protocol NNW Crosswind 5/10/01 NJDOT 2.38 1 0.00037 Tremolite cleavage 7402 Variable 5/15/01 Site 1 0.52 1 0.00039 Tremolite cleavage 7402 NW Downwind 6/11/01 Site 2 0.66 1 0.00036 Tremolite cleavage 7402 S Upwind There is no geological evidence to suggest that chrysotile is present in the quarry. It is therefore likely that the two chrysotile structures detected in the air sample from the remote NJDOT facility originated elsewhere. Since chrysotile has been used in vehicle brake linings, it is possible that the vehicles at that facility were the source of that material in the air samples.
Air Sample QC Results All inter and intra laboratory air QC data are given in detail in Appendix 5. No asbestos structures was detected in any of the air samples randomly and a priori identified for QC analysis. These results are consistent with the observation that no asbestos structures were detected in the primary analysis of these samples. In order to investigate the precision of positive results, however, we non-randomly, and a posteriori selected one air sample identified

26
as positive by the primary laboratory (RJ Lee), and included it among the other samples originally selected for QC analysis by the secondary laboratory (EMS). EMS was blind to the nature of this sample. As was the case with the other QC samples, the sample received by EMS came from the same filter as that originally analyzed by RJ Lee, but from a different third of the filter. Both laboratories, identified the sample as positive for asbestos structures, both identified the structure as tremolite, and both calculated a very similar airborne concentration of asbestos structures based on the analysis (Table 3). They differed somewhat, however, in both the total number of structures detected and in the identification of the category (7402 vs. protocol structure). Given the small number of structures detected in any of these analyses, and the inherent variability associated with detecting a small number of structures distributed over the face of a filter, the reported differences between the two analyses are not surprising, and fall within the range of theoretically predicted variability.
Table 3. Positive Air and Dust QC Samples. Air QC
RJ Lee Protocol Sample Analysis
EMS Protocol QC Analysis
EMS 7402 QC Analysis
Sample ID Tremolite Count
Tremolite Conc. (S/cc)
Tremolite Count
Tremolite Conc. (S/cc)
Tremolite Count
Tremolite Conc. (S/cc)
O 0421-21-2 2 0.00029 0 0 1 0.0003
Quarry Activity in Relation to Air Sampling The lime-related source operations at the quarry were: primary crushing, re-crushing, drying, milling and palletizing. Operations related to granite were not considered for the purposes of this study. To determine whether quarry activity during the air sample periods was typical of usual quarry activity, records of lime-related quarry production during the days of air sampling were compared to records of lime-related quarry activity during the period of April through December 2001. To maintain the confidentiality of these data, analysis of these data were carried out by NJDEP only. Legal requirements of confidentiality prohibit the reporting of quarry production data in this report. However, close comparison of total lime-related production data during the sampling period, to production during the April-December period indicates that, in general, quarry operation on the days when air sampling was conducted was typical of operation both before and after the sampling period.
Statistical Analysis and Risk Characterization of Air Sampling Data Air Measurements
A total of 192 air sampling filters were collected during the current study, including:
• 24 blanks;
• 28 air samples collected at each of four residences in the vicinity of the Quarry (for a total of 112 residential samples); and

27
• 28 air samples collected at each of two remote locations in the general area (for a total of 56 remote samples).
Only a very small number of putative asbestos structures were detected among the air samples analyzed. A total of only eight structures was observed, spread over six samples among the 168 field samples. Two of the putative asbestos structures that were detected (both from the same sample) are in fact chrysotile asbestos. These structures are not further addressed in this evaluation because:
• based on geologic analysis, chrysotile is not known to occur in the rocks of the Quarry;
• only two chrysotile structures were detected, both were observed in the same sample; and the sample was collected from a remote location (and therefore considered to be representative of local background rather than Quarry contributions); and
• chrysotile is ubiquitous (at low concentrations) in the environment in any case, so that occasional detection of chrysotile structures in a study of this type is not considered unusual.
All of the remaining six fibrous structures detected in air samples during this study were tremolite. The six tremolite structures detected were spread over five separate samples (one sample exhibited two structures). These structures are the focus of the following evaluation.
Given the very small number of tremolite structures detected, opportunities for formal analysis of these data are limited to the most robust statistical methods available. Thus, the data were pooled so that they could be reasonably interpreted. Sample results were pooled based on the wind direction during the time that each sample was collected. This is so that samples potentially affected by the Quarry could be grouped and distinguished from samples unlikely to have been affected by the Quarry.
Results of all of the asbestos measurements and the associated characterization of wind direction are summarized in Table 4. The first column of Table 4 indicates the date representing each 24-hour period during which samples were collected. The next three columns indicate the percentage of each 24-hour period during which the wind direction caused residential sampling locations to be crosswind (X), upwind (U), or downwind (D) from the Quarry, respectively. The next column indicates the percentage of time that winds were calm (C) and thus favored no specific direction of transport.
The sixth and seventh columns of Table 4 indicate the average character of the winds assigned for each 24-hour sampling period. Such character was assigned in each of the two following ways. For “Daily Average Wind Character” (Column 6), time during which winds were upwind or crosswind was grouped to represent time during which the Quarry was unlikely to affect residential sampling locations. Similarly, downwind and calm periods were grouped to represent the time during which the Quarry might potentially affect residential sampling locations. The average daily character (reported in Column 6) was then determined using the following algorithm. If either upwind/crosswind (UX) or downwind/calm (DC) periods represented at least 70% of a day, the entire day was characterized as belonging to that category. If neither group

28
represented at least 70% of the day (meaning that the second category represented at least 30% of the day), then the day was characterized as “ambiguous.” Under this approach, asbestos structures detected during a given day would be attributed to the Quarry, if the wind on that day was characterized as either “downwind” or “calm.”

29
TABLE 4:
ASBESTOS AND WIND DIRECTION DATA CHARACTERIZED FOR RESIDENTIAL SAMPLING LOCATIONS (WITH A 70% CUTOFF FOR CATEGORIZING DAILY
AVERAGES) Daily Daily Active Location Type Wind Direction (percent time) Avg Wind Avg Wind Structure Structure
Date Crosswind Upwind Downwind Calm Character Character (excluding
"calm")
Detected Detected
(=X) (=U) (=D) (=C) 4/16/01 11.29 14.52 38.71 35.48 CD Ambiguous 4/17/01 1.64 1.64 78.69 18.03 CD D
4/18/01 6.67 0.00 50.00 43.33 CD D 4/19/01 7.29 2.08 47.92 42.71 CD D 4/20/01 16.67 58.33 8.33 16.67 UX UX 4/21/01 17.71 52.08 4.17 26.04 Ambiguous UX Residence 2 tremolite 4/22/01 25.00 20.83 15.63 38.54 Ambiguous UX 5/4/01 9.38 5.90 50.69 34.03 CD D Residence 1 tremolite
Remote 2 chrysotile 5/5/01 6.94 3.47 85.76 3.82 CD D 5/6/01 18.40 43.40 10.76 27.43 Ambiguous UX 5/7/01 6.25 57.64 9.38 26.74 Ambiguous UX 5/8/01 6.62 51.57 9.41 32.40 Ambiguous UX 5/9/01 4.86 30.90 40.28 23.96 Ambiguous Ambiguous
5/10/01 0.36 40.07 40.79 18.77 Ambiguous Ambiguous Remote 1 tremolite 5/14/01 6.05 2.82 52.82 38.31 CD D 5/15/01 21.22 3.96 38.13 36.69 CD Ambiguous Residence 1 tremolite 5/16/01 53.31 17.42 28.22 1.05 UX UX 5/17/01 81.94 17.01 0.69 0.35 UX UX 5/18/01 40.28 26.04 4.51 29.17 Ambiguous UX 5/19/01 28.82 5.90 45.14 20.14 Ambiguous Ambiguous 5/20/01 48.61 8.68 25.00 17.71 Ambiguous Ambiguous 6/8/01 4.53 21.95 47.04 26.48 CD Ambiguous 6/9/01 34.72 3.82 39.93 21.53 Ambiguous Ambiguous
6/10/01 11.11 31.94 10.07 46.88 Ambiguous UX 6/11/01 6.94 33.68 15.97 43.40 Ambiguous UX Residence 1 tremolite 6/12/01 4.86 44.44 23.61 27.08 Ambiguous Ambiguous 6/13/01 7.99 38.54 20.14 33.33 Ambiguous Ambiguous 6/14/01 3.82 56.60 5.21 34.38 Ambiguous UX
17.62 24.83 30.25 27.30 Avg 18.95 19.90 22.42 12.37 Std Dev
Note that increasing the required fraction of the day represented by a single group of wind conditions (e.g. 80%, instead of 70%) to characterize a day using the algorithm above would increase the confidence that such days are truly representative of the

30
conditions for which they are characterized. Given the daily variability of wind observed during this study, however, it also would substantially increase the number of days defined as “ambiguous” meaning that such days cannot be characterized as representing only a single group of wind conditions.
In contrast, decreasing the required fraction of the day represented by a single group of wind conditions in the above algorithm (e.g. to 50% from 70%) decreases the number of days ultimately characterized as ambiguous. However, this also increases the chance that any particular day might be mis-characterized. Using a cutoff of 50%, for example, results in zero days characterized as ambiguous, but some of the days characterized as one group of conditions (say, downwind) may be as much as 50% upwind. Table 4, illustrates the effect of changing the cutoff to 50%. The format for Table 5 is identical to that of Table 4.
TABLE 5:
ASBESTOS AND WIND DIRECTION DATA CHARACTERIZED FOR RESIDENTIAL SAMPLING LOCATIONS (WITH A 50% CUTOFF FOR CATEGORIZING DAILY
AVERAGES) Daily Daily Active Location Type Wind Direction (percent time) Avg Wind Avg Wind Structure Structure
Date Crosswind Upwind Downwind Calm Character Character (excluding
"calm")
Detected Detected
(=X) (=U) (=D) (=C) 4/16/01 11.29 14.52 38.71 35.48 CD D 4/17/01 1.64 1.64 78.69 18.03 CD D 4/18/01 6.67 0.00 50.00 43.33 CD D 4/19/01 7.29 2.08 47.92 42.71 CD D 4/20/01 16.67 58.33 8.33 16.67 UX UX 4/21/01 17.71 52.08 4.17 26.04 UX UX Residence 2 tremolite 4/22/01 25.00 20.83 15.63 38.54 CD UX 5/4/01 9.38 5.90 50.69 34.03 CD D Residence 1 tremolite
Remote 2 chrysotile 5/5/01 6.94 3.47 85.76 3.82 CD D 5/6/01 18.40 43.40 10.76 27.43 UX UX 5/7/01 6.25 57.64 9.38 26.74 UX UX 5/8/01 6.62 51.57 9.41 32.40 UX UX 5/9/01 4.86 30.90 40.28 23.96 CD D
5/10/01 0.36 40.07 40.79 18.77 CD D Remote 1 tremolite 5/14/01 6.05 2.82 52.82 38.31 CD D 5/15/01 21.22 3.96 38.13 36.69 CD D Residence 1 tremolite 5/16/01 53.31 17.42 28.22 1.05 UX UX 5/17/01 81.94 17.01 0.69 0.35 UX UX 5/18/01 40.28 26.04 4.51 29.17 UX UX 5/19/01 28.82 5.90 45.14 20.14 CD D 5/20/01 48.61 8.68 25.00 17.71 UX UX

31
6/8/01 4.53 21.95 47.04 26.48 CD D 6/9/01 34.72 3.82 39.93 21.53 CD D
6/10/01 11.11 31.94 10.07 46.88 CD UX 6/11/01 6.94 33.68 15.97 43.40 CD UX Residence 1 tremolite 6/12/01 4.86 44.44 23.61 27.08 CD UX 6/13/01 7.99 38.54 20.14 33.33 CD UX 6/14/01 3.82 56.60 5.21 34.38 UX UX
17.62 24.83 30.25 27.30 Avg 18.95 19.90 22.42 12.37 Std Dev
In either table, for “Daily Active Average Wind Character” (Column 7 of either table) crosswind and upwind time was grouped as previously described. For this case, however, calm conditions were considered neutral and ignored so that asbestos structures detected during a given day would only be attributed to the Quarry if the wind during that day was characterized as “downwind.” Then, the daily active character was determined in a manner similar to that described above. Thus, if either UX or D (downwind) periods represented at least 70% of the part of a day that winds were actively blowing (i.e. with the calm period of the day excluded), then the entire day was characterized as belonging to that category. Otherwise, the day was defined as ambiguous.
It is important to remember that, during truly calm periods, the primary mechanism of transport is dispersion (random motion in all directions away from high concentration sources to areas of lower concentrations), while on windy days, the primary mechanism of transport is advection (being carried by the wind) and that the latter mechanism is substantially more rapid than the former. In reality, periods reported as “calm,” may be include brief periods in which winds blow in varied directions at speeds that are too low and for periods that are too brief to allow categorization. Thus, particles may be transported by advection during these periods, but only at low wind speeds in various directions -not necessarily downwind. Thus, the progress of transport in any one direction during such periods will still be substantially slower than during periods that are categorized by winds blowing in specific directions. Therefore, pairing days when winds are calm with days when winds blow such that residential sampling locations are directly downwind of the Quarry should generally overestimate any potential impact of the Quarry. This should be kept in mind when interpreting results from this analysis.
The last two columns of Tables 4 and 5 indicate, respectively, the location where samples exhibiting putative asbestos structures were collected and the number of structures and type of structures detected on each sample. Note that rows representing days in which structures were detected near a residence are highlighted.
Analysis of Air Measurements
Two issues are addressed with these data:
• whether the data suggest that the Quarry may be a source of the fibrous tremolite structures observed in the air; and

32
• estimation of the lifetime cancer risk associated with the concentrations of airborne tremolite fibers that may be found in the area.
Testing whether the Quarry is a source of airborne tremolite
To consider whether the data implicate the Quarry as a source of the asbestos structures detected in the air samples, a series of hypotheses were evaluated to determine, first, whether wind conditions on the days during which asbestos structures were detected differ from wind conditions during days when no structures are detected and, second, (if they do) whether the wind directions associated with detection of asbestos are in an upwind or downwind direction relative to the Quarry. Statistical tests using a combination of chi square analyses (for example, Lowry 2002) and analyses using Fisher’s exact test (for example, Lowry 2002) were employed to make these determinations.
Initially, a series of two-by-three matrices were set up so that chi square analyses could be performed to determine whether the pattern of winds representative of days during which structures were detected differ significantly from days in which no structures were detected. The following Table 6 is an illustration of such a matrix.
TABLE 6:
NUMBER OF DAYS EXHIBITING INDICATED WIND CONDITIONS
(For Days Characterized by Conditions Representing at Least 70% of the Day)
Structures Wind Conditions Row Total Number of Days
Calm- Downwind
(CD)
Upwind-Cross-wind
(UX)
ambiguous
Detected 2 0 2 4 Not-Detected 7 3 14 24 Column Total Number of Days
9 3 16 28
This matrix corresponds to the data from Column 6 of Table 4 and is based on counts of days. A similar matrix was also set up based on Column 7 of Table 4. Additionally, matrices were also tested based on numbers of samples, rather than days. Four residential samples were collected during each sampling day. Thus, for example, while structures were detected on two days characterized as CD (as indicated in the above table), they were also detected on each of two samples under these conditions. At the same time, there were 34 samples representing similar conditions (6 from the same days that structures were detected and 28 on the other 7 days when no structures were detected on any samples) on which no structures were detected. Chi square analysis is a test of whether observed differences in the patterns of two discrete frequencies (such as those presented in the 2 x 3 matrix in Table 6) are due to chance alone. In the case of Table 6,

33
the chi-square analysis tests whether the frequencies of daily wind directions differ for days when structures were detected than for days when structures were not detected. For these tests, when the critical value for the chi-square test is exceeded (at a defined level of confidence, which in this case is chosen to be five percent) it means that there is less than a 5% chance that the difference in the frequencies in daily wind direction observed for days in which structures are either detected or not detected, respectively, is due to random fluctuations Chi square statistics calculated for each of the two-by-three matrices tested are summarized in Table 7.
TABLE 7:
CHI-SQUARE STATISTICS CALCULATED TO TEST WHETHER WIND PATTERNS FAVORING DETECTION OF TREMOLITE STRUCTURES DIFFER
FROM THOSE DURING WHICH NO STRUCTURES WERE DETECTED
Condition Tested Chi Square Statistic
Data from Column 6, Table 4 (by day) 1.0046 Data from Column 6, Table 4 (by sample) 0.8930
Data from Column 7, Table 4 (by day) 0.1296 Data from Column 7, Table 4 (by sample) 0.1152
The critical value for the chi square statistic at the 0.05 level of significance (for two degrees of freedom, which is appropriate for these two-by-three matrices) is 5.99. Since all of the values in the second column of Table 7 are substantially smaller than this critical value, there is no evidence from this analysis that wind conditions favoring detection of tremolite structures in any way differ from wind conditions in which they were not detected. Thus, conditions in which sampling locations are upwind or crosswind of the Quarry are just as likely to have produced detection of a structure than conditions in which sampling locations were downwind (or downwind/calm) from the Quarry. In further support of this conclusion, one of the six tremolite structures observed in this study was in fact collected in a remote location. Therefore, based on this analysis, and within the limitations of this study, these data provide no evidence that the Quarry is contributing tremolite structures to local air.
Given the central importance of determining whether the Quarry is contributing tremolite structures to the local air, the available air data from the current study was subjected to further analyses using Fisher’s Exact Test. When applied to test for trends in a two-by- two matrix, this test is more powerful (i.e. better able to detect small differences) than a chi square analysis. Therefore, the air data were re-grouped to allow comparison of several two-by-two matrices.
Remembering that four residential samples were collected each day, the data in Column 6 of Table 4 indicate that:

34
• 2 of 36 residential samples characterized as downwind(+calm) of the Quarry exhibited tremolite structures (1 on each sample);
• 2 of 64 residential samples characterized as ambiguous for wind exhibited tremolite structures (also 1 each);
• 0 (none) of 12 residential samples characterized as upwind of the Quarry exhibited tremolite structures; and
• 1 of 56 remote samples exhibited tremolite structures (1 structure).
Similar ratios were also constructed from the data in Column 7 of Table 4 and the data from Columns 6 and 7 of Table 5.
Comparing any two of the ratios constructed as described above, allows one to test for a significant difference between the two ratios using Fisher’s Exact Test. None of the ratios tested were significantly different, and none were even close. To illustrate, for the most extreme ratio difference: 2/36 tremolite structures collected during downwind + calm conditions versus 0/12 tremolite structures collected during upwind conditions (from Column 6 of Table 4): there is a 57% chance that two structures collected during downwind + calm conditions could result from the same random atmospheric distribution of structures that also resulted in the collection of no structures in the upwind direction (based on a one-tailed, i.e. directional, difference). In other words, there is a better than even chance that such a pattern of structure detection could have arisen by chance alone. Thus, once again, the data imply that airborne tremolite concentrations are the same no matter what wind conditions prevail. Therefore, within the limitations of the current study, there is no indication that the quarry is contributing to the airborne tremolite structures that have been observed.
Risk Characterization for Airborne Tremolite
Because there is no evidence from these data that the quarry is contributing to the airborne tremolite that has been observed in the study’s measurements and because wind direction does not appear to affect the observed levels, the most likely interpretation of the results is that there is a general background concentration of airborne tremolite structures in the study region. Therefore, the entire data set can be pooled to estimate tremolite structure concentrations in the local environment and the corresponding lifetime cancer risk.
Because Poisson frequency distributions characterize the probability of detecting a discrete event (such as encountering a tremolite structure) among a group of independent observations (such as independent air samples) of a common process or environment, we can fit the observed structure frequencies to a Poisson distribution to estimate the equivalent airborne concentration. Among residential samples, the observed frequencies of encountering structures are:
1 sample with two structures;

35
3 samples with one structure; and
108 samples with no structures.
Fitting these data (for example, Ritter 1998) indicate that they are indeed adequately described by a Poisson distribution and that the best fit distribution exhibits a mean of 0.045 structures. Thus, the average number of structures that would be expected on any single sample taken at any comparable outdoor location in the area is 0.045. Multiplying this expectation value by the analytical sensitivity for the sample measurements in the study (0.0003 s/cm3), results in an estimated airborne concentration of 1.35 x 10⁻⁵ s/cm3 for tremolite structures.
Note that analytical sensitivity is defined as the airborne concentration that would result in detection of a single structure in a sample. Therefore multiplying the analytical sensitivity by the number of structures expected on a sample provides an estimate of the average area-wide airborne concentration represented by that measurement.
As a check, the above calculation can be repeated with the inclusion of the remote samples. Thus, the distribution with the remote samples included is:
1 sample with two structures;
4 samples with one structure; and
163 samples with no structures.
These data are also adequately fit by a Poisson with a mean of 0.035 structures. Moreover, a chi square test for differences between this distribution and the distribution indicated above suggests that they are not statistically distinguishable.
The elevated area-wide average concentration of tremolite structures estimated in the above analysis can be translated into an estimate of lifetime cancer risk. The corresponding risk estimates are derived using each of two approaches.
Four of the six tremolite structures that were detected exhibit dimensions corresponding to NIOSH 7402 fibers (NIOSH 1989). The current U.S. Environmental Protection Agency (EPA) standard for including structures for cancer risk assessment is that they satisfy the NIOSH 7402 dimensional criteria and that they be true asbestos fibers. However, there is no EPA accepted procedure for distinguishing true fibers from other elongated structures (e.g., cleavage fragments) of similar mineral composition that is applicable to isolated structures found in the air. Therefore, to be conservative, all four of these structures are included in the following analysis, even though three of the four structures have been identified by the laboratory as cleavage fragments, and therefore may not be true fibers (see Appendix 3 for the laboratory characterization of individual structures as fibers or cleavage fragments).

36
Using the current EPA approach, lifetime cancer risk is estimated as the product of the estimated exposure concentration and the appropriate cancer potency slope factor. The slope factor for asbestos is 2.3 x 10⁻¹ (fiber/ml)-1 air (IRIS 1988).
Because only four of six (two thirds) of the tremolite structures detected in the air in this study qualify for this analysis (see above), the estimated ambient airborne concentration to which local residents may be exposed is two thirds of the above-estimated ambient concentration (1.35 x 10⁻⁵ s/cm3), which was derived based on observation of all six structures. Thus, the estimated ambient air concentration of 7402 structures is 9.0 x 10⁻⁶ s/cm3. Multiplying this concentration by the slope factor results in an estimated lifetime cancer risk of two in a million (2 x 10⁻⁶).
Risks are also estimated using a new protocol currently being scheduled for USEPA peer review (Berman and Crump 1999a and b). This approach involves evaluation of structures meeting the definition of “protocol structures” (see section “Approaches to Asbestos Risk Assessment” above). Three (i.e., one half) of the six tremolite structures detected in this study qualify as protocol structures. Thus, given an estimated concentration of 6.75 x 10⁻⁶ s/cm3 (one half of the total ambient air concentration estimated above for all six structures), the observation that one of the three protocol structures was longer than 10 µm (33%), and again assuming lifetime-continuous exposure, then the combined risk for lung cancer and mesothelioma estimated using this approach is approximately three in 100,000 (i.e., 3 x 10⁻⁵).
No matter which approach is employed, it appears that the risk attributable to breathing ambient concentrations of tremolite structures found in the environment in the vicinity of the Southdown Quarry are within the range of one-in-a-million (i.e., 1 x 10 -6) to one-in-ten thousand (i.e., 1 x 10⁻⁴) lifetime cancer risk, which is generally considered by the New Jersey Department of Environmental Protection (NJDEP) to be consistent with permitting of air emissions sources with possible consideration of source modification
Dust Samples A total of 54 dust samples were collected from window troughs and other undisturbed locations of 28 houses, which were distributed in the southeast of the Quarry (Figure 4). The houses were categorized to three zones by distance: Near, Middle and Far (Table 8). Only two samples were found to contain asbestos structures. One structure was found in each of two samples from separate houses. Each structure met the definition of both protocol and 7402 structures. Neither of the samples was from a house in the zone located closest to the quarry (the near zone) (Table 8). . The two sites with positive samples, D12 and D36, were both more than 40 years old. To at least some extent, the dust collected from the relatively undisturbed locations in the sampled housed represents historical accumulation of dust and any asbestos structures contained in that dust. The observation that the positive dust samples arose from houses which were among the oldest houses sampled raises the possibility that these samples represent historical deposition of asbestos.

37
Table 8. Dust Sampling Zones Zone Number of Houses Distance from Quarry Average Age of Houses Near 10 0.5 – 1.0 miles 11 years Middle 15 1.0 – 1.25 miles 28 years Far 3 > 1.5 miles 49 years
Table 9. Data for positive Dust Samples Sampling Date
Location Distance Number of Structures Detected
Type Protocol / 7402 structures
Concentration in house dust (million s/g)
Age of House
3/17/2001 Middle Zone (D36)*
1.1 miles 1 tremolite Both 0.81 40 years
2/12/2001 Far Zone (D12)
1.9 miles 1 tremolite Both 0.95 55 years
*: detected positive in QC analysis, containing tremolite cleavage structures.
Statistical Analysis of Dust Sampling Data The settled dust sampling campaign was designed primarily to test for the presence of gross trends in the deposition of asbestos structures inside residences with distance from the Quarry. This design was adopted based on the hypothesis that, if the Quarry were the source of asbestos structures, then the concentration of structures in accumulated house dust would be highest in houses closest to and downwind of the Quarry and lower in areas further from the Quarry. To accomplish this, the residential area that lies adjacent to the Quarry in a downwind direction (under prevailing conditions) was divided into near, middle, and far zones. If sufficient asbestos were found, then by collecting multiple samples from each zone and evaluating average concentrations from pooled results within each zone, differences in the observed content of asbestos in the dust could suggest a general direction from the source of the asbestos.
Fifty-four settled dust samples were collected from the residential area near the Quarry. Among the 54 dust samples, a total of only two putative asbestos structures (both tremolite) were detected (one on each of two samples). Note that, as with the air samples, the structures are defined as “putative” because, while they satisfy the dimensional criteria for asbestos structures and they are both composed of asbestos-related minerals (tremolite), there is laboratory evidence that they may not be true fibers (see Appendix 4). No asbestos structures were detected in any of the other dust samples.
The distribution by zone of the samples collected is provided in Table 10.

38
TABLE 10:
RESULTS OF SETTLED DUST SAMPLING IN THE RESIDENTIAL AREA ADJACENT TO SOUTHDOWN QUARRY
Zone Number of Houses
Sampled Number of
Samples Collected
Number of Samples Exhibiting Tremolite
Structures Near 10 21 Middle 15 27 1 Far 3 6 1
Totals 28 54 2 Statistical Analysis of Dust Samples
That the two tremolite structures detected in settled dust samples (Table 10) were observed in the middle and far zones (as opposed to the near zone) does not provide evidence of a trend in direction that implicates the Quarry as a source of those structures. However, the power of any formal analysis of these data is severely limited by the small number of structures detected. For example, based on Fisher’s Exact Test, the frequencies of detection of tremolite in neither the far zone (one of six samples) nor the middle zone (1 of 27 samples) can be distinguished from observations in the near zone (0 of 21 samples).
Moreover, results from this analysis are confounded by effects of time. Because airborne structures would be expected to accumulate over time, the probability of detecting such structures should increase with the age of the houses sampled (assuming that settled dust accumulated over the entire lifetime of the house). Therefore, that the tremolite structures detected were collected from two of the oldest houses in the residential community (EOHSI 2002b), may simply be consistent with low but steady accumulation of tremolite due to background ambient conditions.

39
Dust Sample QC Results In the dust sample QC analysis, one sample was detected positive for asbestos structures in the primary analysis (RJ Lee), but was negative for asbestos structures in the blind re-analysis by RJ Lee.. Another QC dust sample was negative for asbestos structures in the primary analysis , but was positive in the blind re-analysis by RJ Lee All of the QC samples re-analyzed by EMS, including the two discussed above, were negative for asbestos structures (Table 11). Given that a total of only two asbestos structures were detected among all the analyses of dust samples, and given the variability inherent in analysis of structures distributed across the face of a filter, the difference between the detection of zero structures and one structure in these analyses is not statistical significant. The results reported by EMS are therefore not inconsistent with the results reported by RJ Lee.
Table 11. Dust Sample QC Results
RJ Lee Protocol & 7402
Sample Analysis RJ Lee Protocol & 7402 QC
Analysis EMS Protocol & 7402 QC
Analysis Sample ID Tremolite
Count Tremolite
Conc. in dust (million S/g)
Tremolite Count
Tremolite Conc. in dust (million S/g)
Tremolite Count
Tremolite Conc. in dust (million S/g)
D12 1 0.95 NA NA 0 0 D36 0 0 1 0.81 0 0

40
Summary of Air and Dust Sampling Results and Findings • At the two closest air sampling sites, Site 1 and Site 2, a small concentration of asbestos structures were detected in ambient air samples on three dates. • No asbestos structures were detected in indoor samples. • In general, overall quarry production during the air sampling periods appears to have been typical of quarry production both before and after the air sampling. • Statistical analysis of the wind directions on days when asbestos structures were detected in air samples provides no direct support for the hypothesis that quarry was the source of the structures. • Depending on the risk assessment approach employed, the lifetime cancer risk associated with the measured concentration of asbestos structures is in the range of 2 x 10⁻⁶ to 3 x 10⁻⁵ (two-in-a-million to three in a hundred thousand). These risk estimates are based on the assumption of continuous 70 year exposures. • A total of two asbestos structures were detected in settled dust in two of 28 houses sampled. These houses were located between one and two miles from the quarry. No asbestos structures were detected in the house dust in the zone closest to the quarry. • The results of the house dust sampling do not provide evidence that the quarry is the source of the asbestos structures detected. Based on the results, we can provide the following answers to the three questions posed in the introduction to this report:
Question 1 Are levels of biologically relevant asbestos structures in air present at a level which can case a significant cancer risk with long-term exposure?
The estimated lifetime cancer risk associated with the measured concentration of asbestos structures in outdoor air in this study is 2 x 10⁻⁶ to 3 x 10⁻⁵ (two-in-a-million to three in a hundred thousand) depending on the specific risk assessment approach which is employed. While these values represent a non-zero lifetime risk, they are in a range which is generally considered low in environmental risk management.
No asbestos structures were detected in any of the indoor air samples. This suggests that there is no significant additional risk resulting from long-term accumulation of asbestos structures indoors which are available to be re-suspended in air with normal household activities. Given the fact that people generally spend considerably more time indoors than outdoors, these results have important and positive public health implications.
Question 2 If elevated levels of biologically relevant structures are detected in air downwind of the quarry, is there evidence that the quarry is the source of those structures?
Neither the air samples nor the settled house dust samples provide clear support for the hypothesis that the quarry is the source of the asbestos structures which were detected.

41
The overall estimate of risk would not likely change substantially if additional air and test sampling were done. This does not necessarily imply that the quarry does not emit, or has not emitted asbestos structures. The second phase of this project involving the analysis of core samples from the quarry, modeling of quarry emissions, and their dispersion in the local environment will provide an estimate of the future potential for risk from quarry emissions. This analysis, which will also supplement the current report, is being completed. Results from that portion of the study should provide information about the extent to which any asbestos emission from the quarry may contribute to the overall level of asbestos in the local environment
Question 3 If residents are being exposed to levels of biologically relevant asbestos structures emitted from the quarry which pose a significant health risk, what actions may be necessary to adequately control such exposure?
Given both the relatively low cancer risk which can be estimated from this study, and the lack of evidence linking the quarry to the measured asbestos structures in the local environment, this study provides no basis for identifying additional actions at this time which would be necessary or useful for the control of exposures. However, it should be emphasized that the New Jersey Department of Environmental Protection has required increased controls on the emission of overall dust and particulates from the quarry. Measures which have been required to reduce general dust emissions will necessarily also reduce asbestos emissions.
References Ambient air -- Determination of asbestos fibers -- Direct transfer transmission electron microscopy method, ISO 10312:1995, International Organization for Standardization. Berman D.W., Crump K.S., Chatfield E.J., Davis J.M., Jones A.D. (1995). The sizes, shapes, and mineralogy of asbestos structures that induce lung tumors or mesothelioma in AF/HAN rats following inhalation. Risk Anal Aug;15:541. Berman, D.W. and Crump, K.S. (1999a). Methodology for Conducting Risk Assessments at Asbestos Superfund Sites. Part 1: Protocol. Prepared for: Kent Kitchingman, U.S. Environmental Protection Agency, Region 9, 75 Hawthorne, San Francisco, California 94105. Under EPA Review. Berman, D.W. and Crump, K.S. (1999b). Methodology for Conducting Risk Assessments at Asbestos Superfund Sites. Part 2: Technical Background Document. Prepared for: Kent Kitchingman, U.S. Environmental Protection Agency, Region 9, 75 Hawthorne, San Francisco, California 94105. Under EPA Review. EOHSI. (2001). Quality Assurance Project Plan (QAPP): Assessment of Population Exposure and Risks to Emissions of Protocol structures and Other Biologically Relevant Structures from the Southdown Quarry. EOHSI, August 2001.

42
Integrated Risk Information System-IRIS (1988). Toxicological Review of Asbestos. U.S. Environmental Protection Agency. http://www.epa.gov/iris/subst/0371.htm. Lowry, R (2002) Chapter 8 in Concepts and Applications of Inferential Statistics, on Web Page of Vasser College. http://faculty.vassar.edu/lowry/webtext.html NIOSH B National Institute for Occupational Safety and Health (1989). Method for the determination of asbestos in air using transmission electron microscopy. NIOSH Method 7402. NIOSH, Cincinnati, Ohio, U.S.A.
NJDEP (2000). Framework for Assessing Possible Risks Posed by the Presence of Asbestos and Related Structures from Emissions from Southdown Quarry. NJDEP, August, 2000.
Ritter, J. (1998), Binomial and Poisson Statistics Functions in Java Script, http://www.ciphersbyritter.com/JAVASCRP/BINOMPOI.HTM

43
Appendices

44
Appendix 1. Report of and Response to NJDEP Audit
E O H S I
ENVIRONMENTAL AND OCCUPATIONAL HEALTH SCIENCES INSTITUTE
170 Frelinghuysen Road Piscataway, N.J. 08854 (732} 445-0150 Fax: (732) 445-0116
EXPOSURE MEASUREMENT AND ASSESSMENT DIVISION
MEMORANDUM TO: Joseph Aiello, Chief
Office of Quality Assurance
FROM: Lih-Ming Yiin, Ph.D. EOHSI Project Manager DATE: June 27, 2001
SUBJECT: Response to Audit of Sample Collection for Southdown Study
In the audit report prepared by NJDEP Office of Quality Assurance, it is recommended that all samples should be delivered back to EOHSI at the end of the seven day sampling episode and stored in a secure location prior to delivery to the analytical laboratories. We failed to bring back the samples collected during the second sampling episode, since the third sampling episode started just a weekend away. After receiving the recommendation from the OQA officers on May 14, 2001, we brought back the samples collected from the second sampling episode on the sarne day, and stored them in a lockable tackle box in a secure location at EOHSI.
To avoid any possibility of sample confusion, contamination or loss, during the remaining sampling episodes, we transferred all the samples collected on the same day from the sampling case, which was carried and used during the sampling, to another aluminum case for storage at the end of the day. All the chain of custody forms and sample data sheets were also transferred with those samples. When finishing sample collection for the third and fourth sampling episodes, we brought all the samples back to EOHSl and properly stored them at the end of each sampling episode. We wrapped each sample cartridge with aluminum foil and paired the two cartridges with different flow rates collected at the same site in a plastic bag. Sample labels were double checked and attached to the exterior surfaces of aluminum foil that wrapped around samples. All prepared samples were again stored in a secure location prior to shipment to the analytical laboratory. If you have any questions or concerns with this response, please contact me at (732) 445-6942 or [email protected].

45
Cc: Alan Stern, Dr.P.H., NJDEP Bureau of Risk Analysis Paul Buckley, Ph.D., NJDEP OQA
Marc M. Ferko. NJDEP OQA Paul Lioy, Ph.D., EOHSI Junfeng Zhang. Ph.D., EOHSI Robert Hague., Ph.D. EOHSI
EOHS jointly sponsored by the University of Medicine and Dentistry of New Jersey - Robert Wood Johnson Medical School and Rutgers, the State University of New Jersey

46

47

48

49

50

51

52

53

54

55
From: Marc Ferkc, To: Stern, Alan Date: Thu, Feb 21, 2002 2:39 PM Subject: Southdown Quarry Air Sampling Project
The air sampling performed for the" Assessment of Population Exposure and Risks to Emission of Protocol Structures from the Southdown Quarry" was found to meet all the required quality assurance practices. The Quality Assurance Project Plan was approved, a field audit of the air sampling techniques was performed and the collected data was reviewed. No irregularities exist which would preclude the use of the data for regulatory decision making purposes.
CC: Aiello, Joseph; Buckley, Paul

56
From: Marc Ferko To: Stern, Alan Date: 4/9/02 4:00PM Subjec: Southdown Quarry Dust Sampling Project The dust sampling performed for the "Assessment of Population Exposure and Risks to Emission of Protocol Structures from the Southdown Quarry" was found to meet all the required quality assurance practices. The Quality Assurance Project Plan was approved and the collected data was reviewed. No irregularities exist which preclude the use of the data for regulatory decision making purposes.

57
Appendix 2. Indoor and Outdoor Air Sample Data

58

59

60

61

62

63

64

65

66

67

68

69
Appendix 3. Meteorological Data (Windroses, Wind Speeds and Directions)

70
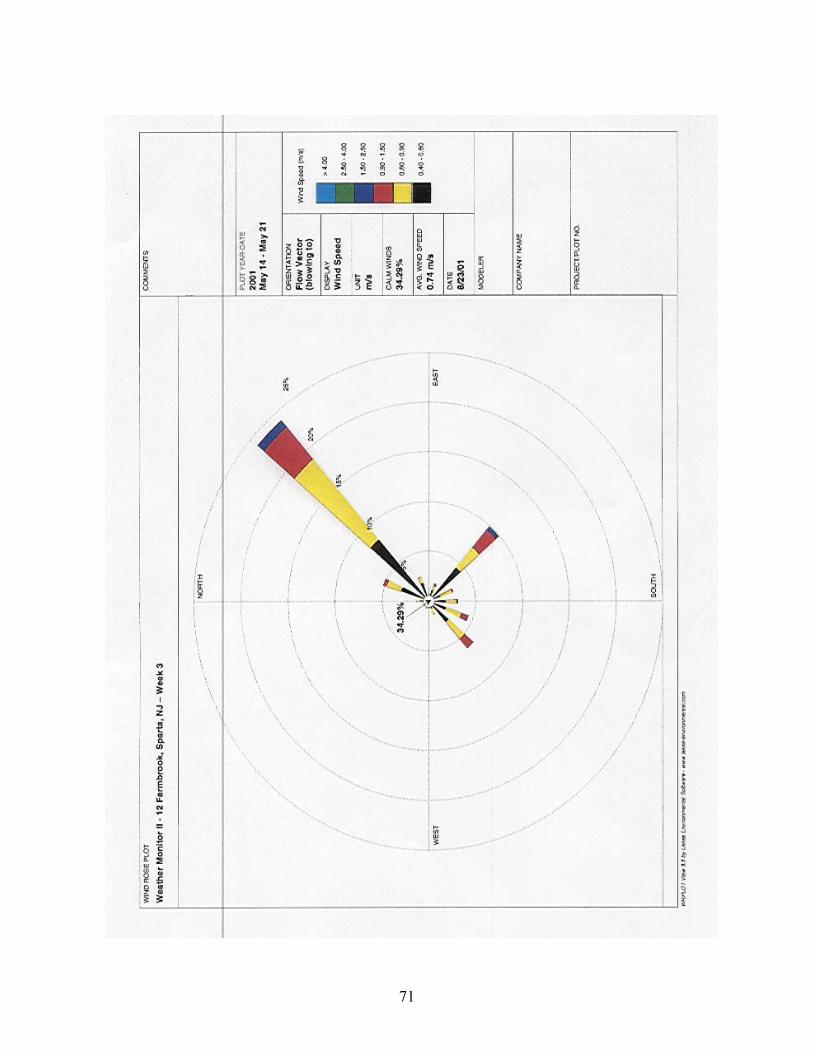
71
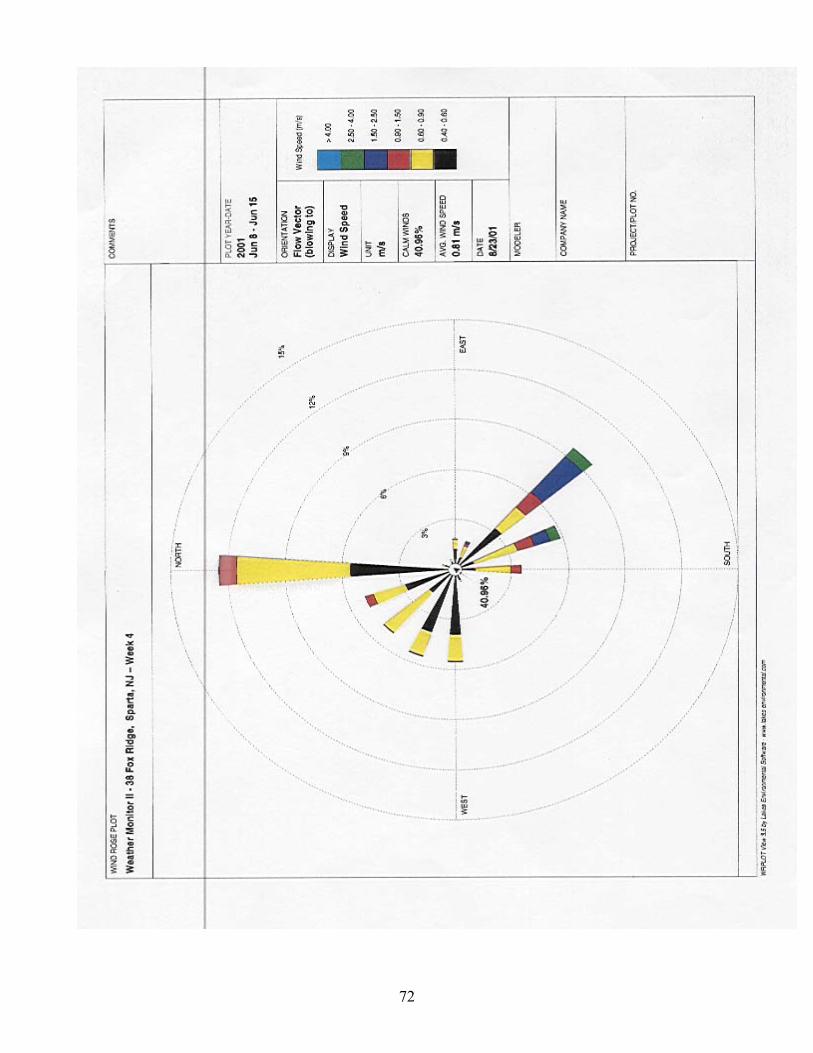
72

73

74

75

76

77

78

79

80

81
Appendix 4. Dust Sample Data.

82

83
Appendix 5. Air and Dust QC Data

84

85

86