statistical yearbook for asia and the pacific 2012
DESCRIPTION
This publication presents data for the 58 ESCAP member countries, as well as world, regional, sub-regional and economic aggregates for comparison. It offers current trends and emerging topics in the Asia-Pacific region, grouped around the themes of people, the environment, the economy and connectivity. It provides the international and regional community with key indicators, objective analyses of the current trends and emerging issues, along with data and charts. In order to maximize the comparability, the data is sourced exclusively from international agencies that adhere to the official global statistical standards.TRANSCRIPT


STATISTICAL YEARBOOK FOR ASIA AND THE PACIFIC
2012
Country profiles
We appreciate your feed-back Questions or comments concerning this publication may be addressed to the Director of the ESCAP Statistics Division, United Nations Economic and Social Commission for Asia and the Pacific, Bangkok, Thailand, 10200 by emailing [email protected] ESCAP encourages all readers and users of the Yearbook to complete the electronic readership survey (http://www.unescap.org/stat/data/syb2012/readership-questionnaire.asp)

Statistical Yearbook for Asia and the Pacific 2012
ii
Statistical Yearbook for Asia and the Pacific 2012
United Nations Publication Copyright © United Nations 2012 All rights reserved ST/ESCAP/2647

Statistical Yearbook for Asia and the Pacific 2012
iii
Preface This 2012 edition of the Statistical Yearbook for Asia and the Pacific is the first in a new publication schedule and is being published only online for the first time. Starting from this edition, the Yearbook will be available as a printed edition every two years and as an online edition in intermediate years. The Yearbook remains a publication for a non-specialized audience interested in development issues in the Asia-Pacific region. While keeping its richness in information content, we try to maintain a user-friendly format, including using numerous charts to visualize statistical information. The 2012 Yearbook includes country profiles for the 58 regional members and associate members of ESCAP. The country profiles present key indicators selected from the complete list of indicators that are published in the Yearbook. For each country, statistical information is presented in tables with the latest available values and numerous statistical charts presenting trends over the last 20 years, and, where possible, comparison with regional and world averages. The country profiles are complemented by regional and sub-regional tables providing an overview of Asia-Pacific in comparison with other major regions of the world and selected country groups. While only key statistical information is available through the country profiles, more complete tables are available on the Yearbook website at http://www.unescap.org/stat/data/syb2012. Tables are published as data files to facilitate their re-use and further processing by data users. The statistical database from which the Yearbook is published is available online at http://www.unescap.org/stat/data/statdb/DataExplorer.aspx. Being updated twice a year (end of March and end of October of every year), the online database contains complete time series. In our continuous attempt to improve the Statistical Yearbook, we need to hear from its users. Please kindly take the time to fill the readership questionnaire available at http://www.unescap.org/stat/data/syb2012/Readership-Questionnaire.asp .

Statistical Yearbook for Asia and the Pacific 2012
iv

Statistical Yearbook for Asia and the Pacific 2012
v
Team for the preparation of the Statistical Yearbook for Asia and the Pacific 2012 The primary responsibility for producing the Statistical Yearbook lies with the ESCAP Statistics Division, under the guidance of Haishan Fu, Director, Statistics Division. The team for the production of the Statistical Yearbook includes: Coordination Eric Hermouet Statistics and data management Krisana Boonpriroje, Nongnuch Hiranyapaisansakul, Marisa Limawongpranee, Nixie Mabanag-Abarquez, Teerapong Praphotjanaporn, and Panpaka Supakalin Editing Isabel Pereira Rodrigues Layout and process management The Statistical Yearbook 2012 has been produced through a script in R developed by Eric Hermouet, with the assistance of Harumi Shibata, Habibur Rahman Khan, Emanuela Furfaro and Nan Ye. Cover design Laksanawadee Klawploadtook and Krisana Boonpriroje.

Statistical Yearbook for Asia and the Pacific 2012
vi
Acknowledgements This publication would not have been possible without the contribution of data from numerous international agencies (listed below) which compiled and produced statistics. Special thanks are extended to the ILO Employment Trends Unit, the UNESCO Institute for Statistics, and the World Tourism Organization (UNWTO) for providing datasets and contributing to the calculation of regional and economic aggregates. List of online data sources Asian Development Bank (ADB), Key Indicators http://www.adb.org/ EM-DAT: Emergency Events Database http://www.emdat.be/ Food and Agriculture Organization (FAO), Global Forest Resources Assessment
http://www.fao.org/
International Energy Agency Database http://www.iea.org/ International Labour Organization (ILO), Key Indicators of the Labour Market Sixth Edition
http://www.ilo.org/
International Monetary Fund (IMF), International Financial Statistics
http://www.imf.org
International Telecommunication Union (ITU), World Telecommunication/ICT Indicators
http://www.itu.int/
International Union for Conservation of Nature (IUCN) http://www.iucn.org/nature Inter-Parliamentary Union, Women in National http://www.ipu.org/wmn-e/ Joint United Nations Programme on HIV/AIDS (UNAIDS), Global Report: UNAIDS Report on the Global Epidemic 2010
http://www.unaids.org/AIDS/globalreport
UNSD, National Accounts Main Aggregates Database http://unstats.un.org/unsd Organisation for Economic Co-operation and Development (OECD), Development Database on Aid from DAC Members; OECD.Stat database; and The Gender, Institutions and Development database
http://www.oecd.org
UNdata http://data.un.org/ ESCAP, Transport Division http://www.unescap.org/ttdw/ UNESCO Institute for Statistics, Data Centre http://www.uis.unesco.org United Nations Comtrade http://comtrade.un.org/ United Nations Conference on Trade and Development (UNCTAD), World Investment Report
http://www.unctad.org/
United Nations Environment Programme, Emission Database for Global Atmospheric Research
http://edgar.jrc.ec.europa.eu/
United Nations Millennium Development Goals Indicators http://mdgs.un.org/ United Nations Population Division (UNPD); World Population Prospects, The 2010 Revision; World Urbanization Prospects, The 2009 Revision; World Migrant Stock, The 2008 Revision
http://esa.un.org/unpd/wpp/ http://esa.un.org/migration/
United Nations Service Trade Database http://unstats.un.org/unsd/ WHO Global Health Observatory; World Malaria Programme, World Malaria Report 2011; WHO Department of Mental Health and Substance Abuse; Global status report on road safety
http://www.who.int http://apps.who.int/ghodata/
World Bank, Development Research Group, World Development Indicators
http://data.worldbank.org/
World Tourism Organization (UNWTO) http://unwto.org/ World Trade Organization (WTO) http://www.wto.org/

Statistical Yearbook for Asia and the Pacific 2012
vii
Asia-Pacific development 2012
Did you know?
People
More than 4.2 billion people lived in the Asia-Pacific region in 2011, constituting 60% of the world’s population...
The region includes the only two countries in the world that have populations exceeding 1 billion: China and India.
Fertility rates have declined in the region; in 2011, the region-wide fertility rate was equal to the “replacement rate” (2.1 births per woman)…
East and North-East Asia and North and Central Asia have the lowest fertility rates in the region, 1.6 and 1.8 live births per woman, respectively. The highest rates are found in South and South-West Asia, at 2.6, and the Pacific island developing economies, at 3.6.
Among female adolescents (women aged 15-19 years) in the Asia-Pacific region, during the period 2005-2010, the fertility rate was 45.2 live births per 1,000 women — less than half the rate in Africa and almost triple the rate in Europe. Afghanistan and Nepal were the only two countries in the region whose adolescent fertility rate exceeded 100.
The Asia-Pacific region has the highest ratio of boys to girls in the world...
In Asia and the Pacific, the child sex ratio (boys per 100 girls aged 0-14) was 110 in 2011, much higher than the sex ratio under natural conditions (105). The population sex ratio in the region was 104 (men per 100 women) in 2011. The child sex ratio and the population sex ratio are higher than in any other region of the world. In 2011, China had the highest child sex ratio (121) and population sex ratio (108) in the region.
The elderly numbered 301 million in the Asia-Pacific region in 2011...
The proportion of the elderly (aged 65 and above) in Asia and the Pacific increased from 5.3% in 1990 to 7.1% in 2011, representing a 36% increase in their share of the total population. By subregion, the share of the elderly increased by 51% in East and North-East Asia, 42% in South-East Asia, 31% in South and South-West Asia, 20% in North and Central Asia, and 19% in the Pacific.
Over the last decade, the life expectancy for both women and men increased in every country in the Asia-Pacific region (with available data); the largest increase was seen in Nepal, where the life expectancy for women increased by 4.1 years, and for men by 3.7 years.
Urbanization in the Asia-Pacific region is increasing, along with the rest of the world...
Between 2005 and 2010, the urban proportion of the world’s population overtook the rural proportion. That tendency continued in 2011, rising from 49% in 2005 to 51% in 2011. In Asia and the Pacific (the second least urbanized region in the world) the proportion of the urban population increased from 33% in 1990 to 43% in 2011. Between 2005 and 2011, the proportion of the urban slum population in the region decreased from 35% to 31%.
In 2010, the Asia-Pacific region was host to 53 million international migrants...
Migrants living in the region comprised 25% of the world’s total migrant population in 2010. The proportion of migrants in the total Asia-Pacific population was 1.3%.

Statistical Yearbook for Asia and the Pacific 2012
viii
In 2011, 2.4 million infants and 3.0 million children under 5 died in the Asia-Pacific region —representing a 4% reduction from 2010 mortality rates.
During the period 1990-2011, the under-five mortality rate decreased by 50%, from 83 deaths per 1,000 live births in 1990 to 42 deaths per 1,000 live births in 2011. The infant mortality rate dropped from 61 deaths per 1,000 live births in 1990 to 33 deaths per 1,000 live births in 2011. As of 2011, Afghanistan still had the highest under-five mortality rate (101), followed by Pakistan (72), Tajikistan (63) and Myanmar (62).
In 2011, the lowest under-five mortality rate in the region was registered in both Japan and Singapore, each with 3 deaths per 1,000 live births.
The maternal mortality ratio in the Asia-Pacific region declined by more than 50% during the past two decades, from 379 deaths per 100,000 live births in 1990 to 146 deaths per 100,000 live births in 2010.
In 2012, regionally, and when compared to 1990 levels, the lives of over 200,000 women were saved. Nevertheless, over 100,000 maternal deaths in the region occurred in 2012, which accounted for 37% of the world’s total maternal deaths. The difference in the maternal mortality ratios between low-income and high-income countries was extreme: 260 maternal deaths per 100,000 live births in low-income countries; 8 maternal deaths per 100,000 live births in high-income countries. Maternal mortality is closely linked with antenatal care. In 2010, approximately 14 million women in the region did not have a single pregnancy-related antenatal care visit, and 22 million births were not attended by skilled health personnel (19 million of these births occurred in South and South-West Asia).
In 2010, in the Asia-Pacific region, 191,066 people living with HIV had access to antiretroviral therapy (ART), an increase from 2009…
In 2009, there were 14,400 additional deaths from AIDS than in 2005. However, given that between 2000 and 2005 there were 66,200 additional deaths from AIDS, this was “progress”.
Malaria affected 10.6 million people in the Asia-Pacific region in 2010...
In Asia and the Pacific, the number of reported cases of malaria declined during the period 2005-2010, down by 575 thousand annual reported cases. Despite this decline, 3,310 people in Asia and the Pacific died due to malaria in 2010. Papua New Guinea had the highest malaria incidence in 2010, with 18,287 cases per 100,000 population, followed by Solomon Islands (13,660), Timor-Leste (10,590) and Vanuatu (7,023).
Although the incidence rate of tuberculosis declined during the last two decades in the Asia-Pacific region, 5.9 million new cases were reported in 2010...
In Asia and the Pacific there were 142 new cases of tuberculosis diagnosed per 100,000 population in 2010, and a total of 8.7 million people were living with tuberculosis.
In the Asia-Pacific region smoking prevalence is higher among men than women…
In 2009, 42% of the men in Asia and the Pacific were smoking (compared to 37% of all men globally); 5% of the women in Asia and the Pacific were smoking (compared to 9% of all women globally).
In the last two decades, in the Asia-Pacific region, female participation in the labour force declined overall, but increased in the non-agricultural sectors...
Female participation in the Asian and Pacific labour force declined from 65 employed women per 100 employed men in 1991 to 62 employed women per 100 employed men in 2010. During the same period, female participation in the labour force increased in non-agricultural sectors, from 49 women per 100 employed men in 1991 to 54 women per 100 employed men in 2010.
In Asia and the Pacific, 45% of employed women were engaged in the agricultural sector in 2009, compared with 37% of men. The proportion of women employed in industry and services has remained relatively constant in the last 20 years, from 17% in 1991 to 19% in 2009 in industry, and from 22% in 1991 to 36% in 2009 in services.

Statistical Yearbook for Asia and the Pacific 2012
ix
Women’s access to land and property remains “very limited” in some countries in the Asia-Pacific region…
Women’s access to land was classified (by OECD) as “very limited” in seven countries in South and South-West Asia (Afghanistan, Bangladesh, India, the Islamic Republic of Iran, Nepal, Pakistan and Sri Lanka), two countries in South-East Asia (Lao People’s Democratic Republic and Timor-Leste), two countries in the Pacific (Fiji and Papua New Guinea) and one country in East and North-East Asia (Mongolia).
In almost all countries in the Asia-Pacific region, women remain underrepresented in national and local politics…
In terms of parliamentary representation, in 2011, women occupied slightly more than 30% of the seats in their national parliaments in only two countries in Asia and Pacific: Nepal (33%) and New Zealand (34%).
The number of people living in extreme poverty in the Asia-Pacific region declined from about 1.7 billion in 1990 to 0.8 billion in 2010…
Based on the available data, in 2010 the proportion of people living in extreme poverty (those living on less than PPP$1.25 per day) was highest in Bangladesh (43%), followed by India (33%). In 2010, 57% of the world population living in extreme poverty lived in Asia and the Pacific, down from 71% in 1990.
In 2010, in the Asia-Pacific region, 380 million people lacked access to improved water sources and 1.74 billion lacked access to improved sanitation…
Region-wide access to improved water sources increased from 73% of the total population in 1990 to 91% in 2010. In 2010, 97% of the urban population and 86% of the rural population had improved water sources. Access to improved sanitation increased from 36% to 58% of the total population during the same period. Rural access to improved sanitation grew from 22% to 46% between 1990 and 2010, while urban access grew from 65% to 75%.
Environment
The Asia-Pacific region accounted for 50% (up from 38% in 1990) of the world’s total CO2 emissions in 2009...
In 2006, the total CO2 emissions in Asia and the Pacific stood at 14.5 billion tons. The annual growth rate was, however, decreasing. In 2009, total CO2 emissions grew in the region by 2.6%, down from 4.1% in 2008.
In 2009, China was the single largest emitter of greenhouse gases worldwide, emitting 6.8 billion tons of CO2, which was 1.1 billion tons more CO2 than from all of North America. However, as of 2009, on a per capita basis, the North American rate of emissions was 3.3 times higher than that of China.
The subregion with the highest carbon intensity in 2009 was North and Central Asia, with 824 grams of CO2 emissions per 1 dollar of GDP (2005 PPP); South-East Asia was the subregion with the lowest carbon intensity, with 391 grams of CO2 per 1 dollar of GDP (2005 PPP).
In 2009, the Asia-Pacific region produced more energy than any other region in the world, accounting for 46% of total global production...
Within Asia and the Pacific, the subregion with highest energy production in 2009 was East and North-East Asia, with 2.3 billion tons of oil equivalent; the Pacific was the subregion with the lowest production of energy, with 326 million tons of oil equivalent.
In per capita terms, in 2009, the total primary energy supply (TPES) in Asia and the Pacific was 1,367 kgs of oil equivalent, which was 24% below the world’s average.
Between 2000 and 2009, electricity production in Asia and the Pacific grew by an average of 5.3% per year, and its share of world electricity production increased from 34% to 44%.
Statistical Yearbook for Asia and the Pacific 2012
x
East and North-East Asia produced 5,262 billion kWh of electricity in 2009, almost 60% of the Asia-Pacific total, with China and Japan collectively accounting for 4,744 billion kWh.
Between 2000 and 2009, the household electricity consumption grew on average 6.8% each year in South and South-West Asia, while it decreased 1.2% in North and Central Asia. However, in 2009, South and South-West Asia was still the subregion with the lowest household electricity consumption in the region, with 169 kWh per capita. The highest household electricity consumption was in Pacific subregion, with 2,752 kWh per capita, mainly due to the performance of Australia and New Zealand.
In 2009, the Asia-Pacific region accounted for 30% of the world’s primary forest and 54% of the world’s planted forest...
During the last decade, the total forest area in Asia and the Pacific increased by 89,291 square kilometres, but there were huge differences between subregions. South-East Asia lost about 332,000 square kilometres of forest, an area roughly equal to the size of Viet Nam. In contrast, East and North-East Asia increased its amount of forest area by 454,284 square kilometres, an area larger than Uzbekistan.
Natural disasters killed (on average) more than 70,000 people every year during the past decade in the Asia-Pacific region, and in 2011 the mortality from natural disasters was particularly high for East and North-East Asia...
In 2011, the Asian and Pacific region paid a huge human toll as a result of natural disasters. In East and North-East Asia almost 21 thousand people died due to natural disasters. In 2011, more than 170 million people in Asia and the Pacific were affected by natural disasters. South-East Asia was particularly hard hit by natural disasters. In 2011 alone, 14.3 million people in South-East Asia were impacted by natural disasters.
Of the world’s total, in 2011, Asia and the Pacific included 83% of those affected by natural disasters, 81% of deaths due to natural disasters, and 80% of economic damage from natural disasters.
In 2011, East and North-East Asia was the subregion with highest economic damages from natural disasters, with Japan accounting for 74% of the economic damages in the entire region.
Economy
Defying the ongoing world financial crisis, the Asia-Pacific region maintained positive GDP growth in 2010…
GDP growth in Asia and the Pacific was positive in 2010, at 6.6%. The low and lower-middle income countries showed average GDP growth rates of 6.1% and 9.4%, respectively. Growth in upper-middle and high income countries was 5.5% and 4.5%, respectively, almost similar to growth rates for the world.
The gross domestic investment rate in Asia and the Pacific increased in 2010 to 3.9%, up from its negative rate in 2009. In 2010, the regional average investment rate was 31% of GDP.
Monetary effects of the ongoing global financial crisis are also apparent in the Asia-Pacific region…
Inflation in Asia and the Pacific increased from 2.6% in 2009 to 3.8% in 2010. Japan was the only country in the region that experienced deflation in 2010. In 2011, the central bank discount rate was lowered in 5 of the 26 Asia-Pacific countries for which data were available — 12 were heightened and 9 stayed constant. In Asia and the Pacific, 13 currencies depreciated vis-à-vis the United States dollar, 26 currencies appreciated and 24 currencies appreciated by 2.0% or more.
In 2010, compared to other regions, the Asia-Pacific region had the lowest unemployment rate at 4.6%...
Unemployment rates in all other regions of the world (Africa, 8.1%; Europe, 9.7%; Latin America and Caribbean, 7.2%; North America, 9.5%) were higher than that in Asia and the Pacific in 2010. Of those employed in Asia and the Pacific, 39% were in the agricultural sector, 37% in services and 24% in industry.

Statistical Yearbook for Asia and the Pacific 2012
xi
Employment is higher for men than women...
Male employment-to-population ratio in the region was 76, while the female ratio was 48. Notably, 6 of the 10 countries in South and South-West Asia had a male employment-to-population ratio of more than double the female ratio.
In 2011, with 36% of total merchandise exports, the Asia-Pacific region surpassed Europe to become the top exporter of merchandise…
In 2011, the share of total world merchandise exports in Asia and the Pacific (36.3%) was higher than that in Europe (36.1%). The total share of world merchandise imports in the region, in 2011, was 34.7%, well below Europe’s share of 36.1%.
In the past decade, the share of export and imports of merchandise from the Asia-Pacific region has shown the largest gains, increasing from 28.4% and 25.1% in 2002 to 36.3% and 34.7% in 2011. In contrast, the shares of Europe and North America in world merchandise exports for the period 2002-2011 dropped from 43.6% to 36.1% and 14.6% to 10.6%, while the share of imports declined from 41.1% to 36.1% and 21.2% to 14.9% respectively.
Trade dependence in the Asia-Pacific region has more than doubled since 1990...
As measured by the ratio of merchandise exports to GDP, the regional dependence on trade increased from 11% in 1990 to 31% in 2011.
In 2011, China was the top exporter and importer of services in the Asia-Pacific region...
Between 2000 and 2011, Japan’s share of export of services fell from 22% to 12.5%, and import of services fell from 29% to 14%. China’s share of export of services increased from 10% to 16%, and its share of import of services doubled from 10% to 20%, making it the country with the highest exporter and importer of services in the Asia and the Pacific, followed by India, whose share of export and import of services more than doubled, from 5% to 13% and 5% to 11% respectively.
In 2010, foreign direct investment (FDI) inflow to the Asia-Pacific region increased by 23%...
FDI increased from US$351 billion in 2009 to US$431 billion in 2010. FDI as a proportion of GDP increased in three subregions: East and North-East Asia, 1.6%; South-East Asia, 5.0%; and the Pacific, 2.6%.
In 2010, the major sources of FDI outflow in the region were China, Japan, the Russian Federation, and Hong Kong, China. Collectively, in 2010, they provided almost one fifth of the world total FDI outflow.
Overseas worker’s remittances contribute substantially to many countries in the Asia-Pacific region…
In 2010, remittances from overseas workers in Asia and the Pacific increased by 12%, from US$125 billion in 2009 to US$140 billion in 2010. Remittances were most significant, as a proportion of GDP, for Tajikistan (at 40%), Kyrgyzstan (27%), Nepal (21%), Samoa (20%), Bangladesh (11%) and the Philippines (8%).
Connectivity
The Asia-Pacific region accounted for more than 50% of the world’s mobile-cellular population in 2008, and the number of subscribers continues to grow…
The total number of mobile-cellular subscribers in Asia and the Pacific grew from 52% in 2008 to 57% in 2011, and the rate of growth shows no sign of abating.
With over 1.1 billion users in 2011, the number of Internet users in the Asia-Pacific region represents about half (49.7%) of the world's total Internet user population (2.3 billion)…
During the period 2005-2010, the average annual growth rate in the Internet user population in the region was 20% — higher than the world average of 13%. However, the percentage of Internet users (per 100 people) in the region stood at 27% in 2011 — well below the world average of 33%.

Statistical Yearbook for Asia and the Pacific 2012
xii
In 2011, over 30 million fixed (wired) broadband subscribers were added in China alone, which accounted for 50% of the increase in the total number of subscribers worldwide (60 million)…
Despite the large increase in the number of fixed (wired) broadband subscribers in China, the Asia-Pacific region, with 6.7 broadband users per 100 people, remains well below the level of use in North America (29.1) and Europe (25.1).
In 2010, 20 of the world’s top container ports (in terms of throughput) were in the Asia-Pacific region, including the top five...
The top five container ports in Asia and the Pacific were located in China; Japan; Republic of Korea; Singapore; and Hong Kong, China.
During the period 1995-2009, the overall demand for Asian and Pacific rail passenger transport services grew by 76%; freight transport grew by 89% to 2010...
In 1995 there were 1.2 trillion passenger-kilometres and 2.9 trillion ton-kilometres of freight transported by railways in Asia and the Pacific. In 2009 there were 2.2 trillion passenger-kilometres, and in 2010 there were 5.5 trillion ton-kilometres of freight.
The railways of China, India and Japan registered the highest number of passenger-kilometres in 2009. In 2010, China, India and the Russian Federation recorded the most freight (in tons-kilometres).
Half of the substandard roadways in the Asian Highway network were upgraded to the minimum standard between 2004 and 2010...
Approximately 17,000 kilometres of Asian Highway substandard roads were upgraded to the minimum standard (double bituminous-treated roads with two lanes) between 2004 and 2010, leaving only 8.0% of network roadways below the minimum standard.
In 2010, inbound tourist arrivals in the Asia-Pacific region totalled nearly 250 million (27% of the world’s total number of tourist arrivals)...
The number of inbound tourist arrivals in the region totalled nearly 250 million in 2010, up 11% from 2009. With the exception of the Pacific, all of the subregions recorded double-digit percentage increases in inbound tourist arrivals. In the region, expenditures by inbound tourists rose to US$350 billion in 2011, up from US$310 billion the previous year. China, Malaysia and Turkey saw the most inbound tourism arrivals.
The Asia-Pacific region accounted for over 25% of the world’s total CO2 emissions from transport in 2009…
In 2009, the transport industry in Asia and the Pacific emitted 1,752 million tons of CO2 (total world CO2 emissions in 2009 was 6,544 million tons). Of those emissions, the road sector was responsible for 84% of the emissions, 12.6% came from aviation and 2.9% from rail.

Statistical Yearbook for Asia and the Pacific 2012
xiii
Table of contents
Preface............................................................................................................................................................... iii
Production team ............................................................................................................................................... v
Acknowledgements ......................................................................................................................................... vi
Asia-Pacific development 2012: Did you know? .......................................................................................... vii Country profiles Afghanistan ............................................................................................................................................ 1 American Samoa ................................................................................................................................... 3 Armenia .................................................................................................................................................. 5 Australia .................................................................................................................................................. 7 Azerbaijan............................................................................................................................................... 9 Bangladesh ........................................................................................................................................... 11 Bhutan................................................................................................................................................... 13 Brunei Darussalam.............................................................................................................................. 15 Cambodia ............................................................................................................................................. 17 China ..................................................................................................................................................... 19 Hong Kong, China.............................................................................................................................. 21 Macao, China ....................................................................................................................................... 23 Cook Islands ........................................................................................................................................ 25 Democratic Republic of Korea......................................................................................................... 27 Fiji .......................................................................................................................................................... 29 French Polynesia ................................................................................................................................. 31 Georgia ................................................................................................................................................. 33 Guam .................................................................................................................................................... 35 India ...................................................................................................................................................... 37 Indonesia .............................................................................................................................................. 39 Iran, Islamic Republic of.................................................................................................................... 41 Japan...................................................................................................................................................... 43 Kazakhstan........................................................................................................................................... 45 Kiribati .................................................................................................................................................. 47 Kyrgyzstan............................................................................................................................................ 49 Lao People’s Democratic Republic .................................................................................................. 51 Malaysia................................................................................................................................................. 53 Maldives................................................................................................................................................ 55 Marshall Islands................................................................................................................................... 57 Micronesia, Federated States of ....................................................................................................... 59 Mongolia............................................................................................................................................... 61 Myanmar............................................................................................................................................... 63 Nauru .................................................................................................................................................... 65 Nepal ..................................................................................................................................................... 67 New Caledonia .................................................................................................................................... 69 New Zealand........................................................................................................................................ 71 Niue....................................................................................................................................................... 73 Northern Mariana Islands.................................................................................................................. 75 Pakistan................................................................................................................................................. 77 Palau ...................................................................................................................................................... 79 Papua New Guinea ............................................................................................................................. 81

Statistical Yearbook for Asia and the Pacific 2012
xiv
Philippines ............................................................................................................................................ 83 Republic of Korea............................................................................................................................... 85 Russian Federation.............................................................................................................................. 87 Samoa.................................................................................................................................................... 89 Singapore .............................................................................................................................................. 91 Solomon Islands.................................................................................................................................. 93 Sri Lanka............................................................................................................................................... 95 Tajikistan .............................................................................................................................................. 97 Thailand ................................................................................................................................................ 99 Timor-Leste .......................................................................................................................................101 Tonga ..................................................................................................................................................103 Turkey .................................................................................................................................................105 Turkmenistan.....................................................................................................................................107 Tuvalu .................................................................................................................................................109 Uzbekistan..........................................................................................................................................111 Vanuatu...............................................................................................................................................113 Viet Nam ............................................................................................................................................115 Regional and subregional comparative tables Asia-Pacific and other regions of the World ................................................................................119 Asia-Pacific: Country income level groups ...................................................................................122 Asia-Pacific: Selected groups - ASEAN, SAARC, ECO, Central Asia ....................................125 Technical notes .............................................................................................................................................128 Statistical methods........................................................................................................................................145

Statistical Yearbook for Asia and the Pacific 2012 − ESCAP Statistics Division Page 1
Unless otherwise specified, the charts below use the following color legend: world aggregate; Asia−Pacific aggregate; Afghanistan
Afghanistan
Demographics trends
Health Education
Poverty & inequalities
Population total (millions), 2011 32.4
Population growth (annual average, %), 2005−10 2.6
Urban population (% of total), 2011 22.9
Population density (population per km²), 2011 49.7
Foreign population (% of total), 2010 0.3
Net migration rate, 2005−10 −2.6(migrants per 1 000 pop.)
Fertility rate (live births per woman), 2011 6.2
Adolescent fertility rate, 2005−10 118.7 (live births per 1 000 women aged 15−19 yrs)
Life expectancy (years), 2005−10 47.3 Male 48.5 Female 48.8
1990 2000 2010
0
2
4
6
8
10
12Annual population growth rate, 1990−2011
% p
er a
nnum
Population age structure, 1990 and 2011
% of total population
Female
20 15 10 5 020 15 10 5 0
Male
19902011
0 5 10 15 20
0−45−9
10−1415−1920−2425−2930−3435−3940−4445−4950−5455−5960−6465−6970−7475−7980+ yrs
Mortality rate (death per 1 000 live births) Infant, 2011 72.7 Under−five, 2011 101.1
Children under−five underweight (%), 2004 32.9
Maternal mortality ratio, 2010 460.0 (deaths per 100 000 live births)
Antenatal care, at least 1 visit, 2010 63.4 (% of women with live birth)
Population living with HIV, − Total adults, − Female adults, −
HIV prevalence rate, − (% of population aged 15−49)
Births attended by skilled health
personnel
No data available
050
010
0015
0020
00
1990 2010
deat
hs p
er 1
00 0
00 li
ve b
irth
s
Maternal mortality1990−2010
Years of life lost (YLL), (% of YLL), 2008 Communicable diseases 18.0 Non−communicable diseases 74.0 Injuries 9.0
Government health expenditure, 2010 1.6 (% of government expenditure)
Number of physicians (*), 2009 2.1Number of hospital beds (*), 2010 4.0 (*) per 10 000 population
1995 2000 2005 2010
0
5
10
15Total health expenditure, 1995−2010
% o
f GD
P
Net enrolment in primary education (*), 1993 25.7Net enrolment in secondary education (*), 2007 24.1Gross enrolment in tertiary education (*), 2009 3.3
(*) % of respective school aged population
Adult literacy rate (*), − Male (*), − Female (*), − (*) % of population aged 15 yrs and above
0.0
0.6
1.2
1993 1993Primary
Rat
io
1993 2007Secondary
1990 2009Tertiary
Gender disparity in education Ratio of female to male enrolment rates
Public expenditure on education as % of GDP, − as % of total government expenditure, −
Gross domestic expenditure
on research and development(% of GDP), −
1990 1995 2000 2005 2010
20
30
40
50
60
Pupils to teacher ratio, 1990−2010
Pup
ils p
er te
ache
r
in primary education
1990 1995 2000 2005 2010
15
20
25
30
35
40
Pup
ils p
er te
ache
r
in secondary education
Population living in poverty
below $1.25 2005 PPP a day, (% of pop.), −
below national poverty line (% of pop.), 2008 36.0
Gini index(income equality coefficient), 2008 27.8
Population lacking access to
improved water sources (% of pop.) , 2010 50.0
Rural 58.0
Urban 22.0
improved sanitation (% of pop.) , 2010 63.0
Rural 70.0
Urban 40.0 1995 2000 2005 20100.0
5.0
10.0
15.0
20.0
Mill
ion
peop
le
People lacking access to improved water sources and
improved sanitation, 1990−2010
Water Sanitation

Statistical Yearbook for Asia and the Pacific 2012 − ESCAP Statistics DivisionPage 2
Air pollution andclimate change
Water
Energy
Biodiversity
Natural disasters
Economic growth
Fiscal balance
Monetary measures
Labour
International relations
Connectivity
Carbon dioxide emissions, 2009Total (millions tons of ) −CO2
Grams per 1 000 GDP 2005 PPP dollars −
Consumption of ozone depletingsubstance (grams per capita), 2009 1.6
emissions per capita, 1990−2011CO2
No data available
Renewable water available (m³ per capita per annum), 2010 2 069
Domestic water withdrawal (m³ per capita per annum), 2007 7.0
Agriculture − 98.8 %Domestic use − 0.7 %Industry − 0.6 %
Water withdrawal by sector, 2000
Total primary energy supply (kg of oil equivalent)
Per capita, −
Per 1 000 GDP 2005 PPP dollar, −
0
10
20
30
40
1990 − 2009Industry
% o
f tot
al fi
nal c
onsu
mpt
ion
1990 − 2009Transport
1990 − 2009Residential
Energy consumption by sector, 1990−2009
Areas protected Marine (% of territorial water) 0.0 Terrestrial (% of surface area) 0.4
Forest area(% of land area), 2010 2.1
1990 2000 2010
0
5
10
15
20
25
30
35Forest area, 1990−2011
% o
f lan
d ar
ea
Deaths(number per annum), 2011 83
People affected (1 000 per annum), 2011 1 753
Economic damages (% of GDP), 2010 0.0
GDP at current prices (billion US $), 2010 15.7 Growth rate (annual average, %), 2005−10 7.5 Per capita (2005 PPP $), 2010 1 185
Gross domestic investment rate (% of GDP), 2010 26.5
1990 1995 2000 2005 2010
0
960
1920
2880
3840
4800
5760
6720
7680
8640
9600
Mill
ion
2005
US
dol
lars
Value added by sectorAgriculture Industry Services
Government revenue (% of GDP), 2009 8.7
Government expenditure (% of GDP), 2009 21.8
Inflation rate(% per annum), −Exchange rateagainst US dollar, 2011 0.6(% change per annum)
Employment−to−population ratio, 2011 Population aged 15 and above 45.1 Females aged 15 and above 13.8 Males aged 15 and above 74.1
Unemployment rate (% of labour force), 2005 8.5 Females 9.5 Males 7.6
Youth unemployment rate % of labour force aged 15−24, −
Employment by sector, 1990−2010
No data available
Exports of merchandise(% of GDP), 2010 2.5Imports of merchandise(% of GDP), 2010 32.9
Exports of services(% of GDP), 1989 0.0Imports of services(% of GDP), 1989 2.9
FDI inflows(% of GDP), 2010 1.3FDI outflows(% of GDP), −
ODA received(% of GDP), 2010 40.7
Workers remittances received(% of GDP), −
Net external debt (% of GDP), 2010 14.7
1990 2000 2010
0
20
40
60
80
100
120
Intraregional imports and exports shares, 1990−2011
Exports Imports
Per
cent
age
Fixed telephone mainlines (*), 2011 0.0
Mobile cellular subscriptions (*), 2011 54.3
Internet users (*), 2011 5.0
Fixed broadband internet subscribers (*), 2010 0.0(*) per 100 population
2000 2005 2010
0
5
10
15
20
25
30
35Internet users, 2000−2011
Per
100
pop
ulat
ion
2000 2005 2010
0
2
4
6
8
10
Fixed broadband internet subscribers, 2000−2011
Per
100
pop
ulat
ion
Railway density (*), −
Road density (*), 2010 64.6 (*) Km of railway/road per 1 000 km² land area
Paved roads(% of roads), 2010 29.3
Passenger cars(per 1 000 population), 2010 21.0
Road traffic deaths (per 100 000 population), 2007 36.3
Transport sector emissions per capita, 1990−2009
CO2
No data available
Inbound tourism expenditure (% of GDP), −
Outbound tourism expenditure (% of GDP), −
The present country profile for Afghanistan is part of a series of
country profiles for each of the 58 ESCAP regional members
and published as part of the Statistical Yearbook for Asia and
the Pacific 2012.
Further information regarding data series used in this country
profile, including indicator definitions and data sources, are
available from the Statistical Yearbook website at
http://www.unescap.org/stat/data/syb2012.
For most indicators, times series data from 1990 to the latest
year with data available can also be accessed and downloaded
from the online database available from the website.
ESCAP Statistics Division
October 2012

Statistical Yearbook for Asia and the Pacific 2012 − ESCAP Statistics Division Page 2
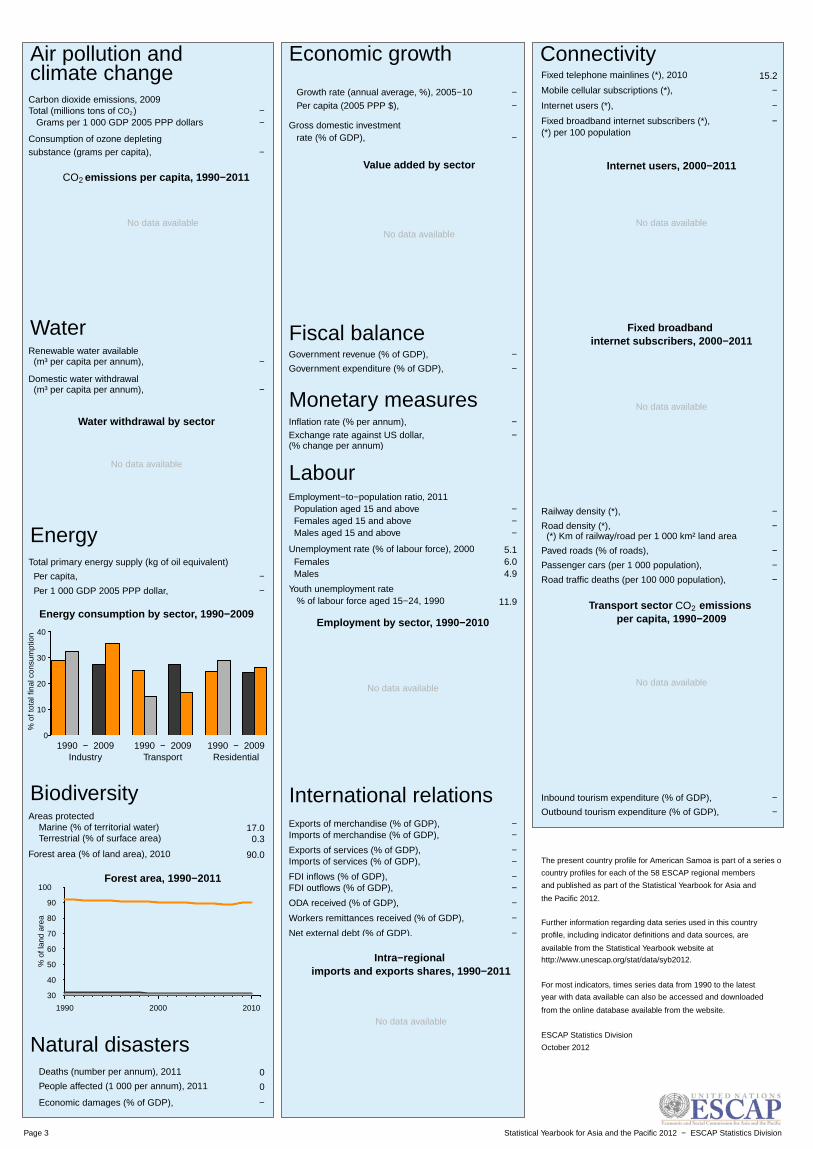
Unless otherwise specified, the charts below use the following color legend: world aggregate; Asia−Pacific aggregate; American Samoa
American Samoa
Demographics trends
Health Education
Poverty & inequalities
Population total (thousands), 2011 69.5
Population growth (annual average, %), 2005−10 1.7
Urban population (% of total), 2010 93.0
Population density (population per km²), 2011 348.0
Foreign population (% of total), 2010 41.5
Net migration rate, 2005−10 −(migrants per 1 000 pop.)
Fertility rate (live births per woman), −
Adolescent fertility rate, 2005−10 − (live births per 1 000 women aged 15−19 yrs)
Life expectancy (years), 2005−10 − Male − Female −
1990 2000 2010
0
1
2
3
4Annual population growth rate, 1990−2011
% p
er a
nnum
Population age structure, 1990 and 2011
No data available
Mortality rate (death per 1 000 live births) Infant, − Under−five, −
Children under−five underweight (%), −
Maternal mortality ratio, − (deaths per 100 000 live births)
Antenatal care, at least 1 visit, − (% of women with live birth)
Population living with HIV, − Total adults, − Female adults, −
HIV prevalence rate, − (% of population aged 15−49)
Births attended by skilled health
personnel
No data available
Maternal mortality
No data available
Years of life lost (YLL), (% of YLL), 2008 Communicable diseases − Non−communicable diseases − Injuries −
Government health expenditure, − (% of government expenditure)
Number of physicians (*), −Number of hospital beds (*), − (*) per 10 000 population
Total health expenditure, 1995−2010
No data available
Net enrolment in primary education (*), −Net enrolment in secondary education (*), −Gross enrolment in tertiary education (*), −
(*) % of respective school aged population
Adult literacy rate (*), − Male (*), − Female (*), − (*) % of population aged 15 yrs and above
No data available
Primary Secondary Tertiary
Gender disparity in education Ratio of female to male enrolment rates
Public expenditure on education as % of GDP, − as % of total government expenditure, −
Gross domestic expenditure
on research and development(% of GDP), −
Pupils to teacher ratio, 1990−2010in primary education
No data available
in secondary education
No data available
Population living in poverty
below $1.25 2005 PPP a day, (% of pop.), −
below national poverty line (% of pop.), −
Gini index(income equality coefficient), −
Population lacking access to
improved water sources (% of pop.) ,
Rural
Urban improved sanitation (% of pop.) ,
Rural
Urban
People lacking access to improved water sources and
improved sanitation, 1990−2010
No data available
Statistical Yearbook for Asia and the Pacific 2012 − ESCAP Statistics DivisionPage 3
Air pollution andclimate change
Water
Energy
Biodiversity
Natural disasters
Economic growth
Fiscal balance
Monetary measures
Labour
International relations
Connectivity
Carbon dioxide emissions, 2009Total (millions tons of ) −CO2
Grams per 1 000 GDP 2005 PPP dollars −
Consumption of ozone depletingsubstance (grams per capita), −
emissions per capita, 1990−2011CO2
No data available
Renewable water available (m³ per capita per annum), −
Domestic water withdrawal (m³ per capita per annum), −
Water withdrawal by sector
No data available
Total primary energy supply (kg of oil equivalent)
Per capita, −
Per 1 000 GDP 2005 PPP dollar, −
0
10
20
30
40
1990 − 2009Industry
% o
f tot
al fi
nal c
onsu
mpt
ion
1990 − 2009Transport
1990 − 2009Residential
Energy consumption by sector, 1990−2009
Areas protected Marine (% of territorial water) 17.0 Terrestrial (% of surface area) 0.3
Forest area(% of land area), 2010 90.0
1990 2000 2010
30
40
50
60
70
80
90
100Forest area, 1990−2011
% o
f lan
d ar
ea
Deaths(number per annum), 2011 0
People affected (1 000 per annum), 2011 0
Economic damages (% of GDP), −
Growth rate (annual average, %), 2005−10 −
Per capita (2005 PPP $), −
Gross domestic investment rate (% of GDP), −
Value added by sector
No data available
Government revenue (% of GDP), −
Government expenditure (% of GDP), −
Inflation rate(% per annum), −Exchange rateagainst US dollar, −(% change per annum)
Employment−to−population ratio, 2011 Population aged 15 and above − Females aged 15 and above − Males aged 15 and above −
Unemployment rate (% of labour force), 2000 5.1 Females 6.0 Males 4.9
Youth unemployment rate % of labour force aged 15−24, 1990 11.9
Employment by sector, 1990−2010
No data available
Exports of merchandise(% of GDP), −Imports of merchandise(% of GDP), −
Exports of services(% of GDP), −Imports of services(% of GDP), −
FDI inflows(% of GDP), −FDI outflows(% of GDP), −
ODA received(% of GDP), −
Workers remittances received(% of GDP), −
Net external debt (% of GDP), −
Intra−regional imports and exports shares, 1990−2011
No data available
Fixed telephone mainlines (*), 2010 15.2
Mobile cellular subscriptions (*), −
Internet users (*), −
Fixed broadband internet subscribers (*), −(*) per 100 population
Internet users, 2000−2011
No data available
Fixed broadband internet subscribers, 2000−2011
No data available
Railway density (*), −
Road density (*), − (*) Km of railway/road per 1 000 km² land area
Paved roads(% of roads), −
Passenger cars(per 1 000 population), −
Road traffic deaths (per 100 000 population), −
Transport sector emissions per capita, 1990−2009
CO2
No data available
Inbound tourism expenditure (% of GDP), −
Outbound tourism expenditure (% of GDP), −
The present country profile for American Samoa is part of a series of
country profiles for each of the 58 ESCAP regional members
and published as part of the Statistical Yearbook for Asia and
the Pacific 2012.
Further information regarding data series used in this country
profile, including indicator definitions and data sources, are
available from the Statistical Yearbook website at
http://www.unescap.org/stat/data/syb2012.
For most indicators, times series data from 1990 to the latest
year with data available can also be accessed and downloaded
from the online database available from the website.
ESCAP Statistics Division
October 2012
Statistical Yearbook for Asia and the Pacific 2012 − ESCAP Statistics Division Page 3
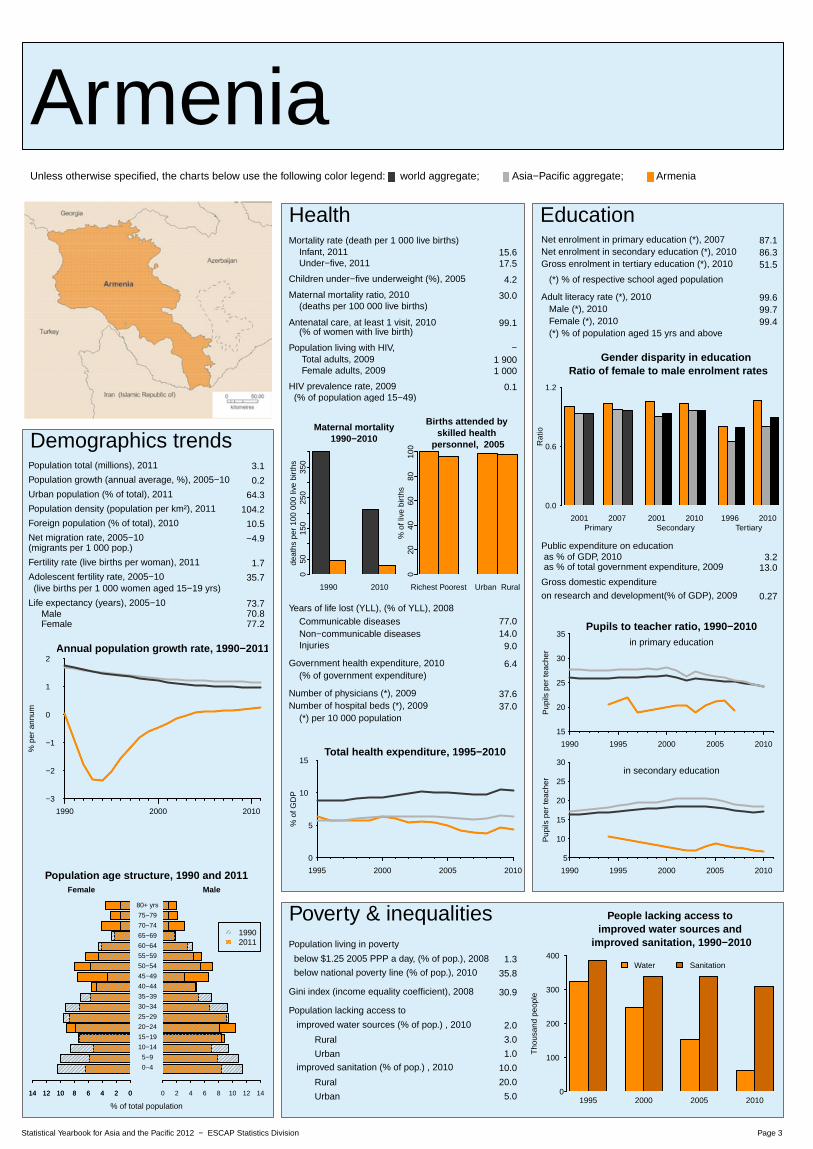
Unless otherwise specified, the charts below use the following color legend: world aggregate; Asia−Pacific aggregate; Armenia
Armenia
Demographics trends
Health Education
Poverty & inequalities
Population total (millions), 2011 3.1
Population growth (annual average, %), 2005−10 0.2
Urban population (% of total), 2011 64.3
Population density (population per km²), 2011 104.2
Foreign population (% of total), 2010 10.5
Net migration rate, 2005−10 −4.9(migrants per 1 000 pop.)
Fertility rate (live births per woman), 2011 1.7
Adolescent fertility rate, 2005−10 35.7 (live births per 1 000 women aged 15−19 yrs)
Life expectancy (years), 2005−10 73.7 Male 70.8 Female 77.2
1990 2000 2010
−3
−2
−1
0
1
2Annual population growth rate, 1990−2011
% p
er a
nnum
Population age structure, 1990 and 2011
% of total population
Female
14 12 10 8 6 4 2 014 12 10 8 6 4 2 0
Male
19902011
0 2 4 6 8 10 12 14
0−4
5−9
10−14
15−19
20−24
25−29
30−34
35−39
40−44
45−49
50−54
55−59
60−64
65−69
70−74
75−79
80+ yrs
Mortality rate (death per 1 000 live births) Infant, 2011 15.6 Under−five, 2011 17.5
Children under−five underweight (%), 2005 4.2
Maternal mortality ratio, 2010 30.0 (deaths per 100 000 live births)
Antenatal care, at least 1 visit, 2010 99.1 (% of women with live birth)
Population living with HIV, − Total adults, 2009 1 900 Female adults, 2009 1 000
HIV prevalence rate, 2009 0.1 (% of population aged 15−49)
020
4060
8010
0
Richest Poorest Urban Rural
% o
f liv
e bi
rths
Births attended by skilled health
personnel, 2005
050
150
250
350
1990 2010
deat
hs p
er 1
00 0
00 li
ve b
irth
s
Maternal mortality1990−2010
Years of life lost (YLL), (% of YLL), 2008 Communicable diseases 77.0 Non−communicable diseases 14.0 Injuries 9.0
Government health expenditure, 2010 6.4 (% of government expenditure)
Number of physicians (*), 2009 37.6Number of hospital beds (*), 2009 37.0 (*) per 10 000 population
1995 2000 2005 2010
0
5
10
15Total health expenditure, 1995−2010
% o
f GD
P
Net enrolment in primary education (*), 2007 87.1Net enrolment in secondary education (*), 2010 86.3Gross enrolment in tertiary education (*), 2010 51.5
(*) % of respective school aged population
Adult literacy rate (*), 2010 99.6 Male (*), 2010 99.7 Female (*), 2010 99.4 (*) % of population aged 15 yrs and above
0.0
0.6
1.2
2001 2007Primary
Rat
io
2001 2010Secondary
1996 2010Tertiary
Gender disparity in education Ratio of female to male enrolment rates
Public expenditure on education as % of GDP, 2010 3.2 as % of total government expenditure, 2009 13.0
Gross domestic expenditure
on research and development(% of GDP), 2009 0.27
1990 1995 2000 2005 2010
15
20
25
30
35Pupils to teacher ratio, 1990−2010
Pup
ils p
er te
ache
r
in primary education
1990 1995 2000 2005 2010
5
10
15
20
25
30
Pup
ils p
er te
ache
r
in secondary education
Population living in poverty
below $1.25 2005 PPP a day, (% of pop.), 2008 1.3 below national poverty line (% of pop.), 2010 35.8
Gini index(income equality coefficient), 2008 30.9
Population lacking access to
improved water sources (% of pop.) , 2010 2.0
Rural 3.0
Urban 1.0
improved sanitation (% of pop.) , 2010 10.0
Rural 20.0
Urban 5.0 1995 2000 2005 20100
100
200
300
400
Tho
usan
d pe
ople
People lacking access to improved water sources and
improved sanitation, 1990−2010
Water Sanitation

Statistical Yearbook for Asia and the Pacific 2012 − ESCAP Statistics DivisionPage 4
Air pollution andclimate change
Water
Energy
Biodiversity
Natural disasters
Economic growth
Fiscal balance
Monetary measures
Labour
International relations
Connectivity
Carbon dioxide emissions, 2009Total (millions tons of ) 4CO2
Grams per 1 000 GDP 2005 PPP dollars 287.0
Consumption of ozone depletingsubstance (grams per capita), 2009 8.1
1990 2000 2010
0
2
4
6
8 emissions per capita, 1990−2011CO2
Tons
per
cap
ita
Renewable water available (m³ per capita per annum), 2010 2 513
Domestic water withdrawal (m³ per capita per annum), 2007 274.2
Agriculture − 65.8 %
Domestic use − 29.8 %
Industry − 4.4 %
Water withdrawal by sector, 2006
Total primary energy supply (kg of oil equivalent)
Per capita, 2009 843
Per 1 000 GDP 2005 PPP dollar, 2009 175
0
10
20
30
40
1990 − 2009Industry
% o
f tot
al fi
nal c
onsu
mpt
ion
1990 − 2009Transport
1990 − 2009Residential
Energy consumption by sector, 1990−2009
Areas protected Marine (% of territorial water) 0.0 Terrestrial (% of surface area) 8.0
Forest area(% of land area), 2010 9.2
1990 2000 2010
5
10
15
20
25
30
35Forest area, 1990−2011
% o
f lan
d ar
ea
Deaths(number per annum), 2011 0
People affected (1 000 per annum), 2011 0
Economic damages (% of GDP), 2011 0.0
GDP at current prices (billion US $), 2010 9.4 Growth rate (annual average, %), 2005−10 3.8 Per capita (2005 PPP $), 2010 4 900
Gross domestic investment rate (% of GDP), 2010 33.4
1990 1995 2000 2005 2010
0
680
1360
2040
2720
3400
4080
4760
5440
6120
6800
Mill
ion
2005
US
dol
lars
Value added by sectorAgriculture Industry Services
Government revenue (% of GDP), 2010 21.4Government expenditure (% of GDP), 2010 24.5
Inflation rate(% per annum), 2011 7.7Exchange rateagainst US dollar, 2011 −0.3(% change per annum)
Employment−to−population ratio, 2011 Population aged 15 and above 40.9 Females aged 15 and above 31.8 Males aged 15 and above 52.1
Unemployment rate (% of labour force), 2008 28.6 Females 35.0 Males 21.9
Youth unemployment rate % of labour force aged 15−24, 2008 45.5
1990 2000 2010
0
200
400
600
800Agriculture Industry Services
Tho
usan
d pe
ople
Employment by sector, 1990−2010
Exports of merchandise(% of GDP), 2011 13.6Imports of merchandise(% of GDP), 2011 42.4
Exports of services(% of GDP), 2011 8.4Imports of services(% of GDP), 2011 11.4
FDI inflows(% of GDP), 2011 5.4FDI outflows(% of GDP), 2011 0.8
ODA received(% of GDP), 2010 3.6
Workers remittances received(% of GDP), 2010 0.8
Net external debt (% of GDP), 2010 65.1
1990 2000 2010
0
20
40
60
80
Intraregional imports and exports shares, 1990−2011
Exports Imports
Per
cent
age
Fixed telephone mainlines (*), 2011 18.6
Mobile cellular subscriptions (*), 2011 103.6
Internet users (*), 2009 15.3
Fixed broadband internet subscribers (*), 2011 5.0(*) per 100 population
2000 2005 2010
0
5
10
15
20
25
30
35Internet users, 2000−2011
Per
100
pop
ulat
ion
2000 2005 2010
0
2
4
6
8
10
Fixed broadband internet subscribers, 2000−2011
Per
100
pop
ulat
ion
Railway density (*), 2010 29.0
Road density (*), 2010 270.5 (*) Km of railway/road per 1 000 km² land area
Paved roads(% of roads), 2010 90.5
Passenger cars(per 1 000 population), 2010 94.0
Road traffic deaths (per 100 000 population), 2007 13.6
1990 2000 2010
0.0
0.2
0.4
0.6
0.8
1.0
Transport sector emissions per capita, 1990−2009
CO2
Tons
per
cap
ita
Inbound tourism expenditure (% of GDP), 2011 4.9
Outbound tourism expenditure (% of GDP), 2011 5.6
The present country profile for Armenia is part of a series of
country profiles for each of the 58 ESCAP regional members
and published as part of the Statistical Yearbook for Asia and
the Pacific 2012.
Further information regarding data series used in this country
profile, including indicator definitions and data sources, are
available from the Statistical Yearbook website at
http://www.unescap.org/stat/data/syb2012.
For most indicators, times series data from 1990 to the latest
year with data available can also be accessed and downloaded
from the online database available from the website.
ESCAP Statistics Division
October 2012

Statistical Yearbook for Asia and the Pacific 2012 − ESCAP Statistics Division Page 4
Unless otherwise specified, the charts below use the following color legend: world aggregate; Asia−Pacific aggregate; Australia
Australia
Demographics trends
Health Education
Poverty & inequalities
Population total (millions), 2011 22.6
Population growth (annual average, %), 2005−10 1.7
Urban population (% of total), 2011 89.3
Population density (population per km²), 2011 2.9
Foreign population (% of total), 2010 21.2
Net migration rate, 2005−10 10.5(migrants per 1 000 pop.)
Fertility rate (live births per woman), 2011 2.0
Adolescent fertility rate, 2005−10 16.5 (live births per 1 000 women aged 15−19 yrs)
Life expectancy (years), 2005−10 81.4 Male 79.7 Female 84.1
1990 2000 2010
0.0
0.5
1.0
1.5
2.0Annual population growth rate, 1990−2011
% p
er a
nnum
Population age structure, 1990 and 2011
% of total population
Female
14 12 10 8 6 4 2 014 12 10 8 6 4 2 0
Male
19902011
0 2 4 6 8 10 12 14
0−4
5−9
10−14
15−19
20−24
25−29
30−34
35−39
40−44
45−49
50−54
55−59
60−64
65−69
70−74
75−79
80+ yrs
Mortality rate (death per 1 000 live births) Infant, 2011 4.1 Under−five, 2011 4.5
Children under−five underweight (%), −
Maternal mortality ratio, 2010 7.0 (deaths per 100 000 live births)
Antenatal care, at least 1 visit, 2008 98.3 (% of women with live birth)
Population living with HIV, − Total adults, 2009 20 000 Female adults, 2009 6 200
HIV prevalence rate, 2009 0.1 (% of population aged 15−49)
Births attended by skilled health
personnel
No data available
050
150
250
350
1990 2010
deat
hs p
er 1
00 0
00 li
ve b
irth
s
Maternal mortality1990−2010
Years of life lost (YLL), (% of YLL), 2008 Communicable diseases 79.0 Non−communicable diseases 6.0 Injuries 15.0
Government health expenditure, 2010 16.8 (% of government expenditure)
Number of physicians (*), 2009 29.9Number of hospital beds (*), 2009 38.0 (*) per 10 000 population
1995 2000 2005 2010
0
5
10
15Total health expenditure, 1995−2010
% o
f GD
P
Net enrolment in primary education (*), 2010 97.1Net enrolment in secondary education (*), 2010 85.5Gross enrolment in tertiary education (*), 2010 79.9
(*) % of respective school aged population
Adult literacy rate (*), − Male (*), − Female (*), − (*) % of population aged 15 yrs and above
0.0
0.6
1.2
1990 2010Primary
Rat
io
1993 2010Secondary
1990 2010Tertiary
Gender disparity in education Ratio of female to male enrolment rates
Public expenditure on education as % of GDP, 2009 5.1 as % of total government expenditure, 2008 12.9
Gross domestic expenditure
on research and development(% of GDP), 2008 2.37
1990 1995 2000 2005 2010
15
20
25
30
35Pupils to teacher ratio, 1990−2010
Pup
ils p
er te
ache
r
in primary education
in secondary education
No data available
Population living in poverty
below $1.25 2005 PPP a day, (% of pop.), −
below national poverty line (% of pop.), −
Gini index(income equality coefficient), 1994 35.2
Population lacking access to
improved water sources (% of pop.) , 2010 0.0
Rural 0.0
Urban 0.0
improved sanitation (% of pop.) , 2010 0.0
Rural 0.0
Urban 0.0 1990 1995 2000 2005 20100.0
20.0
40.0
60.0
80.0
100.0
Tho
usan
d pe
ople
People lacking access to improved water sources and
improved sanitation, 1990−2010
Water Sanitation

Statistical Yearbook for Asia and the Pacific 2012 − ESCAP Statistics DivisionPage 5
Air pollution andclimate change
Water
Energy
Biodiversity
Natural disasters
Economic growth
Fiscal balance
Monetary measures
Labour
International relations
Connectivity
Carbon dioxide emissions, 2009Total (millions tons of ) 395CO2
Grams per 1 000 GDP 2005 PPP dollars 526.9
Consumption of ozone depletingsubstance (grams per capita), 2009 2.6
1990 2000 2010
0
5
10
15
20
25 emissions per capita, 1990−2011CO2
Tons
per
cap
ita
Renewable water available (m³ per capita per annum), 2010 22 094
Domestic water withdrawal (m³ per capita per annum), 2002 179.6
Agriculture − 73.8 %
Domestic use − 15.6 %
Industry − 10.6 %
Water withdrawal by sector, 2000
Total primary energy supply (kg of oil equivalent)
Per capita, 2010 5 651
Per 1 000 GDP 2005 PPP dollar, 2009 175
0
10
20
30
40
1990 − 2009Industry
% o
f tot
al fi
nal c
onsu
mpt
ion
1990 − 2009Transport
1990 − 2009Residential
Energy consumption by sector, 1990−2009
Areas protected Marine (% of territorial water) 28.3 Terrestrial (% of surface area) 10.6
Forest area(% of land area), 2010 19.4
1990 2000 2010
15
20
25
30
35Forest area, 1990−2011
% o
f lan
d ar
ea
Deaths(number per annum), 2011 1
People affected (1 000 per annum), 2011 8
Economic damages (% of GDP), 2011 0.2
GDP at current prices (billion US $), 2010 1 271.9 Growth rate (annual average, %), 2005−10 2.7 Per capita (2005 PPP $), 2009 34 216
Gross domestic investment rate (% of GDP), 2010 27.6
1990 1995 2000 2005 2010
0
85
170
255
340
425
510
595
680
765
850
Bill
ion
2005
US
dol
lars
Value added by sectorAgriculture Industry Services
Government revenue (% of GDP), 2010 22.7Government expenditure (% of GDP), 2010 26.8
Inflation rate(% per annum), 2011 3.4Exchange rateagainst US dollar, 2011 −11.1(% change per annum)
Employment−to−population ratio, 2011 Population aged 15 and above 62.1 Females aged 15 and above 55.7 Males aged 15 and above 68.6
Unemployment rate (% of labour force), 2011 5.1 Females 5.3 Males 4.9
Youth unemployment rate % of labour force aged 15−24, 2011 11.3
1990 2000 2010
0
2
4
6
8
10Agriculture Industry Services
Mill
ion
peop
le
Employment by sector, 1990−2010
Exports of merchandise(% of GDP), 2011 20.9Imports of merchandise(% of GDP), 2011 18.8
Exports of services(% of GDP), 2011 3.9Imports of services(% of GDP), 2011 4.6
FDI inflows(% of GDP), 2011 3.2FDI outflows(% of GDP), 2011 1.5
ODA received(% of GDP), −
Workers remittances received(% of GDP), −
Net external debt (% of GDP), −
1990 2000 2010
0
20
40
60
80
100
Intraregional imports and exports shares, 1990−2011
Exports Imports
Per
cent
age
Fixed telephone mainlines (*), 2011 46.6
Mobile cellular subscriptions (*), 2011 108.3
Internet users (*), 2011 79.0
Fixed broadband internet subscribers (*), 2011 23.9(*) per 100 population
2000 2005 2010
0
20
40
60
80
100Internet users, 2000−2011
Per
100
pop
ulat
ion
2000 2005 2010
0
5
10
15
20
25
30
Fixed broadband internet subscribers, 2000−2011
Per
100
pop
ulat
ion
Railway density (*), 2010 1.1
Road density (*), 2010 106.4 (*) Km of railway/road per 1 000 km² land area
Paved roads(% of roads), 2010 38.7
Passenger cars(per 1 000 population), 2010 550.0
Road traffic deaths (per 100 000 population), 2007 7.7
1990 2000 2010
0
1
2
3
4
5
Transport sector emissions per capita, 1990−2009
CO2
Tons
per
cap
ita
Inbound tourism expenditure (% of GDP), 2011 2.6
Outbound tourism expenditure (% of GDP), 2011 2.6
The present country profile for Australia is part of a series of
country profiles for each of the 58 ESCAP regional members
and published as part of the Statistical Yearbook for Asia and
the Pacific 2012.
Further information regarding data series used in this country
profile, including indicator definitions and data sources, are
available from the Statistical Yearbook website at
http://www.unescap.org/stat/data/syb2012.
For most indicators, times series data from 1990 to the latest
year with data available can also be accessed and downloaded
from the online database available from the website.
ESCAP Statistics Division
October 2012

1990 2011 1990 2011 1990 2011 1990 2011 1990 2011
Demographic trendsPopulation total, millions 3 276 4 218 635 1 046 443 597 573 598 281 348Population growth, % change per annum 1.8 1.0 2.7 2.3 1.9 1.1 0.3 0.2 1.0 0.9Urban population, % of total 33.0 43.1 32.1 40.4 70.3 79.9 68.9 73.0 75.4 82.4
Density, population per km2 60.9 78.5 21.0 34.5 21.6 29.0 96.7 101.1 14.1 17.4Foreign population, % of total 1.6 1.3 (10)
Net migration rate, migrants per 1 000 population -0.3 (90-95) -0.6 (05-10) -0.4 (90-95) -0.6 (05-10) -1.6 (90-95) -1.8 (05-10) 1.3 (90-95) 2.7 (05-10) 3.5 (90-95) 3.6 (05-10)
Fertlity rate, live births per woman 3.1 2.1 5.9 4.4 3.2 2.2 1.7 1.6 1.9 2.0Adolescent fertility rate, live birth per 1 000 woman aged 15-19 59.0 (95-00) 45.2 (05-10) 116.1 (95-00) 101.3 (05-10) 85.6 (95-00) 73.4 (05-10) 20.7 (95-00) 16.2 (05-10) 47.6 (95-00) 38.6 (05-10)
HealthInfant mortality rate, deaths per 100 000 live births 60.7 33.0 99.9 64.6 42.2 16.1 12.1 4.6 8.8 5.9
Under-five mortality rate, deaths per 100 000 live births 82.8 41.7 163.1 100.2 53.3 19.3 14.3 5.4 10.7 7.8
Children under 5 underweight, % of children under 5 33.1 22.9 (10) 27.3 21.0 (10) 10.4 3.4 (10) 0.9 (91) 1.3 (02)
Maternal mortality, deaths per 100 000 live births 379.2 146.2 (10) 768.9 463.8 (10) 139.3 80.3 (10) 24.8 10.6 (10) 11.5 20.3 (10)
Antenatal care coverage, at least one visit, % of women with a live birth 60.4 (91) 81.4 (10) 55.5 75.3 (10) 74.1 96.6 (10)
Population living with HIV: total adults, millions 5.89 (09) 19.5 (09) 1.18 (09) 1.27 (09)
Population living with HIV: female adults, millions 2.24 (09) 11.8 (09) 0.42 (09) 0.33 (09)
HIV prevalence rate, 15-49 years old, % of 15-49 years old 0.1 0.2 (09) 1.9 4.3 (09) 0.3 0.5 (09) 0.2 0.3 (09) 0.5 0.6 (09)
Total health expenditure, % of GDP 5.7 (95) 6.4 (10) 5.1 (95) 5.8 (10) 6.5 (95) 7.7 (10) 8.7 (95) 10.4 (10) 13.3 (95) 17.3 (10)
EducationNet enrolment in primary education, % of primary school aged pop. 85.3 91.8 (10) 56.9 77.5 (10) 87.4 93.9 (10) 92.4 96.7 (10) 97.3 94.9 (10)
Net enrolment in secondary education, % of secondary school aged pop. 50.2 (98) 64.1 (10) 24.2 (94) 35.1 (09) 49.7 73.5 (10) 81.6 90.9 (10) 84.3 89.6 (10)
Gross enrolment in tertiary education, % of tertiary school aged pop. 8.4 25.3 (10) 4.7 10.6 (10) 17.0 40.6 (10) 30.9 62.4 (10) 73.3 91.5 (10)
Adult literacy rate, % of population aged 15+ 80.4 (95-04) 83.0 (05-10) 98.8 (95-04) 99.1 (05-10)
Gender disparity in adult literacy rate, female to male ratio 0.86 (95-04) 0.88 (05-10) 0.99 (95-04) 0.99 (05-10)
Gender disparity in primary educ., ratio of female to male enrolment rates 0.89 0.99 (10) 0.82 0.95 (10) 0.97 0.99 (10) 1.00 1.00 (10) 1.01 1.01 (10)
Gender disparity in secondary educ., ratio of female to male enrolment rates 0.87 (98) 0.96 (10) 0.81 (94) 0.84 (09) 1.06 (98) 1.07 (10) 1.02 1.01 (10) 1.01 1.01 (10)
Gender disparity in tertiary educ., ratio of female to male enrolment rates 0.72 0.98 (10) 0.51 0.80 (10) 0.97 1.28 (10) 1.02 1.27 (10) 1.23 1.40 (10)
Pupils to teacher ratio, in primary education 27.7 24.3 (10) 33.7 39.1 (10) 27.1 21.9 (10) 16.6 13.4 (10) 15.3 13.8 (10)
Pupils to teacher ratio, in secondary education 17.1 18.4 (10) 21.6 21.8 (10) 17.2 16.5 (10) 12.8 11.3 (10) 16.1 12.6 (10)
Poverty and inequalitiesPopulation living in poverty, below $1.25 2005 PPP a day, % of pop. 51.6 18.9 (10) 51.1 39.8 12.8 5.1 (10) 0.0 0.0 0.0 0.0
Population living in poverty, below national poverty line, % of pop. 33.9 15.5 44.7 39.2 52.3 34.3 (10) 0.0 0.0 0.0 0.0
Population lacking access to improved water sources, % of pop. 27.2 9.1 (10) 44.3 34.1 (10) 14.3 5.7 (10) 1.9 0.7 (10) 0.9 0.9 (10)
rural, % of rural population 29.5 13.5 (10) 47.5 46.5 (10) 16.4 18.7 (10) 4.2 2.0 (10) 0.9 5.5 (10)
urban, % of urban population 5.9 3.0 (10) 14.7 15.1 (10) 5.4 2.4 (10) 0.3 0.2 (10) 0.0 0.0 (10)
Population lacking access to improved sanitation, % of total population 63.9 41.7 (10) 65.4 59.8 (10) 32.1 19.8 (10) 3.8 3.1 (10) 0.0 0.0 (10)
Table 1 - Asia-Pacific and other regions of the WorldStatistical Yearbook for Asia and the Pacific 2012
North AmericaAsia-Pacific AfricaLatin America and
CaribbeanEurope
119

1990 2011 1990 2011 1990 2011 1990 2011 1990 2011
North AmericaAsia-Pacific AfricaLatin America and
CaribbeanEurope
rural, % of rural population 78.3 54.3 (10) 75.6 69.1 (10) 61.4 39.5 (10) 8.8 7.6 (10) 1.0 1.0 (10)
urban, % of urban population 34.7 24.8 (10) 43.7 46.1 (10) 19.8 14.4 (10) 1.5 1.4 (10) 0.0 0.0 (10)
People lacking access to improved water sources, millions 890 380 (10) 281 349 (10) 63 33 (10) 11 4 (10) 3 3 (10)
People lacking access to improved sanitation, millions 2 095 1 743 (10) 415 612 (10) 142 117 (10) 21 18 (10) 0 0 (10)
Air pollution and climate changeCarbon dioxide (CO2) emissions, total, million tons of CO2 8 009 14 517 (09) 545 928 (09) 874 1 439 (09) 5 088 4 078 (09) 5 301 5 716 (09)
Carbon dioxide (CO2) emissions, grams per 1 dollar GDP (2005 PPP) 724.3 574.9 (09) 418.7 369.0 (09) 274.0 257.0 (09) 470.1 277.4 (09) 608.5 412.2 (09)
Carbon dioxide (CO2) emissions, per capita 2.5 3.6 (09) 1.0 1.1 (09) 2.0 2.5 (09) 8.9 6.9 (09) 18.9 16.7 (09)
Consumption of ozone-depleting substances, grams per capita 123.6 7.9 (09) 46.3 3.2 (09) 188.9 9.3 (09) 863.9 13.4 (09)
WaterRenewable water available, total, m3 per capita per annum 6 072 (92) 4 913 (10) 9 172 (92) 5 625 (10) 40 504 (92) 31 494 (10) 5 457 (92) 5 419 (10) 20 830 (92) 17 337 (10)
Domestic water withdrawal, m3 per capita per annum 33.4 (92) 47.2 (02) 29.0 (02) 26.3 (07) 94.8 (02) 107.2 (07) 103.4 (02) 100.4 (07) 234.9 (92) 216.5 (07)
Water withdrawal, agriculture, % of total renewable water 87.9 84.2 (00) 66.3 (00) 76.7 (07) 42.1 40.2 (05)
Water withdrawal, domestic use, % of total renewable water 6.0 10.9 (00) 21.4 (00) 13.1 13.7 (05)
Water withdrawal, industry, % of total renewable water 6.1 4.9 (00) 12.4 (00) 44.8 46.1 (05)
EnergyTotal primary energy supply (kg of oil equivalent), per capita 1 038 1 367 (09) 676 743 (09) 1 064 1 281 (09) 3 551 3 581 (10) 7 556 7 231 (10)
(2005 PPP) 305.5 221.6 (09) 283.1 245.3 (09) 146.7 133.7 (09) 187.9 122.6 (10) 243.8 174.3 (10)
Final energy consumption by sector: industry, % of total 32.5 35.6 (09) 24.0 19.5 (09) 33.5 32.3 (09) 32.6 22.9 (09) 22.8 18.8 (09)
Final energy consumption by sector: residential use, % of total 28.9 26.4 (09) 54.8 55.1 (09) 21.1 16.9 (09) 23.7 26.1 (09) 16.4 17.7 (09)
Final energy consumption by sector: transport, % of total 14.9 16.6 (09) 13.9 17.4 (09) 29.8 34.3 (09) 21.3 27.0 (09) 36.5 38.2 (09)
BiodiversityMarine areas protected, % of territorial water 1.8 5.9 (10) 2.6 6.9 (10) 2.4 31.6 (10) 2.9 7.5 (10) 7.6 10.1 (10)
Terrestrial areas protected, % of surface area 7.1 10.3 (10) 9.5 10.2 (10) 9.7 20.3 (10) 9.0 14.0 (10) 9.0 10.5 (10)
Forest area, % of land area 30.4 30.6 (10) 25.3 22.8 (10) 51.7 47.2 (10) 33.0 34.4 (10) 32.6 32.9 (10)
Natural disastersDeaths, number per annum 49 826 27 669 1 681 3 667 1 112 1 871 314 84 222 817People affected by natural disasters, millions per annum 63.8 173.1 9.7 23.3 2.8 11.9 6.0 0.0 0.0 0.4Economic damages from natural disasters, % of GDP 0.3 1.4 0.1 0.1 0.0 0.1 0.3 0.0 0.0 0.4
Economic growthGDP at current prices, billion US $ 6 687 20 765 (10) 507 1 710 (10) 1 155 5 107 (10) 7 991 17 541 (10) 6 341 16 032 (10)
Average annual GDP growth rate, % change per annum 6.0 6.6 (10) 2.8 4.0 (10) 0.8 5.9 (10) 2.5 2.0 (10) 1.7 3.0 (10)
GDP per capita, 2005 PPP dollars per capita 3 380 6 279 (10) 2 055 2 670 (10) 7 200 10 054 (10) 18 977 25 166 (10) 30 997 41 482 (10)
Gross domestic investment rate, % of GDP 31.1 31.5 (10) 20.1 22.1 (10) 20.2 21.3 (10) 23.0 19.0 (10) 18.0 15.9 (10)
Value added by sector: Agriculture, billion 2005 US dollars 665 930 (10) 90 186 (10) 92 158 (10) 260 269 (10) 89 150 (10)
Value added by sector: Industry, billion 2005 US dollars 2 870 5 332 (10) 245 440 (10) 581 986 (10) 3 048 3 433 (10) 2 218 3 048 (10)
Value added by sector: Services, billion 2005 US dollars 4 627 8 625 (10) 256 572 (10) 989 1 893 (10) 6749 10 054 (10) 6 635 11 076 (10)
120

1990 2011 1990 2011 1990 2011 1990 2011 1990 2011
North AmericaAsia-Pacific AfricaLatin America and
CaribbeanEurope
Fiscal balanceGovernment revenue, % of GDP 16.3 16.7 (09)
Government expenditure, % of GDP 17.1 21.1 (09)
Monetary measuresInflation rate (% per annum) 7.3 3.8 (10) 17.2 7.4 (10) 1 588 6.6 (10) 11.2 2.0 (10) 5.3 1.7 (10)
LabourEmployment-to-population ratio: population aged 15 and above 66.0 (91) 62.2 58.5 (91) 59.9 56.4 (91) 61.4 53.1 (91) 52.0 60.5 (91) 57.9
Male aged 15 and above 79.0 (91) 76.0 71.9 (91) 70.1 76.6 (91) 74.9 64.1 (91) 58.7 69.0 (91) 63.2Female aged 15 and above 52.6 (91) 48.1 45.6 (91) 49.9 36.9 (91) 48.5 43.0 (91) 45.7 52.5 (91) 52.8
Unemployment rate, female, % of female labour force 4.9 (91) 4.5 10.3 (91) 9.4 11.4 (91) 9.1 10.1 (91) 9.7 6.9 (91) 8.1Unemployment rate, male, % of male labour force 5.1 (91) 4.5 8.3 (91) 7.5 6.9 (91) 5.9 7.7 (91) 9.7 7.6 (91) 9.5Unemployment rate, total, % of labour force 5.0 (91) 4.5 9.1 (91) 8.3 8.5 (91) 7.2 8.7 (91) 9.7 7.3 (91) 8.8Youth unemployment rate, total, % of labour force aged 15-24 9.7 (91) 10.5 15.8 (91) 14.0 15.6 (91) 14.7 17.1 (91) 20.1 14.0 (91) 17.1
International relationsExports of merchandise, % of GDP 11.3 31.4 20.9 35.3 12.7 21.4 20.9 37.0 8.2 11.9
Imports of merchandise, % of GDP 11.2 30.3 19.6 32.8 11.2 21.2 21.6 37.3 10.1 16.7
Exports of services, % of GDP 2.0 5.4 3.7 4.9 (10) 2.6 2.5 5.3 11.0 2.4 4.0
Imports of services, % of GDP 2.6 5.5 5.2 7.4 (10) 3.1 3.5 5.0 9.0 2.0 3.0
FDI inflows, % of GDP 0.5 2.4 0.6 2.5 0.8 4.2 1.3 2.5 0.9 1.6
FDI outflows, % of GDP 0.9 2.2 0.1 0.2 0.0 1.9 1.7 3.7 0.6 2.7
ODA received, % of GDP 6.6 2.5 (10) 0.4 0.2 (10)
Workers remittances received, % of GDP 0.3 (96) 0.8 (10) 4.3 (05) 3.9 (09) 0.6 1.1 (10)
Net external debt, % of GDP 77.5 18.2 (10) 40.9 21.2 (10)
Intraregional exports shares (ESCAP), percentage 70.5 54.7
Intraregional imports shares (ESCAP), percentage 76.2 55.2
ConnectivityFixed telephone mainlines, per 100 population 6.1 (95) 14.5 1.7 (95) 2.9 9.1 (95) 18.5 39.2 (95) 42.3 59.9 (95) 47.9Mobile cellular subscriptions, per 100 population 6.5 (00) 80.9 1.9 (00) 61.4 12.3 (00) 106.7 47.5 (00) 124.8 37.7 (00) 102.9Internet users, per 100 population 3.3 (00) 26.9 0.5 (00) 16.0 3.9 (00) 39.4 18.7 (00) 68.0 43.9 (00) 78.4Fixed broadband internet subscribers, per 100 population 0.2 (00) 6.7 0.0 (01) 0.6 0.0 (00) 7.5 0.4 (00) 25.1 2.7 (00) 29.1Railway density, km of railway per 1000 km2 land area 6.1 6.5 (10) 3.5 (91) 3.5 (00) 4.4 5.5 (10) 49.9 49.9 (10) 12.4 15.7 (10)
Road density, km of road per 1000 km2 land area 252 (05) 266 (08) 74 (93) 77 (98) 143 158 (04) 1 017 1 133 (09) 387 436 (09)
Passenger cars, per 1 000 population 40.8 (03) 56.0 (09) 27.4 (07) 27.4 (07) 103.2 (03) 135.8 (09) 400.0 (03) 430.2 (09) 476.2 (03) 437.1 (09)
Road traffic deaths, per 100 000 population 17.4 (07) 17.4 (07) 33.5 (07) 33.5 (07) 17.3 (07) 17.3 (07) 10.1 (07) 10.1 (07) 13.6 (07) 13.6 (07)
Transport sector CO2 emissions, tons per capita 0.3 0.4 (09) 0.2 0.3 (09) 0.7 0.9 (09) 1.5 1.7 (09) 5.5 5.2 (09)
Inbound tourism expenditure, % of GDP 0.8 (95) 1.7 2.7 (95) 3.1 (10) 1.4 (95) 1.4 2.4 (95) 2.8 1.3 (95) 1.3Outbound tourism expenditure, % of GDP 1.1 (95) 1.5 1.8 (95) 2.0 (10) 1.1 (95) 1.2 2.3 (95) 2.5 0.9 (95) 1.0
121

Statistical Yearbook for Asia and the Pacific 2012
128
Technical notes Demographic trends Population size (millions) Definition: De facto mid-year population, covering all residents, regardless of legal status or citizenship, except for refugees not permanently settled in the country of asylum. Aggregation/imputation: Sum of individual country values. Missing data are not imputed. Data Source: WPP2010. Estimated demographic trends are projections based on censuses, administrative data and surveys provided by countries through an annual questionnaire. Population data from all sources are evaluated by the UN for completeness, accuracy and consistency. Data obtained: 03-07 May 2011 Population growth (annual average, %) Definition: The average annual rate of change in the total population over a single-year period or five-year periods, starting and ending in the middle of the indicated years. Aggregation/imputation: Weighted averages using population as weight. Missing data are not imputed. Data Source: WPP2010. Estimated demographic trends are projections based on censuses, administrative data and surveys provided by countries through an annual questionnaire. Population data from all sources are evaluated by the UN for completeness, accuracy and consistency. Data obtained: 03-07 May 2011 Urban population (% of total) Definition: Population living in areas classified as urban according to the administrative criteria used by each country or area. Aggregation/imputation: Weighted averages using population as weight. Missing data are not imputed. Data Source: WPP2010. Estimated demographic trends are projections based on censuses, administrative data and surveys provided by countries through an annual questionnaire. Population data from all sources are evaluated by the United Nations for completeness, accuracy and consistency. Data obtained: 03 May 2011 Glossary: There is no common definition in the region of what is “urban”. Definitions of urban areas may be based on administrative criteria, population size and/or density, economic functions or availability of certain infrastructure and services or other criteria. Because many countries define “urban” according to administrative criteria, urbanization levels and urban population growth rates may be underreported. Additionally, most growth occurs in the urban periphery, which may be beyond the boundary of “urban” and therefore may not be reflected in official statistics. Cross-country comparability of statistics related to urbanization is therefore limited. Population density (population per km2) Definition: Number of people per km2 of surface area. Total surface area comprises total land, inland and tidal water areas. Indicator calculations: Population divided by surface area (from FAO, AQUASTAT database, on 07 January 2011). Aggregation/imputation: Sum of individual country values of population divided by the sum of individual country surface areas. Missing data are not imputed. Data Source: WPP2010. Estimated demographic trends are projections based on censuses, administrative data and surveys provided by countries through an annual questionnaire. Population data from all sources are evaluated by the United Nations for completeness, accuracy and consistency. Data obtained: 03 May 2011 Foreign population (% of total) Definition: The estimated number of international immigrants, male and female, in the middle of the indicated year; generally represents the number of persons born in a country other than where they live. When data on the place of birth are unavailable, the number of non-citizens is used as a proxy for the number of international immigrants. The foreign population includes refugees, some of whom may not be foreign-born. Indicator calculations: The number of international immigrants divided by the total population. Aggregation/imputation: Weighted averages using population as weight. Missing data are not imputed. Data Source: United Nations, Trends in International Migrant Stock: The 2008 Revision (United Nations database, POP/DB/MIG/Stock/Rev.2008). Most estimates are based on data from population censuses held during the decennial rounds of censuses. Population census data are supplemented with data from population registers and nationally representative surveys. Data obtained: 25 August 2009 Net migration rate (migrants per 1,000 population) Definition: International immigrants minus emigrants divided by the average population of the country over a period. Aggregation/imputation: Weighted averages using population as weight. Missing data are not imputed. Data Source: WPP2010. Estimated demographic trends are projections based on censuses, administrative data and surveys provided by countries through an annual questionnaire. Population data from all sources are evaluated by the UN for completeness, accuracy and consistency. Data obtained: 03 May 2011 Fertility rate (live births per woman) Definition: The average number of live births per woman. This represents the number of live births a woman will have by the end of her reproductive period assuming the current prevailing age-specific fertility rates continue throughout her childbearing life. Aggregation/imputation: Weighted averages using women aged 15-49 as weight. Missing data are not imputed. Data Source: WPP2010. Estimated demographic trends are projections based on censuses, administrative data and surveys provided by countries through an annual questionnaire. Population data from all sources are evaluated by the UN for completeness, accuracy and consistency. Data obtained: 03-07 May 2011

Statistical Yearbook for Asia and the Pacific 2012
129
Adolescent fertility rate (live births per 1,000 women aged 15-19) Definition: The average number of births a 15-19 year old woman will experience. Indicator calculations: The number of live births to women aged 15-19 divided by the number of women in the same age group. Aggregation/imputation: Weighted averages using women aged 15-19 as weight. Missing data are not imputed. Data Source: WPP2010. Estimated demographic trends are projections based on censuses, administrative data and surveys provided by countries through an annual questionnaire. Population data from all sources are evaluated by the UN for completeness, accuracy and consistency. Data obtained: 03-07 May 2011 Life expectancy at birth (years) Definition: The number of years a newborn infant would live if prevailing age-specific mortality rates at the time of birth were to stay the same throughout the child's life. Aggregation/imputation: No aggregates calculated. Data Source: WPP2010. Estimated demographic trends are projections based on censuses, administrative data and surveys provided by countries through an annual questionnaire. Population data from all sources are evaluated by the UN for completeness, accuracy and consistency. Data obtained: 03-07 May 2011 Life expectancy at birth, female/male (years) Definition: The number of years a newborn female/male infant would live if prevailing age-specific mortality rates at the time of birth were to stay the same throughout the child's life. Disaggregated by gender. Aggregation/imputation: No aggregates calculated. Data Source: WPP2010. Estimated demographic trends are projections based on censuses, administrative data and surveys provided by countries through an annual questionnaire. Population data from all sources are evaluated by the UN for completeness, accuracy and consistency. Data obtained: 03-07 May 2011 Population age structure, female/male, 5-year range age group 0-4, 5-9, … 80+ (% of total population) Definition: Population size disaggregated by 5-year range age group and gender. Aggregation/imputation: Sum of individual country values for each age group divided by the total population. Data Source: WPP2010. Estimated demographic trends are projections based on censuses, administrative data and surveys provided by countries through an annual questionnaire. Population data from all sources are evaluated by the UN for completeness, accuracy and consistency. Data obtained: 03-07 May 2011
Health Infant mortality rate (deaths per 1,000 live births) Definition: The infant mortality rate is the probability (expressed as a rate per 1,000 live births) of a child born in a specified year dying before reaching the age of one if subject to current age-specific mortality rates. Aggregation/imputation: MDG aggregation and imputation methods; weighted averages using the number of live births (from WPP2010) as weight. Data Source: WHO Global Health Observatory Database, World Health Statistics. Data are collected from countries by WHO/UNICEF. Based on country-level data from civil registration systems, population census and household surveys. Data obtained: 03 October 2012 Glossary: A live birth is the complete expulsion or extraction from its mother of a product of conception, irrespective of the duration of the pregnancy, which, after such separation, breathes or shows any other evidence of life – such as beating of the heart, pulsation of the umbilical cord, or definite movement of voluntary muscles – whether or not the umbilical cord has been cut or the placenta is attached. Each product of such a birth is considered a live birth. Under 5 mortality rate (deaths per 1,000 live births) Definition: The Under 5 mortality rate expressed in deaths per 1,000 live births is the probability of a child born in a specified year dying before reaching the age of five if subject to current age-specific mortality rates. Aggregation/imputation: MDG aggregation and imputation methods; weighted averages using the number of live births (from WPP2010) as weight. Data Source: WHO Global Health Observatory Database, World Health Statistics. Data are collected from countries by WHO/UNICEF. Based on country-level data from civil registration systems, population census and household surveys. Data obtained: 03 October 2012 Children under 5 underweight (% of children under 5) Definition: The percentage of children aged 0-59 months whose weight for age is less than two standard deviations below the median weight for age of the international reference population. The inernational reference population, often referred to as the NCHS/WHO reference population, was formulated by the National Center for Health Statistics as a reference for the United States and later adopted by WHO. Aggregation/imputation: MDG aggregation and imputation methods; weighted averages using the number of children 0-59 months (WPP2010) as weight. Data Source: MDG Indicators Database. UNICEF is the primary data custodian. Country-level data are generally obtained from national household surveys, including demographic and health surveys, multiple indicator cluster surveys and national nutrition surveys. Data obtained: 05 July 2012 Maternal mortality ratio (deaths per 100,000 live births) Definition: The maternal mortality ratio (MMR) is the ratio of the number of maternal deaths during a given time period per 100,000 live births during the same time-period. A maternal death refers to a female death from any cause related to or aggravated by pregnancy or its management (excluding accidental or incidental causes) during pregnancy and childbirth or

Statistical Yearbook for Asia and the Pacific 2012
130
within 42 days of termination of pregnancy, irrespective of the duration and site of the pregnancy. Aggregation/imputation: MDG aggregation and imputation methods, weighted averages using the number of live births (WPP2010) as weight. Data Source: MDG Indicators Database. Based on data from WHO, UNDP, UNICEF and the World Bank. Sources and methods used to determine maternal mortality vary by country. Primary sources of data include vital registration systems, household surveys (direct and indirect methods), reproductive-age mortality studies, disease surveillance or sample registration systems, special studies on maternal mortality, and national population censuses. Despite being based on established demographic techniques and empirical data from other countries, the country-specific point estimates obtained through the statistical model do not necessarily represent the true levels of maternal mortality. Data obtained: 05 July 2012 Antenatal care coverage, at least one visit (% of women with a live birth) Definition: Women aged 15-49 years with a live birth in a given time period who received antenatal care provided by skilled health personnel (doctors, nurses, or midwives) at least once during pregnancy. A skilled health worker/attendant is an accredited health professional – such as a midwife, doctor or nurse – who has been educated and trained to proficiency in the skills needed to manage normal (uncomplicated) pregnancies, childbirth and the immediate post-natal period, and in the identification, management and referral of complications in women and newborns. Both trained and untrained traditional birth attendants are excluded. Aggregation/imputation: MDG aggregation and imputation methods; weighted averages using the number of live births (WPP2010) as weight. Data Source: MDG Indicators Database. Based on data from WHO, UNDP, UNICEF and the World Bank. Sources and methods used to determine maternal mortality vary by country. Primary sources of data include vital registration systems, household surveys (direct and indirect methods), reproductive-age mortality studies, disease surveillance or sample registration systems, special studies on maternal mortality, and national population censuses. Despite being based on established demographic techniques and empirical data from other countries, the country-specific point estimates obtained through the statistical model do not necessarily represent the true levels of maternal mortality. Data obtained: 05 July 2012 Population living with HIV: Adults/Female adults (millions) Definition: Estimated number of total adults/female adults living with HIV, expressed in millions. Estimates include all those infected with HIV, whether or not they have developed symptoms of AIDS. Adults is defined as 15 and above. Aggregation/imputation: Sum of individual country values. Missing data are not imputed. Data Source: WHO/GHO. HIV prevalence and AIDS deaths have been collected from national AIDS programmes and produced and compiled by UNAIDS/WHO. Data are shared with national AIDS programmes for review and comments but are not necessarily the official estimates used by the national Government. Data obtained: 03 September 2012 Glossary: Human Immunodeficiency Virus (HIV) is a virus that weakens the immune system, ultimately leading to acquired immunodeficiency syndrome (AIDS). HIV destroys the body's ability to fight off infection and disease, which can ultimately lead to death. HIV prevalence rate, 15-49 years old (% of 15-49 years old) Definition: Individuals aged 15-49 living with HIV. HIV prevalence includes all those infected with HIV, whether or not symptoms of AIDS have developed. Aggregation/imputation: Weighted averages using the population aged 15-49 (WPP2010) as weight. Missing data are not imputed. Data Source: WHO/GHO. HIV prevalence and AIDS deaths have been collected from national AIDS programmes and produced and compiled by UNAIDS/WHO. Data are shared with national AIDS programmes for review and comments but are not necessarily the official estimates used by the national Government. Data obtained: 31 August 2012 Births attended by skilled health personnel: Disaggregated by poorest and richest quintiles (% of live births) Definition: Births attended by skilled health personnel (doctors, nurses or midwives) are deliveries attended by personnel trained in providing life-saving obstetric care, including giving the necessary supervision, care and advice to women during pregnancy, labour and the post-partum period; conducting deliveries on their own; and caring for newborns. Traditional birth attendants, even if they have received a short training course, are not included. Poorest and richest quintiles of the population are based on income data. This indicator is expressed in % of live births. Aggregation/imputation: Poorest and richest quintiles are not aggregated. Data Source: WHO/GHO. Microdata are from nationally representative surveys including the demographic and health surveys, the fertility and family surveys, reproductive health surveys with assistance from the Centers for Disease Control in the United States, the multiple-indicator cluster surveys and national family planning, or health, or household, or socio-economic surveys. Survey data from sources other than the national statistical system are included when other data are not available. The data are taken from published survey reports or, in exceptional cases, other published analytic reports. UNICEF/WHO base their estimates on the available data sources and internal verification procedures. Data obtained: 05 July 2012 Births attended by skilled health personnel: Disaggregated by rural and urban areas (% of live births) Definition: Births attended by skilled health personnel (doctors, nurses or midwives) are deliveries attended by personnel trained in providing life-saving obstetric care, including giving the necessary supervision, care and advice to women during pregnancy, labour and the post-partum period; conducting deliveries on their own; and caring for newborns. Traditional birth attendants, even if they have received a short training course, are not included. Rural and urban disaggregation data are based on the place of residence. This indicator is expressed in % of live births. Aggregation/imputation: Rural and urban data are not aggregated. Data Source: WHO/GHO. Microdata are from nationally representative surveys including the demographic and health surveys, the fertility and family surveys, reproductive health surveys with assistance from the Centers for Disease Control in the United States, the multiple-indicator cluster surveys and national family planning, or health, or household, or socio-economic surveys. Survey data from sources other than the national statistical system are included when other data are
Statistical Yearbook for Asia and the Pacific 2012
131
not available. The data are taken from published survey reports or, in exceptional cases, other published analytic reports. UNICEF/WHO base their estimates on the available data sources and internal verification procedures. Data obtained: 05 July 2012 Years of life lost (YLL) to communicable diseases, non-communicable diseases and injuries (% of YLL) Definition: YLL is an estimate of the average number years a person would have lived had he or she not died prematurely; i.e., a measure of premature mortality. YLL per person represents the difference between the standard life expectancy of a person and his or her age at death; if the age exceeds the life expectancy, YLL equals zero. The standard life expectancy value is consistent across countries and generated using a standard life table. A life table is the statistical representation of the probability that a person will survive for an additional year; and based on that probability, the probability of surviving for another year; and so on. Aggregation/imputation: No aggregates calculated. Data Source: WHO/GHO. WHO uses a standardized questionnaire for data collection. Cause-of-death distributions are estimated from death registration data, together with data from population-based epidemiological studies, disease registers and notifications systems for selected specific causes of death. Causes of death for populations without useable death-registration data are estimated using cause-of-death models together with data from population-based epidemiological studies, disease registers and notification systems for 21 specific causes of death. Data obtained: 20 June 2011 General government health expenditure (% of government expenditure) Definition: The sum of outlays for health maintenance, restoration or enhancement paid for in cash or supplied in kind by governmental entities, such as the ministry of health, other ministries, parastatal organizations or social security agencies (without double-counting governmental transfers to social security and extrabudgetary funds). Such expenditure includes transfer payments to households to offset medical care costs and extrabudgetary funds to finance health services and goods. The revenue base of such entities may comprise multiple sources, including external funds. General government expenditure corresponds to the consolidated outlays of all levels of government: territorial authorities (central/federal government, provincial/regional/State/district authorities, municipal/local government), social security institutions and extrabudgetary funds, including capital outlays. Expressed as the percentage of government expenditure. Aggregation/imputation: No aggregates calculated. Data Source: WHO/GHO. WHO collects national health accounts and other data from countries. National sources collected by WHO include national health accounts (NHA) reports, national accounts (NA) reports, general government (GG) accounts, public expenditure reviews (PER), government expenditure by purpose reports (Classification of the Functions of Government, COFOG), institutional reports of public entities involved in health care provision or financing, notably social security and other health insurance compulsory agencies and ministry of finance (MoF) reports. The most comprehensive and consistent data on health financing is generated from national health accounts. If NHA data are not available, WHO estimates based on technical contacts in-country and publicly available documents and reports that are adjusted to the NHA framework. WHO sends estimates to the respective ministry of health every year for validation. Data obtained: 28 August 2012 Number of physicians (per 10,000 population) Definition: The number of physicians include generalists and specialists expressed in per 10,000 population. Aggregation/imputation: No aggregates are calculated. Data Source: WHO/GHO. WHO collects data from countries. Data collected includes population censuses, labour force and employment surveys, health facility assessments and routine administrative information systems reports (on public expenditure, staffing and payroll as well as professional training, registration and licensure). Most of the data from administrative sources are derived from published national health sector reviews and/or official country reports to WHO offices. Data obtained: 29 August 2012 Number of hospital beds (per 10,000 population) Definition: The number of in-patient hospital beds include hospital and maternity beds, expressed in per 10,000 population, and exclude cots and delivery beds. Aggregation/imputation: No aggregates are calculated. Data Source: WHO/GHO. WHO collects data from countries. Data collected includes population censuses, labour force and employment surveys, health facility assessments and routine administrative information systems reports (on public expenditure, staffing and payroll as well as professional training, registration and licensure). Most of the data from administrative sources are derived from published national health sector reviews and/or official country reports to WHO offices. Data obtained: 29 August 2012 Total health expenditure (% of GDP) Definition: Total health expenditure (THE) is the sum of general government and private expenditure on health. Expressed as a percentage of GDP. Aggregation/imputation: Weighted averages (% of GDP) using current GDP in United States dollars as weight. Missing data are not imputed. Data Source: WHO/GHO. WHO collects national health accounts and other data from countries. National sources collected by WHO include national health accounts (NHA) reports, national accounts (NA) reports, general government (GG) accounts, public expenditure reviews (PER), government expenditure by purpose reports (Classification of the Functions of Government, COFOG), institutional reports of public entities involved in health care provision or financing, notably social security and other health insurance compulsory agencies and ministry of finance (MoF) reports. The most comprehensive and consistent data on health financing is generated from national health accounts. If NHA data are not available, WHO estimates based on technical contacts in-country and publicly available documents and reports that are adjusted to the NHA framework. WHO sends estimates to the respective ministry of health every year for validation. Data obtained: 28 August 2012
Statistical Yearbook for Asia and the Pacific 2012
132
Education Net enrolment in primary education (% of primary school-aged children) Definition: Enrolment of the official age group for primary education expressed as a percentage of primary school-aged population. Aggregation/imputation: UNESCO Institute for Statistics (UIS). Data Source: UIS Data Centre. Values are from school registers, school surveys or censuses for data on net enrolment by age and data on enrolment by level of education; population censuses or estimates of school-age population normally obtained from the central statistical office. UIS collects education statistics in aggregate form from official administrative sources at national level. Collected information encompasses data on educational programmes, access, participation, progression, completion, internal efficiency and human and financial resources. Data obtained: 18 October 2012 Net enrolment in secondary education (% of secondary school-aged children) Definition: Enrolment of the official age group for secondary education expressed as a percentage of secondary school-aged population. Aggregation/imputation: UNESCO Institute for Statistics (UIS). Data Source: UIS Data Centre. Values are from school registers, school surveys or censuses for data on net enrolment by age and data on enrolment by level of education; population censuses or estimates of school-age population normally obtained from the central statistical office. UIS collects education statistics in aggregate form from official administrative sources at national level. Collected information encompasses data on educational programmes, access, participation, progression, completion, internal efficiency and human and financial resources. Data obtained: 18 October 2012 Gross enrolment in tertiary education (% of tertiary school aged population (within 5 years of secondary school age)) Definition: Total enrolment in tertiary education, regardless of age, expressed as a percentage of the eligible official school-age population corresponding to tertiary education in a given school year. For the tertiary level, the population used is that of the five-year age group following on from the secondary school leaving. Aggregation/imputation: UNESCO Institute for Statistics (UIS). Data Source: UIS Data Centre. Values are from school registers, school surveys or censuses for data on net enrolment by age and data on enrolment by level of education; population censuses or estimates of school-age population normally obtained from the central statistical office. UIS collects education statistics in aggregate form from official administrative sources at national level. Collected information encompasses data on educational programmes, access, participation, progression, completion, internal efficiency and human and financial resources. Data obtained: 18 October 2012 Adult literacy rate – total (% of population aged 15 and above) Definition: The percentage of people aged 15 years and above who can both read and write with comprehension a short, simple statement about their everyday life. Generally, literacy also encompasses numeracy or the ability to make simple arithmetic calculations. Disaggregated by gender. Aggregation/imputation: UNESCO Institute for Statistics (UIS). Data Source: UIS Data Centre. Values mainly obtained from population censuses and household and/or labour force surveys. UIS collects education statistics in aggregate form from official administrative sources at the national level. Collected information encompasses data on educational programmes, access, participation, progression, completion, internal efficiency and human and financial resources Data obtained: 25 October 2012 Adult literacy rate – female, male (% of population aged 15 and above) Definition: The percentage of people (female and male) aged 15 years and above who can both read and write with comprehension a short, simple statement about their everyday life. Generally, literacy also encompasses numeracy or the ability to make simple arithmetic calculations. Disaggregated by gender. Aggregation/imputation: No aggregates calculated. Data Source: UIS Data Centre. Values mainly obtained from population censuses and household and/or labour force surveys. UIS collects education statistics in aggregate form from official administrative sources at the national level. Collected information encompasses data on educational programmes, access, participation, progression, completion, internal efficiency and human and financial resources Data obtained: 03 July 2012 Gender parity index – net primary enrolment, net secondary enrolment and gross secondary enrolment (female-to-male ratio) Definition: The ratio of female-to-male enrolment ratios for primary/secondary/tertiary level of education. Aggregation/imputation: UNESCO Institute for Statistics (UIS). Data Source: UIS Data Centre. Values are from school registers, school surveys or censuses for data on net enrolment by age and data on enrolment by level of education; population censuses or estimates of school-age population normally obtained from the central statistical office. UIS collects education statistics in aggregate form from official administrative sources at national level. Collected information encompasses data on educational programmes, access, participation, progression, completion, internal efficiency and human and financial resources. Data obtained: 18 October 2012 Public expenditure on education (% of GDP) Definition: Total public expenditure (current and capital) on education, expressed as a percentage of GDP. GDP are based on national accounts reports from UNESCO Bureau of Statistics. GDP levels may, in this case, not be comparable with GDP published elsewhere in this Yearbook. Aggregation/imputation: No aggregates calculated. Data Source: Values are from annual financial reports by central or federal governments, state or provincial or regional administrations. Data on GDP are normally available from national accounts reports from the bureau of statistics. For percentage of total government expenditure, values come from annual financial reports prepared by the ministry of finance; national accounts reports by the central statistical office and financial reports from the various government departments engaged in education activities, especially the ministry of education. UIS collects education statistics in aggregate form from official administrative sources

Statistical Yearbook for Asia and the Pacific 2012
133
at the national level. Collected information encompasses data on educational programmes, access, participation, progression, completion, internal efficiency and human and financial resources. Data obtained: 26 September 2012 Public expenditure on education (% of total government expenditure) Definition: Total public expenditure (current and capital) on education, expressed as a percentage of total government expenditure. Aggregation/imputation: No aggregates calculated. Data Source: Values are from annual financial reports by central or federal governments, state or provincial or regional administrations. Data on GDP are normally available from national accounts reports from the bureau of statistics. For percentage of total government expenditure, values come from annual financial reports prepared by the ministry of finance; national accounts reports by the central statistical office and financial reports from the various government departments engaged in education activities, especially the ministry of education. UIS collects education statistics in aggregate form from official administrative sources at the national level. Collected information encompasses data on educational programmes, access, participation, progression, completion, internal efficiency and human and financial resources. Data obtained: 26 September 2012 Gross domestic expenditure on research and development (% of GDP) Definition: Gross domestic expenditure on R&D (GERD) is the expenditure on R&D performed on the national territory during a given period. It includes R&D funds allocated by: (1) firms, organizations and institutions whose primary activity is the market production of goods and services for sale to the general public; (2) the central (federal), State, or local government authorities. They include all departments, offices and other bodies which furnish, but normally do not sell to the community, those common services, other than higher education; (3) institutions of higher education comprising all universities, colleges of technology, other institutions of post-secondary education, and all research institutes, experimental stations and clinics operating under the direct control of or administered by or associated with higher education establishments; (4) non-market, private non-profit institutions serving the general public, as well as by private individuals and households; (5) institutions and individuals located outside the political borders of a country, except vehicles, ships, aircraft and space satellites operated by domestic organizations and testing grounds acquired by such organizations, and by all international organizations (except business enterprises) including their facilities and operations within the national borders. Expressed as a percentage of GDP. Aggregation/imputation: No aggregates calculated. Data Source: UIS Data Centre. UIS conducts a biennial R&D survey and collects data through its R&D questionnaire. Data obtained: 26 September 2012 Pupils to teacher ratio in primary education/secondary education (pupils per teacher) Definition: Average number of pupils (students) per teacher in primary education/secondary education in a given school year, based on headcounts for both pupils and teachers. Aggregation/imputation: UNESCO Institute for Statistics (UIS). Data Source: Values mainly obtained from school registers, teacher records, school census or surveys for data on enrolment and teaching staff. UIS collects education statistics in aggregate form from official administrative sources at national level. Collected information encompasses data on educational programmes, access, participation, progression, completion, internal efficiency and human and financial resources. Data obtained: 18 October 2012
Poverty and inequalities Population living in poverty (2005 PPP$1.25 a day) (% of population) Definition: The population living on less than $1.25 per day, measured in 2005 PPP. The threshold of PPP$1.25 per day roughly indicates a global poverty line. Aggregation/imputation: MDG aggregation and imputation methods, with weighted averages (for proportional figures) using population as a weight. Data Source: United Nations MDG Indicators Database. The indicator is produced by the World Bank Development Research Group based on microlevel data from nationally representative household surveys that are conducted by national statistical offices or by private agencies under the supervision of government or international agencies and obtained from government statistical offices and World Bank Group country departments. Global poverty indicators are adjusted for each country using an internationally comparable poverty line, enabling comparisons across countries to be made. Data obtained: 05 July 2012 Glossary: Purchasing power parity (PPP) is an international dollar has the same purchasing power as the U.S. dollar has in the United States. Costs in local currency units are converted to international dollars using purchasing power parity (PPP) exchange rates. A PPP exchange rate is the number of units of a country's currency required to buy the same amounts of goods and services in the domestic market as U.S. dollar would buy in the United States. An international dollar is, therefore, a hypothetical currency that is used as a means of translating and comparing costs from one country to the other using a common reference point, the US dollar. Population living below the national poverty line (% of population) Definition: The national poverty line is defined by each country. Therefore, the figures are not comparable across countries and may not be comparable over time within a country. Aggregation/imputation: MDG aggregation and imputation methods, with weighted averages (for proportional figures) using population as a weight. Data Source: United Nations MDG Indicators Database. Data on developing countries comes mainly from the World Bans Poverty Assessments which are done in close collaboration with national institutions, other development agencies, and civil society groups, including poor people’s organizations. Data are derived from nationally representative household surveys conducted by national statistical offices or by private agencies under the supervision of government or international agencies and obtained from government statistical offices and World Bank Group country departments. Data on developed countries are typically gathered from national poverty reports. The data are not adjusted for international comparability. Data obtained: 05 July 2012

Statistical Yearbook for Asia and the Pacific 2012
134
Gini index (income equality coefficient) Definition: Measures the extent to which the income distribution (or, in some cases, consumption expenditure) within an economy deviates from a perfect income equality. A Gini index of 0 represents perfect equality and of 100 represents absolute inequality. Aggregation/imputation: No aggregates calculated. Data Source: World Bank, Development Research Group. Data are based on primary household survey data obtained from government statistical agencies and World Bank country departments. Data on high-income economies are from the Luxembourg Income Study database. Data obtained: 18 September 2012 Population lacking access to improved water sources: rural, urban and total (% of rural/urban/total population) Definition: The proportion of the rural/urban/total population without access to improved water sources. Improved water sources includes household water connection, public standpipe, borehole, protected dug well, protected spring, rainwater collection and bottled water (if the secondary available source is also improved). Aggregation/imputation: MDG aggregation and imputation methods, with weighted averages using rural/urban/total population as a weight. Data Source: MDG Indicators Database. Countries report data to the WHO/UNICEF Joint Monitoring Programme for Water Supply and Sanitation (JMP). The primary data sources used in international monitoring include nationally representative household surveys, including Multiple Indicator Cluster Surveys (MICS), Demographic Health Surveys (DHS), World Health Surveys (WHS), Living Standards and Measurement Surveys (LSMS), Core Welfare Indicator Questionnaires (CWIQ), Pan Arab Project for Family Health Surveys (PAPFAM) and population censuses. Such data are entered into the JMP database after validation with objective criteria. Data obtained: 06-07 July 2012 Population lacking access to improved sanitation: rural, urban and total (% of rural/urban/total population) Definition: The proportion of the rural/urban/total population without access to improved sanitation. Improved sanitation refers to acilities which include flush or pour-flush toilet or latrine to: piped sewerage, septic tank or pit; a ventilated improved pit (VIP) latrine; a pit latrine with slab; or a composting toilet or latrine. Aggregation/imputation: MDG aggregation and imputation methods, with weighted averages using rural/urban/total population as a weight. Data Source: MDG Indicators Database. Countries report data to the WHO/UNICEF Joint Monitoring Programme for Water Supply and Sanitation (JMP). The primary data sources used in international monitoring include nationally representative household surveys, including Multiple Indicator Cluster Surveys (MICS), Demographic Health Surveys (DHS), World Health Surveys (WHS), Living Standards and Measurement Surveys (LSMS), Core Welfare Indicator Questionnaires (CWIQ), Pan Arab Project for Family Health Surveys (PAPFAM) and population censuses. Such data are entered into the JMP database after validation with objective criteria. Data obtained: 06-07 July 2012 Population lacking access to improved water sources (millions) Definition: The number of people lacking access to improved water, expressed in millions. Aggregation/imputation: MDG aggregation and imputation methods; Data are derived by multiplying the population size with the percentage of the population lacking access to improved water sources (1 minus the percentage of the total population with access to improved water sources). Data Source: MDG Indicators Database. Countries report data to the WHO/UNICEF Joint Monitoring Programme for Water Supply and Sanitation (JMP). The primary data sources used in international monitoring include nationally representative household surveys, including Multiple Indicator Cluster Surveys (MICS), Demographic Health Surveys (DHS), World Health Surveys (WHS), Living Standards and Measurement Surveys (LSMS), Core Welfare Indicator Questionnaires (CWIQ), Pan Arab Project for Family Health Surveys (PAPFAM) and population censuses. Such data are entered into the JMP database after validation with objective criteria. Data obtained: 06 July 2012 People lacking access to improved sanitation (millions) Definition: The number of people lacking access to improved sanitation, expressed in millions; this is only calculated for economic, regional and subregional groupings. Aggregation/imputation: MDG aggregation and imputation methods; Data are derived by multiplying the population size with the percentage of the population lacking access to improved sanitation (1 minus the percentage of the total population with access to improved sanitation). Data Source: MDG Indicators Database. Countries report data to the WHO/UNICEF Joint Monitoring Programme for Water Supply and Sanitation (JMP). The primary data sources used in international monitoring include nationally representative household surveys, including Multiple Indicator Cluster Surveys (MICS), Demographic Health Surveys (DHS), World Health Surveys (WHS), Living Standards and Measurement Surveys (LSMS), Core Welfare Indicator Questionnaires (CWIQ), Pan Arab Project for Family Health Surveys (PAPFAM) and population censuses. Such data are entered into the JMP database after validation with objective criteria. Data obtained: 06 July 2012
Air pollution and climate change Carbon dioxide (CO2) emissions (million tons of CO2) Definition: Total CO2 emissions from fuel combustion, calculated using the Tier 1 Sectoral Approach of the Intergovernmental Panel on Climate Change (IPCC). Aggregation/imputation: Sum of individual country values. Missing data are not imputed. Data Source: International Energy Agency (IEA). Countries report to IEA through the OECD member site and non-OECD government site. The IEA secretariat does not adjust the data. Data obtained: 28 February 2012 Carbon dioxide (CO2) emissions (grams per 1 dollar GDP (2005 PPP)) Definition: CO2 emissions in grams per unit of GDP figures are based on GDP in 2005 PPP dollars figures from WDI. Aggregation/imputation: Weighted averages, using GDP in 2005 PPP dollars as weight. Missing data are not imputed. Data Source: International Energy Agency (IEA). Countries report to IEA through the OECD member site and non-OECD government site. The IEA secretariat does not adjust the data. Data obtained: 28 February 2012

Statistical Yearbook for Asia and the Pacific 2012
135
Carbon dioxide (CO2) emissions per capita (tons per capita) Definition: CO2 emissions per capita figures are based on population figures (WPP 2010). Aggregation/imputation: Weighted averages, using population as weight. Missing data are not imputed. Data Source: International Energy Agency (IEA). Countries report to IEA through the OECD member site and non-OECD government site. The IEA secretariat does not adjust the data. Data obtained: 28 February 2012 Consumption of ozone-depleting substances (grams per capita) Definition: Annual consumption in weighted tons of the individual substances in the group of ozone-depleting substances multiplied by their ozone-depleting potential (ODP). Ozone-depleting substances are those containing chlorine or bromine that destroy the stratospheric ozone layer. Figures are based on population figures (WPP 2010). Aggregation/imputation: Weighted averages, using population as weight. Missing data are not imputed. Data Source: MDG Indicators database. Countries that are Party to the Montreal protocol report data annually to the Secretariat using data reporting formats agreed by the Parties. Data are usually reported by the ministry of environment or by designated authorities such as an environmental protection agency or an environmental management authority or a national ozone unit. Country data are not adjusted. Data obtained: 28 February 2012
Water Renewable water, total (m3 per capita per annum) Definition: The sum of internal renewable water resources and natural incoming flow originating outside the country, taking into consideration the quantity of flows reserved to upstream and downstream countries through formal or informal agreements or treaties. That sum gives the maximum theoretical amount of water available in the country. Expressed in cubic meter per capita per annum. Aggregation/imputation: Weighted averages using total population as weight. Missing data are not imputed. Data Source: AQUASTAT, Food and Agriculture Organization, FAO's Information System on Water and Agriculture Data obtained: 8 February 2012 Domestic water withdrawal (m3 per capita per annum) Definition: Drinking water plus water withdrawn for homes, municipalities, commercial establishments, and public services. Expressed in cubic meter per capita per annum. Aggregation/imputation: Weighted averages using total population as weight. Missing data are not imputed. Data Source: AQUASTAT, Food and Agriculture Organization, FAO's Information System on Water and Agriculture Data obtained: 05 September 2012 Water withdrawal, agriculture (% of total water withdrawal) Definition: Agricultural water withdrawal (quantity of water used for agricultural purposes, including irrigation and for livestock. Methods for computing agricultural water withdrawal vary from country to country) divided by the total water withdrawal. Expressed as percentage of total water withdrawal. Aggregation/imputation: Sum of individual country values of the agricultural sector water withdrawal divided by sum of individual country values of total water withdrawal. Missing data are not imputed. Data Source: AQUASTAT, Food and Agriculture Organization, FAO's Information System on Water and Agriculture Data obtained: 12 April 2012 Water withdrawal, industry (% of total water withdrawal) Definition: Quantity of water used for industrial purposes divided by the total water withdrawal. Usually, this sector refers to self-supplied industries not connected to any distribution network. Expressed as percentage of total water withdrawal. Aggregation/imputation: Sum of individual country values of the industrial sector water withdrawal divided by sum of individual country values of total water withdrawal. Missing data are not imputed. Data Source: AQUASTAT, Food and Agriculture Organization, FAO's Information System on Water and Agriculture Data obtained: 12 April 2012 Water withdrawal, domestic use (% of total water withdrawal) Definition: The total water withdrawn by the public distribution network divided by the total water withdrawal. It can include that part of the industries, which are connected to the network. Expressed as percentage of total water withdrawal. Aggregation/imputation: Sum of individual country values of the domestic water withdrawal divided by sum of individual country values of total water withdrawal. Missing data are not imputed. Data Source: AQUASTAT, Food and Agriculture Organization, FAO's Information System on Water and Agriculture Data obtained: 12 April 2012
Energy Total primary energy supply (TPES) (kg of oil equivalent per capita) Definition: TPES per capita figures are based on population figures (WPP 2010). Aggregation/imputation: Weighted averages using total population as weight. Missing data are not imputed. Data Source: IEA. Countries report to IEA through the OECD member site and the non-OECD government site. The IEA secretariat does not adjust the data. For final consumption, energy balance, primary energy supply and electricity data, IEA notes that energy statistics at the national level are often collected using criteria and definitions that differ, sometimes considerably, from those of international organizations. The IEA secretariat has identified such differences and, where possible, adjusted the data to meet international definitions. Data obtained: 1 March 2012

Statistical Yearbook for Asia and the Pacific 2012
136
Glossary: Total Primary Energy Supply (TPES) is composed of production + imports – exports – international marine bunkers – international aviation bunkers ± stock changes. TPES includes fuels such as coal and gas that are subsequently transformed into other energy forms, such as electricity. For the world total, international marine bunkers and international aviation bunkers are not subtracted from TPES. Total Final Consumption (TFC) is the sum of consumption by the different end-use sectors. Backflows from the petrochemical industry are not included in final consumption. Total primary energy supply (TPES) (kg of oil equivalent per 1,000 dollars GDP (2005 PPP)) Definition: TPES per GDP is often referred to as the overall "energy intensity" of an economy. Figures are based on GDP in 2005 PPP (WDI). Aggregation/imputation: Weighted averages using GDP in 2005 PPP dollars as weight. Missing data are not imputed. Data Source: IEA. Countries report to IEA through the OECD member site and the non-OECD government site. The IEA secretariat does not adjust the data. For final consumption, energy balance, primary energy supply and electricity data, IEA notes that energy statistics at the national level are often collected using criteria and definitions that differ, sometimes considerably, from those of international organizations. The IEA secretariat has identified such differences and, where possible, adjusted the data to meet international definitions. Data obtained: 1 March 2012 Final energy consumption: Transport (% of total final energy consumption) Definition: Encompasses all fuels used for transport (ISIC Divisions 49 to 51), including transport in industry and covering domestic aviation, road, rail, pipeline transport, domestic navigation and non-specified transport. Fuel used in ocean, coastal and inland fishing (included under fishing) and military consumption (included in other non-specified) are excluded from transport. International marine and international aviation bunkers are also included here for world total. Aggregation/imputation: Sum of individual country values of the sector divided by the sum of individual country values of total final consumption. Missing data are not imputed. Data Source: IEA. Countries report to IEA through the OECD member site and the non-OECD government site. The IEA secretariat does not adjust the data. For final consumption, energy balance, primary energy supply and electricity data, IEA notes that energy statistics at the national level are often collected using criteria and definitions that differ, sometimes considerably, from those of international organizations. The IEA secretariat has identified such differences and, where possible, adjusted the data to meet international definitions. Data obtained: 5 March 2012 Final energy consumption: Industry (% of total final energy consumption) Definition: Specified under the following subsectors according to ISIC; energy used for transport by industry is reported under transport: iron and steel industry (ISIC Group 241 and Class 2431); chemical and petrochemical industry (ISIC Divisions 20 and 21), excluding petrochemical feedstocks; non-ferrous metals basic industries (ISIC Group 242 and Class 2432); non-metallic minerals such as glass, ceramic and cement (ISIC Division 23); transport equipment (ISIC Divisions 29 and 30); machinery, comprising fabricated metal products, machinery and equipment other than transport equipment (ISIC Divisions 25 to 28); mining (excluding fuels) and quarrying (ISIC Divisions 07 and 08 and Group 099); food and tobacco (ISIC Divisions 10 to 12); paper, pulp and printing (ISIC Divisions 17 and 18); wood and wood products, other than pulp and paper (ISIC Division 16); construction (ISIC Divisions 41 to 43); textile and leather (ISIC Divisions 13 to 15); non-specified - any manufacturing industry not included above (ISIC Divisions 22, 31 and 32). Aggregation/imputation: Sum of individual country values of the sector divided by the sum of individual country values of total final consumption. Missing data are not imputed. Data Source: IEA. Countries report to IEA through the OECD member site and the non-OECD government site. The IEA secretariat does not adjust the data. For final consumption, energy balance, primary energy supply and electricity data, IEA notes that energy statistics at the national level are often collected using criteria and definitions that differ, sometimes considerably, from those of international organizations. The IEA secretariat has identified such differences and, where possible, adjusted the data to meet international definitions. Data obtained: 5 March 2012 Final energy consumption: Residential use (% of total final energy consumption) Definition: Includes consumption by households and excludes fuels used for transport. It includes households with employed persons (ISIC Rev. 4 Division 97 and 98), a small part of total residential consumption. Aggregation/imputation: Sum of individual country values of the sector divided by the sum of individual country values of total final consumption. Missing data are not imputed. Data Source: IEA. Countries report to IEA through the OECD member site and the non-OECD government site. The IEA secretariat does not adjust the data. For final consumption, energy balance, primary energy supply and electricity data, IEA notes that energy statistics at the national level are often collected using criteria and definitions that differ, sometimes considerably, from those of international organizations. The IEA secretariat has identified such differences and, where possible, adjusted the data to meet international definitions. Data obtained: 5 March 2012 Glossary: Total Final Consumption (TFC) is the sum of consumption by the different end-use sectors. Backflows from the petrochemical industry are not included in final consumption.
Biodiversity Marine areas protected (% of territorial water) Definition: The overall surface of protected marine areas, as a percentage of territorial water, as adopted by the International Union for Conservation of Nature (IUCN). All areas of intertidal or subtidal terrain are covered, together with their overlying

Statistical Yearbook for Asia and the Pacific 2012
137
water and associated flora, fauna and historical and cultural features, that have been reserved by law or other effective means to protect part of or the entire enclosed environment. Only protected areas that are nationally designated are included in this indicator. Aggregation/imputation: Weighted averages using total territorial water area as weight. Missing data are imputed. Data Source: MDG Indicators Database. The data source is the World Database on Protected Areas (WDPA), the most comprehensive global dataset on marine and terrestrial protected areas available. WDPA is a joint product of UNEP and IUCN, prepared by UNEP-WCMC and the IUCN World Commission on Protected Areas working with governments, the secretariats of Multilateral Environmental Agreements and collaborating non-governmental organizations (NGOs). Data are reported by countries to WDPA. Quality control criteria are applied to ensure consistency and comparability of WDPA data. New data are validated at UNEP-WCMC through a number of tools and translated into the standard WDPA data structure. Discrepancies between WDPA data and new data are resolved in communication with data providers. Processed data is fully integrated into the published WDPA. Data obtained: 24 April 2012 Terrestrial areas protected (% of surface area) Definition: The terrestial areas protected refers to the total land area dedicated to the protection and maintenance of biological diversity, and of natural and associated cultural resources, and managed through legal or other effective means. Only protected areas that are nationally designated are included in this indicator. This indicator is expressed as a percentage of the surface area. Aggregation/imputation: Weighted averages using surface area as weight. Missing data are imputed. Data Source: MDG Indicators Database. The data source is the World Database on Protected Areas (WDPA), the most comprehensive global dataset on marine and terrestrial protected areas available. WDPA is a joint product of UNEP and IUCN, prepared by UNEP-WCMC and the IUCN World Commission on Protected Areas working with governments, the secretariats of Multilateral Environmental Agreements and collaborating non-governmental organizations (NGOs). Data are reported by countries to WDPA. Quality control criteria are applied to ensure consistency and comparability of WDPA data. New data are validated at UNEP-WCMC through a number of tools and translated into the standard WDPA data structure. Discrepancies between WDPA data and new data are resolved in communication with data providers. Processed data is fully integrated into the published WDPA. Data obtained: 24 April 2012 Forest area (% of land area) Definition: Total forest area as percentage of total land area. Aggregation/imputation: Weighted averages using total land area as weight. Missing data are not imputed. Data Source: FAO Global Forest Resources Assessment. Data are provided by countries to FAO in response to a common questionnaire. Data obtained: 07 January 2011
Natural disasters Natural disasters mortality (number per annum) Definition: The number of recorded deaths from natural disasters, expressed as number in a year or average number over period of years. Aggregation/imputation: Average of individual country values. Missing data are not imputed. Data Source: EM-DAT: Emergency Events Database. The database is based on various sources, including UN agencies, non-governmental organizations, insurance companies, research institutes and press agencies. Data obtained: 3 September 2012 People affected by natural disasters (millions per annum) Definition: Affected people are those requiring immediate assistance during an emergency including food, water, shelter, sanitation and immediate medical assistance. The definition includes cases of infectious disease introduced in a region or a population that is normally free from that disease, expressed as thousands in a year or average number in thousands over period of years. Aggregation/imputation: Average of individual country values. Missing data are not imputed. Data Source: EM-DAT: Emergency Events Database. The database is based on various sources, including UN agencies, non-governmental organizations, insurance companies, research institutes and press agencies. Data obtained: 3 September 2012 Economic damage from natural disasters (% of GDP) Definition: Economic consequences of a disaster, usually direct (e.g., damage to infrastructure, crops and housing) and indirect (e.g., loss of revenues, unemployment and market destabilization). In each case, the registered figure represents the value of damage at the moment of the event; i.e., the figures are true for the year of the event. Indicator calculations: Data are converted from millions of United States dollars to 2005 US dollars millions using Implicit Price deflators (NAMAD). The proportion of GDP is based on million United States dollar values from EM-DAT divided by GDP in current United States dollars. Aggregation/imputation: sum of the economic damage in million US dollars divided by the sum of GDP in million US dollars. Missing data are not imputed. Data Source: EM-DAT: Emergency Events Database. The database is based on various sources, including UN agencies, non-governmental organizations, insurance companies, research institutes and press agencies. Data obtained: 3 September 2012
Economic growth Gross domestic product in current prices (billion US dollars) Definition: The total market value of all final goods and services produced within the national borders in a given period of time, expressed in the prices of the current reporting period; also known as nominal GDP. Aggregation/imputation: Sum of individual country values. Missing data are not imputed. Data Source: NAMAD. Individual country data are collected from national statistical offices of countries by UNSD in the United Nations National Account Questionnaire (UN-NAQ); data on countries and years that are missing from UN-NAQ are estimated by UNSD. Data obtained: 16 January 2012

Statistical Yearbook for Asia and the Pacific 2012
138
Average annual GDP (2005 US dollars) growth rate (% change per annum) Definition: Average annual growth rates are calculated as percentage change per annum of GDP at constant 2005 United States dollars. Gross domestic product is the total market value of all final goods and services produced within the national borders in a given period of time. Aggregation/imputation: The annual average growth rates of the aggregate values of GDP at constant 2005 United States dollar prices (% change per annum) are calculated as percentage change per annum of the derived sum total of all country-level data within each aggregation. The rates of change from year to the next are calculated as proportional changes from the earlier period. The rate of change over several years of the aggregates are calculated using the geometric growth model. Missing data are imputed. Data Source: NAMAD. Individual country data are collected from national statistical offices of countries by UNSD in the United Nations National Account Questionnaire (UN-NAQ); data on countries and years that are missing from UN-NAQ are estimated by UNSD. Data obtained: 9 January 2012 GDP per capita (2005 PPP dollars per capita) Definition: GDP per capita is calculated as the aggregate of production (GDP) divided by the population size based on WPP2010 and is expressed in constant 2005 PPP dollars per capita. Aggregation/imputation: Weighted averages using total population as weight. Missing data are not imputed. Data Source: WDI. National accounts data are compiled by the World Bank using OECD national accounts. The World Bank makes some adjustments to the data. Data obtained: 24 January 2012 Glossary: Purchasing power parity (PPP) is an international dollar has the same purchasing power as the U.S. dollar has in the United States. Costs in local currency units are converted to international dollars using purchasing power parity (PPP) exchange rates. A PPP exchange rate is the number of units of a country's currency required to buy the same amounts of goods and services in the domestic market as U.S. dollar would buy in the United States. An international dollar is, therefore, a hypothetical currency that is used as a means of translating and comparing costs from one country to the other using a common reference point, the US dollar. Gross domestic investment rate in current prices (% of GDP) Definition: Gross domestic investment rate is the sum of gross fixed capital formation and changes in inventories divided by the total GDP, calculated on GDP in national currencies and expressed as a percentage of GDP. Aggregation/imputation: Weighted averages using GDP in current United States dollars as weight. Missing data are not imputed. Data Source: NAMAD. Individual country data are collected from national statistical offices of countries by UNSD in the United Nations National Account Questionnaire (UN-NAQ); data on countries and years that are missing from UN-NAQ are estimated by UNSD. Data obtained: 16 January 2012 Value added by sector: Agriculture (billion 2005 US dollars) Definition: Generation of gross value added by the ISIC industrial classification of economic activity. Agriculture includes agriculture, hunting, forestry and fishing. This is expressed in constant 2005 prices of the United States dollars. Aggregation/imputation: Sum of individual country values. Missing data are not imputed. Data Source: NAMAD. Individual country data are collected from national statistical offices of countries by UNSD -National Account Questionnaire (UN-NAQ); data on countries and years that are missing from UN-NAQ are estimated by UNSD. Data obtained: 9 January 2012 Value added by sector: Industry (billion 2005 US dollars) Definition: Generation of gross value added by the ISIC industrial classification of economic activity. Industry includes construction, mining, manufacturing and utilities. This is expressed in the constant 2005 prices of the United States dollars. Aggregation/imputation: Sum of individual country values. Missing data are not imputed. Data Source: NAMAD. Individual country data are collected from national statistical offices of countries by UNSD -National Account Questionnaire (UN-NAQ); data on countries and years that are missing from UN-NAQ are estimated by UNSD. Data obtained: 9 January 2012 Value added by sector: Services (billion 2005 US dollars) Definition: Generation of gross value added by the ISIC industrial classification of economic activity. Services include transport, storage and communication; wholesale, retail, restaurants, hotels and other types of enterprises. This is expressed in the constant 2005 prices of the United States dollars. Aggregation/imputation: Sum of individual country values. Missing data are not imputed. Data Source: NAMAD. Individual country data are collected from national statistical offices of countries by UNSD -National Account Questionnaire (UN-NAQ); data on countries and years that are missing from UN-NAQ are estimated by UNSD. Data obtained: 9 January 2012
Fiscal balance Government revenue (% of GDP) Definition: Total current and capital revenues received by the central Government. Aggregation/imputation: Weighted averages using GDP as weight. Missing data are not imputed. Data Source: Asian Development Bank, Key Indicators for Asia and the Pacific 2011 (Manila, 2011). Data on government expenditures and revenue are mostly taken from country sources. The coverage of budget data is not standard throughout the region. Data provided by many economies refer only to the central government, but in other economies cover provincial and local governments. Data obtained: 03 February 2012

Statistical Yearbook for Asia and the Pacific 2012
139
Government expenditure (% of GDP) Definition: The sum of current and capital expenditures of the central Government. Aggregation/imputation: Weighted averages using GDP as weight. Missing data are not imputed. Data Source: Asian Development Bank, Key Indicators for Asia and the Pacific 2011 (Manila, 2011). Data on government expenditures and revenue are mostly taken from country sources. The coverage of budget data is not standard throughout the region. Data provided by many economies refer only to the central government, but in other economies cover provincial and local governments. Data obtained: 03 February 2012.
Monetary measures Inflation rate (% per annum) Definition: The rate of increase of the level of prices during a given period. It is the percentage change in the consumer price index between two points in time. Aggregation/imputation: Weighted averages using the household consumption expenditure component of the GDP as weight. Missing data are not imputed. Data Source: International Monetary Fund (IMF), International Financial Statistics available from http://elibrary-data.imf.org/. Inflation: The data series are compiled from reported versions of national indices. Variation is wide between countries and over time in the selection of base years, depending upon the availability of comprehensive benchmark data that permit an adequate review of weighting patterns. The series are linked by using ratio splicing at the first annual overlap; the linked series are shifted to a common base period 2005=100. Data obtained: 12 June 2012. Exchange rate (% change per annum) Definition: The average annual rate of change in the exchange rate of the national currency against the United States dollar for the period indicated. A positive value means that the national currency has weakened; a negative value indicates a stronger national currency. Aggregation/imputation: No aggregates calculated. Data Source: IMF maintains a database of official exchange rates from countries. Rates are normally provided as currency units per United States dollar to the IMF by the issuing central bank. Rates are normally reported for members whose currencies are used in IMF financial transactions. Data obtained: 12 June 2012
Labour Employment-to-population ratio: total (% of population aged 15 and above) Definition: The proportion of the working-age of the total population that is employed. For most countries, the working-age population is defined as persons aged 15 and above, although that may vary slightly from country to country. Aggregation/imputation: ILO Employment Trends unit. Data Source: ILO, Key Indicators of the Labour Market (KILM), Seventh Edition (available from http://www.ilo.org/empelm/pubs/WCMS_114060/lang--en/index.htm). The ILO Employment Trends unit has designed and maintains three econometric models that are used in estimating labour market indicators of the countries and years for which no real data exist, disaggregated by sex and age. Information was derived from a variety of sources, including household or labour force surveys, official estimates and censuses provided by countries to the ILO. In a very few cases, information was derived from insurance records and establishment surveys. Data obtained: 16 July 2012 Employment-to-population ratio: male (% of males aged 15 and above) Definition: The proportion of the working-age male population that is employed. For most countries, the working-age population is defined as persons aged 15 and above, although that may vary slightly from country to country. Indicator calculations: Number of males employed divided by number of males aged 15 and above. Aggregation/imputation: ILO Employment Trends unit. Data Source: ILO, Key Indicators of the Labour Market (KILM), Seventh Edition (available from http://www.ilo.org/empelm/pubs/WCMS_114060/lang--en/index.htm). The ILO Employment Trends unit has designed and maintains three econometric models that are used in estimating labour market indicators of the countries and years for which no real data exist, disaggregated by sex and age. Information was derived from a variety of sources, including household or labour force surveys, official estimates and censuses provided by countries to the ILO. In a very few cases, information was derived from insurance records and establishment surveys. Data obtained: 16 July 2012. Employment-to-population ratio: female (% of females aged 15 and above) Definition: The proportion of the working-age female population that is employed. For most countries, the working-age population is defined as persons aged 15 and above, although that may vary slightly from country to country. Indicator calculations: Number of females employed divided by number of females aged 15 and above. Aggregation/imputation: ILO Employment Trends unit. Data Source: ILO, Key Indicators of the Labour Market (KILM), Seventh Edition (available from http://www.ilo.org/empelm/pubs/WCMS_114060/lang--en/index.htm). The ILO Employment Trends unit has designed and maintains three econometric models that are used in estimating labour market indicators of the countries and years for which no real data exist, disaggregated by sex and age. Information was derived from a variety of sources, including household or labour force surveys, official estimates and censuses provided by countries to the ILO. In a very few cases, information was derived from insurance records and establishment surveys. Data obtained: 16 July 2012. Unemployment rate, total (% of labour force) Definition: Persons of working age who, during the reference period, were without work, currently available for work and seeking work. National definitions and coverage of unemployment may vary. Aggregation/imputation: ILO Employment Trends unit. Data Source: ILO, Key Indicators of the Labour Market (KILM), Seventh Edition (available from

Statistical Yearbook for Asia and the Pacific 2012
140
http://www.ilo.org/empelm/pubs/WCMS_114060/lang--en/index.htm). The ILO Employment Trends unit has designed and maintains three econometric models that are used in estimating labour market indicators of the countries and years for which no real data exist, disaggregated by sex and age. Information was derived from a variety of sources, including household or labour force surveys, official estimates and censuses provided by countries to the ILO. In a very few cases, information was derived from insurance records and establishment surveys. Data obtained: 7 August 2012 Unemployment rate, females/males (% of female/male labour force) Definition: Females/males of working age who, during the reference period, were without work, currently available for work and seeking work. National definitions and coverage of unemployment may vary. Aggregation/imputation: ILO Employment Trends unit. Data Source: ILO, Key Indicators of the Labour Market (KILM), Seventh Edition (available from http://www.ilo.org/empelm/pubs/WCMS_114060/lang--en/index.htm). The ILO Employment Trends unit has designed and maintains three econometric models that are used in estimating labour market indicators of the countries and years for which no real data exist, disaggregated by sex and age. Information was derived from a variety of sources, including household or labour force surveys, official estimates and censuses provided by countries to the ILO. In a very few cases, information was derived from insurance records and establishment surveys. Data obtained: 7 August 2012. Youth unemployment rate, total, (% of labour force aged 15-24) Definition: Youth unemployment: The number of young persons aged 15-24 unemployed. Aggregation/imputation: ILO Employment Trends unit. Data Source: ILO, Key Indicators of the Labour Market (KILM), Seventh Edition (available from http://www.ilo.org/empelm/pubs/WCMS_114060/lang--en/index.htm). The ILO Employment Trends unit has designed and maintains three econometric models that are used in estimating labour market indicators of the countries and years for which no real data exist, disaggregated by sex and age. Information was derived from a variety of sources, including household or labour force surveys, official estimates and censuses provided by countries to the ILO. In a very few cases, information was derived from insurance records and establishment surveys. Data obtained: 8 August 2012 Agriculture employment (thousand people) Definition: Employment in agriculture, hunting, forestry and fishing. Aggregation/imputation: ILO Employment Trends unit. Data Source: ILO, Key Indicators of the Labour Market (KILM), Seventh Edition (available from http://www.ilo.org/empelm/pubs/WCMS_114060/lang--en/index.htm). The ILO Employment Trends unit has designed and maintains three econometric models that are used in estimating labour market indicators of the countries and years for which no real data exist, disaggregated by sex and age. Information was derived from a variety of sources, including household or labour force surveys, official estimates and censuses provided by countries to the ILO. In a very few cases, information was derived from insurance records and establishment surveys. Data obtained: 27 June 2012 Industry employment (thousand people) Definition: Employment in mining and quarrying, manufacturing, construction and public utilities (electricity, gas and water). Aggregation/imputation: ILO Employment Trends unit. Data Source: ILO, Key Indicators of the Labour Market (KILM), Seventh Edition (available from http://www.ilo.org/empelm/pubs/WCMS_114060/lang--en/index.htm). The ILO Employment Trends unit has designed and maintains three econometric models that are used in estimating labour market indicators of the countries and years for which no real data exist, disaggregated by sex and age. Information was derived from a variety of sources, including household or labour force surveys, official estimates and censuses provided by countries to the ILO. In a very few cases, information was derived from insurance records and establishment surveys. Data obtained: 27 June 2012 Services employment (thousand people) Definition: Employment in wholesale and retail trade, restaurants and hotels, transport, storage and communications, finance, insurance, real estate and business services, and community, social and personal services. Aggregation/imputation: ILO Employment Trends unit. Data Source: ILO, Key Indicators of the Labour Market (KILM), Seventh Edition (available from http://www.ilo.org/empelm/pubs/WCMS_114060/lang--en/index.htm). The ILO Employment Trends unit has designed and maintains three econometric models that are used in estimating labour market indicators of the countries and years for which no real data exist, disaggregated by sex and age. Information was derived from a variety of sources, including household or labour force surveys, official estimates and censuses provided by countries to the ILO. In a very few cases, information was derived from insurance records and establishment surveys. Data obtained: 27 June 2012
International relations Exports of merchandise (% of GDP) Definition: The sum of merchandise exports divided by the value of GDP. Aggregation/imputation: Weighted averages with GDP in current prices of the United States dollars. The GDP figures up to 2010 are sourced from UNSD National Accounts Main Aggregates Database. The 2011 figures are estimated by ESCAP using the GDP growth rate from World Development Indicators database: http://databank.worldbank.org/data/home.aspx. Missing data are not imputed. Data Source: World Trade Organization (WTO). Figures for total merchandise trade are largely derived from IMF, International Financial Statistics. WTO obtains data on merchandise trade by origin, destination and product from the Statistical Office of the European Communities (Eurostat) Comext database (data available from http://epp.eurostat.ec.europa.eu/newxtweb/mainxtnet.do); World Trade Atlas, the database of Global Trade Information Services, Inc. (accessible at http://www.gtis.com/english/GTIS_WTA.html); the United Nations Commodity Trade Statistics Database (COMTRADE; accessible at http://comtrade.un.org/db/); and other sources. Some inconsistencies are inevitable between sources in the aggregate export and import data of a particular country or territory, attributable to the use of different systems of recording
Statistical Yearbook for Asia and the Pacific 2012
141
trade, to the way in which IMF and UNSD have converted data expressed in national currencies into dollars, and to revisions which can be more readily incorporated in the IMF data. Data obtained: 8 August 2012. Imports of merchandise (% of GDP) Definition: The sum of merchandise imports divided by the value of GDP. Aggregation/imputation: Weighted averages with GDP in current prices of the United States dollars. The GDP figures up to 2010 are sourced from UNSD National Accounts Main Aggregates Database. The 2011 figures are estimated by ESCAP using the GDP growth rate from World Development Indicators database: http://databank.worldbank.org/data/home.aspx. Missing data are not imputed. Data Source: World Trade Organization (WTO). Figures for total merchandise trade are largely derived from IMF, International Financial Statistics. WTO obtains data on merchandise trade by origin, destination and product from the Statistical Office of the European Communities (Eurostat) Comext database (data available from http://epp.eurostat.ec.europa.eu/newxtweb/mainxtnet.do); World Trade Atlas, the database of Global Trade Information Services, Inc. (accessible at http://www.gtis.com/english/GTIS_WTA.html); the United Nations Commodity Trade Statistics Database (COMTRADE; accessible at http://comtrade.un.org/db/); and other sources. Some inconsistencies are inevitable between sources in the aggregate export and import data of a particular country or territory, attributable to the use of different systems of recording trade, to the way in which IMF and UNSD have converted data expressed in national currencies into dollars, and to revisions which can be more readily incorporated in the IMF data. Data obtained: 8 August 2012. Export of services (% of GDP) Definition: The sum of services exports divided by the value of GDP. Aggregation/imputation: Weighted averages with GDP in current prices of the United States dollars. The GDP figures up to 2010 are sourced from UNSD National Accounts Main Aggregates Database. The 2011 figures are estimated by ESCAP using the GDP growth rate from World Development Indicators database: http://databank.worldbank.org/data/home.aspx. Missing data are not imputed. Data Source: Data from World Trade Organization (WTO). Figures for imports and exports of services are mainly drawn from the IMF Balance of Payments Statistics. For economies that do not report to the IMF data are drawn from national sources. Estimations for missing data are mainly based on national statistics. Figures on imports and exports of services by origin and destination are also derived from national statistics. The GDP figures up to 2010 are sourced from UNSD National Accounts Main Aggregates Database. The 2011 figures are estimated by ESCAP using the GDP growth rate from World Development Indicators database: http://databank.worldbank.org/data/home.aspx. Data obtained: 8 August 2012. Import of services (% of GDP) Definition: The sum of services imports divided by the value of GDP. Aggregation/imputation: Weighted averages with GDP in current prices of the United States dollars. The GDP figures up to 2010 are sourced from UNSD National Accounts Main Aggregates Database. The 2011 figures are estimated by ESCAP using the GDP growth rate from World Development Indicators database: http://databank.worldbank.org/data/home.aspx. Missing data are not imputed. Data Source: Data from World Trade Organization (WTO). Figures for imports and exports of services are mainly drawn from the IMF Balance of Payments Statistics. For economies that do not report to the IMF data are drawn from national sources. Estimations for missing data are mainly based on national statistics. Figures on imports and exports of services by origin and destination are also derived from national statistics. The GDP figures up to 2010 are sourced from UNSD National Accounts Main Aggregates Database. The 2011 figures are estimated by ESCAP using the GDP growth rate from World Development Indicators database: http://databank.worldbank.org/data/home.aspx. Data obtained: 8 August 2012. FDI inflows (% of GDP) Definition: Capital provided (directly or through other related enterprises) by a foreign direct investor to an enterprise, or capital received by a foreign direct investor from an enterprise. FDI inflows comprise capital provided (directly or through other related enterprises) by a foreign direct investor to an enterprise in the reporting economy. Indicator calculations: Percentage of GDP figures are based on GDP in current United States dollars. Aggregation/imputation: Weighted averages using total GDP in United States dollars as weight. Missing data are not imputed. Data Source: United Nations Conference on Trade and Development (UNCTAD), FDI Statistics (online database, accessible at http://unctadstat.unctad.org/ReportFolders/reportFolders.aspx). UNCTAD collects data through national compilers (such as central banks, various ministries and statistical offices). Data sources of FDI are complemented by corporate reports and information from the press. In the absence of primary sources, UNCTAD uses data from regional and international organizations or research institutions. Data are continually updated, depending on availability and resources. Data obtained: 24 July 2012. FDI outflows (% of GDP) Definition: Capital provided (directly or through other related enterprises) by a foreign direct investor to an enterprise, or capital received by a foreign direct investor from an enterprise. FDI outflows are capital received by a foreign direct investor from entities resident in the reporting economy. Indicator calculations: Percentage of GDP figures are based on GDP in current United States dollars. Aggregation/imputation: Weighted averages using total GDP in United States dollars as weight. Missing data are not imputed. Data Source: United Nations Conference on Trade and Development (UNCTAD), FDI Statistics (online database, accessible at http://unctadstat.unctad.org/ReportFolders/reportFolders.aspx). UNCTAD collects data through national compilers (such as central banks, various ministries and statistical offices). Data sources of FDI are complemented by corporate reports and information from the press. In the absence of primary sources, UNCTAD uses data from regional and international organizations or research institutions. Data are continually updated, depending on availability and resources. Data obtained: 24 July 2012.

Statistical Yearbook for Asia and the Pacific 2012
142
Glossary: Foreign direct investment (FDI) includes the three components of equity capital, reinvested earnings and intra-company loans. (1) Equity capital is the foreign direct investor’s purchase of shares of an enterprise in a country other than that of its residence. (2) Reinvested earnings comprise the direct investor’s share (in proportion to direct equity participation) of earnings not distributed as dividends by affiliates or earnings not remitted to the direct investor. Such retained profits by affiliates are reinvested. (3) Intra-company loans or intra-company debt transactions refer to short- or long-term borrowing and lending of funds between direct investors (parent enterprises) and affiliate enterprises. Ownership or control of less than 10% of a business is not considered to be FDI.
ODA received (% of GDP) Definition: The amount of official development assistance (ODA) received in grants and loans during the reporting period, expressed as a percentage of GDP. Indicator calculations: Percentage of GDP figures are based on GDP in current United States dollars. Aggregation/imputation: Weighted average using GDP in United States dollars as weight. Data Source: OECD, Development Database on Aid from DAC Members (online database accessible at www.oecd.org/document/33/0,2340,en_2649_34447_36661793_1_1_1_1,00.html). The Development Assistance Committee (DAC) publishes statistics and reports on aid and other resource flows to developing countries, based principally on reporting by DAC members, multilateral organizations and other donors. Data obtained: 13 January 2012 Workers remittances received (% of GDP) Definition: Comprise current transfers by migrants who are employed in their host countries and considered residents there (i.e. who have stayed or are expected to stay for one year or longer). Indicator calculations: Percentage of GDP figures are based on GDP in current United States dollars. Aggregation/imputation: Weighted average using GDP in United States dollars as weight. Data Source: IMF, Balance of Payments Statistics (CD-ROM May 2012) . IMF balance of payments data are presented in accordance with the standard components of the fifth edition of the Balance of Payments Manual (BPM5; available at www.imf.org/external/pubs/ft/bopman/bopman.pdf). IMF data conversion work has made possible the presentation in the BPM5 format of both historical data and more recent statistics reported by member countries. All balance of payments data are expressed in United States dollars. The database includes IMF country reports with data in national currencies or SDRs in addition to the dollar equivalents . IMF provides estimates in place of missing data. The estimation procedure relies largely on the World Economic Outlook Database. Data obtained: 24 August 2012. Net external debt (% of GDP) Definition: The outstanding net amount of those current, and not contingent, liabilities owed to non-residents by residents of an economy that require payments either of principal and/or interest by the debtor at some point in the future. Residents comprise the general government, individuals, private non-profit bodies and enterprises. Indicator calculations: Percentage of GDP figures are based on GDP in current United States dollars. Aggregation/imputation: Weighted averages using GDP in United States dollars as weight. Missing data are not imputed. Data Source: The World Bank, World Development Indicator. The World Bank compiles country-level debt data. Data obtained: 17 August 2012. Intraregional export share (percentage) Definition: The proportion of merchandise exports destined to the Asia-Pacific region in the total merchandise exports (percentage). The values of the index can range from 0 to 100%. Aggregation/imputation: The share of exports divided by the sum of total exports. Missing data are imputed. Data Source: Comtrade. UNSD receives reports of individual country values from countries and makes no adjustments. Data obtained: 28 August 2012 Intraregional import share (percentage) Definition: The proportion of merchandise imports sourced from the Asia-Pacific region in total merchandise imports (percentage). The values of the index can range from 0 to 100%. Aggregation/imputation: The share of imports divided by the sum of total imports. Missing data are imputed. Data Source: Comtrade. UNSD receives reports of individual country values from countries and makes no adjustments. Data obtained: 28 August 2012
Connectivity Fixed telephone subscriptions (per 100 population) Definition: It refers to the sum of active number of analogue fixed-telephone lines, voice-over-IP (VoIP) subscriptions, fixed wireless local loop (WLL) subscriptions, ISDN voice-channel equivalents and fixed public payphones. It refers to all accesses over fixed infrastructure that provide voice telephony, including telephone lines using copper wire and voice services using IP delivered over fixed (wired)-broadband infrastructure, for example digital subscriber line (DSL), fibre optic and coaxial cable television networks (cable modem). It also includes fixed WLL connections, which are defined as services provided by licensed fixed-line telephone operators that provide last-mile access to the subscriber using radio technology (the call being subsequently routed over a fixed-line telephone network and not a mobile-cellular network). It includes both postpaid and prepaid subscriptions. If prepaid, the fixed-telephone subscription should be active, i.e. used at least once in the last three months. It should include data from all licensed fixed-telephone line providers. In the case of VoIP, it should include all operators that have been licensed to provide IP telephony, provided that the service includes a subscriber telephone number, allows the ability to place and receive calls at any time and does not require a computer. Both residential and business subscriptions should be included. Fixed telephone subscriptions per 100 population is calculated by dividing the number of fixed telephone lines by the population and multiplying by 100. Aggregation/imputation: Weighted averages using total population as weight. Missing data are not imputed. Data Source: International Telecommunication Union (ITU),
Statistical Yearbook for Asia and the Pacific 2012
143
World Telecommunication/ICT Indicators Database. ITU collects individual country values from an annual questionnaire sent to government telecommunications/ICT agencies and provides estimates of data on countries and years that are missing from the survey. Data obtained: 20 July 2012 Mobile cellular subscriptions (per 100 population) Definition: It refers to the number of subscriptions to a public mobile-telephone service that provide access to the PSTN using cellular technology. The indicator includes (and is split into) the number of postpaid subscriptions, and the number of active prepaid accounts (i.e. that have been used during the last three months). The indicator applies to all mobile-cellular subscriptions that offer voice communications. It excludes subscriptions via data cards or USB modems, subscriptions to public mobile data services, private trunked mobile radio, telepoint, radio paging and telemetry services. Mobile cellular subscriptions per 100 population is calculated by dividing the number of fixed telephone lines by the population and multiplying by 100. Aggregation/imputation: Weighted averages using total population as weight. Missing data are not imputed. Data Source: International Telecommunication Union (ITU), World Telecommunication/ICT Indicators Database. ITU collects individual country values from an annual questionnaire sent to government telecommunications/ICT agencies and provides estimates of data on countries and years that are missing from the survey. Data obtained: 20 July 2012 Internet users (per 100 population) Definition: The estimated number of Internet users of the total population, including those using the Internet from any device (e.g., mobile phones) during the preceding 12 months. Internet users per 100 population is calculated by dividing the number of fixed telephone lines by the population and multiplying by 100. Aggregation/imputation: Weighted averages using total population as weight. Missing data are not imputed. Data Source: International Telecommunication Union (ITU), World Telecommunication/ICT Indicators Database. ITU collects individual country values from an annual questionnaire sent to government telecommunications/ICT agencies and provides estimates of data on countries and years that are missing from the survey. Data obtained: 20 July 2012 Fixed broadband internet subscribers (per 100 population) Definition: It refers to subscriptions to high-speed access to the public Internet (a TCP/IP connection), at downstream speeds equal to, or greater than, 256 kbit/s. This includes cable modem, DSL, fibre-to-the-home/building and other fixed (wired)-broadband subscriptions. This total is measured irrespective of the method of payment. It excludes subscriptions that have access to data communications (including the Internet) via mobile-cellular networks and technologies listed under the wireless-broadband category. Fixed (wired)-broadband subscribers per 100 population is calculated by dividing the number of fixed telephone lines by the population and multiplying by 100. Aggregation/imputation: Weighted averages using total population as weight. Missing data are not imputed. Data Source: International Telecommunication Union (ITU), World Telecommunication/ICT Indicators Database. ITU collects individual country values from an annual questionnaire sent to government telecommunications/ICT agencies and provides estimates of data on countries and years that are missing from the survey. Data obtained: 20 July 2012 Railway density (km of railway per 1,000 km2 land area) Definition: The length of rail lines divided by the land area expressed in 1,000 kilometres. Rail lines are the length of railway route available for train service measured in kilometres, irrespective of the number of parallel tracks. Total road network divided by the land area. Aggregation/imputation: Weighted averages using land area as weight. Missing data are imputed. Data Source: WDI. Railway data come from the International Union of Railways (www.uic.org/). Road and passenger car data come from the International Road Federation, World Road Statistics (accessible at www.irfnet.org/statistics.php) and data files. Data obtained: 7 August 2012 Road density (km of road per 1,000 km2 land area) Definition: Total road network includes motorways, highways, main or national roads, secondary or regional roads, and all other roads measured in kilometres in a country. Total road network divided by the land area. Aggregation/imputation: Weighted averages using land area as weight. Missing data are imputed. Data Source: WDI. Road and passenger car data come from the International Road Federation, World Road Statistics (accessible at www.irfnet.org/statistics.php) and data files. Data obtained: 7 August2012 Paved roads (% of roads) Definition: The share of roads surfaced with crushed stone (macadam) and hydrocarbon binder or bituminized agents, concrete or cobblestones, expressed as a percentage of the length of all roads. Total paved roads divided by the total road network. Aggregation/imputation: No aggregates calculated. Data Source: WDI. Road and passenger car data come from the International Road Federation, World Road Statistics (accessible at www.irfnet.org/statistics.php) and data files. Data obtained: 7 August 2012 Passenger cars (per 1,000 population) Definition: Road motor vehicles designed for the conveyance of passengers and seating not more than nine persons, including the driver. Taxies, jeep-type vehicles and station wagons are included. Special-purpose vehicles, such as two- or three-wheeled cycles or motorcycles, trams, trolley-buses, ambulances, hearses and military vehicles operated by police or other governmental security organizations, are excluded. Indicator calculations: Per 1,000 population figures are based on population figures (WPP2010). Aggregation/imputation: Weighted averages using total population as weight. Missing data are imputed. Data Source: WDI. Road and passenger car data come from the International Road Federation, World Road Statistics (accessible at www.irfnet.org/statistics.php) and data files. Data obtained: 7 August 2012 Road traffic deaths (per 100,000 population)

Statistical Yearbook for Asia and the Pacific 2012
144
Definition: Deaths caused by traffic accidents during a given period: Per 100,000 population figures are based on population figures (WPP2010). Aggregation/imputation: Weighted averages using total population as weight. Missing data are not imputed. Data Source: WHO, Global Status Report on Road Safety: Time for Action (Geneva, 2009; available from http://whqlibdoc.who.int/publications/2009/9789241563840_eng.pdf). The report is the first broad assessment of road safety in 178 countries, using data drawn from a standardized survey Data obtained: 13 October 2009 Transport sector CO2 emissions (tons per capita) Definition: Represents the values of CO2 emissions from fossil fuel combustion by the transport sector. Emissions are expressed in million tons of CO2 and calculated by OECD using IEA energy databases and the default methods and emissions factors from the Revised 1996 Guidelines for National Greenhouse Gas Inventories of the Intergovernmental Panel on Climate Change (IPCC). International and domestic aviation includes emissions from aviation fuels delivered to aircraft for international aviation bunker and domestic aviation: commercial, private and agricultural, among others. It includes use for purposes other than flying; e.g., bench testing of engines, but not airline use of fuel for road transport. Regarding roads, it covers the emissions arising from fuel use in road vehicles, including the use of agricultural vehicles on highways. Regarding rail transport, it covers emission from rail traffic, including industrial railways. Aggregation/imputation: Sum of individual country values. Missing data are not imputed. Data Source: IEA. Courtries report to IEA through the OECD member site and non-OECD government site. The IEA secretariat does not adjust the data. Data obtained: 28 February 2012 Inbound tourism expenditure (% of GDP) Definition: The tourism expenditure of a non-resident visitor within the economy of reference. Percentage of GDP is based on GDP in current United States dollars. Aggregation/imputation: Weighted average using GDP in current United States dollars as weight. Missing data are not imputed. Data Source: UNWTO. Data come from country sources or IMF. Data obtained: 28 September 2012 Outbound tourism expenditure (% of GDP) Definition: The tourism expenditure of a resident visitor outside the economy of reference. Percentage of GDP is based on GDP in current United States dollars. Aggregation/imputation: Weighted average using GDP in current United States dollars as weight. Missing data are not imputed. Data Source: UNWTO. Data come from country sources or IMF. Data obtained: 28 September 2012
Statistical Yearbook for Asia and the Pacific 2012
145
Statistical Methods The methods of compiling data and metadata for this Yearbook, and of calculating the indicators and data aggregates, are described in the following sections.
Compilation of data and metadata
The Yearbook presents data of 58 regional ESCAP member countries compiled from United Nations agencies and other international sources. World, regional, subregional and economic aggregates are also presented, most of which are calculated by ESCAP. The regional ESCAP member countries include members and associate members of ESCAP that are geographically located in the Asia-Pacific region. The Yearbook contains data for selected years. Data for all available years may be accessed from the online database at http://www.unescap.org/stat/data/. Country-level data have been collected from international sources of official statistics. For each indicator, the definition and source of data, along with other metadata, is given in the technical notes section of the Yearbook. To collect the most recent available data for each indicator, ESCAP researches online and print publications, consults experts on specific indicators and monitors the release dates of international reports and databases. The Yearbook aims to present the most recent, internationally comparable data available as of 25 October 2012. In order to maximize comparability, high quality, internationally comparable data sources have been used. Nonetheless, differences in statistical methods may still exist across countries; and, while aiming for international comparability, ESCAP statisticians do not have specialised expertise in all the areas covered in the Yearbook and thus cannot ensure full comparability. The status of each data point, which specifies whether the original data source is (a) a country or (b) an international agency, is available in the online database. On the basis of the country-level data, ESCAP calculates:
Additional indicators (growth rates, periods averages or data relative to the population, land area, economy, etc.);1 and
Aggregates for the world, regions and subregions, and economic groupings of countries.2
Calculation of indicators
The technical notes indicate whether the indicator was calculated by ESCAP or obtained from another international agency. The following types of calculations were performed in deriving indicator values. They are listed here in the order in which they are typically performed:
imputation of land area; growth rates; ratios (such as per capita figures); percentages (such as percentage of GDP); constant price values using implicit price deflators; and period averages (such as five year averages).
Imputation of land area
A number of environment indicators are expressed as a percentage of total land area. To permit calculation and comparison of such indicators across countries and years, ESCAP completes the information for years where the source – the FAO land area database – does not contain a value. Land area is imputed using the value from the previous or following year. The margin of error is small because the land area of a country normally remains constant. If there is evidence that country borders
1 The following section on calculation of indicators describes the methodology in full. 2 Not all aggregates are calculated by ESCAP; the following section on aggregation methods provides full details on aggregation methods.
Statistical Yearbook for Asia and the Pacific 2012
146
have changed, the imputation is not completed. Calculations involving imputed land area are included in this Yearbook, although land areas themselves are only published online.
Ratios and percentages
Ratios are only displayed if data for the numerator is non-missing; and data for the denominator is non-missing and non-zero. Gender parity ratios, per capita figures and mortality rates are a few examples of ratios calculated by ESCAP. Indicators expressed as percentages (such as percentage of GDP, land area or population) are calculated following the same methodology as ratios. For the present Yearbook, per capita figures were calculated using the United Nations population database World Population Prospects: The 2010 Revision (WPP2010) and GDP figures were calculated using the United Nations Statistical Division National Accounts Main Aggregates Database (NAMAD).
Growth rates
Growth rates are presented as percentage change per annum. Where annual data are measured in absolute terms, the rates of change from one year to the next are calculated as proportional changes from the earlier period. Rates of change over several years are calculated using the geometric growth model. The geometric growth rate uses discrete compounding. Where the underlying data are measured in levels, the formula for the average annual percentage change in indicator P over n periods is r = [(Pn /P1)
1/n – 1] • 100.
Constant price values using implicit price deflators
Implicit price deflators with a 2005 base, from NAMAD, are used in converting current price data to constant 2005 prices, as follows:
Where is the 2005 constant price value for year t; Ct is the current price value for year t; and
It 2005 is the 2005 implicit price deflator for year t.
Country names and groupings
“Asia and the Pacific” in this Yearbook refers to the 58 regional members and associate members of the Economic and Social Commission for Asia and the Pacific. The 58 regional members and associate members are referred to as “countries” throughout the Yearbook even though some territories which are not countries are included. Some countries referred to by a shortened version of their official name in tables and charts, as indicated in brackets in the listing below.
Asia-Pacific subregions
By geographic subregion, the countries and areas of Asia and the Pacific are: East and North-East Asia (ENEA): China; Democratic People’s Republic of Korea (DPR Korea); Hong Kong, China; Japan; Macao, China; Mongolia; Republic of Korea.

Statistical Yearbook for Asia and the Pacific 2012
147
South-East Asia (SEA): Brunei Darussalam; Cambodia; Indonesia; Lao People’s Democratic Republic (Lao PDR); Malaysia; Myanmar; the Philippines; Singapore; Thailand; Timor-Leste; Viet Nam.
South and South-West Asia (SSWA): Afghanistan; Bangladesh; Bhutan; India; the Islamic Republic
of Iran; Maldives; Nepal; Pakistan; Sri Lanka; Turkey.
North and Central Asia (NCA): Armenia; Azerbaijan; Georgia; Kazakhstan; Kyrgyzstan; the
Russian Federation; Tajikistan; Turkmenistan; Uzbekistan.
Pacific: American Samoa; Australia; Cook Islands; Fiji; French Polynesia; Guam; Kiribati; Marshall Islands; Micronesia, Federated States of (Micronesia (F.S.)); Nauru; New Caledonia; New Zealand; Niue; Northern Mariana Islands (Northern Mariana Is.); Palau; Papua New Guinea; Samoa; Solomon Islands; Tonga; Tuvalu; Vanuatu.
Economic groupings
The classification of countries into income groups is from the World Bank. The World Bank divides countries according to their 2009 gross national income (GNI) per capita, calculated using the World Bank Atlas method. Group classifications are: low income ($995 or less); lower-middle income ($996-3,945); upper-middle income ($3,946-12,195); and high income ($12,196 or more). Low-income countries: Afghanistan; Bangladesh; Cambodia; Democratic People’s Republic of Korea; Kyrgyzstan; Lao People’s Democratic Republic; Myanmar; Nepal; Solomon Islands; Tajikistan. Lower middle-income countries: Armenia; Bhutan; China; Georgia; India; Indonesia; Kiribati; Maldives; Marshall Islands; Micronesia (Federated States of); Mongolia; Pakistan; Papua New Guinea; the Philippines; Samoa; Sri Lanka; Thailand; Timor-Leste; Tonga; Uzbekistan; Vanuatu; Viet Nam. Upper middle-income countries: American Samoa; Azerbaijan; Fiji; the Islamic Republic of Iran; Kazakhstan; Malaysia; Palau; the Russian Federation; Turkey. Turkmenistan; Tuvalu; High-income countries: Australia; Brunei Darussalam; French Polynesia; Guam; Hong Kong, China; Japan; Macao, China; New Caledonia; New Zealand; Northern Mariana Islands; Republic of Korea; Singapore.
Other Asia-Pacific groupings
Within Asia and the Pacific, the following groupings are also used: Landlocked developing countries: (LLDC): Afghanistan; Armenia; Azerbaijan; Bhutan; Kazakhstan; Kyrgyzstan; Lao People’s Democratic Republic; Mongolia; Nepal; Tajikistan; Turkmenistan; Uzbekistan. Least developed countries (LDC): Afghanistan; Bangladesh; Bhutan; Cambodia; Kiribati; Lao People’s Democratic Republic; Maldives; Myanmar; Nepal; Samoa; Solomon Islands; Timor-Leste; Tuvalu; Vanuatu. Pacific island developing economies (PIDE): American Samoa; Cook Islands; Fiji; French Polynesia; Guam; Kiribati; Marshall Islands; Micronesia (Federated States of); Nauru; New Caledonia; Niue; Northern Mariana Islands; Palau; Papua New Guinea; Samoa; Solomon Islands; Tonga; Tuvalu; Vanuatu.

Statistical Yearbook for Asia and the Pacific 2012
148
Association of Southeast Asian Nations (ASEAN): Brunei Darussalam; Cambodia; Indonesia; Lao People’s Democratic Republic; Malaysia; Myanmar; the Philippines; Singapore; Thailand; Viet Nam. Economic Cooperation Organization (ECO): Afghanistan; Azerbaijan; the Islamic Republic of Iran; Kazakhstan; Kyrgyzstan; Pakistan; Tajikistan; Turkey; Turkmenistan; Uzbekistan. South Asian Association for Regional Cooperation (SAARC): Afghanistan; Bangladesh; Bhutan; India; Maldives; Nepal; Pakistan; Sri Lanka. Central Asia (C Asia): Armenia; Azerbaijan; Georgia; Kazakhstan; Kyrgyzstan; Tajikistan; Turkmenistan; Uzbekistan.
Regions of the world
For comparative purposes, aggregates are also presented for the world’s major regions, as follows: Africa: Algeria; Angola; Benin; Botswana; Burkina Faso; Burundi; Cameroon; Cape Verde; Central African; Republic; Chad; Comoros; Congo; Côte d’Ivoire; Democratic Republic of the Congo; Djibouti; Egypt; Equatorial Guinea; Eritrea; Ethiopia; Gabon; Gambia; Ghana; Guinea; Guinea-Bissau; Kenya; Lesotho; Liberia; Libyan Arab Jamahiriya; Madagascar; Malawi; Mali; Mauritania; Mauritius; Mayotte (France); Morocco; Mozambique; Namibia; Niger; Nigeria; Réunion (France); Rwanda; Saint Helena; São Tomé and Príncipe; Senegal; Seychelles; Sierra Leone; Somalia; South Africa; South Sudan; Sudan; Swaziland; Tanzania (United Republic of ); Togo; Tunisia; Uganda; Western Sahara; Zambia; Zimbabwe. Asia-Pacific region: As described above Latin America and Caribbean (LAC): Anguilla; Antigua and Barbuda; Argentina; Aruba; Bahamas; Barbados; Belize; Bolivia; Brazil; British Virgin Islands; Cayman Islands; Chile; Colombia; Costa Rica; Cuba; Dominica; Dominican Republic; Ecuador; El Salvador; Falkland Islands (Malvinas); French Guiana; Grenada; Guadeloupe; Guatemala; Guyana; Haiti; Honduras; Jamaica; Martinique; Mexico; Montserrat; Netherlands Antilles; Nicaragua; Panama; Paraguay; Peru; Puerto Rico; Saint Kitts and Nevis; Saint Lucia; Saint Vincent and the Grenadines; Suriname; Trinidad and Tobago; Turks and Caicos Islands; United States Virgin Islands; Uruguay; Venezuela (Bolivarian Republic of ). North America (N Am): Bermuda; Canada; Greenland; Saint Pierre and Miquelon; United States. Europe: Albania; Andorra; Ascension; Austria; Belarus; Belgium; Bosnia and Herzegovina; Bulgaria; Channel Islands; Croatia; Cyprus; Czech Republic; Denmark; Estonia; Faeroe Islands; Finland; France; Germany; Gibraltar; Greece; Guernsey; Holy See; Hungary; Iceland; Ireland; Isle of Man; Italy; Jersey; Kosovo; Latvia; Liechtenstein; Lithuania; Luxembourg; Malta; Monaco; Montenegro; Netherlands; Norway; Poland; Portugal; Republic of Moldova; Romania; San Marino; Serbia; Slovakia; Slovenia; Spain; Svalbard and Jan Mayen Islands; Sweden; Switzerland; [the former] Yugoslav Republic of Macedonia; Ukraine; United Kingdom of Great Britain and Northern Ireland. Other countries or areas: Bahrain; Iraq; Israel; Jordan; Kuwait; Lebanon; Norfolk Island; Occupied Palestinian Territories; Oman; Pitcairn; Qatar; Saudi Arabia; Syrian Arab Republic; Taiwan Province of China; Tokelau; United Arab Emirates; Wallis and Futuna Islands; Yemen.
Aggregation methods
Aggregate values are presented for subregional, regional, special economic and world groupings (as per the groupings above). World aggregates are taken directly from the data source when available. Subregional, regional, and economic groupings are calculated using ESCAP country groupings to ensure consistency throughout the Yearbook.

Statistical Yearbook for Asia and the Pacific 2012
149
Some aggregates have been calculated by agencies responsible for the compilation and production of indicators under their area of expertise. These include some education indicators (aggregates calculated by UIS/UNESCO), some employment indicators (aggregates calculated by ILO), and all tourism indicators (aggregates calculated by UNWTO). In such cases, the methodology may differ from the methods described below, additional information can be obtained from the respective agencies. When aggregates are not calculated by ESCAP, the source is indicated in the technical notes. The calculation of aggregates involves three steps: (1) determining whether “enough” data are available (at least two thirds of the population for social indicators, and at least two thirds of GDP for economic indicators); (2) imputing missing values (not employed for all indicators); and (3) calculating the aggregate sum or weighted average. For Millennium Development Goals (MDG) indicators, in addition to aggregate values, the aggregate affected populations are also calculated following the methodology described in the Asia-Pacific MDG Report 2011/12 (http:// www.unescap.org/stat/statpub/mdg-progressclassification).
1: Determining whether “enough” data are available: the “two-thirds test”
To ensure that aggregates are representative, an aggregate is only calculated for a given year if the population (for social indicators) or the GDP (for economic indicators) of countries with available values for that year covers more than two thirds of the total population or GDP of the group of countries under consideration. As population data (including 2010 data) and GDP data (up to 2009) are available for all United Nations member states, the test for two thirds of the total population or GDP can be applied to all indicators in the Yearbook. For data not expected to be available for every country (such as official development assistance [ODA], which is only received by specific developing countries), a slight modification of the above methodology is used. The two-thirds test is applied to the group of countries for which data are expected to be non-missing (such as recurrent ODA recipients).
2: Imputing missing values
If an indicator has passed the two-thirds test, but values are missing for some countries, then the missing country data may be imputed to present a more realistic aggregate (the technical notes specifies if missing values are imputed or not). Imputed values are only used in the calculation of aggregates; they are not published online or in print (with the exception of land area). Two methodologies are applied for imputations: one for MDG indicators, and another for non-MDG indicators, as described below.
2a: Imputation methods: MDG indicators
For MDG indicators, missing values are imputed on the basis of the trend; however, if progress is negative, the latest available value is carried forward for future values. For a full description of the methods, see the Asia-Pacific MDG Report 2011/12 (http://www.unescap.org/stat/statpub/mdg-progress-classification).
2b: Imputation methods: non-MDG indicators
For non-MDG indicators, missing country values are imputed using the following methodology
(1) If values are available for both a preceding and a following year, missing values are imputed using linear interpolation
(2) If a preceding value is available but not a following value, the most recent year of data is carried forward.
(3) If a following value is available but not a preceding value, the most recent year of data is carried backward.

Statistical Yearbook for Asia and the Pacific 2012
150
(4) For countries with only one data point for the whole period, that value is used for all missing years.
(5) If no data exist for any year for a country, no value is imputed. (Information from other countries is never used in imputing missing values.)
3: Calculating aggregate sums and weighted averages
Two types of aggregates are used in the Yearbook: straight sums and weighted averages. For calculated indicators, aggregates are based on the original indicator (as opposed to calculating the aggregate based on other aggregates). If the aggregate is a sum, then the aggregate data are derived by finding the sum total of all country-level data within each aggregation group. If the aggregate is a weighted average, then the aggregate data are derived by finding the weighted average of all data within each aggregation group. Weights have been determined by ESCAP for each indicator and are included in the technical notes. The weights are not imputed; if the weight is missing, then the country-level data for that country are not included. For ratios, denominators are used as weights.