strategic planning for agriculture and fisheries statistics in the...
TRANSCRIPT
Page 1 of 38 – October 2015 Summary Report: Workshop for Agriculture and Fisheries Statistics
Strategic Planning for Agriculture and Fisheries Statistics in the Pacific Island Countries Workshop Summary Report 5-8 October 2015 Nadi, Fiji
The workshop was supported by: The European Union (EU) supported Pacific Agriculture Policy Project (PAPP) which is implemented by the Secretariat of the Pacific Community (SPC), in partnership with the Food and Agriculture Organization (FAO) of the United Nations (UN), through its Global Strategy to Improve Agricultural and Rural Statistics (GSARS).
Workshop Summary Report
October 2015
Page 2 of 38 – October 2015 Summary Report: Workshop for Agriculture and Fisheries Statistics
Contents
1.0 INTRODUCTION ............................................................................................................................ 3
1.1 Event Summary ......................................................................................................................... 3 1.2 Official Opening ........................................................................................................................ 4 1.3 Background ............................................................................................................................... 4
2.0 CONCLUSIONS AND ACTIONS ....................................................................................................... 7
2.1 Conclusions and Actions ........................................................................................................... 7
3.0 PACIFIC PLAN FOR AGRICULTURE AND FISHERIES STATISTICS ...................................................... 8
3.1 Introduction .............................................................................................................................. 8 3.2 Background ............................................................................................................................... 8 3.3 Rationale ................................................................................................................................... 9 3.4 Outcomes of discussions on a new regional strategic plan ...................................................... 9 3.4.1 Gaps, constraints and challenges for agriculture, fisheries and rural data in each country 10 3.4.2 Objectives ............................................................................................................................ 10 3.4.3 Activities ............................................................................................................................... 11 3.4.4 Next steps ............................................................................................................................ 12
4.0 DISCUSSIONS BY THEMATIC AREAS ............................................................................................ 14
4.1 Statistics play a fundamental role in evidence-based policy making and development decisions ....................................................................................................................................... 14 4.2 Increasing the use of statistics through improved communication of their meaning, availability and usefulness to potential users ............................................................................... 14 4.3 Importance of building on and complementing existing national and regional approaches including the Global Strategy ........................................................................................................ 15 4.4 Harmonised and standardised statistics including the sharing of tools, templates and technology .................................................................................................................................... 15 4.5 Capacity development ............................................................................................................ 16 4.6 Challenges and sharing knowledge of data collection in the Pacific ....................................... 16
5.0 SUMMARY OF PRESENTATIONS ................................................................................................. 17
5.1 Workshop – Day One .............................................................................................................. 17 5.2 Workshop – Day Two .............................................................................................................. 22 5.3 Workshop – Day Three ............................................................................................................ 27 5.4 Workshop Group Activity - Day Three and Day Four .............................................................. 31
6.0 APPENDICES ............................................................................................................................... 32
6.1 Agenda .................................................................................................................................... 33 6.2 Participant List ........................................................................................................................ 36 6.3 Complete Presentations .......................................................................................................... 37 6.4 Group Discussions – New Strategy Challenges and Constraints ............................................. 38
Page 3 of 38 – October 2015 Summary Report: Workshop for Agriculture and Fisheries Statistics
1.0 INTRODUCTION
1.1 Event Summary
About 50 planners, statisticians and policy makers from 14 Pacific Island countries gathered for the Strategic Planning for Agriculture and Fisheries Statistics for Pacific Island Countries workshop in Nadi, Fiji, from 5-8 October 2015, to discuss ways to improve the collection and use of agricultural and fisheries statistics in the Pacific. Evidence-based policymaking requires effective, reliable statistics which are accessible to policy makers and other stakeholders, to ensure informed decisions on national development priorities particularly those relating to food security, sustainable livelihoods and economic development in the Pacific. The workshop provided a forum for sharing methodologies and innovations from the Global Strategy to Improve Agricultural and Rural Statistics (GS), plus other national and regional strategies relating to the Pacific region. Workshop participants also agreed on the establishment, and nominated members, of a new Technical Working Group (TWG) for the development of the proposed Pacific Strategic Plan on Agricultural and Fishery Statistics (PSPAFs). Activities extended into the following week with the Pacific Agriculture and Forestry Policy Network (PAFPNet) hosting an online discussion about ‘Agricultural Statistics for evidence based policy making in the Pacific’. The regional event was jointly organised by the European Union supported Pacific Agriculture Policy Project (PAPP), which is implemented by the Secretariat of the Pacific Community (SPC), and the Food and Agriculture Organization (FAO) of the United Nations (UN), through its Global Strategy to Improve Agricultural and Rural Statistics (GSARS) initiative. Importantly, the regional event not only attracted people from a wide range of Pacific countries (refer to Appendices for the ‘Participant List’) but also from diverse work backgrounds, with each attending country invited to bring a statistician from its National Statistics Office (NSO), and representatives from its agriculture and fisheries ministries. As a result, this regional event provided a unique platform for information sharing across areas of expertise, between ministries, and across countries via regional and global discussions. Objectives achieved at the Strategic Planning for Agriculture and Fisheries Statistics for Pacific Island Countries workshop were:
To improve the collection and use of agricultural and rural statistics in the Pacific, by bringing together key stakeholders to take stock of the current situation of agricultural and fisheries statistics, with a view to developing a shared vision on scope and coverage of a proposed Pacific Strategic Plan for Agriculture and Fisheries Statistics.
To share the latest methodological developments by FAO with the framework of the Global Strategy to Improve Agricultural and Rural Statistics (GS), coupled with recent work carried out by other agencies and Pacific countries on agricultural and fisheries statistics.
The workshop also achieved the following key outputs:
Information on global methodological approaches and innovations shared with participants, including those advocated in the World Census of Agriculture 2020;
Best practices and experiences shared among participating countries on applicable approaches to integrate agriculture into their national statistical systems;
Page 4 of 38 – October 2015 Summary Report: Workshop for Agriculture and Fisheries Statistics
Clear recommendations provided by countries on how their long term needs for agricultural and rural statistics collection and use can best be supported by a regional plan.
Information about the workshop, including documents and presentations are online:
PAFPNet website ‘events’ page: http://www.spc.int/pafpnet/our-events/year.listevents/2015/11/06/-
FAO website ‘events’ page: http://www.fao.org/asiapacific/events/detail-events/en/c/1264/
Also, under development for launch late 2015: (site under development) http://www.spc.int/pafpnet/events/strategic-planning-for-agriculture-and-fisheries-statistics-in-the-pacific-island-countries
1.2 Official Opening
The Honourable Minister of Agriculture, Fiji Government, Inia Seruiratu, welcomed local and overseas guests to the workshop. Minister Seruiratu added that: “I am a strong advocate for better use of statistics and data within the agriculture sector and look forward to hearing our combined recommendations from this meeting on how best to develop a regional plan for our approach to statistics. The effective use of data will be critical in meeting the objectives in our new Fiji 2020 Agriculture Policy Agenda, which promotes sustainable community livelihoods.” Addressing the audience during the workshop opening, the Head of the European Union Delegation for the Pacific, H.E. Ambassador Andrew Jacobs, said: "Strengthening agriculture statistics in this region is challenging, given the limited resources and the informal nature of agriculture. However, I believe this workshop has the potential to make a difference by bringing together representatives from both agriculture ministries, fisheries ministries and statistics offices, which often work in isolation. Strengthening cooperation between both will be a key to the development of sustainable statistics and development in the region, more generally." Coordinator for the FAO Sub-Regional Office for the Pacific Islands, Gavin Wall was unable to attend the event, and Mukesh Srivastava, Senior Statistician - Economic, Social and Policy Assistance Group (ESP) FAO Regional Office for Asia and the Pacific, spoke on his behalf about the FAO’s ground breaking Global Strategy effort to improve agricultural, rural and fishery statistics systems. Mr Srivastava said: “The availability of these statistics is crucial to monitor progress towards the Sustainable Development Goals and to inform national policies and programs. This meeting will result in the initiation of a comprehensive long-term plan for building capacities of statistical systems for monitoring the attainment of these goals for the people and communities of the Pacific.”
1.3 Background
Pacific context: The Pacific has approximately 11 million people, of which nearly eight million live in rural areas (73%) and largely rely on agriculture and fisheries for their livelihoods but long-term exposure to the adverse effects of climate change and frequent natural disasters make Pacific rural populations particularly vulnerable. Improved statistics systems will enable countries to better understand the impact of demographic changes, such as changing demand for natural resources, as well as the effects of extreme weather conditions and climate change on their food security and well-being.

Page 5 of 38 – October 2015 Summary Report: Workshop for Agriculture and Fisheries Statistics
National, regional and global statistic strategies: The Global Strategy to Improve Agricultural and Rural Statistics (GS) initiative is the outcome of an international effort endorsed by the UN Statistical Commission and is implemented in the Asia Pacific region by the Asian Development Bank (ADB), the Food and Agriculture Organization of the United Nations (FAO), and the United Nations Economic and Social Commission for Asia and the Pacific (UNESCAP). The GS aims to rebuild the capacities of statistical systems producing agricultural statistics to meet the core and emerging data requirements and to monitor the sustainable development goals. These objectives are guided by the three pillars of the GS which outline a multi-pronged approach through technical assistance, training and research. Implementation of the GS is guided by a Regional Action Plan (RAP) for Asia and the Pacific with an initial target to reach 20 countries by 2017. Implementation started with in-depth country level assessments of capacity to produce agricultural and rural statistics in 15 countries, including Samoa, Fiji and Papua New Guinea in the Pacific area. Since 2013 considerable experience has been gained and lessons learnt while undertaking in-country work in the Asia and the Pacific region. It has been widely recognized that institutional arrangements for coordinating statistical activities and sharing responsibility between national statistics offices (NSOs) and line ministries significantly impact the development of agricultural statistics in the countries. The overarching framework for statistics work for Pacific Islands is provided by the Ten Year Pacific Statistics Strategy (TYPSS) which was endorsed in 2009. In the Pacific, many of the smaller islands struggle with limited staffing and financial resources so the emphasis of the TYPSS is on employing regional solutions to address national statistical development challenges. Work that has been undertaken so far under TYPSS which has overlap with the goals of the GS are collection of a core set of agriculture indicators through the National Minimum Development Indicators (NMDI) database; assisting countries to develop cross sectoral (including agriculture) National Statistics Development Strategies (NSDSs); and the inclusion of agriculture questions into regular household surveys and censuses (e.g. household income and expenditure surveys and the population census). Despite this, agricultural statistics remains a weak area for many Pacific countries and urgently requires the attention of regional policy makers. Ongoing work under TYPSS will include a focus on the use and dissemination of statistics and reaching out to the broader national statistical systems within countries. This has strong synergies with the GS. In the past FAO support to Pacific countries has been focused on the conduct of agricultural censuses with limited follow-up to collect current statistics. Relatively few Pacific islands have established survey calendars for regular collection of data on crops, livestock and fish. Agricultural practices differ in many respects to other countries where the GS is being implemented and there is a strong argument for a more tailored approach within the region, particularly for the smaller islands and territories. Furthermore, it is recognized that within the resources from the GS it will not be possible to reach out to all countries in the Pacific by 2017 therefore a regional strategy could help more Pacific islands to benefit from the GS. FAO has prepared its next World Programme for Census of Agriculture (WCA 2020) which will guide the agricultural censuses during 2016-25. The programme proposes new approaches to establish a system of integrated surveys and cost-effective ways of data collection. In tandem, a number of technical developments are taking place as part of research component of the GS. AGRIS, a survey system, has been developed to serve as a model survey system for many

Page 6 of 38 – October 2015 Summary Report: Workshop for Agriculture and Fisheries Statistics
countries. Open source CAPI software has been developed to meet the requirement of agricultural surveys. A number of other guidelines and research outputs are available to countries for strengthening their systems. In this context FAO and SPC have committed to work together to provide Pacific islands with the opportunity to benefit from greater technical assistance, research and capacity building on agricultural and rural statistics in the longer term. A first step was to convene the workshop on ‘Strategic Planning for Agricultural and Rural Statistics in the Pacific’. The workshop brought together experts and researchers from countries and international organisations. It aimed to make countries aware of latest research in the field of agricultural statistics and provide a forum to discuss the specific needs of pacific countries, particularly the need and efficacy of a Pacific Strategic Plan for Agricultural and Fisheries Statistics.
Page 7 of 38 – October 2015 Summary Report: Workshop for Agriculture and Fisheries Statistics
2.0 CONCLUSIONS AND ACTIONS
The following is an overview of the combined conclusions and actions, or ‘way forward’, as a result of the daily discussions at the workshop.
2.1 Conclusions and Actions
1. Agreed on the importance and benefits of improved statistical data, analysis,
dissemination and use, for agricultural, fisheries and forestry stakeholders in Pacific Island
countries. Improved data is beneficial for a number of reasons including evidence-based
policy development and to meet demands for the monitoring of the Sustainable
Development Goals (SDGs).
2. Noted that countries are to complete the FAO’s Global Strategy’s Capacity Assessment
Questionnaire. It is likely that in each country various agencies will need to work together
to complete the questionnaire, as it is unlikely just one department will have all the
necessary data or expertise to complete the form. Countries are to ensure all parts of the
questionnaire are completed and, in the absence of available data, provide an explanation
about why there is no relevant data as this is particularly useful information for the
capacity assessment.
3. Agreed on the proposal to create a Pacific Strategy on Agriculture and Fishery Statistics,
which is to be well harmonized with ongoing regional and national strategies while also
filling the recognized gaps for agriculture statistics in the Pacific.
4. Agreed to arrange a follow-up regional workshop to review progress on the strategy.
5. Agreed to nominate a Technical Working Group (TWG) to take forward actions for the
planned Pacific Strategy on Agriculture and Fishery Statistics.
6. Agreed on the composition of the TWG and also nominated its initial seven members.
7. Agreed the TWG’s Secretariat will be a collaboration of FAO and SPC efforts, and that the
Secretariat will be responsible for drafting the TWG Terms of Reference (TOR) to assist
and guide on tasks such as developing a Concept Note (for details refer to Section 3).
8. Noted the suggestion to enlist the help of a consultant to act as facilitator for the TWG.
Page 8 of 38 – October 2015 Summary Report: Workshop for Agriculture and Fisheries Statistics
3.0 PACIFIC PLAN FOR AGRICULTURE AND FISHERIES
STATISTICS
Workshop participants agreed on the establishment of a new Technical Working Group (TWG) for the development of the proposed Pacific Strategic Plan on Agricultural and Fishery Statistics (PSPAFs). Delegates agreed on nominated members, including a chair and vice chair, plus the Secretariat. Other actions discussed included the potential objectives and priority activities including the development of a timetable and Concept Note for high level endorsement.
3.1 Introduction
The Strategic Planning for Agriculture and Fisheries Statistics for Pacific Island Countries workshop was attended by participants from 14 different Pacific Islands who all agreed on the importance to develop a regional strategic plan on agriculture and fishery statistics, to strengthen the collection, use and dissemination of statistics to support evidence based policy creation and monitoring.
To develop the proposed Pacific Strategic Plan on Agricultural and Fishery Statistics (PSPAF) the workshop participants agreed to establish a small and efficient Technical Working Group (TWG) and also nominated its members. The resulting TWG comprises of seven representatives nominated at the workshop 1 who represent a broad cross section of experience, linkages with other regional and global strategies, and geographic locations.
Both the Food and Agriculture Organization of the United Nations (FAO) and the Secretariat of the Pacific Community (SPC) will act as the Secretariat of the TWG, which will prepare a Concept Note on the proposed strategic plan for endorsement at key regional fora.
3.2 Background
The regional workshop brought together experts and researchers from countries and international organisations to raise awareness amongst participants about the latest experiences, approaches and research in the field of agricultural statistics. Importantly, it also provided a forum to discuss the specific needs of Pacific Island countries including gaps and opportunities not being currently met by the range of national, regional and global approaches. Raising these issues resulted in a consultation with the Pacific Island delegates on the potential need, efficacy and establishment of a proposed Pacific Strategic Plan for Agricultural and Fisheries Statistics (PSPAF), which would enable Pacific Islands to benefit from greater technical assistance, research and capacity building on agricultural statistics in the longer-term. Furthermore, establishing the long-term comprehensive PSPAF action plan would assist the achievement of the overall objective to support food security, sustainable livelihoods and poverty alleviation in the Pacific through the development of evidence based policy. The Strategy will be designed to meet the specific requirements of Pacific Island Countries and Territories (PICTs), small PICTs in particular, to enable them to partake in the wider global initiative on agricultural and rural statistics. It will aim to also provide a governance structure, source of funds, and be fully integrated with the regional Ten Year Pacific Statistics Strategy
1 The workshop agreed there would be a Kiribati representative, who was nominated after the event.

Page 9 of 38 – October 2015 Summary Report: Workshop for Agriculture and Fisheries Statistics
(TYPSS) and countries’ own National Strategies for the Development of Statistics (NSDS). The Strategy should cover all elements of statistical collection, analysis, dissemination, as well as active promotion of, and technical support to improve data use, as well as research, training and general technical assistance. It is anticipated that the Strategy would focus on leveraging ongoing work in the region and within countries on agricultural statistics data collection, for example, by extracting agricultural data from the Standardised Household Income and Expenditure Surveys (HIESs) supported by SPC and the inclusion of agricultural modules in Population Censuses. The Strategy should focus on the practicality of interventions and ensuring countries get the best value for money from their statistical activities. Where possible, south-south cooperation will be used and lessons taken from the application of the Global Strategy in other Small Islands Developing States. The ultimate outcome would be for the PSPAF to provide the foundation for cross-governmental coordination and collaboration in the generation and use of vital agricultural and rural statistics for evidence based policy development.
3.3 Rationale
There is a current process for the development of Strategic Plans for Agricultural and Rural Statistics (SPARS), coordinated through the Global Strategy to Improve Agricultural and Rural Statistics (GS) and its Regional Action Plan (RAP) for Asia and the Pacific. The RAP is comprehensive and so far both Samoa and Fiji in the Pacific have benefitted from their involvement. However, many smaller PICTs face resource challenges that make the standard SPARS process unsuitable, such as having a national statistical office (NSO) staffed by only one or two personnel responsible for all statistical collections. Furthermore, many small PICTs have large exclusive economic zones but relatively limited land areas and small commercial agricultural sectors. Nevertheless, subsistence agriculture and fisheries remain crucial sources of sustainable livelihoods and food production in these countries, making agricultural, fisheries and rural statistics vital for informing policy on environmental sustainability and food security. This creates a need for a mechanism to enable smaller PICTs to collect core minimum agricultural, fisheries and rural statistics without placing significant additional demands on already overstretched resources.
3.4 Outcomes of discussions on a new regional strategic plan
The Strategic Planning for Agriculture and Fisheries Statistics for Pacific Island Countries workshop addressed the many issues faced by both smaller and larger Pacific Island countries. In particular, delegates discussed the gaps and opportunities for improved agriculture and fisheries statistics in the Pacific, and the proposal to establish a Pacific Strategic Plan for Agricultural and Fisheries Statistics (PSPAF). Specifically, in the final sessions of the workshop, on Day 3 and Day 4, workshop delegates discussed considerations for the proposed strategy. This group work and plenary discussions focussed on a series of questions in relation to the strategy, which included:
What are some of the critical agriculture, fisheries and rural data gaps, constraints and challenges in each country?
Page 10 of 38 – October 2015 Summary Report: Workshop for Agriculture and Fisheries Statistics
What are the main objectives and considerations for a regional strategy on agriculture and fisheries statistics? (Refer to Section 3.5 ‘Objectives and Activities’ for a summary)
What key activities should be considered for the strategy? (Refer to Section 3.5 ‘Objectives and Activities’ for a summary)
Next steps for developing a strategic plan for agricultural and fishery statistics? (Refer to Section 3.6 ‘Summary of Next Steps’ for details)
The following section provides a summary of the outcome of the group discussions on these questions. (Refer to Appendix 6.4 for full details of discussions, in relation to each of the questions.)
3.4.1 Gaps, constraints and challenges for agriculture, fisheries and rural data in each
country
Some of the key challenges and constraints highlighted by countries included:
The need for more accurate and reliable agricultural data that is comparable over time and across countries.
The need for better collaboration and harmonization across agencies plus also national, regional and global approaches. This includes linkages across sectoral and national plans and frameworks to ensure statistics have a greater alignment with national priorities.
The need for more usage of existing and planned statistical data, in particular increased inclusion of agricultural data in evidence-based policy making and development decisions.
Accessibility and transport, such as to remote islands or highlands.
Human resources in terms of the number of staff as well as technical capacity of staff, and the need to build on existing systems and capacity with a focus on sustainability.
Funding remains an ongoing challenge, with census being expensive and time consuming, as does the need to have national level ‘champions’ or advocates for improved budget prioritisation of national statistics.
The need for more Information Technology (IT) support and collaboration.
Reliability of data given poor or non-existent record keeping, especially from subsistence farmers.
Inconsistencies of classifications (i.e. general “bundles” of produce versus specific kilograms) coupled with the need to further improve the adaptation and adoption of standard tools and methodologies.
3.4.2 Objectives
Discussion on objectives were wide ranging but the different groups had the following as key objectives in common, to: 1. Build capacity of countries to collect, use and disseminate agriculture and fisheries statistics to meet the requirements of countries for national policy making and monitoring and for international commitments such as SDGs, by: • Continuing and enhancing work on the harmonization of agriculture and fisheries
statistics in Pacific Island countries using international and regional concepts, definitions, classifications and tools;
• Improving the efficiency of collection activities through establishing agriculture and fishery survey and census schedules;
• Increasing the use of new technologies for data collection and dissemination;
Page 11 of 38 – October 2015 Summary Report: Workshop for Agriculture and Fisheries Statistics
• Further integrating agriculture and fisheries statistics into National Statistics Systems (NSS) and thereby foster improved coordination between agencies involved in agriculture and fisheries statistics; and,
• Improving awareness of the value of agriculture and fisheries statistics by better communicating and translating the meaning of statistical information to stakeholders such as policy makers.
2. Also to: • Be realistic in what the strategy can achieve in the short term; • Have the potential to expand into other areas such as environment and climate change; • Compare agriculture and fisheries statistics between countries in the region.
3.4.3 Activities
Delegates discussed key activities to be the focus areas for the strategy following the workshop (to potentially be listed under three key headings: statistics production process, statistics dissemination process, and actual use of statistics), which include: Statistics production: • Continue to improve the adaptation and adoption of existing tools and methods for
collection of a range of agriculture and fisheries statistics. • Encourage broader adoption of the Agriculture Integrated Survey (AGRIS) approach • Encourage further regional training and capacity building • Further establish mechanisms to integrate TYPSS and SPARS into countries • Further harmonise standard tools, templates and approaches (including data sets) that
can create efficiencies for countries, as well as be shared across countries. • Further the use of existing tools and particularly new technologies through CAPI. This
includes investigating the possible sharing of IT resources (such as tablets) by Pacific Island countries
Statistics dissemination: • Continue to develop and strengthen capacity development programs, including through
“improved” South-South (or intra Pacific) knowledge sharing and collaborations (recognizing there are already many collaborative efforts already in existence)
• Consider the development and adoption of training programmes on data analysis and summarization
• Further the use of new tools and technologies for data dissemination such as POPGis. Statistics use: • Develop a public awareness campaign to enhance understanding and use of statistics • Continue to seek high level advocates for statistical approaches • Consider the development and adoption of training programmes on understanding and
practically using statistics in strategic planning, policy and other development activities. • Continue to work with the Global Strategy (GS) on initiatives, being mindful of the unique
aspects of Small Island Developing States (SIDS). • Continue to link with existing systems and processes, and increase awareness of what is
already “on the ground” • Research on the application of statistics to policy concerns e.g. further development of
use of HIES on food security issues • Support for the application and use of research produced through the GS.

Page 12 of 38 – October 2015 Summary Report: Workshop for Agriculture and Fisheries Statistics
3.4.4 Next steps
Delegates highlighted the following actions and activities as essential for progressing development of the regional strategic plan.
Implementation component should be included in the strategic plan
Promote the plan to ensure the actual use of statistics and the involvement of cross-sectoral stakeholders from NSO and agriculture ministries
Circulate the draft to donors, SPC and others for feedback
Seek high level endorsement such as from PIFS
Consider inviting PSSE
Incorporate objectives of the plan with governments and regional development plans’ objectives.
Most importantly they said that a Technical Working Group should be established to help guide the development of the strategy. Technical Working Group Delegates at the regional workshop agreed on the creation, and the nominated members of the new Technical Working Group (TWG) for the PSPAF.
Activities for the TWG It was agreed that the TWG Secretariat would be a collaboration between FAO and SPC. It was also agreed the Secretariat would be responsible for drafting the Terms of Reference (ToR) for the TWG. The activities in the ToR were likely to include providing assistance and guidance for the following tasks:
Develop a Concept Note and obtain endorsement from an appropriate forum (e.g. Pacific Islands Forum (PIF) or other suitable forum)
Develop a roadmap and timetable for the development of the strategy
Propose a broad vision and mission of the agricultural statistical system in the next 10 years to guide the preparation of the strategy
Review data gaps, constraints and challenges identified at the workshop
Identify expected results, outputs and activities at sub-sectoral level (agriculture, fisheries, forestry)
Technically contribute to the development of the strategy as per the approved roadmap
Seek comments from countries on the draft strategy. Also circulate the draft strategy to donors, partners and other stakeholders for their comments and support.
Finalise the draft strategy with consideration to feedback received.
Obtain endorsement of the strategy.
Criteria for, and composition of the TWG Participants agreed on the composition of the TWG being small and efficient with members representing experience across a variety of strategies and approaches, including:
National Statistics Office (NSO)
Global Strategy to Improve Agricultural and Rural Statistics (GS)
Ten Year Pacific Statistics Strategy (TYPSS)
National Strategies for the Development of Statistics (NSDS)

Page 13 of 38 – October 2015 Summary Report: Workshop for Agriculture and Fisheries Statistics
Strategic Plans for Agricultural and Rural Statistics (SPARS)
Mix of people from National Statistics Offices (NSO) and agriculture, fisheries or forestry.
Minimum one member from each of: Polynesia, Micronesia, Melanesia
Minimum one member from a Small Island Developing State (SIDS) with preference to those not currently running census or related activity, and one member from a larger Pacific nation with experience operationalizing census and other activities
Consideration to include development partners. Nominated members of the TWG Participants discussed and agreed on the nominated its initial seven members:
Name & Delegation TWG Criteria Met
(TWG Chair) Patrick Arioka, Senior
Secretary of Agriculture,
Department of Policy, Ministry of
Agriculture, Cook Islands
Representative of Polynesia. Experience with NSO, PAPP PSC, MoA and agriculture policy.
(TWG Vice-Chair) Edith Faaola, Assistant Chief Executive Officer, Samoa Bureau of Statistics, Samoa
Representative of Polynesia. Experience with NSO, GS, NSDS and SPARS.
Simil Johnson, Head of Vanuatu
National Statistics Office, Vanuatu
Representative of Melanesia. Experience with NSO, NSDS and also as PSSC of TYPSS.
Manaia Halafihi, Head of Policy and Planning Unit, Ministry of Agriculture and Food Forestry and Fisheries, Tonga
Representative of Polynesia. Experience with agriculture census.
Marlyter Silbanuz, Deputy Assistant Secretary, FSM Agriculture Unit, Department of Resources and Development
Representative of Micronesia. Experience with agriculture census (currently in planning phase).
Kiribati (Kiribati accepted nomination, with the nominee later confirmed as Takena Redfern, Kiribati Ministry of Environment, Lands and Agricultural Development (MELAD).
Representative of SIDS.
Leon Hickie, Principle Fisheries
Office, Statistics and Information.
Ministry of Fisheries and Marine
Resources, Solomon Islands
Representative of Melanesia. Experience with fisheries statistics.
Page 14 of 38 – October 2015 Summary Report: Workshop for Agriculture and Fisheries Statistics
4.0 DISCUSSIONS BY THEMATIC AREAS
Following is a summary of key discussions divided into six, thematic areas (for a list of key discussions for each day, refer to ‘Section 6.3: Summary of Presentations’):
4.1 Statistics play a fundamental role in evidence-based policy making and
development decisions
1. Discussed how the agriculture sector is a major source of income, employment and development for most Pacific islands, yet there is a need to improve statistical systems to produce accurate and reliable agricultural data that is comparable over time and across countries.
2. As highlighted in the FAO’s Global Strategy on Agricultural and Rural Statistics (GS) initial 2011 Capacity Assessment Questionnaire, there is an opportunity to improve statistical capacity in Pacific Island countries.
3. Delegates agreed on the proposal to create a Pacific Strategy on Agriculture and Fishery Statistics, which is to be well harmonized with ongoing strategies and approaches while also filling the recognized gaps for agriculture statistics in the Pacific.
4. Discussed how statistics are an important evidence base for policy making and development decisions. Improved statistics enable a better understanding of how factors such as population growth, demand for natural resources, extreme weather and climate change may impact on food security, sustainable livelihoods and economic growth.
5. While statistics in the Pacific attract low investment they have a particularly high impact on decision making about aid and investment efforts to foster agricultural growth – such decisions rely heavily on effectively measured and evaluated information and use of appropriate statistics. Yet in Pacific countries less than 5% of national budgets are allocated to the agriculture sector (as a whole), of which a minor portion is used for agriculture statistics. (Globally the EU estimates only 0.24% of global aid funding goes towards agriculture statistics, according to the 2015 annual report of the Partnership in Statistics for Development in the 21st Century.)
4.2 Increasing the use of statistics through improved communication of their
meaning, availability and usefulness to potential users
6. Statistics need to be relevant and well communicated as they are only valuable if they are used by key stakeholders. To increase their use, and therefore effectiveness, there is a need to ‘translate’ their meaning so that non-specialist audiences, such as policy makers or politicians, understand the insights for discussion and decision making.
7. Discussed opportunities to develop or improve public awareness campaigns to enhance the understanding of the value of agriculture and fisheries statistics.
8. Whilst there is a need for more and improved data, there is an equal need to increase the use of data that already exists.
9. Need to ensure statistics align with national priorities. Encourage more collaboration between statisticians (in NSOs and sector-specific statistics divisions), policy makers across various sectors, and colleagues allocating national finance budgets, to improve strategic planning of data collection targeted to national priorities.
10. Consensus among delegates that having a senior level ‘champion’ or advocate, who understands the link between statistics and national priorities or development decisions, is invaluable for the development of agriculture statistics.

Page 15 of 38 – October 2015 Summary Report: Workshop for Agriculture and Fisheries Statistics
4.3 Importance of building on and complementing existing national and
regional approaches including the Global Strategy
11. Discussion about statistical programmes already in existence and the importance of a regional strategy on agriculture and fishery statistics to harmonise and complement them.
12. At a global level there is the Global Strategy on Agricultural and Rural Statistics (GS) which aims to improve agricultural, rural and fishery statistics systems. The GS has a Regional Action Plan for Asia and the Pacific (RAP) that continues to 2017 and covers 20 countries in Asia and the Pacific. Part of the activities under the RAP are the development of Strategic Plans for Agriculture and Rural Statistics (SPARS);
13. Within the Pacific region there is a Ten Year Pacific Statistics Strategy (TYPSS) that aims to coordinate and ensure there is a harmonised system for all countries to use across the region. Part of the TYPSS is work on the development of National Strategies for the Development of Statistics (NSDSs)
14. At national level countries are developing National Strategies for the Development of Statistics (NSDS) which help countries meet their regional and international commitments with respect to statistics. SPARS developed under the GS should be fully integrated into the NSDS but will further elaborate on the statistical system in regards to agricultural and rural statistics.
15. Any Pacific strategy on agriculture and fishery statistics should i) integrate the lessons from the NSDS and SPARS at national level and ii) act as a subset of the RAP and TYPSS for the Pacific region on agriculture and fisheries statistics.
4.4 Harmonised and standardised statistics including the sharing of tools,
templates and technology
16. Ongoing discussions throughout the workshop raised the need for more harmonized collection and dissemination of agriculture and fisheries statistics.
17. Statistics become more meaningful when they can be compared in regular time intervals. Delegates discussed how the regional dimension of the event was an important advantage, to encourage knowledge and data sharing across countries as well as regionally and globally.
18. Discussed the importance of fostering improved coordination and collaboration between ministries and agencies involved in agriculture and fisheries statistics. Typically different agencies within each country collect different data, so working more closely together can avoid duplication and ensure more strategic planning and targeted collections.
19. There is a need to continue to improve the adaptation and adoption of standard tools and methodologies used for agriculture and fisheries statistics.
20. Discussed ways to continue to develop and share information technology (IT) ideas (i.e. use of ‘drone’ (unstaffed) helicopters for the aerial mapping of crops), IT tools (i.e. CAPI and POPGIS) and resources (i.e. sharing of tablets) being developed to assist Pacific Island countries with their census and surveying approaches. Benefits and disadvantages of technology include: drones may be limited to where they can fly given privacy issues while computer assisted personal interviewing (CAPI) is costly.

Page 16 of 38 – October 2015 Summary Report: Workshop for Agriculture and Fisheries Statistics
4.5 Capacity development
21. Significant discussions through the week about the need, and associated challenges, to build the capacity of countries to better collect agriculture and fisheries statistics.
22. Discussed a need to continue to develop and strengthen capacity development programs, including South-South (or intra Pacific) knowledge sharing and collaborations (recognizing there are already many collaborative efforts in existence) but with extension to agriculture and fishery statistics needs.
23. Capacity development approaches are to be multi-faceted with some focusing on data analysis and summarization, others on dissemination and communication, as well as improving the capacity of national stakeholders to use statistics in strategic planning, policy and other development activities.
24. Discussions about the need to build on existing systems and capacity, with a focus on sustainability. This is the approach of the Global Strategy (GS) whereas in the past FAO had a more ad hoc approach to developing statistical initiatives in the Pacific that did not result in any legacy to the country involved, but now its focus is on long term sustainability.
25. Discussed the need for countries to ‘own’ and manage their approach to statistics rather than defer to an international consultant (best to defer on an ad hoc basis for specific technical inputs).
26. Collaboration across ministries and agencies within each country is important to share existing capacity strengths, and to strategically plan to overcome weaknesses.
4.6 Challenges and sharing knowledge of data collection in the Pacific
27. Conducting an agriculture census is a complicated process and good preparation is needed - FAO recommends 18 months to prepare (two years including initial planning and approval time). Using the example of Tonga, the number one challenge is preparation time as it is not a simple collection process but requires the development of many manuals, forms, training, maps, plans, and other factors. There is also the issue of remoteness, with limited or no internet access at many locations, and limited transport to remote islands.
28. Discussed the complicated aspects of fisheries statistics and how there is no single instrument that can collect all the relevant fisheries data. Need a variety of approaches to address the three areas for fisheries statistics: industrial, artesanal, and inshore fisheries.
29. Discussed inshore fishing and how it is the least regulated and least understood area in fisheries, but the most important for food security and livelihoods in the Pacific. For this reason, fisheries statistics and data collection includes social and economic aspects.
30. Several discussions about the pros and cons of production data collection. Issues raised included: how consideration should be given to collecting production data via surveys rather than relying on less regular census data; how units of measure vary (i.e. “bundles” of produce versus kg); and that many households have subsistence and/or shared farming so there is often double-counting and other associated issues.

Page 17 of 38 – October 2015 Summary Report: Workshop for Agriculture and Fisheries Statistics
5.0 SUMMARY OF PRESENTATIONS
A summary of presentations provided at the four-day workshop follow. For more details of each presenter’s comments and subsequent delegate discussions, refer to Appendix 6.3 ‘Complete Presentations’.
5.1 Workshop – Day One
WELCOMING REMARKS BY SPC: Ken Cokanasiga, Deputy Director of the SPC Land Resources Division (LRD) SESSION: OPENING REMARKS OPENING REMARKS BY FAO: On behalf of Gavin Wall, FAO Sub-regional Coordinator for the Pacific delivered by Mukesh Srivastava, Senior Statistician, FAO Regional Office for Asia and the Pacific SUMMARY An overview was provided about FAO’s Global Strategy and how “the main purpose of this meeting is to inform countries in this region of the developments at the global and regional levels, and consider adapting them to the needs of this region for implementation through a Strategic Plan that is well harmonized with on-going strategies such as the Ten Year Pacific Strategy on Statistics (TYPSS).” The Global Strategy (GS) is a ground breaking effort to improve agricultural, rural and fishery statistics systems, with three countries in the Pacific sub-region selected for support in the GS Regional Action Plan (RAP): Samoa (2013), Fiji (2014), and Papua New Guinea (2015). Mr Srivastava explained the GS Regional Action Plan funding gap as support is available only until 2017 so there will be a need for additional complementary efforts to achieve the GS goals. The GS links to the monitoring of the new Sustainable Development Goals (SDGs) that need quality statistics to monitor their progress and to inform national policies and programs. FAO’s main mandate is to combat hunger and malnutrition, and monitor progress thus the FAO focus is on SDG 2”, though other SDGs also relate to FAO’s work. “This is a historical opportunity to help countries develop sustainable statistical systems which will produce accurate and reliable agricultural and rural data – comparable over time and across countries for use by decision-makers. However, a necessary condition for the Strategy to succeed is the political will and commitment of your governments.” SESSION: GUEST SPEAKER HONOURED SPEAKER: EU Head of Delegation Ambassador, Andrew Jacobs SUMMARY Addressing the audience during the workshop opening, the Head of the European Union Delegation for the Pacific, H.E. Ambassador Andrew Jacobs, said: "Strengthening agriculture statistics in this region is challenging, given the limited resources and the informal nature of agriculture. However, I believe this workshop has the potential to make a difference by bringing together representatives from both agriculture ministries, fisheries ministries and statistics offices, which often work in isolation. Strengthening cooperation between both will
Page 18 of 38 – October 2015 Summary Report: Workshop for Agriculture and Fisheries Statistics
be a key to the development of sustainable statistics and development in the region, more generally." Ambassador Jacobs explained how the European Union (EU) is currently preparing cooperation programmes up to the year 2020, via funding from new 11th European Development Fund (EDF), and in the Pacific agriculture and fisheries will remain key sectors for EU support. In 2016 EU will launch new rural development agriculture programmes in Vanuatu (Euro $25m), Solomon Islands (Euro $10m) and Fiji (Euro $20m). In addition, Euro $35m support for the sustainable management of oceanic and coastal natural resources project starts next year led by the Pacific Islands Forum Fisheries Agency (FFA). He said “today, statistics play a fundamental role in development” yet limited funds are dedicated to their development. According to the 2015 annual report of the Partnership in Statistics for Development in the 21st Century (PARIS21) “only approximately 0.24% of Official Development Assistance in 2013 was allocated to supporting statistics.” Regionally comparable and harmonised statistics are important making this regional workshop of particular importance. SESSION: FORMAL OPENING FORMAL OPENING: The Honourable Minister for Agriculture, Government of Fiji, Inia Seruiratu SUMMARY The Honourable Minister of Agriculture, Fiji Government, Inia Seruiratu, welcomed local and overseas guests to workshop. Minister Seruiratu said he is “a strong advocate for better use of statistics and data within the agriculture sector and look forward to hearing our combined recommendations from this meeting on how best to develop a regional plan for our approach to statistics. The effective use of data will be critical in meeting the objectives in our new Fiji 2020 Agriculture Policy Agenda, which promotes sustainable community livelihoods.” FAO and PAPP provided support for the Agenda, and are helping Fiji to develop an implementation plan plus also its own Strategic Plan for Agriculture and Rural Statistics, along with other activities including staff training. However, given nearly three quarters (73%) of the Pacific population lives in rural areas and in Fiji the sugar industry alone supports the livelihoods of 200,000 Fijians, Minister Seruiratu repeatedly questioned delegates about: “How can we transform agriculture so it becomes profitable, sustainable and resilient?” He explained that “year in and year out” Fiji has been producing data and other activities to transform agriculture but “where is the effect? How are we improving?” He said change is needed and for that to happen “we need big data and we need reliable data.” “Participants and organisers should remember throughout the workshop that statistics are not useful unless they are used by the key stakeholders in our countries. Statistics must therefore be aligned with our national priorities and emphasis placed on making the insights they reveal accessible to non-specialist audiences. Secondly, there are relatively few fora within the Pacific which bring together representatives from the Statistics Offices and their colleagues in the Ministries of Agriculture and Fisheries. I would urge all participants at this workshop to use the opportunity to network, collaborate, and strengthen their partnerships.”
Page 19 of 38 – October 2015 Summary Report: Workshop for Agriculture and Fisheries Statistics
SESSION: GROUP ACTIVITY GROUP ACTIVITY: Each delegate introduced themself. (Refer to Appendix 6.2 ‘Participant List’ for details.) SESSION 1: PANEL OF SPEAKERS PANEL FACILITATOR: Chair of the PAPP Steering Committee, Mr Patrick Arioka SESSION 1: STATISTICS FOR POLICY MAKING ON AGRICULTURAL AND RURAL SECTORS IN PACIFIC COUNTRIES PRESENTATION: Linking Agriculture and Fisheries Statistics with Policy, Vili Caniogo, PAPP Team Leader, SPC SUMMARY There is a shortage of funding for the agricultural sector especially for statistics – on average Pacific countries allocate less than 5% of their national budgets to the agriculture sector – so the challenge is to make good use of the funds given via the use of statistics to drive smart investments. The two key messages are the availability and quality of agricultural statistics is a key challenge, and how decisions about aid or investment efforts to foster agricultural growth need to be based on sound information. Based on an inventory of 15 countries’ agriculture policy and key documents, eight countries mentioned agriculture statistics and research as important but “accessing data is a serious challenge”, and only four national agriculture sector plans included data or information as evidence to inform policy (based on data used from Agriculture Census, Trade data, HIES and other sources). In addition to the need for more data, are the challenges of ensuring data is relevant, and that it is understand and used by policy makers and other non-specialist audiences. There is also the need to better “connect” policy people with statisticians to ensure they are best equipped with the data and knowledge they need to develop evidence based policy, and to guide national finance budgets. SESSION 1: STATISTICS FOR POLICY MAKING ON AGRICULTURAL AND RURAL SECTORS IN PACIFIC COUNTRIES Discussion led by Mukesh Srivastava on data for monitoring the SDGs (Sustainable Development Goals) SUMMARY The new SDGs have 17 goals with about 169 sub-goals and many indicators (approx. 350). They will also have a focus on monitoring from the outset, moreso than their predecessors the Millennium Development Goals (MDGs). The monitoring framework is expected to be finalised by March 2016. This means central to the SDGs planning process are discussions on how prepared and able are statisticians to meet the requirements of monitoring progress of the SDGs. Key messages from the SDGs meeting in Bangkok are that demands for data are high, with a developed country like Japan estimating it can only meet 60% of the data requirements and that non developed countries may be likely to only meet 25%. Given the high demands and limited capacity of National Statistics Offices (NSOs) nations will need to need to focus on

Page 20 of 38 – October 2015 Summary Report: Workshop for Agriculture and Fisheries Statistics
partnerships between national statistics bodies and sector ministries and also look at non-official sources, ie private sector, NGOs civil societies, and how can best source information and data for SDGs monitoring. Disaggregation of data is also an emphasis for the SDGs, ie gender, geography, social groups, etc. SESSION: GLOBAL STRATEGY FOR AGRICULTURAL AND RURAL STATISTICS Allan Nicholls, An overview of the Global Strategy for Agricultural and Rural Statistics and the Regional Action Plan SUMMARY The Global Strategy for Agricultural and Rural Statistics and its associated Regional Action Plan (RAP) is a huge undertaking, but necessary as there has been an increase in data needs but a decline over time in capacity and funding. Samoa and Fiji are engaged countries from the Pacific. The GS has three pillars, to: establish a minimum set of core data that countries will disseminate on a regular basis; integrate agriculture into National Statistical Systems (NSSs); to foster the sustainability of agricultural statistical systems through governance and statistical capacity building. The GS Regional Action Plan for Asia Pacific (RAP) is based largely on the GS Country Assessment Questionnaire from 2011. It is hoped the GS Strategic Plan for Agricultural and Rural Statistics (SPARS) becomes the building block for NSDS, as this creates a sustainable and long term plan to develop national plans in countries. Most important is to ensure agriculture is included in SPARS to raise its profile thus its likelihood to get more funding over time. SESSION 2: GLOBAL STRATEGY TO IMPROVE AGRICULTURAL AND RURAL STATISTICS PRESENTATION: Carola Fabi, FAO Rome, TA and Training Coordinator - Global Strategy SUMMARY The idea of the GS RAP is to seek what is available (country practices, methodologies, etc) and make the best use of scarce resources. Initially the visible results for GS have been on research but now, at the mid-point of the GS that runs to 2017, we focus on the development of training materials, capacity development and technical assistance. Research is at its maximum now, and will reduce, while technical assistance is now starting to increase along with the training component that builds on available methods and materials. Research is running on 15 themes (10 themes with work underway) and 25 topics. Major results (critical mass of reports coming online: www.gsars.org/publications ) are: Technical Reports (6 technical reports published, 2 undergoing editing, and 8 additional reports for end 2015); Guidelines (GL) and Handbooks (HB) (8 published, 4 additional publications by the end 2015, 3 guidelines produced under the AMIS project); Working papers in 2015 (3 published about Administrative data, Post Harvest Losses, Crops Statistics). Publications planned for 2016 including 8 Technical Reports, 8 Guidelines. A knowledge repository by theme will be developed in 2016. Next challenge will be to ensure linkages between the completed research topics, and up-date research outputs to make them living documents. SESSION: TYPSS PRESENTATION: Key features of TYPSS and agricultural statistics, Simil Johnson, Chair of TYPSS (Ten Year Pacific Statistics Strategy) Action Plan
Page 21 of 38 – October 2015 Summary Report: Workshop for Agriculture and Fisheries Statistics
SUMMARY The Ten Year Pacific Statistics Strategy (TYPSS) Action Plan is a 2011-2020 regional strategy for statistics. Its role is to coordinate and make sure there are harmonised systems that everyone should be using across the region, so that across Pacific Island countries we are “talking the same language.” It was explained that through TYPSS it is important we bring sectors together, and help countries with the development of their NSDS, in particular to collaborate with SPC and FAO. Assistance has included responding to requests for technical assistance from various National Statistical Offices (NSOs) in the Region. As chair of TYPSS, Mr Johnson said together we have to take this to another level when we return to our respective countries. “It is important that we work together.” SESSION 3: STRATEGIC PLANNING FOR AGRICULTURAL AND RURAL STATISTICS (SPARS) Guidelines to SPARS, Carola Fabi, FAO Rome, TA and Training Coordinator - Global Strategy SUMMARY Delegates were provided with more details about the approach to Strategic Plan for Agricultural and Rural Statistics (SPARS), that helps countries to establish policy priorities; to identify data needs, gaps, deficiencies, duplications and inconsistencies; to define future short and long-term statistical programs and interventions; and that can be used as a building block in the NSDS. An overview of SPARS process phases was provided, from launch (including preparation) to assessment and planning. Some essentials for a SPARS include: mainstreamed into the NSDS national process (if any); backed by political support, nationally led and owned; at least partially funded by governments for its implementation; covering the whole agricultural and rural sector; and taking into account what is in place and international commitments. A road map is needed to guide the development of SPARS. The strategic plan must include a logical frame for result-based management and a Core Budget. SESSION 3 (continued): STRATEGIC PLANNING FOR AGRICULTURAL AND RURAL STATISTICS (SPARS). Overview of Global Strategy work in Pacific Countries and experience in other Asian Countries Allan Nicholls, Regional Coordinator of the Global Strategy in the Asia-Pacific Region SUMMARY FAO provided further insights on the Global Strategy and its implementation across Asia Pacific targeting 20 countries selected based on the 2011-12 pilot Country Capacity Assessment questionnaire sent to 51 countries of which only 50% of Pacific countries responded (75% overall in Asia Pacific). Each of the selected 20 countries receives GS Technical Assistance on specific activities along with an In-depth Country Assessment (IdCA), short-term Country Proposal paper, and development of a roadmap for SPARS development as part of the country’s long-term strategic plan. Progress in Pacific Countries includes: Samoa where the IdCA and Country Proposal paper were endorsed by government in November 2014, NSDS exists and SPARS is in the development stage; Fiji where the IdCA and Country Proposal paper were recently revised,
Page 22 of 38 – October 2015 Summary Report: Workshop for Agriculture and Fisheries Statistics
NSDS does not yet exist and the SPARS is in the development stage; and finally PNG where GS just completed its first mission. General findings at the country level indicate coordination is not always good between an NSO and Ministries or within a Ministry and the GS consultative process is working to improve this situation. Also there is a lack of qualified statistical staff and the GS process is helping to identify specific training needs, though this issue is compounded by insufficient budgets with suggested GS approaches including more coordination of data collection activities, the adoption of more efficient collection methodologies, and rationalization of scarce skilled resources. In conclusion, the involvement of all stakeholders is key especially donors (better the planning then the more attractive to donors) with flexibility needed to adapt the process to suit each country’s unique situation. SESSION 3 (continued): STRATEGIC PLANNING FOR AGRICULTURAL AND RURAL STATISTICS Rationale for a Pacific Strategy for Agriculture and Fisheries Statistics Mukesh Srivastava, Senior Statistician, FAO Regional Office for Asia and the Pacific SUMMARY The agriculture sector has to be well coordinated with a country’s development and other plans, such as its NSDS. Better coordination creates efficiencies, improves planning and opportunities to seek assistance, and most importantly results in a greater likelihood of getting a champion (ie national minister). TYPSS provides an inspirational approach, but maybe does not provide the region with all the statistics required and so perhaps there is a need for an action plan such as a long term plan of 5 to 10 years, that should be well harmonized with the TYPSS and the Global Strategy (and taking advantage of its research outputs). This kind of plan can work on the basis of a common minimum plan across all countries, whereby one-on-one TA is replaced with FAO supporting multi-country tools, standards of questionnaires, common training materials, document and information sharing via south-south collaboration, etc.
5.2 Workshop – Day Two
SESSION 4: ASSESSING COUNTRY CAPACITY TO PRODUCE AGRICULTURAL AND RURAL STATISTICS (INCLUDING FISHERIES) Capacity assessment framework for the Global Strategy and findings of the FAO 2011 baseline survey, Mukesh Srivastava, Senior Statistician SUMMARY: For the FAO 2011 baseline survey Capacity Assessment Questionnnaire for agricultural and rural statistics there were 4 dimensions (and 23 elements within these 4 dimensions): institutional infrastructure; resources – financial and human; statistical – methods and practices; and availability of statistical information. The speaker also discussed in detail the indicators for the four dimensions and 23 elements, and gave examples of questions to be asked (refer to the presentation). Based on this analysis of the questionnaire responses received from 13 countries in the Pacific sub-region (half of FAO and ESCAP member countries in the Pacific), the FAO 2011 Baseline Survey concluded: “Many countries in the sub-region produce less than a quarter of the

Page 23 of 38 – October 2015 Summary Report: Workshop for Agriculture and Fisheries Statistics
minimum core data items” and “responses received were often insufficient to establish a proper baseline for the Pacific…”. Lessons learned for FAO from the process for the Pacific include the need to simplify the questionnaire and support it with guidelines and increased FAO assistance, as well as communicate more clearly to countries that this is a measure of capacity so reporting weaknesses is useful and not negative. Mukesh explained that: “These are indicators and not precise measures, so when you are applying these questions you need to be honest as that will be more useful as tool for FAO to see the weaknesses and strengths and then make informed decisions (glean guidance) on key areas of need, etc.” The 2015 questionnaire takes a country about 2 hours to complete, plus 4-5 hours to compile the indicators. SESSION 4: ASSESSING COUNTRY CAPACITY TO PRODUCE AGRICULTURAL AND RURAL STATISTICS (INCLUDING FISHERIES) Capacity assessment questionnaire: ‘Country Questionnaire for the Assessment of Agricultural Statistical Systems in Pacific Island Countries’, Anthony Burgard, FAO SUMMARY Consultant for FAO Anthony Burgard went through the FAO’s 2015 questionnaire, explaining each questions and highlighting that even if a country does not have an answer, to still provide a response explaining why it cannot answer (that information is of significant use for a capacity assessment). The main goal of the GS is to build sustainable capacity of the statistical systems to meet the requirements of data for monitoring developments. For the purpose of monitoring the impact of work done under GS, and well as for designing appropriate interventions, a global framework for assessing and monitoring capacity has been developed including the standard questionnaire. SESSION 5: AGRICULTURAL CENSUS AS THE MAIN PILLAR OF AGRICULTURAL STATISTICS New features of the FAO World Programme of Census of Agriculture (WCA) 2020 (presented on behalfof Castano Jairo, FAO) Main features and changes of the WCA 2020 SUMMARY In preparation for the WCA 2020 the FAO has held extensive consultations over 2013-14 with census stakeholders (countries in the regions, FAO divisions and DOs, the International Advisory Group on FAO Statistics (IAGFS) about the implementation of the WCA 2010 and other experiences and inputs. Beginning with 1950, the FAO World Programme for the Census of Agriculture (WCA) has been helping countries to carry out their national agricultural census at least once every decade using standard international concepts, definitions and methodology. The programme assists countries by providing guidelines to generate internationally comparable figures on variable defining structure of agriculture, such as number and area of farms by size, number of livestock by type and age/sex classification, land tenure and land use, crops grown and agricultural inputs. FAO encourages countries to develop their programmes of censuses and surveys, keeping in view their priorities, practices and resource availability within the
Page 24 of 38 – October 2015 Summary Report: Workshop for Agriculture and Fisheries Statistics
framework of a modular approach advocated in WCA 2010. Details: http://www.fao.org/economic/ess/ess-wca/en/ WCA 2020 will have close linkages to the Global Strategy. Other aspects include the introduction of two new themes: ‘Fisheries’ and ‘Environment/GHG emissions’ plus the theme ‘Agricultural practices’ has extended the items on sustainable agriculture. Also there will be an increased emphasis on ‘Use of information technology (IT)’ such as use of IT in data collection, processing and dissemination. SESSION 5 (continued): AGRICULTURAL CENSUS AS THE MAIN PILLAR OF AGRICULTURAL STATISTICS. FAO World Programme of Census of Agriculture (WCA) 2020 - The Global Strategy and the Planning of an Agricultural Census (Chapter 2 of WCA 2020), Anthony Burgard, FAO Consultant SUMMARY FAO consultant, Anthony Burgard, provided additional background context to the WCA 2020 and explained the strong linkages it has with the GS. In terms of context, a general decline in the overall quality and availability of agricultural statistics has been observed by FAO, compounded by the fact that many countries are not adequately including agriculture statistics (including Agricultural census) in the national strategies for the development of statistics (NSDS). There is also a need for more reliable and timely statistical data with emerging needs pointing to data on climate change, environment, land and water use; and data on rural poverty The WCA agricultural census contributes to the Global Strategy’s implementation through three pillars: minimum set of core data of the GS (first pillar); integration of agricultural statistics into the national statistical system (second pillar); and capacity building exercise (third pillar). In turn, the GS contributes to census by providing operational aspects and research documents including a Master sample frame; integrated census and surveys programme (AGRIS); documentation and software on CAPI and the use of remote sensing; elaboration of SPARS (AC one of the pillars of the agricultural surveys programme; etc. The WCA 2020 programme makes cross references to relevant parts of the Global strategy, including referring the reader to the disseminated publications of the Global Strategy SESSION 5: AGRICULTURAL CENSUS AS THE MAIN PILLAR OF AGRCICULTURAL STATISTICS An example of Integrated Crop, Livestock, Fish and Handicraft Census, Mana’ia Halafihi, National Project Coordinator (NPC) - 2015 Tonga National Agricultural Census SUMMARY Tonga has just completed its 2015 National Agricultural Census and is about to analyse the results. It conducted an agriculture census in 1985, 2001 then 2015, so there are big gaps that the government would like to see reduced – ideally it wants to have one census every 10 years to generate more reliable data. Mr Halafihi explained it is important to Tonga to know that the residents of the country have enough food as food security is very important. The third agriculture census for Tonga was conducted from with assistance FAO. Coordinating a census is a complicated exercise, especially compared with a survey that can be quick and much simpler. Need a timeline, supervisors (including recruitment processes and
Page 25 of 38 – October 2015 Summary Report: Workshop for Agriculture and Fisheries Statistics
training manuals and support), spreadsheet of crops and their codes plus also English and Tongan names, down to details such as types of fishing ie reef gleaning, hand fishing, etc; summary forms to summarise census responses; village forms also created as most villages have a town officer who knows the economic information for the village. And even after using all the forms and training and running the census it is still good to “actually go the bush so you can compare what they have versus what (information) they give to you” such as measure the actual areas of the plantations. Many challenges such as allowing sufficient preparation time (FAO recommends 2 years planning and implementation time); getting the right people and providing the right training; remoteness of some geographic locations (ie Tonga has two remote islands closer to Samoa, one has flight only every fortnight and a grass runway which disallows landing in rain}, and even national events and traditions such as Tonga’s recent coronation for which the census was postponed. SESSION 5: AGRICULTURAL CENSUS AS THE MAIN PILLAR OF AGRCICULTURAL STATISTICS Federated States of Micronesia (FSM) Integrated Agriculture Census SUMMARY FSM last Agricultural Census was in 1969 and since 2012 been trying to have another, and currently in process of finalizing plans to have a census next year but needs further funds to enable this process (FAO committed US$200,000; SPC committed US$150,000; FSM Congress committed US$50,000 but current estimated funding gap of US$389,399 would prevent implementation of a full census but would allow a 15% sample). Thus, funds are available for an Agricultural Survey (Plan B) but stakeholders have requested that time be allocated for identification of additional funds for a Census (Plan A). FSM is keen for an agriculture census to provide: baseline data on the structure of agriculture, especially for smaller farmers/fishers; policy makers with minimum set of core data, for evidence-based policy development and project monitoring and evaluation purposes; benchmarks to improve current crop and livestock statistics (GDP, etc) and to provide sampling frames for follow-up agricultural sample surveys; and to establish a sustainable plan for ensuring regular updating of agriculture, forestry, fishery and livestock data (at least every 2 years) through integration with other national survey tools. SESSION 6: RECENT GLOBAL AND REGIONAL ADVANCEMENTS IN AGRICULTURE AND FISHERIES STATISTICS Recent Developments on Agriculture Integrated Surveys (AGRIS), Carola Fabi, TA and Training Coordinator for the FAO Global Strategy – Rome (on behalf of François Fonteneau, Program Coordinator, FAO Statistics Division) SUMMARY AGRIS collects 65% of the Minimum Set of Core Data (MSCD) for the Global Strategy and makes a large contribution to SDGs monitoring, but importantly it can be used as a cheaper and faster ways countries to collect statistical data on the agricultural and rural sector. AGRIS, being a 10-year integrated survey program, lays the foundations for the creation of an efficient agricultural statistical system. It complements the Agricultural Census.

Page 26 of 38 – October 2015 Summary Report: Workshop for Agriculture and Fisheries Statistics
SESSION 6: RECENT GLOBAL AND REGIONAL ADVANCEMENTS IN AGRICULTURE AND FISHERIES STATISTICS Collecting fishery data through agricultural census, Mukesh Srivastava, Senior Statistician FAO SUMMARY The presentation provided a broad overview about collecting fishery data through agricultural census, with fishing activity divided into the broad categorization of: Industrial fishing; semi industrial and artisanal or small scale fisheries – this category in particular highlights how fisheries has environmental and social indicators. FAO’s World Agriculture Census (WCA) 2020 has a section dedicated to fisheries, developed together with the FAO Fisheries Division. SESSION 6: RECENT GLOBAL AND REGIONAL ADVANCEMENTS IN AGRICULTURE AND FISHERIES STATISTICS Fisheries data collection in the Pacific Michael Sharp, Economic Adviser (Household Surveys), Statistics for Development Program - Secretariat of the Pacific Community SUMMARY The SPC’s Michael Sharp gave an overview of fisheries data collection based on the context of their being three categories of fisheries in the Pacific: Industrial, artisanal and inshore. Some trends raised for fisheries include: the dramatic increase in tuna catch volumes since per seine introduced in 1980; in Tuvalu its GDP is perhaps 60-70% from tuna fishing license; the SPC tagging programme is comprehensive with about 500,000 fish tagged to monitor over fishing and other trends. For industrial fisheries monitoring there is comprehensive scientific monitoring (also economic/price monitoring but limited financial monitoring) with 100% observer coverage of purse seine (independent observer coverage/person on every boat so very comprehensive) plus 5% (target) observer coverage of longline, full log sheet coverage (in theory should have 100% of longline log sheets excluding smaller vessels), and other monitoring. Artisanal tuna fisheries has ongoing monitoring in some countries - not without coverage challenges - and other project based monitoring, such as Fish aggregating device (FAD) monitoring. The main issue with monitoring artisanal vessels is that many are not based in rural not urban areas so cannot glean 100% logsheet data making it difficult to monitor vessels. Inshore fisheries monitoring is ad hoc and with low coverage. There are many complexities of inshore fisheries: many species of fish, coral, invertebrates, etc so monitoring them takes a very specific approach and not a one size fits all model. Inshore is an area we perhaps least understand but one that Pacific communities rely most upon, ie subsistence fishing. One thing missing from regional fishing monitoring is the socio economic aspects and perhaps the use of census for agriculture and HEIS can really add a lot to the fishing monitoring that is currently occurring. Mr Sharp commented that it is “good we are all in the room together with agriculture, fisheries and statistics (people) and I encourage us all going forward to collaborate more closely.”
Page 27 of 38 – October 2015 Summary Report: Workshop for Agriculture and Fisheries Statistics
SESSION: TECHNOLOGY Use of Computer Assisted Personal Interviewing in the Pacific: CAPI / Mobile – Android Pierre Wong – SPC SUMMARY An overview was provided about the traditional ‘pen and paper’ versus tablet data collection modes, including the benefits and disadvantages, based on the current pilot, such as technology based interviews taking more resources to set-up but then offering considerable time and potential cost savings long term, but then GPS is not as good as manual systems (though results can improve with user training). Some features of the pilot include the hardware ($350 for the Samsung Galaxy Tab 4) as well as the design, including 11 selected EA (Enumeration Area), 365 households, and run in Parallel as silent observers. Experiences and results found tablets are currently best deployed for limited areas for simple and complex studies; that use is simple and enumerator errors are reduced; screens can be difficult to read in the sunlight (an unexpected issue); development time takes longer than traditional methods and needs much longer for testing and planning. Need to select the right collection mode, CAPI or tablet. SESSION 6: RECENT GLOBAL AND REGIONAL ADVANCEMENTS IN AGRICULTURE AND FISHERIES Dissemination of Statistics: POPGIS 2.0, Pierre Wong – SPC SUMMARY POPGis is a mapping tool to produce and customize maps and that can be configured to your liking, ie if have fisheries information then can can upload it into this interactive system. Six countries have their POPGIS2 released (Solomon Islands, Fiji, Tuvalu, FSM, Kiribati, Vanuatu) and soon also Tonga and Cook Islands (scheduled November 2015): http://www.spc.int/popgis2 Users can download maps from Google maps or Bing maps as a background layer to the data, which is a powerful and useful feature now incorporated into POPGIS. Also can pinpoint households or a whole nation, province or community – depending on needs or confidentiality restrictions. There are also visual indicators, and can use colour code or symbols or pie charts, as well as provide ‘split maps’ (ie Tongan islands are broadly dispersed but with split maps can crop and place them all on one page. Can also download geographic layers and datasets for more complex analysis with desktop GIS, plus can control security access to certain indicators or geographical levels (certain people can be nominated various levels of access).
5.3 Workshop – Day Three
SESSION: GLOBAL AND REGIONAL ADVANCEMENTS IN AGRICULTURE AND FISHERIES Use of S-HIES for agricultural and fisheries statistics, Anna Fink, SPC Agricultural Statistician SUMMARY Delegates were provided information about the agriculture modules that can be inserted into a standard Household Income and Expenditure Survey (HIES). This ‘Standardised’ HIES activity provides a standardised questionnaire, classifications, data processing system, and field work. It is aimed at achieving greater harmonisation of statistical systems and classifications, and

Page 28 of 38 – October 2015 Summary Report: Workshop for Agriculture and Fisheries Statistics
comparable national statistics and indicators. For example, there is Module 1 – demographic (individuals, diary module) and also Module 4 – household and individual income (agriculture module). Modules were developed through ongoing technical working groups to revise and update them, and used in Solomon Islands (2012/13); Nauru (2013); FSM (2013/14); Palau (2014) and is planned for: Tokelau (2015/16), Tonga (2015/16), Niue, Cook Islands and Tuvalu. Discussed how collecting agriculture and fisheries data through HIES is never as good as an agriculture census, but it does offer many advantages including a consistently collected basic data set of information. Collecting agricultural and fisheries data from the HIES has methodological and interpretative challenges but it is also a rich source of data which is hard to get through other means particularly for countries which do not conduct agriculture or fishery household surveys. Strengths and weaknesses were also discussed. Strengths include the approach being cost-effective for countries which cannot conduct a separate Agriculture Census; it is conducted over a 12-month period and that can ‘smooth-out’ seasonal fluctuations, plus it captures valuable subsistence production. There is also the issue of non-standardised units (ie ‘bundles’ or ‘baskets’ versus kilograms) and these have to be determined by countries (in an agriculture census can provide significant detail on this but as an inserted module in the HIES units need to be kept simple). Other weaknesses include: production, income received and expenditure by commercial entities and public entities (e.g. schools, hospitals) are not captured, though this is less important for many Pacific countries; and that the sample of the survey is limited as the agriculture module will only be completed by households who nominate themselves as being involved in agriculture, e.g. perhaps 6 in 10 (whereas a specific agricultural census would be targeted to 10 out of 10). SESSION 6: GLOBAL AND REGIONAL ADVANCEMENTS IN AGRICULTURE AND FISHERIES Population census for agricultural and fisheries statistics, Michael Sharp, Economic Adviser (household surveys) - Statistics for Development Division, SPC SUMMARY A regionally standardised questionnaire has been developed for the 2020 round of Population and Housing Census that includes a core and supplementary agricultural module (including fisheries, aquaculture, forestry and handicrafts). The speaker discussed how this workshop involving agriculture, fisheries and FAO experts is a great opportunity to gather feedback on the new questionnaire, which was yesterday circulated along with the first draft of the census module for 2020, with feedback due by the end of the month. There are recommended core questions and recommended supplementary questions (e.g. 4 questions for agriculture, 1 for livestock, 1 for management, 3 for fisheries, 2 for forestry, 2 for hunting, 2 for aquaculture). The rationale for the inclusion of agriculture in census is three-fold: basic data requirements are not being met (e.g. capacity in agricultural statistics has declined since early ’80s in terms of both collection and use of data); agricultural statistics are not integrated in the National Statistical System (e.g. typically there is a lack of coordination between NSO & Min. of Agriculture; lack of coordination can result in duplicated efforts in data collection or conflicting numbers); and emerging data needs (e.g. data for SDGs; environment, etc). Briefly discussed the history of census that include fisheries, based on a review of about 40 past census with fisheries included, and not one country collected the same information over

Page 29 of 38 – October 2015 Summary Report: Workshop for Agriculture and Fisheries Statistics
two consecutive census and so no chance of time series, also about 40% asked about fishing activity versus 5% production questions. Thus, good history but need for better consistency. SESSION 6: GLOBAL AND REGIONAL ADVANCEMENTS IN AGRICULTURE AND FISHERIES Evidence-based policy-making in the Pacific: developing targeted food and nutrition policies using Household Income and Expenditure Survey data Tim Martyn, Policy Officer - Food and Agriculture Organisation SUMMARY Provided an overview of the importance of gathering and, in particular, using HIES statistical data for evidence-based policy-making for food and nutrition policies, especially for food security and NCDs. Research indicates the extra cost is minimal to convert the current un-nutritional diets to become nutritional, with a focus on some of the local super foods such as island cabbage. However, there is work to prepare the data set to include nutrition in HIES. Key messages from the presentation were that: HIES data provides policy-makers with an insight into food and nutritional security of households, by sub-population, in order to identify at risk groups; and HIES also identifies which foods contribute most to poor nutrition, and improved nutrition. This enables PICs to design and implement policies which effectively target policy interventions. Next steps involve FAO working in number of PICs to use HIES to source food and nutritional insights to agriculture and health sector stakeholders, specifically Vanuatu (launching report October 2015); Samoa (launching November 2015); FSM (beginning Nov 2015; aim to launch Jan 2015), and Solomon Islands (beginning Nov 2015; launching Feb 2016). SESSION 7: LINKAGE BETWEEN NSDS, SPARS, TYPSS NAD Pacific SPARS NSDS in Asia-Pacific: Lessons learnt and opportunities for integration, Alan Nicholls FAO SUMMARY A National Strategy for the Development of Statistics (NSDS) is expected to provide a country with a 5 to 10-year strategy for developing statistical capacity across the entire national statistical system (NSS), to enable countries to build a reliable statistical system that produces the data necessary to design, implement, and monitor national development policies and programmes. It provides a vision for the NSS. NSDS aims to assist statistical development that in recent times has been a bit disjointed so trust in data can be weak; the use of data in policy and monitoring has been minimal; and often donors focus on specific needs rather than long term strategies. In combination, these factors result in systems that are not integrated or harmonized -NSDS turns the viscous cycle into a virtuous cycle to ensure a better overall, synchronised system rather than pockets of statistical systems. An update on the status of NSDS was provided globally, and also in the Pacific, where 4 are being implemented (Samoa recently had a mid-term evaluation of NSDS, Vanuatu, Cook Islands, PNG), while and NSDS is being designed for 3 countries (Fiji, Tonga, Solomon Islands), and planned for another 3 (Tokelau (end of 2015), Tuvalu, Timor-Leste (2016).

Page 30 of 38 – October 2015 Summary Report: Workshop for Agriculture and Fisheries Statistics
Some of the benefits of the NSDS process in Pacific countries, so far, include transforming how NSS is managed, organized, and coordinated; and strengthened advocacy on statistics at the highest policy level as ministries better understand the strategic approach for statistics and their link to development and evidence-based policy. NSDS areas for improvement include the identification of key national indicators in the NSDS; alternative sources of statistics other than surveys and censuses (e.g., administrative data); strengthening of sector and subnational statistical systems (i.e., better integration in the NSDS); and improving resources for NSDS implementation including on sector-specific statistical concerns. SESSION 7: LINKAGE BETWEEN NSDS, SPARS, TYPSS NAD Pacific SPARS Integrating Agriculture into National Statistical Systems: Connection between NSDS and SPARS, Allan Nicholls FAO SUMMARY It is best to plan ahead if want to link results of different census or surveys. Delegates were provided with information about how integrating agriculture into National Statistical Systems (NSS) and bolstering links with NSDS and SPARS, can improve a country’s strategic approach to statistics as well as agency coordination. Collaboration is important across agencies, firstly across agriculture agencies (fisheries, ag, forestries, etc), then extend this ‘united agricultural approach’ to collaborate with other agencies for better integration of agriculture into the National Statistical System (NSS), ie with National Statistics Office (NSO), etc. If an NSDS is under development that is an ideal time to integrate with SPARS (SPARS is a cornerstone of NSDS if developed in parallel). Alternatively, if there is no NSDS a country can still develop SPARS, but with a future view for it to be potentially and easily integrating it into a future NSDS. TYPSS offers a similar relationship as NSDS/SPARS, but at a regional level. Mr Nicholls explained exactly what is meant by integration, starting with the integration of agriculture into the NSS, whereby agriculture is part of the overall statistics planning and collection processes; there is the use of a master sample frame for agriculture and use of standard concepts, definitions and classifications; an integration of the Population Census and Agriculture Census.
Page 31 of 38 – October 2015 Summary Report: Workshop for Agriculture and Fisheries Statistics
5.4 Workshop Group Activity - Day Three and Day Four
Refer to this Workshop Summary Report’s section 3.0 ‘Pacific Plan for agriculture and fisheries statistics’ for details of the Group Activity discussions and conclusions, in relation to the proposal to establish a Pacific Strategic Plan for Agricultural and Fisheries Statistics. SESSION: GROUP ACTIVITY The Strategic Planning for Agriculture and Fisheries Statistics for Pacific Island Countries workshop addressed the many issues faced by both smaller and larger Pacific Island countries. In particular, delegates discussed the gaps and opportunities for improved agriculture and fisheries statistics in the Pacific, and the proposal to establish a Pacific Strategic Plan for Agricultural and Fisheries Statistics (PSPAF). Specifically, in the final sessions of the workshop, on Day 3 and Day 4, workshop delegates discussed considerations for the proposed strategy. This group work and plenary discussions focussed on a series of questions in relation to the strategy, which included: • What are some of the critical agriculture, fisheries and rural data gaps, constraints and challenges in each country? • What are the main objectives and considerations for a regional strategy on agriculture and fisheries statistics? (Refer to Section 3.5 ‘Objectives and Activities’ for a summary) • What key activities should be considered for the strategy? (Refer to Section 3.5 ‘Objectives and Activities’ for a summary) • Next steps for developing a strategic plan for agricultural and fishery statistics? (Refer to Section 3.6 ‘Summary of Next Steps’ for details). For more details refer to the following sections of this Workshop Summary Report:
Section 3.0 ‘Pacific Plan for agriculture and fisheries statistics’ for a summary of the outcomes and actions resulting from the group discussions, including the formation of the Technical Working Group (TWG).
Appendix 6.4 ‘Group Discussions – New Strategy Challenges and Constraints’ for a one-page summary of discussions, in relation to each of the questions
Appendix 6.3 ‘Complete Presentations’ for full details all activities and discussions held on Days Three and Four.)

Page 32 of 38 – October 2015 Summary Report: Workshop for Agriculture and Fisheries Statistics
6.0 APPENDICES
6.1 Agendas
6.2 Participant Lists
6.3 Complete Presentations (Refer to separate ‘Appendix 5.3’ document) 6.4 Group Discussions – New Strategy Challenges and Constraints
Page 33 of 38 – October 2015 Summary Report: Workshop for Agriculture and Fisheries Statistics
6.1 Agenda
Workshop on Strategic Planning for Agricultural and Fisheries Statistics for the Pacific Island
Countries 5-8 October 2015, Nadi, Fiji
Agenda and Session Plan
Day 1: Monday 5th October 2015
08:30-09:00 Registration
09:00-10:00 Opening session Chair: Deputy Director of the Land Resources Division, Ken Cokanasiga Opening remarks: FAO Sub-regional Coordinator for the Pacific, Gavin Wall Formal opening: Honourable Minister for Agriculture, Fiji, Inia Seruiratu Honoured speaker: EU Head of Delegation Ambassador, Andrew Jacobs
10:00-10:30 Tea break/Group photo
10:30-12:30 Chair: Chair of the PAPP Programme Steering Committee, Patrick Arioka Session 1: Statistics for policy making on agricultural and rural sectors in Pacific Countries
Pacific context and demand from agricultural policy for statistics (Vili Caniogo, SPC)
Key features of TYPSS and agricultural statistics (Simil Johnson, Chair of TYPSS PSC)
Discussion (Led by Mukesh Srivastava on data for monitoring the SDGs)
This session will provide the context and rationale for work on agricultural and fisheries statistics in the Pacific by looking at emerging data demands and existing plans and projects.
12:30-13:30 Lunch break
13:30-14:30 Session 2: Global Strategy to Improve Agricultural and Rural Statistics
An overview of the Global Strategy for Agricultural and Rural Statistics and the Regional Action Plan (Allan Nicholls, FAO)
Global Strategy research outputs and new methodologies (Carola Fabi, FAO, Rome)
Discussion
This session will inform the participants about the context, need and design of the Global Strategy in addition to how it is implemented at country level. The research agenda to meet the need for new methodologies will also be presented. Feedback from countries on whether current research meets their needs will be welcome.
14:30-15:00 Session 3: Strategic Planning for Agricultural and Rural Statistics
Guidelines on SPARS (Carola Fabi, FAO, Rome)
15:00-15:30 Tea break
15:30-17:00
Session 3 (continued):
Overview of work in Pacific Countries and experience in other Asian countries (Allan Nicholls, FAO)
The rationale for a Pacific Strategy for Agriculture and Fisheries Statistics (Mukesh Srivastava, FAO)
Discussion (Led by Anna Fink, SPC)
The session will present the global guidelines on preparing SPARS, and how these have been adapted to specific needs of selected Pacific countries. The discussion
Page 34 of 38 – October 2015 Summary Report: Workshop for Agriculture and Fisheries Statistics
will focus on the need for adaptation of these guidelines to pacific countries. This session will also introduce the rationale for a Pacific Strategic Plan on Agricultural and Fisheries Statistics.
6pm-8pm Welcome Cocktail
Day 2: Tuesday 6th October 2015
09:00-10:30 Session 4: Assessing country capacity to produce agricultural and rural (including fisheries) statistics
Capacity assessment framework for the Global Strategy and findings of the FAO 2011 baseline survey (Mukesh Srivastava, FAO)
Experience of capacity assessment in FSM (FSM)
Clarification on completing abridged country assessment questionnaires (FAO)
Discussion
The main goal of the GS is to build sustainable capacity of the statistical systems to meet the requirements of data for monitoring developments. For the purpose of monitoring the impact of work done under GS, and well as for designing appropriate interventions, a global framework for assessing and monitoring capacity has been developed. The framework implemented through a standard questionnaire results in a set of indicators on various dimensions and elements of capacity to produce agricultural and rural statistics, which can be compared across countries and over time. The session will present this framework to the countries and clarify any doubt towards implementation of these in the countries.
10:30-11:00 Tea break
11:00-12:30 Session 5: Agricultural census as the main pillar of agricultural statistics
New features of the FAO World Programme of Census of Agriculture 2020 (Jairo, Castano, FAO)
The WCA 2020 and the Global Strategy (FAO)
An example of Integrated Crop, Livestock, Fish and Handicraft Census (Mana’ia Halafihi, Tonga)
Agriculture Census in FSM (FSM)
Discussion
An agricultural census occupies a strategic place in the statistical system as it provides an opportunity to update the agricultural system. The successive FAO WCA programmes have provided guidance to countries to develop an agricultural census as per their need. The session will present the key features of WCA 2020 and some good practices which could be adopted during the next decade. The session will also provide an occasion for countries to share their plans for agricultural censuses and clarify the technical issues related to these.
12:30-13:30 Lunch break
13:30-15:00 Session 6: Recent global and regional advancements in agriculture and fisheries statistics
Recent developments on Agriculture Integrated Surveys (AGRIS) (Carola Fabi, FAO)
Collecting fishery data through agricultural census (Mukesh Srivastava)
Fishery data collection in the Pacific (Michael Sharp, SPC)
Use of Computer Assisted Personal Interviewing in Pacific (Pierre Wong, SPC)
Discussion (Led by Carola Fabi, FAO)
15:00-15:30 Tea break
15:30-17:00 Session 6 (continued) :
Dissemination of statistics/POPGis (Pierre Wong, SPC)
Use of household income and expenditure surveys (HIES) for agriculture and fisheries statistics (Anna Fink, SPC)
Population census for agricultural and fisheries statistics (Michael
Page 35 of 38 – October 2015 Summary Report: Workshop for Agriculture and Fisheries Statistics
Sharp, SPC)
HIES for food security analysis (Tim Martyn, FAO)
Discussion
This session will highlight some of the recent work conducted under TYPSS related to increasing the collection and use of agricultural and fisheries statistics which could form a core element of a Pacific strategy on Agriculture and Fishery Statistics.
Day 3: Wednesday 7th October 2015
09:00-10:30
Session 7: Linkage between NSDS, SPARS, TYPSS, and Pacific-SPARS
Integrating agriculture into National Statistical Systems: Connection between NSDS and SPARS (Allan Nicholls, FAO)
Work of PARIS 21 for developing NSDS in Pacific countries (TBC)
Pacific country experience in development of NSDS (TBC)
Discussion
Discussion will focus on the importance of linking existing national and regional level strategies on statistics in preparation for group work on the development of a regional strategy.
10:30-11:00
Tea break
11:00-12:30
Session 8: Group work on Pacific Agriculture and Fishery Statistics Strategy The participants will be assigned groups and asked to prepare presentations on the following questions:
1. Critical data gaps, constraints and challenges 2. Main objective of a regional strategy 3. Key activities for a regional strategy 4. Main steps for development of a regional strategy
12:30-13:30
Lunch break
13:30-15:00
Session 8 (continued):
15:00-15:30
Tea break
15:30-17:00
Session 9: Roundtable on Pacific regional strategy for agricultural and fisheries statistics
Presentation of outputs from group work
Day 4: Thursday 8th October
09:00-10:30
Session 9(continued): Recap and plenary discussion
Discussion on identification of key features of a Pacific Strategy on Agriculture and Fishery Statistics
10:30-11:00
Tea break
11:00-12:30
Session 10: Draft roadmap and key features of Pacific-Strategy for Agricultural and Fisheries Statistics
Lead presentation from meeting organisers
12:30-13:30
Lunch break
13:30-15:00
Concluding session: Conclusions and recommendations and follow-up work.
End of workshop cocktail. Time (TBC)
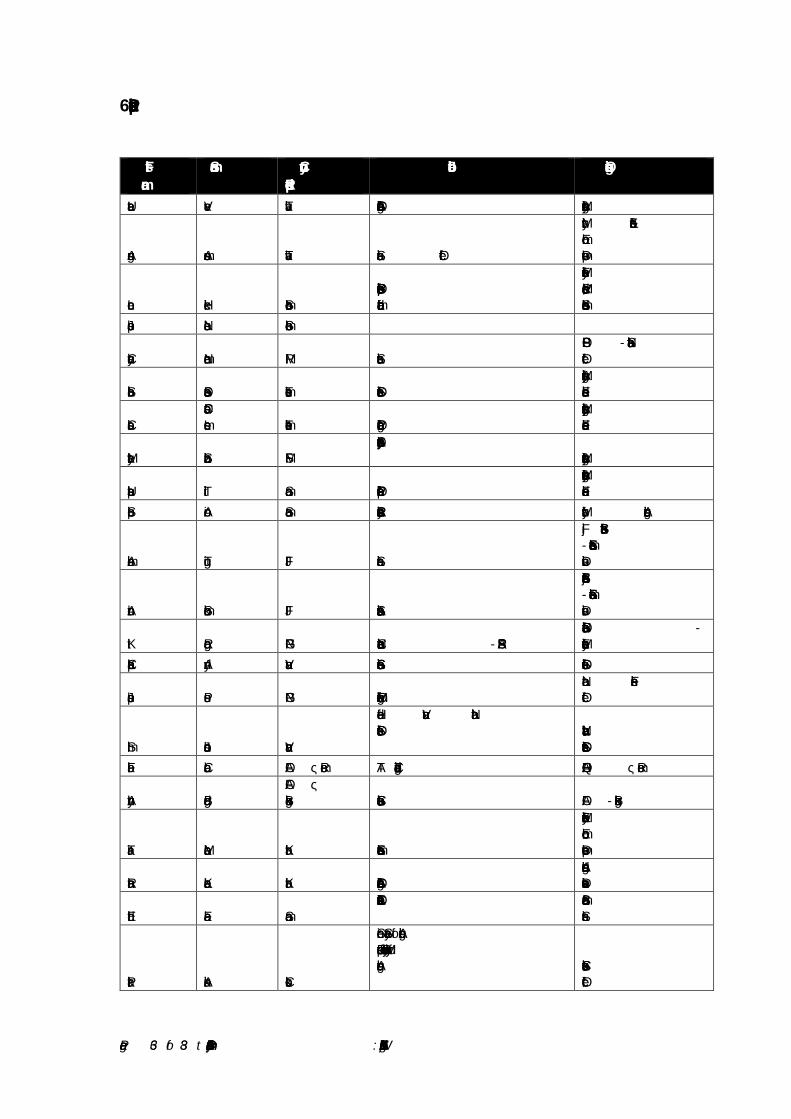
Page 36 of 38 – October 2015 Summary Report: Workshop for Agriculture and Fisheries Statistics
6.2 Participant List
First name
Surname Country Represented
Job title Organisation
Uatea Vave Tuvalu Senior Agriculture Officer Ministry of Agriculture
Angus Amasone Tuvalu Statistician Officer
Ministry of Finance & Economic Development
Leon Hickie Solomon Is Principle Fisheries Office, Statistics and Information.
Ministry of Fisheries and Marine Resources, Solomon Islands
Joseph Naesol Solomon Is
Carolyn Neamon RMI Statistician EPPSO - National Stats Office
Sabilio Dos Santos Timor Leste Statistics Officer Ministry of Agriculture and Fisheries
Carlos Da Costa Lemos Timor Leste Planning Officer
Ministry of Agriculture and Fisheries
Marlyter Silbanuz FSM Deputy Assistant Secretary Ministry of Agriculture
Ulusapeti Tiitii Samoa Principal Fisheries Officer Ministry of Agriculture and Fisheries
Silupe Aiono Samoa Policy Research Assistant Ministry of Agriculture
Amelia Tungi FIJI Statistician
Fiji Bureau of Statistics - Economic Statistics Division
Antonio Sokomuri FIJI Assistant Statistician
Fiji Bureau of Statistics - Economic Statistics Division
Kit Ronga PNG National Consultant - SPARS National Stats Office - Ministry of Finance
Kap Calo Andy Vanuatu Senior Statistician Statistics Office
Joseph Posu PNG Fisheries Management Officer National Fisheries Office
Simil Johnson Vanuatu
Head of Vanuatu National Statistics Office
Vanuatu National Statistics Office
Fabi Carola FAO – Rome TA and Training Coordinator FAO HQ – Rome
Anthony Burgard FAO – Bangkok Consultant on Statistics FAO - Bangkok
Tiriara Moaniba Kiribati Economic Statistician
Ministry of Finance & Economic Development
Rutiana Kareba Kiribati Senior Agriculture Officer Agriculture and Livestock Division
Edith Faaola Samoa Assistant Chief Executive Officer
Samoa Bureau of Statistics
Patrick Arioka Cook Is
Senior Secretary of Agriculture, Department of Policy, Ministry of Agriculture
Cook Is. Statistics Office
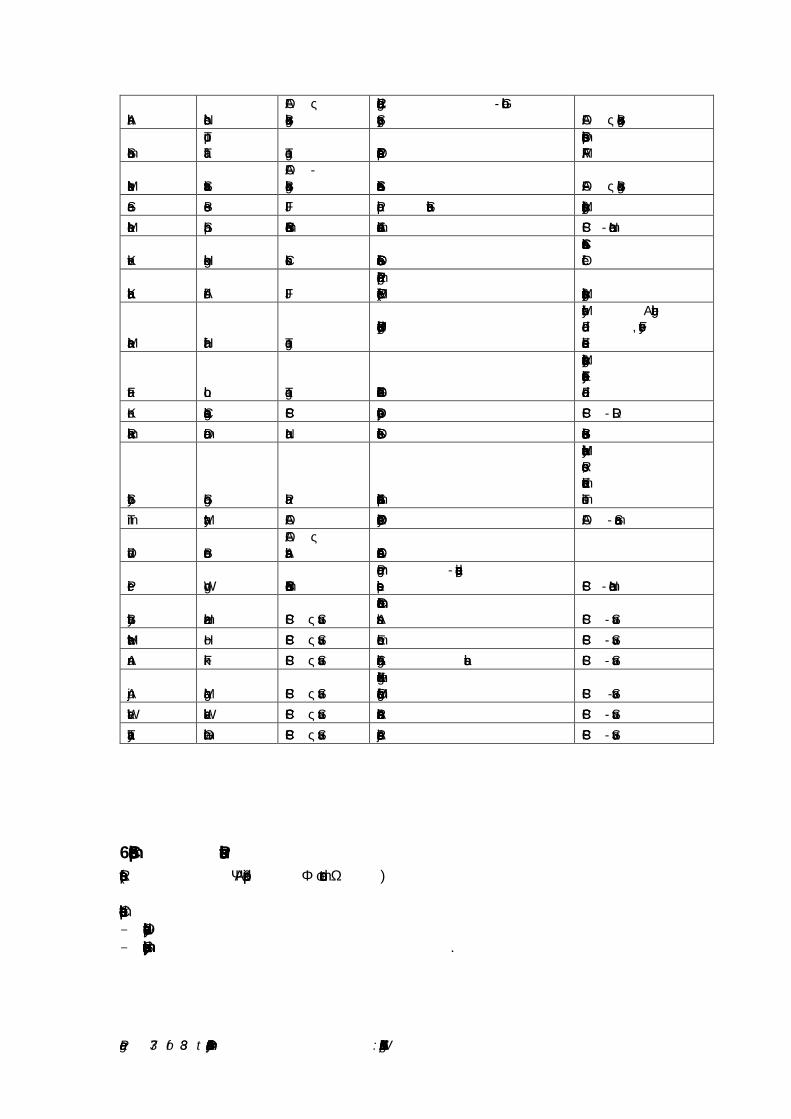
Page 37 of 38 – October 2015 Summary Report: Workshop for Agriculture and Fisheries Statistics
Allan Nicholls FAO – Bangkok
Regional Coordinator - Global Strategy FAO – Bangkok
Salome Tupou Taufa Tonga Principal Fisheries Officer
Fisheries Department, MAFFF
Mukesh Srivastava FAO - Bangkok Senior Statistician FAO – Bangkok
Sera Bose FIJI Principal Statistician Ministry of Agriculture
Michael Sharp SPC Noumea Economic Adviser SPC- Noumea
Kevin Hosking Cook Is Senior Statistics Officer Cook Is. Statistics Office
Kolianita Alfred FIJI Principal Economic Planning Officer (M&E) Ministry of Agriculture
Manaia Halafihi Tonga Head of Policy and Planning Unit
Ministry of Agriculture and Food, Forestry and Fisheries
Futa Lolo Tonga Technical Officer Grade 2
Ministry of Agriculture & Forestry, Fisheries and Food
Ken Cokanasiga SPC Deputy Director SPC - LRD
Ramrahka Detanamo Nauru Statistics Officer Bureau of Statistics
Scherryl Solang Palau Administrative Specialist II
Ministry of Natural Resources, Environment and Tourism
Tim Martyn FAO FAO Policy Officer FAO - Samoa
David Brereton FAO – Australia FAO Consultant
Pierre Wong SPC Noumea Programmer - data processing specialist SPC- Noumea
Brittany Hazelman SPC – Suva Information & Communication Assistant SPC - Suva
Matthew Ho SPC – Suva Economist SPC - Suva
Anna Fink SPC – Suva Agricultural Statistician SPC - Suva
Anju Mangal SPC – Suva Information & Knowledge Management Officer SPC -Suva
Walter Wasile SPC – Suva Publications Assistant SPC - Suva
LaTanya Gwilliam SPC – Suva Project Assistant SPC - Suva
6.3 Complete Presentations
(Refer to separate ‘Appendix 6.3’ document) Complete presentations include: - Overview of daily discussion topics - Summary presentation and complete presentations.
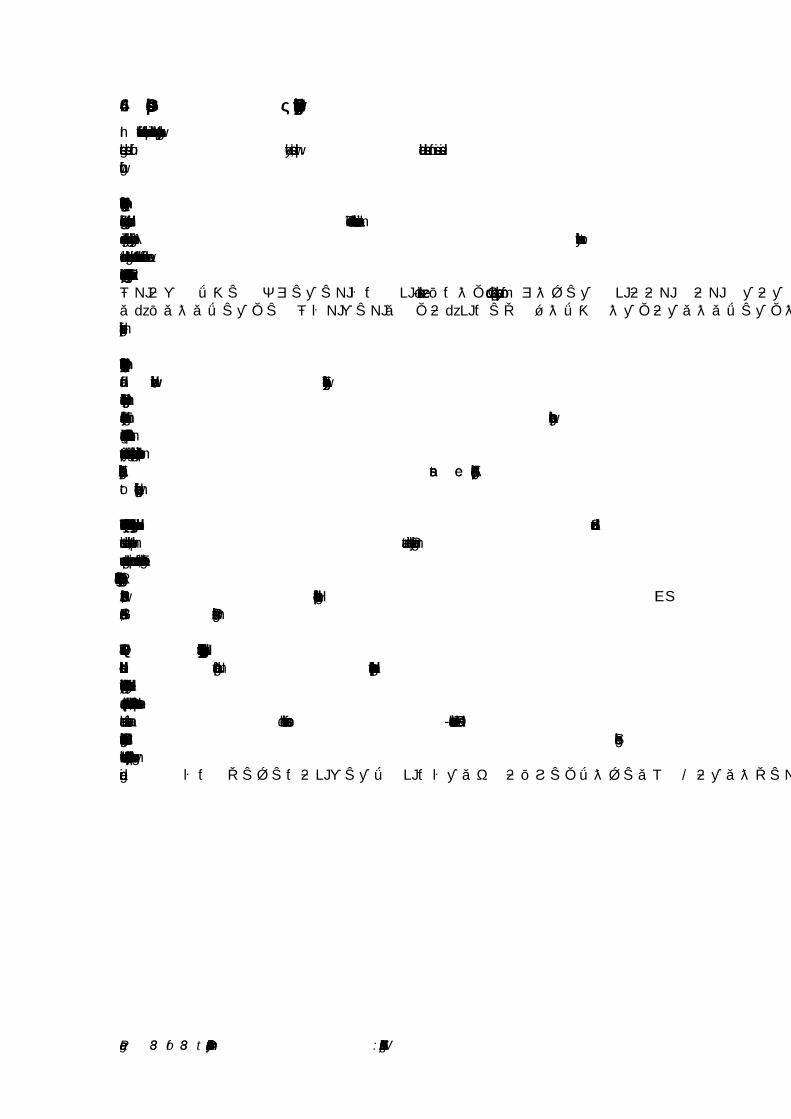
Page 38 of 38 – October 2015 Summary Report: Workshop for Agriculture and Fisheries Statistics
6.4 Group Discussions – New Strategy Challenges and Constraints
In the final sessions of the workshop, and in relation to the proposed strategy, workshop delegates discussed four key questions, with detailed summaries of issues discussed following. QUESTION 1: Some of the critical agriculture, fisheries and rural data gaps, constraints and challenges in each country include: The need for better collaboration and harmonization across agencies plus also national, regional and global approaches; Accessibility such as to remote islands or highlands; Human resources in terms of the number of staff as well as technical capacity of staff; Funding; Information Technology (IT) support; Reliability of data from the ‘general public’ given poor or non-existent record keeping especially from subsistence farmers coupled with inconsistencies of classifications (ie general “bundles” of produce versus specific kilograms). QUESTION 2: The main objectives and considerations for a regional strategy on agriculture and fisheries statistics would be: The need for any regional strategy to be realistic in what it can achieve in the short term, and including decision making; Potential to expand into other areas such as forestry, livestock, environment and climate change; To align with other plans and strategies such as the SDGs; Have a coordinated approach at all levels from institutions (departments and donors) to coding (common regional tools and classifications); Improve technical resources capacity including Technical Assistance (TA) and training support; Be able to compare agriculture and fisheries statistics between countries in the region. QUESTION 3: Key activities included in the strategy would be, or consider: Standard and consistent data collection methods; Improve data and dissemination systems; Promoting awareness programs about the importance and use of statistics; Enhancing collaboration Regional training and capacity building; Further establish mechanisms to integrate TYPSS and SPARS into countries, as well as coordinated approaches for countries to integrate into HIES and use AGRIS; Promotion of new technologies like CAPI. QUESTION 4: Next steps for developing a strategic plan for agricultural and fishery statistics should include: Nominate a group to draft and develop the strategic plan (perhaps consultant involved); Technical Working Group to follow the drafting of this plan and ensure deadlines are met; Implementation component should be included; Promote the plan to ensure the actual use of statistics and the involvement of cross-sectoral stakeholders from NSO and agriculture ministries; Circulate the draft to donors, SPC and others for feedback; Seek high level endorsement such as from PIFS; Incorporate objectives of the plan with governments and regional development plans’ objectives; Consider inviting PSSE.