studies on modulated electrohyperthermia induced...
TRANSCRIPT

STUDIES ON MODULATED ELECTROHYPERTHERMIA
INDUCED TUMOR CELL DEATH IN A COLORECTAL
CARCINOMA MODEL
PhD thesis
Nóra Meggyesházi M.D.
Pathological Sciences Doctoral School
Semmelweis University
Supervisor: Dr. Tibor Krenács Ph.D.
Official reviewers:
Dr. Tibor Glasz Ph.D.
Dr. Gyula Péter Szigeti Ph.D.
Head of the Final Examination Committee:
Dr. Péter Sótonyi Member of MTA.
Members of the Final Examination Committee:
Dr. Gábor Lotz Ph.D.
Dr. Árpád Csurgay Member of MTA
Budapest, 2015

1
1. TABLE OF CONTENT
1. TABLE OF CONTENT ................................................................................................. 1
2. ABBREVIATIONS ........................................................................................................ 4
3. INTRODUCTION .......................................................................................................... 7
3.1. Characteristics of hyperthermia in oncology ........................................................... 7
3.1.1. Forms of hyperthermia ..................................................................................... 7
3.1.2. Theoretical background of local hyperthermia ................................................. 8
3.1.3. Pre-clinical observations and results ................................................................ 9
3.1.4. Clinical observations ...................................................................................... 10
3.2. Principles of modulated electrohyperthermia ........................................................ 11
3.2.1. Bioelectrodynamic description of tissues ....................................................... 12
3.2.1.1. Conditions and variables ............................................................................. 12
3.2.1.2. Bioelectrodynamic characteristics of malignancies .................................... 13
3.2.2. Biophysical background of modulated electrohyperthermia .......................... 14
3.2.3. Clinical observations using modulated electrohyperthermia.......................... 16
3.3. Theoretical background of the observed biological impact of hyperthermia ........ 16
3.3.1. Characteristics of cell death forms ................................................................. 17
3.3.2. Characteristics of immunogenic cell death forms .......................................... 20
4. OBJECTIVES ............................................................................................................... 24
5. MATERIALS AND METHODS ................................................................................. 25
5.1. Tumor model .......................................................................................................... 25
5.1.1. Cell line .......................................................................................................... 25
5.1.2. Animal model ................................................................................................. 25
2
5.2. Treatment conditions and sampling ....................................................................... 26
5.3. Histomorphological analysis .................................................................................. 27
5.4. Molecular analysis ................................................................................................. 29
5.4.1. mRNA chip analysis .............................................................................................. 29
5.4.1.1. Total RNA isolation and RNA quality control ........................................... 29
5.4.1.2. Microarray analysis ..................................................................................... 29
5.4.2. Apoptosis protein array .......................................................................................... 30
5.4.3. Immunohistochemistry and immunofluorescence ................................................. 30
5.4.4. Terminal deoxynucleotidyl transferase nick end labeling (TUNEL) assay ........... 33
5.4.5. Western blot ........................................................................................................... 33
6. RESULTS ..................................................................................................................... 35
6.1. Histomorphological analysis of treatment related tumor cell death ...................... 35
6.2. Detection of treatment related DNA fragmentation............................................... 36
6.3. Detection of treatment related differential mRNA expression .............................. 37
6.4. Detection of apoptosis related differential protein expression .............................. 38
6.5. Detection of treatment related differential protein expression in situ.................... 41
6.5.1. Programmed cell death related proteins ......................................................... 41
6.5.2. Stress related proteins ..................................................................................... 47
6.5.3. Identification of immune cells ........................................................................ 52
7. DISCUSSION ............................................................................................................... 54
8. CONCLUSION – NEW OBSERVATIONS ................................................................ 62
9. SUMMARY ................................................................................................................. 63
10. ÖSSZEFOGLALÁS .................................................................................................. 64
11. BIBLIOGRAPHY ..................................................................................................... 65

3
12. BIBLIOGRAPHY OF THE CANDIDATE’S PUBLICATIONS ............................. 77
13. ACKNOWLEDGEMENTS ...................................................................................... 79

4
2. ABBREVIATIONS
AEC aminoethylcarbazole
AIF apoptosis inducing factor
Apaf 1 apoptotic protease activating factor 1
APC antigen presenting cell
AsPC-1 human pancreatic cell line
ATP adenosine triphosphate
Bag3 Bcl-2-associated athanogene 3
Bak Bcl-2 homologous antagonist/killer
Bax Bcl-2 associated X protein
Bcl-2 B-cell lymphoma 2
BID BH3 interacting-domain death agonist
BSA bovine serum albumin
CD cluster of differentiation
CHPP continous hyperthermic peritoneal perfusion
CRT calreticulin
DC dendritic cell
DAB 3,3’ diaminobenzidine
DAMP damage associated molecular pattern
DAPI 4’,6 diamidino-2-phenylindole
dATP deoxyadenosine triphosphate
DMEM Dulbecco’s modified Eagle’s minimal essential medium
DNA deoxyribonucleic acid
DNAJB DnaJ (Heat shock protein 40) homolog, subfamily B
DIABLO direct IAP-binding protein with low pI
dUTP 2'-deoxyuridine 5'-triphosphate
ECL electrochemiluminescence
EDTA ethylenediaminetetraacetic acid
ER endoplasmic reticulum
FADD Fas-associated protein with death domain
FASL Fas ligand

5
FCS fetal calf serum
FFPE formalin-fixed paraffin-embedded
FOV field of views
HIPEC hyperthermic intraperitoneal chemotherapy
HMGB1 high mobility group box 1
HRP horseradish peroxidase
HSF heat shock factor
Hsp70 heat shock protein 70
Hsp90 heat shock protein 90
HSPA heat shock protein 70 A
HT29 human colorectal adenocarcinoma cell line
HTRA2 high temperature requirement protein A2
H&E hematoxylin and eosin
IAP inhibitor of apoptosis
ICD immunogenic cell death
Ig immunogloubulin
log2FC binary logarithm of fold change
mEHT modulated electrohyperthermia
MHC major histocompatibility complex
MIAME Minimum information about a microarray experiment
MIAPaCa-2 human pancreatic cell line
min/h minute per hour
MLS mitochondrial localization signal
MMP mitochondrial membrane permebilization
MPO myeloperoxidase
mRNA messenger ribonucleic acid
NF-κB nuclear factor kappa-light-chain-enhancer of activated B cells
NK natural killer
PS phosphatidilserin
PVDF polyvinylidene difluoride
RAGE receptor advanced glycation endproducts
RIN RNA integrity number

6
RIP1 receptor-interacting serine/threonine-protein kinase 1
RIP3 receptor-interacting serine/threonine-protein kinase 3
rMA relative mask area
RNA ribonucleic acid
ROS reactive oxygen species
SAM significance analysis of microarrays
SAR specific absorption rate
SAS human tongue squamous cell carcinoma cell line
SDS-PAGE sodium dodecylsulfate polyacrylamide gel
tBID truncate BH3 interacting-domain death agonist
TBS Tris-buffered saline
TDE tumor destruction efficiency
TDR tumor destruction ratio
TdT terminal deoxynucleotidyl transferase
TER thermal enhancement ratio
TIM3 T-cell immunoglobulin domain and mucin domain 3
TLR2/4 Toll like receptor 2/4
TMA tissue microarray
TNFα tumor necrosis factor α
TNFα-R1 tumor necrosis factor α receptor 1
TRAIL TNF-related apoptosis-inducing ligand
TRAIL-R1 TNF-related apoptosis-inducing ligand receptor 1
TRAIL-R2 TNF-related apoptosis-inducing ligand receptor 2
TUNEL terminal deoxynucleotidyl transferase dUTP nick end labeling
WBH whole body hyperthermia
WGA wheat germ agglutinin
εk complex permittivity
σk complex conductivity
T temperature difference
t time difference
Eloc average local electric field
ρ density of a material
7
3. INTRODUCTION
3.1. Characteristics of hyperthermia in oncology
The term hyperthermia in oncology refers to techniques of heat application administered to
tissues as an adjunct to conventional strategies of cancer treatment such as chemo- or
radiotherapy. (Hildebrandt et al. 2002). The aim of hyperthermia treatment is, like any
oncological therapies, to completely and selectively destroy the malignant tissue (Szasz et
al. 2010). Hyperthermia is mostly identified with a range of temperature of the target
between 40-48°C maintained at a treated site for a period of one hour or more each time
(Chicheł et al. 2007). From this loose definition it becomes clear that this is a rather
heterogeneous group of treatments with diverse efficiency and outcome depending on the
source of heat generation and the histogenesis, differentiation, site/microenvironment and
the defective regulatory pathways of the treated tumors.
3.1.1. Forms of hyperthermia
The main forms of hyperthermia include whole body hyperthermia, hyperthermic perfusion
techniques and local/regional hyperthermia (Hildebrandt et al. 2002).
Whole body hyperthermia (WBH) is used for patients with metastatic disease usually in
combination with chemotherapy. It can be performed by thermal chambers, hot water
blankets or infrared radiators. In extreme WBH the patient core temperature is heated up to
42°C for 60 minutes under general anesthesia or deep sedation, while in moderate WBH the
patient core temperature is heated up between 39.5-41°C for 3-4 hours (Chicheł et al.
2007). A few phase II studies were carried out using WBH in combination with
chemotherapy. WBH was applied with oxaliplatin, leucovorin and 5-fluorouracil treating
patients with metastatic rectal tumors with a 20% response rate (Hegewisch-Becker et al.
2002). Recurrent ovarian cancer and recurrent and metastatic ovarian cancer patients were
treated with WBH in combination with carboplatin with a response rate of 45% (Atmaca et
al. 2009) and 33% (Richel et al. 2004) respectively. The phase II study of metastatic soft
tissue sarcoma patients treated with WBH in combination with fosfamide, carboplatin and
etoposide revealed a 28.4% response rate (Westermann et al. 2003).

8
Hyperthermic perfusion techniques include hyperthermic isolated limb perfusion and
hyperthermic intraperitoneal perfusion with or without administering a chemotherapy agent
(hyperthermic intraperitoneal chemotherapy- HIPEC, continuous hyperthermic peritoneal
perfusion- CHPP) (Wust et al. 2002; Chicheł et al. 2007). HIPEC proved to be beneficial
for patients with peritoneal cacinomatosis from appendicial cancer, colorectal cancer,
ovarium cancer and peritoneal mesothelioma (Chua et al. 2009). The median survival was
found to be between 26 to 56 months in ovarian cancer with peritoneal carcinomatosis
when cytoreductive surgery was used with HIPEC (Chua et al. 2009). In colorectal cancer
with peritoneal carcinomatosis the median disease specific survival was found to be
22.2 months when cytoreductive surgery was applied with HIPEC while it was 12.6 months
in the control arm (Aoyagi et al. 2014). Hyperthermic isolated limb perfusion is a technique
bypassing a large supplying artery and a vein of a limb to deliver heat to drained blood in
an extra corporal way (Chicheł et al. 2007). This method has fewer side effects than WBH,
mostly administered in combination of chemotherapy in melanomas or soft tissue sarcomas
(Chicheł et al. 2007). Hyperthermic isolated limb perfusion may be used to treat malignant
melanomas with an overall median response rate of 90% (Moreno-Ramirez et al. 2010) or
soft tissue sarcomas with an overall response rate of 81.5% (Trabulsi et al. 2012).
Local hyperthermia is applied to tumors of relatively small size, while regional
hyperthermia is used to heat up a body region involving the tumor. For such heating
infrared radiation, microwaves, radio waves and ultrasound can be used (Szasz et al. 2002;
Chicheł et al. 2007). The following sections will briefly summarize what is known about
the biophysical background, major characteristics and utilization for cancer treatment of
local hyperthermia.
3.1.2. Theoretical background of local hyperthermia
Oncological hyperthermia uses heat energy to destroy the malignant cells. The absorbed
energy is converted to heat, which further leads to increment on temperature. Therefore,
one has to distinguish heat (as the absorbed energy) and the resulted elevation of
temperature as a consequence of energy absorption. Local/regional hyperthermia works by
energy/heat absorption in the targeted tissue volume. Although, blood flow can reduce the
9
efficiency of energy absorption by cooling the heated volume incorporating the tumor
tissue (Szasz et al. 2010).
3.1.3. Pre-clinical observations and results
To provoke the cytotoxic effect of hyperthermia either in vitro or in vivo, usually a water
bath is applied for generating heat within a therapeutic range of temperature and duration.
For example human head and neck squamous cell carcinoma cell line xenografted to the
hind leg of BALB/cA Jcl-nu mice, (Tamamoto et al. 2003) or HT29 human colorectal
carcinoma cell line xenografted to NCI Nu/nu mice (Sun et al. 2008) or HT29 xenografted
to BALB/C nu/nu mice were tested in this way (Liang et al. 2007).
Hyperthermia can inhibit DNA, RNA and protein synthesis during the treatment, but RNA
and protein synthesis rapidly recover after the treatment (Hildebrandt et al. 2002). The
DNA synthesis is inhibited due to denaturation of proteins involved in DNA repair such as
DNA-polymerase α and β and Rad51 (Hildebrandt et al. 2002; Genet et al. 2013). Heat can
change the fluidity of the cell membrane resulting in the softening or melting of the lipid
bilayer. This leads to the accumulation of cholesterol and ceramide in the lipid layer
resulting in the rearrangement of the lipid rafts with concomitant changes in the protein
content such as phospholipase A2 and phospholipase C causing either calcium release from
the ER or the transcriptional activation of heat shock proteins (Hsp) (Csoboz et al. 2013).
The heat stress related to hyperthermia on the other hand may induce heat shock protein
(Hsp) synthesis through protein aggregation and denaturation followed by heat shock factor
(HSF) binding to the promoter regions of different Hsp’s (Hildebrandt et al. 2002). The
elevated intracellular Hsp concentration can be cytoprotective (Horvath et al. 2010), may
translocate to the cytoplasm membrane, where it either protects the cell (Horvath et al.
2010) or act as an immunostimulant (Nishida et al. 1997; Hildebrandt et al. 2002).
Hyperthermia can lead to necrosis and programmed cell death in a tremperature dependent
manner in a murine mastocytoma cell line (Harmon et al. 1990) and in several
hematological tumor cell lines (Harmon et al. 1990; Baxter et al. 1992; Gabai et al. 1995;
Yonezawa et al. 1996). However, hyperthermia in vivo is usually used for targeting solid
tumors. Unfortunately the anti-tumor efficiency of hyperthermia can vary depending on the

10
models used. Hyperthermia for 1h at 43.5°C induced DNA fragmentation 6h post-treatment
in Dunn osteosarcoma cell line (Rong et al. 2000) and for 44 min on 44°C in human tongue
squamous cell carcinoma cell line (SAS) (Kajihara et al. 2008). On the other hand
hyperthermia was not found to be effective either at 42°C in colorectal cancer cell line
(HT29) (Shchepotin et al. 1997), or at 43°C when used for 1h in pancreatic cancer cell lines
(AsPC-1, MIAPaCa-2) (Adachi et al. 2009). In vivo however, instead of water bath infrared
radiation, microwave or radiofrequency is applied for generating heat.
Beside the cellular and cytotoxic effects, hyperthermia can regulate blood flow by elevating
blood flow/perfusion up to ~42oC and reducing it above 42°C. This can be exploited in
combination with chemotherapy for elevating the local concentration of chemotherapeutic
agents by moderate hyperthermia (Hildebrandt et al. 2002).
3.1.4. Clinical observations
Hyperthermia is usually applied in combination with radiotherapy, chemotherapy or both.
As mentioned above hyperthermia below 42°C can increase the blood flow, which is
reduced above this temperature. In clinical conditions local/regional hyperthermia in most
of the cases does not exceed 42°C, therefore, this is the basis of combinational therapy
(Hildebrandt et al. 2002). When hyperthermia and radiation therapy act synergistically the
term “thermal radiosenzitization” is used, which is most prominent in S-phase proliferating
cell fractions that are usually resistant to radiotherapy (Hildebrandt et al. 2002). To define
the benefit of the combinational therapy thermal enhancement ratio (TER, the quotient of
survival fraction of cells treated with radiation alone or with radiation and hyperthermia in
combination) is used (Overgaard 1984; Hildebrandt et al. 2002). Hypoxic cells, cells with
impaired nutrient supply and/or acidic pH, react sensitively to combined therapy of heat
and radiation (Dewey et al. 1977; Dewey 1994). Synchronous application of the combined
therapy would be the best routine; however, technical difficulties still need to be overcome
for this to be carried out. Therefore, in clinical practice heat and radiation are applied after
one and other within a short period of time. Some prefer applying radiation first followed
by heat within 2-4 hours, while others apply heat prior to irradiation. So far, neither of these
strategies has been tested by randomized clinical studies (Hildebrandt et al. 2002).

11
The term “thermal chemosenzitization” is used in analogy with thermal radiosensitization,
for indicating synergy between hyperthermia and chemo- or radiotherapy. The applicability
of chemotherapeutic agents in combination with hyperthermia depends on pharmacokinetic
properties of the drug. For example drugs which are metabolized in the liver should be
applied a few hours before hyperthermia (e.g.: cyclophosphamide, ifosfamide). One would
expect that changes in tumor blood supply will affect the distribution of the drug in the
malignant tissue. In reality, this interaction is highly complex and depends much more on
environmental factors such as fluid balance and pH in addition to blood supply, than
radiation and heat (Hildebrandt et al. 2002).
So far a few randomized trials have been carried out i.e. where hyperthermia was combined
with radiotherapy of head and neck tumors and breast cancers with a complete response
rate of 32% with hyperthermia and 30% without hyperthermia, (Perez et al. 1991;
Hildebrandt et al. 2002). Hyperthermia was used together with chemotherapy of soft tissue
sarcomas with a response rate of 28.8% in the combination group and 12.7% in the
chemotherapy group (Issels et al. 2010). A phase II study was performed on locally
advanced rectal tumors (T4) with an 83% disease free survival in the 24.9 months median
follow up time. (Barsukov et al. 2013).
3.2. Principles of modulated electrohyperthermia
Modulated electrohyperthermia (mEHT), a subtype of local/regional hyperthermia, is a
non-invasive technique for targeted tumor treatment using 13.56 MHz radiofrequency with
1/f amplitude modulation. Besides the thermal effect of the electric field generated by
mEHT, the electric field itself also has a tumor destructing effect (Andocs et al. 2009),
however its mechanism of action has not been described yet.

12
3.2.1. Bioelectrodynamic description of tissues
3.2.1.1. Conditions and variables
Biological materials can be described by complex permittivity and complex conductivity
(Mátay et al. 2000).
Complex permittivity (εk) is related to the dipole content of the biological material, due to
the cytoplasmic and extracellular macromolecules and the membrane bound
macromolecules. Tissue molecules as dipoles will rotate upon the influence of an exciting
electric field. This rotation will be asynchronous with the electric field due to the inertia
and the internal friction of the dipoles, this is called dielectric relaxation, which is time
dependent. This relaxation results in dispersion which is highly frequency dependent
(Mátay et al. 2000). The relaxation can be described by more than one relaxation constants
α, β, γ and δ (Figure 1). Each domain is determined by relaxation frequencies. α dispersion
( < 1 kHz) can be explained by the cell membrane capacitance. The capacitance decreases
from 20 µF/cm2 to 1 µF/cm
2 with the elevation of the frequency (1 Hz - 1 kHz.) This
decrement is caused by the elevated ion current through the plasma membrane. β dispersion
(1 kHz-10 MHz) is related to the accumulation of the dielectric material on the cell
membrane surface. γ dispersion (in the GHz range) is linked with the relaxation of the
bound water (Blad et al. 1996; Mátay et al. 2000; Zou et al. 2003). A small δ dispersion
exists between β and γ dispersion frequencies (not visible in Figure 1), related to bound
water on the macromolecules and the charged proteins (Schwan 1957; Mátay et al. 2000).
Besides dipoles, biological materials also contain free charges which can drift upon
influence by the electric field. To describe this drifting we use the term complex
conductivity (σk), which is also frequency dependent (Figure 1) (Mátay et al. 2000).
The interference between radiofrequency field and the biological material can result in
thermal and non-thermal effects. The thermal effect is related to the rotation of dipoles and
the concomitant friction, resulted in electric displacement of the electric field (Mátay et al.
2000).
The permittivity and the conductivity are characteristic to the biological material itself and
not the electric circuit (Mátay et al. 2000).
13
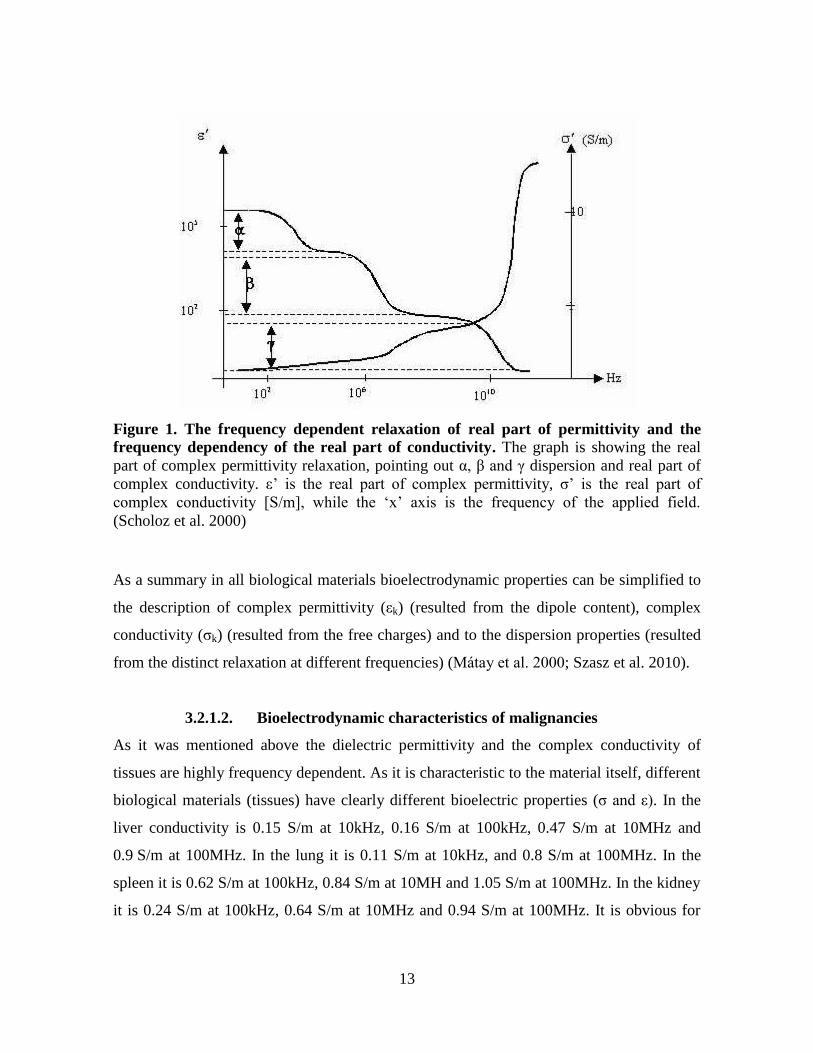
Figure 1. The frequency dependent relaxation of real part of permittivity and the
frequency dependency of the real part of conductivity. The graph is showing the real
part of complex permittivity relaxation, pointing out α, β and γ dispersion and real part of
complex conductivity. ε’ is the real part of complex permittivity, σ’ is the real part of
complex conductivity [S/m], while the ‘x’ axis is the frequency of the applied field.
(Scholoz et al. 2000)
As a summary in all biological materials bioelectrodynamic properties can be simplified to
the description of complex permittivity (εk) (resulted from the dipole content), complex
conductivity (σk) (resulted from the free charges) and to the dispersion properties (resulted
from the distinct relaxation at different frequencies) (Mátay et al. 2000; Szasz et al. 2010).
3.2.1.2. Bioelectrodynamic characteristics of malignancies
As it was mentioned above the dielectric permittivity and the complex conductivity of
tissues are highly frequency dependent. As it is characteristic to the material itself, different
biological materials (tissues) have clearly different bioelectric properties (σ and ε). In the
liver conductivity is 0.15 S/m at 10kHz, 0.16 S/m at 100kHz, 0.47 S/m at 10MHz and
0.9 S/m at 100MHz. In the lung it is 0.11 S/m at 10kHz, and 0.8 S/m at 100MHz. In the
spleen it is 0.62 S/m at 100kHz, 0.84 S/m at 10MH and 1.05 S/m at 100MHz. In the kidney
it is 0.24 S/m at 100kHz, 0.64 S/m at 10MHz and 0.94 S/m at 100MHz. It is obvious for

14
example that the conductivity of the spleen is higher than that of the liver or the lung. The
difference of σ or ε between the different tissues on diverse frequencies is not linear.
(Foster 2000; Raoof et al. 2013)
If we compare the bioelectric properties of malignant and non-malignant tissues at the same
frequency, malignant tumors show higher permittivity (ε) and conductivity (σ) than normal
tissues (Pethig et al. 1984; Blad et al. 1996; Zou et al. 2003; O'Rourke et al. 2007). For
example, in breast tissue in the range of 3MHz-3GHz, σ of the normal tissue increases from
1.5 to 3 mS/cm, while σ of malignant breast tumors increases from 7.5-12 mS/cm, while ε
of the normal tissue remains 10 and of the malignant it increases from 50 to 400. There is a
4-fold increase in conductivity and 5 to 40 fold increase in permittivity for the benefit of
tumors compared to normal tissues (Zou et al. 2003).
The elevated conductivity can be explained by the altered metabolism of the tumor cells.
This is called aerobic glucolysis or the Warburg effect. The high rate of glucose uptake and
lactate production results in an increased ion concentration and concomitant increased
conductivity (Szasz et al. 2010). On the other hand the altered electrical properties of
malignant tissue are attributed to increased cellular water and salt content, as well as altered
membrane permeability of the tumor cells (Pethig et al. 1984; Blad et al. 1996; Scholoz et
al. 2000; Zou et al. 2003; O'Rourke et al. 2007).
3.2.2. Biophysical background of modulated electrohyperthermia
Modulated electrohyperthermia is a non-invasive technique using capacitive coupled (the
targeted tissue is put between the condenser electrodes) 13.56 MHz radiofrequency with 1/f
amplitude modulation to target tumor tissue.
This specific frequency is used because of the following reasons. The applied
radiofrequency has to penetrate deeply into and across the body. The penetration depth
depends on the frequency used, as well as permittivity and conductivity of the targeted
tissue. Therefore, at a fixed frequency the penetration depth is higher e.g. through the same
thickness of homogenous fat than of homogenous muscle (Cheung 1982). In order to
ensure that capacitive coupled radiofrequency penetrates into and across the average human
body thickness the frequency has to be below 25 MHz (Szasz et al. 2010). The applied
15
frequency has to be safe, not to trigger nerve excitation, preferable to be between 10 kHz
and 1 GHz (Szasz et al. 2010) and has to be in the range of β dispersion (around 10 MHz)
to influence cell membranes including their embedded receptors (Szasz et al. 2010). It is
also practical to be in a free frequency range, which does not need shielding for avoiding
interference with other electronic devices. All these criteria meet at 13.56 MHz (Szasz et al.
2010).
The selectivity of mEHT is based on the difference in σ and ε values between malignant
and non-malignant tissue on 13.56 MHz. Significant difference in these values was found
among breast cancer, pancreatic carcinoma, and hepatocellular carcinoma cell lines but in
all cases both the permittivity and conductivity significantly exceeded of those found in the
related normal cells (Zou et al. 2003; Raoof et al. 2013).
The thermal effect of the electromagnetic field is associated with the absorbed energy by
the tissue; it is described by the specific absorption rate (SAR) (Mátay et al. 2000).
(1)
where σ is the conductivity, ρ the density of the material, while Eloc is the average local
electric field.
Changes in the temperature, as a thermal effect, can be described by the following:
(2)
where ΔT is the temperature difference in Δt time difference and C is the specific heat of
the biological material.
Therefore SAR can be used as the dose of the thermal effect of electromagnetic field.
On the other hand, in the interaction between the electric field and the biological material a
non-thermal (or non temperature dependent) effect can also be described related to the non
thermal equilibrium (Mátay et al. 2000). It was shown that mEHT has such effect on HT29
(human colorectal adenocarcinoma cell line) cancer xenograft model, where the thermal

16
and non-thermal effects act in synergy for tumor destruction, but the molecular mechanism
of these effects were not explained (Andocs et al. 2009).
3.2.3. Clinical observations using modulated electrohyperthermia
So far, mainly the thermal effect is taken into consideration when mEHT is used in clinical
practice. Therefore, mEHT represents a heating method in hyperthermic oncology.
There have been several case reports and retrospective studies published on the benefits of
using hyperthermia for anti-tumor therapy (Szasz et al. 2010). Though mEHT treatment can
interfere with tumor tissue in monotherapy it has been used for hyperthermic oncology in
phase I and phase II clinical studies in combination with chemo- and/or radiotherapy of
brain, liver, breast and gastrointestinal malignancies (Brazma et al. 2001; Fiorentini et al.
2006; Fiorentini et al. 2006; Wismeth et al. 2010). For instance, compared to the published
30-33 weeks median overall survival, temozolomide-based chemotherapy and radiotherapy
supported with mEHT resulted in 36 weeks median overall survival (n = 12) with one
complete and two partial remissions (response rate 25%) in recurrent malignant gliomas
(Fiorentini et al. 2006). Also, fluorouracil based chemotherapy combined with mEHT
resulted in 24.1 months median overall survival in liver metastatic primary colorectal
cancers (n = 90) compared to the 12 month median survival reported when fluorouracil
chemotherapy was used alone (Hager et al. 1999). Also, it has already been used in
combination with chemo– and radiotherapy with benefit for treating recurrent breast cancer
(Feyerabend et al. 2001).
3.3. Theoretical background of the observed biological impact of hyperthermia
Several studies have proven that hyperthermia can cause different cell death forms under
various programmed cell death subroutines (e.g. caspase dependent apoptosis or autophagic
cell death) and accidental necrosis at a heat absorption dependent manner (Hildebrandt et
al. 2002). In vitro circumstances caspase dependent programmed cell death was proven in
cervical cancer cell line and in osteosarcoma cell line (Zhou et al. 2011; Hou et al. 2014).
Hyperthermia induced DNA fragmentation was found in human head and neck squamous
cell carcinoma cell line and in murine fibrosarcoma cell line in vitro without further
17
specifying the exact programmed cell death subroutine (Tamamoto et al. 2003; Lui et al.
2010). In HT29 cell line in vitro cell death subroutines were contradictory (Chen et al.
2008; Makizumi et al. 2008) though in vivo the upregulation of Bax protein was found
without further clarifying the cell death mechanism (Liang et al. 2007). Accordingly,
hyperthermia related cell death mechanism needs to be specified in vivo in different tumor
types.
3.3.1. Characteristics of cell death forms
For the definition of different type of cell death forms we first have to define the first
irreversible phase within cell damage, the so called “point of no return” and then the
characteristics of a dead cell.
The “point of no return” in a cell’s fate can usually be characterized by (1) a massive
caspase activation, which is part of the classic apoptotic program. However, caspase
independent death may also occur, moreover, caspases might also be involved in non-lethal
pathways such as cell differentiation and activation. Further feature is the loss of
mitochondrial transmembrane potential (2), which is usually preceded by mitochondrial
membrane permeabilisation (MMP). The complete MMP (3) results in the liberation of
lethal catabolic enzymes or activators. Finally, the phosphatidilserin (PS) exposure (4) from
the inner to the outer leaflet of the plasma membrane can also be a sign of irreversible cell
damage (Kroemer et al. 2005; Kroemer et al. 2009).
The main characteristics of cell death are: loss of plasma membrane integrity (1); blebbing
of the cytoplasmic membranes and shrinkage of nuclear chromatin followed by the
complete fragmentation of the cell including the nucleus (2); the occurrence of discrete
nuclear bodies (referred to as “apoptotic bodies”) (3) and finally, the engulfment of cells’
corps by adjacent cells or phagocytes (4) in vivo (Kroemer et al. 2005; Kroemer et al.
2009).
Several subroutines of programmed cell death forms exist including apoptosis,
necroptosis/regulated necrosis, autophagic cell death, mitotic catastrophe, netosis,
parthantos, pyroptosis, anoikis, entosis and cornification (Galluzzi et al. 2012).

18
Apoptosis was first described as a specific morphological aspect of cell death by Kerr in
1972 (Kerr et al. 1972; Elmore 2007). It was first investigated occurring during the
development of Caenorhabiditis elegans, which is made up of 1090 somatic cells in an
adult worm of which 131 undergoes the apoptotic process during development (Elmore
2007). The morphological signs of apoptosis are reduction of cellular volume (pycnosis),
chromatin condensation, nuclear fragmentation (karyorrhexis), plasma membrane blebbing
(Elmore 2007; Kroemer et al. 2009; Galluzzi et al. 2012). For the molecular
characterization we have to differentiate extrinsic and intrinsic apoptosis, which can be
caspase dependent and independent (Galluzzi et al. 2012). Extrinsic apoptosis can be
initiated by a death ligand (e.g. FASL, TNFα and TRAIL) through death receptors (e.g.
FAS, TNFα-R1, TRAIL-R1 and TRAIL-R2). Alternatively, extrinsic apoptosis can also be
initiated by dependence receptors (netrin receptors) which exert lethal functions when the
concentration of their specific ligand falls below a critical threshold (Galluzzi et al. 2012).
Extrinsic apoptosis would undergo one of the three major signaling cascades: (1) death
receptor signaling, activation of caspase-8 followed by the activation of the effector
caspase-3 or (2) death receptor signaling activation of caspase-8 cleavage of BID (tBID)
resulting in MMP followed by caspase-9 and caspase-3 activation. Ligand deprivation-
induced dependence receptor signaling (3) followed by caspase-9 and caspase-3 cascade
activation (Galluzzi et al. 2012).
Intrinsic apoptosis can be triggered by intracellular stress such as DNA damage, oxidative
stress, cytosolic Calcium overload, accumulation of unfolded proteins in the endoplasmic
reticulum (ER), radiation, hypoxia, hyperthermia, viral infection or free radicals (Elmore
2007; Galluzzi et al. 2012). As a result of intracellular stress pores are formed in the
mitochondria membrane leading to release of intermembrane space proteins to the
cytoplasm (Elmore 2007; Galluzzi et al. 2012). The mechanism of pore formation can be
achieved by induction of mitochondrial permeability transition, in which non-specific pores
are opened in the outer and the inner membranes of the mitochondria. This can occur in
both programmed cell death and accidental necrosis (Gogvadze et al. 2006). The second
option for pore formation is the outer membrane permeabilisation by Bcl2 (B-cell
lymphoma 2) family pro-apoptotic proteins, such as Bax (Bcl-2 associated X protein) and
19
Bak (Bcl-2 homologous antagonist/killer) occurring in the apoptotic cascades (Gogvadze et
al. 2006; Galluzzi et al. 2012). Also, hypotonicity and the modulation of ionic fluxes can
lead to mitochondrial membrane permeabilisation (Gogvadze et al. 2006). Once the pores
are formed, the mitochondrial transmembrane potential decreases and the intermembrane
space proteins are released to the cytosol, such as cytochrome c, apoptosis inducing factor
(AIF), endonuclease G, direct IAP-binding protein with low pI (DIABLO) and high
temperature requirement protein A2 (HTRA2) (Galluzzi et al. 2012).
If the intermembrane space protein release is followed by a caspase dependent subroutine,
then the cytochrome c and Apaf1 (Apoptotic protease activating factor 1) (with d9ATP)
will form the apoptosome, which will further trigger the activation of pro-caspase-9 and the
effector cascase-3.
On the other hand mitochondrial AIF and endonuclease G can also tranaslocate to the cell
nucleus, where they can mediate large scale DNA fragmentation on a caspase independent
manner. AIF is synthesized in the cytoplasm as a 67 kDa protein with a mitochondrial
localization signal (MLS) in the N terminus. Once it is imported to the mitochondria MLS
is removed resulting in a 62 kDa mature protein. During the mitochondrial pore formation a
soluble 57 kDa fragment is cleaved form AIF, released from the intermembrane space and
transferred to the nucleus (Norberg et al. 2010). Although AIF does not have a canonical
DNA binding domain but has a positive charged surface which can bind to the negative
charged phosphate backbone of the DNA (Natarajan et al. 2012).
For a long time, necrosis was only considered as an accidental cell death mechanism,
however, it can occur also in a regulated manner referred to as programmed necrosis
(Galluzzi et al. 2012). It can be triggered by the same ligands and receptors as extrinsic
apoptosis (Denecker et al. 2001; Nicotera 2002; Christofferson et al. 2010; Vandenabeele et
al. 2010; Han et al. 2011), but caspases are inhibited, therefore RIP1 (receptor interacting
serin/threonin-protein kinase 1) and RIP3 (receptor interacting serin/threonin-protein kinase
1) are not degraded and activate the execution of regulated necrosis (Galluzzi et al. 2012).
RIP1 can be activated by autophosphorilation on Ser161 and dimerization. RIP3 can be
phosphorilated on Ser199 leading to its activation (Christofferson et al. 2010). Regulated
necrosis can occur on RIP1 dependent manner or RIP3 dependent but RIP1 independent

20
manner (Galluzzi et al. 2012). Although the initiation of necroptosis is known the
downstream execution mechanism is still unclear (Christofferson et al. 2010;
Vanlangenakker et al. 2012).
Autophagic cell death is characterized by a massive cytoplasmic vacuolization. This kind of
cell death can be related to some types of cancers which lack modulators like Bax, Bak or
caspases. In most cases autophagy acts as a cytoprotective response, only when it fails to
protect the cell it turns into a cell death mechanism (Galluzzi et al. 2012).
3.3.2. Characteristics of immunogenic cell death forms
Apoptosis was considered as an immunologically silent form of cell death, however,
recently it has been revealed that some lethal stimuli can lead to an immunogenic way of
cell death (Kroemer et al. 2009; Krysko et al. 2012). Immunogenic cell death (ICD) is a
form of programmed tumor cell death. In overlap with the molecular signs of programmed
cell death the spatiotemporal occurrence of the damage associated molecular pattern
(DMAP) is required for professional antigen presenting cells to trigger an antitumor
immune response. (Scheffer et al. 2003; Ullrich et al. 2008; Kepp et al. 2011; Garg et al.
2012; D'Eliseo et al. 2013; Ladoire et al. 2013). ICD is known to be provoked by massive
cell stress in synergy with programmed cell death (Kepp et al. 2009; D'Eliseo et al. 2013;
Krysko et al. 2013; Ladoire et al. 2013) triggered by chemotherapeutic agents (doxorubicin,
oxaliplatin etc.) (Tesniere et al. 2010; Ladoire et al. 2013), cardiac glycosides (Menger et
al. 2012), hypericin based photodynamic therapy (Castano et al. 2006; Mroz et al. 2011;
Garg et al. 2012) or capsaicin (D'Eliseo et al. 2013). It is of note, however, that these
interventions can generate slightly different DAMP patterns (Garg et al. 2013; Kroemer et
al. 2013).
The DAMP sequence, relevant to induce ICD in tumor cells include the pre-apoptotic
surface exposure of calreticulin (CRT), the surface appearance of heat shock proteins
(Hsp70 and Hsp90) and ATP release at early apoptotic stages, followed by passive release
of high mobility group box 1 (HMGB1) as well as Hsp70 and Hsp90 at the late stages
(Garg et al. 2010; Kepp et al. 2011; Garg et al. 2012; Martins et al. 2012; D'Eliseo et al.
2013; Garg et al. 2013; Ladoire et al. 2013).

21
Calreticulin is mainly located in the endoplasmic reticulum, interacting with ERp57 and
calnexin to maintain the proper protein folding. In the cytoplasm membrane ecto-
calreticulin, located in the lipid rafts, act as an ‘eat me‘ signal, where its life time is around
12h. The calreticulin exposure occurs before any sign of an apoptotic event, however an
apoptotic signal is required for this exposure. It is suggested that mitochondrial dysfunction
and reactive oxygen species (ROS) production with secondary endoplasmic reticulum stress
or local ROS generation at the endoplasmic reticulum or unfolded protein response
pathway plays an important role in ecto-calreticulin translocation (Garg et al. 2010; Garg et
al. 2013). Calreticulin translocation pathway is dependent on the inducer signal (Krysko et
al. 2012). Ecto-calreticulin can be uptaken by phagocytes and professional antigen
presenting cells (APC) through CD91 (Garg et al. 2010). Unfortunately, ecto-calreticulin
driven tumor antigen uptake alone is not sufficient for antitumor immune response (Ladoire
et al. 2013).
Heat shock proteins are a family of conserved chaperones induced by cell stress including
oxidative stress, irradiation, chemotherapeutic drugs, heat and electromagnetic field (Robert
2003; Blank et al. 2009; Horvath et al. 2010). Tumors frequently show elevated Hsp70
levels (Multhoff et al. 2011). In the cytoplasm, overexpressed Hsp70 can inhibit apoptosis
and act as a cytoprotector (Horvath et al. 2010) maintaining protein homeostasis
(Gehrmann et al. 2008). However, treatments using oxaliplatin, -radiation, anthracyclines,
epidermal growth factor receptor specific antibody or hypericin based photodynamic
therapy can trigger the cell membrane accumulation of heat shock proteins leading to ICD
(Gehrmann et al. 2008; Garg et al. 2010; Krysko et al. 2012; Kroemer et al. 2013). On the
other hand, cell membrane Hsp70 was also linked with the protection of membrane
integrity under stress conditions (Horvath et al. 2010). Therefore, in tumor therapy, cell
surface Hsp70 positivity has been associated both with negative prognosis, e.g. in lower
rectal carcinomas and in squamous cell carcinoma of the lung (Pfister et al. 2007;
Gehrmann et al. 2008) and also with improved outcome e.g. in gastric and colon
carcinomas (Pfister et al. 2007). Unfortunately, it is not known how the membrane bound
Heat shock proteins can translocate to the cell membrane from the cytoplasm (D'Eliseo et
al. 2013) but it was suggested that membrane bound Hsp is associated with

22
phosphatidilserin in tumor cells and by a flip-flop mechanism, it can be exposed to the
outer membrane leaflet into lipid rafts (Multhoff 2007). Heat shock proteins may have a
crucial effect on initiating immune response on APCs and NK cells (Gehrmann et al. 2008;
Garg et al. 2010). However, heat shock proteins alone on the cell surface are not enough for
signaling immunostimulation, they have to form a complex in the cell membrane with a
tumor peptide. This happens in paralel with the programmed cell death signaling
(Gehrmann et al. 2008; Garg et al. 2010; Multhoff et al. 2011). Besides the immunogenicity
of cell membrane Hsp70 (Gehrmann et al. 2008), extracellular heat shock proteins can
directly boost the innate immune response (Multhoff et al. 2011).
Both intracellular Hsp70 and Hsp90 assist in protein folding, by stabilizing proteins and
preventing their degradation (Calderwood 2013). Membrane exposure of Hsp90 can be
induced by bortezomib, anti-EGFR antibody (7A7) and hypericin-based photodynamic
therapy (Garg et al. 2013). The surface exposure of Hsp90 may trigger DC activation signal
required for cell-cell interaction between dying tumor cell and DC (Spisek et al. 2007),
although the Hsp90 receptor on DC remains unknown (Garg et al. 2013).
Release of HMGB1 represents a late signal of ICD with diverse roles. In the nucleus it acts
as a non-histone chromatin binding protein interacting with the minor groove of DNA and
regulatory molecules such as p53, NF-B and steroid hormone receptors (Kepp et al. 2011;
Guo et al. 2013; Ladoire et al. 2013). Upon cell stress HMGB1 is released either from
necrotic or apoptotic cells (D'Eliseo et al. 2013). Extracellular HMGB1 can be a cytokine-
like activator of macrophages, a chemotactant for neutrophils and a promoter of dendritic
cell (DC) maturation (Guo et al. 2013). However, epigenetic and posttranslational
modifications dictate HMGB1 further functions, its acethylation and phosphorilation on
both nuclear localization signal leads to secretion to the cytpolasm. Hyperphosphorylation
also relocates HMGB1 to the cytoplasm. HMGB1 may be oxidized in a caspase dependent
manner or related to ROS production (Guo et al. 2013). The reduced HMGB1 usually binds
to RAGE attenuating the pro-inflammatory activity but the oxidized protein binds to toll
like receptor (TLR) 2/4 on the dendritic cells which may lead to tumor-specific immune
response (Guo et al. 2013). However, if HMGB1 binds to TIM3 (T-cell immunoglobulin

23
domain and mucin domain 3) on tumor associated dendritic cells, it will inhibit anti-tumor
activity (Guo et al. 2013).
These DAMP signals combined with cancer antigens can stimulate the maturation of
antigen presenting cells, which finally ‘cross-prime’ and activate anti-tumor T-cell
immunity (Kepp et al. 2011; Sachamitr et al. 2012).
As a summary, the altered bioelectrodynamic properties of cancer can result in the
enrichment of electromagnetic field in the malignant compared to the normal tissues. Since
mEHT, a form of hyperthermic therapy, uses electric field in the radiofrequency range
(13.56 MHz) it can target the tumor tissue. The treatment related tumor cell death may
occur in a programmed manner utilizing caspase dependent apoptosis, caspase independent
apoptosis, programmed necrosis, autophagic cell death or accidental necrosis in the tumor
tissue. Heat by itself can induce caspase dependent programmed cell death, autophagic cell
death and accidental necrosis. In line with the treatment induced programmed cell death
specific DAMP signals may appear on malignant cells which can potentially trigger
specific anti-tumor immune response through DCs.

24
4. OBJECTIVES
1. Determining tumor cell damage induced by a single shot of modulated
electrohyperthermia (mEHT) treatment in an in vivo xenograft model set up using
HT29, an aggressive colorectal cancer cell line, in Balb/c (nu/nu)
immunocompromised mice.
2. Investigating the molecular background of cell death induced by the mEHT
treatment in the HT29 xenograft model.
3. Characterizing additional, cell stress related molecular changes induced by mEHT
in the HT29 xenograft model, which may promote antitumor immune response.
Testing for damage associated molecular pattern (DAMP) sequence relevant to
immunogenic cell death (ICD) response.

25
5. MATERIALS AND METHODS
5.1.Tumor model
HT29 colorectal adenocarcinoma cell line xenografted to Balb/c (nu/nu) mice were used to
determine the molecular mechanism of cell damage induced by a single shot mEHT
treatment.
5.1.1. Cell line
HT29 invasive colorectal adenocarcinoma cell line was propagated in Dulbecco’s modified
Eagle’s minimal essential medium (DMEM)+ GlutaMax, high-glucose (4.5 g/l) medium
including 10% heat inactivated fetal calf serum (FCS) and 1% streptomycin-penicillin
(5000 units penicillin and 5 mg streptomycin/ml). Cells were released from a sub-confluent
monolayer using 0.25% trypsin and 0.22 mg/ml ethylenediaminetetraacetic acid (EDTA)
for 5 min and suspended in a serum free medium to reach the required 107/ml cell
concentration. All reagents were from GIBCO (Invitrogen, Carlsbad, USA).
5.1.2. Animal model
Female nude Balb/c (nu/nu) mice (provided by the Experimental Animal House of the
National Research Institute for Radiobiology and Radiohygiene, Budapest, Hungary)
maintained in sterile environment, kept on sterilized food and water ad libitum under 12 h
dark/12 h light cycles. Both femoral regions of 6 to 8-week old mice were subcutaneously
injected with 0.1 ml suspension of 107/ml HT29 cells. The animals were treated using
mEHT 18 days after HT29 cell injection, when the diameter of symmetrical tumor implants
had reached ~1.5 cm. Laboratory animals were kept and treated in compliance with the
Hungarian Laws No. XXVIII/1998 and LXVII/2002 on the protection and welfare of
animals, and the animal welfare regulations of the European Union. The Governmental
Ethical Committee approved the study under No. 22.1/609/001/2010.

26
5.2.Treatment conditions and sampling
Tumor implants in the right legs of Balb/c (nu/nu) mice were placed into the plan-parallel
electric condenser of the circuit. The circuit’s impedance was kept at a standard 50 Ohm
and the electrode arrangement was asymmetrical. Animals were laid down on the
rectangular grounded (lower) electrode made of polished aluminum of 72.0 cm2, which was
kept at 37 °C during the treatment. A 2,5 cm2 round shaped electrode, made of flexible
textile (copper-silver-tin coated woven fabric; Lorix Ltd. Bajna, Hungary), was overlaid on
the tumor region for full skin contact and cooled from the outside using a wet pad
(Figure 2). Electromagnetic field was generated at 13.56 MHz radiofrequency using 1/f
amplitude modulation by a LabEHY instrument (both from Oncotherm Ltd, Paty,
Hungary).
Treatment groups involved 33 animals, which were delivered a single shot of mEHT for
30 min at an average power of 4 W under 100 mg/kg Ketamine and 10 mg/kg Xylazine
anesthesia. Parameters were adjusted to keep intratumoral temperature between 41-42 °C
on the treated side (right leg), measured with optical sensors (Luxtron FOT Lab Kit,
LumaSense Technologies, Inc. CA, USA). The subcutaneous temperature underneath the
electrode was kept at ~40 °C and the rectal and the contralateral (untreated) tumor (left leg)
core temperature was at ~37 °C. Sampling was made from both, treated (right leg) and
untreated (left leg) sides 0, 1, 4, 8, 14, 24, 48, 72, 120, 168, and 216 h after treatment using
3 mice in each group. Additional 5 sham treated control animals were sacrificed 3 at 24 h
and 2 at 72 h post-treatment. All in all 38 mice were sacrificed resulting in 76 tumor
samples.
One half of the excised tumors was fixed in 10% formalin, dehydrated and embedded
routinely into paraffin wax (FFPE). The other half was fresh-frozen in liquid nitrogen and
kept at -80 °C in deep freezer until further testing.

27
Figure 2 Experimental setup of modulated electrohyperthermia (mEHT) treatment.
A) Parameters of the electric field and tumor temperature between 41-42 oC during
treatment are monitored. B) Thermal probes and electrode cooling of the treated right side.
C-D) The electric field (red lines) is concentrated in the tumor implant (violet lump)
between the condenser electrodes but cannot pass through cell membranes.
5.3. Histomorphological analysis
Whole cross sections from each (11) time point of all 76 (treated, untreated and sham
treated control) tumor samples were stained for hematoxylin and eosin (H&E) for
histomorphological analysis of signs of cell death. The stained slides were digitalized using
Pannoramic Scan and analyzed with the HistoQuant module of Pannoramic Viewer
software (all from 3DHISTECH, Budapest, Hungary) based on image color and intensity
segmentation. The mEHT related tumor destruction ratio (TDR) was calculated by dividing

28
the area of destructed tumor tissue (D) by the whole tumor area (W) measured in whole
cross sections. Treatment related tumor destruction efficiency (TDE) was assessed by
dividing the TDR of the treated by the TDR of the untreated tumor of the same animal
(Figure 3A). For statistical analysis the Kruskal-Wallis test of the SPSS Statistics v.20
software (IBM Corp. New York, NY) was used.
Figure 3 Histomorphological analysis and TMA core selection. A) The damaged tumor
areas (circled in red) and the whole tumor areas (circled in blue) were delineated precisely
in digital slides at high microscopic power (at x45 theoretical objective magnification) and
measured with software. The tumor destruction ratio (TDR) value was calculated by
dividing the area of destructed tumor tissue (D in red) by the whole tumor area (W in blue)
measured in cross sections both of the treated (t) and untreated (u) tumors. The tumor
destruction efficiency (TDE) of mEHT treatment was assessed by dividing the TDR of the
treated tumor by the TDR of the untreated tumor of the same mouse. B) Standard regions of
2 mm diameter from the damaged-intact tumor border (1 and 2) and from the damaged
tumor center (3) were selected based on H&E stained slides.
The number of apoptotic bodies was counted at x100 objective magnification in 10
different microscopic fields of views (FOV) of 3 treated and 3 untreated samples at 48, 72 h
post-treatment time points. Statistical analysis was carried out using SPSS Statistics v.20
software (IBM Corp).First the normality distribution of the data was tested by Sapiro Wilk
test followed by a Student t-test.
In the course of the morphological analysis the signs of apoptotic, necrotic and autophagic
cell death were taken into consideration.

29
5.4. Molecular analysis
To assess the early (4 h post-treatment) mRNA based molecular changes of the mEHT
induced tumor damage a human genome expression array was used. To determine the form
of cell death and the stress related tumor response first as a screening method an apoptosis
array was applied followed by verifying the molecular changes using
immunohistochemistry, immunofluorescence, TUNEL assay and western blot.
5.4.1. mRNA chip analysis
To determine the early treatment related mRNA changes mRNA chip analysis was carried
out in 9 tumor samples.
5.4.1.1.Total RNA isolation and RNA quality control
Frozen tissue sections were prepared both from the 3 treated and the 3 untreated samples
collected at 4 h post-treatment and from the 24 h 3 sham treated controls. Total RNA was
extracted by Roche MagNA Pure LC RNA Isolation Tissue Kit (Roche, Basel,
Switzerland). RNA concentration was measured by NanoDrop instrument (Thermo
Scientific, Rockford, IL, USA). The quality of the nucleic acid was determined with
microcapillary electrophoresis system using Agilent BioAnalyzer 6000 Pico LabChip kit
(Aligent Technologies, Santa Clara, CA, USA). With RNA Integrity Number above 7 (RIN
> 7) 100 ng total RNA from each sample were mixed and 250 ng pooled total RNA was
amplified and labeled in each group.
5.4.1.2.Microarray analysis
The recommendation of Minimum Information About a Microarray Experiment (MIAME)
guideline was followed (Brazma et al. 2001). Amplification and labeling of the transcripts
was performed by using Affymetrix 3’ IVT Express Kit (Affymetrix, Santa Clara, CA,
USA). Samples were hybridized on HGU133 Plus2.0 arrays (Affymetrix) at 45 °C for 16 h.
The microarrays were washed and stained on Fluidics Station 450 device (Affymetrix)
using the vendors kit with the FS450_001 wash protocol. Fluorescent signals were detected

30
by Gene Chip Scanner 3000 (Affymetrix) following the antibody-based signal
amplification with streptavidin-phycoerythrin according to manufacturer’s instructions.
From the CEL files quality control and RNA digestion plots were generated in R-
environment using the Bioconductor system. The differentially expressed genes between
the analyzed sample groups were determined by SAM (Significance Analysis of
Microarrays) at the significance level p < 0.05. Feature selections were done according to
the log2FC (log2 fold change) values to select at least two-fold up/downregulated genes.
5.4.2. Apoptosis protein array
To screen the apoptosis related protein changes, tissue lysates were prepared from the
whole tumor sections of the 8, 14 and 24 h treated and 24 h sham treated control samples.
Proteins were isolated from the frozen samples using extraction buffer (20 mM Tris, 2 mM
EDTA, 150 mM NaCl, 1% Triton-X100, 10 µl/ml phosphatase inhibitor and 5 µl/ml
proteinase inhibitors) for 30 min on ice, followed by centrifugation at 15,000 rpm at 4 °C
for 15 min. Protein concentration was measured with Bradford assay the lysates protein
concentration was set to 100 µg/µl. The expression of 35 apoptosis-related proteins was
tested simultaneously in the treated and untreated samples using a nitrocellulose membrane
Proteome Profiler TM
Human Apoptosis Array Kit array (R&D, Minneapolis, MN). Arrays
were incubated on a shaker with 250 µl of 1,200 µg/ml protein lysates at 4 °C overnight,
then with biotinylated anti-human IgG for 60 min and Streptavidin-horseradish peroxidase
(HRP) conjugate for 30 min and visualized using a chemilunescence (ECL) kit
(SuperSignal® West Pico Chemiluminescent Kit; Thermo Sci., Rockford, IL) for 10 min in
Kodak Image Station 4000 mm (Rochester, NY). Semi-quantitative analysis of signal
density was done using ImageJ 1.45s (http://rsbweb.nih.gov/ij/).
5.4.3. Immunohistochemistry and immunofluorescence
All 76 FFPE tissue samples were used for creating tissue microarray (TMA) blocks to
further characterize the proteins –and their subcellular distribution- related to mEHT
induced cell death and cellular stress. TMAs included 3 cores of 2 mm diameter from, 2
from the edges of degraded and intact tumor border and 1 from the degraded center, of each

31
archived tissue using the semi-automated TMA Master (3DHISTECH Ltd., Budapest,
Hungary) (Figure 3B). For immunohistochemistry 4 m thick sections were dewaxed and
rehydrated routinely, and then endogen peroxidase enzymes were blocked using 3%
hydrogen peroxide in methanol for 20 min except for immunfuorescence. Antigen retrieval
was performed either in electric pressure cooker (Avair Ida YDB50-90D, Biatlon kft, Pécs)
at ~105°C for 50 min or in a microwave oven (Whirlpool, Benton Harbor, MI) ~100oC for
40 min by using buffer made either of 0.01 M sodium citrate-citric acid (citrate, pH 6.0) or
0.1 M Trisbase and 0.01 M EDTA (T-E, pH 9.0). For blocking non-specific tissue binding
of antibodies a buffer containing 1% bovine serum albumin (BSA) and 0.1% sodium azide
(Sigma Aldrich, St Luis, MO) was used for 20 min. Then, sections were incubated in
humidity chambers at room temperature for 16 h using the primary antibodies listed in
Table 1. For immunohistochemistry the EnVision polymer peroxidase detection system
(DAKO) was used for 30 min followed by enzyme development for 5-8 min under
microscopic control using either 3,3’-diaminobenzidine (DAB, brown) kit (RE7105, Leica-
NovoCastra, Newcastle, UK) or aminoethylcarbazole (AEC, red) kit (Dako, K3461). For
immunofluorescence detection either Alexa546 (orange-red) or Alexa488 (green, both from
Invitrogen-Molecular Probes) anti-rabbit Ig-s diluted in 1:200 were used for 90 min.
Between incubations the slides were washed in Tris-buffered saline (TBS) buffer for 3x2
min and finally counterstained using hematoxylin or 4’,6-diamidino-2-phenylindole (DAPI,
Invitrogen-Molecular Probes). For membrane staining wheat germ agglutinin conjugated
with Alexa488 (WGA, Invitrogen-Molecular Probes) was used.
Biomarker expression revealed by immunofluorescence was evaluated using image (color,
intensity and size) segmentation based software HistoQuant (3DHISTECH). 3-5
representative annotations per tumor section involving >1000 cells each were tested.
Relative mask area (rMA) was calculated by dividing stained area with the whole
annotation area in the following reactions: Bax, cleaved caspasase 3, TRAIL-R2, HMGB1,
Hsp70 and Hsp90. In the rest of detected markers, nuclear, mitochondrial or cell membrane
signals were counted in 10 (FOV) in each core at x100 magnification. Analyzing a single
time point, normality of the data was tested by Sapiro-Wilk test than in case of normal
distribution the Student t-test (independent) was applied, in case of non-normal distribution

32
the Mann-Whitney U-test was used. To analyze time series, we used the Friedmann test
followed by the Wilcoxon post-hoc test. The results were significant at p < 0.05. For all
statistical analysis the SPSS software (SPSS Statistics v.20; IBM, New York, NY) was
used.
Table 1. Antibodies and conditions used for immunohistochemistry and immuno-
fluorescence.
Antigen Clonality Host Dilution Vendor Antigen
retrival
AIF polyclonal rabbit 1:25 Cell Signaling T-E
Bax polyclonal rabbit 1:50 Sigma
Aldrich T-E
cleaved
caspase-3 polyclonal rabbit 1:100 Cell Signaling citrate
cytochrome c polyclonal rabbit 1:50 Cell Signaling T-E
mitochondrial
antigen
monoclonal
(113-1) mouse 1:50
BioGenex
Laboratories T-E
RIP1 monoclonal
(D94C12) rabbit 1:100 Cell Signaling T-E
RIP3 polyclonal rabbit 1:400 Sigma
Aldrich T-E
TRAIL-R2 monoclonal
(D4E9) rabbit 1:50 Cell Signaling T-E
Ki-67 monoclonal
(SP6) rabbit 1:600 LabVision T-E
calreticulin polyclonal rabbit 1:100 Cell Signaling T-E
HMGB1 polyclonal rabbit 1:200 Cell Signaling T-E
Hsp70 polyclonal rabbit 1:50 Cell Signaling T-E
Hsp90 polyclonal rabbit 1:100 Cell Signaling T-E
CD3 polyclonal rabbit 1:2 DAKO T-E
MPO polyclonal rabbit 1:200 Sigma
Aldrich citrate
Vendor specification: Sigma Aldrich, ST Luis, MO; Cell Signaling, Danvers, MA;
LabVision Thermo Sci, Rockford, IL; BioGenex Laboratories, San Ramon, CA.

33
5.4.4. Terminal deoxynucleotidyl transferase nick end labeling (TUNEL)
assay
TUNEL assay was used to pre-screen FFPE TMA sections for DNA fragmentation
including the whole time-lapse series of mEHT treated, untreated and sham treated control
xenografts. Based on the semi-quantitative results the assay was also performed on whole
cross sections of mEHT treated tumors and their matched untreated pairs of 24h and 48h
post-treatment. TUNEL assay is based on the detection of DNA nick ends by terminal
deoxynucleotidyl transferase (TdT) and linking them with fluorochome labeled
deoxyuridine triphosphate (dUTP) nucleotides by the TdT enzyme. Labeling in cell nuclei
is proportional to the amount of fragmented DNA as a result of programmed cell death. The
“Click it TUNEL Alexa Fluor 488 Imaging Assay” (Invitrogen) was used according to the
manufacturer’s instructions. Briefly, dewaxed and rehydrated slides were heated in a citrate
based pH 6.0 antigen unmasking solution (H-3300, Vector Lab, Burlingame, CA) using
electric pressure cooker (Avair Ida, as above). Then slides were incubated at 37 °C for
60 min with a cocktail of alkyne substituted dUTP and TdT followed by the fluorochrome
for 30 min at room temperature which is coupled to dUTP under copper (I) catalysis.
Finally, nuclear DNA was stained with DAPI (see above). The number of biomarker
positive cells was counted at x100 objective magnification in 10 different microscopic FOV
of 3 treated and 3 untreated samples at each tested time point. DAPI co-staining was used
for confirming the critical nuclear localization in the samples. The data was first tested by
Kolmogorov-Smirnov normality test followed by the independent t-test (SPSS Statistics
v.20; IBM, New York, NY).
5.4.5. Western blot
Tissue lysates were prepared from 4, 14 and 24 h treated, untreated and 24 h sham treated
control frozen samples to measure expression of proteins characteristic to programmed cell
death. Extraction buffer (20 mM Tris, 2 mM EDTA, 150 mM NaCl, 1% Triton-X100,
10 µl/ml phosphatase inhibitor and 5 µl/ml proteinase inhibitors) for 30 min on ice were
used to produce tissue lysates, followed by centrifugation at 15,000 rpm at 4 °C for 15 min.
Protein concentration was measured with Bradford assay. The extracts were mixed with 5x

34
Laemmli sample buffer containing 5% 2-mercaptoethanol and heated to 95 °C for 5 min.
30 g protein was loaded into each well of 12% sodium dodecylsulfate polyacrylamide gel
(SDS-PAGE) and electrophoresis was done at 150 V for 1 h. Proteins were then
immunoblotted into polyvinylidene difluoride (PVDF) membrane at 75 mA and 4 °C
overnight. For immunodetection, membranes were sequentially incubated with 5% semi-
skimmed milk as a protein block for 60 min, followed by the incubation with primary
antibody (Table 2) at 4 °C and (HRP)-conjugated goat anti-rabbit IgG (1:1000; Cell
Signaling) for 60 min and SuperSignal ECL kit (Thermo Sci.) for 10 min. For loading
control β-actin (1:500, Cell Signaling) was used. The precision Plus Protein Standard
ladder produced bands at 250kDa, 150-, 100-, 75-, 50-, and 37kDa. Signals were detected
using Kodak Image Station and its 4.1 software. All reagents except where otherwise
indicated were from BioRad (Hercules, CA). Semi-quantitative analysis was done using
ImageJ 1.45s software (http://rsbweb.nih.gov/ij/).
Table 2. Antibodies and condition used for Western immunoblots
Antigen Clonality Host Dilution Vendor
caspase-3 polyclonal rabbit 1:1000 Cell Signaling
caspase-8 polyclonal rabbit 1:2000 Sigma Aldrich
AIF polyclonal rabbit 1:1000 Cell Signaling
RIP1 polyclonal rabbit 1:1000 Sigma Aldrich

35
6. RESULTS
6.1. Histomorphological analysis of treatment related tumor cell death
The H&E stained cross sections of HT29 xenografts showed significant damaged central
zones of the treated tumors between 24-120 h post-treatment, which were clearly
demarcated as pale areas (Figure 3A). At this stage we did not discriminate among the
different types of cell death subroutines. Free annotation option within the digital slide
viewer software allowed accurate area measurements in m2. Damaged areas were
correlated with the whole tumor area (TDR) (Figure 4A). When TDR values of treated and
untreated tumors were compared the mEHT related cell destruction (TDE) was not
significantly changed within the first 14 h post-treatment but it showed a dynamic increase
between 14-24 h. The peak of a single shot treatment showed a 7-fold increase in cell
damage 72 h after mEHT treatment (Figure 4B), which was gradually reduced between
120 h and 216 h.
H&E slides were lack of any morphological sign of autophagic cell death.
Figure 4. Measurement of mEHT related tumor destruction. A) The TDR (tumor
destruction ratio) upon mEHT treatment significantly exceeded that measured in the
untreated tumors from 24h post-treatment on. B) The TDE (tumor destruction efficiency)
values, which exclude the systemic effect of mEHT treatment, also show treatment related
increase with a peak at 72 h post-treatment.

36
6.2. Detection of treatment related DNA fragmentation
TUNEL assay utilizing nick end labeling of damaged and fragmented DNA with
fluorescent labeled dUTP was performed in the HT29 xenograft tumors. First, the kinetics
of DNA damage was pretested in TMA sections for selecting the most appropriate time
points for detailed analysis (χ2(11) = 26.931, p < 0.05). The TUNEL assay proved
significantly higher programmed cell death related DNA fragmentation in whole cross
sections of the treated compared to the untreated tumors both at 24 h and 48 h post-
treatment (Figure 5A, B). In agreement with this, there was a significantly higher degree of
nuclear shrinking (pycnosis) and accumulation of dense chromatin fragments (apoptotic
bodies) in the treated compared to the untreated tumors with a peak difference reached at
72 h, as counted at high power (x100) microscopic fields of H&E stained slides
(Figure 5A, C).

37
Figure 5 showing DNA fragmentation, nuclear shrinkage and apoptotic bodies. A)
Significant elevation of DNA fragmentation revealed by TUNEL assay (green
fluorescence), nuclear shrinkage and apoptotic bodies (H&E staining; arrows) in mEHT
treated (upper row) compared to untreated tumors (lower row), at 48h post-treatment. Insets
show single channel views of areas within rectangles at higher power. TUNEL and DAPI
(blue) double positivity verifies nuclear DNA staining in identical cells labeled. Untreated
tumor cells show only basic green fluorescence. Bar indicates 50 m in the left column and
15 m in the right column. B) Graphs showing significantly increased mean number of
TUNEL positive cells both at 24 h and 48 h post-treatment (black columns); and C) of
apoptotic bodies at 48 h and 72 h post-treatment (black columns) compared to the untreated
controls (grey columns) (*p < 0.05, **p < 0.01).
6.3. Detection of treatment related differential mRNA expression
Messenger RNA gene expression was measured from pooled samples of the 4 h treated, 4 h
untreated and 24 h sham treated tumors, respectively using Affymetrix HGU133 Plus2.0
mircoarrays. Modulated EHT treatment induced significant up- or down-regulation of 48

38
transcripts of 39 genes compared to controls. Members of the heat shock protein 70 family
including HSPA1A, HSPA1B, HSPA4, HSPA6 and HSPA8, and their co-chaperons hsp40
(DNAJB1 and DNAJB4) and Bag3 became upregulated. Hsp90 alpha (HSP90AA1) and
hsp60 (HSPD1) gene transcripts were also elevated upon mEHT treatment (Figure 6).
Figure 6. Heat map on gene expression summarizing transcripts showing significantly
differential expression 4 h after mEHT treatment of HT29 colon cancer xenografts.
Arrows highlight the elevated expression (red boxes) of heat shock protein genes from the
Hsp70, Hsp40, Hsp90 and Hsp60 families in the treated samples (left column) compared
either to sham treated (middle) and untreated samples (right).
6.4. Detection of apoptosis related differential protein expression
The expression of 35 apoptosis related proteins was compared using pooled samples of 3
animals at each time point from treated (8, 14 and 24 h post-treatment) and sham treated

39
(24 h post-treatment) experiments on nitrocellulose membrane plotted protein arrays.
Protein extraction was made using whole cross sections of the dissected frozen tumors.
We detected the early (8h post-treatment) elevation of 12 apoptosis related proteins
including Bax, catalase, c-IAP, cytochrome c, TRAIL-R2, FADD, Hsp60, Hsp70, Hsp27,
HTRA2/Omi, HO-2, SMAC/Diablo (Figure 7). Due to the cell death related progressive
inhomogenity of treated tissues observed at morphological analysis, only the 8 h post-
treatment samples were considered representative.
Figure 7. Modulated EHT induced elevated expression of apoptosis related proteins.
Elevated expression of A) Bax, B) FADD, C) Hsp60, D) cytochrome c, E) SMAC/Diablo
F) HTRA2/Omi and G) hsp70 proteins upon mEHT treatment of HT29 xenograft tumors in
apoptosis protein arrays.
No significant change in the expression of Bad, pro-Caspase-3 and cleaved Caspase-3
proteins were detected between the treated and the control samples (Figure 8)

40
Figure 8. Unchanged expression of apoptosis related proteins upon mEHT. Unchanged
expression of A) Bad, B) procaspase-3 (casp-3) and C) cleaved caspase-3 (c-casp-3)
proteins upon mEHT treatment of HT29 xenograft tumors in apoptosis protein arrays.
The mEHT treatment resulted in the reduced expression of 5 apoptosis related proteins
including Fas, phospho-p53 (S392), phosphor-p53 (S15) Survivin and XIAP. (Figure 9)
Figure 9. Reduced expression of apoptosis related proteins upon mEHT. Reduced
expression of A) Fas, B) Survivin and C) XIAP proteins upon mEHT treatment of HT29
xenograft tumors in apoptosis protein arrays.
No signal was detected in case of the following proteins: BAD, Bcl-2, Bcl-x, cIAP2,
claspin, clusterin, TRAIL-R1, Hif-1a, HO1, Livin, PON2, p21, p53(S46), pRad17 and
TNFRSF1A.
The expression and subcellular localization of Bax, cleaved Caspase-3, cytochrome c,
TRAIL-R2 and Hsp70 proteins were further tested in situ in tissue sections using
immunohistochemistry or immunofluorescence technique.

41
6.5. Detection of treatment related differential protein expression in situ
6.5.1. Programmed cell death related proteins
TMA sections prepared from HT29 xenograft tumor samples were immunostained using
antibodies recognizing the following programmed cell death and proliferation related
protein antigens: AIF, Bax, cleaved Caspase-3, Cytochrome c, RIP1, RIP3, TRAIL-R2 and
Ki67.
Modulated EHT treatment resulted in the significant mitochondrial accumulation of Bax
protein and the mitochondrial to cytoplasmic release of cytochrome c protein both at 8 h
(*p < 0.05) and 14 h (**p < 0.01) post-treatment. Mitochondrial localization of these pro-
apoptotic proteins was confirmed using double immunofluorescence staining for either of
these proteins and anti-mitochondrial antigen (Figure 10).
Treatment related significant cytoplasmic to nuclear translocation of the AIF protein was
observed both at 14 h (*p < 0.05) and 24 h (**p < 0.01) post-treatment (Figure 11A, B) as
an effector for DNA fragmentation. As opposed to this, normal cytoplasmic granular
(mitochondrial) expression of AIF was seen in the intact tumor cells and in cells of the
reactive microenvironment. Also AIF western immunoblots confirmed the mitochondrial
62 kDa band in both treated and untreated samples and the 57 kDa band corresponding to
the molecular range of released protein from the mitochondria in the treated samples 14 h
post-treatment (Figure 11C).
Though a significant elevation in the effector cleaved Caspase-3 levels was observed in the
mEHT treated tumors compared to their untreated controls (*p < 0.05) at 4 and 8 h post-
treatment, the signals were detected only at a very low level resulting in an undetectable
global difference in Western immunoblots between treated and control samples.
Furthermore, the cleaved Caspase-3 reaction was almost exclusively localised to
inflammatory cells involving myeloperoxidase positive neutrophil granulocytes
(monocytes) and CD3 positive immature T lymphocytes demarcating the cleaved
Caspase-3 negative tumor nests (Figure 12).

42
Figure 10. Immunofluorescence staining (Alexa 564, red) for the pro-apoptotic Bax
and cytochrome c (cyt c) proteins and semi quantitative image analysis of the signals
in mEHT treated and untreated tumors. A) Mitochondrial accumulation of Bax and
cytoplasmic release of cytochrome c (cyt c) are linked with the mEHT treatment at 14 h.
Insets highlight areas in rectangles at high power (arrows, x100) where cytoplasmic
delocalization of cyt c in the treated tumor is shown by arrows. Cell nuclei are stained using
DAPI (blue). Identical sections labeled for cyt c were later stained also for H&E where
circled area reveals pyknotic tumor cell nuclei. B) Mitochondrial localization of Bax in the
treated and cyt c (both red) in the untreated samples was confirmed by their co-localization
with anti-mitochondrial antigen (mito - green). Bar indicates 25 μm in the insets and 60 μm
in the rest of 4A and 10μm in 4B. C) Graphs showing significant increase of accumulated
granular Bax reaction in tumor cells (*p < 0.05; **p < 0.01) (rMA- relative mask area) and
D) loss of granular cyt c reaction (black columns) upon mEHT treatment compared to
untreated controls (grey columns) (FOV- field of views).

43
Figure 11. Activation of apoptosis inducing factor (AIF) upon mEHT treatment of
HT29 xenografts. A) Identical tissue sections consecutively stained for AIF using
immunofluorescence (Alexa 564, red) then with H&E. Many tumor cells show nuclear
translocation of AIF in the treated but not in the untreated tumors. Insets show single
channel views at higher power of representative areas within rectangles. Arrows highlight
identical cells with nuclear AIF staining. Arrowheads points to tumor nests of granular
mitochondrial AIF staining characteristic of intact tumor cells. Cell nuclei are stained using
DAPI (blue). Bar indicates 50 µm in the left and 25 µm in the right column. B) Graph
showing the significantly elevated mean number of nuclear AIF positive cells in the treated
(black columns) compared to the untreated (grey columns) tumors (*p < 0.05; **p < 0.001).
C) In western immunoblots the 57 kDa cleaved AIF protein is detected only in the treated
tumors at 14 h post-treatment besides the mature 62 kDa protein.

44
Figure 12. Expression of caspase-3 protein in mEHT treated HT29 xenografts. A)
Though treated tumors show significantly more cleaved/activated caspase-3 (C casp-3)
positive cells than untreated controls (left column; AEC, red), the reaction is primarily
localized to peritumoral leukocytes (arrows) and not to tumor nests (asterisks). Bar
indicates 50 m in the left and 25 m in the right columns. B) Cleaved caspase-3 positive
areas (relative mask area; rMA) measured with the HistoQuant software are significantly
higher (*p < 0.05) in the treated than in the untreated samples both at 4 h and 8 h post-
treatment. C) Caspase-3 expression (either the full length 32 kDa or the missing 17 kDa
cleaved fragment) does not differ significantly in the treated compared to the untreated
tumors. The 17 kDa fragment is detected in Staurosporine treated control HTC-116 cell
extract.
Based on the apoptosis array results, which revealed an elevated TRAIL-R2 expression in
the treated compared to the untreated samples, immunofluorescence staining also showed a
highly significant elevation (**p < 0.01) of TRAIL-R2 protein levels in the mEHT treated

45
compared with the control samples both at 8 h and 14 h post-treatment using automated
image analysis based on signal intensity segmentation and area measurement (Figure 13).
Furthermore, there was no significant change in RIP protein levels (neither in RIP1 nor in
RIP3) upon mEHT treatment. RIP kinase could have mediated necroptosis, another caspase
independent form of programmed cell death, either using RIP1 or RIP3.
There was no significant change in caspse-8 expression either on immunostaining or on
western blot where the cleaved fragment was not detected at any time point.
Ki67 immunostaining also revealed no significant difference in cell proliferation at any
time point in the morphologically intact tumor areas between the mEHT treated and control
samples, while the staining was lost from 24h post-treatment on in the destructed areas
(data not shown).

46
Figure 13. Significant upregulation of TRAIL-R2 cell membrane death receptor upon
mEHT treatment of HT29 xenografts. A) Image analysis using the HistoQuant software
confirms the significantly elevated expression of TRAIL-R2 protein both 8h and 14h post
treatment (black columns) compared to the untreated tumors (grey columns). B) An
immunopositive (Alexa564, red fluorescence) area (left) thresholded and masked (right) for
defining the relative mask area (rMA = masked/annotated area). C) Elevated expression of
TRAIL-R2 protein in the tumor cell membranes (red) both 8h and 14h post-treatment
compared to the untreated tumors of the opposite legs. Please note that TRAIL-R2
expression is evenly widespread at 8h but only focal at 14h and show lower levels towards
the tumor centre (asterisk) in line with the progressing tumor damage. Insets show higher
power views of representative tumor areas within dashed rectangles. Cell nuclei are stained
using DAPI (blue).

47
6.5.2. Stress related proteins
TMA samples from the HT29 xenograft experiment were stained using the following
antibodies recognizing stress related proteins: CRT, HMGB1, Hsp70 and Hsp90.
Immunofluorescence analysis revealed elevated expression of Hsp70 between the treated
and untreated group (χ2(19) = 54.634, p < 0.05). The post-hoc test showed significant
difference between 14-24 h and 72-120 h post-treatment and a transitional decrement at
48 h. At 14h post-treatment the association of Hsp70 to the cytoplasmic membrane was
significant in the treated xenografts. At later (72-120 h) stages no cytoplasmic membrane
positivity was seen however, upregulation of cytoplasmic Hsp70 was observed, but only in
the transient zone between the morphologically intact and dead tumor areas (Figure 14).
Also, significantly increased Hsp90 levels were detected (χ2(21) = 83.559, p < 0.05) in the
mEHT treated compared to the untreated tumors, at 24, 48, 72, 120, 168 and 216 h after
mEHT treatment as revealed by the post-hoc test (Figure 15). Hsp90 appeared in the
cytoplasmic membrane only at later time points at 168 h and 216 h post-treatment. In
contrast to Hsp70 kinetics, Hsp90 levels showed continuous elevation upon treatment
between 24 h and 216 h.

48
Figure 14. Abundance and
localization of heat shock
protein 70 (Hsp70) in colorectal
cancer xenografts measured
with immunofluorescence
(Alexa 564, red). A) Hsp70
immunofluorescence (Alexa 564,
red), in 14 h post-mEHT treated
(a-e) and untreated (f-j) tumor
cells also immunoreacted with
wheat germ agglutinin (Alexa
488, green) and DAPI to stain
nuclei. In 14 h post-mEHT treated
tumor cells Hsp70
immunofluorescence is
predominately in cell membranes
(arrows) as indicated by the wheat
germ agglutinin reactivity
(arrowheads). In the untreated
tumor cells Hsp70
immunofluorescence is
predominately cytoplasmic. Scale
bar = 80 µm in a and f, 10 µm in b
and g, and 5 µm in c, d, e and h, i,
j. B) Semi-quantitative image
analysis of immunofluorescence
confirms significant elevation of
Hsp70 levels both between
14-24 h and 72-120 h post-
treatment (*p < 0.05) with a
decline at 48 h (rMA- relative
mask area).
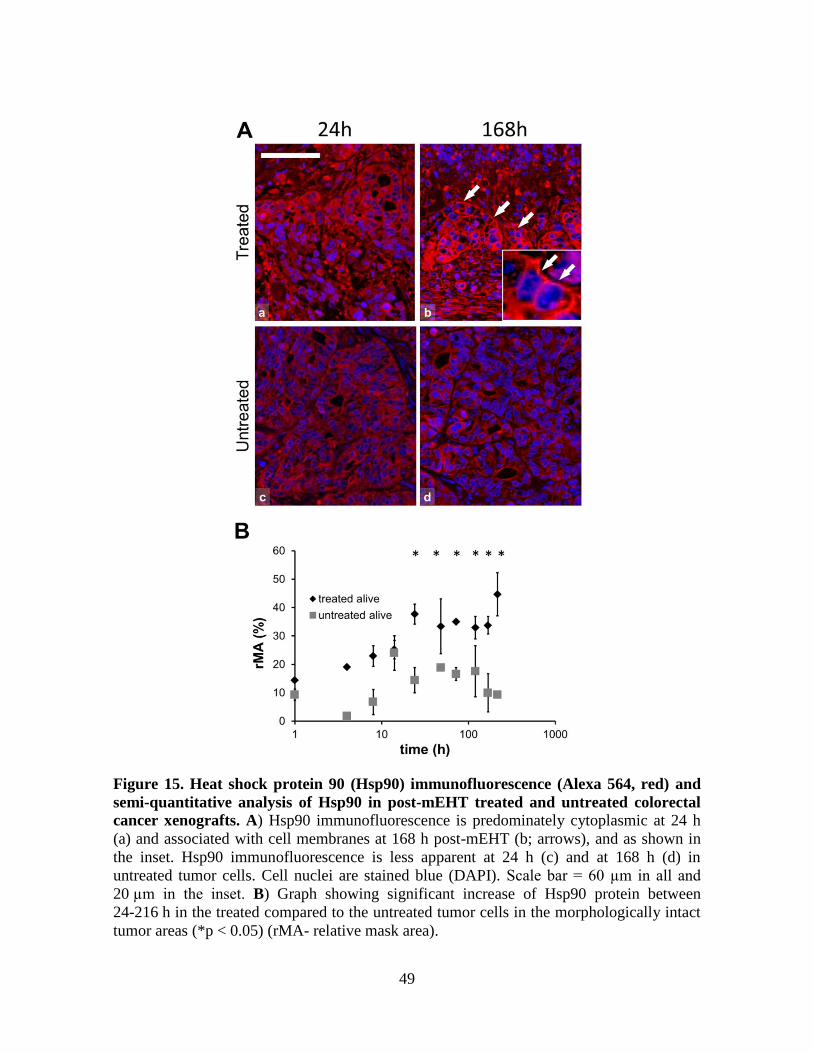
49
Figure 15. Heat shock protein 90 (Hsp90) immunofluorescence (Alexa 564, red) and
semi-quantitative analysis of Hsp90 in post-mEHT treated and untreated colorectal
cancer xenografts. A) Hsp90 immunofluorescence is predominately cytoplasmic at 24 h
(a) and associated with cell membranes at 168 h post-mEHT (b; arrows), and as shown in
the inset. Hsp90 immunofluorescence is less apparent at 24 h (c) and at 168 h (d) in
untreated tumor cells. Cell nuclei are stained blue (DAPI). Scale bar = 60 µm in all and
20 µm in the inset. B) Graph showing significant increase of Hsp90 protein between
24-216 h in the treated compared to the untreated tumor cells in the morphologically intact
tumor areas (*p < 0.05) (rMA- relative mask area).

50
Furthermore, the early accumulation of calreticulin to the cell membrane, before any
morphological or molecular sign of programmed cell death, was observed at 4 h (p = 0.001)
post-treatment (Figure 16).
Figure 16. Calreticulin immunofluorescence (Alexa 564, red) and semi-quantitative
analysis of calreticulin in post-mEHT treated and untreated colorectal cancer
xenografts. A) Calreticulin immunofluorescence is localized to the cell membranes 4 h
post-mEHT (arrows; a - e) before any morphological or molecular sign of programmed cell
death. Calreticulin immunofluorescence is diffuse and cytoplasmic in untreated tumor cells
(f - j). Cells nuclei are stained blue (DAPI). Scale bar = 60 µm in a, b, c, f, g, h and 10 µm
in d, e, i, j. B) Graph showing the mean number of cytoplasmic membrane positive cells
counted at x 100 magnification in 10 field of views (FOV) of 5 parallel samples. Elevation
of calreticulin cell membrane immunofluorescence is highly significant (**p < 0.01) in 4 h
post-mEHT treated compared to untreated tumor cells (FOV- field of views).
HMGB1 protein was detected in cell nuclei up to 14 h both in the treated and in the
untreated samples, followed by a cytoplasmic translocation from 24 h in the treated
xenografts. HMGB1 immunofluorescence disappeared 48 h post-treatment from the
damaged central areas of the treated tumors while still prevailed in the untreated controls.

51
Figure 17. HMGB1 immunofluorescence (Alexa 564, red) and semi-quantitative
analysis of HMGB1 post-mEHT treated and untreated colorectal cancer xenografts.
A) HMGB1 immunofluorescence shows normal nuclear localization up to 14 h post-mEHT
treated (a) and untreated (d) tumor cells. HMGB1 immunofluorescence is diffuse and
diminished in 24 h and not evident in 48 h post-mEHT treated (b, c, respectively) tumor
cells but not changed in 24 and 48 h untreated (e, f, respectively) tumor cells. Boxes show
the location of the high magnification insets. Circles in the insets show the location of
nuclei. Scale bar = 60 µm in a, b, c, d, e, f, and 25 µm in all insets. B) Semi-quantitative
analysis highlights significant reduction of HMGB1 immunofluorescence between 48-216h
post mEHT treated compared to untreated tumor cells (*p < 0.05) (rMA- relative mask
area).

52
In the treated tumors nuclear HMGB1 protein was significantly lost (χ2(19) = 64.657,
p < 0.05) compared to the untreated group, post-hoc test revealed significant difference at
each time point between 24-216 h post-treatment (Figure 17).
6.5.3. Identification of immune cells
TMA samples from the HT29 xenograft experiment were also stained for CD3 and MPO
antigens to identify major subgroups of leucocytes. The results revealed that though
BALB/c (nu/nu) mice have compromised immune system featuring deficient thymic
functions and T cell maturation a massive inflammatory infiltrate was observed in the
treated tumors, which was concentrated at the boundary of degraded and intact tumor. The
number of MPO positive neutrophil granulocytes (and monocytes) were significantly
elevated in the treated samples (χ2(21) = 51.364, p < 0.05) compared to the controls. The
post-hoc test confirmed the significant elevation at 48, 72, 120, 168 and 216 h post-
treatment. The number of CD3 positive immature T lymphocytes was also significantly
higher in the treated group (χ2(21) = 79.949, p < 0.05) than in the controls. The difference
was proved significant at 120, 168 and 216 h post-treatment (Figure 18).

53
Figure 18. Leukocyte infiltration detected with immunohistochemistry upon mEHT
treatment of HT29 colorectal cancer xenografts. A-B) The number of both the
myeloperoxidase (MPO - red) positive neutrophil granulocytes (A) and the CD3 positive
(brown) T lymphocytes (B) are significantly elevated in the treated compared to the
untreated tumors at 72 h (only for MPO) and 120 h (both markers) post-treatment. C-D)
Graphs show the dynamic treatment related appearance of MPO positive cells (C) and CD3
positive cells (D) during the study period. Peritumoral infiltration by myeloid leukocytes
(C) start very early (after 1h), while T cell accumulation is observed after 72 h and both
show significant treatment related elevation afterwards. Black boxes represent the mean
scores in the treated tumors and grey boxes highlight scores gained in the untreated
controls. Red triangles show leukocyte scores in xenografts of sham-treated animals.

54
7. DISCUSSION
Electric field and the concomitant heat induced by modulated electrohyperthermia (mEHT)
can be selectively enriched in malignant tissue due to elevated glycolysis (Warburg effect),
ion concentration and the resulting elevated conductivity and permittivity in cancer
compared to non-malignant tissues. The objective of this study was to investigate the nature
and time course of tumor cell destruction, its molecular mechanism and the stress-related
molecular changes induced by mEHT in HT29 colorectal cancer xenograft model.
Modulated EHT is a non-invasive technique in oncotherapy using 13.56 MHz capacitive
coupled radiofrequency field. The generated electric field selectively enriches in the
malignant tumor tissue due to the bioelectrodynamic differences (such as elevated
permittivity and conductivity) related to metabolic (Warburg-effect and the concomitant
elevation in ion concentration) and structural differences (such as increased water and
sodium content and altered membrane permeability) compared to non-malignant tissue
(Pethig et al. 1984; Scholoz et al. 2000; Andocs et al. 2009). Our results in this project are
based on morphological observations, mRNA expression microarray studies, in vitro
(protein array chip and Western immunoblot) and in situ (immunoperoxidase and
immunofluorescence) protein detection studies combined with digital microscopy based
semiquantitative image analysis and the TUNEL assay.
Comparative analysis of hematoxylin and eosin stained sections across the center of tumor
xenografts revealed significant tumor destruction between 24-120 h after a 30 min long
single shot of mEHT treatment. At this stage, we did not discriminate between the different
types of cell death subroutines (apoptosis, necroptosis, accidental necrosis, autophagia, etc).
The peak of tumor destruction reached a 7-fold increase at 72 h post-treatment compared to
the untreated contralateral xenograft. Significant appearance of apoptotic bodies were
observed 48-72 h post-treatment, and TUNEL positivity, referring to DNA fragmentation,
was found the highest at 24-48 h post-treatment. Chromatin condensation, the appearance
of discrete nuclear bodies and the signs of the DNA fragmentation together suggested
programmed cell death (Kroemer et al. 2009) as the major mechanism of tumor destruction
upon mEHT treatment. Hyperthermia was described to be suitable to induce both accidental

55
necrosis and programmed cell death in vitro in a temperature dependent manner without
specifying the dose related response (Hildebrandt et al. 2002). Most of the apoptotic cell
death inducing treatments were achieved in hematological cell lines (Harmon et al. 1990;
Baxter et al. 1992; Gabai et al. 1995) which are known to be rather thermo-sensitive
(Hildebrandt et al. 2002). In these studies the molecular mechanism of cell death was not
described in details, and the results were rather contradictory. As opposed to our findings,
in vitro hyperthermia delivered in a 42 °C incubator or in a water bath, could not induce
DNA fragmentation in HT29 colorectal carcinoma cells up to 72 h post-treatment (Nishida
et al. 1997; Shchepotin et al. 1997).
Because both the morphological and molecular signs suggested DNA fragmentation and
programmed cell death mechanisms we have tested molecules that might be involved and
characteristic of the major programmed cell death pathways. The mitochondrial
accumulation of pro-apoptotic Bcl-2 superfamily member Bax was found to be significant
between 8-14 h post-treatment in the treated tumors compared to the contralateral untreated
xenografts. In line with the morphological findings, mitochondrial Bax was consistent with
a controlled outer mitochondrial membrane pore formation, which further supported the
programmed nature of the treatment induced cell death (Gogvadze et al. 2006; Basanez et
al. 2012; Galluzzi et al. 2012). Due to the mitochondrial pores intermembrane space
proteins can also be released from the mitochondria (Tait et al. 2010). Accordingly,
significant mitochondrial to cytoplasmic cytochrome c release was observed between
8-14 h post-treatment, simultaneously with mitochondrial Bax accumulation, reflecting the
rapid cytoplasmic release of cytochrome c (Basanez et al. 2012). At 8 h post-treatment
elevated expression of the intermembrane space proteins Smac/Diablo and HTRA2/Omi
were also detected, as a further support of the cytoplasmic release of intermembrane space
proteins (Tait et al. 2010). Mitochondrial pore formation, and concomitant loss of
mitochondrial transmembrane potential, together with the release of intermembrane space
proteins to the cytoplasm can lead to an irreversible “point of no return” in the fate of
affected cells (Kroemer et al. 2005; Kroemer et al. 2009). Between 14-24 h post-treatment
mitochondrial AIF was released to the nucleus, where the 57 kDa activated AIF fragment
was also detected using immunoblots. AIF release from the mitochondria requires a
56
cleavage in the mitochondrial intermembrane space (Norberg et al. 2010), and a
concomitant time delay can be noted compared to the pore formation and mitochondrial
protein release (Norberg et al. 2010). Activated nuclear AIF fragments are responsible for
chromatin condensation and cleavage of the DNA into relatively large 50 kbp fragments
(Boujrad et al. 2007), which were detected with the TUNEL assay at later time points.
Modulated EHT induced programmed cell death in HT29 xenograft in a caspase
independent manner, since cleaved caspase-3 protein was not found in the tumor cells at
any tested time point. Although detected cleaved-caspase 3 levels were significantly higher
in the treated whole tumor samples compared to the untreated control xenografts,
immunohistochemistry revealed that cleaved caspase-3 positive cells were found only in
stromal inflammatory cells adjacent to tumor nests. These cells were consistently MPO
positive myelomonocytic cells primarily of neutrophil granulocytes and CD3 immature T
lymphocytes (immunocompromised animals). Leukocytes are known to be sensitive for
heat shock (Hildebrandt et al. 2002; Dieing et al. 2003), which can explain their relatively
high cleaved caspase-3 positivity. The timing and major molecular pathways involved in
mEHT treatment related tumor cell death are summarized in a simplified scheme in
Figure 19.
When markers for necroptosis (programmed necrosis) were analyzed, no significant
difference was found at any time point either in RIP1 or RIP3 expression between treated
and untreated tumors. RIP1 and RIP3 are crucial members of the necrosome complex
(Vandenabeele et al. 2010), which can be activated by phosphorylation. RIP1 at Ser161 can
be either autophosphorylated or phosphorylated by RIP3, which can also be phosphorylated
on Ser199 for activation (Vandenabeele et al. 2010; Han et al. 2011). Although RIP3 seems
to be necessary for regulated necrosis it can be either dependent or independent on RIP1
(Vandenabeele et al. 2010; Han et al. 2011; Galluzzi et al. 2012). RIP1 and RIP3 can be
inactivated by proteolytic cleavage resulting in the shifting of cell degradation pathway to
external apoptosis. Despite the extensive research the exact downstream mechanism of
regulated necrosis has not been clarified yet (Christofferson et al. 2010; Han et al. 2011).
The lack of massive cytoplasmic vacuolization and the proven Bax mediated mitochondrial
pore formation rule out the possibility of autophagic cell death (Galluzzi et al. 2012).

57
Interestingly, preliminary results of mEHT treated C26 (murine colorectal carcinoma cell
line) allografts suggest rather a caspase dependent cell death pathway. Therefore, further
investigations are needed for revealing the factors that determine the different programmed
cell death subroutines.
Figure 19. Schema of mEHT induced programmed cell death mechanism in HT29
xenograft model. Treatment related mitochondrial pore formation was observed 8-14 h
post-treatment by Bax mitochondrial localization, in line with this cytochrome c released
from the mitochondria. Concomitant nuclear AIF induced DNA fragmentation followed by
apoptotic body formation.
As it was described earlier ICD requires a characteristic spatiotemporal emergence of a
DAMP signal sequence including the early (pre-apoptotic) exposure of calreticulin to the
cell surface as ecto-calreticulin, followed by a membrane localization and release of Hsp70
and/or Hsp90 accompanied by ATP release during the programmed cell death process, the

58
late apoptotic release of HMGB1 and possible late externalization of Hsp70 and or Hsp90
(Garg et al. 2013; Kroemer et al. 2013; Krysko et al. 2013). Different ICD inducers can
provoke slightly distinct DAMP patterns. For example, oxaliplatin can initiate the pre-
apoptotic ecto-calreticulin exposure, followed by an early-apoptotic ATP release without
Hsp involvement, with late apoptotic HMGB1 release (Ladoire et al. 2013). Another
example is hypericin based photodynamic therapy, which induces pre-apoptotic ecto-
calreticulin exposure and ATP release with pre-apoptotic Hsp70 membrane appearance and
the passive, late-apoptotic release of Hsp70, Hsp90 and HMGB1 (Garg et al. 2012; Krysko
et al. 2012).
In our HT29 colorectal xenograft model a significant early (4 h post-treatment) cell
membrane exposure of calreticulin was detected in the treated compared to the contra-
lateral untreated tumors. The first molecular signs of programmed cell death were revealed
later at 8 h post-treatment. Ecto-calreticulin can serve as an ‘eat-me’ signal which can bind
to DCs and macrophages through CD91 to stimulate the efficient engulfing of dying cells,
and processing their antigens followed by priming a connate immune response (Kroemer et
al. 2013).
Hsp70 was found in the cytoplasmic membranes of tumor cells from 14 h post-treatment
followed by a decrement at 48 h with a second peak observed at 72 h post-treatment in the
morphologically intact peripheral part of mEHT treated xenografts. This second peek is
possibly related to the soluble factors released from the mEHT damaged cells. Significant
elevation of Hsp90 was observed from 24h post-treatment but membrane association of
Hsp90 was observed only at later time points (168-216 h). Interactions of membrane
associated Hsp70 with immune cells can be rather complex. Membrane associated Hsp70
combined with IL-2 and IL-15 can stimulate natural killer (NK) cells (Gehrmann et al.
2008). Membrane bound Hsp70-peptide complex possibly bind to scavenger receptors,
C-type lectin receptor or TLR 2/4 or a currently not well defined receptor on APCs
including monocytes, macrophages and DC followed by cross presentation on MHC
molecules to initiate antigen specific immune response through CD8+ T cells (Multhoff
2007; Gehrmann et al. 2008). Extracellular Hsp70 can directly boost the innate immune
response (Multhoff et al. 2011). However, membrane bound Hsp70 has also been described

59
to protect cell membrane integrity under stress condition (Horvath et al. 2008; Horvath et
al. 2010), therefore, the outcome of cell membrane exposure of Hsp70 can be context
dependent. Membrane associated Hsp90 binding receptors on APCs have not been
identified yet (Garg et al. 2013).
The late HMGB1 release from cell nuclei was observed from 24 h post-treatment showing
first a cytoplasmic manifestation in the mEHT destructed central tumor areas. HMGB1
staining was worn off between 48-216 h post-treatment. Given that HMGB1 can also be
released passively from the necrotic cells nuclei (Guo et al. 2013), necrotic areas of
untreated tumors also showed moderate HMGB1 disappearance. The mEHT related
spatiotemporal appearance of DAMP signals, which can be relevant to ICD in the HT29
xenograft model is summarized in a drawing (Figure 20).
Earlier, HMGB1 was thought to be released only from the necrotic cells, recent evidence
suggest that cells dying through a programmed cell death subroutine can also release
HMGB1 (Ladoire et al. 2013). The extracellular HMGB1 can bind to RAGE, TIM3 or
TLR2/4 on the DCs leading to distinct responses (Garg et al. 2013). HMGB1-RAGE
interaction may mediate invasion, migration and tumor growth resulting in the association
with aggressive tumor phenotype and poor prognosis in colon carcinoma (Ladoire et al.
2013). HMGB1 binding to TIM3 can also suppress the immunostimulatory pathway in
DCs. HMGB1-TLR2/4 interaction is essential for determining the immunogenicity of the
dying tumor through cross presentation of the tumor antigens and promotion of the tumor
specific Tc1/Th1 cell responses (Ladoire et al. 2013).
We have found CD3 positive T lymphocytes (between 120-216 h post-treatment) and MPO
positive neutrophil granulocytes/monocytes (between 72-216 h post-treatment) demarcating
the destructed central tumor areas in mEHT treated xenografts. These inflammatory
infiltrates can be consistent with the immunostimulatory effects of HMGB1 release from
the nucleus and beyond (Ladoire et al. 2013).
As it has become clear the ultimate outcome of DAMP related immune response to cancer
cell death is rather complex and context dependent. Cell death is influenced by the type and
localization/microenvironment of cancer cells, the cell death pathways activated, the type
of immune cells interacting with the cancer and the efficiency of the recognition of cancer

60
antigens (Garg et al. 2013). In this project we used immunodeficient Balb/c (nu/nu) mice
lacking mature T cells to host HT29 colorectal cancer xenografts. Therefore, this model is
inappropriate for investigating proper immune response upon mEHT treatment thus the
detected DAMP signals cannot be linked directly to ICD. However, the DAMP signal
sequence revealed in this model support the feasibility of testing if mEHT treatment in
immune competent animal models can directly promote ICD.
Furthermore, some of the chemotherapeutic ICD inducers are already used on daily bases,
but in combination with corticosteroids, which may demolish the potential immune
response (Kepp et al. 2011). If a local treatment can induce DAMP and consequently ICD
these may give rise to effective anti-tumor immune response. On the other hand mEHT
treatment might destroy locally the leucocytes as suggested by elevated expression of
caspase-3 in these cells, but does not eradicate them on a systemic level.
Figure 20. Schema of mEHT induced spatiotemporal appearance of DAMP related to
ICD in HT29 xenograft model. Modulated EHT induced ecto-calreticulin exposure,
Hsp70 membrane appearance, followed by nuclear HMGB1 release and Hsp90 membrane
translocation. Concomitant MPO and CD3 positive leukocyte were detected around the
destructed tumor area.

61
Finally, as an important observation we found the significant elevation of TRAIL-R2 a pro-
apoptotic receptor mediating extrinsic programmed cell death signal, between 8-14 h post-
treatment. This can either be a direct consequence of the treatment, then the cell death
subroutine should be external apoptosis mediated by caspase-8 or necroptosis mediated by
RIP1 or RIP3 (Jouan-Lanhouet et al. 2012). TRAIL-R2 externalization can be a secondary
effect related to the ER stress induced by unfolded protein response (Stolfi et al. 2012). The
lack of caspase-8 cleavage or RIP1 or RIP3 activation leads to the conclusion that
TRAIL-R2 elevation is more probably a secondary event (Jouan-Lanhouet et al. 2012).
Heat may induce endoplasmic reticulum stress related unfolded protein response (Adachi et
al. 2009), which can induce elevated TRAIL-R2 expression even in p53 mutant cell lines
such as colorectal cancer cell lines including HT29 (Stolfi et al. 2012). This is further
supported by that TRAIL-R2 positivity was observed in the periphery of the tumor 14 h
post-treatment where no mitochondrial Bax or cytoplasmic cytochrome c release was
observed. In line with this, a decrement in survivin was measured on the apoptosis protein
arrays as it has also been referred in the literature (Stolfi et al. 2012). TRAIL upregulation
upon mEHT treatment can potentially be exploited for potentiating TRAIL-R2 agonist
tumor treatment with mEHT (Hellwig et al. 2012). Obviously, further investigations are
required for revealing the endoplasmic reticulum stress related unfolded protein response.
Furthermore, for an adequate therapeutic response through TRAIL or TRAIL agonists
testing the pattern of decoy receptors (DcR1 and DcR2) is also crucial. TRAIL is the ligand
of decoy receptors, however, decoy receptors lack death domains, therefore, the
downstream signaling for any programmed cell death subroutine is insufficient through
them. Not surprisingly, DcR1 and DcR2 can inhibit TRAIL-R1 and TRAIL-R2 (Wang
2010).
In summary, mEHT treatment can induce programmed cell death related tumor destruction
in HT29 colorectal adenocarcinoma xenografts, which dominantly follows a caspase
independent subroutine in line with spatiotemporal DAMP sequence that may be relevant
for promoting immunological cell death.

62
8. CONCLUSION – NEW OBSERVATIONS
1. A single shot mEHT treatment in an in vivo HT29 xenograft raised in Balb/c (nu/nu)
mice cause significant tumor cell destruction with a peak of 7-fold increase at 72 h
post-treatment compared to the untreated control tumors.
2. Programmed cell death induced by mEHT in HT29 xenograft dominantly follows a
caspase independent subroutine with mitochondrial permeabilization by Bax, the
cytoplasmic release of cytochrome c and concomitant mitochondrial to nuclear
translocation and activation of AIF resulting in DNA fragmentation as measured
with the TUNEL assay.
3. A single shot mEHT treatment related tumor cell stress can generate the
spatiotemporal sequence of DAMP signals in the HT29 colorectal cancer xenograft
model without any additional genetic or pharmaceutical intervention. Our data
suggest that mEHT can be a potential local inducer of ICD, without a systemic
interference with immune functions.

63
9. SUMMARY
Electric field and concomitant heat induced by modulated electrohyperthermia (mEHT) can
be selectively enriched in malignant tissue due to elevated glucolysis (Warburg effect),
resulting in elevated conductivity and permittivity in cancer compared to non-malignant
tissue. In this project we studied the mechanism and time course of tumor destruction and
focused on spatiotemporal appearance of damage associated molecular pattern (DAMP)
related to mEHT.
Bilateral implants of HT29 colorectal cancer in the femoral regions of Balb/c (nu/nu) mice
were treated with a single 30 min shot of mEHT. Tumors at 0, 1, 4, 8, 14, 24, 48, 72, 120,
168 and 216 h post-treatment were studied for morphology, DNA fragmentation and cell
death response related protein expression using tissue microarrays, immunohistochemistry,
western immunoblots and mRNA microarrays.
Modulated EHT treatment induced significant tumor destruction in HT29 xenografts with a
peak of 7-fold increase compared to the untreated controls. The significant treatment
related elevation of DNA fragmentation and apoptotic bodies between 24-72 h post-
treatment proved a programmed cell death response. This was associated with significant
mitochondrial accumulation of Bax and cytoplasmic release of cytochrome c proteins
between 8-14 h. Cleaved caspase-3 levels were low and mainly localized to inflammatory
cells. The substantial cytoplasmic to nuclear translocation of 57 kDa activated fragment of
apoptosis inducing factor was detected between 14-24 h. The cell death response was
accompanied by the 4 h post-treatment upregulation of heat shock protein mRNA levels.
The treatment resulted in spatiotemporal occurrence of a DAMP featured by significant
cytoplasmic to cell membrane translocation of calreticulin at 4 h, Hsp70 between 14-24 h
and Hsp90 at 216 h post-treatment. The release of high mobility group box1 protein from
tumor cell nuclei from 24 h post-treatment was also detected.
Modulated EHT treatment can induce programmed cell death related tumor destruction in
HT29 colorectal adenocarcinoma xenografts, which dominantly follows a caspase
independent subroutine in line with spatiotemporal DAMP sequence that may be relevant
for promoting immunological cell death.

64
10. ÖSSZEFOGLALÁS
Az elektromos tér és az általa generált hő (modulált elektrohipertermia- mEHT) szelektíven
dúsul a malignus szövetben. A daganatos szövet megváltozott metabolizmusa, aerob
glikolízis (Warburg hatás) hatására a malignus szövet vezetőképessége és permittivitása
emelkedett a malignusan nem elfajult szövethez képest. Jelen tanulmányban a mEHT
sejtpusztító hatás molekuláris szintű hatásmechanizmusát, valamint az immunogén
sejthalálra (ICD) jellemző molekuláris mintázatot (DAMP) vizsgáltuk.
A kísérletekhez HT29 kolorektális adenocarcinoma sejtvonalat injektáltunk Balb/c (nu/nu)
egerek mindkét oldali femorális régiójába. A jobb oldali tumorokat egyszeri 30 perces,
mEHT-val kezeltünk. A mintavételezés 0, 1, 4, 8, 14, 24, 48, 72, 120, 168 és 216 órával a
kezelést követően történt. A minták morfológiai, mRNS expressziós, DNS fragmentációs
vizsgálatára, valamint a sejthalállal kapcsolatos fehérjék expressziójának analízisére került
sor western blottal valamint szöveti multiblokkokon immunperoxidáz és
immunfluoreszcencia vizsgálatokkal.
A morfológiai vizsgálatok alapján megállapítottuk, hogy a mEHT kezelés HT29
xenograftokban maximálisan hétszeres sejtelhalást eredményezett a kezeletlen tumorokhoz
képest. A kezelés hatására szignifikáns DNS fragmentációt és apoptotikus testek
megjelenését detektáltuk 24–72 órával a kezelést követően. 8–14 órával a kezelés után a
pro-apoptotikus Bax mitokondriális felhalmozódását és a citokróm-c mitokondriumból való
kiáramlását észleltük. Ugyanakkor hasított kaszpáz-3 pozitív sejteket kizárólag a MPO
vagy CD3 pozitív gyulladásos sejtekben találtunk. 14–24 órával a kezelést követően az
apoptózis indukáló factor 57 kDa-os fragmentjét detektáltuk western blottal és sejtmagi
előfordulását imunnhisztokémiai vizsgálattal. 4 órával a kezelést követően hő sokk fehérjék
mRNS szintű szignifikáns emelkedését detektáltuk. Fehérje szinten DAMP mintázatot is
észleltünk, így citoplazma membrán dúsulását detektáltunk 4 órával a kezelést követően a
karetikulin, 14-24 óránál a Hsp70 és 216 óránál a Hsp90 esetében. A sejtmagokból a
HMGB1 kiáramlás 24 órával a kezelést követően kezdődött.
Összefoglalva: a HT29 humán kolorektális adenokarcinóma modellben a mEHT kezelés
elsősorban kaszpáz független programozott sejthalált váltott ki és egyidejűleg indukálta az
immunogén sejthalálra jellemző DAMP megjelenését.

65
11. BIBLIOGRAPHY
Adachi, M., Liu, Y., Fujii, K., Calderwood, S. K., Nakai, A., Imai, K. and Shinomura, Y.
(2009). "Oxidative stress impairs the heat stress response and delays unfolded
protein recovery." PLoS One 4(11): e7719.
Adachi, S., Kokura, S., Okayama, T., Ishikawa, T., Takagi, T., Handa, O., Naito, Y. and
Yoshikawa, T. (2009). "Effect of hyperthermia combined with gemcitabine on
apoptotic cell death in cultured human pancreatic cancer cell lines." Int J
Hyperthermia 25(3): 210-219.
Andocs, G., Renner, H., Balogh, L., Fonyad, L., Jakab, C. and Szasz, A. (2009). "Strong
synergy of heat and modulated electromagnetic field in tumor cell killing."
Strahlenther Onkol 185(2): 120-126.
Aoyagi, T., Terracina, K. P., Raza, A. and Takabe, K. (2014). "Current treatment options
for colon cancer peritoneal carcinomatosis." World J Gastroenterol 20(35): 12493-
12500.
Atmaca, A., Al-Batran, S. E., Neumann, A., Kolassa, Y., Jager, D., Knuth, A. and Jager, E.
(2009). "Whole-body hyperthermia (WBH) in combination with carboplatin in
patients with recurrent ovarian cancer - a phase II study." Gynecol Oncol 112(2):
384-388.
Barsukov, Y. A., Gordeyev, S. S., Tkachev, S. I., Fedyanin, M. Y. and Perevoshikov, A. G.
(2013). "Phase II study of concomitant chemoradiotherapy with local hyperthermia
and metronidazole for locally advanced fixed rectal cancer." Colorectal Dis 15(9):
1107-1114.
Basanez, G., Soane, L. and Hardwick, J. M. (2012). "A new view of the lethal apoptotic
pore." PLoS Biol 10(9): e1001399.
Baxter, G. D. and Lavin, M. F. (1992). "Specific protein dephosphorylation in apoptosis
induced by ionizing radiation and heat shock in human lymphoid tumor lines." J
Immunol 148(6): 1949-1954.

66
Blad, B. and Baldetorp, B. (1996). "Impedance spectra of tumour tissue in comparison with
normal tissue; a possible clinical application for electrical impedance tomography."
Physiol Meas 17 Suppl 4A: A105-115.
Blank, M. and Goodman, R. (2009). "Electromagnetic fields stress living cells."
Pathophysiology 16(2-3): 71-78.
Boujrad, H., Gubkina, O., Robert, N., Krantic, S. and Susin, S. A. (2007). "AIF-mediated
programmed necrosis: a highly regulated way to die." Cell Cycle 6(21): 2612-2619.
Brazma, A., Hingamp, P., Quackenbush, J., Sherlock, G., Spellman, P., Stoeckert, C.,
Aach, J., Ansorge, W., Ball, C. A., Causton, H. C., Gaasterland, T., Glenisson, P.,
Holstege, F. C., Kim, I. F., Markowitz, V., Matese, J. C., Parkinson, H., Robinson,
A., Sarkans, U., Schulze-Kremer, S., Stewart, J., Taylor, R., Vilo, J. and Vingron,
M. (2001). "Minimum information about a microarray experiment (MIAME)-
toward standards for microarray data." Nat Genet 29(4): 365-371.
Calderwood, S. K. (2013). "Molecular cochaperones: tumor growth and cancer treatment."
Scientifica (Cairo) 2013: 217513.
Castano, A. P., Mroz, P. and Hamblin, M. R. (2006). "Photodynamic therapy and anti-
tumour immunity." Nat Rev Cancer 6(7): 535-545.
Chen, F., Wang, C. C., Kim, E. and Harrison, L. E. (2008). "Hyperthermia in combination
with oxidative stress induces autophagic cell death in HT-29 colon cancer cells."
Cell Biol Int 32(7): 715-723.
Cheung, A. Y. (1982). "Microwave and radiofrequency techniques for clinical
hyperthermia." Br J Cancer Suppl 5: 16-24.
Chicheł, A., Skowronek, J., Kubaszewska, M. and Kanikowski, M. (2007). "Hyperthermia
– description of a method and a review of clinical applications." Reports of Practical
Oncology & Radiotherapy 12(5): 267-275.
Christofferson, D. E. and Yuan, J. (2010). "Necroptosis as an alternative form of
programmed cell death." Curr Opin Cell Biol 22(2): 263-268.
Chua, T. C., Robertson, G., Liauw, W., Farrell, R., Yan, T. D. and Morris, D. L. (2009).
"Intraoperative hyperthermic intraperitoneal chemotherapy after cytoreductive

67
surgery in ovarian cancer peritoneal carcinomatosis: systematic review of current
results." J Cancer Res Clin Oncol 135(12): 1637-1645.
Csoboz, B., Balogh, G. E., Kusz, E., Gombos, I., Peter, M., Crul, T., Gungor, B., Haracska,
L., Bogdanovics, G., Torok, Z., Horvath, I. and Vigh, L. (2013). "Membrane
fluidity matters: hyperthermia from the aspects of lipids and membranes." Int J
Hyperthermia 29(5): 491-499.
D'Eliseo, D., Manzi, L. and Velotti, F. (2013). "Capsaicin as an inducer of damage-
associated molecular patterns (DAMPs) of immunogenic cell death (ICD) in human
bladder cancer cells." Cell Stress Chaperones.
Denecker, G., Vercammen, D., Declercq, W. and Vandenabeele, P. (2001). "Apoptotic and
necrotic cell death induced by death domain receptors." Cell Mol Life Sci 58(3):
356-370.
Dewey, W. C. (1994). "Arrhenius relationships from the molecule and cell to the clinic."
Int J Hyperthermia 10(4): 457-483.
Dewey, W. C., Hopwood, L. E., Sapareto, S. A. and Gerweck, L. E. (1977). "Cellular
responses to combinations of hyperthermia and radiation." Radiology 123(2): 463-
474.
Dieing, A., Ahlers, O., Kerner, T., Wust, P., Felix, R., Loffel, J., Riess, H. and Hildebrandt,
B. (2003). "Whole body hyperthermia induces apoptosis in subpopulations of blood
lymphocytes." Immunobiology 207(4): 265-273.
Elmore, S. (2007). "Apoptosis: a review of programmed cell death." Toxicol Pathol 35(4):
495-516.
Feyerabend, T., Wiedemann, G. J., Jager, B., Vesely, H., Mahlmann, B. and Richter, E.
(2001). "Local hyperthermia, radiation, and chemotherapy in recurrent breast cancer
is feasible and effective except for inflammatory disease." Int J Radiat Oncol Biol
Phys 49(5): 1317-1325.
Fiorentini, G., Giovanis, P., Rossi, S., Dentico, P., Paola, R., Turrisi, G. and Bernardeschi,
P. (2006). "A phase II clinical study on relapsed malignant gliomas treated with
electro-hyperthermia." In Vivo 20(6A): 721-724.

68
Fiorentini, G. and Szasz, A. (2006). "Hyperthermia today: electric energy, a new
opportunity in cancer treatment." J Cancer Res Ther 2(2): 41-46.
Foster, K. R. (2000). The biomedical Engineering Handbook: SecondEdition, CRC Press.
Gabai, V. L., Zamulaeva, I. V., Mosin, A. F., Makarova, Y. M., Mosina, V. A., Budagova,
K. R., Malutina, Y. V. and Kabakov, A. E. (1995). "Resistance of Ehrlich tumor
cells to apoptosis can be due to accumulation of heat shock proteins." FEBS Lett
375(1-2): 21-26.
Galluzzi, L., Vitale, I., Abrams, J. M., Alnemri, E. S., Baehrecke, E. H., Blagosklonny, M.
V., Dawson, T. M., Dawson, V. L., El-Deiry, W. S., Fulda, S., Gottlieb, E., Green,
D. R., Hengartner, M. O., Kepp, O., Knight, R. A., Kumar, S., Lipton, S. A., Lu, X.,
Madeo, F., Malorni, W., Mehlen, P., Nunez, G., Peter, M. E., Piacentini, M.,
Rubinsztein, D. C., Shi, Y., Simon, H. U., Vandenabeele, P., White, E., Yuan, J.,
Zhivotovsky, B., Melino, G. and Kroemer, G. (2012). "Molecular definitions of cell
death subroutines: recommendations of the Nomenclature Committee on Cell Death
2012." Cell Death Differ 19(1): 107-120.
Garg, A. D., Krysko, D. V., Vandenabeele, P. and Agostinis, P. (2012). "Hypericin-based
photodynamic therapy induces surface exposure of damage-associated molecular
patterns like HSP70 and calreticulin." Cancer Immunol Immunother 61(2): 215-221.
Garg, A. D., Martin, S., Golab, J. and Agostinis, P. (2013). "Danger signalling during
cancer cell death: origins, plasticity and regulation." Cell Death Differ.
Garg, A. D., Nowis, D., Golab, J., Vandenabeele, P., Krysko, D. V. and Agostinis, P.
(2010). "Immunogenic cell death, DAMPs and anticancer therapeutics: an emerging
amalgamation." Biochim Biophys Acta 1805(1): 53-71.
Gehrmann, M., Radons, J., Molls, M. and Multhoff, G. (2008). "The therapeutic
implications of clinically applied modifiers of heat shock protein 70 (Hsp70)
expression by tumor cells." Cell Stress Chaperones 13(1): 1-10.
Genet, S. C., Fujii, Y., Maeda, J., Kaneko, M., Genet, M. D., Miyagawa, K. and Kato, T. A.
(2013). "Hyperthermia inhibits homologous recombination repair and sensitizes
cells to ionizing radiation in a time- and temperature-dependent manner." J Cell
Physiol 228(7): 1473-1481.

69
Gogvadze, V., Orrenius, S. and Zhivotovsky, B. (2006). "Multiple pathways of cytochrome
c release from mitochondria in apoptosis." Biochim Biophys Acta 1757(5-6): 639-
647.
Guo, Z. S., Liu, Z., Bartlett, D. L., Tang, D. and Lotze, M. T. (2013). "Life after death:
targeting high mobility group box 1 in emergent cancer therapies." Am J Cancer
Res 3(1): 1-20.
Hager, E. D., Dziambor, H., Hohmann, D., Gallenbeck, D., Stephan, M. and Popa, C.
(1999). "Deep hyperthermia with radiofrequencies in patients with liver metastases
from colorectal cancer." Anticancer Res 19(4C): 3403-3408.
Han, J., Zhong, C. Q. and Zhang, D. W. (2011). "Programmed necrosis: backup to and
competitor with apoptosis in the immune system." Nat Immunol 12(12): 1143-1149.
Harmon, B. V., Corder, A. M., Collins, R. J., Gobe, G. C., Allen, J., Allan, D. J. and Kerr,
J. F. (1990). "Cell death induced in a murine mastocytoma by 42-47 degrees C
heating in vitro: evidence that the form of death changes from apoptosis to necrosis
above a critical heat load." Int J Radiat Biol 58(5): 845-858.
Hegewisch-Becker, S., Gruber, Y., Corovic, A., Pichlmeier, U., Atanackovic, D., Nierhaus,
A. and Hossfeld, D. K. (2002). "Whole-body hyperthermia (41.8 degrees C)
combined with bimonthly oxaliplatin, high-dose leucovorin and 5-fluorouracil 48-
hour continuous infusion in pretreated metastatic colorectal cancer: a phase II
study." Ann Oncol 13(8): 1197-1204.
Hellwig, C. T. and Rehm, M. (2012). "TRAIL signaling and synergy mechanisms used in
TRAIL-based combination therapies." Mol Cancer Ther 11(1): 3-13.
Hildebrandt, B., Wust, P., Ahlers, O., Dieing, A., Sreenivasa, G., Kerner, T., Felix, R. and
Riess, H. (2002). "The cellular and molecular basis of hyperthermia." Crit Rev
Oncol Hematol 43(1): 33-56.
Horvath, I., Multhoff, G., Sonnleitner, A. and Vigh, L. (2008). "Membrane-associated
stress proteins: more than simply chaperones." Biochim Biophys Acta 1778(7-8):
1653-1664.
Horvath, I. and Vigh, L. (2010). "Cell biology: Stability in times of stress." Nature
463(7280): 436-438.

70
Hou, C. H., Lin, F. L., Hou, S. M. and Liu, J. F. (2014). "Hyperthermia induces apoptosis
through endoplasmic reticulum and reactive oxygen species in human osteosarcoma
cells." Int J Mol Sci 15(10): 17380-17395.
Issels, R. D., Lindner, L. H., Verweij, J., Wust, P., Reichardt, P., Schem, B. C., Abdel-
Rahman, S., Daugaard, S., Salat, C., Wendtner, C. M., Vujaskovic, Z.,
Wessalowski, R., Jauch, K. W., Durr, H. R., Ploner, F., Baur-Melnyk, A.,
Mansmann, U., Hiddemann, W., Blay, J. Y. and Hohenberger, P. (2010). "Neo-
adjuvant chemotherapy alone or with regional hyperthermia for localised high-risk
soft-tissue sarcoma: a randomised phase 3 multicentre study." Lancet Oncol 11(6):
561-570.
Jouan-Lanhouet, S., Arshad, M. I., Piquet-Pellorce, C., Martin-Chouly, C., Le Moigne-
Muller, G., Van Herreweghe, F., Takahashi, N., Sergent, O., Lagadic-Gossmann,
D., Vandenabeele, P., Samson, M. and Dimanche-Boitrel, M. T. (2012). "TRAIL
induces necroptosis involving RIPK1/RIPK3-dependent PARP-1 activation." Cell
Death Differ 19(12): 2003-2014.
Kajihara, A., Takahashi, A., Ohnishi, K., Imai, Y., Yamakawa, N., Yasumoto, J., Ohnishi,
T. and Kirita, T. (2008). "Protein microarray analysis of apoptosis-related protein
expression following heat shock in human tongue squamous cell carcinomas
containing different p53 phenotypes." Int J Hyperthermia 24(8): 605-612.
Kepp, O., Galluzzi, L., Martins, I., Schlemmer, F., Adjemian, S., Michaud, M.,
Sukkurwala, A. Q., Menger, L., Zitvogel, L. and Kroemer, G. (2011). "Molecular
determinants of immunogenic cell death elicited by anticancer chemotherapy."
Cancer Metastasis Rev 30(1): 61-69.
Kepp, O., Tesniere, A., Schlemmer, F., Michaud, M., Senovilla, L., Zitvogel, L. and
Kroemer, G. (2009). "Immunogenic cell death modalities and their impact on cancer
treatment." Apoptosis 14(4): 364-375.
Kerr, J. F., Wyllie, A. H. and Currie, A. R. (1972). "Apoptosis: a basic biological
phenomenon with wide-ranging implications in tissue kinetics." Br J Cancer 26(4):
239-257.

71
Kroemer, G., El-Deiry, W. S., Golstein, P., Peter, M. E., Vaux, D., Vandenabeele, P.,
Zhivotovsky, B., Blagosklonny, M. V., Malorni, W., Knight, R. A., Piacentini, M.,
Nagata, S. and Melino, G. (2005). "Classification of cell death: recommendations of
the Nomenclature Committee on Cell Death." Cell Death Differ 12 Suppl 2: 1463-
1467.
Kroemer, G., Galluzzi, L., Kepp, O. and Zitvogel, L. (2013). "Immunogenic cell death in
cancer therapy." Annu Rev Immunol 31: 51-72.
Kroemer, G., Galluzzi, L., Vandenabeele, P., Abrams, J., Alnemri, E. S., Baehrecke, E. H.,
Blagosklonny, M. V., El-Deiry, W. S., Golstein, P., Green, D. R., Hengartner, M.,
Knight, R. A., Kumar, S., Lipton, S. A., Malorni, W., Nunez, G., Peter, M. E.,
Tschopp, J., Yuan, J., Piacentini, M., Zhivotovsky, B. and Melino, G. (2009).
"Classification of cell death: recommendations of the Nomenclature Committee on
Cell Death 2009." Cell Death Differ 16(1): 3-11.
Krysko, D. V., Garg, A. D., Kaczmarek, A., Krysko, O., Agostinis, P. and Vandenabeele,
P. (2012). "Immunogenic cell death and DAMPs in cancer therapy." Nat Rev
Cancer 12(12): 860-875.
Krysko, O., Love Aaes, T., Bachert, C., Vandenabeele, P. and Krysko, D. V. (2013). "Many
faces of DAMPs in cancer therapy." Cell Death Dis 4: e631.
Ladoire, S., Hannani, D., Vetizou, M., Locher, C., Aymeric, L., Apetoh, L., Kepp, O.,
Kroemer, G., Ghiringhelli, F. and Zitvogel, L. (2013). "Cell-Death-Associated
Molecular Patterns As Determinants of Cancer Immunogenicity." Antioxid Redox
Signal.
Liang, H., Zhan, H. J., Wang, B. G., Pan, Y. and Hao, X. S. (2007). "Change in expression
of apoptosis genes after hyperthermia, chemotherapy and radiotherapy in human
colon cancer transplanted into nude mice." World J Gastroenterol 13(32): 4365-
4371.
Lui, P. C., Fan, Y. S., Xu, G., Ngai, C. Y., Fung, K. P., Tse, G. M., Yu, A. M. and Li, J. Y.
(2010). "Apoptotic and necrotic effects of tumour necrosis factor-alpha potentiated
with hyperthermia on L929 and tumour necrosis factor-alpha-resistant L929." Int J
Hyperthermia 26(6): 556-564.
72
Makizumi, R., Yang, W. L., Owen, R. P., Sharma, R. R. and Ravikumar, T. S. (2008).
"Alteration of Drug Sensitivity in Human Colon Cancer Cells after Exposure to
Heat: Implications for Liver Metastasis Therapy using RFA and Chemotherapy." Int
J Clin Exp Med 1(2): 117-129.
Martins, I., Michaud, M., Sukkurwala, A. Q., Adjemian, S., Ma, Y., Shen, S., Kepp, O.,
Menger, L., Vacchelli, E., Galluzzi, L., Zitvogel, L. and Kroemer, G. (2012).
"Premortem autophagy determines the immunogenicity of chemotherapy-induced
cancer cell death." Autophagy 8(3): 413-415.
Mátay, G. and Zombory, L. (2000). A rádiófrekvenciás sugárzás élettani hatásai és
orvosbiológiai alkalmazásai, Műegyetemi Kiadó.
Menger, L., Vacchelli, E., Adjemian, S., Martins, I., Ma, Y., Shen, S., Yamazaki, T.,
Sukkurwala, A. Q., Michaud, M., Mignot, G., Schlemmer, F., Sulpice, E., Locher,
C., Gidrol, X., Ghiringhelli, F., Modjtahedi, N., Galluzzi, L., Andre, F., Zitvogel,
L., Kepp, O. and Kroemer, G. (2012). "Cardiac glycosides exert anticancer effects
by inducing immunogenic cell death." Sci Transl Med 4(143): 143ra199.
Moreno-Ramirez, D., de la Cruz-Merino, L., Ferrandiz, L., Villegas-Portero, R. and Nieto-
Garcia, A. (2010). "Isolated limb perfusion for malignant melanoma: systematic
review on effectiveness and safety." Oncologist 15(4): 416-427.
Mroz, P., Hashmi, J. T., Huang, Y. Y., Lange, N. and Hamblin, M. R. (2011). "Stimulation
of anti-tumor immunity by photodynamic therapy." Expert Rev Clin Immunol 7(1):
75-91.
Multhoff, G. (2007). "Heat shock protein 70 (Hsp70): membrane location, export and
immunological relevance." Methods 43(3): 229-237.
Multhoff, G. and Hightower, L. E. (2011). "Distinguishing integral and receptor-bound heat
shock protein 70 (Hsp70) on the cell surface by Hsp70-specific antibodies." Cell
Stress Chaperones 16(3): 251-255.
Natarajan, S. K. and Becker, D. F. (2012). "Role of apoptosis-inducing factor, proline
dehydrogenase, and NADPH oxidase in apoptosis and oxidative stress." Cell Health
Cytoskelet 2012(4): 11-27.

73
Nicotera, P. (2002). "Apoptosis and age-related disorders: role of caspase-dependent and
caspase-independent pathways." Toxicol Lett 127(1-3): 189-195.
Nishida, T., Akagi, K. and Tanaka, Y. (1997). "Correlation between cell killing effect and
cell membrane potential after heat treatment: analysis using fluorescent dye and
flow cytometry." Int J Hyperthermia 13(2): 227-234.
Norberg, E., Orrenius, S. and Zhivotovsky, B. (2010). "Mitochondrial regulation of cell
death: processing of apoptosis-inducing factor (AIF)." Biochem Biophys Res
Commun 396(1): 95-100.
O'Rourke, A. P., Lazebnik, M., Bertram, J. M., Converse, M. C., Hagness, S. C., Webster,
J. G. and Mahvi, D. M. (2007). "Dielectric properties of human normal, malignant
and cirrhotic liver tissue: in vivo and ex vivo measurements from 0.5 to 20 GHz
using a precision open-ended coaxial probe." Phys Med Biol 52(15): 4707-4719.
Overgaard, J. (1984). "Formula to estimate the thermal enhancement ratio of a single
simultaneous hyperthermia and radiation treatment." Acta Radiol Oncol 23(2-3):
135-139.
Perez, C. A., Pajak, T., Emami, B., Hornback, N. B., Tupchong, L. and Rubin, P. (1991).
"Randomized phase III study comparing irradiation and hyperthermia with
irradiation alone in superficial measurable tumors. Final report by the Radiation
Therapy Oncology Group." Am J Clin Oncol 14(2): 133-141.
Pethig, R., Gascoyne, P. R., McLaughlin, J. A. and Szent-Gyorgyi, A. (1984). "Interaction
of the 2,6-dimethoxysemiquinone and ascorbyl free radicals with Ehrlich ascites
cells: a probe of cell-surface charge." Proc Natl Acad Sci U S A 81(7): 2088-2091.
Pfister, K., Radons, J., Busch, R., Tidball, J. G., Pfeifer, M., Freitag, L., Feldmann, H. J.,
Milani, V., Issels, R. and Multhoff, G. (2007). "Patient survival by Hsp70
membrane phenotype: association with different routes of metastasis." Cancer
110(4): 926-935.
Raoof, M., Cisneros, B. T., Corr, S. J., Palalon, F., Curley, S. A. and Koshkina, N. V.
(2013). "Tumor selective hyperthermia induced by short-wave capacitively-coupled
RF electric-fields." PLoS One 8(7): e68506.

74
Richel, O., Zum Vorde Sive Vording, P. J., Rietbroek, R., Van der Velden, J., Van Dijk, J.
D., Schilthuis, M. S. and Westermann, A. M. (2004). "Phase II study of carboplatin
and whole body hyperthermia (WBH) in recurrent and metastatic cervical cancer."
Gynecol Oncol 95(3): 680-685.
Robert, J. (2003). "Evolution of heat shock protein and immunity." Dev Comp Immunol
27(6-7): 449-464.
Rong, Y. and Mack, P. (2000). "Apoptosis induced by hyperthermia in Dunn osteosarcoma
cell line in vitro." Int J Hyperthermia 16(1): 19-27.
Sachamitr, P. and Fairchild, P. J. (2012). "Cross presentation of antigen by dendritic cells:
mechanisms and implications for immunotherapy." Expert Rev Clin Immunol 8(6):
547-555.
Scheffer, S. R., Nave, H., Korangy, F., Schlote, K., Pabst, R., Jaffee, E. M., Manns, M. P.
and Greten, T. F. (2003). "Apoptotic, but not necrotic, tumor cell vaccines induce a
potent immune response in vivo." Int J Cancer 103(2): 205-211.
Scholoz, B. and Anderson, R. (2000). "On electrical impedance scanning-principles and
simulations." Electromedica 68: 35-44.
Schwan, H. P. (1957). "Electrical properties of tissue and cell suspensions." Adv Biol Med
Phys 5: 147-209.
Shchepotin, I. B., Soldatenkov, V., Wroblewski, J. T., Surin, A., Shabahang, M., Buras, R.
R., Nauta, R. J., Pulyaeva, H. and Evans, S. R. (1997). "Apoptosis induced by
hyperthermia and verapamil in vitro in a human colon cancer cell line." Int J
Hyperthermia 13(5): 547-557.
Spisek, R., Charalambous, A., Mazumder, A., Vesole, D. H., Jagannath, S. and Dhodapkar,
M. V. (2007). "Bortezomib enhances dendritic cell (DC)-mediated induction of
immunity to human myeloma via exposure of cell surface heat shock protein 90 on
dying tumor cells: therapeutic implications." Blood 109(11): 4839-4845.
Stolfi, C., Pallone, F. and Monteleone, G. (2012). "Molecular Targets of TRAIL-
Sensitizing Agents in Colorectal Cancer." Int J Mol Sci 13(7): 7886-7901.
75
Sun, X., Li, X. F., Russell, J., Xing, L., Urano, M., Li, G. C., Humm, J. L. and Ling, C. C.
(2008). "Changes in tumor hypoxia induced by mild temperature hyperthermia as
assessed by dual-tracer immunohistochemistry." Radiother Oncol 88(2): 269-276.
Szasz, A., Szasz, N. and Szasz, O. (2010). Oncothermia: Principles and Practices:
Principles and Practices, Springer.
Szasz, A., Szasz, O. and Szasz, N. (2002). "Onkotermia Fizika a rák ellen." Fizikai szemle
52(2): 45-52.
Tait, S. W. and Green, D. R. (2010). "Mitochondria and cell death: outer membrane
permeabilization and beyond." Nat Rev Mol Cell Biol 11(9): 621-632.
Tamamoto, T., Yoshimura, H., Takahashi, A., Asakawa, I., Ota, I., Nakagawa, H., Ohnishi,
K., Ohishi, H. and Ohnishi, T. (2003). "Heat-induced growth inhibition and
apoptosis in transplanted human head and neck squamous cell carcinomas with
different status of p53." Int J Hyperthermia 19(6): 590-597.
Tesniere, A., Schlemmer, F., Boige, V., Kepp, O., Martins, I., Ghiringhelli, F., Aymeric, L.,
Michaud, M., Apetoh, L., Barault, L., Mendiboure, J., Pignon, J. P., Jooste, V., van
Endert, P., Ducreux, M., Zitvogel, L., Piard, F. and Kroemer, G. (2010).
"Immunogenic death of colon cancer cells treated with oxaliplatin." Oncogene
29(4): 482-491.
Trabulsi, N. H., Patakfalvi, L., Nassif, M. O., Turcotte, R. E., Nichols, A. and
Meguerditchian, A. N. (2012). "Hyperthermic isolated limb perfusion for extremity
soft tissue sarcomas: systematic review of clinical efficacy and quality assessment
of reported trials." J Surg Oncol 106(8): 921-928.
Ullrich, E., Bonmort, M., Mignot, G., Kroemer, G. and Zitvogel, L. (2008). "Tumor stress,
cell death and the ensuing immune response." Cell Death Differ 15(1): 21-28.
Vandenabeele, P., Galluzzi, L., Vanden Berghe, T. and Kroemer, G. (2010). "Molecular
mechanisms of necroptosis: an ordered cellular explosion." Nat Rev Mol Cell Biol
11(10): 700-714.
Vanlangenakker, N., Vanden Berghe, T. and Vandenabeele, P. (2012). "Many stimuli pull
the necrotic trigger, an overview." Cell Death Differ 19(1): 75-86.

76
Wang, S. (2010). "TRAIL: a sword for killing tumors." Curr Med Chem 17(29): 3309-
3317.
Westermann, A. M., Wiedemann, G. J., Jager, E., Jager, D., Katschinski, D. M., Knuth, A.,
Vorde Sive Vording, P. Z., Van Dijk, J. D., Finet, J., Neumann, A., Longo, W.,
Bakhshandeh, A., Tiggelaar, C. L., Gillis, W., Bailey, H., Peters, S. O. and Robins,
H. I. (2003). "A Systemic Hyperthermia Oncologic Working Group trial.
Ifosfamide, carboplatin, and etoposide combined with 41.8 degrees C whole-body
hyperthermia for metastatic soft tissue sarcoma." Oncology 64(4): 312-321.
Wismeth, C., Dudel, C., Pascher, C., Ramm, P., Pietsch, T., Hirschmann, B., Reinert, C.,
Proescholdt, M., Rummele, P., Schuierer, G., Bogdahn, U. and Hau, P. (2010).
"Transcranial electro-hyperthermia combined with alkylating chemotherapy in
patients with relapsed high-grade gliomas: phase I clinical results." J Neurooncol
98(3): 395-405.
Wust, P., Hildebrandt, B., Sreenivasa, G., Rau, B., Gellermann, J., Riess, H., Felix, R. and
Schlag, P. M. (2002). "Hyperthermia in combined treatment of cancer." Lancet
Oncol 3(8): 487-497.
Yonezawa, M., Otsuka, T., Matsui, N., Tsuji, H., Kato, K. H., Moriyama, A. and Kato, T.
(1996). "Hyperthermia induces apoptosis in malignant fibrous histiocytoma cells in
vitro." Int J Cancer 66(3): 347-351.
Zhou, J., Wang, X., Du, L., Zhao, L., Lei, F., Ouyang, W., Zhang, Y., Liao, Y. and Tang, J.
(2011). "Effect of hyperthermia on the apoptosis and proliferation of CaSki cells."
Mol Med Rep 4(1): 187-191.
Zou, Y. and Guo, Z. (2003). "A review of electrical impedance techniques for breast cancer
detection." Med Eng Phys 25(2): 79-90.

77
12. BIBLIOGRAPHY OF THE CANDIDATE’S PUBLICATIONS
Publication related to the PhD thesis
Andocs, G., Meggyeshazi, N., Balogh, L., Spisak, S., Maros, M. E., Balla, P., Kiszner, G.,
Teleki, I., Kovago, C. and Krenacs, T. (2014). "Upregulation of heat shock proteins and the
promotion of damage-associated molecular pattern signals in a colorectal cancer model by
modulated electrohyperthermia." Cell Stress Chaperones. (Ahead of print)
Andocs G. and Meggyeshazi N. are equally contributed to this work.
Meggyeshazi, N., Andocs, G., Balogh, L., Balla, P., Kiszner, G., Teleki, I., Jeney, A. and
Krenacs, T. (2014). "DNA fragmentation and caspase-independent programmed cell death
by modulated electrohyperthermia." Strahlenther Onkol. (Ahead of print)
Publication not related to the PhD thesis
Teleki, I., Szasz, A. M., Maros, M. E., Gyorffy, B., Kulka, J., Meggyeshazi, N., Kiszner,
G., Balla, P., Samu, A. and Krenacs, T. (2014). "Correlations of differentially expressed
gap junction connexins cx26, cx30, cx32, cx43 and cx46 with breast cancer progression and
prognosis." PLoS One 9(11): e112541.
Penzvalto, Z., Lanczky, A., Lenart, J., Meggyeshazi, N., Krenacs, T., Szoboszlai, N.,
Denkert, C., Pete, I. and Gyorffy, B. (2014). "MEK1 is associated with carboplatin
resistance and is a prognostic biomarker in epithelial ovarian cancer." BMC Cancer 14:
837.
Kiszner, G., Wichmann, B., Nemeth, I. B., Varga, E., Meggyeshazi, N., Teleki, I., Balla, P.,
Maros, M. E., Penksza, K. and Krenacs, T. (2014). "Cell cycle analysis can differentiate
thin melanomas from dysplastic nevi and reveals accelerated replication in thick
melanomas." Virchows Arch 464(5): 603-612.

78
Stelkovics, E., Kiszner, G., Meggyeshazi, N., Korom, I., Varga, E., Nemeth, I., Molnar, J.,
Marczinovits, I. and Krenacs, T. (2013). "Selective in situ protein expression profiles
correlate with distinct phenotypes of basal cell carcinoma and squamous cell carcinoma of
the skin." Histol Histopathol 28(7): 941-954.
Citable abstracts
Meggyeshazi, N; Andocs, G; Balogh, L; Krenacs, T (2011) “DNA fragmentation-driven
tumor cell degradation induced by modulated electro-hyperthermia” Virchows Arch 459
(Suppl 1):S204-205
Meggyeshazi, N; Andocs, G; Krenacs, T (2012) “Modulated electro-hyperthermia induced
programmed cell death in HT29 colorectal carcinoma xenograft” Virchows Arch 461
(Suppl 1):S131–S132
Teleki, I, .Szasz, M. A., Kulka, J. Meggyeshazi, N.;Kiszner, G.; Balla, B.; Krenacs, T.
(2013) “Expression and potential involvement of connexins in breast cancer progression”
Virchows Arch 463 (2) 260-261
Kiszner, G., Teleki, I.; Meggyeshazi, N.; Balla, P.; Maros, M. E.; Nemeth, I. B.; Varga, E.;
Korom, I.; Krenacs, T. (2013) “Exploring connexin expression in melanocytic tumors”
Virchows Arch 463 (2) 284
Meggyeshazi, N.; Andocs, G.; Spisak, S.; Kiszner, G.; Balla, P.; Balogh, L.; Krenacs, T.
(2013) “Modulated electrohyperthermia causes caspase independent programmed cell death
in HT29 colon cancer xenografts” Virchows Arch 463 (2) 329

79
13. ACKNOWLEDGEMENTS
I am thankful for Professor Dr András Matolcsy for hosting me in his Institution.
I am utterly grateful for Dr. Tibor Krenács for the possibility to work in his laboratory and
for his helpful advices and support.
I am thankful for all the members of the laboratory first of all Edit Parsch whose technical
help was crucial for my work, for Dr. Ivett Teleki, Dr. Maté Maros, Dr. Gergő Kiszner and
Péter Balla for their remarks and friendly conversations.
I am utterly grateful for Professor Dr. András Jeney for his advices, support and friendly
conversations.
I am grateful for all the members of the Department who at any how helped me throughout
my work.
I am thankful for Dr. Lajos Balogh for his help in the animal experiments.
I am also grateful to Professor Dr. Andras Szasz for support and useful advice throughout
my project.
At last but not least I am thankful from the bottom of my heart for all the members of my
family for their lifetime love and support.