table list of tables pages - دائرة الإحصاءات...
TRANSCRIPT
Department of Statistics, Jordan Statistical Yearbook 2011 2011
v
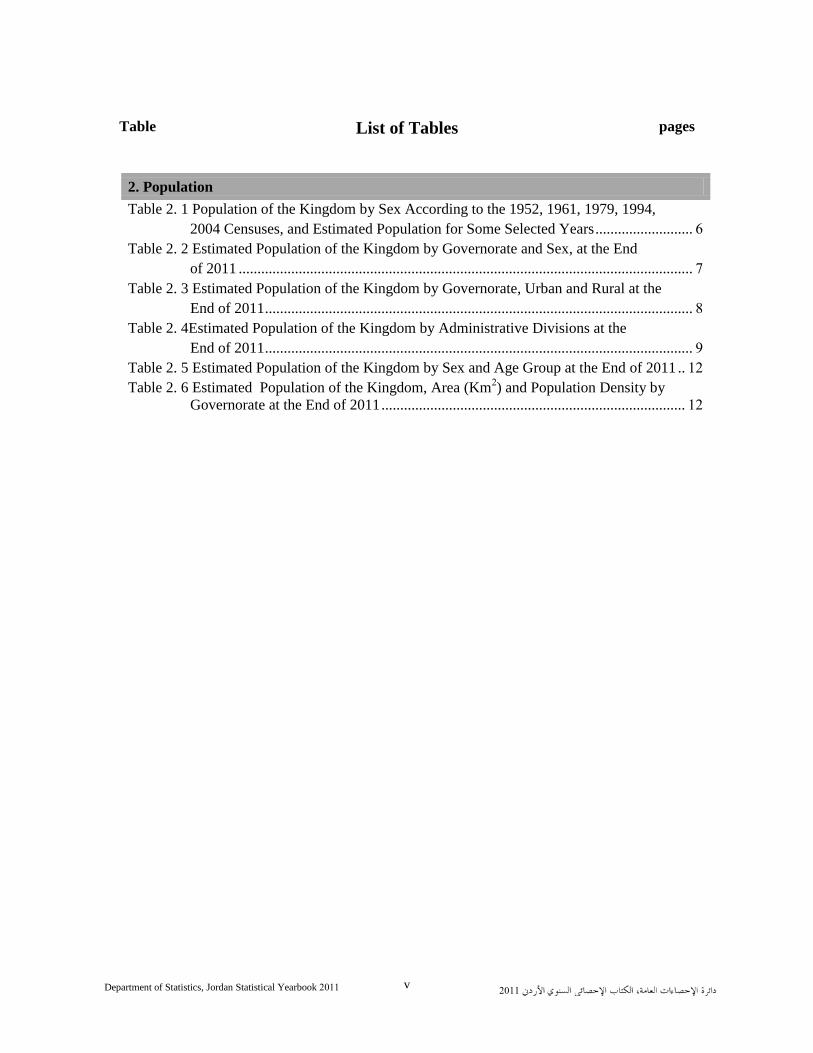
Table List of Tables pages
Table 2. 1 Population of the Kingdom by Sex According to the 1952, 1961, 1979, 1994, 2004 Censuses, and Estimated Population for Some Selected Years .......................... 6
Table 2. 2 Estimated Population of the Kingdom by Governorate and Sex, at the End of 2011 ......................................................................................................................... 7
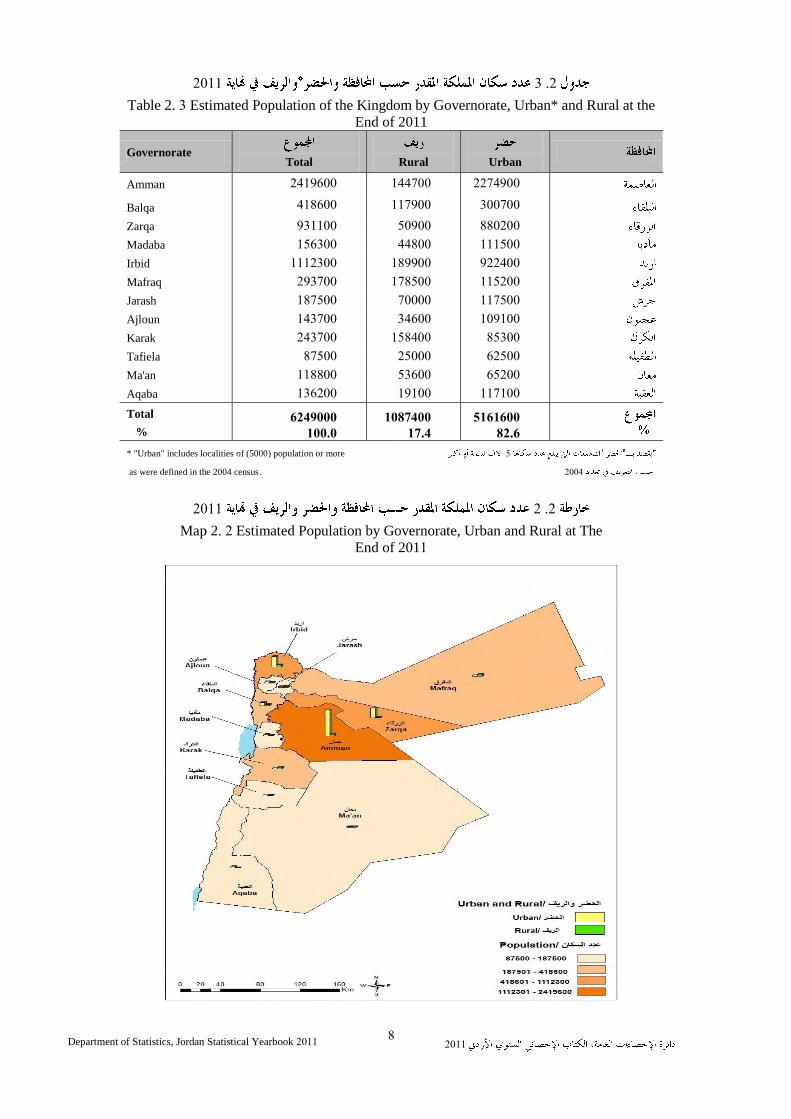
Table 2. 3 Estimated Population of the Kingdom by Governorate, Urban and Rural at the End of 2011 .................................................................................................................. 8
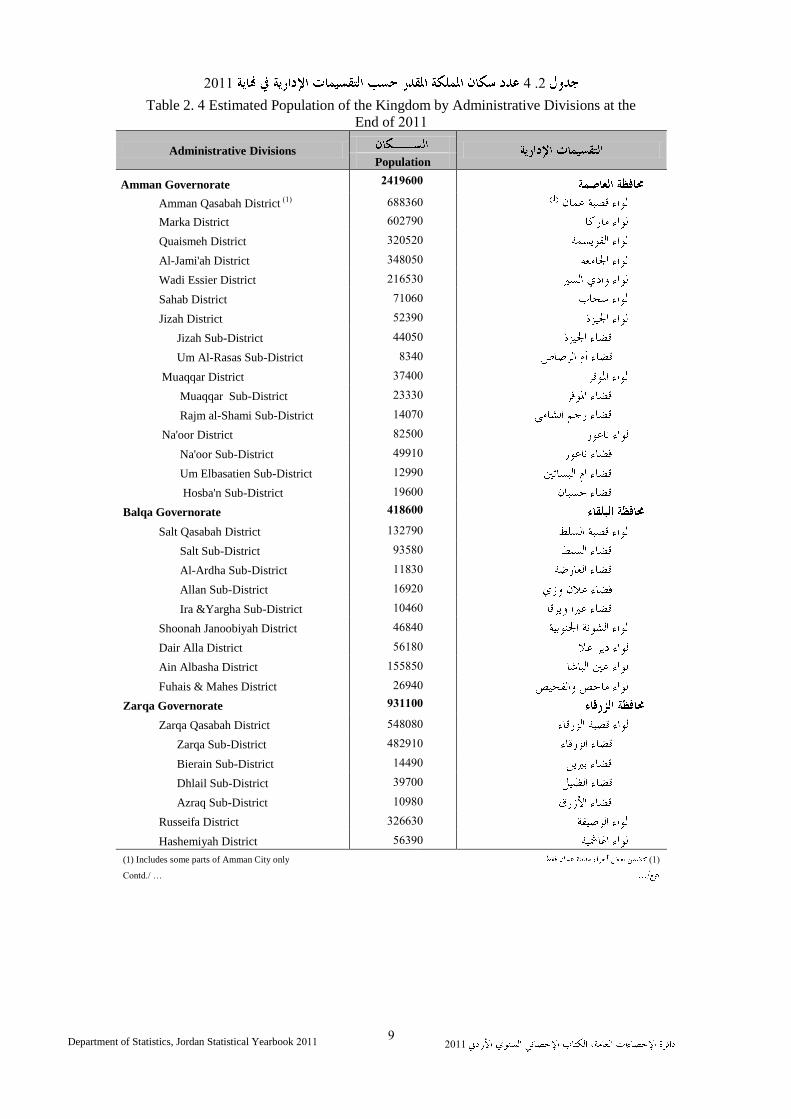
Table 2. 4Estimated Population of the Kingdom by Administrative Divisions at the End of 2011 .................................................................................................................. 9
Table 2. 5 Estimated Population of the Kingdom by Sex and Age Group at the End of 2011 .. 12 Table 2. 6 Estimated Population of the Kingdom, Area (Km2) and Population Density by
Governorate at the End of 2011 ................................................................................. 12
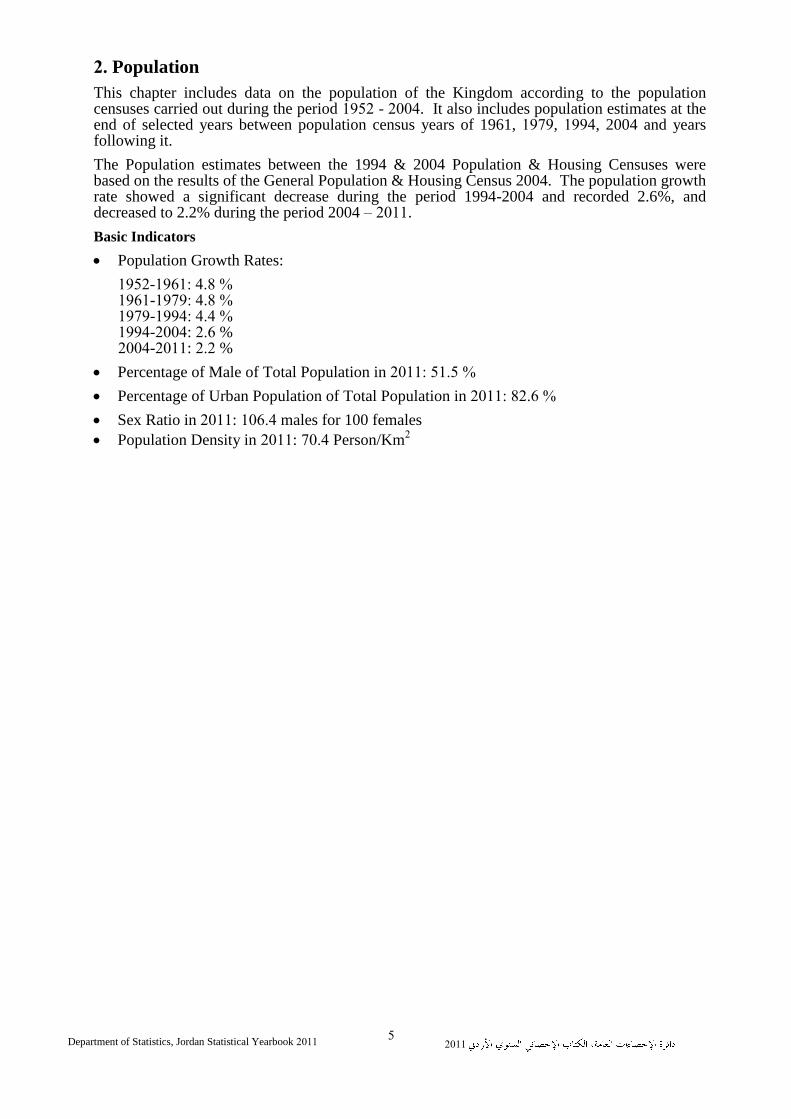
2. Population
2011 Department of Statistics, Jordan Statistical Yearbook 2011
. Population
This chapter includes data on the population of the Kingdom according to the population censuses carried out during the period - . It also includes population estimates at the end of selected years between population census years of 1961, , , 2004 and years following it.
The Population estimates between the 1994 & 2004 Population & Housing Censuses were based on the results of the General Population & Housing Census 2004. The population growth rate showed a significant decrease during the period 1994-2004 and recorded 2.6%, and decreased to 2.2% during the period 2004 – .
Basic Indicators
Population Growth Rates:
- - - -2004: 2.6 % - 1: 2.2 %
Percentage of Male of Total Population in 1
Percentage of Urban Population of Total Population in 1
Sex Ratio in 1: males for 100 females
Population Density in 1: Person/Km
6
������ ��� � ����� ������ ����� � ���� ����� 2011
Department of Statistics, Jordan Statistical Yearbook 2011
���� 2 .1 � ��� ����� �� ���� ��� ������ ���1952 ،1961 ،1979 ،1994 �2004 �����! �"��# ��$��
(���� ���)
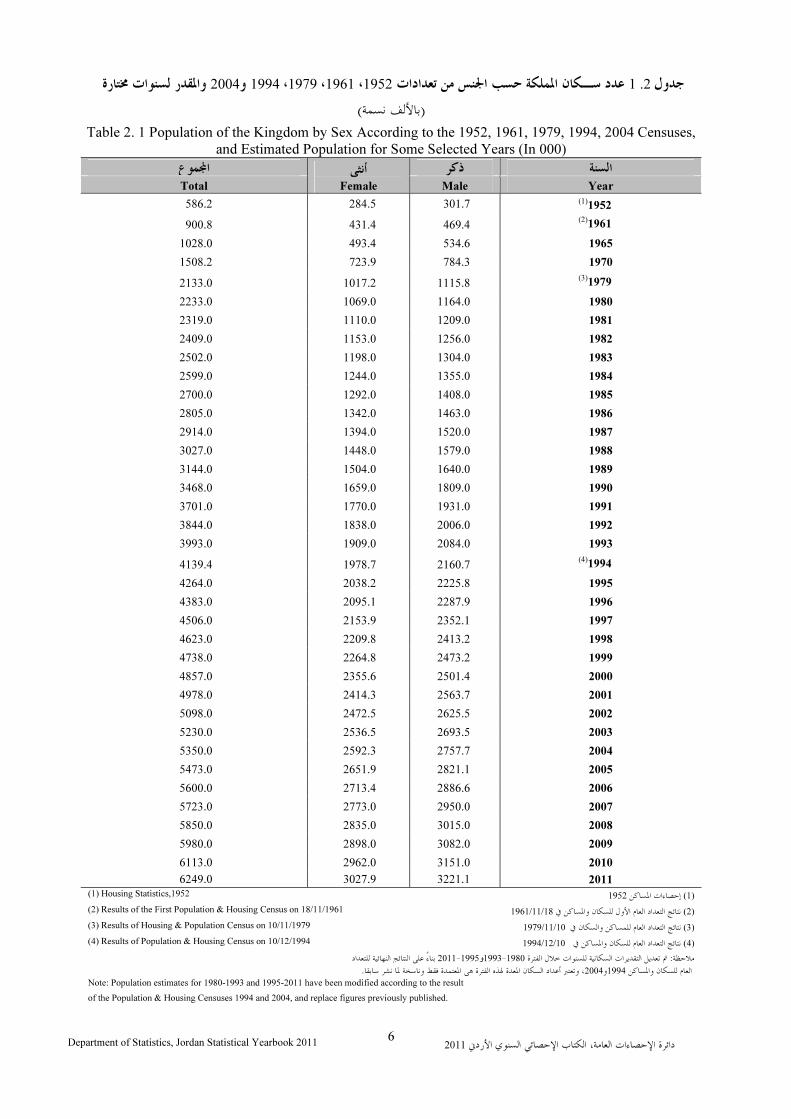
Table 2. 1 Population of the Kingdom by Sex According to the 1952, 1961, 1979, 1994, 2004 Censuses,
and Estimated Population for Some Selected Years (In 000)
����� ���� Female
�����
Year MaleTotal
(1)1952
301.7 284.5 586.2
(2)1961 469.4 431.4 900.8
1965 534.6 493.4 1028.0
1970 784.3 723.9 1508.2
(3)1979 1115.8 1017.2 2133.0
1980 1164.0 1069.0 2233.0
1981 1209.0 1110.0 2319.0
1982 1256.0 1153.0 2409.0
1983 1304.0 1198.0 2502.0
1984 1355.0 1244.0 2599.0
1985 1408.0 1292.0 2700.0
1986 1463.0 1342.0 2805.0
1987 1520.0 1394.0 2914.0
1988 1579.0 1448.0 3027.0
1989 1640.0 1504.0 3144.0
1990 1809.0 1659.0 3468.0
1991 1931.0 1770.0 3701.0
1992 2006.0 1838.0 3844.0
1993 2084.0 1909.0 3993.0
(4)1994 2160.7 1978.7 4139.4
1995 2225.8 2038.2 4264.0
1996 2287.9 2095.1 4383.0
1997 2352.1 2153.9 4506.0
1998 2413.2 2209.8 4623.0
1999 2473.2 2264.8 4738.0
2000 2501.4 2355.6 4857.0
2001 2563.7 2414.3 4978.0
2002 2625.5 2472.5 5098.0
2003 2693.5 2536.5 5230.0
2004 2757.7 2592.3 5350.0
2005 2821.1 2651.9 5473.0
2006 2886.6 2713.4 5600.0
2007 2950.0 2773.0 5723.0
2008 3015.0 2835.0 5850.0
2009 3082.0 2898.0 5980.0
2010 3151.0 2962.0 6113.0
2011 3221.1 3027.9 6249.0
)1( ������ �����1952 (1) Housing Statistics,1952
)2( ������� ������ ���� ����� ������� ����� 1961/11/18
(2) Results of the First Population & Housing Census on 18/11/1961
)3 ( ������� ������� ����� ������� ����� 1979/11/10 (3) Results of Housing & Population Census on 10/11/1979
)4( ������� ������ ����� ������� �����1994/12/10
(4) Results of Population & Housing Census on 10/12/1994
���!�� �"# ��$%��� &'�3%�2 0�1 ��%���� ��%/��'& �������1995�2011و1980�1993."�-&: , +��)* ���(�)��� ����� ������� ������ �����1994�2004.�)3�5 �6� �� &75��� 8)9 ������� ;< ���!�� =>? ����� ������ ���1@ A��+� B
Note: Population estimates for 1980-1993 and 1995-2011 have been modified according to the result
of the Population & Housing Censuses 1994 and 2004, and replace figures previously published.
2011 Department of Statistics, Jordan Statistical Yearbook 2011
2 .2
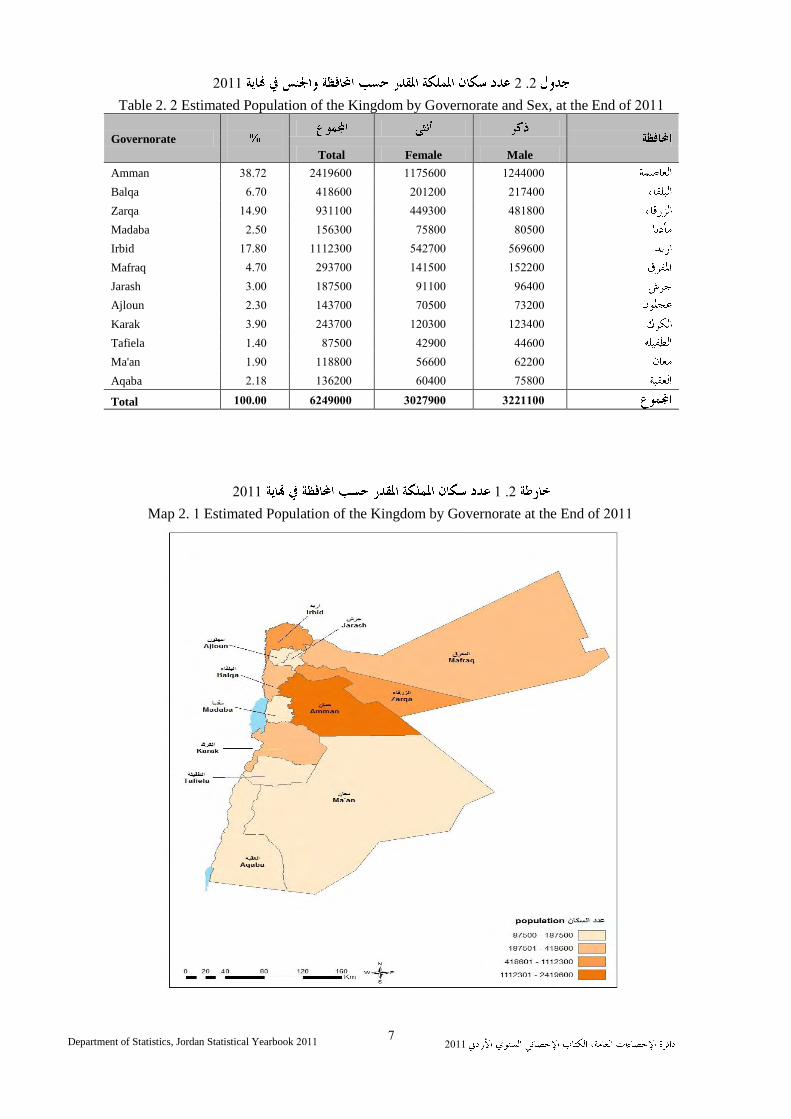
Table 2. Estimated Population of the Kingdom by Governorate and Sex, at the End of
Governorate
Male FemaleTotal
Amman
Balqa
Zarqa
Madaba
Irbid
Mafraq
Jarash
Ajloun
Karak
Tafiela
Ma'an
Aqaba
Total
2 .1 2011
Map 2. Estimated Population of the Kingdom by Governorate at the End of
2011 Department of Statistics, Jordan Statistical Yearbook 2011
2 .3
Table 2. Estimated Population of the Kingdom by Governorate, Urban* and Rural at the
End of 2011
UrbanRuralTotalGovernorate
Amman
Balqa
Zarqa
Madaba
Irbid
Mafraq
Jarash
Ajloun
Karak
Tafiela
Ma'an
Aqaba
Total
%
5
2004
* "Urban" includes localities of (5000) population or more
as were defined in the 2004 census
2 .2 2011
Map 2. Estimated Population by Governorate, Urban and Rural at The
End of 2011
2011 Department of Statistics, Jordan Statistical Yearbook 2011
2 .4
Table 2. Estimated Population of the Kingdom by Administrative Divisions at the
End of
Administrative DivisionsPopulation
Amman Governorate
Amman Qasabah District
Marka District
Quaismeh District
Al-Jami'ah District
Wadi Essier District
Sahab District
Jizah District
Jizah Sub-District
Um Al-Rasas Sub-District
Muaqqar District
Muaqqar Sub-District
Rajm al-Shami Sub-District
Na'oor District
Na'oor Sub-District
Um Elbasatien Sub-District
Hosba'n Sub-District
Balqa Governorate
Salt Qasabah District
Salt Sub-District
Al-Ardha Sub-District
Allan Sub-District
Ira &Yargha Sub-District
Shoonah Janoobiyah District
Dair Alla District
Ain Albasha District
Fuhais & Mahes District
Zarqa Governorate
Zarqa Qasabah District
Zarqa Sub-District
Bierain Sub-District
Dhlail Sub-District
Azraq Sub-District
Russeifa District
Hashemiyah District
(1)(1) Includes some parts of Amman City only
Contd …
2011 Department of Statistics, Jordan Statistical Yearbook 2011
4.2
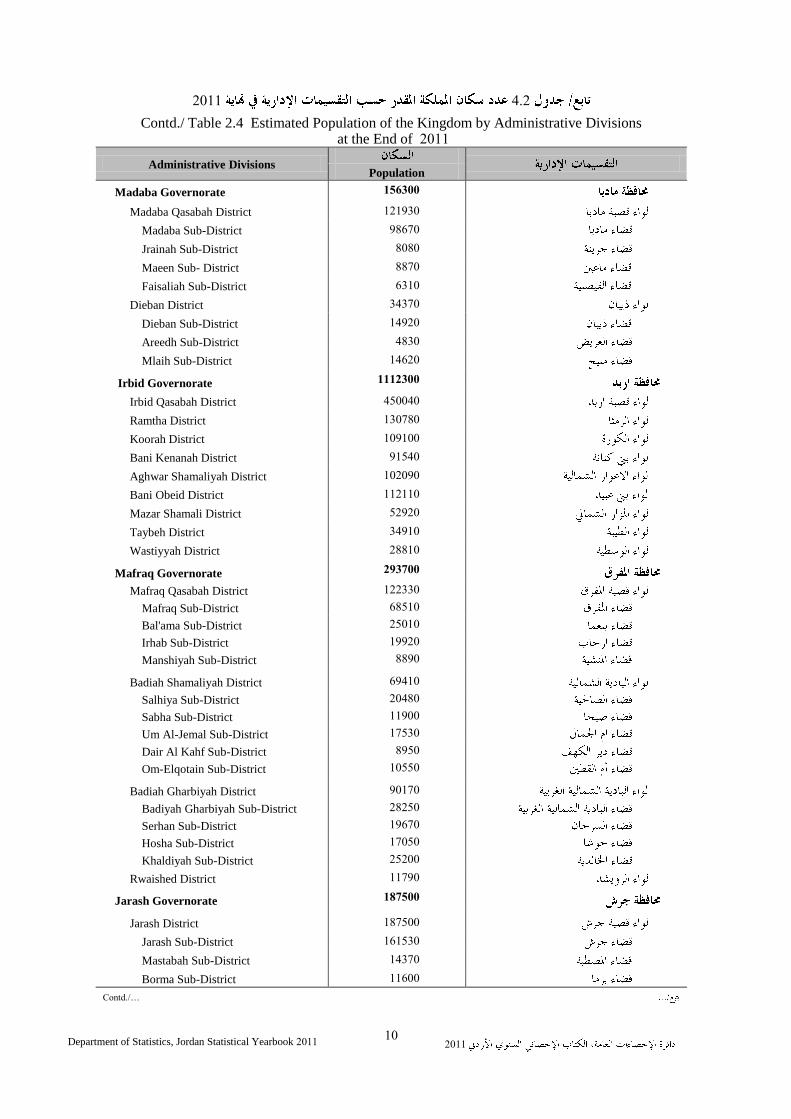
Contd./ Table 2.4 Estimated Population of the Kingdom by Administrative Divisions at the End of
Administrative DivisionsPopulation
Madaba Governorate
Madaba Qasabah District
Madaba Sub-District
Jrainah Sub-District
Maeen Sub- District
Faisaliah Sub-District
Dieban District
Dieban Sub-District
Areedh Sub-District
Mlaih Sub-District
Irbid Governorate
Irbid Qasabah District
Ramtha District
Koorah District
Bani Kenanah District
Aghwar Shamaliyah District
Bani Obeid District
Mazar Shamali District
Taybeh District
Wastiyyah District
Mafraq Governorate
Mafraq Qasabah District
Mafraq Sub-District
Bal'ama Sub-District
Irhab Sub-District
Manshiyah Sub-District
Badiah Shamaliyah District
Salhiya Sub-District
Sabha Sub-District
Um Al-Jemal Sub-District
Dair Al Kahf Sub-District
Om-Elqotain Sub-District
Badiah Gharbiyah District
Badiyah Gharbiyah Sub-District
Serhan Sub-District
Hosha Sub-District
Khaldiyah Sub-District
Rwaished District
Jarash Governorate
Jarash District
Jarash Sub-District
Mastabah Sub-District
Borma Sub-District
Contd …
2011 Department of Statistics, Jordan Statistical Yearbook 2011
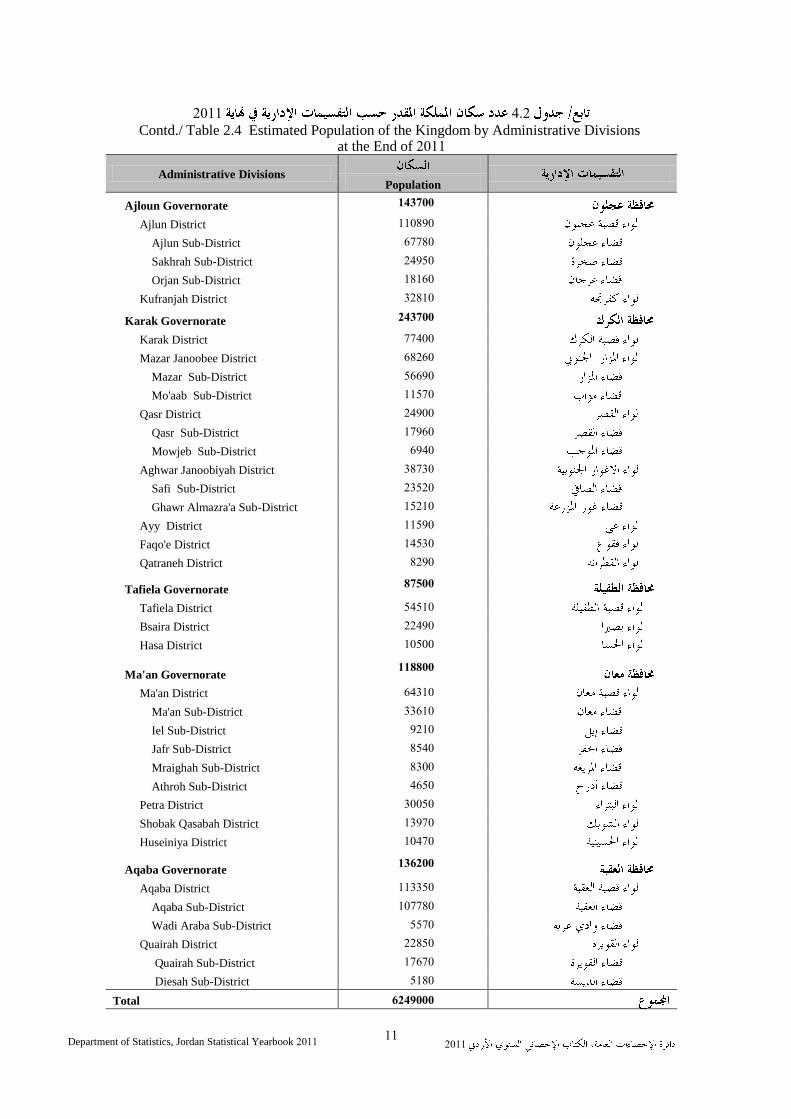
4.2 Contd./ Table 2.4 Estimated Population of the Kingdom by Administrative Divisions
at the End of
Administrative DivisionsPopulation
Ajloun Governorate
Ajlun District
Ajlun Sub-District
Sakhrah Sub-District
Orjan Sub-District
Kufranjah District
Karak Governorate
Karak District
Mazar Janoobee District
Mazar Sub-District
Mo'aab Sub-District
Qasr District
Qasr Sub-District
Mowjeb Sub-District
Aghwar Janoobiyah District
Safi Sub-District
Ghawr Almazra'a Sub-District
Ayy District
Faqo'e District
Qatraneh District
Tafiela Governorate
Tafiela District
Bsaira District
Hasa District
Ma'an Governorate
Ma'an District
Ma'an Sub-District
Iel Sub-District
Jafr Sub-District
Mraighah Sub-District
Athroh Sub-District
Petra District
Shobak Qasabah District
Huseiniya District
Aqaba Governorate
Aqaba District
Aqaba Sub-District
Wadi Araba Sub-District
Quairah District
Quairah Sub-District
Diesah Sub-District
Total
2011 Department of Statistics, Jordan Statistical Yearbook 2011
2 .
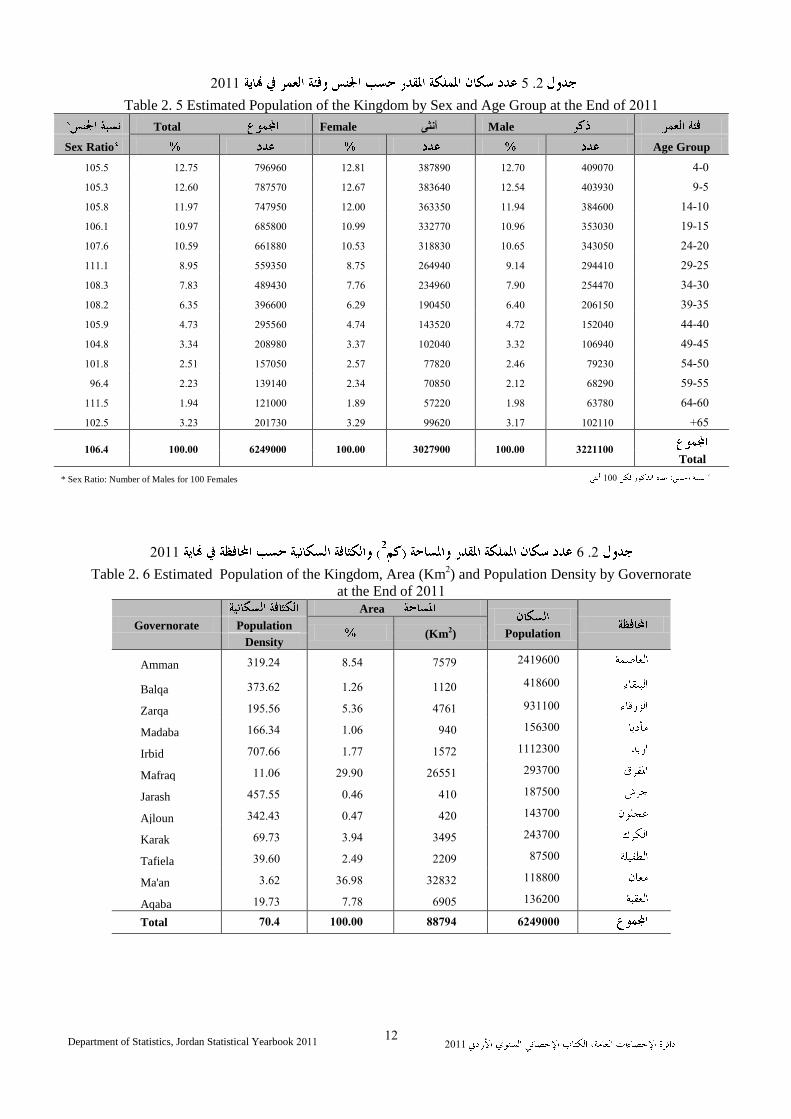
Table 2. Estimated Population of the Kingdom by Sex and Age Group at the End of
MaleأنثىFemale Total
Age GroupSex Ratio
-
-
-
-
-
-
-
-
-
-
-
-
-
Total
100 * Sex Ratio: Number of Males for 100 Females
2 .6
Table 2. Estimated Population of the Kingdom, Area (Km ) and Population Density by Governorate
at the End of
Population
Area
Governorate(Km )
Population
Density
Amman
Balqa
Zarqa
Madaba
Irbid
Mafraq
Jarash
Ajloun
Karak
Tafiela
Ma'an
Aqaba
Total
2011 Department of Statistics, Jordan Statistical Yearbook 2011
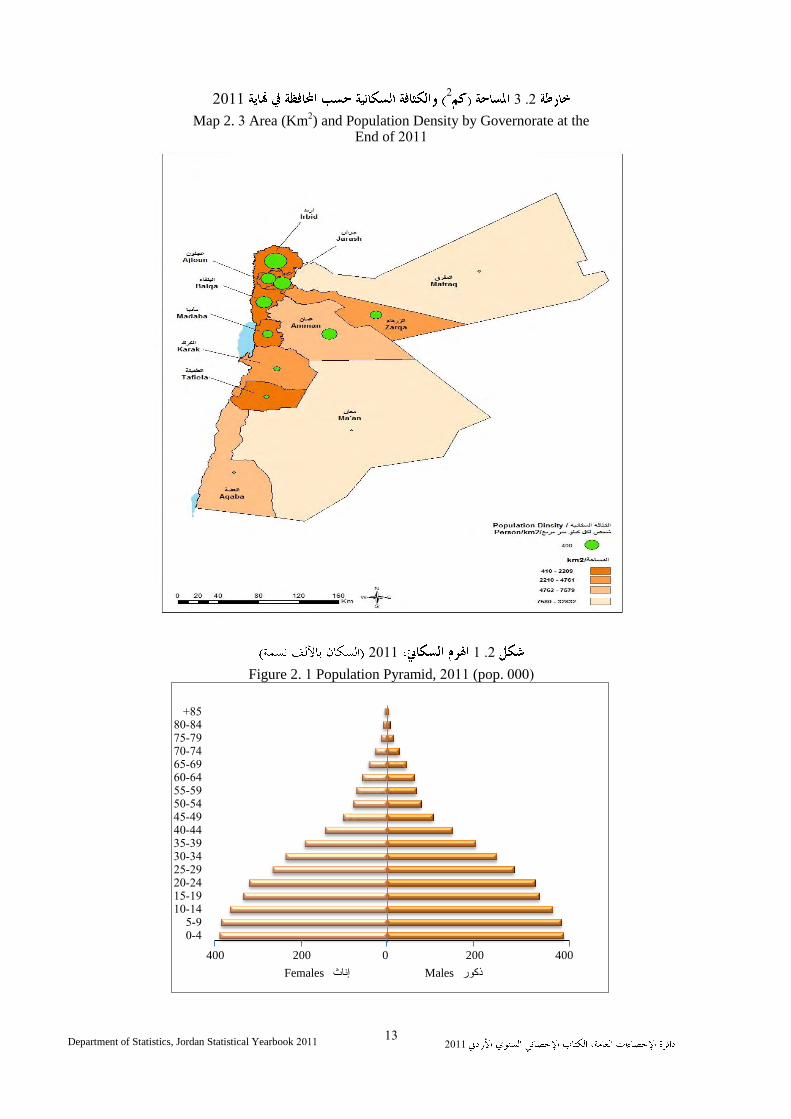
2 .32
2011
Map 2. Area (Km ) and Population Density by Governorate at the
End of 1
2 .12011
Figure 2. Population Pyramid, (pop.
4-0 9-5
14-10 19-15 24-20 29-25 34-30 39-35 44-40 49-45 54-50 59-55 64-60 69-65 74-70 79-75 84-80 85+
Maleركىس Femaleاَاز
400 200 0 200 400
Females إَاز Males ركىس