technical paper 8b measuring the impact of pre-school on
TRANSCRIPT
A Longitudinal Study funded by the DfES 1997-2003
department for
education and skills
Technical Paper 8b
Measuring the Impact of Pre-School on Children’s Social/Behavioural Development over the Pre-School Period
Th
e Effectiv
e Pro
visio
n o
f Pre-Sch
oo
l Ed
ucatio
n (E
PP
E) P
roject

The Effective Provision of Pre-School
Education [EPPE] Project
Technical Paper 8b
Measuring the Impact of Pre-School on Children’s Social/Behavioural Development over the Pre-School
Period
A Longitudinal Study funded by the DfES
1997 – 2003
Address for correspondence: EPPE Project Room 416 University of London Institute of Education Tel: +44 (0)20 7612 6219 20 Bedford Way Fax: +44 (0)20 7612 6230 London WC1H 0AL Email: [email protected] Website http://www.ioe.ac.uk/projects/eppe

Technical Paper 8b MEASURING THE IMPACT OF PRE-SCHOOL ON CHILDREN’S
SOCIAL/BEHAVIOURAL DEVELOPMENT OVER THE PRE-SCHOOL PERIOD
AUTHORS :
Pam Sammons Kathy Sylva
Edward Melhuish Iram Siraj-Blatchford
Brenda Taggart Karen Elliot
ACKNOWLEDGEMENT The EPPE project is a major five year study funded by the DfES. The research would not be possible without the support and co-operation of the six Local Authorities (LAs) and the many pre-school centres, primary schools, children and parents participating in the research. The important contribution of the Regional Research Officers Anne Dobson, Isabella Hughes, Marjorie Jeavons, Margaret Kehoe, Katie Lewis, Maria Morahan, Sharon Sadler and our part-time Research Assistants, especially Nadine Boyne and Wesley Welcomme, has been vital to the project's completion. Helpful discussions on issues surrounding the interpretation and calculation of effect sizes were held with Professor Harvey Goldstein, Professor Peter Tymms, Dr. Steve Strand and Dr. Robert Coe. We are grateful to both the project's Steering and Consultative Committees for their helpful advice on the study, in particular Rebecca Goldman (DfES Analytical Services).

THE EPPE RESEARCH TEAM
Principal Investigators Professor Kathy Sylva Department of Educational Studies, University of Oxford
Professor Edward Melhuish Institute for the Study of Children, Families and Social Issues, Birkbeck University of London
Professor Pam Sammons Institute of Education, University of London
Professor Iram Siraj-Blatchford Institute of Education, University of London
Research Co-ordinator Brenda Taggart Institute of Education, University of London
Senior Research Officer for Multilevel Analyses Karen Elliot Institute of Education, University of London
First Published in March 2003 by the Institute of Education University of London 20 Bedford Way, London WC1H OAL
Pursuing Excellence in Education
ISBN 085473 683 2
Printed by Formara Ltd. Southend on Sea. Essex.
The views expressed in this report are the authors’ and do not necessarily reflect those of the Department for Education and Skills.
© The Institute of Education
Contents page
Overview of the Project 1-10 Main Findings and Implications for Policy i-vi Introduction 1
Section 1: Characteristics of the Sample and Social Behavioural Development at Primary School Entry 6 Section 2: Children’s Social Behavioural Development at Primary School Entry: Results from Contextualised Multilevel Analyses 13 Child Measures 15 Family Measures 16 Home Environment Measures 16 Other measures 19 Section 3: Children’s Social Behavioural Development Over the Pre-school Period: Results from Value Added Multilevel Analyses 23 Simple Value Added Models 24 Complex Value Added Models 27 ‘Independence and Concentration’ Developmental Gains 29 ‘Co-operation & Conformity’ Developmental Gains 30 ‘Peer Sociability’ Developmental Gains 30 Changes in ‘Anti-Social/Worried’ Behaviour 31 Differences Between Individual Pre-school Centres in their Effects 33 Section 4: Accounting for Pre-school Centre Effects on Children’s Social Behavioural
Development. 38 Pre-school Type 38 Quality Characteristics in terms of ECER-R and ECERS-E 41 Quality Characteristics in terms of Caregiver Interaction Scale 44 Staff Qualifications 45 Ratios 46 Amount of Pre-school Provision 48 Child Age at Start of Pre-school Centre 50 Parental Involvement 50 Section 5: The Impact of Pre-school Provision: Comparison of Home Children with
Children who Attended a Pre-school Centre 52 Characteristics of the Home Children Compared with Children who Attended a Pre-school Centre. 53 A Contextualised Analysis of the Home Children’s Social Behavioural Development at Primary School Entry Compared to Children who Attended a Pre-school Centre 54 Section 6: Summary and Conclusions 58 Appendices 64 Glossary 96 References 101

1
Effective Provision of Pre-school Education
“EPPE”
Overview of the Project
This series of 12 reports describes the research on effective pre-school provision funded by the UK Department for Education & Employment (DfEE). Further details appear in Technical Paper 1 (Sylva, Sammons, Melhuish, Siraj-Blatchford & Taggart 1999). This longitudinal study assesses the attainment and development of children followed longitudinally between the ages of 3 and 7 years. Three thousand children were recruited to the study over the period January 1997 to April 1999 from 141 pre-school centres. Initially 114 centres from four types of provision were selected for the study but in September 1998 an extension to the main study was implemented to include innovative forms of provision, including ‘combined education and care’ (Siraj-Blatchford et al. 1997). Both qualitative and quantitative methods (including multilevel modelling) have been used to explore the effects of individual pre-school centres on children's attainment and social/behavioural development at entry to school and any continuing effects on such outcomes at the end of Key Stage 1 (age 7). In addition to centre effects, the study investigates the contribution to children’s development of individual and family characteristics such as gender, ethnicity, language, parental education and employment. This overview describes the research design and discusses a variety of research issues (methodological and practical) in investigating the impact of pre-school provision on children’s developmental progress. A parallel study is being carried out in Northern Ireland. There have been many initiatives intended to improve educational outcomes for young children. Will these initiatives work? Will they enable children to enter school ‘more ready’ to learn, or achieve more at the end of Key Stage 1? Which are the most effective ways to educate young children? The research project described in this paper is part of the new emphasis on ensuring ‘a good start’ for children.
PREVIOUS RESEARCH ON THE EFFECTS OF EARLY EDUCATION IN THE UK There has been little large-scale, systematic research on the effects of early childhood education in the UK. The ‘Start Right’ Enquiry (Ball 1994; Sylva 1994) reviewed the evidence of British research and concluded that small-scale studies suggested a positive impact but that large-scale research was inconclusive. The Start Right enquiry recommended more rigorous longitudinal studies with baseline measures so that the ‘value added’ to children’s development by pre-school education could be established. Research evidence elsewhere on the effects of different kinds of pre-school environment on children's development (Melhuish et al. 1990; Melhuish 1993; Sylva & Wiltshire 1993; Schweinhart & Weikart 1997; Borge & Melhuish, 1995; National Institute of Child Health Development 1997) suggests positive outcomes. Some researchers have examined the impact of particular characteristics, e.g. gender and attendance on children's adjustment to nursery classes (Davies & Brember 1992), or adopted cross-sectional designs to explore the impact of different types of pre-school provision (Davies & Brember 1997). Feinstein, Robertson & Symons (1998) attempted to evaluate the effects of pre-schooling on children’s subsequent progress but birth cohort designs may not be appropriate for the study of the influence of pre-school education. The absence of data about children’s attainments at entry to pre-school means that neither the British Cohort Study (1970) nor the National Child Development Study (1958) can be used to explore the effects of pre-school education on children’s progress. These studies are also limited by the time lapse and many changes in the nature of pre-school provision which have

2
occurred. To date no research using multilevel models (Goldstein 1987) has been used to investigate the impact of both type of provision and individual centre effects. Thus little research in the UK has explored whether some forms of provision have greater benefits than others. Schagen (1994) attempted multilevel modelling but did not have adequate control at entry to pre-school. In the UK there is a long tradition of variation in pre-school provision both between types (e.g. playgroup, local authority or private nursery or nursery classes) and in different parts of the country reflecting Local Authority funding and geographical conditions (i.e. urban/rural and local access to centres). A series of reports (House of Commons Select Committee 1989; DES Rumbold Report 1990; Ball 1994) have questioned whether Britain's pre-school education is as effective as it might be and have urged better co-ordination of services and research into the impact of different forms of provision (Siraj-Blatchford 1995). The EPPE project is thus the first large-scale British study on the effects of different kinds of pre-school provision and the impact of attendance at individual centres.
OVERVIEW OF RESEARCH METHODS The EPPE project is a major study instituted in 1996 to investigate three issues which have important implications for policy and practice:
• the effects on children of different types of pre-school provision, • the ‘structural’ (e.g. adult-child ratios) and ‘process’ characteristics (e.g. interaction styles) of more
effective pre-school centres, and • the interaction between child and family characteristics and the kind of pre-school provision a
child experiences. An educational effectiveness research design was chosen to investigate these topics because this enabled the research team to investigate the progress and development of individual children (including the impact of personal, socio-economic and family characteristics), and the effect of individual pre-school centres on children's outcomes at both entry to school (the start of Reception which children can enter between the ages of 4 and 5 plus) and at the end of Key Stage 1 (age 7 plus). Such research designs are well suited to social and educational research with an institutional focus (Paterson & Goldstein 1991). The growing field of school effectiveness research has developed an appropriate methodology for the separation of intake and school influences on children's progress using so called 'value added' multilevel models (Goldstein 1987, 1995). As yet, however, such techniques have not been applied to the pre-school sector, although recent examples of value added research for younger ages at the primary level have been provided by Tymms et al. 1997; Sammons & Smees 1998; Jesson et al. 1997; Strand 1997; and Yang & Goldstein 1997. These have examined the relationship between baseline assessment at reception to infant school through to Key Stage 1 (age 7 plus years). School effectiveness research during the 1970s and 1980s addressed the question "Does the particular school attended by a child make a difference?" (Mortimore et al. 1988; Tizard et al. 1988). More recently the question of internal variations in effectiveness, teacher/class level variations and stability in effects of particular schools over time have assumed importance (e.g. Luyten 1994; 1995; Hill & Rowe 1996; Sammons 1996). This is the first research to examine the impact of individual pre-school centres using multilevel approaches. The EPPE project is designed to examine both the impact of type of pre-school provision as well as allow the identification of particular pre-school characteristics which have longer term effects. It is also designed to establish whether there are differences in the effects of individual pre-school centres on children's progress and development. In addition, the project explores the impact of pre-school provision for different groups of children and the extent to which pre-schools are effective in promoting different kinds of outcomes (cognitive and social/behavioural).

3
The 8 aims of the EPPE Project
• To produce a detailed description of the 'career paths' of a large sample of children and their
families between entry into pre-school education and completion (or near completion) of Key Stage 1.
• To compare and contrast the developmental progress of 3,000+ children from a wide range of
social and cultural backgrounds who have differing pre-school experiences including early entry to Reception from home.
• To separate out the effects of pre-school experience from the effects of education in the period
between Reception and Year 2. • To establish whether some pre-school centres are more effective than others in promoting
children's cognitive and social/emotional development during the pre-school years (ages 3-5) and across Key Stage 1 (5-7 years).
• To discover the individual characteristics (structural and process) of pre-school education in those
centres found to be most effective. • To investigate differences in the progress of different groups of children, e.g. second language
learners of English, children from disadvantaged backgrounds and both genders. • To investigate the medium-term effects of pre-school education on educational performance at
Key Stage 1 in a way which will allow the possibility of longitudinal follow-up at later ages to establish long-term effects, if any.
• To relate the use of pre-school provision to parental labour market participation.
The sample: regions, centres and children
In order to maximise the likelihood of identifying the effects of individual centres and also the effects of various types of provision, the EPPE sample was stratified by type of centre and geographical location.
• Six English Local Authorities (LAs) in five regions were chosen strategically to participate in the research. These were selected to cover provision in urban, suburban and rural areas and a range of ethnic diversity and social disadvantage. (Another related project covering Northern Ireland was instituted in April 1998 [Melhuish et al. 1997]. This will enable comparison of findings across different geographical contexts.)
• Six main types of provision are included in the study (the most common forms of current
provision; playgroups, local authority or voluntary day nurseries, private day nurseries, nursery schools, nursery classes, and centres combining care and education. Centres were selected randomly within each type of provision in each authority.
In order to enable comparison of centre and type of provision effects the project was designed to recruit 500 children, 20 in each of 20-25 centres, from the six types of provision, thus giving a total sample of approximately 3000 children and 140 centres1. In some LAs certain forms of provision are less common and others more typical. Within each LA, centres of each type were selected by stratified random sampling and, due to the small size of some centres in the project (e.g. rural playgroups), more of these centres were recruited than originally proposed, bringing the sample total to 141 centres and over 3000 children.
1 The nursery school and combined centre samples were added in 1998 and their cohorts will be assessed
somewhat later; results will be reported separately and in combined form.

4
Children and their families were selected randomly in each centre to participate in the EPPE Project. All parents gave written permission for their children to participate. In order to examine the impact of no pre-school provision, it was proposed to recruit an additional sample of 500 children pre-school experience from the reception classes which EPPE children entered. However in the five regions selected a sample of only 200+ children was available for this ‘home’ category. The progress and development of pre-school children in the EPPE sample is being followed over four years until the end of Key Stage 1. Details about length of sessions, number of sessions normally attended per week and child attendance have been collected to enable the amount of pre-school education experienced to be quantified for each child in the sample. Two complicating factors are that a substantial proportion of children have moved from one form of pre-school provision to another (e.g. from playgroup to nursery class) and some will attend more than one centre in a week. Careful records are necessary in order to examine issues of stability and continuity, and to document the range of pre-school experiences to which individual children can be exposed.
Child assessments
Around the third birthday, or up to a year later if the child entered pre-school provision after three, each child was assessed by a researcher on four cognitive tasks: verbal comprehension, naming vocabulary, knowledge of similarities seen in pictures, and block building. A profile of the child’s social and emotional adjustment was completed by the pre-school educator who knew the child best. If the child changed pre-school before school entry, he or she was assessed again. At school entry, a similar cognitive battery was administered along with knowledge of the alphabet and rhyme/alliteration. The Reception teacher completed the social emotional profile. Further assessments were made at exit from Reception and at the end of Years 1 and 2. In addition to standardised tests of reading and mathematics, information on National Assessments will be collected along with attendance and special needs. At age 7, children will also be invited to report themselves on their attitudes to school.
Measuring child/family characteristics known to have an impact on children’s development
1) Information on individual ‘child factors’ such as gender, language, health and birth order was
collected at parent interview. 2) Family factors were investigated also. Parent interviews provided detailed information about parent
education, occupation and employment history, family structure and attendance history. In addition, details about the child's day care history, parental attitudes and involvement in educational activities (e.g. reading to child, teaching nursery rhymes, television viewing etc) have been collected and analysed.
Pre-school Characteristics and Processes
Regional researchers liaised in each authority with a Regional Coordinator, a senior local authority officer with responsibility for Early Years who arranged ‘introductions’ to centres and key staff. Regional researchers interviewed centre managers on: group size, child staff ratio, staff training, aims, policies, curriculum, parental involvement, etc.

5
‘Process’ characteristics such as the day-to-day functioning within settings (e.g. child-staff interaction, child-child interaction, and structuring of children's activities) were also studied. The Early Childhood Environment Rating Scale (ECERS) which has been recently adapted (Harms, Clifford & Cryer 1998) and the Caregiver Interaction Scale (Arnett 1989) were also administered. The ECERS includes the following sub-scales:
• Space and furnishings • Personal care routines • Language reasoning • Activities • Interaction • Programme structure • Parents and staffing
In order that the more educational aspects of English centres could be assessed, Sylva, Siraj-Blatchford, Taggart & Colman (unpublished) developed four additional ECERS sub-scales describing educational provision in terms of: Language, Mathematics, Science and the Environment, and Diversity.
Setting the centres in context
In addition to describing how each centre operated internally, qualitative interviews were conducted with centre managers to find out the links of each setting to local authority policy and training initiatives. Senior local authority officers from both Education and Social Services were also interviewed to find out how each local authority implemented Government early years policy, especially the Early Years Development Plans which were established to promote education and care partnerships across providers in each local authority.
Case Studies
In addition to the range of quantitative data collected about children, their families and their pre-school centres, detailed qualitative data will be collected using case studies of several “effective” pre-school centres (chosen retrospectively as ‘more effective’ on the basis of the multilevel analyses of intake and outcome measures covering the period baseline to entry into reception). This will add the fine-grained detail to how processes within centres articulate, establish and maintain good practice. The methodology of the EPPE project is thus mixed. These detailed case studies will use a variety of methods of data gathering, including documentary analysis, interviews and observations and the results will help to illuminate the characteristics of more successful pre-school centres and assist in the generation of guidance on good practice. Particular attention will be paid to parent involvement, teaching and learning processes, child-adult interaction and social factors in learning. Inevitably there are difficulties associated with the retrospective study of process characteristics of centres identified as more or less effective after children in the EPPE sample have transferred to school and it will be important to examine field notes and pre-school centre histories to establish the extent of change during the study period.
ANALYTIC STRATEGY The EPPE research was designed to enable the linking of three sets of data: information about children's attainment and development (at different points in time), information about children's personal, social and family characteristics (e.g. age, gender, SES etc), and information about pre-school experience (type of centre and its characteristics).

6
Identifying individual centre effects and type of provision at entry to school
Longitudinal research is essential to enable the impact of child characteristics (personal, social and family) to be disentangled from any influence related to the particular pre-school centre attended. Multilevel models investigate the clustered nature of the child sample, children being nested within centres and centres within regions. The first phase of the analysis adopts these three levels in models which attempt to identify any centre effects at entry to reception class. Given the disparate nature of children's pre-school experience it is vital to ensure that the influences of age at assessment, amount and length of pre-school experience and pre-school attendance record are accounted for when estimating the effects of pre-school education. This information is also important in its own right to provide a detailed description of the range of pre-school provision experienced by different children and any differences in the patterns of provision used by specific groups of children/parents and their relationship to parents' labour market participation. Predictor variables for attainment at entry to reception will include prior attainment (verbal and non-verbal sub scales), social/emotional profiles, and child characteristics (personal, social and family). The EPPE multilevel analyses will seek to incorporate adjustment for measurement error and to examine differences in the performance of different groups of children at entry to pre-school and again at entry to reception classes. The extent to which any differences increase/decrease over this period will be explored, enabling equity issues to be addressed. After controlling for intake differences, the estimated impact of individual pre-school centres will be used to select approximately 12 ‘outlier’ centres from the 141 in the project for detailed case studies (see ‘Case Studies’ above). In addition, multilevel models will be used to test out the relationship between particular process quality characteristics of centres and children's cognitive and social/behavioural outcomes at the end of the pre-school period (entry to school). The extent to which it is possible to explain (statistically) the variation in children's scores on the various measures assessed at entry to reception classes will provide evidence about whether particular forms of provision have greater benefits in promoting such outcomes by the end of the pre-school period. Multilevel analyses will test out the impact of measures of pre-school process characteristics, such as the scores on various ECERS scales and Pre-School Centre structural characteristics such as ratios. This will provide evidence as to which measures are associated with better cognitive and social/behavioural outcomes in children.
Identifying continuing effects of pre-school centres at KS1
Cross-classified multilevel models have been used to examine the long term effects of primary schools on later secondary performance (Goldstein & Sammons, 1997). In the EPPE research it is planned to use such models to explore the possible mid-term effects of pre-school provision on later progress and attainment at primary school at age 7. The use of cross classified methods explicitly acknowledges that children's educational experiences are complex and that over time different institutions may influence cognitive and social/behavioural development for better or worse. This will allow the relative strength of any continuing effects of individual pre-school centre attendance to be ascertained, in comparison with the primary school influence.
THE LINKED STUDY IN NORTHERN IRELAND 1998-2003 The Effective Pre-school Provision in Northern Ireland (EPPNI) is part of EPPE and is under the directorship of Professor Edward Melhuish, Professor Kathy Sylva, Dr. Pam Sammons, and Dr. Iram Siraj-Blatchford. The study explores the characteristics of different kinds of early years provision and examines children’s development in pre-school, and influences on their later adjustment and progress at primary school up to age 7 years. It will help to identify the aspects of pre-school provision which have a positive impact on children’s attainment, progress, and development, and so provide guidance on good practice. The research involves 70 pre-school centres randomly selected throughout Northern Ireland.
7
The study investigates all main types of pre-school provision attended by 3 to 4 year olds in Northern Ireland: playgroups, day nurseries, nursery classes, nursery schools and reception groups and classes. The data from England and Northern Ireland offer opportunities for potentially useful comparisons.
SUMMARY This “educational effectiveness” design of the EPPE research study enables modelling of the complicated effects of amount and type of pre-school provision (including attendance) experienced by children and their personal, social and family characteristics on subsequent progress and development. Assessment of both cognitive and social/behavioural outcomes has been made. The use of multilevel models for the analysis enables the impact of both type of provision and individual centres on children's pre-school outcomes (at age 5 and later at age 7) to be investigated. Moreover, the relationships between pre-school characteristics and children's development can be explored. The results of these analyses and the findings from the qualitative case studies of selected centres can inform both policy and practice. A series of 12 technical working papers will summarise the findings of the research. .
8
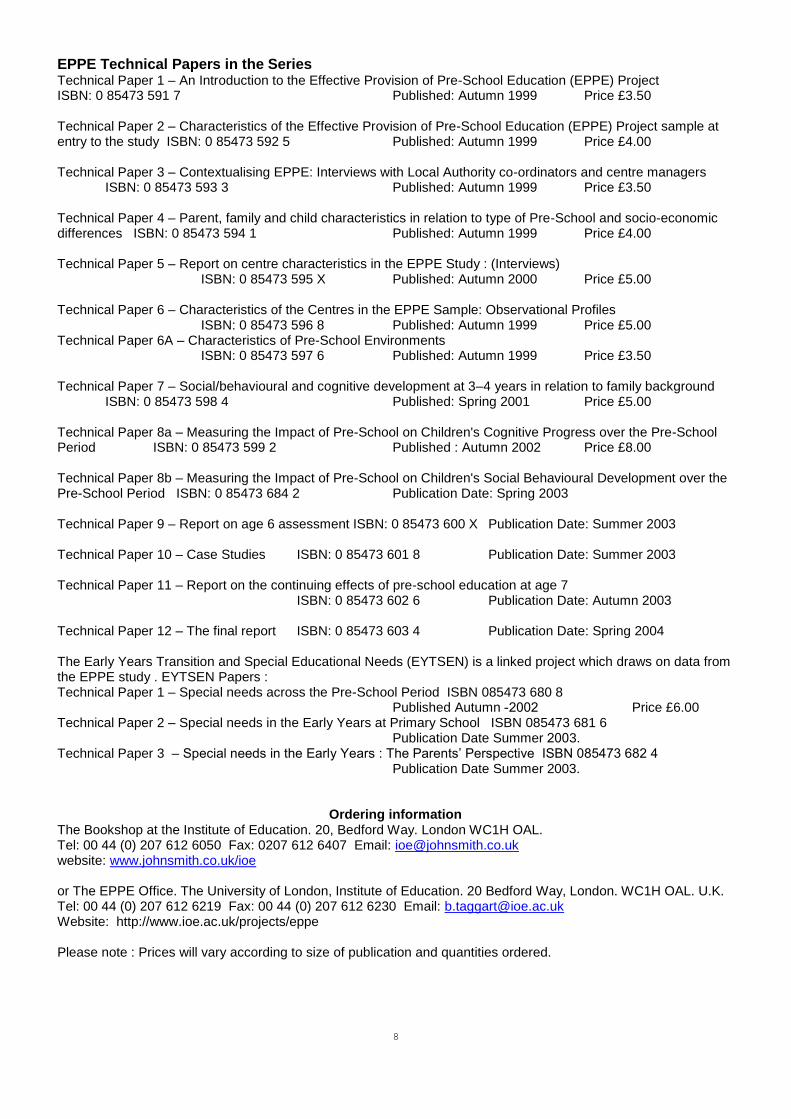
EPPE Technical Papers in the Series Technical Paper 1 – An Introduction to the Effective Provision of Pre-School Education (EPPE) Project ISBN: 0 85473 591 7 Published: Autumn 1999 Price £3.50 Technical Paper 2 – Characteristics of the Effective Provision of Pre-School Education (EPPE) Project sample at entry to the study ISBN: 0 85473 592 5 Published: Autumn 1999 Price £4.00 Technical Paper 3 – Contextualising EPPE: Interviews with Local Authority co-ordinators and centre managers ISBN: 0 85473 593 3 Published: Autumn 1999 Price £3.50 Technical Paper 4 – Parent, family and child characteristics in relation to type of Pre-School and socio-economic differences ISBN: 0 85473 594 1 Published: Autumn 1999 Price £4.00 Technical Paper 5 – Report on centre characteristics in the EPPE Study : (Interviews) ISBN: 0 85473 595 X Published: Autumn 2000 Price £5.00 Technical Paper 6 – Characteristics of the Centres in the EPPE Sample: Observational Profiles
ISBN: 0 85473 596 8 Published: Autumn 1999 Price £5.00 Technical Paper 6A – Characteristics of Pre-School Environments
ISBN: 0 85473 597 6 Published: Autumn 1999 Price £3.50 Technical Paper 7 – Social/behavioural and cognitive development at 3–4 years in relation to family background ISBN: 0 85473 598 4 Published: Spring 2001 Price £5.00 Technical Paper 8a – Measuring the Impact of Pre-School on Children's Cognitive Progress over the Pre-School Period ISBN: 0 85473 599 2 Published : Autumn 2002 Price £8.00 Technical Paper 8b – Measuring the Impact of Pre-School on Children's Social Behavioural Development over the Pre-School Period ISBN: 0 85473 684 2 Publication Date: Spring 2003 Technical Paper 9 – Report on age 6 assessment ISBN: 0 85473 600 X Publication Date: Summer 2003 Technical Paper 10 – Case Studies ISBN: 0 85473 601 8 Publication Date: Summer 2003 Technical Paper 11 – Report on the continuing effects of pre-school education at age 7
ISBN: 0 85473 602 6 Publication Date: Autumn 2003 Technical Paper 12 – The final report ISBN: 0 85473 603 4 Publication Date: Spring 2004 The Early Years Transition and Special Educational Needs (EYTSEN) is a linked project which draws on data from the EPPE study . EYTSEN Papers : Technical Paper 1 – Special needs across the Pre-School Period ISBN 085473 680 8
Published Autumn -2002 Price £6.00 Technical Paper 2 – Special needs in the Early Years at Primary School ISBN 085473 681 6
Publication Date Summer 2003. Technical Paper 3 – Special needs in the Early Years : The Parents’ Perspective ISBN 085473 682 4
Publication Date Summer 2003.
Ordering information The Bookshop at the Institute of Education. 20, Bedford Way. London WC1H OAL. Tel: 00 44 (0) 207 612 6050 Fax: 0207 612 6407 Email: [email protected] website: www.johnsmith.co.uk/ioe or The EPPE Office. The University of London, Institute of Education. 20 Bedford Way, London. WC1H OAL. U.K. Tel: 00 44 (0) 207 612 6219 Fax: 00 44 (0) 207 612 6230 Email: [email protected] Website: http://www.ioe.ac.uk/projects/eppe Please note : Prices will vary according to size of publication and quantities ordered.
9
REFERENCES Arnett, J. (1989) Caregivers in Day-Care Centres: Does training matter? Journal of Applied Developmental
Psychology, 10, 541-552. Ball, C. (1994) Startright: The Importance of Early Learning, London: RSA. Borge, A., & Melhuish, E., (1995) A Longitudinal Study of Childhood Behaviour Problems, Maternal Employment
and Day-care in Rural Norwegian Community, International Journal of Behavioural Development, 18, 23-42.
Davies, J. & Brember, I. (1992) The Effects of Gender, Attendance Period and Age on Children's Adjustment to
Nursery Classes, Research in Education, 47, 89-103. Davies, J, & Brember, I. (1997) The Effects of Pre-School Experience on Reading Attainment: a four year cross-
sectional study, Educational Psychology, 178, 3, 255-266. Department of Education & Science (1990) The Report of the Committee of Inquiry into the Quality of the
Educational Experience offered to 3- and 4-year olds (Rumbold, A), London: HMSO. Feinstein, L., Robertson, D. & Symons, J. (1998) Pre-school Education and Attainment in the NCDS and BCSI
Centre for Economic Performance, London Goldstein, H. (1987) Multilevel Models in Educational and Social Research, London: Charles Griffin and Co. Goldstein, H. (1995) Multilevel Statistical Models (2nd Edition), London: Edward Arnold. Goldstein, H. & Sammons, P. (1997) The Influence of Secondary and Junior Schools on Sixteen Year
Examination Performance: A Cross-Classified Multilevel Analysis, School Effectiveness and School Improvement, 8, (2): 219-230.
Harms, T., Clifford, R. & Cryer, D. (1998) Early Childhood Environment Rating Scale Revised, New York and
London: Teachers' College Press. Hill, P. & Rowe, K. (1996) Multilevel Modelling in School Effectiveness Research, School Effectiveness and
School Improvement, 7, (1): 1-34. House of Commons Select Committee (1989) The Education of Children 3-5, London: HMSO. Jesson, D., Bartlett, D., & Machon, C., (1997) Baseline Assessment and School Improvement - the use of data
from the assessment of children on entry to school to support the raising of standards, paper presented to the annual conference of the British Educational Research Association, University of York, September 1997.
Luyten, H. (1994) Stability of School Effects in Dutch Secondary Education: The impact of variance across
subjects and years, International Journal of Educational Research, 21, (2): 197-216. Luyten, H. (1995) Teacher Change and Instability Across Grades, School Effectiveness and School Improvement,
1, (1): 67-89. Melhuish, E.C. (1993) Pre-school care and education: Lessons from the 20th and the 21st century, International
Journal of Early Years Education, 1, 19-32. Melhuish, E.C., Lloyd, E., Martin, S. & Mooney, A. (1990) Type of day-care at 18 months: ii Relations with
Cognitive and Language Development, Journal of Child Psychology and Psychiatry, 31, 861-870. Melhuish, E.C., Sylva, K., Sammons, P. & Siraj-Blatchford, I. (1997) Effective Pre-School Provision in Northern
Ireland, proposal to the DfEE for research linked to the Effective Provision of Pre-school Education Project. Mortimore, P., Sammons, P., Stoll, L., Lewis, D. & Ecob, R. (1988) School Matters: The Junior Years, Wells:
Open Books.

10
National Institute of Child Health & Development (1997) The effects of infant child care on infant-mother
attachment security: Restuls of the NICHD study of early child care, Child Development, 68, (5): 860-879. Paterson, L. & Goldstein H. (1991) New statistical methods of analysing social structures: an introduction to
multilevel models, British Educational Research Journal, 17, (4): 387-393. Sammons, P. (1996) Complexities in the judgement of school effectiveness. Educational Research and Evaluation,
Vol. 2 113 – 149 Sammons, P. & Smees, R. (1998) Measuring Pupil Progress at Key Stage 1: using baseline assessment to
investigate value added. School Leadership and Management, Vol. 18, No. 3, pp.389 – 407 Schweinhart, L.J. & Weikart, D.P., (1997) Lasting Differences, The High/Scope preschool curriculum comparison
through age 23. High/Scope Press, Ypsilanti, Michigan. Siraj-Blatchford, I. (1995) Expanding Combined Nursery Provision: Bridging the gap between care and
education, in P Gammage and J Meighan The Early Years: The Way Forward, Nottingham: Education New Books.
Siraj-Blatchford, I., Sylva, K., Melhuish, E. & Sammons, P. (1997) Studying the Effects of Innovations in Nursery
School Provision, a proposal to the DfEE for research linked to the Effective Provision of Pre-school Education Project
Strand, S. (1997) Pupil Progress during Key Stage 1: A value added analysis of school effects, British
Educational Research Journal, 23, (4): 471-487. Sylva, K., Sammons, P., Melhuish, E., Siraj-Blatchford, I. & Taggart, B. (unpublished) Technical Paper 1. An
Introduction to the EPPE Project Sylva, K., Siraj-Blatchford, I., Taggart, B. & Colman, P. (forthcoming) The Early Childhood Environment Rating
Scales: 4 Curricular Subscales, London: Institute of Education. Sylva, K. (1994) A Curriculum for Early Learning. In Ball, C. (Ed.) Startright: The Importance of Early Learning,
London: RSA. Sylva, K. & Wiltshire, J. (1993) The Impact of Early Learning on Children's Later Development. A review
prepared for the RSA enquiry 'Start Right', European Early Childhood Education Research Journal, 1, (1): 17-40.
Tizard, P., Blatchford, P, Burke, J., Farquhar, C. & Plewis, I. (1988) Young Children at School in the Inner City,
Hove: Lawrence Erlbaum Associates Ltd. Tymms, P., Merrell, C. & Henderson, B. (1997) The First Year at School: A quantitative Investigation of the
Attainment and Progress of Pupils, Educational Research and Evaluation, 3, (2): 101-118. Yang, M. & Goldstein, H. (1997) Report on Value Added Analysis for Primary Schools in Hampshire County,
Mathematical Sciences, Institute of Education, University of London, August 1997.
i
Main Findings and Implications for Policy and Practice Background The Effective Provision of Pre-school Education (EPPE) project explores the impact of pre-school centre provision on young children’s cognitive progress and their social behavioural development. The EPPE study was commissioned and funded by the Department for Education and Employment (now the Department for Education and Skills). EPPE Technical Papers 8a and 8b report on the main findings of the first phase of the longitudinal research which tracked a large sample of young children over the pre-school period from age 3 years plus to the start of primary school, when children entered reception classes. An educational effectiveness design was adopted which explores the developmental progress children made during this period and analyses the contribution made by different pre-school centres to cognitive and social behavioural gains. The study follows a large sample of young children for five years from pre-school entry at age 3 years plus up to age 7 years (the end of Key Stage 1 of primary education). It investigates the influence on children’s cognitive and social behavioural outcomes of a wide variety of child, parent and family factors, including amount of care outside the family, and aspects of the home learning environment provided by parents. The research seeks to establish whether different types of pre-school settings differ in their impact and effectiveness. It also seeks to identify any variations between individual pre-school centres in their impact upon children’s cognitive progress and social behavioural development. Measures of the quality of pre-school centres and details of variations in centre policy and practices have been collected from observations by researchers and from interviews with centre managers. The study has sought to establish whether such factors show a relationship with young children’s progress and development. In total 141 pre-school centres drawn from five regions across England form the focus of the EPPE research. Centres were drawn from six types of provision: nursery classes, playgroups, local authority day care, private day nurseries, nursery schools and integrated centres (i.e. combined centres). The research drew approximately equal numbers of target centres of each of the main type of provisions, with the exception of integrated centres which are a relatively recent innovation and of which only a small number existed at the start of the research. The five regions were chosen to cover a range of socio-economic and geographical areas including rural, metropolitan, shire county, inner-city. The regions were selected to include ethnically diverse and socio-economically disadvantaged communities. Detailed case studies of centres, chosen because they were in the more effective half of the spectrum in terms of children’s outcomes, are reported separately (see EPPE Technical Paper 10, forthcoming). These provide rich information about processes operating in different centres and illuminate our understanding of the ways different aspects of policy and practice, including effective early childhood pedagogical strategies, can help promote young children’s learning and development. This report describes the results of analyses of young children’s social behavioural development during their time in pre-school. Equivalent analyses of the cognitive progress of children in the study have been conducted and the results are reported separately in EPPE Technical Paper 8a. Developmental gains were measured from entry to the EPPE study until the start of primary school. Young children’s social behavioural outcomes were assessed by their class teachers at entry to primary school. Four aspects of social behavioural development have been studied, namely ‘Independence & Concentration’, ‘Co-operation & Conformity’, ‘Peer Sociability’ and ‘Anti-social / Worried’. A range of statistical methods has been used to analyse data for around 2,800 children, representing around 95 per cent of the total child sample at entry to the study. Multilevel modelling has been used to identify and explore pre-school centre effects. An additional sample of ‘home’ children (without pre-school centre experience) was recruited at primary school entry bringing the total to over 3100 in some analyses.
ii
Methodology EPPE uses statistical techniques (multilevel modelling) to measure the influence of different background factors on young children’s social behavioural development at the start of primary school. Contextualised analyses are used to identify the unique (net) contribution of particular characteristics to variation in children’s outcomes, in this instance their development in different social behavioural measures, while other influences are controlled. Thus, for example, the impact of family socio-economic status (SES), is established while taking into account the influence of mother’s qualification levels, low income (indicated by eligibility for free school meals), ethnicity, birthweight, home learning environment etc. It is of policy interest to establish the nature and strength of such background influences, individually and in total, because they are relevant to issues of equity and social inclusion. Multilevel modelling has been used to identify and explore pre-school centre effects and the ‘value added’ by different centres.2 Value added multilevel models investigate children’s developmental gains over their time in pre-school, by controlling for a child’s age at assessment and prior social behavioural development at entry to pre-school, as well as a wide range background influences. These analyses are used to establish whether there is evidence of pre-school influences on young children’s social behavioural developmental gains. In particular, the extent to which children’s social behavioural developmental gains are associated with the pre-school centre attended can be calculated. The centre level variance provides an indication of the size of any effect related to pre-school attended. More effective centres (positive outliers in value added terms) can be identified where children made significantly greater developmental gains than predicted on the basis of prior social behavioural and intake characteristics. Centres where children made less developmental gains than predicted can be viewed as less effective (negative outliers in value added terms). The multilevel value added analyses are also extended to establish the extent to which factors such as type of pre-school attended, number of sessions, quality characteristics ratios and staff qualifications show any statistical relationship with the effects of pre-school. It is thus possible to establish whether variations in quality and extent of time in pre-school have an impact on children’s social behavioural developmental gains and, in particular, whether higher quality and more pre-school experience have a positive impact. Findings concerning a sample of ‘home children‘, who have had no pre-school centre experience before starting primary school, are reported for comparison with the pre-school sample. The contextualised multilevel analyses explore whether home children are at a disadvantage in terms of social behavioural development when they start primary school and the extent to which any development gap can be attributed to the absence of pre-school experience, rather than to differences in their background characteristics. These analyses provide important additional evidence concerning the overall impact of pre-school provision. Main Findings and Implications for Policy The main findings of the EPPE study provide a range of evidence relevant to current policy concerns with developing pre-school provision, promoting social inclusion and combating exclusion. The impact of a child’s background Early findings from the EPPE research (EPPE Technical Paper 2 & 7) illustrated that there are important differences in young children’s cognitive and social behavioural attainments related to specific child, parent and home environment characteristics at entry to the study (age 3 years plus). EPPE Technical Paper 8a confirmed the continued strength of such influences on cognitive outcomes measured at the start of primary education. It should be noted that in
2 Social behavioural developmental gains were measured from entry to the EPPE study (age 3 years plus)
until the start of primary school (usually at entry to reception classes at rising 5 years, though in some instances children are enrolled directly into year 1 classes and do not join a reception class).
iii
general, children’s cognitive attainments are more susceptible to child, family and home environment influences than social behaviour for this pre-school age group. The results from the analyses of social behavioural outcomes emphasise the need to make adequate statistical control for differences in the characteristics of young children who attend different pre-school settings, in both prior social behavioural development and other relevant characteristics, in any studies of the influence of pre-school institutions. Such control for intake differences is important to ensure that valid comparisons can be made both at the level of individual centres and also by type of provision. It is also essential for studies seeking to compare children who do not attend a pre-school centre before they start school, because as a group they show differences in terms of a range of characteristics and, in particular, are more likely to experience multiple disadvantage. Home learning environment The research points to the importance of a range of factors, such as mother’s educational level, socio-economic status (SES) etc, and the influence of aspects of the home learning environment, (i.e. activities that offer learning opportunities to the child), when investigating young children’s social behavioural outcomes. The present analyses confirm that parental involvement in activities (such as reading to their child, teaching songs and nursery rhymes, playing with letters & numbers, visiting the library, painting & drawing, emphasising the alphabet, etc) are significant in accounting for differences in social behavioural development at the start of primary school. The effect sizes relating to the home learning environment (and in particular the home learning environment index3) are generally higher than for family measures such as mothers’ qualification level. The home learning environment measures also influence young children’s social behavioural developmental gains over the pre-school period. The analyses reported in EPPE Technical Paper 8a also reveal that aspects of the home learning environment are associated with significantly better cognitive and language outcomes at primary school entry. These results suggest that policies targeted at working with parents in disadvantaged communities (such as Sure Start) might consider encouraging active parenting strategies that promote children’s social behavioural development and their cognitive progress. Many pre-school settings already encourage parental participation, and some have developed programmes that feature parent education. The EPPE results suggest programmes that directly promote activities for parents and children to engage in together are likely to be most beneficial for young children (see EPPE Technical Paper 10 for further discussion of this issue). Health visitors may also be well placed to provide guidance for parents on ways to enrich young children’s home learning environments and some primary schools run activities for parents. Such provision could also seek to promote the benefits of joint activities, which promote pre-school children’s developmental learning at home. Variations in centre effectiveness The value added multilevel analyses show the individual pre-school centre attended by a child also has an impact on children’s social behavioural developmental gains.4 A number of statistically significant outlier centres were identified. These are centres where children showed significantly better (in the case of positive outliers) or, by contrast, significantly poorer social behavioural developmental gains than predicted (negative outliers), given their prior social behaviour and background. There were 52 (36.9%) centres identified as performing broadly as expected across all areas of social behavioural development, when intake differences are controlled. Just over one in 10 centres (12.8%) were found to be statistical outliers (performing significantly above or significantly below expectation at the 95% confidence levels for one or
3 The home learning environment index provides a summary based on the individual measures reported
above such as parents reading to their child. It is interesting to note that the home learning environment index is only moderately correlated (r=0.3) with family SES or mother’s qualification levels. 4 Significant centre level variance in children’s social behavioural developmental gains remain even when
account is taken of prior social behavioural development and other intake differences (in terms of child, family and home learning environment characteristics).

iv
more social behavioural area). This is likely to be a conservative estimate of the extent of real differences in effectiveness between individual centres, since, with small numbers of children per centre an effect has to be large to reach statistical significance. Typically centres vary in their effects on different social behavioural outcomes. No centre performed significantly above or significantly below expectation for all social behavioural outcomes. However, pre-school centre effects are generally more highly correlated in social behavioural outcomes than cognitive outcomes. This suggests that pre-school settings show more internal variation in effectiveness in promoting children’s cognitive outcomes than is the case for their social behavioural outcomes. Nonetheless, the most usual profiles across the four outcomes studied show that a number of centres could be distinguished with broadly positive effects, whereas others showed generally poorer effects on social behavioural developmental gains. It is important to note that more than a fifth of children (23%) had left their target centre before starting primary school and moved to other provision. There was no evidence that mobile children, who moved pre-school centre during the study, showed poorer social behavioural outcomes when they started school. The proportion of mobile children varied significantly for different types of provision, however, being very uncommon for those in nursery classes or nursery schools. By contrast the majority of playgroup children (52%) had moved centre, often to a different form of provision. The much higher incidence of movement from playgroups has implications for the analysis of the effects of this type of provision, and the effects of individual playgroup centres. The high degree of mobility means that it is very difficult to measure the impact of playgroups on children’s social behavioural developmental gains (either at the level of individual centres or as a type of provision) accurately. The impact of pre-school – type, quantity and quality Elsewhere it has been shown that pre-school centre experience has an important influence on young children’s cognitive development (see EPPE Technical Paper 8a). The findings for social behavioural development also support this interpretation. Quality of pre-school provision is regarded as a vital feature of early years education and care. The EPPE study explored variation in the quality of individual centres using the Early Childhood Environment Rating Scale (total ECERS-E and ECERS-R scales). Trained researchers conducted detailed observations of centres to assess quality. Higher quality scores as assessed by the ECERS-R scale were positively related to better child outcomes for one of the social behavioural measures (‘Co-operation & Conformity’). The results of analyses of the ECERS-R subscales also suggest that specific subscales of quality measured by this instrument (social interaction, and language and reasoning) are associated with better social behavioural developmental outcomes at primary school entry. In addition, another observational instrument, which provides measures of adult child interaction (Caregiver Interaction Scale, Arnett, 1989), is related to all three of the social behavioural outcomes except ‘Anti-social / Worried’ behaviour. In particular, where staff child interactions were rated as more ‘Positive’ better child social behavioural outcomes are found. Types of provision effects were identified for several social behavioural outcomes, in line with findings for cognitive outcomes. These results suggest that, as a group, children who attended LA day care and private day nurseries show poorer behavioural outcomes than those who attended other forms of provision (note that proportionately more of the children in LA day nurseries and private day nurseries started at their pre-school target centre before 3 years of age). Moreover children who attended integrated provision or nursery classes tended to make greater gains in social behavioural development during the pre-school period. Nonetheless, there was significant variation in effectiveness on social behavioural gains within each type of provision; thus differences between individual pre-school centres and differences between types of provision are both important.

v
The EPPE research indicates that pre-school centre experience can play an important part in promoting young children’s social behavioural development, and that higher quality provision in particular, is beneficial in promoting better social behavioural outcomes by the start of primary school. There is evidence that some types of provision are associated with better social behavioural development and that higher staff qualifications (proportion of staff hours at qualified teacher status) have a positive influence on young children’s social behavioural outcomes. Elsewhere, it has been demonstrated that there is a significant link between pre-school centre quality ratings and centre manager qualification levels (EPPE Technical Paper 5), and variations between type of provision and quality (EPPE Technical Paper 6), thus improving staff training and qualification levels may be strategies which can help raise the quality of provision. When looking at social behaviour outcomes at start of school (i.e. contextualised models), it is found that children who spent longer in pre-school (measured from start date at target pre-school centre to date started primary school) were rated by class teachers as showing more ‘Anti-social / Worried’ behaviour at primary school entry. In other words, a longer time (in years and months) spent in pre-school, is associated with slightly more ‘Anti-social / Worried’ behaviour, although it should be noted that only a small proportion of children in total show difficulties for this behavioural outcome. This effect is primarily related to LA day care nurseries and private day nurseries where a substantial proportion start under 2 years of age and some under one year. However, when a measure of pre-school centre quality was added to the model (i.e. ECERS-R), the impact of duration was reduced (although still remained significant). This suggests that higher quality in pre-school centres tends to reduce, but not eliminate, the negative effect of a longer time spent in pre-school centres on ‘Anti-social / Worried’ behaviour. It is important to note the significant positive link of duration of pre-school with young children’s cognitive progress over the pre-school period (see EPPE Technical Paper 8a). Referring to social behavioural development gains over the pre-school period (by controlling for social behavioural development at age 3 and other significant background characteristics), analyses showed that the indicator of ‘duration’ of pre-school was not statistically significant in accounting for social behavioural developmental gains over the pre-school period in any of the four outcomes. Ratios & staff qualifications Adult child ratios can be measured in several ways. Statutory minimum levels vary by type of provision. However many settings operate with more generous ratios than those statutorily required. Observed ratios (with and without volunteers) were used to provide indicators of staffing levels normally experienced by children aged 3-5 years in individual centres. Statutory, reported (by centre managers) and observed ratios were all tested for links with children’s social behavioural gains. The results show no significant relationships between ratios and young children’s social behavioural developmental gains over the pre-school period. More generous adult/child ratios showed a significant link with one aspect of children’s cognitive progress, early numbers concepts. Elsewhere it has been demonstrated that quality, qualifications and type of provision are themselves associated (EPPE Technical Papers 5 & 6). Ratios tended to be poorer (i.e. higher ratios with more children per adult) in some forms of provision which had more highly qualified staff and higher observed ratings for quality (measured by ECERS-E), although the correlation is fairly low (r=0.21). The exception, are integrated centres which have higher quality scores but low ratios. As noted earlier, Centre managers’ qualification levels and the proportion of staff hours at different qualification levels also show significant variation between individual centres and by type of provision (EPPE Technical Paper 5). Centre managers’ qualifications are significantly associated with the observed quality profiles of centres (EPPE Technical Paper 6). Centres where managers reported they had Level 5 qualifications (trained teachers) exhibited higher quality. Findings from the associated Researching Effective Pedagogy in the Early Years study

vi
(see Siraj-Blatchford et al, 2002a) also indicate that the observed behaviour of other staff is positively influenced by the presence of a member of staff with Level 5 qualifications. The value added multilevel analyses found a significant positive relationship between the percentage of Level 5 staff hours and young children’s social behavioural developmental gains in ‘Co-operation & Conformity’. In addition, children who attended centres where proportionately more staff time were at level 5 showed reductions in ‘Anti-social / Worried’ behaviour. Given the complex inter-relationships between ratios, staff qualifications, quality and type of provision, plus the extent of variation between individual centres of the same type, these influences on children’s social behavioural outcomes may be confounded. It may be more relevant for policy makers and practitioners to consider the impacts of packages of provision, rather than to try to separate the impact of particular features in isolation. Children who do not experience pre-school Data were collected for a group of ‘home’ children with no or minimal pre-school centre experience. Comparison of the home sample with the main EPPE sample of children who experienced pre-school showed that both the characteristics and the social behavioural development of home children vary significantly. It is not possible to conclude with certainty that differences in social behaviour found for the home group are directly a consequence of their lack of pre-school experience, due to the home children’s very different social backgrounds. Contextualised multilevel analyses of their class teachers’ social behavioural assessments exploring the impact of child, parent and home environment factors illustrate that, even when these important influences are controlled, home children’s social behaviour is rated as significantly poorer in terms of three areas of development - ‘Independence & Concentration’, ‘Co-operation & Conformity’ and ‘Peer Sociability’ - than those of children who attended any of the six types of pre-school provision studied. This result suggests that pre-schooling has a positive impact on these aspects of social behavioural development, in particular ‘Peer Sociability’. Hence children without pre-school centre experience may be at a disadvantage in terms of ‘Peer Sociability’, ‘Independence & Concentration’ and ‘Co-operation & Conformity’ when they start primary school, as these behaviours are likely to be important for successful adjustment to primary school. In addition, ‘Independence & Concentration’ is modestly associated with cognitive attainment at entry to school and hence would be expected to promote classroom learning. Home children do not show any significant differences in terms of ‘Anti-social / Worried’ behaviour than the pre-school sample. In combination with the findings for cognitive progress reported in Technical Paper 8a, the results summarised here indicate that pre-school centre experience can help to combat social exclusion and promote inclusion by offering disadvantaged young children, in particular, a better start at school, through promoting positive social behavioural as well as cognitive development. Further analyses will explore the subsequent progress and development of these children over Key Stage 1. Such analyses will help to establish whether the positive impact of pre-school on young children’s cognitive and social behavioural development remains significant as children progress through their first years at primary school.
1
Introduction The Effective Provision of Pre-School Education (EPPE) study is a large scale longitudinal study funded by the Department for Education & Skills. It was begun in 1996 with the aim of investigating which kinds of Early Childhood provision were most ‘effective’ in promoting young children’s development during their time attending a pre-school setting, and to explore whether any pre-school effects continue to influence children after they start primary school up until the end of Key Stage 1 (age 7 plus years). The EPPE research is the first study of pre-schools in Europe to use an educational effectiveness design based on sampling children in a range of pre-school settings and uses statistical approaches (multilevel modelling) that enable the identification of individual centre effects. Beginning around the age of 3 years (at entry to a target pre-school in the sample or at their third birthday for children who had already entered provision at a younger age), children were assessed at each major change of provision and then at entry to primary school. In this way it has been possible to explore variations between centres in the ‘value added’ in terms of impact on children’s cognitive progress and social behavioural development. The study follows children for five years from pre-school up to the end of Key Stage 1 (the first phase of primary education). It explores the impact of a wide variety of child, parent and family factors, including amount of care outside the family, and aspects of the home learning environment provided by parents. The research explores whether different types of pre-school settings differ in their impact and effectiveness, as well as identifying variations between individual pre-school centres in children’s cognitive progress and social behavioural development. Measures of the quality of pre-school centres and details of variations in centre policy and practices have been collected from observations by trained researchers and from interviews with centre managers. The study has sought to establish whether such factors have an impact on young children’s progress and development. In total 141 pre-school centres drawn from five regions across England form the focus of the EPPE research. Centres were drawn from six types of provision - nursery classes, playgroups, local authority day nurseries, private day nurseries, nursery schools and integrated centres (i.e. combined centres which fully integrate education and care). The EPPE study uses a mixed methods approach, including detailed statistical analyses of effectiveness and in-depth case studies of individual centres. Full details of the EPPE study have been provided in a series of Technical Papers. The present paper is based on statistical analyses for a sample of over 3100 children. A wide range of information has been drawn on, including assessments of individual children at entry to pre-school (age 3 years plus) and followed up again at entry to school (typically age rising 5 years) based on child care workers’ and, later, class teachers’ assessments of social behavioural development at these two time points. Detailed information about children’s health, and care histories, family characteristics and home learning environments was collected from parental interviews. Researchers conducted detailed observations in each centre to provide information about the quality of provision, and centre managers were interviewed to provide details about a range of centre policies and practices. The EPPE project draws on rich information about pre-school children's personal and family characteristics and details of the home learning environment collected from parental interviews. The analyses of young children's social behaviour, as assessed by pre-school workers at entry to the study (age 3 plus years) revealed important relationships between both cognitive attainments, social behaviour and measures of these characteristics (see Technical Papers 2 , 4 and 7 for details).
2
Aims The aims of the multilevel analyses in this report are:
To model young children’s social development across the pre-school period until entry to primary school.5
To explore the impact of a range of child, parent and home characteristics on pre-school children’s social behavioural development over their time in pre-school and at entry to school.
To explore the impact of pre-school, including any variations in children’s social behavioural outcomes at the start of school for those who attended different types of pre-school (and those who received no pre-school provision).
To establish whether there is significant variation between individual pre-school centres in their effects on different social behavioural outcomes.
To explore the impact of pre-school characteristics, including quality and staff qualifications.
Research questions addressed in this report 1. What is the variation in children's school entry social behavioural assessments for different
groups of children? (e.g. girls compared with boys, those from different ethnic or language backgrounds, those whose parents have different levels of educational qualifications, or from different socio-economic groups). Of particular interest will be the question of whether the variation between different groups of children has increased or decreased over the pre-school period
2. What is the impact of amount and duration of pre-school experience? Children's pre-school
'careers' are very varied. Does more pre-school experience result in better social behavioural outcomes at school entry when account is taken of the impact of other factors? Are different groups of children equally affected, or is more experience particularly beneficial for disadvantaged groups? These results should help to inform policy makers about the relative benefits which may be expected to arise from policies that increase pre-school provision.
3. What is the extent of child mobility (in terms of change of pre-school centre) evident for
children in the pre-school period? In particular does a change of pre-school centre before starting primary school show a significant association with young children’s social behavioural development?6
4. Do individual pre-schools vary in their effectiveness in promoting young children’s social
behavioural development? As there are differences between individual centres in the characteristics of the children they serve, it is essential to take account of such differences in any comparisons of child outcomes measured at the start of primary school. It is also of particular interest to establish whether centres vary in their effectiveness in different domains. Are the same centres that promote better child outcomes in one area, say Independence and concentration, also more effective in promoting other social behavioural outcomes, e.g. Peer sociability?
5. Does type of pre-school experience matter? Taking account of children’s differences at entry
to pre-school, and the amount of provision experienced, do children attending certain types of pre-school (playgroup, nursery class, private day nursery, local authority day nursery, nursery school or integrated centre) differ in their social behavioural development by the time they
5 This is primarily entry to reception class. However one LEA in the sample has a policy of sometimes
allowing children to enter directly into year 1. 6 A future Technical paper will focus in detail on the issue of child mobility during the pre-school period and
in particular on those children who experience highly mobile pre-school careers. It will explore whether discontinuity/fragmentation of experience (frequent changes of pre-school centre) has an adverse impact on children's cognitive and social behavioural development as measured at primary school entry and at the end of year 1.

3
enter school? If type of pre-school does matter, do some groups do better (e.g. disadvantaged groups or boys show better social behavioural outcomes) if they experience certain types of provision?
6. Does quality of pre-school setting have a significant impact on young children’s social
behaviour development? A range of observational measures of environmental quality and staff child interactions were collected for the EPPE research. Analyses explore whether these show a statistically significant association with better child outcomes at the start of primary school.
7. How do children entering primary school without any pre-school experience differ from their
peers who have attended centres in the main EPPE pre-school sample? The analysis will compare the personal and background characteristics of ‘home’ children (those without pre-school centre experience) with those of the pre-school centre sample to establish whether ‘home’ children are drawn from specific groups. It will also compare the school entry social behavioural assessments of such children to establish whether they are significantly different from those of children who have attended a pre-school centre.
Methods The analyses employ a range of statistical techniques from descriptive and correlation analysis of the reception assessments to multilevel (hierarchical) regression methods to examine children's social behavioural development over the pre-school period (see Goldstein, 1995). Principal components analysis is used to examine underlying dimensions in young children's social behaviour and to identify groups of items that distinguish different aspects of social behaviour (see EPPE Technical Papers 2 & 7 for details). The multilevel analyses are central to the study of changes in young children's development over time and impact of pre-school. These analyses allow the variation in children’s outcomes measured at entry to primary school to be separated into that which reflects variation between children, and that which reflects variations between different pre-school centres. Multilevel models provide more accurate assessments of the impact of different child or centre level characteristics, and enable the calculation of value added estimates (residuals) of individual centre level effects on each of the four areas of social behaviour measured in the EPPE study. These residuals measure the difference between the expected and actual results, after controlling for differences in characteristics such as prior social behaviour (most important) and child parent and home environment characteristics like age, gender, SES, and home environment. An important feature of the value added analysis is the calculation of the confidence limits associated with each centre level residual estimate. These allow us to establish whether variations between individual centres are statistically significant and to identify outlier centres (those which show strong positive or negative effects on young children’s social behavioural development). Background information about child, parent and family characteristics, was obtained through parent interviews. Parent interviews were conducted soon after children were recruited to the study. It should be noted that most interviews were with children’s mothers and usually took place at the child’s pre-school centre, although for some working parents telephone interviews were found to be more convenient. All parents had agreed to their child taking part in the EPPE study and given written consent. The parent interviews were designed to obtain information about a child’s health and care history, details of family structure and parent’s own educational and occupational backgrounds as well as some indications of parent-child activities and routines. Parents were assured of confidentiality and anonymity in presenting results. An excellent response rate (97%) to the interview was achieved, although in some instances particular questions had a slightly lower rate of response (e.g. related to occupations). In most cases the parent interviews were conducted within 10 weeks of recruiting a child to the study, though for a small number of children in ‘hard to reach’ groups a longer time gap sometimes occurred.

4
This report describes the results of analyses of young children’s social behavioural development during their time in pre-school. Equivalent analyses of the cognitive progress of children in the study have been conducted. The results are reported separately in EPPE Technical Paper 8a. Social behavioural development gains have been measured from entry to the EPPE study (age 3 years plus) until the start of primary school (usually measured at entry to reception classes at rising 5 years, though in some regions children can be enrolled directly into Year 1 classes and did not join a reception class). An additional group of over 300 ‘home’ children recruited at entry to primary school brings the total sample to over 3100 children for some analyses. Structure of Main Report and Analyses This report is divided into six sections. The first provides some descriptive statistics concerning the characteristics of the EPPE sample and investigates whether particular groups of pupils show differences in social behavioural development at entry to primary school. The second section addresses the question of the extent to which different child, parent and home environment background characteristics account for variation in social behavioural development in the four outcomes at school entry. This section uses multilevel modelling techniques so that the net influence of different background factors on children’s development at different ages can be ascertained. Contextualised analyses are used to identify the unique (net) contribution of particular characteristics to variation in children’s outcomes, in this instance their development in different social behavioural outcomes, while other influences are controlled. Thus, for example, the impact of family SES, is established while taking into account the influence of mother’s qualification levels, low income (measured by eligibility for free school meals), ethnicity, birthweight, home learning environment, etc. It is of policy interest to establish the nature and strength of such background influences individually and in total, because they are relevant to issues of equity and social inclusion. The third section describes the results of value added multilevel models which investigate child social behavioural development gains over their time in pre-school (by controlling for a child’s age at assessment and prior social behavioural development at entry to the study). These analyses enable the EPPE research to establish whether there is evidence that pre-school influences young children’s social behavioural developmental gains. In particular, the extent to which children’s social behavioural developmental gains are statistically associated with the individual pre-centre they attended can be calculated. The centre level variance provides an indication of the size of any effect related to pre-school attended. The calculation of centre level residuals can be interpreted as value added indicators of centre effectiveness. Centres where children made significantly greater social behavioural developmental gains than predicted on the basis of prior social behavioural development and intake characteristics can be viewed as more effective (significant positive outliers in value added terms), while centres where children made less developmental gains than predicted can be viewed as less effective (significant negative outliers in value added terms). In the fourth section the multilevel analyses are extended to establish the extent to which factors such as type of pre-school attended, number of sessions, quality characteristics, ratios and staff qualifications show any statistically significant relationship with social behavioural gains. Do variations in quality and extent of time in pre-school have an impact on social behavioural developmental gains and, in particular, does higher quality and more pre-school experience have a positive impact? The fifth section presents findings concerning a sample of ‘home children‘ who have had no or only very limited pre-school experience before starting primary school, in comparison with the pre-school sample. The inclusion of a sample of ‘home children’ enables the study to provide further information about the impact of pre-school provision as a whole (rather than just examining variations amongst children who attended different settings and types of provision). The analyses explore whether home children are at a lower social behavioural development level

5
when they start primary school taking into account the background characteristics of home children, compared with the main EPPE sample. The last section of the paper summarises the results drawing together the main findings and conclusions.

6
Section 1: Characteristics of the Sample and Social Behavioural Development at Entry to Primary School The sample recruited for the EPPE study is described in detail in EPPE Technical Paper 1. In summary, six English Local Authorities (LAs) in five regions participated in the research with children recruited from six main types of provision (nursery classes, playgroups, private day nurseries, LA day care nurseries, nursery schools and integrated centres). In order to enable comparison of centre and type of provision effects the project was designed to recruit 500 children, 20 in each of 20-25 centres, from the six types of provision; thus giving a total sample of 3000 children and 140 centres. In some LAs certain forms of provision are less common and others more typical. Within each LA, centres of each type were selected by stratified random sampling and, due to the small size of some centres in the project (e.g. rural playgroups), more of these centres were recruited than originally proposed, bringing the sample total to 141 centres and over 3000 children.7 The sample with matched data (in other words, data at both assessment time points i.e. entry to the EPPE study and entry to primary school) is 2857 children from 141 centres. Table 1.1 reports the number of centres and EPPE children, the mean number and spread (i.e. standard deviation and range) of EPPE children per centre for each type of provision (Chart A.1 in Appendix A shows in graph format the number of EPPE children in the pre-school centres). Note that the total EPPE sample is more than 3100 when the ‘home’ children are included. Table 1.1 Descriptive Statistics of the EPPE Sample by Type of Provision
Centres Children
n n mean sd range
Nursery class 25 588 23.52 3.14 13-28
Playgroup 34 609 17.91 4.65 10-28
Private day nursery 31 516 16.65 5.14 6-27
LA day care 24 433 18.04 5.01 10-28
Nursery school 20 519 25.95 2.37 19-30
Integrated centre 7 192 27.43 3.55 25-35
All 141 2857 20.26 5.66 6-35
Table 1.2 shows the number and percentage of mobile children (i.e. those who had made a change of centre during the course of the EPPE study) by pre-school type. It can be seen that just under a quarter of the sample (23.0%) had moved from the target pre-school centre from which they were recruited at entry to the study during the pre-school period. However, far more children were identified as mobile for certain forms of provision. Children attending nursery classes, nursery schools and integrated centres were least likely to have changed centre, while the majority of those in playgroups (52%) had moved centre. Children who left their target pre-school were tracked in their new settings and re-assessed there. They were also followed up into primary school to maintain sample size and so that the impact of mobility could be analysed for this young age group. A further paper will focus in greater detail on the nature and extent of mobility amongst the EPPE sample and its impact.
7 Only a small number of integrated centres were recruited because nationally there were few examples of
this relatively recent form of pre-school provision in existence at the start of the project.

7
Table 1.2 Number & Percentage of Children Changing Pre-school Centre Before Primary School Entry by Type of Provision
n of children % of children n of centres
Nursery class 16 2.4 25
Playgroup 340 51.7 34
Private day nursery 157 23.9 31
LA day care 121 18.4 24
Nursery school 11 1.7 20
Integrated centre 13 2.0 7
All 658 23.0 141
Social Behavioural Factors at Primary School Entry During the first few weeks after entry to primary school, the child’s class teacher was asked to complete the Child Social Behaviour Questionnaire (CSBQ).8 The CSBQ provides a measure of current social behavioural development at exit from pre-school and a baseline measure for entry to primary school. Social behavioural factors were obtained from a principal components analysis of the child social behavioural items in the CSBQ at entry to primary school. The analysis identified a number of underlying dimensions (factors) which reflect patterns of associations amongst the questionnaire items. The four main factors are detailed below with the items relating to each factor given in Appendix 1:
Primary School Entry Social Behavioural Factor 1: Independence & Concentration Example items: Item 45 – ‘sees tasks through to the end, good attention span’; Item 14 – ‘easily distracted, concentration wanders’ (note that this item was reversed in the analysis) This factor measures the child’s ability to play or work independently showing a certain level of concentration.
Primary School Entry Social Behavioural Factor 2: Co-operation & Conformity Example items: Item 13 – ‘co-operates with your request’s; Item 21 – ‘ follows school rules’ This factor measures the child’s co-operative behaviour and conformity to requests or rules.
Primary School Entry Social Behavioural Factor 3: Peer Sociability Example items: Item 18 – ‘will join a group of children playing’; Item 20 – ‘In social activities, tends to just watch others’ (note that this item was reversed in the analysis)
This factor measures the child’s ability to play or work well with peers and in groups.
Primary School Entry Social Behavioural Factor 4: Anti-social / Worried
Example items: Item 29 –‘teases other children, calls them names’; Item 37 – ‘bullies other children’ This factor measures the child’s tendency to show behaviour that is disruptive to others or that is aggressive or destructive. Often, but not always, such behaviour occurs together with indications of worry or upset by the child.
The social behavioural outcomes examined in this technical paper are the main four factors as identified above that account for 52% of the variance in teachers’ ratings of children on the instrument. A parallel study in Northern Ireland (EPPNI9) has also explored social behaviour development for a sample of children attending different forms of pre-school provision (see EPPNI Technical Paper 4). This study has similar results.
8 An instrument developed by the EPPE team from the Adaptive Social Behaviour Inventory by Hogan et
al. (1992). See Appendix A for further details. 9 Effective Pre-School Provision Northern Ireland.

8
Details such as mean and spread of the data (i.e. standard deviation:sd) of the primary school entry social behavioural factors are shown in Table 1.3 whilst Charts A.2–A.5 in Appendix A show their respective distributions graphically. The distributions of the four social behavioural outcomes show a degree of skewness that is often associated with behavioural and attitude rating scales. The skewness is most marked for the factor Anti-social/worried, with most children being very favourably rated on this dimension. Note that a high score on ‘Independence & Concentration’, ‘Co-operation & Conformity’, and ‘Peer Sociability’ relates to more positive outcomes, whereas a high score on ‘Anti-social / Worried’ relates to greater anti-social / worried behaviour (children were rated on a 5 point scale with 1 signifying the behavioural description rarely / never occurred and 5 the description almost always occurred). Table 1.3 The Distribution of Children’s Scores on the Primary School Entry Child Social Behavioural Factors
n mean sd minimum value
maximum value
Independence & Concentration 2562 3.54 0.83 1 5
Co-operation & Conformity 2570 3.92 0.68 1.33 5
Peer Sociability 2568 3.65 0.71 1 5
Anti-social / Worried 2567 1.74 0.66 1 4.57
Table1.4 shows the correlations (a measure of statistical association which ranges from +1 to –1) between children’s scores on the different social behavioural factors. The correlations vary considerably, although all are highly significant. The strongest statistical association is between children’s scores on ‘Independence & Concentration’ and ‘Co-operation & Conformity’ whilst the weakest correlation is between ‘Peer Sociability’ and ‘Anti-social / Worried’. Charts A.6 and A.7 in Appendix A show the degree of these associations graphically. Table 1.4 Correlations Between Children’s Scores on the Primary School Entry Child Social Behavioural Factors
Independence & Concentration
Co-operation & Conformity
Peer Sociability Anti-social / Worried
Independence & Concentration
1.00** 0.81** 0.43** - 0.54**
Co-operation & Conformity
1.00** 0.38** - 0.69**
Peer Sociability 1.00** - 0.10**
** Statistically significant at the 0.01 level
It is of interest to compare teachers' scores on the four social behavioural outcomes for various subsets of children to see if certain groups of children are assessed as showing significant differences in social behaviour at the start of primary school. It should be noted that the study relies on class teachers' assessment of individual children's behaviour; Class teachers are those with the most direct knowledge of young children's behaviour in school and they are in a position to judge a child’s behaviour in relation to the typical behaviour of that age group. Also their perceptions and expectations of behaviour are likely to influence children's experiences and understanding of what is considered appropriate. This is an inevitable limitation inherent in instruments which rely on teacher perceptions and judgements. Nonetheless teachers remain essential sources of information about children’s social behaviour in school. Table 1.5 provides some descriptive statistics for the EPPE sample.

9
Table 1.5: The Characteristics of the EPPE Sample at Primary School Entry
n %
Gender: male 1489 52.1
female 1368 47.9
Ethnicity*: White UK 2127 74.5
White European 118 4.1
Black Caribbean 116 4.1
Black African 64 2.2
Black other 22 0.8
Indian 55 1.9
Pakistani 75 2.6
Bangladeshi 25 0.9
Chinese 5 0.2
Other 62 2.2
Mixed heritage 185 6.5
English as an additional language
249 8.7
Receiving free school meals 598 22.5
3 or more siblings 374 13.4
Mother has no formal qualification
501 18.1
Area: East Anglia 559 19.6
Shire County 594 20.8
Inner London 656 23.0
North-east 503 17.6
West Midlands 545 19.1
total n=2857
Gender Table 1.6 provides descriptive statistics comparing boys’ and girls’ social behavioural development at entry to primary school. Girls’ scores, on average, are somewhat more positive for each factor. Nonetheless, the differences are small and there is considerable overlap in the ratings given to the two groups by their class teacher. The identification of gender differences in social behaviour at the start of primary school is in line with findings for the same children at a younger age (see EPPE Technical Paper 2, & 7).
Table 1.6 Distribution of Children’s Scores on the Primary School Entry Social Behavioural Factors by Gender
Boys Girls
n mean sd n mean sd
Independence & Concentration 1341 3.37 0.84 1221 3.72 0.78
Co-operation & Conformity 1344 3.79 0.70 1226 4.06 0.64
Peer Sociability 1343 3.62 0.71 1225 3.68 0.72
Anti-social / Worried 1342 1.78 0.66 1225 1.70 0.66
Child’s First Language The descriptive statistics for the four measures of social behaviour for children who speak English as an additional language compared with children for whom English is their mother tongue are shown in Table 1.7. The results show that the social behavioural development of children for whom English is their mother tongue was rated more positively on all social

10
behavioural factors (i.e. higher scores on ‘Independence & Concentration’, ‘Co-operation & Conformity’, and ‘Peer Sociability’ and lower scores on ‘Anti-social / Worried’).
Table 1.7 Distribution of Children’s Scores on the primary School Entry Social Behavioural Factors by Child’s First Language
English as Mother Tongue English as an Additional Language
n mean sd n mean sd
Independence & Concentration 2382 3.56 0.83 180 3.33 0.85
Co-operation & Conformity 2390 3.93 0.68 180 3.73 0.68
Peer Sociability 2388 3.68 0.70 180 3.34 0.76
Anti-social / Worried 2387 1.74 0.66 180 1.78 0.63
Mother’s qualification level Table 1.8 summarises the social behavioural scores by mother’s qualification level. Again a trend can be seen, with the behaviour of children whose mothers have no formal qualifications tending to be rated slightly more negatively, while those whose mothers have degrees or higher degrees tended to be rated slightly more positively. The results reveal differences in the social behaviour (as rated by class teachers) of children whose mothers are at the top and bottom of the qualification scale in each measure.
Table 1.8 Distribution of Children’s Scores on the Primary School Entry Social Behavioural Factors by Mother’s Qualification Level
Mother No Qualifications
Mother Vocational Qualification
Mother Academic Qualification at 16
n mean sd n mean sd n mean sd
Independence & Concentration
446 3.26 0.85 387 3.51 0.78 948 3.56 0.83
Co-operation & Conformity
447 3.71 0.69 389 3.86 0.68 950 3.94 0.67
Peer Sociability
447 3.47 0.76 389 3.68 0.66 950 3.66 0.70
Anti-social / Worried
447 1.84 0.70 389 1.81 0.67 950 1.71 0.65
Mother Academic Qualification at 18
Mother Degree Mother Higher Degree
n mean sd n mean sd n mean sd
Independence & Concentration
226 3.47 0.80 341 3.84 0.76 116 3.84 0.80
Co-operation & Conformity
226 3.90 0.68 341 4.15 0.62 117 4.08 0.70
Peer Sociability
226 3.67 0.67 341 3.77 0.72 116 3.77 0.74
Anti-social / Worried
226 1.75 0.64 340 1.62 0.60 116 1.75 0.67
Qualification categories ‘other professional’ and ‘miscellaneous’ excluded due to the small number of mother’s in these categories.
Similarly there are indications of weak associations between family SES (based on highest occupational level of either parent) and class teachers’ behaviour ratings at the start of primary school as can be seen in Table 1.9.

11
Table 1.9 Distribution of Children’s Scores on the Primary School Entry Child Social Behavioural Factors by Family SES Level
Professional non-manual Intermediate non-manual
n mean sd n mean sd
Independence & Concentration 250 3.79 0.77 684 3.67 0.82
Co-operation & Conformity 251 4.06 0.68 685 4.02 0.66
Peer Sociability 251 3.78 0.69 684 3.73 0.68
Anti-social / Worried 251 1.68 0.67 683 1.69 0.62
Skilled non-manual Skilled manual
n mean sd n mean sd
Independence & Concentration 835 3.55 0.81 317 3.42 0.80
Co-operation & Conformity 837 3.92 0.68 319 3.86 0.67
Peer Sociability 836 3.68 0.69 319 3.59 0.74
Anti-social / Worried 836 1.77 0.66 319 1.73 0.64
Semi-skilled manual Unskilled manual Never worked
n mean sd n mean sd n mean sd
Independence & Concentration
317 3.30 0.86 55 3.15 0.85 58 3.31 0.92
Co-operation & Conformity
319 3.75 0.69 55 3.59 0.73 58 3.67 0.80
Peer
Sociability
319 3.45 0.78 55 3.52 0.77 58 3.44 0.66
Anti-social / Worried
319 1.77 0.66 55 1.82 0.73 58 1.94 .82
The analyses also indicate that there are weak but significant associations between social behavioural development at the start of primary school and children's cognitive attainments10 at this age. In Table 1.10 the correlations between children's social behavioural scores and their cognitive attainments in different areas are reported with the associations strongest for ‘Independence & Concentration’ and cognitive attainments at the start of primary school. Once again this is in line with earlier findings at pre-school entry, which indicated associations between cognitive attainment and social behaviour development. Table 1.10 Correlations between Children’s scores on the Primary School Entry Child Social Behavioural Factors and Children’s Cognitive Attainment at Entry to Primary School
Independence & Concentration
Co-operation & Conformity
Peer Sociability Anti-social / Worried
Pre-Reading
0.23** 0.14** 0.13** -0.03
Early Number Concepts
0.24** 0.15** 0.14** -0.08**
Language
0.22** 0.15** 0.15** -0.05**
Non-verbal reasoning
0.18** 0.11** 0.11** -0.03
Spatial awareness / reasoning
0.19** 0.12** 0.11** -0.04
** Statistically significant at the 0.01 level
10
For more details on the cognitive attainments at entry to primary school, see EPPE Technical Paper 8a.

12
As child, parent and home environment factors are associated, a method of separating out the net contributions of different background characteristics in accounting for variations between individual children in class teachers' ratings of different features of social behaviour is required. In Section 2 the results of multilevel analyses that explore this question are described. These statistical analyses allow the combined contribution of a range of factors to be assessed and the net (or unique) contribution of each to be identified.

13
Section 2: Children’s Social Behavioural Development at Entry to Primary School: Results From Contextualised Multilevel Analyses This section presents the results of a contextualised multilevel analysis (including all children in the EPPE sample with pre-school centre experience) establishing the pattern of relationships between child, family and home environment characteristics and children’s social behavioural development at primary school entry11. The four social behavioural factors discussed in Section 1 are employed as outcomes in the contextualised multilevel model. Background details about children’s earlier child care experiences, health, family and home learning environment were obtained from parental interviews conducted when children entered the EPPE study. Are patterns of associations between social behavioural development with child, family and home environment factors similar at primary school entry to the pattern found when children were younger at pre-school entry age 3 years plus (see EPPE Technical Paper 7 for earlier findings)? It is important to theory and policy to establish, in particular, whether the power of such factors to account for the variation between children in their social behavioural development at school entry is weaker or stronger than at pre-school entry. The value added analyses of changes in child social behavioural development over the pre-school period, reported subsequently in Section 3, are used to investigate the impact of pre-school in more detail. Multilevel models provide a method of exploring the extent of variation in children’s social behavioural development which can be attributed to differences between individual children and group attributes such as the area in which they live or the institution they attend.12 In the contextualised analysis reported here in Section 2, multilevel models allow an exploration of the variation in children’s scores on the four measures of Child Social Behaviour in terms of centre level variation and the extent of differences related to particular individual (child, family and home environment) characteristics. Table 2.1 shows the null models (i.e. with no explanatory variables included) for the four social behavioural outcomes. The intra-centre correlation measures the extent to which the scores of children in the same centre resemble each other in comparison with those from children at different centres. The intra-centre correlations indicate that approximately 4-6% of the variation in children’s social behavioural scores is attributed to systematic differences between pre-school centres, while the majority (over 94%) reflects differences between individual children. These intra-centre correlations are smaller than the intra-centre correlations for the cognitive outcomes reported in EPPE Technical Paper 8a. They suggest that individual pre-school centres may not vary greatly in their impact on social behavioural outcomes at the start of primary school. Table 2.1 Null model showing pre-school centre and child level variance
Independence & Concentration
Co-operation & Conformity
Peer Sociability
Anti-Social / Worried
Centre level variance: estimate (se)
0.029 (0.008)
0.025 (0.006)
0.023 (0.006)
0.022 (0.005)
Child level variance: estimate (se)
0.660 (0.019)
0.443 (0.013)
0.484 (0.014)
0.411 (0.012)
Intra-centre correlation 0.044 0.056 0.045 0.054
Number of children (number of centres)
2562 (141)
2570 (141)
2568 (141)
2567 (141)
The results from a contextualised analysis, where explanatory variables related to child, family and home environment characteristics are added to the multilevel model to control for the 11
Children’s social behavioural development at entry to primary school will also provide a baseline for later assessment of developmental gains across, for example, the reception year or Key Stage 1. 12
Multilevel models are a generalised form of regression analysis, particularly suited to the study of educational and social data exhibiting a hierarchical structure (Paterson and Goldstein, 1991; Goldstein, 1995)

14
influence of background characteristics, are reported in Table 2.2. The intra-centre correlation represents the extent to which individual pre-school centres differ in their impact on social behavioural development in these contextualised models. If all centres were equally effective, the intra-centre correlation would be zero, but this would not mean that pre-schooling had no impact, rather that centres did not differ in their impact on young children’s social behavioural development. The intra-centre correlation indicates that between 4-5% of the unexplained variance in pupils’ social behavioural ratings at primary school entry may be attributed to pre-school centre attended, after control for the impact of all significant background characteristics. While the size of the intra-centre correlation seems small, this does not imply that the pre-school influence is unimportant. Gage (1984) has drawn attention to the educational importance of measures that account for very small proportions of total variance, and made comparisons with medical research where interventions that account for less than 1% of total variance have been shown to be of great importance in improving outcomes. Table 2.2 Contextualised models (at entry to study and at entry to primary school) showing pre-school centre and child level variance Entry to Primary School Entry to Pre-school Study
(3+) Independence & Concentration
Co-operation & Conformity
Peer Sociability
Anti-Social / Worried
Cooperation & Conformity
Peer Sociability
Centre level variance: estimate (se)
0.025 (0.007)
0.017 (0.005)
0.023 (0.006)
0.014 (0.004)
0.028 (0.004)
0.038 (0.006)
Child level variance: estimate (se)
0.554 (0.017)
0.393 (0.012)
0.451 (0.013)
0.388 (0.011)
0.135 (0.004)
0.178 (0.005)
Intra-centre correlation
0.043 0.041 0.049 0.035 0.172 0.176
% Reduction in centre level variance
10.71 29.17 4.17 36.36 12.50 8.57*
% Reduction in child level variance
16.57 11.88 7.20 5.83 12.90 9.64
% Reduction in total variance
16.33 12.77 7.06 7.37 12.83 6.90
Number of children (number of centres)
2370 (141)
2424 (141)
2499 (141)
2425 (141)
2561 (141)
2750 (141)
* Percentage increase in centre level variance
The impact of child, family and home environment factors on social behavioural development at the start of primary school can be compared with the impact of these factors on social behavioural development at pre-school entry. Table 2.2 also shows the equivalent contextualised analysis for the sample using ‘Co-operation & Conformity’ and ‘Peer Sociability’ factor scores at pre-school entry13 as the dependent variables for the whole sample. Considering the reduction in total variance, it can be seen that child, family and home environment factors in combination accounted for a similar percentage of the total variance of children’s ‘Co-operation & Conformity’ scores at entry to the study (age 3+) and at the start of primary school (age 5). Referring to the centre level variance, for ‘Peer Sociability’ the findings at entry to the study show an increase in centre level variance when child, family and home environment factors are accounted for whereas at entry to primary school there is a small decrease in the centre level variance. These findings do not suggest that there is any increase in the strength of background influences on these social behavioural outcomes between the ages of 3 and 5 years. It should also be noted that the items in the instrument developed for the younger age group use a three-point scale. At start of primary school the items in the extended CSBQ use a five-point scale, allowing class
13
See Section 3 of this report for further details on the social behavioural measures (and subsequent factors) at entry to the study.
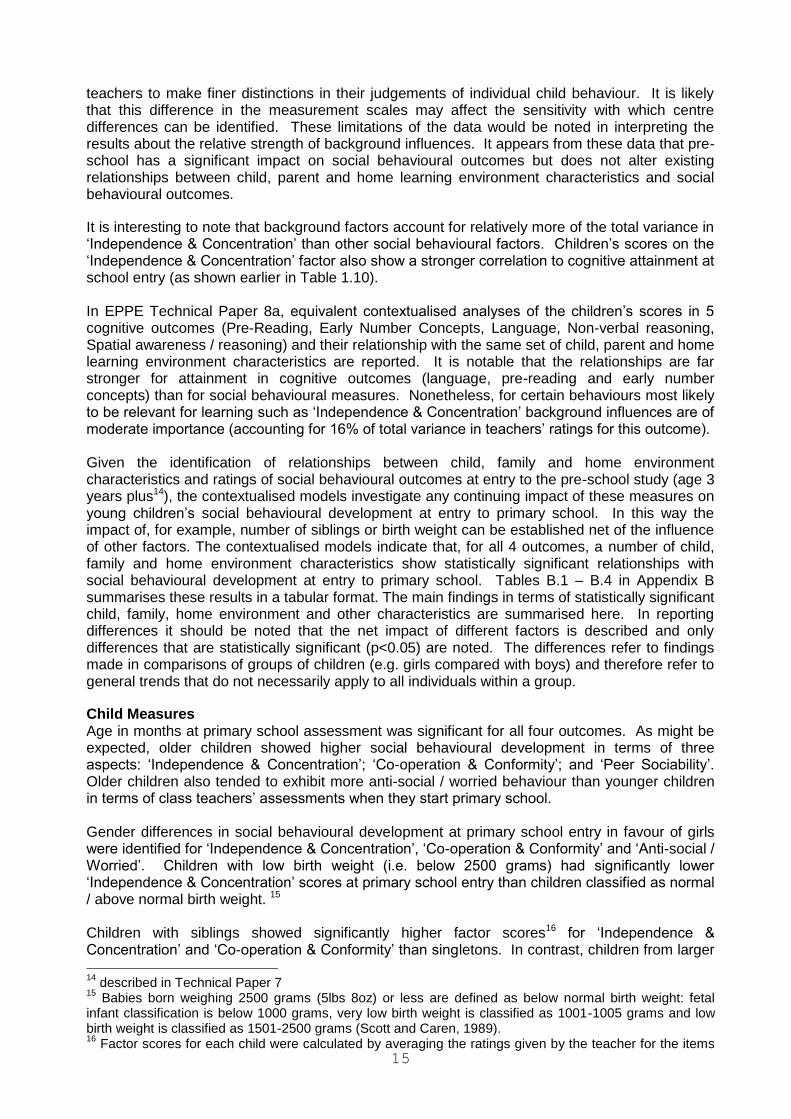
15
teachers to make finer distinctions in their judgements of individual child behaviour. It is likely that this difference in the measurement scales may affect the sensitivity with which centre differences can be identified. These limitations of the data would be noted in interpreting the results about the relative strength of background influences. It appears from these data that pre-school has a significant impact on social behavioural outcomes but does not alter existing relationships between child, parent and home learning environment characteristics and social behavioural outcomes.
It is interesting to note that background factors account for relatively more of the total variance in ‘Independence & Concentration’ than other social behavioural factors. Children’s scores on the ‘Independence & Concentration’ factor also show a stronger correlation to cognitive attainment at school entry (as shown earlier in Table 1.10). In EPPE Technical Paper 8a, equivalent contextualised analyses of the children’s scores in 5 cognitive outcomes (Pre-Reading, Early Number Concepts, Language, Non-verbal reasoning, Spatial awareness / reasoning) and their relationship with the same set of child, parent and home learning environment characteristics are reported. It is notable that the relationships are far stronger for attainment in cognitive outcomes (language, pre-reading and early number concepts) than for social behavioural measures. Nonetheless, for certain behaviours most likely to be relevant for learning such as ‘Independence & Concentration’ background influences are of moderate importance (accounting for 16% of total variance in teachers’ ratings for this outcome). Given the identification of relationships between child, family and home environment characteristics and ratings of social behavioural outcomes at entry to the pre-school study (age 3 years plus14), the contextualised models investigate any continuing impact of these measures on young children’s social behavioural development at entry to primary school. In this way the impact of, for example, number of siblings or birth weight can be established net of the influence of other factors. The contextualised models indicate that, for all 4 outcomes, a number of child, family and home environment characteristics show statistically significant relationships with social behavioural development at entry to primary school. Tables B.1 – B.4 in Appendix B summarises these results in a tabular format. The main findings in terms of statistically significant child, family, home environment and other characteristics are summarised here. In reporting differences it should be noted that the net impact of different factors is described and only differences that are statistically significant (p<0.05) are noted. The differences refer to findings made in comparisons of groups of children (e.g. girls compared with boys) and therefore refer to general trends that do not necessarily apply to all individuals within a group.
Child Measures Age in months at primary school assessment was significant for all four outcomes. As might be expected, older children showed higher social behavioural development in terms of three aspects: ‘Independence & Concentration’; ‘Co-operation & Conformity’; and ‘Peer Sociability’. Older children also tended to exhibit more anti-social / worried behaviour than younger children in terms of class teachers’ assessments when they start primary school. Gender differences in social behavioural development at primary school entry in favour of girls were identified for ‘Independence & Concentration’, ‘Co-operation & Conformity’ and ‘Anti-social / Worried’. Children with low birth weight (i.e. below 2500 grams) had significantly lower ‘Independence & Concentration’ scores at primary school entry than children classified as normal / above normal birth weight. 15 Children with siblings showed significantly higher factor scores16 for ‘Independence & Concentration’ and ‘Co-operation & Conformity’ than singletons. In contrast, children from larger 14
described in Technical Paper 7 15
Babies born weighing 2500 grams (5lbs 8oz) or less are defined as below normal birth weight: fetal infant classification is below 1000 grams, very low birth weight is classified as 1001-1005 grams and low birth weight is classified as 1501-2500 grams (Scott and Caren, 1989). 16
Factor scores for each child were calculated by averaging the ratings given by the teacher for the items

16
families (with 3 or more siblings) had lower ‘Peer Sociability’ scores than singletons. For the ‘Anti-social / Worried’ outcome, the analyses reveal that teachers rated singletons as showing significantly more anti-social / worried behaviour compared with children who had siblings.
Children with English as an additional language (EAL) were rated less positively on two factors, ‘Independence & Concentration’ and ‘Co-operation & Conformity’ outcomes. For ethnicity, the relationships varied markedly as follows:
- Black African children showed significantly higher ‘Co-operation & Conformity’ scores in comparison with the White UK group.
- Children from the Pakistani and Bangladeshi ethnic groups had lower scores for ‘Peer Sociability’ than the White UK ethnic group
- The Pakistani group recorded significantly lower ‘Anti-social /Worried’ scores compared to the White UK group (where lower anti-social / worried scores indicate less anti-social / worried behaviour) .
Family Measures The results indicate that the free school meals (FSM) measure of socio-economic disadvantage17 (despite its acknowledged limitations for this young age group where home dinners are more common) showed a negative relationship with the ‘Independence & Concentration’ and ‘Co-operation & Conformity’ measures at entry to school. In other words children entitled to free school meals tend to have on average lower scores for the ‘Independence & Concentration’ and ‘Co-operation & Conformity’ factor scores. The relationship was significant and positive for ‘Anti-social / Worried’ suggesting that, in general, children entitled to FSM tend to be slightly more likely to exhibit more anti-social / worried behaviour in their class teachers’ assessments.
Mother’s education18 as measured by degree level academic qualifications was consistently found to show a positive and significant relationship with ‘Independence & Concentration’, ‘Co-operation & Conformity’ and ‘Anti-social / Worried’ (see Appendix B for significant results for various other qualification groups). Fathers’ education is also significant for the ‘Independence & Concentration’ and ‘Co-operation & Conformity’ outcomes with children whose fathers have a higher degree being rated more highly in terms of factor scores at entry to primary school than children whose fathers have no qualifications. Fathers’ employment status is only significant for one outcome (‘Peer Sociability’), with the category of ‘not working’ showing a negative significant impact compared with the category full-time employment.
In terms of parents’ highest social class of occupation, compared to professional non-manual occupations (Class I), all other categories are associated with lower levels of social behavioural development for ‘Peer Sociability’. Significant differences are noted between children with a parent in a professional (Class I) occupation and children from families where the highest status occupation is semi-skilled manual.
Home Environment Measures19 The results indicate that the frequency with which parents said they teach their child the alphabet compared with the never category shows a positive relationship with two aspects of social behavioural development, namely ‘Independence & Concentration’ and ‘Co-operation & Conformity’ outcomes. The frequency with which parents reported that they taught their child songs or nursery rhymes also showed a significant impact on a child’s social behavioural development in all four outcomes at school entry controlling for other factors. The parent’s reported emphasis on teaching letters/numbers is important for ‘Independence & Concentration’
that form each factor. 17
Note that, unlike the other family measures collected at entry to the study, the FSM measure is collected at entry to primary school. 18
This information was collected in the parental interview at entry to the study. 19
This information was also collected in the parental interview at entry to pre-school.
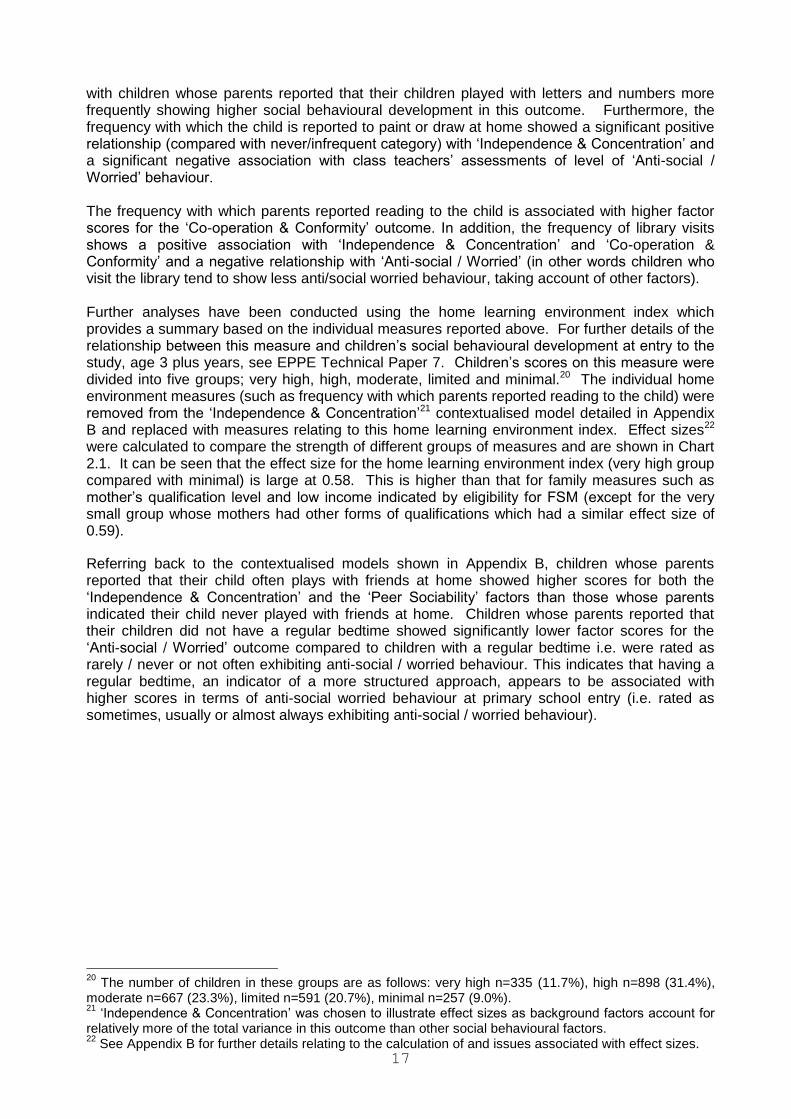
17
with children whose parents reported that their children played with letters and numbers more frequently showing higher social behavioural development in this outcome. Furthermore, the frequency with which the child is reported to paint or draw at home showed a significant positive relationship (compared with never/infrequent category) with ‘Independence & Concentration’ and a significant negative association with class teachers’ assessments of level of ‘Anti-social / Worried’ behaviour. The frequency with which parents reported reading to the child is associated with higher factor scores for the ‘Co-operation & Conformity’ outcome. In addition, the frequency of library visits shows a positive association with ‘Independence & Concentration’ and ‘Co-operation & Conformity’ and a negative relationship with ‘Anti-social / Worried’ (in other words children who visit the library tend to show less anti/social worried behaviour, taking account of other factors). Further analyses have been conducted using the home learning environment index which provides a summary based on the individual measures reported above. For further details of the relationship between this measure and children’s social behavioural development at entry to the study, age 3 plus years, see EPPE Technical Paper 7. Children’s scores on this measure were divided into five groups; very high, high, moderate, limited and minimal.20 The individual home environment measures (such as frequency with which parents reported reading to the child) were removed from the ‘Independence & Concentration’21 contextualised model detailed in Appendix B and replaced with measures relating to this home learning environment index. Effect sizes22 were calculated to compare the strength of different groups of measures and are shown in Chart 2.1. It can be seen that the effect size for the home learning environment index (very high group compared with minimal) is large at 0.58. This is higher than that for family measures such as mother’s qualification level and low income indicated by eligibility for FSM (except for the very small group whose mothers had other forms of qualifications which had a similar effect size of 0.59).
Referring back to the contextualised models shown in Appendix B, children whose parents reported that their child often plays with friends at home showed higher scores for both the ‘Independence & Concentration’ and the ‘Peer Sociability’ factors than those whose parents indicated their child never played with friends at home. Children whose parents reported that their children did not have a regular bedtime showed significantly lower factor scores for the ‘Anti-social / Worried’ outcome compared to children with a regular bedtime i.e. were rated as rarely / never or not often exhibiting anti-social / worried behaviour. This indicates that having a regular bedtime, an indicator of a more structured approach, appears to be associated with higher scores in terms of anti-social worried behaviour at primary school entry (i.e. rated as sometimes, usually or almost always exhibiting anti-social / worried behaviour).
20
The number of children in these groups are as follows: very high n=335 (11.7%), high n=898 (31.4%), moderate n=667 (23.3%), limited n=591 (20.7%), minimal n=257 (9.0%). 21
‘Independence & Concentration’ was chosen to illustrate effect sizes as background factors account for relatively more of the total variance in this outcome than other social behavioural factors. 22
See Appendix B for further details relating to the calculation of and issues associated with effect sizes.

18
Chart 2.1 Effect sizes for child, parent, home environment (in terms of the home environment index) and other measures as predictors of ‘Independence & Concentration’ at primary school entry * denotes a negative effect
Note that the effect sizes shown do not take into account the size of groups. Some large effects (e.g. for mother’s and father’s qualification other professional) apply to very small numbers of children and not all are statistically significant.
CH
ILD
ME
AS
UR
ES
Bir
th w
eig
ht c
f av
era
ge
/ab
ove:
v lo
w*
low
*
Gir
ls c
f b
oys
En
glis
h a
s a
n a
ddi
tion
al l
ang
cf
mo
the
r to
ngu
e*
Sib
ling
s cf
no
ne:
1-2
3+
sib
ling
s
FA
MIL
Y M
EA
SU
RE
S
Mo
the
r's q
ua
lific
atio
n cf
no
ne:
oth
er
deg
ree
(mot
her
)
hig
her
(mo
the
r)
16
aca
dem
ic (
mo
the
r)
16/
18
voc
atio
nal
(mo
the
r)
18
aca
dem
ic (
mo
the
r)*
Fa
the
r's q
ual
ific
atio
n cf
no
ne:
oth
er*
hig
her
(fa
the
r)
16/
18
voc
atio
nal
(fat
her
)*
deg
ree
(fa
the
r)
16
aca
dem
ic (
fath
er)
18
aca
dem
ic (
fath
er)*
Elig
ible
for
FS
M c
f n
ot e
ligib
le*
HO
ME
EN
VIR
ON
ME
NT
ME
AS
UR
ES
Hom
e L
ea
rnin
g E
nvir
onm
en
t (c
f ve
ry h
igh
): m
inim
al*
Hom
e L
ea
rnin
g E
nvir
onm
en
t m
ode
rate
*
Hom
e L
ea
rnin
g E
nvir
onm
en
t lim
ited
*
Hom
e L
ea
rnin
g E
nvir
onm
en
t hi
gh
*
Pla
y fr
ien
ds a
t h
ome
cf n
eve
r: 1
-2 t
imes
occ
asio
nal
ly (
pla
y fr
ien
ds)
3-4
tim
es
(pla
y fr
ien
ds)
5-7
tim
es
(pla
y fr
ien
ds)
OT
HE
R M
EA
SU
RE
S
Dev
elo
pm
en
tal P
rob
lem
s cf
no
ne*
So
ug
ht h
elp
fo
r p
rob
lem
s c
f n
o h
elp
*
cha
nge
*
0.000
0.200
0.400
0.600
eff
ect
siz
e o
f ca
teg
ori
ca
l p
red
icto
r va
riab
les

19
Other Measures In terms of amount of pre-school experience, children who spent longer in pre-school (measured from start date of target pre-school centre to date started primary school) tended to show higher factor scores for the ‘Anti-social / Worried’ outcome. In other words, a longer time (in years and months) spent in the target pre-school, is associated with slightly more anti-social / worried behaviour in class teachers’ ratings. However, when a measure of quality was tested in the model (i.e. ECERS-R)23, the impact of duration was reduced (although still remained significant). This suggests that higher quality pre-school centres (as measured by ECERS-R) tend to reduce the negative effect of time spent in pre-school on anti-social / worried behaviour. By contrast, there was no evidence that a longer duration of time in the target pre-school centre had a negative impact on any of the other three areas of social behavioural development. Indeed, as reported in Section 5 of this paper (see Table 5.5 and Chart 5.1) in comparison with ‘home’ children, those who had spent longer in the pre-school show the best outcomes for ‘Peer Sociability’. In addition, note that only the children who had greater than three years pre-school centre experience had significantly poorer outcomes for ‘Anti-Social / Worried’ behaviour and that this impact was relatively modest in terms of effect size. It should also be noted that the analyses of cognitive attainment at both age 3 years plus and at entry to primary school point to a significant positive impact of an early start. Additionally, the number of non-parental carers a child experienced before entering the study (e.g. relatives usually grandmothers, childminders) was also tested in the contextualised models, with children who had only parental carers compared to children with 1, 2, 3 and 4+ non-parental carers.24 The number of non-parent carers a child had showed a statistically significant positive relationship for ‘Anti-social / Worried’ (children with non-parent carers attaining higher scores for anti-social / worried behaviour than children with only parental carers). Additional analyses were conducted to explore the relationship between social behavioural development and other variables related to amount of childcare before entering the study. Three variables in particular were tested in the models:
Group care before entry to the study (age 3 years plus) either in target centre or other group care. Those children who had no or less than 1000 hours of group care were compared in the multilevel analyses to children who had experienced group care for 1001-2000 hours and more than 2000 hours.25
Relative care before entry to the study (usually grandmothers). Children with no relative care are compared to those children with up to 1000 hours and more than 1000 hours of relative care.26
Individual care before entry to the study (usually childminders). Children with no individual care are compared to groups of children with varying numbers of hours of individual care. 27
23
This measure of quality applies to the pre-school centre environment that the child experienced during the EPPE study. 24
The number of children in each group are as follows: only parental carers n=997 (35.7%), one non-parental carer n=996 (35.6%), two non-parental carers n=526 (18.8%), three non-parental carers n=181 (6.5) and four or more non-parental carers n=94 (3.4%). 25
The number of children in each of these groups relating to the number of hours of group care that a child experienced are as follows: no or less than 1000 hours of group care n=2188 (78.7%), 1001-2000 hours of group care n=266 (9.6%) and more than 2000 hours of group care n=327 (11.8%). 26
The number of children in each of the relative care groups are as follows: no relative care n=2086 (73.0%), up to 1000 hours of relative care n=366 (12.8%) and more than 1000 hours of relative care n=404 (14.1%). 27
The number of children in each of the individual care groups are as follows: no individual care n=2146 (75.1%), up to 1000 hours of individual care n=350 (12.3%), 1001-2000 hours n=135 (4.7%), 2001-3000 hours n=86 (3.0)% and more than 3000 hours of individual care n=139 (4.9%).
20
It is important to note that these variables are correlated with other measures, for example, the variable measuring group care before entry to the study (either in target centre or other group care) is correlated to the duration variable, which measures time in the target pre-school centre from start date. Likewise, the variables associated with the number of non-parental carers are correlated to the number of hours of relative and individual care variables. Thus, when testing these additional childcare variables, duration and number of non-parental carers are removed from the contextualised models. The findings indicated that the amount of childcare before entering the study had a statistically significant impact on the incidence of anti-social / worried behaviour at start of primary school.
Children with higher levels (i.e. greater than 1000 hours) of relative care (usually grandmothers) showed statistically significantly less anti-social / worried behaviour.
Children with very high levels (i.e. greater than 3000 hours) of individual care (usually childminders), by contrast, showed statistically significantly more anti-social / worried behaviour.
Furthermore, children who had experienced moderate to high levels (i.e. greater than 2000 hours) of group care before entry to the study (either in target centre or other group care) showed statistically significantly higher levels of anti-social / worried behaviour.
It should be noted that this effect is in line with that noted for social behaviour at entry to the pre-school study (3 years plus) and is mainly associated with children attending two types of provision where a young age at entry is more common (LA day care nurseries and private day nurseries where a substantial proportion start under 2 years of age and some under one year, see further discussion in EPPE Technical Paper 7). Chart 2.2 displays effect sizes for the ‘Anti-social / Worried’ outcome for a contextualised model at primary school entry including the group care, relative care and individual care variables alongside child, family and home environment measures. In relation to the other social behavioural outcomes, children who experienced greater than 2000 hours of group care before entry to the study showed statistically significantly higher levels of peer sociability. While children with greater than 1000 hours of relative care showed more ‘Independence & Concentration’ and ‘Co-operation & Conformity’ (these results verged on the statistically significant). Taken together, these results indicate that, in contrast to cognitive development and to other areas of social behavioural development, high levels of non-parental care (other than relatives) at a young age seem to be associated with an increased ‘risk’ for some children of developing anti-social / worried behavioural problems, although experience of a pre-school centre for a longer period of time shows significant benefits for cognitive development and in particular ‘Peer Sociability’ (see EPPE Technical Paper 8a and Section 5 of this report). These findings are in line with previous research by the NICHD childcare project on the links between quantity of childcare and anti-social behaviour (NICHD, 2002). Parents were asked in the interviews at the start of the study whether their child had any developmental or behavioural problems and if so, whether they had sought any help in relation to these problems. Referring back to the contextualised models shown in Appendix B, as a group, children whose parents reported no developmental problems with their children showed higher ‘Independence & Concentration’, ‘Co-operation & Conformity’ and ‘Peer Sociability’ scores than children whose parents reported a developmental problem. In terms of behavioural problems in particular, children reported to have no problems in their parent’s view showed higher scores on the ‘Co-operation & Conformity’ and ‘Peer Sociability’ and lower scores on the ‘Anti-social / Worried’, compared with children whose parents thought they showed earlier behavioural problems. The children of parents that sought help for any behavioural/developmental problems tended to show lower scores for ‘Independence & Concentration’.
21
The fully contextualised model tests the net impact of different measures while controlling for all other measures simultaneously. It thus provides more rigorous and conservative estimates of statistical significance for the impact of specific background characteristics. It does not imply that measures have no relevance if they are not statistical predictors after control for other, related measures. For example, parents’ occupational status is related to mother’s educational qualification level. Likewise, the various measures of home environment are inter-related. The contextualised model shows which set of child, parent or home environment measures, taken together, provides the best predictors of different aspects of children’s social behavioural development and which individual measures show a specific impact over and above other influences.
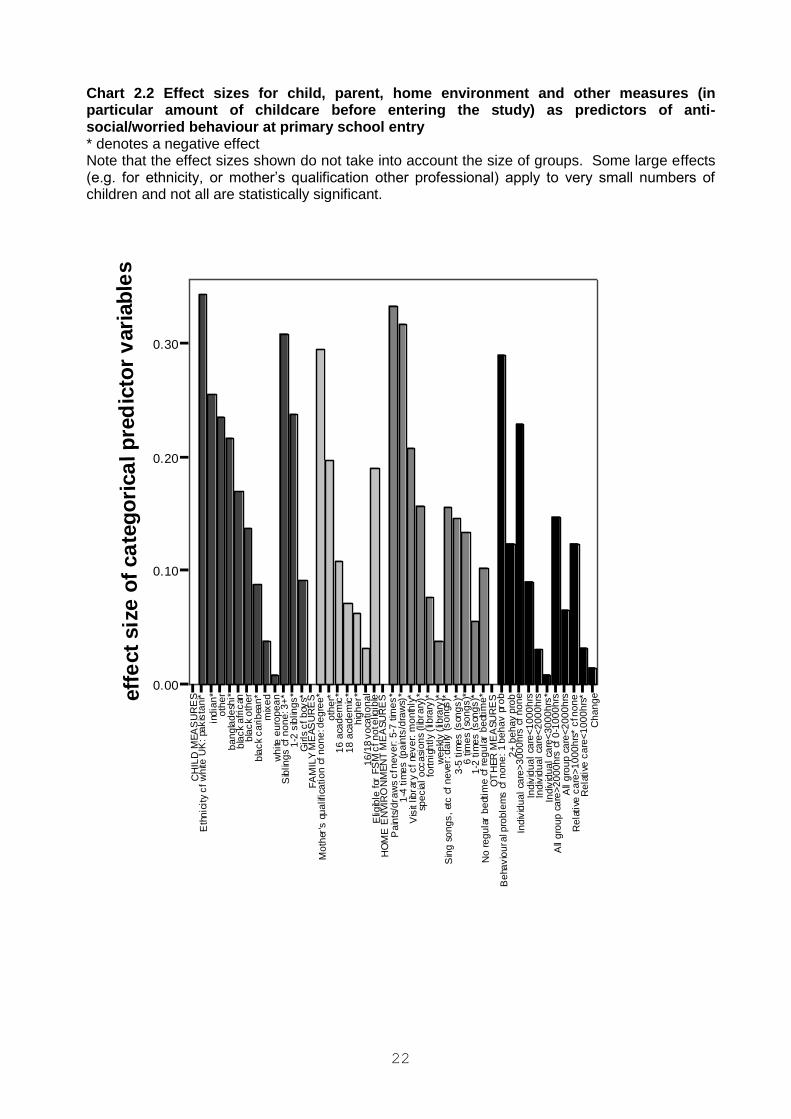
22
Chart 2.2 Effect sizes for child, parent, home environment and other measures (in particular amount of childcare before entering the study) as predictors of anti-social/worried behaviour at primary school entry * denotes a negative effect Note that the effect sizes shown do not take into account the size of groups. Some large effects (e.g. for ethnicity, or mother’s qualification other professional) apply to very small numbers of children and not all are statistically significant.
CH
ILD
ME
AS
UR
ES
Eth
nic
ity
cf
wh
ite U
K:
pak
ista
ni*
ind
ian
*o
the
rb
an
gla
de
shi*
bla
ck
afr
ican
bla
ck
oth
er
bla
ck
ca
rib
ean
*m
ixe
dw
hite
eu
rop
ea
nS
iblin
gs
cf
no
ne
: 3+
*1
-2 s
iblin
gs
*G
irls
cf
boy
s*F
AM
ILY
ME
AS
UR
ES
Mo
ther
's q
ua
lific
ati
on
cf
no
ne
: de
gre
e*
oth
er*
16
aca
de
mic
*1
8 a
cad
em
ic*
hig
he
r*1
6/1
8 v
oca
tio
na
lE
ligib
le f
or F
SM
cf
no
t elig
ible
HO
ME
EN
VIR
ON
ME
NT
ME
AS
UR
ES
Pa
ints
/dra
ws
cf n
ev
er:
5-7
tim
es
*1
-4 t
ime
s (
pa
ints
/dra
ws)
*
Vis
it lib
rary
cf
nev
er:
mo
nth
ly*
spe
cia
l o
cca
sio
ns
(lib
rary
)*fo
rtn
igh
tly
(lib
rary
)*w
ee
kly
(lib
rary
)*S
ing
so
ng
s,
etc
cf
ne
ver:
da
ily (
so
ngs
)*
3-5
tim
es
(s
ong
s)*
6 t
ime
s (
son
gs
)*1
-2 t
ime
s (
son
gs
)*N
o r
eg
ula
r b
edt
ime
cf
reg
ula
r b
edt
ime
*O
TH
ER
ME
AS
UR
ES
Be
hav
iou
ral p
rob
lem
s c
f n
on
e:
1 b
eh
av
pro
b
2+
be
ha
v p
rob
Ind
ivid
ua
l ca
re>
30
00
hrs
cf
no
ne
Ind
ivid
ua
l ca
re<
10
00
hrs
Ind
ivid
ua
l ca
re<
20
00
hrs
Ind
ivid
ua
l ca
re<
30
00
hrs
*A
ll g
rou
p c
are
>2
00
0h
rs c
f 0
-10
00
hrs
All
gro
up
ca
re<
20
00
hrs
Re
lati
ve c
are
>1
00
0h
rs*
cf n
on
eR
ela
tive
ca
re<
10
00
hrs
*
Ch
an
ge
0.00
0.10
0.20
0.30
eff
ect
siz
e o
f ca
teg
ori
ca
l p
red
icto
r v
ari
ab
les

23
Section 3: Children’s Social Behavioural Development Over the Pre-school Period: Results from the Value Added Multilevel Analyses In order to investigate the impact of individual pre-school centres on young children’s social behavioural developmental gains during the pre-school period covered in the EPPE study, it is necessary to have baseline data about children's prior social behavioural development so that subsequent change can be measured. Only in this way will it be possible to establish whether children attending specific centres show greater developmental gains by entry to school. Additionally, it is also necessary to make proper control for differences in the characteristics of the children they serve because only when differences in the intake characteristics of children attending different centres are taken into account can valid comparisons be drawn. This section presents the results of value added analyses of children’s social behavioural developmental gains over the pre-school period for each of the four social behaviour factors described previously. These analyses include all children in the EPPE sample with pre-school centre experience. The value added models examined are (i) simple value added models controlling for children’s prior social behavioural development only, and (ii) complex value added models controlling for children’s prior social behavioural development and, in addition, any significant child, family and home environment characteristics. Comparisons between simple and complex value added models allow the impact of background factors on social behavioural developmental gains, over and above the impact of prior social behavioural development, to be ascertained. By comparing these results with models in Section 2 it is also possible to explore the extent to which such factors influence changes in social behavioural development over the pre-school period. Research in the school effectiveness field (Goldstein et al, 1992; Mortimore et al, 1994; DFE, 1995; Strand, 2002; Tymms, 1997) shows that, for cognitive progress, prior attainment is the best predictor of future attainment. Although there is a smaller research base examining social behavioural development, the evidence also suggests that prior social behavioural development can be a significant predictor of future social behavioural development for young children in primary school (Tizard et al, 1988; Mortimore et al, 1988). The instrument chosen at entry to the EPPE study (age 3 plus) to provide a baseline for the value added analysis was the Adaptive Social Behavior Inventory (ASBI)28. The ASBI was completed by a pre-school worker who was familiar with the child and provides measures of social behavioural development at entry to the target centre (age 3 years plus). The social behavioural factors at entry to pre-school (detailed below) are obtained from a principal components analysis of the ASBI child social behavioural items, which identified a number of underlying dimensions, reflecting patterns of associations amongst the questionnaire items. Appendix C details the ASBI items that form the 5 factors which, in total, account for 56% of the variance.
Entry to study Social Behavioural Factor 1: Co-operation & Conformity Example items: Item 3 –‘is obedient and compliant’; Item 8 – ‘waits his/her turn in games or other activities’
Entry to study Social Behavioural Factor 2: Peer sociability Example items: Item 13 –‘ will join a group of children playing’; Item 19 –‘plays games and talks with other children’
Entry to study Social Behavioural Factor 3: Confidence Example items: Item 22 –‘is confident with other people’;
28
The ASBI was developed by Hogan et al, (1992) as a general measure of the social and behavioural development of pre-school children. It was developed because there was not a measure then available that produced measures of social competence, pro-social and anti-social behaviours for pre-school children. See Appendix C for further details.
24
Item 9 – ‘is open and direct about what he/she wants’
Entry to study Social Behavioural Factor 4: Anti-social Example items: Item 21 – ‘ teases other children, calls them names’; Item 26 – ‘bullies other children’
Entry to Pre-school Social Behavioural Factor 5: Worried / upset Example items: Item 6 – ‘gets upset if you don’t pay enough attention’; Item 25 –‘accepts changes without fighting against them or becoming upset’ (note that this item is reversed in the analysis).
Table 3.1 reports the correlations between the first four prior social behaviour factors at entry to the study and the social behavioural factors measured by class teachers’ assessments at entry to primary school. Although the correlations between the factors at the different time points are low, they are generally statistically significant. It is important to note that the lower correlations (in comparison with those for cognitive outcomes over the same time period) are likely to reflect a number of influences, including real changes in child behaviour at different ages, measurement error in terms of teachers and care workers’ assessments, and differences in the instruments (in terms of number of points on the rating scales used). Given this the extent of change should be interpreted with caution. Further details of the social behavioural measures used at the start of school are in Appendix A and at the start of the study in Appendix C. Table 3.1 Correlations Between Children’s Scores on Four Social Behavioural Factors at Entry to Study and at Entry to Primary School
Independence & Concentration
at age 5
Co-operation & Conformity
at age 5
Peer Sociability at age 5
Anti-Social / Worried at age 5
Co-operation & Conformity
at age 3
0.19**
0.16**
0.10**
-0.12**
Peer Sociability at age 3
0.12** 0.09** 0.16** 0.02
Confidence at age 3
0.08** 0.04* 0.13** 0.04*
Anti-Social at age 3
-0.08** -0.09** 0.01 0.15**
** Statistically significant at the 0.01 level * Statistically significant at the 0.05 level
Children are assessed at pre-school entry (and because there are variations in centre policies and uptake the age of assessment varies). The value added models control for age of entry to pre-school and age at entry to school. The age at assessment measures also control to some extent for amount of pre-school experience. Simple value added models The multilevel analyses of children’s social behavioural development gains over the pre-school period use the four CBSQ factor scores at primary school entry as outcome measures and prior social behavioural development at pre-school entry. The results indicate the existence of significant centre level variance after controlling for age, and prior social behavioural factors at pre-school entry. Table 3.2 shows the results of the simple value added model of child social behavioural development gains for the four social behavioural outcomes, reporting the intra-centre correlation and the extent of variance at the pre-school centre level and at the child level. The intra-centre correlation provides an indication of the extent to which unexplained variance in children’s social behavioural development gains may be attributed to differences between the different pre-school settings. This gives an indication of possible variation in pre-school effectiveness (between the 141 individual pre-school centres in the EPPE sample). The results

25
show that the size of the intra-centre correlation varies only slightly between the four social behavioural outcomes for the simple value added models. The smallest intra-centre correlation is for ‘Anti-social / Worried’, indicating that pre-schools seem to vary slightly less in their impact on this outcome over the pre-school period compared with their impact on the other three social behavioural outcomes. The intra-centre correlations for the simple value added models are generally larger (with the exception being ‘Anti-social / Worried’) than those reported for the null models (i.e. with no explanatory variables included – see Table 2.1 in Section 2). In other words, when prior social behavioural development is accounted for in the simple value added multilevel models, greater differences in children’s social behavioural developmental gains between pre-school centres are evident. The increase is greatest for the factor ‘Independence & Concentration’ where centre level variance rose by over 20%. This result indicates that it is important to take account of children’s prior social behavioural development in any studies of the impact of pre-school, in the same way as studies of differences between individual centres in their effects on cognitive progress control for children’s prior attainment. The extent of any centre level differences may not be accurately identified without the inclusion of baseline measures of prior behaviour. Considering centre level variance in Table 3.2, it can be seen that for two outcome factors (‘Independence & Concentration’ and ‘Peer Sociability’) controlling for age and significant prior social behavioural factors at pre-school entry do not explain differences between centres and, in fact, the differences between centres increase slightly. In contrast, for ‘Co-operation & Conformity’ and ‘Anti-social / Worried’, the addition of significant prior social behavioural factors reduces the centre-level variance, accounting for 8% and 14% of the centre level variance respectively. These results suggest that different pre-school settings do vary in their impact on young children’s social behavioural development. The findings on social behaviour are in line with those reported for the analysis of cognitive progress (see Section 3, EPPE Technical Paper 8a). Table 3.2 Simple value added model
29 showing pre-school centre and child level variance
Independence & Concentration
Co-operation & Conformity
Peer Sociability Anti-social / Worried
Centre level variance:
estimate (se)
0.035
(0.008)
0.023
(0.005)
0.025
(0.006)
0.019
(0.005)
Child level variance:
estimate (se)
0.551
(0.016)
0.366
(0.011)
0.413
(0.012)
0.346
(0.010)
Intra-centre correlation 0.060 0.059 0.057 0.052
% Reduction in centre level variance
-20.69 (i.e. an increase of 20.69)
8.00 -8.70(i.e. an increase of 20.69)
13.64
% Reduction in child level variance
16.77 17.38 14.67 15.61
% Reduction in total variance
15.20 16.88 13.61 15.51
Number of children
(number of centres)
2546
(141)
2549
(141)
2553
(141)
2548
(141)
The best fit in the simple value added models is achieved by inclusion of the prior social behavioural measures described in Table 3.3. Only significant effects have been reported with positive denoting a positive significant effect, whilst negative shows a negative significant effect.
29
Controlling for age at both entry to pre-school and entry to school social behavioural assessment and significant social behavioural factors at pre-school entry

26
Table 3.3 Impact of Prior Social Behavioural Factors on Developmental Gains over the Pre-school Period in Four Social Behavioural Outcomes (Simple Value Added Models)
30
Independence & Concentration at
age 5
Co-operation & Conformity at
age 5
Peer Sociability at age 5
Anti-Social / Worried at age 5
Co-operation & Conformity at
age 3
positive positive negative ( i.e. associated with
reductions in anti-social / worried
behaviour)
Peer Sociability at age 3
positive
Confidence at age 3
negative positive positive (i.e. associated with
increases in anti-social / worried
behaviour)
Anti-Social at age 3
negative positive (i.e. associated with
increases in anti-social / worried
behaviour)
Independence & Concentration
Prior social behavioural development in ‘Co-operation & Conformity’ is the only prior social behavioural factor to show a significant relationship with children's scores on this outcome at start of primary school. The relationship is positive suggesting that the higher a child’s rating at age 3 plus on items from the ‘Co-operation & Conformity’ dimension of the ASBI, the higher a child’s subsequent rating at entry to school on the ‘Independence & Concentration’ factor.
Co-operation & Conformity
As one might expect, prior social behavioural development in the factor ‘Co-operation & Conformity’ at age 3 plus years shows a highly significant positive relationship with later ‘Co-operation & Conformity’ development.
Prior ‘Anti-Social’ behaviour shows a significant negative relationship with this outcome i.e. the less anti-social behaviour a child exhibits at entry to the pre-school study, the higher a child is rated as co-operative and conforming at entry to primary school.
Prior social behavioural development in ‘Confidence’ shows a significant negative relationship with later ‘Co-operation & Conformity’. This suggests that the less confident a child is at entry to pre-school, the higher a child is rated as co-operative and conforming at entry to school.
Peer Sociability
Prior social behavioural development in ‘Peer Sociability’31 is unsurprisingly related to later ratings of ‘Peer Sociability’, showing a highly significant positive relationship
Prior social behavioural development in ‘Confidence’ also shows a significant positive relationship with later ‘Peer Sociability’
30
Controlling for age at both entry to pre-school and entry to school social behavioural assessment and significant social behavioural factors at pre-school entry. 31
Note that the addition of a quadratic term for the prior social behavioural ‘Peer Sociability’ outcome has also been included in the model to improve the fit.

27
Anti-social / Worried (Anti-social, Worried or Upset)
Prior ‘Anti-social’ behaviour32 is related to later ‘Anti-social / Worried’ behaviour, showing a significant positive relationship i.e. if a child is seen by pre-school workers as exhibiting anti-social behaviour at entry to the pre-school study, they are also more likely to be rated as more anti-social / worried by their class teacher at entry to primary school.
Prior social behavioural development in ‘Co-operation & Conformity’ shows a significant negative relationship with later ‘Anti-social / Worried’ behaviour. This suggests that the higher a child is rated as co-operative and conforming at entry to pre-school, the less likely they are to show anti-social / worried behaviour at entry to school. These findings and the results above for the outcome ‘Co-operation & Conformity’ suggest a significant inverse relationship between the items relating to the ‘Co-operation & Conformity’ and ‘Anti-Social/Worried’ behaviour dimensions of the ASBI at entry to pre-school and the CSBQ at entry to primary school.
Prior social behavioural development in ‘Confidence’ also shows a significant positive relationship with ‘Anti-social / Worried’. This suggests that the more confident a child is rated at entry to the pre-school study, the more likely they are to be rated as ‘Anti-Social / Worried’ at entry to school.
Complex value added model Significant relationships between child, family and home environment characteristics and children’s attainment in the social behavioural outcomes have been identified at entry to pre-school age 3 years plus33 and also at primary school entry34, although these relationships are notably weaker than those found in the analyses of cognitive attainment (see EPPE Technical Paper 8a). Subsequently, further multilevel analyses have been conducted to investigate the continuing impact of such measures on young children’s social behavioural developmental gains over the pre-school period, while taking account of the links with prior social behavioural development reported above. The results show that a number of statistically significant relationships with children’s social behavioural development gains over the pre-school period remain evident, and such measures account for additional variance at both the centre and child level. The complex value added model is shown in Table 3.4. It demonstrates that to explore the impact of pre-school settings (pre-school centres) on children’s social behavioural development gains over the pre-school period, it is necessary to have good data about child, parent and home environment characteristics and to control for these intake characteristics as well as measures of children’s prior social behavioural development in assessing the impact of pre-school. As reported previously for the contextualised models (see Section 2) and the simple value added models, the size of the intra-centre correlation only varies to a small extent between social behavioural outcomes. The results show that approximately 5 per cent of the variance in social behavioural development gains not accounted for by prior development and child, parent and home characteristics is attributable to pre-school centre differences. The inclusion of factors related to children’s background shows the strongest impact on social behavioural developmental gains for the ‘Independence & Concentration’ outcome. In the simple value added model (accounting only for prior social behavioural development and age at both testing points), the intra-centre correlation for the ‘Independence & Concentration’ outcome is 6 per cent whilst in the complex value added model, the equivalent percentage is 5 per cent. This indicates that when only prior social behavioural development is taken into account, 6 per cent of the unexplained variance is attributable to pre-school centre differences in ‘Independence & Concentration’ developmental gains during the pre-school period, whereas when child, family and home characteristics are controlled for in addition to prior social behaviour, only 5 per cent of
32
Note that the addition of a quadratic term for the prior ‘Anti-Social’ behaviour outcome has also been included in the model to improve the fit. 33
described in EPPE Technical Paper 7 34
described in Section 2 of this paper

28
the unexplained variance is attributable to pre-school centre differences. These are broadly in line with results for cognitive progress over the pre-school period reported in EPPE Technical Paper 8a. Table 3.4 Complex value added model
35 showing pre-school centre and child level variance
Independence & Concentration
Co-operation & Conformity
Peer Sociability
Anti-social / Worried
Centre level variance: estimate (se)
0.026
(0.007)
0.020
(0.005)
0.024
(0.006)
0.016
(0.004)
Child level variance: estimate (se)
0.496
(0.015)
0.339
(0.010)
0.400
(0.012)
0.334
(0.010)
Intra-centre correlation
0.050 0.056 0.057 0.046
% Reduction in centre level variance
7.14 20.00 0 23.81
% Reduction in child level variance
25.19 23.99 17.53 18.73
% Reduction in total variance
24.46 23.78 16.70 18.98
Number of children (number of centres)
2428
(141)
2423
(141)
2497
(141)
2421
(140)
In comparing the simple value added model (Table 3.2) and the complex value added model (Table 3.4) it can be seen that there is a substantial reduction in the centre level variance for all 4 social behavioural factors. This reduction reflects the increased variance accounted for by the child, family and home environment characteristics of the sample. The increase in the total variance accounted for in the simple and complex value added models indicates that the importance of background measures varies for different behavioural factors. A comparison of the reduction in total variance reported in Tables 3.2 and 3.4 shows that compared to the simple value added model, the complex value added model accounts for an additional 9.3 per cent and 6.9 per cent of the total variance for the ‘Independence & Concentration’ factor and the ‘Co-operation & Conformity’ factors respectively. In summary, when exploring the impact of pre-school centres on children’s social behavioural developmental gains, in addition to baseline measures of children’s prior social behavioural development, it is helpful to include information about the child, parent and home environment. This allows proper control for differences between centres in the characteristics of the children they serve. Only when differences in intake are measured can valid comparisons be drawn. For developmental gains in all four social behavioural outcomes (after controlling for prior social behavioural development at entry to the EPPE study), a number of child, parent and home environment characteristics continue to show statistically significant relationships over the pre-school period. Table C.5 in Appendix C summarises these results in a tabular format and Tables C.1-C.4 show multilevel estimates and their associated standard errors for each outcome. These tables highlight all groups of variables tested and their respective significance. In addition, Charts D.1-D.4 in Appendix D display graphically effect sizes for the outcomes ‘Independence & Concentration’ and ‘Co-operation & Conformity’36. The main findings in terms of intake characteristics for social behavioural developmental gains in each outcome are summarised below. In reporting differences it should be noted that the net impact of different
35
Controlling for age at baseline and outcome assessment, social behavioural development at pre-school entry and child, parent and home environment characteristics 36
Note that effect sizes have been calculated for the all measures included in the complex value added models discussed in this section with also the inclusion of a measure of quality (see Section 4 for more details).

29
factors is described and only differences that are statistically significant (p<0.05) are noted. The differences refer to findings made in comparisons of groups of children (e.g. girls compared with boys) and therefore refer to general trends that do not necessarily apply to all individuals within a group. Independence & Concentration Developmental Gains (taking account of prior social behavioural development) Child measures:
Girls made greater developmental gains in ‘Independence & Concentration’ than boys.
Older children made greater developmental gains in ‘Independence & Concentration’.
Children from families with 1 or 2 siblings made greater developmental gains in ‘Independence & Concentration’ than singletons.
Children with below normal birth weight made less developmental gains in ‘Independence & Concentration’ than children classified as normal / above normal birth weight.
Family Measures:
Compared with children whose mothers have no qualifications, children whose mothers have qualification levels 16 year academic, degree or other qualifications made greater developmental gains in ‘Independence & Concentration’, with those whose mothers have other qualifications recording the most positive impact.
Compared with children whose fathers have no qualifications, children whose fathers have higher degrees made greater developmental gains in ‘Independence & Concentration’.
Home Environment Measures:
Children whose parents report taking their children to the library made greater developmental gains in ‘Independence & Concentration’ than children who never visit the library, with those whose parents who take them fortnightly or monthly recording a significant positive impact.
Children whose parents reported that they paint and draw at home made greater developmental gains in ‘Independence & Concentration’ than children whose parents said that they never paint or draw at home.
Children whose parents reported that their children played with letters and numbers daily made greater developmental gains in ‘Independence & Concentration’ than children who never played with letters and numbers at home.
Children whose parents reported encouraging their children to learn songs, poems and nursery rhymes (with a frequency of 3 or more times a week) made greater developmental gains in ‘Independence & Concentration’ than children whose parents never reported this activity.
Developmental / Behavioural measures:
Children whose parents reported their child had no developmental problems made greater gains in ‘Independence & Concentration’ than children whose parents reported any developmental problems.
Children whose parents reported that no help was sought for any health, behavioural or developmental problems made greater developmental gains in ‘Independence & Concentration’ than children whose parents had sought help. This may reflect parents seeking help for more severe problems or greater parental concern.
There are no statistically significant differences related to change of pre-school centre during the EPPE study period in terms of children’s developmental gains over the pre-school period when ‘Independence & Concentration’ at school entry is studied, after controlling for social behavioural development. Interestingly, no compositional effects (such as percent of children in a centre whose mother has a degree or above) were found to be statistically significant in the development of children’s ‘Independence & Concentration’. This compositional factor had been found to be important in predicting children's cognitive progress over pre-school (see EPPE Technical Paper 8a).

30
For details of estimates and effect sizes for ‘Independence & Concentration’ see Table C.1 in Appendix C and Charts D.1-D.2 Appendix D. Co-operation & Conformity Developmental Gains (taking account of prior social behavioural development) Child measures:
Girls made greater developmental gains in ‘Co-operation & Conformity’ than boys.
Older children made greater developmental gains in ‘Co-operation & Conformity’.
Children from families with 1 or 2 siblings made greater developmental gains in ‘Co-operation & Conformity’ than singletons.
Children from the Black African ethnic group made more developmental gains in ‘Co-operation & Conformity’ than the White UK ethnic group.
Family measures:
Children whose mothers have academic qualifications made greater developmental gains in ‘Co-operation & Conformity’ than children whose mothers have no qualifications, with those whose mothers have degrees recording a significant positive impact.
Compared with children whose fathers have no qualifications, children whose fathers have higher degrees made greater developmental gains in ‘Co-operation & Conformity’.
Children not eligible for FSM made more developmental gains in ‘Co-operation & Conformity’ than children eligible for FSM.
Home Environment measures:
Children whose parents reported frequently encouraging their children to learn songs, poems and nursery rhymes made more developmental gains in ‘Co-operation & Conformity’ than children who were never encouraged to learn songs, poems and nursery rhymes.
Children whose parents read to them daily made more developmental gains in ‘Co-operation & Conformity’ than children whose parents read to them less frequently.
Children whose parents reported that their children had a regular bedtime made less developmental gains in ‘Co-operation & Conformity’ than children without a regular bedtime. Findings at entry to pre-school indicated that regular bedtime had a positive effect. Hence the greater improvement where children do not have a regular bedtime may reflect their greater potential for improvement given their lower baseline scores. Alternatively, it may suggest that at older age this greater level of structure can be less advantageous.
Developmental / Behavioural measures:
Children whose parents reported no behavioural problems with their children made more gains in ‘Co-operation & Conformity’ than children whose parents reported one behavioural problem.
There was no evidence that children who changed pre-school centre during the EPPE study period made less developmental gains in terms of ‘Co-operation & Conformity’ over the pre-school period. No compositional effects were found to be statistically significant in the development of ‘Co-operation & Conformity’. For details of estimates and effect sizes for ‘Co-operation & Conformity’ see Table C.2 in Appendix C and Charts D.3-D-4 in Appendix D. Peer Sociability Developmental Gains (taking account of prior social behavioural development) Child measures:
Children who are older at time of school entry made greater developmental gains in ‘Peer Sociability’.
Children from the Bangladeshi ethnic group made less developmental gains in ‘Peer Sociability’ than the White UK ethnic group.
31
Family measures:
Children from families where the highest social class of occupation is professional non-manual made greater developmental gains in ‘Peer Sociability’ than children from other families, with those families where the highest social class of occupation is semi-skilled manual recording a significant negative impact.
Compared to children whose fathers work full time, children whose fathers are not working made less developmental gains in ‘Peer Sociability’
Home Environment measures:
Children whose parents report encouraging their children to learn songs, poems or nursery rhymes made greater developmental gains in ‘Peer Sociability’, with those children whose parents report this frequently (6 or more times a week) recording a significant positive impact.
Children whose parents reported that their children never played with friends at home made less developmental gains in ‘Peer Sociability’ than children who play with friends at home, with those children who play with friends at home once or twice a week (rather then more often) recording a significant positive impact.
Developmental / Behavioural measures:
Children whose parents reported no behavioural problems with their children made greater developmental gains in ‘Peer Sociability’ than children whose parents reported one behavioural problem, as might be expected.
Composition of intake measures:
Interestingly, in contrast to cognitive outcomes, children attending pre-school settings where there is a higher proportion of mothers with degrees, higher degrees or other qualifications made less developmental gains in ‘Peer Sociability’.
There were no significant gender differences in developmental gains for ‘Peer Sociability’ in the value added analysis. Likewise birth weight and English as an additional language showed no significant association with development in ‘Peer Sociability’. There was no evidence that children who changed pre-school centre during the EPPE study period made less developmental gains in terms Peer Sociability’ over the pre-school period. For details of estimates for ‘Peer Sociability’ see Table C.3 in Appendix C. Changes in Anti-social / Worried Behaviour (taking account of prior social behavioural development) Child measures:
Children who are older at primary school entry displayed a greater increase in their ‘Anti-social / Worried’ behaviour over the pre-school period.
Compared with the White UK ethnic group, children from the Pakistani ethnic group showed a greater decrease ‘Anti-social / Worried’ behaviour over the pre-school period.
As a group, children with siblings (both the group 1-2 siblings & the 3+ siblings groups) showed a greater decrease in ‘Anti-social / Worried’ behaviour compared with singletons over the pre-school period.
Family measures:
Compared with children whose mothers have no qualifications, children whose mothers have academic qualifications showed a greater decrease in ‘Anti-social / Worried’ behaviour over the pre-school period, and children whose mothers have degrees recorded a significant reduction.
Compared with children whose fathers have no qualifications, children whose fathers highest level of qualification is 16 academic showed a greater decrease in ‘Anti-social / Worried’ behaviour over the pre-school period.
Children not eligible for FSM showed a greater decrease in ‘Anti-social / Worried’ behaviour compared with children eligible for FSM over the pre-school period.

32
Compared to children whose fathers work full time, children whose fathers are classified in the ‘other’ category37 showed a greater decrease in ‘Anti-social / Worried’ behaviour.
Home Environment measures:
Children whose parents report encouraging their children to paint and draw at home (compared to those children that never paint or draw at home) showed a greater decrease in ‘Anti-social / Worried’ behaviour over the pre-school period.
Children whose parents report taking them to the library showed a greater decrease in ‘Anti-social / Worried’ behaviour over the pre-school period compared with children who never visit the library. Those children who visit the library every month recorded significant reduction.
Children whose parents reported that their children did not have a regular bedtime showed a greater decrease in ‘Anti-social / Worried’ behaviour over the pre-school period compared to children with a regular bedtime. This is in line with findings for the outcome ‘Co-operation & Conformity’.
Developmental / behavioural measures:
Children whose parents reported no behavioural problems with their children up to the start of the study showed a greater decrease in ‘Anti-social / Worried’ behaviour over the pre-school period compared to children whose parents reported one behavioural problem.
Other measures:
Children who had been cared for by one or more non-parental carers before entry to the study (e.g. relatives usually grandmothers, childminders) displayed a greater increase in their ‘Anti-social / Worried’ behaviour over the pre-school period compared with children who had not had any non-parental carers, with those children with 3 non-parental carers recording a significantly greater increase. However, in contrast, further analyses show that children who had been cared for by relatives (e.g. grandmother) more often showed a greater decrease in ‘Anti-social / Worried’ behaviour over the pre-school period.
Gender, birth weight and English as an additional language are not significantly associated with developmental change in ‘Anti-social / Worried’ behaviour over the pre-school period. There was no evidence that children who moved pre-school centre during the EPPE study period displayed an increase in their ‘Anti-social / Worried’ behaviour.
For details of estimates for ‘Anti-social / Worried’ see Table C.4 in Appendix C.
37
The ‘other’ category in terms of father’s working status comprises primarily fathers who work part-time but also a small number of fathers who work part time and are self-employed.

33
Differences Between Individual Pre-School Centres in their Effects on Child Social / Behavioural Outcomes Using an ‘educational effectiveness’ design based on multilevel modelling, the progress of EPPE children has been tracked to estimate the impact of individual centres on children’s social behavioural development over the pre-school period. As seen earlier in this report, social background was taken into account, along with the ‘home learning environment’ provided by parents. Centres that are more or less effective in promoting children’s social behavioural gains (i.e. outliers) have been identified by categorising the value added residuals for the four outcome measures. Pre-school centre effects significantly above/below expectation at the 95 per cent confidence limit are identified by calculating confidence intervals for each value added residual (value added residual +/- 1.96 standard error). If the confidence intervals for a value added residual do not overlap zero38, the value added residual is significantly different either above or below expectation and the centre is identified as an outlier. In studies of institutional effects particularly where the numbers of children in individual institutions are small, it is common for the majority of residual estimates to have 95% confidence intervals that overlap zero, suggesting centre effects on children’s social behavioural developmental gains are not significantly different from zero (or, in other words, children make developmental gains in line with that predicted by prior behaviour and other characteristics). It is also possible to classify centre effects either above or below expectation by calculating less stringent confidence intervals at the 68 per cent significance level for the value added residuals (value added residual +/- 1 standard error). Table 3.5 summaries centre effects for the 141 pre-school settings (pre-school centres). The results show that there is greater variation in pre-school effects for children’s developmental gains in ‘Co-operation & Conformity’ than for gains in other factors. For example, 9 centres (6.3%) of the 141 included in the analysis of ‘Co-operation & Conformity’ developmental gains were identified as significant outliers at the 95% significance level. For the other social behavioural outcomes (‘Independence & Concentration’, ‘Peer Sociability’ and ‘Anti-Social / Worried’), there are fewer significant outliers (approx 4-5%). It is possible that this finding reflects differences among pre-school centres in their aims and the emphasis given to promoting particular aspects of social behavioural development. It may also reflect greater difficulties in measuring social behavioural change in young children in comparison with assessments of cognitive attainment that tend to show higher reliability. Table 3.5 Summary of pre-school centre effects showing the number of pre-school centres in each category
Independence & Concentration
Co-operation & Conformity
Peer Sociability
Anti-social / Worried
39
Above expectation (95% significance)
4 (2.8%) 5 (3.5%) 4 (2.8%) 1 (0.7%)
Above expectation (68% significance)
15 (10.6%) 17 (12.1%) 18 (12.8%) 22 (15.6%)
As expected
100 (70.9%) 97 (68.8%) 101 (71.6%) 101 (71.6%)
Below expectation (68% significance)
19 (13.5%) 18 (12.8%) 15 (10.7%) 12 (8.5%)
Below expectation (95%significance)
3 (2.1%) 4 (2.8%) 3 (2.1%) 5 (3.5%)
percentages given in brackets
38
Note that the average effect predicted for the whole sample based on child, parent and home environment characteristics and prior attainment is designed to be zero. 39
Note that for the ‘Anti-social / Worried’ outcome an effect significantly above expectation indicates a reduction in anti-social / worried behaviour. Likewise, an effect significantly below expectation indicates an increase in anti-social / worried behaviour.

34
The number of children per centre is a crucial factor that affects the identification of statistically significant outliers. Where the number of children is small, the confidence limits for value added residual estimates of individual centre effects are wider. Therefore, as some pre-school centres have small numbers of children in the study, the number of centres identified as outliers is likely to be a conservative estimate of the extent of any ‘real’ differences. Moreover, as the number of children per centre (see Table 1.1 for mean number) is largest for nursery schools, integrated centres and nursery classes, the chances of identifying statistically significant differences are likely to be somewhat higher for these types of provision. In terms of correlations between value added residuals across all centres, the results in Table 3.6 show there is generally a moderately high, statistically significant, association between residual estimates of centre effects on social behavioural developmental gains over the pre-school period. As expected, the correlations between the fourth factor ‘Anti-Social / Worried’ and the other factors are negative (statistically significant). The strongest correlation is between ‘Independence & Concentration’ and ‘Co-operation & Conformity’. The similarity of centre effects on different aspects of social behavioural development is somewhat stronger than those found for the different aspects of cognitive progress over the pre-school period. Tables 3.7 – 3.9 show pictorially the relationship between the 141 pre-school centres’ value added residuals for different combinations of outcomes. For example, the cross tabulation of pre-school centre effects for the ‘Independence & Concentration’ and ‘Co-operation & Conformity’ outcomes (Table 3.7) reveals that 74 per cent of the pre-school centres in the EPPE sample have the same ‘effectiveness’ category for the two outcomes. In the other centres, different levels of effectiveness for the two outcomes are found. This demonstrates that internal variations in EPPE pre-school centres’ effectiveness across the four social behavioural outcomes do exist although to a lesser degree than for the cognitive outcomes reported in EPPE Technical Paper 8a. Table 3.6 Correlations between pre-school centre effects across four social behavioural outcomes
Independence & Concentration
Co-operation & Conformity
Peer Sociability Anti-social / Worried
Independence & Concentration
1.00** 0.76** 0.61** -0.50**
Co-operation & Conformity
1.00** 0.54** -0.65**
Peer Sociability 1.00** -0.20*
** Statistically significant at the 0.01 level * Statistically significant at the 0.05 level

35
Table 3.7 Cross tabulation of pre-school centre effects for the outcomes ‘Independence & Concentration’ and ‘Co-operation & Conformity’
‘Co-operation & Conformity’
Above expectation
(95% significance)
Above expectation
(68% significance)
As expected
Below expectation
(68% significance)
Below expectation
(95% significance) Independence
& Concentration
Above expectation (95% significance)
3 (2.1%) 1 (0.7%)
Above expectation (68% significance)
1 (0.7%) 11 (7.7%) 3 (2.1%)
As expected
1 (0.7%) 6 (4.2%) 81 (57.4%) 12 (8.5%)
Below expectation (68% significance)
12 (8.5%) 6 (4.2%) 1 (0.7%)
Below expectation (95%significance)
3 (2.1%)
Percentages given in brackets Table 3.8 Cross tabulation of pre-school centre effects for the outcomes ‘Independence & Concentration’ and ‘Peer Sociability’
Peer
Sociability
Above expectation
(95% significance)
Above expectation
(68% significance)
As expected Below expectation
(68% significance)
Below expectation
(95% significance) Independence &
Concentration
Above expectation (95% significance)
1 (0.7%) 2 (1.4%) 1 (0.7%)
Above expectation (68% significance)
2 (1.4%) 4 (2.8%) 9 (6.3%)
As expected
1 (0.7%) 12 (8.5%) 78 (55.3%) 9 (6.4%)
Below expectation (68% significance)
13 (9.3%) 3 (2.1%) 3 (2.1%)
Below expectation (95%significance)
3 (2.1%)
Percentages given in brackets
Table 3.9 Cross tabulation of pre-school centre effects for the outcomes ‘Peer Sociability’ and ‘Anti-social / Worried’
40
Anti-social / Worried
Above expectation
(95% significance)
Above expectation
(68% significance)
As expected Below expectation
(68% significance)
Below expectation
(95% significance) Peer Sociability
Above expectation (95% significance)
1 (0.7%) 3 (2.1%)
Above expectation (68% significance)
1 (0.7%) 3 (2.1%) 14 (10.0%)
As expected
14 (9.9%) 74 (52.5%) 10 (7.1%) 3 (2.1%)
Below expectation (68% significance)
3 (2.1%) 8 (5.7%) 2 (1.4%) 2 (1.4%)
Below expectation (95%significance)
1 (0.7%) 2 (1.4%)
Percentages given in brackets
40
Note that for the ‘Anti-social / Worried’ outcome an effect significantly above expectation indicates a reduction in anti-social / worried behaviour. Likewise, an effect significantly below expectation indicates an increase in anti-social / worried behaviour.
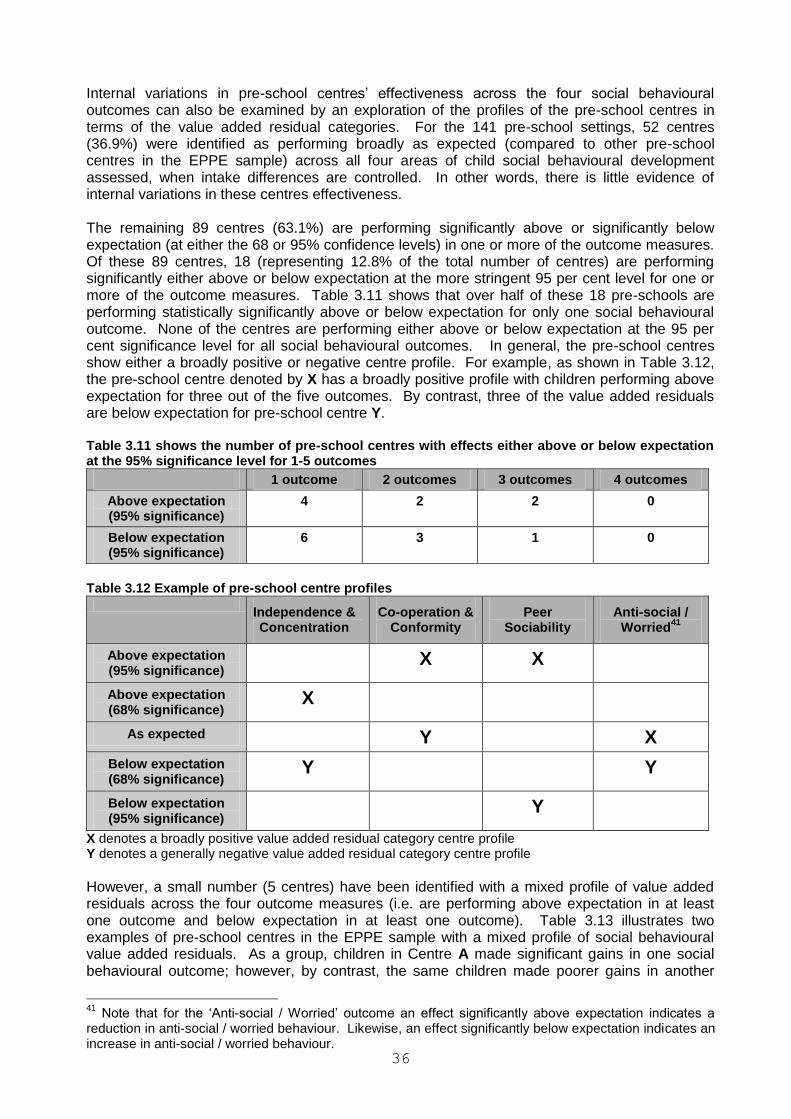
36
Internal variations in pre-school centres’ effectiveness across the four social behavioural outcomes can also be examined by an exploration of the profiles of the pre-school centres in terms of the value added residual categories. For the 141 pre-school settings, 52 centres (36.9%) were identified as performing broadly as expected (compared to other pre-school centres in the EPPE sample) across all four areas of child social behavioural development assessed, when intake differences are controlled. In other words, there is little evidence of internal variations in these centres effectiveness. The remaining 89 centres (63.1%) are performing significantly above or significantly below expectation (at either the 68 or 95% confidence levels) in one or more of the outcome measures. Of these 89 centres, 18 (representing 12.8% of the total number of centres) are performing significantly either above or below expectation at the more stringent 95 per cent level for one or more of the outcome measures. Table 3.11 shows that over half of these 18 pre-schools are performing statistically significantly above or below expectation for only one social behavioural outcome. None of the centres are performing either above or below expectation at the 95 per cent significance level for all social behavioural outcomes. In general, the pre-school centres show either a broadly positive or negative centre profile. For example, as shown in Table 3.12, the pre-school centre denoted by X has a broadly positive profile with children performing above expectation for three out of the five outcomes. By contrast, three of the value added residuals are below expectation for pre-school centre Y. Table 3.11 shows the number of pre-school centres with effects either above or below expectation at the 95% significance level for 1-5 outcomes
1 outcome 2 outcomes 3 outcomes 4 outcomes
Above expectation (95% significance)
4 2 2 0
Below expectation (95% significance)
6 3 1 0
Table 3.12 Example of pre-school centre profiles
Independence & Concentration
Co-operation & Conformity
Peer Sociability
Anti-social / Worried
41
Above expectation (95% significance)
X X
Above expectation (68% significance)
X
As expected Y X
Below expectation (68% significance)
Y Y
Below expectation (95% significance)
Y
X denotes a broadly positive value added residual category centre profile Y denotes a generally negative value added residual category centre profile
However, a small number (5 centres) have been identified with a mixed profile of value added residuals across the four outcome measures (i.e. are performing above expectation in at least one outcome and below expectation in at least one outcome). Table 3.13 illustrates two examples of pre-school centres in the EPPE sample with a mixed profile of social behavioural value added residuals. As a group, children in Centre A made significant gains in one social behavioural outcome; however, by contrast, the same children made poorer gains in another
41
Note that for the ‘Anti-social / Worried’ outcome an effect significantly above expectation indicates a reduction in anti-social / worried behaviour. Likewise, an effect significantly below expectation indicates an increase in anti-social / worried behaviour.
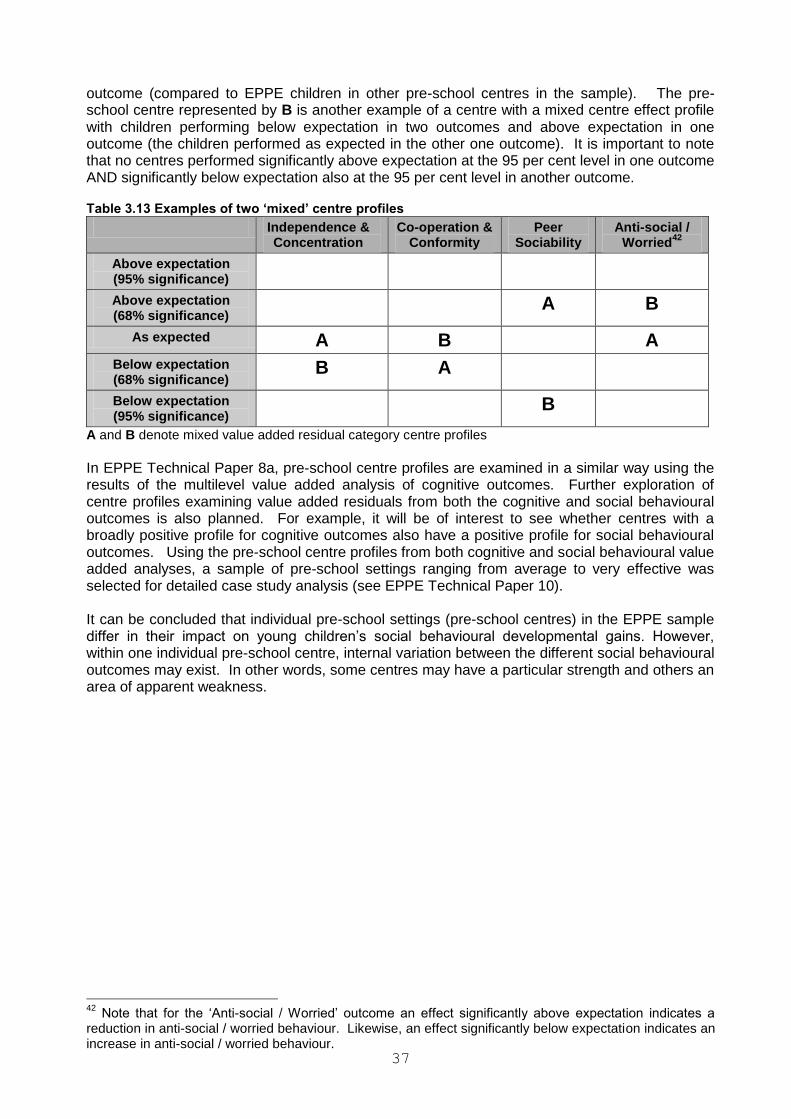
37
outcome (compared to EPPE children in other pre-school centres in the sample). The pre-school centre represented by B is another example of a centre with a mixed centre effect profile with children performing below expectation in two outcomes and above expectation in one outcome (the children performed as expected in the other one outcome). It is important to note that no centres performed significantly above expectation at the 95 per cent level in one outcome AND significantly below expectation also at the 95 per cent level in another outcome. Table 3.13 Examples of two ‘mixed’ centre profiles
Independence & Concentration
Co-operation & Conformity
Peer Sociability
Anti-social / Worried
42
Above expectation (95% significance)
Above expectation (68% significance)
A B
As expected A B A
Below expectation (68% significance)
B A
Below expectation (95% significance)
B
A and B denote mixed value added residual category centre profiles
In EPPE Technical Paper 8a, pre-school centre profiles are examined in a similar way using the results of the multilevel value added analysis of cognitive outcomes. Further exploration of centre profiles examining value added residuals from both the cognitive and social behavioural outcomes is also planned. For example, it will be of interest to see whether centres with a broadly positive profile for cognitive outcomes also have a positive profile for social behavioural outcomes. Using the pre-school centre profiles from both cognitive and social behavioural value added analyses, a sample of pre-school settings ranging from average to very effective was selected for detailed case study analysis (see EPPE Technical Paper 10). It can be concluded that individual pre-school settings (pre-school centres) in the EPPE sample differ in their impact on young children’s social behavioural developmental gains. However, within one individual pre-school centre, internal variation between the different social behavioural outcomes may exist. In other words, some centres may have a particular strength and others an area of apparent weakness.
42
Note that for the ‘Anti-social / Worried’ outcome an effect significantly above expectation indicates a reduction in anti-social / worried behaviour. Likewise, an effect significantly below expectation indicates an increase in anti-social / worried behaviour.

38
Section 4: Accounting for Pre-school Centre Effects on Children’s Social Behavioural Development An important aim of the EPPE research is to establish whether particular features of pre-school settings are related to children’s progress or social behavioural development. In this paper, the focus is on social behavioural outcomes. Observational data on the quality of pre-school centres environments was obtained using the Early Childhood Environment Rating Scale and the English Extension (ECERS-R and ECERS-E) and the Caregiver Interaction Scale instruments (for further details see EPPE Technical Paper 6a). In addition, type of pre-school setting is an important feature given diversity in pre-school provision in England. The EPPE study therefore also has the further aim of examining whether there are systematic variations in centre effectiveness for the six types of provision included in the sample of 141 centres. Given the links between quality and type of provision identified elsewhere (see EPPE Technical Papers 5 and 6), the relationships between staff qualification levels and effectiveness is also explored. For each of the four social behavioural outcomes collected at primary school entry, the possible influence of a number of process measures related to pre-school experience were tested. Process measures were included in the complex value added models to explore any statistically significant relationship with child social behavioural outcomes. It should be noted that the models adopted control for age, change of centre, significant prior social behavioural factors and all child, parent and home learning environment measures found to be significant predictors in the complex value added models described in Section 3 of this report. These analyses include all children in the EPPE sample with pre-school centre experience. Pre-School Type The five regions in EPPE were strategically chosen to represent urban, suburban, and rural areas and also to include neighbourhoods with social and ethnic diversity. All local authorities in the EPPE sample were divided into five sampling areas, usually geographic divisions that already existed. Official lists of playgroups, nursery classes, nursery schools, private day nurseries, social services/voluntary day nurseries, and nursery schools combining care and education were obtained with the help of the local early years co-ordinators in every authority. Within each sampling area, one of each type of provision was randomly selected, yielding approximately 25 centres of various types in each region. Some over and under-sampling occurred in each category of provision because not all authorities had sufficient numbers of local authority day nurseries. Summary of the different types of provision For the main analysis pre-schools were divided into six types.
1. Local Education Authority nursery classes (n=25) These are part of primary schools, have an adult:child ratio of 1:13, (one in every two adults is normally a 4 year graduate qualified teacher and the other adult usually has had 2 years child care training) and usually offer only half-day sessions in term time, 5 days/week.
2. Voluntary playgroups and/or pre-schools (n=34)
These have an adult:child ratio of 1:8, (training of adults is variable from none to graduate level. The most common type of training is based on short Pre-school Learning Alliance courses). All offer sessional provision in term time. Many children attend fewer then 5 sessions/week. Playgroups usually have fewer resources (facilities, materials and sole use of space) than other types of centres.
3. Private day nurseries (n=31)
These have an adult:child ratio of 1:8, (normally the adults have a two year child care training, but some have less training). All offer full day care for payment.
39
4. Local authority (day care) centres (n=24) These came from the social services day care tradition, although in recent years many
have come under the authority of the LEA. Thirteen in this group combined care and education with one teacher per centre or a peripatetic teacher shared with other centres. 11 centres have not officially incorporated education into care. The ratio is 1:8, (normally the adults have two years child care training. The combined centres have a small input from a teacher), and all offer full day care.
5. Nursery schools (n=20)
These are ‘traditional’ nursery schools under the LEA with adult:child ratios of 1:13, (the headteacher would be a 4 year graduate qualified teacher with an early years background, other staff would have similar training to nursery classes employees, usually a trained teacher and classroom assistant in each class), usually offering half-day provision. One in this group was an ‘Early Excellence Centre’.
6. Integrated centres (also known as combined centres). In the sample these are former
nursery schools combining education and care (n=7) These are similar to nursery schools but have developed their provision of extended care to include full day care and parent involvement. They would have statutory adult:child ratio of 1:13, although many negotiated more generous ratios reflecting their additional care provision (staffing would be the same as nursery schools for the over 3s). Even though these centres were chosen as a stratified random sample four in this group were ‘Early Excellence Centres’.
Multilevel analyses were used to test the impact of pre-school type on children’s developmental gains in four aspects of social behaviour over the pre-school period. The full range of type of pre-school comparisons43 for the four social behavioural outcomes is shown in Table 4.1. Only significant effects between types of pre-school provision are reported. For example, in terms of developmental gains in ‘Co-operation & Conformity’ during the pre-school period, the analyses shows that there is a statistically negative effect associated with children who attended playgroups, private day nurseries and local day authority nurseries compared to children who attended nursery classes. These effects are after controlling for a wide range of child, parent, family, home environment and other pre-school characteristics. Note that a high score on ‘Independence & Concentration’, ‘Co-operation & Conformity’ and ‘Peer Sociability’ relates to more positive developmental gains whereas higher scores on ‘Anti-social / Worried’ relate to worsening anti-social / worried behaviour over the pre-school period. The social behavioural measure ‘Independence & Concentration’ shows no statistically significant differences according to type of provision. It should be noted that there are major difficulties in identifying any clear effects for playgroups because there is a confounding of change and type of pre-school provision.44
43
For the variable ‘types of provision’, the analysis has been repeated using each type of provision as the comparison group. In this way it is possible to establish with greater certainty the extent to which progress varies for children attending different types of provision. 44
See Table 1.2 in Section 1 illustrating number and percentage of children changing pre-school centre before school entry by type of provision.

40
Table 4.1 Impact of type of provision on children’s social behavioural development gains (using the complex value added models)
Co-operation & Conformity
Peer Sociability Anti-Social / Worried
Compared to Integrated Centres
Nursery classes
Playgroups
Private day nurseries
LA day care
Nursery schools
negative
negative
negative
Compared to Nursery Classes
Playgroups
Private day nurseries
LA day care
Nursery schools
Integrated centres
negative
negative
negative
negative
negative
positive (worse)
positive (worse)
Compared to Playgroups
Nursery classes
Private day nurseries
LA day care
Nursery schools
Integrated centres
positive
positive
positive
Compared to Private Day Nurseries
Nursery classes
Playgroups
LA day care
Nursery schools
Integrated centres
positive
positive
negative (better)
negative (better)
Compared to LA Day Care
Nursery classes
Playgroups
Private day nurseries
Nursery schools
Integrated centres
positive
positive
positive
negative (better)
negative (better)
Compared to Nursery Schools
Nursery classes
Playgroups
Private day nurseries
LA day care
Integrated centres
positive (worse)
positive (worse)
Types of provision effects were identified for several social behavioural outcomes, in line with findings for cognitive outcomes. The results suggest differences on the factor ‘Co-operation & Conformity’ where children in nursery classes and integrated centres (i.e. combined centres) made more developmental gains. The difference is statistically significant when nursery classes and integrated centres are compared to playgroups, private day nurseries and local authority day nurseries. It appears that nursery classes show a positive impact for ‘Peer Sociability’ compared with playgroups and local authority day nurseries.

41
There are indications that poorer outcomes in terms of the factor ‘Anti-social / Worried’ behaviour (i.e. a worsening of anti-social / worried behaviour) are associated with both private and LA day care nurseries. These differences are statistically significant in comparison with nursery classes and nursery schools. The two groups of children (private day nursery and LA Day Care) differ from the rest of the sample in that proportionately more of them started at their pre-school target centre before 3 years of age and this was associated with increased incidence of anti-social / worried behaviour at age 3 (see EPPE Technical Paper 7). (It is also important to note that children attending nursery classes, nursery schools and integrated centres may previously have had daycare experience from an early age in other centres and other types of provision.) It should be noted that age at start of target pre-school is not found to be significant in accounting for change in any measure of social behavioural development over the pre-school period and therefore this measure is not controlled for in the complex value added models (for descriptive statistics on the age at start of target pre-school variable, see Table 4.2). Table 4.2 Age at start of target pre-school to according to pre-school type
n of children
mean sd min max n of centres
Nursery class 588 43.9 4.0 28.1 52.0 25
Playgroup 609 34.0 3.8 21.4 50.5 34
Private day nursery 516 25.5 12.1 1.2 51.3 31
LA day care 433 26.2 11.9 1.0 50.1 24
Nursery school 519 43.5 4.1 35.2 52.3 20
Integrated centre 192 34.0 10.0 3.3 49.8 7
All 2857 35.0 11.0 1.0 52.3 141
There is also a degree of variation in the effectiveness of individual centres within most types of provision. In terms of the social behavioural outcomes, although the number of outlier centres are small, centres performing statistically above expectation were proportionately more likely to be drawn from nursery classes and integrated centres whereas proportionately more of the centres performing below expectation were playgroups. In addition, the mean pre-school centre effects (i.e. value added residuals) by pre-school type can be examined (see Table 4.3). The results generally mirror the findings above. Table 4.3 Mean pre-school centre effects by pre-school type
Independence& Concentration
Co-operation & Conformity
Peer Sociability
Anti-Social / Worried
Nursery classes 0.02 0.04 0.05 -0.01
Playgroups -0.01 -0.01 -0.02 -0.01
Private day nurseries -0.01 -0.02 0.00 0.02
LA day care -0.01 -0.02 -0.02 0.03
Nursery schools 0.01 0.00 -0.01 -0.03
Integrated centres 0.04 0.08 -0.01 -0.02
Note that the average predicted for the whole sample based on child, parent and home environment characteristics and prior attainment is designed to be zero.
Quality Characteristics (in terms of ECERS-R and ECERS-E) Two rating scales were used in EPPE to assess the quality of pedagogy, curriculum and resources. The American Early Childhood Environment Rating Scale (ECERS-R) (Harms et al, 1998) is based on a child-centred pedagogy and also assesses resources for indoor and outdoor play45. The English rating scale ECERS-E (Sylva et al, 1999d) was intended as a supplement to
45
ECERS-R subscales relate to Space and Furnishings, Personal Care Routines, Language and Reasoning, Activities (pre-school activities), Social Interaction, Programme Structure and Parents and

42
the ECERS-R and was developed especially for the EPPE study to reflect the Desirable Learning Outcomes46 and more importantly the Curriculum Guidance for the Foundation Stage which at the time was in trial stage. This scale focuses squarely on three curricular areas (Literacy, Numeracy, Science / Knowledge of the world) and on Diversity of provision for children of different abilities, gender and cultures. All ECERS observations were carried out in each of the 141 centres in the period May 1998 – June 1999. EPPE Technical Paper 6 and 6a give full details of the range in centres’ characteristics as measured by these scales. It was found that there was substantial variation between centres of the same type (within-type variation) and also significant variation between types of provision in these measures of quality of pre-school provision. In general, the quality characteristics of playgroups and private day nurseries were found to be lower than those of other forms of provision in the two ECERS instruments. The highest average ECERS scores were found for integrated centres and nursery schools (see EPPE Technical Paper 6). Table 4.4 reports a summary of results. Two overall measures of quality characteristics were tested in the multilevel analysis of centre effects, i.e. a centre’s average total score on the ECERS-R and on the ECERS-E scale. Only significant effects are reported. For example, in terms of ‘Co-operation & Conformity’, the analyses shows that there is a statistically positive effect associated with the average total ECERS-R score after controlling for a wide range of child, parent, family, home environment and other pre-school characteristics. In addition, the impacts of individual ECERS-R and ECERS-E subscales47 were analysed and the results are also summarised in Table 4.4. Note that a high score on ‘Independence & Concentration’, ‘Co-operation & Conformity’ and ‘Peer Sociability’ relates to more positive outcomes whereas higher scores on ‘Anti-social / Worried’ relate to worse anti-social / worried behaviour. Table 4.4 Impact of quality of provision (as measured by ECERS-R and ECERS-E) on children’s social behavioural developmental gains (using the complex value added models)
Independence & Concentration
Co-operation & Conformity
Peer Sociability
Anti-Social / Worried
ECERS-E average total positive#
positive#
ECERS-E subscale: literacy
positive#
ECERS-E subscale: maths
ECERS-E subscale: science/envir
positive#
ECERS-E subscale: diversity
positive# positive
#
ECERS-R average total positive
ECERS-R subscale: space & furnishings
negative#(better)
ECERS-R subscale: personal care routines
ECERS-R subscale: language and reasoning
positive
ECERS-R subscale: pre-school activities
ECERS-R subscale: social interaction
positive positive positive#
ECERS-R subscale: organisation & routine
ECERS-R subscale: adults working together
# verging on statistical significance
Staffing (adults working together) 46
Desirable Learning Outcomes have since been replaced by the Early Learning Goals 47
See EPPE Technical Papers 6 and 6a for further details on ECERS-R and ECER-E subscales.

43
To summarise, the results show that:
There is no statistically significant relationship between children’s developmental gains in three aspects of social behaviour - ‘Independence & Concentration’, ‘Peer Sociability’ and ‘Anti-Social / Worried’ - over the pre-school period and the pre-school centre’s average total ECERS-R score.
The pre-school centre’s average total ECERS-R score shows a positive relationship in terms of children’s developmental gains over the pre-school period for ‘Co-operation & Conformity’.
There is no statistically significant relationship between children’s developmental gains in ‘Peer Sociability’ or increase in ‘Anti-social / Worried’ behaviour over the pre-school period and the pre-school centre’s average total ECERS-E score (effects are weakly positive but non significant).
The pre-school centre’s average total ECERS-E score shows a positive relationship (verging on statistical significance) in terms of children’s developmental gains over the pre-school period in ‘Independence & Concentration’ and ‘Co-operation & Conformity’.
The ECERS-R subscale ‘Social Interaction’48 shows a statistically significant positive relationship with centre effects on both ‘Co-operation & Conformity’ and ‘Independence & Concentration’, and verges on the significant for ’Peer Sociability’. Charts D.2 and D.4 show illustratively effect sizes for continuous predictor variables included in these complex value added models. For both ‘Independence & Concentration’ and ‘Co-operation & Conformity’, the effect size for the ECERS-R ‘Social Interaction’ subscale is not surprisingly smaller than the effect sizes associated with prior social behavioural development at age 3, but larger than the effect size for age at entry to the study assessment point. It should be noted that effect sizes for continuous measures might appear modest but generally apply to all children in the sample (in contrast to those for some categorical predictors that apply to very small sub-groups).
The ECERS-R subscale ‘Language & Reasoning’ shows a statistically significant positive relationship with greater gains in ‘Co-operation & Conformity’.
The ECERS-R subscale ‘Space & Furnishings’ shows a favourable association (verging on statistical significance) with a reduction in ‘Anti-social / Worried’ behaviour. This suggests that where provision for the physical environment is better, a decrease in ‘Anti Social / Worried’ behaviour is shown. This subscale includes indoor space and space for gross motor play amongst other aspects.
None of the ECERS-E subscales show a statistically significant relationship with children’s social behavioural development, though several are positive and verge on significance (e.g. the ‘Diversity’ subscale49 with both ‘Independence & Concentration’ and ‘Co-operation & Conformity’).
Quality is not a universal concept but depends on national curricula and cultural priorities. The ‘outcomes’ deemed important in children’s development will relate in different ways to different measures of quality. In terms of social behavioural development over the pre-school period, ECERS-R findings for average total score and the individual subscales suggest that certain aspects of environmental quality, measures of 'social interaction' and 'language and reasoning' in particular, have a positive impact on children’s social behavioural development, especially for ‘Co-operation & Conformity’. In EPPE Technical Paper 8a, relationships with cognitive outcomes are reported. As might be anticipated, the ECERS-E measures given their focus on specific curricular areas show a stronger positive impact on cognitive progress.
48
The ECERS-R ‘Social Interaction’ subscale includes a strong emphasis upon staff showing respect to children, listening to what they say, and responding sympathetically. 49
The ECERS-E ‘Diversity’ subscale includes items on individual learning needs, gender equity and multicultural education.

44
Quality Characteristics (in terms of Caregiver Interaction Scale) Additional measures of pre-school quality are provided by the Caregiver Interaction Scale (CIS) (Arnett, 1989). This scale of adult-child interaction is completed after sustained period of observation with the 26 items forming 4 subscales: ‘Positive relationships’, ‘Permissiveness’, ‘Punitiveness’ and ‘Detachment’. - Positive relationships is a subscale made up of 10 items indicating warmth and enthusiasm
interaction with children by the caregiver. - Punitiveness is a subscale made up of 8 items indicating harsh or over-controlling behaviour in
interaction with children by the caregiver. - Permissiveness is a subscale made up of 4 items indicating avoidance of discipline and control
of children by the caregiver. - Detachment is a subscale made up of 4 items indicating lack of involvement in interaction with children by the caregiver. Comparing the ECERS-R / ECERS-E scales and the Caregiver Interaction Scale, there are significant associations between centres in terms of these two separate measures of quality. For example, the overall correlations between the Caregiver Interaction Scale ‘Positive relationships’ and the ECERS-R subscale ‘Language reasoning’ is 0.64, and with ‘Social Interaction’ 0.68 (for more details, see Table D.1 in Appendix D). Table 4.5 reveals that the behaviour of staff in pre-school centres varies significantly in terms of ‘Positive relationships’, ‘Permissive’ and ‘Detachment’. Integrated centres, followed by nursery classes and nursery schools score more highly in terms of the Caregivers Interaction Scale measure of ‘Positive relationships’. Playgroups score least well on this scale, and show higher mean scores on the ‘Detachment’ and ‘Permissiveness’ scale (negative aspects of adult-child interactions) followed by LA day care nursery. Table 4.5 Mean Arnett factors by pre-school type
Nursery Classes
Playgroups Private Day Nurseries
LA Day Care
Nursery Schools
Integrated centres
Positive 3.50 2.94 3.20 3.25 3.45 3.67
Permissive 1.30 1.62 1.49 1.59 1.44 1.31
Detachment 1.26 1.66 1.53 1.47 1.24 1.08
Note that ‘Punitiveness’ did not differ by pre-school type so is not included in the table
The multilevel analyses reveal that different areas measured by the Caregiver Interaction Scale instrument show a significant relationship with developmental gains in three of the social behavioural outcomes. Table 4.6 provides a summary of results with only significant effects reported; positive denoting a positive significant effect and negative shows a negative significant effect. Children who attend pre-school centres that score highly on the ‘Positive relationships’ scale made on average more developmental gains in ‘Independence & Concentration’, ‘Co-operation & Conformity’ and ‘Peer Sociability’. The other scales which provide measures of less favourable types of adult-child interaction (i.e. ‘Detachment’, ‘Permissive’ and ‘Punitive’) by contrast show a significant negative impact on certain aspects of children’s social behavioural development over the pre-school period.

45
Table 4.6 Impact of quality of provision as measured by the Caregivers Interaction Scale on children’s social behavioural developmental gains (using the complex value added models)
Independence & Concentration
Co-operation & Conformity
Peer Sociability Anti-Social / Worried
Positive positive
positive positive
Punitiveness negative
Permissive negative negative
Detachment negative# negative
# verging on statistical significance
The analyses of both ECERS and Caregiver Interaction Scale measures indicate that aspects of pre-school centre quality vary significantly both between individual centres and by type of provision (see EPPE Technical Paper 6a). The multilevel analyses reported here also demonstrate that process measures of observed pre-school centre quality are statistically significant predictors of changes in young children’s social behavioural development over the pre-school period. To summarise, better quality of provision is associated with a positive impact on several different aspects of social behaviour. These findings on the importance of quality for social behaviour are in line with those reported elsewhere (EPPE Technical Paper 8a) on cognitive progress. Taken together they indicate that young children who attend pre-school settings with higher quality characteristics tend to make more cognitive progress and show better social behavioural development, and thus are better prepared for the start of primary school. Staff Qualifications Information was collected as part of the Centre Manager’s Interview about the numbers, qualifications and hours worked by staff of the pre-schools in the EPPE study (for further details about the characteristics of centres from these interviews see EPPE Technical Paper 5). In order to explore the impact of staff qualifications a number of measures were constructed from these data. Centres were categorised according to the percentage of unqualified, Level 2, Level 3-4, and Level 5 staff hours using classifications based on the “Early Years Education, Childcare and Playwork: A frame of nationally accredited qualifications” (QCA, 1999) classification scheme. The study of staff qualification levels is complicated at the centre level because staff vary in their qualifications and also in the hours they work with children (contact time). Therefore, the percentage of total staff time (hours) at different levels of qualification was calculated for each centre. Quality characteristics (both overall ECERS-E and ECERS-R and subscales) also show a significant link with centre managers’ qualification levels (see EPPE Technical Paper 6). Further analyses of additional observational measures of quality (the Caregiver Interaction Scale subscales described above) also show a statistically significant link with level of centre managers’ qualifications. Centres where managers had higher qualification levels scored significantly higher in caregivers’ interactions with children in terms of ‘Positive relationships’, and lower in terms of ‘Detachment’ and ‘Permissiveness’. (See Chart D.5 in Appendix D.) Overall, a significant relationship between the percentage of level 550 staff’s contact time and centres’ scores on these three Arnett scales was identified. This finding is in accord with that for centre managers’ qualification levels and ECERS measures of environmental quality. Therefore, we can conclude that higher levels of centre manager and staff qualifications are associated with more positive aspects of adult-child interaction and negatively associated with less favourable indicators of adult-child interaction (for further details of the classification of and extent of variations between types of provision in measures of centre manager and staff qualifications see EPPE Technical Paper 5). There are indications that higher staff qualifications (i.e. trained teachers) have some impact in promoting young children’s social behavioural development. Children who attended centres
50
Level 5 includes QTS via PGCE, BEd, Cert Ed and DipEd.

46
where proportionately more staff time were at level 5 (50-100% of staff hours) showed a positive relationship in ‘Co-operation & Conformity’ and reductions in ‘Anti-social / Worried’ behaviour. In addition, higher proportions of staff hours with relatively low-level qualifications (level 2) were associated with poorer outcomes for ‘Peer Sociability’ and ‘Co-operation & Conformity’. The relationship between qualifications and young children’s social behavioural development is likely to be related with and to the influence of centre type and quality, because of the different patterns of staff recruitment in different types of settings. It is suggested that staff qualification levels probably have an indirect effect on children’s development through their association with better quality of pre-school provision, although staff with level 5 qualifications may have a better knowledge of young children’s social behavioural development and this may lead to improved adult-child interactions and communication. Ratios It is very difficult to study the effects of ratio as a stand-alone variable in existing British practice, without using an experimental study. Munton et al (2002) provide an example of a quasi-experimental study and provide further discussion of ratios and their relationships with staff qualifications and training in the early years. Complexities in measuring class size and ratios in reception classes and in Key Stage 1 have been described by Blatchford et al (2002a and b). The possible effects of ratio in EPPE are inevitably confounded with training, resources and pedagogical practices. Moreover, children from socio-economically disadvantaged and/or minority ethnic backgrounds were concentrated in LA day care and combined centres whereas children from more advantaged backgrounds were clustered in private day nurseries. The study has compared three kinds of information on staffing ratios in EPPE pre-school centres: 1) The statutory minimum levels (for when the EPPE children were in pre-school provision)51 The minimum staffing level across the 6 types of pre-school provision in the EPPE sample is not uniform. In playgroups, private day nurseries, local authority day care and the combined centres the ratios of 1 adult to 8 children in the age group 3-5 are laid down by the 1989 Children Act. This sets out the statutory levels of staffing which would enable a pre-school setting to comply with the appropriate Children Act inspection framework, which historically was undertaken by Social Services. All settings with children under three are required to have this inspection of care. In addition, after the introduction of the Desirable Learning Outcomes, the Government introduced an education inspection conducted by the Office for Standards in Education (OFSTED). In the other ‘educational’ forms of provision, nursery classes and nursery schools, the ratios are 1 adult to 13 children for three to five-year-olds, although in nursery schools it can quite often be as low as 1:10 because the head teacher has a major teaching function in addition to administration. These government ratios are determined by the Nursery Education Act (1996). Inspections are conducted by OFSTED but they are similar to school inspections. The integrated centres may differ from these arrangements i.e. if their local authority considers them as nursery schools, they can have the ‘education’ ratios. However, most integrated centre heads have negotiated lower ratios with their LA because they argue they need lower ratios to carry out the family support aspects of their work. Integrated centres are inspected under both social services and education frameworks. 2) Interview data from the centre managers’ interviews It was possible to calculate staffing levels from the managers’ reports of the number of children and staff in their centre. These figures did not necessarily reflect the usual number of children and adults in the centre at any one time and thus provide only a very limited guide to actual ratios usually experienced by children in the centres.
51
Note that social services inspections are now carried out by OFSTED in line with National Standards for Daycare. The requirement is for settings with children under eight to be inspected as daycare settings.
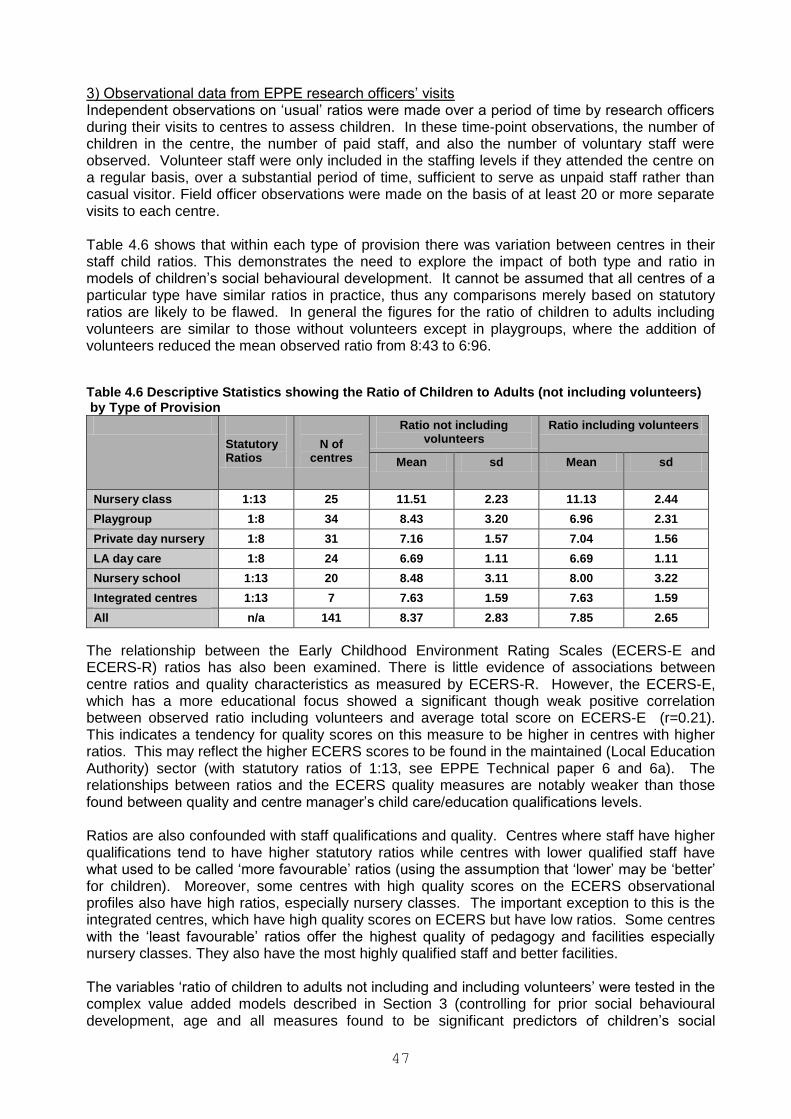
47
3) Observational data from EPPE research officers’ visits Independent observations on ‘usual’ ratios were made over a period of time by research officers during their visits to centres to assess children. In these time-point observations, the number of children in the centre, the number of paid staff, and also the number of voluntary staff were observed. Volunteer staff were only included in the staffing levels if they attended the centre on a regular basis, over a substantial period of time, sufficient to serve as unpaid staff rather than casual visitor. Field officer observations were made on the basis of at least 20 or more separate visits to each centre. Table 4.6 shows that within each type of provision there was variation between centres in their staff child ratios. This demonstrates the need to explore the impact of both type and ratio in models of children’s social behavioural development. It cannot be assumed that all centres of a particular type have similar ratios in practice, thus any comparisons merely based on statutory ratios are likely to be flawed. In general the figures for the ratio of children to adults including volunteers are similar to those without volunteers except in playgroups, where the addition of volunteers reduced the mean observed ratio from 8:43 to 6:96.
Table 4.6 Descriptive Statistics showing the Ratio of Children to Adults (not including volunteers) by Type of Provision
Statutory Ratios
N of centres
Ratio not including volunteers
Ratio including volunteers
Mean sd Mean sd
Nursery class 1:13 25 11.51 2.23 11.13 2.44
Playgroup 1:8 34 8.43 3.20 6.96 2.31
Private day nursery 1:8 31 7.16 1.57 7.04 1.56
LA day care 1:8 24 6.69 1.11 6.69 1.11
Nursery school 1:13 20 8.48 3.11 8.00 3.22
Integrated centres 1:13 7 7.63 1.59 7.63 1.59
All n/a 141 8.37 2.83 7.85 2.65
The relationship between the Early Childhood Environment Rating Scales (ECERS-E and ECERS-R) ratios has also been examined. There is little evidence of associations between centre ratios and quality characteristics as measured by ECERS-R. However, the ECERS-E, which has a more educational focus showed a significant though weak positive correlation between observed ratio including volunteers and average total score on ECERS-E (r=0.21). This indicates a tendency for quality scores on this measure to be higher in centres with higher ratios. This may reflect the higher ECERS scores to be found in the maintained (Local Education Authority) sector (with statutory ratios of 1:13, see EPPE Technical paper 6 and 6a). The relationships between ratios and the ECERS quality measures are notably weaker than those found between quality and centre manager’s child care/education qualifications levels. Ratios are also confounded with staff qualifications and quality. Centres where staff have higher qualifications tend to have higher statutory ratios while centres with lower qualified staff have what used to be called ‘more favourable’ ratios (using the assumption that ‘lower’ may be ‘better’ for children). Moreover, some centres with high quality scores on the ECERS observational profiles also have high ratios, especially nursery classes. The important exception to this is the integrated centres, which have high quality scores on ECERS but have low ratios. Some centres with the ‘least favourable’ ratios offer the highest quality of pedagogy and facilities especially nursery classes. They also have the most highly qualified staff and better facilities. The variables ‘ratio of children to adults not including and including volunteers’ were tested in the complex value added models described in Section 3 (controlling for prior social behavioural development, age and all measures found to be significant predictors of children’s social

48
behavioural gains). The results show no significant relationships between ratios and young children’s developmental gains over the pre-school period for any social behavioural outcome. It has been shown above that ratios vary in the EPPE study in systematic ways, in particular by type and quality. Therefore ratios, type and ECERS-R (a measure of quality) were all tested in the complex value added models. The results show that ratios, however measured, are not statistically significant predicators of young children’s social behavioural development, when type and quality are controlled. Amount of Pre-school Provision The amount of pre-school centre provision children have experienced can be measured in various ways. Firstly, the number of months over which a child attended pre-school (created by measuring the number of months from cognitive assessment date52 at entry to the EPPE study aged 3 plus to the start of primary school53) was tested. This indicator of ‘duration’ of pre-school (in terms of number of months) was not statistically significant in accounting for social behavioural developmental gains over the pre-school period in each of the four outcomes. The amount of pre-school provision can also be examined by an exploration of the number of sessions per week children were registered for at their pre-school settings and also the number of sessions attended over the pre-school period from the cognitive assessment date at entry to the EPPE study to leaving the target pre-school (Note, once again, the number of months at the target pre-school before the child entered the EPPE study is not included in either of these measures). These two measures were tested in the complex value added models reported in Section 3. The number of sessions per week children were registered for at their pre-school settings is generally considered a relatively crude indicator of amount of provision. Table 4.7 details the number of sessions per week for which children were registered at their target pre-school. As can be seen, no children in the EPPE pre-school experience sample were registered to attend only 1 session. The majority were registered to attend 5 sessions (44%) whilst 23 per cent were registered for 10 sessions a week. The mean number of sessions per week for which children are registered varied by type of provision with the highest providers generally being local authority day nurseries and the lowest playgroups (as shown in Table 4.8). It should be noted that some children will have changed the number of sessions per week they attended during the study and thus the number of sessions registered per week measure recorded at entry may not have applied throughout the pre-school period. In the value added multilevel analyses the social behavioural outcomes of children registered for 5 sessions were compared to those of children registered for 2-4 sessions and also children registered for 6-10 sessions. The results showed no significant link with social behavioural developmental gains for number of sessions a child was registered to attend at his or her centre, after control for prior social behaviour, change of centre and children’s background characteristics. Table 4.7 Number of Sessions per week for which Children were Registered at Entry to the Study
Numbers of sessions per week
2 3 4 5 6 7 8 9 10
n 209 283 254 1267 97 11 75 15 642
% 7.3% 9.9% 8.9% 44.4% 3.4% 0.4% 2.6% 0.5% 22.5%
Note that the number of sessions per week registered was not known for 4 children
52
The cognitive assessment date was chosen because ASBI assessments tended to be made after cognitive assessment, thus this date gives a clearer baseline for calculating ‘duration’. 53
Note that the number of months at the target pre-school before the child entered the EPPE study is not included in this duration measure.

49
Table 4.8 Mean Number of Sessions per week for which Children are Registered According to Pre-school Type
n of children mean sd n of centres
Nursery class 588 5.84 1.87 25
Playgroup 609 3.69 1.47 34
Private Day Nursery 513 5.29 2.67 31
LA Day Care 432 8.00 2.64 24
Nursery school 519 6.27 2.13 20
Integrated centre 192 6.89 2.35 7
All 2853 5.76 2.56 141
Note that the number of sessions per week registered was not known for 4 children
Attendance records are generally considered a better indication of quantity of pre-school provision than number of sessions registered per week, because holiday closures and absences are taken into account in the calculation. However, a limitation of the attendance variable used (which measures the total number of sessions attended over the pre-school period from the cognitive assessment date at entry to the EPPE study to leaving the target pre-school based on centre registers) is that attendance is only measured for the target pre-school centre. As reported in Table 1.2 in Section 1, just under a quarter of the sample (23.0%) moved from the target pre-school centres from which they were recruited at entry to the study during the pre-school period. Thus for these children who changed pre-school, the attendance measure only accounts for a proportion of their pre-school experience. Table 4.9 shows that children varied in their attendance by type of pre-school provision with the highest attenders generally being found in local authority day nurseries and the lowest playgroups (from which over half the children change target pre-school during the pre-school period). Those children who attended 130 or fewer sessions at the target pre-school were compared in the multilevel analyses to children who attended for 131-200 sessions, 201- 400 sessions and over 400 sessions54. The results of the analyses indicate that the measure of target pre-school centre attendance for over 400 sessions (since the cognitive baseline assessment date as children entered the EPPE study) showed a significant positive relationship with increases in anti-social / worried behaviour. In other words children who attended more sessions tended to exhibit more anti-social / worried behaviour. However, it is important to note that the 277 children showing this high level of attendance are predominantly in local authority and private day nurseries. Therefore, it is not possible to draw definitive conclusions that the impact of high levels of attendance is independent of type of provision. The results also indicated that children who attended between 131-200 pre-school sessions tended to have higher scores on the ‘Independence & Concentration’, ‘Co-operation & Conformity’ and ‘Peer Sociability’ outcomes compared with children who attended 130 or fewer sessions. As noted above, the attendance measure is confounded by type and mobility with playgroups showing more change than other types. Total number of sessions attended tends to be lower for those children who change centre. Unstable arrangements (usually playgroups) leading to artificially low attendance figures because such children often moved to other centres but no details of attendance at non-target pre-school centres were available. Hence it seems likely that the significant impact reported above for attendance on the social behavioural outcomes may be viewed as a conservative estimate of the effect of quantity of sessions of pre-school attended. The real relationship may well be stronger, but limitations of the data available may have diluted this association. 54
The number of children in these groups are as follows: 130 or fewer sessions n=957 (33.5%), 131-200 sessions n=715 (25.0%), 201-400 sessions n=613 (21.5%) and over 400 sessions n=277 (9.7%). Attendance information was not available from centre records for 295 children (10.3%).

50
Table 4.9 Attendance (mean total number of sessions at target centre during study period) by Pre-school Type
n of children mean sd n of centres
Nursery class 485 176.0 90.0 25
Playgroup 570 113.7 77.6 34
Private day nursery 490 245.8 164.9 31
LA day care 401 319.8 193.3 24
Nursery school 482 160.4 72.7 20
Integrated centre 134 263.5 157.6 7
All 2562 199.7 145.3 141
Note that attendance information was not known for 295 children Child Age at Start of Pre-school Centre Children who enter the target pre-school centre at an earlier age are mostly drawn from private day nurseries and local authority nurseries. Table 4.10 shows the mean age and distribution of children in terms of age in months at entry to target centres.
Table 4.10 Age in months at start of target pre-school to according to pre-school type
n of children
mean sd min max n of centres
Nursery class 588 43.9 4.0 28.1 52.0 25
Playgroup 609 34.0 3.8 21.4 50.5 34
Private Day Nursery 516 25.5 12.1 1.2 51.3 31
LA Day Care 433 26.2 11.9 1.0 50.1 24
Nursery school 519 43.5 4.1 35.2 52.3 20
Integrated centre 192 34.0 10.0 3.3 49.8 7
All 2857 35.0 11.0 1.0 52.3 141
Results in Technical Paper 7 show that an earlier age at entry to target pre-school is linked to higher social behavioural outcomes studied at age 3 years plus including higher anti-social scores. Analyses have been conducted to explore the impact of age starting in target pre-school in more detail. The categories tested are age at start of target pre-school under 24 months old, between 24 months to 30 months, between 30 months to 36 months and age at start of target pre-school 36 months or above.55 In terms of social behavioural development over the pre-school period measured by the value added models, the results show that a younger age at entry to target pre-school does not result in increased social behavioural development when prior social behavioural development is controlled. This is also the case in the contextualised models detailed in Section 2 when prior social behavioural development is not controlled (note that the conexteualised models in Section2 include all children in the EPPE sample with pre-school centre experience). Parental Involvement As part of the exploration of the contribution of parents to young children’s learning, the extent to which parents became involved with their child’s pre-school centre was investigated using various sources of data. From the centre managers’ interview, variables were constructed reflecting the frequency of parental visits to the centre, production of written materials for parents, parental education activities, parental involvement in meetings, staff opinions of the value of parental involvement and staff opinions on how well their centre caters for parents. Whilst information from these interviews cannot provide a complete and comprehensive measure of all aspects of ‘parental involvement’, it does give an indication of the perceptions of the centre
55
The number of children in these groups are as follows: age at start of target pre-school under 24 months old n= 360 (12.6%), between 24 months to 30 months n= 276 (9.7%), between 30 months to 36 months n= 703 (24.6%) and age at start of target pre-school 36 months or above = 1518 (53.1%).
51
managers in the EPPE study about the extent and nature of the contact they have with their parents. Those variables reflecting frequency of parental visits to the centres and parental involvement in meetings were significantly related to children’s social behavioural development over the pre-school period. Centres where these aspects of parental involvement were reported to be higher showed significant positive effects on developmental gains in ‘Independence and Concentration,’ Cooperation & Conformity’, and ‘Peer Sociability’ and reductions in anti-social/worried upset behaviour.

52
Section 5: The Impact of Pre-School Provision: Comparison of Home Children to Children who attended a Pre-school Centre In order to make comparisons of the cognitive attainment and social behavioural development of children who have had no or only minimal pre-school centre experience with those EPPE children who experienced pre-school provision, an additional sample of home children was included in the research. Home children were classified as those who had experienced less than 10 weeks at 2 sessions per week (i.e. less than 50 hours) of pre-school before entering school. It should be noted that home children may have had experience of toddler groups, childminders, nannies or other carers56 but no or only minimal pre-school institutional experience. This section presents the results of contextualised multilevel analyses establishing whether home children score less highly on the social behavioural factors at primary school entry than children who have had some form of pre-school experience, after controlling for the impact of any significant differences attributable to child, parent and home learning environment characteristics.
It had been hoped to recruit 500 home children during the first weeks of reception amongst children starting at primary schools that the main EPPE pre-school sample entered57. In practice the recruitment of home children proved very difficult. This is likely to be due to the increased access to, and take up of, pre-school provision (perhaps reflecting Government policy to expand pre-school provision since 1997 onwards). Many children recorded as having no pre-school centre experience on their school records were subsequently found at parental interview to have attended a centre and thus were not eligible for the home sample. It proved possible to identify just under 200 children from meeting the home child requirement from 10% of the primary schools which the EPPE children from target pre-school centres entered. A further 100+ home children were recruited from a small number of other primary schools. Amongst home children recruited, the main reasons reported in the parental interview for the child not having had any centre based pre-school experience were that there was no appropriate provision close to hand, no pre-school places available, the parent wanted to spend more time with the child or the child was ‘clingy’/unsettled58.
The mean number of EPPE children per primary school is 4 with a standard deviation of 5. In terms of numbers of children from the EPPE sample (both children with pre-school experience and home children), just under half of the primary schools only have one child, a sixth of the schools have two children and one school notably has 60 children (all home children). Chart E.1 in Appendix E shows the distribution of EPPE children (both with and without pre-school provision) in primary schools. EPPE Technical Paper 3 reported that some of the local authorities in the study, during the reconfiguration of their early years services, had found areas where there was a lack of early years provision or lack of knowledge about the provision that existed. Therefore some groups of children, and in two of the five regions especially minority ethnic groups, were over-represented in the ‘home’ category. The sample of ‘home’ children reflects this anomaly and this has led to clusters of ‘home’ children being recruited in some areas from particular schools, with an over-representation of minority ethnic groups. The EPPE home sample is probably therefore typical of the way in which ‘pockets’ of home children are unevenly distributed in some localities.
56
Childminders, nannies and informal carers may provide a stimulating learning environment but the study had no measures of this. Information about the home learning environment provided by parents was collected from parental interviews for all children in the sample. 57
The 2857 EPPE children with pre-school experience entered 770 different primary schools. 58
Other reasons related to the provision itself were that the provision did not fit parental work patterns, it was unaffordable or parents were unhappy with the level of hygiene. Additionally, a small number of parents wanted to teach their child at home, were housebound or felt that their child was too young to attend.

53
Characteristics of the Home Children Compared with Children who Attended a Pre-school Centre Table 5.1 provides descriptive statistics for the home children compared with children in the main EPPE sample who attended pre-school. As can be seen, home children differ considerably in some of their background characteristics from other EPPE children with pre-school education experience. For example, home children are more likely to be from ethnic minority groups, in particular Pakistani, with a higher proportion of children for whom English is an additional language recorded in the home child category. Furthermore, a considerably higher percentage of home children are from larger families and have mothers with no formal qualifications. A third of home children (compared with just over a fifth of children with pre-school experience) receive free school meals. However, it should be noted that the FSM data for reception aged children provides only a partial measure of socio-economic disadvantage since many young children have home dinners at this age and therefore do not take up their entitlement to this benefit. This is likely to be particularly marked for children from certain ethnic minority groups (e.g. Bangladeshi).
Table 5.1: The Characteristics of Home Children Compared with Children with Pre-school Experience
Children with Pre-school Experience
Home children
n % n %
Gender: male 1489 52.1 146 46.5
female 1368 47.9 168 53.5
Ethnicity* White UK 2127 74.5 168 53.5
White European 118 4.1 4 1.3
Black Caribbean 116 4.1 0 0
Black African 64 2.2 2 0.6
Black other 22 0.8 0 0
Indian 55 1.9 12 3.8
Pakistani 75 2.6 102 32.5
Bangladeshi 25 0.9 15 4.8
Chinese 5 0.2 0 0
Other 62 2.2 4 1.2
Mixed heritage 185 6.5 7 2.2
English as an additional language 249 8.7 118 38.2
Receiving free school meals 598 22.5 103 33.9
3 or more siblings 374 13.4 109 39.5
Mother has no formal qualification 501 18.1 146 57.0
Area East Anglia 559 19.6 91 29.0
Shire Counties 594 20.8 10 3.2
Inner London 656 23.0 11 3.5
North-east 503 17.6 75 23.9
Midlands 545 19.1 127 40.4
*not known excluded
The mean and standard deviation for the four social behavioural primary school entry factors are shown for both home children and the main EPPE pre-school sample in Table 5.2. It can be seen that on ‘Independence & Concentration’, ‘Co-operation & Conformity’ and ‘Peer Sociability’ the home children’s mean factor scores are lower than those of children with pre-school experience. As a group, therefore, children without pre-school experience show poorer social behavioural development in these outcomes than other children who attended pre-school. In

54
contrast, for the ‘Anti-social / Worried’ outcome, home children are rated slightly lower in their anti-social / worried behaviour by their teachers (note that the difference between raw ratings for this outcome between the home and pre-school groups is very small and smaller than raw differences on the other social behavioural outcomes). This suggests that home children may exhibit slightly less anti-social / worried behaviour at entry to primary school than EPPE children who experienced pre-school. However, without further analyses, it cannot be concluded that these lower factor scores are a direct result of lack of pre-school experience due to the different characteristics of the home child sample which are also likely to influence their social behavioural development. Nonetheless the data would suggest that there is an association that is worth further exploration to separate the impact of no pre-school centre experience from other factors. For further discussion of the impact of multiple disadvantage and risk of SEN for the home group compared with the EPPE children experiencing pre-school centre provision see Appendix F and EYTSEN59 Technical Paper 1.
Table 5.2: Descriptive Statistics of Primary School Entry Factors for Home Children Compared with Children who attended Pre-school
Children with Pre-school Experience
Home Children
n mean sd n mean sd
Independence & Concentration 2562 3.54 0.83 304 3.16 0.88
Co-operation & Conformity 2570 3.92 0.68 308 3.62 0.78
Peer Sociability 2568 3.65 0.71 308 3.12 0.84
Anti-social / Worried 2567 1.74 0.66 308 1.72 0.63
A Contextualised Analysis of the Home Children’s Social Behavioural Development at Primary School Entry Compared to Children who Attended a Pre-school Centre In order to explore in detail home children’s social behavioural development at entry to primary school, a strategy for analysis was employed where children with no pre-school provision were compared firstly to all children with pre-school provision as a group and then to children from six different types of pre-school provision included in the study. In addition, the impact of pre-school was also examined by comparing the social behavioural development of children with varying durations of pre-school provision. A categorical variable indicating pre-school centre provision versus no pre-school centre attended was added to the contextualised models described in Section 2. Table 5.3 shows the results of the multilevel analyses indicating that, after controlling for the impact of child, parent and home learning environments influences, home children remain at a social behavioural disadvantage in terms of ‘Independence & Concentration’, ‘Co-operation & Conformity’ and ‘Peer Sociability’ compared with children who have had pre-school experience. The findings reported in Table 5.3 suggest that there is no statistically significant difference between the home and pre-school groups in terms of ‘Anti-social / Worried’ behaviour. Table 5.3 shows that after controlling for the child, parent and home learning environments factors noted in Section 2, a child with pre-school experience attains on average for ‘Independence & Concentration’ a score 0.22 points higher than a child without such experiences. By way of comparison, having a mother with a degree, adds 0.26 score points on a child’s ‘Independence & Concentration’ rating compared to children whose mothers have no qualifications at all. Similarly, data for ‘Co-operation & Conformity’ reveal an estimate of 0.12 points increase for pre-school vs. home as compared with a 0.21 points increase for having a mother with a degree. Therefore, for ‘Co-operation & Conformity’, the effect of attendance at pre-school centre is statistically significant but somewhat smaller in terms of points score than a mother’s academic qualifications at degree level. Similarly, Chart E.2 in Appendix E shows
59
Early Years Transition and Special Educational Needs

55
illustratively the effect sizes for the categorical predictor variables for ‘Independence & Concentration’. Table 5.3: Multilevel results showing the effect of no pre-school provision on social behavioural development at primary school entry
Independence & Concentration
Co-operation & Conformity
Peer Sociability Anti-social / Worried
No pre-school centre provision
(compared to pre-school centre provision)
-0.217* (0.068)
-0.118* (0.057)
-0.359* (0.058)
-0.061 (0.056)
* Statistically significant at 0.05 level Standard error given in brackets
It is also of interest to examine the impact on children’s social behavioural development of no pre-school provision compared with the six different types of pre-school provision examined within the EPPE research. Thus, type of pre-school was added to the model with no pre-school provision as the comparison group. The results suggest that all types of pre-school provision compared to none show a positive significant relationship with better social behavioural development for ‘Independence & Concentration’ and ‘Peer Sociability’. Children that attend nursery classes, nursery schools and integrated centres show significantly higher factor scores in ‘Co-operation & Conformity’. It appears that only one type of provision shows a significant difference for anti-social / worried behaviour. Children who attended local authority day care show higher levels in this area in comparison with the home group (note that a high score on ‘Anti-social / Worried’ relates to worse in anti-social / worried behaviour). Table 5.4 reports the types of pre-school provision showing a positive, statistically significant (at the 0.05 level) impact on social behavioural development. Table 5.4: Multilevel results showing the effect of no pre-school provision compared to different types of pre-school provision on social behavioural development at primary school entry
Independence & Concentration
Co-operation & Conformity
Peer Sociability
Anti-social / Worried
Nursery Classes positive positive positive
Playgroups positive positive
Private Day Nurseries positive positive
LA Day Care positive positive positive(worse)
Nursery Schools positive positive positive
Integrated Centres positive positive positive
Statistically significant at 0.05 level
Additionally, the impact of pre-school provision can be explored by examining the ‘duration’ of pre-school (measured from date of entry to the target pre-school centre) using the following categories: - no pre-school centre experience i.e. home children (n=314) - up to 1 years pre-school experience (n=556) - 1-2 years pre-school experience (n=1095) - 2-3 years pre-school experience (n=774) - more than 3 years pre-school experience (n=290). Table 5.5 shows the results of the contextualised analysis of all EPPE children (home and those with pre-school experience) taking into account the above variables measuring the varying categories of ‘duration’ of pre-school in addition to child, parent and home environment factors discussed in Section 2. In general, the results show that children who have spent more time in pre-school have significantly better social behavioural development in these areas. The exception is for the ‘Anti-social / Worried’ outcome where children who attended for over three

56
years show significantly higher anti-social / worried behaviour. Chart 5.1 displays the effect sizes for the varying degrees of duration of pre-school centre experience, illustrating that the strongest effect is for the ‘Peer Sociability’ outcome. However, it is important to note that not all effects are statistically significant. Details of the statistical significance are shown in Table 5.5. Table 5.5 Multilevel results showing the impact of the net effect of varying categories of ‘duration’ of pre-school centre experience on social behavioural development at primary school entry after controlling for child, parent and home learning environment characteristics
Compared to no pre-school centre
experience i.e. home children
Independence & Concentration
Co-operation & Conformity
Peer Sociability Anti-social / Worried
< 1 yr pre-school
1-2 yrs pre-school
2-3 yrs pre-school
> 3 yrs pre-school
0.270* (0.075)
0.193* (0.070)
0.212* (0.073)
0.229* (0.084)
0.170* (0.063)
0.105 (0.059)
0.114 (0.061)
0.071 (0.071)
0.357* (0.065)
0.364* (0.061)
0.372* (0.064)
0.400* (0.072)
-0.031 (0.062)
0.079 (0.058)
0.099 (0.060)
0.148* (0.068)
* Statistically significant at 0.05 level
In summary, although as a group home children differ from the EPPE pre-school sample in terms of their background characteristics (being generally more disadvantaged), these differences do not fully account for differences in their social behavioural development. In other words, after controlling for the impact of child, parent and home learning environments influences, the gap in social behavioural development between home children and those who have had pre-school experience is not merely attributable to differences in the background characteristics of these two groups. In particular for the three outcomes ‘Independence & Concentration’, ‘Co-operation & Conformity’ and ‘Peer Sociability’, pre-school experience is shown to confer a significant advantage with attendance at any pre-school provision showing a positive impact in terms of better child social behavioural development at start of primary school. In addition, duration of pre-school centre experience is significant showing that children who have spent more time in pre-school have higher social behavioural development for ‘Independence & Concentration’ and ‘Peer Sociability’. The findings for the outcome ‘Anti-social / Worried’ suggest that generally there is no significant difference between home children and children who have experienced pre-school. The exception is for children who attend local authority day care (see Table 5.4) and children who have experienced more than 3 years pre-school60 (see Table 5.5); children in these groups tend to exhibit more anti-social / worried behaviour. As children continue through the educational system, further analyses will be conducted to explore the social behaviour and cognitive attainments of these children during Key Stage 1 to establish whether the ‘gap’ in both cognitive and social behavioural development between home children and those who experienced pre-school reduces or remains constant as they progress through school.
60
Note that the group of children with more than 3 years pre-school centre experience also has high levels of group care (including target and other group care) prior to entry to the study. High levels of group care show a statistically significant impact on increased anti-social / worried behaviour (see Section 2).
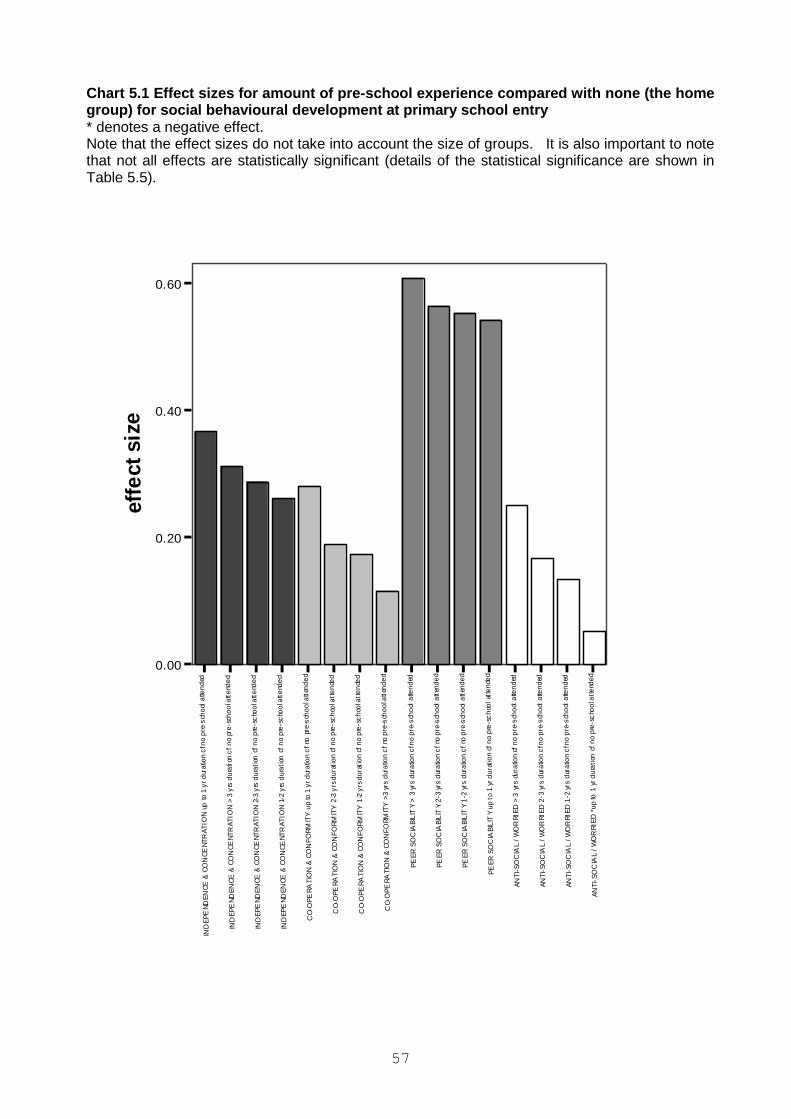
57
Chart 5.1 Effect sizes for amount of pre-school experience compared with none (the home group) for social behavioural development at primary school entry * denotes a negative effect. Note that the effect sizes do not take into account the size of groups. It is also important to note that not all effects are statistically significant (details of the statistical significance are shown in Table 5.5).
IND
EP
EN
DE
NC
E &
CO
NC
EN
TR
AT
ION
up
to
1 y
r d
ura
tion
cf n
o p
re-s
cho
ol a
tten
ded
IND
EP
EN
DE
NC
E &
CO
NC
EN
TR
AT
ION
> 3
yrs
du
rati
on c
f n
o pr
e-s
cho
ol a
tte
nde
d
IND
EP
EN
DE
NC
E &
CO
NC
EN
TR
AT
ION
2-3
yrs
du
rati
on c
f n
o p
re-s
cho
ol a
tte
nde
d
IND
EP
EN
DE
NC
E &
CO
NC
EN
TR
AT
ION
1-2
yrs
du
rati
on c
f n
o p
re-s
cho
ol a
tte
nde
d
CO
-OP
ER
AT
ION
& C
ON
FO
RM
ITY
up
to 1
yr
dur
atio
n c
f no
pre
-sch
oo
l att
end
ed
CO
-OP
ER
AT
ION
& C
ON
FO
RM
ITY
2-3
yrs
du
rati
on
cf n
o p
re-s
ch
ool a
tte
nde
d
CO
-OP
ER
AT
ION
& C
ON
FO
RM
ITY
1-2
yrs
du
rati
on
cf n
o p
re-s
ch
ool a
tte
nde
d
CO
-OP
ER
AT
ION
& C
ON
FO
RM
ITY
>3
yrs
dur
atio
n c
f no
pre
-sch
oo
l att
end
ed
PE
ER
SO
CIA
BIL
ITY
> 3
yrs
dur
atio
n c
f no
pre
-sch
ool
atte
nd
ed
PE
ER
SO
CIA
BIL
ITY
2-3
yrs
dur
atio
n c
f no
pre
-sch
ool
att
end
ed
PE
ER
SO
CIA
BIL
ITY
1-2
yrs
dur
atio
n c
f no
pre
-sch
ool
att
end
ed
PE
ER
SO
CIA
BIL
ITY
up
to
1 yr
du
rati
on
cf n
o p
re-s
ch
ool
atte
nde
d
AN
TI-
SO
CIA
L /
WO
RR
IED
> 3
yrs
du
ratio
n c
f n
o p
re-s
cho
ol a
tten
ded
AN
TI-
SO
CIA
L /
WO
RR
IED
2-3
yrs
dur
atio
n c
f no
pre
-sch
ool
atte
nd
ed
AN
TI-
SO
CIA
L /
WO
RR
IED
1-2
yrs
dur
atio
n c
f no
pre
-sch
ool
atte
nd
ed
AN
TI-
SO
CIA
L /
WO
RR
IED
*u
p to
1 y
r d
ura
tion
cf
no
pre
-sc
hoo
l att
end
ed
0.00
0.20
0.40
0.60
eff
ect
siz
e
58
Section 6: Summary of Main Findings from Analyses of Social Behavioural Outcomes at Entry to Primary School This report describes the results of analyses of different aspects of young children’s social behavioural development over the pre-school period. Change in social behaviour was measured from entry to the EPPE study (age 3 years plus) until the start of primary school (rising 5 years). Four measures of children’s social behaviour were constructed from individual rating scales completed by their class teachers at entry to primary school, namely ‘Independence & Concentration’, ‘Co-operation & Conformity’, ‘Peer Sociability’ and ‘Anti-social / Worried’. A range of statistical methods has been used to analyse data for around 2800 children, representing around 95 per cent of the total child sample at entry to the EPPE pre-school study. Multilevel modelling has been used to identify and explore pre-school centre effects on social behavioural outcomes. Contextualised analyses investigate a range of measures which are predictors of young children’s social behaviour measured at a given time point, entry to primary school. In addition, the extent of developmental gains or change in social behaviour over the pre-school period is also analysed using longitudinal value-added models. The analyses have explored the extent of variation in children’s scores on the four social behaviour measures at primary school entry for different sub-groups of children. The analyses reported in Section 2 identify a number of statistically significant predictors of social behaviour. Taken together a number of child, family and home environment characteristics of children are found to account for a significant proportion of the total variation in different aspects of social behaviour (ranging from 7 to 16 per cent). Although statistically significant, such characteristics account for a much lower proportion of the variance in children's scores for social behaviour than is the case in equivalent analyses of their cognitive attainments at entry to primary school (see EPPE Technical Paper 8a for details of results for cognitive outcomes). This finding indicates that cognitive attainment is more susceptible to child, family and home environment influences than social behaviour for this pre-school age group. When developmental gains or changes in young children’s social behaviour are measured longitudinally over time for the pre-school period the impact of child, family and home environment characteristics is found to be smaller than when variations in social behaviour are explored cross-sectionally, at any one time point. It must be remembered that such characteristics showed relationships with prior social behaviour (measured at entry to the target pre-school at age 3 years plus). Prior social behaviour is used as the baseline for measuring later change/developmental gains in social behaviour up to primary school entry. Nonetheless, a number of characteristics continue to show a small, but statistically significant influence on social behavioural change over the pre-school period. Interestingly, such characteristics show a stronger association with teacher’s ratings of children’s behaviour for ‘Independence & Concentration’ and ‘Co-operation & Conformity’ than for ‘Peer Sociability’ or ‘Anti-social/Worried’ behaviour. The analyses have considered both the child’s level of development at entry to primary school and the developmental gain (progress) over the pre-school period having allowed for previous attainment measured at entry to the study. The effects of child, family, home environment and child care variables on children’s social behaviour measured at start of primary school, and on developmental gains or change over the pre-school period are summarised below. In all cases the relationships are statistically significant, when the influence of other measures is controlled. The findings identify general tendencies for different groups of children, but do not apply to every individual in a specific group. For example, with reference to gender, girls were rated more favourably than boys and showed greater developmental gains over the pre-school period for ‘Independence and Concentration’, ‘Co-operation & Conformity’. They were also perceived to show less ‘Antisocial / Worried’ behaviour at the start of primary school. Similar results were reported by Maccoby (1998).

59
In relation to SES, children with a parent in a professional occupation had the highest teacher ratings, and made the greatest developmental gains over the pre-school period, for ‘Peer Sociability’. In contrast, children with an unemployed father were rated less favourably, and made fewer developmental gains over their time in pre-school for ‘Peer Sociability. Children living in families with better socio-economic circumstances have been found to show developmental advantages on social competence in several studies, e.g. in Australian studies summarised by Amato (1987). The EPPE findings on family effects on social behavioural development fit with this pattern of results. Referring to the home learning environment, various parental activities in the home that offer learning opportunities to the child (library visits, reading, painting/drawing, teaching alphabet, letters/numbers, songs/poems/rhymes) showed significant relationships with ratings of children’s social behaviour at entry to primary school and with developmental gains over the pre-school period. A more positive home learning environment was associated with more favourable outcomes, and with greater developmental gains during pre-school, for all four social behavioural outcomes. The finding that aspects of home experience are important for social development is not new (see, for example, Eisenberg et al., 1999; Howes et al., 1994). However the detailing of specific everyday activities that may be particularly beneficial is a unique contribution of this study.
Results from the contextualised analysis reported in section 2 show that children who spent longer in pre-school (measured from start date at target pre-school centre to date started primary school) were rated by class teachers as showing more ‘Anti-social / Worried’ behaviour at primary school entry. In other words, a longer time (in years and months) spent in pre-school, is associated with slightly more ‘Anti-social / Worried’ behaviour, although it should be noted that only a small proportion of children in total show difficulties for this behavioural outcome. This effect is primarily related to LA day care nurseries and private day nurseries where a substantial proportion start under 2 years of age and some under one year. However, when a measure of pre-school centre quality was added to the model (i.e. ECERS-R), the impact of duration was reduced (although still remained significant). This suggests that higher quality in pre-school centres tends to reduce, but not eliminate, the negative effect of a longer time spent in pre-school centres on ‘Anti-social / Worried’ behaviour. It is important to note the significant positive link of duration of pre-school with young children’s cognitive progress over the pre-school period (see EPPE Technical Paper 8a). There are results from other studies that show similar patterns to the effects of group care found in the EPPE study. In particular, the National Institute of Child Health and Development (NICHD) longitudinal study of 1300 children in the USA found that the more time children spent in non-maternal care arrangements across the first 4.5 years of life, the more externalising problems and conflict with adults they manifested at 54 months, as reported by mothers, caregivers, and/or teachers. These effects remained even when quality, type, and instability of child care were controlled, and when maternal sensitivity and other family background factors were taken into account. The magnitude of quantity-of-care effects were modest and smaller than those of maternal sensitivity and indicators of family socio-economic status, though typically greater than those of other features of child care, maternal depression, and infant temperament (NICHD, 2002; NICHD, in press). The finding of increased anti-social behaviour being associated with an early start in day care has also been found by a number of other studies e.g. Baydar & Brooks-Gunn (1991), Hofferth (1999). In two of these studies, Haskins (1985) and Egeland & Heister (1995), the increased antisocial behaviour at 3-5 years of age, which was associated with early day care, dissipated when the children were 8 years and older. NICHD also find a positive impact of childcare on cognitive outcomes. Variations in centre effectiveness These results point to the need to make appropriate control for differences in the characteristics of young children who attend different pre-school settings, both at the level of individual centres and by type of provision, if valid comparisons of the impact of pre-school are to be made.

60
The multilevel analyses of children’s social behavioural gains over the pre-school period show that significant centre level variance in children’s social behavioural outcomes remains, even when account is taken of prior social behaviour and other intake differences (in terms of child, family and home environment characteristics). It is relevant to note that pre-school centre differences are smaller for the ‘Anti-social / Worried’ dimension than for the other three social behavioural outcomes, suggesting that variations in the characteristics of pre-schools may have less influence on this behavioural dimension than on other areas. Despite the relatively small number of children in the EPPE sample in some centres (mean = 20.3), a number of statistically significant outlier centres were identified. These centres were ones where children showed significantly better or, by contrast, significantly poorer developmental gains61 in particular dimensions of social behaviour than predicted, given their prior social behaviour at entry to pre-school and background characteristics. In all, just over a third (37%) of the 141 centres were identified as performing broadly as expected (compared with other pre-school settings in the sample) across all areas of social behavioural development assessed, when intake differences are controlled. By contrast, 18 centres (12.8%) were found to be statistical outliers (performing significantly above or significantly below expectation for one or more dimension of social behaviour). This is likely to be a conservative estimate of the extent of differences in effectiveness between individual centres, since with small numbers of children in the sample at the centre level an effect has to be larger to reach statistical significance. It should be noted that variations in centre effects on young children's cognitive development were generally stronger than those found for social behavioural development (just over one in five centres was identified as an outlier for progress in one or more cognitive outcome as described in EPPE Technical Paper 8a). It appears therefore that, in general, pre-schools vary more in their impact on cognitive than on social behavioural outcomes. Typically centres vary in their effects on different social behavioural outcomes. No centre performed significantly above or significantly below expectation for all four developmental outcomes assessed. Pre-school centre effects in different aspects of social behaviour are moderately correlated. This suggests that pre-school settings (pre-school centres), which are more effective in promoting particular aspects of social behaviour, will also tend to promote better child outcomes in other dimensions measured in the EPPE study. The individual centre profiles for the four social behavioural dimensions show that a number of centres could be distinguished with broadly positive effects whereas others were generally poorer for developmental gains. Over a fifth of children (23%) had left their target centre62 before starting primary school and moved to other provision. This varied significantly for different types of provision, being very uncommon for those in nursery classes or nursery schools. By contrast the majority of playgroup children (52%) had moved centre, often to a different form of provision. The much higher incidence of movement from playgroups has implications for the analysis of the effects of this type of provision, and the effects of individual centres. The high degree of mobility means that it is very difficult to measure the impact of playgroups on children’s social behaviour development (either at the level of individual centres or as a type of provision) accurately. Nonetheless, the results indicate that child mobility at pre-school was not found to be significant in predicting differences in young children's social behavioural development. The impact of pre-school – type, quantity and quality Elsewhere it has been shown that attending a pre-school centre has an important influence on young children’s cognitive progress (see EPPE Technical Paper 8a). The findings for social behavioural development also support this interpretation. Children without pre-school experience (the ‘home’ group) may be at a disadvantage in terms of ‘Peer Sociability’, ‘Independence & Concentration’ and ‘Co-operation & Conformity’ when they start primary school, as these behaviours are likely to be important for successful adjustment to primary school. Indeed for
61
i.e. positive or negative outliers 62
i.e. the pre-school centre in which they were recruited to the EPPE study

61
‘Peer Sociability’, an earlier start at pre-school is a particular advantage. In addition, ‘Independence & Concentration’ is modestly associated with cognitive attainment at entry to school and hence would be expected to promote classroom learning. Comparable findings about the positive impact of pre-school attendance on social behavioural outcomes have been identified in the parallel pre-school study (EPNNI) in Northern Ireland (see EPPNI Technical Papers 4 and 5). In one area, however, there are differences. An extended time in pre-school (associated with a younger starting age - e.g. at age 2 years or below - at entry to the target pre-school often associated with Local Authority and Private Day nurseries) is linked with poorer outcomes for ‘Anti-social / Worried’ behaviour both at age 3 years plus (the start of the pre-school study) and at rising five years (start of primary school). For cognitive outcomes, however, an earlier start is associated with better progress and higher attainment at entry to primary school. This pattern of poorer antisocial behaviour, yet higher cognitive attainment, associated with an early start in group care, has also been found in the major American study of child care (NICHD, 2002). Quality of pre-school provision (as measured by the total observational schedule ECERS-R) was positively related to better child outcomes in ‘Co-operation & Conformity’. The results of analyses of the ECERS-R subscales suggest that two specific aspects of quality measured by this instrument (language and reasoning and social interaction) are associated with better social behavioural outcomes at primary school entry. In addition, other observational measures of adult child interactions (the Arnett Caregiver Interaction Scale), are related to three of the social behavioural outcomes. These findings indicate that high quality of pre-school is associated with more positive impacts on social behavioural developmental gains. These results are supported by other studies (e.g. NICHD, 2002) finding positive effects for quality of child care upon social development. Howes & Olencik (1986) found that higher quality child care was associated with increased co-operation for children and both Lamb et al. (1992) and Vandell et al. (1988) report better social adjustment for children was associated with higher quality child care. Type of provision effects were identified for several social behavioural outcomes, again in line with findings for cognitive outcomes. The results suggest differences on the factor ‘Co-operation & Conformity’ where children in nursery classes and integrated settings (i.e. combined centres) made greater developmental gains during the pre-school period. The difference is statistically significant when nursery classes and integrated centres are compared with playgroups, private day nurseries and local authority day nurseries. It appears that nursery classes also show a particularly positive impact for Peer Sociability compared with playgroups and local authority day nurseries. Overall effective provision was found in all types of setting; however the proportion of effective settings was higher in the maintained (LEA) sector. There are indications that poorer outcomes in terms of the factor ‘Anti-social / Worried’ behaviour are associated with private and local authority day nurseries, and this appears to be linked with the higher levels of group care experienced by these children before entry to the study related to an earlier start at pre-school. These differences are statistically significant in comparison with nursery classes and nursery schools. There are no significant differences in effectiveness between nursery schools and nursery classes or integrated centres for any of the social behavioural outcomes. Overall, the results show that there was significant variation between individual centres in effectiveness on social behavioural gains within each type of provision; thus it can be concluded that differences between individual pre-school centres are likely to be more important than differences between types of provision. Significant variations in centre managers’ qualification levels have been shown to exist amongst the EPPE sample of centres, and the proportion of staff hours at different qualification levels also varies. Centre managers’ qualification levels are significantly positively associated with the observed quality profiles of centres (EPPE Technical Paper 5), with centres where managers reported they had level 5 qualifications showing higher observed measure of quality. Findings

62
from the Researching Effective Pedagogy in Early Years (REPEY) Project that drew on the EPPE sample indicate that the observed behaviour of other staff is positively influenced by the presence of a member of staff with level 5 qualifications (see Siraj-Blatchford et al, 2002) The multilevel analyses of changes in young children’s social behavioural development showed significant positive relationships between proportion of staff time at level 5 (higher qualification) and two outcomes, ‘Co-operation & Conformity’ and reductions in ‘Anti-social / Worried’ behaviour. Controlling for the impact of child, parent and home environment influences, including prior social behaviour, the results also suggest that a higher proportion of staff hours at a relatively low level of qualification (level 2) is associated with poorer child outcomes at start of primary school for ‘Peer Sociability’. Improving staff qualifications and training levels may be effective strategies to help improve the quality of pre-school provision. Children who do not attend a pre-school centre Data were collected for a group of home children with none or minimal pre-school experience. Comparison of the home sample with the main EPPE sample of children who attended a pre-school showed that both the characteristics and the social behavioural development of home children vary significantly. It is not possible to conclude with certainty that differences in social behaviour found for the home group are directly a consequence of their lack of pre-school experience, due to the home children’s very different characteristics. A controlled experiment (which would not be feasible on either ethical or practical grounds) would be needed to draw firm conclusions. Nonetheless, contextualised multilevel analyses of social behavioural assessments by class teachers at entry to primary school explored the impact of child, family and home environment factors and illustrate that, even when these influences are controlled, home children’s social behaviour is rated as poorer for three areas ‘Independence & Concentration’, ‘Co-operation & Conformity’ and ‘Peer Sociability’ than those of children in the EPPE sample who attended any of the six types of pre-school provision studied. This result, combined with the findings reported elsewhere on the advantages of an early start date and on ‘duration’ of pre-school for cognitive progress (see EPPE Technical Paper 8a), suggest that pre-schooling has a positive impact on young children’s social behavioural development in all areas except the ‘Anti-social / Worried’ dimension. The implication of these results is that children without pre-school experience may be at a disadvantage in terms of ‘Peer Sociability’, ‘Independence and Concentration’ and ‘Co-operation and Conformity’ as well as cognitive attainment when they start primary school. Therefore, the positive impact of duration should not be ignored for cognitive outcomes and important aspects of social behaviour. Future analyses will explore the progress and development of the main EPPE sample and the home group over Key Stage 1. Such analyses will help to establish whether the positive impact of pre-school on young children’s cognitive and social behavioural development remains significant as children move through their first years at primary school. The analyses in this paper have focussed on young children's social behavioural development at two time points and have also measured developmental gains in social behaviour over the pre-school period from start at target pre-school (age 3 years plus) until start of primary school (age rising 5 years). A separate paper presents the findings for cognitive attainment and progress for the same group of children up to primary school entry (EPPE Technical Paper 8a). There are important links between social behavioural development and cognitive attainment as a number of studies of school age children have demonstrated. Brief details of these associations have been reported for the EPPE sample in this paper. There are weak but significant associations between young children's cognitive scores and various dimensions of social behaviour (see Table 1.10 in Section 1). The multilevel analyses indicate that prior cognitive development is a statistically significant predictor of young children's subsequent social behaviour, although it makes little difference to estimates of the impact of different pre-school centres on social behavioural outcomes at the start of primary school. A separate study focussing on the special educational needs (SEN) of children in the sample has investigated different classifications of children who may be viewed as at risk. The results of the Early Years Transition and Special Educational Needs (EYTSEN) project reveal that only a small proportion of pre-school children were
63
classified as 'at risk' for both cognitive and social behavioural measures at the start of primary school. These children, however, may be especially vulnerable at this transition phase (see EYTSEN Technical paper 1 for further details). Home children were significantly more likely to be identified as at risk of SEN for both cognitive outcomes and several measures of social behaviour (EYTSEN Technical Paper 2). It will be important to explore whether such the weak but significant associations between young children's social behaviour and cognitive attainments during pre-school remain stable or increase in strength as children grow older and progress through primary school. Further analyses will explore the continuing impact of pre-school over Key Stage 1, particularly the impact of type, quality and effectiveness of pre-school settings attended and, for the ‘home’ group, the extent to which lack of pre-school attendance continues to influence subsequent outcomes.

64
Appendix A
Chart A.1 Number of EPPE children in pre-school centres
35.032.5
30.027.5
25.022.5
20.017.5
15.012.5
10.07.5
5.02.5
0.0
40
30
20
10
0
Std. Dev = 5.66
Mean = 20.3
N = 141.00
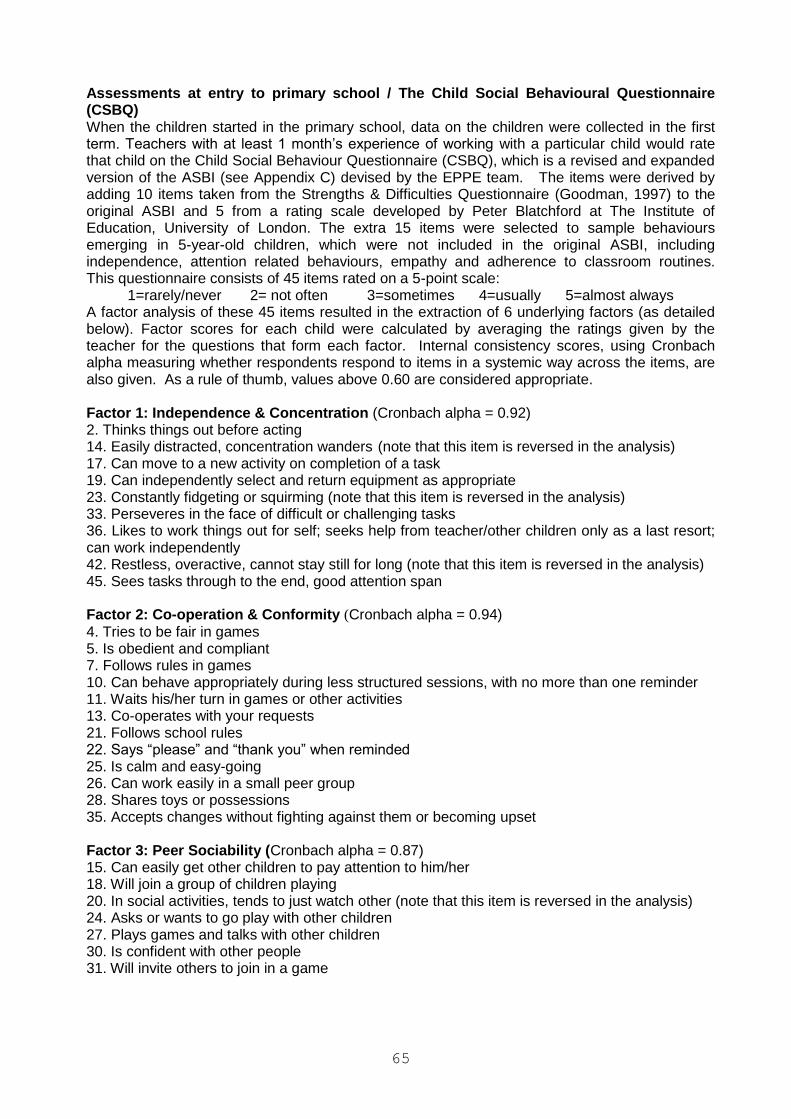
65
Assessments at entry to primary school / The Child Social Behavioural Questionnaire (CSBQ) When the children started in the primary school, data on the children were collected in the first term. Teachers with at least 1 month’s experience of working with a particular child would rate that child on the Child Social Behaviour Questionnaire (CSBQ), which is a revised and expanded version of the ASBI (see Appendix C) devised by the EPPE team. The items were derived by adding 10 items taken from the Strengths & Difficulties Questionnaire (Goodman, 1997) to the original ASBI and 5 from a rating scale developed by Peter Blatchford at The Institute of Education, University of London. The extra 15 items were selected to sample behaviours emerging in 5-year-old children, which were not included in the original ASBI, including independence, attention related behaviours, empathy and adherence to classroom routines. This questionnaire consists of 45 items rated on a 5-point scale:
1=rarely/never 2= not often 3=sometimes 4=usually 5=almost always A factor analysis of these 45 items resulted in the extraction of 6 underlying factors (as detailed below). Factor scores for each child were calculated by averaging the ratings given by the teacher for the questions that form each factor. Internal consistency scores, using Cronbach alpha measuring whether respondents respond to items in a systemic way across the items, are also given. As a rule of thumb, values above 0.60 are considered appropriate. Factor 1: Independence & Concentration (Cronbach alpha = 0.92) 2. Thinks things out before acting 14. Easily distracted, concentration wanders (note that this item is reversed in the analysis) 17. Can move to a new activity on completion of a task 19. Can independently select and return equipment as appropriate 23. Constantly fidgeting or squirming (note that this item is reversed in the analysis) 33. Perseveres in the face of difficult or challenging tasks 36. Likes to work things out for self; seeks help from teacher/other children only as a last resort; can work independently 42. Restless, overactive, cannot stay still for long (note that this item is reversed in the analysis) 45. Sees tasks through to the end, good attention span Factor 2: Co-operation & Conformity (Cronbach alpha = 0.94)
4. Tries to be fair in games 5. Is obedient and compliant 7. Follows rules in games 10. Can behave appropriately during less structured sessions, with no more than one reminder 11. Waits his/her turn in games or other activities 13. Co-operates with your requests 21. Follows school rules 22. Says “please” and “thank you” when reminded 25. Is calm and easy-going 26. Can work easily in a small peer group 28. Shares toys or possessions 35. Accepts changes without fighting against them or becoming upset Factor 3: Peer Sociability (Cronbach alpha = 0.87) 15. Can easily get other children to pay attention to him/her 18. Will join a group of children playing 20. In social activities, tends to just watch other (note that this item is reversed in the analysis) 24. Asks or wants to go play with other children 27. Plays games and talks with other children 30. Is confident with other people 31. Will invite others to join in a game

66
Factor 4: Anti-social / Worried (Cronbach alpha = 0.84)
6. When you give him/her an idea for playing, he/she frowns, shrugs shoulders, pouts or stamps foot 8. Gets upset when you don’t pay enough attention 29. Teases other children, calls them names 32. Prevents other children from carrying out routines 37. Bullies other children 40. Is worried about not getting enough (where enough might include attention, access to toys, food/drink etc.) 41. Is bossy, needs to have his/her way Factor 5: Empathy & Pro-social (Cronbach alpha = 0.89)
1. Understands others’ feelings, like when they are happy, sad or mad 3. Is helpful to other children 9. Is sympathetic toward other children’s distress, tries to comfort others when they are upset 16. Says nice or friendly things to others, or is friendly towards others 39. Apologises spontaneously after a misdemeanour 44. Offers to help other children who are having difficulty with a task in the classroom Factor 6: Openness (Cronbach alpha = 0.78)
12. Is open and direct about what he/she wants 34. Tends to be proud of things she/he does 38. Is interested in many and different things 43. Enjoys talking with you

67
Chart A.2 Distribution of primary school entry social behavioural factor 1: Independence & Concentration
5.00
4.75
4.50
4.25
4.00
3.75
3.50
3.25
3.00
2.75
2.50
2.25
2.00
1.75
1.50
1.25
1.00
600
500
400
300
200
100
0
Std. Dev = .83
Mean = 3.54
N = 2562.00
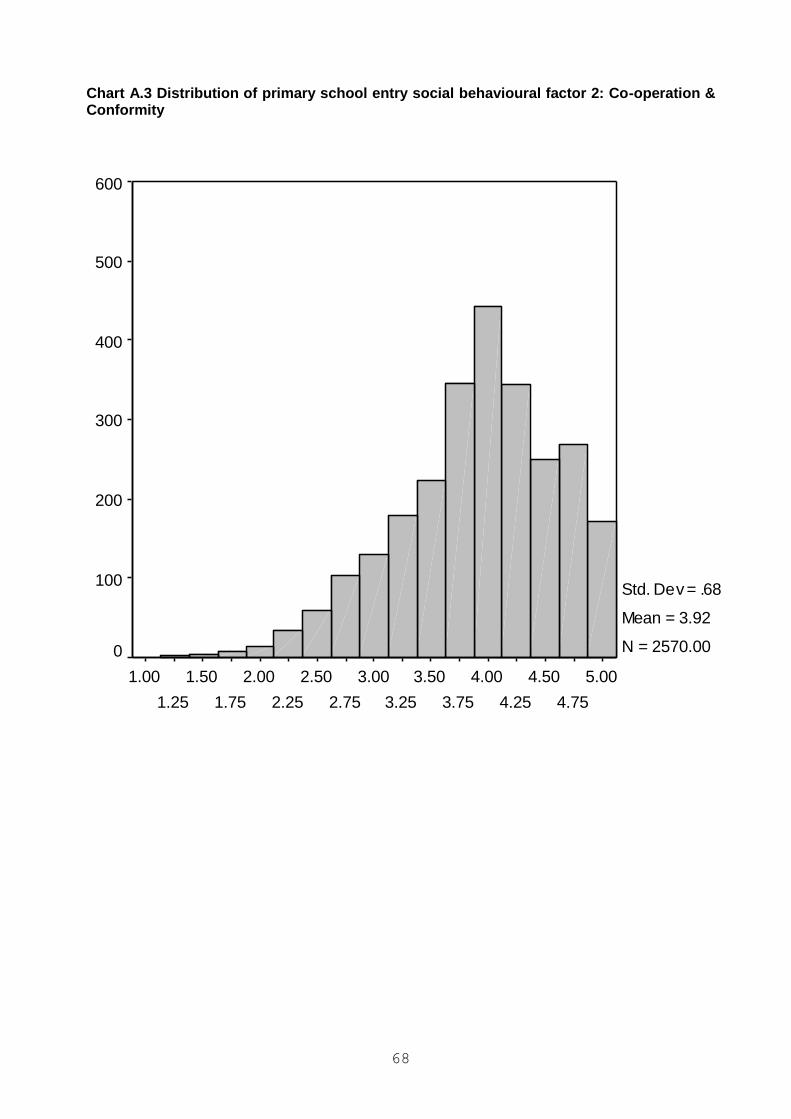
68
Chart A.3 Distribution of primary school entry social behavioural factor 2: Co-operation & Conformity
5.00
4.75
4.50
4.25
4.00
3.75
3.50
3.25
3.00
2.75
2.50
2.25
2.00
1.75
1.50
1.25
1.00
600
500
400
300
200
100
0
Std. Dev = .68
Mean = 3.92
N = 2570.00

69
Chart A.4 Distribution of primary school entry social behavioural factor 3: Peer Sociability
5.00
4.75
4.50
4.25
4.00
3.75
3.50
3.25
3.00
2.75
2.50
2.25
2.00
1.75
1.50
1.25
1.00
600
500
400
300
200
100
0
Std. Dev = .71
Mean = 3.65
N = 2568.00

70
Chart A.5 Distribution of primary school entry social behavioural factor 4: Anti-social / Worried
Note that a high score on Factor 4 ‘Anti-Social / Worried’ relates to an increase in anti-social/worried behaviour
5.00
4.75
4.50
4.25
4.00
3.75
3.50
3.25
3.00
2.75
2.50
2.25
2.00
1.75
1.50
1.25
1.00
600
500
400
300
200
100
0
Std. Dev = .66
Mean = 1.74
N = 2567.00

71
Chart A.6 Independence & Concentration versus Co-operation & Conformity
entry to school 'Co-operation & Conformity'
654321
entr
y to
sch
oo
l 'In
depen
dence &
Co
nce
ntratio
n
6
5
4
3
2
1
0
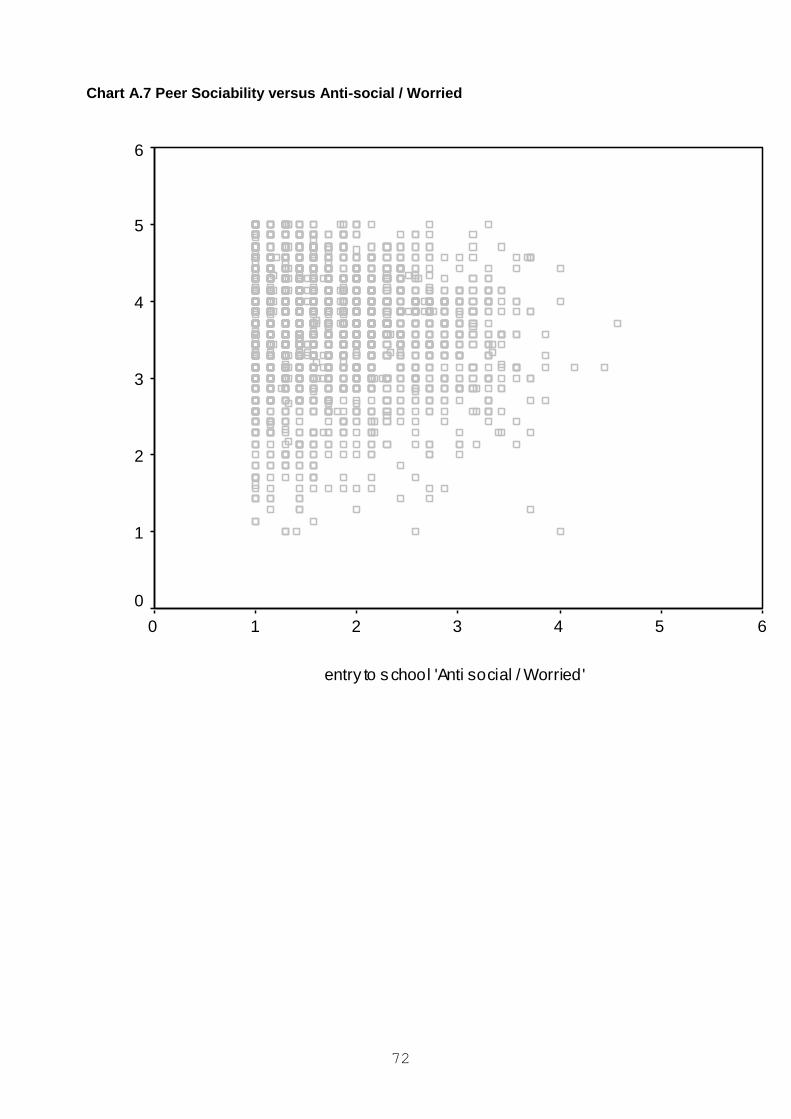
72
Chart A.7 Peer Sociability versus Anti-social / Worried
entry to school 'Anti social / Worried'
6543210
entr
y to
sch
oo
l 'P
eer S
oci
ability
'
6
5
4
3
2
1
0
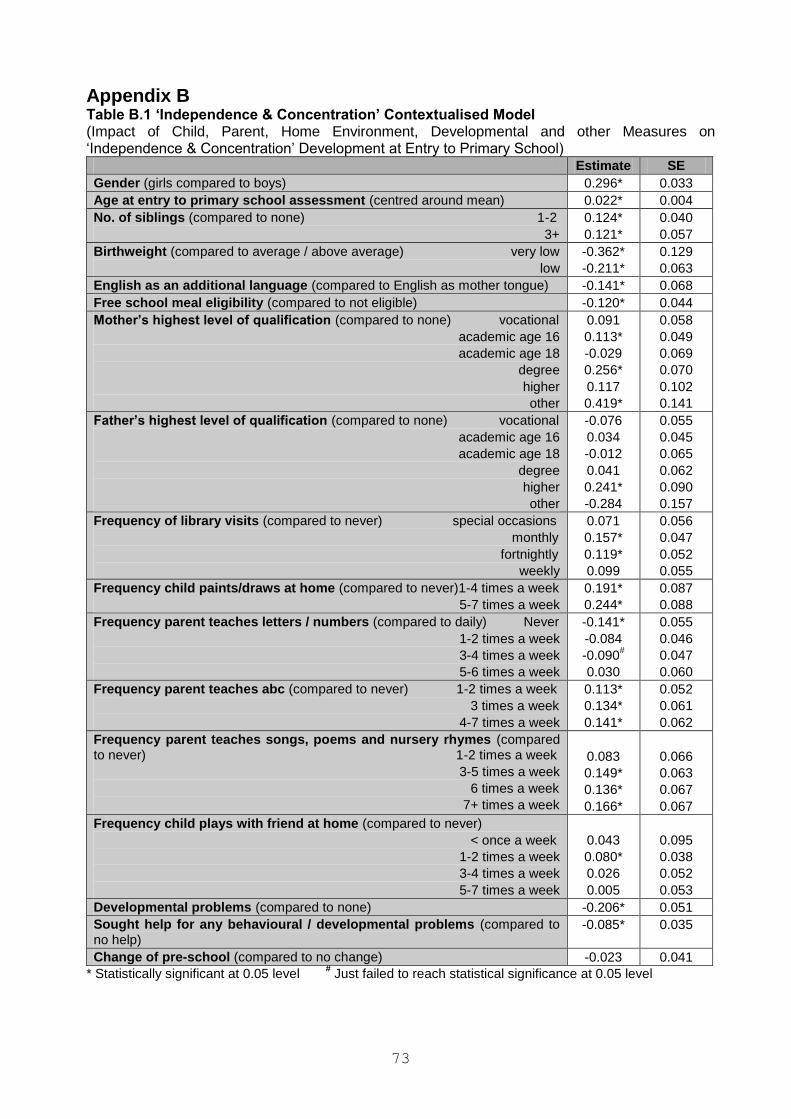
73
Appendix B Table B.1 ‘Independence & Concentration’ Contextualised Model (Impact of Child, Parent, Home Environment, Developmental and other Measures on ‘Independence & Concentration’ Development at Entry to Primary School)
Estimate SE
Gender (girls compared to boys) 0.296* 0.033
Age at entry to primary school assessment (centred around mean) 0.022* 0.004
No. of siblings (compared to none) 1-2
3+
0.124*
0.121*
0.040
0.057
Birthweight (compared to average / above average) very low
low
-0.362*
-0.211*
0.129
0.063
English as an additional language (compared to English as mother tongue) -0.141* 0.068
Free school meal eligibility (compared to not eligible) -0.120* 0.044
Mother’s highest level of qualification (compared to none) vocational
academic age 16
academic age 18
degree
higher
other
0.091
0.113*
-0.029
0.256*
0.117
0.419*
0.058
0.049
0.069
0.070
0.102
0.141
Father’s highest level of qualification (compared to none) vocational
academic age 16
academic age 18
degree
higher
other
-0.076
0.034
-0.012
0.041
0.241*
-0.284
0.055
0.045
0.065
0.062
0.090
0.157
Frequency of library visits (compared to never) special occasions
monthly
fortnightly
weekly
0.071
0.157*
0.119*
0.099
0.056
0.047
0.052
0.055
Frequency child paints/draws at home (compared to never)1-4 times a week
5-7 times a week
0.191*
0.244*
0.087
0.088
Frequency parent teaches letters / numbers (compared to daily) Never
1-2 times a week
3-4 times a week
5-6 times a week
-0.141*
-0.084
-0.090#
0.030
0.055
0.046
0.047
0.060
Frequency parent teaches abc (compared to never) 1-2 times a week
3 times a week
4-7 times a week
0.113*
0.134*
0.141*
0.052
0.061
0.062
Frequency parent teaches songs, poems and nursery rhymes (compared to never) 1-2 times a week
3-5 times a week
6 times a week
7+ times a week
0.083
0.149*
0.136*
0.166*
0.066
0.063
0.067
0.067
Frequency child plays with friend at home (compared to never)
< once a week
1-2 times a week
3-4 times a week
5-7 times a week
0.043
0.080*
0.026
0.005
0.095
0.038
0.052
0.053
Developmental problems (compared to none) -0.206* 0.051
Sought help for any behavioural / developmental problems (compared to no help)
-0.085* 0.035
Change of pre-school (compared to no change) -0.023 0.041
* Statistically significant at 0.05 level # Just failed to reach statistical significance at 0.05 level

74
Table B.2 ‘Co-operation & Conformity’ Contextualised Model (Impact of Child, Parent, Home Environment, Developmental and other Measures on ‘Co-operation & Conformity’ Development at Entry to Primary School)
*Statistically significant at 0.05 level # Just failed to reach statistical significance at 0.05 level
Estimate SE
Gender (girls compared to boys) 0.240* 0.026
Age at entry to primary school assessment (centred around mean) 0.009* 0.004
Ethnicity (compared to white UK) white european
black caribbean
black african
black other
indian
pakistani
bangladeshi
other
mixed
0.005
0.021
0.206*
-0.002
0.110
0.080
-0.014
-0.046
0.011
0.077
0.075
0.098
0.167
0.112
0.110
0.178
0.103
0.055
No. of siblings (compared to none) 1-2
3+
0.112*
0.099*
0.033
0.047
English as an additional language (compared to English as mother tongue) -0.154* 0.076
Free school meal eligibility (compared to not eligible) -0.135* 0.036
Mother’s highest level of qualification (compared to none) vocational
academic age 16
academic age 18
degree
higher
other
0.006
0.078#
0.007
0.222*
0.052
0.279*
0.048
0.041
0.058
0.059
0.085
0.115
Father’s highest level of qualification (compared to none) vocational
academic age 16
academic age 18
degree
higher
other
-0.012
0.044
0.031
0.021
0.152*
-0.202
0.046
0.038
0.054
0.052
0.075
0.127
Frequency parent reads to child (compared to daily) rarely
weekly
several times a week
twice daily
-0.139
-0.113
-0.075*
-0.029
0.081
0.089
0.034
0.044
Frequency of library visits (compared to never) special occasions
monthly
fortnightly
weekly
0.034
0.081*
0.046
0.052
0.046
0.039
0.044
0.046
Frequency parent teaches abc (compared to never) 1-2 times a week
3 times a week
4-7 times a week
0.066
0.077
0.104*
0.043
0.051
0.051
Frequency parent teaches songs, poems and nursery rhymes (compared to never) 1-2 times a week
3-5 times a week
6 times a week
7+ times a week
0.089
0.163*
0.147*
0.168*
0.056
0.053
0.056
0.056
Developmental problems (compared to none) -0.134* 0.039
Behavioural problems (compared to none) 1 behavioural problem
2 + behavioural problems
-0.196*
-0.029
0.045
0.090
Change of pre-school (compared to no change) -0.006 0.034

75
Table B.3 ‘Peer Sociability’ Contextualised Model (Impact of Child, Parent, Home Environment, Developmental and other Measures on ‘Peer Sociability’ Development at Entry to Primary School)
*Statistically significant at 0.05 level
Estimate SE
Age at entry to primary school assessment (centred around mean) 0.016* 0.004
Ethnicity (compared to white UK) white european
black caribbean
black african
black other
indian
pakistani
bangladeshi
other
mixed
-0.050
0.010
0.121
0.132
-0.106
-0.244*
-0.601*
-0.119
0.015
0.075
0.080
0.102
0.172
0.108
0.099
0.174
0.101
0.058
No. of siblings (compared to none) 1-2
3+
-0.022
-0.121*
0.035
0.050
Father’s employment (compared to work full-time) not working
self employed
other
father absent
-0.132*
0.020
0.010
0.021
0.049
0.045
0.087
0.041
Family SES (compared to professional non-manual) intermediate non-manual
skilled non-manual
skilled manual
semi-skilled manual
unskilled manual
never worked
-0.029
-0.057
-0.091
-0.235*
-0.142
-0.195
0.052
0.053
0.061
0.064
0.107
0.108
Frequency parent teaches songs, poems and nursery rhymes (compared to never) 1-2 times a week
3-5 times a week
6 times a week
7+ times a week
0.105
0.123*
0.222*
0.198*
0.057
0.054
0.057
0.057
Frequency child plays with friend at home (compared to never)
< once a week
1-2 times a week
3-4 times a week
5-7 times a week
0.101
0.087*
0.020
0.046
0.083
0.033
0.046
0.047
Developmental problems (compared to none) -0.206* 0.041
Behavioural problems (compared to none) 1 behavioural problem
2 + behavioural problems
-0.136*
0.085
0.046
0.097
Change of pre-school (compared to no change) 0.041 0.037
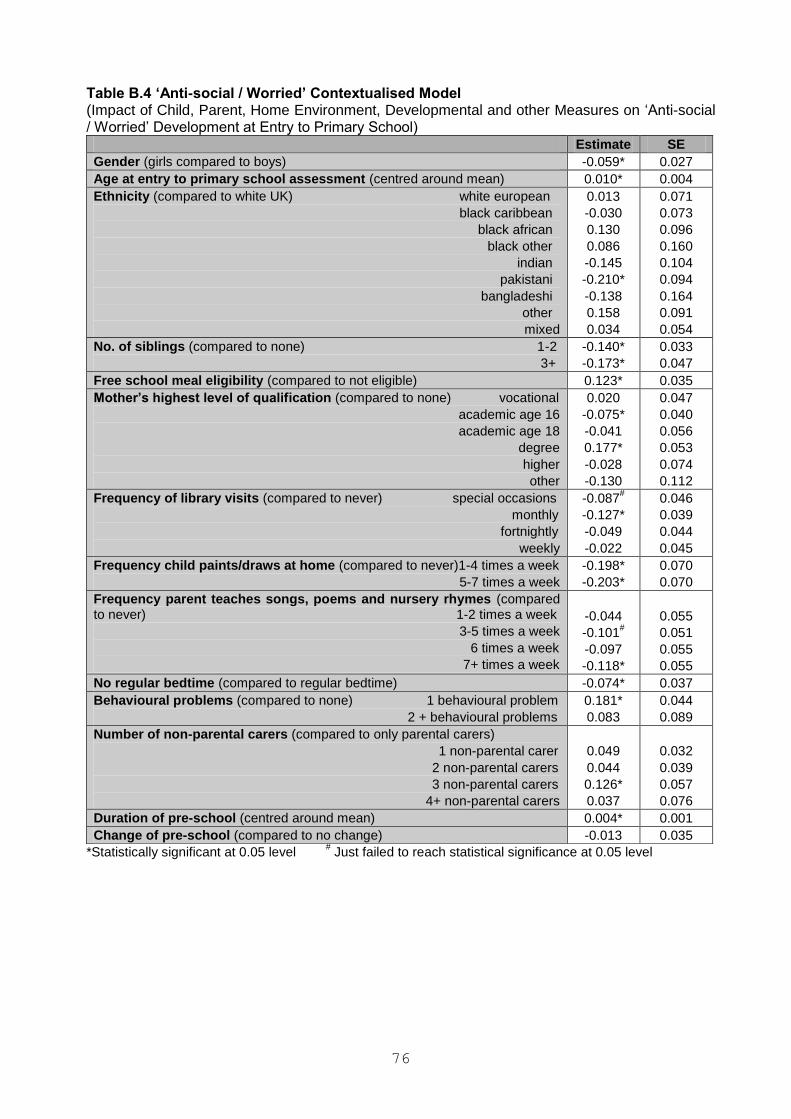
76
Table B.4 ‘Anti-social / Worried’ Contextualised Model (Impact of Child, Parent, Home Environment, Developmental and other Measures on ‘Anti-social / Worried’ Development at Entry to Primary School)
*Statistically significant at 0.05 level # Just failed to reach statistical significance at 0.05 level
Estimate SE
Gender (girls compared to boys) -0.059* 0.027
Age at entry to primary school assessment (centred around mean) 0.010* 0.004
Ethnicity (compared to white UK) white european
black caribbean
black african
black other
indian
pakistani
bangladeshi
other
mixed
0.013
-0.030
0.130
0.086
-0.145
-0.210*
-0.138
0.158
0.034
0.071
0.073
0.096
0.160
0.104
0.094
0.164
0.091
0.054
No. of siblings (compared to none) 1-2
3+
-0.140*
-0.173*
0.033
0.047
Free school meal eligibility (compared to not eligible) 0.123* 0.035
Mother’s highest level of qualification (compared to none) vocational
academic age 16
academic age 18
degree
higher
other
0.020
-0.075*
-0.041
0.177*
-0.028
-0.130
0.047
0.040
0.056
0.053
0.074
0.112
Frequency of library visits (compared to never) special occasions
monthly
fortnightly
weekly
-0.087#
-0.127*
-0.049
-0.022
0.046
0.039
0.044
0.045
Frequency child paints/draws at home (compared to never)1-4 times a week
5-7 times a week
-0.198*
-0.203*
0.070
0.070
Frequency parent teaches songs, poems and nursery rhymes (compared to never) 1-2 times a week
3-5 times a week
6 times a week
7+ times a week
-0.044
-0.101#
-0.097
-0.118*
0.055
0.051
0.055
0.055
No regular bedtime (compared to regular bedtime) -0.074* 0.037
Behavioural problems (compared to none) 1 behavioural problem
2 + behavioural problems
0.181*
0.083
0.044
0.089
Number of non-parental carers (compared to only parental carers)
1 non-parental carer
2 non-parental carers
3 non-parental carers
4+ non-parental carers
0.049
0.044
0.126*
0.037
0.032
0.039
0.057
0.076
Duration of pre-school (centred around mean) 0.004* 0.001
Change of pre-school (compared to no change) -0.013 0.035

77
Effect Sizes Effect sizes (ES) are most commonly used in experimental studies where there is a control group and an experimental group. Following Glass et al (1981), the effect size can be defined as:
ES = (mean of experimental group)-(mean of control group)/pooled standard deviation
_ _ or ∆∆= XExp - XCont __________
SDpooled
The EPPE study is not an experimental study, rather it explores naturally occurring variation in pre-school provision and, in particular, pre-school centre effects. It employs multilevel models to separate pre-school centre level variance in child outcome measures from that attributable to differences at the individual child level, recognising the hierarchical nature of the data (Goldstein, 1995). Effect size is essentially a mean difference involving the ‘fixed’ part of the model. Thus, the above equation would be suitable even if the means were derived from the multilevel model. Furthermore, in a multilevel model, the (standardised) between-school variance of an effect can also be estimated. In this technical paper, effect sizes have been calculated for a number of contextualised and value added models, using both the child level variance63 and coefficients from the multilevel statistical models. The formulae used for the categorical and continuous variables are detailed below and have the advantage of being relatively quick to calculate and readily understandable. For categorical predictor variables, the effect size has been calculated following Tymms et al (1997) (a method also used by Strand, 2002):
ES = categorical predictor variable coefficient √child level variance
or = 1 __________
e
For continuous predictor variables, the effect size has been taken as follows and describes the change on the outcome measure that will be produced by a change of one standard deviation on the continuous predictor variable, standardised by the within school SD adjusted for covariates in the model – the level 1 SD: ES = continuous predictor variable coefficient*SD continuous predictor variable √child level variance
or = 1*sdx1 where x1=continuous predictor variable _________________
e
Charts showing effect sizes for both categorical and continuous predictor variables have been produced providing an indication of the relative magnitude or importance of potential predictor (explanatory) variables. It is important to note that the charts displaying effect sizes for the two types of variables are not directly comparable and that effect sizes do not give an indication of statistical significance of particular predictors (information about this is provided in accompanying tables which show the multilevel estimates and their associated standard errors). Effect sizes for some categorical measures are large but may only apply to very small numbers of children (e.g. the very low birthweight group or specific ethnic groups) and may not always be statistically significant. Effect sizes for continuous measures may appear relatively modest but generally apply to all children. When interpreting effect sizes, Coe (2002) reports the danger of using terms like ‘small’, ‘medium’ and ‘large’ stating that,
63
Using the child level variance from the multilevel models (i.e. amount of variation in the outcome measure attributable to the individual child after controlling for prior attainment in value added models and other significant background characteristics in contextualised and value added models) tends to increase the effect size compared to calculations which use a raw standard deviation (i.e. amount of variation in the outcome measure before controlling for prior attainment, etc).

78
‘Glass et al (1981, p104) are particularly critical of this approach, arguing that the effectiveness of a particular intervention can only be interpreted in relation to other interventions that seek to produce the same effect. They also point out that the practical importance of an effect depends entirely on its relative costs and benefits. In education, if it could be shown that making a small and inexpensive change would raise academic achievement by an effect size of even as little as 0.1, then this could be a very significant improvement, particularly if the improvement applied uniformly to all students, and even more so if the effect were cumulative over time.’ Coe (2002) Effect sizes can be useful for comparisons between studies but interpretations must be made with caution and with reference to the outcomes concerned. The influence of different categorical predictor variables (child, family, home learning environment characteristics, etc.) in the contextualised models described in Section 2 and 5 illustrate the impact on attainment at a given point in time (entry to primary school). These effect sizes are generally considerably larger than those identified in the value added analyses (reported in Section 3 and 4), which measure children’s cognitive progress over time in pre-school. This is because of the strong relationships with prior attainment (at entry to the study at age 3 years plus), which is controlled in the models of progress. Further analyses are planned which will investigate effect sizes further by means of the calculation of confidence limits. This will aid interpretation of effect sizes for predictor measures relating to small sub-groups of children in particular (see discussion by Coe, 2002).

79
Appendix C
Assessments entry to Pre-school / Adaptive Social Behaviour Inventory (ASBI) On the EPPE project a pre-school centre worker who was familiar with the child was asked to complete the Adaptive Social Behaviour Inventory (ASBI) (Hogan et al, 1992). The ASBI provided measures of social/behavioural development. This is the measure used in the NICHD study of Early Child Care, (see NICHD, 2002). The ASBI was developed by Hogan et al. (1992) as a general measure of the social and behavioural development of pre-school children. It was developed because there was not a measure then available that produced measures of social competence, pro-social and antisocial behaviours for pre-school children. Conceptually, social competence was regarded as multi-faceted and separate from behaviour problems. Hence, a child might have varying degrees of social skills and behaviour problems simultaneously. The inventory contains 30 items that were chosen:
to be appropriate to pre-school children, particularly 3-year-olds
to be written in a style suitable for adults of varying education
to have content relevant to a range of home, neighbourhood and day-care settings
to sample behaviours related to social skills
to sample behaviours related to social knowledge
to sample behaviours related to positive emotion
to sample behaviours related to self-control
to sample behaviours related to behaviour problems. Another consideration was to choose positive and negative behaviours that had been identified as potentially related to children’s experience with adults and other children. The response choices for each of the 30 items are: 1 – rarely or never, 2 – sometimes and 3 – almost always. A factor analysis of these 30 items resulted in the extraction of 5 underlying factors. Factor scores for each child were calculated by averaging the ratings given by the teacher for the questions that form each factor. Internal consistency scores, using Cronbach alpha measuring whether respondents respond to items in a systemic way across the items, are also given64. As a rule of thumb, values above 0.60 are considered appropriate. Factor 1: Co-operation &Conformity (Cronbach alpha = 0.88) 2. Is helpful to other children 3. Is obedient and compliant 5. Follows rules in games 8. Waits his/her turn in games or other activities 10. Co-operates with your requests 15. Follows household or pre-school centre rules 16. Says “please” and “thank you” when reminded 18. Is calm and easy-going 20. Shares toys or possessions Factor 2: Peer Sociability (Cronbach alpha = 0.85) 1. Understands others’ feelings, like when they are happy, sad or mad 7. Is sympathetic toward other children’s distress, tries to comfort others when they are upset 11. Can easily get other children to pay attention to him/her 12. Says nice or friendly things to others, or is friendly towards others 13. Will join a group of children playing 14. In social activities, tends to just watch other (note that this item is reversed in the analysis) 17. Asks or wants to go play with other children 19. Plays games and talks with other children Factor 3:Confidence (Cronbach alpha = 0.70) 9. Is open and direct about what he/she wants 22. Is confident with other people 24. Tends to be proud of things she/he does
64
Cronbach alpha was also calculated for the scales produced by Hogan (see Hogan et al, 1992)

80
27. Is interested in many and different things 30. Enjoys talking with you Factor 4: Anti-social (Cronbach alpha = 0.70) 21. Teases other children, calls them names 23. Prevents other children from carrying out routines 26. Bullies other children 29. Is bossy, needs to have his/her way Factor 5: Worried / Upset (Cronbach alpha = 0.61) 4. When you give him/her an idea for playing, he/she frowns, shrugs shoulders, pouts or stamps foot 6. Gets upset when you don’t pay enough attention 25. Accepts changes without fighting against them or becoming upset (note that this item is reversed in the analysis) 28. Is worried about not getting enough (where enough might include attention, access to toys, food/drink etc)

81
Table C.1 ‘Independence & Concentration’ Value Added Model (Impact of Prior Social Behavioural Development, Child, Parent, Home Environment and other Measures on ‘Independence & Concentration’ Development over the Pre-school Period)
Estimate SE
Prior social behavioural development – Co-operation & Conformity (centred around mean)
0.618* 0.037
Age at entry to study assessment (centred around mean) -0.004
0.004
Age at entry to primary school assessment (centred around mean) 0.023* 0.004
Gender (girls compared to boys) 0.237* 0.031
No. of siblings (compared to none) 1-2
3+
0.080* 0.066
0.037 0.053
Birthweight (compared to average / above average) very low
low
-0.372* -0.163*
0.118 0.058
Mother’s highest level of qualification (compared to none)
vocational
academic age 16
academic age 18
degree
higher
other
0.097 0.096* -0.003
0.240* 0.093 0.356*
0.053 0.045 0.064
0.065 0.097 0.133
Father’s highest level of qualification (compared to none) vocational
academic age 16
academic age 18
degree
higher
other
-0.042 0.031 0.047
0.062 0.252* -0.203
0.051 0.041 0.060
0.056 0.084 0.148
Frequency of library visits (compared to never) special occasions
monthly
fortnightly
weekly
0.031 0.134* 0.107* 0.078
0.052 0.044 0.049 0.051
Frequency child paints/draws at home (compared to never)1-4 times a week
5-7 times a week
0.213* 0.242*
0.080 0.081
Frequency parent teaches letters/numbers (compared to daily) never
1-2 times a week
3-4 times a week
5-6 times a week
-0.145* -0.060 -0.064
0.042
0.051 0.043 0.044
0.056
Frequency parent teaches songs, poems and nursery rhymes (compared to never) 1-2 times a week
3-5 times a week
6 times a week
7+ times a week
0.065 0.115* 0.136* 0.147*
0.061 0.057 0.061 0.061
Developmental problems (compared to none) -0.123* 0.048
Sought help for any behavioural / developmental problems (compared to no help)
-0.083* 0.032
Change of pre-school (compared to no change) -0.013 0.041
* Statistically significant at 0.05 level
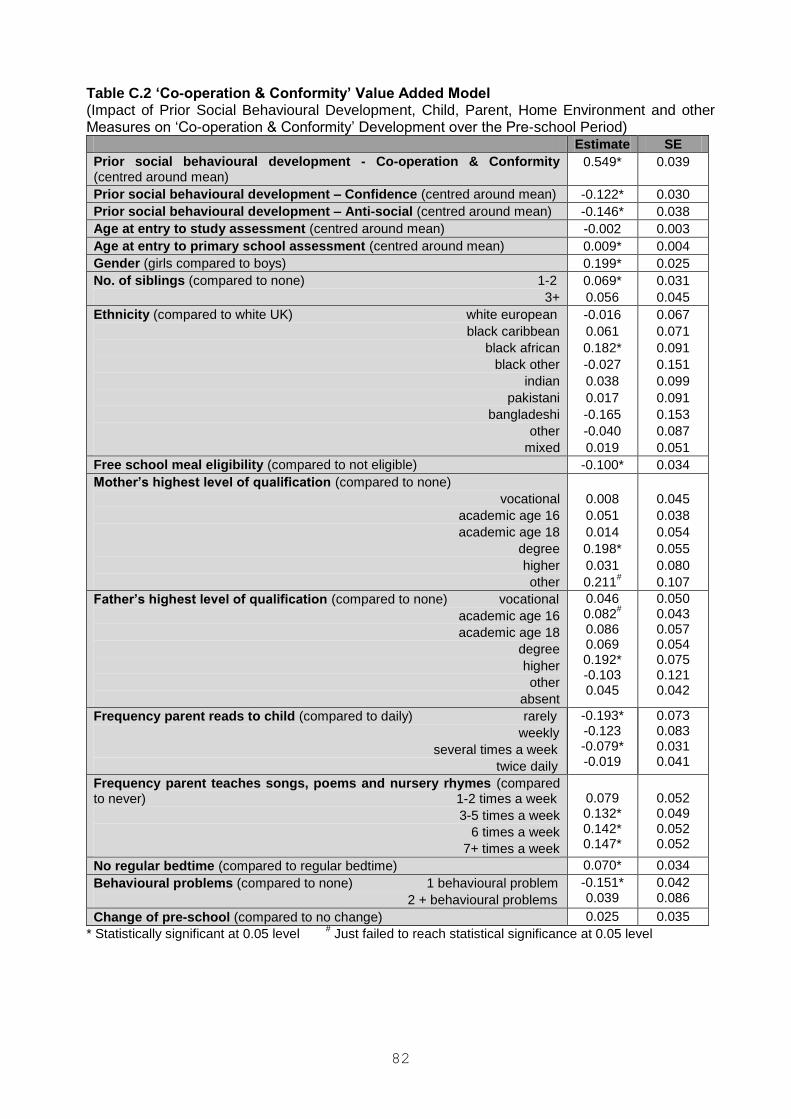
82
Table C.2 ‘Co-operation & Conformity’ Value Added Model (Impact of Prior Social Behavioural Development, Child, Parent, Home Environment and other Measures on ‘Co-operation & Conformity’ Development over the Pre-school Period)
Estimate SE
Prior social behavioural development - Co-operation & Conformity (centred around mean)
0.549* 0.039
Prior social behavioural development – Confidence (centred around mean) -0.122* 0.030
Prior social behavioural development – Anti-social (centred around mean) -0.146* 0.038
Age at entry to study assessment (centred around mean) -0.002 0.003
Age at entry to primary school assessment (centred around mean) 0.009* 0.004
Gender (girls compared to boys) 0.199* 0.025
No. of siblings (compared to none) 1-2
3+
0.069*
0.056
0.031
0.045
Ethnicity (compared to white UK) white european
black caribbean
black african
black other
indian
pakistani
bangladeshi
other
mixed
-0.016
0.061
0.182*
-0.027
0.038
0.017
-0.165
-0.040
0.019
0.067
0.071
0.091
0.151
0.099
0.091
0.153
0.087
0.051
Free school meal eligibility (compared to not eligible) -0.100* 0.034
Mother’s highest level of qualification (compared to none)
vocational
academic age 16
academic age 18
degree
higher
other
0.008
0.051
0.014
0.198*
0.031
0.211#
0.045
0.038
0.054
0.055
0.080
0.107
Father’s highest level of qualification (compared to none) vocational
academic age 16
academic age 18
degree
higher
other
absent
0.046 0.082
#
0.086 0.069 0.192* -0.103 0.045
0.050 0.043 0.057 0.054 0.075 0.121 0.042
Frequency parent reads to child (compared to daily) rarely
weekly
several times a week
twice daily
-0.193* -0.123 -0.079* -0.019
0.073 0.083 0.031 0.041
Frequency parent teaches songs, poems and nursery rhymes (compared to never) 1-2 times a week
3-5 times a week
6 times a week
7+ times a week
0.079 0.132* 0.142* 0.147*
0.052 0.049 0.052 0.052
No regular bedtime (compared to regular bedtime) 0.070* 0.034
Behavioural problems (compared to none) 1 behavioural problem
2 + behavioural problems
-0.151* 0.039
0.042 0.086
Change of pre-school (compared to no change) 0.025 0.035
* Statistically significant at 0.05 level # Just failed to reach statistical significance at 0.05 level

83
Table C.3 ‘Peer Sociability’ Value Added Model (Impact of Prior Social Behavioural Development, Child, Parent, Home Environment and other Measures on ‘Peer Sociability’ Development over the Pre-school Period)
Estimate SE
Prior social behavioural development – Peer Sociability (centred around mean) (note that a squared term is also significant)
0.326* 0.041
Prior social behavioural development – Confidence (centred around mean) 0.183* 0.039
Age at entry to study assessment (centred around mean) -0.005
0.004
Age at entry to primary school assessment (centred around mean) 0.018* 0.004
Ethnicity (compared to white UK) white european
black caribbean
black african
black other
indian
pakistani
bangladeshi
other
mixed
-0.018
0.007
0.142
0.156
-0.053
-0.157
-0.565*
-0.041
0.021
0.071
0.075
0.097
0.163
0.103
0.094
0.165
0.097
0.055
Family SES (compared to professional non-manual) intermediate non-manual
skilled non-manual
skilled manual
semi-skilled manual
unskilled manual
never worked
-0.056 -0.073 -0.096 -0.200* -0.122 -0.201
0.050 0.052 0.060 0.063 0.103 0.104
Father’s employment (compared to work full-time) not working
self employed
other
father absent
-0.113* 0.012 0.011 0.014
0.047 0.042 0.082 0.038
Frequency parent teaches songs, poems and nursery rhymes (compared to never) 1-2 times a week
3-5 times a week
6 times a week
7+ times a week
0.054 0.069 0.156* 0.115*
0.054 0.051 0.054 0.054
Frequency child plays with friend at home (compared to never)
< once a week
1-2 times a week
3-4 times a week
5-7 times a week
0.096 0.073* 0.017 0.038
0.079 0.031 0.043 0.044
Behavioural problems (compared to none) 1 behavioural problem
2 + behavioural problems
-0.110* 0.103
0.044 0.093
Change of pre-school (compared to no change) 0.024 0.037
% of children in centre with mothers who have a degree or higher (centred around mean)
-0.002* 0.001
* Statistically significant at 0.05 level

84
Table C.4 ‘Anti-social / Worried’ Value Added Model (Impact of Prior Social Behavioural Development, Child, Parent, Home Environment and other Measures on ‘Anti-social / Worried’ Development over the Pre-school Period)
Estimate SE
Prior social behavioural development - Co-operation & Conformity (centred around mean)
-0.448* 0.038
Prior social behavioural development – Confidence (centred around mean) 0.228* 0.030
Prior social behavioural development – Anti-social (centred around mean) 0.241* 0.038
Age at entry to study assessment (centred around mean) -0.003
0.003
Age at entry to primary school assessment (centred around mean) 0.012* 0.004
Ethnicity (compared to white UK) white european
black caribbean black african
black other indian
pakistani bangladeshi
other mixed
-0.007 -0.070 0.094 0.120 -0.139 -0.211* -0.154 0.110 0.006
0.066 0.070 0.089 0.149 0.098 0.088 0.151 0.086 0.051
No. of siblings (compared to none) 1-2
3+ -0.098* -0.122*
0.031 0.045
Free school meal eligibility (compared to not eligible) 0.092* 0.036
Mother’s highest level of qualification (compared to none) vocational
academic age 16 academic age 18
degree higher other
0.006 -0.042 -0.057 -0.184* -0.027 -0.085
0.045 0.038 0.054 0.055 0.080 0.106
Father’s highest level of qualification (compared to none) vocational academic age 16 academic age 18
degree higher other
absent
-0.015 -0.103* -0.076 0.001 -0.090 0.092
-0.132*
0.050 0.043 0.057 0.054 0.074 0.119 0.062
Father’s employment (compared to work full-time) not working
self employed other
father absent
-0.066 0.011
-0.151* 0.089
0.046 0.039 0.074 0.062
Frequency of library visits (compared to never) special occasions
monthly fortnightly weekly
-0.044 -0.107* -0.038 0.015
0.043 0.036 0.040 0.042
Frequency child paints/draws at home (compared to never)1-4 times a week
5-7 times a week
-0.161* -0.153*
0.064 0.064
No regular bedtime (compared to regular bedtime) -0.096* 0.034
Behavioural problems (compared to none) 1 behavioural problem
2 + behavioural problems
0.135* -0.016
0.041 0.085
Number of non-parental carers (compared to only parental carers) 1 non-parental carer 2 non-parental carers 3 non-parental carers 4+ non-parental carers
0.040 0.033 0.113* 0.014
0.030 0.036 0.053 0.071
Change of pre-school (compared to no change) -0.043 0.034
* Statistically significant at 0.05 level
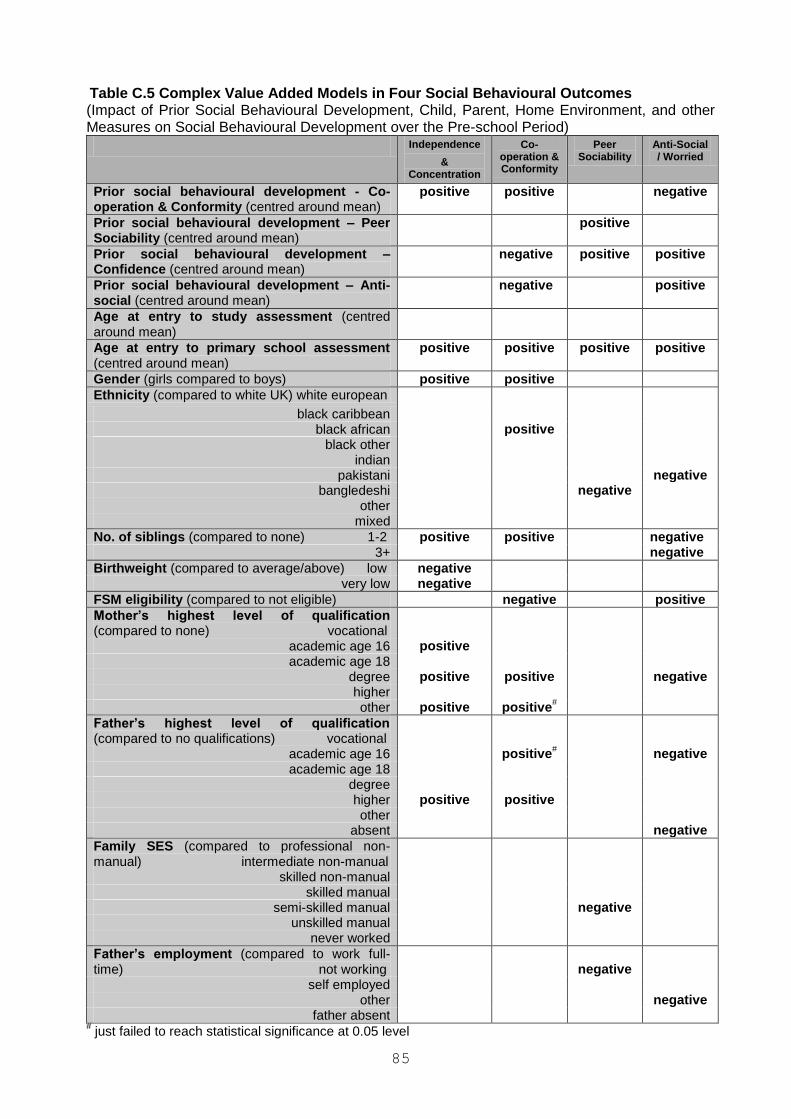
85
Table C.5 Complex Value Added Models in Four Social Behavioural Outcomes (Impact of Prior Social Behavioural Development, Child, Parent, Home Environment, and other Measures on Social Behavioural Development over the Pre-school Period)
Independence
& Concentration
Co-operation & Conformity
Peer Sociability
Anti-Social / Worried
Prior social behavioural development - Co-operation & Conformity (centred around mean)
positive positive negative
Prior social behavioural development – Peer Sociability (centred around mean)
positive
Prior social behavioural development – Confidence (centred around mean)
negative positive positive
Prior social behavioural development – Anti-social (centred around mean)
negative positive
Age at entry to study assessment (centred around mean)
Age at entry to primary school assessment (centred around mean)
positive positive positive positive
Gender (girls compared to boys) positive positive
Ethnicity (compared to white UK) white european
black caribbean black african positive
black other indian
pakistani negative bangledeshi negative
other mixed
No. of siblings (compared to none) 1-2 positive positive negative
3+ negative
Birthweight (compared to average/above) low negative very low negative
FSM eligibility (compared to not eligible) negative positive
Mother’s highest level of qualification (compared to none) vocational
academic age 16 positive academic age 18
degree positive positive negative higher other positive positive
#
Father’s highest level of qualification (compared to no qualifications) vocational
academic age 16 positive# negative
academic age 18 degree higher positive positive other
absent negative
Family SES (compared to professional non-manual) intermediate non-manual
skilled non-manual skilled manual
semi-skilled manual negative unskilled manual
never worked
Father’s employment (compared to work full-time) not working
negative
self employed other negative
father absent # just failed to reach statistical significance at 0.05 level
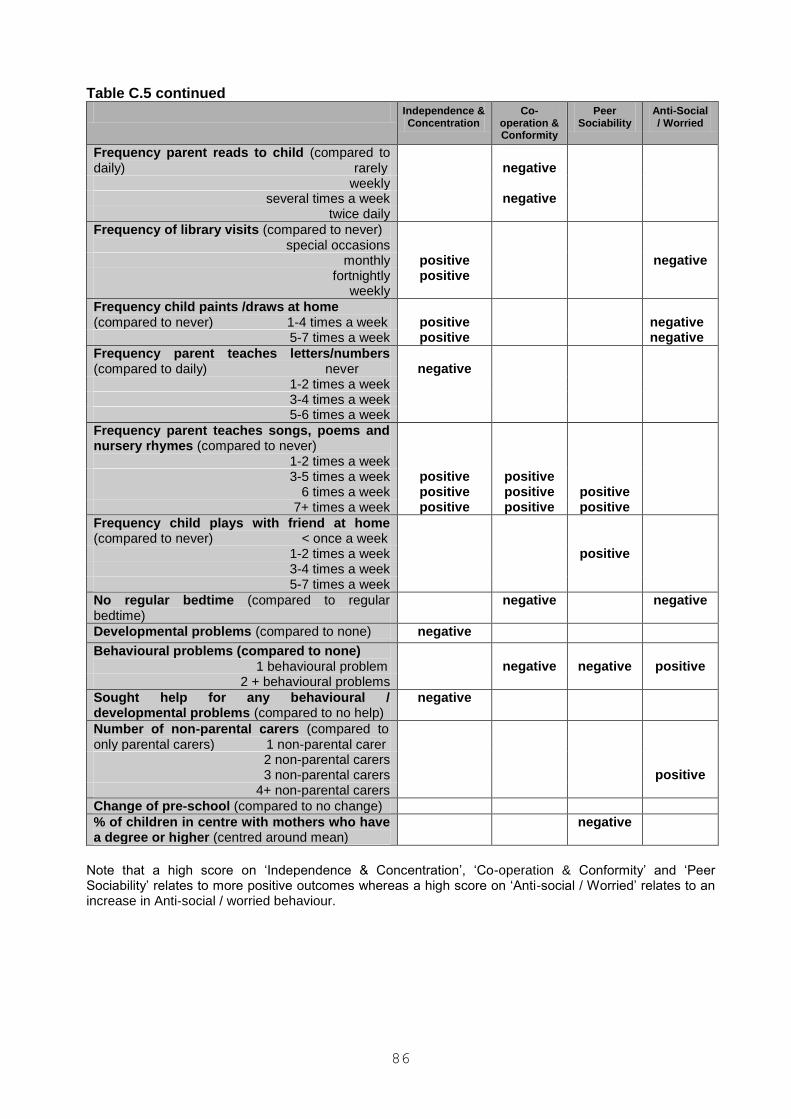
86
Table C.5 continued
Independence & Concentration
Co-operation & Conformity
Peer Sociability
Anti-Social / Worried
Frequency parent reads to child (compared to daily) rarely
negative
weekly several times a week negative
twice daily
Frequency of library visits (compared to never) special occasions
monthly positive negative fortnightly positive
weekly
Frequency child paints /draws at home (compared to never) 1-4 times a week
positive
negative
5-7 times a week positive negative
Frequency parent teaches letters/numbers (compared to daily) never
negative
1-2 times a week 3-4 times a week 5-6 times a week
Frequency parent teaches songs, poems and nursery rhymes (compared to never)
1-2 times a week
3-5 times a week positive positive 6 times a week positive positive positive
7+ times a week positive positive positive
Frequency child plays with friend at home (compared to never) < once a week
1-2 times a week positive 3-4 times a week 5-7 times a week
No regular bedtime (compared to regular bedtime)
negative negative
Developmental problems (compared to none) negative
Behavioural problems (compared to none) 1 behavioural problem
negative
negative
positive
2 + behavioural problems
Sought help for any behavioural / developmental problems (compared to no help)
negative
Number of non-parental carers (compared to only parental carers) 1 non-parental carer
2 non-parental carers 3 non-parental carers positive
4+ non-parental carers
Change of pre-school (compared to no change)
% of children in centre with mothers who have a degree or higher (centred around mean)
negative
Note that a high score on ‘Independence & Concentration’, ‘Co-operation & Conformity’ and ‘Peer Sociability’ relates to more positive outcomes whereas a high score on ‘Anti-social / Worried’ relates to an increase in Anti-social / worried behaviour.

87
Appendix D Chart D.1 ‘Independence & Concentration’ value added model - Effect sizes of categorical predictor variables *denotes a negative effect Note that the effect sizes shown do not take into account the size of groups. Some large effects (e.g. mother’s qualification other professional) apply to very small numbers of children and not all are statistically significant. Details of the statistical significance of different measures are shown in Table C.1.
CH
ILD
ME
AS
UR
ES
Bir
th w
eig
ht c
f av
era
ge
/abo
ve:
v lo
w*
low
*
Gir
ls c
f b
oys
Sib
ling
s cf
no
ne:
1-2
3+
sib
ling
s
FA
MIL
Y M
EA
SU
RE
S
Mo
the
r's q
ua
lific
atio
n cf
no
ne:
oth
er
deg
ree
(mot
her
)
16
aca
dem
ic (
mo
the
r)
16/
18
voc
atio
nal
(mo
the
r)
hig
her
(mo
the
r)
18
aca
dem
ic (
mo
the
r)*
Fa
the
r's q
ual
ific
atio
n cf
no
ne:
hig
he
r
oth
er
(fa
ther
)*
deg
ree
(fa
the
r)
16/
18
voc
atio
nal
(fat
her)
*
18
aca
dem
ic (
fath
er)
16
aca
dem
ic (
fath
er)
HO
ME
EN
VIR
ON
ME
NT
ME
AS
UR
ES
Pa
int/
dra
w c
f n
eve
r: 5
-7 ti
mes
1-4
tim
es
(pa
ints
/dra
ws)
Vis
it lib
rary
cf
ne
ver:
mo
nth
ly
fort
nig
htly
(lib
rary
)
wee
kly
(lib
rary
)
spe
cial
occ
asio
ns (
libra
ry)
Sin
g s
ong
s, e
tc c
f n
ever
: 7
tim
es
6 t
ime
s (s
on
gs)
3-5
tim
es
(so
ngs
)
1-2
tim
es
(so
ngs
)
Let
ters
Nu
mb
ers
cf
daily
: ne
ver*
3-4
tim
es
(let
ters
/nu
mb
ers
)*
1-2
tim
es
(let
ters
/nu
mb
ers
)*
5-6
tim
es
(let
ters
/nu
mb
ers
)
AB
C c
f n
eve
r: 3
4+
(ab
c)
1-2
(a
bc)
OT
HE
R M
EA
SU
RE
S
So
ug
ht h
elp
fo
r b
eha
v/d
ev p
robs
cf
no h
elp
: 3*
1 (
sou
gh
t he
lp)*
2 (
sou
ght
he
lp)*
Ba
ha
vio
ura
l pr
obl
ems
cf
non
e: 1
*
2+
Cha
ng
e of
pre
-sch
ool
cf
no
ne
0.10
0.20
0.30
0.40
0.50
eff
ect
siz
e o
f cate
go
rica
l p
red
icto
r va
riab
les
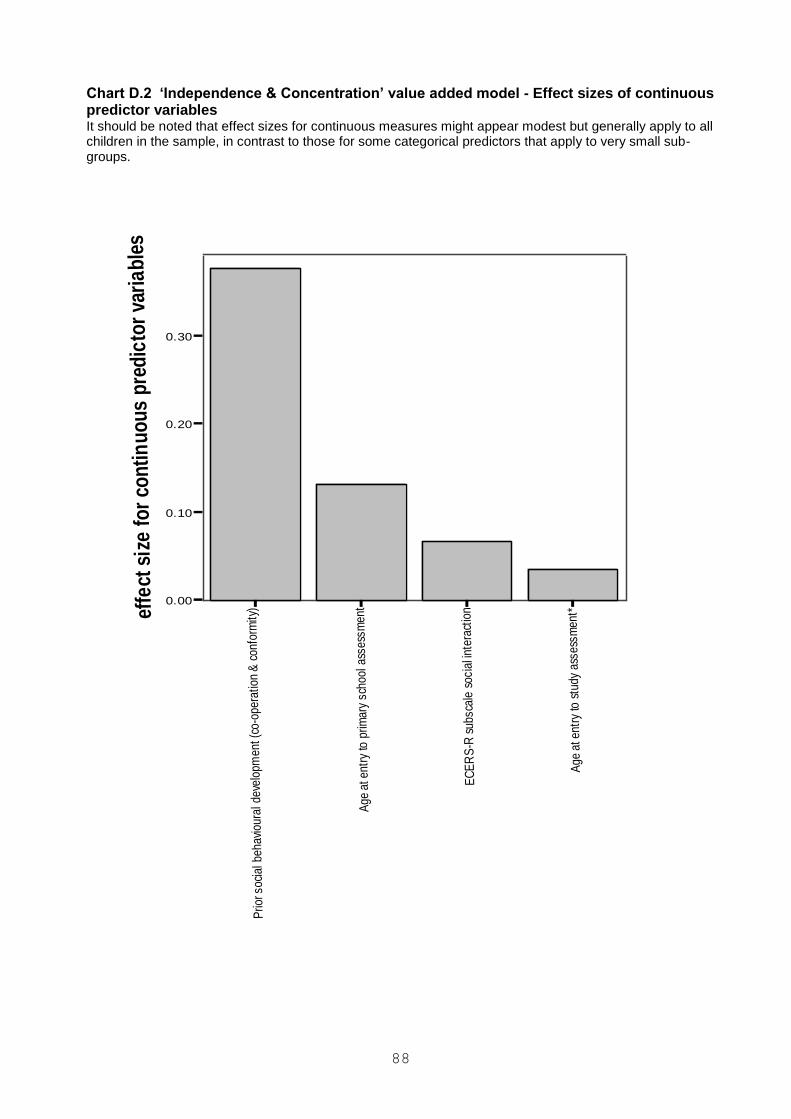
88
Chart D.2 ‘Independence & Concentration’ value added model - Effect sizes of continuous predictor variables It should be noted that effect sizes for continuous measures might appear modest but generally apply to all children in the sample, in contrast to those for some categorical predictors that apply to very small sub-groups.
Prio
r soc
ial b
ehav
iour
al d
evel
opm
ent (
co-o
pera
tion
& c
onfo
rmity
)
Age
at e
ntry
to p
rimar
y sc
hool
ass
essm
ent
EC
ER
S-R
sub
scal
e so
cial
inte
ract
ion
Age
at e
ntry
to s
tudy
ass
essm
ent*
0.00
0.10
0.20
0.30
effe
ct s
ize
for
con
tin
uo
us
pre
dic
tor
vari
ab
les

89
Chart D.3 ‘Co-operation & Conformity’ value added model - Effect sizes of categorical predictor variables *denotes a negative effect Note that the effect sizes shown do not take into account the size of groups. Some large effects (e.g. mother’s qualification other professional) apply to very small numbers of children and not all are statistically significant. Details of the statistical significance of different measures are shown in Table C.2.
C
HIL
D M
EA
SU
RE
S
Gir
ls c
f b
oys
Eth
nic
ity c
f w
hite
UK
: b
lack
afr
ican
ban
gla
des
hi*
oth
er
eth
nic
*
bla
ck c
ari
bbe
an
bla
ck o
the
r*
ind
ian
whi
te e
uro
pea
n*
mix
ed
pak
ista
ni
Sib
ling
s cf
no
ne:
1-2
3+
sib
ling
s
FA
MIL
Y M
EA
SU
RE
S
Mo
the
r's q
ua
lific
atio
ns c
f no
ne
: oth
er
deg
ree
(mot
her
)
16
aca
dem
ic (
mo
the
r)
hig
her
(mo
the
r)
18
aca
dem
ic (
mo
the
r)
16/
18
voc
atio
nal
(mo
the
r)
Fa
the
r's q
ual
ific
atio
n cf
no
ne:
hig
he
r
oth
er
(fa
ther
)*
18
aca
dem
ic (
fath
er)
16
aca
dem
ic (
fath
er)
deg
ree
(fa
the
r)
16/
18
voc
atio
nal
(fat
her)
abs
ent
(fa
the
r)
Elig
ible
for
FS
M c
f n
ot e
ligib
le*
HO
ME
EN
VIR
ON
ME
NT
ME
AS
UR
ES
Pa
ren
t's
rea
d cf
da
ily:
rare
ly*
wee
kly
*
sev
era
l tim
es
a w
ee
k*
twic
e a
day
*
Sin
g s
ong
s, e
tc c
f n
ever
: 7
tim
es
(son
gs)
6 t
ime
s (s
ong
s)
3-5
tim
es
(so
ngs
)
1-2
tim
es
(so
ngs
)
No
reg
ula
r be
dtim
e c
f re
gu
lar
bed
time
OT
HE
R M
EA
SU
RE
S
Be
ha
vio
ura
l P
rob
lem
s cf
no
ne:
1*
2+
be
hav
pro
bs
Cha
ng
e of
pre
-sch
ool
cf
no
ne
0.00
0.10
0.20
0.30
eff
ect
siz
e o
f cate
go
rica
l p
red
icto
r va
riab
les
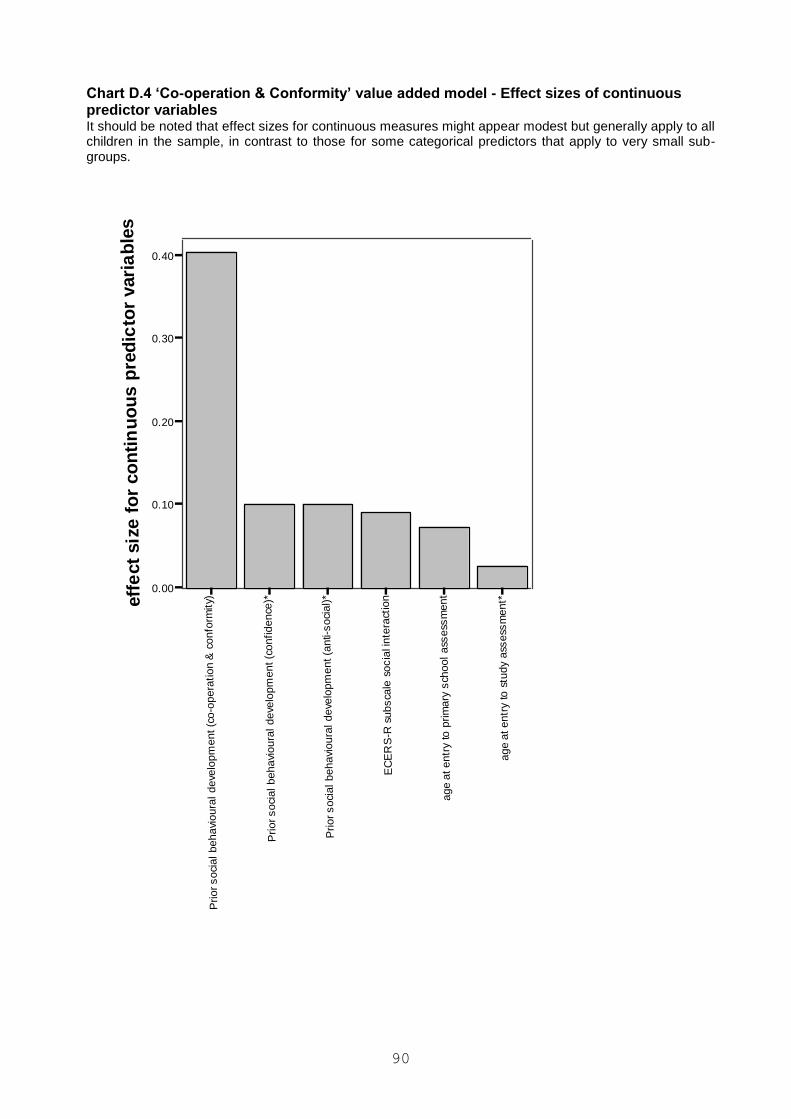
90
Chart D.4 ‘Co-operation & Conformity’ value added model - Effect sizes of continuous predictor variables It should be noted that effect sizes for continuous measures might appear modest but generally apply to all children in the sample, in contrast to those for some categorical predictors that apply to very small sub-groups.
Prior
soci
al
be
ha
viou
ral
de
velo
pm
en
t (c
o-o
pera
tion
& c
on
form
ity)
Prior
soci
al
be
ha
viou
ral
de
velo
pm
en
t (c
on
fide
nce
)*
Prior
soci
al
be
ha
viou
ral
de
velo
pm
en
t (a
nti-
soci
al)
*
EC
ER
S-R
sub
sca
le s
oc
ial i
nte
ract
ion
ag
e a
t en
try
to p
rim
ary
sch
ool
ass
ess
men
t
ag
e a
t en
try
to s
tud
y ass
ess
men
t*
0.00
0.10
0.20
0.30
0.40
eff
ect
siz
e f
or
co
nti
nu
ou
s p
red
icto
r vari
ab
les

91
The Caregivers Interaction Scale and ECERS: comparing separate measures of quality The table below shows that the two ‘quality’ rating scales are highly correlated. Note that the Arnett Caregiver Interaction Scale assesses the ‘relationships’ which staff establish with children while the Early Childhood Environment Rating Scales (ECERS-R and ECERS-E) provide a broader profile that includes social interactions but also resources, curriculum and facilities. Table D.1
Positive relationship
Punitiveness Permissive Detachment
ECERS_E
Average total 0.59** -0.18* -0.32** -0.45**
literacy subscale 0.58** -0.24** -0.35** -0.46**
maths subscale 0.47** -0.14 -0.28** -0.36**
science/envir subscale
0.45** -0.05 -0.30** -0.32**
diversity subscale 0.48** -0.19* -0.22** -0.39**
ECERS_R
Average total 0.58** -0.23** -0.33** -0.49**
space & furnishings
subscale
0.31** -0.15 -0.15 -0.34**
personal care routines subscale
0.29** -0.02 -0.13 -0.20*
language and reasoning subscale
0.64** -0.21* -0.47** -0.48**
pre-school activities subscale
0.42** -0.05 -0.25** -0.26**
social interaction subscale
0.68** -0.36** -0.42** -0.68**
organisation & routine subscale
0.44** -0.23** -0.20* -0.41**
adults working together subscale
0.42** -0.20* -0.19* -0.30**
The Caregivers Interaction Scale and Centre Managers’ Highest Childcare Qualification Using the 5-point scale, it was observed that ‘Positive relationship’ differed significantly by manager qualification (H(4)=21.5, p<.01), as did ‘Permissivness’ (H(4)=14.6, p<.05), and ‘Detachment’ (H(4)=12.0, p<.05). ‘Punitiveness’ did not differ by manager qualification (H(4)=4.9, p=.29). Chart D.5
0
1
2
3
4
Unqualif ied Level 2 Level 3 Level 4 Level 5
Positive relationship Permissive Detachment

92
Appendix E Chart E.1 Distribution of the number of EPPE children (with pre-school provision and home) in each primary school
Number of EPPE children (with pre-school provision and home)
605550454035302520151050
Nu
mb
er
of p
rim
ary
sch
oo
ls
500
400
300
200
100
0
Std. Dev = 5.49
Mean = 4
N = 784.00
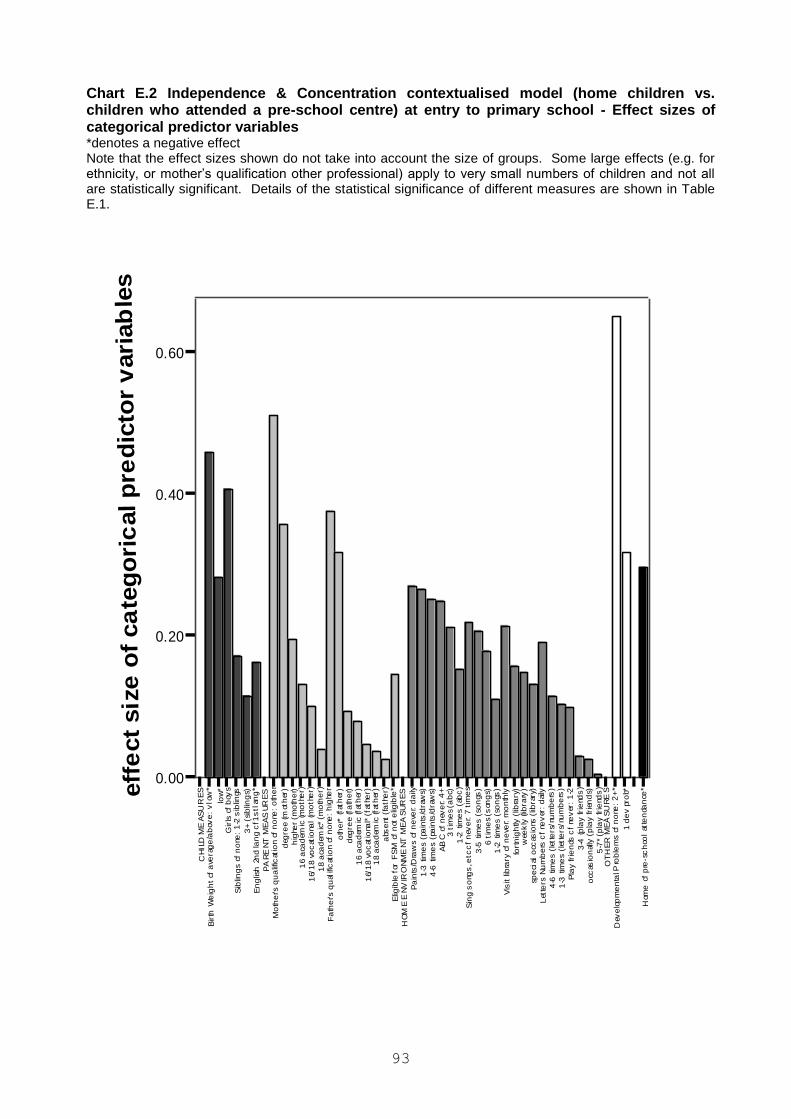
93
Chart E.2 Independence & Concentration contextualised model (home children vs. children who attended a pre-school centre) at entry to primary school - Effect sizes of categorical predictor variables *denotes a negative effect Note that the effect sizes shown do not take into account the size of groups. Some large effects (e.g. for ethnicity, or mother’s qualification other professional) apply to very small numbers of children and not all are statistically significant. Details of the statistical significance of different measures are shown in Table E.1.
CH
ILD
ME
AS
UR
ES
Bir
th W
eig
ht
cf a
vera
ge
/ab
ove
: v
low
*
low
*G
irls
cf
boy
s
Sib
ling
s cf
no
ne:
1-2
sib
lings
3+
(si
blin
gs)
En
glis
h 2
nd
lan
g c
f 1s
t lan
g*
PA
RE
NT
ME
AS
UR
ES
Mo
the
r's q
ua
lific
atio
n cf
no
ne:
oth
er
deg
ree
(mot
her
)
hig
her
(mo
the
r)1
6 a
cad
emic
(m
oth
er)
16/
18
voc
atio
nal
(mo
the
r)
18
aca
dem
ic*
(mo
the
r)
Fa
the
r's q
ual
ific
atio
n cf
no
ne:
hig
her
oth
er*
(fa
ther
)
deg
ree
(fa
the
r)
16
aca
dem
ic (
fath
er)
16/
18
voc
atio
nal*
(fa
the
r)
18
aca
dem
ic (
fath
er)
abs
ent
(fa
the
r)
Elig
ible
for
FS
M c
f n
ot e
ligib
le*
HO
ME
EN
VIR
ON
ME
NT
ME
AS
UR
ES
Pa
ints
/Dra
ws
cf n
eve
r: d
aily
1-3
tim
es
(pa
ints
/dra
ws)
4-6
tim
es
(pa
ints
/dra
ws)
AB
C c
f n
eve
r: 4
+3
tim
es
(ab
c)
1-2
tim
es
(ab
c)
Sin
g s
ong
s, e
tc c
f n
eve
r: 7
tim
es
3-5
tim
es
(so
ngs
)
6 t
ime
s (s
ong
s)
1-2
tim
es
(so
ngs
)
Vis
it lib
rary
cf
ne
ver:
mo
nth
ly
fort
nig
htly
(lib
rary
)w
eek
ly (
libra
ry)
spe
cial
occ
asio
ns (
libra
ry)
Let
ters
Nu
mb
ers
cf
nev
er:
dai
ly
4-6
tim
es
(let
ters
/nu
mb
ers
)
1-3
tim
es
(let
ters
/nu
mb
ers
)
Pla
y fr
ien
ds c
f ne
ver
: 1
-2
3-4
(p
lay
frie
nds
)
occ
asio
nal
ly (
pla
y fr
ien
ds)
5-7
* (p
lay
frie
nds
)O
TH
ER
ME
AS
UR
ES
Dev
elo
pm
en
tal P
rob
lem
s cf
no
ne:
2+
*
1 d
ev
pro
b*
Hom
e c
f p
re-s
ch
ool
atte
nda
nce
*
0.00
0.20
0.40
0.60
eff
ect
siz
e o
f ca
teg
ori
cal p
red
icto
r v
ari
ab
les
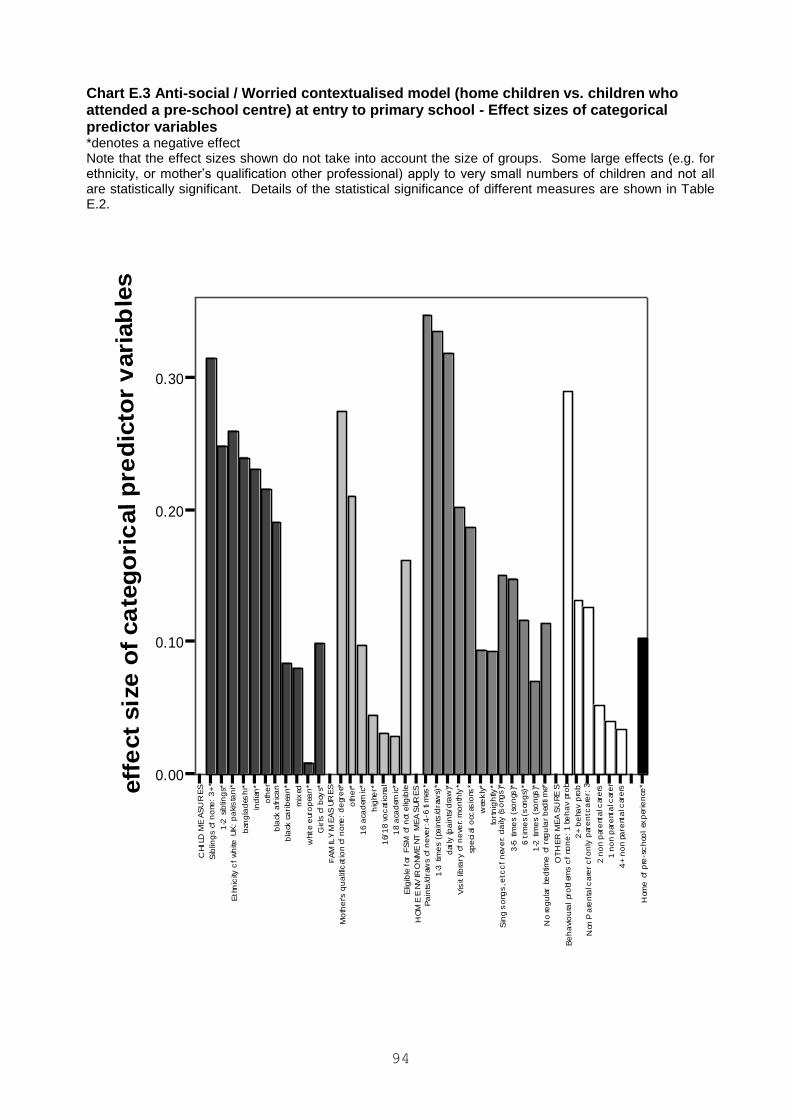
94
Chart E.3 Anti-social / Worried contextualised model (home children vs. children who attended a pre-school centre) at entry to primary school - Effect sizes of categorical predictor variables *denotes a negative effect Note that the effect sizes shown do not take into account the size of groups. Some large effects (e.g. for ethnicity, or mother’s qualification other professional) apply to very small numbers of children and not all are statistically significant. Details of the statistical significance of different measures are shown in Table E.2.
CH
ILD
ME
AS
UR
ES
Sib
ling
s cf
no
ne:
3+
*
1-2
sib
ling
s*
Eth
nic
ity c
f w
hite
UK
: p
aki
sta
ni*
ban
gla
des
hi*
ind
ian
*
oth
er
bla
ck a
fric
an
bla
ck c
ari
bea
n*
mix
ed
whi
te e
uro
pea
n*
Gir
ls c
f b
oys*
FA
MIL
Y M
EA
SU
RE
S
Mo
the
r's q
ua
lific
atio
n cf
no
ne:
de
gre
e*
oth
er*
16
aca
dem
ic*
hig
her*
16/
18
voc
atio
nal
18
aca
dem
ic*
Elig
ible
for
FS
M c
f n
ot e
ligib
le
HO
ME
EN
VIR
ON
ME
NT
ME
AS
UR
ES
Pa
ints
/dra
ws
cf n
eve
r: 4
-6 ti
mes
*
1-3
tim
es
(pa
ints
/dra
ws)
*
dai
ly (
pa
ints
/dra
w)*
Vis
it lib
rary
cf
ne
ver:
mo
nth
ly*
spe
cial
occ
asio
ns*
wee
kly
*
fort
nig
htly
*
Sin
g s
ong
s, e
tc c
f n
eve
r: d
aily
(s
ong
s)*
3-5
tim
es
(so
ngs
)*
6 t
ime
s (s
ong
s)*
1-2
tim
es
(so
ngs
)*
No
reg
ula
r be
dtim
e c
f re
gu
lar
bed
tim
e*
OT
HE
R M
EA
SU
RE
S
Be
ha
vio
ura
l pr
obl
ems
cf
non
e:
1 be
ha
v pr
ob
2+
be
hav
pro
b
Non
Pa
ren
tal c
are
r c
f on
ly p
are
nt c
are
r: 3
2 n
on
par
ent
al c
are
rs
1 n
on
par
ent
al c
are
r
4+
no
n pa
rent
al c
are
rs
Hom
e c
f p
re-s
ch
ool
exp
erie
nce
*
0.00
0.10
0.20
0.30
eff
ect
siz
e o
f ca
teg
ori
cal p
red
icto
r v
ari
ab
les
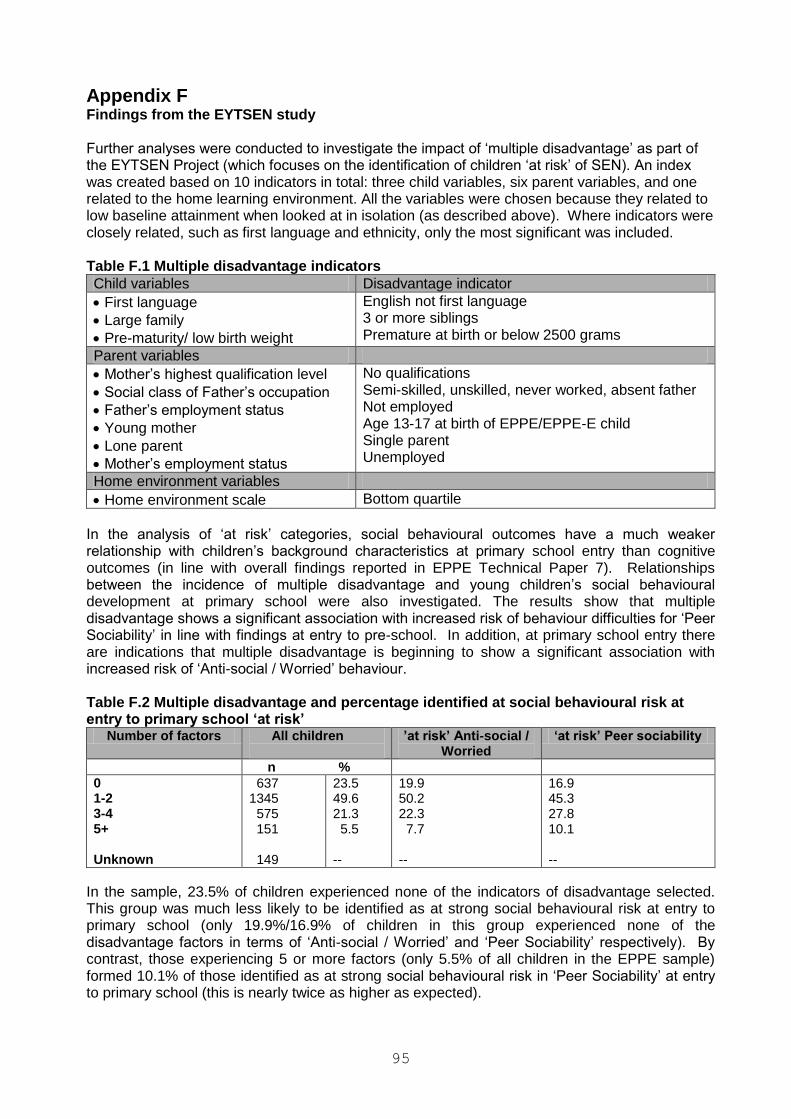
95
Appendix F Findings from the EYTSEN study Further analyses were conducted to investigate the impact of ‘multiple disadvantage’ as part of the EYTSEN Project (which focuses on the identification of children ‘at risk’ of SEN). An index was created based on 10 indicators in total: three child variables, six parent variables, and one related to the home learning environment. All the variables were chosen because they related to low baseline attainment when looked at in isolation (as described above). Where indicators were closely related, such as first language and ethnicity, only the most significant was included. Table F.1 Multiple disadvantage indicators
Child variables Disadvantage indicator
First language
Large family
Pre-maturity/ low birth weight
English not first language 3 or more siblings Premature at birth or below 2500 grams
Parent variables
Mother’s highest qualification level
Social class of Father’s occupation
Father’s employment status
Young mother
Lone parent
Mother’s employment status
No qualifications Semi-skilled, unskilled, never worked, absent father Not employed Age 13-17 at birth of EPPE/EPPE-E child Single parent Unemployed
Home environment variables
Home environment scale Bottom quartile
In the analysis of ‘at risk’ categories, social behavioural outcomes have a much weaker relationship with children’s background characteristics at primary school entry than cognitive outcomes (in line with overall findings reported in EPPE Technical Paper 7). Relationships between the incidence of multiple disadvantage and young children’s social behavioural development at primary school were also investigated. The results show that multiple disadvantage shows a significant association with increased risk of behaviour difficulties for ‘Peer Sociability’ in line with findings at entry to pre-school. In addition, at primary school entry there are indications that multiple disadvantage is beginning to show a significant association with increased risk of ‘Anti-social / Worried’ behaviour. Table F.2 Multiple disadvantage and percentage identified at social behavioural risk at entry to primary school ‘at risk’
Number of factors All children
’at risk’ Anti-social / Worried
‘at risk’ Peer sociability
n %
0 1-2 3-4 5+ Unknown
637 1345 575 151 149
23.5 49.6 21.3 5.5 --
19.9 50.2 22.3 7.7 --
16.9 45.3 27.8 10.1 --
In the sample, 23.5% of children experienced none of the indicators of disadvantage selected. This group was much less likely to be identified as at strong social behavioural risk at entry to primary school (only 19.9%/16.9% of children in this group experienced none of the disadvantage factors in terms of ‘Anti-social / Worried’ and ‘Peer Sociability’ respectively). By contrast, those experiencing 5 or more factors (only 5.5% of all children in the EPPE sample) formed 10.1% of those identified as at strong social behavioural risk in ‘Peer Sociability’ at entry to primary school (this is nearly twice as higher as expected).

96
Glossary of terms
‘Anti-social / Worried’ At primary school entry, teachers rated the social behaviour of EPPE children using the CSBQ. A factor analysis of the 45 items resulted in the extraction of 6 underlying factors. Primary school entry factor 4 measures the child’s tendency to show behaviour that is disruptive to others or that is aggressive or destructive. Often, but not always, such behaviour occurs together with indications of worry or upset by the child. This scale is termed ‘Anti-social / Worried’. Similarly, a factor analysis of the ASBI (rated by a pre-school worker at entry to the study) resulted in the extraction of 5 underlying factors with entry to study factor 4 and 5 measuring ‘Anti-social’ and ‘Worried / Upset’ behaviour. ASBI The Adaptive Social Behaviour Inventory (ASBI) (Hogan et al, 1992) is a rating scale consisting of 30 items completed by a caregiver of a child. The items can be combined to produce factors that are measures of different aspects of the child’s social behaviour. For further details, see Appendix C. ‘at risk’ The EYTSEN report acknowledges that the term ‘at risk’ is a complex one which will differ depending on the particular criteria used. In the EYTSEN study cognitive risk is defined as 1 sd below national average and strong cognitive risk as 1 sd below sample average. Social Behavioural risk is defined as 1 sd below sample average. These provide definitions of children who may be seen to be ‘at risk’ on the basis of their cognitive attainment or Social Behavioural development at entry to pre-school. Attendance The number of sessions attended at the target centre by an EPPE child from entry to study (BAS assessment) until exit from target pre-school centre (from attendance records of pre-school centre). This measure provides a crude indicator of amount of pre-school experience. Baseline measures Social behavioural ratings given by the careworker at entry to the study. These social behavioural scores are subsequently employed as prior social behavioural measures in a value added analysis of pupils’ social behavioural outcomes. Birth weight Babies born weighing 2500 grams (5lbs 8oz) or less are defined as below normal birth weight, fetal infant classification is below 1000 grams, very low birth weight is classified as 1001-1005 grams and low birth weight is classified as 1501-2500 grams (Scott and Caren, 1989). Caregiver Interaction Scale (CIS) A rating scale consisting of 26 items completed by an observer of the interactions between caregivers and children. The items are grouped to produce 4 subscales: positive relationships, punitiveness, permissiveness and detachment. The CIS was developed by Arnett (1989). - Positive relationships is a subscale made up of 10 items indicating warmth and enthusiasm
interaction with children by the caregiver. - Punitiveness is a subscale made up of 8 items indicating harsh or over-controlling behaviour in
interaction with children by the caregiver. - Permissiveness is a subscale made up of 4 items indicating avoidance of discipline and control
of children by the caregiver. - Detachment is a subscale made up of 4 items indicating lack of involvement in interaction with
children by the caregiver. Centre level variance The proportion of variance in a particular child outcome measure (e.g. pre-reading scores at start of primary school) attributable to differences between individual centres rather than differences between individual children. Child background factors Child background characteristics such as age, gender, or ethnicity. Compositional effects The impact of peer group measures on a child’s individual outcomes. For example, when the characteristics of children in a centre (measured as a centre level
97
aggregated variable) show a significant relationship with outcomes at the individual child level, after controlling for the same variable at the individual level. For further details see Harker (2001). ‘Confidence’ At entry to the study, pre-school workers rated the social behaviour of EPPE children using the ASBI. A factor analysis of the 30 items resulted in the extraction of 5 underlying factors. Entry to study factor 3 measures the child’s apparent confidence in his/her own ability and is termed ‘Confidence’. Confidence intervals at the 95% level A range of values which can be expected to include the ‘true’ value in 95 out of 100 samples (i.e. if the calculation was repeated using 100 random samples). Contextualised models Cross-sectional multilevel models exploring children’s social behavioural development at entry to primary school, controlling for child, family and home learning environment characteristics (but not prior social behaviour). These models are equivalent to the cross-sectional multilevel models in Section 2 of EPPE Technical Paper 8a exploring children’s cognitive attainment over the pre-school period, controlling for significant child, parent and home learning environment characteristics. Controlling for Several variables may influence an outcome and these variables may themselves be associated. Multilevel statistical analyses can calculate the influence of one variable upon an outcome having allowed for the effects of other variables. When this is done the net effect of a variable upon an outcome controlling for other variables can be established. ‘Co-operation & Conformity’ At primary school entry, teachers rated the social behaviour of EPPE children using the CSBQ. A factor analysis of the 45 items resulted in the extraction of 6 underlying factors. Primary school entry factor 2 measures the child’s co-operative behaviour and conformity to group norm and is termed ‘Co-operation & Conformity’. Similarly, a factor analysis of the ASBI (rated by a pre-school worker at entry to the study) resulted in the extraction of 5 underlying factors with entry to study factor 1 measuring ‘Co-operation & Conformity’. CSBQ The Child Social Behaviour Questionnaire (CSBQ) is an extension of the ASBI and has 45 items concerning a child’s social behaviour rated by teachers at entry to school. The items can be combined produce factors that are measures of different aspects of the child’s’ social behaviour. For further details see Appendix A. Duration In terms of the value added models, the duration of pre-school covers the time period between date of BAS assessment at entry to the EPPE study until entry to primary school. Note that the number of months of pre-school attended before the child entered the EPPE study is not included in this duration measure. A separate ‘duration’ measure of amount of time in pre-school prior to entering the study was tested but was not found to be significant (note that this ‘duration’ measure is confounded with prior attainment). In the contextualised models, duration of pre-school refers to the time period between entry to the target pre-school until entry to primary school. These duration measures provide a crude indication of length of pre-school experience. ECERS-R and ECERS-E The American Early Childhood Environment Rating Scale (ECERS-R) (Harms et al, 1998) is based on child centred pedagogy and also assesses resources for indoor and outdoor play. The English rating scale (ECERS-E) (Sylva et al, 1999d) was intended as a supplement to the ECERS-R and was developed specially for the EPPE study to reflect the Desirable Learning Outcomes (which have since been replaced by the Early Learning Goals), and more importantly the Curriculum Guidance for the Foundation Stage which at the time was in trial stage. Educational effectiveness Research design which seeks to explore the effectiveness of educational institutions in promoting a range of child / student outcomes (often academic

98
measures although in the case of EPPE, both cognitive and social behavioural) while controlling for the influence of intake differences in child / student characteristics. ‘Empathy & Pro-social’ At primary school entry, teachers rated the social behaviour of EPPE children using the CSBQ. A factor analysis of the 45 items resulted in the extraction of 6 underlying factors. Primary school entry factor 5 measures the child’s ability to show empathy or understanding for another child’s feelings and is termed ‘Empathy & Pro-social’. Family factors Examples of family factors are mother’s qualifications, father’s employment and family SES. Factor scores Factor scores for each child were calculated by averaging the ratings given by the teacher / pre-school centre worker for the questions that form each factor. Hierarchical nature of the data Data that clusters into pre-defined sub-groups or levels within a system (e.g. young children, pre-school centres, LEAs). Home learning environment factors Measures derived from reports from parents (at interview) about what children do at home, for example, playing with numbers and letters, singing songs and nursery rhymes. ‘Independence & Concentration’ At primary school entry, teachers rated the social behaviour of EPPE children using the CSBQ. A factor analysis of the 45 items resulted in the extraction of 6 underlying factors. Primary school entry factor 1 measures the child’s ability to play or work independently showing a certain level of concentration and is termed ‘Independence & Concentration’. Intervention study A study in which researchers ‘intervene’ in the sample to control variables i.e. control by setting, the adult / child ratios in order to compare different specific ratios in different settings. EPPE is not an intervention study in that it investigates naturally occurring variation in pre-school settings. Intra-centre correlation The intra-centre correlation measures the extent to which the scores of children in the same centre resemble each other as compared with those from children at different centres. The intra-centre correlation provides an indication of the extent to which unexplained variance in children’s progress (i.e. that not accounted for by prior attainment) may be attributed to differences between pre-school settings. This gives an indication of possible variation in pre-school effectiveness. Language attainment Composite formed by adding together the scores for two of the BAS assessments (naming vocabulary and verbal comprehension). Multiple Disadvantage Based on three child variables, six parent variables, and one related to the home learning environment, which were considered ‘risk’ indicators when looked at in isolation. A child’s ‘multiple disadvantage’ was calculated by summing the number of indicators the child was at risk on. Multilevel modelling A methodology that allows data to be examined simultaneously at different levels within a system (e.g. young children, pre-school centres, LEAs), essentially a generalisation of multiple regression. Multiple regression A method of predicting outcome scores on the basis of the statistical relationship between observed outcome scores and one or more predictor variables. Net effect The unique contribution of a particular variable upon an outcome while other variables are controlled.

99
Outliers Pre-school centres where children made significantly greater/less social behavioural developmental gains than predicted on the basis of prior social behaviour and other significant child, parent and home learning environment characteristics. Pedagogical strategies Strategies used by the educator to support learning. These include the face interactions with children, the organisation of the resources and the assessment practices and procedures. ‘Peer Sociability’ At primary school entry, teachers rated the social behaviour of EPPE children using the CSBQ. A factor analysis of the 45 items resulted in the extraction of 6 underlying factors. Primary school entry factor 3 measures the child’s ability to play or work well with peers and in groups and is termed ‘Peer Sociability’. Similarly, a factor analysis of the ASBI (rated by a pre-school worker at entry to the study) resulted in the extraction of 5 underlying factors with entry to study factor 2 measuring ‘Peer Sociability’. Pre-reading attainment Composite formed by adding together the scores for phonological awareness (rhyme and alliteration) and letter recognition. Principal components analysis This is a statistical technique for extracting the most important underlying factors from the correlations (measures of association) between a set of variables, and hence enables many separate variables to be reduced to a few underlying factors. Prior attainment factors Measures that describe pupils’ achievement at the beginning of the phase or period under investigation (e.g. taken on entry to primary or secondary school or, in this case, on entry to the EPPE study). Quality Measures of pre-school centre quality collected through observational assessments (ECERS-R, ECERS-E and CIS) made by trained researchers. Sampling profile / procedures The EPPE sample was constructed by:
Five regions (six LEAs) randomly selected around the country, but being representative of urban, rural, inner city areas.
Pre-schools from each of the 6 types of target provision (nursery classes, nursery schools, local authority day care, private day nurseries, play groups and integrated centres) randomly selected across the region. Significance level Criteria for judging whether differences in scores between groups of children or centres might have arisen by chance. The most common criteria is the 95% level (p<0.05) which can be expected to include the ‘true’ value in 95 out of 100 samples (i.e. the probability being one in twenty that a difference might have arisen by chance). Social / behavioural development A child’s ability to ‘socialise’ with other adults and children and their general behaviour to others. Socio Economic Status (SES) Occupational information was collected by means of a parental interview when children were recruited to the study. The Office of Population Census and Surveys OPCS (1995) Classification of Occupations was used to classify mothers and fathers current employment into one of 8 groups: professional non-manual, intermediate non-manual, skilled non-manual, skilled manual, semi-skilled manual, unskilled manual, never worked and no response. Family SES was obtained by assigning the SES classification based on the parent with the highest occupational status. Standard deviation (sd) A measure of the spread around the mean in a distribution of numerical scores. In a normal distribution, 68 percent of cases fall within one standard deviation of the mean and 95 percent of cases fall within two standard deviations.

100
Target centre A total of 141 pre-school centres were recruited to the EPPE research covering 6 types of provision. The sample of children was drawn from these target centres. Value added models Longitudinal multilevel models exploring children’s social behavioural developmental gains over the pre-school period, controlling for prior social behaviour and significant child, parent and home learning environment characteristics. These models are equivalent to the value added multilevel models in Section 3 of EPPE Technical Paper 8a exploring children’s cognitive progress over the pre-school period, controlling for prior attainment and significant child, parent and home learning environment characteristics. Value added residuals Differences between predicted and actual results for pre-school centres (where predicted results are calculated using value added models).

101
References Amato, P. (1987). Children in Australian Families: The growth of competence. Englewood Cliffs, NJ: Prentice Hall. Arnett, J. (1989), 'Caregivers in Day-Care Centres: Does training matter?' Journal of Applied Developmental Psychology, 10, 541-552. Baydar, N., & Brooks-Gunn, J. (1991) Effects of maternal employment and child care arrangements on preschoolers’ cognitive and behavioral outcomes: Evidence from the children of the national longitudinal survey of youth. Developmental Psychology 27, 932-45. Blatchford, P., Goldstein, H., Martin, C. and Browne, W. (2002a), 'A Study of Class Size Effects in English Reception Year Classes'. British Educational Research Journal, 28, 169-186. Blatchford, P., Martin, C., Moriaty, V., Basset, P. and Goldstein, H. (2002b), Pupil Adult Ratio Differences and Educational Progress over Reception and Key Stage1, Department for Education & Skills. Research Report 335. London: HMSO. Coe, R. (2002), It's the Effect Size, Stupid: What effect size is and why it is important. Paper presented at the British Educational Research Association Conference, Exeter. DfE. (1995), Value Added in Education: a briefing paper. London: Department for Education. DfEE. (1996), Desirable Outcomes for Children's Learning on entering compulsory education. London: Department for Education & Employment. DfEE / QCA. (1999), Early Learning Goals. London: DfEE / QCA DfEE / QCA. (2000), Curriculum Guidance for the Foundation Stage. London: DfEE / QCA. Egeland, B, & Heister, M. (1995) The long-term consequences of infant day-care and mother-infant attachment. Child Development, 66, 74-85. Eisenberg, N., Fabes, R., Shepard, S., Guthrie, I., Murphy, B., & Reiser, M. (1999). Parental reactions to children's negative emotions: Longitudinal relations to quality of children's social functioning. Child Development, 70, 513-534. Gage, N. L. (1984), 'What Do We Know about Teaching Effectiveness?' Phi Delta Kappan, 66, 87-93. Glass, G. V., McGaw, B. and Smith, M. L. (1981), Meta-Analysis in Social Research. London: Sage. Goldstein, H. (1995), Multilevel Statistical Models. (2nd ed.). London: Arnold. Goldstein, H., Rasbash, J., Yang, M., Woodhouse, G., Pan, H., Nuttall, D. and Thomas, S. (1992), 'A multilevel analysis of examination results'. Oxford Review of Education, 19, 425-433.
Goodman, R. (1997), 'The Strengths & Difficulties Questionnaire: A Research Note'. Journal of Child Psychology & Psychiatry, 38, 581-586.
Harker, H. (2001), The Effects of Student Composition on School Outcomes. Paper presented at the British Educational Research Association Conference, Leeds.
102
Harms, T., Clifford, M. and Cryer, D. (1998), Early Childhood Environment Rating Scale, Revised Edition (ECERS-R). Vermont: Teachers College Press. Haskins, R. (1985). Public school aggression among children with varying day-care experience. Child Development, 56, 689-703 HMSO. (1989), Children Act. London: HMSO. HMSO. (1996), Nursery Education and Grant Maintained Schools Act. London: HMSO.
Hofferth, S. (1999, April). Child care in the first three years of life and preschoolers' language and behavior. Paper presented at the biennial meeting of the Society for Research in Child Development, Albuquerque, New Mexico. Hogan, A. E., Scott, K. G. and Baurer, C. R. (1992), 'The Adaptive Social Behavior Inventory (ASBI): A new assessment of social competence in high risk three year olds.' Journal of Psychoeducational Assessments, 10, 230-239.
Howes, C. & Olencik, M. (1986). Family and child care influences on toddler’s compliance. Child Development, 57, 202-216.
Howes, C., Matheson, C. C., & Hamilton, C. E. (1994). Maternal, teacher, and child care correlates of children’s relationships with peers. Child Development, 65, 253-263. Lamb, M., Sternberg, K., Hwang, C. & Broberg, A. (Eds.) (1992). Child Care in Context. Hillsdale, NJ: Lawrence Erlbaum. Maccoby, E. E. (1998). The Two Sexes: Growing up apart, coming together. Cambridge, MA: Harvard University Press. Melhuish, E. C., Sylva, K., Sammons, P., Siraj-Blatchford, I. and Taggart, B. (1999), The Effective Provision of Pre-School Education (EPPE) Project: Technical Paper 4 - Parent, Family and Child Characteristics in Relation to Type of Pre-school and Socio-Economic Differences. London: DfEE / Institute of Education, University of London. Melhuish, T., Sylva, K., Sammons, P., Siraj-Blatchford, I. and Taggart, B. (2001), The Effective Provision of Pre-School Education (EPPE) Project: Technical Paper 7 - Social/Behavioural and Cognitive Development at 3-4 Years in Relation to Family Background. London: DfEE / Institute of Education, University of London. Melhuish, E. C., Quinn, L., Sylva, K., Sammons, P., Siraj-Blatchford, I., Taggart, B. and Currie, G. (2002), The Effective Pre-School Provision Northern Ireland (EPPNI) Project: Technical Paper 4 - Developmental Progress for Social/Behavioural Variables at the Start of Primary School. Belfast: Stranmillis University College. Melhuish, E. C., Quinn, L., Sylva, K., Sammons, P., Siraj-Blatchford, I., Taggart, B. and Shields, C. (2000), The Effective Pre-School Provision Northern Ireland (EPPNI) Project: Technical Paper 5 - Progress of Cognitive Development at the Start of P1. Belfast: Stranmillis University College. Mortimore, P., Sammons, P., Stoll, L., Lewis, D. and Ecob, R. (1988), School Matters: The Junior Years. Wells: Open Books. Mortimore, P., Sammons, P. and Thomas, S. (1994), 'School effectiveness and value added measures'. Assessment in Education: Principles, Policy & Practice, 1, 315-332.
103
Munton, T., Barclay, L., Mallardo, M. and Barreau, S. (2002), Research on ratios, group size and staff qualifications and training in early years and childcare settings, Department for Education & Skills. Research Report RR320. London: HMSO. NICHD. (2002), 'Early Child Care and Children's Development Prior to School Entry: results from the NICHD Study of Early Child Care.' American Educational Research Journal, 39, (1): 133-164. NICHD (In press). Does amount of time spent in child care predict socioemotional adjustment during the transition to kindergarten? Child Development. Office of Population, Censuses and Surveys. (1995), Classification of occupations and coding index. London: HMSO. Paterson, L. and Goldstein, H. (1991), 'New statistical methods of analysing social structures: an introduction to multilevel models'. British Educational Research Journal, 17, (4): 387-393. QCA. (1999), Early years education, childcare and playwork: A framework of nationally accredited qualifications. London: Qualifications and Curriculum Authority. Sammons, P., Sylva, K., Melhuish, E. C., Siraj-Blatchford, I. and Taggart, B. (1999), The Effective Provision of Pre-School (EPPE) Project: Technical Paper 2 - Characteristics of the EPPE project sample at entry to the study. London: DfEE / Institute of Education, University of London. Sammons, P., Sylva, K., Melhuish, E. C., Siraj-Blatchford, I., Taggart, B. and Elliot, K. (2002), The Effective Provision of Pre-School Education (EPPE) Project: Technical Paper 8a - Measuring the Impact of Pre-School on Children's Cognitive Progress over the Pre-School Period. London: DfES / Institute of Education, University of London. Sammons, P., Smees, R., Taggart, B., Sylva, K., Melhuish, E. C., Siraj-Blatchford, I. and Elliot, K. (2002), The Early Years Transition and Special Educational Needs (EYTSEN) Project: Technical Paper 1 - Special Needs Across the Pre-School Period. London: DfES / Institute of Education, University of London. Scott, K. and Carran, D. (1989), 'Identification and Referral of Handicapped Infants'. In M. C. Wang, M. C. Reynolds and H. J. Walberg (eds), Handbook of Special Education Research and Practice/Vol.3, Low Incidence Conditions (pp. 227-242). Siraj-Blatchford, I., Sylva, K., Melhuish, E. C., Sammons, P. and Taggart, B. (1999), The Effective Provision of Pre-School Education (EPPE) Project: Technical Paper 3 - Contextualising EPPE: Interviews with local authority co-ordinators and centre managers. London: DfEE / Institute of Education, University of London. Siraj-Blatchford, I., Sylva, K., Muttock, S., Gilden, R. and Bell, D. (2002), Researching Effective Pedagogy in the Early Years (REPEY): DfES Research Report 356. London: DfES, HMSO. Siraj-Blatchford, I., Sylva, K., Taggart, B., Sammons, P. and Melhuish, E. C. (forthcoming), The Effective Provision of Pre-School Education (EPPE) Project: Technical Paper 10 - The EPPE Case Studies. London: DfES / Institute of Education, University of London. Strand, S. (2002), 'Pupil Mobility, Attainment and Progress During Key Stage 1: a study in cautious interpretation'. British Education Research Journal, 28, 63-78. Sylva, K., Sammons, P., Melhuish, E. C., Siraj-Blatchford, I. and Taggart, B. (1999), The Effective Provision of Pre-School Education (EPPE) Project: Technical Paper 1 - An Introduction of EPPE. London: DfEE / Institute of Education, University of London.

104
Sylva, K., Siraj-Blatchford, I., Melhuish, E. C., Sammons, P. and Taggart, B. (1999), The Effective Provision of Pre-School Education (EPPE) Project: Technical Paper 6 - Characteristics of the Centres in the EPPE Sample: Observation Profiles. London: DfEE / Institute of Education, University of London. Sylva, K., Siraj-Blatchford, I., Melhuish, E. C., Sammons, P. and Taggart, B. (1999), The Effective Provision of Pre-School Education Project: Technical Paper 6a - Characteristics of Pre-School Environments. London: DfEE / Institute of Education, University of London. Sylva, K., Siraj-Blatchford, I. and Taggart, B. (1999), The Early Childhood Environmental Rating Scale: 4 Curricular Subscales Draft. London: Institute of Education. Taggart, B., Sylva, K., Siraj-Blatchford, I., Melhuish, E. C., Sammons, P. and Walker-Hall, J. (1999), The Effective Provision of Pre-School Education (EPPE) Project: Technical Paper 5 - Characteristics of the Centres in the EPPE Sample: Interviews. London: DfEE / Institute of Education, University of London. Tizard, P., Blatchford, P., Burke, J., Farquhar, C. and Plewis, I. (1988), Young Children at School in the Inner City. Hove: Lawrence Erlbaum Associates Ltd. Tymms, P., Merrell, C. and Henderson, B. (1997), 'The First Year at School: A Quantitative Investigation of the Attainment and Progress of Pupils'. Educational Research and Evaluation, 3, 101-118. Vandell, D. L., Henderson,V. K. & Wilson, K. S. (1988). A longitudinal study of children with day-care experiences of varying quality. Child Development, 59, 1286-1292.

Ordering Information: The Bookshop at the Institute of Education,
20, Bedford Way, London, WC1H 0AL
Telephone: 020 7612 6050 Facsimile: 020 7612 6407 Email: [email protected] website: www.johnsmith.co.uk/ioe
Price £8.50
ISBN 0-85473-683-2
Address for correspondence:
EPPE Project Room 416 University of London Institute of Education 20 Bedford Way London WC1H 0AL
Tel: +44 (0) 20 7612 6219 Fax: +44 (0) 20 7612 6230
Email: [email protected] Website: http://www.ioe.ac.uk/projects/eppe