the countryside in figures: pangasinanrsso01.psa.gov.ph/sites/default/files/2019 pangasinan... ·...
TRANSCRIPT
The COUNTRYSIDE IN FIGURES: PANGASINAN
6th Edition, 2019
is a publication prepared by the Pangasinan Provincial Statistical Office of the PHILIPPINE STATISTICS AUTHORITY
For technical inquiries, please contact us at: (075) 633-8075 or email us at [email protected]
TERMS OF USE OF PSA PUBLICATIONS
The PSA reserves its exclusive right to reproduce all its publications in whatever form. · Any part of this publication should not be reproduced, recopied, lend or
repackaged for other parties for any commercial purposes without written permission from the PSA. · Any part of this publication may only be reproduced for internal
use of the recipient/customer company. · Should any portion of the data in this publication are to be included in a report/article, the source of the data, the title of the
publication and the PSA as publisher should always be cited. · Any information derived from the manipulation of data contained in the publication will no longer be the responsibility of PSA.
Published by the Philippine Statistics Authority
Pangasinan Provincial Statistical Office 2nd and 3rd Floor MB Bldg., Nalsian Rd., cor De Venecia St.
Calasiao, Pangasinan Philippines.
December 2019
The CIF: Pangasinan, 6th Edition, 2019 is available in printed and electronic formats (Excel/Word/PDF in CDRom).
For details, please contact us at (075) 633-8075 or at [email protected]

i
FOREWORD In line with our commitment to provide relevant and more disaggregated statistics at the local level, the Philippine Statistics Authority (PSA), through the Regional Division I (RD I), has come up with the Sixth Edition of The Countryside in Figures: Pangasinan. This sixth issue provides provincial data and municipal disaggregation of statistics from various sectors, such as general information, governance, agriculture, education, energy, finance, health, income and prices, infrastructure, public order, tourism and transportation and communication. Further, this publication contains indicators comparing the performance of Pangasinan with those of other provinces in Region I, as well as rankings of the 4 cities and 44 municipalities of the province based on their social economic performance. Sectoral highlights are also included to guide our data users in their analysis. We hope that this publication will provide relevant and timely information about the province and will serve the need for more comprehensive statistics useful in planning, decision-making and policy setting towards effective governance and public service at the local level. Through The Countryside in Figures: Pangasinan, we hope we can contribute to countryside development. The PSA acknowledges the assistance of the Provincial Government of Pangasinan, thru its Provincial Planning and Development Office, in coordinating data collection at the provincial and municipal/city levels. We are likewise grateful to the various data producing agencies at the regional and local levels for providing the data inputs to this publication.
CLAIRE DENNIS S. MAPA, Ph.D. National Statistician and Civil Registrar General

ii
F O R E W O R D
Statistics serves as prime indicator and guide on where an institution or organization should focus its set of priorities, programs and projects beneficial on improving and uplifting the lives of the people as it proves to be the barometer in finding long-term solutions for the success of every undertaking. It is for these reasons that I have so much respect for the working force of the Philippine Statistics Authority (PSA) who are continuously exerting all efforts to effectively partner with the local government units through a clear vision of an unmatched performance and quality service in our mutual aim to uplift the people from extreme poverty. As a Hall of Famer in the line of statistics, Pangasinan can now look forward, dream bigger, and take big leaps towards greater economic progress and prosperity. Hence, as you prepare your report for 2019 Countryside in Figures 6th Edition, may I urge other LGUs to put statistics in a brighter light and accept the tasks in performing a greater role in achieving a brighter future for our beloved country. With this, I am seeking for your support in helping us achieve more breakthroughs for Pangasinan and for the entire nation, as well. For this, I say congratulations for a job well done!
HON. AMADO “POGI” I. ESPINO III Governor

iii
PSA Publications
Multisectoral Statistics
·· The Philippine Statistical Yearbook *
·· The Countryside in Figures * (Philippines, selected provinces)
·· Regional Social and Economic Trends (RSET) (CAR, I , V, VI, VIII, IX , X, XI, XII)*
·· Metro Manila: Gateway to the Philippines
Economic Statistics
·· National Accounts of the Philippines: Quarterly, Annual and Annual with Consolidated Accounts and Income and Outlay Accounts *
·· Gross Regional Domestic Product *
·· Gross Regional Domestic Expenditure *
·· Input-Output Accounts of the Philippines *
·· Economic Indicators *
·· Quarterly Economic Indices*
·· Foreign Direct Investments*
·· Food Balance Sheet of the Philippines*
·· Leading Economic Indicators Social Statistics
·· Official Poverty Statistics of the Philippines*
·· Statistical Handbook on Women and Men (Philippines, CAR, I, V, VI, VIII, IX, X, XI, XII)*
·· Report on the Philippine Human Development Index
·· Philippine National Health Accounts
·· National Education Expenditure Accounts
·· Poverty Maps (Selected Provinces)*
Environmental Statistics
·· Compendium of Philippine Environment Statistics*
Statistical Standards and Classifications
·· Philippine Standard Industrial Classification (PSIC)*
·· Philippine Standard Commodity Classification (PSCC)*
·· Philippine Standard Classification for Education (PSCEd)*
·· Philippine Standard Occupational Classification (PSOC)*
·· Philippine Central Product Classification (PCPC)*
Reference Materials
·· Philippine Statistical Development Program*
·· NSCB Annual Report*
·· Profile of Censuses and Surveys conducted by the Philippine Statistical System*
·· Directory of Government Statistical Services in the Philippines (DGSSP)*
·· A Guide to Statistics for Business Planning
·· Framework for the Development of Environment Statistics
·· State of the Philippine Land and Soil Resources
·· Statistics for Entrepreneurs
Proceedings of Conventions
·· National Convention on Statistics*
·· Asian Regional Section, International Conference on Statistical Computing
Information Sheets
·· Statwatch (Philippines, CAR, I, V, VI, VIII, IX, X, XI, XII and selected provinces and cities)
·· Factsheets (Philippines, CAR, I, V, VI, VIII, IX, X, XI, XII)
·· MDG Watch (Philippines, CAR, I, V, VI, VIII, IX, X, XI, XII)
·· Genderwatch (VI)
·· Statwatch on Children (VI)
·· Stat Informer (VI)
·· Stat Trivia (CAR)
·· Statistics Series
Technical Papers
·· Gearing a National Statistical System Towards the Measurement of the Impact of Climate Change: The Case of the Philippines (2008)
·· Distributive Trade Statistics in the Philippines (2006)

iv
·· Official Poverty Statistics in the Philippines: Methodology and 2003 Estimates (2006)
·· Real Estate Price Index: A Model for the Philippines (2004)
·· Official Provincial Poverty Statistics in the Philippines and the Issue of Comparability Across Space (2003)
·· The NSCB: Our Products and Services (2003)
·· Enhancing the Relevance of the Philippine System of National Accounts (2002)
·· The Philippine Tourism Satellite Accounts: Dealing with Data Shortfalls (2002)
·· Development, Institutionalization and Improvement of the Philippine National Health Accounts (2001)
·· Measuring the Contribution of the Informal Sector in the Philippines (2001)
·· Rebasing, Linking and Constant Price Estimation of the National Accounts of the Philippines (2001)
·· Recent Initiatives of the NSCB in Improving Official Statistics in the Philippines (2001)
·· Environmental Accounting in the Philippines (2000)
·· Poverty Assessment in the Philippines (2000)
Online Articles and References
·· Statistically Speaking
·· Statistical Indicators for Philippine Development (StatDev)
·· Philippine Standard Geographic Codes
·· Provincial and Municipal Profiles
·· Statistical Reference System
·· Official Concepts and Definitions for Statistical Purposes
·· Technical Notes
* CD-ROM versions of publications are available
in PDF format.

v
Other PSA Products and Services
Products
1. Statistical policies and measures to resolve specific issues and
provide policy directions in the Philippine Statistical System (PSS) 2. The Philippine Statistical Development Program (PSDP) to serve
as blueprint of priority programs and activities to be undertaken to improve the PSS in the Medium Term
3. National Accounts and related economic accounts to assess the
economic performance of the country thru the following: § National Accounts § Regional Accounts § Input-Output (I-O) Accounts § Consolidated and Income and Outlay Accounts § Tourism Satellite Accounts § Economic -Environmental and Natural Resources Accounts § National Health Accounts § National Education Accounts § Informal Sector § Contribution of Women to the Economy
4. Other social and economic indicators
§ Poverty statistics § Happiness index § Good governance index § Environment statistics § Gender statistics (including children) § Gender development index § Food balance sheet § Quarterly economic indices § Foreign direct investment statistics § Leading economic indicators § Statistical indicators for Philippine development § Human development index
§ Hunger Index
5. Standards and classification systems to prescribe uniform standards in government statistics § Philippine Standard Occupational Classification (PSOC) § Philippine Standard Commodity Classification (PSCC) § Philippine Standard Industrial Classification (PSIC) § Philippine Standard Geographic Code (PSGC) § Philippine Standard Classification of Education (PSCED) § Philippine Central Product Classification (PCPC)
6. Statistical publications to disseminate the most relevant
information produced by the PSS and to make statistics more accessible to the public
Services
1. One-stop statistical information center – the National Statistical
Information Center (NSIC) 2. Monitoring of designated statistics 3. Coordination of subnational statistical system 4. Coordination of inter-agency concerns on statistics 5. Survey review and clearance 6. Online statistical service through the Internet
(http://www.psa.gov.ph) 7. Servicing data requests 8. Technical services 9. Advocacy for statistical awareness
§ National Statistics Month § National Convention on Statistics § Government Statistics Accessibility Program § Hosting of international conferences in statistics § Users fora, workshops, seminar

The Countryside in Figures: Pangasinan, 6th Edition 2019
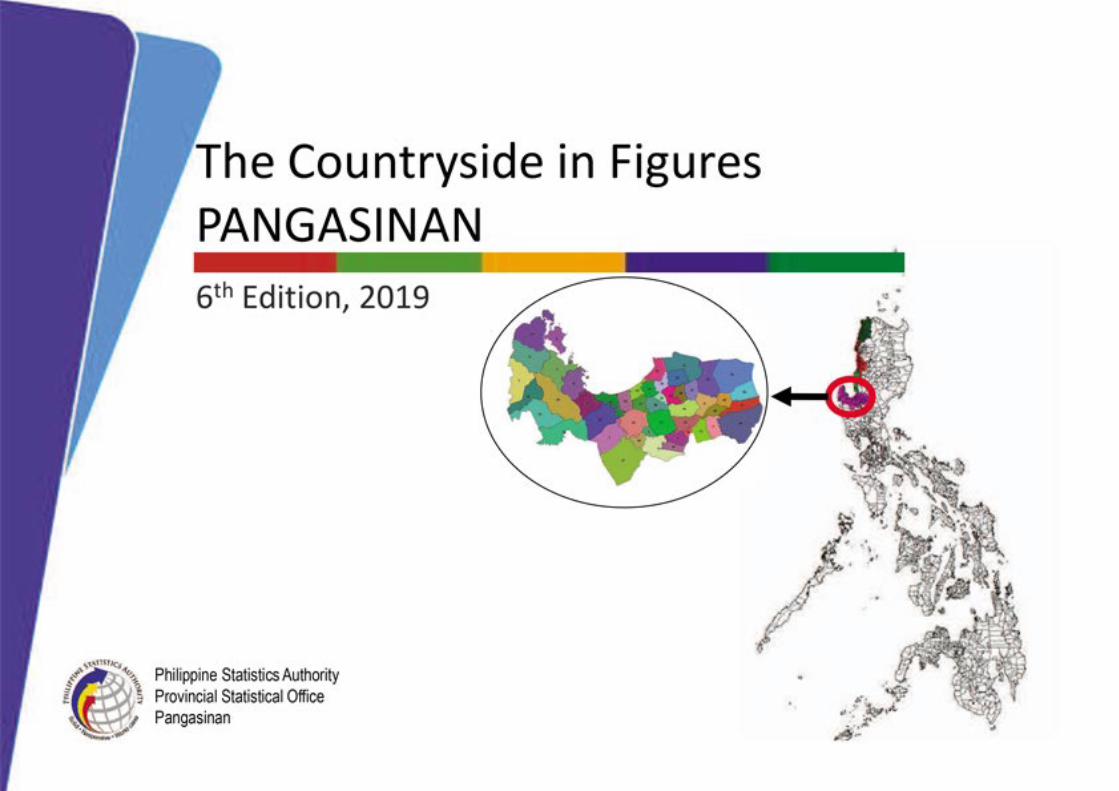
Figure 1: Map of the Philippines Identifying the Location of
Ilocos Region and Province of Pangasinan

The Countryside in Figures: Pangasinan, 6th Edition 2019
Figure 2: Map of the Province of Pangasinan Identifying the Municipalities and Cities by
Municipal Code
1 Agno 11 Bayambang 21 Labrador 31 Rosales 41 Sison
2 Aguilar 12 Binalonan 22 Lingayen 32 San Carlos City 42 Sual
3 Alaminos City 13 Binmaley 23 Mabini 33 San Fabian 43 Tayug
4 Alcala 14 Bolinao 24 Malasiqui 34 San Jacinto 44 Umingan
5 Anda 15 Bugallon 25 Manaoag 35 San Manuel 45 Urbiztondo
6 Asingan 16 Burgos 26 Mangaldan 36 San Nicolas 46 Urdaneta City
7 Balungao 17 Calasiao 27 Mangatarem 37 San Quintin 47 Villasis
8 Bani 18 Dagupan City 28 Mapandan 38 Santa Barbara 48 Laoac
9 Basista 19 Dasol 29 Natividad 39 Santa Maria
10 Bautista 20 Infanta 30 Pozorrubio 40 Santo Tomas

viii
TABLE OF CONTENTS Foreword i-ii
National Statistician Provincial Governor
PSA Publications iii
Other PSA Products and Services v
Map of the Philippines Identifying the Location of ILOCOS Region and Province of PANGASINAN vi
Map of the Province of PANGASINAN Identifying the Cities and Municipalities vii
Names of City/Municipal Mayors xii
Names of Provincial Officials xiv
Overview of the Province xv
Top Performing Local Government Units 1-10
GENERAL INFORMATION 11-24
Highlights Population, 2015
Land Area Population Density, 2015
Projected Population, 2016 to 2020 Number of Barangays, as of August 2015
Number of Registered Voters, 2013 and 2016
GOVERNANCE 25-30
Highlights Internal Revenue Allotment Allocation, 2018

ix
AGRICULTURE 31-40
Highlights Palay Production, 2018
Livestock Population, 2018 Poultry Population, 2018
EDUCATION 41-70 Highlights
Number of Child Development Centers, 2018 Number of Child Development Workers, 2018
Number of Enrollees in Public Elementary Schools, 2018-2019
Number of Enrollees in Public Secondary (Junior High) Schools, 2018-2019 Number of Enrollees in Public Secondary (Senior High) Schools, 2018-2019
Number of Teachers in Private Elementary Schools, 2018-2019
Number of Teachers in Private Secondary (Junior High) Schools, 2018-2019 Number of Teachers in Private Secondary (Senior High) Schools, 2018-2019
Number of Public Elementary Schools, 2018-2019 Number of Public Secondary (Junior High) Schools, 2018-2019
Number of Private Secondary (Senior High) Schools, 2018-2019
ENERGY 71-80
Highlights Potential Household Connections, 2018
Actual Households Connections, 2018 Percent of Barangays Energized, 2018
FINANCE 81-90
Highlights Number of Universal and Commercial Banks, 2018
Number of Thrift Banks, 2018 Number of Rural and Cooperative Banks, 2018
Number of Automated Teller Machines (ATMs), 2018

x
HEALTH 91-108 Highlights
Contraceptive Prevalence Rate, 2018 Number of Health Facilities, 2018
Number of Live Births, 2018 Number of Infant Deaths, 2018
Infant Mortality Rate, 2018
INCOME AND PRICES
109-114
Highlights
Revenue and Expenses, 2018
INFRASTRUCTURE 115-144
Highlights Length of Barangay Roads by Pavement Type, 2016
Length of Municipal Roads by Pavement Type, 2016 Length of Provincial Roads by Pavement Type, 2016
Length of National Roads by Pavement Type, 2016 Length of Municipal Bridges by Type, 2016
Length of Provincial Bridges by Type, 2016 Length of National Bridges by Type, 2016
PUBLIC ORDER 145-162
Highlights Total Number of Index Crimes, 2018
Total Number of Non-index Crimes, 2018 Total Number of Firetrucks, 2018
Total Number of Firemen, 2018 TOURISM 163-166
Number of Tourist Arrivals Based on Accommodation Establishments, 2017 Number of Tourist Arrivals in Tourist Destinations, 2017
xi
TRANSPORTATION AND COMMUNICATION
167-178
Highlights Total Number of Motor Vehicles Registered by Classification and Mode of Registration, 2017
Total Number of Motor Vehicles Registered by Type, 2017 Total Number of Post Offices, 2016
Total Number of Letter Carriers, 2016
Average Monthly Mail Volume, 2016 Total Number of Subscribed Telephone Lines, 2016
Total Number of Available Telephone Lines, 2016
ANNEXES 179-184 General Notes
Symbols Used Ranking
Glossary of Terms Data Sources

1. Agno Hon. Gualberto R. Sison 1. Aguilar Hon. Roldan C. Sagles
2. Anda Hon. Joganie C. Rarang 2. Basista Hon. Jolly R. Resuello
3. Bani Hon. Cothera Gwen P. Yamamoto 3. Binmaley Hon. Simplicio D. Rosario
4. Bolinao Hon. Alfonso D. Celeste 4. Bugallon Hon. Priscilla I. Espino
5. Burgos Hon. Ronald G. Ngayawan 5. Labrador Hon. Dominador V. Arenas
6. Dasol Hon. Noel A. Nacar 6. Lingayen Hon. Leopoldo N. Bataoil
7. Infanta Hon. Marvin M. Martinez 7. Mangatarem Hon. Ramil P. Ventenilla
8. Mabini Hon. Ariel G. De Guzman 8. Urbiztondo Hon. Martin Raul S. Sison II
9. Sual Hon. Liseldo D. Calugay
10. Alaminos City Hon. Arth Bryan C. Celeste
1. Bayambang Hon. Cezar T. Quiambao 1. Manaoag Hon. Kim Mikael D. Amador
2. Calasiao Hon. Joseph Arman C. Bauzon 2. Mangaldan Hon. Mary Marilyn D. Lambino
3. Malasiqui Hon. Noel Anthony M. Geslani 3. San Fabian Hon. Constante B. Agbayani
4. Mapandan Hon. Anthony C. Penuliar 4. San Jacinto Hon. Leo F. De Vera
5. Santa Barbara Hon. Joel F. Delos Santos 5. Dagupan City Hon. Mark Brian C. Lim
6. San Carlos City Hon. Julier C. Resuello
Fourth DistrictThird District
The Countryside in Figures: Pangasinan, 6th Edition 2019: City/Municipal Mayors
First District
City/Municipality
Second District
City/MunicipalityName of Mayor Name of Mayor
xii

Governor HON. AMADO I. ESPINO, III
Vice - Governor HON. JOSE FERDINAND Z. CALIMLIM JR.
Representatives
District I HON. ARNOLD "NOLI" D. CELESTE
District II HON. JUMEL ANTHONY I. ESPINO
District III HON. ROSE MARIE "BABY" J. ARENAS
District IV HON. CHRISTOPHER V. DE VENECIA
District V HON. RAMON "MON-MON" V. GUICO
District VI HON. TYRONE D. AGABAS
District II
HON. VON MARK R. MENDOZA
HON. NESTOR D. REYES
District IV
HON. LIBERATO Z. VILLEGAS
HON. JEREMY AGERICO B. ROSARIO
District VI
HON. NOEL C. BINCE
HON. SALVADOR S. PEREZ, JR.
HON. JOSE G. PERALTA
President - Philippine Councilors League HON. SHIELA MARIE PEREZ-GALICIA
President - SK Provincial Federation HON. JEROME VIC ESPINO
SECTORAL REPRESENTATIVES
President - Liga ng mga Barangay
District V
HON. NICHOLI JAN LOUIE Q. SISON
HON. VICI M. VENTANILLA
HON. ANGEL M. BANIQUED, JR.
HON. CHINKY PEREZ-TABABA
The Countryside in Figures: Pangasinan, 6th Edition 2019: Provincial Officials
District I
HON. DONABEL N. FONTELERA
HON. MARGIELOU ORANGE H. VERSOZA
District III
PROVINCIAL BOARD MEMBERS
xiv

xv
OVERVIEW OF THE PROVINCE
Created in 1580 by Governor General Ronquillo de Penalosa, the Province of Pangasinan was among the earliest political and administrative units in the Philippines. It was officially conquered and colonized by D. Martin de Goiti in 1571. At that time, its territorial jurisdiction extended to the present province of Zambales and parts of La Union and Tarlac. The province has always been known in historical accounts as Pangasinan which figuratively means “where salt is made”. By the middle of the 19th century, however, the northern towns of Agoo to Bacnotan were separated from the province and became parts of La Union. The provincial territory was further diminished in 1875 with the annexation of Paniqui and other towns south of Tarlac. Pangasinan is located on the northwest portion of the Central Plains of Luzon. It is bounded in the north by Lingayen Gulf, La Union and Benguet, in the northeast by Nueva Vizcaya, in the east by Nueva Ecija, Tarlac in the south, and Zambales and China Sea in the west. It has an area of 5,368.2 sq. km., comprising of six congressional districts, four cities, 44 municipalities and 1,364 barangays. The province had a total population of 2,956,726 as of the latest population census (2015), accounting for more than one-half of the total regional population. It was the fourth most populous province in the country in 2015. There are two dialects spoken in the province. The Pangasinan dialect is common to the households in the central part of the province while the western and eastern portions speak Ilocano. Bolinao, however, has a dialect of its own. English and Filipino are languages used in government, school and business. Although several religious sectors are present, Roman Catholic is the prevalent religion. With its vast tract of fertile lands suitable for growing high value crops, Pangasinan is an agricultural province with the following farm products: palay, corn, vegetables, fruits and rootcrops. It exports high quality mangoes, acclaimed to be sweeter and finer in texture than those of other provinces in the country, and milkfish or “bangus” which is considered to be one of the best tasting fishes in the world. Because of its extensive shoreline and rivers, the province is considered the major fish producer and supplier in Northern Luzon. It also has vast deposits of mineral resources such as limestone, chromite, manganese, sand and gravel. Apart from its rich heritage, Pangasinan is also known for its wares and edibles, such as: snow white salt, bagoong (fermented fish), sweet bocayo (coconut candy), tupig (banana leaf-wrapped rice) and white gold puto. Pangasinan is accessible through any mode of transportation. It is approximately 170 kms. from Manila and it takes about four hours to reach Pangasinan by bus, passing through the Manila North Road or through Tarlac via the Romulo Highway or the Olongapo-Alaminos-Bugallon road via Zambales. Aircon and ordinary buses ply the route 24 hours daily.
xvi
Due to its accessibility, it is known as “gateway of opportunities” to the North and is situated at the geographical center for commerce and trade, making it the most strategically-located distribution hub in the Northern Luzon Growth Quadrangle. In the province situates big commercial and financial centers north of Manila. The province had an extensive road network and bridges interlinking major trade centers that provide accessibility to agriculture and tourism areas in the province. It also has two existing feeder airports in Lingayen and Rosales. The existence of the 1218 MW Team Energy Sual Power Station and the 345 MW San Roque Hydro Power Plant in the province provided adequate power supply for the Luzon Power Grid.

The Countryside in Figures: Pangasinan, 6th Edition 2019
Top Performing Local Government Units

1
San Carlos City 188,571 Mabini 85
Dagupan City 171,271 Infanta 97
Urdaneta City 132,940 Burgos 165
Malasiqui 130,275 Agno 165
Bayambang 118,205 San Nicolas 169
Mangaldan 106,331 Dasol 175
Lingayen 103,278 Natividad 181
Calasiao 95,154 Santo Tomas 183
Alaminos City 89,708 Aguilar 213
Binmaley 83,052 Mangatarem 231
5
2015
10
9
8
RANK RANK
6
5
HIGHEST IN POPULATION LOWEST IN POPULATION DENSITY
The Countryside in Figures: Pangasinan, 6th Edition 2019: Top Performing Local Government Units
GENERAL INFORMATION
7
3 3
2
1
2016
10
9
8
7
6
44
2
1
2

2
The Countryside in Figures: Pangasinan, 6th Edition 2019: Top Performing Local Government Units
in PhP in thousand
San Carlos City 611,962,401 Dagupan City 286,171
Dagupan City 485,691,584 San Carlos City 206,076
Urdaneta City 476,653,624 Urdaneta City 154,484
Alaminos City 461,989,053 Sual 153,062
Malasiqui 243,225,337 Alcala 89,959
Bayambang 227,397,900 Umingan 82,342
Mangaldan 195,389,186 Bayambang 73,662
Lingayen 193,413,221 Bolinao 71,824
Mangatarem 186,898,707 Manaoag 69,339
Bolinao 181,009,232 Calasiao 68,709
5
2018
10
6
1
2
3
9
2
5
GOVERNANCE
4
HIGHEST IRA ALLOCATION
RANK
HIGHEST FINANCIAL PERFORMANCE-SURPLUS/(DEFICIT)
RANK
7
8
1
2018
3
10
9
8
7
6
4
3

3
The Countryside in Figures: Pangasinan, 6th Edition 2019: Top Performing Local Government Units
# of Pupils # of Students
San Carlos City 31,538 San Carlos City 17,590
Dagupan City 26,855 Dagupan City 16,690
Malasiqui 20,733 Malasiqui 12,806
Bayambang 19,214 Lingayen 10,847
Lingayen 17,010 Bayambang 9,792
Mangaldan 16,530 Mangaldan 8,613
Bolinao 13,520 Calasiao 7,536
Calasiao 13,475 Mangatarem 7,383
San Fabian 12,448 Bolinao 7,307
Binmaley 12,022 San Fabian 6,72610
7
8
1
9
10
5
6
7
8
9
RANK
PUBLIC AND PRIVATE SCHOOLSPUBLIC AND PRIVATE SCHOOLS
SY 2018 - 2019
5
6
2
1
SY 2018 - 2019
RANK
HIGHEST NUMBER OF ENROLLEES (ELEMENTARY)
HIGHEST NUMBER OF ENROLLEES
(JUNIOR SECONDARY)
EDUCATION
4
3
2
4
3
4

4
The Countryside in Figures: Pangasinan, 6th Edition 2019: Top Performing Local Government Units
# of Students # of Schools
Dagupan City 11,331 San Carlos City 75
San Carlos City 6,987 Dagupan City 64
Malasiqui 4,404 Malasiqui 62
Lingayen 3,816 Bayambang 57
Bayambang 3,627 Mangatarem 51
Calasiao 2,956 Umingan 49
Bolinao 2,737 Lingayen 48
Mangatarem 2,547 Bolinao 40
Santa Barbara 2,120 Rosales 40
Urbiztondo 2,065 Calasiao 39
7
5
6
7
8
9
10
PUBLIC AND PRIVATE SCHOOLS
SY 2018 - 2019
1
2
3
4
9
10
PUBLIC AND PRIVATE SCHOOLS
SY 2018 - 2019
1
2
3
4
5
6
HIGHEST NUMBER OF ENROLLEES
(SENIOR SECONDARY)HIGHEST NUMBER OF SCHOOLS (ELEMENTARY)
RANK RANK
EDUCATION
8
5

5
The Countryside in Figures: Pangasinan, 6th Edition 2019: Top Performing Local Government Units
# of Schools # of Schools
Dagupan City 39 San Carlos City 34
San Carlos City 38 Dagupan City 32
Malasiqui 23 Malasiqui 22
Bolinao 17 Sison 16
Calasiao 17 Bolinao 15
Lingayen 16 Pozzorubio 12
Sison 16 Bayambang 11
Bayambang 14 Lingayen 11
Umingan 14 Umingan 11
Asingan 13 Bani 10
10 Mangaldan 13 10 Calasiao 10
Pozzorubio 13 Mangatarem 10
San Nicolas 10
7
8
9
5
PUBLIC AND PRIVATE SCHOOLS
SY 2018 - 2019
1
2
3
4
6
7
8
9
PUBLIC AND PRIVATE SCHOOLS
SY 2018 - 2019
1
2
RANK RANK
4
3
5
6
EDUCATION
HIGHEST NUMBER OF SCHOOLS
(JUNIOR SECONDARY)
HIGHEST NUMBER OF SCHOOLS (SENIOR
SECONDARY)
6

6
The Countryside in Figures: Pangasinan, 6th Edition 2019: Top Performing Local Government Units
in % in metric tons
1 Urdaneta City 164.7 1 Umingan 96,737.92
2 San Manuel 164.3 2 Mangatarem 69,086.01
3 Infanta 153.8 3 San Manuel 52,577.68
4 Calasiao 150.0 4 Villasis 47,115.27
5 Burgos 142.9 5 San Carlos City 45,116.07
6 Labrador 140.0 6 Rosales 45,046.25
7 Anda 133.3 7 Asingan 43,135.56
8 San Jacinto 131.6 8 Alaminos City 42,553.12
9 Aguilar 131.3 9 San Quintin 39,734.35
10 Binalonan 125.0 10 Urdaneta City 37,826.70
20182018
HIGHEST PERCENTAGE OF CHILD DEVELOPMENT
CENTERS TO NUMBER OF BARANGAYS
RANK
AGRICULTURE
HIGHEST IN PALAY PRODUCTION
RANK
EDUCATION
7

7
The Countryside in Figures: Pangasinan, 6th Edition 2019: Top Performing Local Government Units
# of livestock # of poultry
1 Balungao 119,457 1 San Carlos City 491,460
2 San Carlos City 65,081 2 Alaminos City 310,066
3 Bayambang 35,337 3 Lingayen 284,643
4 Malasiqui 26,239 4 Calasiao 215,082
5 Santa Barbara 26,041 5 Infanta 183,200
6 Manaoag 25,546 6 Santa Barbara 152,468
7 Pozzorubio 24,937 7 Rosales 133,879
8 Bolinao 22,942 8 Laoac 118,336
9 Santa Maria 21,843 9 Manaoag 101,572
10 San Jacinto 21,204 10 Bani 75,384
AGRICULTURE
RANK
2018
HIGHEST IN POULTRY POPULATION
RANK
HIGHEST IN LIVESTOCK POPULATION
2018
8

8
The Countryside in Figures: Pangasinan, 6th Edition 2019: Top Performing Local Government Units
in % in %
1 Santo Tomas 100.0 1 Anda 98.0
2 Anda 99.5 2 Urbiztondo 94.0
3 Labrador 99.2 3 Bayambang 93.8
4 Mangatarem 98.6 4 San Fabian 93.5
5 Alcala 98.6 5 Alcala 93.2
6 Santa Maria 98.1 6 labrador 93.2
7 San Quintin 97.6 7 Bolinao 92.0
8 Burgos 97.6 8 Mapandan 91.0
9 Binalonan 97.3 9 San Nicolas 90.9
10 San Fabian 97.2 10 Villasis 89.8
PUBLIC ORDER
RANK RANK
HIGHEST CRIME CLEARED EFFICIENCY RATE HIGHEST CRIME SOLVED EFFICIENCY RATE
2018 2018
9

9
The Countryside in Figures: Pangasinan, 6th Edition 2019: Top Performing Local Government Units
No. of Health Facilities monthly mail volume
San Carlos City 87 1 Dagupan City 64,625
Urdaneta City 34 2 San Carlos City 31,691
Sison 29 3 Lingayen 20,179
Bayambang 27 4 Aguilar 18,650
Bugallon 26 4 Alaminos City 18,650
Binalonan 25 6 Urdaneta City 17,625
Calasiao 24 7 Basista 11,924
Mangaldan 22 7 Malasiqui 11,924
Malasiqui 21 9 Mangaldan 11,378
Lingayen 20 10 Tayug 9,780
AVERAGE MONTHLY DELIVERED MAIL VOLUME
RANK
HEALTH
RANK
2016
HIGHEST NUMBER OF HEALTH FACILITIES
TRANSPORTATION AND COMMUNICATION
4
3
2017
1
2
10
9
8
7
6
5
10

The Countryside in Figures: Pangasinan, 6th Edition 2019
GENERAL INFORMATION

LIST OF INDICATORS
• 2016 – 2020 Population Projections
• 2015 Population
• 2015 Population Density
• 2013 and 2016 Voters Population
HIGHLIGHTS
• The Province of Pangasinan had a total population of 2,956,726 in 2015. San Carlos City recorded the
highest population among the municipalities and cities with a total of 188,571.
• In 2020, the province’s population was projected to have already reached 3,180,320 based on the 2000-
2010 Census of Population.
• The Municipality of Mabini was the most densely populated in the province in 2015.
•In the October 2013 Barangay and SK Elections, the Province of Pangasinan had a 78.8 percentage
turnout of voters who actually voted and 85.1 percentage turnout for the May 2016 National and Local
Elections.
The Countryside in Figures: Pangasinan, 6th Edition 2019

2015 Rank 1/ persons/sq. km. Rank 2/
PANGASINAN 1,364 2,956,726 5,451.0 542
Agno 17 28,052 42 169.75 165 4
Aguilar 16 41,463 29 195.07 213 9
City of Alaminos 39 89,708 9 164.26 546 22
Alcala 21 43,402 27 45.71 950 33
Anda 18 39,504 31 74.55 530 21
Asingan 21 57,355 21 66.64 861 31
Balungao 20 31,106 40 73.25 425 19
Bani 27 50,306 24 179.65 280 13
Basista 13 32,959 36 24.00 1,373 43
Bautista 18 32,307 38 46.33 697 24
Bayambang 77 118,205 5 143.94 821 28
Binalonan 24 54,555 22 47.57 1,147 38
1/ Rank is provincewide. Best (Rank 1) has the most population
2/ Rank is provincewide. Best (Rank 1) has the lowest density.
Source: Philippine Statistics Authority, PPDO, DENR Dagupan City
The Countryside in Figures: Pangasinan, 6th Edition 2019: General Information
Population (census-based)
City/Municipality
Population Density
2015
Land Area (sq.
km.)
Number of
Barangays (as
of August 2015)
13

2015 Rank 1/ persons/sq. km. Rank 2/
The Countryside in Figures: Pangasinan, 6th Edition 2019: General Information
Population (census-based)
City/Municipality
Population Density
2015
Land Area (sq.
km.)
Number of
Barangays (as
of August 2015)
Binmaley 33 83,052 10 118.50 701 25
Bolinao 30 82,084 12 197.22 416 18
Bugallon 24 67,348 18 189.64 355 16
Burgos 14 21,637 47 131.32 165 3
Calasiao 24 95,154 8 48.36 1,968 45
Dagupan City 31 171,271 2 37.23 4,600 48
Dasol 18 29,110 41 166.60 175 6
Infanta 13 24,584 44 254.29 97 2
Labrador 10 23,201 46 90.99 255 11
Laoac 22 31,497 39 40.50 778 27
Lingayen (Capital) 32 103,278 7 62.76 1,646 44
Mabini 16 24,765 43 291.01 85 1
1/ Rank is provincewide. Best (Rank 1) has the most population
2/ Rank is provincewide. Best (Rank 1) has the lowest density.
Source: Philippine Statistics Authority, PPDO, DENR Dagupan City
14

2015 Rank 1/ persons/sq. km. Rank 2/
The Countryside in Figures: Pangasinan, 6th Edition 2019: General Information
Population (census-based)
City/Municipality
Population Density
2015
Land Area (sq.
km.)
Number of
Barangays (as
of August 2015)
Malasiqui 73 130,275 4 131.37 992 35
Manaoag 26 69,497 17 55.95 1,242 41
Mangaldan 30 106,331 6 48.47 2,194 46
Mangatarem 82 73,241 15 317.50 231 10
Mapandan 15 37,059 32 30.00 1,235 40
Natividad 18 24,299 45 134.36 181 7
Pozorrubio 34 69,555 16 134.60 517 20
Rosales 37 63,081 19 66.39 950 34
San Carlos City 86 188,571 1 169.03 1,116 37
San Fabian 34 83,025 11 81.28 1,021 36
San Jacinto 19 40,848 30 44.18 925 32
San Manuel 14 52,939 23 129.18 410 17
1/ Rank is provincewide. Best (Rank 1) has the most population
2/ Rank is provincewide. Best (Rank 1) has the lowest density.
Source: Philippine Statistics Authority, PPDO, DENR Dagupan City
15
2015 Rank 1/ persons/sq. km. Rank 2/
The Countryside in Figures: Pangasinan, 6th Edition 2019: General Information
Population (census-based)
City/Municipality
Population Density
2015
Land Area (sq.
km.)
Number of
Barangays (as
of August 2015)
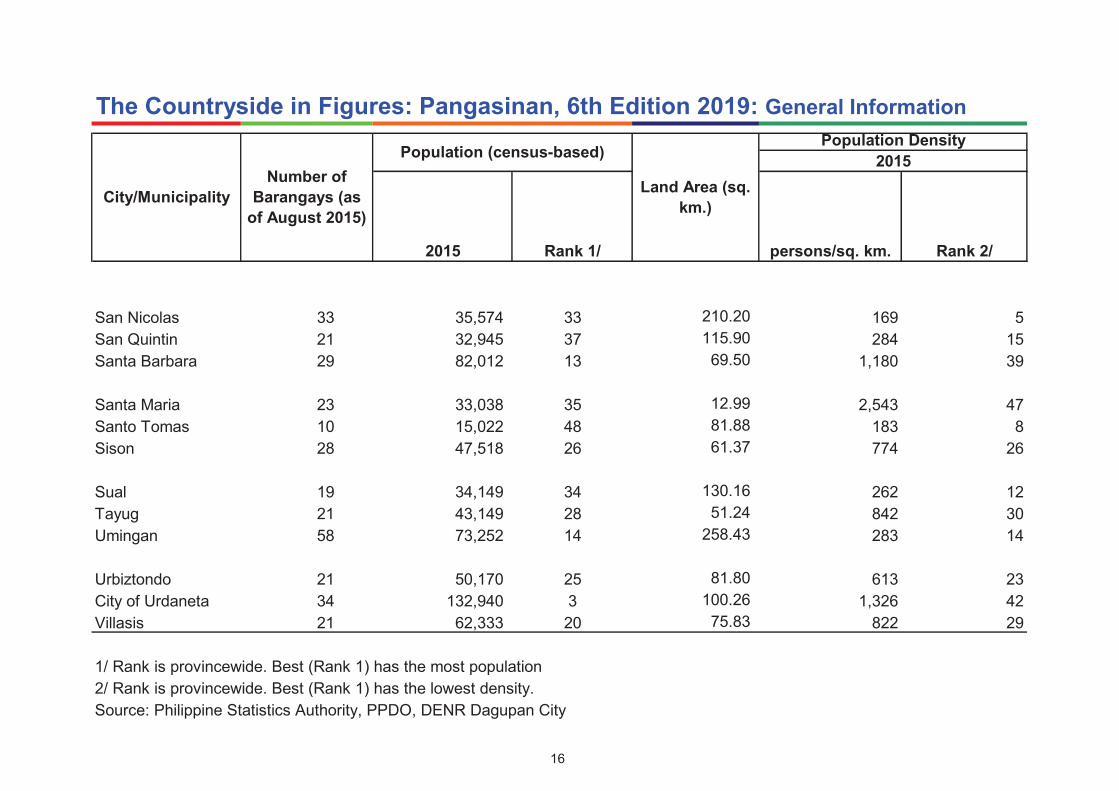
San Nicolas 33 35,574 33 210.20 169 5
San Quintin 21 32,945 37 115.90 284 15
Santa Barbara 29 82,012 13 69.50 1,180 39
Santa Maria 23 33,038 35 12.99 2,543 47
Santo Tomas 10 15,022 48 81.88 183 8
Sison 28 47,518 26 61.37 774 26
Sual 19 34,149 34 130.16 262 12
Tayug 21 43,149 28 51.24 842 30
Umingan 58 73,252 14 258.43 283 14
Urbiztondo 21 50,170 25 81.80 613 23
City of Urdaneta 34 132,940 3 100.26 1,326 42
Villasis 21 62,333 20 75.83 822 29
1/ Rank is provincewide. Best (Rank 1) has the most population
2/ Rank is provincewide. Best (Rank 1) has the lowest density.
Source: Philippine Statistics Authority, PPDO, DENR Dagupan City
16

Average Annual
Growth Rate
2000-2010 2016 2017 2018 2019 2020
PANGASINAN 1.34 3,013,005 3,053,909 3,095,423 3,137,557 3,180,320
Agno 0.93 29,078 29,349 29,621 29,897 30,175
Aguilar 1.76 43,881 44,652 45,436 46,234 47,046
Alaminos City 1.47 92,830 94,198 95,587 96,997 98,427
Alcala 1.40 44,659 45,286 45,921 46,565 47,219
Anda 1.21 39,769 40,248 40,733 41,224 41,721
Asingan 0.96 59,673 60,245 60,823 61,406 61,994
Balungao 1.14 28,560 28,886 29,216 29,550 29,888
Bani 0.66 47,614 47,931 48,249 48,570 48,893
Basista 1.33 32,898 33,337 33,781 34,231 34,688
Bautista 1.10 32,240 32,594 32,953 33,315 33,681
Bayambang 1.45 121,551 123,309 125,092 126,900 128,735
Binalonan 0.76 55,296 55,718 56,143 56,571 57,002
1/ Population projections are based from the 2000-2010 Census of Population.
Sources: Pangasinan Provincial Planning and Development Office; Philippine Statistics Authority
The Countryside in Figures: Pangasinan, 6th Edition 2019: General Information
City/MunicipalityProjected Population 1/
17

Average Annual
Growth Rate
2000-2010 2016 2017 2018 2019 2020
The Countryside in Figures: Pangasinan, 6th Edition 2019: General Information
City/MunicipalityProjected Population 1/
Binmaley 0.81 82,590 83,256 83928 84,605 85,288
Bolinao 2.01 84,020 85,712 87,438 89,200 90,996
Bugallon 1.13 68,719 69,493 70,276 71,067 71,868
Burgos 0.09 18,420 18,437 18,455 18,472 18,490
Calasiao 1.69 100,756 102,461 104,194 105,956 107,749
Dagupan City 2.30 187,652 191,977 196,401 200,927 205,557
Dasol 0.62 28,006 28,178 28,352 28,527 28,703
Infanta 1.29 25,331 25,658 25,989 26,325 26,664
Labrador 0.94 22,367 22,577 22,789 23,003 23,218
Laoac 0.98 31,228 31,534 31,842 32,154 32,469
Lingayen 1.06 105,166 106,277 107,399 108,534 109,680
Mabini 1.33 25,995 26,341 26,692 27,048 27,408
1/ Population projections are based from the 2000-2010 Census of Population.
Sources: Pangasinan Provincial Planning and Development Office; Philippine Statistics Authority
18

Average Annual
Growth Rate
2000-2010 2016 2017 2018 2019 2020
The Countryside in Figures: Pangasinan, 6th Edition 2019: General Information
City/MunicipalityProjected Population 1/
Malasiqui 0.88 130,243 131,390 132,548 133,715 134,893
Manaoag 1.67 71,308 72,496 73,704 74,932 76,180
Mangaldan 1.87 110,563 112,636 114,747 116,898 119,089
Mangatarem 1.39 76,014 77,071 78,143 79,230 80,332
Mapandan 1.13 36,844 37,260 37,682 38,108 38,539
Natividad 1.35 24,611 24,942 25,278 25,618 25,963
Pozzorubio 1.27 71,327 72,235 73,155 74,087 75,030
Rosales 1.37 64,770 65,658 66,559 67,472 68,397
San Carlos City 1.28 188,934 191,344 193,783 196,255 198,757
San Fabian 1.63 85,831 87,230 88,651 90,095 91,563
San Jacinto 1.42 41,081 41,666 42,260 42,862 43,473
San Manuel 1.3 50,644 51,301 51,967 52,641 53,324
1/ Population projections are based from the 2000-2010 Census of Population.
Sources: Pangasinan Provincial Planning and Development Office; Philippine Statistics Authority
19

Average Annual
Growth Rate
2000-2010 2016 2017 2018 2019 2020
The Countryside in Figures: Pangasinan, 6th Edition 2019: General Information
City/MunicipalityProjected Population 1/
San Nicolas 0.82 35,831 36,127 36,425 36,725 37,028
San Quintin 1.45 35,565 36,079 36,602 37,132 37,669
Santa Barbara 1.78 85,179 86,693 88,233 89,801 91,396
Santa Maria 1.10 33,207 33,573 33,944 34,318 34,697
Santo Tomas 1.59 15,836 16,088 16,343 16,606 16,867
Sison 0.71 45,900 46,228 46,558 46,891 47,226
Sual 1.91 34,971 35,639 36,321 37,015 37,722
Tayug 1.01 42,500 42,929 43,361 43,798 44,240
Umingan 1.43 75,533 74,584 75,649 76,730 77,826
Urbiztondo 1.78 53,177 54,124 55,088 56,069 57,068
Urdaneta City 1.18 134,587 136,173 137,777 139,401 141,044
Villasis 0.87 62,252 62,792 63,336 63,885 64,438
1/ Population projections are based from the 2000-2010 Census of Population.
Sources: Pangasinan Provincial Planning and Development Office; Philippine Statistics Authority
20

No. of
Registered
Voters
No. of Voters
Who Actually
Voted
Percentage
Turnout
No. of
Registered
Voters
No. of Voters
Who Actually
Voted
Percentage
Turnout
PANGASINAN 1,705,260 1,451,877 85.1 1,722,651 1,357,929 78.8
Agno 17,036 14,388 84.5 32 17,987 13,984 77.7 39
Aguilar 23,781 20,369 85.7 20 23,794 19,105 80.3 22
Alaminos City 49,503 40,628 82.1 47 48,754 38,531 79.0 34
Alcala 25,655 22,094 86.1 16 25,344 18,539 73.1 46
Anda 23,235 19,427 83.6 40 23,254 1,845 7.9 48
Asingan 34,236 30,082 87.9 5 34,287 27,537 80.3 21
Balungao 17,999 15,359 85.3 24 17,986 14,381 80.0 23
Bani 27,568 23,331 84.6 29 27,307 22,583 82.7 2
Basista 19,611 16,738 85.4 23 22,186 16,307 73.5 45
Bautista 17,974 15,556 86.5 14 18,088 14,598 80.7 19
Bayambang 65,471 55,660 85.0 26 71,875 55,107 76.7 42
Binalonan 32,746 27,226 83.1 42 33,405 26,487 79.3 32
1/ Rank is provincewide. Best (Rank 1) has the highest percentage turnout.
Source: Commission on Elections, Regional Office I
Pangasinan Provincial Planning and Development Office
The Countryside in Figures: Pangasinan, 6th Edition 2019: General Information
City/Municipality
Based on October 28, 2013 Barangay and SK
Elections
Rank 1/
Based on May 9, 2016 National and Local
Elections Rank
1/
21

No. of
Registered
Voters
No. of Voters
Who Actually
Voted
Percentage
Turnout
No. of
Registered
Voters
No. of Voters
Who Actually
Voted
Percentage
Turnout
The Countryside in Figures: Pangasinan, 6th Edition 2019: General Information
City/Municipality
Based on October 28, 2013 Barangay and SK
Elections
Rank 1/
Based on May 9, 2016 National and Local
Elections Rank
1/
Binmaley 55,280 47,024 85.1 25 57,075 45,624 79.9 24
Bolinao 39,870 32,457 81.4 48 39,282 32,224 82.0 4
Bugallon 38,360 34,217 89.2 1 36,116 29,434 81.5 12
Burgos 11,842 9,853 83.2 41 12,554 9,728 77.5 40
Calasiao 53,412 47,094 88.2 3 55,237 44,669 80.9 18
Dagupan City 105,183 86,860 82.6 45 103,109 81,801 79.3 31
Dasol 20,392 18,061 88.6 2 19,571 15,559 79.5 29
Infanta 15,287 13,168 86.1 15 15,335 11,963 78.0 37
Labrador 16,085 13,803 85.8 19 16,538 12,471 75.4 43
Laoac 18,452 15,536 84.2 36 18,543 15,014 81.0 16
Lingayen 57,617 48,726 84.6 30 56,890 44,864 78.9 35
Mabini 14,626 12,509 85.5 22 14,714 11,722 79.7 27
1/ Rank is provincewide. Best (Rank 1) has the highest percentage turnout.
Source: Commission on Elections, Regional Office I
Pangasinan Provincial Planning and Development Office
22
No. of
Registered
Voters
No. of Voters
Who Actually
Voted
Percentage
Turnout
No. of
Registered
Voters
No. of Voters
Who Actually
Voted
Percentage
Turnout
The Countryside in Figures: Pangasinan, 6th Edition 2019: General Information
City/Municipality
Based on October 28, 2013 Barangay and SK
Elections
Rank 1/
Based on May 9, 2016 National and Local
Elections Rank
1/
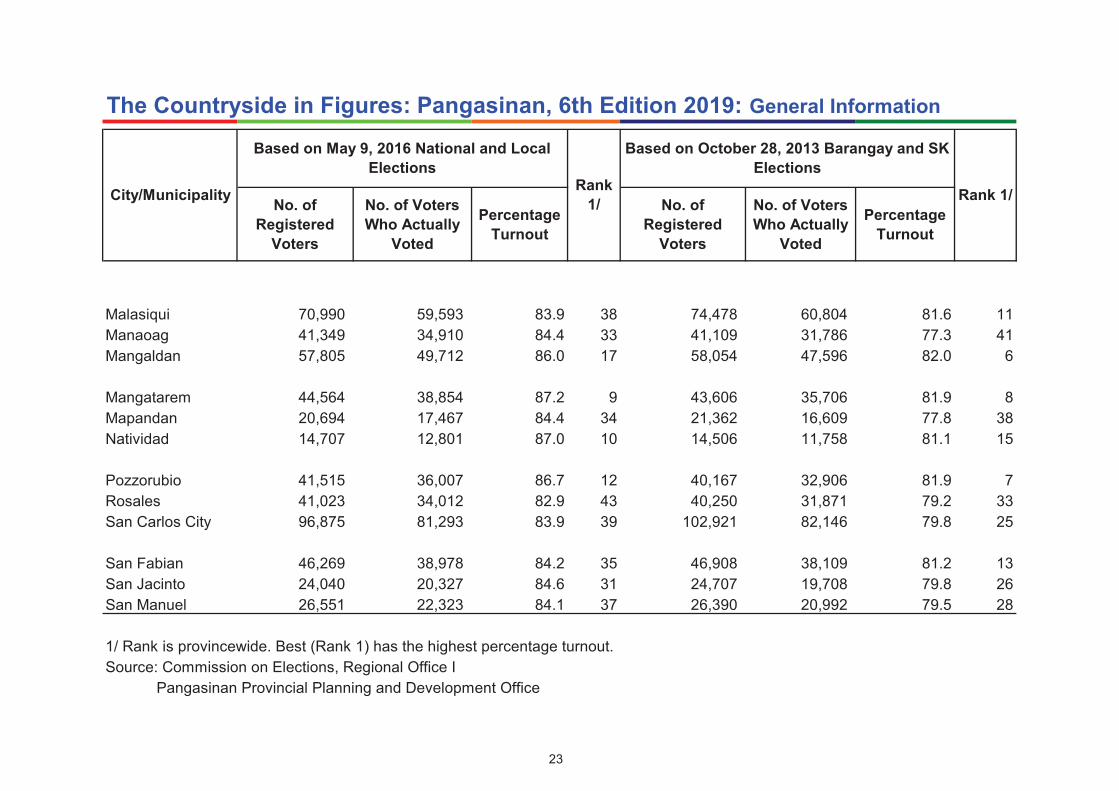
Malasiqui 70,990 59,593 83.9 38 74,478 60,804 81.6 11
Manaoag 41,349 34,910 84.4 33 41,109 31,786 77.3 41
Mangaldan 57,805 49,712 86.0 17 58,054 47,596 82.0 6
Mangatarem 44,564 38,854 87.2 9 43,606 35,706 81.9 8
Mapandan 20,694 17,467 84.4 34 21,362 16,609 77.8 38
Natividad 14,707 12,801 87.0 10 14,506 11,758 81.1 15
Pozzorubio 41,515 36,007 86.7 12 40,167 32,906 81.9 7
Rosales 41,023 34,012 82.9 43 40,250 31,871 79.2 33
San Carlos City 96,875 81,293 83.9 39 102,921 82,146 79.8 25
San Fabian 46,269 38,978 84.2 35 46,908 38,109 81.2 13
San Jacinto 24,040 20,327 84.6 31 24,707 19,708 79.8 26
San Manuel 26,551 22,323 84.1 37 26,390 20,992 79.5 28
1/ Rank is provincewide. Best (Rank 1) has the highest percentage turnout.
Source: Commission on Elections, Regional Office I
Pangasinan Provincial Planning and Development Office
23

No. of
Registered
Voters
No. of Voters
Who Actually
Voted
Percentage
Turnout
No. of
Registered
Voters
No. of Voters
Who Actually
Voted
Percentage
Turnout
The Countryside in Figures: Pangasinan, 6th Edition 2019: General Information
City/Municipality
Based on October 28, 2013 Barangay and SK
Elections
Rank 1/
Based on May 9, 2016 National and Local
Elections Rank
1/
San Nicolas 23,297 20,027 86.0 18 22,891 18,691 81.7 10
San Quintin 20,180 17,637 87.4 8 20,189 16,264 80.6 20
Santa Barbara 44,754 38,913 86.9 11 45,518 37,896 83.3 1
Santa Maria 19,187 16,283 84.9 27 19,287 15,751 81.7 9
Santo Tomas 7,740 6,384 82.5 46 7,678 5,365 69.9 47
Sison 26,177 22,703 86.7 13 26,193 21,248 81.1 14
Sual 23,911 19,783 82.7 44 22,999 18,603 80.9 17
Tayug 25,600 21,899 85.5 21 26,267 20,595 78.4 36
Umingan 43,793 38,609 88.2 4 43,529 35,689 82.0 5
Urbiztondo 29,874 26,236 87.8 6 28,490 23,391 82.1 3
Urdaneta City 76,296 64,682 84.8 28 76,123 60,472 79.4 30
Villasis 36,848 32,278 87.6 7 39,798 29,896 75.1 44
1/ Rank is provincewide. Best (Rank 1) has the highest percentage turnout.
Source: Commission on Elections, Regional Office I
Pangasinan Provincial Planning and Development Office
24

The Countryside in Figures: Pangasinan, 6th Edition 2019
GOVERNANCE

LIST OF INDICATORS
• 2018 IRA Allocation per City/Municipality
HIGHLIGHTS
• San Carlos City accumulated the highest internal revenue allotment IRA which soared to P611,962,401.00.
The Countryside in Figures: Pangasinan, 6th Edition 2019

Income ClassCY 2015 Census of
PopulationIRA Allocation
PANGASINAN 2,956,726 7,641,320,244
Agno 3rd 28,052 97,320,387.00 37
Aguilar 3rd 41,463 120,776,390.00 24
Alaminos City 4th 89,708 461,989,053.00 4
Alcala 3rd 43,402 101,713,749.00 32
Anda 3rd 39,504 100,089,825.00 34
Asingan 2nd 57,355 125,785,686.00 23
Balungao 4th 31,106 87,522,150.00 41
Bani 2nd 50,306 131,733,290.00 21
Basista 4th 32,959 82,863,981.00 45
Bautista 4th 32,307 85,348,699.00 43
Bayambang 1st 118,205 227,397,900.00 6
Binalonan 1st 54,555 118,694,858.00 25
1/ Rank is provincewide. Best (Rank 1) has the highest value.
Source: Department of Budget and Management
The Countryside in Figures: Pangasinan, 6th Edition 2019: Governance
City/Municipality
CY 2018
Rank 1/
27

Income ClassCY 2015 Census of
PopulationIRA Allocation
The Countryside in Figures: Pangasinan, 6th Edition 2019: Governance
City/Municipality
CY 2018
Rank 1/
Binmaley 1st 83,052 171,590,560.00 13
Bolinao 1st 82,084 181,009,232.00 10
Bugallon 2nd 67,348 158,239,067.00 16
Burgos 4th 21,637 81,930,342.00 46
Calasiao 1st 95,154 178,849,211.00 11
Dagupan City 2nd 171,271 485,691,584.00 2
Dasol 3rd 29,110 98,253,567.00 35
Infanta 3rd 24,584 104,414,090.00 30
Labrador 4th 23,201 78,491,112.00 47
Laoac 4th 31,497 83,276,386.00 44
Lingayen 1st 103,278 193,413,221.00 8
Mabini 3rd 24,765 110,161,525.00 29
1/ Rank is provincewide. Best (Rank 1) has the highest value.
Source: Department of Budget and Management
28

Income ClassCY 2015 Census of
PopulationIRA Allocation
The Countryside in Figures: Pangasinan, 6th Edition 2019: Governance
City/Municipality
CY 2018
Rank 1/
Malasiqui 1st 130,275 243,225,337.00 5
Manaoag 1st 69,497 142,077,847.00 18
Mangaldan 1st 106,331 195,389,186.00 7
Mangatarem 1st 73,241 186,898,707.00 9
Mapandan 3rd 37,059 90,036,144.00 39
Natividad 4th 24,299 86,589,662.00 42
Pozzorubio 1st 69,555 153,918,537.00 17
Rosales 1st 63,081 134,216,916.00 20
San Carlos City 3rd 188,571 611,962,401.00 1
San Fabian 1st 83,025 165,778,951.00 14
San Jacinto 3rd 40,848 97,717,614.00 36
San Manuel 1st 52,939 128,243,434.00 22
1/ Rank is provincewide. Best (Rank 1) has the highest value.
Source: Department of Budget and Management
29

Income ClassCY 2015 Census of
PopulationIRA Allocation
The Countryside in Figures: Pangasinan, 6th Edition 2019: Governance
City/Municipality
CY 2018
Rank 1/
San Nicolas 1st 35,574 114,660,951.00 27
San Quintin 3rd 32,945 96,598,970.00 38
Santa Barbara 1st 82,012 161,162,665.00 15
Santa Maria 4th 33,038 89,786,492.00 40
Santo Tomas 5th 15,022 54,808,062.00 48
Sison 3rd 47,518 113,249,474.00 28
Sual 1st 34,149 100,362,653.00 33
Tayug 3rd 43,149 102,314,757.00 31
Umingan 1st 73,252 177,786,292.00 12
Urbiztondo 3rd 50,170 116,885,907.00 26
Urdaneta City 2nd 132,940 476,653,624.00 3
Villasis 1st 62,333 134,439,796.00 19
1/ Rank is provincewide. Best (Rank 1) has the highest value.
Source: Department of Budget and Management
30

The Countryside in Figures: Pangasinan, 6th Edition 2019
AGRICULTURE

The Countryside in Figures: Pangasinan, 6th Edition 2019
LIST OF INDICATORS
• 2018 Palay Production by City/Municipality
•2018 Livestock Population by City/Municipality
• 2018 Poultry Population by City/Municipality
HIGHLIGHTS
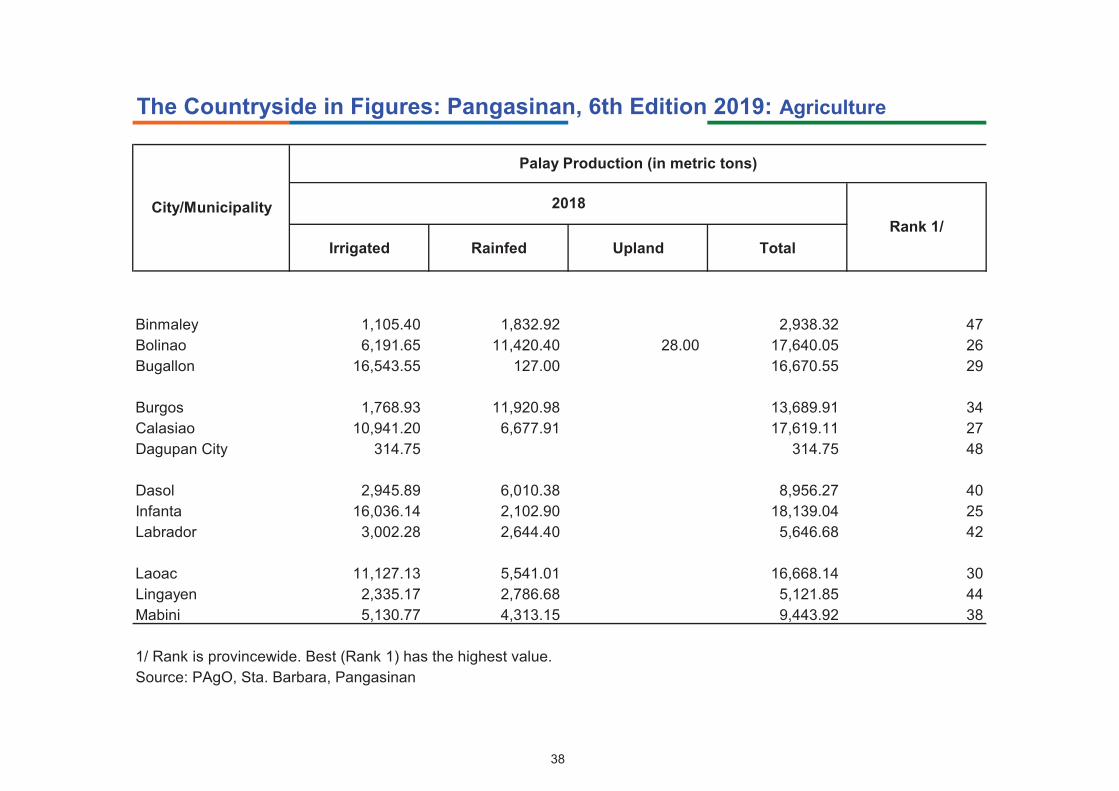
• The province of Pangasinan produced 1,144,814.29 metric tons of palay in 2018 where the municipality of
Umingan contributed the highest with 96,737.92 metric tons produced.
•Balungao registered the highest number of livestock with a total of 119,457.
• The City of San Carlos has a total of 491,460 poultry population which is the highest in the province.

Carabao Cattle Swine Goats Native Broiler
PANGASINAN 32,549 149,133 400,594 201,761 784,037 1,720,311 1,222,639 2,942,950
Agno 2,993 2,441 7,730 6,410 19,574 11 14,701 15,100 29,801 25
Aguilar 3,529 3,140 1,470 8,139 36 15,350 15,350 32
Alaminos City 1,200 4,356 4,306 6,623 16,485 15 27,429 282,637 310,066 2
Alcala 208 2,633 6,705 4,015 13,561 19 34,380 34,380 21
Anda 471 5,303 3,118 1,253 10,145 31 - 46
Asingan 778 1,067 9,830 3,457 15,132 17 58,797 58,797 13
Balungao 645 4,573 94,244 19,995 119,457 1 45,057 45,057 16
Bani 1,618 3,666 5,450 6,117 16,851 14 55,384 20,000 75,384 10
Basista 33 1,428 3,826 1,580 6,867 39 11,066 11,066 35
Bautista 1,749 293 7,824 2,929 12,795 21 1,740 1,740 42
Bayambang 121 7,846 16,670 10,700 35,337 3 54,238 54,238 14
Binalonan 505 1,814 6,031 3,968 12,318 22 5,627 5,627 38
1/ Rank is provincewide. Best (Rank 1) has the highest value.
Source: Provincial Veterinary Office
Poultry
Total
The Countryside in Figures: Pangasinan, 6th Edition 2019: Agriculture
Rank 1/
City/Municipality Livestock Rank
1/
Livestock and Poultry Population by Type CY 2018
Total
33

Carabao Cattle Swine Goats Native Broiler
Poultry
Total
The Countryside in Figures: Pangasinan, 6th Edition 2019: Agriculture
Rank 1/
City/Municipality Livestock Rank
1/
Livestock and Poultry Population by Type CY 2018
Total
Binmaley 54 628 3,485 1,660 5,827 40 43,500 43,500 18
Bolinao 2,144 3,251 10,824 6,723 22,942 8 25,030 25,030 26
Bugallon 378 4,450 3,903 3,032 11,763 25 7,342 7,342 37
Burgos 3,360 2,883 4,412 6,750 17,405 13 21,413 8,775 30,188 23
Calasiao 1,391 2,926 985 5,302 43 7,984 207,098 215,082 4
Dagupan City 48 293 384 390 1,115 48 3,359 3,359 40
Dasol 1,555 901 335 5,140 7,931 37 428 428 45
Infanta 796 995 4,813 863 7,467 38 183,200 183,200 5
Labrador 206 991 1,902 591 3,690 46 2,434 2,434 41
Laoac 276 2,033 2,849 4,859 10,017 33 118,336 118,336 8
Lingayen 473 1,405 2,606 6,965 11,449 27 46,455 238,188 284,643 3
Mabini 987 1,189 662 2,017 4,855 45 65,200 65,200 12
1/ Rank is provincewide. Best (Rank 1) has the highest value.
Source: Provincial Veterinary Office
34

Carabao Cattle Swine Goats Native Broiler
Poultry
Total
The Countryside in Figures: Pangasinan, 6th Edition 2019: Agriculture
Rank 1/
City/Municipality Livestock Rank
1/
Livestock and Poultry Population by Type CY 2018
Total
Malasiqui 353 8,140 9,393 8,353 26,239 4 40,331 40,331 19
Manaoag 81 15,477 6,330 3,658 25,546 6 37,648 63,924 101,572 9
Mangaldan 485 1,730 6,955 2,452 11,622 26 14,810 14,810 33
Mangatarem 779 11,337 5,387 2,018 19,521 12 44,510 44,510 17
Mapandan 99 1,690 3,581 272 5,642 41 15,905 15,905 31
Natividad 144 2,806 9,686 2,820 15,456 16 17,831 17,831 29
Pozzorubio 1,016 5,007 12,988 5,926 24,937 7 50,158 50,158 15
Rosales 210 1,691 4,290 4,486 10,677 30 63,879 70,000 133,879 7
San Carlos City 215 11,975 46,910 5,981 65,081 2 174,610 316,850 491,460 1
San Fabian 1,104 2,355 2,975 5,553 11,987 24 31,027 31,027 22
San Jacinto 968 1,243 9,898 9,095 21,204 10 - 46
San Manuel 652 782 5,001 3,662 10,097 32 24,513 24,513 27
1/ Rank is provincewide. Best (Rank 1) has the highest value.
Source: Provincial Veterinary Office
35

Carabao Cattle Swine Goats Native Broiler
Poultry
Total
The Countryside in Figures: Pangasinan, 6th Edition 2019: Agriculture
Rank 1/
City/Municipality Livestock Rank
1/
Livestock and Poultry Population by Type CY 2018
Total
San Nicolas 334 2,787 4,005 2,552 9,678 34 30,014 30,014 24
San Quintin 232 3,545 3,132 1,676 8,585 35 20,916 20,916 28
Santa Barbara 148 2,122 21,660 2,111 26,041 5 152,468 152,468 6
Santa Maria 479 4,074 4,821 12,469 21,843 9 67,559 67,559 11
Santo Tomas 344 841 2,730 1,534 5,449 42 1,449 67 1,516 44
Sison 99 248 938 472 1,757 47 4,265 4,265 39
Sual 471 963 6,855 2,623 10,912 28 12,605 12,605 34
Tayug 224 1,563 2,211 957 4,955 44 8,667 8,667 36
Umingan 1,556 3,513 3,500 4,342 12,911 20 - 46
Urbiztondo 40 5,300 6,500 2,700 14,540 18 1,650 1,650 43
Urdaneta City 277 1,211 7,878 2,798 12,164 23 39,741 39,741 20
Villasis 250 765 4,995 4,759 10,769 29 17,305 17,305 30
1/ Rank is provincewide. Best (Rank 1) has the highest value.
Source: Provincial Veterinary Office
36

Irrigated Rainfed Upland Total
PANGASINAN 847,832.90 296,593.63 387.76 1,144,814.29
Agno 1,266.28 11,167.40 12,433.68 36
Aguilar 36,153.85 36,153.85 12
Alaminos City 18,598.72 23,954.40 42,553.12 8
Alcala 7,621.43 5,538.40 13,159.83 35
Anda 1,118.90 14,711.00 15,829.90 31
Asingan 41,919.43 1,216.13 43,135.56 7
Balungao 19,313.99 12,913.24 32,227.23 14
Bani 5,955.00 10,740.85 16,695.85 28
Basista 1,828.80 1,501.92 3,330.72 46
Bautista 5,531.67 3,628.00 9,159.67 39
Bayambang 11,399.50 7,089.00 18,488.50 22
Binalonan 11,618.67 3,841.54 15,460.21 32
1/ Rank is provincewide. Best (Rank 1) has the highest value.
Source: PAgO, Sta. Barbara, Pangasinan
The Countryside in Figures: Pangasinan, 6th Edition 2019: Agriculture
City/Municipality
Palay Production (in metric tons)
2018
Rank 1/
37
Irrigated Rainfed Upland Total
The Countryside in Figures: Pangasinan, 6th Edition 2019: Agriculture
City/Municipality
Palay Production (in metric tons)
2018
Rank 1/
Binmaley 1,105.40 1,832.92 2,938.32 47
Bolinao 6,191.65 11,420.40 28.00 17,640.05 26
Bugallon 16,543.55 127.00 16,670.55 29
Burgos 1,768.93 11,920.98 13,689.91 34
Calasiao 10,941.20 6,677.91 17,619.11 27
Dagupan City 314.75 314.75 48
Dasol 2,945.89 6,010.38 8,956.27 40
Infanta 16,036.14 2,102.90 18,139.04 25
Labrador 3,002.28 2,644.40 5,646.68 42
Laoac 11,127.13 5,541.01 16,668.14 30
Lingayen 2,335.17 2,786.68 5,121.85 44
Mabini 5,130.77 4,313.15 9,443.92 38
1/ Rank is provincewide. Best (Rank 1) has the highest value.
Source: PAgO, Sta. Barbara, Pangasinan
38

Irrigated Rainfed Upland Total
The Countryside in Figures: Pangasinan, 6th Edition 2019: Agriculture
City/Municipality
Palay Production (in metric tons)
2018
Rank 1/
Malasiqui 21,927.32 11,539.84 33,467.16 13
Manaoag 19,509.07 3,192.55 22,701.62 20
Mangaldan 14,854.66 3,538.60 18,393.26 23
Mangatarem 67,153.45 1,932.56 69,086.01 2
Mapandan 3,788.32 1,749.10 5,537.42 43
Natividad 13,529.25 1,088.65 14,617.90 33
Pozzorubio 16,173.98 6,628.08 22,802.06 19
Rosales 41,708.25 3,338.00 45,046.25 6
San Carlos City 26,111.27 19,004.80 45,116.07 5
San Fabian 14,406.58 3,933.87 18,340.45 24
San Jacinto 7,702.87 3,831.42 219.76 11,754.05 37
San Manuel 52,093.35 484.33 52,577.68 3
1/ Rank is provincewide. Best (Rank 1) has the highest value.
Source: PAgO, Sta. Barbara, Pangasinan
39

Irrigated Rainfed Upland Total
The Countryside in Figures: Pangasinan, 6th Edition 2019: Agriculture
City/Municipality
Palay Production (in metric tons)
2018
Rank 1/
San Nicolas 24,248.33 175.00 24,423.33 18
San Quintin 30,517.45 9,076.90 140.00 39,734.35 9
Santa Barbara 30,785.02 5,747.95 36,532.97 11
Santa Maria 16,620.10 8,151.50 24,771.60 17
Santo Tomas 3,868.00 3,868.00 45
Sison 15,600.50 4,197.00 19,797.50 21
Sual 23,624.04 2,788.10 26,412.14 16
Tayug 27,253.07 946.30 28,199.37 15
Umingan 57,769.62 38,968.30 96,737.92 1
Urbiztondo 5,278.50 3,200.00 8,478.50 41
Urdaneta City 36,530.70 1,296.00 37,826.70 10
Villasis 37,010.10 10,105.17 47,115.27 4
1/ Rank is provincewide. Best (Rank 1) has the highest value.
Source: PAgO, Sta. Barbara, Pangasinan
40

The Countryside in Figures: Pangasinan, 6th Edition 2019
EDUCATION

LIST OF INDICATORS
• Number of Enrollees for the Public and Private Elementary Schools for SY 2018-2019
• Number of Teachers for the Public and Private Secondary Schools for SY 2018-2019
• Number of Public and Private Elementary and Secondary Schools for SY 2018-2019
•2018 Total Number of Child Development Centers and Child Development Workers
HIGHLIGHTS
• For the School Year 2018-2019, Pangasinan has 1,366 elementary schools broken down as 1,107 public
schools and 259 private schools. There were also 486 secondary schools for Junior High School students
where 293 of which is public and 193 private. On the other hand, there were 389 secondary schools for
Senior High School students, 276 of which are public and 113 private.
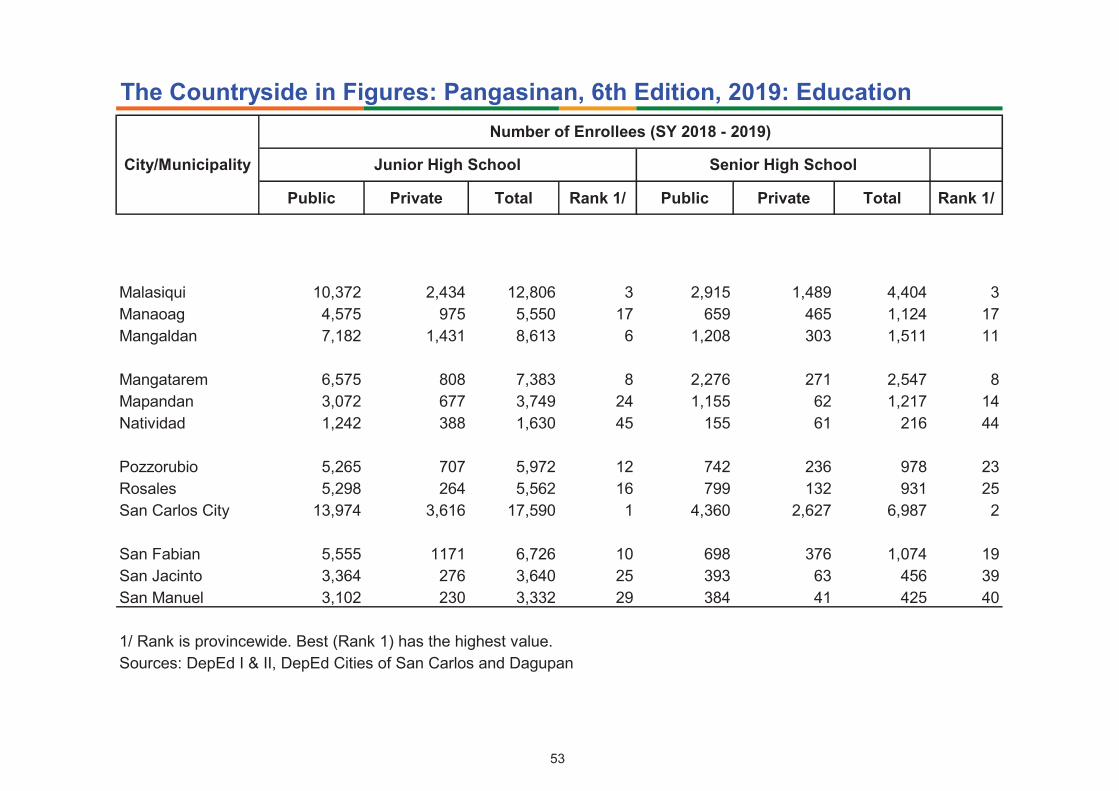
• San Carlos City had the highest number of enrollees for both elementary and secondary junior high levels
with 31,538 and 17,590 enrollees. For the secondary senior high level, Dagupan City had the highest
number of enrollees, 11,331 totaled.
• Pangasinan had a total of 16,171 elementary teachers, 10,276 junior high school teachers and 3,773
senior high school teachers in 2018.
•The City of Urdaneta had the highest percentage of Child Development Centers to total number of
barangays with 164.7 percent in 2018.
The Countryside in Figures: Pangasinan, 6th Edition 2019

Percent Rank 1/
PANGASINAN 1,364 1,496 109.7 1,535
Agno 17 20 117.6 15 20
Aguilar 16 21 131.3 9 20
Alaminos City 39 42 107.7 25 46
Alcala 21 26 123.8 11 26
Anda 18 24 133.3 7 25
Asingan 21 23 109.5 22 22
Balungao 20 22 110.0 21 22
Bani 27 29 107.4 27 41
Basista 13 14 107.7 25 15
Bautista 18 21 116.7 16 21
Bayambang 77 73 94.8 44 72
Binalonan 24 30 125.0 10 30
1/ Rank is provincewide. Best (Rank 1) has the highest percent of DCCs to total barangays.
Sources:DSWD FO-I
The Countryside in Figures: Pangasinan, 6th Edition, 2019: Education
2018 Percent of CDCs to Total
Number of Barangays2018 Number of
Child Development
Workers (CDW)
City/Municipality
2018 Total Number
of Barangays as of
May 2019
2018 Number of
Child Development
Centers (CDCs)
43

Percent Rank 1/
The Countryside in Figures: Pangasinan, 6th Edition, 2019: Education
2018 Percent of CDCs to Total
Number of Barangays2018 Number of
Child Development
Workers (CDW)
City/Municipality
2018 Total Number
of Barangays as of
May 2019
2018 Number of
Child Development
Centers (CDCs)
Binmaley 33 30 90.9 46 30
Bolinao 30 36 120.0 14 46
Bugallon 24 28 116.7 16 29
Burgos 14 20 142.9 5 18
Calasiao 24 36 150.0 4 36
Dagupan City 31 46 … 46
Dasol 18 18 100.0 31 19
Infanta 13 20 153.8 3 17
Labrador 10 14 140.0 6 13
Laoac 22 25 113.6 19 26
Lingayen 32 35 109.4 23 36
Mabini 16 18 112.5 20 18
1/ Rank is provincewide. Best (Rank 1) has the highest percent of DCCs to total barangays.
Sources:DSWD FO-I
44

Percent Rank 1/
The Countryside in Figures: Pangasinan, 6th Edition, 2019: Education
2018 Percent of CDCs to Total
Number of Barangays2018 Number of
Child Development
Workers (CDW)
City/Municipality
2018 Total Number
of Barangays as of
May 2019
2018 Number of
Child Development
Centers (CDCs)
Malasiqui 73 79 108.2 24 77
Manaoag 26 26 100.0 31 26
Mangaldan 30 35 116.7 16 37
Mangatarem 82 82 100.0 31 80
Mapandan 15 14 93.3 45 15
Natividad 18 19 105.6 29 19
Pozzorubio 34 34 100.0 31 34
Rosales 37 36 97.3 41 36
San Carlos City 86 68 79.1 47 66
San Fabian 34 41 120.6 13 53
San Jacinto 19 25 131.6 8 26
San Manuel 14 23 164.3 2 24
1/ Rank is provincewide. Best (Rank 1) has the highest percent of DCCs to total barangays.
Sources:DSWD FO-I
45

Percent Rank 1/
The Countryside in Figures: Pangasinan, 6th Edition, 2019: Education
2018 Percent of CDCs to Total
Number of Barangays2018 Number of
Child Development
Workers (CDW)
City/Municipality
2018 Total Number
of Barangays as of
May 2019
2018 Number of
Child Development
Centers (CDCs)
San Nicolas 33 34 103.0 30 34
San Quintin 21 20 95.2 42 21
Santa Barbara 29 31 106.9 28 31
Santa Maria 23 23 100.0 31 23
Santo Tomas 10 10 100.0 31 10
Sison 28 28 100.0 31 28
Sual 19 23 121.1 12 24
Tayug 21 21 100.0 31 21
Umingan 58 55 94.8 43 55
Urbiztondo 21 21 100.0 31 23
Urdaneta City 34 56 164.7 1 56
Villasis 21 21 100.0 31 22
1/ Rank is provincewide. Best (Rank 1) has the highest percent of DCCs to total barangays.
Sources:DSWD FO-I
46

Public Private Total Rank 1/
PANGASINAN 384,158 32,612 416,770
Agno 4,170 52 4,222 38
Aguilar 6,493 339 6,832 23
Alaminos City … … … …
Alcala 6,050 322 6,372 27
Anda 5,872 362 6,234 29
Asingan 6,396 647 7,043 22
Balungao 3,748 242 3,990 41
Bani 7,053 293 7,346 20
Basista 5,521 361 5,882 30
Bautista 4,919 1 4,920 35
Bayambang 18,125 1,089 19,214 4
Binalonan 6,486 587 7,073 21
1/ Rank is provincewide. Best (Rank 1) has the highest value.
Sources: DepEd I & II, DepEd Cities of San Carlos and Dagupan
The Countryside in Figures: Pangasinan, 6th Edition, 2019: Education
City/Municipality Elementary (including Kindergarten)
Number of Enrollees (SY 2018 - 2019)
47

Public Private Total Rank 1/
The Countryside in Figures: Pangasinan, 6th Edition, 2019: Education
City/Municipality Elementary (including Kindergarten)
Number of Enrollees (SY 2018 - 2019)
Binmaley 11,186 836 12,022 10
Bolinao 13,017 503 13,520 7
Bugallon 10,851 445 11,296 13
Burgos 2,621 392 3,013 45
Calasiao 12,072 1,403 13,475 8
Dagupan City 21,711 5,144 26,855 2
Dasol 4,469 191 4,660 37
Infanta 3,868 164 4,032 40
Labrador 3,093 266 3,359 44
Laoac 3,889 165 4,054 39
Lingayen 14,987 2,023 17,010 5
Mabini 3,646 86 3,732 42
1/ Rank is provincewide. Best (Rank 1) has the highest value.
Sources: DepEd I & II, DepEd Cities of San Carlos and Dagupan
48

Public Private Total Rank 1/
The Countryside in Figures: Pangasinan, 6th Edition, 2019: Education
City/Municipality Elementary (including Kindergarten)
Number of Enrollees (SY 2018 - 2019)
Malasiqui 19,459 1,274 20,733 3
Manaoag 9,101 1,071 10,172 15
Mangaldan 14,346 2,184 16,530 6
Mangatarem 11,245 594 11,839 11
Mapandan 4,929 758 5,687 31
Natividad 3,272 117 3,389 43
Pozzorubio 9,342 804 10,146 16
Rosales 8,610 801 9,411 18
San Carlos City 28,654 2,884 31,538 1
San Fabian 11,445 1003 12,448 9
San Jacinto 5,991 335 6,326 28
San Manuel 6,241 183 6,424 26
1/ Rank is provincewide. Best (Rank 1) has the highest value.
Sources: DepEd I & II, DepEd Cities of San Carlos and Dagupan
49

Public Private Total Rank 1/
The Countryside in Figures: Pangasinan, 6th Edition, 2019: Education
City/Municipality Elementary (including Kindergarten)
Number of Enrollees (SY 2018 - 2019)
San Nicolas 4,824 112 4,936 34
San Quintin 4,817 299 5,116 33
Santa Barbara 11,138 640 11,778 12
Santa Maria 4,562 216 4,778 36
Santo Tomas 1,885 0 1,885 46
Sison 6,227 295 6,522 25
Sual 5,411 222 5,633 32
Tayug 5,550 1037 6,587 24
Umingan 9,652 569 10,221 14
Urbiztondo 8,634 416 9,050 19
Urdaneta City … … … …
Villasis 8,580 885 9,465 17
1/ Rank is provincewide. Best (Rank 1) has the highest value.
Sources: DepEd I & II, DepEd Cities of San Carlos and Dagupan
50

Public Private Total Rank 1/ Public Private Total Rank 1/
PANGASINAN 202,469 32,777 235,246 49,162 21,375 70,537
Agno 1,867 0 1,867 43 687 0 687 31
Aguilar 2,918 665 3,583 26 950 106 1,056 20
Alaminos City … … … … … … … …
Alcala 3,217 70 3,287 30 476 0 476 38
Anda 2,828 730 3,558 28 748 391 1,139 15
Asingan 3,916 455 4,371 21 632 154 786 29
Balungao 1,907 99 2,006 41 229 0 229 43
Bani 4,232 0 4,232 23 1,134 0 1,134 16
Basista 2,813 215 3,028 33 1,028 66 1,094 18
Bautista 2,693 0 2,693 34 338 0 338 41
Bayambang 9,197 595 9,792 5 3,561 66 3,627 5
Binalonan 4,341 391 4,732 20 234 450 684 32
1/ Rank is provincewide. Best (Rank 1) has the highest value.
Sources: DepEd I & II, DepEd Cities of San Carlos and Dagupan
The Countryside in Figures: Pangasinan, 6th Edition, 2019: Education
City/Municipality
Number of Enrollees (SY 2018 - 2019)
Junior High School Senior High School
51

Public Private Total Rank 1/ Public Private Total Rank 1/
The Countryside in Figures: Pangasinan, 6th Edition, 2019: Education
City/Municipality
Number of Enrollees (SY 2018 - 2019)
Junior High School Senior High School
Binmaley 4,030 1635 5,665 15 930 547 1,477 12
Bolinao 7,215 92 7,307 9 2,737 0 2,737 7
Bugallon 5,447 391 5,838 13 1,419 0 1,419 13
Burgos 1,408 499 1,907 42 580 334 914 26
Calasiao 6,808 728 7,536 7 1,780 1176 2,956 6
Dagupan City 12,374 4,316 16,690 2 3,235 8,096 11,331 1
Dasol 1,536 856 2,392 37 384 405 789 28
Infanta 1,715 402 2,117 39 466 158 624 33
Labrador 1,702 552 2,254 38 733 63 796 27
Laoac 1,778 35 1,813 44 134 0 134 46
Lingayen 9,611 1,236 10,847 4 3,515 301 3,816 4
Mabini 1,727 330 2,057 40 411 114 525 35
1/ Rank is provincewide. Best (Rank 1) has the highest value.
Sources: DepEd I & II, DepEd Cities of San Carlos and Dagupan
52
Public Private Total Rank 1/ Public Private Total Rank 1/
The Countryside in Figures: Pangasinan, 6th Edition, 2019: Education
City/Municipality
Number of Enrollees (SY 2018 - 2019)
Junior High School Senior High School
Malasiqui 10,372 2,434 12,806 3 2,915 1,489 4,404 3
Manaoag 4,575 975 5,550 17 659 465 1,124 17
Mangaldan 7,182 1,431 8,613 6 1,208 303 1,511 11
Mangatarem 6,575 808 7,383 8 2,276 271 2,547 8
Mapandan 3,072 677 3,749 24 1,155 62 1,217 14
Natividad 1,242 388 1,630 45 155 61 216 44
Pozzorubio 5,265 707 5,972 12 742 236 978 23
Rosales 5,298 264 5,562 16 799 132 931 25
San Carlos City 13,974 3,616 17,590 1 4,360 2,627 6,987 2
San Fabian 5,555 1171 6,726 10 698 376 1,074 19
San Jacinto 3,364 276 3,640 25 393 63 456 39
San Manuel 3,102 230 3,332 29 384 41 425 40
1/ Rank is provincewide. Best (Rank 1) has the highest value.
Sources: DepEd I & II, DepEd Cities of San Carlos and Dagupan
53

Public Private Total Rank 1/ Public Private Total Rank 1/
The Countryside in Figures: Pangasinan, 6th Edition, 2019: Education
City/Municipality
Number of Enrollees (SY 2018 - 2019)
Junior High School Senior High School
San Nicolas 1,975 508 2,483 36 295 205 500 37
San Quintin 1,842 1187 3,029 31 163 560 723 30
Santa Barbara 6,445 107 6,552 11 2,120 0 2,120 9
Santa Maria 2,317 179 2,496 35 273 61 334 42
Santo Tomas 1,065 0 1,065 46 138 0 138 45
Sison 3,344 237 3,581 27 340 209 549 34
Sual 3,017 12 3,029 31 983 0 983 22
Tayug 3,544 758 4,302 22 521 527 1,048 21
Umingan 4,512 1004 5,516 18 571 364 935 24
Urbiztondo 5,107 562 5,669 14 1,190 875 2,065 10
Urdaneta City … … … … … … … …
Villasis 4,445 954 5,399 19 483 21 504 36
1/ Rank is provincewide. Best (Rank 1) has the highest value.
Sources: DepEd I & II, DepEd Cities of San Carlos and Dagupan
54

Public Private Total Rank 1/
PANGASINAN 14,025 2,146 16,171
Agno 163 2 165 38
Aguilar 227 21 248 27
Alaminos City … … … …
Alcala 221 19 240 28
Anda 215 25 240 28
Asingan 269 30 299 22
Balungao 155 16 171 37
Bani 286 16 302 21
Basista 190 18 208 33
Bautista 163 163 39
Bayambang 646 73 719 4
Binalonan 266 59 325 20
1/ Rank is provincewide. Best (Rank 1) has the highest value.
Sources: DepEd I & II, DepEd Cities of San Carlos and Dagupan
The Countryside in Figures: Pangasinan, 6th Edition, 2019: Education
City/Municipality Elementary (including Kindergarten)
Number of Teachers (SY 2018 - 2019)
55

Public Private Total Rank 1/
The Countryside in Figures: Pangasinan, 6th Edition, 2019: Education
City/Municipality Elementary (including Kindergarten)
Number of Teachers (SY 2018 - 2019)
Binmaley 408 53 461 9
Bolinao 456 31 487 8
Bugallon 370 39 409 13
Burgos 117 21 138 44
Calasiao 433 95 528 7
Dagupan City 731 330 1,061 2
Dasol 170 9 179 35
Infanta 146 9 155 42
Labrador 117 10 127 45
Laoac 149 13 162 40
Lingayen 528 176 704 5
Mabini 148 8 156 41
1/ Rank is provincewide. Best (Rank 1) has the highest value.
Sources: DepEd I & II, DepEd Cities of San Carlos and Dagupan
56

Public Private Total Rank 1/
The Countryside in Figures: Pangasinan, 6th Edition, 2019: Education
City/Municipality Elementary (including Kindergarten)
Number of Teachers (SY 2018 - 2019)
Malasiqui 707 82 789 3
Manaoag 298 50 348 17
Mangaldan 478 137 615 6
Mangatarem 434 434 11
Mapandan 176 89 265 24
Natividad 134 9 143 43
Pozzorubio 328 73 401 15
Rosales 309 81 390 16
San Carlos City 1,038 207 1,245 1
San Fabian 411 48 459 10
San Jacinto 206 22 228 31
San Manuel 231 231 30
1/ Rank is provincewide. Best (Rank 1) has the highest value.
Sources: DepEd I & II, DepEd Cities of San Carlos and Dagupan
57

Public Private Total Rank 1/
The Countryside in Figures: Pangasinan, 6th Edition, 2019: Education
City/Municipality Elementary (including Kindergarten)
Number of Teachers (SY 2018 - 2019)
San Nicolas 247 9 256 25
San Quintin 179 18 197 34
Santa Barbara 381 41 422 12
Santa Maria 168 7 175 36
Santo Tomas 63 63 46
Sison 246 10 256 25
Sual 200 25 225 32
Tayug 219 76 295 23
Umingan 382 27 409 13
Urbiztondo 310 25 335 19
Urdaneta City … … … …
Villasis 306 37 343 18
1/ Rank is provincewide. Best (Rank 1) has the highest value.
Sources: DepEd I & II, DepEd Cities of San Carlos and Dagupan
58

Public Private Total Rank 1/ Public Private Total Rank 1/
PANGASINAN 8,461 1,815 10,276 2,481 1,292 3,773
Agno 85 0 85 39 22 0 22 44
Aguilar 138 27 165 26 48 6 54 27
Alaminos City … … … … … … … …
Alcala 141 15 156 28 41 0 41 32
Anda 130 29 159 27 37 20 57 25
Asingan 184 44 228 19 69 12 81 17
Balungao 79 17 96 37 30 0 30 39
Bani 182 0 182 25 45 0 45 31
Basista 125 10 135 32 40 8 48 29
Bautista 106 0 106 35 26 0 26 42
Bayambang 337 29 366 6 114 3 117 7
Binalonan 189 30 219 21 36 52 88 14
1/ Rank is provincewide. Best (Rank 1) has the highest value.
Sources: DepEd I & II, DepEd Cities of San Carlos and Dagupan
The Countryside in Figures: Pangasinan, 6th Edition, 2019: Education
City/Municipality
Number of Teachers (SY 2018 - 2019)
Junior High School Senior High School
59

Public Private Total Rank 1/ Public Private Total Rank 1/
The Countryside in Figures: Pangasinan, 6th Edition, 2019: Education
City/Municipality
Number of Teachers (SY 2018 - 2019)
Junior High School Senior High School
Binmaley 165 63 228 19 42 30 72 21
Bolinao 327 0 327 7 75 0 75 19
Bugallon 234 0 234 18 58 0 58 24
Burgos 68 0 68 43 19 12 31 38
Calasiao 241 73 314 8 61 90 151 5
Dagupan City 495 266 761 2 135 317 452 1
Dasol 69 32 101 36 16 16 32 36
Infanta 67 0 67 45 18 6 24 43
Labrador 68 0 68 43 28 2 30 39
Laoac 75 7 82 40 13 0 13 45
Lingayen 401 79 480 4 119 59 178 3
Mabini 72 0 72 41 25 3 28 41
1/ Rank is provincewide. Best (Rank 1) has the highest value.
Sources: DepEd I & II, DepEd Cities of San Carlos and Dagupan
60

Public Private Total Rank 1/ Public Private Total Rank 1/
The Countryside in Figures: Pangasinan, 6th Edition, 2019: Education
City/Municipality
Number of Teachers (SY 2018 - 2019)
Junior High School Senior High School
Malasiqui 447 59 506 3 138 25 163 4
Manaoag 202 62 264 13 52 27 79 18
Mangaldan 276 117 393 5 91 51 142 6
Mangatarem 244 41 285 10 81 33 114 8
Mapandan 123 27 150 29 46 27 73 20
Natividad 54 18 72 41 24 8 32 36
Pozzorubio 231 37 268 12 78 33 111 9
Rosales 213 47 260 14 66 28 94 12
San Carlos City 592 253 845 1 179 158 337 2
San Fabian 233 66 299 9 60 25 85 16
San Jacinto 130 20 150 29 31 9 40 33
San Manuel 140 45 185 24 30 16 46 30
1/ Rank is provincewide. Best (Rank 1) has the highest value.
Sources: DepEd I & II, DepEd Cities of San Carlos and Dagupan
61

Public Private Total Rank 1/ Public Private Total Rank 1/
The Countryside in Figures: Pangasinan, 6th Edition, 2019: Education
City/Municipality
Number of Teachers (SY 2018 - 2019)
Junior High School Senior High School
San Nicolas 109 29 138 31 43 13 56 26
San Quintin 60 29 89 38 22 32 54 27
Santa Barbara 259 12 271 11 88 0 88 14
Santa Maria 103 15 118 33 30 10 40 33
Santo Tomas 45 0 45 46 10 0 10 46
Sison 180 24 204 22 53 50 103 11
Sual 115 0 115 34 34 0 34 35
Tayug 132 60 192 23 46 64 110 10
Umingan 196 54 250 15 64 26 90 13
Urbiztondo 213 22 235 17 48 12 60 22
Urdaneta City … … … … … … … …
Villasis 186 57 243 16 50 9 59 23
1/ Rank is provincewide. Best (Rank 1) has the highest value.
Sources: DepEd I & II, DepEd Cities of San Carlos and Dagupan
62

The Countryside in Figures: Pangasinan, 6th Edition, 2019: Education
Public Private Total Rank 1/
PANGASINAN 1,107 259 1,366
Agno 18 1 19 32
Aguilar 17 2 19 32
Alaminos City … … … …
Alcala 16 5 21 29
Anda 21 4 25 26
Asingan 19 7 26 24
Balungao 18 3 21 29
Bani 29 3 32 16
Basista 11 2 13 43
Bautista 11 1 12 44
Bayambang 50 7 57 4
Binalonan 22 7 29 21
1/ Rank is provincewide. Best (Rank 1) has the highest value.
Sources: DepEd-Region I, DepEd I & II, DepEd Cities of San Carlos and Dagupan
City/Municipality
Number of Schools (SY 2018 - 2019)
Elementary (including Kindergarten)
63

The Countryside in Figures: Pangasinan, 6th Edition, 2019: Education
Public Private Total Rank 1/
City/Municipality
Number of Schools (SY 2018 - 2019)
Elementary (including Kindergarten)
Binmaley 29 4 33 14
Bolinao 34 6 40 8
Bugallon 28 5 33 14
Burgos 15 3 18 39
Calasiao 27 12 39 10
Dagupan City 34 30 64 2
Dasol 17 2 19 32
Infanta 16 1 17 41
Labrador 9 1 10 45
Laoac 14 2 16 42
Lingayen 32 16 48 7
Mabini 18 1 19 32
1/ Rank is provincewide. Best (Rank 1) has the highest value.
Sources: DepEd-Region I, DepEd I & II, DepEd Cities of San Carlos and Dagupan
64

The Countryside in Figures: Pangasinan, 6th Edition, 2019: Education
Public Private Total Rank 1/
City/Municipality
Number of Schools (SY 2018 - 2019)
Elementary (including Kindergarten)
Malasiqui 54 8 62 3
Manaoag 17 10 27 23
Mangaldan 25 9 34 13
Mangatarem 47 4 51 5
Mapandan 12 6 18 39
Natividad 18 1 19 32
Pozzorubio 27 8 35 12
Rosales 29 11 40 8
San Carlos City 59 16 75 1
San Fabian 29 7 36 11
San Jacinto 16 3 19 32
San Manuel 23 2 25 26
1/ Rank is provincewide. Best (Rank 1) has the highest value.
Sources: DepEd-Region I, DepEd I & II, DepEd Cities of San Carlos and Dagupan
65

The Countryside in Figures: Pangasinan, 6th Edition, 2019: Education
Public Private Total Rank 1/
City/Municipality
Number of Schools (SY 2018 - 2019)
Elementary (including Kindergarten)
San Nicolas 32 2 32 16
San Quintin 16 3 19 32
Santa Barbara 26 6 32 16
Santa Maria 17 3 20 31
Santo Tomas 4 - 4 46
Sison 27 4 31 19
Sual 19 3 22 28
Tayug 17 11 28 22
Umingan 44 5 49 6
Urbiztondo 22 4 26 24
Urdaneta City … … … …
Villasis 22 8 30 20
1/ Rank is provincewide. Best (Rank 1) has the highest value.
Sources: DepEd-Region I, DepEd I & II, DepEd Cities of San Carlos and Dagupan
66

The Countryside in Figures: Pangasinan, 6th Edition, 2019: Education
Public Private Total Rank 1/ Public Private Total Rank 1/
PANGASINAN 293 193 486 276 113 389
Agno 4 0 4 40 4 0 4 36
Aguilar 6 2 8 28 5 2 7 20
Alaminos City … … … … … … … …
Alcala 7 3 10 18 7 0 7 20
Anda 9 2 11 13 7 2 9 14
Asingan 9 4 13 10 7 1 8 16
Balungao 4 2 6 33 4 0 4 36
Bani 10 1 11 13 10 0 10 10
Basista 3 2 5 39 3 2 5 31
Bautista 3 0 3 44 3 0 3 41
Bayambang 10 4 14 8 9 2 11 7
Binalonan 6 4 10 18 6 3 9 14
1/ Rank is provincewide. Best (Rank 1) has the highest value.
Sources: DepEd-Region I, DepEd I & II, DepEd Cities of San Carlos and Dagupan
City/Municipality Junior High School Senior High School
Number of Schools (SY 2018 - 2019)
67

The Countryside in Figures: Pangasinan, 6th Edition, 2019: Education
Public Private Total Rank 1/ Public Private Total Rank 1/
City/Municipality Junior High School Senior High School
Number of Schools (SY 2018 - 2019)
Binmaley 4 3 7 29 4 2 6 28
Bolinao 16 1 17 4 15 0 15 5
Bugallon 5 2 7 29 5 0 5 31
Burgos 3 1 4 40 3 1 4 36
Calasiao 4 13 17 4 4 6 10 10
Dagupan City 8 31 39 1 8 24 32 2
Dasol 4 2 6 33 3 2 5 31
Infanta 5 1 6 33 3 1 4 36
Labrador 2 1 3 44 2 1 3 41
Laoac 5 1 6 33 2 0 2 45
Lingayen 7 9 16 6 6 5 11 7
Mabini 5 1 6 33 5 1 6 28
1/ Rank is provincewide. Best (Rank 1) has the highest value.
Sources: DepEd-Region I, DepEd I & II, DepEd Cities of San Carlos and Dagupan
68

The Countryside in Figures: Pangasinan, 6th Edition, 2019: Education
Public Private Total Rank 1/ Public Private Total Rank 1/
City/Municipality Junior High School Senior High School
Number of Schools (SY 2018 - 2019)
Malasiqui 20 3 23 3 19 3 22 3
Manaoag 4 7 11 13 4 3 7 20
Mangaldan 4 9 13 10 4 3 7 20
Mangatarem 7 3 10 18 7 3 10 10
Mapandan 4 5 9 23 4 1 5 31
Natividad 4 2 6 33 4 1 5 31
Pozzorubio 9 4 13 10 9 3 12 6
Rosales 4 7 11 13 4 3 7 20
San Carlos City 20 18 38 2 20 14 34 1
San Fabian 6 4 10 18 6 2 8 16
San Jacinto 2 2 4 40 2 1 3 41
San Manuel 5 2 7 29 5 2 7 20
1/ Rank is provincewide. Best (Rank 1) has the highest value.
Sources: DepEd-Region I, DepEd I & II, DepEd Cities of San Carlos and Dagupan
69

The Countryside in Figures: Pangasinan, 6th Edition, 2019: Education
Public Private Total Rank 1/ Public Private Total Rank 1/
City/Municipality Junior High School Senior High School
Number of Schools (SY 2018 - 2019)
San Nicolas 9 2 9 23 9 1 10 10
San Quintin 3 6 9 23 3 3 6 28
Santa Barbara 7 2 9 23 7 0 7 20
Santa Maria 4 3 7 29 3 1 4 36
Santo Tomas 2 - 2 46 2 0 2 45
Sison 14 2 16 6 14 2 16 4
Sual 3 1 4 40 3 0 3 41
Tayug 2 8 10 18 2 6 8 16
Umingan 7 7 14 8 7 4 11 7
Urbiztondo 7 2 9 23 7 1 8 16
Urdaneta City … … … … … … … …
Villasis 7 4 11 13 6 1 7 20
1/ Rank is provincewide. Best (Rank 1) has the highest value.
Sources: DepEd-Region I, DepEd I & II, DepEd Cities of San Carlos and Dagupan
70

The Countryside in Figures: Pangasinan, 6th Edition 2019
ENERGY

LIST OF INDICATORS
• 2018 Percentage of Barangays Energized
• 2018 Household Connections
HIGHLIGHTS
• All the barangays of the Province of Pangasinan have been energized as of 2018.
• Mapandan had the highest percentage of households with energy connections at 101.13 percent in 2018.
Pangasinan had 96.34 percent household connections in the same year.
The Countryside in Figures: Pangasinan, 6th Edition 2019

Potential Actual Percent Rank 1/
PANGASINAN 688,949 663,762 96.34
Agno 6,800 6,288 92.47 41 PANELCO I
Aguilar 8,500 7,909 93.05 40 CENPELCO
Alaminos City 23,400 23,012 98.34 19 PANELCO I
Alcala 10,200 10,181 99.81 10 CENPELCO
Anda 9,000 8,645 96.06 30 PANELCO I
Asingan 7,500 7,246 96.61 25 PANELCO III
Balungao 14,500 14,479 99.86 9 PANELCO III
Bani 12,000 11,563 96.36 29 PANELCO I
Basista 7,600 7,619 100.25 CENPELCO
Bautista 6,700 6,738 100.57 3 CENPELCO
Bayambang 26,000 24,407 93.87 37 CENPELCO
Binalonan 7,000 6,749 96.41 28 PANELCO III
1/ Rank is provincewide. Best (Rank 1) has the highest percentage
Sources: PANELCO I and III, DECORP, CENPELCO and LUELCO
The Countryside in Figures: Pangasinan, 6th Edition 2019: Energy
2018Province/Electric Cooperative
Household Connections
Electrical Service
73

Potential Actual Percent Rank 1/
The Countryside in Figures: Pangasinan, 6th Edition 2019: Energy
2018Province/Electric Cooperative
Household Connections
Electrical Service
Binmaley 20,000 18,107 90.54 43 CENPELCO
Bolinao 17,500 15,945 91.11 42 PANELCO I
Bugallon 14,500 14,516 100.11 8 CENPELCO
Burgos 4,900 4,599 93.86 38 PANELCO I
Calasiao 22,375 21,610 96.58 26 DECORP
Dagupan City 44,407 43,400 97.73 22 DECORP
Dasol 6,500 6,191 95.25 34 PANELCO I
Infanta 5,100 5,073 99.47 13 PANELCO I
Labrador 5,800 5,765 99.40 14 CENPELCO
Laoac 14,800 14,755 99.70 12 PANELCO III
Lingayen 26,000 25,938 99.76 11 CENPELCO
Mabini 6,000 5,230 87.17 45 PANELCO I
1/ Rank is provincewide. Best (Rank 1) has the highest percentage
Sources: PANELCO I and III, DECORP, CENPELCO and LUELCO
74

Potential Actual Percent Rank 1/
The Countryside in Figures: Pangasinan, 6th Edition 2019: Energy
2018Province/Electric Cooperative
Household Connections
Electrical Service
Malasiqui 29,500 29,125 98.73 17 CENPELCO
Manaoag 15,858 15,307 96.53 27 DECORP
Mangaldan 23,500 22,963 97.71 23 CENPELCO
Mangatarem 16,900 16,626 98.38 18 CENPELCO
Mapandan 3,000 3,034 101.13 1 PANELCO III
Natividad 33,000 33,081 100.25 6 PANELCO III
Pozzorubio 14,500 14,612 100.77 2 PANELCO III
Rosales 13,500 12,914 95.66 32 PANELCO III
San Carlos City 43,368 43,089 99.36 15 CENPELCO/DECORP
San Fabian 22,454 21,797 97.07 24 DECORP/LUELCO
San Jacinto 9,949 9,402 94.50 36 DECORP/LUELCO
San Manuel 7,000 5,784 82.63 46 PANELCO III
1/ Rank is provincewide. Best (Rank 1) has the highest percentage
Sources: PANELCO I and III, DECORP, CENPELCO and LUELCO
75

Potential Actual Percent Rank 1/
The Countryside in Figures: Pangasinan, 6th Edition 2019: Energy
2018Province/Electric Cooperative
Household Connections
Electrical Service
San Nicolas 5,500 5,155 93.73 39 PANELCO III
San Quintin 15,000 14,730 98.20 21 PANELCO III
Santa Barbara 18,638 17,840 95.72 31 DECORP
Santa Maria 12,000 9,055 75.46 48 PANELCO III
Santo Tomas 8,000 6,109 76.36 47 PANELCO III
Sison 10,000 9,526 95.26 33 LUELCO
Sual 7,500 7,368 98.24 20 CENPELCO
Tayug 8,000 7,605 95.06 35 PANELCO III
Umingan 7,300 7,309 100.12 7 PANELCO III
Urbiztondo 10,300 10,204 99.07 16 CENPELCO
Urdaneta City 10,100 10,146 100.46 4 PANELCO III
Villasis 17,000 15,016 88.33 44 PANELCO III
1/ Rank is provincewide. Best (Rank 1) has the highest percentage
Sources: PANELCO I and III, DECORP, CENPELCO and LUELCO
76

Percent of Barangays Energized
2018
PANGASINAN 1,364 100.0
Agno 17 100.0
Aguilar 16 100.0
Alaminos City 39 100.0
Alcala 21 100.0
Anda 18 100.0
Asingan 21 100.0
Balungao 20 100.0
Bani 27 100.0
Basista 13 100.0
Bautista 18 100.0
Bayambang 77 100.0
Binalonan 24 100.0
Sources: PANELCO I and III, DECORP, CENPELCO and LUELCO
The Countryside in Figures: Pangasinan, 6th Edition 2019: Energy
City/MunicipalityNumber of
Barangays
77

Percent of Barangays Energized
2018
The Countryside in Figures: Pangasinan, 6th Edition 2019: Energy
City/MunicipalityNumber of
Barangays
Binmaley 33 100.0
Bolinao 30 100.0
Bugallon 24 100.0
Burgos 14 100.0
Calasiao 24 100.0
Dagupan City 31 100.0
Dasol 18 100.0
Infanta 13 100.0
Labrador 10 100.0
Laoac 22 100.0
Lingayen 32 100.0
Mabini 16 100.0
Sources: PANELCO I and III, DECORP, CENPELCO and LUELCO
78

Percent of Barangays Energized
2018
The Countryside in Figures: Pangasinan, 6th Edition 2019: Energy
City/MunicipalityNumber of
Barangays
Malasiqui 73 100.0
Manaoag 26 100.0
Mangaldan 30 100.0
Mangatarem 82 100.0
Mapandan 15 100.0
Natividad 18 100.0
Pozzorubio 34 100.0
Rosales 37 100.0
San Carlos City 86 100.0
San Fabian 34 100.0
San Jacinto 19 100.0
San Manuel 14 100.0
Sources: PANELCO I and III, DECORP, CENPELCO and LUELCO
79

Percent of Barangays Energized
2018
The Countryside in Figures: Pangasinan, 6th Edition 2019: Energy
City/MunicipalityNumber of
Barangays
San Nicolas 33 100.0
San Quintin 21 100.0
Santa Barbara 29 100.0
Santa Maria 23 100.0
Santo Tomas 10 100.0
Sison 28 100.0
Sual 19 100.0
Tayug 21 100.0
Umingan 58 100.0
Urbiztondo 21 100.0
Urdaneta City 34 100.0
Villasis 21 100.0
Sources: PANELCO I and III, DECORP, CENPELCO and LUELCO
80

The Countryside in Figures: Pangasinan, 6th Edition 2019
FINANCE

LIST OF INDICATORS
• 2018 Number of Banking Offices
•2018 Number of ATMs
HIGHLIGHTS
• A total of 336 banking offices were recorded in the whole Province of Pangasinan in 2018 where Dagupan
City had the highest number recorded with 63 banking offices.
•Three hundred seventy-two Automated Teller Machines (ATMs) were installed in the province. Dagupan
City had a total of 80 ATMs installed while the municipalities of Balungao, Bautista, Infanta, Labrador,
Natividad, San Jacinto and San Nicolas still have no ATMs in their areas.
The Countryside in Figures: Pangasinan, 6th Edition 2019

Universal and
Commercial BankThrift Bank
Rural Bank and
Cooperative Bank
PANGASINAN 110 106 120 336
Agno 1 1 2 28
Aguilar 1 4 5 16
Alaminos City 8 7 6 21 3
Alcala 2 2 28
Anda 1 2 3 22
Asingan 2 2 4 19
Balungao 1 1 36
Bani 1 3 4 19
Basista 0 45
Bautista 1 1 36
Bayambang 4 3 6 13 8
Binalonan 1 2 4 7 14
1/ Rank is provincewide. Best (Rank 1) has the highest value.
Source: Bangko Sentral ng Pilipinas
The Countryside in Figures: Pangasinan, 6th Edition 2019: Finance
1/RankTotal
Banking Offices (2018)
83

Universal and
Commercial BankThrift Bank
Rural Bank and
Cooperative Bank
The Countryside in Figures: Pangasinan, 6th Edition 2019: Finance
1/RankTotal
Banking Offices (2018)
Binmaley 3 4 7 14
Bolinao 1 4 5 16
Bugallon 3 3 22
Burgos 2 2 28
Calasiao 4 2 2 8 12
Dagupan City 36 18 9 63 1
Dasol 1 1 36
Infanta 1 1 36
Labrador 1 1 36
Laoac
Lingayen 6 8 5 19 4
Mabini 1 1 36
1/ Rank is provincewide. Best (Rank 1) has the highest value.
Source: Bangko Sentral ng Pilipinas
84

Universal and
Commercial BankThrift Bank
Rural Bank and
Cooperative Bank
The Countryside in Figures: Pangasinan, 6th Edition 2019: Finance
1/RankTotal
Banking Offices (2018)
Malasiqui 1 3 8 12 9
Manaoag 2 2 4 19
Mangaldan 6 4 7 17 5
Mangatarem 1 2 6 9 11
Mapandan 1 1 36
Natividad 0 45
Pozzorubio 4 4 8 12
Rosales 10 4 2 16 6
San Carlos City 6 5 4 15 7
San Fabian 3 2 5 16
San Jacinto 1 1 2 28
San Manuel 2 2 28
1/ Rank is provincewide. Best (Rank 1) has the highest value.
Source: Bangko Sentral ng Pilipinas
85

Universal and
Commercial BankThrift Bank
Rural Bank and
Cooperative Bank
The Countryside in Figures: Pangasinan, 6th Edition 2019: Finance
1/RankTotal
Banking Offices (2018)
San Nicolas 1 1 36
San Quintin 1 1 36
Santa Barbara 3 3 22
Santa Maria 2 2 28
Santo Tomas
Sison 2 1 3 22
Sual 2 2 28
Tayug 5 3 3 11 10
Umingan 1 1 2 28
Urbiztondo 1 2 3 22
Urdaneta City 20 13 7 40 2
Villasis 1 2 3 22
1/ Rank is provincewide. Best (Rank 1) has the highest value.
Source: Bangko Sentral ng Pilipinas
86

On-Site Off-Site
PANGASINAN 230 142 372
Agno 2 2 24
Aguilar 1 1 30
Alaminos City 20 6 26 3
Alcala 1 1 30
Anda 2 2 24
Asingan 1 1 30
Balungao 0 41
Bani 1 1 2 24
Basista 1 1 30
Bautista 0 41
Bayambang 9 3 12 9
Binalonan 5 1 6 15
1/ Rank is provincewide. Best (Rank 1) has the highest value.
Source: Bangko Sentral ng Pilipinas
The Countryside in Figures: Pangasinan, 6th Edition 2019: Finance
Automated Teller Machine (ATM)
2018Total 1/Rank
87

On-Site Off-Site
The Countryside in Figures: Pangasinan, 6th Edition 2019: Finance
Automated Teller Machine (ATM)
2018Total 1/Rank
Binmaley 3 3 20
Bolinao 2 1 3 20
Bugallon 1 1 2 24
Burgos 1 1 2 24
Calasiao 8 7 15 8
Dagupan City 54 26 80 1
Dasol 1 1 2 24
Infanta 0 41
Labrador 0 41
Laoac 1 1
Lingayen 15 10 25 5
Mabini 1 1 30
1/ Rank is provincewide. Best (Rank 1) has the highest value.
Source: Bangko Sentral ng Pilipinas
88

On-Site Off-Site
The Countryside in Figures: Pangasinan, 6th Edition 2019: Finance
Automated Teller Machine (ATM)
2018Total 1/Rank
Malasiqui 6 5 11 10
Manaoag 2 5 7 13
Mangaldan 10 6 16 7
Mangatarem 5 2 7 13
Mapandan 1 1 30
Natividad 0 41
Pozzorubio 3 6 9 12
Rosales 16 10 26 3
San Carlos City 14 4 18 6
San Fabian 2 3 5 16
San Jacinto 0 41
San Manuel 1 1 30
1/ Rank is provincewide. Best (Rank 1) has the highest value.
Source: Bangko Sentral ng Pilipinas
89

On-Site Off-Site
The Countryside in Figures: Pangasinan, 6th Edition 2019: Finance
Automated Teller Machine (ATM)
2018Total 1/Rank
San Nicolas 0 41
San Quintin 1 1 30
Santa Barbara 2 1 3 20
Santa Maria 1 1 30
Santo Tomas
Sison 1 1 30
Sual 3 3 20
Tayug 8 3 11 10
Umingan 2 2 4 17
Urbiztondo 2 2 4 17
Urdaneta City 35 16 51 2
Villasis 1 3 4 17
1/ Rank is provincewide. Best (Rank 1) has the highest value.
Source: Bangko Sentral ng Pilipinas
90

The Countryside in Figures: Pangasinan, 6th Edition 2019
HEALTH

LIST OF INDICATORS
• 2018 Contraceptive Prevalence Rates
• 2018 Total Number of Health Facilities
•2018 Total Number of Live Births, Infant Deaths and Infant Mortality Rates
HIGHLIGHTS
• Pangasinan recorded 48,636 live births in 2018. On the other hand, there were 342 infant deaths recorded
in the same year.
• The Municipality of Alcala, Mangaldan, Santo Tomas and Sison had no recorded infant death resulting to
zero infant mortality rate in 2018.
• There were 70 Rural Health Units and 637 Barangay Health Stations listed in Pangasinan in 2018. San
Carlos City had the biggest number of RHUs and Barangay Health Stations listed.
• The Municipality of Natividad had the highest Contraceptive Prevalence Rate (CPR) of 111.55 percent in
2018.
The Countryside in Figures: Pangasinan, 6th Edition 2019

The Countryside in Figures: Pangasinan, 6th Edition 2019: Health
TotalRate
(per 1,000 population)
PANGASINAN 2,956,726 48,636 16.45
Agno 28,052 502 17.90
Aguilar 41,463 661 15.94
Alaminos City 89,708 1716 19.13
Alcala 43,402 712 16.40
Anda 39,504 657 16.63
Asingan 57,355 824 14.37
Balungao 31,106 489 15.72
Bani 50,306 733 14.57
Basista 32,959 931 28.25
Bautista 32,307 768 23.77
Bayambang 118,205 2373 20.08
Binalonan 54,555 1062 19.47
Source: Department of Health, Region I
Philippine Statistics Authority
City/Munipality Population 2015
Number of Live Births (2018)
93

The Countryside in Figures: Pangasinan, 6th Edition 2019: Health
TotalRate
(per 1,000 population)
City/Munipality Population 2015
Number of Live Births (2018)
Binmaley 83,052 1090 13.12
Bolinao 82,084 1320 16.08
Bugallon 67,348 1200 17.82
Burgos 21,637 487 22.51
Calasiao 95,154 1538 16.16
Dagupan City 171,271 2,670 15.59
Dasol 29,110 607 20.85
Infanta 24,584 444 18.06
Labrador 23,201 350 15.09
Laoac 31,497 577 18.32
Lingayen 103,278 1771 17.15
Mabini 24,765 522 21.08
Source: Department of Health, Region I
Philippine Statistics Authority
94

The Countryside in Figures: Pangasinan, 6th Edition 2019: Health
TotalRate
(per 1,000 population)
City/Munipality Population 2015
Number of Live Births (2018)
Malasiqui 130,275 2367 18.17
Manaoag 69,497 1131 16.27
Mangaldan 106,331 1525 14.34
Mangatarem 73,241 996 13.60
Mapandan 37,059 535 14.44
Natividad 24,299 328 13.50
Pozzorubio 69,555 981 14.10
Rosales 63,081 876 13.89
San Carlos City 188,571 3286 17.43
San Fabian 83,025 1458 17.56
San Jacinto 40,848 708 17.33
San Manuel 52,939 800 15.11
Source: Department of Health, Region I
Philippine Statistics Authority
95

The Countryside in Figures: Pangasinan, 6th Edition 2019: Health
TotalRate
(per 1,000 population)
City/Munipality Population 2015
Number of Live Births (2018)
San Nicolas 35,574 517 14.53
San Quintin 32,945 521 15.81
Santa Barbara 82,012 1371 16.72
Santa Maria 33,038 489 14.80
Santo Tomas 15,022 153 10.19
Sison 47,518 822 17.30
Sual 34,149 534 15.64
Tayug 43,149 631 14.62
Umingan 73,252 1131 15.44
Urbiztondo 50,170 1004 20.01
Urdaneta City 132,940 1705 12.83
Villasis 62,333 763 12.24
Source: Department of Health, Region I
Philippine Statistics Authority
96

The Countryside in Figures: Pangasinan, 6th Edition 2019: Health
Infant DeathsInfant Mortality Rate
(per 1000 population)
PANGASINAN 342 7.03
Agno 1 1.99 39
Aguilar 10 15.13 6
Alaminos City 10 5.83 21
Alcala 0 0.00 45
Anda 4 6.09 19
Asingan 6 7.28 14
Balungao 5 10.22 13
Bani 4 5.46 24
Basista 4 4.30 26
Bautista 1 1.30 44
Bayambang 14 5.90 20
Binalonan 3 2.82 36
Rank/1 has the lowest rate
Source: Provincial Health Office, Pangasinan
Pangasinan Provincial Planning and Development Office
City/Munipality
CY 2018
Rank/1
97

The Countryside in Figures: Pangasinan, 6th Edition 2019: Health
Infant DeathsInfant Mortality Rate
(per 1000 population)
City/Munipality
CY 2018
Rank/1
Binmaley 13 11.93 8
Bolinao 9 6.82 16
Bugallon 4 3.33 34
Burgos 1 2.05 38
Calasiao 6 3.90 30
Dagupan City 45 16.85 3
Dasol 1 1.65 42
Infanta 3 6.76 17
Labrador 4 11.43 9
Laoac 15 26.00 1
Lingayen 6 3.39 33
Mabini 1 1.92 40
Rank/1 has the lowest rate
Source: Provincial Health Office, Pangasinan
Pangasinan Provincial Planning and Development Office
98

The Countryside in Figures: Pangasinan, 6th Edition 2019: Health
Infant DeathsInfant Mortality Rate
(per 1000 population)
City/Munipality
CY 2018
Rank/1
Malasiqui 9 3.80 31
Manaoag 8 7.07 15
Mangaldan 0 0.00 45
Mangatarem 11 11.04 11
Mapandan 6 11.21 10
Natividad 1 3.05 35
Pozzorubio 4 4.08 28
Rosales 9 10.27 12
San Carlos City 54 16.43 5
San Fabian 6 4.12 27
San Jacinto 4 5.65 23
San Manuel 2 2.50 37
Rank/1 has the lowest rate
Source: Provincial Health Office, Pangasinan
Pangasinan Provincial Planning and Development Office
99

The Countryside in Figures: Pangasinan, 6th Edition 2019: Health
Infant DeathsInfant Mortality Rate
(per 1000 population)
City/Munipality
CY 2018
Rank/1
San Nicolas 3 5.80 22
San Quintin 10 19.19 2
Santa Barbara 2 1.46 43
Santa Maria 3 6.13 18
Santo Tomas 0 0.00 45
Sison 0 0.00 45
Sual 2 3.75 32
Tayug 8 12.68 7
Umingan 19 16.80 4
Urbiztondo 5 4.98 25
Urdaneta City 3 1.76 41
Villasis 3 3.93 29
Rank/1 has the lowest rate
Source: Provincial Health Office, Pangasinan
Pangasinan Provincial Planning and Development Office
100

The Countryside in Figures: Pangasinan, 6th Edition 2019: Health
Rural Health UnitBarangay Health
StationTotal Rank 1/
PANGASINAN 70 637 707
Agno 2 10 12 23
Aguilar 1 5 6 41
Alaminos City 2 12 14 18
Alcala 1 7 8 33
Anda 1 5 6 41
Asingan 2 14 16 14
Balungao 1 7 8 33
Bani 2 10 12 23
Basista 1 13 14 18
Bautista 1 6 7 37
Bayambang 2 25 27 4
Binalonan 1 24 25 6
1/ Rank is provincewide. Best (Rank 1) has the highest value.
Source: Department of Health, Region I
City/Munipality2018
Number of Health Facilities
101

The Countryside in Figures: Pangasinan, 6th Edition 2019: Health
Rural Health UnitBarangay Health
StationTotal Rank 1/
City/Munipality2018
Number of Health Facilities
Binmaley 2 16 18 11
Bolinao 2 11 13 20
Bugallon 2 24 26 5
Burgos 1 4 5 45
Calasiao 2 22 24 7
Dagupan City 1 14 15 17
Dasol 1 8 9 30
Infanta 1 11 12 23
Labrador 1 4 5 45
Laoac 1 6 7 37
Lingayen 2 18 20 10
Mabini 1 4 5 45
1/ Rank is provincewide. Best (Rank 1) has the highest value.
Source: Department of Health, Region I
102

The Countryside in Figures: Pangasinan, 6th Edition 2019: Health
Rural Health UnitBarangay Health
StationTotal Rank 1/
City/Munipality2018
Number of Health Facilities
Malasiqui 2 19 21 9
Manaoag 1 17 18 11
Mangaldan 2 20 22 8
Mangatarem 2 14 16 14
Mapandan 1 8 9 30
Natividad 1 5 6 41
Pozzorubio 1 10 11 27
Rosales 1 9 10 29
San Carlos City 6 81 87 1
San Fabian 2 11 13 20
San Jacinto 1 6 7 37
San Manuel 1 12 13 20
1/ Rank is provincewide. Best (Rank 1) has the highest value.
Source: Department of Health, Region I
103

The Countryside in Figures: Pangasinan, 6th Edition 2019: Health
Rural Health UnitBarangay Health
StationTotal Rank 1/
City/Munipality2018
Number of Health Facilities
San Nicolas 1 8 9 30
San Quintin 1 6 7 37
Santa Barbara 1 11 12 23
Santa Maria 1 5 6 41
Santo Tomas 1 2 3 48
Sison 1 28 29 3
Sual 1 7 8 33
Tayug 1 7 8 33
Umingan 2 14 16 14
Urbiztondo 1 10 11 27
Urdaneta City 3 31 34 2
Villasis 1 16 17 13
1/ Rank is provincewide. Best (Rank 1) has the highest value.
Source: Department of Health, Region I
104

Women of
Reproductive Age
(WRA)
USER Contraceptive
Prevalence Rates Rank 1/
PANGASINAN 377,098 263,048 69.76
Agno 3,578 3091 86.39 8
Aguilar 5,288 3769 71.27 31
Alaminos City 11,441 8449 73.85 25
Alcala 5,535 5805 104.88 2
Anda 5,038 4436 88.05 6
Asingan 7,315 5338 72.97 26
Balungao 3,967 3,074 77.49 17
Bani 6,416 4,611 71.87 30
Basista 4,204 3,714 88.34 5
Bautista 4,120 3,451 83.76 9
Bayambang 15,076 13,739 91.13 4
Binalonan 6,958 4,803 69.03 35
1/ Rank is provincewide. Best (Rank 1) has the highest rate.
Source: Department of Health, Region I
The Countryside in Figures: Pangasinan, 6th Edition 2019: Health
City/Munipality
2018
105

Women of
Reproductive Age
(WRA)
USER Contraceptive
Prevalence Rates Rank 1/
The Countryside in Figures: Pangasinan, 6th Edition 2019: Health
City/Munipality
2018
Binmaley 10,592 6,583 62.15 42
Bolinao 10,469 8,547 81.64 14
Bugallon 8,589 5,752 66.97 38
Burgos 2,760 2,294 83.12 10
Calasiao 12,136 6,601 54.39 44
Dagupan City 21,844 7,939 36.34 48
Dasol 3,713 3,591 96.71 3
Infanta 3,135 2,565 81.82 13
Labrador 2,959 1,910 64.55 41
Laoac 4,017 3,293 81.98 11
Lingayen 13,172 6,621 50.27 45
Mabini 3,159 2,435 77.08 18
1/ Rank is provincewide. Best (Rank 1) has the highest rate.
Source: Department of Health, Region I
106

Women of
Reproductive Age
(WRA)
USER Contraceptive
Prevalence Rates Rank 1/
The Countryside in Figures: Pangasinan, 6th Edition 2019: Health
City/Munipality
2018
Malasiqui 16,615 12,095 72.80 27
Manaoag 8,864 6,653 75.06 22
Mangaldan 13,561 7,805 57.55 43
Mangatarem 9,341 6,721 71.95 29
Mapandan 4,727 3,076 65.07 39
Natividad 3,099 3,457 111.55 1
Pozzorubio 8,871 6,218 70.09 33
Rosales 8,045 5,801 72.11 28
San Carlos City 24,050 11,642 48.41 46
San Fabian 10,589 7,527 71.08 32
San Jacinto 5,210 3,630 69.67 34
San Manuel 6,752 4568 67.65 37
1/ Rank is provincewide. Best (Rank 1) has the highest rate.
Source: Department of Health, Region I
107

Women of
Reproductive Age
(WRA)
USER Contraceptive
Prevalence Rates Rank 1/
The Countryside in Figures: Pangasinan, 6th Edition 2019: Health
City/Munipality
2018
San Nicolas 4,537 3,714 81.86 12
San Quintin 4,202 2,725 64.85 40
Santa Barbara 10,460 7,889 75.42 21
Santa Maria 4,214 3,180 75.46 20
Santo Tomas 1,916 910 47.49 47
Sison 6,060 5,328 87.92 7
Sual 4,355 3,435 78.87 15
Tayug 5,503 4,183 76.01 19
Umingan 9,342 6,404 68.55 36
Urbiztondo 6,399 4,768 74.51 24
Urdaneta City 16,955 12,646 74.59 23
Villasis 7,950 6,262 78.77 16
1/ Rank is provincewide. Best (Rank 1) has the highest rate.
Source: Department of Health, Region I
108

The Countryside in Figures: Pangasinan, 6th Edition 2019
INCOME AND PRICES

LIST OF INDICATORS
• 2018 Financial Performance of Cities/Municipalities
HIGHLIGHTS
• The cities/municipalities in the Province of Pangasinan had a total budget surplus of 2,419,123,000.00 in
2018. Dagupan City had the highest budget surplus amounting to 286,171,000.00.
The Countryside in Figures: Pangasinan, 6th Edition 2019

PANGASINAN 11,264,876 8,845,753 2,419,123
Agno 111,172 83,472 27,700 27
Aguilar 137,073 119,765 17,308 38
Alaminos City 634,178 573,375 60,803 14
Alcala 213,595 123,636 89,959 5
Anda 123,105 96,493 26,612 28
Asingan 151,470 126,944 24,526 31
Balungao 112,547 96,261 16,286 39
Bani 156,955 145,129 11,826 41
Basista 93,901 79,699 14,202 40
Bautista 92,748 86,097 6,651 44
Bayambang 396,215 322,553 73,662 7
Binalonan 207,618 161,656 45,962 20
1/ Rank is provincewide. Best (Rank 1) has the highest value.
Source: Commission on Audit
The Countryside in Figures: Pangasinan, 6th Edition 2019: Income and Prices
City/Munipality Rank 1/
Financial Performance of Cities/Municipalities 2018
Revenue Expenses Surplus/(Deficit)
in thousand
111

The Countryside in Figures: Pangasinan, 6th Edition 2019: Income and Prices
City/Munipality Rank 1/
Financial Performance of Cities/Municipalities 2018
Revenue Expenses Surplus/(Deficit)
Binmaley 202,997 151,598 51,399 18
Bolinao 274,247 202,423 71,824 8
Bugallon 187,236 153,825 33,411 26
Burgos 99,054 78,104 20,950 35
Calasiao 289,746 221,037 68,709 10
Dagupan City 989,006 702,835 286,171 1
Dasol 114,738 92,837 21,901 32
Infanta 123,065 101,437 21,628 34
Labrador 88,508 68,766 19,742 37
Laoac 150,217 82,726 67,491 11
Lingayen 333,263 272,497 60,766 15
Mabini 124,187 119,000 5,187 47
1/ Rank is provincewide. Best (Rank 1) has the highest value.
Source: Commission on Audit
112

The Countryside in Figures: Pangasinan, 6th Edition 2019: Income and Prices
City/Munipality Rank 1/
Financial Performance of Cities/Municipalities 2018
Revenue Expenses Surplus/(Deficit)
Malasiqui 315,099 250,710 64,389 13
Manaoag 200,617 131,278 69,339 9
Mangaldan 274,182 233,468 40,714 22
Mangatarem 215,229 161,607 53,622 17
Mapandan 106,699 97,514 9,185 42
Natividad 95,205 68,751 26,454 29
Pozzorubio 215,583 167,790 47,793 19
Rosales 241,475 220,691 20,784 36
San Carlos City 784,795 578,719 206,076 2
San Fabian 198,013 193,628 4,385 48
San Jacinto 122,323 88,595 33,728 25
San Manuel 197,694 175,909 21,785 33
1/ Rank is provincewide. Best (Rank 1) has the highest value.
Source: Pangasinan Provincial Planning and Development Office
113

The Countryside in Figures: Pangasinan, 6th Edition 2019: Income and Prices
City/Munipality Rank 1/
Financial Performance of Cities/Municipalities 2018
Revenue Expenses Surplus/(Deficit)
San Nicolas 144,634 138,049 6,585 45
San Quintin 112,511 104,221 8,290 43
Santa Barbara 160,091 103,727 56,364 16
Santa Maria 230,703 188,690 42,013 21
Santo Tomas 123,774 86,041 37,733 23
Sison 63,485 57,864 5,621 46
Sual 336,444 183,382 153,062 4
Tayug 149,929 124,271 25,658 30
Umingan 272,838 190,496 82,342 6
Urbiztondo 134,493 97,236 37,257 24
Urdaneta City 914,250 759,766 154,484 3
Villasis 247,969 181,185 66,784 12
1/ Rank is provincewide. Best (Rank 1) has the highest value.
Source: Pangasinan Provincial Planning and Development Office
114

The Countryside in Figures: Pangasinan, 6th Edition 2019
INFRASTRUCTURE

LIST OF INDICATORS
• 2016 Length of Barangay Roads and Bridges
• 2016 Length of Municipal Roads and Bridges
• 2016 Length of Provincial Roads and Bridges
• 2016 Length of National Roads and Bridges
HIGHLIGHTS
• As of 2016, the Province of Pangasinan had 5,907.8 km barangay roads, 475.1 km municipal roads, 727.7
km provincial roads and 630.2 km national roads.
• Pangasinan had 13,995.8 l.m. barangay bridges, 2,001.6 l.m. municipal bridges, 5,934.1 l.m. provincial
bridges and 13,760.9 l.m. national bridges which are all permanent in 2016.
The Countryside in Figures: Pangasinan, 6th Edition 2019

Concrete Asphalt Total Gravel Earth Total
PANGASINAN 2,586.9 298.8 2,885.7 1,930.1 1,113.6 3,022.1 5,907.8
Agno 30.7 4.1 34.8 57.4 64.4 121.8 156.5 10
Aguilar 47.5 1.3 48.8 72.3 11.8 84.1 132.9 16
Alaminos City 106.5 8.1 114.6 124.5 173.2 297.7 412.3 1
Alcala 46.3 0.9 47.2 25.0 28.1 53.1 100.3 32
Anda 2.6 3.1 5.7 36.2 14.1 50.3 56.0 42
Asingan 52.8 2.2 55.0 49.9 13.3 63.2 118.2 25
Balungao 25.0 0.5 25.5 74.8 26.0 100.8 126.3 19
Bani 18.8 1.5 20.3 126.6 58.3 184.9 205.3 6
Basista 27.5 7.5 34.9 9.7 2.9 12.5 47.5 43
Bautista 23.9 5.2 29.1 7.5 14.1 29.1 46
Bayambang 126.8 6.7 133.6 28.3 59.7 88.0 221.5 5
Binalonan 38.1 2.1 40.2 53.6 16.3 69.8 110.0 26
1/ Rank is provincewide. Best (Rank 1) has the highest value.
Source: MPDC/CPDC/ME Offices
Pangasinan Provincial Planning and Development Office
The Countryside in Figures: Pangasinan, 6th Edition 2019: Infrastructure
City/Municipality
Length (km) of Barangay Roads by Pavement Type (2016)
PAVED UNPAVEDGRAND
TOTALRank 1/
117

Concrete Asphalt Total Gravel Earth Total
The Countryside in Figures: Pangasinan, 6th Edition 2019: Infrastructure
City/Municipality
Length (km) of Barangay Roads by Pavement Type (2016)
PAVED UNPAVEDGRAND
TOTALRank 1/
Binmaley 56.5 23.4 79.8 6.9 6.9 86.7 35
Bolinao 30.6 6.0 36.6 6.5 253.4 259.8 296.4 2
Bugallon 50.6 7.0 57.6 38.8 5.0 43.8 101.4 31
Burgos 19.2 1.0 20.2 122.3 0.1 122.4 142.5 12
Calasiao 65.1 - 65.1 33.6 11.1 44.7 109.8 27
Dagupan City 52.2 3.8 56.0 - 56.0 41
Dasol 65.3 65.3 99.9 99.9 165.2 9
Infanta 31.4 4.0 35.4 56.4 13.6 70.0 105.4 29
Labrador 15.1 0.8 15.8 16.7 6.7 23.4 39.2 45
Laoac 41.0 0.6 41.6 35.1 35.1 76.7 38
Lingayen 63.7 70.7 134.4 36.5 62.2 98.7 233.1 3
Mabini 39.6 3.5 43.0 31.2 52.1 83.3 126.3 18
1/ Rank is provincewide. Best (Rank 1) has the highest value.
Source: MPDC/CPDC/ME Offices
Pangasinan Provincial Planning and Development Office
118
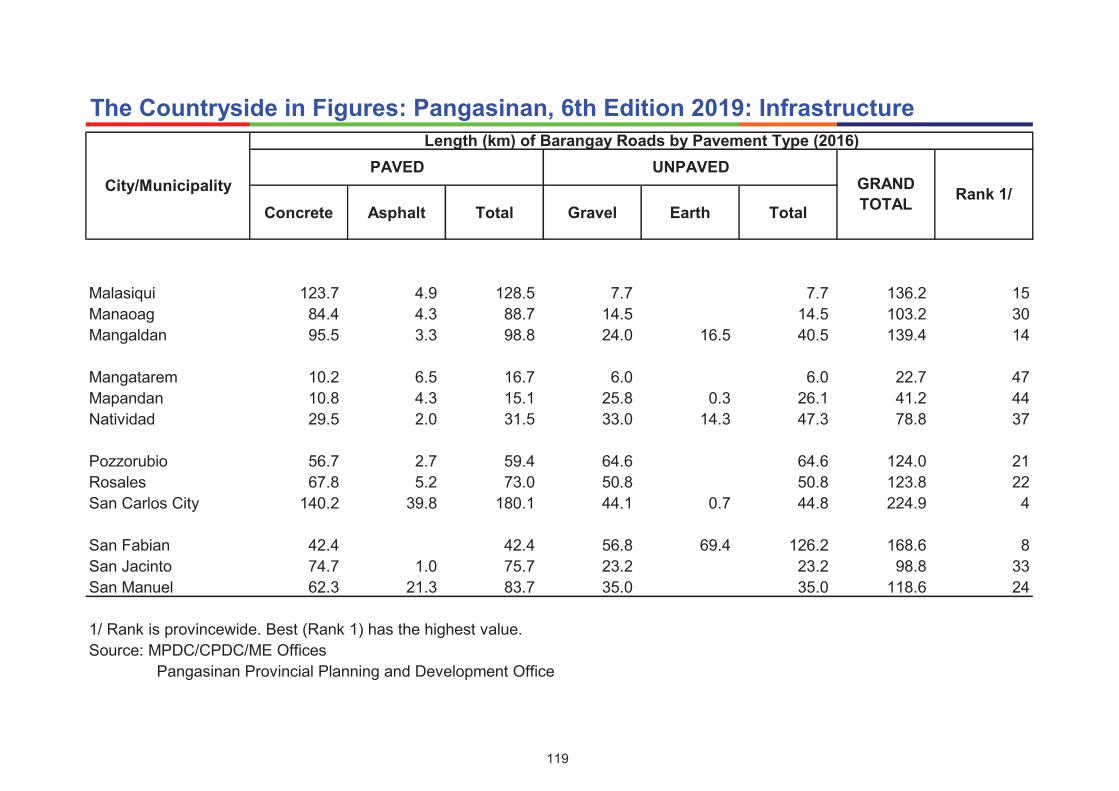
Concrete Asphalt Total Gravel Earth Total
The Countryside in Figures: Pangasinan, 6th Edition 2019: Infrastructure
City/Municipality
Length (km) of Barangay Roads by Pavement Type (2016)
PAVED UNPAVEDGRAND
TOTALRank 1/
Malasiqui 123.7 4.9 128.5 7.7 7.7 136.2 15
Manaoag 84.4 4.3 88.7 14.5 14.5 103.2 30
Mangaldan 95.5 3.3 98.8 24.0 16.5 40.5 139.4 14
Mangatarem 10.2 6.5 16.7 6.0 6.0 22.7 47
Mapandan 10.8 4.3 15.1 25.8 0.3 26.1 41.2 44
Natividad 29.5 2.0 31.5 33.0 14.3 47.3 78.8 37
Pozzorubio 56.7 2.7 59.4 64.6 64.6 124.0 21
Rosales 67.8 5.2 73.0 50.8 50.8 123.8 22
San Carlos City 140.2 39.8 180.1 44.1 0.7 44.8 224.9 4
San Fabian 42.4 42.4 56.8 69.4 126.2 168.6 8
San Jacinto 74.7 1.0 75.7 23.2 23.2 98.8 33
San Manuel 62.3 21.3 83.7 35.0 35.0 118.6 24
1/ Rank is provincewide. Best (Rank 1) has the highest value.
Source: MPDC/CPDC/ME Offices
Pangasinan Provincial Planning and Development Office
119

Concrete Asphalt Total Gravel Earth Total
The Countryside in Figures: Pangasinan, 6th Edition 2019: Infrastructure
City/Municipality
Length (km) of Barangay Roads by Pavement Type (2016)
PAVED UNPAVEDGRAND
TOTALRank 1/
San Nicolas 38.7 3.6 42.4 55.1 25.0 80.0 122.4 23
San Quintin 34.5 8.7 43.2 81.8 81.8 125.0 20
Santa Barbara 26.0 4.5 30.4 60.9 1.2 62.1 92.5 34
Santa Maria 1.2 1.3 2.5 4.3 6.7 11.0 13.5 48
Santo Tomas 132.6 9.6 142.3 10.6 10.6 152.9 11
Sison 46.9 2.9 49.8 3.8 26.6 30.4 80.3 36
Sual 84.1 2.2 86.3 38.0 17.4 55.5 141.8 13
Tayug 57.8 0.5 58.3 0.2 0.2 58.5 40
Umingan 19.2 3.3 22.5 86.4 19.7 106.1 128.6 17
Urbiztondo 45.2 2.3 47.5 15.6 11.6 27.2 74.7 39
Urdaneta City 175.8 175.8 - 175.8 7
Villasis 49.7 0.8 50.5 48.8 7.3 56.2 106.7 28
1/ Rank is provincewide. Best (Rank 1) has the highest value.
Source: MPDC/CPDC/ME Offices
Pangasinan Provincial Planning and Development Office
120
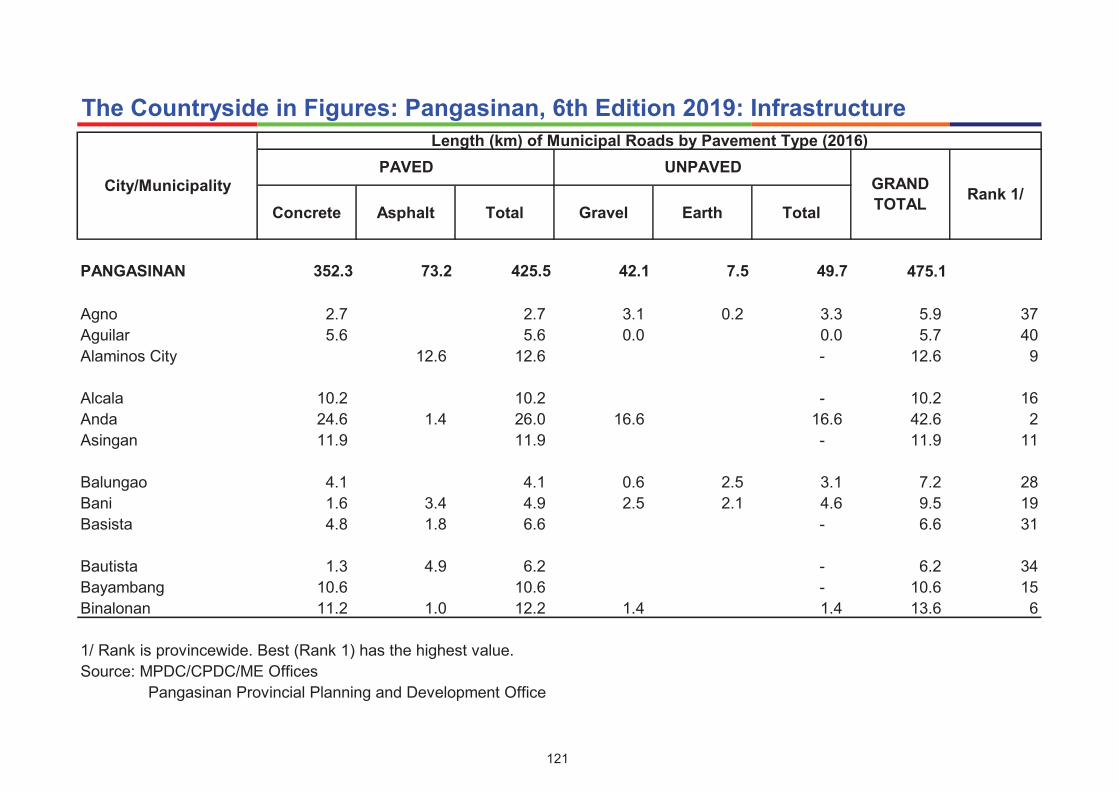
Concrete Asphalt Total Gravel Earth Total
PANGASINAN 352.3 73.2 425.5 42.1 7.5 49.7 475.1
Agno 2.7 2.7 3.1 0.2 3.3 5.9 37
Aguilar 5.6 5.6 0.0 0.0 5.7 40
Alaminos City 12.6 12.6 - 12.6 9
Alcala 10.2 10.2 - 10.2 16
Anda 24.6 1.4 26.0 16.6 16.6 42.6 2
Asingan 11.9 11.9 - 11.9 11
Balungao 4.1 4.1 0.6 2.5 3.1 7.2 28
Bani 1.6 3.4 4.9 2.5 2.1 4.6 9.5 19
Basista 4.8 1.8 6.6 - 6.6 31
Bautista 1.3 4.9 6.2 - 6.2 34
Bayambang 10.6 10.6 - 10.6 15
Binalonan 11.2 1.0 12.2 1.4 1.4 13.6 6
1/ Rank is provincewide. Best (Rank 1) has the highest value.
Source: MPDC/CPDC/ME Offices
Pangasinan Provincial Planning and Development Office
Length (km) of Municipal Roads by Pavement Type (2016)
PAVED UNPAVEDGRAND
TOTALRank 1/
The Countryside in Figures: Pangasinan, 6th Edition 2019: Infrastructure
City/Municipality
121

Concrete Asphalt Total Gravel Earth Total
Length (km) of Municipal Roads by Pavement Type (2016)
PAVED UNPAVEDGRAND
TOTALRank 1/
The Countryside in Figures: Pangasinan, 6th Edition 2019: Infrastructure
City/Municipality
Binmaley 1.8 1.4 3.3 0.1 0.1 3.3 45
Bolinao 2.1 5.4 7.5 0.1 0.9 1.0 8.5 23
Bugallon 4.0 2.9 6.9 2.7 2.7 9.6 18
Burgos 5.0 2.6 7.7 0.1 0.0 0.1 7.7 25
Calasiao 11.6 11.6 2.6 0.2 2.8 14.4 5
Dagupan City 15.6 2.0 17.6 - 17.6 3
Dasol 6.9 6.9 0.5 0.5 7.3 27
Infanta 0.8 1.2 2.0 - 2.0 47
Labrador 2.0 2.0 - 2.0 47
Laoac 2.1 1.3 3.4 4.2 4.2 7.7 26
Lingayen 9.5 2.3 11.8 0.6 0.4 1.0 12.8 8
Mabini 5.5 0.1 5.6 0.3 0.3 5.9 39
1/ Rank is provincewide. Best (Rank 1) has the highest value.
Source: MPDC/CPDC/ME Offices
Pangasinan Provincial Planning and Development Office
122

Concrete Asphalt Total Gravel Earth Total
Length (km) of Municipal Roads by Pavement Type (2016)
PAVED UNPAVEDGRAND
TOTALRank 1/
The Countryside in Figures: Pangasinan, 6th Edition 2019: Infrastructure
City/Municipality
Malasiqui 9.0 3.8 12.8 - 12.8 7
Manaoag 7.9 0.6 8.5 - 8.5 22
Mangaldan 9.2 1.4 10.6 0.2 0.2 10.7 14
Mangatarem 14.2 0.1 14.4 0.3 0.3 14.7 4
Mapandan 1.3 4.2 5.5 1.0 1.0 6.4 32
Natividad 3.7 3.7 - 3.7 43
Pozzorubio 9.2 9.2 - 9.2 20
Rosales 8.1 1.0 9.1 - 9.1 21
San Carlos City 43.2 9.0 52.2 - 52.2 1
San Fabian 7.7 0.3 7.9 - 7.9 24
San Jacinto 9.6 9.6 0.2 0.2 9.7 17
San Manuel 8.0 3.6 11.6 - 11.6 13
1/ Rank is provincewide. Best (Rank 1) has the highest value.
Source: MPDC/CPDC/ME Offices
Pangasinan Provincial Planning and Development Office
123

Concrete Asphalt Total Gravel Earth Total
Length (km) of Municipal Roads by Pavement Type (2016)
PAVED UNPAVEDGRAND
TOTALRank 1/
The Countryside in Figures: Pangasinan, 6th Edition 2019: Infrastructure
City/Municipality
San Nicolas 6.2 6.2 - 6.2 35
San Quintin 3.4 3.4 - 3.4 44
Santa Barbara 4.2 4.2 - 4.2 42
Santa Maria 6.0 6.0 - 6.0 36
Santo Tomas 2.1 2.1 - 2.1 46
Sison 6.1 0.1 6.2 0.7 0.1 0.9 7.0 29
Sual 6.8 2.2 9.0 2.5 0.6 3.1 12.1 10
Tayug 6.7 6.7 - 6.7 30
Umingan 5.4 5.4 0.5 0.5 5.9 38
Urbiztondo 2.2 2.5 4.7 0.4 0.4 0.9 5.6 41
Urdaneta City 6.1 0.2 6.3 - 6.3 33
Villasis 10.7 10.7 1.1 1.1 11.8 12
1/ Rank is provincewide. Best (Rank 1) has the highest value.
Source: MPDC/CPDC/ME Offices
Pangasinan Provincial Planning and Development Office
124

Concrete Asphalt Total Gravel Earth Total
PANGASINAN 478.5 244.9 723.4 3.2 1.1 4.3 727.7
Agno 2.7 7.5 10.1 1.2 - 1.2 11.4 29
Aguilar 12.8 2.2 15.1 15.1 23
Alaminos City
Alcala 7.9 1.6 9.5 9.5 34
Anda 11.5 3.9 15.4 15.4 21
Asingan 25.4 4.3 29.7 29.7 4
Balungao 4.8 10.4 15.2 0.0 15.2 22
Bani 10.4 6.3 16.8 16.8 19
Basista 4.4 6.3 10.7 10.7 30
Bautista 2.4 3.5 5.9 5.9 39
Bayambang 4.0 16.0 20.0 20.0 12
Binalonan 8.6 - 8.6 8.6 36
1/ Rank is provincewide. Best (Rank 1) has the highest value.
Source: PEO Pangasinan
Pangasinan Provincial Planning and Development Office
The Countryside in Figures: Pangasinan, 6th Edition 2019: Infrastructure
City/Municipality
Length (kms) of Provincial Roads by Pavement Type (2016)
PAVED UNPAVEDGRAND
TOTALRank 1/
125

Concrete Asphalt Total Gravel Earth Total
The Countryside in Figures: Pangasinan, 6th Edition 2019: Infrastructure
City/Municipality
Length (kms) of Provincial Roads by Pavement Type (2016)
PAVED UNPAVEDGRAND
TOTALRank 1/
Binmaley 12.8 6.6 19.4 19.4 14
Bolinao 12.5 0.4 12.9 12.9 25
Bugallon 14.7 2.4 17.0 0.2 1.1 1.4 18.4 15
Burgos 17.3 6.5 23.8 0.0 23.8 7
Calasiao 21.2 0.6 21.8 21.8 9
Dagupan City
Dasol 1.5 - 1.5 1.5 40
Infanta - 0.4 0.4 0.4 41
Labrador
Laoac
Lingayen 10.9 16.3 27.2 27.2 6
Mabini 4.0 6.0 10.0 0.0 10.0 31
1/ Rank is provincewide. Best (Rank 1) has the highest value.
Source: PEO Pangasinan
Pangasinan Provincial Planning and Development Office
126

Concrete Asphalt Total Gravel Earth Total
The Countryside in Figures: Pangasinan, 6th Edition 2019: Infrastructure
City/Municipality
Length (kms) of Provincial Roads by Pavement Type (2016)
PAVED UNPAVEDGRAND
TOTALRank 1/
Malasiqui 13.0 8.3 21.3 21.3 10
Manaoag 13.2 4.0 17.2 17.2 18
Mangaldan 10.6 1.5 12.1 12.1 28
Mangatarem 29.7 5.3 35.1 35.1 3
Mapandan 14.6 5.0 19.6 19.6 13
Natividad 14.3 3.1 17.4 17.4 17
Pozzorubio 16.4 4.6 21.0 21.0 11
Rosales 0.2 9.7 9.9 9.9 32
San Carlos City 12.5 11.1 23.5 0.0 23.5 8
San Fabian 14.8 - 14.8 14.8 24
San Jacinto 15.7 0.4 16.1 16.1 20
San Manuel 8.4 18.0 26.4 1.0 - 1.0 27.4 5
1/ Rank is provincewide. Best (Rank 1) has the highest value.
Source: PEO Pangasinan
Pangasinan Provincial Planning and Development Office
127

Concrete Asphalt Total Gravel Earth Total
The Countryside in Figures: Pangasinan, 6th Edition 2019: Infrastructure
City/Municipality
Length (kms) of Provincial Roads by Pavement Type (2016)
PAVED UNPAVEDGRAND
TOTALRank 1/
San Nicolas 8.6 0.7 9.3 0.0 9.3 35
San Quintin 16.5 1.6 18.1 0.0 18.1 16
Santa Barbara 14.4 3.0 17.4 17.4 17
Santa Maria 7.7 4.6 12.3 12.3 27
Santo Tomas
Sison 2.2 5.5 7.7 7.7 37
Sual 6.4 - 6.4 6.4 38
Tayug 6.5 3.1 9.7 9.7 33
Umingan 16.2 25.1 41.3 0.8 - 0.8 42.0 2
Urbiztondo 2.2 19.2 21.3 21.3 10
Urdaneta City 32.5 9.8 42.3 42.3 1
Villasis 12.4 - 12.4 12.4 26
1/ Rank is provincewide. Best (Rank 1) has the highest value.
Source: PEO Pangasinan
Pangasinan Provincial Planning and Development Office
128

Concrete Asphalt Total Gravel Total
PANGASINAN 242.0 388.2 630.2 0.0 0.0 630.2
Agno 7.9 5.9 13.9 13.9 22
Aguilar 9.6 9.6 9.6 31
Alaminos City 5.2 22.0 27.2 27.2 3
Alcala 2.9 7.0 10.0 10.0 30
Anda - -
Asingan 3.4 7.0 10.4 10.4 29
Balungao 4.1 2.9 7.0 7.0 37
Bani 14.7 4.8 19.6 19.6 8
Basista 1.9 4.1 6.0 6.0 38
Bautista 3.0 0.1 3.1 3.1 44
Bayambang 6.2 13.2 19.3 19.3 9
Binalonan 11.1 5.2 16.3 16.3 15
1/ Rank is provincewide. Best (Rank 1) has the highest value.
Source: PEO Pangasinan
Pangasinan Provincial Planning and Development Office
UNPAVED
Rank 1/GRAND
TOTAL
The Countryside in Figures: Pangasinan, 6th Edition 2019: Infrastructure
City/Municipality
Length (kms) of National Roads by Pavement Type (2016)
PAVED
129

Concrete Asphalt Total Gravel Total
UNPAVED
Rank 1/GRAND
TOTAL
The Countryside in Figures: Pangasinan, 6th Edition 2019: Infrastructure
City/Municipality
Length (kms) of National Roads by Pavement Type (2016)
PAVED
Binmaley 8.7 12.2 20.9 20.9 7
Bolinao 5.6 12.5 18.0 18.0 12
Bugallon 4.9 11.8 16.6 16.6 13
Burgos 4.4 7.3 11.7 11.7 27
Calasiao 2.8 11.8 14.6 14.6 19
Dagupan City 12.4 16.3 28.8 28.8 2
Dasol 1.0 15.4 16.4 16.4 14
Infanta 2.5 6.7 9.2 9.2 33
Labrador 0.2 15.4 15.6 15.6 17
Laoac 4.9 4.9 4.9 42
Lingayen 1.1 12.6 13.7 13.7 23
Mabini 2.1 10.9 13.0 13.0 26
1/ Rank is provincewide. Best (Rank 1) has the highest value.
Source: PEO Pangasinan
Pangasinan Provincial Planning and Development Office
130

Concrete Asphalt Total Gravel Total
UNPAVED
Rank 1/GRAND
TOTAL
The Countryside in Figures: Pangasinan, 6th Edition 2019: Infrastructure
City/Municipality
Length (kms) of National Roads by Pavement Type (2016)
PAVED
Malasiqui 11.4 14.4 25.9 25.9 4
Manaoag 1.6 7.2 8.8 8.8 34
Mangaldan 0.2 14.2 14.3 14.3 21
Mangatarem 13.1 3.0 16.1 16.1 16
Mapandan
Natividad 2.0 3.8 5.8 5.8 39
Pozzorubio 3.5 5.8 9.3 9.3 32
Rosales 7.4 18.2 25.6 25.6 5
San Carlos City 7.4 11.7 19.1 19.1 10
San Fabian 14.8 14.8 14.8 18
San Jacinto 4.9 4.9 4.9 41
San Manuel
1/ Rank is provincewide. Best (Rank 1) has the highest value.
Source: PEO Pangasinan
Pangasinan Provincial Planning and Development Office
131

Concrete Asphalt Total Gravel Total
UNPAVED
Rank 1/GRAND
TOTAL
The Countryside in Figures: Pangasinan, 6th Edition 2019: Infrastructure
City/Municipality
Length (kms) of National Roads by Pavement Type (2016)
PAVED
San Nicolas 4.3 6.4 10.7 10.7 28
San Quintin 2.7 2.7 5.4 5.4 40
Santa Barbara 6.7 15.6 22.4 22.4 6
Santa Maria 4.2 10.3 14.5 14.5 20
Santo Tomas 0.4 3.5 3.9 3.9 43
Sison 4.8 2.7 7.5 7.5 36
Sual 8.0 5.5 13.5 13.5 25
Tayug 1.3 7.3 8.5 8.5 35
Umingan 28.3 13.4 41.7 41.7 1
Urbiztondo - -
Urdaneta City 10.0 8.4 18.4 18.4 11
Villasis 9.1 4.5 13.6 13.6 24
1/ Rank is provincewide. Best (Rank 1) has the highest value.
Source: PEO Pangasinan
Pangasinan Provincial Planning and Development Office
132

Concrete Steel Total Bailey TimberHanging
Ft. Br.Total
PANGASINAN 9,453.0 734.4 10,187.3 958.3 79.0 2,771.2 3,808.5 13,995.8
Agno 193.5 193.5 - 193.5 24
Aguilar 364.0 364.0 289.5 289.5 653.5 6
Alaminos City 687.7 118.2 805.9 21.0 50.0 71.0 876.9 4
Alcala - - - - -
Anda 21.5 21.5 18.0 18.0 39.5 44
Asingan 78.8 78.8 140.0 140.0 218.8 21
Balungao 440.0 440.0 - 440.0 11
Bani 101.0 101.0 12.0 12.0 113.0 35
Basista - - -
Bautista - - -
Bayambang 106.2 106.2 56.0 56.0 162.2 28
Binalonan 82.8 82.8 - 82.8 39
1/ Rank is provincewide. Best (Rank 1) has the highest value.
Source: MPDC/CPDC/ME Offices
Pangasinan Provincial Planning and Development Office
The Countryside in Figures: Pangasinan, 6th Edition 2019: Infrastructure
City/Municipality
Length (l.m.) of Barangay Bridges by Type (2016)
PERMANENT TEMPORARYGRAND
TOTALRank 1/
133

Concrete Steel Total Bailey TimberHanging
Ft. Br.Total
The Countryside in Figures: Pangasinan, 6th Edition 2019: Infrastructure
City/Municipality
Length (l.m.) of Barangay Bridges by Type (2016)
PERMANENT TEMPORARYGRAND
TOTALRank 1/
Binmaley 393.1 393.1 - 393.1 13
Bolinao 211.0 211.0 154.0 154.0 365.0 17
Bugallon 135.3 135.3 121.9 110.0 231.9 367.2 16
Burgos 187.5 187.5 - 187.5 25
Calasiao 60.0 45.0 105.0 79.5 79.5 184.5 26
Dagupan City 252.0 24.0 276.0 - 276.0 19
Dasol 409.9 409.9 - 409.9 12
Infanta 350.4 350.4 98.0 205.0 303.0 653.4 7
Labrador - 57.0 57.0 57.0 43
Laoac 335.5 335.5 150.0 150.0 485.5 10
Lingayen 155.0 155.0 20.0 46.0 155.0 221.0 376.0 15
Mabini 92.0 92.0 26.0 26.0 118.0 34
1/ Rank is provincewide. Best (Rank 1) has the highest value.
Source: MPDC/CPDC/ME Offices
Pangasinan Provincial Planning and Development Office
134

Concrete Steel Total Bailey TimberHanging
Ft. Br.Total
The Countryside in Figures: Pangasinan, 6th Edition 2019: Infrastructure
City/Municipality
Length (l.m.) of Barangay Bridges by Type (2016)
PERMANENT TEMPORARYGRAND
TOTALRank 1/
Malasiqui 231.0 18.0 249.0 - 249.0 20
Manaoag 658.5 658.5 45.0 45.0 703.5 5
Mangaldan 101.0 101.0 - 101.0 36
Mangatarem 466.8 34.0 500.8 43.0 43.0 543.8 8
Mapandan 78.0 78.0 - 78.0 40
Natividad 8.0 8.0 50.0 50.0 58.0 42
Pozzorubio 126.5 170.0 296.5 45.0 45.0 341.5 18
Rosales 25.0 25.0 13.0 13.0 38.0 45
San Carlos City 590.9 - 590.9 332.0 332.0 922.9 2
San Fabian 685.0 111.0 796.0 105.0 105.0 901.0 3
San Jacinto 159.0 159.0 - 159.0 29
San Manuel 174.0 174.0 - 174.0 27
1/ Rank is provincewide. Best (Rank 1) has the highest value.
Source: MPDC/CPDC/ME Offices
Pangasinan Provincial Planning and Development Office
135

Concrete Steel Total Bailey TimberHanging
Ft. Br.Total
The Countryside in Figures: Pangasinan, 6th Edition 2019: Infrastructure
City/Municipality
Length (l.m.) of Barangay Bridges by Type (2016)
PERMANENT TEMPORARYGRAND
TOTALRank 1/
San Nicolas 25.0 25.0 190.0 190.0 215.0 22
San Quintin 146.0 146.0 - 146.0 31
Santa Barbara 29.9 - 29.9 113.5 243.1 356.6 386.4 14
Santa Maria 138.0 138.0 - 138.0 32
Santo Tomas 89.0 35.0 124.0 - 124.0 33
Sison 247.1 99.1 346.2 152.0 152.0 498.2 9
Sual 148.0 148.0 - 148.0 30
Tayug 164.4 164.4 8.0 34.3 42.3 206.7 23
Umingan 332.8 14.0 346.8 9.4 604.3 613.7 960.5 1
Urbiztondo 30.0 41.0 71.0 12.0 - - 12.0 83.0 38
Urdaneta City 98.0 98.0 - 98.0 37
Villasis 69.0 69.0 - 69.0 41
1/ Rank is provincewide. Best (Rank 1) has the highest value.
Source: MPDC/CPDC/ME Offices
Pangasinan Provincial Planning and Development Office
136

Concrete Steel Total Bailey TimberHanging
Ft. Br.Total
PANGASINAN 1,491.6 147.0 1,638.6 88.0 15.0 260.0 363.0 2,001.6
Agno 6.0 6.0 0.0 6.0 22
Aguilar 0.0 0.0 0.0 0.0
Alaminos City 0.0 0.0 0.0 0.0 0.0
Alcala 0.0 0.0 0.0 0.0
Anda 94.5 94.5 0.0 94.5 7
Asingan 0.0 0.0 0.0
Balungao 0.0 0.0 0.0
Bani 0.0 0.0 0.0
Basista 0.0 0.0 0.0
Bautista 0.0 0.0 0.0
Bayambang 0.0 0.0 0.0
Binalonan 0.0 0.0 0.0
1/ Rank is provincewide. Best (Rank 1) has the highest value.
Source: MPDC/CPDC/ME Offices
Pangasinan Provincial Planning and Development Office
The Countryside in Figures: Pangasinan, 6th Edition 2019: Infrastructure
City/Municipality
Length (l.m.) of Municipal Bridges by Type (2016)
PERMANENT TEMPORARYGRAND
TOTALRank 1/
137

Concrete Steel Total Bailey TimberHanging
Ft. Br.Total
The Countryside in Figures: Pangasinan, 6th Edition 2019: Infrastructure
City/Municipality
Length (l.m.) of Municipal Bridges by Type (2016)
PERMANENT TEMPORARYGRAND
TOTALRank 1/
Binmaley 0.0 0.0 0.0
Bolinao 46.0 46.0 0.0 46.0 13
Bugallon 15.0 15.0 60.0 60.0 75.0 10
0.0 0.0 0.0
Burgos 9.0 9.0 0.0 9.0 21
Calasiao 0.0 0.0 0.0
Dagupan City 0.0 0.0 0.0
Dasol 0.0 0.0 0.0
Infanta 23.9 23.9 0.0 23.9 16
Labrador 173.2 53.5 226.7 0.0 226.7 3
Laoac 10.0 10.0 0.0 10.0 20
Lingayen 30.0 30.0 20.0 20.0 50.0 12
Mabini 164.0 164.0 0.0 164.0 5
1/ Rank is provincewide. Best (Rank 1) has the highest value.
Source: MPDC/CPDC/ME Offices
Pangasinan Provincial Planning and Development Office
138

Concrete Steel Total Bailey TimberHanging
Ft. Br.Total
The Countryside in Figures: Pangasinan, 6th Edition 2019: Infrastructure
City/Municipality
Length (l.m.) of Municipal Bridges by Type (2016)
PERMANENT TEMPORARYGRAND
TOTALRank 1/
Malasiqui 15.0 15.0 0.0 15.0 17
Manaoag 32.2 32.2 0.0 32.2 15
Mangaldan 326.0 36.0 362.0 10.0 10.0 372.0 1
Mangatarem 0.0 0.0 0.0
Mapandan 36.8 36.8 0.0 36.8 14
Natividad 12.0 12.0 200.0 200.0 212.0 4
Pozzorubio 0.0 0.0 0.0 0.0
Rosales 28.0 57.5 85.5 0.0 85.5 8
San Carlos City 0.0 0.0 0.0
San Fabian 133.0 133.0 0.0 133.0 6
San Jacinto 191.0 191.0 58.0 58.0 249.0 2
San Manuel 12.0 12.0 0.0 12.0 18
1/ Rank is provincewide. Best (Rank 1) has the highest value.
Source: MPDC/CPDC/ME Offices
Pangasinan Provincial Planning and Development Office
139

Concrete Steel Total Bailey TimberHanging
Ft. Br.Total
The Countryside in Figures: Pangasinan, 6th Edition 2019: Infrastructure
City/Municipality
Length (l.m.) of Municipal Bridges by Type (2016)
PERMANENT TEMPORARYGRAND
TOTALRank 1/
San Nicolas 0.0 0.0 0.0
San Quintin 12.0 12.0 0.0 12.0 18
Santa Barbara 0.0 0.0 0.0
Santa Maria 0.0 0.0 0.0
Santo Tomas 0.0 0.0 0.0
Sison 0.0 0.0 0.0
Sual 0.0 0.0 0.0
Tayug 6.0 6.0 0.0 6.0 22
Umingan 76.0 76.0 0.0 76.0 9
Urbiztondo 0.0 0.0 0.0 0.0 0.0
Urdaneta City 40.0 40.0 15.0 15.0 55.0 11
Villasis 0.0 0.0 0.0
1/ Rank is provincewide. Best (Rank 1) has the highest value.
Source: MPDC/CPDC/ME Offices
Pangasinan Provincial Planning and Development Office
140

Concrete Steel Total Timber Bailey Total
PANGASINAN 5219.7 714.4 5934.1 - - - 5934.1 13760.9
Agno 55.25 - 55.3 - - - 55.3 29 66.15 34
Aguilar 156.00 - 156.0 - - - 156.0 13 160.60 23
Alaminos City - - - - - 202.60 20
Alcala 24.00 - 24.0 - - - 24.0 34 1002.00 4
Anda 12.00 397.40 409.4 - - - 409.4 4
Asingan 111.30 - 111.3 - - - 111.3 20 452.63 11
Balungao 106.00 80.00 186.0 - - - 186.0 9 117.16 30
Bani 64.67 - 64.7 - - - 64.7 25 244.91 17
Basista 22.00 - 22.0 - - - 22.0 35 12.70 41
Bautista - - - - -
Bayambang 12.00 - 12.0 - - - 12.0 37 601.91 8
Binalonan 138.00 - 138.0 - - - 138.0 17 133.78 28
1/ Rank is provincewide. Best (Rank 1) has the highest value.
Source: PEO Pangasinan
DPWH I, II, III and IV
Pangasinan Provincial Planning and Development Office
Rank
1/
Length (l.m.) of National
Bridges by Type (2016)
The Countryside in Figures: Pangasinan, 6th Edition 2019: Infrastructure
City/Municipality PERMANENTRank 1/
Length (l.m.) of Provincial Bridges by Type (2016)
TEMPORARYGRAND
TOTALPERMANENT (Total)
141

Concrete Steel Total Timber Bailey Total
Rank
1/
Length (l.m.) of National
Bridges by Type (2016)
The Countryside in Figures: Pangasinan, 6th Edition 2019: Infrastructure
City/Municipality PERMANENTRank 1/
Length (l.m.) of Provincial Bridges by Type (2016)
TEMPORARYGRAND
TOTALPERMANENT (Total)
Binmaley 56.70 - 56.7 - - - 56.7 28 645.79 7
Bolinao 18.25 - 18.3 - - - 18.3 36
Bugallon 120.30 - 120.3 - - - 120.3 19 1097.72 2
39
Burgos 96.30 - 96.3 - - - 96.3 22 84.25 33
Calasiao 121.00 - 121.0 - - - 121.0 18 321.12 15
Dagupan City - - - - - 1035.38 3
Dasol - - - - - 288.09 16
Infanta - - - - - 120.35 29
Labrador - - - - - 167.50 21
Laoac - - - - - 62.30 37
Lingayen 62.40 - 62.4 - - - 62.4 26 830.90 6
Mabini 6.00 - 6.0 - - - 6.0 38 162.37 22
1/ Rank is provincewide. Best (Rank 1) has the highest value.
Source: PEO Pangasinan
DPWH I, II, III and IV
Pangasinan Provincial Planning and Development Office
142

Concrete Steel Total Timber Bailey Total
Rank
1/
Length (l.m.) of National
Bridges by Type (2016)
The Countryside in Figures: Pangasinan, 6th Edition 2019: Infrastructure
City/Municipality PERMANENTRank 1/
Length (l.m.) of Provincial Bridges by Type (2016)
TEMPORARYGRAND
TOTALPERMANENT (Total)
Malasiqui 155.00 - 155.0 - - - 155.0 14 63.07 35
Manaoag 520.67 50.00 570.7 - - - 570.7 2 134.20 27
Mangaldan - - - - - 156.80 24
Mangatarem 612.92 - 612.9 - - - 612.9 1 224.59 18
Mapandan 168.60 - 168.6 - - - 168.6 11
Natividad 85.00 - 85.0 - - - 85.0 24 321.45 14
Pozzorubio 32.27 - 32.3 - - - 32.3 32 34.01 39
Rosales 26.20 - 26.2 - - - 26.2 33 948.65 5
San Carlos City 154.00 - 154.0 - - - 154.0 15 89.62 32
San Fabian 144.00 - 144.0 - - - 144.0 16 407.45 12
San Jacinto 178.67 42.00 220.7 - - - 220.7 8 30.60 40
San Manuel 350.45 - 350.5 - - - 350.5 5
1/ Rank is provincewide. Best (Rank 1) has the highest value.
Source: PEO Pangasinan
DPWH I, II, III and IV
Pangasinan Provincial Planning and Development Office
143

Concrete Steel Total Timber Bailey Total
Rank
1/
Length (l.m.) of National
Bridges by Type (2016)
The Countryside in Figures: Pangasinan, 6th Edition 2019: Infrastructure
City/Municipality PERMANENTRank 1/
Length (l.m.) of Provincial Bridges by Type (2016)
TEMPORARYGRAND
TOTALPERMANENT (Total)
San Nicolas 513.50 - 513.5 - - - 513.5 3 95.35 31
San Quintin 48.00 - 48.0 - - - 48.0 30 38.70 38
Santa Barbara 148.90 20.00 168.9 - - - 168.9 10 218.55 19
Santa Maria 101.85 101.9 - - - 101.9 21 1464.00 1
Santo Tomas - - - - -
Sison 37.20 - 37.2 - - - 37.2 31 558.00 9
Sual 61.80 - 61.8 - - - 61.8 27 136.65 26
Tayug 169.50 65.00 234.5 - - - 234.5 7 472.32 10
Umingan 103.00 60.00 163.0 - - - 163.0 12 337.85 13
Urbiztondo 90.00 - 90.0 - - - 90.0 23
Urdaneta City 336.00 - 336.0 - - - 336.0 6 155.83 25
Villasis - - - 63.00 36
1/ Rank is provincewide. Best (Rank 1) has the highest value.
Source: PEO Pangasinan
DPWH I, II, III and IV
Pangasinan Provincial Planning and Development Office
144

The Countryside in Figures: Pangasinan, 6th Edition 2019
PUBLIC ORDER

LIST OF INDICATORS
• 2018 Crime Statistics
• 2018 Total Number of Firemen and Fire Trucks
HIGHLIGHTS
• The Province of Pangasinan recorded 20,682 crimes in 2018; 18,863 of which were cleared cases and
16,163 solved cases.
– Solved Case are cases where a case was filed and the suspects were arrested
– Cleared Case are cases where a case was filed but suspects were not arrested plus (+) solved
cases
• The province had 433 firemen and 83 fire trucks in 2018, both from the Bureau of Fire Protection and the
Local Government Units.
The Countryside in Figures: Pangasinan, 6th Edition 2019

Murder HomicidePhysical
InjuryRape Robbery Theft
Carnappin
g (MV)
Carnapp
ing (MC)
PANGASINAN 137 38 689 332 226 687 9 114 2,232 1,678 1,058 75.2 47.4
Agno 1 2 4 2 1 1 0 0 11 10 6 90.9 15 54.5 22
Aguilar 2 0 20 2 0 4 0 1 29 27 23 93.1 11 79.3 4
Alaminos City 2 1 22 23 12 36 0 1 97 72 30 74.2 35 30.9 45
Alcala 3 0 6 2 1 3 0 0 15 14 9 93.3 10 60.0 16
Anda 2 1 12 8 0 3 0 0 26 25 23 96.2 7 88.5 3
Asingan 2 3 19 6 3 7 0 4 44 40 25 90.9 15 56.8 20
Balungao 1 0 12 8 0 5 0 3 29 25 14 86.2 25 48.3 28
Bani 1 0 3 3 4 6 0 1 18 14 7 77.8 29 38.9 37
Basista 0 0 8 1 2 4 0 1 16 10 6 62.5 45 37.5 40
Bautista 1 0 6 2 1 2 1 0 13 9 4 69.2 41 30.8 46
Bayambang 3 3 26 5 8 19 1 2 67 49 42 73.1 36 62.7 12
Binalonan 2 1 4 5 2 6 0 4 24 22 10 91.7 14 41.7 33
1/ Rank is provincewide. Best (Rank 1) has the highest efficiency rate.
Source: Philippine National Police
Rank
1/Solved
Crimes
Cleared
Efficiency
Rank
1/Cleared
Crimes
Solved
Efficiency
The Countryside in Figures: Pangasinan, 6th Edition 2019: Public Order
City/Municipality
Crime Statistics (January - December 2018)
Against Persons Against Property
Total
Index Crimes
147

Murder HomicidePhysical
InjuryRape Robbery Theft
Carnappin
g (MV)
Carnapp
ing (MC)
Rank
1/Solved
Crimes
Cleared
Efficiency
Rank
1/Cleared
Crimes
Solved
Efficiency
The Countryside in Figures: Pangasinan, 6th Edition 2019: Public Order
City/Municipality
Crime Statistics (January - December 2018)
Against Persons Against Property
Total
Index Crimes
Binmaley 4 0 17 6 10 8 0 6 51 31 14 60.8 46 27.5 48
Bolinao 5 3 10 11 1 21 0 2 53 43 36 81.1 28 67.9 10
Bugallon 1 1 22 6 4 7 0 4 45 40 34 88.9 23 75.6 5
Burgos 1 1 8 4 1 3 0 0 18 18 11 100.0 1 61.1 14
Calasiao 7 1 22 10 7 44 2 3 96 62 28 64.6 44 29.2 47
Dagupan City 10 4 85 20 40 147 2 19 327 185 108 56.6 47 33.0 42
Dasol 0 0 2 2 1 4 0 1 10 10 4 100.0 1 40.0 35
Infanta 1 0 6 8 2 3 0 1 21 16 12 76.2 31 57.1 19
Labrador 0 0 4 9 3 1 0 0 17 17 8 100.0 1 47.1 29
Laoac 1 1 2 2 1 2 0 0 9 7 3 77.8 29 33.3 41
Lingayen 5 2 23 13 15 51 1 2 112 92 68 82.1 27 60.7 15
Mabini 1 1 10 4 0 10 0 0 26 24 14 92.3 13 53.8 23
1/ Rank is provincewide. Best (Rank 1) has the highest efficiency rate.
Source: Philippine National Police
148

Murder HomicidePhysical
InjuryRape Robbery Theft
Carnappin
g (MV)
Carnapp
ing (MC)
Rank
1/Solved
Crimes
Cleared
Efficiency
Rank
1/Cleared
Crimes
Solved
Efficiency
The Countryside in Figures: Pangasinan, 6th Edition 2019: Public Order
City/Municipality
Crime Statistics (January - December 2018)
Against Persons Against Property
Total
Index Crimes
Malasiqui 7 0 17 12 11 9 0 2 58 44 22 75.9 32 37.9 38
Manaoag 5 0 15 15 10 14 0 3 62 55 45 88.7 24 72.6 7
Mangaldan 2 1 38 20 8 39 0 14 122 89 53 73.0 37 43.4 32
Mangatarem 4 0 9 4 1 4 1 1 24 23 15 95.8 8 62.5 13
Mapandan 2 1 5 2 1 5 0 4 20 15 11 75.0 33 55.0 21
Natividad 0 0 6 2 0 3 0 0 11 10 7 90.9 15 63.6 11
Pozzorubio 5 1 15 2 6 15 0 5 49 34 24 69.4 40 49.0 27
Rosales 5 2 26 5 6 38 1 4 87 65 50 74.7 34 57.5 18
San Carlos City 12 1 39 27 13 43 0 5 140 74 46 52.9 48 32.9 43
San Fabian 4 1 21 9 5 6 0 0 46 43 33 93.5 9 71.7 8
San Jacinto 2 0 8 3 3 3 0 0 19 17 10 89.5 22 52.6 24
San Manuel 2 0 8 3 1 8 0 1 23 15 9 65.2 43 39.1 36
1/ Rank is provincewide. Best (Rank 1) has the highest efficiency rate.
Source: Philippine National Police
149

Murder HomicidePhysical
InjuryRape Robbery Theft
Carnappin
g (MV)
Carnapp
ing (MC)
Rank
1/Solved
Crimes
Cleared
Efficiency
Rank
1/Cleared
Crimes
Solved
Efficiency
The Countryside in Figures: Pangasinan, 6th Edition 2019: Public Order
City/Municipality
Crime Statistics (January - December 2018)
Against Persons Against Property
Total
Index Crimes
San Nicolas 0 1 2 1 1 0 0 0 5 5 5 100.0 1 100.0 1
San Quintin 2 0 5 2 2 3 0 0 14 13 7 92.9 12 50.0 26
Santa Barbara 2 2 4 11 6 4 0 0 29 21 9 72.4 38 31.0 44
Santa Maria 1 0 10 1 4 4 0 3 23 19 10 82.6 26 43.5 31
Santo Tomas 1 0 2 1 0 0 0 0 4 4 3 100.0 1 75.0 6
Sison 3 0 1 5 0 1 0 0 10 9 6 90.0 20 60.0 16
Sual 1 1 9 4 3 9 0 3 30 27 21 90.0 20 70.0 9
Tayug 6 0 11 3 10 6 0 0 36 25 15 69.4 39 41.7 33
Umingan 3 0 22 6 3 34 0 1 69 47 26 68.1 42 37.7 39
Urbiztondo 0 0 6 8 1 1 0 0 16 16 15 100.0 1 93.8 2
Urdaneta City 8 2 45 18 11 35 0 11 130 118 61 90.8 18 46.9 30
Villasis 4 0 12 6 1 6 0 2 31 28 16 90.3 19 51.6 25
1/ Rank is provincewide. Best (Rank 1) has the highest efficiency rate.
Source: Philippine National Police
150

PANGASINAN 279 3853 4965 9353 18,450 17,185 93.1 15,105 81.9
Agno 2 18 8 24 52 47 90.4 39 40 76.9 38
Aguilar 6 52 35 133 226 206 91.2 37 179 79.2 36
Alaminos City 1 187 167 198 553 533 96.4 26 467 84.4 30
Alcala 3 27 14 148 192 190 99.0 5 184 95.8 4
Anda 4 54 17 95 170 170 100.0 1 169 99.4 1
Asingan 8 91 108 188 395 385 97.5 17 290 73.4 35
Balungao 6 30 28 234 298 289 97.0 19 267 89.6 15
Bani 4 56 59 124 243 232 95.5 26 170 70.0 36
Basista 2 66 29 182 279 264 94.6 28 245 87.8 19
Bautista 1 48 29 30 108 103 95.4 26 99 91.7 10
Bayambang 10 148 144 863 1,165 1142 98.0 10 1113 95.5 3
Binalonan 8 75 109 311 503 491 97.6 14 446 88.7 15
1/ Rank is provincewide. Best (Rank 1) has the highest efficiency rate.
Source: Philippine National Police
RIR Damage
to PropertyRank 1/Total Cleared Rank 1/
Crime Statistics (January - December 2018)
Non-Index Crimes
Crimes
Solved
Efficiency
The Countryside in Figures: Pangasinan, 6th Edition 2019: Public Order
City/Municipality
Solved
Crimes
Cleared
Efficiency
Other Non-
Index
Crimes
RIR
Homicide
RIR
Phycical
Injury
151

RIR Damage
to PropertyRank 1/Total Cleared Rank 1/
Crime Statistics (January - December 2018)
Non-Index Crimes
Crimes
Solved
Efficiency
The Countryside in Figures: Pangasinan, 6th Edition 2019: Public Order
City/Municipality
Solved
Crimes
Cleared
Efficiency
Other Non-
Index
Crimes
RIR
Homicide
RIR
Phycical
Injury
Binmaley 7 127 221 85 440 424 96.4 20 409 93.0 6
Bolinao 8 78 52 183 321 317 98.8 5 308 96.0 2
Bugallon 5 79 81 145 310 276 89.0 26 269 86.8 14
Burgos 0 38 25 165 228 222 97.4 15 209 91.7 7
Calasiao 9 169 296 212 686 625 91.1 24 521 75.9 25
Dagupan City 14 195 738 458 1,405 1,151 81.9 30 564 40.1 31
Dasol 2 4 2 117 125 121 96.8 15 101 80.8 23
Infanta 5 14 20 67 106 93 87.7 24 86 81.1 22
Labrador 2 43 45 144 234 232 99.1 3 226 96.6 1
Laoac 1 14 25 104 144 141 97.9 10 130 90.3 7
Lingayen 6 132 378 461 977 959 98.2 7 840 86.0 12
Mabini 4 27 37 89 157 137 87.3 21 123 78.3 19
1/ Rank is provincewide. Best (Rank 1) has the highest efficiency rate.
Source: Philippine National Police
152
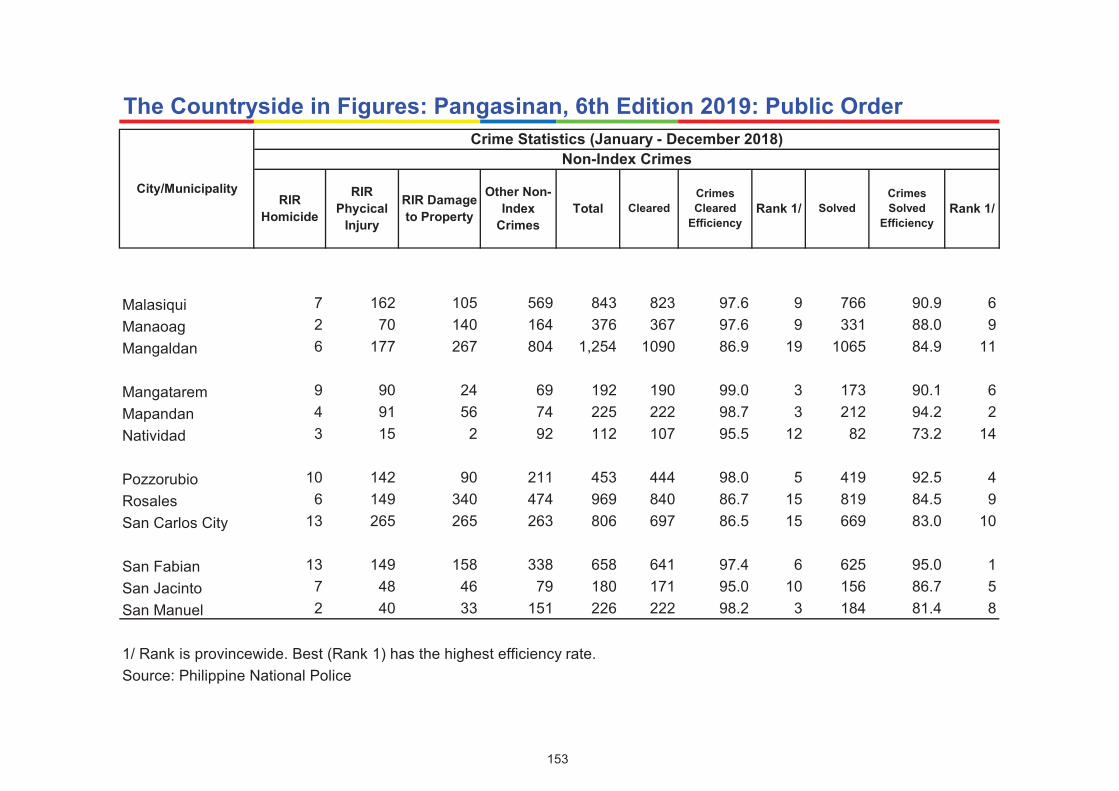
RIR Damage
to PropertyRank 1/Total Cleared Rank 1/
Crime Statistics (January - December 2018)
Non-Index Crimes
Crimes
Solved
Efficiency
The Countryside in Figures: Pangasinan, 6th Edition 2019: Public Order
City/Municipality
Solved
Crimes
Cleared
Efficiency
Other Non-
Index
Crimes
RIR
Homicide
RIR
Phycical
Injury
Malasiqui 7 162 105 569 843 823 97.6 9 766 90.9 6
Manaoag 2 70 140 164 376 367 97.6 9 331 88.0 9
Mangaldan 6 177 267 804 1,254 1090 86.9 19 1065 84.9 11
Mangatarem 9 90 24 69 192 190 99.0 3 173 90.1 6
Mapandan 4 91 56 74 225 222 98.7 3 212 94.2 2
Natividad 3 15 2 92 112 107 95.5 12 82 73.2 14
Pozzorubio 10 142 90 211 453 444 98.0 5 419 92.5 4
Rosales 6 149 340 474 969 840 86.7 15 819 84.5 9
San Carlos City 13 265 265 263 806 697 86.5 15 669 83.0 10
San Fabian 13 149 158 338 658 641 97.4 6 625 95.0 1
San Jacinto 7 48 46 79 180 171 95.0 10 156 86.7 5
San Manuel 2 40 33 151 226 222 98.2 3 184 81.4 8
1/ Rank is provincewide. Best (Rank 1) has the highest efficiency rate.
Source: Philippine National Police
153

RIR Damage
to PropertyRank 1/Total Cleared Rank 1/
Crime Statistics (January - December 2018)
Non-Index Crimes
Crimes
Solved
Efficiency
The Countryside in Figures: Pangasinan, 6th Edition 2019: Public Order
City/Municipality
Solved
Crimes
Cleared
Efficiency
Other Non-
Index
Crimes
RIR
Homicide
RIR
Phycical
Injury
San Nicolas 4 4 0 20 28 27 96.4 6 25 89.3 3
San Quintin 1 55 52 43 151 148 98.0 4 134 88.7 3
Santa Barbara 8 172 174 116 470 358 76.2 10 322 68.5 7
Santa Maria 7 27 24 130 188 188 100.0 1 160 85.1 3
Santo Tomas 0 4 0 13 17 17 100.0 1 9 52.9 8
Sison 7 11 14 52 84 79 94.0 5 61 72.6 5
Sual 3 50 55 124 232 216 93.1 5 197 84.9 3
Tayug 3 41 139 91 274 265 96.7 2 228 83.2 3
Umingan 12 114 94 145 365 323 88.5 4 198 54.2 4
Urbiztondo 2 51 42 89 184 177 96.2 3 173 94.0 1
Urdaneta City 21 36 59 320 436 428 98.2 1 262 60.1 2
Villasis 11 118 119 162 410 395 96.3 1 380 92.7 1
1/ Rank is provincewide. Best (Rank 1) has the highest efficiency rate.
Source: Philippine National Police
154
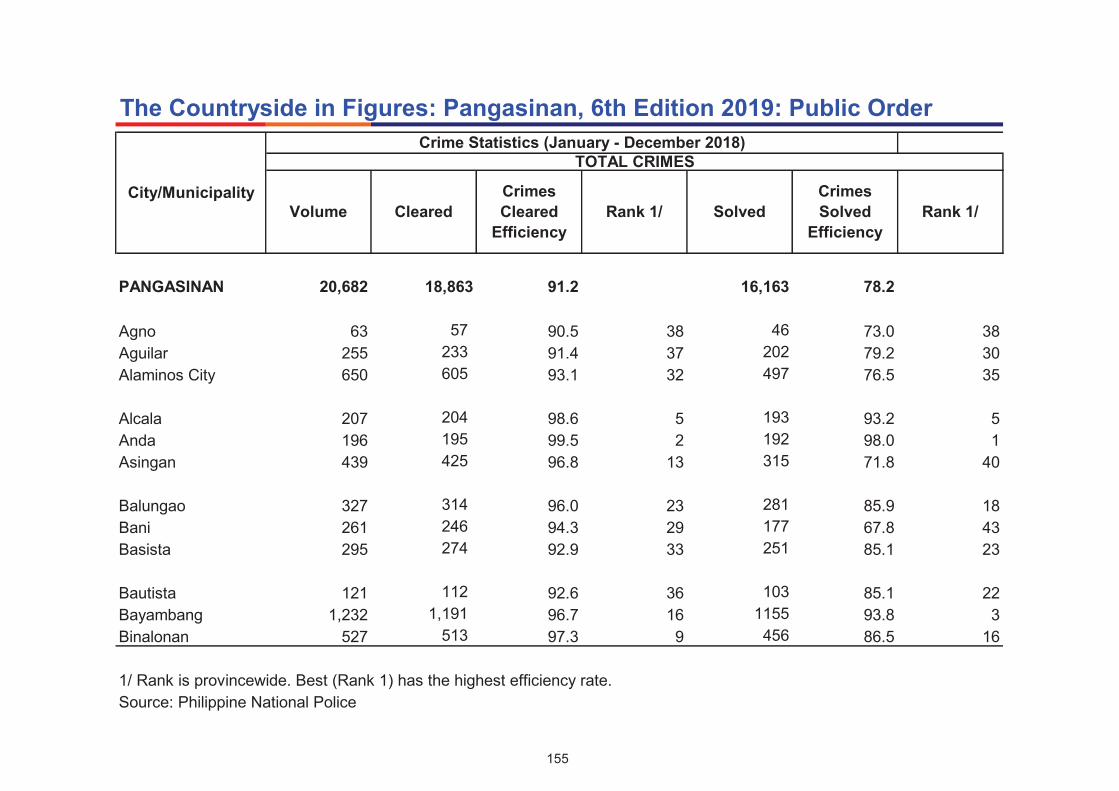
PANGASINAN 20,682 18,863 91.2 16,163 78.2
Agno 63 57 90.5 38 46 73.0 38
Aguilar 255 233 91.4 37 202 79.2 30
Alaminos City 650 605 93.1 32 497 76.5 35
Alcala 207 204 98.6 5 193 93.2 5
Anda 196 195 99.5 2 192 98.0 1
Asingan 439 425 96.8 13 315 71.8 40
Balungao 327 314 96.0 23 281 85.9 18
Bani 261 246 94.3 29 177 67.8 43
Basista 295 274 92.9 33 251 85.1 23
Bautista 121 112 92.6 36 103 85.1 22
Bayambang 1,232 1,191 96.7 16 1155 93.8 3
Binalonan 527 513 97.3 9 456 86.5 16
1/ Rank is provincewide. Best (Rank 1) has the highest efficiency rate.
Source: Philippine National Police
Rank 1/
The Countryside in Figures: Pangasinan, 6th Edition 2019: Public Order
City/Municipality
Volume Cleared Solved
Crimes
Cleared
Efficiency
Crimes
Solved
Efficiency
TOTAL CRIMES
Rank 1/
Crime Statistics (January - December 2018)
155

Rank 1/
The Countryside in Figures: Pangasinan, 6th Edition 2019: Public Order
City/Municipality
Volume Cleared Solved
Crimes
Cleared
Efficiency
Crimes
Solved
Efficiency
TOTAL CRIMES
Rank 1/
Crime Statistics (January - December 2018)
Binmaley 491 455 92.7 35 423 86.2 17
Bolinao 374 360 96.3 21 344 92.0 7
Bugallon 355 316 89.0 39 303 85.4 21
Burgos 246 240 97.6 8 220 89.4 11
Calasiao 782 687 87.9 41 549 70.2 42
Dagupan City 1,732 1,336 77.1 47 672 38.8 48
Dasol 135 131 97.0 11 105 77.8 32
Infanta 127 109 85.8 42 98 77.2 34
Labrador 251 249 99.2 3 234 93.2 6
Laoac 153 148 96.7 15 133 86.9 15
Lingayen 1,089 1,051 96.5 17 908 83.4 25
Mabini 183 161 88.0 40 137 74.9 37
1/ Rank is provincewide. Best (Rank 1) has the highest efficiency rate.
Source: Philippine National Police
156

Rank 1/
The Countryside in Figures: Pangasinan, 6th Edition 2019: Public Order
City/Municipality
Volume Cleared Solved
Crimes
Cleared
Efficiency
Crimes
Solved
Efficiency
TOTAL CRIMES
Rank 1/
Crime Statistics (January - December 2018)
Malasiqui 901 867 96.2 22 788 87.5 13
Manaoag 438 422 96.3 20 376 85.8 19
Mangaldan 1,376 1,179 85.7 44 1118 81.3 28
Mangatarem 216 213 98.6 4 188 87.0 14
Mapandan 245 237 96.7 14 223 91.0 8
Natividad 123 117 95.1 27 89 72.4 39
Pozzorubio 502 478 95.2 25 443 88.2 12
Rosales 1,056 905 85.7 43 869 82.3 27
San Carlos City 946 771 81.5 46 715 75.6 36
San Fabian 704 684 97.2 10 658 93.5 4
San Jacinto 199 188 94.5 28 166 83.4 24
San Manuel 249 237 95.2 26 193 77.5 33
1/ Rank is provincewide. Best (Rank 1) has the highest efficiency rate.
Source: Philippine National Police
157

Rank 1/
The Countryside in Figures: Pangasinan, 6th Edition 2019: Public Order
City/Municipality
Volume Cleared Solved
Crimes
Cleared
Efficiency
Crimes
Solved
Efficiency
TOTAL CRIMES
Rank 1/
Crime Statistics (January - December 2018)
San Nicolas 33 32 97.0 12 30 90.9 9
San Quintin 165 161 97.6 7 141 85.5 20
Santa Barbara 499 379 76.0 48 331 66.3 44
Santa Maria 211 207 98.1 6 170 80.6 29
Santo Tomas 21 21 100.0 1 12 57.1 45
Sison 94 88 93.6 30 67 71.3 41
Sual 262 243 92.7 34 218 83.2 26
Tayug 310 290 93.5 31 243 78.4 31
Umingan 434 370 85.3 45 224 51.6 47
Urbiztondo 200 193 96.5 18 188 94.0 2
Urdaneta City 566 546 96.5 19 323 57.1 46
Villasis 441 423 95.9 24 396 89.8 10
1/ Rank is provincewide. Best (Rank 1) has the highest efficiency rate.
Source: Philippine National Police
158

Bureau of Fire
ProtectionLocal Government Unit Total
PANGASINAN 62 21 83 433
Agno 1 0 1 5
Aguilar 1 0 1 6
Alaminos City 2 1 3 16
Alcala 0 1 1 1
Anda 1 0 1 7
Asingan 2 0 2 12
Balungao 1 0 1 8
Bani 2 0 2 8
Basista 1 0 1 5
Bautista 0 1 1 1
Bayambang 1 1 2 9
Binalonan 2 0 2 12
Source: Bureau of Fire Protection (BFP)
Firemen
The Countryside in Figures: Pangasinan, 6th Edition 2019: Public Order
City/Municipality
Firemen and Firetrucks 2018
Firetrucks
159

Bureau of Fire
ProtectionLocal Government Unit Total
Firemen
The Countryside in Figures: Pangasinan, 6th Edition 2019: Public Order
City/Municipality
Firemen and Firetrucks 2018
Firetrucks
Binmaley 2 0 2 7
Bolinao 0 1 1 7
Bugallon 2 0 2 10
Burgos 0 1 1 1
Calasiao 1 0 1 11
Dagupan City* 4 0 4 24
Dasol 2 0 2 11
Infanta 1 1 2 7
Labrador 1 0 1 7
Laoac 2 0 2 8
Lingayen 3 1 4 32
Mabini 0 0 0 1
Source: Bureau of Fire Protection (BFP)
160
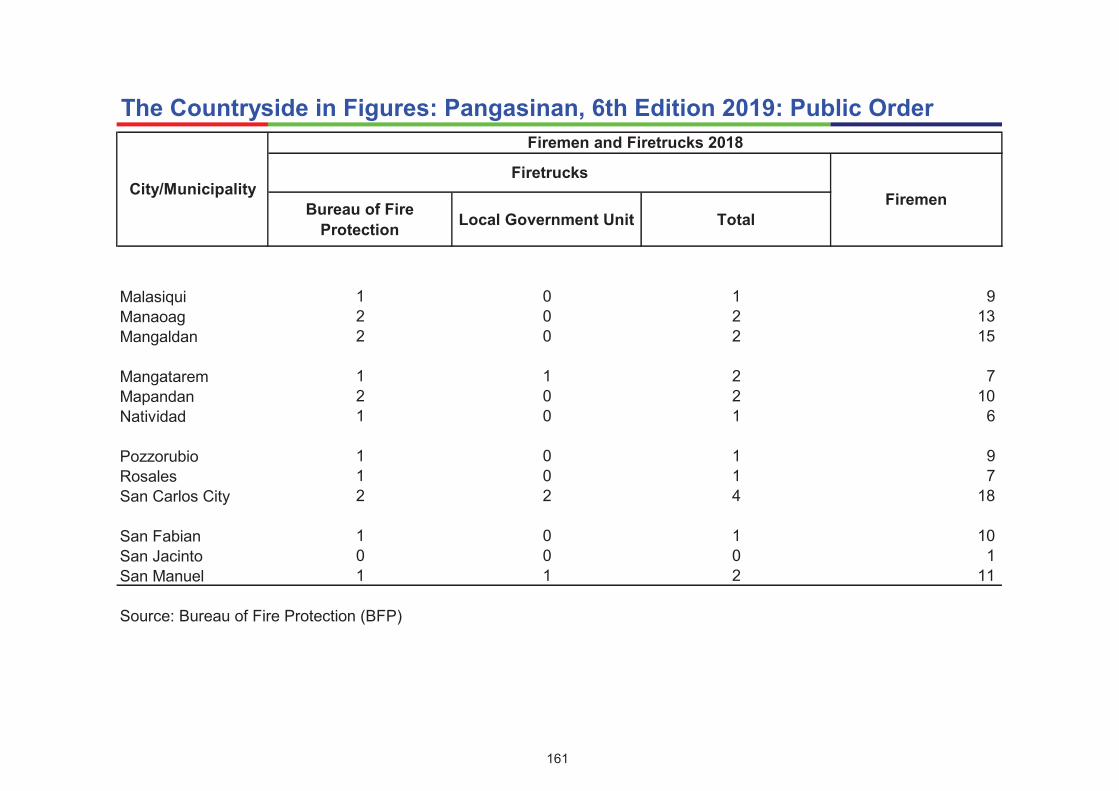
Bureau of Fire
ProtectionLocal Government Unit Total
Firemen
The Countryside in Figures: Pangasinan, 6th Edition 2019: Public Order
City/Municipality
Firemen and Firetrucks 2018
Firetrucks
Malasiqui 1 0 1 9
Manaoag 2 0 2 13
Mangaldan 2 0 2 15
Mangatarem 1 1 2 7
Mapandan 2 0 2 10
Natividad 1 0 1 6
Pozzorubio 1 0 1 9
Rosales 1 0 1 7
San Carlos City 2 2 4 18
San Fabian 1 0 1 10
San Jacinto 0 0 0 1
San Manuel 1 1 2 11
Source: Bureau of Fire Protection (BFP)
161

Bureau of Fire
ProtectionLocal Government Unit Total
Firemen
The Countryside in Figures: Pangasinan, 6th Edition 2019: Public Order
City/Municipality
Firemen and Firetrucks 2018
Firetrucks
San Nicolas 2 0 2 8
San Quintin 2 0 2 9
Santa Barbara 0 1 1 9
Santa Maria 2 0 2 9
Santo Tomas 1 1 2 1
Sison 0 0 0 8
Sual 1 1 2 7
Tayug 2 0 2 11
Umingan 1 1 2 9
Urbiztondo 1 0 1 6
Urdaneta City 2 4 6 13
Villasis 1 1 2 11
Source: Bureau of Fire Protection (BFP)
Pangasinan Provincial Planning and Development Office
162

The Countryside in Figures: Pangasinan, 6th Edition 2019
TOURISM

LIST OF INDICATORS
•2017 Number of Tourist Arrivals Based on Accommodation Establishment and Tourist Destinations Survey
•2017 Tourist Destinations Based on Accommodation Establishment and Tourist Destinations Survey
HIGHLIGHTS
•The Municipality of Lingayen recorded the highest domestic tourist arrivals based on Survey of Tourist
Arrivals based on Accommodation Establishment in 2017 with a total of 181,472 tourists, as well as the
highest foreign tourist arrivals with 5,144 tourists.
•Among the tourist destinations in Pangasinan, Manaoag Pilgrims recorded the highest number of tourists in
2017 with a total of 6,239,115 based on Accommodation Establishment and Tourist Destinations Survey.
The Countryside in Figures: Pangasinan, 6th Edition 2019

The Countryside in Figures: Pangasinan 6th Edition 2019: Tourism
Rank 1/
Alaminos City 20,784 2,279 23,063 7
Anda 30,599 775 31,374 6
Bolinao 180,816 2,652 183,468 2
Bugallon 10,213 19 10,232 8
Dagupan City 101,114 289 101,403 4
Lingayen 181,472 5,144 186,616 1
San Fabian 110,720 32 110,752 3
Urdaneta City 83,585 2,198 85,783 5
Villasis 3,768 43 3,811 9
1/ Rank is provincewide. Best (Rank 1) has the highest value
Source: Tourism Operations Division, Lingayen
Pangasinan Provincial Planning and Development Office
LocationSurvey of Tourist Arrivals Based on Accomodation Establishment (2017)
Domestic Foreign Total
165

The Countryside in Figures: Pangasinan 6th Edition 2019: Tourism
Rank 1/
Hundred Islands National Park, Alaminos City 546,568 18,075 564,643 3
Provincial Capitol Building 596,348 216 596,564 2
Sison Auditorium 57,954 259 58,213 8
Narciso Ramos Sports and Civic Center 193,546 24 193,570 5
Capitol Resort Hotel 43,844 164 44,008 10
Capitol Tourist Assistance and Pasalubong Center (CTAPC) 9,201 107 9,308 11
Urduja Palace 6,730 330 7,060 12
Pangasinan Training and Development Center (PTDC) 451,485 67 451,552 4
Balungao Hilltop Adventure 170,253 3,344 173,597 6
Manleluag Spring Protected Landscape, Mangatarem 51,623 202 51,825 9
Bolinao Tourist Destinations 161,568 2,258 163,826 7
Manaoag Pilgrims 6,208,000 31,115 6,239,115 1
1/ Rank is provincewide. Best (Rank 1) has the highest value
Source: Tourism Operations Division, Lingayen
Pangasinan Provincial Planning and Development Office
Tourist Destination
Survey of Tourist Arrivals Based on Accomodation Establishment (2017)
Domestic Foreign Total
166

The Countryside in Figures: Pangasinan, 6th Edition 2019
TRANSPORTATION and
COMMUNICATION

LIST OF INDICATORS
• 2016 Total Number of Post Offices
• 2016 Total Number of Letter Carrier
• 2016 Average Monthly Mail Volume
• 2016 Total Number of Telephone Services
• 2017 Number of Motor Vehicles Registered by Classification and Mode of Registration
• 2017 Number of Motor Vehicles Registered by Type
HIGHLIGHTS
• Pangasinan had 50 post offices and 107 letter carriers in 2016. The average monthly mail volume delivered
was recorded at 327,257. The province also had 106,604 telephone services, 61,396 of which are available
lines.
• The number of motor vehicles registered in the province was recorded at 226,532 in 2016.
The Countryside in Figures: Pangasinan, 6th Edition 2019

Posted Delivered Rank 1/
PANGASINAN 50 107 119,035 327,257
Agno - - - -
Aguilar 1 1 3,077 18,650 4
Alaminos City 1 5 3,077 18,650 4
Alcala 1 1 - -
Anda 1 1 - -
Asingan 1 2 850 4,592 19
Balungao 1 1 88 592 37
Bani 1 1 226 5,247 18
Basista 1 1 1,916 11,924 7
Bautista 1 1 2,078 8,834 11
Bayambang 1 4 2,078 8,833 12
Binalonan 1 3 1,196 6,221 16
1/ Rank is provincewide. Best (Rank 1) has the highest value.
Source: PHILPOST Region I
National Telecommunications Commission
Pangasinan Provincial Planning and Development Office
Number of Post
Office
Number of Letter
Carrier
Post Offices and Letter Carriers
The Countryside in Figures: Pangasinan, 6th Edition 2019: Transportation and Communication
City/Municipality
Postal Services (2016)
Average Monthly Mail Volume
169

Posted Delivered Rank 1/
Number of Post
Office
Number of Letter
Carrier
Post Offices and Letter Carriers
The Countryside in Figures: Pangasinan, 6th Edition 2019: Transportation and Communication
City/Municipality
Postal Services (2016)
Average Monthly Mail Volume
Binmaley 1 4 785 8,494 14
Bolinao 1 2 552 3,022 28
Bugallon 1 1 171 3,120 26
Burgos 1 1 - -
Calasiao 2 4 1,393 7,489 15
Dagupan City 3 14 56,717 64,625 1
Dasol 1 1 175 641 34
Infanta 1 - 175 641 34
Labrador 1 1 329 3,777 22
Laoac 1 - - -
Lingayen 1 6 2,855 20,179 3
Mabini - - - -
1/ Rank is provincewide. Best (Rank 1) has the highest value.
Source: PHILPOST Region I
National Telecommunications Commission
Pangasinan Provincial Planning and Development Office
170

Posted Delivered Rank 1/
Number of Post
Office
Number of Letter
Carrier
Post Offices and Letter Carriers
The Countryside in Figures: Pangasinan, 6th Edition 2019: Transportation and Communication
City/Municipality
Postal Services (2016)
Average Monthly Mail Volume
Malasiqui 1 4 1,916 11,924 7
Manaoag 1 2 6,186 5,732 17
Mangaldan 1 3 1,492 11,378 9
Mangatarem 1 1 245 3,890 21
Mapandan 1 2 3,881 3,751 23
Natividad 1 1 - -
Pozzorubio 1 3 1,470 3,376 25
Rosales 1 3 2,716 2,977 29
San Carlos City 2 7 4,662 31,691 2
San Fabian 1 2 3,997 3,747 24
San Jacinto 1 1 300 3,094 27
San Manuel 1 1 55 1,845 33
1/ Rank is provincewide. Best (Rank 1) has the highest value.
Source: PHILPOST Region I
National Telecommunications Commission
Pangasinan Provincial Planning and Development Office
171
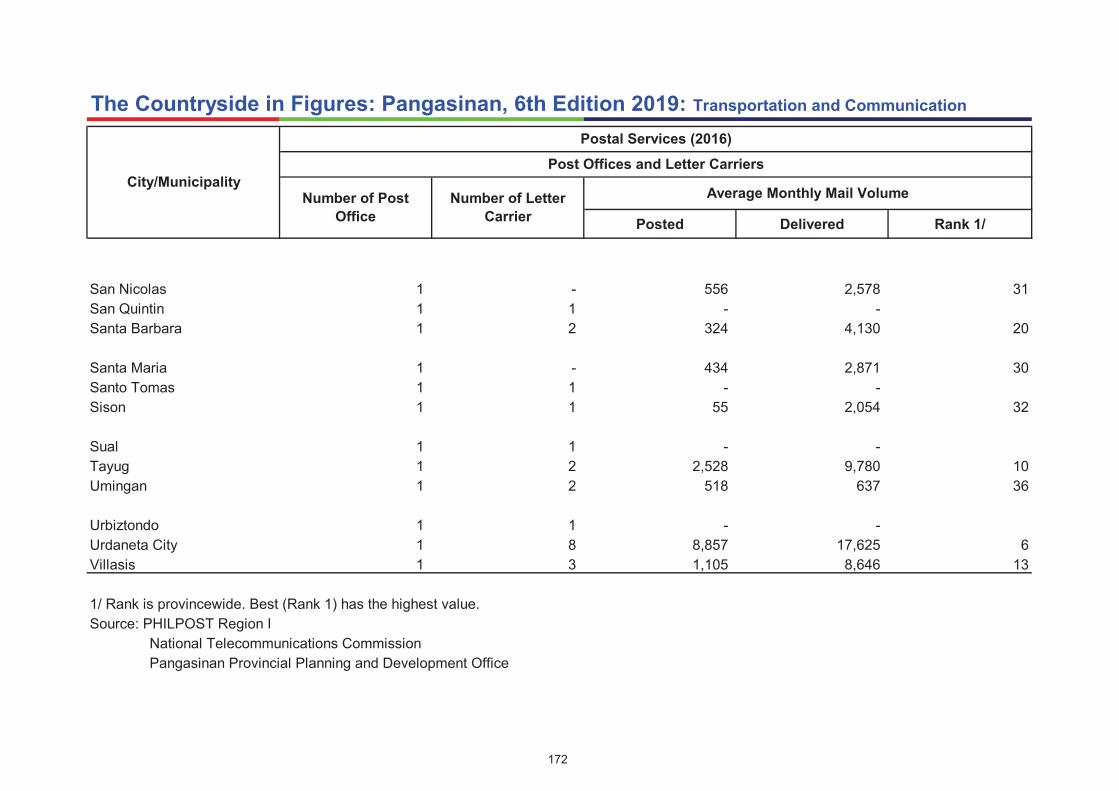
Posted Delivered Rank 1/
Number of Post
Office
Number of Letter
Carrier
Post Offices and Letter Carriers
The Countryside in Figures: Pangasinan, 6th Edition 2019: Transportation and Communication
City/Municipality
Postal Services (2016)
Average Monthly Mail Volume
San Nicolas 1 - 556 2,578 31
San Quintin 1 1 - -
Santa Barbara 1 2 324 4,130 20
Santa Maria 1 - 434 2,871 30
Santo Tomas 1 1 - -
Sison 1 1 55 2,054 32
Sual 1 1 - -
Tayug 1 2 2,528 9,780 10
Umingan 1 2 518 637 36
Urbiztondo 1 1 - -
Urdaneta City 1 8 8,857 17,625 6
Villasis 1 3 1,105 8,646 13
1/ Rank is provincewide. Best (Rank 1) has the highest value.
Source: PHILPOST Region I
National Telecommunications Commission
Pangasinan Provincial Planning and Development Office
172

ResidentialBusiness
Commercial/IndustryPublic Calling
PANGASINAN 40,414 4,094 700 61,396 106,604
Agno 11 1 116 128
Aguilar 51 1 140 192
Alaminos City 1,206 124 25 1,705 3,060
Alcala 610 8 1,046 1,664
Anda 34 4 154 192
Asingan 1,016 10 19 1,451 2,496
Balungao 327 9 376 712
Bani 184 10 654 848
Basista 97 2 237 336
Bautista 100 4 389 493
Bayambang 739 14 1,505 2,258
Binalonan 2,453 18 2,285 4,756
1/ Rank is provincewide. Best (Rank 1) has the highest value.
Source: PHILPOST Region I
National Telecommunications Commission
Pangasinan Provincial Planning and Development Office
Total
The Countryside in Figures: Pangasinan, 6th Edition 2019: Transportation and Communication
City/MunicipalitySubscribed Lines
Available Lines
Telephone Services (2016)
173
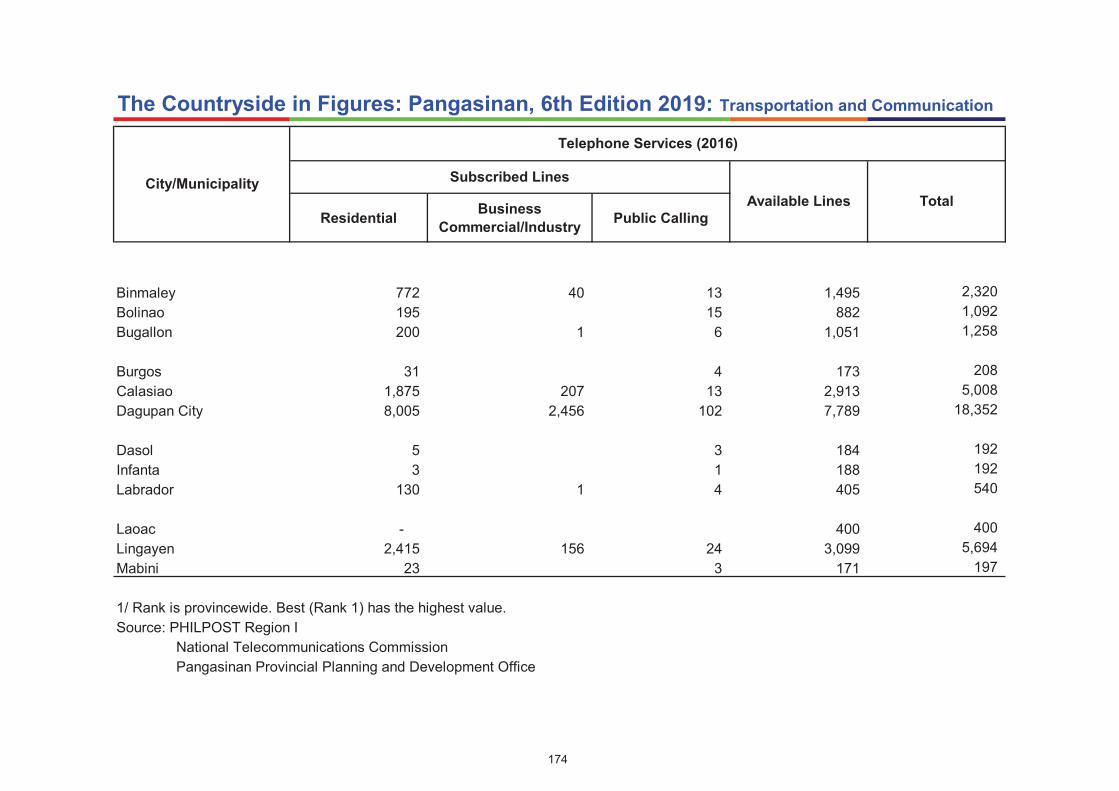
ResidentialBusiness
Commercial/IndustryPublic Calling
Total
The Countryside in Figures: Pangasinan, 6th Edition 2019: Transportation and Communication
City/MunicipalitySubscribed Lines
Available Lines
Telephone Services (2016)
Binmaley 772 40 13 1,495 2,320
Bolinao 195 15 882 1,092
Bugallon 200 1 6 1,051 1,258
Burgos 31 4 173 208
Calasiao 1,875 207 13 2,913 5,008
Dagupan City 8,005 2,456 102 7,789 18,352
Dasol 5 3 184 192
Infanta 3 1 188 192
Labrador 130 1 4 405 540
Laoac - 400 400
Lingayen 2,415 156 24 3,099 5,694
Mabini 23 3 171 197
1/ Rank is provincewide. Best (Rank 1) has the highest value.
Source: PHILPOST Region I
National Telecommunications Commission
Pangasinan Provincial Planning and Development Office
174

ResidentialBusiness
Commercial/IndustryPublic Calling
Total
The Countryside in Figures: Pangasinan, 6th Edition 2019: Transportation and Communication
City/MunicipalitySubscribed Lines
Available Lines
Telephone Services (2016)
Malasiqui 1,241 38 13 1,523 2,815
Manaoag 1,193 77 14 2,092 3,376
Mangaldan 2,089 130 16 3,637 5,872
Mangatarem 363 9 1,676 2,048
Mapandan 105 1 278 384
Natividad 48 - 224 272
Pozzorubio 1,314 23 883 2,220
Rosales 842 113 25 1,292 2,272
San Carlos City 2,284 108 37 3,082 5,511
San Fabian 762 40 9 2,213 3,024
San Jacinto 350 56 698 1,104
San Manuel 662 11 811 1,484
1/ Rank is provincewide. Best (Rank 1) has the highest value.
Source: PHILPOST Region I
National Telecommunications Commission
Pangasinan Provincial Planning and Development Office
175

ResidentialBusiness
Commercial/IndustryPublic Calling
Total
The Countryside in Figures: Pangasinan, 6th Edition 2019: Transportation and Communication
City/MunicipalitySubscribed Lines
Available Lines
Telephone Services (2016)
San Nicolas 520 9 687 1,216
San Quintin 631 14 571 1,216
Santa Barbara 1,232 93 7 3,284 4,616
Santa Maria 472 20 724 1,216
Santo Tomas 174 4 334 512
Sison 236 20 25 1,039 1,320
Sual 100 10 4 476 590
Tayug 667 18 937 1,622
Umingan 281 20 313 614
Urbiztondo 276 7 421 704
Urdaneta City 3,105 414 82 4,147 7,748
Villasis 985 29 1,246 2,260
1/ Rank is provincewide. Best (Rank 1) has the highest value.
Source: PHILPOST Region I
National Telecommunications Commission
Pangasinan Provincial Planning and Development Office
176

New Renewal New Renewal New Renewal New Renewal
PANGASINAN 0 182,120 0 43,289 0 1,125 0 226,534 226,534
District I
Alaminos City - 22,041 - 7,494 - 210 0 29,745 29,745 4
District II
Lingayen - 15,179 - 2,800 - 290 0 18,269 18,269 6
District III
San Carlos City - 24,594 - 6,720 - 45 0 31,359 31,359 3
Bayambang - 6,410 - 1,598 - 10 0 8,018 8,018 7
District IV
Dagupan City - 44,539 - 8,983 - 202 0 53,724 53,724 2
District V
Urdaneta City - 44,749 - 11,127 - 181 0 56,057 56,057 1
District VI
Rosales* - 24,608 - 4,567 - 187 0 29,362 29,362 5
1/ Rank is provincewide. Best (Rank 1) has the highest value.
* Rosales Extension Office is formerly known as Tayug Extension Office
Source: Land Transportation Office, Region I
Pangasinan Provincial Planning and Development Office
Rank
1/
TOTALGOVERNMENTGRAND
TOTAL
The Countryside in Figures: Pangasinan, 6th Edition 2019: Transportation and Communication
District/Outlet
Number of Motor Vehicles Registered by Classification and Mode of Registration (2017)
FOR HIREPRIVATE
177

The Countryside in Figures: Pangasinan, 6th Edition 2019: Transportation and Communication
CarsUtility
VehiclesTrucks Buses
Motorcycles/
TricyclesTrailers TOTAL
Rank
1/
PANGASINAN 17,552 43,029 8,585 194 148,596 459 226,532
District I
Alaminos City 1,492 5,248 1,124 22 20,945 22 29,745 4
District II
Lingayen 1,684 3,636 662 18 11,450 29 18,269 6
District III
San Carlos City 1,970 5,112 988 1 22,495 27 31,359 3
Bayambang 530 1,327 284 7 5,661 13 8,018 7
District IV
Dagupan City 5,542 12,084 2,750 106 30,569 186 53,724 2
District V
Urdaneta City 4,359 9,608 1,627 22 38,399 120 56,057 1
District VI
Rosales* 1,975 6,014 1,150 18 19,077 62 29,360 5
1/ Rank is provincewide. Best (Rank 1) has the highest value.
* Rosales Extension Office is formerly known as Tayug Extension Office
Source: Land Transportation Office, Region I
Pangasinan Provincial Planning and Development Office
196
1,064
2,487
1,922
790
766
District/Outlet
Number of Motor Vehicles Registered by Type (2017)
Sports Utility
Vehicles
8,117
892
178
The Countryside in Figures: Pangasinan, 6th Edition 2019
ANNEXES

The Countryside in Figures: Pangasinan, 6th Edition 2019
GENERAL
NOTESSYMBOLS USED:
- means data is nil or zero
. . . No data available
RANKING
For indicators where higher levels are desirable such as financial resources, agricultural production, tax
revenue, etc., the data were ranked from highest to lowest. For these, the higher the figure, the better.
On the other hand, indicators where lower levels are desired such as population density and percent of
IRA to total financial resources, the data were ranked from lowest to highest. For these, the lower the
figure, the better. For indicators with national ranking, NCR was not included. For some of the
indicators, 2 or more provinces/municipalities have the same levels, hence, of the same rank.

The Countryside in Figures:Pangasinan, 6th Edition 2019: Glossary of Terms
Banking Institutions - corporations, companies or associations which are engaged in the lending of funds obtained from the public through the receipt
of deposits and sale of bonds, securities or obligations of any kind.
Banks, Commercial - corporation engaged regularly in the lending of funds obtained from the public through the receipt of deposit and which accept
or create demand deposits subject to withdrawal by checks.
Banks, Rural - government-sponsored/assisted banks which are privately managed and largely privately owned that provide credit facilities to farmers
and merchants or to cooperatives of such farmers or merchants at reasonable terms and in general , to the people of the rural community.
Banks, Specialized Government - these are completely government-owned institution established mainly to provide medium and long- term credits
to industrial, agricultural, real state sectors of the economy.
Barangay Health Stations (BHS) - the primary health care facility at the barangay level wherein health services are delivered.
Bridge - a structure across a waterway or other opening serving as a pathway and/or with a minimum clear span of six meters.
Birth, Live - refers to the complete expulsion or extraction of a product of conception from its mother, irrespective of the duration of pregnancy,which
after such separation, breathes or shows any other evidence of life, such as beating of the heart, pulsation of the umbilical cord, or definite
movement of voluntary muscles, whether or not the umbilical cord has been cut off or the placenta is still attached; each product of such
birth is considered alive.
Contraceptive Prevalence Rate (CPR) - the percentage of women who are practicing, or whose sexual partners are practicing, any form of contraception.
It is usually reported for women ages 15-49 in marital or consensual unions.
Crimes, Index - crimes which are sufficiently significant and which occur with sufficient regularity to be meaningful. Included in this category are the
following: roberry, homicide, murder, physical injury, rape and theft.
Crimes, Non-index - all types of crimes not considered as index crimes.
Internal Revenue Allotment (IRA) - the account created under PD 144, as amended, representing the portion of total national government revenues which
accrue to the local governments. Includes the local government's share in the specific tax on oil products authorized by PD 436, as amended.
This share has been revised under the Local Government Code of 1991 and it is now termed as internal revenue allotment.
Length of Stay, Average - refers to the average number of nights/days a guest stays in an establishment. It is calculated from the duration of the
guest's stay from his/her registration until the check-out from the establishment.
Letter Carrier - refers to a person deployed to deliver mail.
Mail - dispatches of correspondence and other objects tendered by and intended for delivery by means of postal services.
Mortality Rate, Infant - refers to number of deaths among infants (below one year) per 1,000 livebirths.
Motor Vehicles, For Hire - motor vehicles registered and authorized to be operated as public utility by virtue of certificate of public convenience or provisional
authority issued by the Land Transportation Franchising and Regulatory Board (LTFRB).
181

The Countryside in Figures:Pangasinan, 6th Edition 2019: Glossary of Terms
Motor Vehicles, Government - motor vehicles owned by the Government of the Philippines or any of its political subdivisions.
Motor Vehicles, Private - motor vehicles registered not to be used for hire under any circumstances.
Population - total number of individuals in a territory or a locality living at a specified moment of time with an agreed definition of residence; all the persons
falling within the scope of a census or other inquiry
- it is also the total number of individuals in a territory at a specified time. It covers both nationals and aliens, native and foreign born persons, internees,
refugees and other group physically present within the borders of a country at a specified time. In assembling national demographic statistics for
publication, the basic aim has been to obtain data for the physically present (or de facto) population rather than for the legally established resident
(or de jure) inhabitants.
Population Density - number of persons per unit of land area (square kilometer or square mile).
Population Projection - computation of future changes in population numbers, given certain assumptions about future trends in the rates of fertility, mortality
and migration.
Roads - a long, narrow stretch with a smoothed or paved surface, made for tracelling by motor vehicle, carriage, etc., between two or more points.
Sanitary Toilet Facility - is an installation, whether public or private, used for the disposal of human waste. The following are considered sanitary toilet
facilities: (a) water-sealed, sewer/septic tank, used exclusively by the household -water-sealed is the type of toilet where after water is
flushed or poured into the bowl, a small amount of water is left in the bowl and seals the bottom of the bowl from the pipe leading to the depository.
A sewer/septic tank is a tank in which the solid matter or sewage is accumulated to be disintegrated by bacteria. This is commonly called "poso negro";
(b) water-sealed, sewer/septic tank, shared with other households; (c) water-sealed, other depository, used exclusively
by the household - this depository refers to those other than a sewer/septic tank; (d) water-sealed, other depository shared with other
households; (e) closed pit - a type of toilet without a water-sealed bowl and the depository is constructed usually of large circular tubes made of
concrete or clay covered on top and has a small opening. It may or may not have a box for sitting or squatting over the opening; (f) open pit -
the same as closed pit but without covering; (g) others (pail system, etc.) - classified as a toilet wherein fecal matter is accumulated in a pail to
be picked up for disposal from time to time, or any kind of toilet facility not belonging to the preceding types; and (h) none - refers to the households
without toilet facility.
Tourist - any person whose permanent place of residence is in another country, who stays in the Philippines for at least 24 hours for any reason other
than following an occupation remunerated from within the Philippines.
182

Sources of Data
Data Source
Population Philippine Statistics Authority
Population Density Provincial Planning and Development, Pangasinan
Projected Population
Land Area Department of Environment and Natural Resources
Provincial Planning and Development, Pangasinan
Number of Barangays National Statistical Coordination Board
Number of Registered Voters Commission on Elections, Dagupan City
Provincial Planning and Development, Pangasinan
Internal Revenue Allotment Department of Budget and Management, Regional Office I
Banking Offices Banko Sentral ng Pilipinas
ATMs
Palay Production Office of the Provincial Agriculturist, Sta. Barbara
Corn Production
Livestock Inventory Provincial Veterenarian Office, Lingayen
Length of National Bridges Office of the MPDCs, CPDCs and MEs
Length of Provincial Bridges Provincial Engineering Office Pangasinan
Length of Municipal Bridges DPWH I, II, III and IV
Length of Narangay Bridges Provincial Planning and Development, Pangasinan
Length of National Roads
Length of Provincial Roads
Length of Municipal Roads
Length of Barangay Roads
183

Data Source
Tourist Arrivals Department of Tourism, Regional Office I
Provincial Planning and Development, Pangasinan
Percent of Barangays Energized PANELCO I and III, DECORP, CENPELCO, LUELCO
Service Connections (Potential and Served)
Number of Motor Vehicles Registered Land Transportation Office, Regional Office I
Provincial Planning and Development, Pangasinan
Number of Letter Carriers Philippine Postal Corporation, Regional Office I
Mail Volume Handled National Telecommunications Commission
Provincial Planning and Development, Pangasinan
Number of Enrolees in Elementary Schools Department of Education, Regional Office I
Number of Enrolees in Secondary Schools Department of Education I & II
Number of Public and Private Schools DepEd Cities of Alaminos, San Carlos, Dagupan and Urdaneta City
Teacher-Pupil Ratio in Public Elementary Schools Provincial Planning and Development, Pangasinan
Teacher-Student Ratio in Public Secondary Schools
Number of Day Care Centers Department of Social Welfare and Development - Field Office I
Number of Day Care Workers
Number of Day Care Children
Number of Barangay Health Stations Provincial Health Office, Pangasinan
Number of Livebirths
Number of Infant Deaths
Infant Mortality Ratio
Number of Contraceptive Users
Number of Index and Non-Index Philippine National Police, PPO Pangasinan
Crimes
184
