the ocean and cryosphere in a changing climate … · 8 | office for climate education ipcc special...
TRANSCRIPT
THE OCEAN AND CRYOSPHERE IN A CHANGING CLIMATESUMMARY FOR TEACHERSBASED ON THE IPCC SPECIAL REPORT ON THE OCEAN AND CRYOSPHERE IN A CHANGING CLIMATE (SROCC)

Coordinator
Lydie Lescarmontier (Office for Climate Education – OCE,
France).
Authors
Eric Guilyardi (Institut Pierre Simon Laplace, France),
Lydie Lescarmontier (OCE), Robin Matthews (IPCC
Working Group I Technical Support Unit, France), Nathalie
Morata (OCE, France), Mariana Rocha (OCE, France), Jenny
Schlüpmann (Freie Universität Berlin, Germany), Mathilde
Tricoire (OCE, France), David Wilgenbus (OCE, France).
Copy editors
Simon Klein (OCE, France), Maria A. Martin (Potsdam
Institute for Climate Impact Research, Germany), Anwar
Bhai Rumjaun (Mauritius Institute of Education, Mauritius),
Gabrielle Zimmermann (La main à la pâte, France).
Date of publication
March 2020.
Acknowledgements
Experts who support the OCE: Juan Carlos Andrade, Laurent
Bopp, Badin Borde, Eric Brun, Caroline Côté, Sanny Djohan,
Randy Fananta, Serge Janicot, Jean Jouzel, Pierre Léna,
Claudia Martinez, Valérie Masson-Delmotte, Cliona Murphy,
Natalie Nicetto, Anna Pirani, Jean-Baptiste Sallée, Pramod
Kumar Sharma, Aline Tribollet, Martin Vancoppenolle.
The following organisations for their scientific, operational
and financial support: Technical Support Unit of IPCC Wor-
king Group I, Institut Pierre Simon Laplace (IPSL), Institut de
Recherche pour le Développement, Fondation La main à la
pâte, Fondation Luciole, Météo-France, Association Météo
et Climat, Fondation Prince Albert II de Monaco, Siemens
Stiftung, Sorbonne Université, UNESCO, ADEME, CASDEN.
Photos
Jake Hawkes (cover), Quang Nguyen Vinh (page 7), Riccardo
Maccarini (page 9), Chrissy from Chicago (page 11), Наталья Коллегова (page 14), Benjamin Jones (page 24), Stekirr (page
25), Bishnu Sarangi (page 28), Canislupus (page 29), Daniil
Vnoutchkov (page 31), AkshayaPatra Foundation (page 34).
Art work
Mareva Sacoun ([email protected]).
Licence
This work (excluding photos) has been published under the
following Creative Commons licence. It is free to share, use and
adapt with no commercial use.

SUMMARY FOR TEACHERS
The ocean and cryospherein a changing climate
Based on the IPCC Special Report on the Ocean and Cryosphere in a Changing Climate (SROCC).

The ocean and cryosphere sustain us.
The ocean and cryosphere are under pressure.
Changes to the ocean and cryosphere affect all of our lives.
The time for action is now.
Summary
Introduction 6
1. What is the IPCC and why prepare a summary for teachers? 8
2. The ocean and cryosphere 10
3. Observed and projected impacts 14
4. Implementing responses to ocean and cryosphere change 27
Conclusion 31
Glossary 32
Bibliography 34
6 | OFFICE FOR CLIMATE EDUCATION IPCC SPeCIal RePoRT on The oCean and CRyoSPheRe In a ChangIng ClImaTe — SummaRy foR TeaCheRS
THE INDUSTRIAL REVOLUTION
The Industrial Revolution resulted in the most profound
changes in the history of humanity and its influence
continues to be part of our lives today. Beginning in
Great Britain in the 18th century, the Industrial Revo-
lution was a period in which advances in science and
technology led to rapid developments in industry,
transportation and agriculture across Europe and the
United States.
The world’s population also grew rapidly, due to pro-
gress in hygiene and medicine. The Industrial Revolu-
tion led to several shifts: people moved from the coun-
try to cities, and from working in the fields to working in
factories, while animal power was replaced by engines
powered by fossil fuels. Together, these factors led to
a rapid increase in fossil fuel consumption, and con-
sequently, to substantial greenhouse gases emissions.
HOW ARE WE CHANGING THE EARTH’S CLIMATE?
Greenhouse gases (mainly water vapour, carbon dioxide,
methane, nitrous oxide and ozone) released by human
activities have a direct impact on the global temperature
rise through a process called the “greenhouse effect”.
To date, human-generated emissions of greenhouse
gases since the beginning of the Industrial Revolution
(i.e. since “pre-industrial” times) have led to global
warming of approximately 1.0°C 1. If this continues at
current rates, we are likely to reach warming of 1.5°C
between 2030 and 2052 – an additional increase of
0.5°C from today’s level (see note 1).
The greenhouse effect starts with solar radiation (the
sun’s energy) travelling through space until it reach-
es the Earth’s surface. Part of the energy is sent back
to space, and the rest travels through the atmosphere
until it reaches the Earth’s surface and warms it. When
warmed, the Earth’s surface emits infrared radiation (IR
– heat) into the atmosphere. Some of this heat is trapped
on its escape to space by greenhouse gases in the at-
mosphere and sent back towards the Earth’s surface.
Greenhouse gases thus act like a “blanket”, trapping
1 IPCC Special Report “Global Warming of 1.5°C”, http://www.ipcc.ch/sr15/chapter/spm/, paragraph A.1
heat. As a consequence, the temperature of the lower
atmosphere is warmer than it otherwise would be.
In fact, without greenhouse gases, the average temper-
ature at the Earth’s surface would be around -18°C rath-
er than the actual average of +15°C.
1
2
-11910 1960 2010
0
Models using only natural effects
Models using both natural and anthropogenic effects
Tem
pera
ture
ano
mal
y (°
C)
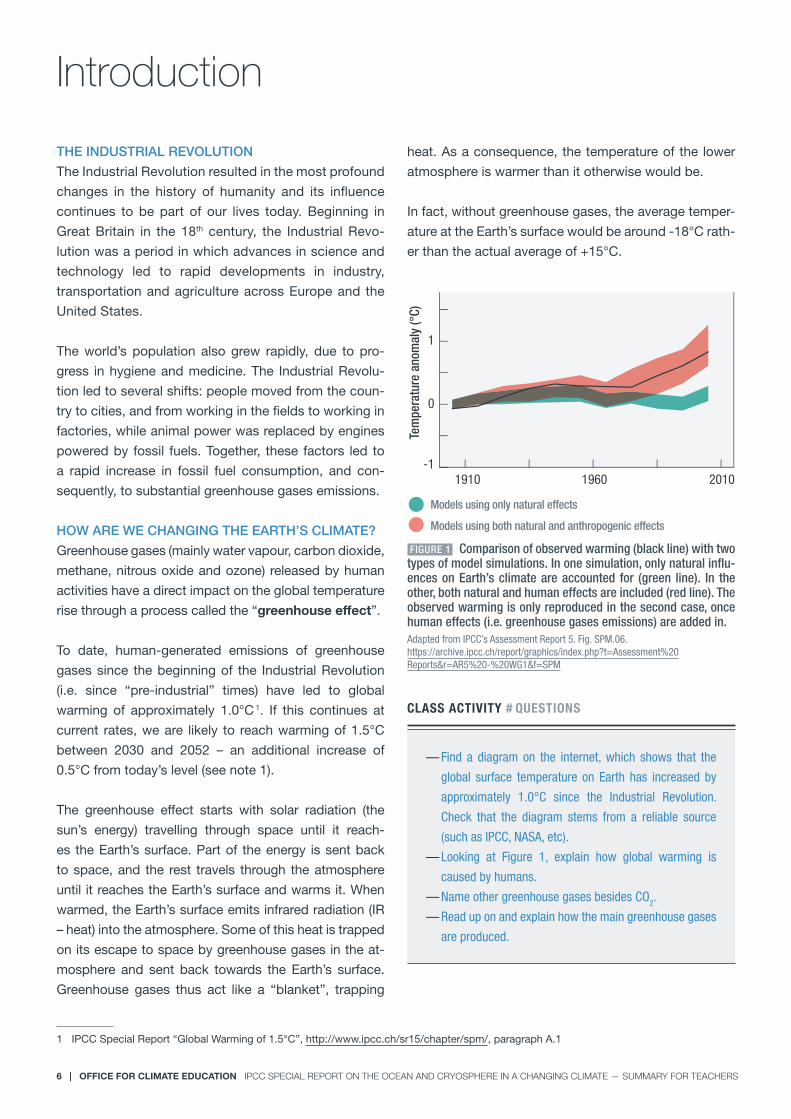
FIGURE 1 Comparison of observed warming (black line) with two types of model simulations. In one simulation, only natural influ-ences on Earth’s climate are accounted for (green line). In the other, both natural and human effects are included (red line). The observed warming is only reproduced in the second case, once human effects (i.e. greenhouse gases emissions) are added in.Adapted from IPCC’s Assessment Report 5. Fig. SPM.06. https://archive.ipcc.ch/report/graphics/index.php?t=Assessment%20Reports&r=AR5%20-%20WG1&f=SPM
CLASS ACTIVITY # QUESTIONS
— Find a diagram on the internet, which shows that the
global surface temperature on Earth has increased by
approximately 1.0°C since the Industrial Revolution.
Check that the diagram stems from a reliable source
(such as IPCC, NASA, etc).
— Looking at Figure 1, explain how global warming is
caused by humans.
— Name other greenhouse gases besides CO2.
— Read up on and explain how the main greenhouse gases
are produced.
Introduction

7 | OFFICE FOR CLIMATE EDUCATION IPCC SPeCIal RePoRT on The oCean and CRyoSPheRe In a ChangIng ClImaTe — SummaRy foR TeaCheRS
CH4
H2O
CO2
A part of the energy received from the Sun is sent back to space
Energy coming from the sun and crossing the atmosphere
reaches the surface
Greenhouse gases trap a part of the infrared radiation
The Earth’s surface is warmed by the Sun’s energy and emits infrared radiation partly sent back to space
INFRAREDRADIATION
FIGURE 2 The greenhouse effect.The Office for Climate Education, adapted from an infographic by Lannis.

8 | OFFICE FOR CLIMATE EDUCATION IPCC SPeCIal RePoRT on The oCean and CRyoSPheRe In a ChangIng ClImaTe — SummaRy foR TeaCheRS
2 Another Summary for Teachers, for the IPCC Special Report on Global Warming of 1.5°C, is available on the OCE website (www.oce.global) in English, French, Spanish and German.
In 1988, The Intergovernmental Panel on Climate
Change (IPCC) was created by the United Nations,
in order to provide assessments of climate change
science. It assesses the current state of knowledge on
climate change, including possible impacts and options
on how to adapt to these changes, and ways of reduc-
ing greenhouse gas emissions. These assessments
present projections of future climate change based on
different global emissions scenarios (continued growth,
rapid reduction, etc.) and the corresponding risks for
humans and the planet.
The reports are policy relevant which means they lay
out response options and their implications, but they
are not policy prescriptive: they do not tell policymak-
ers which actions to take. IPCC assessments are writ-
ten by hundreds of scientists from around the world and
formally adopted by the governments of its 195 mem-
ber countries. The IPCC works by assessing existing
published literature, rather than conducting its own
scientific research.
The IPCC periodically releases detailed reports, either
on specific topics (“Special Reports”) or more gener-
al. Each IPCC report is accompanied by a Summary
for Policymakers (SPM), more compact, easier to read
and understand.
In its current Sixth Assessment cycle, the IPCC has al-
ready published three Special Reports:
— Global warming of 1.5°C – October 2018
— Climate Change and Land – August 2019
— The Ocean and Cryosphere in a Changing Climate –
September 2019.
While these reports are designed for policymakers, they
are not adapted to the teacher’s needs, even though
the importance of education systems for preparing the
youth to the ecological transition is recognized in the
Art.12 of Paris Agreement (COP21, 2015). To fill that gap
and starting in 2018, the Office for Climate Education
prepares dedicated Summaries for teachers of the
IPCC Reports. The present document presents a Sum-
mary of the Special Report Ocean and Cryosphere in
a Changing Climate, alongside a selection of related
activities and exercises that can be implemented in the
classroom 2.
1. What is the IPCC and why prepare a summary for teachers?

9 | OFFICE FOR CLIMATE EDUCATION IPCC SPeCIal RePoRT on The oCean and CRyoSPheRe In a ChangIng ClImaTe — SummaRy foR TeaCheRS
FINALVERSION
SUM
MAR
Y
REPO
RT
REPORT
FINALVERSION
WE NEED YOU !
The Summary for Policymakers is approved, which means that every single line has been validated by all of the member states – including the United States and Saudi Arabia. Negotiations take place as to how the content is to be presented in the summary, but under no circumstances can it go against what is said in the long report. This approval gives the summary significant political weight.
HOW THE IPCC WORKS
STRUCTURE APPROVAL
APPOINTING AND SELECTING REPORT WRITERS
VERSIONN°1
FIRST DRAFT OF REPORT
PREPARATORY MEETING
SECOND DRAFT OF REPORT
Government-appointed experts and organisations with IPCC observer status decide on the report’s key themes.
The IPCC approves the report’s key themes.
Governments and organizations with IPCC observer status name experts as authors. The bureau select the writers.
The authors establish a first draft of the report which is reviewed by the experts.
The writers validate the final versions of the report and the Summary for Policymakers, which are then distributed to governments.
The working group / ICPP approves the Summary for Policymakers and accepts the report.
The report is adopted (which means it is validated section by section) or accepted (general validation) depending on the type of report in question.
Governments review the final version of the summary in order to approve it.
The second draft of the report and the first draft of the Summary for Policymakers are submitted for review by governments and experts.
VERSIONN°2 REPORT PUBLISHED
FINAL VERSION
REVIEW BY GOVERNMENTS
APPROVAL AND ACCEPTANCE OF THE REPORT
FIGURE 3 The functioning of the IPCC. Adapted from an infographic by Citoyens pour le climat – https://citoyenspourleclimat.org/2019/03/24/informations/

10 | OFFICE FOR CLIMATE EDUCATION IPCC SPeCIal RePoRT on The oCean and CRyoSPheRe In a ChangIng ClImaTe — SummaRy foR TeaCheRS
Geography of the ocean and cryosphere
3 https://www.ipcc.ch/site/assets/uploads/sites/3/2019/12/SROCC_FullReport_FINAL.pdf, Startup Box, p. 5
The ocean covers around 70% of the Earth’s surface,
and contains about 97% of the Earth’s water. Some
even suggest that our planet should be called Ocean
rather than Earth. Five major oceans are part of the glob-
al ocean: the Arctic, the Southern, the Atlantic, the Pacif-
ic and the Indian oceans. Even though the surface of the
ocean may seem homogenous, its temperature, salinity,
colour and ecosystems vary geographically.
The cryosphere (the global mass of frozen water, com-
prised of snow and ice) also covers a large part of the
Earth, with the great ice sheets of Antarctica and
Greenland alone covering around 3% of the Earth’s
surface. In addition, there are nearly 200,000 gla-
ciers worldwide, including those at high altitude in the
tropics (where it is cold, despite the tropical climate). A
lesser known fact is that permafrost (permanently frozen
ground) covers around a quarter of land in the north-
ern hemisphere. Certain components of the cryosphere
vary seasonally. For instance, each winter, snow covers
around a third of land in the northern hemisphere (known
as “seasonal snow”), while sea ice in the Arctic and Ant-
arctic expands each winter and shrinks each summer.
People and wildlife live in harmony with the ocean and
cryosphere. Many of the world’s megacities are located
on the coast, and in 2010 about 28% of the global pop-
ulation lived less than 100 kilometres from the coast-
line and 100 metres above sea level. Around 10% of
the world’s population lives in high mountain regions,
while around 4 million people live in the Arctic. Unlike the
Arctic, the Antarctic, protected by an international treaty,
is only visited by scientists, explorers and tourists, and
has no permanent residents 3.
2. The ocean and cryosphere
ICE SHEET
ICE SHELF
SEA ICEGLACIERS
LAKE & RIVER ICE
PERMAFROSTSNOW COVER
FIGURE 4 The components of the Earth’s cryosphere. Adapted from Fig 4.25 of the IPCC WG1 of the AR5 (2013) – https://www.ipcc.ch/site/assets/uploads/2018/02/Fig4-25_errata-1.jpg

11 | OFFICE FOR CLIMATE EDUCATION IPCC SPeCIal RePoRT on The oCean and CRyoSPheRe In a ChangIng ClImaTe — SummaRy foR TeaCheRS
CLASS ACTIVITY # ACTIVITY
— On a world map, locate these geographical entities:
North Pole, South Pole, Atlantic Ocean, Pacific Ocean,
Indian Ocean, Arctic sea ice, Antarctic sea ice, Greenland
ice sheet, Antarctic ice sheet. Which entities are part of
the ocean and which are part of the cryosphere?
— Read up on the areas covered by these geographical
entities and compare them with the area of the Earth’s
land surface.
— What is the cryosphere? Read up on the etymology of the
word cryosphere.
— What is permafrost? How does it form?
— Can you name the different types of continental ice?
— Read up on how sea ice is formed. Is sea ice as salty or
less salty than sea water? What about the salt content
(also called the salinity) of the Antarctic or Greenland ice
sheets?
— Explain why our planet is sometimes called the “blue
planet”.
FIGURE 5 The Arctic (top) and Antarctic (bottom) polar re-gions. The dotted lines denote approximate boundaries for the polar regions. Note that the Arctic is comprised of an ocean surrounded by land while the Antarctic is the opposite: land surrounded by water. Antarctica is nearly entirely covered by ice (the Antarctic ice sheet,) while the Arctic’s equivalent is the Greenland ice sheet. Adapted from the SROCC, Chapter 3, IPCC 2019 – http://www.ipcc.ch/site/assets/uploads/sites/3/2019/11/07_SROCC_Ch03_FINAL.pdf
SOUTHERN OCEAN
ANTARCTICA
ATLANTIC OCEAN
INDIANOCEAN
PACIFIC OCEAN
SOUTHERN OCEAN
ARCTICOCEAN
GREENLAND
CANADA
ALASKA
RUSSIA
SIBERIA
0 1000 2000 KMBathymetry (meters)
0
-10,000
Winter sea ice limit
12 | OFFICE FOR CLIMATE EDUCATION IPCC SPeCIal RePoRT on The oCean and CRyoSPheRe In a ChangIng ClImaTe — SummaRy foR TeaCheRS
The importance of the ocean and cryosphere for people
4 http://www.fao.org/fishery/topic/16603/en5 https://www.aaas.org/news/spy-satellites-reveal-himalayan-ice-loss-has-doubled-2000
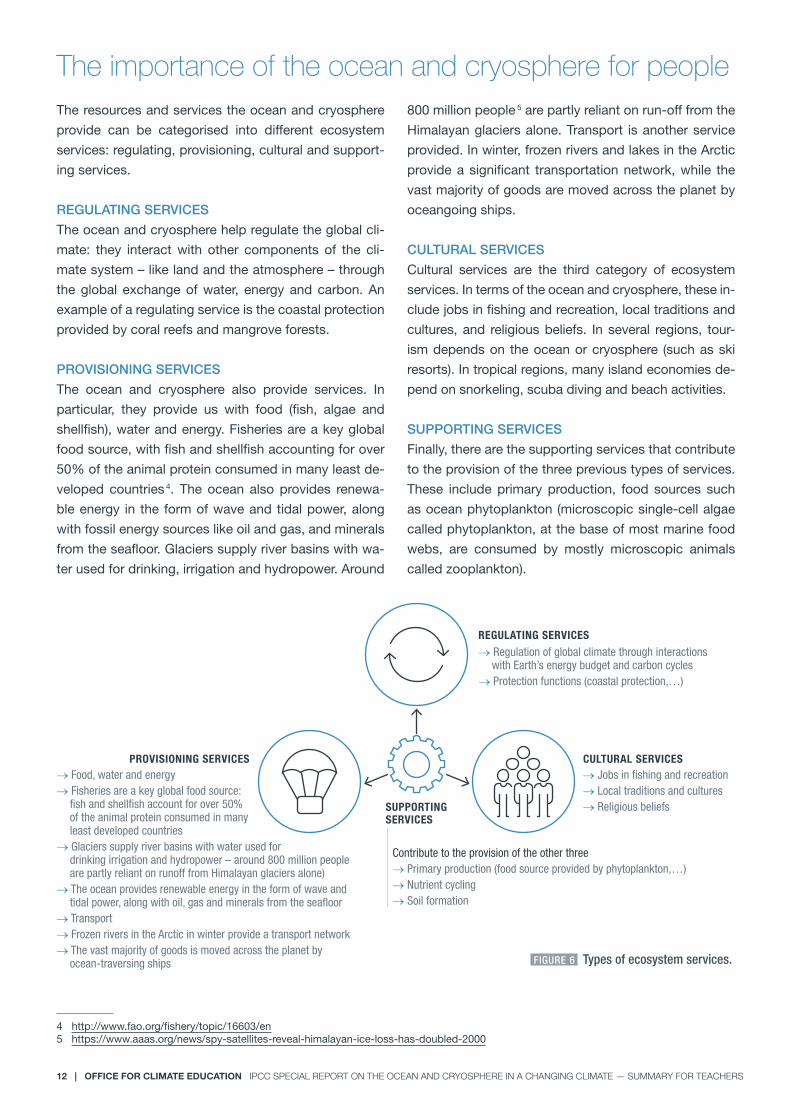
The resources and services the ocean and cryosphere
provide can be categorised into different ecosystem
services: regulating, provisioning, cultural and support-
ing services.
REGULATING SERVICES
The ocean and cryosphere help regulate the global cli-
mate: they interact with other components of the cli-
mate system – like land and the atmosphere – through
the global exchange of water, energy and carbon. An
example of a regulating service is the coastal protection
provided by coral reefs and mangrove forests.
PROVISIONING SERVICES
The ocean and cryosphere also provide services. In
particular, they provide us with food (fish, algae and
shellfish), water and energy. Fisheries are a key global
food source, with fish and shellfish accounting for over
50% of the animal protein consumed in many least de-
veloped countries 4. The ocean also provides renewa-
ble energy in the form of wave and tidal power, along
with fossil energy sources like oil and gas, and minerals
from the seafloor. Glaciers supply river basins with wa-
ter used for drinking, irrigation and hydropower. Around
800 million people 5 are partly reliant on run-off from the
Himalayan glaciers alone. Transport is another service
provided. In winter, frozen rivers and lakes in the Arctic
provide a significant transportation network, while the
vast majority of goods are moved across the planet by
oceangoing ships.
CULTURAL SERVICES
Cultural services are the third category of ecosystem
services. In terms of the ocean and cryosphere, these in-
clude jobs in fishing and recreation, local traditions and
cultures, and religious beliefs. In several regions, tour-
ism depends on the ocean or cryosphere (such as ski
resorts). In tropical regions, many island economies de-
pend on snorkeling, scuba diving and beach activities.
SUPPORTING SERVICES
Finally, there are the supporting services that contribute
to the provision of the three previous types of services.
These include primary production, food sources such
as ocean phytoplankton (microscopic single-cell algae
called phytoplankton, at the base of most marine food
webs, are consumed by mostly microscopic animals
called zooplankton).
� Food, water and energy� Fisheries are a key global food source:
fish and shellfish account for over 50% of the animal protein consumed in many least developed countries
� Glaciers supply river basins with water used for drinking irrigation and hydropower – around 800 million people are partly reliant on runoff from Himalayan glaciers alone)
� The ocean provides renewable energy in the form of wave and tidal power, along with oil, gas and minerals from the seafloor
� Transport� Frozen rivers in the Arctic in winter provide a transport network� The vast majority of goods is moved across the planet by
ocean-traversing ships
REGULATING SERVICES
CULTURAL SERVICES
� Regulation of global climate through interactions with Earth’s energy budget and carbon cycles
� Protection functions (coastal protection,…)
Contribute to the provision of the other three� Primary production (food source provided by phytoplankton,…)� Nutrient cycling� Soil formation
� Jobs in fishing and recreation� Local traditions and cultures� Religious beliefs
PROVISIONING SERVICES
SUPPORTINGSERVICES
FIGURE 6 Types of ecosystem services.

13 | OFFICE FOR CLIMATE EDUCATION IPCC SPeCIal RePoRT on The oCean and CRyoSPheRe In a ChangIng ClImaTe — SummaRy foR TeaCheRS
Biodiversity and ecosystems
6 Epple and Dunning (2014). Ecosystem resilience to climate change: What is it and how can it be addressed in the context of climate change adaptation? UNEP - WCMC.
7 World Register of Marine Species – http://www.marinespecies.org/index.php
Like supporting services, biodiversity, or the diversity of
organisms and their networks, also permeates ecosys-
tem services, since it helps the ecosystem to function.
Biodiverse ecosystems are also more resilient to cli-
mate change 6.
The ocean is highly biodiverse with hotspots found,
for instance, in coral reef ecosystems. At the top of the
phytoplankton and zooplankton food webs are sharks
and marine mammals, such as seals and whales, some
of which migrate long distances across the ocean.
Species diversity maintains ecosystem functions, but
each ecosystem has its own specific key organisms
at play. While our knowledge of ocean biodiversity is
rapidly growing with thousands of new species discov-
ered every year 7, it is also limited, and marine biolo-
gists estimate that hundreds of thousands of species
remain unknown.
ATLANTIC OCEAN
ARCTIC OCEAN
SOUTHERN OCEAN
INDIANOCEAN
PACIFIC OCEAN
CORAL
MANGROVE
SALT MARSH
SEAGRASSMEADOW
SEA ICE ALGAE
PHYTOPLANKTON
FIGURE 7 Example of different marine and coastal ecosystems in the world.
CLASS ACTIVITY # ACTIVITIES
One of the threats to marine biodiversity is overfishing. An alter-
native to fishing could be fish farming, also called aquaculture.
Today, just as many fish are produced in aquaculture as those
caught wild in the oceans. In rich countries, people mainly eat
tuna and salmon. But these two fish species are carnivorous
and have a major drawback: they eat 10 times their weight as
they grow (1 kg of salmon “eats” 10 kg of herring!).
— Calculate how much herring is required to farm 800,000
tonnes of salmon, equivalent to the record catch of cod
in 1968?
— If an adult eats 100 g of salmon every day (on average)
how many adults can be fed with 800,000 tonnes of
salmon?
— How many adults could have been fed on the herring
that was fed to the salmon?
— Comment on whether you think that aquaculture is a vi-
able solution to protect marine biodiversity.
The International Union for Conservation of Nature (IUCN) mon-
itors the number of threatened species worldwide. It regularly
updates and publishes the Red List of Threatened Species.
— Look up the definition of the different Red List catego-
ries – from “Extinct” to “Least Concern”.
— Go to the IUCN homepage and look at the “amazing spe-
cies”. Choose one that lives in or comes from the ocean.
Look up additional information and make a short pres-
entation of this species to your classmates. Emphasize
how this species is important for other marine species.

14 | OFFICE FOR CLIMATE EDUCATION IPCC SPeCIal RePoRT on The oCean and CRyoSPheRe In a ChangIng ClImaTe — SummaRy foR TeaCheRS
Physical changesThe SROCC compiles the impacts of climate change on
the ocean, on coastal, polar and mountain ecosystems,
as well as on the human communities that depend on
them. It deals with the vulnerability of ecosystems and
humans and evaluates the adaptation capacities. Addi-
tionally, options for achieving climate-resilient develop-
ment pathways are presented.
The future climate projections, as presented in the
SROCC, include two different emission scenarios:
RCP2.6 and RCP8.5 – RCP stands for Representa-
tive Concentration Pathway. The RCP2.6 assumes that
greenhouse gas emissions will decline in response to
major steps taken by human societies to reduce emis-
sions so that global warming is kept below 2.5°C by
2100 (for reference, we reached 1°C global warming in
2018). By contrast, the RCP8.5 assumes that green-
house gas emissions will increase rapidly throughout
the 21st century, resulting in global warming of around
4°C by 2100. Hereafter, we will refer to the RCP2.6 and
RCP8.5 scenarios as “low emissions scenario” and
“high emissions scenario” respectively.
-11950 2000 2050 2100
0
1
2
3
4
5
Global mean surface air temperatureChange relative to 1986−2005
Time
°C
Projected (RCP2.6)
Projected (RCP8.5)
Historical (modelled)
FIGURE 9 Historical change of the global mean surface air tem-perature and projected change under the two emission scenarios RCP2.6 and RCP8.5.https://www.ipcc.ch/site/assets/uploads/sites/3/2019/11/IPCC-SROCC-TS_3.jpg
3. Observed and projected impacts
15 | OFFICE FOR CLIMATE EDUCATION IPCC SPeCIal RePoRT on The oCean and CRyoSPheRe In a ChangIng ClImaTe — SummaRy foR TeaCheRS
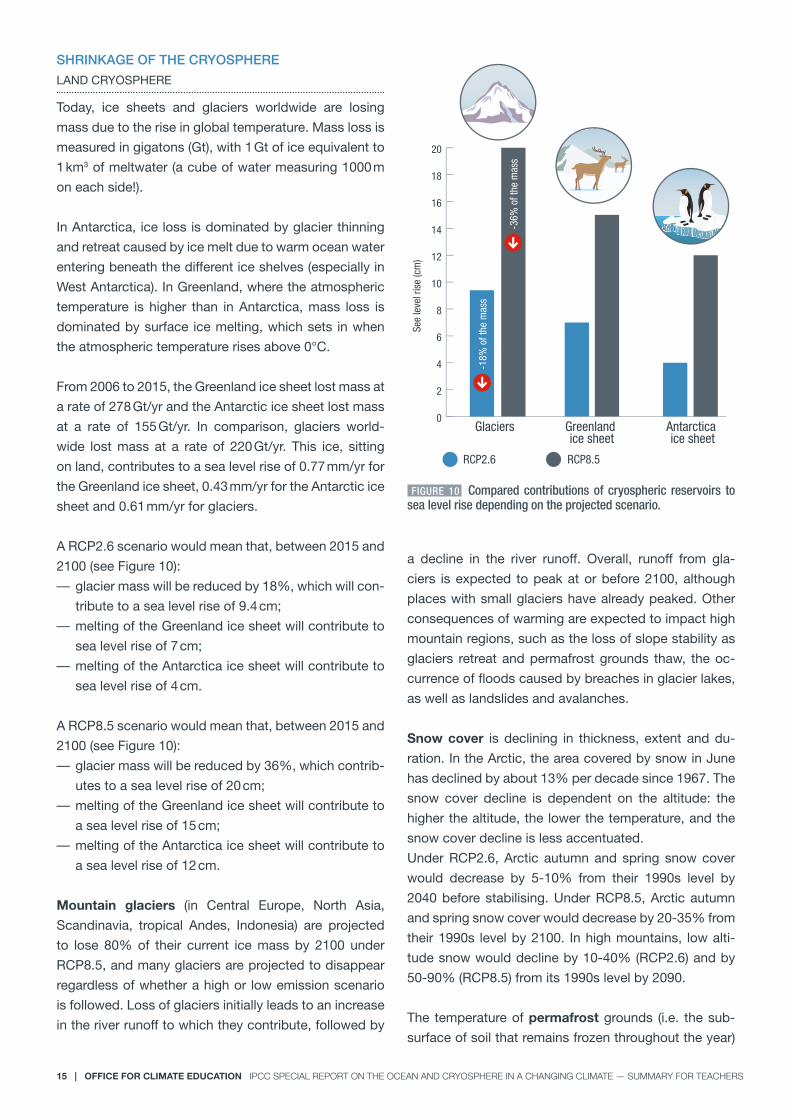
SHRINKAGE OF THE CRYOSPHERE
LAND CRYOSPHERE
Today, ice sheets and glaciers worldwide are losing
mass due to the rise in global temperature. Mass loss is
measured in gigatons (Gt), with 1 Gt of ice equivalent to
1 km3 of meltwater (a cube of water measuring 1000 m
on each side!).
In Antarctica, ice loss is dominated by glacier thinning
and retreat caused by ice melt due to warm ocean water
entering beneath the different ice shelves (especially in
West Antarctica). In Greenland, where the atmospheric
temperature is higher than in Antarctica, mass loss is
dominated by surface ice melting, which sets in when
the atmospheric temperature rises above 0°C.
From 2006 to 2015, the Greenland ice sheet lost mass at
a rate of 278 Gt/yr and the Antarctic ice sheet lost mass
at a rate of 155 Gt/yr. In comparison, glaciers world-
wide lost mass at a rate of 220 Gt/yr. This ice, sitting
on land, contributes to a sea level rise of 0.77 mm/yr for
the Greenland ice sheet, 0.43 mm/yr for the Antarctic ice
sheet and 0.61 mm/yr for glaciers.
A RCP2.6 scenario would mean that, between 2015 and
2100 (see Figure 10):
— glacier mass will be reduced by 18%, which will con-
tribute to a sea level rise of 9.4 cm;
— melting of the Greenland ice sheet will contribute to
sea level rise of 7 cm;
— melting of the Antarctica ice sheet will contribute to
sea level rise of 4 cm.
A RCP8.5 scenario would mean that, between 2015 and
2100 (see Figure 10):
— glacier mass will be reduced by 36%, which contrib-
utes to a sea level rise of 20 cm;
— melting of the Greenland ice sheet will contribute to
a sea level rise of 15 cm;
— melting of the Antarctica ice sheet will contribute to
a sea level rise of 12 cm.
Mountain glaciers (in Central Europe, North Asia,
Scandinavia, tropical Andes, Indonesia) are projected
to lose 80% of their current ice mass by 2100 under
RCP8.5, and many glaciers are projected to disappear
regardless of whether a high or low emission scenario
is followed. Loss of glaciers initially leads to an increase
in the river runoff to which they contribute, followed by
a decline in the river runoff. Overall, runoff from gla-
ciers is expected to peak at or before 2100, although
places with small glaciers have already peaked. Other
consequences of warming are expected to impact high
mountain regions, such as the loss of slope stability as
glaciers retreat and permafrost grounds thaw, the oc-
currence of floods caused by breaches in glacier lakes,
as well as landslides and avalanches.
Snow cover is declining in thickness, extent and du-
ration. In the Arctic, the area covered by snow in June
has declined by about 13% per decade since 1967. The
snow cover decline is dependent on the altitude: the
higher the altitude, the lower the temperature, and the
snow cover decline is less accentuated.
Under RCP2.6, Arctic autumn and spring snow cover
would decrease by 5-10% from their 1990s level by
2040 before stabilising. Under RCP8.5, Arctic autumn
and spring snow cover would decrease by 20-35% from
their 1990s level by 2100. In high mountains, low alti-
tude snow would decline by 10-40% (RCP2.6) and by
50-90% (RCP8.5) from its 1990s level by 2090.
The temperature of permafrost grounds (i.e. the sub-
surface of soil that remains frozen throughout the year)
0
2
4
6
8
10
12
14
16
18
20
Antarctica ice sheet
Greenland ice sheet
GlaciersSe
e le
vel r
ise
(cm
)
-18%
of t
he m
ass
-36%
of t
he m
ass
RCP2.6 RCP8.5
FIGURE 10 Compared contributions of cryospheric reservoirs to sea level rise depending on the projected scenario.

16 | OFFICE FOR CLIMATE EDUCATION IPCC SPeCIal RePoRT on The oCean and CRyoSPheRe In a ChangIng ClImaTe — SummaRy foR TeaCheRS
has increased to levels unprecedented in the observa-
tion records (1980s - present). Once permafrost ground
warms to 0°C, it thaws. The main concern with per-
mafrost thaw is the potential release of carbon dioxide
and methane. Permafrost grounds can be found in the
northern hemisphere (mainly in Siberia, Canada, Alaska
and Greenland) but also in some alpine regions covering
one fifth of the global land surface.
Currently, some 1460-1600 Gt of organic carbon are
stored in permafrost grounds. This is about twice the
amount of carbon currently present in the atmosphere
as CO2. Evidence is divergent as to whether permafrost
warming is currently causing the release of additional
greenhouse gases to the atmosphere or not. Perma-
frost thaw and glacier retreat have decreased the stabil-
ity of high-mountain slopes (which is ensured by frozen
ground and glacier ice). The area of near-surface per-
mafrost (grounds that are frozen to a depth of 3-4 m)
recedes in both scenarios: it is reduced by between 2%
and 66% for RCP2.6 compared to 30-99% for RCP8.5.
Tens to hundreds of billions of tonnes of permafrost car-
bon could be released due to permafrost thawing by
2100 (RCP8.5) with the potential to exacerbate climate
change. Interestingly, the increased plant growth from
the newly available non-frozen land – known as green-
ing – should partially offset this release of carbon.
FIGURE 11 Thawing permafrost grounds in Alaska.NASA/JPL-Caltech - https://www.jpl.nasa.gov/news/news.php?feature=4376
ARCTIC SEA ICE
The sea ice cover in the Arctic has been declining. The
sea ice extent reaches its annual minimum each Sep-
tember at the end of the summer before expanding to
its annual maximum in March. Over the past 40 years,
the areal coverage at the September minimum has
decreased by about 12.8% per decade, equivalent to
about 40% in total surface. It is likely that these chang-
es have not been seen for at least 1000 years. Warm
winters in 2016, 2017 and 2018, during which surface
temperatures in the central Arctic reached 6°C above
normal, caused a record low in sea ice cover at a time
of the year when it usually reaches its maximum extent.
Coinciding with the steady loss in areal coverage, less
sea ice remains from one melt season to the next, and
therefore the average age of the ice is also on the de-
cline. Unlike ice melting on land, loss of sea ice does
not contribute to sea level rise since it is already in the
water, afloat (like melting ice cubes in a glass of water).
RUSSIA
ALASKA
CANADA
GREENLAND
Median extent (1981-2010)15 100
Sea ice concentration (%)
September 18, 2019
FIGURE 12 Evolution of Arctic sea ice concentration.NOAA. Data NSIDC - https://www.climate.gov/sites/default/files/ClimateDashboard_ArcticSeaIce_minimum_2019_map_large.jpg
The loss of summer sea ice, together with the loss of
spring snow cover on land, have amplified the warm-
ing in the Arctic through a number of effects, such as
changes in moisture content and albedo. Air temper-
ature in the Arctic has risen twice as fast as the global
average over the last two decades, and changes in the
Arctic sea ice have the potential to influence mid-lati-
tude weather.
What about the future? In both scenarios, sea ice loss
will continue until 2050. If warming is stabilised at 2°C,
the Arctic would be free of sea ice in September up to
every three years.

17 | OFFICE FOR CLIMATE EDUCATION IPCC SPeCIal RePoRT on The oCean and CRyoSPheRe In a ChangIng ClImaTe — SummaRy foR TeaCheRS
TO SUM UP
Melting glaciers and ice sheets, permafrost
thaw, and a decline in snow cover and the Arctic
sea ice are being observed and are projected to
continue over the next two decades. The rate of
mass loss from the Greenland and Antarctic ice
sheets will continue to increase throughout the
21st century. Arctic sea ice extent and age are
decreasing and contributing to amplified warm-
ing in the Arctic.
Even if greenhouse gas emissions are rapidly
reduced, the cryosphere will continue to change
until 2050, altering river runoff and increasing
mountain hazards like avalanches and land-
slides.
CLASS ACTIVITY # ACTIVITY
There is ice floating in the sea (sea ice) and ice sitting on
land (glaciers and ice sheets). With climate change, both
types of ice are melting.
— Explain where the meltwater goes.
Answer: Meltwater from sea ice and ice sheets goes di-
rectly into the ocean; meltwater from glaciers may first
flow to rivers, feed groundwater reservoirs and inland
seas and lakes, and eventually reach the ocean as well.
— Explain why meltwater from sea ice and meltwater from
ice on land do not contribute equally to sea level rise.
Design an experiment to show the difference and carry
out that experiment.
OCEAN HEAT AND CARBON UPTAKE
Since 1970, the ocean has absorbed and stored
about 93% of the excess heat generated by global
warming, playing a key role in regulating the climate
system. Since 1993, the rate of ocean warming, and
thus of heat uptake, has more than doubled. Ocean
temperatures are rising fastest at the surface, where the
heat uptake occurs, but deeper waters are also warm-
ing. Warming of the upper 2 km of the ocean has main-
ly occurred around Antarctica (in the Southern Ocean),
which has absorbed 35-43% of the total heat gain in
this layer over the past 50 years.
As a consequence of ocean warming, periods of ex-
tremely high ocean surface temperature, known as ma-
rine heatwaves, have doubled in frequency and have
become longer lasting, more intense and more exten-
sive over the last 40 years. Marine heatwaves are ex-
pected to occur more frequently (20 times more often
under RCP2.6 and 50 times more often by the end of
the 21st century under RCP8.5).
Surface ocean warming, together with freshwater in-
put from land ice melt, are making the surface ocean
less dense relative to deeper waters. This increase in
the density difference between surface and subsurface
waters inhibits mixing between the different ocean lay-
ers and has consequences on the ocean oxygen and
nutrient content. The phenomenon by which ocean lay-
ers do not mix is called density stratification. By 2090,
for both the RCP2.6 and RCP8.5 scenarios, oxygen and
nutrients are projected to decline, with a smaller decline
expected for RCP2.6.
The ocean is an important carbon sink: it has ab-
sorbed between 20 and 30% of the CO2 released into
the atmosphere by human activities since 1980.
When CO2 dissolves in the ocean’s surface water, carbon-
ic acid is produced, which increases seawater acidity (i.e.
it lowers seawater pH). This process is known as ocean
acidification. Since the late 1980s, open ocean surface pH
has declined by around 0.02 units per decade. It may not
seem like much, but small changes can have very large
impacts on the ecosystems, as we will see in the following
section. The degree of ocean acidification is directly relat-
ed to the amount of CO2 released into the atmosphere.
Under RCP8.5, continued uptake of CO2 from the atmos-
phere by the ocean would result in ocean pH declining by
a further 0.3 pH units by the end of the century.
Ocean93.4%
Where is global warming going?
Atmosphere2.3%
Continents2.1%
Glaciers & ice caps0.9%
Arctic sea ice0.8%
Greenland Ice Sheet0.2%
Antarctic Ice Sheet0.2%
FIGURE 13 Global storage of heat excess from global warming.https://skepticalscience.com/Infographic-on-where-global-warming-is-going.html
18 | OFFICE FOR CLIMATE EDUCATION IPCC SPeCIal RePoRT on The oCean and CRyoSPheRe In a ChangIng ClImaTe — SummaRy foR TeaCheRS
TO SUM UP
The ocean is warming at all depths and has ab-
sorbed over 90% of the excess heat generat-
ed by global warming. Ocean surface and the
Southern Ocean have taken up most of the heat.
Marine heatwaves are more frequent and more
intense. The density stratification in the upper
200 metres of the ocean is increasing, causing a
decrease in oxygen and nutrient content.
The ocean surface layers absorb more CO2,
leading to increased ocean acidification.
CLASS ACTIVITY # ACTIVITY
Understanding the effect of ocean acidification on corals
— Think of an experiment to demonstrate the effect of CO2
absorption on seawater pH. In the experiment, you will
have to add CO2 to seawater. How can you do that? How
can you then measure the impact on the pH?
Answer: You could, for example, blow into the water with
a straw.
— Look up and explain what consequences ocean acidifi-
cation has on corals and shellfish.
OCEAN CYCLES AND CIRCULATION: EL NIÑO AND
THE ATLANTIC MERIDIONAL OVERTURNING CIRCU-
LATION
El Niño is an anomalous warming event that occurs
in the central and eastern tropical Pacific. It has ma-
jor global environmental and human impacts, including
the reduction of fish catch along the coasts of Peru and
Chile, and severe droughts in Indonesia, the Philippines
and Australia. Throughout the 21st century, extreme El
Niño events could occur more often, as a consequence
of ocean warming.
Global ocean circulation is also expected to be affected
by climate change. The Atlantic Meridional Overturning
Circulation (AMOC – meridional meaning in the North-
South direction) is the Atlantic branch of the global sys-
tem of marine currents which transport heat, carbon,
oxygen and nutrients throughout the world’s oceans.
This Atlantic branch, in particular, is projected to weaken
over the 21st century, although a collapse is very unlike-
ly. The rate and magnitude of the changes will be small-
er in scenarios with low greenhouse gas emissions, but
in all cases, the weakening of the AMOC would lead to
decreased biological productivity in the North Atlantic,
more winter storms in Northern Europe, less summer
rainfall in the Sahel and South Asia, fewer hurricanes in
the Atlantic and an increased sea level along the north-
east coast of North America.
TO SUM UP
Ocean circulation and phenomena such as El
Niño are expected to be affected by climate
change. The Atlantic Meridional Overturning
Circulation is projected to weaken over the
21st century, and extreme El Niño events could
occur more often as a consequence of ocean
warming.
SEA LEVEL RISE
Global mean sea level has risen by 16 cm over the
past century and has been rising at ever increasing
rates. The rate of rise for 2006-2015, of 3.6 mm/yr, was
unprecedented in the last century, and 2.5 times larg-
er than the rate for 1901-1990. While a few millimetres
of rise per year may not sound like much, it adds up
over time, and leads to more frequent extreme flooding
events in coastal regions.
The main drivers of sea level rise are shown in Figure 14.
Today, ice loss from ice sheets and glaciers is the main
source of rise and has contributed 1.8 mm/yr to the
rise over 2006-2015. Thermal expansion contributed to
1.4 mm/yr rise over the same period: as the ocean water
warms, it expands and occupies a larger volume, addi-
tionally enhancing sea level rise.
As sea level rises, a storm surge can reach further in-
land. Compounding the resulting coastal flooding and
erosion from tropical cyclones, the associated rainfall
and winds can be enhanced by climate change.

19 | OFFICE FOR CLIMATE EDUCATION IPCC SPeCIal RePoRT on The oCean and CRyoSPheRe In a ChangIng ClImaTe — SummaRy foR TeaCheRS
Warming atmosphere
Melting glaciers
Melting ice sheets
Ocean thermal expansion
Sea level rise
Warming ocean
FIGURE 14 How a warming atmosphere and a warming ocean cause sea level rise.
Sea level rise is projected to continue, and at an in-
creasing rate. Due to the slow response of the ocean
associated to its thermal inertia, global sea level will
continue to rise even after global temperature has sta-
bilised.
Under RCP2.6, sea levels in 2100 could reach 29-59 cm
above the 1990s level and at a rate of 2-6 mm/year. In
contrast, under RCP8.5, sea level in 2100 could rise by
61-110 cm and will be rising at 1-2 cm/year. Compared
to the previous IPCC sea level assessment (in the last
main IPCC report AR5), this projection is 10 cm higher,
due to the inclusion of a larger ice loss from the Ant-
arctic ice sheet. Moreover, ice sheet instabilities could
increase Antarctica’s contribution to sea level rise to
substantially higher values over the next century and
thereafter. Under RCP2.6, models project a sea level
rise of about 1 m, compared to up to 5 m by 2300 in
RCP8.5.
As sea level rises, extreme sea level events will occur
more often (see Figure 15). Events that historically oc-
curred only once per century are projected to occur at
least annually by 2100 under both scenarios.
1/month
1/year
1/decade
1/century
mean sea level
1/month
1/year
1/decade
1/century
mean sea level
Schematic effect of regional sea level rise on projected extreme sea level events (not to scale) Historical Centennial extreme sea level Events (HCEs) become more common due to sea level rise
Sea level rise
Time
Sea
leve
l hei
ght a
nd re
curr
ence
freq
uenc
y
recent past future
FIGURE 15 Due to projected global mean sea level rise, lo-cal sea levels that historically occured once per century are projected to become at least annual events at most locations during the 21st century.http://www.ipcc.ch/srocc/chapter/summary-for-policymakers/spm-section-3/srocc_spm4_final_edit_sl/
TO SUM UP
Ice loss from glaciers and from the Greenland
and Antarctic ice sheets as well as thermal ex-
pansion of seawater due to ocean warming are
contributing to global sea level rise. The glob-
al mean sea level is currently rising at about
3.6 mm/year, and the rate of increase has ac-
celerated over the last century with regional dif-
ferences. Extreme sea level events that are his-
torically rare will occur more frequently (at least
once per year) in many locations by 2050.
Sea level rise is expected to continue beyond
2100 under both emissions scenarios (RCP 2.6
and RCP 8.5).
CLASS ACTIVITY # ACTIVITY
— Look at the two diagrams measuring sea level on NA-
SA’s “Sea Level Change” page: https://climate.nasa.gov/
vital-signs/sea-level/. How was sea level measured until
2013? And after 2013? Explain why sea level measure-
ments are particularly relevant to study climate change.
— Using the data provided, calculate the average sea level
rise since 1880. Compare your result to the current 3.4
mm/year sea level rise and comment on your findings.
— Name two factors that contribute to sea level rise and
explain why.
20 | OFFICE FOR CLIMATE EDUCATION IPCC SPeCIal RePoRT on The oCean and CRyoSPheRe In a ChangIng ClImaTe — SummaRy foR TeaCheRS
TROPICAL CYCLONES
The proportion of the strongest tropical cyclones, as
well as their rainfall, is projected to increase as global
temperatures increase. The associated storm surges
will add to a raised sea level baseline, increasing the
risk of greater coastal flooding events.
Glacier mass
Marine heatwaves
Ocean pH
Sea level
Permafrosttemperature
Sea ice
Continental shelf
Upper ocean
Continental slope
Ice sheet
Sea iceIce shelf
Ocean heat content
Snow cover
Sea ice(Arctic)
Abyssal plain
O2
Ocean oxygen
Ice sheet mass (Greenland & Antarctica)
Cryosphere Changes
Ocean Changes Deep ocean Ocean circulation
Coast
pH
Increase
Decrease
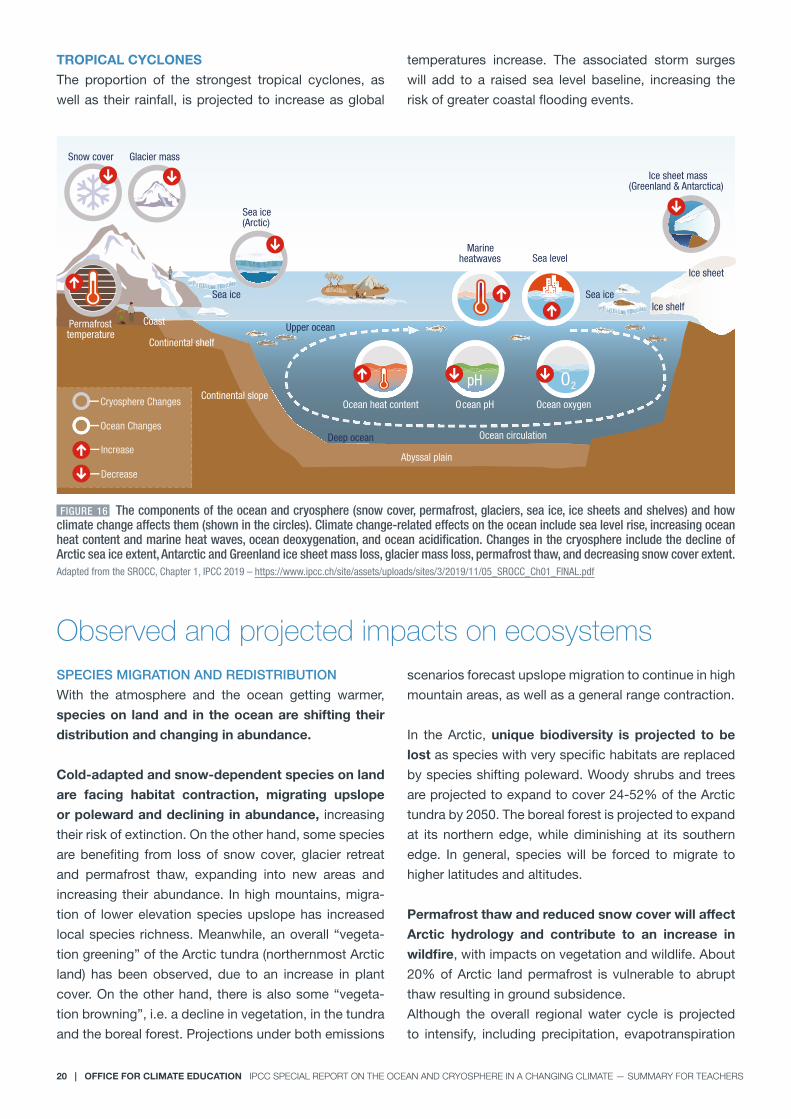
FIGURE 16 The components of the ocean and cryosphere (snow cover, permafrost, glaciers, sea ice, ice sheets and shelves) and how climate change affects them (shown in the circles). Climate change-related effects on the ocean include sea level rise, increasing ocean heat content and marine heat waves, ocean deoxygenation, and ocean acidification. Changes in the cryosphere include the decline of Arctic sea ice extent, Antarctic and Greenland ice sheet mass loss, glacier mass loss, permafrost thaw, and decreasing snow cover extent. Adapted from the SROCC, Chapter 1, IPCC 2019 – https://www.ipcc.ch/site/assets/uploads/sites/3/2019/11/05_SROCC_Ch01_FINAL.pdf
Observed and projected impacts on ecosystemsSPECIES MIGRATION AND REDISTRIBUTION
With the atmosphere and the ocean getting warmer,
species on land and in the ocean are shifting their
distribution and changing in abundance.
Cold-adapted and snow-dependent species on land
are facing habitat contraction, migrating upslope
or poleward and declining in abundance, increasing
their risk of extinction. On the other hand, some species
are benefiting from loss of snow cover, glacier retreat
and permafrost thaw, expanding into new areas and
increasing their abundance. In high mountains, migra-
tion of lower elevation species upslope has increased
local species richness. Meanwhile, an overall “vegeta-
tion greening” of the Arctic tundra (northernmost Arctic
land) has been observed, due to an increase in plant
cover. On the other hand, there is also some “vegeta-
tion browning”, i.e. a decline in vegetation, in the tundra
and the boreal forest. Projections under both emissions
scenarios forecast upslope migration to continue in high
mountain areas, as well as a general range contraction.
In the Arctic, unique biodiversity is projected to be
lost as species with very specific habitats are replaced
by species shifting poleward. Woody shrubs and trees
are projected to expand to cover 24-52% of the Arctic
tundra by 2050. The boreal forest is projected to expand
at its northern edge, while diminishing at its southern
edge. In general, species will be forced to migrate to
higher latitudes and altitudes.
Permafrost thaw and reduced snow cover will affect
Arctic hydrology and contribute to an increase in
wildfire, with impacts on vegetation and wildlife. About
20% of Arctic land permafrost is vulnerable to abrupt
thaw resulting in ground subsidence.
Although the overall regional water cycle is projected
to intensify, including precipitation, evapotranspiration

21 | OFFICE FOR CLIMATE EDUCATION IPCC SPeCIal RePoRT on The oCean and CRyoSPheRe In a ChangIng ClImaTe — SummaRy foR TeaCheRS
and river discharge to the Arctic ocean, decreases in
snow cover and permafrost may lead to soil drying.
In the ocean, the distribution of phytoplankton, fish
and marine mammals has been shifting poleward
due to warming, at rates up to several tens of kilo-
metres per decade. The shifts have been faster at the
ocean surface than near the seafloor.
These changes in species’ spatial distribution are ac-
companied by changes in their seasonal activities.
As the warm season gets longer, in the ocean, polar
and mountain regions, many species are extending their
seasonal activities and changing their behaviour.
TO SUM UP
Loss of land cryosphere is altering and will con-
tinue to alter ecosystems in high mountain areas
and the Arctic, resulting in migrations, shifts in
species distributions and loss of biodiversity.
MARINE ECOSYSTEMS, CONSUMERS AND FISHER-
IES
Primary producers, such as phytoplankton, are organ-
isms that produce organic matter from inorganic mate-
rials through photosynthesis. In turn, primary consum-
ers, such as zooplankton, feed on primary producers.
Increased stratification of the upper ocean since the
1970s has altered the supply of nutrients to surface
waters, affecting regional phytoplankton production.
However, there are poor records of these changes, so
their spatial patterns are uncertain.
In the Arctic, net primary production has increased –
since more water is ice-free. Furthermore, spring phyto-
plankton and ice algae blooms are occurring earlier
in the year. Since zooplankton, as primary consumers,
eat phytoplankton, they are directly affected by changes
in phytoplankton abundance and seasonal distribution.
Moreover, since plankton is at the base of many marine
food webs, these changes cascade up the food web, af-
fecting its overall structure and function, and eventually
has consequences for biodiversity and fisheries.
Climate models project a decline in primary production
by 4-11% by 2090 under RCP8.5, as a consequence
of warming and stratification. Moreover, ocean acidifi-
cation is expected to affect an important zooplankton
species called pteropods. They are sometimes called
“the potato chips of the ocean” due to their critical role
in marine food webs, especially in the Arctic. Pteropods
have shells made of calcium carbonate and are thus
vulnerable to ocean acidification.
Warming and the decline in primary production are
projected to cause the global biomass of all marine
animals (including fish) to decline by 15% from their
1990s levels by 2100 (in the Arctic, this biomass will,
however, increase).
Enhanced stratification has lowered the amount of
oxygen in the subsurface ocean, by inhibiting the
supply from the oxygen-rich sea surface that is essen-
tial to marine organisms. The global-scale loss of ocean
oxygen is known as ocean deoxygenation.
In many ocean regions, warming and changes in prima-
ry production have led to a decline in the abundance of
fish and shellfish species, resulting in reduced catches.
The composition of catches has also altered since the
1970s, with the shallow seas of the world increasingly
being populated by warm water species and fish stocks
moving poleward.
TO SUM UP
The combined effects of ocean warming, strat-
ification, heatwaves, oxygen loss and acidifica-
tion are altering marine ecosystems. Changes in
abundance and shifts in the distribution of ma-
rine species from plankton to fish, mammals and
seabirds, have occurred due to ocean warming
since the 1950s. This is altering the structure
and function of marine food webs, along with
fishery catches.
CLASS ACTIVITY # ACTIVITY
— Draw a simple diagram, known as a food chain, to repre-
sent the relationship in an ecosystem using the following
words: primary producers, secondary producers, sun’s
energy, zooplankton, phytoplankton, fish, consumers.
— Using another colour, add the different impacts of cli-
mate change on the food chain you have drawn.

22 | OFFICE FOR CLIMATE EDUCATION IPCC SPeCIal RePoRT on The oCean and CRyoSPheRe In a ChangIng ClImaTe — SummaRy foR TeaCheRS
Biodiversity changes which includes shifts in
species distribution, changes in species abundance and
changes in seasonal activity.
Changes in the structure of ecosystems which includes changes to
the foodwebs
Existing ecosystems at risk
including coral reefs, rocky shores, kelp forests,seagrass meadows, etc.
Changes in primary production
Changes in fishery catches
Wildfire increase
FIGURE 17 Observed and projected impacts on ecosystems.
8 IPCC Special Report “Global Warming of 1.5°C”, https://www.ipcc.ch/sr15/
COASTAL ECOSYSTEMS
Coastal ecosystems, such as wetlands (saltmarshes,
mangrove forests, seagrass meadows), coral reefs and
rocky shores provide a large number of ecosystem
services. They protect coastlines from erosion, buffer
the impacts of sea level rise, and provide food and hab-
itat for dependent fauna and human communities. As
well as ensuring invaluable cultural and spiritual func-
tions for human populations living in those areas, they
are essential for tourism.
Due to a combination of human pressures, sea level
rise, ocean warming, marine heatwaves and extreme
weather events, nearly 50% of coastal wetlands have
been lost over the 19th century. Widespread die-off of
mangroves has been observed since the 1960s. The loss
of all these important carbon stores is resulting in the re-
lease of about 0.15-5.35 Gt of CO2 per year. In estuaries,
warming, sea level rise and tidal changes lead to the ex-
pansion of salinization (salty waters spreading into fresh-
water environments) and of low oxygen waters.
Global-scale coral bleaching events have been in-
creasing in frequency, causing worldwide reef degra-
dation since 1997. Driven by marine heatwaves, bleach-
ing occurs when corals expel their resident algae and
lose their colour (become white).
In the tropics, almost all coral reefs are projected to
suffer significant areal loss and local extinction due
to warming along with ocean acidification – even if
global warming is limited to 1.5°C. Already 30% of the
world’s corals have been lost (due to pollution and over-
fishing, as well as warming). A loss of 70-90% of corals
is projected for a 1.5°C warming scenario and even 99%
of corals would be lost in a 2.0°C warming scenario 8.
The species composition and diversity of the remaining
reef communities will differ from today’s reefs.
TO SUM UP
A multitude of climate-change related effects,
like ocean acidification, oxygen loss and sea
ice melt, combined with local pressures from
human activities, are affecting coastal ecosys-
tems. Their biodiversity and the services they
provide to humans are being altered.
The rate and magnitude of species decline are
projected to be highest in the tropics. Sensitive
ecosystems like coral reefs, seagrass mead-
ows and kelp forests will be at high risk if global
warming exceeds 2°C.
CLASS ACTIVITY # ACTIVITY
There are currently few invasive species in the Arctic, but
more are expected to emerge with climate change and in-
creased activity.
— Using reports from the Conservation of Arctic Flora and
Fauna (CAF) https://www.caff.is/invasive-species, name
some invasive species that are present in the Arctic to-
day due to climate change and explain why their number
is expected to rise.
— Discuss the effect of this increase on arctic ecosystems.
— Identify some activities and policies that have been
adopted to improve management of invasions.

23 | OFFICE FOR CLIMATE EDUCATION IPCC SPeCIal RePoRT on The oCean and CRyoSPheRe In a ChangIng ClImaTe — SummaRy foR TeaCheRS
Observed and projected impacts on peopleARCTIC AND HIGH-MOUNTAIN-AREA COMMUNITIES
Arctic and high mountain communities are affected by
from the loss of snow cover, the loss of river and lake ice,
glacier melt and permafrost thaw, in a number of ways.
Shrinkage of the land cryosphere is affecting water re-
sources as well as food access and availability (hunting,
fishing and herding) and agricultural yields. For glacier-
and snow-fed river basins, loss of the cryosphere has al-
tered the amount and seasonality of runoff. Furthermore,
changes in the seasonality of water input have an impact
on hydropower facilities, and this in turn affects energy
supply. All these changes have consequences for com-
munities living in and downstream of mountain areas.
The loss of the cryosphere is also affecting human
health. Increased risk of food and waterborne diseases,
malnutrition and injuries, and mental health challenges
are some of the health impacts, with indigenous peo-
ples being particularly affected. In some high-mountain
areas, water quality has already been deteriorated by
contaminants, particularly mercury, released from melt-
ing glaciers and thawing permafrost.
Loss of permafrost in the Arctic and in high mountain re-
gions is causing land to sink and slopes to become un-
stable, thus damaging buildings and roads. Subsiding
ground following permafrost thaw has impacts on over-
lying infrastructure. The majority of Arctic infrastructure
is located in regions where permafrost thaw is projected
to intensify by mid-century.
CLASS ACTIVITY # ACTIVITY
— Cover the bottom of an oven dish with soil. Use the soil
to shape mountains, valleys and other geographical fea-
tures and put the whole construction in the freezer: you
will have created permafrost. Build a small town – some
houses and roads – with playdough. The next day, take
the oven dish out of the freezer and place your houses
and roads in the landscape you have built. Leave it near
a window or heater for one day.
— Describe what has happened to your town. How do you
think climate change will impact communities living
near the Arctic?
Thawing permafrost
3
4
2
1Present
Present
Present
Present
Present
Area of interest
Future
1Future
3Future
4Future
2Future
FloodsMore & larger glacier lakes
Unstable slopes and landslides Smaller glaciers, Thawing permafrost
Snow avalanchesLess and wetter snow
Social and infrastructure systems Socio-economic development in the mountains and downhill
FIGURE 18 Anticipated changes in high mountain hazards under climate change, driven by changes in snow cover, glaciers and per-mafrost, overlay changes in the exposure and vulnerability of individuals, communities, and mountain infrastructure. SROCC, Chapter 2, IPCC 2019 – https://www.ipcc.ch/srocc/chapter/chapter-2/2-1introduction/ipcc-srocc-ch_2_7/

24 | OFFICE FOR CLIMATE EDUCATION IPCC SPeCIal RePoRT on The oCean and CRyoSPheRe In a ChangIng ClImaTe — SummaRy foR TeaCheRS
The loss of the cryosphere in high mountains already
impacts and will continue to impact tourism (skiing, gla-
cier tourism, hiking and mountaineering). Snowmaking
technologies in ski resorts will become increasingly in-
effective as the atmosphere warms further.
The past two decades have seen an increase in Arc-
tic shipping activity associated with sea ice decline.
In 2011, four ships crossed the northeast passage. In
2018, 227 took the same route. The rise in shipping ac-
tivities increases the risk of introducing invasive species
and pollution, if actions to implement new regulations
do not keep pace.
Adaptation options are available, and some have al-
ready been implemented. In the Arctic, community
freezers help increase food security. Arctic communi-
ties have also adjusted the timing of their activities to
respond to changes in seasonality and unsafe ice travel
conditions.
In high mountains, adaptation measures include coordi-
nated water management of various scales and indus-
tries as well as the diversification of tourism activities.
In both the Arctic and high mountain areas, adaptation
has been made easier thanks to the knowledge held by
indigenous peoples and local populations.
TO SUM UP
Future loss of cryosphere components on land
will have an impact on water resources and their
uses, such as hydropower and agriculture irriga-
tion in and downstream of high-mountain areas,
as well as livelihoods in the Arctic. Increased
risks from floods, avalanches, landslides and
ground destabilization will affect infrastructure,
tourism and safety.
CLASS ACTIVITY # ACTIVITY
— Arctic peoples have a very large number of words for
snow. Can you name 5 of them? How can you explain why
many countries around the world only have one word?
You can find some examples by clicking on this link:
https://www.thecanadianencyclopedia.ca/en/article/in-
uktitut-words-for-snow-and-ice
— Do you know what a hummock is? What does it mean
in Inuktitut?
Answer: A hummock means “a mountain”. A hummock
is a mound of ice rising above an ice field.
— Discuss the link between the cryosphere and certain hu-
man cultures.

25 | OFFICE FOR CLIMATE EDUCATION IPCC SPeCIal RePoRT on The oCean and CRyoSPheRe In a ChangIng ClImaTe — SummaRy foR TeaCheRS
COASTAL ZONE
Coastal communities are exposed to multiple cli-
mate-related hazards, including tropical cyclones,
storm surges and flooding, marine heatwaves, sea ice
loss, and permafrost thaw. Climate hazards can interact
with other “non-climate” factors, such as land subsid-
ence, pollution, habitat degradation, reef and sand min-
ing, and loss of indigenous and local knowledge. When
several climate hazards occur simultaneously or in suc-
cession, they can lead to amplified impacts in what is
known as a “compound event”.
Storm surges occurring alongside a rise in mean sea
level can cause loss of life, damage to infrastructure,
and saline intrusion into soils and groundwater. In the
Arctic, loss of sea ice is exposing coastal communities
to increased shoreline erosion, affecting the infrastruc-
ture. Some coastal communities are already planning to
relocate.
A wide range of options are available to tackle each
climate change hazard, but selecting which ones are
the most suitable depends on the local context. In all
cases, monitoring and early-warning systems can be
used to take action to reduce the risks. For sea lev-
el rise, adaptation options include coastal protection
and even retreat from coasts. Barriers to implementing
these options include lack of funding, knowledge and
capacity.
TO SUM UP
Changes in the ocean are affecting marine eco-
systems, challenging coastal communities and
indigenous peoples. The impact may be seen in
many areas: in food security through fisheries, in
health and well-being, in local cultures and live-
lihoods, and on tourism and recreation. A variety
of solutions is being implemented worldwide to
reduce coastal hazards.
MARINE, COASTAL ECOSYSTEMS AND FISHERIES
A global reduction in fish biomass is projected to cause
a 20% decline in (maximum sustainable) fish catches
by 2100 in RCP8.5. These changes could be 3-4 times
smaller in RCP2.6. Regionally, fish biomass will increase
at high latitudes allowing for fishing expansion pole-
ward, while tropical fisheries decline. These changes in
fish stocks could lead to conflicts among fisheries, au-
thorities and/or communities.
Seafood safety is also at stake, with increased accu-
mulation of persistent organic pollutants and mercury
in marine plants and animals. The risks are higher for
coastal Indigenous communities that consume a lot of
seafood.

HUMAN ACTIONMITIGATION
ADAPTATION
FEEDBACKS
PhysicalBiogeochemicalChanges
PhysicalEcologicalChanges
HumanSystemsChanges
ForcingIMPACTS
FIGURE 19 Cascading effects. We can include a concrete example: GHG emissions rise → global warming → ocean temperature increases → abundance of primary producers decreases→ fish stocks move poleward → arctic communities catch less fish → impacts on health and livelihoodsAdapted from an infographic by IPCC, 2019 – https://www.ipcc.ch/srocc/chapter/chapter-1-framing-and-context-of-the-report/1-3time-scales-thresholds-and-detection-of-ocean-and-cryosphere-change/ipcc-srocc-ch_1_1-e1574938357439/
26 | OFFICE FOR CLIMATE EDUCATION IPCC SPeCIal RePoRT on The oCean and CRyoSPheRe In a ChangIng ClImaTe — SummaRy foR TeaCheRS
Changes in marine ecosystems will lead to cultural
losses, including local and indigenous knowledge. Tra-
ditional diets and food security will be negatively affect-
ed, along with recreational activities.
Each centimetre rise in local sea levels will increase
erosion, land loss, flooding, salinization, and inten-
sify the impacts of storm surges. Sea level will con-
tinue to rise throughout this century under both emis-
sions scenarios. Annual coastal flooding damages are
projected to increase by 2-3 orders of magnitude by
2100 compared to today, if no action is taken. Low-ly-
ing islands and coasts are most at risk, including some
urban deltas, tropical island nations and coastal Arctic
communities. Some island nations may become unin-
habitable, although the level of sea level rise at which
this will occur is extremely difficult to assess.
TO SUM UP
Shifts in fish distribution and abundance due to
climate change will affect income, livelihoods
and food security of fishing-dependent commu-
nities. Loss and degradation of marine ecosys-
tems compromises the ocean’s contribution to
human identity and well-being. Finally, human
communities in low-lying areas will be at in-
creasing risk from sea level rise and storm surg-
es over the coming century.

27 | OFFICE FOR CLIMATE EDUCATION IPCC SPeCIal RePoRT on The oCean and CRyoSPheRe In a ChangIng ClImaTe — SummaRy foR TeaCheRS
ChallengesThere is a broad range of challenges for adaptation to
climate change. Human interventions can be monetary,
technological or institutional. The challenges to adapt-
ing ecosystems is that they require space; recovery
rates following disturbances are slow, and they are put
under pressure by human activities. A key challenge is
the time scale: the impacts of climate change occur
over time horizons which are longer than those in
which decisions are typically made in government,
business and elsewhere. Climate impacts also cross
societal industries (e.g. water, food, energy) and national
boundaries, requiring integrated international responses.
EARTH’S CLIMATE
HUMANS & ECOSYSTEMS
CO2
Our greenhousegas emissions
Exposure &vulnerability
Strongergreenhouse effect
Feedbacks Internal variations
Changes in the climate system
Risks
Impacts
ADAPTATIONMITIGATION
FIGURE 20 Flow diagram from human greenhouse gas emissions to the impacts of climate change and the possible solutions (miti-gation and adaptation).
4. Implementing responses to ocean and cryosphere change

28 | OFFICE FOR CLIMATE EDUCATION IPCC SPeCIal RePoRT on The oCean and CRyoSPheRe In a ChangIng ClImaTe — SummaRy foR TeaCheRS
For both human society and ecosystems, the faster
and higher the rate of change, the less able they will
be to adapt. Ecosystems will be able to more readily
adapt to slower and smaller changes. Similarly, more
adaptation options will be possible for human society at
lower levels of global warming.
Exposure and susceptibility to climate change, and
ability to cope with the changes, are far from uniform
across species, ecosystems, nations and communities.
For human society, the most exposed and vulnerable
people are also often those with the lowest capacity
to adapt (they become even more exposed and more
vulnerable) — for instance, poor people living in the low-
est-lying areas of a coastal megacity.
Even after making major efforts to adapt, certain risks
may still remain. These irreducible risks are known as
“limits to adaptation”. An example is unavoidable
flooding and inundation of low-lying coastal areas, lead-
ing to coastal retreat.
TO SUM UP
Impacts of climate-related changes on the
ocean and cryosphere challenge current mech-
anisms and capacities for both humans and
ecosystems to respond, in some cases pushing
them to their limits. People who are the most
exposed and vulnerable to climate change are
often those with the lowest capacity to adapt.
Strengthening responsesADAPTATION
Protection, restoration and reduction of additional
stressors, such as pollution, can help ecosystems
adapt. Establishing networks of protected areas can fa-
cilitate uphill migration of species and poleward move-
ment of marine species. Species can also be assisted
with their relocation. In some places, experiments with
ecosystem reconstruction are carried out – “coral gar-
dening” is one example, although these measures may
fail to be effective when confronted with further warm-
ing and sea level rise. These strategies work best when
local communities and their knowledge are taken into
account.
Concerning fishery catches, rebuilding overexploited
stocks and management that regularly assesses and
updates measures can reduce risks. For water resourc-
es, integrated management across uses (energy, agri-
culture, drinking water etc.) can be effective, including
the development and optimization of storage. In both
cases, cooperation across boundaries (e.g., between
countries) can assist management efforts.
Measures to combat sea level rise range from building
dikes and seawalls (which can be costly), to restor-
ing coastal ecosystems (like mangroves) in order
to reduce incoming wave energy, to retreating from

29 | OFFICE FOR CLIMATE EDUCATION IPCC SPeCIal RePoRT on The oCean and CRyoSPheRe In a ChangIng ClImaTe — SummaRy foR TeaCheRS
coastal areas. At a global scale, coastal protection can
reduce flood risk by 2-3 orders of magnitude during the
21st century, but large investments are required. The
higher the sea level rises, the greater the coastal protec-
tion challenge will be, mainly due to financial and social
limits rather than due to technical limits.
Despite the vast uncertainties about how much the sea
level will rise after 2050, many decisions which will
have an influence this far into the future are being
made now. As such, an iterative approach is necessary,
in which the latest science, current adaptation plans
and implemented adaptation strategies are periodically
assessed and altered as needed.
A slower rate of sea level rise, or any other conse-
quence of climate change, provides greater adap-
tation opportunities, hence the need to also reduce
greenhouse gas emissions (discussed in the next sec-
tion) in addition to adaptation.
TO SUM UP
Adaptation to sea level rise will be a worldwide
problem for coastal communities. Reducing lo-
cal drivers of exposure and vulnerability, imple-
menting early-warning systems, flood-proofing
buildings and ecosystem-based adaptation are
effective responses in the coming decades that
may, at least in the short-term, limit the need for
more costly measures that cannot be afforded
by resource-limited communities.
CLASS ACTIVITY # ACTIVITY
— Imagine the whole class lives in a seaside village. Each
student has a different role in this community (example:
the fisherman, the summer tourist, a random inhabitant,
the grocery store owner, the civil engineer, the town
governor, the bank owner, the surf teacher, the maritime
police, the chairperson of the animal protection associa-
tion, the beach bar owner, etc.).
Due to sea level rise and other factors, the local beach is
getting smaller by a metre every year, and during the big-
gest storms the streets and buildings closest to the beach
are frequently flooded.
— Let the students discuss the pros and cons of multiple
possible solutions for their community from the point of
view of their character, and come to the realisation that
there is no simple answer.
Answer: Different characters have different priorities,
and no solution is perfect and will always favour some
and disadvantage others. Options could include delo-
calising the entire community further inland, building
coastal protection structures, beach nourishment, re-
storing coastal local ecosystems, do nothing, etc.
Issues might be: costs, unequal profit, tourism impacts
(landscape changes, beach disappearance), livelihood
impacts (loss of jobs, structure damage), impacts on
local biodiversity, etc.

30 | OFFICE FOR CLIMATE EDUCATION IPCC SPeCIal RePoRT on The oCean and CRyoSPheRe In a ChangIng ClImaTe — SummaRy foR TeaCheRS
MITIGATION
Certain types of coastal ecosystems are effective carbon
sinks, so restoring them can help draw down CO2 from
the atmosphere. These carbon sinks include mangrove
forests, tidal marshes and seagrass meadows, and are
known as “blue carbon” ecosystems. Although their
potential contribution to emissions reductions would be
small in global terms — around 0.5% of current global
emissions — they bring many additional local benefits,
such as providing storm protection, better water quality,
and benefits to biodiversity and fisheries.
Ocean renewable energy can also support climate
change mitigation, and can comprise energy production
with offshore winds, tides, waves, thermal and salinity
gradients and algal biofuels. The emerging demand for
alternative energy sources is expected to generate new
economic opportunities.
TO SUM UP
Ecosystem-based adaptation and mitigation
can help strengthen future response options to
climate-related ocean and cryosphere changes.
Ecosystem-based adaptation will be effective
only under the lowest levels of warming but can
provide multiple short-term benefits to ecosys-
tems and local communities.
CLASS ACTIVITY # QUESTION
CO2 is emitted when fossil fuels are burned.
— Think about a simple experiment to demonstrate how
combustion releases CO2.
— How can we reduce our CO2 emissions? How can we
reduce other greenhouse gas emissions like methane
(CH4) and nitrous oxide (N2O)?
Key words: biogas production, deforestation, fertilisers, ag-
riculture, renewable energy, energy saving.
ENABLING RESPONSES
Enabling appropriate responses will be key to tackling
the impacts of climate change. This critically depends
on “rapid” and ambitious emissions reductions,
alongside major efforts in adaptation. Adaptation works
best when an integrated, cooperative approach is tak-
en. In addition, different timescales need to be account-
ed for both short and long-term; this is particularly true
for sea level rise.
Cooperation is needed across spatial scales and
sectors, and within and between countries – for in-
stance, through treaties and conventions. Communi-
ty-led responses, including experimental approaches,
should also be encouraged, with the knowledge gained
subsequently shared with similar communities.
In addition to good management, other essential ele-
ments for effective adaptation include:
— education and climate literacy, which can build
public awareness, engagement and skill sets;
— using and sharing data, information and knowledge
(including local and indigenous knowledge);
— monitoring and forecasting; early warning sys-
tems, such as those used today for El Niño/La Niña
events, tropical cyclones and marine heatwaves, can
be used to manage negative impacts;
— addressing social vulnerabilities and equity to
build a fair and just future.
Of course, funding resources will be key to making all
this happen.
TO SUM UP
Rapid transformative change is needed across
nations and societies in order to tackle climate
change. Key elements that can facilitate effec-
tive adaptation include cooperation, education,
monitoring and forecasting, data sharing and
addressing inequities.

31 | OFFICE FOR CLIMATE EDUCATION IPCC SPeCIal RePoRT on The oCean and CRyoSPheRe In a ChangIng ClImaTe — SummaRy foR TeaCheRS
The ocean and cryosphere play a major role in the Earth’s
climate system. The ocean absorbs and redistributes
CO2 and heat, it supplies us with food, renewable energy
and raw materials, and provides us with transport facil-
ities. The cryosphere, in the form of glacier melt water,
supplies us with fresh water. Both the ocean and cry-
osphere are fundamentally important to our health and
well-being, for recreation and our cultural values.
Climate-change-induced disturbances in the ocean and
cryosphere have strong impacts on human communities
– particularly on those living near the coast, on small is-
lands, in polar areas or in high mountain regions. Today,
around 4 million people live permanently in the Arctic re-
gion, of whom 10% are indigenous; 680 million people
live near the coast and 670 million people live in high
mountain regions. The changes will continue throughout
the decades and the millennia – some occurring abruptly
and (others) being irreversible.
By preserving the ocean and cryosphere and their eco-
systems – through ambitious mitigation and effective
adaption – we can also achieve several of the Sustain-
able Development Goals (SDGs) adopted by the United
Nations. Conversely, if we wait before taking action, the
risks of climate change impacts will increase, and so will
the costs of mitigation and adaptation.
As the original Summary for Policymakers of the report
concludes:
“Realising this potential depends on transformative
change. This highlights the urgency of prioritising timely,
ambitious, coordinated and enduring action.”
CLASS ACTIVITY # ACTIVITY
— Do you know what a haiku is?
Answer: A haiku is a Japanese poem, which uses 17 syl-
lables arranged in three lines in specific order. On the first
line, you have 5 syllables, on the second line 7 and on the
third one 5. Here are some examples of haiku:
http://climate.miami.edu/your-haiku-to-the-environment/
— Write some haikus on the topic of climate change, the
ocean and cryosphere.
Conclusion
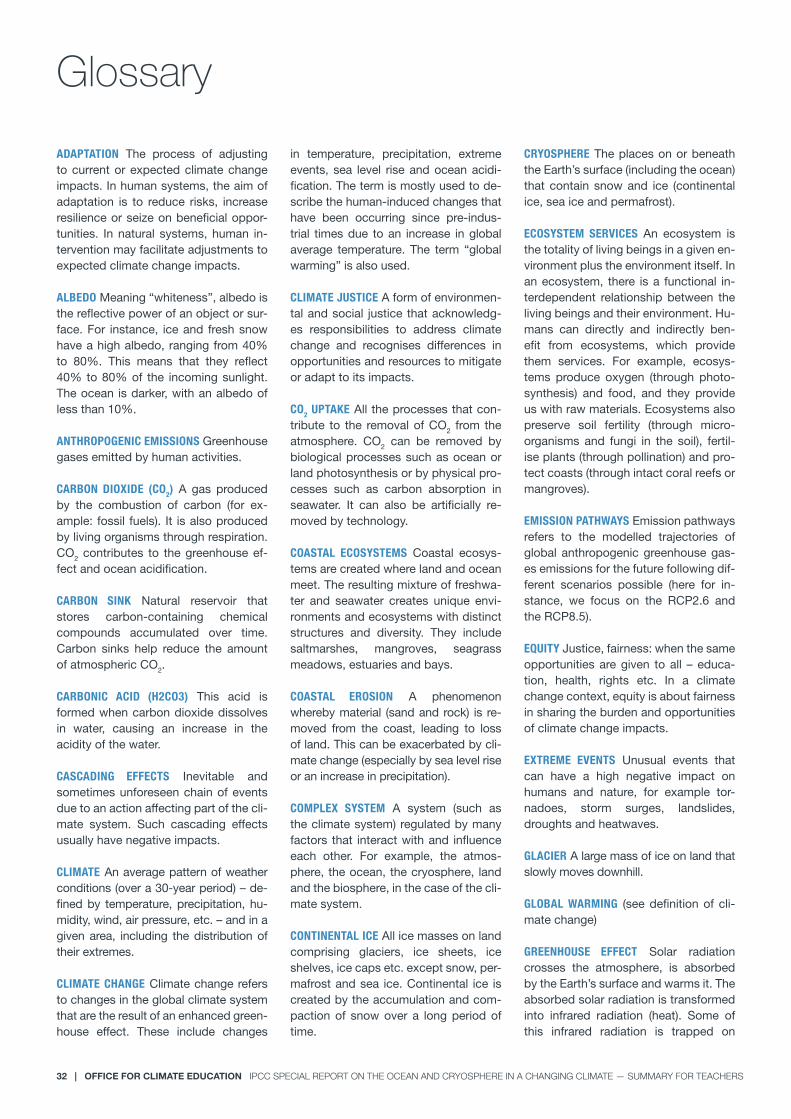
32 | OFFICE FOR CLIMATE EDUCATION IPCC SPeCIal RePoRT on The oCean and CRyoSPheRe In a ChangIng ClImaTe — SummaRy foR TeaCheRS
ADAPTATION The process of adjusting to current or expected climate change impacts. In human systems, the aim of adaptation is to reduce risks, increase resilience or seize on beneficial oppor-tunities. In natural systems, human in-tervention may facilitate adjustments to expected climate change impacts.
ALBEDO Meaning “whiteness”, albedo is the reflective power of an object or sur-face. For instance, ice and fresh snow have a high albedo, ranging from 40% to 80%. This means that they reflect 40% to 80% of the incoming sunlight. The ocean is darker, with an albedo of less than 10%.
ANTHROPOGENIC EMISSIONS Greenhouse gases emitted by human activities.
CARBON DIOXIDE (CO2) A gas produced by the combustion of carbon (for ex-ample: fossil fuels). It is also produced by living organisms through respiration. CO2 contributes to the greenhouse ef-fect and ocean acidification.
CARBON SINK Natural reservoir that stores carbon-containing chemical compounds accumulated over time. Carbon sinks help reduce the amount of atmospheric CO2.
CARBONIC ACID (H2CO3) This acid is formed when carbon dioxide dissolves in water, causing an increase in the acidity of the water.
CASCADING EFFECTS Inevitable and sometimes unforeseen chain of events due to an action affecting part of the cli-mate system. Such cascading effects usually have negative impacts.
CLIMATE An average pattern of weather conditions (over a 30-year period) – de-fined by temperature, precipitation, hu-midity, wind, air pressure, etc. – and in a given area, including the distribution of their extremes.
CLIMATE CHANGE Climate change refers to changes in the global climate system that are the result of an enhanced green-house effect. These include changes
in temperature, precipitation, extreme events, sea level rise and ocean acidi-fication. The term is mostly used to de-scribe the human-induced changes that have been occurring since pre-indus-trial times due to an increase in global average temperature. The term “global warming” is also used.
CLIMATE JUSTICE A form of environmen-tal and social justice that acknowledg-es responsibilities to address climate change and recognises differences in opportunities and resources to mitigate or adapt to its impacts.
CO2 UPTAKE All the processes that con-tribute to the removal of CO2 from the atmosphere. CO2 can be removed by biological processes such as ocean or land photosynthesis or by physical pro-cesses such as carbon absorption in seawater. It can also be artificially re-moved by technology.
COASTAL ECOSYSTEMS Coastal ecosys-tems are created where land and ocean meet. The resulting mixture of freshwa-ter and seawater creates unique envi-ronments and ecosystems with distinct structures and diversity. They include saltmarshes, mangroves, seagrass meadows, estuaries and bays.
COASTAL EROSION A phenomenon whereby material (sand and rock) is re-moved from the coast, leading to loss of land. This can be exacerbated by cli-mate change (especially by sea level rise or an increase in precipitation).
COMPLEX SYSTEM A system (such as the climate system) regulated by many factors that interact with and influence each other. For example, the atmos-phere, the ocean, the cryosphere, land and the biosphere, in the case of the cli-mate system.
CONTINENTAL ICE All ice masses on land comprising glaciers, ice sheets, ice shelves, ice caps etc. except snow, per-mafrost and sea ice. Continental ice is created by the accumulation and com-paction of snow over a long period of time.
CRYOSPHERE The places on or beneath the Earth’s surface (including the ocean) that contain snow and ice (continental ice, sea ice and permafrost).
ECOSYSTEM SERVICES An ecosystem is the totality of living beings in a given en-vironment plus the environment itself. In an ecosystem, there is a functional in-terdependent relationship between the living beings and their environment. Hu-mans can directly and indirectly ben-efit from ecosystems, which provide them services. For example, ecosys-tems produce oxygen (through photo-synthesis) and food, and they provide us with raw materials. Ecosystems also preserve soil fertility (through micro-organisms and fungi in the soil), fertil-ise plants (through pollination) and pro-tect coasts (through intact coral reefs or mangroves).
EMISSION PATHWAYS Emission pathways refers to the modelled trajectories of global anthropogenic greenhouse gas-es emissions for the future following dif-ferent scenarios possible (here for in-stance, we focus on the RCP2.6 and the RCP8.5).
EQUITY Justice, fairness: when the same opportunities are given to all – educa-tion, health, rights etc. In a climate change context, equity is about fairness in sharing the burden and opportunities of climate change impacts.
EXTREME EVENTS Unusual events that can have a high negative impact on humans and nature, for example tor-nadoes, storm surges, landslides, droughts and heatwaves.
GLACIER A large mass of ice on land that slowly moves downhill.
GLOBAL WARMING (see definition of cli-mate change)
GREENHOUSE EFFECT Solar radiation crosses the atmosphere, is absorbed by the Earth’s surface and warms it. The absorbed solar radiation is transformed into infrared radiation (heat). Some of this infrared radiation is trapped on
Glossary

33 | OFFICE FOR CLIMATE EDUCATION IPCC SPeCIal RePoRT on The oCean and CRyoSPheRe In a ChangIng ClImaTe — SummaRy foR TeaCheRS
its escape towards space by green-house gases in the atmosphere and is sent back towards the Earth’s surface – heating it up even more. This is called the greenhouse effect.
GREENHOUSE GAS Greenhouse gases cause the greenhouse effect. They in-clude water vapour, carbon dioxide, methane, nitrous oxide and ozone.
HEATWAVE A period of abnormally hot weather with high daytime tempera-tures and no or little cooling down at night. A heatwave can last up to sev-eral weeks.
ICE SHEET A very large and thick layer of ice on a continent.
INDUSTRIAL REVOLUTION Historical pe-riod between 1760 and the 1840s. It marks the transition from agricultural to industrial societies. The Industrial Rev-olution started in Europe and the United States and led to rapid development in productivity, technologies and science, and to population growth.
INFRARED RADIATION Infrared radiation is the invisible part of light we can feel as heat. It plays a key role in the green-house effect.
INVASIVE SPECIES Species that is not na-tive to a specific location and have the tendency to spread to a degree that can cause damage to the environment, hu-man economy or human health. Many factors can favour the spreading of in-vasive species such as the increase of the intensity of global commercial flows.
MARINE CURRENTS A flow of water through the ocean. Warm and cold cur-rents redistribute heat around the globe.
MARINE HEATWAVE Period of time of 5 days minimum when seawater temper-ature exceed a seasonally based max-imum temperature (with an exceeding average of minimum 2°C).
MITIGATION Human intervention to re-duce global warming by reducing greenhouse gas emissions or enhanc-ing greenhouse gas sinks.
NATURAL VARIABILITY Variations in the climate system that are not related to human activities (for example, El Niño
or alternation of glacial and interglaci-al eras).
OCEAN ACIDIFICATION Increase in the acidity of seawater, caused by CO
2 from the atmosphere dissolving in the ocean’s surface water. When CO2 re-acts with water, the water becomes more acidic.
PERMAFROST Soil, rock or sediment that is permanently frozen (for at least two consecutive years).
pH pH is a measure of acidity and alkalin-ity of a solution on a scale in which 7 rep-resents neutrality. A lower value indicates a more acidic solution whereas a higher value indicates a more alkaline solution.
PRIMARY PRODUCTION Primary produc-tion is the process by which primary producers, such as phytoplankton and kelp, produce organic matter from inor-ganic materials through photosynthesis.
RUNOFF The draining away of water or snow from the surface of an area of land, a building or a structure.
SEA ICE Frozen seawater that floats on the ocean’s surface.
SEA LEVEL RISE Rise of sea level caused by the impact of climate change, such as melting of ice sheets and thermal ex-pansion of the oceans.
SEA SURFACE TEMPERATURE The aver-age water temperature at a depth range from 1mm to 20 meters, according to the type of measurement.
STORM SURGE Local rising of the sea as a result of wind and atmospheric pres-sure changes due to a storm.
STRATIFICATION Layers of seawater masses with different properties: they vary in salinity, oxygenation, density and/or temperature. As a result, water in the ocean will not mix, leading to anoxia and lack of nutrients (the water is depleted in O2 and/or in nutrients, which has conse-quences on the marine wildlife).
SUSTAINABLE DEVELOPMENT Develop-ment that meets the needs of the pres-ent generations without compromising the ability of future generations to meet their own needs.
SUSTAINABLE DEVELOPMENT GOALS (SDGs) Universal calls to action to end global poverty, protect the planet and ensure that all people enjoy peace and prosperity by 2030. There are 17 dif-ferent Sustainable development goals, which were adopted by all United Na-tions Member States in 2015: (1) no poverty, (2) zero hunger, (3) good health and well-being, (4) quality education, (5) gender quality, (6) clean water and san-itation, (7) affordable and clean energy, (8) decent work and economic growth, (9) industry, innovation and infrastruc-ture, (10) reduced inequalities, (11) sus-tainable cities and communities, (12) re-sponsible consumption and production, (13) climate action, (14) life below water, (15) life on land, (16) peace, justice and strong institutions and (17) partnerships for the goals.
THERMAL EXPANSION An increase in vol-ume as a result of rising temperature. With regard to climate change: when the ocean gets warmer, it expands and occupies more space.
THERMAL INERTIA A property of matter characterising the speed with which it approaches the temperature of its sur-roundings. The slower it does this, the higher the thermal inertia.
TIPPING POINT The point at which a se-ries of small changes or incidents be-comes significant enough to cause a larger, more important change.
TRANSFORMATION Adaptation that changes the fundamental attributes of a system in response to climate and its effects.
VULNERABILITY Sensitivity of a popula-tion, a building etc. when exposed to climate change hazards.
WEATHER The state of the atmosphere at a particular time and place. To define it, many variables such as temperature, precipitation, cloudiness or wind are taken into account.

34 | OFFICE FOR CLIMATE EDUCATION IPCC SPeCIal RePoRT on The oCean and CRyoSPheRe In a ChangIng ClImaTe — SummaRy foR TeaCheRS
SCIENTIFIC DOCUMENTATION ON THE OCEAN, THE CRYOSPHERE AND THE CLIMATE IPCC Special Report The Ocean and Cryosphere in a Changing Climatewww.ipcc.ch/srocc
NASA – Global Climate Change: Graphics and multimedia
https://climate.nasa.gov/resources/graphics-and-multimedia/
National Snow and Ice Data Center: Satellite images and data showing Arctic – and Antarctic – wide changes in sea ice
https://nsidc.org/data/seaice_index/
Ocean and Climate platform
www.ocean-climate.org/?page_id=4534
UNESCO – Ocean Literacy
https://oceanliteracy.unesco.org
OCE EDUCATIONAL RESOURCESCLIM – Educational videos about the ocean and cryosphere in a changing climate
www.youtube.com/channel/UCFWnXg29G9npeWgFEaaao5w
IPCC summaries for teachers
www.oce.global/en/resources/ipcc-summaries-teachers
Professional development resources for teachers
— The greenhouse effect: www.oce.global/en/resources/professional-development/greenhouse-effect
— Ocean and climate change: www.oce.global/en/resources/professional-development/ocean-and-climate-change
The climate in our hands – Ocean and Cryosphere
www.oce.global/en/resources/class-activities/climate-our-hands-ocean-and-cryosphere
Bibliography

35 | OFFICE FOR CLIMATE EDUCATION IPCC SPeCIal RePoRT on The oCean and CRyoSPheRe In a ChangIng ClImaTe — SummaRy foR TeaCheRS
OTHER EDUCATIONAL RESOURCESDublin City University, Institute of Education: Trocaire and the Centre for Human Rights and Citizenship Education – “Creating Futures”
resources produced in the scope of the “Education for a Just World Initiative”
www.trocaire.org/getinvolved/education/creating-futures
Eco-schools – Stories and news about sustainability projects conducted in schools
www.ecoschools.global/stories-news
La main a la pate – The Ocean, my planet and me: A teaching unit for primary school and lower secondary school classrooms
www.fondation-lamap.org/en/20322/the-ocean-my-planet-and-me
NASA Climate Kids
https://climatekids.nasa.gov
National Oceanic and Atmospheric Administration – Teaching climate, fact sheets, lesson plans, case studies, etc.
https://oceanservice.noaa.gov/education/pd/climate/welcome.html
The Sandwatch Foundation – A network of children, youth and adults working together to enhance their beach environment and build
resilience to climate change
www.sandwatchfoundation.org
TROPICSU – Resources for high-school teachers
https://tropicsu.org/un-resources/
INTERACTIVE SIMULATIONSEn-ROADS – Simulation used to understand how we can achieve our climate goals (high school)
https://www.climateinteractive.org/tools/en-roads/
University of Colorado – Simulation of the greenhouse effect (high school)
https://phet.colorado.edu/en/simulation/greenhouse
University of Manchester – Build your own Earth (high school)
http://www.buildyourownearth.com

Working Group I - The Physical Science Basis
Under the auspices ofUNESCO
United NationsEducational, Scientific and
Cultural Organization
Commissioned in 2018 by the La main à la pâte foundation and the climate science community, the Office for Climate Education (OCE) promotes climate change education and associated teacher support worldwide. The OCE has been a centre under the auspices of UNESCO since 2020.
UNDER THE AUSPICES OF
FOUNDING MEMBERS
IN PARTNERSHIP WITH
“Parties should take measures [...] to
enhance climate education”, states
Art.12 of the Paris Agreement.
“Educating the present and future
generations about climate change,
and teaching them to act with a
critical mind and a hopeful heart, is
essential for the future of humanity.
Science education must meet the
challenge [...]”, recommend the 113
science academies of the world in
their recent Statement on Climate
Change and Education.
Replying to these urgent calls, cli-
mate scientists and educators es-
tablished an Office for Climate
Education. Teachers are key for
implementing these recommen-
dations, especially in primary and
secondary schools. Hence, the of-
fice produces for them educational
resources, based on active pedago-
gies, such as inquiry-based science
education and project-based learn-
ing. As IPCC produces “assess-
ment reports” and “summaries for
policymakers”, the Office produces
“resources and tools for teachers”,
focusing on the issues of adapta-
tion and attenuation. It pays special
attention to developing countries.
Working closely with climate scien-
tists, involving social scientists and
educators, the Office for Climate
Education has an executive sec-
retariat in Paris and a global net-
work of local or regional partners
in over 20 countries already. The
teaching resources are conceived
in a global frame, then are locally
tested and adapted to particular
situations. The numerous initiatives
already taken in the same direction
are documented and publicised by
the Office.
The Office for Climate Education
was launched in 2018 with the
support of public and private funds
provided by French and German
partners. It amplifies its action in
proportion with its resources and
develops partnerships, especially
with IPCC and IAP for Science –
the global federation of science
academies.
http://oce.global
Office for Climate Education
Institut Pierre-Simon Laplace,
Case 101
4, place Jussieu
75252 Paris Cedex 05 – France