the state of hospitality distribution: metasearch · meanwhile, trivago announced a partnership...
TRANSCRIPT

THE STATE OF HOSPITALITY DISTRIBUTION: METASEARCH
www.eyefortravel.com 1
THE STATE OF HOSPITALITY
DISTRIBUTION: METASEARCH
A report series between EyeforTravel and Fornova
The information and opinions in this report were prepared by EyeforTravel Ltd and its partners. EyeforTravel Ltd has no obligation to tell you when opinions or information in this report change. EyeforTravel Ltd makes every effort to use reliable, comprehensive information, but we make no representation that it is accurate or complete. In no event shall EyeforTravel Ltd and its partners be liable for any damages, losses, expenses, loss of data, loss of opportunity or profit caused by the use of the material or contents of this report. No part of this document may be distributed, resold, copied or adapted without EyeforTravel’s prior written permission. © EyeforTravel Ltd ® 2018
Authors: Kerry Medina
Alex Hadwick Head of Research, EyeforTravel
THE STATE OF HOSPITALITY DISTRIBUTION: METASEARCH
www.eyefortravel.com 2
ABOUT
AB
OU
T
We bring together everyone in the travel industry, from small tech start-ups to international hotel brands, to form a community working towards a smarter and more connected travel industry.
Our mission is to be the place our industry goes to share knowledge and data so that travel and tech brands can work collaboratively to create the perfect experience for the modern traveler.
We do this through our network of global events, our digital content, and our knowledge hub - EyeforTravel On Demand.
Our Values
We aim to enable the above by valuing impartiality, independent thought, openness and cooperation. We hope that these qualities allow us to foster dialogue, guide business decisions, build partnerships and conduct thorough research directly with the industry.
These principles have guided us since 1997 and will continue to keep us at the forefront of the industry as a vibrant travel community for many more years to come.
Our Services
Our events are at the heart of EyeforTravel. These draw in experts from every part of the travel industry to give thought-provoking presentations and engage in discussions. It is our aim that every attendee takes back something new that can help their business to improve. This might be in the fields of consumer research, data insights, technological trends, or marketing and revenue management techniques.
Alongside this we provide our community with commentary, reports, white papers, webinars and other valuable expert-driven content. All of this can be accessed through one place – the On Demand subscription service.
We are always expanding the content we create, so please get in touch if you want to write an article for us, create a white paper or webinar, or feature in our podcast by emailing [email protected].
EyeforTravel by the Numbers
80,000+ database contacts
2,000+ annual event attendees
100,000+ monthly online reach
1,000+ online conference presentations
THE STATE OF HOSPITALITY DISTRIBUTION: METASEARCH
www.eyefortravel.com 3
CONTENTSAbout EyeforTravel ...............................................................................................................2 Our Values .........................................................................................................................2 Our Services .......................................................................................................................2 EyeforTravel in Numbers ...................................................................................................2
List of Figures ........................................................................................................................4
List of Tables ..........................................................................................................................4
Acknowledgements ..............................................................................................................5
An Introduction to Metasearch and the Key Players .........................................................6
1. The State of Play in Metasearch 2018 .............................................................................7 1.1. Metasearch & the Consumer .....................................................................................7 1.2. A Demographic and Pyschographic Look at Meta Users .........................................9 1.3. Meta’s Hotel Customer ............................................................................................11 1.3.1. Hotel Meta Usage by Geography ....................................................................12
2. How Can My Brand Control Its Metasearch Presence? ................................................14 2.1. Inventory Issues ........................................................................................................14 2.2. Rate Parity ................................................................................................................15 2.3. Loyalty and Customer Retention .............................................................................20
3. Working with, and Competing on, Meta ......................................................................21 3.1. CPC vs. CPA ...............................................................................................................21 3.2. Bidding on a Budget and Judging Value ................................................................21 3.3. Incorporating Google ..............................................................................................22 3.4. The Limits of Meta Spend ........................................................................................23 3.5. Evaluating Meta Success ..........................................................................................23
4. The Future of Meta .........................................................................................................24 4.1. Plateauing Financials: Potential Outcomes and Upshots .......................................24 4.2. Overlap Between OTAs and Meta Sites ..................................................................25 4.3. The Future of Hotels on Meta .................................................................................26 4.4. Conclusion ................................................................................................................26
About Fornova ....................................................................................................................27
Methodology .......................................................................................................................28
References ...........................................................................................................................29
CO
NT
EN
TS

THE STATE OF HOSPITALITY DISTRIBUTION: METASEARCH
www.eyefortravel.com 4
Figure 1: How Often Do Consumers Use Price Comparison Websites When Booking Accommodation? ....................................................................................................................7
Figure 2: Why Do Consumers Make Repeat Bookings with Travel Brands? ...............................8
Figure 3: How Often Do Consumers Use Price Comparison Websites When Booking Accommodation? (By Age) .......................................................................................................9
Figure 4: How Often Do Consumers Use Price Comparison Websites When Booking Accommodation? Business Travelers Versus Leisure Only Travelers ..........................................10
Figure 5: Percentage of Metasearch Shops Where Hotel Bids Are Present and Average Position of Hotel Bids, March 2018 to May 2018 ................................................................................11
Figure 6: Percentage of Metasearch Shops Where Hotel Bids Are Present on Google, HotelsCombined, trivago and TripAdvisor, March 2018 to May 2018......................................12
Figure 7: Tripadvisor.com Outgoing Links, Desktop, Apr 2017 - Mar 2018 .............................12
Figure 8: Percentage of Metasearch Shops Where Hotel Bids Are Present by Region, March to June 2018 ..............................................................................................................................13
Figure 9: Percentage of Metasearch Shops Where Hotels Are Present by Country of Origin for the Search, March to June 2018 ............................................................................................13
Figure 10: Average Bidder Numbers on Meta Sites, March to June 2018 ...............................14
Figure 11: Percentage of Metasearch Bids Where Hotels Were Undercut by OTAs, March to June 2018 ..............................................................................................................................15
Figure 12: Percentage of Metasearch Shops Where Hotels Were Undercut by Contracted OTAs for Lead Times Longer and Shorter than 14 Days, March to June 2018 ..................................16
Figure 13: Percentage of Metasearch Shops Where Hotels Were Undercut by Non-Contracted OTAs for Lead Times Longer and Shorter than 14 Days, March to June 2018 .........................17
Figure 14: Percentage of Metasearch Shops Where Contracted OTAs Lose to non-contracted OTAs, March to May 2018 .....................................................................................................18
Figure 15: Percentage of metasearch shops where hotels are Undercut by contracted OTAs by country ..................................................................................................................................18
Figure 16: Percentage of metasearch shops where hotels are Undercut by non-contracted OTAs by country ....................................................................................................................19
Figure 17: What Rewards Make Consumers Use Loyalty Programs Most? ..............................20
Table 1: Visits to TripAdvisor’s Top 10 Domains in May 2018 ....................................................8
Table 2: How Often Do Consumers Use Price Comparison Websites When Booking Accommodation? (By Age) .....................................................................................................10
Table 3: Metasearch Shops Data by Country ..........................................................................19
CO
NT
EN
TS
LIST OF FIGURES
LIST OF TABLES

THE STATE OF HOSPITALITY DISTRIBUTION: METASEARCH
www.eyefortravel.com 5
ACKNOWLEDGEMENTS
AB
OU
T
EyeforTravel would like to acknowledge, with great thanks, the contributions of our advisory panel of thought leaders and industry experts. Each individual named below provided insights and analysis to ensure the focus and quality of this report reflects the highest industry standards.
Leora Lanz | Lecturer | Boston University School of Hospitality Administration
Kathryn Barrett | Vice President, Revenue Management | Dream Hotel Group
Chatchai Pongprapat | Assistant Vice President – Revenue Management | Dusit International
Dori Stein | CEO | Fornova
Nir Dupler | Chief Revenue Officer | Fornova
Ujjwal Suri | Vice President, Distribution Solutions | Fornova
Jafar Alam | Senior Product Manager | Fornova
Einav Guez | Customer Success Manager | Fornova
Dr. Patrick Andrae |CEO and Co-Founder | HomeToGo
Sanchit Rege | Manager Distribution Strategy | Hyatt
Rhett Hirko | Global Vice President, Revenue Optimization | Preferred Hotels & Resorts
Joe Pettigrew | Director of Revenue Maximization, Europe Hotels | Starwood Capital
Jose Murta | Global Head of Hospitality | Trivago
Brian Schmidt | Vice President, Sales & Operations | TripAdvisor

THE STATE OF HOSPITALITY DISTRIBUTION: METASEARCH
www.eyefortravel.com 6
INTRODUCTIONTO METASEARCH AND THE KEY PLAYERS
INT
RO
DU
CT
ION
Metasearch engines are among the newest, most complex, and rapidly evolving distribution channels that the hotel industry currently has at its disposal. After claiming its stake in the distribution mix a number of years ago, meta continues to evolve and mature with the hallmark rapidity of technology development – and investment.
Many have stood up and taken notice of its growing role in trip planning, with a host of acquisitions and intense investment in the platforms in recent years underlining how important major players see meta. Virtually all of the larger Online Travel Agencies (OTAs) have made investments in meta brands and their technology platforms since 2016, illustrating how it has become integral to their growth plans.
Following 2017’s USD550 million acquisition of European travel meta engine the Momondo Group, including its Cheapflights brand, the former Priceline Group Inc., now Booking Holdings, agreed to acquire Sydney-headquartered metasearch site HotelsCombined for an undisclosed sum in July 2018. The Australia-based brand is likely to be rolled into the travel behemoth’s KAYAK portfolio, in a similar manner to Momondo Group and Cheapflights. In turn, Booking Holdings’ meta brands, which also include SWOODOO, Checkfelix and Mundi, will have greater global reach extending across, Europe, North America and now Australasia.
KAYAK expanded its TopPlace insights and location scores in April to its hotel search, as well as those of Momondo and Mundi, the Brazilian travel meta site also acquired in 2017. It followed that up with the May launch of its KAYAK Trip Huddle tool, enabling groups to collaboratively plan a trip together.
After upping its game earlier this year by improving its mobile hotel search experience with enhanced booking capabilities, price filtering, amenity details and automated comparisons, Google, more recently bettered its hotel ads platform. In July, the search engine announced that later this year, hotel ads will become part of the Google Ads platform with a new campaign type. The change will allow management of hotel campaigns in a single platform, alongside advertisers’ other Google campaigns. A new Hotel Center, rolled out at the same time, aims to simplify the management of hotel price feeds and the company appeared to be experimenting with putting Hotel Ads above its usual top-listed paid ads in mid-2018.
TripAdvisor, too, expanded its offerings. In April, it added Sponsored Placements to its roster of advertising products available to hotels. Meanwhile, trivago announced a partnership with Silicon Valley startup platform Plug and Play.
Yet, despite their constant advancements and acquisitions, metasearch engines, at-heart, continue to function as customer-facing Global Distribution Systems (GDS). Some include the option of an internal booking engine and others – like a traditional GDS — simply redirect the travel buyer to vendors’ booking engines.
The simplicity of the concept has been attractive to the consumer (see Section 1.1 and 1.2 for more), and most sites have added to their offering with thousands of peer reviews and property-provided details. Travelers have been further empowered to make their own travel decisions via meta and have seen an explosion of choice.
Metasearch engines have evolved from being a practical tool for the consumer to plan with, to being able to book directly on them, and now they are addressing the inspiration phase as well.
For travel suppliers, direct bookings are augmented by the redirected traffic from meta at an acquisition cost considered to be less than that of an Online Travel Agent (OTA) booking. Furthermore, it allows ownership of the customer if they click through to brand domains.
However, like nearly all technological developments, metasearch has its downsides. Given the consumer’s desire to achieve the lowest price, it is a medium open to being manipulated by savvy players willing to undercut the competition. This makes parity extremely hard to maintain in the metasearch age and hotels are finding it hard to compete within the medium.
Therefore, this white paper from EyeforTravel and Fornova will investigate the effects of metasearch on the hospitality industry, the challenges its rise has created and how best to use the channel. This report is part of a series into the state of hospitality distribution and will be followed by reports into the direct and OTA channels.
www.eyefortravel.com 7
1. THE STATE OF PLAY IN METASEARCH 2018
1 | TH
E S
TA
TE
OF
PL
AY
IN M
ETA
SE
AR
CH
20
18
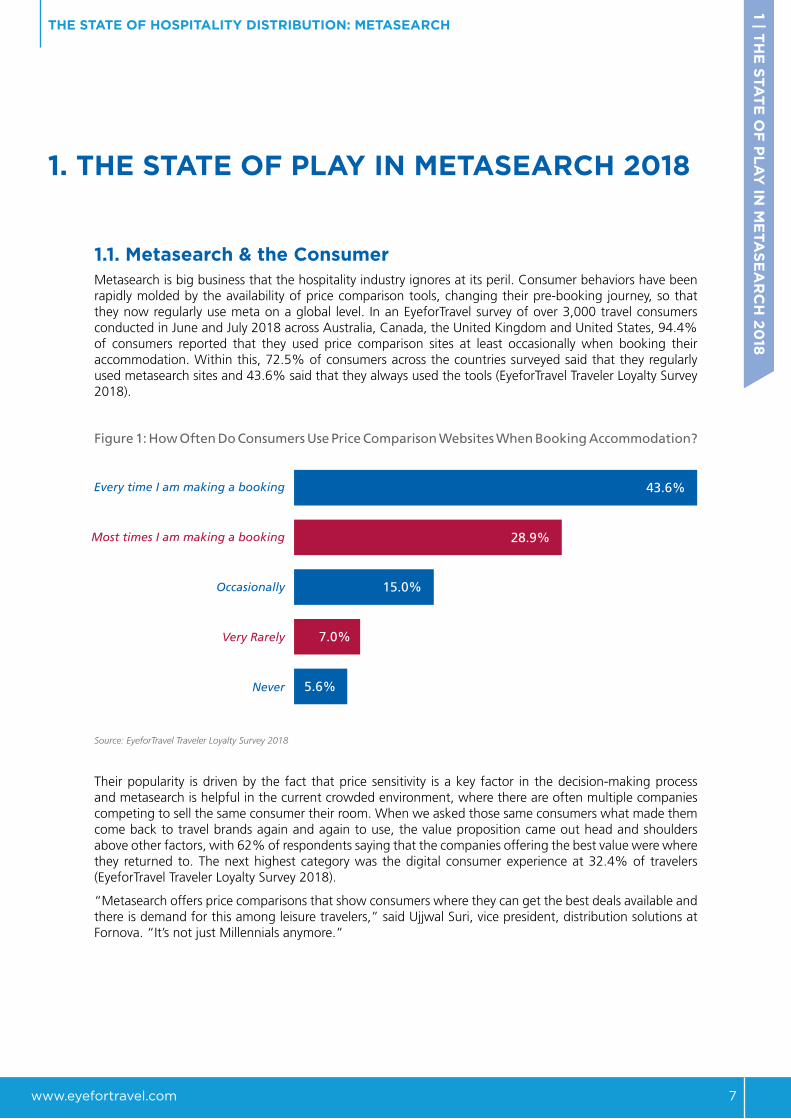
1.1. Metasearch & the Consumer Metasearch is big business that the hospitality industry ignores at its peril. Consumer behaviors have been rapidly molded by the availability of price comparison tools, changing their pre-booking journey, so that they now regularly use meta on a global level. In an EyeforTravel survey of over 3,000 travel consumers conducted in June and July 2018 across Australia, Canada, the United Kingdom and United States, 94.4% of consumers reported that they used price comparison sites at least occasionally when booking their accommodation. Within this, 72.5% of consumers across the countries surveyed said that they regularly used metasearch sites and 43.6% said that they always used the tools (EyeforTravel Traveler Loyalty Survey 2018).
Figure 1: How Often Do Consumers Use Price Comparison Websites When Booking Accommodation?
Source: EyeforTravel Traveler Loyalty Survey 2018
Their popularity is driven by the fact that price sensitivity is a key factor in the decision-making process and metasearch is helpful in the current crowded environment, where there are often multiple companies competing to sell the same consumer their room. When we asked those same consumers what made them come back to travel brands again and again to use, the value proposition came out head and shoulders above other factors, with 62% of respondents saying that the companies offering the best value were where they returned to. The next highest category was the digital consumer experience at 32.4% of travelers (EyeforTravel Traveler Loyalty Survey 2018).
“Metasearch offers price comparisons that show consumers where they can get the best deals available and there is demand for this among leisure travelers,” said Ujjwal Suri, vice president, distribution solutions at Fornova. “It’s not just Millennials anymore.”
THE STATE OF HOSPITALITY DISTRIBUTION: METASEARCH
Every time I am making a booking
Most times I am making a booking
Occasionally
Very Rarely
Never
43.6%
28.9%
15.0%
7.0%
5.6%

THE STATE OF HOSPITALITY DISTRIBUTION: METASEARCH
www.eyefortravel.com 8
Figure 2: Why Do Consumers Make Repeat Bookings with Travel Brands?
Source: EyeforTravel Traveler Loyalty Survey 2018
Figures from across the industry appear to support the idea that metasearch has become a key pillar of the travel research and purchase journey. An Oxford Economics study published in conjunction with TripAdvisor in May suggested that out of the global travel spend of over USD5.29 trillion in 2017, TripAdvisor influenced USD546 billion of that total in some form or another, or more than 433 million trips, including 65 million in the US alone (TripAdvisor, 2018).
Indeed, TripAdvisor is the most visited travel site globally. According to SimilarWeb data, just its top 10 domains alone by traffic generated over 412 million visits in May 2018. Given that TripAdvisor has more than 50 localized sites, it is safe to say that the final figure far exceeds even this prodigious total, and these 10 domains alone are only just shy of Booking.com’s entire presence. Booking.com had 443.5 million visitors in the same month as a single domain for its global operations (SimilarWeb, 2018a).
Looking beyond TripAdvisor, there are plenty of other healthy competitors claiming big numbers. Since the 2014 launch of Skyscanner Hotels, the platform has experienced 70% year-on-year growth. Trivago receives two billion visits annually. Global Head of Hospitality José Murta explained that the company’s 55 localized websites available in 33 languages “speaks volumes to how global the use of metasearch has become for finding the ideal hotel from across diverse booking sites.”
In a presentation to EyeforTravel London 2018, Cassian Sillins, Industry Head, Accommodations at KAYAK, said that they handled more than 2 billion search queries per year across their different metasearch domains.
These volumes are impossible to ignore and make metasearch one of the most powerful channels in the online travel space.
1 | TH
E S
TA
TE
OF
PL
AY
IN M
ETA
SE
AR
CH
20
18
Table 1: Visits to TripAdvisor’s Top 10 Domains in May 2018
May 2018 visits
TripAdvisor.com 175.72
TripAdvisor.co.uk 51.17
TripAdvisor.it 32.15
TripAdvisor.fr 26.49
TripAdvisor.ru 22.75
TripAdvisor.es 22.13
TripAdvisor.in 22.86
TripAdvisor.jp 25.7
TripAdvisor.de 17.85
TripAdvisor.com.br 15.57
Total 412.39
Source: SimilarWeb, 2018a
They offered the best value
62.0%
Their digital service is easy-to-use and make bookings with
32.4%
They have a lot of choice to select from
31.5%
They’re easy to reach when I need them
28.4%
They offer a good experience as I travel
27.1%
They look after their customers and I know I can get a refund 62.0%
22.2%

THE STATE OF HOSPITALITY DISTRIBUTION: METASEARCH
www.eyefortravel.com 9
1.2. A Demographic and Pyschographic Look at Meta UsersFor Preferred Hotels & Resorts, a collection of more than 700 independent properties across 85 countries, the 25-to-34 age group is the sweet spot for metasearch conversions, rendering the channel particularly valuable for the group, which has historically struggled to court Millennials. The company’s Global Vice President, Revenue Optimization, Rhett Hirko additionally noted that metasearch is also delivering more affinity groups and more business travelers for Preferred.
According to our results, Preferred is tapping into a global trend, with Millennials and business travelers some of the heaviest metasearch users.
Travelers between the ages of 18 and 35 in EyeforTravel’s Traveler Loyalty Survey 2018 are the age group most likely to report using price comparison tools every time they book accommodations at 46.4% of the demographic, while those ages 36 to 55 are just behind at 45%, whereas the oldest generation of over 55 years see a noticeably lower 36.8% reporting that they always use metasearch (EyeforTravel Traveler Loyalty Survey 2018; see Figure 3).
Business travelers also far outpace their leisure counterparts for meta use, at 47.4% comparing rooms every time they shop for a room, compared with 37.4% of those who have not made a business trip in the last 12 months. Some 30% of business travelers also report using meta ‘most times’ they book lodging, compared with 27.2% of leisure travel consumers (EyeforTravel Traveler Loyalty Survey 2018; see Figure 4).
Figure 3: How Often Do Consumers Use Price Comparison Websites When Booking Accommodation? (By Age)
Source: EyeforTravel Traveler Loyalty Survey 2018
1 | TH
E S
TA
TE
OF
PL
AY
IN M
ETA
SE
AR
CH
20
18
EverytimeIammakingabooking
MosttimesIammakingabooking
Occasionally Veryrarely Never0.0%
5.0%
10.0%
15.0%
20.0%
25.0%
30.0%
35.0%
40.0%
45.0%
50.0%
18-35
36-55 Over55
Every time I am making a booking
Most times I am making a booking
Occasionally
Very Rarely
Never
0% 10% 20% 30% 40% 50%
_______
• 18-35• 36-55• 55+_______

THE STATE OF HOSPITALITY DISTRIBUTION: METASEARCH
www.eyefortravel.com 10
Table 2: How Often Do Consumers Use Price Comparison Websites When Booking Accommodation? (By Age)
Every time I am
making a bookingMost times I am
making a bookingOccasionally Very rarely Never
18-35 46.4% 29.2% 15.1% 6.2% 3.1%
36-55 45.0% 29.6% 14.2% 6.7% 4.5%
Over 55 36.8% 27.3% 15.8% 8.8% 11.4%
Total 43.6% 28.9% 15.0% 7.0% 5.6%
Source: EyeforTravel Traveler Loyalty Survey 2018
Figure 4: How Often Do Consumers Use Price Comparison Websites When Booking Accommodation? Business Travelers Versus Leisure Only Travelers
Source: EyeforTravel Traveler Loyalty Survey 2018
While this data shows overall trends, Joe Pettigrew, director of revenue maximization for Starwood Capital’s Europe hotels warns that hotels need to look at their own performance on a granular level and not expect meta to deliver sudden changes in customer profiles. “You have to understand the data by each hotel and not make assumptions,” he said. So, luxury hotels that typically attract guests with high household incomes should not expect metasearch to deliver an entirely new set of budget-minded guests, nor are tropical resorts that are popular with families likely to convert with solo travelers who customarily stay at urban, boutique hotels.
1 | TH
E S
TA
TE
OF
PL
AY
IN M
ETA
SE
AR
CH
20
18
Every time I am making a booking
Most times I am making a booking
Occasionally
Very Rarely
Never
0% 10% 20% 30% 40% 50%
______________________
• Only Leisure Travelers• Business Travelers______________________

THE STATE OF HOSPITALITY DISTRIBUTION: METASEARCH
www.eyefortravel.com 11
1.3. Meta’s Hotel CustomerDefining an appropriate and successful meta strategy is also a commitment that each hotel or hotel brand must take on when incorporating this distribution channel into the mix. According to Fornova’s Suri, most major hotel brands, along with those in the luxury category, have already carved out winning game plans, especially as their mission to increase direct bookings over the past several years has gained momentum and meta sites have realized greater monetization by creating a more user-friendly buy-in for hotel partners. “But that’s only about the top 8%. For smaller chains and independent hotels, meta has helped increase visibility, but I don’t think it’s really helped the distribution mix,” he said.
According to Fornova data collected over the first half of 2018 and looking at nearly 10 million shops for hotel rooms, hotels are underrepresented on meta sites and frequently ranking low on these sites (for more on how the data was collected, see Methodology).
Overall, just 34% of bids monitored by Fornova featured a hotel bid for the period from March to June 2018 (Fornova Distribution Intelligence data, 2018).
Figure 5: Percentage of Metasearch Shops Where Hotel Bids Are Present and Average Position of Hotel Bids, March 2018 to May 2018
Source: Fornova Distribution Intelligence data, 2018
Across March, April, and May 2018, less than a third of the shops made by Fornova on meta sites had a direct hotel option being displayed. This rate reached a low of 18% in March 2018 and rose to a high of 28% of shops made in May. The latter was also the best month for the average position of hotels amongst those measured, but even here, the hotels’ bid came in at the sixth-ranked option on average across meta shops (Fornova Distribution Intelligence data, 2018).
The data shows that OTAs currently dominate the meta channels and that hotels need to put in place appropriate strategies and budgets for the meta channel, otherwise they risk creating a well of sunken investment without much to show for it. Smaller brands and independent properties are getting left behind or appear to have struck meta from their distribution mix after an initial attempt simply sowed confusion.
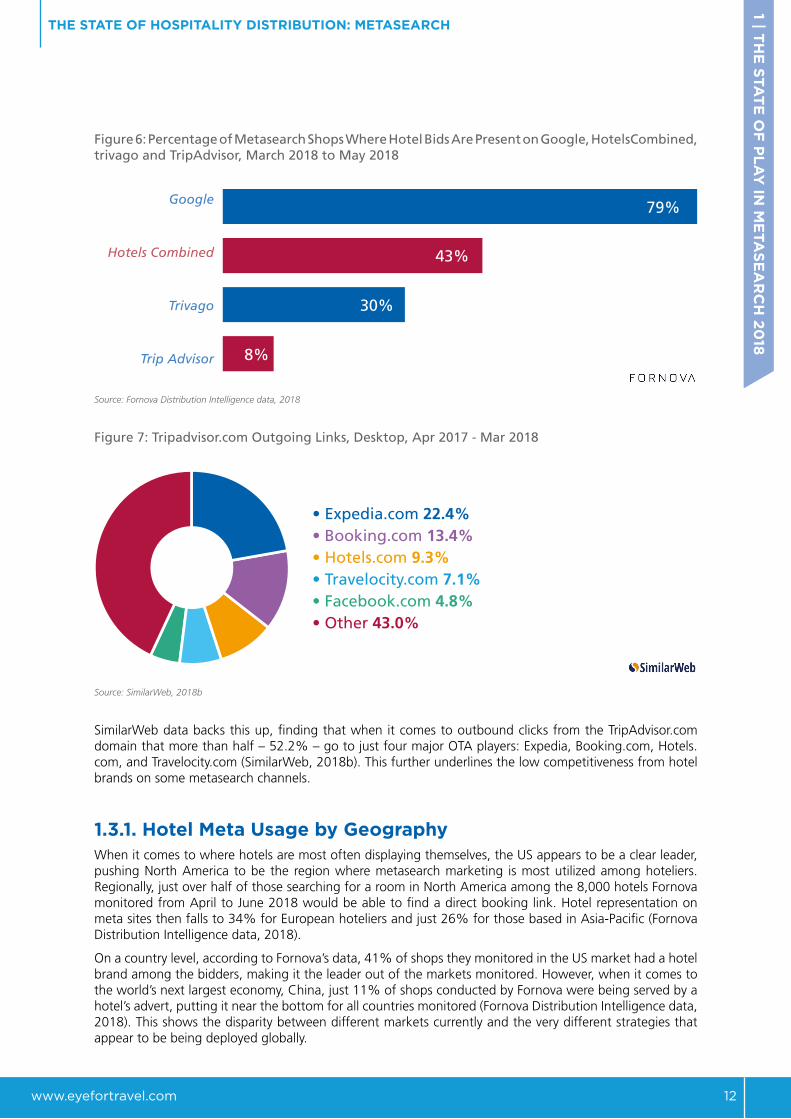
This is an issue as metasearch sites are no longer just a point for consumers to compare prices when they know which hotel they wish to stay at. Meta sites have added in more functionality and are being used earlier in the funnel, meaning they are hugely important spaces for brand awareness and new customers. As we noted earlier, TripAdvisor is the world’s largest travel site by visitors and, although something of a hybrid rather than just a pure metasearch site, it is a critical player for brands to use in the metasearch space. However, according to Fornova data, few consumers on the site are seeing hotel brand direct booking links, as there are very few direct bidders from the hotel brands. While 79% of shops made via Google had a hotel bidding directly on the service in the three months to May 2018, the same could only be said of just 8% of the TripAdvisor shops monitored by Fornova across the period. This is a big gulf that hotels need to address or face missing out on a lot of eyeballs hungry for hotel content (Fornova Distribution Intelligence data, 2018).
1 | TH
E S
TA
TE
OF
PL
AY
IN M
ETA
SE
AR
CH
20
18
30%
20%
10%
0%MARCH APRIL MAY
6
8
7
• Average Position of hotel bid on metasearch sites
• Percentage of metasearch shops with a hotel bid
THE STATE OF HOSPITALITY DISTRIBUTION: METASEARCH
www.eyefortravel.com 12
Figure 6: Percentage of Metasearch Shops Where Hotel Bids Are Present on Google, HotelsCombined, trivago and TripAdvisor, March 2018 to May 2018
Source: Fornova Distribution Intelligence data, 2018
Figure 7: Tripadvisor.com Outgoing Links, Desktop, Apr 2017 - Mar 2018
Source: SimilarWeb, 2018b
SimilarWeb data backs this up, finding that when it comes to outbound clicks from the TripAdvisor.com domain that more than half – 52.2% – go to just four major OTA players: Expedia, Booking.com, Hotels.com, and Travelocity.com (SimilarWeb, 2018b). This further underlines the low competitiveness from hotel brands on some metasearch channels.
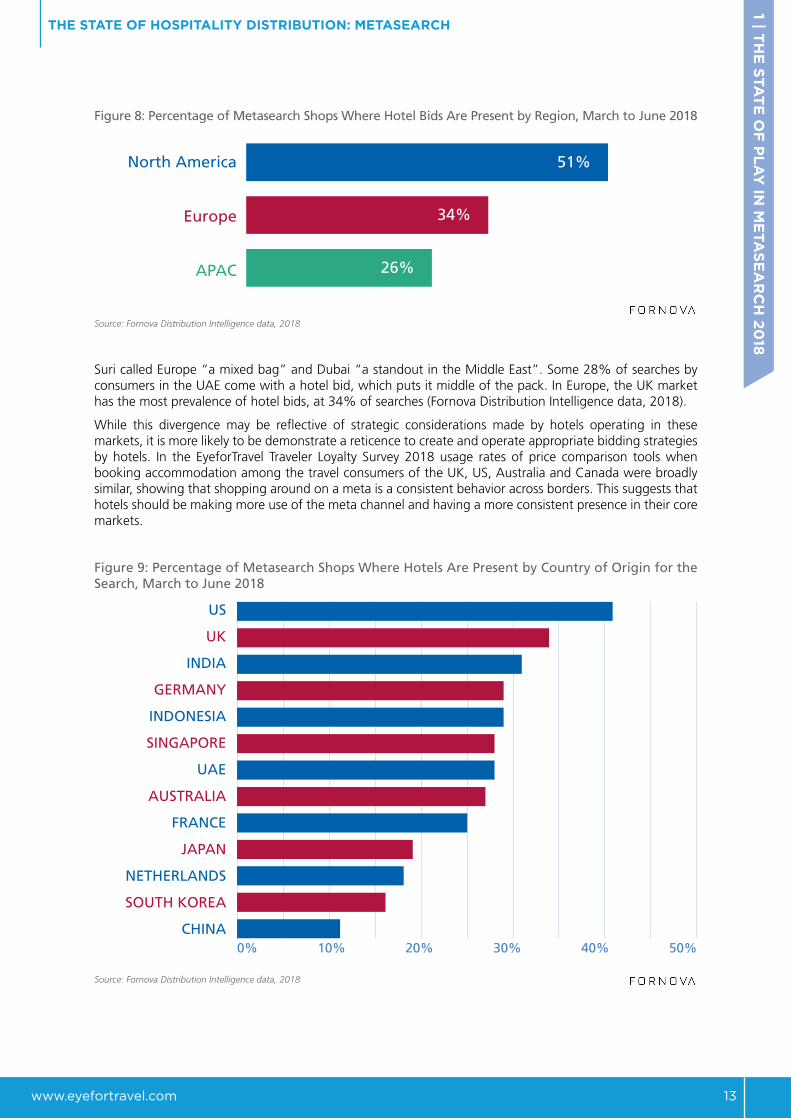
1.3.1. Hotel Meta Usage by GeographyWhen it comes to where hotels are most often displaying themselves, the US appears to be a clear leader, pushing North America to be the region where metasearch marketing is most utilized among hoteliers. Regionally, just over half of those searching for a room in North America among the 8,000 hotels Fornova monitored from April to June 2018 would be able to find a direct booking link. Hotel representation on meta sites then falls to 34% for European hoteliers and just 26% for those based in Asia-Pacific (Fornova Distribution Intelligence data, 2018).
On a country level, according to Fornova’s data, 41% of shops they monitored in the US market had a hotel brand among the bidders, making it the leader out of the markets monitored. However, when it comes to the world’s next largest economy, China, just 11% of shops conducted by Fornova were being served by a hotel’s advert, putting it near the bottom for all countries monitored (Fornova Distribution Intelligence data, 2018). This shows the disparity between different markets currently and the very different strategies that appear to be being deployed globally.
1 | TH
E S
TA
TE
OF
PL
AY
IN M
ETA
SE
AR
CH
20
18
Hotels Combined
Trivago
Trip Advisor
79%
43%
30%
8%
• Expedia.com 22.4%• Booking.com 13.4%• Hotels.com 9.3%• Travelocity.com 7.1%• Facebook.com 4.8%• Other 43.0%
THE STATE OF HOSPITALITY DISTRIBUTION: METASEARCH
www.eyefortravel.com 13
Figure 8: Percentage of Metasearch Shops Where Hotel Bids Are Present by Region, March to June 2018
Source: Fornova Distribution Intelligence data, 2018
Suri called Europe “a mixed bag” and Dubai “a standout in the Middle East”. Some 28% of searches by consumers in the UAE come with a hotel bid, which puts it middle of the pack. In Europe, the UK market has the most prevalence of hotel bids, at 34% of searches (Fornova Distribution Intelligence data, 2018).
While this divergence may be reflective of strategic considerations made by hotels operating in these markets, it is more likely to be demonstrate a reticence to create and operate appropriate bidding strategies by hotels. In the EyeforTravel Traveler Loyalty Survey 2018 usage rates of price comparison tools when booking accommodation among the travel consumers of the UK, US, Australia and Canada were broadly similar, showing that shopping around on a meta is a consistent behavior across borders. This suggests that hotels should be making more use of the meta channel and having a more consistent presence in their core markets.
Figure 9: Percentage of Metasearch Shops Where Hotels Are Present by Country of Origin for the Search, March to June 2018
Source: Fornova Distribution Intelligence data, 2018
1 | TH
E S
TA
TE
OF
PL
AY
IN M
ETA
SE
AR
CH
20
18
North America
Europe
APAC
51%
34%
26%
0% 10% 20% 30% 40% 50%
US
UK
INDIA
GERMANY
INDONESIA
SINGAPORE
UAE
AUSTRALIA
FRANCE
JAPAN
NETHERLANDS
SOUTH KOREA
CHINA

2 | H
OW
CA
N M
Y B
RA
ND
CO
NT
RO
L IT
S M
ETA
SE
AR
CH
PR
ES
EN
CE
?
www.eyefortravel.com 14
2. HOW CAN MY BRAND CONTROL ITS METASEARCH PRESENCE?
In the confines of such a highly fractured environment, there is no silver bullet for success – and less so for hotels that do not have their own digital house in order. As a means of growing direct bookings, metasearch is only as good as the booking engine on the hotel’s brand.com site on both mobile and desktop. “If your conversion numbers on Google Analytics are low, don’t waste a penny on meta because you’re up against the OTAs and their conversion rates are unparalleled in the industry,” Fornova CEO Dori Stein advised.
It is therefore premature to jump straight to managing a complex metasearch operation for a hotel if the basics aren’t taken care of first, particularly the hotel’s direct channel and its ability to manage inventory and rates on meta. Without this fundamental housekeeping, budgets can be sapped almost immediately for no return if those click-throughs aren’t converting, and even worse, those customers are likely to choose another booking route, further upping the cost through commissions. For more on creating a high conversion environment digitally, click here for the EyeforTravel Converting the Customer report.
Beyond creating a strong brand online that converts customers, hotels also need to know how to operate with the medium, which this chapter will address, through looking at inventory control, monitoring meta channels, maintaining parity and using meta to drive bookers towards becoming loyal bookers.
2.1. Inventory IssuesCore to using metasearch effectively from a hotelier’s perspective is to be able to have visibility across the space. The fuller a picture a hotel has over where it is inventory is available and being marketed, the better a hotel can place spend and inventory in the future.
Monitoring the online space, and meta in particular, is critical as there is a growing profusion of bidders, placing what seems like identical inventory to the consumer on price comparison sites and playing clever pricing games to win them over.
Fornova’s data finds that across the sites it monitored from March to June 2018 there were generally between seven and 10 bidders for each search. More striking though, is how many of these were non-contracted OTAs who source hotel inventory indirectly, typically from wholesalers who have been directly contracted by the hotel. In each case, the majority of bidders over the time period and across meta sites were these non-contracted OTAs. Numbers ranged from an average of four out of seven for Google shops conducted in the period to seven out of nine for trivago, which was proportionally the highest out of the four meta sites studied (Fornova Distribution Intelligence data, 2018; see Figure 10).
Figure 10: Average Bidder Numbers on Meta Sites, March to June 2018
Source: Fornova Distribution Intelligence data, 2018
THE STATE OF HOSPITALITY DISTRIBUTION: METASEARCH
Hotels Combined
Trivago
Trip Advisor
0 1 2 3 4 5 6 7 8 9 10
• Average number of bidders
• Average number of non-contacted bidders

www.eyefortravel.com 15
The growth of APIs has allowed more players to access and market inventory to more partners but this is not necessarily in the hotel’s best interest. Hotels need to have a view on who is selling their inventory and at what price to protect their brand’s integrity and also to prevent their prices being consistently undercut by wholesalers who should not be placing inventory in this manner (see Section 2.2 for more). Failing to do so means hotels cannot understand the true effectiveness or cost of their marketing and sales efforts and for consumers to shift away from seeing value in making a direct booking.
A further issue when it comes to inventory is that meta is something of a blunt tool that doesn’t allow hotels to target specific need periods throughout the year. So, a meta campaign in summer intended to fill rooms during the post-holiday period in January will not necessarily have the desired effect. However, most metasearch engines give hoteliers the option of temporarily switching off their campaigns, which can be beneficial if and when the property is at, or nearing, capacity. From a budgetary perspective, Fornova’s Chief Revenue Officer Nir Dupler suggested halting work with metasearch partners for that property and redirecting those marketing funds to another of the brand’s hotels with more unsold supply.
Investing into inventory management and connectivity can immediately affect the bottom line as well. A glitch on the hotel’s reservation system or a connectivity issue with an OTA can falsely indicate that the property is sold out or result in overbooking, leading to lost revenues. According to Einav Guez, Fornova’s Customer Success Manager, this is actually a common occurrence for hotels that typically lack the internal resources necessary to invest the time in daily monitoring of inventory across all channels. She explained, “if the brand.com site is showing no availability because of a tech issue, while the OTAs are still selling inventory, the hotel will lose out on direct bookings and pay commission for those reservations instead.”
2.2. Rate ParityKeeping tabs on rate parity across all distribution partners poses an arduous task for any hotel and the reality is contracts with third party vendors often leaves them with wriggle room to outcompete a hotel on the initial price offered on meta. For example, contracts can preclude fine print on how local taxes in a given market are presented to the consumer as a component of pricing. “Tax exclusive or tax inclusive rates can create a perceived rate disparity wherein a vendor appears to be cheaper, even if the consumer pays the same amount in the end,” said Sanchit Rege, Manager Distribution Strategy at Hyatt.
Here, OTAs are at an advantage as they are equipped to keep track of local laws dictating how taxes appear on a market-to-market basis. The average hotel usually falls short of the labor and technological resources to do so. Furthermore, as Stein points out, there’s no way for a hotel’s revenue or e-commerce manager to know what meta engines are showing their guests in different countries because of the varying IP addresses. “Unless the hotel has a way to monitor its top inbound source markets, it’s a losing battle,” he added.
Figure 11: Percentage of Metasearch Bids Where Hotels Were Undercut by OTAs, March to June 2018
Source: Fornova Distribution Intelligence data, 2018
THE STATE OF HOSPITALITY DISTRIBUTION: METASEARCH 2
| HO
W C
AN
MY
BR
AN
D C
ON
TR
OL
ITS
ME
TA
SE
AR
CH
PR
ES
EN
CE
?
80%
60%
40%
20%
0%MARCH APRIL MAY JUNE
• Percentage of metasearch shops where hotels are undercut by OTAs and lead times less than 14 days• Percentage of metasearch shops where hotels are undercut by OTAs and lead times greater than 14 days
www.eyefortravel.com 16
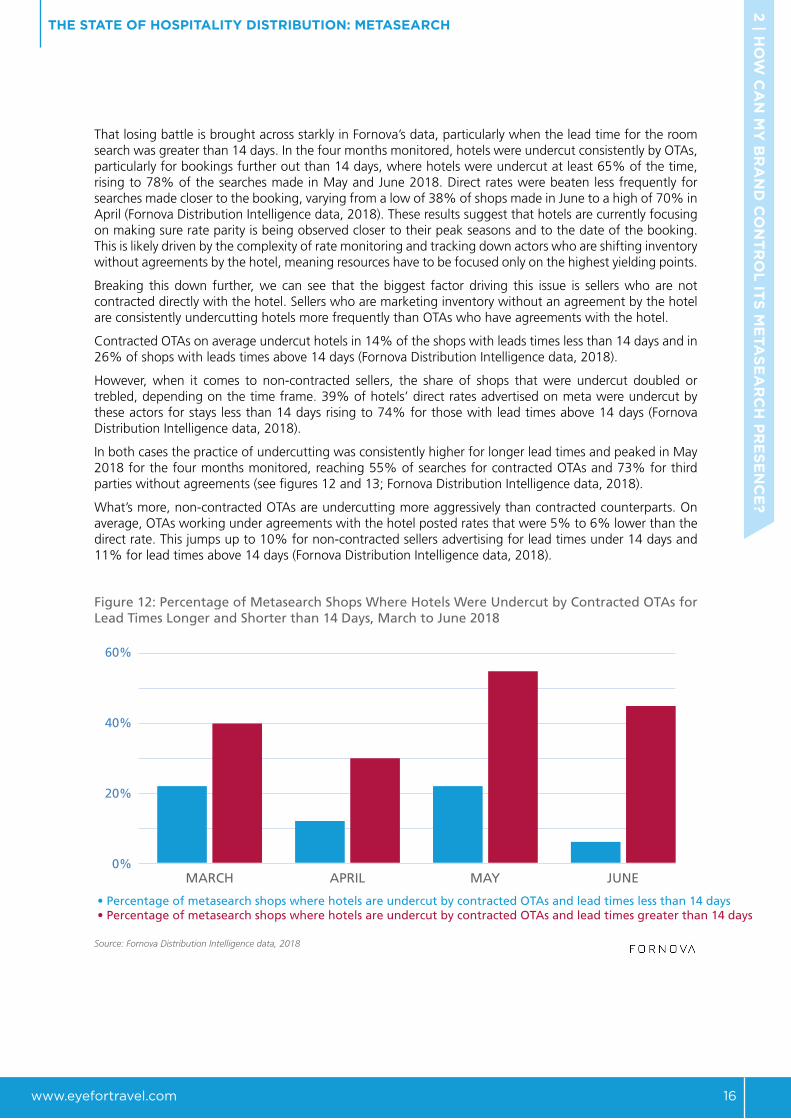
That losing battle is brought across starkly in Fornova’s data, particularly when the lead time for the room search was greater than 14 days. In the four months monitored, hotels were undercut consistently by OTAs, particularly for bookings further out than 14 days, where hotels were undercut at least 65% of the time, rising to 78% of the searches made in May and June 2018. Direct rates were beaten less frequently for searches made closer to the booking, varying from a low of 38% of shops made in June to a high of 70% in April (Fornova Distribution Intelligence data, 2018). These results suggest that hotels are currently focusing on making sure rate parity is being observed closer to their peak seasons and to the date of the booking. This is likely driven by the complexity of rate monitoring and tracking down actors who are shifting inventory without agreements by the hotel, meaning resources have to be focused only on the highest yielding points.
Breaking this down further, we can see that the biggest factor driving this issue is sellers who are not contracted directly with the hotel. Sellers who are marketing inventory without an agreement by the hotel are consistently undercutting hotels more frequently than OTAs who have agreements with the hotel.
Contracted OTAs on average undercut hotels in 14% of the shops with leads times less than 14 days and in 26% of shops with leads times above 14 days (Fornova Distribution Intelligence data, 2018).
However, when it comes to non-contracted sellers, the share of shops that were undercut doubled or trebled, depending on the time frame. 39% of hotels’ direct rates advertised on meta were undercut by these actors for stays less than 14 days rising to 74% for those with lead times above 14 days (Fornova Distribution Intelligence data, 2018).
In both cases the practice of undercutting was consistently higher for longer lead times and peaked in May 2018 for the four months monitored, reaching 55% of searches for contracted OTAs and 73% for third parties without agreements (see figures 12 and 13; Fornova Distribution Intelligence data, 2018).
What’s more, non-contracted OTAs are undercutting more aggressively than contracted counterparts. On average, OTAs working under agreements with the hotel posted rates that were 5% to 6% lower than the direct rate. This jumps up to 10% for non-contracted sellers advertising for lead times under 14 days and 11% for lead times above 14 days (Fornova Distribution Intelligence data, 2018).
Figure 12: Percentage of Metasearch Shops Where Hotels Were Undercut by Contracted OTAs for Lead Times Longer and Shorter than 14 Days, March to June 2018
Source: Fornova Distribution Intelligence data, 2018
THE STATE OF HOSPITALITY DISTRIBUTION: METASEARCH 2
| HO
W C
AN
MY
BR
AN
D C
ON
TR
OL
ITS
ME
TA
SE
AR
CH
PR
ES
EN
CE
?
60%
40%
20%
0%MARCH APRIL MAY JUNE
• Percentage of metasearch shops where hotels are undercut by contracted OTAs and lead times less than 14 days• Percentage of metasearch shops where hotels are undercut by contracted OTAs and lead times greater than 14 days

www.eyefortravel.com 17
Figure 13: Percentage of Metasearch Shops Where Hotels Were Undercut by Non-Contracted OTAs for Lead Times Longer and Shorter than 14 Days, March to June 2018
Source: Fornova Distribution Intelligence data, 2018
The prevalence and depth of hotels’ bids being undercut on the meta channel suggests that there is a clear problem that needs policing but currently hotels are struggling to find the solutions to monitor and affect the space.
This capability gap is most severe in international markets, where OTAs are more likely to be relied upon, less likely to be monitored and can use subtle tactics. Rege gave examples of differences in currency conversion rates in international markets or tax exclusion in some markets providing a perceived rate advantage on metasearch channels.
However, the greatest factor that impacts rate integrity is contracted wholesalers, who sell inventory to non-contracted OTAs with which the hotel does not do business. Stein estimates that 40% to 50% of hotel inventory contracted to wholesalers is leaked online, despite the fact that they negotiate for static rates, based on the fact that those rates will be opaque to consumers who are purchasing the room as part of a package with other services included.
The issue is ongoing for Thailand-based Dusit International, which operates primarily in Southeast Asia and which maintains static contracts with a multitude of traditional wholesalers. “There is crossover between all of the different players on various channels and that makes it very hard to maintain rate integrity,” said Chatchai Pongprapat, assistant vice president, revenue management. The company’s solution has been to partner with Fornova, which polices the rates and in turn, Dusit tackles rate disparities one-by-one as they arise, while also reconsidering the terms and conditions of individual static contracts in order to keep the hotels from being undercut.
However, resolving each rate discrepancy doesn’t necessarily remedy the issue in the long-term. The third-party vendor will rectify the issue at the time it occurs says Stein, but without contractual obligations, the partner isn’t necessarily obligated to maintain parity in the long-term. Plus, they will often change the rate in the local market where the hotel’s revenue or distribution team is located, while leaving incongruent rates in international markets as it’s more difficult for the hotel to verify that the changes have been made. Stein added, “when hotels have a bad parity situation and they’re on meta, they’re effectively paying to tell the world that their brand.com rates aren’t the cheapest.”
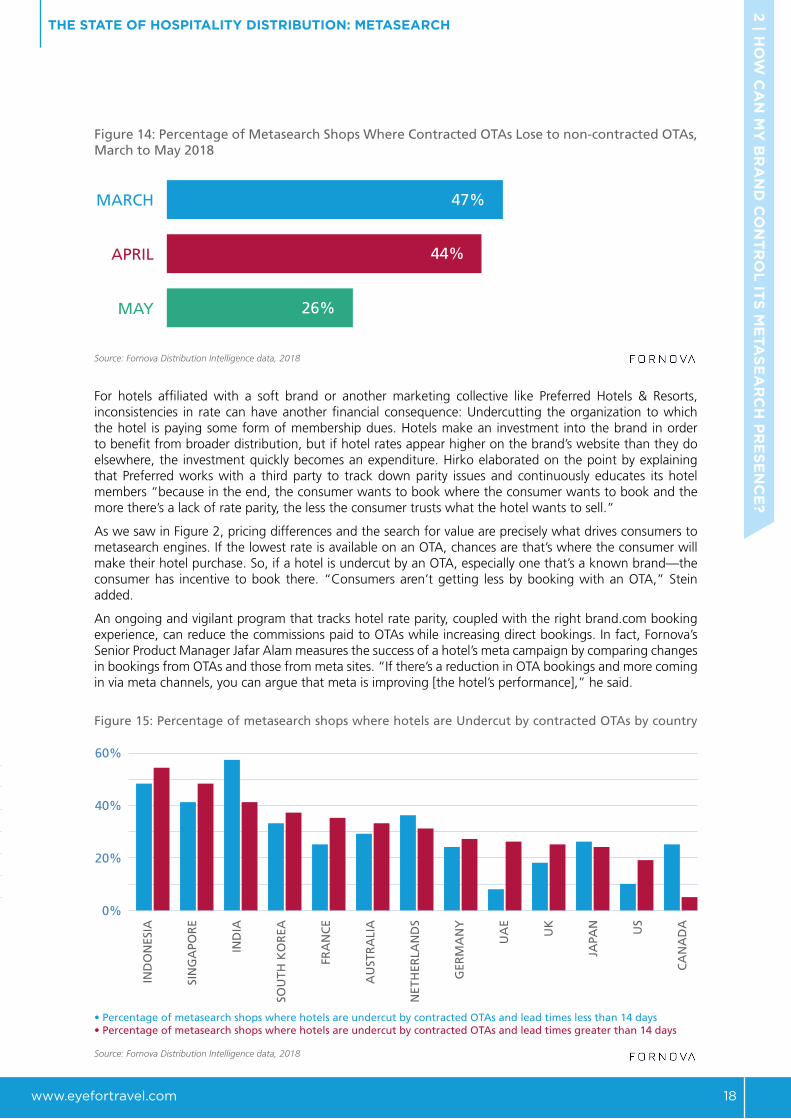
This doesn’t just affect the hotels, however, as contracted OTAs are also losing out to these rogue actors on meta as well. Fornova data shows that at least a quarter of OTA bids in Q2 2018 had a cheaper non-contracted seller on the search, rising to a high of 47% in March, so partners are also affected and being hit by this undercutting (Fornova Distribution Intelligence data, 2018).
THE STATE OF HOSPITALITY DISTRIBUTION: METASEARCH 2
| HO
W C
AN
MY
BR
AN
D C
ON
TR
OL
ITS
ME
TA
SE
AR
CH
PR
ES
EN
CE
?
80%
60%
40%
20%
0%MARCH APRIL MAY JUNE
• Percentage of metasearch shops where hotels are undercut by non-contracted OTAs and lead times less than 14 days• Percentage of metasearch shops where hotels are undercut by non-contracted OTAs and lead times greater than 14 days
www.eyefortravel.com 18
Figure 14: Percentage of Metasearch Shops Where Contracted OTAs Lose to non-contracted OTAs, March to May 2018
Source: Fornova Distribution Intelligence data, 2018
For hotels affiliated with a soft brand or another marketing collective like Preferred Hotels & Resorts, inconsistencies in rate can have another financial consequence: Undercutting the organization to which the hotel is paying some form of membership dues. Hotels make an investment into the brand in order to benefit from broader distribution, but if hotel rates appear higher on the brand’s website than they do elsewhere, the investment quickly becomes an expenditure. Hirko elaborated on the point by explaining that Preferred works with a third party to track down parity issues and continuously educates its hotel members “because in the end, the consumer wants to book where the consumer wants to book and the more there’s a lack of rate parity, the less the consumer trusts what the hotel wants to sell.”
As we saw in Figure 2, pricing differences and the search for value are precisely what drives consumers to metasearch engines. If the lowest rate is available on an OTA, chances are that’s where the consumer will make their hotel purchase. So, if a hotel is undercut by an OTA, especially one that’s a known brand—the consumer has incentive to book there. “Consumers aren’t getting less by booking with an OTA,” Stein added.
An ongoing and vigilant program that tracks hotel rate parity, coupled with the right brand.com booking experience, can reduce the commissions paid to OTAs while increasing direct bookings. In fact, Fornova’s Senior Product Manager Jafar Alam measures the success of a hotel’s meta campaign by comparing changes in bookings from OTAs and those from meta sites. “If there’s a reduction in OTA bookings and more coming in via meta channels, you can argue that meta is improving [the hotel’s performance],” he said.
Figure 15: Percentage of metasearch shops where hotels are Undercut by contracted OTAs by country
Source: Fornova Distribution Intelligence data, 2018
THE STATE OF HOSPITALITY DISTRIBUTION: METASEARCH 2
| HO
W C
AN
MY
BR
AN
D C
ON
TR
OL
ITS
ME
TA
SE
AR
CH
PR
ES
EN
CE
?
0%
10%
20%
30%
40%
50%
60%
PercentageofmetasearchshopswherehotelsareundercutbycontractedOTAsandleadtimeslessthan14days
PercentageofmetasearchshopswherehotelsareundercutbycontractedOTAsandleadtimesgreaterthan14days
26%
44%
47%MARCH
APRIL
MAY
IND
ON
ESIA
SIN
GA
POR
E
IND
IA
SOU
TH K
OR
EA
FRA
NC
E
AU
STR
ALI
A
NET
HER
LAN
DS
GER
MA
NY
UA
E
UK
JAPA
N US
CA
NA
DA
• Percentage of metasearch shops where hotels are undercut by contracted OTAs and lead times less than 14 days• Percentage of metasearch shops where hotels are undercut by contracted OTAs and lead times greater than 14 days
60%
40%
20%
0%

www.eyefortravel.com 19
Figure 16: Percentage of metasearch shops where hotels are Undercut by non-contracted OTAs by country
Source: Fornova Distribution Intelligence data, 2018
Table 3: Metasearch Shops Data by Country
Percentage of metasearch shops where
hotels are present
Percentage of metasearch shops where
hotels are undercut by contracted
OTAs and lead times less than
14 days
Percentage of metasearch shops where
hotels are undercut by
non-contracted OTAs and lead times greater than 14 days
Percentage of metasearch shops where
hotels are undercut by
non-contracted OTAs and lead times less than
14 days
Percentage of metasearch shops where
hotels are undercut by
non-contracted OTAs and lead times greater than 14 days
Australia 27% 29% 33% 59% 78%
China 11% 25% 5% 69% 84%
France 25% 25% 35% 66% 74%
Germany 29% 24% 27% 60% 67%
India 31% 57% 41% 74% 76%
Indonesia 29% 48% 54% 57% 65%
Japan 19% 26% 24% 75% 80%
Netherlands 18% 36% 31% 60% 60%
Singapore 28% 41% 48% 71% 72%
South Korea 16% 33% 37% 67% 77%
UK 34% 18% 25% 58% 74%
UAE 28% 8% 26% 82% 83%
US 41% 10% 19% 33% 63%
Source: Fornova Distribution Intelligence data, 2018
THE STATE OF HOSPITALITY DISTRIBUTION: METASEARCH 2
| HO
W C
AN
MY
BR
AN
D C
ON
TR
OL
ITS
ME
TA
SE
AR
CH
PR
ES
EN
CE
?
100%
80%
60%
40%
20%
0%
CA
NA
DA
UA
E
JAPA
N
AU
STR
ALI
A
SOU
TH K
OR
EA
IND
IA UK
FRA
NC
E
SIN
GA
POR
E
GER
MA
NY
IND
ON
ESIA US
NET
HER
LAN
DS
• Percentage of metasearch shops where hotels are undercut by non-contracted OTAs and lead times less than 14 days• Percentage of metasearch shops where hotels are undercut by non-contracted OTAs and lead times greater than 14 days

www.eyefortravel.com 20
2.3. Loyalty and Customer RetentionThe lure of metasearch for hoteliers isn’t simply about shifting share from OTAs and increasing direct bookings in order to lower acquisition costs. The possibility of improving customer retention rates and guest loyalty derived from these bookings represents positive gains in the long term. Customers coming through metasearch are likely to be new and for that Alam designates them particular value because the hotel may not have to acquire them again in the future through additional spending.
In other words, it is about knowing the value of the hotel’s direct bookings in terms of the lifetime value of those guests, particularly compared with those coming from OTAs – which is how Pettigrew assesses the worth of metasearch for Starwood Capital’s Europe properties.
Direct bookings gained from metasearch sites translate into the hotel’s ownership of the customer and their data. The guest’s information can go directly into the property’s Customer Relationship Management (CRM) system, making him or her eligible for the hotel to retarget in the future or to use their data for targeting lookalike audience targeting. Dupler explained that the value of direct booking originating from metasearch “is not the cost of the transaction, but the ecosystem surrounding it.”
At Hyatt, budget allocated to metasearch campaigns that can multiply direct bookings is viewed as an investment in attracting an incremental channel agnostic guests and providing them with a branded customer experience and personalization. Rege says, “If we know who the guest is before arrival, we get an opportunity to personalize our service and offerings tailored to the guest. Direct bookers also provide us the means to maintain their preferences that can be leveraged to gain loyalty over a period of time.”
There’s also opportunity to build loyalty even more instantly, since metasearch users who click over to the hotel’s brand.com site can be immediately exposed to member rates. Despite the fact that most metasearch contracts will not allow hotels to promote their loyalty pricing, Hirko believes that once users arrive to the Preferred Hotels and Resorts website and see the rates, it will entice them to join the program instantly. “I can’t speak to the direct cause and effect,” he said. “But our loyalty program grew by a half million members in the last year and that comes at the same time that we engaged a third party to manage our presence on metasearch engines, so I have to believe that there’s been an equivalent amount of membership increases due to our use of meta.”
Figure 17: What Rewards Make Consumers Use Loyalty Programs Most?
Source: EyeforTravel Traveler Loyalty Survey 2018
Nevertheless, technology still won’t replace the human aspect of hotel service and ultimately, it will be guest’s stay at the hotel that will determine retention, regardless of how the booking was made. Delivering a remarkable experience is what will entice the guest to come back and perhaps even post on TripAdvisor and that, said Leora Lanz, lecturer at Boston University’s School of Hospitality Administration, is how guests have to win new loyal customers.
THE STATE OF HOSPITALITY DISTRIBUTION: METASEARCH 2
| HO
W C
AN
MY
BR
AN
D C
ON
TR
OL
ITS
ME
TA
SE
AR
CH
PR
ES
EN
CE
?
52.4% Free upgrade to rooms or seats
45.1% Ability to spend points on further travel and transportation
42.5% Discount to products
40.3% Free amenities, such as WiFi, spa usage or breakfast
38.3% Cashback offers
33.7% Special treatment access to VIP only elements and priority access to security or boarding
23.0% Unique experiences and personalized offers
20.6% Ability to spend points on non-travel purchases

www.eyefortravel.com 21
3. WORKING WITH, AND COMPETING ON, META
3 | W
OR
KIN
G W
ITH
, AN
D C
OM
PE
TIN
G O
N, M
ETA
Although conceptually simple, meta can very quickly become complicated and easy to put money into without properly measuring or understanding the return on investment. Brands need to know what they should be looking out for, what to measure and what the limitations of the medium are, all of which will be addressed in this chapter.
3.1. CPC vs. CPAThe benefits of Cost-Per-Click (CPC), also called Pay-Per-Click (PPC), versus Cost-Per-Acquisition (CPA) will need to be addressed by most managers overseeing metasearch campaigns as these are the dominant models used by metasearch companies and need to be considered individually.
Hotels generally see value in operating CPA campaigns because the returns can be directly measured, they’re viewed as posing less risk and they don’t require the same degree of management as CPC campaigns. But Dupler also pointed out that there are advantages and disadvantages to both: “It’s critical that both are maintained, monitored and managed.”
Hirko found success with meta after hiring a third party to oversee Preferred Hotels’ campaigns across the channel. Since driving revenue to member hotels is the foundation of the soft brand’s business, CPA is essential. Yet, CPC has also proven valuable to Preferred’s meta presence as Hirko explained that “meta works better with CPC and some metasearch engines require it,” adding “we’ve had to be creative working it into a strategy that leverages both and we’ve finally hit the sweet spot that balances the two.”
Achieving that equilibrium, according to Dupler, requires a 360-degree view of what’s currently happening in the market. But implementing the right mix of CPC and CPA is also a matter of understanding the ever-shifting business strategies of each metasearch site. “We felt we weren’t featured very visibly as their models evolved and so we hired a third party that could constantly monitor our meta campaigns and make them effective programs,” said Hirko. Meta-driven bookings jumped 30% after Preferred began working with a third-party partner to manage meta campaigns. They determine the best ROI from each individual meta site based on the budget Preferred dedicates to the channel, as well as meta sites’ performance for Preferred based on click-through volumes. Hirko noted that in terms of how cost effective the move was, “it took a while to tweak the program, but we’re definitely getting good returns for our investment.”
3.2. Bidding on a Budget and Judging ValueOnce brands have understood the basic frameworks of costs and benefits surrounding a metasearch investment, they need to build on this and incorporate additional metrics surrounding brand performance and customer value. Alam suggests that looking at CPC costs in isolation is an insufficient measure of success, since the investment is impacted by the quality of the brand.com’s website experience, booking engine, available and relevant offers, as well as rate integrity. “That combination will dictate the threshold of revenue that CPC delivers and beyond that, it doesn’t make sense to get into a bidding war,” he said.
Hyatt’s Rege agrees that a more rounded view is critical: “Understanding the fact that hotel tactics on third party channels affect hotel’s direct business is probably the biggest take away for hotels. Once the hotel team moves away from making single channel decisions to a more omnichannel approach, the next step is to drive rate integrity across all public channels.” he says. “On metasearch, I would focus on trying to drive total revenue management for all of our hotels in a quest to reach for an incremental customer base. Equally important is the rigor to segment direct bookers sourced from metasearch channels and understand their value. The ultimate goal is to overlay source metasearch, feeder markets and other booking factors to create granular customer segments make bidding decisions based on their micro-behavior. For example a customer booking on Trivago from Europe booking at a US hotel may behave differently and bring different long term value than a customer who books on TripAdvisor from the US into a Chinese hotel.”
THE STATE OF HOSPITALITY DISTRIBUTION: METASEARCH

www.eyefortravel.com 22
“I would focus on trying to drive total revenue management for all hotels or all things that are coming through the direct channel and then really look at whether there’s any distinction between the business that I get from a non-metasearch direct bookers as against a metasearch direct booker.… [Then] I would be looking at what is the added value that someone who goes onto trivago from, let’s say Europe, against someone from TripAdvisor from the US, for example?”
For independent hotels and regional hotel companies it is a case of evaluating the value derived and what to compete on and what to step back from. OTAs always have the capacity to outbid competing hotels with smaller budgets and margins on premium positioning and as we saw in figures 12 and 13 are also frequently undercutting hotels, make competing even harder.
Chatchai Pongprapat, assistant vice president, revenue management, at Thailand-based Dusit International is willing to pay for premium positioning in markets that do not have exorbitant traffic levels. “We don’t see markets where there is a lot of bidding and disparity happening as relevant to our strategy, but we look at it on a market-by-market or region-by-region basis and then make a decision based upon where we are strongest and can get the best return.”
Moreover, for hotels with limited resources, there is little point competing if the hotel or hotel group’s brand.com site does not support a localized experience. Consumers will quickly leave when the experience doesn’t adequately meet their needs and as we saw in Figure 2, the digital experience is the next most important element after price when it comes to trusting a brand.
Rege echoes Pongprapat that hotels need to consider ROI and brand strengths on a market-by-market basis and not try to overstretch: “Before you decide on a strategy for a specific market or segment, you have to evaluate the internal capabilities to drive business in these markets. Let’s say you were trying to drive business in a market that you don’t have the capability to compete in. This could be due to various reasons such as absence of a website in the local language, or lack of a nuanced cultural understanding of a non-mainstream or new market. If this is the case, then it could be possible to drive incremental business in the true sense at a better opportunity cost by working with a third party channel partner. However, if you are trying to drive business in a mature market or a market that is strategically important for you to build loyalty in the long run, then it makes sense to align your third party strategies to provide impetus to drive direct business in this market with more leniency on metasearch ROI.”
Therefore, gauging the economics of CPC, and bids in general, is not just a matter of comparing the expense to the base return. Dupler further elaborated that “it’s not just about CPC costs, but also brand recognition and the perception that direct is more expensive than indirect and that the consumer can find better prices on OTAs.” In this hyper-competitive environment hoteliers need to make sure that when they do compete, they are price-competitive, can adequately monitor the space, and consider their revenue data from multiple angles.
3.3. Incorporating GoogleBidding on search terms potentially has more value than meta for Starwood Capital’s European hotels. Pettigrew still prioritizes search term marketing, with the goal of optimizing Google Ads. However, he expressed concern over the amount of influence that platform holders like Google and Apple will have over consumers, particularly as they introduce products like Google Home and other voice search technologies. “We don’t have clear visibility on that, but the next disruptions could be from those gatekeepers,” he speculated, adding that in the meantime, “hotels are shifting some of that search term budget over to meta because, in the end, it’s delivers a better return.”
Google Hotel Ads have evolved over the last decade and Kathryn Barrett, Dream Hotel Group’s Vice President Revenue Management, anticipates they will continue to do so, “shaping the future of where metasearch moves.” This overlap and interaction between search engines and metasearch means that brands should not judge in isolation and will need to consider AdWord bidding strategies alongside their metasearch campaigns.
Until such a time, it’s also worth keeping in mind that Google announced earlier this year that sites ‘following best practices for mobile-first indexing’ will see significantly better results, as was reported at EyeforTravel Europe 2018.
THE STATE OF HOSPITALITY DISTRIBUTION: METASEARCH 3
| WO
RK
ING
WIT
H, A
ND
CO
MP
ET
ING
ON
, ME
TA

www.eyefortravel.com 23
3.4. The Limits of Meta SpendThe hotel industry generally heralds metasearch as a more cost-efficient tool for bolstering direct bookings compared with the acquisition costs of those made through OTAs. But nothing is that clear cut in the hotel distribution ecosystem. Kathryn Barrett’s take on CPC is that paying for premium positioning isn’t necessarily going to deliver the best ROI and “that’s something to look at through testing.”
Regardless of whether you choose a CPC or CPA meta campaign, the budgetary benefits of meta-generated direct business are only as good as that customer’s spend across the stay. This is owing to several reasons, including the fact that metasearch campaigns cannot target specific booking windows, despite the fact that most meta sites allow temporary campaign suspension. In terms of economics, Rege noted that the day on which hotels commit to a meta spend is not the day when travelers will arrive to the hotel and it’s the rate paid for the day of check-in that determines ROI. “Ideally on metasearch channels, one should have the ability to bid based on specific booking windows, which is not the case right now.”
The optimal meta expenditure for hotels, in Rege’s view, will happen when hotels can leverage their internal occupancy and revenue management data against information from the meta sites on booking window opportunities from different markets for various hotels. “There’s a lot more we could do with other data sets at our disposal in order to get the most value from metasearch,” he said.
Nor is it possible to target specific markets beyond the strength that certain meta sites are known to have in certain geographic regions or particular sub-domains. So meta isn’t necessarily a primary tool for specific marketing objectives, such as Miami hotels that want to reach American travelers in the Northeast who traditionally travel south during North American winter months and South American travelers who head north in the Southern Hemisphere’s winter season. The optimal meta expenditure for hotels, in Rege’s view, will happen when hotels can leverage their internal occupancy and revenue management data against information from the meta sites on booking window opportunities from different markets for various hotels. “There’s a lot more we could do with other data sets at our disposal in order to get the most value from metasearch,” he said.
3.5. Evaluating Meta SuccessRegardless of all of the factors that influence meta bookings and the revenues that they generate for any given hotel, Alam recommended that hotels appraise their net RevPAR (Revenue Per Available Room) to judge their success on meta channels. That is, compare the total number of incremental direct booking generated by meta search and compare that to the total number of direct booking received if the channel didn’t exist. Pettigrew concurred that “if you have a finite budget, you can still deliver higher returns and more direct bookings with meta.”
THE STATE OF HOSPITALITY DISTRIBUTION: METASEARCH 3
| WO
RK
ING
WIT
H, A
ND
CO
MP
ET
ING
ON
, ME
TA
4 | T
HE
FU
TU
RE
OF
ME
TA
www.eyefortravel.com 24
4. THE FUTURE OF META
4.1. Plateauing Financials: Potential Outcomes and Upshots Whilst consumers love metasearch engines, investors have not been so excited over 2018, with mixed results and market caps coming across the industry. As EfT’s Sally White reported in February 2018, the “big three” –Booking, Expedia, and TripAdvisor—are facing “headwinds” as Google eats into their pieces of the meta pie and ‘return on advertising spend has been noticeably down across the industry.’ Plus, the competition is becoming even more intense as Airbnb expanded to include hotels this year and Ctrip has stepped up its international efforts.
This has meant a tighter year for all the largest metasearch players, with the exception of the Qunar/Ctrip juggernaut, which continues to ride the wave of an expanding Chinese travel market, with relatively low internal competition. Among the remainder, trivago has had the toughest year so far and is in the midst of adjusting its strategy. The company saw its value plummet across the middle of the year as revenue growth turned negative, reversing exceptional growth in 2017 (trivago, 2018). Diminished growth has been put down to a stronger competitive environment and a pull-back in spending from some of its biggest spenders, including Booking Holdings’ brands. This has forced trivago to announce a shift away from its hefty marketing budget and instead to focus on profitability.
TripAdvisor is also having a mixed year. Whilst its stock value was up from the start of 2018 at the time of writing, results from the hotel sector across the year have been less than positive. It reported in its second quarter results that revenues derived from hotels declined by 4% (FT, 2018). This fits into a longer-term picture of struggling to raise revenues from the hotel sector, which is especially concerning for the brand given how powerful it is for the discovery and research of accommodation by consumers.
The best performer out of this big three appeared to be the metasearch brands of Booking Holdings. In its second quarter earnings call, the company reported that: “Advertising and other revenue, which is mainly comprised of non-intercompany revenues from KAYAK and OpenTable, grew 34% in Q2 compared to the prior year, including revenue from Momondo” (Motley Fool, 2018). This suggests that its metasearch business component is performing relatively well and doesn’t appear to have the same reliance on ad spending from major OTAs that trivago and TripAdvisor have. Booking Holdings deep pockets and profitability gives further cushioning to its meta brands, who can expand marketing spend if required, something that trivago is now pulling back on.
Stein theorized that the meta sites struggling to meet financial projections are victims of Google’s advantage as holders of what he called the most sought-after real estate in the Western World. “TripAdvisor and Trivago’s share prices aren’t doing that well and they’re spending more and more on advertising so that they can reach more consumers,” he noted. “But it’s coming at tremendous costs while Google is increasing the number of consumers exposed to their metasearch engine with no real additional costs. No one said it’s a fair world.”
Alam also expects more hoteliers will turn to Google Hotel Ads as they look to expand their meta presence because “TripAdvisor and trivago have run into financial difficulties and haven’t been making it work commercially.”
The rising star of Google appears to be borne out by our results, with hotels participating in it far more than on the other three metasearch sites measured as part of Fornova’s data gathering. With nearly four fifths of shops on Google having a hotel bid, compared to 43% for HotelsCombined, 30% for trivago, and 8% for TripAdvisor, it seems that Google has captured substantial market share and offered a strong value proposition for hotels (see Figure 6).
THE STATE OF HOSPITALITY DISTRIBUTION: METASEARCH
www.eyefortravel.com 25
Regardless of financial performances, however, Google is not alone in exploring how to improve its value proposition to hotels. TripAdvisor and trivago have found success amongst hoteliers in what Barrett described as their “almost extranet” sites that allow hotels to manage their content and engagement with the users on the platform by including property-direct phones numbers and websites, the ability to curate hotel images and messaging, as well as the opportunity to respond directly to questions that travelers post on the sites. The tools, she said, give hoteliers greater control over how their brands appear on the sites, while also enabling them to develop direct relationships with travelers. “We’ve had success with TripAdvisor in almost every single market and we’ve seen trivago strengthen its presence in the U.S. and so they have tremendous value,” she added. “But my impression of KAYAK is that they are very crowded in terms of inventory.”
Stein on the other hand believes that ongoing investments at KAYAK and SkyScanner put both sites in a position to become frontrunners among metasearch engines. Both sites’ hotel search features are currently overshadowed by consumers’ awareness of the sites’ platforms as flight comparison tools. Stein surmised, “it’s a challenge to change the perception of a brand, but if they crack it, they will leap forward based on pure traffic numbers to play with the big boys.”
As the space continues to be crowded with brands names, metasearch sites are increasingly moving towards greater personalization and curation to help deal with this mass of options.
At least that will be the case for trivago and HomeAway. After trivago integrated HomeAway into its hotel search platform last November, totaling more than 350,000 units of alternative accommodation, Murta said “data-driven personalization will be an important factor in trivago’s innovations” in an effort to display these properties to users when relevant.
It is a similar case for vacation rental metasearch company HomeToGo. Delivering more than 20 million monthly users to its partners’ sites, HomeToGo, will continue its international expansion into new markets over the next five years, with additional plans to bolster its machine learning technologies with the same aim of enhanced personalization. The company’s CEO said “metasearch will have to continue to evolve to accommodate users seamlessly across devices, including voice search technology.”
It also stands to reason that these brands will want to realize the revenue potential that hoteliers see in the international global reach of meta platforms, maximizing their technology capabilities to allow hotels to target specific markets during explicit booking windows. This will result in more clear-cut value for hotels, while creating an additional revenue stream for metasearch engines. Barrett offered the insight that although metasearch engines are perceived to be marketing channels, “they’re really tech companies and that’s how they’ll drive it forward.”
Another possibility is that meta sites open up to the loyalty member rates and promotions offered by hotels and OTAs alike as doing so creates a more concrete argument for the lifetime customer value that metasearch drives to brand.com sites. Likewise, travelers who begin their path to purchase on a meta site would derive greater value from an experience that includes a more comprehensive range of rates. “Meta sites,” Hirko said, “will need to figure it out.”
4.2. Overlap Between OTAs and Meta SitesThere’s no denying that there’s crossover between metasearch engine sites and OTAs. The major OTAs all hold significant shares in more than one meta site. OTAs are also just as apt –and perhaps even more so–than the hotels themselves to use metasearch as a marketing vehicle to drive hotel bookings.
Until late 2017, Fornova Customer Success Manager Einav Guez’s enjoyed a near six-year tenure as Booking.com’s Israel market manager and gave an insight into the tactical plays major OTAs make to gain bookings. She said, the OTA giant incorporated metasearch – both through CPA and CPC – into its marketing efforts for certain hotels, bidding high in CPC to ensure they came high in results and tracking every click that meta generated.
“For every new property that came to Booking.com, a link would be added to TripAdvisor if the hotel had one, so that Booking could, in part, use data from that to decide if they wanted to pay for a meta presence on behalf of the hotel client,” she said. Furthermore, they were so aggressive in their strategy that as long as meta delivered conversion results, ROI was considered positive.
THE STATE OF HOSPITALITY DISTRIBUTION: METASEARCH 4
| TH
E F
UT
UR
E O
F M
ETA

www.eyefortravel.com 26
While OTAs see enough value in meta to build them deeply into their business models, conversely, metasearch sites are also starting to take cues from their OTA owners. Some are offering booking capabilities directly on their websites, others patterning new business offerings after their OTA counterparts. trivago’s Hotel Price Index and Rate Insights are similar to the data insights that Expedia’s lodging partners can find on Expedia PartnerCentral and TripAdvisor’s new Sponsored Placements, which allows advertisement above user’s search results, bears a certain resemblance to Expedia Media Solutions’ TravelAds Sponsored Listings.
But TripAdvisor’s Schmidt and trivago’s Murta are careful to make distinctions between their respective platforms and OTAs, with Schmidt pointing to the breadth and depth of the first party content that attracts travelers at the onset of their trip planning and Murta, to the fact that Trivago does not have booking functionality. “Our core responsibility in the traveler’s booking journey is the search stage,” he said. “We do not foresee a ‘Booking on trivago’ option being integrated into our hotel search experience and for the same reason, our booking funnel provides strong branding to our advertisers.”
Nevertheless, Pongprapat sees the two channels as becoming more and more indistinguishable from each other as some meta sites include their own booking engine and OTAs offer consumers more comparison tools. “There is certainly a big fight going on at the moment between the various players in online distribution as they become more alike,” he said.
That view is lending enough of a consensus among hoteliers to cause them to speculate that consumers are also finding it difficult to differentiate between the two. If there is an aspect of differentiation, it’s that quantity of option available on meta sites and their marketing positions gives the general traveler to believe that these sites are unbiased. But Hirko believes that in terms of rate strategies, OTA and meta sites are blending into a single platform for consumers “who are not likely [to be] consciously thinking about the two as they conduct online searches for their hotel options and once they find a property with the right location, amenities and rates, they will book,” he said.
4.3. The Future of Hotels on MetaThe movement by both hotel brands and independent properties to drive more direct bookings has led to increased interest in metasearch as a direct marketing tool. But Murta reminds these hoteliers of the importance of data when developing strategies to succeed on meta. “With the data we provide them, hoteliers can reach their guests with relevant and targeted marketing strategies and position their properties competitively in the market with their pricing strategies,” he said.
He also noted that if increased direct bookings are every hotel’s end game, then there is also some onus on them to invest in new technology now in order to stay in control of their business. “We’re starting to see a shift in this direction and I’m confident we’ll see a more balanced distribution landscape in which hotels will be able to fully compete,” he said. “At the same time, marketing platforms must get easier to use and technology must become more accessible.”
4.4. ConclusionIn the meantime, it would be an error to flout the value of these distribution channels. Murta and Pongprapat concurred that metasearch is no longer an outlier or future trend in hotel distribution. Instead Murta described it as a cornerstone of the online distribution landscape where travelers of all demographics go first to access information, search for options, compare offerings and make their booking decision, a view we confirmed in Chapter 1. “We cannot ignore the importance they play in the customer journey,” said Pongprapat. “The hotel industry is lagging behind in technology and we need to understand and to utilize emerging technology trends to serve the needs of new generations and if not, the competition will adapt and win.”
It is also a mistake to buy into the rhetoric that any one distribution channel is superior. There is no single channel solution, according to Dupler, “It’s about how you manage a channel and what the right mix is for your hotel,” he said.
THE STATE OF HOSPITALITY DISTRIBUTION: METASEARCH 4
| TH
E F
UT
UR
E O
F M
ETA

THE STATE OF HOSPITALITY DISTRIBUTION: METASEARCH
www.eyefortravel.com 27
AB
OU
T F
OR
NO
VA
About Fornova
Fornova’s patented technology helps hoteliers maximize revenue and profit by continuously optimizing their distribution mix across ALL channels – to sell every room through the best channel, every time.
Hotel distribution is evolving fast. Fornova’s leading-edge technology delivers a comprehensive, constantly updated view across both direct and indirect distribution channels – giving hotels dynamic control of their entire distribution and e-commerce operations. And with intelligence and automation, hoteliers can get maximum profit on every room by optimizing their distribution mix across ALL channels.
Founded in 2010, Fornova has over 130 employees with offices in London, New York, Israel and Amsterdam, providing market-leading distribution solutions for more than 15,000 hotels globally.
Find out more at www.fornova.com

THE STATE OF HOSPITALITY DISTRIBUTION: METASEARCH
www.eyefortravel.com 28
METHODOLOGY
ME
TH
OD
OLO
GY
The data used in this research and credited to Fornova was collected using Fornova’s patented visual web-analysis technology, known as Distribution Intelligence. This technology scans the web visually, like a real user, using image analysis and providing a true picture of what a guest really sees when searching online.
Using Distribution Intelligence Fornova looked at a sample of 8,000 properties spread globally, over a four-month period from March to June, 2018 (Q2 2018). During this time, four leading metasearch Engines - Google, TripAdvisor, Trivago and HotelsCombined – were monitored daily from 15 different points of sale. During this effort, nearly 10 million shops were made - where a shop is a single search for an upcoming stay date for a property on a website for a standard request of two guests staying one night.
To compliment this data, EyeforTravel conducted consumer research. EyeforTravel’s Traveler Loyalty Survey 2018 was a multi-country study conducted through partners TapResearch across Australia, Canada, the UK, and the US. The survey population sample was designed to be broadly representative of travel consumers in those countries by age and income. Respondents had to have conducted at least one paid overnight stay in the past 12 months for business or leisure purposes to qualify. 5,544 started the survey and 3,136 consumers completed the survey in its entirety.

THE STATE OF HOSPITALITY DISTRIBUTION: METASEARCH
www.eyefortravel.com 29
REFERENCES
RE
FE
RE
NC
ES
EyeforTravel Traveler Loyalty Survey 2018. See Methodology for more.
Fornova Distribution Intelligence data, 2018. See Methodology for more.
FT, 2018. TripAdvisor shares eye worst day since Nov 2017. https://www.ft.com/content/db98c5b2-9651-11e8-b67b-b8205561c3fe. Accessed 31 August 2018.
Motley Fool, 2018. Booking Holdings (BKNG) Q2 2018 Earnings Conference Call Transcript. Available at: https://www.fool.com/earnings/call-transcripts/2018/08/10/booking-holdings-bkng-q2-2018-earnings-conference.aspx. Accessed 31 August 2018.
SimilarWeb, 2018a. Top Websites Ranking, Travel, Worldwide [Online]. Available at: https://www.similarweb.com/top-websites/category/travel. Accessed 6 July 2018.
SimilarWeb, 2018b. Travel Industry US - Trends & Insights [Online]. Available at: https://www.similarweb.com/corp/travel-trends-insights-2018/. Accessed 6 July 2018.
TripAdvisor, 2018. TripAdvisor Has a Massive Influence on a $5 Trillion+ (and Growing) Global Travel Economy, According to New Oxford Economics Study. Available at: http://ir.tripadvisor.com/news-releases/news-release-details/tripadvisor-has-massive-influence-5-trillion-and-growing-global. Accessed 31 August 2018.
Trivago, 2018. Quarterly Results. Available at: http://ir.trivago.com/phoenix.zhtml?c=254450&p=irol-reportsOther. Accessed 31 August 2018.