the team focus model - paulfriga.com · the team focus framework for team problem solving...
TRANSCRIPT

THE TEAM FOCUS FRAMEWORK FOR TEAM PROBLEM SOLVING
Confidential material from the book: The McKinsey Engagement:
A Powerful Toolkit for More Efficient and Effective Team Problem Solving Paul N. Friga

Introduction to TEAM FOCUS
2
• A guide for any team problem-solving project
• Based upon the author’s experiences at McKinsey and research into best practices at other top consulting firms and business schools
• Note that all of the content you find herein is alive and well at McKinsey, based on my experience and hundreds of interviews, the actual framework presented (TEAM FOCUS) is my new, unique, and hopefully value-adding contribution
What is it?
• A baseline construct of the book published by McGraw Hill entitled “The McKinsey Engagement,” including:
• 9 Primary Areas (TEAM FOCUS) - for team problem-solving
• 27 Rules of Engagement - for guiding the teams to success
• 40 Operating Tactics – for executing best practices
What is included?
• As a checklist of the most important elements of successful team problem solving – includes templates and examples
• As a deeper dive for tutorial lessons – utilizing the web based apps shown on slide 3
• As a source of specific applications, including consulting firm projects, business school field studies/consulting projects, business school case competitions, and executive task forces in corporations – any team problem solving opportunity!
How should I use it?
Source: The McKinsey Engagement by Paul N. Friga

TEAM FOCUS: Links to Web Based Apps
3
Module Area Discussion Link*
Password: teamfocus
Quiz (5 interactive questions per module)
1 Overview http://vimeo.com/36087078 https://kenan-flagler.qualtrics.com/SE/?SID=SV_cZaJdDHXRd1OeBC
2 Talk http://vimeo.com/36083776
https://kenan-flagler.qualtrics.com/SE/?SID=SV_9n1PH9s8GGJX1be
3 Evaluate http://vimeo.com/36082060
https://kenan-flagler.qualtrics.com/SE/?SID=SV_6gugCROKaeW7gzi
4 Assist http://vimeo.com/36079811
https://kenan-flagler.qualtrics.com/SE/?SID=SV_4U6NzpIS2JCpoO0
5 Motivate http://vimeo.com/36066970
https://kenan-flagler.qualtrics.com/SE/?SID=SV_dbwqCGtpMghh97m
6 Frame http://vimeo.com/36108034
https://kenan-flagler.qualtrics.com/SE/?SID=SV_1CeaYJ7PLtsRggs
7 Organize http://vimeo.com/36122822 https://kenan-flagler.qualtrics.com/SE/?SID=SV_d7pUVJORr20eGbi
8 Collect http://vimeo.com/36167577 https://kenan-flagler.qualtrics.com/SE/?SID=SV_2n1mIsZbaiL4VTK
9 Understand http://vimeo.com/36310196
https://kenan-flagler.qualtrics.com/SE/?SID=SV_bpyB6RLSbQEAjcw
10 Synthesize http://vimeo.com/36316152 https://kenan-flagler.qualtrics.com/SE/?SID=SV_0puRBwqUiKzMNIo
Source: The McKinsey Engagement by Paul N. Friga * Approximately 20 minutes per module
NOTE: The web based apps are designed around the case study “UNC Printing Services”

The TEAM FOCUS “Rules of Engagement”
4
Talk
• Communicate constantly
• Listen attentively
• Separate issues from people
Evaluate
• Discuss group dynamics
• Set expectations and monitor results
• Develop and reevaluate a personal plan
Assist
• Leverage expertise
• Keep teammates accountable
• Provide timely feedback
Motivate
• Identify unique motivators
• Positively reinforce teammates
• Celebrate achievements
Frame
• Identify the key question
• Develop the issue tree
• Formulate hypotheses
Organize
• Develop a high-level process map
• Create a content map to test hypotheses
• Design the story line
Collect
• Design “ghost charts” to exhibit necessary data
• Conduct meaningful interviews
• Gather relevant secondary data
Understand
• Identify the “so what(s)”
• Think through the implications for all constituents
• Document the key insight on all charts
Synthesize
• Obtain input and ensure buy-in from client
• Offer specific recommendations for improvement
• Tell a good story FO
CU
S
TE
AM
Source: The McKinsey Engagement by Paul N. Friga

The FOCUS Analytical Process Map
Conclusion Analysis Data
Info Type
1
Info Type
2
Info Type
3
Info Type
4
Key
Question
• Info
•
•
• Info
•
•
• Info
•
•
• Info
•
•
Hypo-
thesis 1
Hypo-
thesis 2
Hypo-
thesis 3
• Finding
•
•
• Finding
•
•
• Finding
•
•
Insight 1
Insight 2
Insight 3
Recommend
Iterate
Frame Organize Collect Understand Synthesize
5
Source: The McKinsey Engagement by Paul N. Friga

TALK: Key Questions
Source: The McKinsey Engagement by Paul N. Friga
6
Who is on the team?
When should we meet?
How should we communicate?
T E M A F O U C S

TALK: Rules
7
Communicate constantly
Listen attentively
Separate issues from people
Source: The McKinsey Engagement by Paul N. Friga T E M A F O U C S

TALK: Tactics
8
Tactic 1: Document and share all contact information for the entire internal and external team, identify the key communication point players (who will contact whom), and the overall scope of the project.
Tactic 2: Agree upon a meeting schedule that matches the nature of the project, but try to meet in person as a full team at least weekly (include the client in some meetings) or daily for one- to two-week projects.
Tactic 3: All meetings should have a clear agenda (or issues to discuss), produce specific deliverables, and result in new action plans.
Tactic 4: Use email frequently to keep the team updated on progress and use a brief and consistent format – remember that over-communication is better than under-communication.
Tactic 5: When evaluating pros/cons of issues and ideas, remember to separate the issue/idea from the person (once presented, everyone evaluates the merit without any personal attachment).
Source: The McKinsey Engagement by Paul N. Friga T E M A F O U C S

TALK: Team Charter
9
TEAM NAME :
(Be Creative)
CLIENT NAME :
(If Applicable)
PROJECT DESCRIPTION :
(One Sentence)
POTENTIAL ISSUES :
(By End of Project)
SUCCESS GOALS :
(By End of Project)
GUIDING PRINCIPLES :
(No More Than 3)
CONTACT INFORMATION (Include Client Team Members)
Name Role Email Phone (W) Phone (M)
Team Member 1
Team Member 2
Team Member 3
Team Member 4
Team Member 5
Source: The McKinsey Engagement by Paul N. Friga T E M A F O U C S
TEMPLATES

TALK: Letter of Agreement
10
Source: The McKinsey Engagement by Paul N. Friga T E M A F O U C S
TEMPLATES

EVALUATE: Listening Skill Development
11
1. Release your agenda – suspend your communication
goals and don’t interrupt
2. Attend to the speaker – orient your body to the speaker,
maintain eye contact, watch for non-verbals, reflect the
speakers physical attitude
3. Amplify the speaker’s ideas – encourage (verbal and
nonverbal), clarify, build
4. Reflect the speaker’s ideas – summarize, paraphrase,
contrast and note feelings
Source: The McKinsey Engagement by Paul N. Friga T E M A F O U C S
TEMPLATES

EVALUATE: Key Questions
12
What are the individual working styles of team
members?
How shall we get along?
Who is responsible for what?
How is everyone doing?
Source: The McKinsey Engagement by Paul N. Friga T E M A F O U C S

EVALUATE: Rules
13
Openly discuss group dynamics
Set expectations and monitor results
Develop and reevaluate a personal plan
Source: The McKinsey Engagement by Paul N. Friga T E M A F O U C S

EVALUATE: Tactics
14
Tactic 6: Identify the personality types of the team members (including the client) – consider using Myers Briggs.
Tactic 7: Hold a brief, relaxed session at the outset of the project to discuss personalities and working preferences. Keep the dialogue open over the course of the project.
Tactic 8: Be aware of your default tendencies, but incorporate flexibility to deal with different personality types as needed.
Tactic 9: Each team member should identify and document his one or two primary objectives in the project.
Tactic 10: The team should openly discuss and reconcile individuals’ personal objectives.
Tactic 11: Establish procedures for handling disagreements and giving/receiving feedback.
Tactic 12: Hold regular feedback sessions to allow time for improvement.
Source: The McKinsey Engagement by Paul N. Friga T E M A F O U C S

EVALUATE: Individual Development Plan
15
Name :
Project :
Incoming Strengths & Weaknesses :
Special Development Objectives :
Results :
Source: The McKinsey Engagement by Paul N. Friga T E M A F O U C S
TEMPLATES

EVALUATE: Myers-Briggs Profile Scales
16
Extraversion Introversion
Sensing
Thinking
Judgement
Intuitive
Feeling
Perception
(Direction of Focus) (Direction of Focus)
(Ways of gathering information)
(Ways of coming to conclusions, decision making)
(Attitude toward the outer world) Source: Fleisher & Bensoussan, 2002
Source: The McKinsey Engagement by Paul N. Friga T E M A F O U C S
TEMPLATES
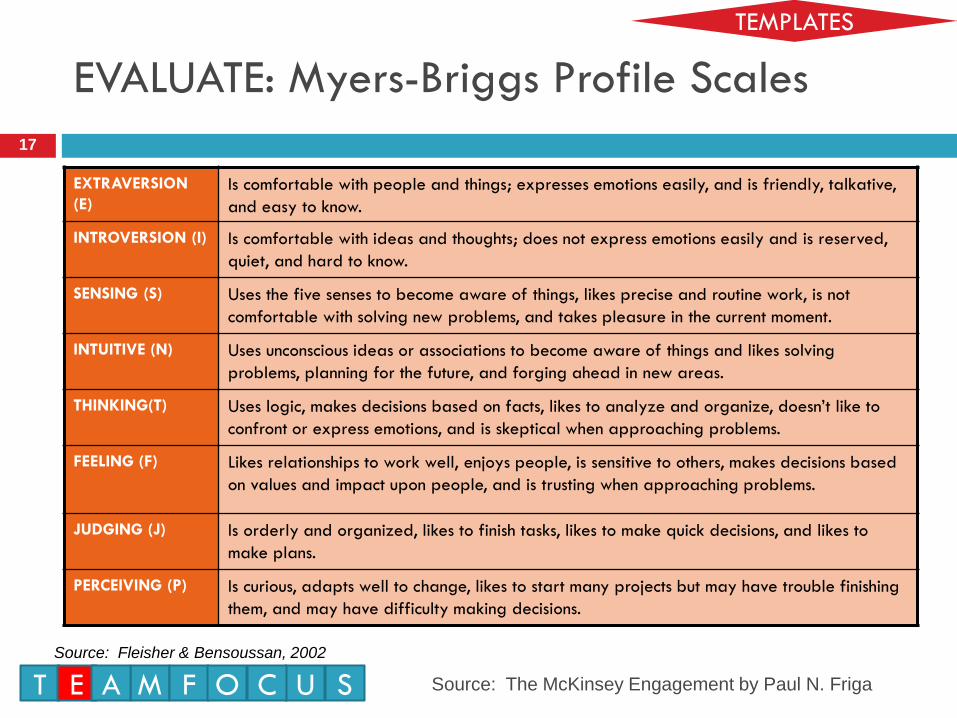
17
EXTRAVERSION
(E)
Is comfortable with people and things; expresses emotions easily, and is friendly, talkative,
and easy to know.
INTROVERSION (I) Is comfortable with ideas and thoughts; does not express emotions easily and is reserved,
quiet, and hard to know.
SENSING (S) Uses the five senses to become aware of things, likes precise and routine work, is not
comfortable with solving new problems, and takes pleasure in the current moment.
INTUITIVE (N) Uses unconscious ideas or associations to become aware of things and likes solving
problems, planning for the future, and forging ahead in new areas.
THINKING(T) Uses logic, makes decisions based on facts, likes to analyze and organize, doesn’t like to
confront or express emotions, and is skeptical when approaching problems.
FEELING (F) Likes relationships to work well, enjoys people, is sensitive to others, makes decisions based
on values and impact upon people, and is trusting when approaching problems.
JUDGING (J) Is orderly and organized, likes to finish tasks, likes to make quick decisions, and likes to
make plans.
PERCEIVING (P) Is curious, adapts well to change, likes to start many projects but may have trouble finishing
them, and may have difficulty making decisions.
Source: The McKinsey Engagement by Paul N. Friga
Source: Fleisher & Bensoussan, 2002
T E M A F O U C S
EVALUATE: Myers-Briggs Profile Scales
TEMPLATES

Participant E/I S/N T/F J/P
Your Guess
Actual
Your Guess
Actual
Your Guess
Actual
Your Guess
Actual
18
EVALUATE: Your Team Members
Source: The McKinsey Engagement by Paul N. Friga T E M A F O U C S
TEMPLATES
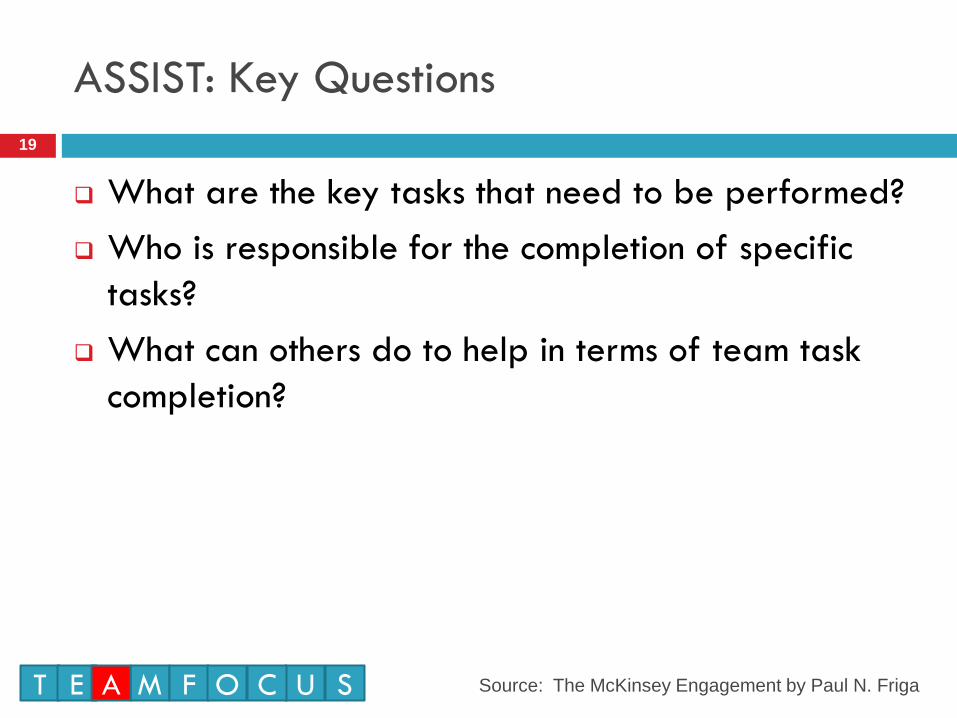
ASSIST: Key Questions
19
What are the key tasks that need to be performed?
Who is responsible for the completion of specific
tasks?
What can others do to help in terms of team task
completion?
Source: The McKinsey Engagement by Paul N. Friga T E M A F O U C S

ASSIST: Rules
20
Leverage expertise
Keep teammates accountable
Provide timely feedback
Source: The McKinsey Engagement by Paul N. Friga T E M A F O U C S

21
Tactic 13: First spend at least 1 hour in a general brainstorming session to openly discuss the problem and key issues to explore (see the “Organize” section later in this model).
Tactic 14: Be sure to balance out the load equitably based upon the estimated number of hours to complete the tasks - revisit the assignments after work has begun to ensure continued equitable work distribution.
Tactic 15: Identify and leverage the specific skill set of each team member (and the firm/client, if applicable).
Tactic 16: Include at least one or two key status report meetings with the team (and the client) to review findings, data sources, and work streams.
Tactic 17: On a daily basis, provide an update of individual and team progress to assess opportunities to adjust workload and assignments.
ASSIST: Tactics
Source: The McKinsey Engagement by Paul N. Friga T E M A F O U C S
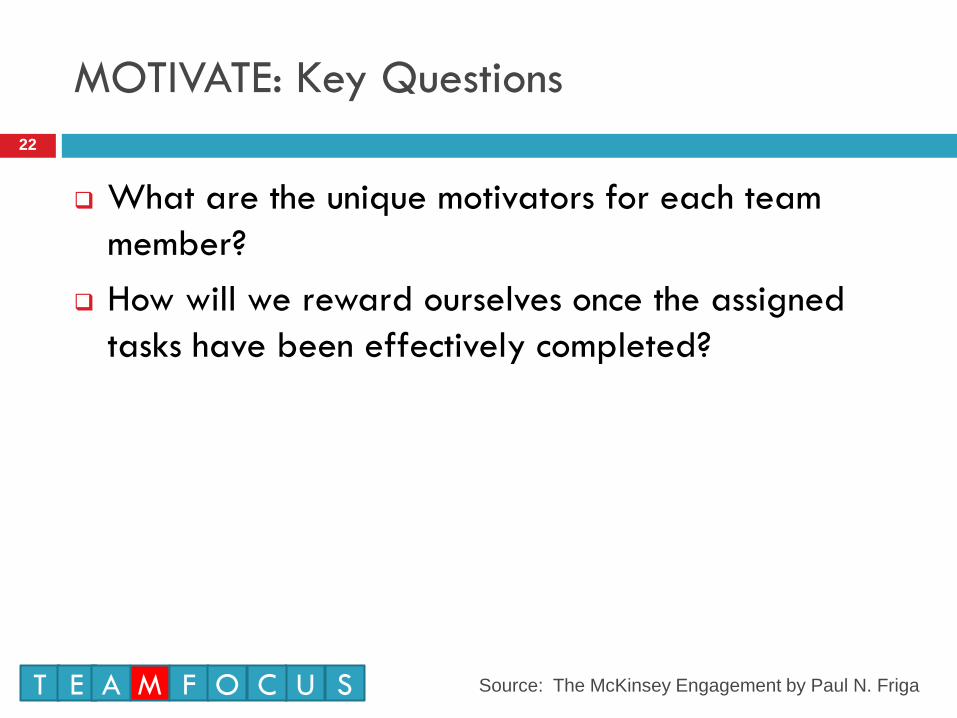
MOTIVATE: Key Questions
22
What are the unique motivators for each team
member?
How will we reward ourselves once the assigned
tasks have been effectively completed?
Source: The McKinsey Engagement by Paul N. Friga T E M A F O U C S
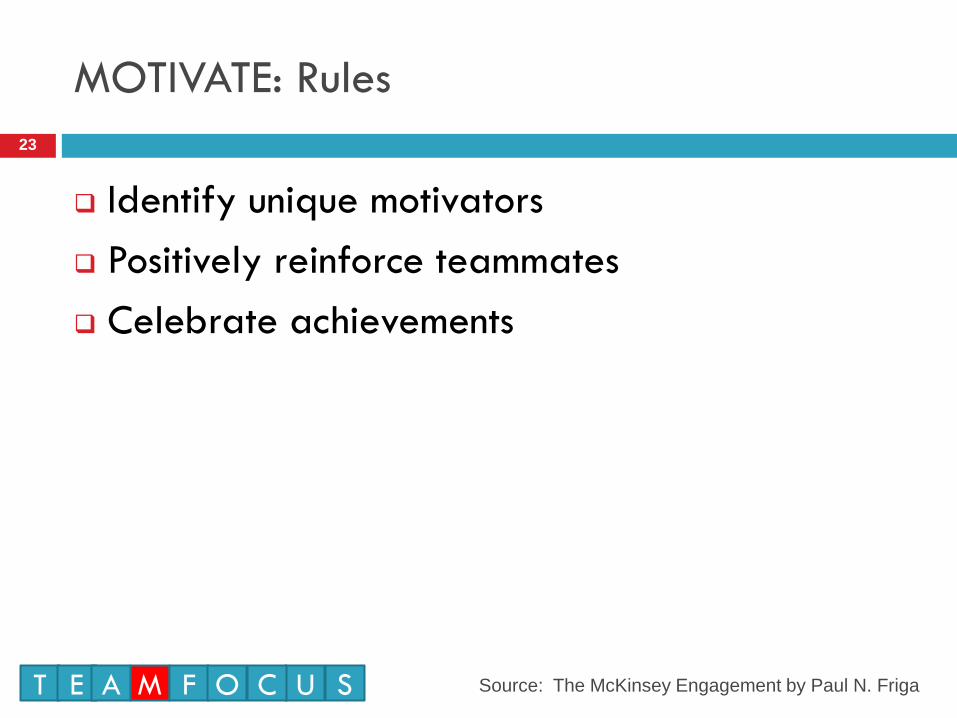
MOTIVATE: Rules
23
Identify unique motivators
Positively reinforce teammates
Celebrate achievements
Source: The McKinsey Engagement by Paul N. Friga T E M A F O U C S

MOTIVATE: Tactics
24
Tactic 18: Identify and discuss one primary and
one secondary motivator for each person (the
source of energy for each team member).
Tactic 19: Give praise for and celebrate each
major team milestone; share compliments with
team members on a daily basis.
Tactic 20: Have a social gathering after the
project is complete.
Source: The McKinsey Engagement by Paul N. Friga T E M A F O U C S

MOTIVATE: Motivation Chart
25
Source
• __e.g. Financial
• ___e.g. Recognition
• ___e.g. Development
• ___e.g. Contribution
Person
• _____________
• _____________
• _____________
Motivators
Source: The McKinsey Engagement by Paul N. Friga T E M A F O U C S
TEMPLATES

FRAME: Key Questions
26
What are the key questions that we are trying to
answer?
What are the parameters of our analysis?
What is our hypothesis?
Source: The McKinsey Engagement by Paul N. Friga T E M A F O U C S
FRAME: Rules
27
Identify the key question
Develop the issue tree (MECE)
Formulate hypotheses
Source: The McKinsey Engagement by Paul N. Friga T E M A F O U C S

FRAME: Tactics
28
Tactic 21: Identify the key question to drive the project, which should be based upon specific discussions with the client.
Tactic 22: Document this question, the scope, and the high-level plan of attack in an engagement letter.
Tactic 23: Specifically identify the temporal (years under study), geographical, and functional areas for the project.
Tactic 24: Avoid common “Scope Creep,” when additional work is added that is beyond the original parameters or is only tangentially relevant. Refer back to the base problem, parameters, and engagement letter to mitigate “Scope Creep.”
Tactic 25: Develop a general hypothesis that is a potential answer to the problem at hand.
Tactic 26: Develop supporting hypotheses that must be true to support the general hypothesis (for testing).
Tactic 27: Revisit and revise the hypotheses during the project as data are gathered (prove or disprove them).
Source: The McKinsey Engagement by Paul N. Friga T E M A F O U C S

•
•
•
•
•
•
•
•
•
•
•
•
1. Identify key question
2. Develop information tree
3. Formulate hypotheses
H1:
H2:
H3:
FRAME: Content Map
TEMPLATES
Source: The McKinsey Engagement by Paul N. Friga
29
T E M A F O U C S

ORGANIZE: Key Questions
30
What needs to be true for the hypotheses to be
correct/incorrect?
What should we not analyze for now?
Source: The McKinsey Engagement by Paul N. Friga T E M A F O U C S

ORGANIZE: Rules
31
Develop a high-level process map
Create a content map to test hypotheses
Design the story line
Source: The McKinsey Engagement by Paul N. Friga T E M A F O U C S

ORGANIZE: Tactics
32
Tactic 28: Maintain objectivity as the hypotheses are tested during the project.
Tactic 29: Use frameworks as a starting point to identify issues for analysis.
Tactic 30: Explicitly list the types of analysis and related data that the team will and will not pursue (at least for that stage in the project life-cycle).
Tactic 31: Revisit this list if the hypotheses are modified.
Source: The McKinsey Engagement by Paul N. Friga T E M A F O U C S

ORGANIZE: Process Map
33
Phase 1 2 3
Primary Objective
Frame, Organize, and Collect
Develop a Situational Understanding
Understand
Create a Preliminary Storyline
Synthesize
Finalize Report
Deliverables
Work Plan
Preliminary Fact Pack
Interview Summaries
Incorporation example overview
(Avon)
Ghost Deck
Interview Summaries
Revised Fact Pack
Executive Summary
Final Report
Appendix
Completion Date
Source: The McKinsey Engagement by Paul N. Friga T E M A F O U C S
TEMPLATES

34
Key line Support Analysis Data source Resp. Date
Governing thought
ORGANIZE: Content Map
Source: The McKinsey Engagement by Paul N. Friga T E M A F O U C S
TEMPLATES
35
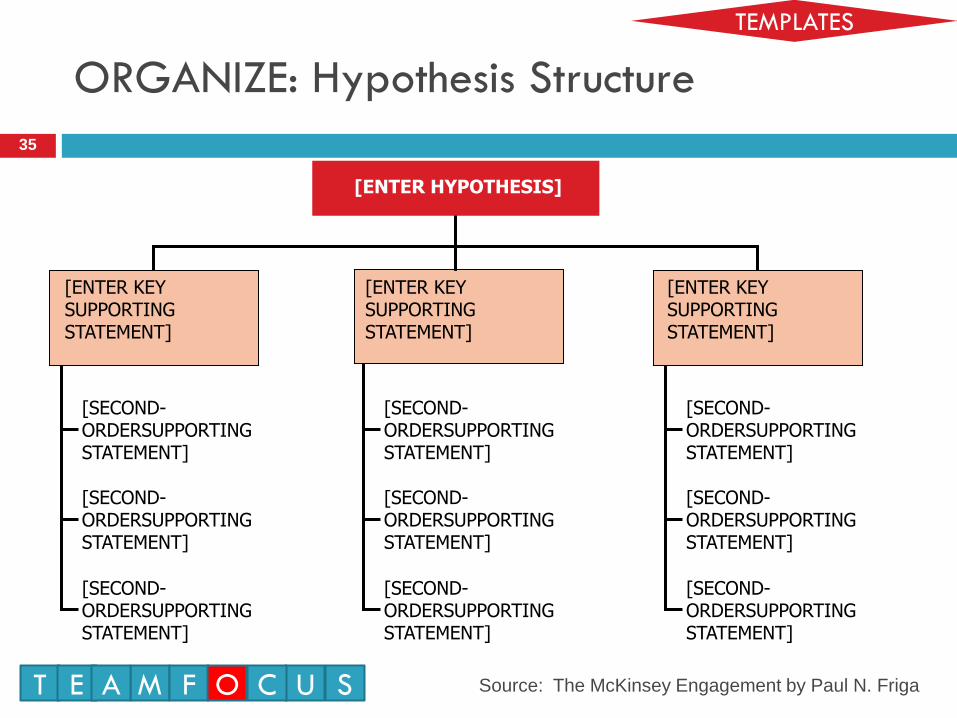
[SECOND- ORDERSUPPORTING STATEMENT]
[SECOND- ORDERSUPPORTING STATEMENT]
[SECOND- ORDERSUPPORTING STATEMENT]
[ENTER KEY SUPPORTING STATEMENT]
[SECOND- ORDERSUPPORTING STATEMENT]
[SECOND- ORDERSUPPORTING STATEMENT]
[SECOND- ORDERSUPPORTING STATEMENT]
[ENTER KEY SUPPORTING STATEMENT]
[SECOND- ORDERSUPPORTING STATEMENT]
[SECOND- ORDERSUPPORTING STATEMENT]
[SECOND- ORDERSUPPORTING STATEMENT]
[ENTER KEY SUPPORTING STATEMENT]
[ENTER HYPOTHESIS]
ORGANIZE: Hypothesis Structure
Source: The McKinsey Engagement by Paul N. Friga T E M A F O U C S
TEMPLATES

36
We should exit the low-end PC business
It is not profitable
This market will continue to shrink
Our other busi-ness do not require us to serve the low-end market
Mid-tier will expand
Core customers are decreasing
Experts predict so
Experts predict so
Core cus- tomers are decreasing
mid-tier will expand
Work plan
Statement: we should exit from the low-end PC business
Key line
This
market
will con-
tinue
to
shrink
Support Ana- lysis
Data source Resp. Date
ORGANIZE: Hypothesis Testing
Source: The McKinsey Engagement by Paul N. Friga T E M A F O U C S
TEMPLATES

ORGANIZE: Storyline (Sample)
37
Executive
Overview
Topics to Cover
(Key Supporting
Points)
Main Point 1
Main Point 3
Supporting
Slide(s)
Main Point 2
Supporting
Slide(s)
Supporting
Slide(s)
Main Point 4
Main
Recommendations
/ Governing
Thoughts
Supporting
Slide(s)
Conclusion
Source: The McKinsey Engagement by Paul N. Friga T E M A F O U C S
TEMPLATES

COLLECT: Key Questions
38
What data do we need (based upon the questions
to answer)?
What primary and secondary sources should we
utilize?
Source: The McKinsey Engagement by Paul N. Friga T E M A F O U C S

COLLECT: Rules
39
Design “ghost charts” to exhibit necessary data
Conduct meaningful interviews
Gather relevant secondary data
Source: The McKinsey Engagement by Paul N. Friga T E M A F O U C S

COLLECT: Tactics
40
Tactic 32: Design ghost charts to exhibit the necessary data relevant to the overall story.
Tactic 33: Always cite the source of data on each chart created.
Tactic 34: Use primary research and especially interview the client personnel – document interview guides ahead of time and share the insights with the team in written form within 24 hours.
Source: The McKinsey Engagement by Paul N. Friga T E M A F O U C S

COLLECT: Interview Guide Tool
41
Background of Interviewee
Introduction
Key questions to ask
1. How does the annexation process in IN work?
2. The Avon incorporation example
3. Lessons learned and tips for White River Township
Interviewee:
Date:
Interviewer:
Topic:
T E M A F O U C S Source: The McKinsey Engagement by Paul N. Friga
TEMPLATES

COLLECT: Interview Summary Tool
42
2. There are several challenges that can be overcome
Lots of analysis necessary
He likened annexation to a business transaction. The problem seems to
be that an offer is made, but not accepted by some because it is not
explained. The offer needs to be clear, translated into dollars and
cents. People respond emotionally to tax issues. Municipalities need to
approach them with a benefit-cost analysis.
Significant communication effort
Those annexations that involved good communication went well and
those that involved poor or non-existent communication had problems.
People should have more power.
Notification and communication with citizens and townships are
important.
Funding for mailings and other process requirements
3. Annexation is a slow and complex process
It took a long time
The fight lasted more than a year, during which Westfield launched an
aggressive campaign to win over landowners.
Legal requirements
De-annexation is an option if cities fail to provide services- within a
three-year time frame.
It would be even longer and more complex for the size of the WRT
annexation Approximately 10 – 30 times as large
Key insights:
1. Avon is a relevant example
2. There are several challenges that can be overcome
3. Annexation is a slow and complex process
1. Avon is relevant
It’s recent – 1995
Rationale / motivation for incorporation was better services and
more control
Farmers were selling their land to the highest bidder, and
the highest bidder was often an irresponsible developer –
the development often wasn’t what the town had planned
or would like to see. If the town had incorporated earlier,
they could have prevented much of the bad development
with zoning guidelines.
They had crime spilling over from Plainfield.
Wanted to annex 1100 acres in Hendricks County
Citizen and govt. effort led to actual incorporation of a new
town
They didn’t annex enough land, though, and they are still
dealing with bad development on the outskirts of town.
When Avon tries to annex more land, they are annexing
poorly developed land, not free land that can be used
for business development.
T E M A F O U C S Source: The McKinsey Engagement by Paul N. Friga
TEMPLATES
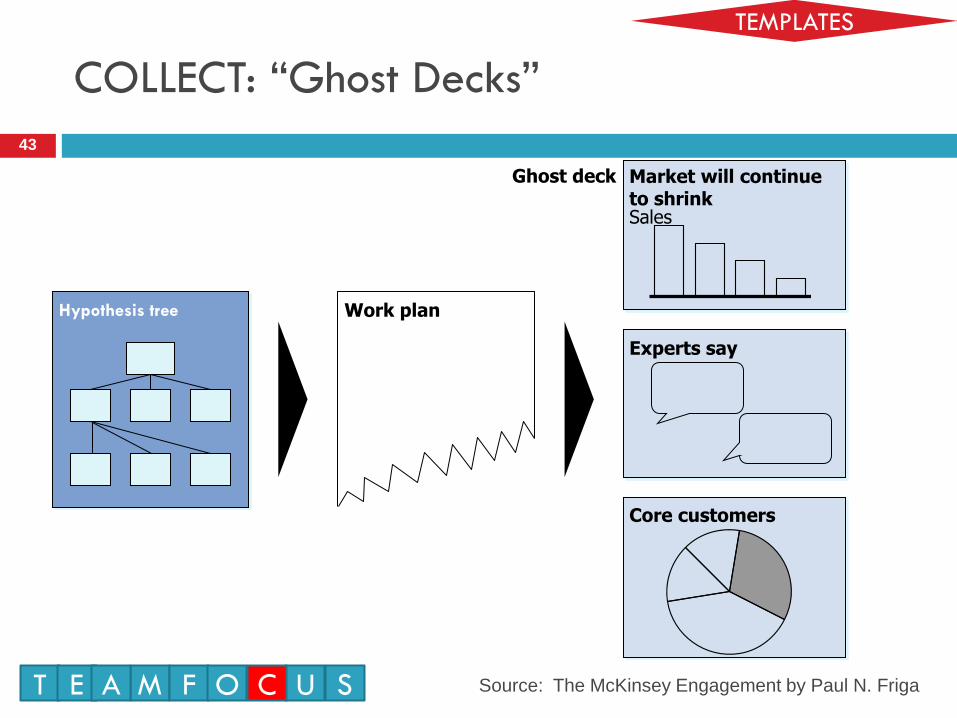
43
Hypothesis tree Work plan
Market will continue to shrink Sales
Experts say
Core customers
Ghost deck
COLLECT: “Ghost Decks”
Source: The McKinsey Engagement by Paul N. Friga T E M A F O U C S
TEMPLATES
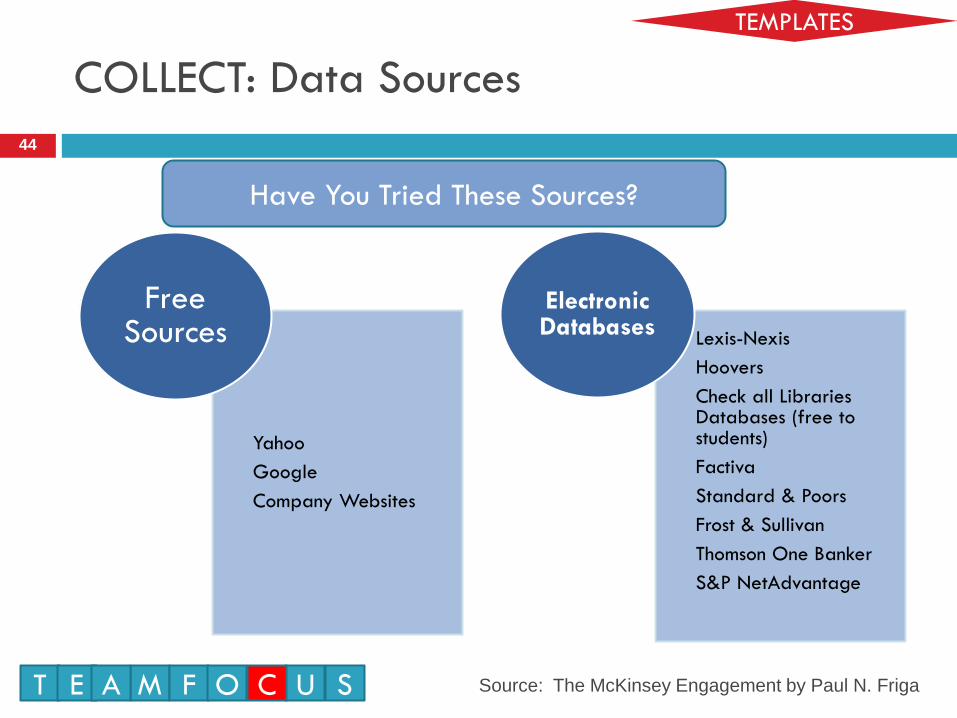
COLLECT: Data Sources
44
Yahoo
Company Websites
Free Sources Lexis-Nexis
Hoovers
Check all Libraries Databases (free to students)
Factiva
Standard & Poors
Frost & Sullivan
Thomson One Banker
S&P NetAdvantage
Electronic Databases
Have You Tried These Sources?
Source: The McKinsey Engagement by Paul N. Friga T E M A F O U C S
TEMPLATES

UNDERSTAND: Key Questions
45
What are the “so whats” of our analysis?
Source: The McKinsey Engagement by Paul N. Friga T E M A F O U C S

46
Identify the “so what(s)”
Think through the implications to all constituents
Document the key insight on all charts
Source: The McKinsey Engagement by Paul N. Friga T E M A F O U C S
UNDERSTAND: Rules

UNDERSTAND: Tactics
47
Tactic 35: Ask “so what” to sort through the
analysis to find out what is ultimately important.
Tactic 36: Estimate the impact of the
recommendations on the client’s operations.
Source: The McKinsey Engagement by Paul N. Friga T E M A F O U C S

UNDERSTAND: Chart Examples
48
Vertical Bar Chart
Line
Trends
Waterfall Chart
Pie Chart
Compositions
Document structuring
Text
• aslkfdkdsklfj lasdkfj asdlkfj aslkdfj asldh gf
• aslkfdkdsklfj lasdkfj asdlkfj aslkdfj asldh gf
• aslkfdkdsklfj lasdkfj asdlkfj asl
Framework
Horizontal Bar Chart
Comparison Bar Chart
Scatter Plot
Relationships/ Comparison
Source: The McKinsey Engagement by Paul N. Friga T E M A F O U C S
TEMPLATES
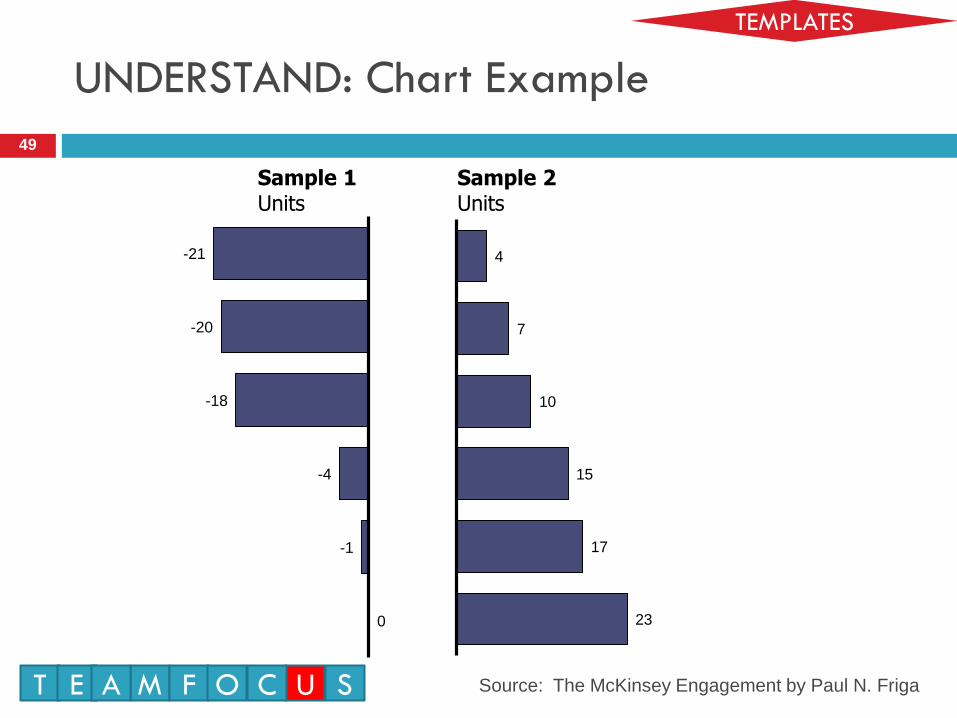
49
-21
-20
-18
-4
-1
0
4
7
10
15
17
23
Sample 1 Units
Sample 2 Units
Source: The McKinsey Engagement by Paul N. Friga T E M A F O U C S
TEMPLATES
UNDERSTAND: Chart Example

50
51
61
72
66
65
50
ABC
ABC
ABC
ABC
ABC
ABC
Chart name Units
Source: Insert Source
Source: The McKinsey Engagement by Paul N. Friga T E M A F O U C S
TEMPLATES
UNDERSTAND: Chart Example

51
20.1
9.2
5.7
65.0 ABC
DEF
GHI
JKL
100% = 84,586
Source: The McKinsey Engagement by Paul N. Friga T E M A F O U C S
TEMPLATES
UNDERSTAND: Chart Example
Source: Insert Source
Chart name Units

52
5.1
15.9 21.0
8.8
0.4 11.8
Base Addition New base Less A Less B Remainder
Source: The McKinsey Engagement by Paul N. Friga T E M A F O U C S
TEMPLATES
UNDERSTAND: Chart Example
Source: Insert Source
Chart name Units
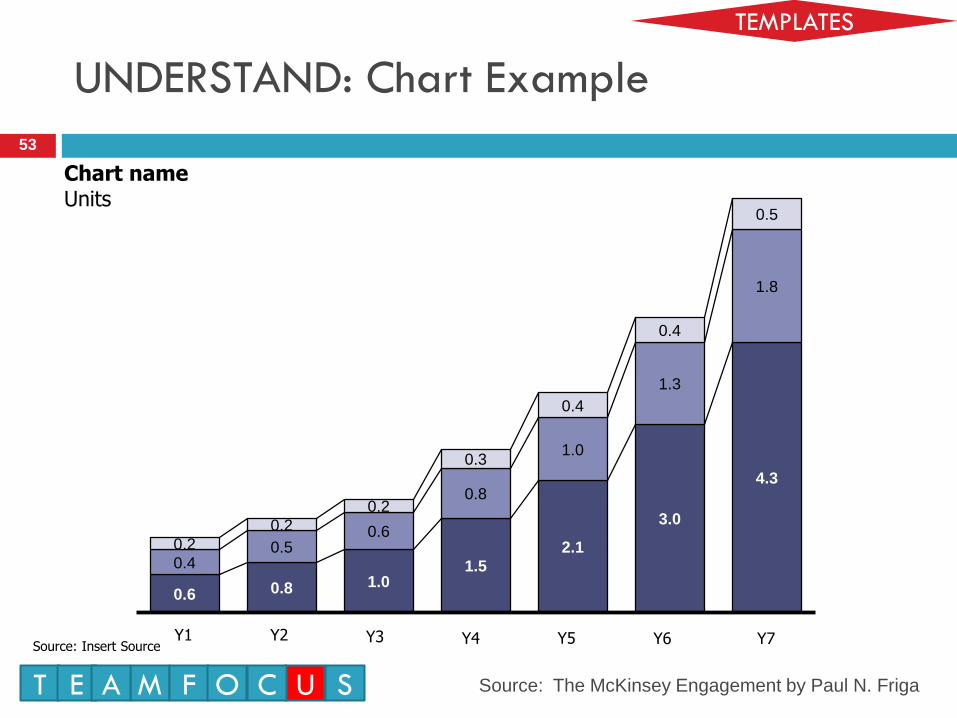
53
0.6 0.8 1.0 1.5
2.1
3.0
4.3
0.4 0.5
0.6
0.8
1.0
1.3
1.8
0.2
0.2
0.2
0.3
0.4
0.4
0.5
Y1 Y2 Y3 Y4 Y5 Y6 Y7
Source: The McKinsey Engagement by Paul N. Friga T E M A F O U C S
TEMPLATES
UNDERSTAND: Chart Example
Source: Insert Source
Chart name Units

54
100% =
Series name
5 7 5
20 23
12
65 48
40
10 22
43
Series name
Series name
Series name
$XX million $YY million $ZZ million
DEF ABC GHI
Source: The McKinsey Engagement by Paul N. Friga T E M A F O U C S
TEMPLATES
UNDERSTAND: Chart Example
Source: Insert Source
Chart name Percentage

55
3.3
7.2
12.4
18.8
28.9
37.4
ABC ABC ABC ABC ABC
2000 – 2005 annual CAGR =
XX%
ABC
Source: The McKinsey Engagement by Paul N. Friga T E M A F O U C S
TEMPLATES
UNDERSTAND: Chart Example
Source: Insert Source
Chart name Units

56
0.5
1.1
1.9
2.8
4.2
5.0
0.4
0.9
1.4
2.0
2.5
4.2
[ENTER CONCLUSION/ “SO WHAT” HERE
ABC ABC ABC ABC ABC ABC
[SERIES 1]
[SERIES 2]
Source: The McKinsey Engagement by Paul N. Friga T E M A F O U C S
TEMPLATES
UNDERSTAND: Chart Example
Source: Insert Source
Chart name Units
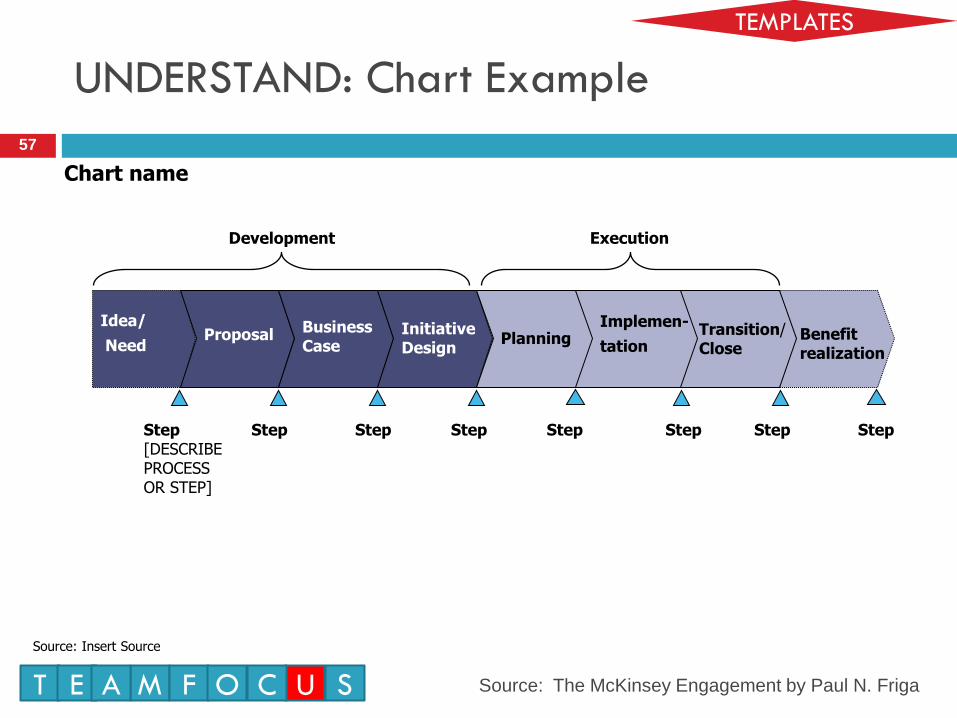
57
Benefit realization
Idea/
Need
Proposal
Business Case
Initiative Design
Planning Transition/ Close
Step [DESCRIBE PROCESS OR STEP]
Execution
Implemen-
tation
Development
Step Step Step Step Step Step Step
Source: The McKinsey Engagement by Paul N. Friga T E M A F O U C S
TEMPLATES
UNDERSTAND: Chart Example
Source: Insert Source
Chart name
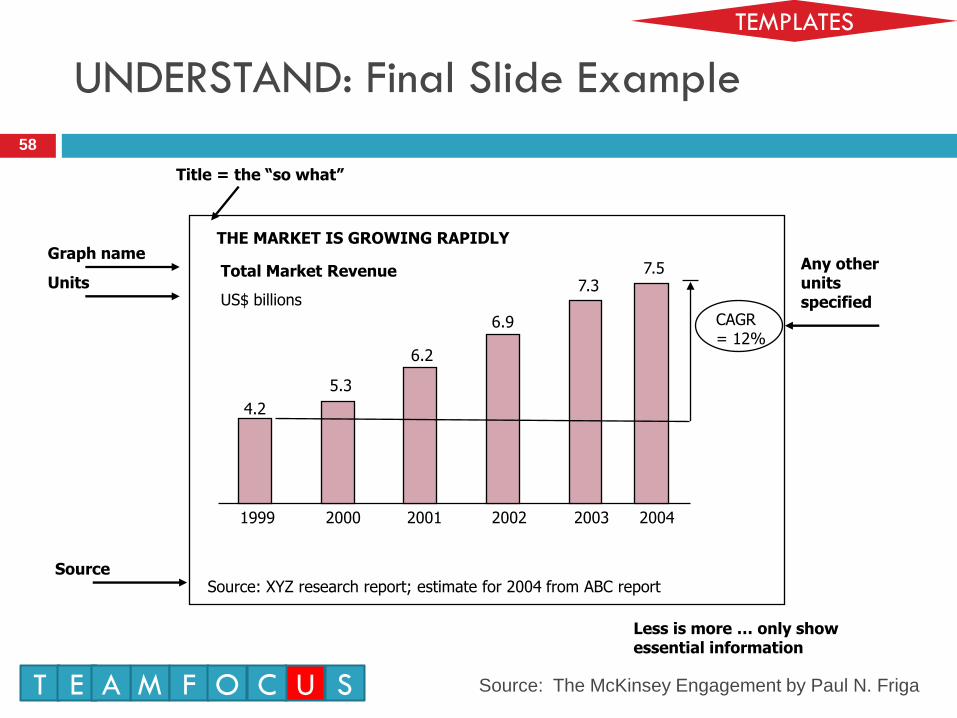
58
THE MARKET IS GROWING RAPIDLY
Total Market Revenue
US$ billions
4.2
Source: XYZ research report; estimate for 2004 from ABC report
5.3
6.2
6.9
7.3 7.5
CAGR= 12%
1999 2000 2001 2002 2003 2004
Title = the “so what”
Graph name
Units
Source
Any other units specified
Less is more … only show essential information
Source: The McKinsey Engagement by Paul N. Friga T E M A F O U C S
TEMPLATES
UNDERSTAND: Final Slide Example
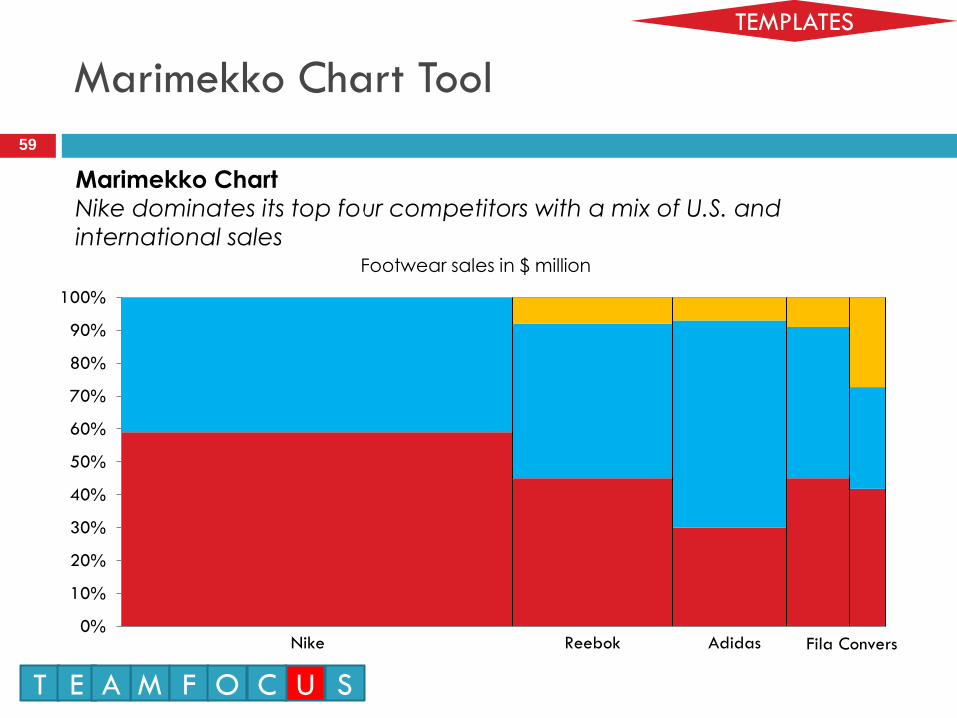
Marimekko Chart Tool
Marimekko Chart
Nike dominates its top four competitors with a mix of U.S. and
international sales Footwear sales in $ million
0%
10%
20%
30%
40%
50%
60%
70%
80%
90%
100%
Adidas Fila Convers
Reebok Nike
T E M A F O U C S
59
TEMPLATES

Bar-Mekko Chart Tool
Bar-mekko Chart
While more women’s footwear is sold, the average sales price is higher
for men’s footwear.
$41
$51
$30
$22
10
20
30
40
50
$60
Juniors' Infants' Men's Women's
Average Price per Pair
Average price $42.50
Sales (in $ billion) $6.7 $6.1 $1.5 $0.2
Pairs Sold (in millions) 162.6 119.0 48.7 10.5
Total= 340.8 Million Pairs Sold
T E M A F O U C S
60
TEMPLATES

Cascade (or Waterfall) Chart Tool
3.0B 2.5B
2.3B 1.8B
1.2B 0.9B 0.8B 0.5B 0.3B 0.2B 0.2B 1.1B 14.8B
0
5
10
$15B
Sales by Category (in $ Billion)
Cascade (or Waterfall)
Basketball, cross-training, and running are the three largest
categories of athletic footwear
T E M A F O U C S
61
TEMPLATES

Cluster Bar Chart Tool
Cluster Bar Chart
Nike sales were predominately from the U.S., while Adidas sales
were predominately international
3,797
1,229
490
2,640
1,098 1,172
308 212
0
1,000
2,000
3,000
$4,000
Nike Reebok Adidas
Footw
ear
Sa
les
in $
millions
U.S.
International
Licensed
T E M A F O U C S
62
TEMPLATES

Stacked Bar Chart Tool
Nike, 3,261 Nike, 3,797
Reebok, 1,193
Reebok, 1,229 Adidas, 390
Adidas, 490 Fila, 555
Fila, 488 Converse, 194
Converse, 285 Others, 1,622
Others, 1,785
0
2,000
4,000
6,000
8,000
$10,000
1996 1997
Footw
ear
Sa
les
in $
million
CAGR
12%
10%
47%
-12%
26%
3%
16%
$7,215
$8,074
Stacked Bar Chart
Fila sales decreased significantly, while converse sales
increased by almost 50%
T E M A F O U C S
63
TEMPLATES

Horizontal Cluster Bar Chart Tool
Horizontal Cluster Bar Chart
Fila sales decreased significantly, while converse sales increased by
almost 50%
165
407
1,172
1,098
2,640
285
488
490
1,229
3,797
0 1,000 2,000 3,000 $4,000
Converse
Fila
Adidas
Reebok
Nike
Footwear sales in $ millions
U.S.
International
T E M A F O U C S
64
TEMPLATES

100% Stacked Bar Chart Tool
100% Stacked Bar Chart
Nike dominates U.S. branded athletic footwear market
Nike 47%
Reebok 15%
Adidas 6%
Fila 6%
Converse 4% New Balance 3%
Airwalk 2%
Keds 2%
Footjoy 2% Others 11%
0%
20%
40%
60%
80%
100%
1997
$8,074
T E M A F O U C S
65
TEMPLATES

Area Chart Tool
Area Chart
Nike, Adidas and Fila sales grew faster than the industry average over
the past 5 years, while Reebok, Converse and smaller companies fell
behind
Nike
Reebok
Adidas Fila Converse
Others
0
2,000
4,000
6,000
$8,000
1993 1994 1995 1996 1997
CAGR
Industry
6.1%
-2.8%
1.5%
14.4%
20.9%
-0.7%
14.2%
T E M A F O U C S
66
TEMPLATES

100% Area Chart Tool
100% Area Chart
Nike, Adidas and Fila share grew over the past 5 years, while Reebok,
Converse and smaller competitors fell behind
Nike
Reebok
Adidas
Fila
Converse
Others
0%
20%
40%
60%
80%
100%
1993 1994 1995 1996 1997
T E M A F O U C S
67
TEMPLATES

Stacked Bar Line Chart Tool
Stacked Bar Line Chart
Nike’s sales have increased significantly with a greater reliance on non-
U.S. markets. Net income growth has not kept pace with sales growth.
U.S.
Europe
Asia Pacific
Americas
287 329 365 299 400 553 796 400 451 579 590
0
2,000
4,000
6,000
8,000
$10,000
Net Income
($ million)
Sales & Net Income in $ Million
T E M A F O U C S
68
TEMPLATES

Cluster Bar Line Chart Tool
Cluster Bar Line Chart
Price per pair has increased across all four market segments from 1993 to
1997.
$47.7 $46.8 $47.5 $50.5 $51.5
$37.2 $37.0 $37.4 $39.8 $41.1
$26.9 $25.6 $25.8 $28.6
$30.4
$19.9 $19.9 $19.4 $20.6 $22.1
0
20
40
$60
1993 1994 1995 1996 1997
Price per Pair
Retail Sales $12.1B $12.4B $13.3B $14.1B $15.3B
Men’s
Women’s
Junior’s
Infants’
T E M A F O U C S
69
TEMPLATES

Horizontal Stacked Bar Chart Tool
Horizontal Stacked Bar Chart
Nike sales were predominately from the U.S., while Adidas sales were
predominately international. Licensing is a small, but significant, revenue
source for all companies, except Nike.
$590
$1,025
$1,900
$2,300
0 2,000 4,000 6,000 $8,000
Converse
Fila
Adidas
Reebok
Nike
U.S.
Int'l
Licensed
$6,300
Footwear Sales in $ Million
T E M A F O U C S
70
TEMPLATES

Line Chart Tool
Line Chart
Nike overtook Reebok in sales in 1989 and has grown rapidly.
0
1,000
2,000
3,000
$4,000
1988 1989 1990 1991 1992 1993 1994 1995 1996 1997
Nike
Reebok
Footwear Sales in $ Million
T E M A F O U C S
71
TEMPLATES
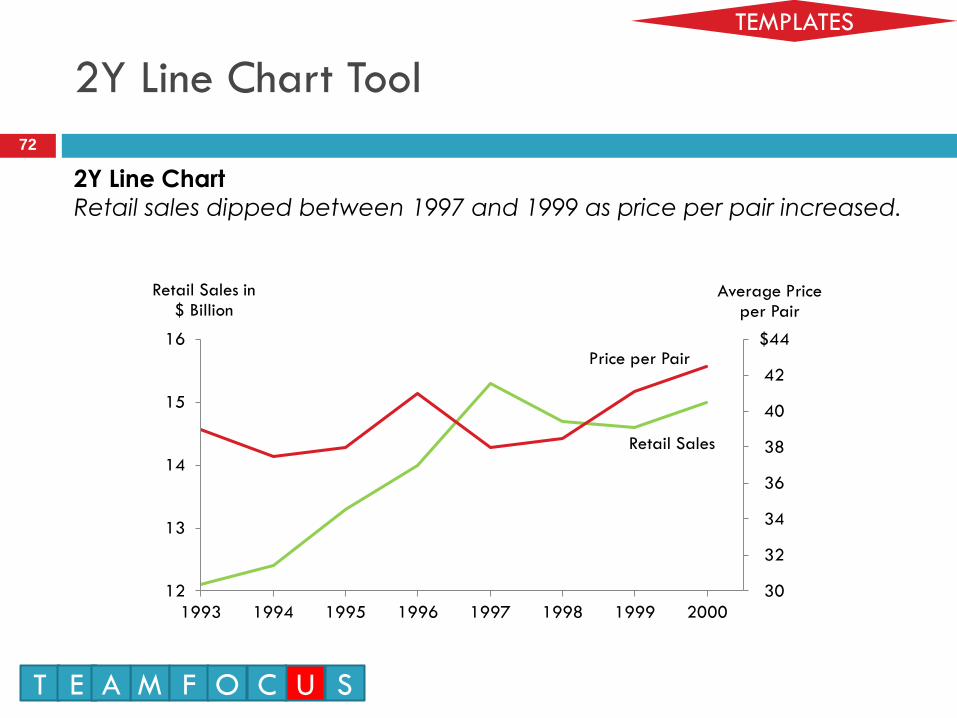
2Y Line Chart Tool
2Y Line Chart
Retail sales dipped between 1997 and 1999 as price per pair increased.
Retail Sales
Price per Pair
30
32
34
36
38
40
42
$44
12
13
14
15
16
1993 1994 1995 1996 1997 1998 1999 2000
Average Price per Pair
Retail Sales in $ Billion
T E M A F O U C S
72
TEMPLATES
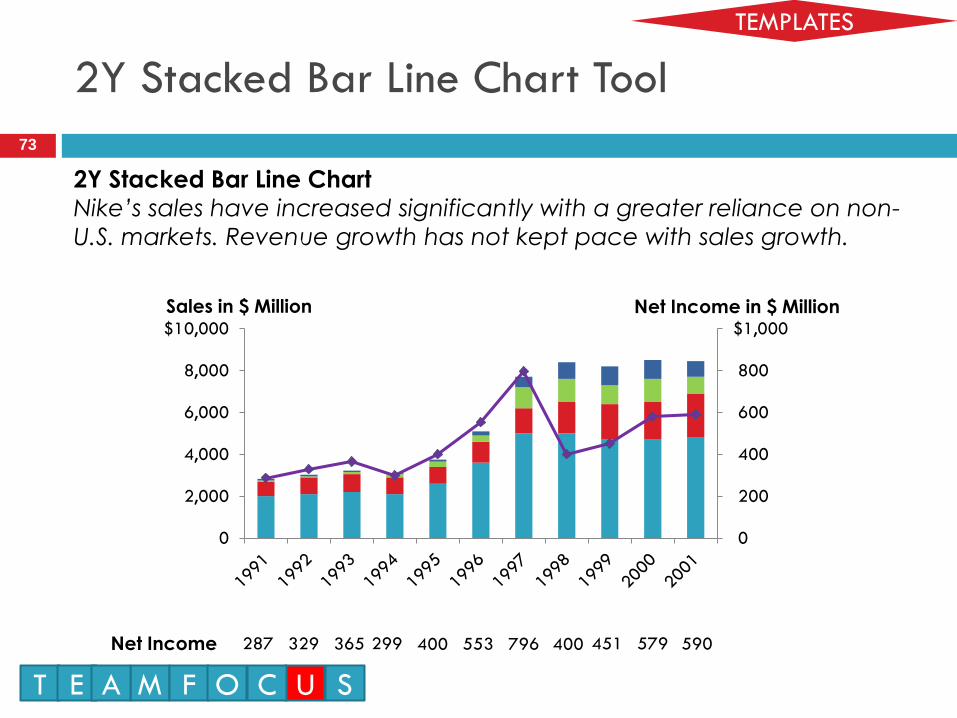
2Y Stacked Bar Line Chart Tool
2Y Stacked Bar Line Chart
Nike’s sales have increased significantly with a greater reliance on non-
U.S. markets. Revenue growth has not kept pace with sales growth.
287 329 365 299 400 553 796 400 451 579 590
0
200
400
600
800
$1,000
0
2,000
4,000
6,000
8,000
$10,000
Sales in $ Million Net Income in $ Million
Net Income
T E M A F O U C S
73
TEMPLATES

2Y Cluster Bar Line Chart Tool
2Y Cluster Bar Line Chart
Retail sales dipped between 1997 and 1999 as price per pair increased
12.1B 12.4B 13.3B
14.1B 15.3B 14.7B 14.5B 15.1B
0
10
20
30
40
$50
0
5
10
15
20
$25
1993 1994 1995 1996 1997 1998 1999 2000
Retail Sales in $ Billion Average Price per Pair R
eta
il Sa
les
T E M A F O U C S
74
TEMPLATES

Pie Chart Tool
Pie Chart
Nike dominates U.S. branded athletic footwear market.
Nike 3,797
Reebok 1,229
Adidas 490
Fila 488
Converse 285
New Balance 265
Airwalk 180
Keds 180
ASICS 130
Footjoy 122
Others 908
T E M A F O U C S
75
TEMPLATES

X-Y Linear Bubble Chart Tool
X-Y Linear Bubble Chart
Nike experienced strong growth in the U.S. and overseas, while Fila
experienced international growth and lower U.S. sales.
-20%
0%
20%
40%
-20% 0% 20% 40%
Nike Fila
Reebok
Adidas
New Balance
Converse
ASICS U.S. Sales Growth
International Sales Growth
X-Y Linear Bubble Chart
T E M A F O U C S
76
TEMPLATES
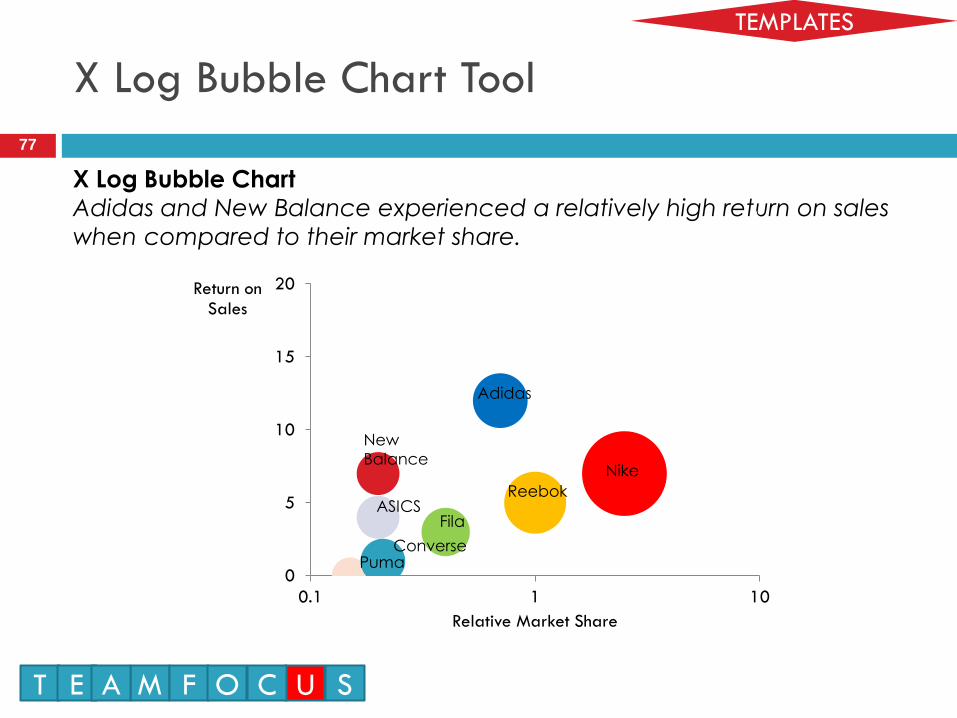
X Log Bubble Chart Tool
X Log Bubble Chart
Adidas and New Balance experienced a relatively high return on sales
when compared to their market share.
0
5
10
15
20
0.1 1 10
Return on Sales
Relative Market Share
Nike
Reebok
Adidas
Fila
New
Balance
ASICS
Converse Puma
T E M A F O U C S
77
TEMPLATES

X-Y Linear Scatter Chart Tool
X-Y Linear Scatter Chart
Of the top 20 companies, five experienced declines in both U.S. and
international sales.
-2
-1.5
-1
-0.5
0
0.5
1
-0.5 0 0.5 1
U.S. Sales Growth
International Sales Growth
T E M A F O U C S
78
TEMPLATES

Gantt Chart Tool
0 7 14 21 28
Ship Date
Deploy
Design
Website
Fix Defects
Test Build
Create Build
Second Iteration
Fix Defects
Test Build
Create Build
First Iteration
QA Product
January
Gantt Chart
Product release project plan.
Tasks
T E M A F O U C S
79
TEMPLATES

SYNTHESIZE: Key Questions
80
What is the story (situation, complication, and
resolution), and what is the best way to tell it?
T E M A F O U C S Source: The McKinsey Engagement by Paul N. Friga
SYNTHESIZE: Rules
81
Obtain input and ensure buy-in from client
Offer specific recommendations for improvement
Tell a good story
T E M A F O U C S Source: The McKinsey Engagement by Paul N. Friga

SYNTHESIZE: Tactics
82
Tactic 37: Tell a story – using a very brief situation and complication, followed by the resolution which is the most important aspect of the project.
Tactic 38: Share the story with the client and the team ahead of time to obtain input and ensure buy-in.
Tactic 39: Keep the story simple and focus on the original problem and specific recommendations for improvement – include estimated impact on the organization.
Tactic 40: Have fun!
T E M A F O U C S Source: The McKinsey Engagement by Paul N. Friga

SYNTHESIZE: Executive Summary Slide
Governing Thought (answer to the key question and summarizes the statements)
Statement #1
Statement #2
Statement #3
Recommendations
Benefits
Reasons
Phases
Supporting Evidence
•
•
•
Supporting Evidence
•
•
•
Supporting Evidence
•
•
•
Findings
Facts
Charts
Diagrams
83
Source: The McKinsey Engagement by Paul N. Friga T E M A F O U C S

The problem-solving and presentation
processes each have their own unique steps 84
Preliminary
Hypothesis
Recommendations
The problem-solving process:
The presentation process:
Data Conclusions Recommendations
Conclusions Data
So what?
Source: The McKinsey Mind – Rasiel and Friga 2001