transporters in hypothalamic astrocytes leptin regulates ... · manuel tena-sempere,3,5 pilar...
TRANSCRIPT
Leptin regulates glutamate and glucosetransporters in hypothalamic astrocytes
Esther Fuente-Martín, … , Tamas L. Horvath, Julie A.Chowen
J Clin Invest. 2012;122(11):3900-3913. https://doi.org/10.1172/JCI64102.
Glial cells perform critical functions that alter the metabolism and activity of neurons, andthere is increasing interest in their role in appetite and energy balance. Leptin, a keyregulator of appetite and metabolism, has previously been reported to influence glialstructural proteins and morphology. Here, we demonstrate that metabolic status and leptinalso modify astrocyte-specific glutamate and glucose transporters, indicating that metabolicsignals influence synaptic efficacy and glucose uptake and, ultimately, neuronal function.We found that basal and glucose-stimulated electrical activity of hypothalamicproopiomelanocortin (POMC) neurons in mice were altered in the offspring of mothers fed ahigh-fat diet. In adulthood, increased body weight and fasting also altered the expression ofglucose and glutamate transporters. These results demonstrate that whole-organismmetabolism alters hypothalamic glial cell activity and suggest that these cells play animportant role in the pathology of obesity.
Research Article Metabolism
Find the latest version:
http://jci.me/64102-pdf
Research article
3900 The Journal of Clinical Investigation http://www.jci.org Volume 122 Number 11 November 2012
Leptin regulates glutamate and glucose transporters in hypothalamic astrocytes
Esther Fuente-Martín,1,2,3 Cristina García-Cáceres,1,2,3 Miriam Granado,1,2,3 María L. de Ceballos,4 Miguel Ángel Sánchez-Garrido,3,5 Beatrix Sarman,6 Zhong-Wu Liu,6 Marcelo O. Dietrich,6 Manuel Tena-Sempere,3,5 Pilar Argente-Arizón,1,2,3 Francisca Díaz,1,3 Jesús Argente,1,2,3
Tamas L. Horvath,6 and Julie A. Chowen1,3
1Hospital Infantil Universitario Niño Jesús, Department of Endocrinology, Instituto de Investigación La Princesa, Madrid, Spain. 2University Autónoma of Madrid, Department of Pediatrics, Madrid, Spain. 3Centro de Investigación Biomédica en Red de la Fistiopatología (CIBER) de
Fisiopatología de Obesidad y Nutrición, Instituto de Salud Carlos III, Madrid, Spain. 4Department of Cellular, Molecular and Developmental Neuroscience, Cajal Institute, Consejo Superior de Investigaciones Científicas (CSIC) and CIBER de Enfermedades Neurodegenerativas (CIBERNED), Madrid, Spain.
5Department of Cell Biology, Physiology and Immunology, University of Córdoba, and Instituto Maimonides de Investigaciones Biomédicas de Córdoba, Córdoba, Spain. 6Program in Integrative Cell Signaling and Neurobiology of Metabolism, Section of Comparative Medicine,
Department of Obstetrics/Gynecology and Reproductive Sciences, Yale University School of Medicine, New Haven, Connecticut, USA.
Glial cells perform critical functions that alter the metabolism and activity of neurons, and there is increasing interest in their role in appetite and energy balance. Leptin, a key regulator of appetite and metabolism, has previously been reported to influence glial structural proteins and morphology. Here, we demonstrate that metabolic status and leptin also modify astrocyte-specific glutamate and glucose transporters, indicating that metabolic signals influence synaptic efficacy and glucose uptake and, ultimately, neuronal function. We found that basal and glucose-stimulated electrical activity of hypothalamic proopiomelanocortin (POMC) neurons in mice were altered in the offspring of mothers fed a high-fat diet. In adulthood, increased body weight and fasting also altered the expression of glucose and glutamate transporters. These results demonstrate that whole-organism metabolism alters hypothalamic glial cell activity and suggest that these cells play an impor-tant role in the pathology of obesity.
IntroductionThe pathophysiological function of glial cells has become a pri-mary focus in the investigation of numerous diseases. Astrocytes appeared evolutionarily subsequent to neurons, augmenting in abundance and complexity in parallel with increasingly complex brain functions (1–3), which supports the concept that they play a more sophisticated role than previously considered. Indeed, these glial cells are fundamental for normal brain development and function, as they modulate neuronal proliferation, survival and metabolism, synaptogenesis, and synaptic transmission and main-tain local extracellular homeostasis, with new and more complex functions continuing to be described (2, 3).
Astrocytes were reported to participate in diverse neuroendo-crine processes over 2 decades ago (4, 5), although their impor-tance in the control of appetite and energy balance has only recently come to the forefront (6–11). Astrocytes and tanycytes, the specialized glial cells lining the third ventricle, transport nutri-ents into and within the brain, express receptors for numerous neuropeptides, neurotransmitters, and growth factors, produce neuroactive substances, and express key enzymes necessary for sensing and processing nutritional signals (2, 6, 12–15), situating them as prime targets for metabolic signals and control. Indeed, the diet-induced increase in leptin receptor (LepR) levels in hypo-thalamic astrocytes is proposed to participate in obesity onset and perpetuation (7, 8, 16). Leptin also affects astrocyte morphology and synaptic protein levels in the hypothalamus and can rapidly induce synaptic changes in metabolically important neurons (9, 17, 18). As astrocytes participate in the hormone-induced synaptic
rearrangement involved in diverse neuroendocrine functions (4, 5), they may also control leptin-induced synaptic remodeling (17, 18).
Acute activation of glial cells can have beneficial effects on neurons, including reduction of oxidative stress (19). However, their long-term activation can have detrimental results, such as the release of inflammatory factors (20). Fatty acids have recently been shown to directly activate inflammatory signaling in astro-cytes (21), suggesting that in addition to hormones, prolonged exposure to increased levels of specific metabolites could induce hypothalamic inflammation. However, little is known regarding the involvement of astrocytes in physiological metabolic control.
Communication between astrocytes and neurons is required for glucose to be used centrally as a fuel source, with astrocytes being primarily responsible for the captation of this substrate (22–24) through glucose transporter 1 (GLUT-1), which is highly expressed in the endfeet that envelop capillaries (25, 26). Not only is it an energy source, but central glucose levels also modulate systemic metabolism through a mechanism involving GLUT-2, expressed in hypothalamic astrocytes, ependymal-glial cells, tanycytes, and glucose-sensitive neurons (27–30). Expression of this transporter in astrocytes is fundamental for central glucose sensing and regu-lation of food intake (30–33). In contrast, GLUT-3 is expressed primarily in neurons throughout the brain (34–36).
Glucose uptake is tightly coupled to neuronal activity, not only to meet neuronal energy requirements, but also to fuel the uptake and metabolism of neurotransmitters by astrocytes (22–24). Glu-tamate, for example, is removed from the synaptic cleft by these glial cells, where it is metabolized to glutamine via glutamine synthetase (GS). This glutamine is then distributed to neurons to produce glutamate or, in the presence of glutamic acid decarboxyl-ase (GAD), GABA (37, 38). This process not only directly regulates
Conflict of interest: The authors have declared that no conflict of interest exists.
Citation for this article: J Clin Invest. 2012;122(11):3900–3913. doi:10.1172/JCI64102.
research article
The Journal of Clinical Investigation http://www.jci.org Volume 122 Number 11 November 2012 3901
excitatory synaptic transmission and decreases synaptic spillover, but also prevents glutamate excitotoxicity (39–41). The glutamate transporter GLT-1 is expressed almost exclusively in astrocytes (42), while glial high-affinity glutamate transporter (GLAST) is found in astrocytes and other glial cells (43, 44). Hence, changes in the number or functioning of hypothalamic astrocytes could sub-stantially modify synaptic transmission and efficiency, and thus neuroendocrine responses.
The maternal and early neonatal nutritional environments affect metabolic functions in the mature offspring, which can be at least partially attributed to modifications in the development of hypo-thalamic circuits that control metabolism (9, 45–48) Changes in circulating leptin levels are proposed as one factor inducing these long-term changes, as this hormone affects neuronal development (49–51). However, although glial development is also leptin sensi-tive, little is known regarding the outcome of early nutritional or hormonal changes on this cell type.
As glia perform a plethora of functions and hypothalamic astro-cytes are clearly affected in obese and overweight animals (7–9, 11, 16, 18), understanding their role in metabolic control is highly warranted. Here, we demonstrate that early nutritional changes can affect astrocyte number and morphology as well as physiologi-cal functions, such as glucose sensing that involves glia. Moreover, we found glucose and glutamate transporters to be affected by metabolic status, with leptin directly modulating transport of these factors in hypothalamic astrocytes, indicating that these cells are indeed fundamental players in controlling energy homeostasis.
ResultsWeight change, metabolic hormone levels, and hypothalamic neuropeptides in response to neonatal overnutrition. As previously reported (18, 52), neonatal overnutrition (NeoON) increased adult body weight (control [Ct]: 286.6 ± 3.9 g, NeoON: 353.2 ± 5.3 g; P < 0.0001) and circulating leptin (Ct: 2.12 ± 0.19 ng/ml, NeoON: 5.00 ± 0.07 ng/ml; P < 0.005). In contrast with our pre-vious studies (52), insulin levels were also increased (Ct: 0.34 ± 0.03 ng/ml, NeoON: 0.51 ± 0.07 ng/ml; P < 0.05), while acylated ghrelin levels were decreased (Ct: 76.5 ± 8.1 pg/ml, NeoON: 50.2 ± 5.1 pg/ml; P < 0.02), with no change in total ghrelin (Ct: 923.1 ± 107.3 pg/ml, NeoON: 879.4 ± 107.3 pg/ml) or the percentage of acylated ghrelin (Ct: 7.4% ± 1.1%, NeoON: 5.6% ± 0.8%). These differences are most likely due to fasting of the rats before sacrifice in the present study.
In NeoON rats, the hypothalamic mRNA levels for neuropeptide Y (NPY) were lower (Ct: 100% ± 12.2%, NeoON: 37.4% ± 9.0%; P < 0.01) and proopiomelanocortin (POMC) levels higher (Ct: 100% ± 33.8%, NeoON: 359.7% ± 71.1%; P < 0.001), with no difference in cocaine- and amphetamine-regulated transcript (CART) (Ct: 100% ± 22.4%, NeoON: 82.9% ± 16.6%), Agouti-related peptide (AgRP) (Ct: 100% ± 14.6%, NeoON: 136.5% ± 23.1%), or LepR (Ct: 100% ± 11.3%, NeoON: 137.0% ± 5.6%) mRNA levels.
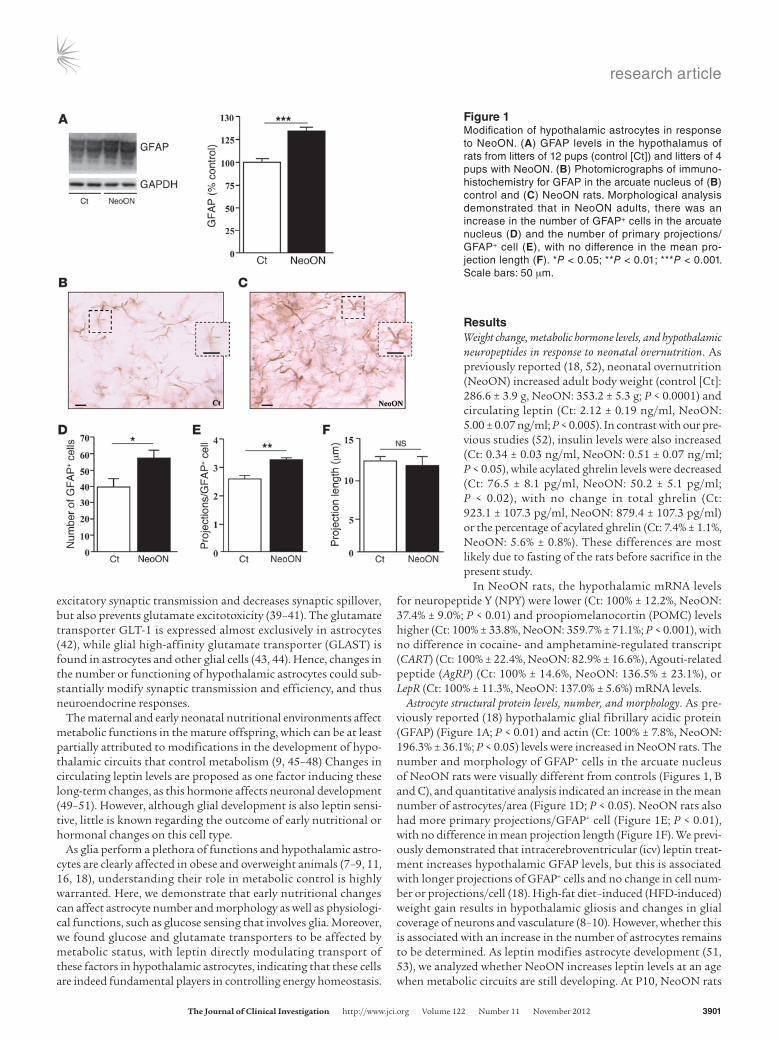
Astrocyte structural protein levels, number, and morphology. As pre-viously reported (18) hypothalamic glial fibrillary acidic protein (GFAP) (Figure 1A; P < 0.01) and actin (Ct: 100% ± 7.8%, NeoON: 196.3% ± 36.1%; P < 0.05) levels were increased in NeoON rats. The number and morphology of GFAP+ cells in the arcuate nucleus of NeoON rats were visually different from controls (Figures 1, B and C), and quantitative analysis indicated an increase in the mean number of astrocytes/area (Figure 1D; P < 0.05). NeoON rats also had more primary projections/GFAP+ cell (Figure 1E; P < 0.01), with no difference in mean projection length (Figure 1F). We previ-ously demonstrated that intracerebroventricular (icv) leptin treat-ment increases hypothalamic GFAP levels, but this is associated with longer projections of GFAP+ cells and no change in cell num-ber or projections/cell (18). High-fat diet–induced (HFD-induced) weight gain results in hypothalamic gliosis and changes in glial coverage of neurons and vasculature (8–10). However, whether this is associated with an increase in the number of astrocytes remains to be determined. As leptin modifies astrocyte development (51, 53), we analyzed whether NeoON increases leptin levels at an age when metabolic circuits are still developing. At P10, NeoON rats
Figure 1Modification of hypothalamic astrocytes in response to NeoON. (A) GFAP levels in the hypothalamus of rats from litters of 12 pups (control [Ct]) and litters of 4 pups with NeoON. (B) Photomicrographs of immunohistochemistry for GFAP in the arcuate nucleus of (B) control and (C) NeoON rats. Morphological analysis demonstrated that in NeoON adults, there was an increase in the number of GFAP+ cells in the arcuate nucleus (D) and the number of primary projections/GFAP+ cell (E), with no difference in the mean projection length (F). *P < 0.05; **P < 0.01; ***P < 0.001. Scale bars: 50 μm.
research article
3902 The Journal of Clinical Investigation http://www.jci.org Volume 122 Number 11 November 2012
weighed more (Ct: 22.4 g ± 0.1 g, NeoON: 24.7 g ± 0.2 g; P < 0.0001) and had higher circulating leptin levels (Ct: 3.97 ± 0.26 ng/ml, NeoON: 12.45 ± 3.03 ng/ml; P < 0.0001). Thus, this early rise in leptin could affect glial development and the number of hypotha-lamic astrocytes in adulthood.
In the hippocampus, an area involved in eating behavior (54), GFAP levels were also increased by NeoON (Ct: 100% ± 6.7%; NeoON: 162.0% ± 18.8%; P < 0.005), while in the cerebellum, GFAP levels were unaffected (Ct: 100% ± 15.5%; NeoON: 105.7% ± 9.8%). In contrast to the hypothalamus, the increase in hippocampal GFAP was not associated with a change in the number of astro-cytes (Ct: 15.4 ± 0.6 GFAP+ cells/field; NeoON: 15.9 ± 1.3 GFAP+ cells/field) or primary projections/astrocyte (Ct: 2.9 ± 0.6 projec-tions/GFAP+ cells; NeoON: 2.9 ± 0.9 projections/GFAP+ cells), but
with an increase in the mean projection length (Ct: 15.6 ± 2.1 μm; NeoON: 17.7 ± 0.8 μm; P < 0.01).
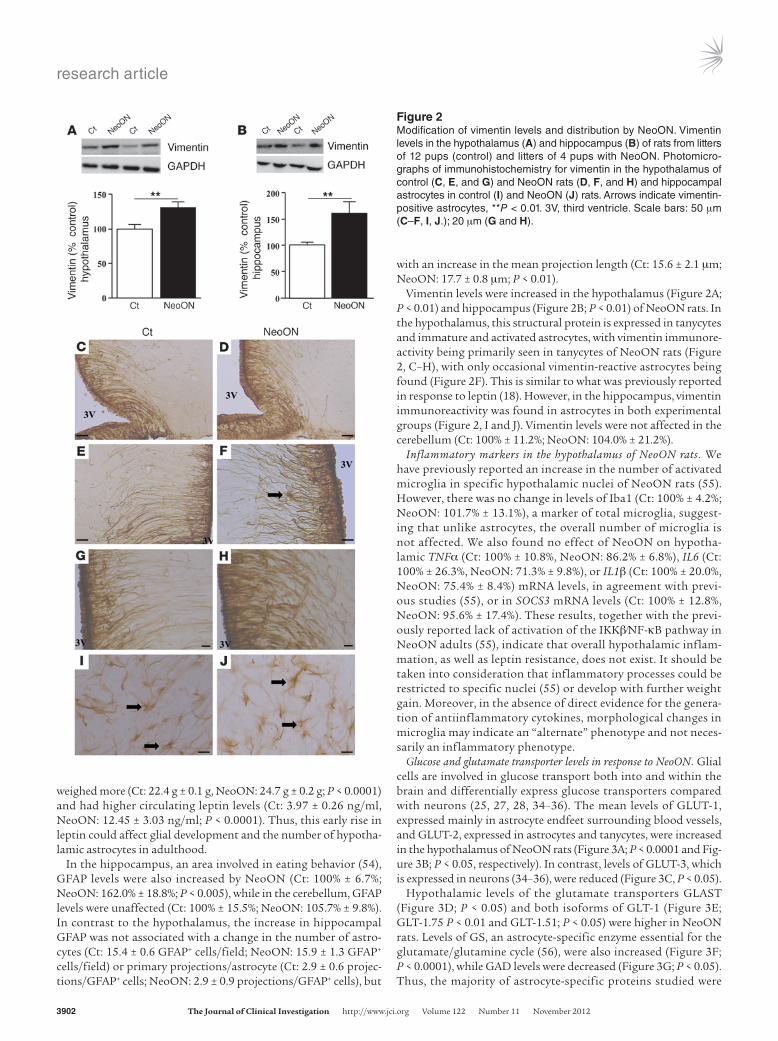
Vimentin levels were increased in the hypothalamus (Figure 2A; P < 0.01) and hippocampus (Figure 2B; P < 0.01) of NeoON rats. In the hypothalamus, this structural protein is expressed in tanycytes and immature and activated astrocytes, with vimentin immunore-activity being primarily seen in tanycytes of NeoON rats (Figure 2, C–H), with only occasional vimentin-reactive astrocytes being found (Figure 2F). This is similar to what was previously reported in response to leptin (18). However, in the hippocampus, vimentin immunoreactivity was found in astrocytes in both experimental groups (Figure 2, I and J). Vimentin levels were not affected in the cerebellum (Ct: 100% ± 11.2%; NeoON: 104.0% ± 21.2%).
Inflammatory markers in the hypothalamus of NeoON rats. We have previously reported an increase in the number of activated microglia in specific hypothalamic nuclei of NeoON rats (55). However, there was no change in levels of Iba1 (Ct: 100% ± 4.2%; NeoON: 101.7% ± 13.1%), a marker of total microglia, suggest-ing that unlike astrocytes, the overall number of microglia is not affected. We also found no effect of NeoON on hypotha-lamic TNFα (Ct: 100% ± 10.8%, NeoON: 86.2% ± 6.8%), IL6 (Ct: 100% ± 26.3%, NeoON: 71.3% ± 9.8%), or IL1β (Ct: 100% ± 20.0%, NeoON: 75.4% ± 8.4%) mRNA levels, in agreement with previ-ous studies (55), or in SOCS3 mRNA levels (Ct: 100% ± 12.8%, NeoON: 95.6% ± 17.4%). These results, together with the previ-ously reported lack of activation of the IKKβ⁄NF-κB pathway in NeoON adults (55), indicate that overall hypothalamic inflam-mation, as well as leptin resistance, does not exist. It should be taken into consideration that inflammatory processes could be restricted to specific nuclei (55) or develop with further weight gain. Moreover, in the absence of direct evidence for the genera-tion of antiinflammatory cytokines, morphological changes in microglia may indicate an “alternate” phenotype and not neces-sarily an inflammatory phenotype.
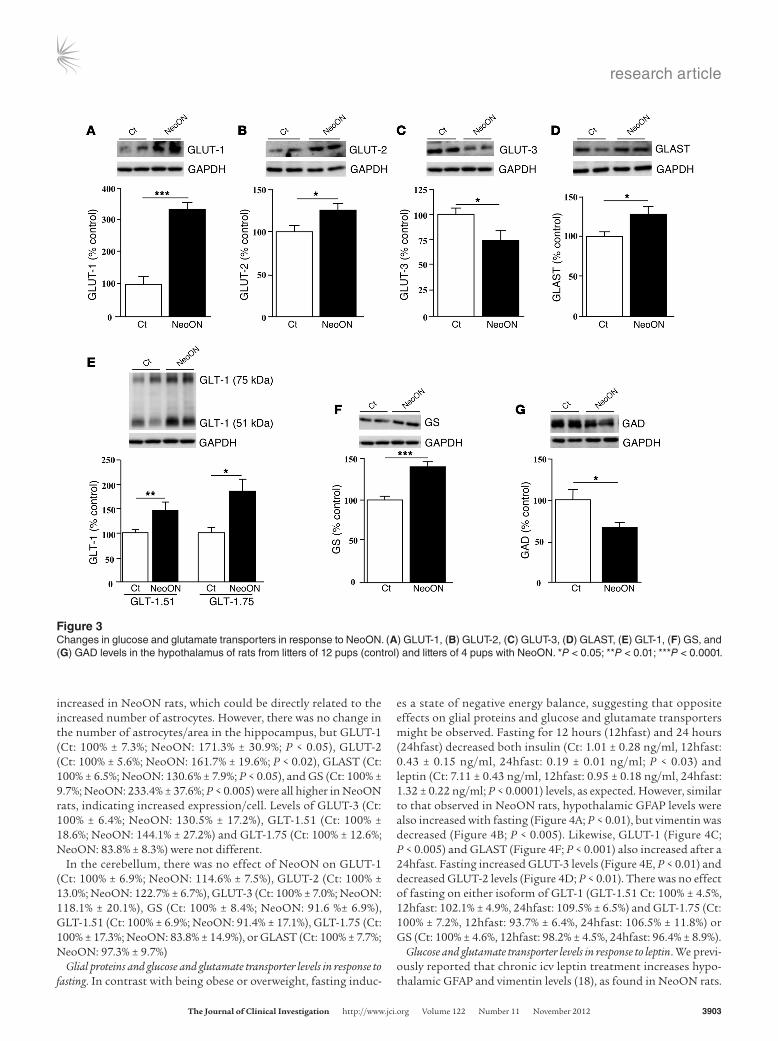
Glucose and glutamate transporter levels in response to NeoON. Glial cells are involved in glucose transport both into and within the brain and differentially express glucose transporters compared with neurons (25, 27, 28, 34–36). The mean levels of GLUT-1, expressed mainly in astrocyte endfeet surrounding blood vessels, and GLUT-2, expressed in astrocytes and tanycytes, were increased in the hypothalamus of NeoON rats (Figure 3A; P < 0.0001 and Fig-ure 3B; P < 0.05, respectively). In contrast, levels of GLUT-3, which is expressed in neurons (34–36), were reduced (Figure 3C, P < 0.05).
Hypothalamic levels of the glutamate transporters GLAST (Figure 3D; P < 0.05) and both isoforms of GLT-1 (Figure 3E; GLT-1.75 P < 0.01 and GLT-1.51; P < 0.05) were higher in NeoON rats. Levels of GS, an astrocyte-specific enzyme essential for the glutamate/glutamine cycle (56), were also increased (Figure 3F; P < 0.0001), while GAD levels were decreased (Figure 3G; P < 0.05). Thus, the majority of astrocyte-specific proteins studied were
Figure 2Modification of vimentin levels and distribution by NeoON. Vimentin levels in the hypothalamus (A) and hippocampus (B) of rats from litters of 12 pups (control) and litters of 4 pups with NeoON. Photomicrographs of immunohistochemistry for vimentin in the hypothalamus of control (C, E, and G) and NeoON rats (D, F, and H) and hippocampal astrocytes in control (I) and NeoON (J) rats. Arrows indicate vimentinpositive astrocytes, **P < 0.01. 3V, third ventricle. Scale bars: 50 μm (C–F, I, J.); 20 μm (G and H).
research article
The Journal of Clinical Investigation http://www.jci.org Volume 122 Number 11 November 2012 3903
increased in NeoON rats, which could be directly related to the increased number of astrocytes. However, there was no change in the number of astrocytes/area in the hippocampus, but GLUT-1 (Ct: 100% ± 7.3%; NeoON: 171.3% ± 30.9%; P < 0.05), GLUT-2 (Ct: 100% ± 5.6%; NeoON: 161.7% ± 19.6%; P < 0.02), GLAST (Ct: 100% ± 6.5%; NeoON: 130.6% ± 7.9%; P < 0.05), and GS (Ct: 100% ± 9.7%; NeoON: 233.4% ± 37.6%; P < 0.005) were all higher in NeoON rats, indicating increased expression/cell. Levels of GLUT-3 (Ct: 100% ± 6.4%; NeoON: 130.5% ± 17.2%), GLT-1.51 (Ct: 100% ± 18.6%; NeoON: 144.1% ± 27.2%) and GLT-1.75 (Ct: 100% ± 12.6%; NeoON: 83.8% ± 8.3%) were not different.
In the cerebellum, there was no effect of NeoON on GLUT-1 (Ct: 100% ± 6.9%; NeoON: 114.6% ± 7.5%), GLUT-2 (Ct: 100% ± 13.0%; NeoON: 122.7% ± 6.7%), GLUT-3 (Ct: 100% ± 7.0%; NeoON: 118.1% ± 20.1%), GS (Ct: 100% ± 8.4%; NeoON: 91.6 %± 6.9%), GLT-1.51 (Ct: 100% ± 6.9%; NeoON: 91.4% ± 17.1%), GLT-1.75 (Ct: 100% ± 17.3%; NeoON: 83.8% ± 14.9%), or GLAST (Ct: 100% ± 7.7%; NeoON: 97.3% ± 9.7%)
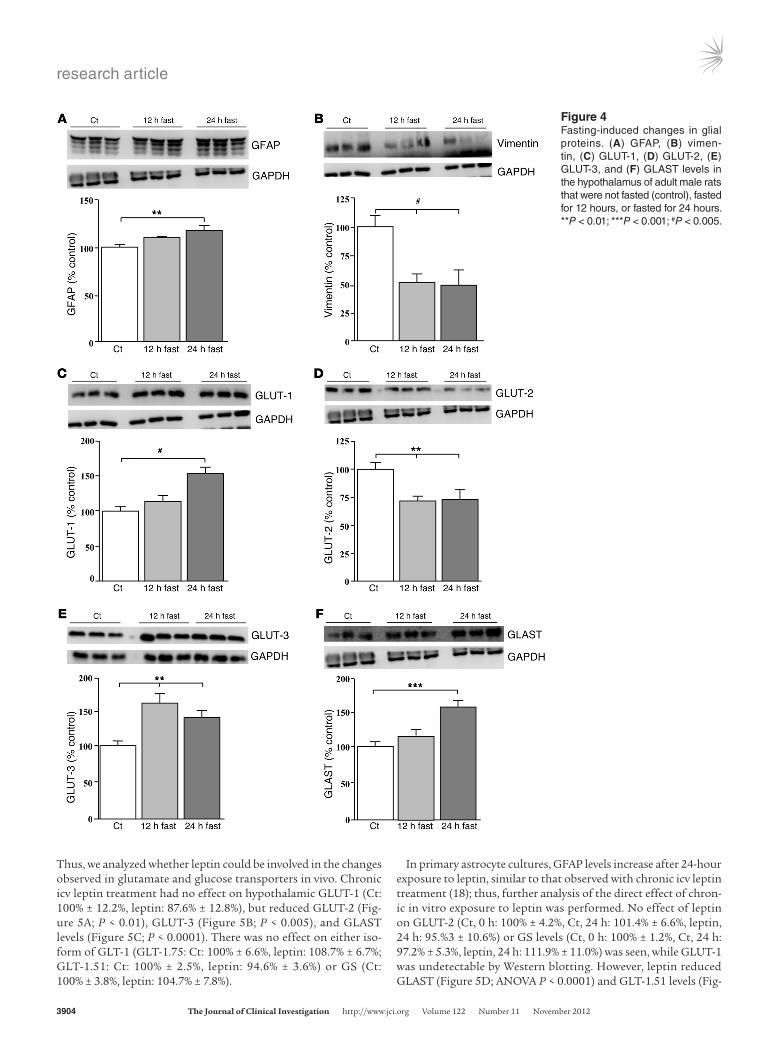
Glial proteins and glucose and glutamate transporter levels in response to fasting. In contrast with being obese or overweight, fasting induc-
es a state of negative energy balance, suggesting that opposite effects on glial proteins and glucose and glutamate transporters might be observed. Fasting for 12 hours (12hfast) and 24 hours (24hfast) decreased both insulin (Ct: 1.01 ± 0.28 ng/ml, 12hfast: 0.43 ± 0.15 ng/ml, 24hfast: 0.19 ± 0.01 ng/ml; P < 0.03) and leptin (Ct: 7.11 ± 0.43 ng/ml, 12hfast: 0.95 ± 0.18 ng/ml, 24hfast: 1.32 ± 0.22 ng/ml; P < 0.0001) levels, as expected. However, similar to that observed in NeoON rats, hypothalamic GFAP levels were also increased with fasting (Figure 4A; P < 0.01), but vimentin was decreased (Figure 4B; P < 0.005). Likewise, GLUT-1 (Figure 4C; P < 0.005) and GLAST (Figure 4F; P < 0.001) also increased after a 24hfast. Fasting increased GLUT-3 levels (Figure 4E, P < 0.01) and decreased GLUT-2 levels (Figure 4D; P < 0.01). There was no effect of fasting on either isoform of GLT-1 (GLT-1.51 Ct: 100% ± 4.5%, 12hfast: 102.1% ± 4.9%, 24hfast: 109.5% ± 6.5%) and GLT-1.75 (Ct: 100% ± 7.2%, 12hfast: 93.7% ± 6.4%, 24hfast: 106.5% ± 11.8%) or GS (Ct: 100% ± 4.6%, 12hfast: 98.2% ± 4.5%, 24hfast: 96.4% ± 8.9%).
Glucose and glutamate transporter levels in response to leptin. We previ-ously reported that chronic icv leptin treatment increases hypo-thalamic GFAP and vimentin levels (18), as found in NeoON rats.
Figure 3Changes in glucose and glutamate transporters in response to NeoON. (A) GLUT1, (B) GLUT2, (C) GLUT3, (D) GLAST, (E) GLT1, (F) GS, and (G) GAD levels in the hypothalamus of rats from litters of 12 pups (control) and litters of 4 pups with NeoON. *P < 0.05; **P < 0.01; ***P < 0.0001.
research article
3904 The Journal of Clinical Investigation http://www.jci.org Volume 122 Number 11 November 2012
Thus, we analyzed whether leptin could be involved in the changes observed in glutamate and glucose transporters in vivo. Chronic icv leptin treatment had no effect on hypothalamic GLUT-1 (Ct: 100% ± 12.2%, leptin: 87.6% ± 12.8%), but reduced GLUT-2 (Fig-ure 5A; P < 0.01), GLUT-3 (Figure 5B; P < 0.005), and GLAST levels (Figure 5C; P < 0.0001). There was no effect on either iso-form of GLT-1 (GLT-1.75: Ct: 100% ± 6.6%, leptin: 108.7% ± 6.7%; GLT-1.51: Ct: 100% ± 2.5%, leptin: 94.6% ± 3.6%) or GS (Ct: 100% ± 3.8%, leptin: 104.7% ± 7.8%).
In primary astrocyte cultures, GFAP levels increase after 24-hour exposure to leptin, similar to that observed with chronic icv leptin treatment (18); thus, further analysis of the direct effect of chron-ic in vitro exposure to leptin was performed. No effect of leptin on GLUT-2 (Ct, 0 h: 100% ± 4.2%, Ct, 24 h: 101.4% ± 6.6%, leptin, 24 h: 95.%3 ± 10.6%) or GS levels (Ct, 0 h: 100% ± 1.2%, Ct, 24 h: 97.2% ± 5.3%, leptin, 24 h: 111.9% ± 11.0%) was seen, while GLUT-1 was undetectable by Western blotting. However, leptin reduced GLAST (Figure 5D; ANOVA P < 0.0001) and GLT-1.51 levels (Fig-
Figure 4Fastinginduced changes in glial proteins. (A) GFAP, (B) vimentin, (C) GLUT1, (D) GLUT2, (E) GLUT3, and (F) GLAST levels in the hypothalamus of adult male rats that were not fasted (control), fasted for 12 hours, or fasted for 24 hours. **P < 0.01; ***P < 0.001; #P < 0.005.

research article
The Journal of Clinical Investigation http://www.jci.org Volume 122 Number 11 November 2012 3905
ure 5E; ANOVA P < 0.0001), while the reduction in GLT-1.75 was not significant. This decrease in glutamate transporters was asso-ciated with an increase in the levels of glutamate found in the cul-ture medium after 24 hours of incubation with leptin (Figure 5F).
To determine how leptin affects membrane-associated GLAST levels (functional GLAST), the astrocyte cell line C6 was used in order to isolate sufficient membrane proteins. Leptin increased GFAP protein levels (Ct, 0 h: 100% ± 8.8%, Ct, 24 h: 102.4% ± 7.8%, leptin, 24 h: 141.0% ± 3.4%; ANOVA: P < 0.05) similar to as was pre-viously shown for primary hypothalamic astrocyte cultures (18). Leptin also decreased overall GLAST levels (Figure 5G; ANOVA: P < 0.05), as seen in primary cultures, and in addition, decreased membrane-associated GLAST levels (Figure 5H; ANOVA: P < 0.05). Thus, chronic exposure to leptin both in vivo and in vitro reduces the glutamate captation capacity of astrocytes.
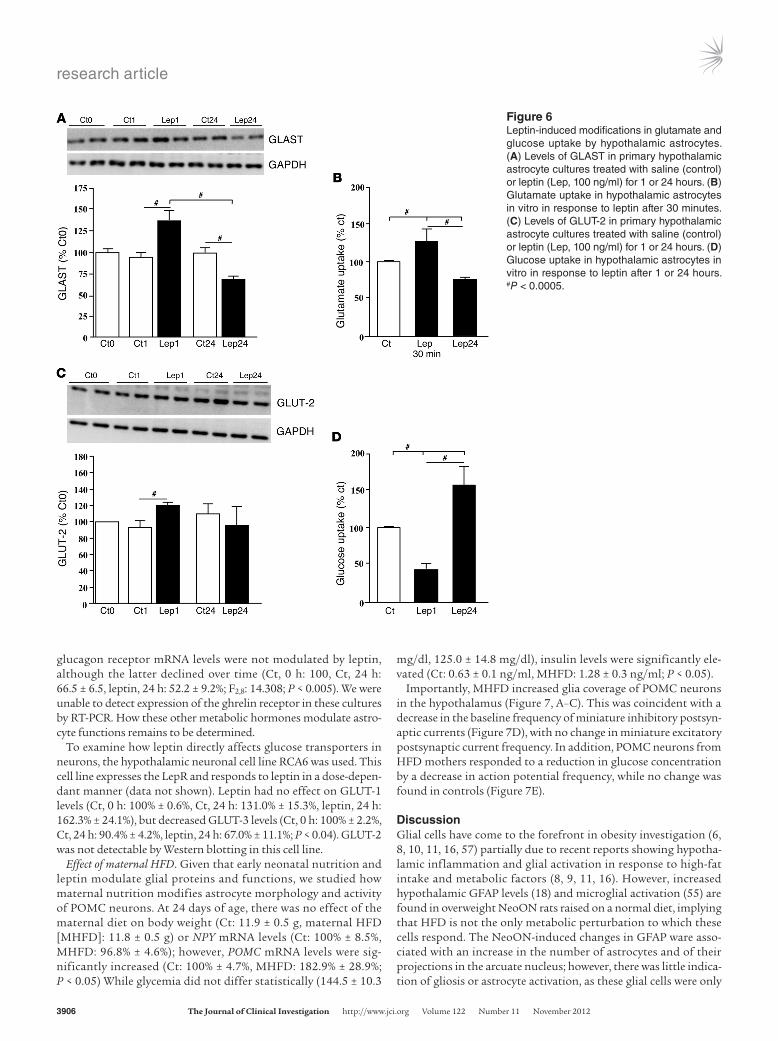
The astroglial response to leptin in vitro is time dependent, with GFAP levels decreasing at 1 hour and increasing by 24 hours (18); thus, we determined how leptin affects glucose and glutamate transport at these time points. There was a significant interaction between leptin treatment and time on GLAST lev-els (F2,22: 15.170; P < 0.001). At 1 hour, GLAST levels increased,
while at 24 hours, there was a decrease (Figure 6A; P < 0.0001). This was coincident with a rapid leptin-induced increase in glu-tamate uptake into hypothalamic astrocytes at 30 minutes, but a decrease in uptake at 24 hours (Figure 6B; P < 0.0005). This is also in accordance with the increase in glutamate in the culture medium at 24 hours (Figure 5F).
Leptin increased GLUT-2 levels at 1 hour with no effect at 24 hours (Figure 6C). However, glucose uptake was decreased at 1 hour and increased at 24 hours (Figure 6D; P < 0.0005). This leptin-induced increase in glucose uptake at 24 hours was not associated with an increase in overall GLUT-2 protein levels or GLUT-2 in the cell membrane or the mRNA levels of GLUT-2 (Ct, 0 h: 100%, Ct, 24 h: 164.5% ± 50.6%, leptin, 24 h: 131.0% ± 42.6%), GLUT-1 (Ct, 0 h: 100%, Ct, 24 h: 136.1% ± 19.6%, leptin, 24 h: 123.4% ± 21.2%), or GLUT-3 (Ct, 0 h: 100%, Ct, 24 h: 106.5% ± 10.1, leptin, 24 h: 104.3% ± 14.1%). These results suggest that glucose uptake may be modulated by leptin in the absence of alterations in glucose transporter expression.
Receptors for other circulating factors involved in glucose homeo-stasis are also expressed in astrocytes in vitro. Insulin receptor (Ct, 0 h: 100%, Ct, 24 h: 117.5% ± 5.6%, leptin, 24 h: 78.3% ± 10.1%) and
Figure 5Leptininduced modifications in glucose and glutamate transporters. (A) Hypothalamic levels of GLUT2, (B) GLUT3, and (C) GLAST levels in adult male rats treated with leptin icv for 14 days (15 μg/d). (D) GLAST and (E) GLT1 levels in primary hypothalamic astrocyte cultures treated with saline (control) or leptin (100 ng/ml) for 24 hours (ct24 and Lep24). (F) Relative glutamate levels in the culture medium of primary hypothalamic astrocyte cultures after treatment with either saline or leptin for 24 hours. (G) Total or (H) membrane GLAST levels in cultures of the astroglioma cell line C6 after treatment with leptin for 24 hours. **P < 0.01; ***P < 0.0001; #P < 0.005.
research article
3906 The Journal of Clinical Investigation http://www.jci.org Volume 122 Number 11 November 2012
glucagon receptor mRNA levels were not modulated by leptin, although the latter declined over time (Ct, 0 h: 100, Ct, 24 h: 66.5 ± 6.5, leptin, 24 h: 52.2 ± 9.2%; F2,8: 14.308; P < 0.005). We were unable to detect expression of the ghrelin receptor in these cultures by RT-PCR. How these other metabolic hormones modulate astro-cyte functions remains to be determined.
To examine how leptin directly affects glucose transporters in neurons, the hypothalamic neuronal cell line RCA6 was used. This cell line expresses the LepR and responds to leptin in a dose-depen-dant manner (data not shown). Leptin had no effect on GLUT-1 levels (Ct, 0 h: 100% ± 0.6%, Ct, 24 h: 131.0% ± 15.3%, leptin, 24 h: 162.3% ± 24.1%), but decreased GLUT-3 levels (Ct, 0 h: 100% ± 2.2%, Ct, 24 h: 90.4% ± 4.2%, leptin, 24 h: 67.0% ± 11.1%; P < 0.04). GLUT-2 was not detectable by Western blotting in this cell line.
Effect of maternal HFD. Given that early neonatal nutrition and leptin modulate glial proteins and functions, we studied how maternal nutrition modifies astrocyte morphology and activity of POMC neurons. At 24 days of age, there was no effect of the maternal diet on body weight (Ct: 11.9 ± 0.5 g, maternal HFD [MHFD]: 11.8 ± 0.5 g) or NPY mRNA levels (Ct: 100% ± 8.5%, MHFD: 96.8% ± 4.6%); however, POMC mRNA levels were sig-nificantly increased (Ct: 100% ± 4.7%, MHFD: 182.9% ± 28.9%; P < 0.05) While glycemia did not differ statistically (144.5 ± 10.3
mg/dl, 125.0 ± 14.8 mg/dl), insulin levels were significantly ele-vated (Ct: 0.63 ± 0.1 ng/ml, MHFD: 1.28 ± 0.3 ng/ml; P < 0.05).
Importantly, MHFD increased glia coverage of POMC neurons in the hypothalamus (Figure 7, A–C). This was coincident with a decrease in the baseline frequency of miniature inhibitory postsyn-aptic currents (Figure 7D), with no change in miniature excitatory postsynaptic current frequency. In addition, POMC neurons from HFD mothers responded to a reduction in glucose concentration by a decrease in action potential frequency, while no change was found in controls (Figure 7E).
DiscussionGlial cells have come to the forefront in obesity investigation (6, 8, 10, 11, 16, 57) partially due to recent reports showing hypotha-lamic inflammation and glial activation in response to high-fat intake and metabolic factors (8, 9, 11, 16). However, increased hypothalamic GFAP levels (18) and microglial activation (55) are found in overweight NeoON rats raised on a normal diet, implying that HFD is not the only metabolic perturbation to which these cells respond. The NeoON-induced changes in GFAP ware asso-ciated with an increase in the number of astrocytes and of their projections in the arcuate nucleus; however, there was little indica-tion of gliosis or astrocyte activation, as these glial cells were only
Figure 6Leptininduced modifications in glutamate and glucose uptake by hypothalamic astrocytes. (A) Levels of GLAST in primary hypothalamic astrocyte cultures treated with saline (control) or leptin (Lep, 100 ng/ml) for 1 or 24 hours. (B) Glutamate uptake in hypothalamic astrocytes in vitro in response to leptin after 30 minutes. (C) Levels of GLUT2 in primary hypothalamic astrocyte cultures treated with saline (control) or leptin (Lep, 100 ng/ml) for 1 or 24 hours. (D) Glucose uptake in hypothalamic astrocytes in vitro in response to leptin after 1 or 24 hours. #P < 0.0005.

research article
The Journal of Clinical Investigation http://www.jci.org Volume 122 Number 11 November 2012 3907
occasionally found to be vimentin positive and no increase in the expression of TNFα, IL1β, or IL6 was detected. In contrast, other glial proteins were markedly affected.
Each astrocyte defines a functional domain in the brain (2) such that an increase in the number of hypothalamic astrocytes changes the local anatomical structure and functionality; this could have important effects on neuronal circuits controlling metabolism. The upregulation of GLUT-1 and -2, GLAST, GLT-1, and GS in NeoON rats may be directly related to the greater number of glial cells, but could also result from changes in expression level per cell. Regardless of the specific mechanism, the overall hypothalamic capacity to transport and metabolize glucose and glutamate is increased. Hence, these factors and possibly other metabolic sig-nals that are transported, produced, or processed by astrocytes and tanycytes may be perceived differently in the hypothalamus of these overweight rats. For example, modification of GLUT-2 in hypotha-lamic astrocytes affects central glucose sensing (32) and NeoON have increased hypothalamic GLUT-2 levels, with an altered glu-cose tolerance response and an increase in carbohydrate intake (58).
Transport of neurotransmitters and glucose by astrocytes governs the composition of the extracellular space surround-ing neurons, thus directly influencing neuronal electrical activ-ity and glucose-sensing capacity (30, 59, 60), both of which are affected by early changes in nutritional status. Glial coverage of POMC neurons in the arcuate nucleus was increased in offspring of mothers fed a HFD, and this was associated with a decrease in
miniature inhibitory postsynaptic current (mIPSC) frequency. Moreover, glucose sensing was affected, as POMC neurons from these mice responded differently to a change in glucose concen-tration. Decreased inhibitory electrical activity was in accordance with the rise in POMC mRNA levels, which together indicate that even at this early stage of development, this system is sensitized to metabolic signals and attempting to compensate for the maternal high-fat exposure. However, it remains to be determined how these modifications in electrical activity and glucose responsiveness of POMC neurons are involved in the long-term metabolic changes reported after MHFD exposure.
Some of the long-term metabolic outcomes due to changes in early nutritional status have been attributed to affectation of leptin levels during critical developmental periods. Leptin is impli-cated in brain progenitor cell proliferation and astrocyte differen-tiation (51, 53); thus, the hyperleptinemia at P10, a critical period for development of hypothalamic circuits (61), could underlie the increase in astrocytes in NeoON rats. The hyperleptinemia in adult overweight rats could also increase GFAP and vimentin expression, but leptin treatment in adult rats was not found to modify the number of astrocytes (18). Of note, HFD-induced obe-sity is associated with hypothalamic glial activation, as shown by increased GFAP levels (8, 9, 11, 16), increased astrocytic coverage of neurons and capillaries (9), and activation of microglia (11), but no increase in the number of astrocytes has been reported to date. Whether gliosis and hypothalamic inflammation progress with
Figure 7Effects of maternal diet on glial coverage and glucose sensitivity of POMC neurons. Electron micro graphs of POMC neurons in the arcuate nucleus of 24dayold mice from mothers on a control (A) or MHFD diet (B). Glial coverage is outlined in green. There was a significant increase in the mean glial coverage of POMC neurons in MHFD mice (C). The frequency of resting mEPSCs was not affected by MHFD, but mIPSC frequency was significantly decreased (D). Lowering glucose concentration decreased action potential frequency in POMC neurons from MHFD mice, but had no effect on control mice (E). *P < 0.05, **P < 0.01, ***P < 0.001. Scale bar: 500 nm.
research article
3908 The Journal of Clinical Investigation http://www.jci.org Volume 122 Number 11 November 2012
increased weight gain on a normal diet remains to be determined, but it is conceivable that hypothalamic inflammation in response to HFD involves more than one process, including those due to metabolic and/or toxic effects of the diet and those resulting from weight gain and its other associated complications. Furthermore, the early metabolic environment could determine astrocyte devel-opment, including cell number, while later metabolic or dietary modifications may preferentially affect glial functions.
One fundamental function of astrocytes is to control the extra-cellular concentrations of glutamate and GABA (2, 22, 23, 37–40), with the balance of the activity of these 2 neurotransmitters within the hypothalamus being crucial in determining metabolic output (62). The fasting-induced rise in GLUT-1, GLUT-3, GLAST, and GFAP is in concordance with increased neuronal activity and glu-tamate uptake by astrocytes, as glutamate uptake into astrocytes rises with increased glutamate concentrations in the synaptic cleft (63, 64) and glucose uptake is stimulated with increased neuronal activity (65, 66). Moreover, GFAP is essential for retaining GLAST in the cell membrane (67). Fasting activates AgRP neurons (68) via increased NMDA receptor–dependent excitatory tone (69) to stim-ulate appetite and food-seeking behavior, while glutamate input to POMC neurons does not appear to be critical for fasting responses (69). Glutamate release in the ventromedial hypothalamus is also important for the prevention of hypoglycemia during fasting (70). Although glutamate can directly stimulate its own reuptake into astrocytes to impede excitotoxicity (71), fasting-induced metabolic changes, such as changes in leptin levels, may also participate in this process. Our results indicate that leptin directly modulates glu-tamate uptake in astrocytes in a time-dependant manner, stimu-lating a rapid increase that is downregulated with chronic exposi-tion. Thus, the decrease in circulating leptin after 12 and 24 hours of fasting could result in increased GLAST levels, although other metabolic signals may also be involved.
The rise in GLUT-1 in response to fasting is reported to partici-pate in glucose sensing, glycemia control, and neuroprotection against hypoglycemia (72, 73). Decreased GLUT-2 stimulates appe-tite (33), which is coherent with the observed decline caused by fasting found here, while the increase in NeoON rats would serve as a signal to decrease food intake. Leptin modulates glucose trans-porters in different tissues (74–76), and this cytokine decreased with fasting and increased in NeoON rats. However, chronic icv treatment decreased both hypothalamic GLUT-2 and -3, but had no effect on GLUT-1 levels, and we found no evidence of a direct effect of chronic leptin treatment on GLUT-1, -2, or -3 mRNA or GLUT-2 protein levels in astrocytes. In contrast, leptin decreased GLUT-3 in neurons in vitro. In fasted individuals, leptin levels decreased and glucose levels increased, with the inverse occurring with feeding; thus, under normal conditions, leptin may be another signal indicating nutrient availability directly to neu-rons and regulating their glucose uptake. However, the decrease in GLUT-3 expression in this neuronal cell line could also indicate a leptin-induced decrease in activity and thus glucose utilization.
Although no in vitro changes in glucose transporter levels were found in response to leptin after 24 hours, it stimulated glucose transport in astrocytes, and this was preceded by a rapid decrease in uptake. We have previously found the effects of leptin on astrocytes to be biphasic, rapidly reducing GFAP levels both in vivo and in vitro, which is then followed by an increase at 24 hours (18). The leptin-induced changes in glucose uptake did not correspond to modifica-tions in GLUT-2 mRNA, total protein, or membrane protein levels;
indeed, although glucose uptake decreased at 1 hour, total GLUT-2 levels increased. Other glucose transporter forms are most likely involved in this response, and further studies are required to deter-mine the physiological implications of this phenomenon.
Leptin-induced glutamate uptake was also biphasic and cor-responded to the observed changes in GLAST. The rapid rise in glutamate captation indicates that leptin could reduce the stimu-latory effects of glutamate at nearby synapses, emphasizing the importance of astrocyte number and morphology and their inter-actions with neurons. Whether chronic exposure to increased leptin levels, as frequently occurs in overweight or obese subjects, reduces the ability of astrocytes to correctly modulate glutamate levels in the synaptic cleft or whether this is an adaptational mech-anism remains to be determined.
Astrocytes were modified by NeoON in an anatomically specific manner, similar to that induced by leptin (18). Glial proteins were upregulated in the hippocampus, but not in the cerebellum, sug-gesting that the effects could be related to metabolic control, as the hippocampus is involved in food-seeking and food-memory behaviors (54, 77), with leptin targeting this brain area and mod-ulating these effects (77). Moreover, HFD modifies glutamate uptake and metabolism in the hippocampus (78). In contrast with the hypothalamus, in the hippocampus, vimentin is expressed in astrocytes, with its levels increasing with age; this is suggested to impede neurogenesis (79). Further investigation into the anatom-ically distinct responses and functions of glial cells could prove prosperous in identification of new targets for obesity control.
Multiple metabolic factors exert at least part of their central effects through hypothalamic astrocytes and tanycytes. For example, these glial cells express type II iodothyronine 5′-deiodinase (DII), an enzyme required for T3 production, and mediate central thyroid hormone effects. DII levels are modulated by fasting and implicated in T3 effects on NPY/AgRP neuron responses to fasting (6, 15, 80). Moreover, leptin’s inhibitory effects on feeding are partially mediated through apoE signaling in the hypothalamus, and in the CNS, apoE is produced by astrocytes (81). Thus, it is clear that glia respond to numerous metabolic signals, indicating that modifications in their number or function in the hypothalamus would have dramatic effects on metabolic responses. Astrocytes express receptors for glu-cagon and insulin, and these receptors were not modified by leptin treatment. How the ligands for these receptors affect astrocyte func-tion in metabolic control remains to be addressed.
Astrocytes are clearly involved in metabolic control and are most likely involved in the pathogenesis of obesity. Here, we dem-onstrate that physiological changes in metabolic status as well as increased body weight on a normal diet substantially affect glial cells. Some of these effects are through leptin, as it not only mod-ulates glial morphology and activation, but has direct effects on glutamate and glucose uptake by hypothalamic astrocytes, which would directly modulate local synaptic circuits and neuronal activ-ity. Hence, the participation of astrocytes and most likely tany-cytes in metabolic control appears to be multiform, and these cells should undoubtedly be taken into consideration when analyzing central metabolic responses.
Methods
NeoONWistar rats were bred in our in-house facilities. On the day of birth, cross-fostering was employed to produce litters of 4 pups (NeoON) or 12 pups/
research article
The Journal of Clinical Investigation http://www.jci.org Volume 122 Number 11 November 2012 3909
dam for controls. After weaning on P21, rats were placed at 4 rats per cage under constant temperature (20–22°C), with lights on from 0730 to 1930 hours. They were given free access to normal rat chow and tap water.
Rats were killed on P90 between 900 and 1100 hours after a 12-hour fast. Thirteen rats per group were sacrificed by decapitation. Trunk blood was collected in cooled tubes, allowed to clot, centrifuged, and stored at –80°C. The brains were removed and rapidly frozen on dry ice and stored at –80°C. Seven rats per group were perfused transcardially with phos-phate-buffered 4% paraformaldehyde (pH 7.4) under pentobarbital anes-thesia (1 mg/kg). The brains were postfixed overnight at 4°C and then stored in cryoprotection solution (30% sucrose, 30% ethylene glycol in phosphate buffer) at –20°C.
To determine whether this experimental paradigm modulates circulat-ing leptin levels during early stages when leptin imprinting on the meta-bolic system is thought to occur, one group of rats (n = 6) was weighed and sacrificed by decapitation at P10. Trunk blood was collected and handled as described above.
FastingAdult male Wistar rats (250–300 g; n = 6/group) were killed between 0900 and 1100 hours by decapitation after 12 or 24 hours of fasting or without fasting. Brains and trunk blood were collected as described above.
Chronic leptin treatment during adulthoodAdult male Wistar rats (250–300 g; n = 6/group) were anesthetized with 2.5% Fluothane (AstraZeneca Farmacéutica SA), and a minipump (Alzet; Durect Co.) delivering 15 μg/d leptin (Sigma-Aldrich) or saline for 14 days was implanted in the left lateral ventricle (–0.3 mm anteroposterior, 1.1 mm lateral from bregma). Rats were weighed every 2 days until killed between 0900 and 1100 hours by decapitation after the 14th day of treat-ment. Brains and trunk blood were collected as described above. The meta-bolic changes observed in these animals have been previously reported (18).
MHFDFor electron microscopy and electrophysiology studies, C57BL/6 mice that express GFP under the POMC promoter (Jackson Laboratory) were employed. Female mice (8 weeks of age) were given free access to either a low-fat diet (3.3 Kcal/g, 59.8% carbohydrate, 28% protein, 12.1% fat; Purina Lab Chow 5001; Ralston Purina Co.) or HFD (4.75 Kcal/g, 35% carbohy-drate, 20% protein, 45% fat; Purina Lab Chow D12451; Ralston Purina Co.) for 6 weeks before being placed with normal male mice. During gestation and lactation, they were maintained on their respective diets. On P21, mice were weaned and given normal rat chow ad libitum until sacrificed on P24.
In vitro studiesPrimary astrocyte cultures. Two-day old male Wistar rats were decapitated and the diencephalon removed under sterile conditions and triturated in DMEM F-12 (Gibco; Invitrogen) containing 1% penicillin-streptomycin (Gibco; Invitrogen). The suspension was centrifuged and the pellet resus-pended in DMEM F-12 plus 10% FCS (Linus) plus 1% antibiotics. Cells were grown in this culture medium in 75 cm3 culture flasks at 37°C and 5% CO2. On the ninth day, the flasks were placed in a 37°C shaking incubator (SI-300, Jeoi Tech; Medline Scientific) at 280 rpm for 16 hours. The cells were then harvested (0.05% trypsin/EDTA solution; Biochrom AG), resus-pended in DMEM F-12 plus 10% FCS plus 1% antibiotics, and centrifuged for 5 minutes at 233.6 g. Cells were seeded at a concentration of 217,500 cells/ml in culture plates previously treated with poly-l-lysine hydrobro-mide (10 μg/ml; Sigma-Aldrich) and grown for 24 hours. The medium was changed to DMEM F-12 plus 1% antibiotics (without FCS), and 24 hours later, the same medium plus either 100 ng/ml of recombinant rat leptin
(National Hormone and Pituitary Program) or vehicle was added. Cells were collected at 1 and/or 24 hours. In each experiment, treatments were done in triplicate; each experiment was repeated 3 to 6 times (n = 3 to 6).
Glial cell line C6. Stock cultures of the astrocytoma cell line C6 were a gift of L.M. García-Segura (Cajal Institute). Cells (1 × 10⁶ cells/100 mm culture dish) were grown in RPMI (Biochrom) with 2.0 g/l NaHCO3, without phenol red, supplemented with 10% FCS, 100 U/ml penicillin-streptomycin, and glutamine (200 mM), and maintained at 37°C and 5% CO2 for 72 hours. They were then maintained for 48 hours in differen-tiation medium (RPMI supplemented with 2.0 g/l NaHCO3, 100 U/ml penicillin-streptomycin, glutamine [200 mM] and cAMP [100 mM]) with-out FCS. Subsequently, the cells were treated with leptin at a concentra-tion of 100 ng/ml or vehicle (saline) for 24 hours. Each treatment was done in triplicate and the experiment repeated 3 times (n = 3).
Hypothalamic neuronal cell line RCA-6Stock cultures of the hypothalamic cell line RCA-6 (82), a gift of I. Torres-Alemán (Cajal Institute), were grown in 100-mm culture dishes in DMEM without phenol red supplemented with 10% FCS, 100 U/ml penicillin-streptomycin, and glutamine (200 mM) and maintained at 37°C and 5% CO2. Cells (2 × 10⁵) were plated in 60-mm culture dishes for 72 hours in DMEM containing 10% FCS and then in DMEM-Ham’s F12 (1:1) without FCS, but containing 1.2 g/l NaHCO3, 15 mM HEPES, and supplemented with 0.1 mg/ml transferrin, 10–5 M putrescine, 2 × 10⁻⁸ M progesterone, 10–7 M corticosterone, 10–5 M T3, 1 μg/ml arachidonic acid, and 2 × 10⁻⁸ M Na2SeO3. Cultures were maintained for 48 hours in this differentiation medium without FCS and then treated with leptin at a concentration of 10 ng/ml or vehicle for 24 hours. Each treatment was done in triplicate and the experiment repeated 3 times (n = 3).
Dose-response curves were performed in each cell type to determine the appropriate dose of leptin to be used. The lowest dose with the maximum effect was selected in each case.
Leptin and insulin ELISAs. Serum leptin and insulin levels were measured by ELISA following the manufacturer’s instructions (Linco Research). The lower limits of detection for the leptin and insulin assays were 0.04 and 0.2 ng/ml, respectively. The intra-assay variation was 2.2% for leptin and 1.9% for insulin, and the inter-assay variation was 3.4% for leptin and 7.6% for insulin. All samples were run in duplicate and within the same assay for all analyses.
Total and acylated ghrelin radioimmunoassays. Total and acylated ghrelin were measured by radioimmunoassay (RIA) following the manufacturer’s instruc-tions (Linco Research). The sensitivity of the method was 93 pg/ml for both assays, and the intra- and inter-assay coefficients of variation were 6.4% and 16.3% for total ghrelin and 7.4% and 13.4% for acylated ghrelin, respectively.
Glutamate concentrations. After incubation of primary hypothalamic astro-cyte cultures with leptin or vehicle for 24 hours as described above, 1 ml of medium was removed from each culture and lyophilized (n = 3 inde-pendent experiments). Glutamate detection was performed following the manufacturer’s instructions (BioVision).
Glucose uptake. [3H]-2-deoxy-glucose ([3H]-2-DG) uptake experiments were conducted as previously described (83), with some modifications.The assay was initiated by replacing the culture medium with assay buffer: NaCl (113 mM), KCl (3 mM), KH2PO4 (1.2 mM), MgSO4 (1.2 mM), CaCl2 (2.5 mM), NaHCO3 (25 mM), glucose (5.5 mM), and HEPES (10 mM) and washed (5 minutes). Astrocytes (25,000 in P96 plates, 100 μl) were either treated with leptin (100 ng/ml) for 24 hours or added for 10 minutes dur-ing the preincubation period and maintained during the incubation. Assay buffer containing [3H]-2-DG (100 nM final concentration; specific activity 60.0 Ci/mmol; American Radiolabeled Chemicals Inc.) was added, and the cells were incubated for an additional 60 minutes at 37°C in a shaking
research article
3910 The Journal of Clinical Investigation http://www.jci.org Volume 122 Number 11 November 2012
incubator. Uptake was terminated by washing the cells 4 times for 3 min-utes with ice-cold assay buffer. The cells were lysed with 120 μl 0.1 N NaOH scraped and maintained in a microplate shaker for 1 hour; an aliquot of 100 μl was counted in a scintillation counter. Blanks that were similarly processed but incubated at 0°C accounted for 20% of the radioactivity in control cultures, and this was subtracted from all measurements. All experiments were performed in triplicate and using astrocyte cultures from at least 5 different male pups.
Glutamate uptake. Glutamate uptake was performed according to the method described by Flott and Seifert (84) with the modifications reported by Fernández-Tomé et al. (85). In preliminary experiments, the appro-priate cell density was selected. Accordingly, astrocytes were plated at a density of 25,000 cells in 96-well plates (100 μl). In brief, cultures were washed (two 5-minute washes and one 10-minute wash) with warm (37°C) HEPES sucrose medium (HSM) (20 mM HEPES, pH 7.4, adjusted with KOH, isosmotic at 310 mosM by sucrose). Cultures were preincubated for 10 minutes at 37°C in a shaking incubator in incubation buffer (28 mM HEPES, 150 mM NaCl, pH 7.4, adjusted with Tris base isosmotic at 310 mosM by sucrose). Astrocytes were either treated with leptin (100 ng/ml) for 24 hours or added for 10 minutes during the preincubation period. After that, [3H]-Glu (10 nM final concentration; specific activity 30.0 Ci/mmol; American Radiolabeled Chemicals Inc.) in 50 μM cold glutamate (in incubation buffer) was added to the cells and further incubated for 20 minutes. Plates were washed (four 3-minute washes) with ice-cold HSM. The cells were lysed with 120 μl 0.1 N NaOH, scraped, and maintained in a microplate shaker for 1 hour; an aliquot of 100 μl was counted in a scintillation counter. Blanks that were similarly processed but incubated at 0°C accounted for 20% of the radioactivity in control cultures, and this was subtracted from all measurements. All experiments were performed in triplicate and using astrocyte cultures from at least 5 different male pups.
Protein extraction. Hypothalami were isolated on ice using the following boundaries: an anterior cut was made at the level of the optic chiasm, a posterior coronal section anterior to the mammillary bodies, 2 sagittal cuts parallel to the lateral ventricles, and a dorsal horizontal cut at the level of the anterior commissure. Tissue was homogenized on ice in RIPA lysis buf-fer (50 mM NaH2PO4, 100 mM Na2H2PO4, 0.1% SDS, 0.5% NaCl, 1% Triton X-100) with 5 mg/ml sodium deoxycholate, phenyl-methane-sulfonylfluo-ride (1 mM), and a cocktail of EDTA-free protease inhibitors (Roche Diag-nostics). The lysates were incubated overnight at –80°C and centrifuged at 14,000 g for 10 minutes at 4°C; the supernatant was transferred to a new tube to be stored at –80°C until assayed. Total protein concentration was determined by the method of Bradford (Bio-Rad Laboratories).
The RCA-6 cultures were processed using the above lysis buffer, while a lysis buffer containing 25 mM HEPES, 150 mM KCl, 2 mM EDTA, 0.1% Igepal, 1 mM PMSF, 10 μM benzamidine and leupeptin, and 0.5 mM DTT was used for primary astrocyte cultures. The samples were frozen and stored at –80°C for 24 hours. They were then centrifuged for 20 min-utes at 21,200 g (4°C) and the supernatant removed. Protein from RCA-6 neurons was stored at –80°C. The supernatant from astrocyte cultures was removed, frozen, lyophilized, and then resuspended in 40 μl sterile water and stored at –80°C.
Cell membrane isolation. Plasma membrane proteins isolation was per-formed by using Plasma Membrane Qproteome kits (QIAGEN) following the manufacturer’s instructions and starting with 107 cells per column. Briefly, cells were lysed and centrifuged for 20 minutes at 15,600 g at 4°C. A sample of the total protein fraction (50 μl) was collected, lyophilized, resuspended in distilled water, and stored at –80°C. The binding ligand product supplied by the manufacturer was added to the samples and incu-bated at 4°C for 60 minutes with continuous mixing. Equilibrated Strep-Tactin magnetic beads were added to the remaining total protein fraction
and incubated for 60 minutes at 4°C with continuous mixing. Membrane proteins were eluted from the magnetic beads with the supplied buffer and the proteins precipitated with acetone. The pellet was reconstituted in 15 μl distilled water.
Western blotting. Proteins were resolved on a 10% SDS-polyacrylamide gel under denaturing conditions, electro-transferred to PVDF membranes (Bio-Rad), and the transfer efficiency determined by Ponceau red dyeing. Membranes were blocked and incubated overnight at 4°C under agitation, with the primary antibody at a concentration of 1:1000 unless otherwise stated. Primary antibodies included the following: anti-GFAP and anti-vimentin (Sigma-Aldrich); anti-PCNA (Signet Laboratories); anti–GLT-1 (Affinity BioReagents); anti–GLUT-1, anti–GLUT-2, anti–GLUT-3, and anti-GLAST (Alpha Diagnostic International); anti-GS (USBiological); anti-Iba1 (WAKO Chemicals); anti-GAD (Millipore); and anti-GAPDH (AnaSpec). Secondary antibodies conjugated with peroxidase were from Pierce Biotechnology. Bound peroxidase activity was visualized by chemi-luminescence (PerkinElmer Life Science) and quantified by densitometry using a Kodak Gel Logic 1500 Image Analysis system and Molecular Imaging Software, version 4.0. All blots were rehybridized with GAPDH to normalize samples to control values on each gel. See complete uned-ited blots in the supplemental material (available online with this article; doi:10.1172/JCI64102DS1).
RNA preparation and quantitative real-time PCRTotal RNA was extracted from the hypothalamus or cell cultures according to the Tri-Reagent protocol, and cDNA was then synthesized from total RNA by using a high-capacity cDNA reverse transcription kit (Applied Biosystems).
Hypothalamic AgRP (Rn01431703), POMC (Rn00595020), NPY (Rn01410145), CART (Rn00567382), LepR (Rn01433205), IL6 (Rn01410330), IL1β (Rn00580432), TNFα (Rn01525859), and SOCS3 (Rn00585674) mRNA levels were assessed by quantitative real-time PCR using assay-on-demand kits (Applied Biosystems). In cell cultures, GLUT-1 (Rn01417099), GLUT-2 (Rn00563565) GLUT-3 (Rn00567331), GLUT-4 (Rn00562597), glucagon receptor (Rn00597158), ghrelin receptor (Rn00821417), and insulin receptor (Rn00567670) were used. TaqMan Universal PCR Master Mix (Applied Bio-systems) was used for amplification according to the manufacturer’s proto-col in an ABI PRISM 7000 Sequence Detection System (Applied Biosystems). Values were normalized to the housekeeping gene phosphoglycerate kinase 1 (PGK-1) (Rn00821429). According to the manufacturer’s guidelines, the ΔΔCT method was used to determine relative expression levels. Statistics were performed using ΔΔCT values (86).
Electron microscopy. The mice were perfused (4% paraformaldehyde, 0.1% glutaraldehyde, and 15% picric acid in phospate buffer), and their brains were processed for immunolabeling for GFP for electron microscopy stud-ies. Ultrathin sections were cut on a Leica Ultra-Microtome, collected on Formvar-coated single-slot grids, and analyzed with a Tecnai 12 Biotwin electron microscope (FEI). The analysis of synapse number was performed in an unbiased fashion as described elsewhere (14, 15, 17, 18, 22, 23).
Quantification of astrocytic coverage on POMC cells. The analysis of the astro-cytic coverage of the cell membrane of labeled POMC cells was performed using ImageJ. Electron microscopy photographs (×11,500) were used to measure the perimeter of each POMC cell analyzed and the amount of membrane covered by astrocytes (in nanometers). The results are reported as astrocyte coverage/perimeter POMC cell.
Immunohistochemistry. Coronal brain sections (40 μm) were cut on a vibra-tome (Leica VT1200S; Leica Biosystems Nussloch GmbH) and stored in cryoprotection solution at –20°C. Immunohistochemistry for GFAP and vimentin was performed as previously described (18). Six sections/animal distributed from –2.3 to –3.3 mm from the bregma (87) containing both the arcuate nucleus and hippocampus were analyzed. Images from 15

research article
The Journal of Clinical Investigation http://www.jci.org Volume 122 Number 11 November 2012 3911
Action potential threshold and spike frequency adaptation were examined as described in our previous papers (6, 17).
Miniature PSCs. Miniature excitatory postsynaptic currents (mEPSCs) were recorded under voltage clamp (held at –60 mV) in the presence of TTX (1 μM) and bicuculline (30 μM). mEPSCs were verified by being blocked with CNQX (10 μM) and AP-5 (50 μM). mIPSCs were recorded under voltage clamp (held at –60 mV) in the presence of TTX (1 μM), CNQX (10 μM), and AP-5 (50 μM), which were verified by being blocked with bicuculline (30 μM). To examine statistical significance of change in mPSC frequency in different conditions, Student’s t test and ANOVA were used to compare 2 or more groups of data, respectively. The Kolmogorov-Smirnov test was used to evaluate the significance of change in the ampli-tude of miniature postsynaptic currents.
StatisticsAll data are presented as mean ± SEM. A 2-tailed Student’s t test was used for comparison between 2 groups and 1-way ANOVA for more than 2 groups. Scheffe’s F test was employed for post-hoc analysis. All Western blotting results are reported as the percentage of the control value. P < 0.05 was considered significant.
Study approvalAll experiments were designed according to the European Union laws and NIH guidelines for animal care. Experiments in these studies were approved by the following institutional committees: Commission of Investigation, Hospital Infantil Universitario Niño Jesús; Committee of Animal Experi-mentation of the Universidad Complutense de Madrid, Madrid, Spain; Ethical Committee of Animal Experimentation of the Universidad de Cór-doba; and Institutional Animal Care and Use Committee of Yale University.
AcknowledgmentsThis work was supported by grants from the Spanish Govern-ment (FIS PI100747, BFU2011-27492, and CIBER de Obe-sidad y Nutrición, Instituto de Salud Carlos III, Madrid, Spain). E. Fuente-Martín is supported by a postdoctoral fellowship from CIBERobn. T.L. Horvath was supported by NIH grants DK080000 and DK006850 and an ADA Fellowship grant.
Received for publication April 2, 2012, and accepted in revised form August 27, 2012.
Address correspondence to: Tamas L. Horvath, Program in Inte-grative Cell Signaling and Neurobiology of Metabolism, Section of Comparative Medicine, Department of Obstetrics/Gynecology and Reproductive Sciences, Yale University School of Medicine, 310 Cedar St. BML 330, New Haven, Connecticut 06520-8016, USA. Phone: 203.785.2525; Fax: 203.785.7499; E-mail: tamas. [email protected]. Or to: Julie A. Chowen, Department of Endocri-nology, Hospital Infantil Universitario Niño Jesús, Avenida Mené-ndez Pelayo 65, 28009 Madrid, Spain. Phone: 34.91.503.5939; Fax: 34.91.503.5939; E-mail: [email protected].
Cristina García-Cáceres’s present address is: Institute for Diabetes and Obesity Helmholtz Center Munich, Neuherberg, Germany.
rectangular fields of the arcuate nucleus and hippocampus correspond-ing to an area of 19.5 mm2 in each section were captured at ×40 by using a digital camera. The number of GFAP immunoreactive (GFAP+) cells per field, the number of projections per cell, and the mean projection length were determined using Image-Pro Plus software (version 5.0 for Windows; Media Cybernetics Inc). All morphometric analyses were performed with-out previous knowledge of the experimental group from which the sec-tions were obtained.
ElectrophysiologyMice were anesthetized with isoflurane and killed by decapitation. The brain was gently removed from the skull and chilled in 4°C artificial cerebrospinal fluid (containing NaCl [126 mM]; KCl [2.5 mM]; MgCl2 [1.2 mM]; CaCl2.2H2O [2.4 mM]; NaH2PO4.H2O [1.2 mM]; NaHCO3 [21.4 mM]; glucose levels varied between 2.5 and 11.1: Krebs) that was saturated with 95% O2/5% CO2. Coronal slices (180 μm) were cut through the full extent of the arcuate nucleus/lateral hypothalamus. Slices were maintained for 1 hour at 35°C in 95% O2/5% CO2-saturated ACSF prior to recordings. We routinely obtained 6 usable slices contain-ing GFP neurons from each mouse. After recovery for 1 hour, the slices were placed on the stage of the upright, hybrid fluorescence/infrared microscope with long working distance objectives (Olympus BX51WI), and the presence of florescent cells was verified. Fluorescence filter sets appropriate for Sapphire FP, cyan FP, and GFP (Chroma Technology Corp.) were used to confirm cell fluorescence. The slices are perfused with oxygenated Krebs (35°C). Using established criteria, an appropri-ate healthy, fluorescent cell was visually selected, and a patch electrode (2–2.5 megaOhm resistance) advanced onto the surface of the cell by a piezo-electric drive. For measurements of membrane potential and glu-tamatergic EPSCs, the patch electrode contained K gluconate (128 mM); HEPES (10 mM); EGTA (1 mM); KCl (10 mM); MgCl2 (1 mM); CaCl2 (0.3 mM); {Mg}-ATP (5 mM); and {Na}GTP (0.3 mM); for measurements of GABAergic IPSC frequency, it contained CsCl (140 mM); Hepes (10 mM); MgCl2 (5 mM); Bapta (1 mM); {Mg}-ATP (5 mM); and {Na}GTP (0.3 mM). The junction potential between the intracellular electrode and the bath solution was manually balanced immediately prior to seal for-mation. A seal-test program (part of Axograph 4.9 software suite; Axon Instruments) was used to follow seal formation. Once the pressure in the electrode was released, a seal onto the cell began to form. Sufficient holding current to maintain the cell at –60 mV was applied through the amplifier headstage (Multiclamp 700A; Axon Instruments Inc.); this also assisted the seal formation. Once a seal with more than a giga Ohm resistance was formed, the pressure in the electrode was normalized to atmospheric pressure. The cell membrane under the electrode was ruptured by gentle suction, and cellular capacitance and resistance were manually compensated. Throughout the recording, both intracellular access and membrane capacitance were monitored, and only cells that showed stable access resistance were used for data analysis.
I-V relationships. The I-V relationships (current voltage curves) were exam-ined using current clamp recording. A series of current injections (100 ms duration, from –50pA to 50 pA with an increment of 5 pA) were delivered to the recorded neuron. The I-V relationship was obtained from the above experiments, and membrane conductance of the recorded neuron was determined. The protocol was run several times and the response averaged.
1. Kálmán M. GFAP expression withdraws--a trend of glial evolution? Brain Res Bull. 2002;57(3–4):509–511.
2. Nedergaard M, Ransom B, Goldman SA. New roles for astrocytes: redefining the functional architecture of the brain. Trends Neurosci. 2003;26(10):523–530.
3. Hartline DK. The evolutionary origins of glia. Glia.
2011;59(9):1215–1236. 4. Garcia-Segura LM, Chowen JA, Naftolin F. Endo-
crine glia: roles of glial cells in the brain actions of steroid and thyroid hormones and in the regula-tion of hormone secretion. Front Neuroendocrinol. 1996;17(2):180–211.
5. Theodosis DT, Piet R, Poulain DA, Oliet SHR. Neuronal, glial and synaptic remodeling in the adult hypothalamus: functional consequences and role of cell surface and extracellular matrix adhe-sion molecules. Neurochem Int. 2004;45(4):491–501.
6. Coppola A, et al. A central thermogenic-like mech-

research article
3912 The Journal of Clinical Investigation http://www.jci.org Volume 122 Number 11 November 2012
anism in feeding regulation: an interplay between arcuate nucleus T3 and UCP2. Cell Metab. 2007; 5(1):21–33.
7. Pan W, et al. Astrocyte leptin receptor (ObR) and leptin transport in adult-onset obese mice. Endocri-nology. 2008;149(6):2798–2806.
8. Hsuchou H, et al. Obesity induces functional astrocytic leptin receptors in hypothalamus. Brain. 2009;132(pt 4):889–902.
9. Horvath TL, et al. Synaptic input organization of the melanocortin system predicts diet-induced hypothalamic reactive gliosis and obesity. Proc Natl Acad Sci U S A. 2010;107(33):14875–14880.
10. Yi C-X, Habegger KM, Chowen JA, Stern J, Tschöp MH. A role for astrocytes in the central control of metabolism. Neuroendocrinology. 2011;93(3):143–149.
11. Thaler JP, et al. Obesity is associated with hypotha-lamic injury in rodents and humans. J Clin Invest. 2012;122(1):153–162.
12. Lee DA, et al. Tanycytes of the hypothalamic medi-an eminence form a diet-responsive neurogenic niche. Nat Neurosci. 2012;15(5):700–702.
13. Dietrich MO, Horvath TL. Fat incites tanycytes to neurogenesis. Nat Neurosci. 2012;15(5):651–653.
14. Garcia-Segura LM, Lorenz B, DonCarlos LL. The role of glia in the hypothalamus: implications for gonadal steroid feedback and reproductive neuroen-docrine output. Reproduction. 2008;135(4):419–429.
15. Diano S, Naftolin F, Horvath TL. Kainate gluta-mate receptors (GluR5-7) in the rat arcuate nucle-us: relationship to tanycytes, astrocytes, neurons and gonadal steroid receptors. J Neuroendocrinol. 1998;10(4):239–247.
16. Hsuchou H, Pan W, Barnes MJ, Kastin AJ. Leptin receptor mRNA in rat brain astrocytes. Peptides. 2009;30(12):2275–2280.
17. Pinto S, et al. Rapid rewiring of arcuate nucle-us feeding circuits by leptin. Science. 2004; 304(5667):110–115.
18. García-Cáceres C, et al. Differential acute and chronic effects of leptin on hypothalamic astrocyte morphology and synaptic protein levels. Endocrinol-ogy. 2011;152(5):1809–1818.
19. Fernandez-Fernandez S, Almeida A, Bolaños JP. Antioxidant and bioenergetic coupling between neurons and astrocytes. Biochem J. 2012;443(1):3–11.
20. Khandelwal PJ, Herman AM, Moussa CEH. Inflam-mation in the early stages of neurodegenerative pathology. J Neuroimmunol. 2011;238(1–2):1–11.
21. Gupta S, Knight AG, Gupta S, Keller JN, Bruce-Keller AJ. Saturated long-chain fatty acids activate inflammatory signaling in astrocytes. J Neurochem. 2012;120(6):1060–1071.
22. Pellerin L. How astrocytes feed hungry neurons. Mol Neurobiol. 2005;32(1):59–72.
23. Pellerin L, Bouzier-Sore A-K, Aubert A, et al. Activ-ity-dependent regulation of energy metabolism by astrocytes: an update. Glia. 2007;55(12):1251–1262.
24. Levin BE, Magnan C, Dunn-Meynell A, Foll CL. Metabolic sensing and the brain: who, what, where, and how? Endocrinology. 2011;152(7):2552–2557.
25. Morgello S, Uson RR, Schwartz EJ, Haber RS. The human blood-brain barrier glucose transporter (GLUT1) is a glucose transporter of gray matter astrocytes. Glia. 1995;14(1):43–54.
26. Kacem K, Lacombe P, Seylaz J, Bonvento G. Struc-tural organization of the perivascular astrocyte endfeet and their relationship with the endothelial glucose transporter: a confocal microscopy study. Glia. 1998;23(1):1–10.
27. García MA, Millán C, Balmaceda-Aguilera C, et al. Hypothalamic ependymal-glial cells express the glucose transporter GLUT2, a protein involved in glucose sensing. J Neurochem. 2003;86(3):709–724.
28. Young JK, McKenzie JC. GLUT2 immunoreactivity in Gomori-positive astrocytes of the hypothala-mus. J Histochem Cytochem. 2004;52(11):1519–1524.
29. Kang L, Routh VH, Kuzhikandathil EV, Gaspers
LD, Levin BE. Physiological and molecular charac-teristics of rat hypothalamic ventromedial nucleus glucosensing neurons. Diabetes. 2004;53(3):549–559.
30. Guillod-Maximin E, Lorsignol A, Alquier T, Pénicaud L. Acute intracarotid glucose injection towards the brain induces specific c-fos activation in hypothalamic nuclei: involvement of astrocytes in cerebral glucose-sensing in rats. J Neuroendocri-nol. 2004;16(5):464–471.
31. Stolarczyk E, et al. Detection of extracellular glu-cose by GLUT2 contributes to hypothalamic con-trol of food intake. Am J Physiol Endocrinol Metab. 2010;298(5):E1078–E1087.
32. Marty N, et al. Regulation of glucagon secretion by glucose transporter type 2 (glut2) and astrocyte-dependent glucose sensors. J Clin Invest. 2005; 115(12):3545–3553.
33. Bady I, et al. Evidence from glut2-null mice that glucose is a critical physiological regulator of feed-ing. Diabetes. 2006;55(4):988–995.
34. Yu S, Tooyama I, Ding WG, Kitasato H, Kimura H. Immunohistochemical localization of glucose transporters (GLUT1 and GLUT3) in the rat hypo-thalamus. Obes Res. 1995;3(suppl 5):753S–776S.
35. McCall AL, Bueren AMV, Moholt-Siebert M, Cherry NJ, Woodward WR. Immunohistochemical localization of the neuron-specific glucose trans-porter (GLUT3) to neuropil in adult rat brain. Brain Res. 1994;659(1–2):292–297.
36. Gerhart DZ, Leino RL, Borson ND, et al. Localization of glucose transporter GLUT 3 in brain: comparison of rodent and dog using species-specific carboxyl-terminal antisera. Neuroscience. 1995;66(1):237–246.
37. Sonnewald U, Westergaard N, Schousboe A. Gluta-mate transport and metabolism in astrocytes. Glia. 1997;21(1):56–63.
38. Westergaard N, Sonnewald U, Schousboe A. Meta-bolic trafficking between neurons and astrocytes: the glutamate/glutamine cycle revisited. Dev Neu-rosci. 1995;17(4):203–211.
39. Rothstein JD, et al. Knockout of glutamate trans-porters reveals a major role for astroglial transport in excitotoxicity and clearance of glutamate. Neu-ron. 1996;16(3):675–686.
40. Oliet SH, Piet R, Poulain DA. Control of glutamate clearance and synaptic efficacy by glial coverage of neurons. Science. 2001;292(5518):923–926.
41. Marcaggi P, Billups D, Attwell D. The role of glial glutamate transporters in maintaining the indepen-dent operation of juvenile mouse cerebellar parallel fibre synapses. J Physiol. 2003;552(pt 1):89–107.
42. Regan MR, Huang YH, Kim YS, et al. Variations in promoter activity reveal a differential expres-sion and physiology of glutamate transporters by glia in the developing and mature CNS. J Neurosci. 2007;27(25):6607–6619.
43. Schmitt A, Asan E, Püschel B, Kugler P. Cellular and regional distribution of the glutamate trans-porter GLAST in the CNS of rats: nonradioactive in situ hybridization and comparative immunocy-tochemistry. J Neurosci. 1997;17(1):1–10.
44. Yamada K, Fukaya M, Shibata T, et al. Dynamic transformation of Bergmann glial fibers proceeds in correlation with dendritic outgrowth and syn-apse formation of cerebellar Purkinje cells. J Comp Neurol. 2000;418(1):106–120.
45. Vickers MH, Gluckman PD, Coveny AH, et al. The effect of neonatal leptin treatment on postnatal weight gain in male rats is dependent on maternal nutritional status during pregnancy. Endocrinology. 2008;149(4):1906–1913.
46. Tamashiro KLK, Terrillion CE, Hyun J, Koenig JI, Moran TH. Prenatal stress or high-fat diet increas-es susceptibility to diet-induced obesity in rat off-spring. Diabetes. 2009;58(5):1116–1125.
47. Glavas MM, Kirigiti MA, Xiao XQ, et al. Early overnutrition results in early-onset arcuate leptin resistance and increased sensitivity to high-fat diet.
Endocrinology. 2010;151(4):1598–1610. 48. Steculorum SM, Bouret SG. Maternal diabetes
compromises the organization of hypothalamic feeding circuits and impairs leptin sensitivity in offspring. Endocrinology. 2011;152(11):4171–4179.
49. Bouret SG, Draper SJ, Simerly RB. Trophic action of leptin on hypothalamic neurons that regulate feeding. Science. 2004;304(5667):108–110.
50. Udagawa J, Hashimoto R, Hioki K, Otani H. The role of leptin in the development of the cortical neuron in mouse embryos. Brain Res. 2006;1120(1):74–82.
51. Desai M, Li T, Ross MG. Fetal hypothalamic neuro-progenitor cell culture: preferential differentiation paths induced by leptin and insulin. Endocrinology. 2011;152(8):3192–3201.
52. Fuente-Martín E, et al. Early nutritional changes induce sexually dimorphic long-term effects on bodyweight gain and the response to sucrose intake in adult rats. Metabolism. 2012;61(6):812–822.
53. Udagawa J, et al. The role of leptin in the devel-opment of the cerebral cortex in mouse embryos. Endocrinology. 2006;147(2):647–658.
54. Benoit SC, Davis JF, Davidson TL. Learned and cognitive controls of food intake. Brain Res. 2010; 1350:71–76.
55. Tapia-González S, et al. Activation of microglia in specific hypothalamic nuclei and the cerebellum of adult rats exposed to neonatal overnutrition. J Neuroendocrinol. 2011;23(4):365–370.
56. Hertz L, Dringen R, Schousboe A, Robinson SR. Astrocytes: glutamate producers for neurons. J Neurosci Res. 1999;57(4):417–428.
57. Pan W, Hsuchou H, Xu C, Wu X, Bouret SG, Kastin AJ. Astrocytes modulate distribution and neuronal signaling of leptin in the hypothalamus of obese A vy mice. J Mol Neurosci. 2011;43(3):478–484.
58. Fuente-Martín E, et al. Early postnatal overnutri-tion increases adipose tissue accrual in response to a sucrose-enriched diet. Am J Physiol Endocrinol Metab. 2012;302(12):E1586–E1598.
59. Navarrete M, Perea G, Maglio L, Pastor J, García de Sola R, Araque A. Astrocyte calcium signal and gliotransmission in human brain tissue [pub-lished online ahead of print May 10, 2012]. Cereb Cortex. doi:10.1093/cercor/bhs122.
60. Serres S, Bouyer J-J, Bezancon E, Canioni P, Merle M. Involvement of brain lactate in neuronal metab-olism. NMR Biomed. 2003;16(6–7):430–439.
61. Bouret SG, Simerly RB. Development of leptin-sen-sitive circuits. J Neuroendocrinol. 2007;19(8):575–582.
62. Stanley BG, Urstadt KR, Charles JR, Kee T. Gluta-mate and GABA in lateral hypothalamic mecha-nisms controlling food intake. Physiol Behav. 2011; 104(1):40–46.
63. Duan S, Anderson CM, Stein BA, Swanson RA. Glutamate induces rapid upregulation of astrocyte glutamate transport and cell-surface expression of GLAST. J Neurosci. 1999;19(23):10193–10200.
64. Bergles DE, Dzubay JA, Jahr CE. Glutamate trans-porter currents in bergmann glial cells follow the time course of extrasynaptic glutamate. Proc Natl Acad Sci U S A. 1997;94(26):14821–14825.
65. Magistretti PJ, Pellerin L. Astrocytes couple synap-tic activity to glucose utilization in the brain. News Physiol Sci. 1999;14:177–182.
66. Pellerin L, Magistretti PJ. Glutamate uptake into astrocytes stimulates aerobic glycolysis: a mechanism coupling neuronal activity to glucose utilization. Proc Natl Acad Sci U S A. 1994;91(22):10625–10629.
67. Sullivan SM, et al. Cytoskeletal anchoring of GLAST determines susceptibility to brain dam-age: an identified role for GFAP. J Biol Chem. 2007; 282(40):29414–29423.
68. Yang Y, Atasoy D, Su HH, Sternson SM. Hunger states switch a flip-flop memory circuit via a synap-tic AMPK-dependent positive feedback loop. Cell. 2011;146(6):992–1003.
69. Liu T, et al. Fasting activation of AgRP neurons
research article
The Journal of Clinical Investigation http://www.jci.org Volume 122 Number 11 November 2012 3913
requires NMDA receptors and involves spinogen-esis and increased excitatory tone. Neuron. 2012; 73(3):511–522.
70. Tong Q, et al. Synaptic glutamate release by ventro-medial hypothalamic neurons is part of the neu-rocircuitry that prevents hypoglycemia. Cell Metab. 2007;5(5):383–393.
71. Lehmann C, Bette S, Engele J. High extracellular glutamate modulates expression of glutamate transporters and glutamine synthetase in cultured astrocytes. Brain Res. 2009;1297:1–8.
72. Chari M, et al. Glucose transporter-1 in the hypo-thalamic glial cells mediates glucose sensing to regulate glucose production in vivo. Diabetes. 2011; 60(7):1901–1906.
73. Mastaitis JW, Wurmbach E, Cheng H, Sealfon SC, Mobbs CV. Acute induction of gene expression in brain and liver by insulin-induced hypoglycemia. Diabetes. 2005;54(4):952–958.
74. Fanjul C, Barrenetxe J, Iñigo C, et al. Leptin regu-lates sugar and amino acids transport in the human intestinal cell line Caco-2. Acta Physiol (Oxf). 2012; 205(1):82–91.
75. Sakar Y, Nazaret C, Lettéron P, et al. Positive regu-latory control loop between gut leptin and intesti-
nal GLUT2/GLUT5 transporters links to hepatic metabolic functions in rodents. PLoS One. 2009; 4(11):e7935.
76. Tang Y, Chen A. Curcumin prevents leptin raising glucose levels in hepatic stellate cells by blocking translocation of glucose transporter-4 and increasing glucokinase. Br J Pharmacol. 2010;161(5):1137–1149.
77. Kanoski SE, et al. Hippocampal leptin signaling reduces food intake and modulates food-related memory processing. Neuropsychopharmacology. 2011;36(9):1859–1870.
78. Valladolid-Acebes I, et al. High-fat diets induce changes in hippocampal glutamate metabolism and neurotransmission. Am J Physiol Endocrinol Metab. 2012;302(4):E396–E402.
79. Larsson A, Wilhelmsson U, Pekna M, Pekny M. Increased cell proliferation and neurogenesis in the hippocampal dentate gyrus of old GFAP(–/–)Vim(–/–) mice. Neurochem Res. 2004;29(11):2069–2073.
80. Diano S, Naftolin F, Goglia F, Csernus V, Horvath TL. Monosynaptic pathway between the arcuate nucleus expressing glial type II iodothyronine 5’-deiodinase mRNA and the median eminence-projective TRH cells of the rat paraventricular nucleus. J Neuroendocrinol. 1998;10(10):731–742.
81. Shen L, et al. Up-regulation of apolipoprotein E by leptin in the hypothalamus of mice and rats. Physiol Behav. 2009;98(1–2):223–228.
82. Rasmussen JE, Torres-Aleman I, MacLusky NJ, Nafto-lin F, Robbins RJ. The effects of estradiol on the growth patterns of estrogen receptor-positive hypothal amic cell lines. Endocrinology. 1990;126(1):235–240.
83. Allaman I, et al. Amyloid-beta aggregates cause alter-ations of astrocytic metabolic phenotype: impact on neuronal viability. J Neurosci. 2010;30(9):3326–3338.
84. Flott B, Seifert W. Characterization of glutamate uptake systems in astrocyte primary cultures from rat brain. Glia. 1991;4(3):293–304.
85. Fernández-Tomé P, Brera B, Arévalo M-A, de Cebal-los ML. Beta-amyloid25-35 inhibits glutamate uptake in cultured neurons and astrocytes: modu-lation of uptake as a survival mechanism. Neurobiol Dis. 2004;15(3):580–589.
86. Livak KJ, Schmittgen TD. Analysis of relative gene expression data using real-time quantitative PCR and the 2(-Delta Delta C(T)) Method. Methods. 2001;25(4):402–408.
87. Paxinos G, Watson C. The Rat Brain in Stereotaxic Coordinates. 2nd ed. New York, New York, USA: Academic Press; 1986.