united states cancer statistics - cdc wonder
TRANSCRIPT

UnitedStates
Cancer Statistics
2004 InCIdenCe and mortalIty
Publication Year 2007
U . S . d e p a r t m e n t o f H e a lt H a n d H U m a n S e r v I C e S
National Program of Cancer Registries (NPCR)National Center for Chronic Disease Prevention and Health PromotionCenters for Disease Control and Prevention4770 Buford Highway, MS K-53 Atlanta, GA 30341-3717 Phone: (770) 488-4783 Fax: (770) 488-4759 Web address: http://www.cdc.gov/cancer/npcr
National Center for Health StatisticsCenters for Disease Control and Prevention3311 Toledo RoadHyattsville, MD 20782-2064Phone: (301) 458-4000E-mail address: [email protected] address: http://www.cdc.gov/nchs
Surveillance, Epidemiology, and End Results (SEER) Program
Surveillance Research ProgramDivision of Cancer Control and Population SciencesNational Cancer InstituteSuite 504, MSC 83156116 Executive BoulevardBethesda, MD 20892-8315Phone: (301) 496-8506Fax: (301) 496-4077Web Address: http://seer.cancer.gov
For more information, contact
Suggested citation: U.S. Cancer Statistics Working Group. United States Cancer Statistics: 2004 Incidence and Mortality. Atlanta: U.S. Department of Health and Human Services, Centers for Disease Control and
Prevention and National Cancer Institute; 2007.
All material in this report is in the public domain and may be reproduced or copied without permission; however, citation as to source is requested.
Ordering Information
United States Cancer Statistics will be published annually. All sections of this report are available on the following Web sites:
• http://www.cdc.gov/uscs• http://seer.cancer.gov/statistics
A CD-ROM of the report may be ordered at http://www.cdc.gov/uscs.
Web-site addresses of nonfederal organizations are provided solely as a service to our readers. Their provision does not constitute an endorsement of these organizations by
CDC or the federal government, and none should be inferred. CDC is not responsible for the content of other organizations’ Web pages.

UnitedStates
Cancer Statistics
2004 Incidence and mortality
U.S. Cancer Statistics Working Group
ii
U.S. Cancer Statistics Working Group
Editors
Centers for Disease North American Association Control and Prevention National Cancer Institute of Central Cancer Registries, Inc. NationalCenterforChronic Brenda K. Edwards, PhD Holly L. Howe, PhD DiseasePreventionand Marsha E. Reichman, PhD Betsy A. Kohler, MPH, CTR HealthPromotion Umed A. Ajani, MBBS, MPH
Cheryll J. Cardinez, MSPH Jessica B. King, MPH Sherri L. Stewart, PhD Trevor D. Thompson, BS Hannah K. Weir, PhD
NationalCenterforHealthStatistics Robert N. Anderson, PhD
United States Cancer Statistics: 2004 Incidence and Mortality
The Centers for Disease Control and Prevention and the National Cancer Institute thank the staff in state and metropolitan area cancer registries for their commitment to cancer surveillance and control programs. The consistent efforts of registry staff to collect complete, timely, and high-quality cancer incidence data are essential for monitoring progress toward reducing the burden of cancer in the United States. A list of state and metropolitan area cancer registries in the National Program of Cancer Registries (NPCR) and the Surveillance, Epidemiology, and End Results (SEER) Program is available at http://www.cdc.gov/uscs.
We thank the National Program of Cancer Registries’ Scientific Working Group members (listed in Appendix A) for their assistance in designing and reviewing this report. We also wish to thank vital registration and statistics staff in the 50 states, New York City, and the District of Columbia for their efforts to provide high-quality, timely, and comparable mortality data.
National partner organizations are crucial to the success of cancer registration and cancer surveillance in the United States. This document, and many advances in cancer surveillance in the United States, would not have been possible without the tireless efforts and many achievements of these organizations. The Centers for Disease Control and Prevention and the National Cancer Institute gratefully acknowledge and thank the American Cancer Society, the American College of Surgeons Commission on Cancer, the American Joint Committee on Cancer, the National Cancer Registrars Association, and our collaborating partner, the North American Association of Central Cancer Registries, Inc. for their support for cancer registration and cancer surveillance provided over many years. Contact information for these national partner organizations is available at http://www.cdc.gov/uscs.
We wish to thank Gayle Clutter, Karen Ledford, Mary Lewis, Frances Michaud, Joan Phillips, and Reda Wilson for assisting with the evaluation and presentation of non-malignant brain data and also for verifying data presented in this volume. We also thank Macro International Inc. for their technical support in receiving and evaluating the data.
Additionally, we would like to acknowledge the members of the Division of Cancer Prevention and Control Web Development Team for their expert assistance with the Web site.
Publication support was provided by Macro International Inc. for the Division of Cancer Prevention and Control, National Center for Chronic Disease Prevention and Health Promotion, Centers for Disease Control and Prevention, U.S. Department of Health and Human Services.
Acknowledgments
iii


�
Preface
United States Cancer Statistics: 2004 Incidence and Mortality is a joint publication of the Centers for Disease Control and Prevention (CDC) in Atlanta, Georgia, and the National Cancer Institute (NCI) in Bethesda, Maryland, in collaboration with the North American Association of Central Cancer Registries, Inc. (NAACCR) in Springfield, Illinois. This is the sixth annual joint report produced by the two federal programs that support population-based cancer registries in the United States: CDC’s National Program of Cancer Registries (NPCR) and NCI’s Surveillance, Epidemiology, and End Results (SEER) Program. This report contains official federal government cancer statistics for more than 1 million invasive cancer cases diagnosed during 2004 among residents of 49 states, 6 metropolitan areas, and the District of Columbia, and these geographic areas are inhabited by about 98% of the U.S. population.
In addition to cancer incidence data, we present cancer mortality data collected and processed by CDC’s National Center for Health Statistics (NCHS). Mortality statistics, based on records of deaths that occurred during 2004, are available for all 50 states and the District of Columbia.
The age-adjusted incidence and death rates are adjusted to the 2000 U.S. standard population, consistent with rates published in previous United States Cancer Statistics reports. Readers should not compare these data with published cancer rates that were not adjusted to the 2000 U.S. standard.
The data presented for brain and other nervous system cancer are expanded this year. In addition to malignant cancer, non-malignant tumors of the brain and other nervous system are included. These data are categorized by histologic subtype, age, and sex.
A Web-based version of the report with current (2004) and updated (1999–2003) cancer incidence statistics is available at http://www.cdc.gov/uscs. Mortality statistics for 1999–2004 are also available. In addition, the Web-based version includes age-specific rates and 3-year combined rates (2002–2004).


�ii
Acknowledgments . . . . . . . . . . . . . . . . . . . . . . . . . . . . . . . . . . . . . . . . . . . . . . . . . . . . . . . . . . . . . iii
Preface . . . . . . . . . . . . . . . . . . . . . . . . . . . . . . . . . . . . . . . . . . . . . . . . . . . . . . . . . . . . . . . . . . . . . . v
List of Tables, Figures, and Appendices . . . . . . . . . . . . . . . . . . . . . . . . . . . . . . . . . . . . . . . . . . . . .ix
Executive Summary . . . . . . . . . . . . . . . . . . . . . . . . . . . . . . . . . . . . . . . . . . . . . . . . . . . . . . . . . . . xv
Format for Numbering the Tables and Figures. . . . . . . . . . . . . . . . . . . . . . . . . . . . . . . . . . . . . . xxiii
Technical Notes
Background. . . . . . . . . . . . . . . . . . . . . . . . . . . . . . . . . . . . . . . . . . . . . . . . . . . . . . . . . . . . . . . . 1
Federal Programs . . . . . . . . . . . . . . . . . . . . . . . . . . . . . . . . . . . . . . . . . . . . . . . . . . . . . . . . . . . 2
Collaborating Partner . . . . . . . . . . . . . . . . . . . . . . . . . . . . . . . . . . . . . . . . . . . . . . . . . . . . . . . . 3
Data Sources . . . . . . . . . . . . . . . . . . . . . . . . . . . . . . . . . . . . . . . . . . . . . . . . . . . . . . . . . . . . . . . 4
United States Cancer Statistics Publication Criteria . . . . . . . . . . . . . . . . . . . . . . . . . . . . . . . . . 7
Populations Covered by This Report . . . . . . . . . . . . . . . . . . . . . . . . . . . . . . . . . . . . . . . . . . . . . 8
Statistical Methods . . . . . . . . . . . . . . . . . . . . . . . . . . . . . . . . . . . . . . . . . . . . . . . . . . . . . . . . . . 9
Interpreting the Data . . . . . . . . . . . . . . . . . . . . . . . . . . . . . . . . . . . . . . . . . . . . . . . . . . . . . . . . 11
United States Cancer Statistics on the Web . . . . . . . . . . . . . . . . . . . . . . . . . . . . . . . . . . . . . . . 16
References . . . . . . . . . . . . . . . . . . . . . . . . . . . . . . . . . . . . . . . . . . . . . . . . . . . . . . . . . . . . . . . 17
Cancer Incidence and Mortality for All Ages: All Areas Combined . . . . . . . . . . . . . . . . . . . . . . . . 25
Cancer Incidence and Mortality, by U.S. Census Region and Division, State,
and Metropolitan Area . . . . . . . . . . . . . . . . . . . . . . . . . . . . . . . . . . . . . . . . . . . . . . . . . . . . . . . . . 55
State and Metropolitan-Area Incidence Rates and State Death Rates for the
Most Common Cancers . . . . . . . . . . . . . . . . . . . . . . . . . . . . . . . . . . . . . . . . . . . . . . . . . . . . . . . . 242
Appendices
List of Abbreviations. . . . . . . . . . . . . . . . . . . . . . . . . . . . . . . . . . . . . . . . . . . . . . . Inside back cover
Table of Contents


ix
Cancer Incidence and Mortality for All Ages: All Areas Combined
Figure 1 State and Metropolitan-Area Cancer Registries, by Affiliation in Federal Cancer Surveillance Programs. . . . . . . . . . . . . . . . . . . . . . . . . . . . . . . . . 25 Tables 1.1.1.1M– Age-adjusted invasive cancer incidence and death 1.1.1.2F rates and 95% confidence intervals by primary site, race and ethnicity, and sex, United States, 2004. . . . . . . . . . . . . . . . . . . . . . . . . . 26
Tables 1.1.2.1M– All cancer sites combined. Invasive cancer incidence and 1.1.2.2F death rates and 95% confidence intervals by age, race and ethnicity, and sex, United States, 2004 . . . . . . . . . . . . . . . . . . . . . . . . . . . . . . . . . 34 Tables 1.2.1.1M– Age-adjusted invasive cancer incidence rates and 95% 1.2.1.1F confidence intervals for ages 0–19 by International Classification of Childhood Cancer (ICCC) group and subgroup, race and ethnicity, and sex, United States, 2004. . . . . . . . . . . . . . . . . . . . . . . . . . 38 Table 1.2.2.1 Age-Adjusted Invasive Cancer Incidence Rates and 95% Confidence Intervals by International Classification of Childhood Cancer (ICCC) Group and Subgroup, and Age, United States. All Races, Males and Females, 2004. . . . . . . . . . . . . . . . . . . . . . . 42 Table 1.2.3.1 Invasive Cancer Incidence Rates and 95% Confidence Intervals by International Classification of Childhood Cancer (ICCC) Group and Subgroup, and Age, United States. All Races, Males and Females, 2004. . . . . . . . . . . . . . . . . . . . . . . . . . . . . 44 Tables 1.2.4.1M– Childhood age-adjusted invasive cancer incidence and 1.2.4.2F death rates and 95% confidence intervals for ages 0–19 by primary site, race and ethnicity, and sex, United States, 2004. . . . . . . . . . . . . 46 Tables 1.2.5.1– Childhood age-adjusted invasive cancer incidence and death 1.2.5.2 rates and 95% confidence intervals by primary site and age, United States. All races, males and females, 2004 . . . . . . . . . . . . . . . . . . . . . . . . 48 Tables 1.2.6.1– Childhoodinvasivecancerincidenceanddeathratesand 1.2.6.2 95%confidenceintervalsbyprimarysiteandage,United States.Allraces,malesandfemales,2004 . . . . . . . . . . . . . . . . . . . . . . . . . . . . . . 49Tables1.3.1.1M– Age-adjustedincidenceratesand95%confidenceintervals 1.3.1.1F forbrainandothernervoussystemtumorsbyhistologic grouping,age,behavior,andsex,UnitedStates,2004 . . . . . . . . . . . . . . . . . . . . . 50
List of Tables, Figures, and Appendices

United States Cancer Statistics: 2004 Incidence and Mortality
x
Cancer Incidence and Mortality, by U.S. Census Region and Division, State, and Metropolitan Area
Figure 2 Geographic Areas Contributing Data to United States Cancer Statistics: 2004 Incidence and Mortality, by U.S. Census Region and Division . . . . . . . . . . . . . . . . . . . . . . . . . . . . . . . . . . . . . . . . . . . . . . . 55
Tables 2.1.1.1M– Age-adjusted cancer incidence and death rates and 95% confidence 2.27.1.2F intervals, by U.S. Census region and division, state, metropolitan area, and race and ethnicity, by primary site and sex, United States, 2004
All Cancer Sites Combined . . . . . . . . . . . . . . . . . . . . . . . . . . . . . . . . . . . . . . . . . . . . . . . . . . 56
Brain and Other Nervous System . . . . . . . . . . . . . . . . . . . . . . . . . . . . . . . . . . . . . . . . . . . . . . 64
Breast . . . . . . . . . . . . . . . . . . . . . . . . . . . . . . . . . . . . . . . . . . . . . . . . . . . . . . . . . . . . . . . . . . . 72
Breast, in situ . . . . . . . . . . . . . . . . . . . . . . . . . . . . . . . . . . . . . . . . . . . . . . . . . . . . . . . . . . . . . 76
Cervix Uteri . . . . . . . . . . . . . . . . . . . . . . . . . . . . . . . . . . . . . . . . . . . . . . . . . . . . . . . . . . . . . . 78
Colon and Rectum. . . . . . . . . . . . . . . . . . . . . . . . . . . . . . . . . . . . . . . . . . . . . . . . . . . . . . . . . . 82
Corpus and Uterus, NOS. . . . . . . . . . . . . . . . . . . . . . . . . . . . . . . . . . . . . . . . . . . . . . . . . . . . . 90
Esophagus. . . . . . . . . . . . . . . . . . . . . . . . . . . . . . . . . . . . . . . . . . . . . . . . . . . . . . . . . . . . . . . . 94
Hodgkin Lymphoma . . . . . . . . . . . . . . . . . . . . . . . . . . . . . . . . . . . . . . . . . . . . . . . . . . . . . . . 102
Kaposi Sarcoma . . . . . . . . . . . . . . . . . . . . . . . . . . . . . . . . . . . . . . . . . . . . . . . . . . . . . . . . . . 110
Kidney and Renal Pelvis . . . . . . . . . . . . . . . . . . . . . . . . . . . . . . . . . . . . . . . . . . . . . . . . . . . . 114
Larynx . . . . . . . . . . . . . . . . . . . . . . . . . . . . . . . . . . . . . . . . . . . . . . . . . . . . . . . . . . . . . . . . . 122
Leukemias . . . . . . . . . . . . . . . . . . . . . . . . . . . . . . . . . . . . . . . . . . . . . . . . . . . . . . . . . . . . . . 130
Liver and Intrahepatic Bile Duct . . . . . . . . . . . . . . . . . . . . . . . . . . . . . . . . . . . . . . . . . . . . . . 138
Lung and Bronchus . . . . . . . . . . . . . . . . . . . . . . . . . . . . . . . . . . . . . . . . . . . . . . . . . . . . . . . . 146
Melanomas of the Skin . . . . . . . . . . . . . . . . . . . . . . . . . . . . . . . . . . . . . . . . . . . . . . . . . . . . . 154
Mesothelioma . . . . . . . . . . . . . . . . . . . . . . . . . . . . . . . . . . . . . . . . . . . . . . . . . . . . . . . . . . . . 162
Myeloma. . . . . . . . . . . . . . . . . . . . . . . . . . . . . . . . . . . . . . . . . . . . . . . . . . . . . . . . . . . . . . . . 170
Non-Hodgkin Lymphoma . . . . . . . . . . . . . . . . . . . . . . . . . . . . . . . . . . . . . . . . . . . . . . . . . . . 178
Oral Cavity and Pharynx . . . . . . . . . . . . . . . . . . . . . . . . . . . . . . . . . . . . . . . . . . . . . . . . . . . . 186
Ovary . . . . . . . . . . . . . . . . . . . . . . . . . . . . . . . . . . . . . . . . . . . . . . . . . . . . . . . . . . . . . . . . . . 194
Pancreas . . . . . . . . . . . . . . . . . . . . . . . . . . . . . . . . . . . . . . . . . . . . . . . . . . . . . . . . . . . . . . . . 198
Prostate . . . . . . . . . . . . . . . . . . . . . . . . . . . . . . . . . . . . . . . . . . . . . . . . . . . . . . . . . . . . . . . . . 206
Stomach . . . . . . . . . . . . . . . . . . . . . . . . . . . . . . . . . . . . . . . . . . . . . . . . . . . . . . . . . . . . . . . . 210
Testis . . . . . . . . . . . . . . . . . . . . . . . . . . . . . . . . . . . . . . . . . . . . . . . . . . . . . . . . . . . . . . . . . . 218

List of Tables, Figures, and Appendices
xi
Thyroid . . . . . . . . . . . . . . . . . . . . . . . . . . . . . . . . . . . . . . . . . . . . . . . . . . . . . . . . . . . . . . . . . 222
Urinary Bladder . . . . . . . . . . . . . . . . . . . . . . . . . . . . . . . . . . . . . . . . . . . . . . . . . . . . . . . . . . 230
State and Metropolitan-Area Incidence Rates and State Death Rates for the Most Common Cancers
Figures 3.1.M1– Age-adjusted cancer incidence and death rates for the 10 3.58.F2 primary sites with the highest rates within race- and ethnic-specific categories, by geographic area and sex, 2004
United States. . . . . . . . . . . . . . . . . . . . . . . . . . . . . . . . . . . . . . . . . . . . . . . . . . . . . . . . . . . . . 242
Alabama . . . . . . . . . . . . . . . . . . . . . . . . . . . . . . . . . . . . . . . . . . . . . . . . . . . . . . . . . . . . . . . . 246
Alaska. . . . . . . . . . . . . . . . . . . . . . . . . . . . . . . . . . . . . . . . . . . . . . . . . . . . . . . . . . . . . . . . . . 250
Arizona . . . . . . . . . . . . . . . . . . . . . . . . . . . . . . . . . . . . . . . . . . . . . . . . . . . . . . . . . . . . . . . . . 254
Arkansas . . . . . . . . . . . . . . . . . . . . . . . . . . . . . . . . . . . . . . . . . . . . . . . . . . . . . . . . . . . . . . . . 258
California . . . . . . . . . . . . . . . . . . . . . . . . . . . . . . . . . . . . . . . . . . . . . . . . . . . . . . . . . . . . . . . 262
Los Angeles . . . . . . . . . . . . . . . . . . . . . . . . . . . . . . . . . . . . . . . . . . . . . . . . . . . . . . . . . . . . 266
San Francisco-Oakland . . . . . . . . . . . . . . . . . . . . . . . . . . . . . . . . . . . . . . . . . . . . . . . . . . . 270
San Jose-Monterey. . . . . . . . . . . . . . . . . . . . . . . . . . . . . . . . . . . . . . . . . . . . . . . . . . . . . . . 274
Colorado . . . . . . . . . . . . . . . . . . . . . . . . . . . . . . . . . . . . . . . . . . . . . . . . . . . . . . . . . . . . . . . . 278
Connecticut. . . . . . . . . . . . . . . . . . . . . . . . . . . . . . . . . . . . . . . . . . . . . . . . . . . . . . . . . . . . . . 282
Delaware. . . . . . . . . . . . . . . . . . . . . . . . . . . . . . . . . . . . . . . . . . . . . . . . . . . . . . . . . . . . . . . . 286
District of Columbia . . . . . . . . . . . . . . . . . . . . . . . . . . . . . . . . . . . . . . . . . . . . . . . . . . . . . . . 290
Florida . . . . . . . . . . . . . . . . . . . . . . . . . . . . . . . . . . . . . . . . . . . . . . . . . . . . . . . . . . . . . . . . . 294
Georgia . . . . . . . . . . . . . . . . . . . . . . . . . . . . . . . . . . . . . . . . . . . . . . . . . . . . . . . . . . . . . . . . . 298
Atlanta . . . . . . . . . . . . . . . . . . . . . . . . . . . . . . . . . . . . . . . . . . . . . . . . . . . . . . . . . . . . . . . . 302
Hawaii . . . . . . . . . . . . . . . . . . . . . . . . . . . . . . . . . . . . . . . . . . . . . . . . . . . . . . . . . . . . . . . . . 306
Idaho. . . . . . . . . . . . . . . . . . . . . . . . . . . . . . . . . . . . . . . . . . . . . . . . . . . . . . . . . . . . . . . . . . . 310
Illinois . . . . . . . . . . . . . . . . . . . . . . . . . . . . . . . . . . . . . . . . . . . . . . . . . . . . . . . . . . . . . . . . . 314
Indiana . . . . . . . . . . . . . . . . . . . . . . . . . . . . . . . . . . . . . . . . . . . . . . . . . . . . . . . . . . . . . . . . . 318
Iowa . . . . . . . . . . . . . . . . . . . . . . . . . . . . . . . . . . . . . . . . . . . . . . . . . . . . . . . . . . . . . . . . . . . 322
Kansas . . . . . . . . . . . . . . . . . . . . . . . . . . . . . . . . . . . . . . . . . . . . . . . . . . . . . . . . . . . . . . . . . 326
Kentucky . . . . . . . . . . . . . . . . . . . . . . . . . . . . . . . . . . . . . . . . . . . . . . . . . . . . . . . . . . . . . . . 330
Louisiana . . . . . . . . . . . . . . . . . . . . . . . . . . . . . . . . . . . . . . . . . . . . . . . . . . . . . . . . . . . . . . . 334
Maine . . . . . . . . . . . . . . . . . . . . . . . . . . . . . . . . . . . . . . . . . . . . . . . . . . . . . . . . . . . . . . . . . . 338
List of Tables, Figures, and Appendices

United States Cancer Statistics: 2004 Incidence and Mortality
xiixii
Maryland . . . . . . . . . . . . . . . . . . . . . . . . . . . . . . . . . . . . . . . . . . . . . . . . . . . . . . . . . . . . . . . 342
Massachusetts . . . . . . . . . . . . . . . . . . . . . . . . . . . . . . . . . . . . . . . . . . . . . . . . . . . . . . . . . . . . 346
Michigan. . . . . . . . . . . . . . . . . . . . . . . . . . . . . . . . . . . . . . . . . . . . . . . . . . . . . . . . . . . . . . . . 350
Detroit . . . . . . . . . . . . . . . . . . . . . . . . . . . . . . . . . . . . . . . . . . . . . . . . . . . . . . . . . . . . . . . . 354
Minnesota . . . . . . . . . . . . . . . . . . . . . . . . . . . . . . . . . . . . . . . . . . . . . . . . . . . . . . . . . . . . . . . 358
Mississippi . . . . . . . . . . . . . . . . . . . . . . . . . . . . . . . . . . . . . . . . . . . . . . . . . . . . . . . . . . . . . . 362
Missouri . . . . . . . . . . . . . . . . . . . . . . . . . . . . . . . . . . . . . . . . . . . . . . . . . . . . . . . . . . . . . . . . 366
Montana . . . . . . . . . . . . . . . . . . . . . . . . . . . . . . . . . . . . . . . . . . . . . . . . . . . . . . . . . . . . . . . . 370
Nebraska. . . . . . . . . . . . . . . . . . . . . . . . . . . . . . . . . . . . . . . . . . . . . . . . . . . . . . . . . . . . . . . . 374
Nevada . . . . . . . . . . . . . . . . . . . . . . . . . . . . . . . . . . . . . . . . . . . . . . . . . . . . . . . . . . . . . . . . . 378
New Hampshire . . . . . . . . . . . . . . . . . . . . . . . . . . . . . . . . . . . . . . . . . . . . . . . . . . . . . . . . . . 382
New Jersey . . . . . . . . . . . . . . . . . . . . . . . . . . . . . . . . . . . . . . . . . . . . . . . . . . . . . . . . . . . . . . 386
New Mexico . . . . . . . . . . . . . . . . . . . . . . . . . . . . . . . . . . . . . . . . . . . . . . . . . . . . . . . . . . . . . 390
New York . . . . . . . . . . . . . . . . . . . . . . . . . . . . . . . . . . . . . . . . . . . . . . . . . . . . . . . . . . . . . . . 394
North Carolina . . . . . . . . . . . . . . . . . . . . . . . . . . . . . . . . . . . . . . . . . . . . . . . . . . . . . . . . . . . 398
North Dakota . . . . . . . . . . . . . . . . . . . . . . . . . . . . . . . . . . . . . . . . . . . . . . . . . . . . . . . . . . . . 402
Ohio . . . . . . . . . . . . . . . . . . . . . . . . . . . . . . . . . . . . . . . . . . . . . . . . . . . . . . . . . . . . . . . . . . . 406
Oklahoma . . . . . . . . . . . . . . . . . . . . . . . . . . . . . . . . . . . . . . . . . . . . . . . . . . . . . . . . . . . . . . . 410
Oregon . . . . . . . . . . . . . . . . . . . . . . . . . . . . . . . . . . . . . . . . . . . . . . . . . . . . . . . . . . . . . . . . . 414
Pennsylvania. . . . . . . . . . . . . . . . . . . . . . . . . . . . . . . . . . . . . . . . . . . . . . . . . . . . . . . . . . . . . 418
Rhode Island . . . . . . . . . . . . . . . . . . . . . . . . . . . . . . . . . . . . . . . . . . . . . . . . . . . . . . . . . . . . . 422
South Carolina . . . . . . . . . . . . . . . . . . . . . . . . . . . . . . . . . . . . . . . . . . . . . . . . . . . . . . . . . . . 426
South Dakota . . . . . . . . . . . . . . . . . . . . . . . . . . . . . . . . . . . . . . . . . . . . . . . . . . . . . . . . . . . . 430
Tennessee . . . . . . . . . . . . . . . . . . . . . . . . . . . . . . . . . . . . . . . . . . . . . . . . . . . . . . . . . . . . . . . 434
Texas . . . . . . . . . . . . . . . . . . . . . . . . . . . . . . . . . . . . . . . . . . . . . . . . . . . . . . . . . . . . . . . . . . 438
Utah . . . . . . . . . . . . . . . . . . . . . . . . . . . . . . . . . . . . . . . . . . . . . . . . . . . . . . . . . . . . . . . . . . . 442
Vermont . . . . . . . . . . . . . . . . . . . . . . . . . . . . . . . . . . . . . . . . . . . . . . . . . . . . . . . . . . . . . . . . 446
Virginia. . . . . . . . . . . . . . . . . . . . . . . . . . . . . . . . . . . . . . . . . . . . . . . . . . . . . . . . . . . . . . . . . 450
Washington . . . . . . . . . . . . . . . . . . . . . . . . . . . . . . . . . . . . . . . . . . . . . . . . . . . . . . . . . . . . . . 454
Seattle-Puget Sound . . . . . . . . . . . . . . . . . . . . . . . . . . . . . . . . . . . . . . . . . . . . . . . . . . . . . . 458
West Virginia . . . . . . . . . . . . . . . . . . . . . . . . . . . . . . . . . . . . . . . . . . . . . . . . . . . . . . . . . . . . 462
Wisconsin . . . . . . . . . . . . . . . . . . . . . . . . . . . . . . . . . . . . . . . . . . . . . . . . . . . . . . . . . . . . . . . 466
Wyoming . . . . . . . . . . . . . . . . . . . . . . . . . . . . . . . . . . . . . . . . . . . . . . . . . . . . . . . . . . . . . . . 470

xiii
List of Tables, Figures, and Appendices
Appendices
Appendix A National Program of Cancer Registries: Scientific Working Group Members
Appendix B Data quality criteria for cancer incidence and mortality data
Appendix C Primary cancer site, histology, and cause-of-death codes based on International Classification of Diseases: ICD–O–3 (incidence) and ICD–10 (mortality)
Appendix D Invasive cancer incidence counts and cancer death counts by primary site, sex, race, ethnicity, and age (all ages, <1, 1–4, 5–9, 10–14, 15–19, 0–14, and 0–19), United States, 2004
Appendix E Invasive cancer incidence counts and cancer death counts by U.S. Census region and division, state, metropolitan area, sex, and race and ethnicity, United States, 2004
Appendix F Age-adjusted invasive cancer incidence and death rates and 95% confidence intervals for Asians/Pacific Islanders and American Indians/Alaska Natives by state, metropolitan area, primary site, and sex, United States, 2004
Appendix G Population counts by U.S. Census region and division, state, metropolitan area, sex, age, and race and ethnicity, 2004


x�
Executive Summary
The Centers for Disease Control and Prevention (CDC) and the National Cancer Institute (NCI), in collaboration with the North American Association of Central Cancer Registries, Inc. (NAACCR), are pleased to release the sixth annual United States Cancer Statistics (USCS) report. This report provides official federal government cancer statistics for cases diagnosed in 2004 and for cancer deaths that occurred in 2004. Cancer incidence statistics included in this report come from CDC’s National Program of Cancer Registries (NPCR) and NCI’s Surveillance, Epidemiology, and End Results (SEER) Programs. Cancer mortality statistics are from CDC’s National Vital Statistics System (NVSS).
Incidence data from 49 states, 6 metropolitan areas, and the District of Columbia are included in the report. The data obtained from NPCR and SEER registries in these areas cover approximately 98% of the U.S. population. Mortality data from NVSS are presented for all 50 states and the District of Columbia and therefore cover 100% of the U.S. population. Cancer incidence and mortality statistics are reported for 68 selected primary cancer sites and subsites for men of all ages and 72 selected primary cancer sites and subsites for women of all ages. These data are presented in tables and graphs in the following categories: 1) by geography: all U.S. combined, U.S. Census regions and divisions, states, and selected metropolitan areas; and 2) by race and ethnicity: all races combined, whites, blacks, Asians/Pacific Islanders, American Indians/Alaska Natives, and Hispanics/Latinos. Incidence data for American Indians/Alaska Natives are classified according to information on race obtained from medical records and recorded in the registry. To address the racial misclassification that exists in the registries, all NPCR and SEER registries linked their registry records with those of the Indian Health Service (IHS), which provides medical services to approximately 55% of the American Indian/Alaska Native population. American Indian/Alaska Native race is reported for mortality data as recorded on the death certificate.
The section on childhood cancer includes incidence data for more than 13,000 cancer cases and 2,000 cancer deaths among children and adolescents aged 19 years or younger. These data are presented by race, sex, age, and primary site as well as by specific cancer types, classified according to the International Classification of Childhood Cancer, Third Edition (ICCC-3).
This year, incidence data for nonmalignant tumors of the brain and other nervous system from approximately 97% of the U.S. population have been added to the report; these data are categorized by histologic subtype, age, and sex.
United States Cancer Statistics: 2004 Incidence and Mortality
United States Cancer Statistics: 2004 Incidence and Mortality
x�i
A companion USCS Web site is available at http://www.cdc.gov/uscs. The USCS Web site is a comprehensive source of 2004 data and contains: 1) tables of age-adjusted incidence and death rates for all U.S. combined, U.S. Census regions and divisions, states, and selected metropolitan areas by sex and race and ethnicity; 2) figures of the most commonly diagnosed cancers and the leading causes of cancer death by state, sex, and race and ethnicity; 3) tables with information on cancer cases and cancer deaths among children and adolescents aged 19 years or younger; 4) tables of detailed data on malignant and nonmalignant tumors of the brain and other nervous system presented by age, sex, and specific cancer type and subtype; 5) combined data for the years 2002-2004 for all tables and graphs (which results in more stable incidence and death rates); 6) age-adjusted rates (age adjusted to the 2000 U.S. standard population), crude rates, incidence and death counts, and 95% confidence intervals for all rates presented; and 7) tables of age-specific incidence and death rates for 27 cancer sites. The USCS Web site also contains updated information for 1999-2003 diagnoses.
All rates in this report are age-adjusted to the 2000 U.S. standard population. Age adjustment allows researchers to compare data across populations by controlling for the effect of age on populations with different age distributions. In this report, population estimates for 2004 were obtained from the 2000 U.S. Census and slightly modified by SEER for the Native Hawaiian population. These modified population estimates improve the accuracy of the rates for some racial and geographic populations. Because of differences in the population coverage for incidence (approximately 98%) and mortality (100%), readers should be cautious when interpreting comparisons between incidence rates and death rates at the national and regional levels; state comparisons are valid.
In addition, readers should not compare the rates published in this report with cancer rates that were calculated using different methods or standardized to different populations. Incidence rates for all ages are coded according to the third revision of the International Classification of Diseases for Oncology (ICD–O–3). Incidence rates for cancer among children and adolescents (ages 0-19 years) are coded according to the third revision of the ICCC. Readers should be cautious when comparing cases coded according to earlier versions of the ICD–O (cases diagnosed before 2001) and ICCC (cases diagnosed before 2003) with ICD–O–3- or ICCC-3-coded cases, respectively. The USCS Web site contains updated statistics for 1999-2003 diagnoses; all cases on the Web site are coded according to the current ICD–O–3 and ICCC-3 classifications so that readers can accurately compare cancer cases from all diagnosis years (1999-2004) listed on the USCS Web site.

x�ii
Executi�e Summary
Major Findings
Rates are presented in parentheses where appropriate and are per 100,000 persons.
Cancer Among Men*
Most commonly diagnosed cancers among men:
• Prostate cancer (145.3)⌂First among men of all races and Hispanic origin.
• Lung cancer (85.3)⌂Second among white (84.4), black (104.5), Asian/Pacific
Islander (49.7), and American Indian/Alaska Native (51.1) men.
⌂Third among Hispanic men (48.5).• Colorectal cancer (58.2)
⌂Second among Hispanic men (50.3).⌂Third among white (57.0), black (67.6), Asian/Pacific
Islander (42.0), and American Indian/Alaska Native (32.6) men.
Leading causes of cancer death among men:
• Lung cancer (70.3)⌂First among men of all races and Hispanic origin.
• Prostate cancer (25.4)⌂Second among white (23.4), black (56.1), American Indian/
Alaska Native (16.5), and Hispanic (19.3) men.• Colorectal cancer (21.6)
⌂Third among men of all races and Hispanic origin.• Liver cancer
⌂Second among Asian/Pacific Islander men (15.1).
Cancer Among Women*
Most commonly diagnosed cancers among women:
• Breast cancer (117.7) ⌂First among women of all races and Hispanic origin.
• Lung cancer (54.2)⌂Second among white (55.5) and American Indian/Alaska
Native (35.3) women.⌂Third among black (50.4), Asian/Pacific Islander (26.9),
and Hispanic (26.7) women.• Colorectal cancer (42.7)
⌂Second among black (50.6), Asian/Pacific Islander (32.1), and Hispanic (34.2) women.
* The combined rate for all races is presented when the ranking of cancer sites did not differ across race and ethnicity; race- or ethnicity-specific rates are presented when ranking differed by race or ethnicity.

United States Cancer Statistics: 2004 Incidence and Mortality
x�iii
⌂Third among white (41.6) and American Indian/Alaska Native women (28.7).
Leading causes of cancer death among women:
• Lung cancer (40.9)⌂First among white (41.9), black (40.0), Asian/Pacific
Islander (18.1), and American Indian/Alaska Native (30.2) women.
⌂Second among Hispanic women (14.4).• Breast cancer (24.4)
⌂First among Hispanic women (15.7).⌂Second among white (23.8), black (32.3), Asian/Pacific
Islander (12.6), and American Indian/Alaska Native (15.0) women.
• Colorectal cancer (15.2)⌂Third among women of all races and Hispanic origin.
Cancer Among Children
The most commonly diagnosed cancers and leading causes of cancer death in children aged 0-19 years:
• Leukemias ⌂Highest incidence rate (8.7) found among children aged 1-4
years. ⌂Highest death rate (1.0) found among children aged 15-19
years. • Brain and other nervous system cancer
⌂Highest incidence rate (4.1) found among children aged 1-4 years.
⌂Highest death rate (0.9) found among children aged 5-9 years.
Benign and Borderline (Nonmalignant) Brain and Other Nervous System Tumors†
• The incidence rate among boys aged 0-19 years is 1.3; the incidence rate among girls aged 0-19 years is 1.6.
• The incidence rate among men aged 20 years and older is 10.9; the incidence rate among women aged 20 years and older is 16.5.
• Among men aged 20 years or older, the most common nonmalignant brain tumor is meningioma (4.5), followed by tumors of the pituitary (2.7).
• Among women aged 20 years and older, the most common nonmalignant brain tumor is meningioma (10.3), followed by tumors of the pituitary (2.7).
† The data included cover approximately 97% of the U.S. population.

xix
Executi�e Summary
Racial or Ethnic Variations‡
All cancers combined, men: • Incidence rates are highest among black (607.3), followed by white
(527.2), Hispanic (415.5), Asian/Pacific Islander (325.8), and American Indian/Alaska Native (288.6) men.
• Death rates are highest among black (303.5), followed by white (224.8), Hispanic (152.8), American Indian/Alaska Native (151.2), and Asian/Pacific Islander (137.0) men.
All cancers combined, women:• Incidence rates are highest among white (405.9), followed by
black (379.7), Hispanic (318.6), Asian/Pacific Islander (267.4), and American Indian/Alaska Native (242.2) women.
• Death rates are highest among black (182.8), followed by white (156.4), American Indian/Alaska Native (110.7), Hispanic (101.9), and Asian/Pacific Islander (92.3) women.
Among four races and Hispanic origin: • American Indian/Alaska Native men have the lowest incidence
rates of cancer; however, Asian/Pacific Islander men have the lowest death rates from cancer.
• White women have the highest incidence rates of cancer; however, black women have the highest death rates from cancer.
• American Indian/Alaska Native women have the lowest incidence rates of cancer and the third-highest cancer death rates.
Geographic Variations§
Breast cancer:• The incidence rate for the United States is 117.7.
⌂ Incidence rates are highest in the Northeast U.S. Census region (125.9), followed by the Midwest (117.7), West (117.4), and South (113.2).
⌂Registry incidence rates range from 102.9 to 135.8.• The death rate for the United States is 24.4.
⌂Death rates are highest in the Northeast U.S. Census region (25.1), followed by the Midwest and South (both 24.6) and the West (22.9).
⌂State death rates range from 15.6 to 27.6.Prostate cancer:
• The incidence rate for the United States is 145.3.⌂ Incidence rates are highest in the Northeast U.S. Census
region (151.6), followed by the West (148.9), Midwest (147.9), and South (138.1).
⌂Registry incidence rates range from 109.7 to 196.6.• The death rate for the United States is 25.4.
⌂Death rates are highest in the South U.S. Census region (26.4), followed by the Midwest (26.0), Northeast (24.4), and West (24.3).
‡ Race- or ethnicity-specific rates are presented for all cancer sites combined.§ Geographic variations are presented for the four most common cancers.

United States Cancer Statistics: 2004 Incidence and Mortality
xx
⌂State death rates range from 18.9 to 44.8.Lung cancer:
Men• The incidence rate for the United States is 85.3.
⌂ Incidence rates are highest in the South U.S. Census region (97.9), followed by the Midwest (88.6), Northeast (81.0), and West (66.0).
⌂Registry incidence rates range from 37.5 to 133.2.• The death rate for the United States is 70.3.
⌂Death rates are highest in the South U.S. Census region (80.1), followed by the Midwest (75.2), Northeast (64.3), and West (54.2).
⌂State death rates range from 35.6 to 106.0.Women• The incidence rate for the United States is 54.2.
⌂ Incidence rates are highest in the South U.S. Census region (56.4), followed by the Midwest (55.7), Northeast (55.3), and West (48.1).
⌂Registry incidence rates range from 20.6 to 75.5. • The death rate for the United States is 40.9.
⌂Death rates are highest in the South U.S. Census region (42.8), followed by the Midwest (42.7), Northeast (39.9), and West (36.5).
⌂State death rates range from 18.5 to 57.0.Colorectal cancer:
Men• The incidence rate for the United States is 58.2.
⌂ Incidence rates are highest in the Northeast U.S. Census region (61.7), followed by the Midwest (60.8), South (58.9), and West (51.0).
⌂Registry incidence rates range from 45.7 to 69.4. • The death rate for the United States is 21.6.
⌂Death rates are highest in the Midwest U.S. Census region (22.7), followed by the South (22.1), Northeast (21.9), and West (19.2).
⌂State death rates range from 15.0 to 27.3.Women• The incidence rate for the United States is 42.7.
⌂ Incidence rates are highest in the Northeast U.S. Census region (46.2), followed by the Midwest (44.0), South (42.5), and West (38.2).
⌂Registry incidence rates range from 29.0 to 50.6. • The death rate for the United States is 15.2.
⌂Death rates are highest in the Northeast and Midwest U.S. Census regions (both 15.8), followed by the South (15.3) and West (13.5).
⌂State death rates range from 9.4 to 18.5.

Two points should be kept in mind when interpreting the data in this report. First, race and ethnicity specific data should be interpreted with caution. Recent studies show that overall agreement of the race data in cancer registries is excellent compared with self-reported race data for most races, with the exception of American Indian/Alaska Natives, who were substantially under-classified in registry data. Hispanic ethnicity data were slightly under-classified in the registries compared with self-reported data. Therefore, incidence and mortality data published in this report may be underestimated for some populations. Also, specific subpopulations, which are not presented in this report due to small numbers and possible misclassification, may have higher cancer incidence or death rates than the U.S. population. For example, overall cancer mortality among American Indians/Alaska Natives residing in Alaska and the Northern Plains regions is higher compared to the U.S. population; the American Indian/Alaska Native population as a whole has lower cancer mortality than the U.S. general population.
Second, geographic variations may be influenced by several factors, such as the following: 1) areas in which a high percentage of the population is screened for cancer will have more cancer cases diagnosed than areas in which a low percentage of the population is screened; 2) rates for certain cancers are different for different racial and ethnic populations (e.g., black men have higher rates of prostate cancer rates than other racial and ethnic groups), and thus when comparing cancer rates across geographic areas the racial and ethnic makeup of that area should be considered; 3) the population burden of cancer in a geographic area is determined by the number of cases diagnosed and the number of cancer deaths in the population, not by the age-adjusted rate; therefore, a relatively high or low age-adjusted rate may not be a reflection of the true cancer burden within that geographic area. Crude rates, which are a reflection of the cancer burden within a population, are available on the USCS Web site.
United States Cancer Statistics: 2004 Incidence and Mortality provides a basis for states and researchers to describe the variability in cancer incidence and death rates across different populations and to identify certain populations for evidence-based measures in cancer control. Work continues to ensure the receipt of high-quality data from all NPCR and SEER registries. Since the publication of our first report covering diagnosis year 1999, additional registries have contributed high-quality data every year, resulting in increased coverage of the U.S. population with every new report. We expect that future reports will include high-quality data from all state registries, thus allowing a more comprehensive description of the cancer burden across racial, ethnic, and geographic populations in the United States.
Executi�e Summary
xxi

United States Cancer Statistics: 2004 Incidence and Mortality
xxii
Table 1.1.1.1M
Format for Numbering the Tables and Figures
The tables and figures in United States Cancer Statistics: 2004 Incidence and Mortality have a unique numbering system, and the diagrams below illustrate what each number or letter represents. There are three main sections of this report. The diagram specific to each section is repeated on the dividers.
Figure 3.1.M1
Consecutive numbering of states in alphabetical order beginning with the United States
M = malesF = females
1 = incidence rate2 = death rate
3 = figures that display data for statesFigures 1 and 2 are maps of the United States.
Consecutive numbering based on table seriesIn the Table 1 series (U.S. rates), the second digit indicates all cancer sites for all ages.
In the Table 2 series (e.g., regional, state, metropoli-tan area), the second digit indicates consecutive numbering of cancer sites in alphabetical order beginning with all cancer sites.
Specific types or categorization of rates
M = malesF = femalesIf no M or F, then table presents both sexes or cancer that occurs only or primarily in either males or females (e.g., prostate for males, ovary for females).
1 = incidence rate2 = death rate
1 = U.S. rates2 = geographic area ratesOrganized by cancer site
Tables
Figures
xxiii


Technical Notes


Technical Notes
�
Background
Cancer is the second-leading cause of death among Americans. One of every four deaths in the United States is due to cancer.1,2 The American Cancer Society estimates that in 2007, about 1,444,920 Americans will receive a new diagnosis of invasive cancer, and 559,650 Americans will die of this disease.1 These estimates do not include in situ cancers or the more than 1 million cases of basal and squamous cell skin cancers expected to be diagnosed this year. The National Cancer Institute (NCI) recently estimated that on January 1, 2004, 10.8 million Americans were alive with a history of invasive cancer.3
According to the 2007 Annual Report to the Nation on the Status of Cancer, age-adjusted incidence rates for all cancers combined were stable from 1995 through 2004 in men.4 Rates stabilized among women from 1999 through 2004, following a period of increase from 1987 through 1999. U.S. death rates for all cancer sites combined decreased beginning in 1993, with death rates decreasing 2.1% per year from 2002 to 2004.4 However, the number of Americans diagnosed with cancer each year is expected to double in the next 50 years, from 1.3 million to 2.6 million. The anticipated growth and aging of the U.S. population are possible factors that will increase the number of people who are diagnosed with and treated for cancer.5
For 2005, NCI estimated that direct medical costs were about $74.0 billion for cancer treatment.6 The National Institutes of Health estimated that for 2007 the overall annual cost of cancer would be about $219.2 billion,7 broken down as follows:
• Direct medical costs, including health expenditures: $89.0 billion.
• Indirect costs associated with lost productivity due to illness: $18.2 billion.
• Indirect costs associated with lost productivity due to premature death: $112.0 billion.
These costs are likely to increase because of the anticipated growth and aging of the U.S. population.There are several effective primary and secondary prevention measures that could substantially reduce the number of new cancer cases and prevent many cancer-related deaths. To reduce the nation’s cancer burden, we must reduce behavioral and environmental
factors that increase cancer risk, and we must ensure that high-quality screening services and evidence-based treatments are available and accessible, particularly to medically underserved populations.8,9
Cancer registries collect data about the occurrence of cancer (incidence), the types of cancer (morphology), the site in the body where the cancer first occurred (primary site), the extent of disease at the time of diagnosis (stage), the planned first course of treatment, and the outcome of treatment and clinical management (survival and vital status).10,11 Cancer data are reported to metropolitan area, regional, and statewide cancer registries from a variety of medical facilities, including hospitals, physicians’ offices, radiation facilities, freestanding surgical centers, and pathology laboratories. Cancer death data are recorded on death certificates that are sent to state vital statistics offices. Death certificates contain information regarding primary cancer site and morphology.
Information derived from population-based central cancer registries and from death certificates is critical for directing effective geographic-area or population-specific cancer prevention and control programs that focus on preventing behaviors (e.g., smoking) that put people at increased risk for cancer and on reducing environmental risk factors (e.g., occupational exposure to known carcinogens). This information is also essential for deciding which geographic areas should have cancer-screening programs and for making long-term plans for adequate diagnostic and treatment services. Pooled data at the national, regional, and state levels will help federal and state public health officials establish, prioritize, and monitor national initiatives in public health surveillance and track progress toward the national goals and objectives set forth in Healthy People 2010,12 which contains a set of health objectives for the nation for the first decade of the 21st century. For more information on Healthy People 2010, visit http://www.healthypeople.gov/document.

United States Cancer Statistics: 2004 Incidence and Mortality
�
Federal Programs
Surveillance, Epidemiology, and End Results (SEER) Program
In 1971, Congress passed the National Cancer Act, which mandated the collection, analysis, and dissemination of data useful for the prevention, diagnosis, and treatment of cancer.13 This mandate led to the establishment of the Surveillance, Epidemiology, and End Results (SEER) Program.14 For more than 30 years, the NCI’s SEER Program has provided statistics on cancer incidence, survival, and mortality in the United States; monitored cancer incidence trends in geographic and demographic population groups; provided information on trends in the extent of disease at diagnosis, therapy, and patient survival; promoted studies measuring progress in cancer control and etiology; provided specialty training in epidemiology, biostatistics, surveillance research, and tumor registry methodology, operations, and management; and developed new statistical methods, models, and software for the analysis and presentation of national and small-area statistics.
The SEER Program currently collects and publishes data on cancer incidence and survival from 14 population-based cancer registries and 3 supplemental registries covering approximately 26% of the U.S. population (Figure 1). SEER registries provide complete coverage for metropolitan regions and special populations whose data are reported to their respective NPCR state registries for publication in the report: the Atlanta and Rural Georgia registry covers 37% of Georgia’s population; Metropolitan Detroit, 41%; Seattle-Puget Sound, 69%; Greater Bay Area (San Francisco-Oakland and San Jose-Monterey), 19%; Los Angeles County, 28%; remainder of California, 53%; Alaska Natives, 16%; and Arizona Indians, 5%. In addition, since 2001, NCI funding for Kentucky, Louisiana, New Jersey, and the remainder of California has provided resources for these registries to meet the requirements of the SEER Program regarding completeness of case ascertainment, follow-up, timeliness, and data quality metrics. Information on more than 3 million in situ and invasive cancer cases is included in the SEER database, and approximately 170,000 new cases are added each year within SEER coverage areas. (See http://seer.cancer.gov/registries for the first diagnosis
year for which data were reported to NCI for each SEER area.) The mortality data reported by SEER are provided by the Centers for Disease Control and Prevention’s (CDC’s) National Center for Health Statistics (NCHS). A limited-use data set (formerly called the public use data file) is issued each year by the SEER Program for additional analyses. For more information on the SEER Program, visit http://seer.cancer.gov.
National Program of Cancer Registries (NPCR)
Recognizing the need for more complete local, state, regional, and national data on cancer incidence, in 1992 Congress established the National Program of Cancer Registries (NPCR) by enacting the Cancer Registries Amendment Act, Public Law 102-515; the program was reauthorized in 1998.15 Congress mandated the CDC to provide funds to state and territorial health departments (or their authorized agencies) at a ratio of 3:1 to match state support for the central cancer registry. In 2004, CDC funded a total of 49 cancer registries: 45 states, the District of Columbia, and 3 territories (Figure 1).
NPCR registries cover 96% of the U.S. population. NPCR has the state and national capacity to monitor the cancer burden; identify variation in cancer incidence for racial and ethnic populations and for regions within a state, between states, and between regions; provide data for research; provide guidance for the allocation of health resources; respond to public concerns and inquiries about cancer; improve planning for future health care needs; and evaluate activities in cancer prevention and control.16
In January 2001, NPCR registries began annually reporting their incidence data to CDC; the registries report data to CDC from the first diagnosis year for which they collected data with the assistance of NPCR funds (http://apps.nccd.cdc.gov/cancercontacts/npcr/contacts.asp). Data from the special population cancer registries or the SEER metropolitan-area cancer registries operating in Alaska, Arizona, California, Georgia, Michigan, and Washington are reported to their respective NPCR state cancer registries for inclusion in those states’ incidence data and are transmitted to CDC as part of the state’s annual data submission. In January 2007, CDC received information on more than 11 million

Technical Notes
3
invasive cancer cases diagnosed during 1995-2004, and more than 1 million new invasive cancer cases are added each year. In addition to the United States Cancer Statistics (USCS) series, NPCR disseminates (1) a public-use data set of pre-calculated cancer incidence rates on CDC WONDER (http://wonder.cdc.gov), (2) fact sheets on the states’ cancer burden intended for lay audiences, (3) a data set for selected U.S. counties showing incidence rates and counts for major cancer sites and (4) an expanded USCS data set of age-adjusted rates, crude rates, and case counts.
For more information on NPCR, visit http://www.cdc.gov/cancer/npcr.
National Vital Statistics System (NVSS)
The nation’s vital statistics are available from the National Vital Statistics System (NVSS), which is maintained by NCHS. These vital statistics are provided through state-operated registration systems and are based on vital records filed in state vital statistics offices. The recording of vital events is the responsibility of the individual states and independent registration areas (e.g., District of Columbia, New York City, territories) in which the event occurs. Legal responsibility for the registration of vital events rests with the individual states. Through its Vital Statistics Cooperative Program, NCHS cooperates with state vital statistics offices to develop and recommend standard forms for data collection and model procedures to ensure uniform registration of the events monitored by the NVSS. Detailed annual data on births, deaths (including infant deaths), and fetal deaths are available for the United States and for states, counties, and other local areas. Data variables include cause of death, age, race, Hispanic origin, sex, marital status, place of birth, residence of decedent, education level, and place of death. Monthly provisional data on vital statistics are available for the United States and each state. A public use data set is issued each year by NCHS for additional analyses.
For more information on NCHS and its NVSS, visit http://www.cdc.gov/nchs.
Collaborating Partner
North American Association of Central Cancer Registries, Inc. (NAACCR)
Both federally funded registry programs (i.e., the SEER Program and NPCR) work closely with the North American Association of Central Cancer Registries, Inc. (NAACCR) to promote surveillance of cancer incidence in the United States and Canada. Established in 1987, NAACCR is an organization of population-based cancer registries, governmental agencies, professional associations, and private groups in North America that are interested in cancer surveillance and are dedicated to NAACCR’s mission. This mission is to reduce the burden of cancer in North America by developing and promoting standards for cancer registration; providing education and training; certifying population-based cancer registries; evaluating and publishing data; and promoting the use of cancer surveillance data and systems for cancer control, epidemiologic research, public health programs, and patient care. All state and metropolitan area registries participating in NPCR and SEER, as well as all provincial and territorial registries in Canada, are members of NAACCR. A public online query system, CINA+ (Cancer in North America Plus) Online, is updated annually with the most recent 5 years of incidence data (see http://www.naaccr.org/cinap). Starting with the 1995 diagnosis year, the incidence data file is updated annually for qualified researchers.
In 1992, NAACCR began annual reviews of member registries’ data for completeness, accuracy, and timeliness. In 1997, this process was formalized into a certification program in which registries report their data in December and NAACCR evaluates the data using standard, objective measures. Registries that meet high standards for data quality are recognized annually through certification.17-19
In 1997, when NAACCR evaluated incidence data for 1995, 9 NPCR registries and all 10 SEER registries were certified. Nine years later, in 2006, when NAACCR evaluated the incidence data for 2004, 35 NPCR registries, 4 NPCR/SEER registries, and 9 SEER registries were certified. (Data from San Francisco-Oakland and San Jose-Monterey are combined and evaluated as the Greater Bay Area.)
United States Cancer Statistics: 2004 Incidence and Mortality
�
For more information on NAACCR, visit http://www.naaccr.org.
Data Sources
Incidence Data
Data from the registries participating in NPCR were reported to CDC as of January 31, 2007. Data from registries in the SEER Program were reported to NCI as of November 1, 2006, and made available through the SEER Program limited-use data file released in April 2007 (http://www.seer.cancer.gov/publicdata). For this report, data from California, Kentucky, Louisiana, and New Jersey (states that are supported by both NPCR and SEER) are presented as reported to CDC as of January 31, 2007.
The primary source of data on cancer incidence is medical records. Staff at health care facilities abstract data from patients’ medical records, enter it into the facility’s own cancer registry if it has one, and then send the data to the regional or state registry. Both NPCR and SEER registries collect data using uniform data items and codes as documented by NAACCR. This uniformity ensures that data items collected by the two federal programs are comparable.11,20 Information on primary site and histology was coded according to the International Classification of Diseases for Oncology, Third Edition (ICD–O–3)21
and categorized according to the revised SEER recodes dated January 27, 2003, which define standard groupings of primary cancer sites (Appendix C, Table C.1).3
NPCR and SEER cancer registries consider as reportable all incident cases with a behavior code of 2 (in situ, noninvasive) or 3 (invasive, primary site only) in the ICD–O–3 with the exception of in situ cancer of the cervix. Basal and squamous cell carcinomas of the skin are also excluded, with the exception of those on the skin of the genital organs.21 Several cancers are coded as malignant in ICD–O–3 (beginning with 2001 diagnoses) that were not previously coded as malignant in ICD–O–2.21
Myelodysplastic syndrome (MDS) including refractory anemias (histology codes 9980, 9982-9984, 9989), is considered malignant cancer in ICD–O–3. Chronic myeloproliferative disease (CMPD) including
polycythemia vera and thrombocythemias (histology codes 9950, 9960-9962), is also considered malignant cancer in ICD–O–3.21 MDS and CMPD arise in the bone marrow. MDS is characterized by abnormal growth of blood cells in the bone marrow and is a clonal disease, meaning a large population of exactly alike abnormal cells arise from a single abnormal cell.22 CMPD is the overproduction of blood cells by the bone marrow: polycythemia vera is the production of too many red blood cells and thrombocythemia is the production of too many platelets.22 CMPD sometimes becomes acute leukemia, in which too many abnormal white blood cells are made.22 In this report, these cancers are included in the “Miscellaneous” and “All Sites” categories.
Papillary ependymomas (9393) and papillary meningiomas (9538)—cancers that occur in the central nervous system22—are also classified as malignant according to ICD–O–3. These cancers are included in the “Brain and Other Nervous System” and “All Sites” categories. Although these cancers were first considered malignant beginning with 2001 diagnoses, USCS reports published in 200423 and 200524 did not include them so as to be consistent with other cancer statistics reports and publications.3,25
Some endometrial tumors (8931) are also classified as malignant in ICD–O–3. These cancers were reported in USCS reports published in 200423 and 200524 and continue to be reported in the “Corpus and Uterus, NOS” and “All Sites” categories.
For consistency with USCS reports published in 200423 and 200524 and with other reports that do not include these cancers,3,25 an additional row of data is presented in Tables 1.1.1.1M and 1.1.1.1F and Tables 2.1.1.1.M and 2.1.1.1F with the headings “All Sites (excl. newly classified as malignant)” and “United States (excl. newly classified as malignant),” respectively. These rows exclude all the histology codes newly malignant described above and listed as follows: 8931, 9393, 9538, 9950, 9960–9962, 9980, 9982–9984, 9989.21 Footnotes describing these rows are provided in these tables.
Additional changes in ICD–O–3 apply to ovarian cancer: low malignant potential tumors (8442, 8451, 8462, 8472, 8473) of the ovary are no longer coded as malignant. Therefore, these cancers are not accounted for in the calculations of the incidence rate for ovarian

Technical Notes
�
cancer included in tables and figures. A footnote is provided where appropriate to remind readers of this exclusion. Pilocytic astrocytomas (9421) are also not coded as malignant in ICD–O–3, but these cancers are included in this report.
This report also contains data for two rare cancers, Kaposi sarcoma (KS) and mesothelioma; KS is a cancer of connective tissue such as cartilage, bone, fat, muscle, and blood vessels. Because the vast majority of KS cases have developed in association with human immunodeficiency virus (HIV) infection and acquired immunodeficiency syndrome (AIDS), HIV/AIDS is listed as the underlying cause of death. Therefore, KS death rates were not included in this report. Mesothelioma is a cancer that generally occurs in the chest, abdominal region, and areas surrounding the heart and is typically associated with exposure to asbestos. Because KS and mesothelioma are considered separate cancers for this report, they were removed from counts of other primary cancer sites.
Incidence data on childhood cancer are published in two formats. The first is according to the SEER modification of the third edition of the International Classification of Childhood Cancer (ICCC-3) (Appendix C, Table C.2). The ICCC-3, which is based on ICD–O–3, was published in 2006 by the International Agency for Research on Cancer (IARC).26 The ICCC-3 presents childhood cancers in 12 groups classified primarily by morphology. The SEER modification, which affects the classification of nervous system and bone tumors (http://seer.cancer.gov/iccc), was chosen for compatibility with other published data on rates of childhood cancer in the United States.
The second format is according to the SEER site recode, which is based primarily on cancer site; the incidence data are presented in this format to make them comparable with other published mortality data. This format allows the incidence data for childhood cancers to be categorized in the same groups as adult cancers. Although these groupings are not as appropriate for children as they are for adults, they are necessary to allow comparisons between childhood incidence and childhood mortality.
In situ bladder cancers were recoded to invasive bladder cancers because the information needed to
distinguish between in situ and invasive bladder cancers is not always available or reliable. Case counts and rates for invasive cancers are included in this report. This report also includes counts and rates for in situ breast cancer cases among women; these are reported separately and are not included in counts or rates for the “All Sites” category. Case counts and rates for leukemias were calculated for acute and chronic lymphocytic leukemia, acute and chronic myeloid leukemia, and other leukemias, which include other myeloid/monocytic leukemias. Nonreportable cancers and cancers in patients of unknown sex or age were omitted from all calculations, but cases in patients of unknown race were included in the “All Races” category. Counts of cases used in this report are listed in Appendices D and E.
For the first time, this year’s report features incidence data on nonmalignant primary brain and other nervous system tumors. Cancer registries began collecting information on nonmalignant brain and other nervous system tumors beginning with 2004 diagnoses. Collection of these tumors is in accordance with Public Law 107–260, the Benign Brain Tumor Cancer Registries Amendment Act, which mandates that NPCR registries collect data on all brain and other nervous system tumors with a behavior code of 0 (benign) and those with a behavior code of 1 (borderline), in addition to in situ and malignant.27 SEER registries voluntarily agreed to incorporate registration of these tumors in their standard practices.27 Tables 1.3.1.1M and 1.3.1.1F contain a histologic listing of brain and other nervous system tumors by age and behavior (benign/borderline [nonmalignant] and malignant). The histologic listing is a slight modification of the 2004 revision of the Central Brain Tumor Registry of the United States Tumor Histology Groupings.28 Appendix C, Table C.3 lists the histology codes used in this table. Data for nonmalignant brain and other nervous system tumors were available from all registries contributing to this report with the exception of South Carolina. Therefore, the data in Tables 1.3.1.1M and 1.3.1.1F represent approximately 97% of the U.S. population. Tables 1.3.1.1M and 1.3.1.1F are the exclusive source of information on nonmalignant brain and other nervous system tumors.

United States Cancer Statistics: 2004 Incidence and Mortality
�
Mortality Data
Cancer mortality statistics in this report are based on information from all death certificates filed in the 50 states and the District of Columbia and processed by NVSS at NCHS for deaths that occurred in 2004 and were received as of March 31, 2006. The U.S. Standard Certificate of Death, which is used as a model by the states, was revised in 2003.29 This report includes data for 10 states (California, Idaho, Michigan, Montana, New Jersey, New York, Oklahoma, South Dakota, Washington, and Wyoming) that used the 2003 revision of the U.S. Standard Certificate of Death in 2004 for the entire year, 2 states (New Hampshire and Connecticut) that implemented the 2003 revision for part of 2004, and for the remaining 38 states and the District of Columbia, which collected and reported death data in 2004 based on the 1989 revision of the U.S. Standard Certificate of Death. 29-32
The cancer mortality data were compiled in accordance with World Health Organization (WHO) regulations, which specify that member nations classify and code causes of death in accordance with the current revision of the International Classification of Diseases (ICD). Effective with deaths that occurred in 1999, the United States began using the Tenth Revision of this classification (ICD–10).33
Rules for coding a cause(s) of death may sometimes require modification when evidence suggests that such modifications will improve the quality of cause-of-death data. Before 1999, such modifications were made only when a new revision of the ICD was implemented. A process for updating the ICD that allows for mid-revision changes was introduced with ICD–10. Minor changes may be implemented every year, while major changes may be implemented every 3 years (e.g., 2003 data year). Updates to the ICD for 2004 do not have a significant impact on the data presented in this report.
The ICD not only details disease classification but also provides definitions, tabulation lists, the format of the death certificate, and the rules for coding cause of death. Cause-of-death data presented in this report were coded by procedures outlined in annual issues of the NCHS Instruction Manuals.34,35
Tabulations of cause-of-death statistics are based
solely on the underlying cause of death, which is defined by WHO as “the disease or injury that initiated the train of events leading directly to death, or the circumstances of the accident or violence that produced the fatal injury.”33 The underlying cause of death is selected from the conditions entered by the physician in the cause-of-death section of the death certificate. Generally, more medical information is reported on death certificates than is directly reflected in the underlying cause of death. This information is captured in NCHS multiple cause-of-death statistics.36-38
Since 1968, NCHS has computerized the coding of the underlying cause of death in accordance with WHO rules. In this system, called “Automated Classification of Medical Entities” (ACME),39 multiple cause-of-death codes serve as inputs to the computer software that selects the underlying cause of death. In addition, NCHS has developed two computer systems as inputs to ACME. Beginning with 1990 data, the Mortality Medical Indexing, Classification, and Retrieval (MICAR) system40,41 has been applied to automate coding of multiple causes of death. Then, beginning with data year 1993, SuperMICAR, an enhancement of the MICAR system, was applied to allow for literal entry of the multiple cause-of-death text as reported by medical certifiers in the states. Records that cannot be automatically processed by MICAR or SuperMICAR are manually coded for multiple causes and then further processed through ACME. For 2004 mortality statistics, all of the nation’s death records were coded for multiple causes using SuperMICAR.
For consistency with the data on cancer incidence, the cancer sites in mortality data were grouped according to the revised SEER recodes dated January 27, 2003. Because NCHS uses different groupings for some sites, the death rates in this report may differ slightly from those published by NCHS. In addition, under the ICD, there are differences in mortality and incidence coding. For example, there are several codes for mesothelioma in ICD–10 (depending on the primary site). However in ICD–O–3, one code captures all the primary sites that mesothelioma affects. Appendix C, Table C.4 lists SEER recodes for cancer mortality.
All states and the District of Columbia submitted part or all of their 2004 mortality data in electronic data files to NCHS. All states provided precoded cause-of-death data to NCHS except Illinois and West
Technical Notes
�
Virginia.42 For 2004, all states submitted precoded demographic data (e.g., sex and race of the deceased) for all deaths. Mortality data for the entire United States refer to deaths that occurred within the United States; data for geographic areas are by the decedent’s place of residence. Deaths among overseas Armed Forces personnel are not included.
One index of the quality of reporting causes of death is the proportion of death certificates coded to ICD–10 codes R00–R99 (i.e., symptoms, signs, and abnormal clinical and laboratory findings not elsewhere classified). Although deaths occur for which the underlying causes are impossible to determine, the proportion classified as R00–R99 indicates the care and consideration given to the cause-of-death statement by the medical certifier. This proportion also may be used as a rough measure of the specificity of the medical diagnoses made by the certifier in various areas. In 2004, the percentage of all reported deaths in the United States assigned to symptoms, signs, and abnormal clinical and laboratory findings not elsewhere classified was 1.26%, differing little from 2002 and 2003 (1.23% and 1.28%, respectively) but lower than in 2000 and 2001 (1.33% and 1.34%, respectively).42 In general, from 1990 through 1999 the percentage of deaths from this cause for all ages combined was fairly stable (1.08%–1.18%). In addition, causes of death are more likely to be misclassified for populations other than white as symptoms, signs, and abnormal clinical and laboratory findings not elsewhere classified, and this misclassification may affect comparisons of cause-specific death data.43
Population Denominator Data
The population estimates for the denominators of incidence and death rates presented in this report are race-specific (all races, whites, blacks, Asians/Pacific Islanders, and American Indians/Alaska Natives), Hispanic-specific, and sex-specific county population estimates aggregated to the state or metropolitan-area level. The county population estimates that are incorporated into NCI’s SEER*Stat software (http://www.seer.cancer.gov/seerstat) to calculate cancer incidence and death rates are updated annually and are available at http://www.seer.cancer.gov/popdata. The SEER*Stat population estimates are a slight modification of the annual time series of July 1 county population estimates (by age, sex, race, and Hispanic
origin) produced by the Population Estimates Program of the U.S. Bureau of the Census (Census Bureau) with support from NCI through an interagency agreement. The Census Bureau’s population estimates and documentation of the procedures used to develop them are available at http://www.census.gov/popest/counties. The estimates used in this report are postcensal (estimates for 2004 based on the 2000 census) and include bridged single-race estimates derived from the multiple-race categories through collaboration between the Census Bureau and CDC’s NCHS. For more information on the 2000 bridged population estimates, see http://www.cdc.gov/nchs/about/major/dvs/popbridge/popbridge.htm.
Documentation regarding modifications made by NCI to Census Bureau estimates is available at http://www.seer.cancer.gov/popdata. Briefly, the modification only affects population estimates for the state of Hawaii. Based on concerns that the Native Hawaiian population has been vastly undercounted in previous censuses, the Epidemiology Program of the Hawaii Cancer Research Center has recommended an adjustment to the populations for its state. The “Hawaii-adjustment” to the Census Bureau’s estimates has the net result of reducing the estimated white population and increasing the estimated Asian and Pacific Islander population for the state. The estimates for the total population, black population, and American Indian and Alaska Native populations in Hawaii are not modified.
United States Cancer Statistics Publication Criteria
Cancer incidence data included in this report are from statewide or metropolitan area cancer registries that have high-quality cancer incidence data for 2004 as demonstrated by meeting the following criteria on data quality for all cancer sites combined:
• Case ascertainment is 90% or more complete. The registry data include at least 90% of the expected, unduplicated cases, where the expected cases are estimated by using methods developed by NAACCR.18,19,25,44
Because some cancer patients receive diagnostic or treatment services at more than one reporting facility, cancer registries perform a procedure known as

United States Cancer Statistics: 2004 Incidence and Mortality
�
“unduplication” to ensure that each cancer case is counted only once.45
• No more than 5% of cases are ascertained solely on the basis of a death certificate. The proportion of cases ascertained solely on the basis of a death certificate, with no other information on the case available after the registry has completed a routine procedure known as “death clearance and followback,”45-47 is another measure of the completeness of case ascertainment.
• No more than 3% of cases are missing information on sex.
• No more than 3% of cases are missing information on age.
• No more than 5% of cases are missing information on race.
• At least 97% of the registry’s records passed a set of single-field and interfield computerized edits. Computerized edits are computer programs that test the validity and logic of data components. For example, if (a) a patient received a diagnosis of cancer in 1999, (b) the patient’s age was reported as 80 years, and (c) the patient’s year of birth was reported as 1942, a computerized edit could, without human intervention, identify these components as incompatible. The computerized edits applied to the data in this report were designed by the SEER Program for use by SEER registries. During the 1990s, these edits were expanded and incorporated into NAACCR standards (http://www.naaccr.org) and into the EDITS software designed and maintained by CDC (http://www.cdc.gov/cancer/npcr/tools/edits/).
Complete state- and metropolitan-area-specific measures for the data quality criteria are available (Appendix B, Table B.1). Registry data that were not included in this report are shaded.
Populations Covered by This Report
Incidence data on more than 1.3 million cases of invasive cancer (including approximately 13,000 cases among children younger than 20 years)
diagnosed during 2004 and reported by 49 state cancer registries (40 NPCR, 4 NPCR/SEER, and 5 SEER), the District of Columbia (NPCR), and 6 SEER metropolitan areas (Atlanta, Detroit, Los Angeles, San Francisco-Oakland, San Jose-Monterey, and Seattle-Puget Sound) are included in this report. In total, the NPCR and SEER cancer registries whose data are included in this report cover approximately 98% of the U.S. population (Figure 1) (99% of the white population, 96% of the black population, 98% of the Asian/Pacific Islander population, 99% of the American Indian/Alaska Native population, and 99% of the Hispanic population). The incidence data on nonmalignant primary brain and other nervous system tumors cover approximately 97% of the U.S. population. The population coverage may be affected by the suppression of state incidence data if there were only 16 or fewer cases or if the state requested that the data be suppressed. (For more information, see the discussions under “Suppression of Rates and Counts at the State, Regional, Division, and National Levels,” “Hispanics,” and “American Indians/Alaska Natives.”)
Mortality data on 553,880 deaths in 2004 from malignant neoplasms (i.e., cancers) as recorded in NVSS from the 50 states and the District of Columbia are included in this report, and thus with regard to mortality data, 100% of the U.S. population is covered.42 In 2004, cancer was the second-leading cause of death following heart disease among both men and women in the United States. Cancer was the leading cause of death among men and women in Alaska, Colorado, Maine, Minnesota, Montana, Oregon, and Washington State.

Technical Notes
�
Statistical Methods
Age-Adjusted Incidence and Death Rates
The incidence of many cancers increases with age, as does cancer mortality. The age distribution of a population (i.e., the number of people in particular age categories) can change over time and can be different in different geographic areas. Age-adjusting the rates ensures that differences in incidence or deaths from one year to another or between one geographic area and another are not due to differences in the age distribution of the populations being compared.
The population used to age-adjust the rates in this report is the 2000 U.S. standard population, which is in accordance with a 1998 recommendation of the U.S. Department of Health and Human Services.48,49 The 2000 U.S. standard population is based on the proportion of the 2000 population in specific age groups (younger than 1 year, 1–4 years, 5–9 years, 10–14 years, 15–19 years, . . . 85 years or older); the proportions of the 2000 population in these age groups serve as weights for calculating age-adjusted incidence and death rates. NCHS, however, uses a different set of age groups in its age adjustment of death rates, and thus the cancer death rates in this report may differ slightly from those published by NCHS. In addition, the 2000 U.S. standard population weights are not race or sex specific, and thus they do not adjust for differences in race or sex between geographic areas or populations being compared. They do, however, provide the basis for adjusting for differences in the age distributions across groups defined by sex, race, geography, or other categories.
The 2000 U.S. standard population weights used for this report are based on single years of age from the Census P25-1130 series estimates of the 2000 U.S. population. Populations for single years of age are summed to form the 5-year age groups. For more information, visit http://seer.cancer.gov/stdpopulations/single_age.html. These standard weights are used to compute age-adjusted incidence and death rates by the method of direct standardization as implemented in NCI SEER*Stat software (http://www.seer.cancer.gov/seerstat) and are described as follows:50
If Nj is the number of incident cases diagnosed in 2004 or the number of cancer deaths in 2004 in age category j, and Pj is the population size at risk in age category j, then the incidence or death rate Rj in age category j is defined as
Rj = Nj/Pj
If wj is the 2000 U.S. standard population weight for age category j, then the age-adjusted (directly standardized) incidence or death rate Radj is computed as
Radj = Σj wj Rj x 100,000
Note from the multiplier in the above formula that incidence or death rates are expressed as cases or deaths per 100,000 persons. For childhood cancers coded according to ICCC, the multiplier in the formula is 1,000,000 because the childhood cancer rates are expressed per million persons.
Crude and Age-Specific Incidence and Death Rates
Crude and age-specific rates are available at http://www.cdc.gov/uscs (see “United States Cancer Statistics on the Web”).
The crude and age-specific incidence rates equal the total number of new cancer cases diagnosed in 2004 in the population category of interest, divided by the at-risk population for that category, and multiplied by 100,000 (cancers by primary site) or by 1 million (ICCC-3 groupings of childhood cancers).
The crude and age-specific death rates equal the total number of cancer deaths in 2004 in the population category of interest, divided by the at-risk population for that category, and multiplied by 100,000.
Confidence Intervals
Confidence intervals reflect the range of variation in the estimation of the cancer rates. The width of a confidence interval depends on the amount of variability in the data. Sources of variability include the underlying occurrence of cancer as well as uncertainty about when cancer is detected and diagnosed, when a death from cancer occurs, and when the data about the cancer are sent to the

United States Cancer Statistics: 2004 Incidence and Mortality
�0
registry or the state health department. In any given year, when large numbers of a particular cancer are diagnosed or when large numbers of cancer patients die, the effects of random variability are small compared with the large numbers, and the confidence interval will be narrow. With rare cancers, however, the rates are small and the chance occurrence of more or fewer cases or deaths in a given year can markedly affect those rates. Under these circumstances, the confidence interval will be wide to indicate uncertainty or instability in the cancer rate.
To estimate the extent of this uncertainty, a statistical framework is applied.51 The standard model used for rates for vital statistics is the Poisson process,52 which assigns more uncertainty to rare events relative to the size of the rate than it does to common events. The population risk profile is positioned to influence the underlying Poisson process from which rates arise, and only a single realization of that process is observed.
Parameters are estimated for the underlying disease process. For this report, we estimated a single parameter to represent the incidence rate and its variability. Of note, the Poisson model is capable of estimating separate parameters that represent contributions to the rate from various population risk factors, the effects of cancer control interventions, and other attributes of the population risk profile in any particular year.
For this report, we used confidence intervals that are expected to include the true underlying rate 95% of the time. Beginning this year, confidence intervals in this report are modified gamma intervals53 computed using SEER*Stat Version 6.3.5 software (http://www.seer.cancer.gov/seerstat). The modified gamma intervals are more efficient than the gamma intervals of Fay and Feuer54 in that they are less conservative while still retaining the nominal coverage level. Various factors such as population heterogeneity can sometimes lead to “extra-Poisson” variation in which the rates are more variable than would be predicted by a Poisson model. No attempt was made to correct for this. In addition, as discussed in “Interpreting the Data,” the confidence intervals do not account for systematic (i.e., nonrandom) biases in the incidence rates.
Users of this report who want to know whether the differences between the rates of various groups are
statistically significant might check whether the confidence intervals overlap. However, we discourage the use of overlapping confidence intervals to test for statistically significant differences between two rates because the practice more frequently fails to detect significant differences than standard hypothesis testing.55
Another consideration when comparing differences between rates is their public health importance. For some rates in this report, numerators and denominators are large and standard errors are therefore small, resulting in statistically significant differences that may be so small as to lack importance for decisions related to population-based public health programs.
Suppression of Rates and Counts at the State, Regional, Division, and National Levels
When the numbers of cases or deaths used to compute rates are small, those rates tend to have poor reliability.52 Therefore, to discourage misinterpretation or misuse of rates or counts that are unstable because case or death counts are small, incidence and death rates and counts are not shown in tables and figures if the case or death counts are below 16. A count of fewer than about 16 results in a standard error of the rate that is approximately 25% or more as large as the rate itself. Similarly, a case count below 16 results in the width of the 95% confidence interval around the rate being at least as large as the rate itself. These relationships were derived under the assumption of a Poisson process and with the standard population age distribution assumed to be similar to the observed population age distribution.
Another important reason for using a threshold value for suppressing cells is to protect the confidentiality of patients whose data are included in a report by reducing or eliminating the risk of disclosing their identity.56,57 The cell suppression threshold value of 16, which was selected to reduce misuse and misinterpretation of unstable rates and counts in this report, is more than sufficient to protect patient confidentiality given the low level of geographic and clinical detail provided in the report.58
Because the incidence and death rates shown in the state-, sex-, and race-specific bar graphs in Figures

Technical Notes
��
3.1.M1 through 3.58.F2 are presented in rank order, we applied a criterion for suppressing data in addition to the threshold value of 16 cases. In these figures, incidence rates are not ranked or shown for any population groups of fewer than 50,000 people.
Total United States
Cancer incidence rates for the United States in 2004 are aggregate rates based on more than 1.3 million cancer cases reported from central cancer registries in 49 states, 6 metropolitan areas, and the District of Columbia. The same statistical criteria that were applied to rates and counts for U.S. Census regions and divisions were applied to the rates for the entire United States (see “U.S. Census Regions and Divisions” and http://www.cdc.gov/uscs). The cancer rates for the entire United States met these criteria and are the best estimates of the U.S. cancer burden available that are based on observed data. The observed cancer rates are for approximately 98% of the U.S. population covered by eligible cancer registries.
Case counts for the U.S. incidence rates for all ages combined are in Appendix D, Table D.1.1M and Table D.1.1F. The U.S. case counts are provided only to allow readers to verify the crude rates (available at http://www.cdc.gov/uscs) by recalculation. The U.S. counts in this report pertain to approximately 98% of the U.S. population covered by eligible cancer registries.
U.S. Census Regions and Divisions
Rates for U.S. Census regions and divisions were calculated by aggregating data reported from the states in each region and division. Only data from state registries that met the criteria for inclusion in this report (see “USCS Publication Criteria”) were included in calculations of incidence rates for U.S. Census regions and divisions. Thus, where data for some states are excluded there is a potential for bias in the incidence rates for Census regions and divisions. We estimated cancer rates for Census regions or divisions with ineligible cancer registries by assuming that the incidence-to-mortality ratio in the portion of the region or division that was covered by eligible registries was the same as the incidence-to-mortality ratio in the portion that was not covered by eligible cancer registries. The age-adjusted incidence rates for
U.S. Census regions and divisions are reported only if (1) at least 80% of the population for the Census region or division was covered by cancer registries that met the criteria for inclusion in this report and (2) the 95% confidence intervals around the observed age-adjusted regional or division incidence rates based on data from eligible registries for each of six major cancer sites (prostate, female breast, male colorectal, female colorectal, male lung and bronchus, female lung and bronchus) included the estimate of the regional or division rate calculated using the methods described in “Criteria for Reporting Age-Adjusted Cancer Incidence Rates for U.S. Census Regions and Divisions” available at http://www.cdc.gov/uscs.
This report presents the observed age-adjusted incidence rates for all U.S. Census regions and divisions. Case counts for U.S. Census regions and divisions are in Appendix E if all state cancer registries in the region or division met the criteria for inclusion in this report, unless the count for exactly one state in the region or division is suppressed due to a count below 16.
Interpreting the Data
Age-adjusted and age-specific rates for all cancer sites combined are presented in this report. Crude rates and selected age-specific rates for selected cancers have also been calculated and can be found at http://www.cdc.gov/uscs. Crude rates are helpful in determining the cancer burden and specific needs for services for a given population, compared with another population, regardless of size. Crude rates are influenced by the underlying age distribution of the state’s population. Even if two states have the same age-adjusted rates, the state with the relatively older population (as demonstrated by a higher median age) will have higher crude rates because incidence or death rates for most cancers increase with increasing age. Ideally, crude, age-adjusted, and age-specific rates are all used to plan for population-based cancer prevention and control interventions.49
Incidence Data
Published age-adjusted cancer incidence rates for diagnosis years before 1999 were calculated by using the 1970 U.S. standard population; for mortality data,
United States Cancer Statistics: 2004 Incidence and Mortality
��
the 1940 standard population was used. Beginning with the publication of data for the 1999 diagnosis year, cancer incidence rates were age-adjusted to the 2000 U.S. standard population. This change conforms to U.S. Department of Health and Human Services policy for reporting death and disease rates.48,49 This policy was motivated by a need to standardize age-adjustment procedures across government agencies.48 The change to the 2000 U.S. standard updated the calculation of age-adjusted rates to more closely reflect the current age distribution of the U.S. population and the current burden of cancer. Because of the aging of the U.S. population, the 2000 U.S. standard population gives more weight to older age categories than did the 1940 and 1970 standard populations.5,49
Because the incidence of cancer increases with age, the change to the 2000 U.S. standard population resulted in higher incidence rates for most cancers. The data published here should not be compared with cancer incidence rates adjusted to different standard populations.
Incidence rates are also influenced by the choice of population denominators used in calculating these rates. Because some state health departments use customized projections of the state’s population when calculating incidence rates, the rates published in this report may differ slightly from those published by individual states.
Statistical bias can arise if, within a region, division, or country, the sub-area for which data are available has rates that are substantially different from the rates in the sub-area for which data are not available. Because of bias, rates for a U.S. Census region or division, or the country, may not meet statistical criteria for inclusion in this report. It is possible to have some statistical bias even if the percentage of coverage is high and large numbers of cases are recorded. Where coverage is less than 100%, merely increasing the percentage of the population covered may not reduce statistical bias unless the covered population is similar to the uncovered population in terms of cancer rates or proportions. The U.S. counts and rates in this report pertain to approximately 98% of the U.S. population covered by eligible cancer registries.
Data quality is routinely evaluated by NPCR and the SEER Program.59,60 Some evaluation activities
are conducted intermittently to find missing cases or to identify errors in the data. Although the cancer registries whose data are included in this report meet data quality criteria for all invasive sites combined, the completeness and quality of site-specific data may vary. The observed rates may have been influenced by differences in the timeliness, completeness, and accuracy of the data from one registry to another, from one reporting period to another, or from one primary cancer site to another.
Completeness and accuracy of the site-specific data may also be affected by the time interval allowed for reporting data to the two federal programs. For this report of 2004 data, the NPCR and SEER time interval for reporting data differed by 3 months: NPCR allowed an interval of 25 months after the close of the diagnosis year (data submission by January 31, 2007), and SEER allowed a shorter interval of 22 months after the close of the diagnosis year (data submission by November 1, 2006).
Delays in reporting cancer cases can affect the timely and accurate calculation of cancer incidence rates.61 Cases are reported continuously to state and metropolitan-area cancer registries in accordance with statutory and contractual reporting requirements. After the initial submission of the most recent year’s data to the federal funding agency, cancer registries continue to revise and update their data on the basis of new information received. Therefore, some cancer cases for the 2004 diagnosis year will likely have been reported to state and metropolitan-area cancer registries after these registries submitted their 2004 data to CDC or NCI. For this reason, incidence rates and case counts reported directly by state or metropolitan-area cancer registries may differ from those in this publication. Reporting delays appear to be more common for cancers that are usually diagnosed and treated in non-hospital settings such as physicians’ offices (e.g., early-stage prostate and breast cancer, melanoma of the skin). NCI routinely models SEER reporting patterns and estimates that the delay-adjusted 2004 incidence rate for all sites combined is about 3% higher than the observed 2004 age-adjusted incidence rate. Delay adjustments for 2004 SEER age-adjusted rates vary: melanoma is 4%; prostate cancer, 4%; breast cancer, 2%; lung cancer, 3%; leukemia, 15%; and myeloma, 10% (Dr. Brenda K. Edwards, NCI, personal communication, June 2007). Updates to observed data and reported cancer rates are due to improvements in the registry database
Technical Notes
�3
gained through additional knowledge that only comes with increased time and effort (Dr. Brenda K. Edwards, NCI, personal communication, June 2007). Methods to adjust incidence rates for reporting delay were not applied to the data in this report.61
Each year, state cancer registries submit cancer cases for a new diagnosis year and an updated version of the previous years’ cancer cases to CDC or NCI. Federal agencies in turn update their cancer incidence cases with each data submission and document the states’ date of data submission whenever the data are published. These continual updates by state and federal agencies illustrate the dynamic nature of cancer surveillance and the attention to detail that is characteristic of cancer registries. Cancer incidence rates from previous years are re-calculated (see “Statistical Methods”) using the most recent data submission and the most recent population data (see “Data Sources”). These updated cancer statistics are available at http://www.cdc.gov/uscs (see “United States Cancer Statistics on the Web”). Users of cancer incidence data published by federal agencies should be mindful of the data submission dates for all data used in their analyses.
Geographic variation in cancer incidence rates may be the result of regional differences in the exposure of the population to known or unknown risk factors.62-
65 Differences may arise because of differences in sociodemographic characteristics of the population (e.g., age, race and ethnicity, geographic region, urban or rural residence), screening use, health-related behaviors (e.g., tobacco use, diet, physical activity), exposure to cancer-causing agents, or factors associated with the registries’ operations (e.g., completeness, timeliness, specificity in coding cancer sites). Cancer researchers are investigating variability associated with known factors that affect cancer rates and risks by using model-based statistical techniques and other approaches for surveillance research. Differences in registry operations are being evaluated to ensure the consistency and quality in reporting data.
Mortality Data
The cancer mortality statistics in this report are influenced by the accuracy of information on the death certificate. Cause of death determined by autopsy combined with clinical data is considered the best estimate of the true cause of death.66 Autopsy studies of mortality data coded according to the eighth
or ninth revision of ICD (ICD–8A or ICD–9) indicate that, when neoplasms (i.e., cancers) are an underlying cause of death, the sensitivity of death certificates was 87%–93%, and their predictive value positive was 85%–96%.66-68 However, these studies are limited by selection bias, and currently less than 10% of deaths in the United States are autopsied.69 The percentage of cancers coded as the underlying cause of death on the death certificate that agree with the cancer diagnosis in the medical record is an indication of the reliability with which the underlying cause of death can be determined from the death certificate. Available studies show that 78%–85% of malignant neoplasms coded as an underlying cause of death on death certificates agreed with the cancer diagnosis in medical records under ICD–8A or ICD–9,70-72 with a range of 69% for larynx cancer to 98% for prostate cancer under ICD–9 (Appendix B, Table B.2). These results underscore the need to further monitor the accuracy of cancer mortality data overall and by anatomic site.
Some cancer patients may die with cancer (rather than die of it) and have cancer listed as an underlying cause of death. Comparing the original cancer diagnosis in the medical record with those cancers later coded as an underlying cause of death on death certificates is a way of measuring whether a person died with cancer rather than of it. Findings from an 11-year study under ICD–9 showed that about 83% of malignant neoplasms recorded on the medical record in ICD for oncology were also coded as an underlying cause of death on death certificates;72 this percentage ranged from 72% for larynx cancer to 97% for multiple myeloma (Appendix B, Table B.2). The SEER study suggests that misattribution bias (i.e., the mistaken assignment of cancer as the underlying cause of death because the decedent received a diagnosis of cancer) affects how cancer is recorded on death certificates.73
In collaboration with the Social Security Administration and the National Association for Public Health Statistics and Information Systems, NCHS is developing a Model Vital Event Re-Engineered System to improve the accuracy and timeliness of vital statistics disseminated through the NVSS. Under the system, standard certificates for births and deaths will be revised, and state data systems will be re-engineered to better accommodate revisions, special studies or projects, and linkage with other health promotion programs. With regard to mortality statistics, handbooks have been revised for

United States Cancer Statistics: 2004 Incidence and Mortality
��
professionals who complete death certificates.74 (Also see “Data Sources, Mortality Data”).
Race and Ethnicity in Cancer Data
The NAACCR Race and Ethnicity Identifier Assessment Project confirmed the importance of publishing cancer rates by race and ethnicity.75 In cancer incidence, race and ethnicity information is abstracted from medical records and then grouped into race and ethnicity categories.20 Although state registries across the country use standardized data items and codes for both race and ethnicity (i.e., Hispanic origin), the initial collection of this information by health care facilities and practitioners and the procedures for assigning and verifying codes for race and ethnicity are not well standardized.75 Thus, some inconsistency is expected in this information.
In cancer mortality, race and Hispanic origin are reported separately on the death certificate by the funeral director as provided by an informant or, in the absence of an informant, on the basis of observation.42 Inconsistencies in the collection and coding of data on race and Hispanic origin and their effect on mortality statistics have been described previously.76 The net effect of misclassification is an underestimation of deaths and death rates for races other than white or black. In addition, under-coverage of minority populations in the census and resultant population estimates introduce biases into death rates by race.76-78 Published death rates are overstated by an estimated 1% for the white population and by 5% for the black population, resulting principally from undercounts of these populations in the census.In this report, cancer incidence and mortality data are presented for all races combined and by race (whites, blacks, Asians/Pacific Islanders, and American Indians/Alaska Natives) and ethnicity (Hispanics). Data for Asians/Pacific Islanders and American Indians/Alaska Natives are presented only for the nation and for states with at least 50,000 population of a given race (Asians/Pacific Islanders or American Indians/Alaska Natives) because of concerns regarding possible misclassification of race data and the relatively small sizes of these populations in the United States (see Figures 3.1.M1–3.58.F2). For NPCR and NPCR/SEER registries, race-specific incidence counts and rates are based on Race1 (NAACCR data element 160),20 Race2 (NAACCR
data element 161),20 and IHS Link (NAACCR data element 192).20 If Race1 is white and Race2 is a specified race other than white, then the value from Race2 is used. After this check, if race is still white, unknown, or other non-specified race and there is a positive IHS Link, then the race is set to American Indian/Alaska Native. For Alaska and Kansas, IHS Link was not used to determine race. For SEER registries, race-specific incidence counts and rates are based on Race1 and IHS Link; if Race1 is white, unknown, or other and there is a positive IHS link, then race/ethnicity is set to American Indian/Alaska Native, otherwise, race/ethnicity is set to the Race1 value.
Asians/Pacific Islanders
Data for Asians/Pacific Islanders were included for the first time in United States Cancer Statistics: 2000 Incidence.79 The Asian, Native Hawaiian, and other Pacific Islander population in the United States is approximately 12.8 million or 4.4% of the 2004 U.S. population, substantially smaller than the white or black populations.80 The Asian/Pacific Islander population is concentrated in several states: California, New York, Hawaii, Texas, New Jersey, Illinois, and Washington.81,82
Grouping Asians and Pacific Islanders into one racial population can mask differences in subpopulations. The U.S. Asian/Pacific Islander population is not a homogeneous group. Rather, it comprises many subpopulations that differ in language, culture, and length of residence in the United States.82,83 The three largest Asian subpopulations in the United States are Chinese, Filipino, and Asian Indian.82 Although state cancer registries have designated codes for race that allow them to document the occurrence of cancer in 23 different Asian/Pacific Islander subpopulations,20 in this report the subpopulations are grouped into a single Asian/Pacific Islander category because of small numbers and concerns regarding the possible misclassification of race for the various subpopulations.
Studies show that a person self-reported as Asian/Pacific Islander in a census or survey is sometimes reported as white on the death certificate.84,85 Death rates are understated for Asians/Pacific Islanders by approximately 11%.76 Studies show excellent agreement (k=0.90) for Asian/Pacific Islander race
Technical Notes
��
in SEER registry data compared to self-reported data from the U.S. census.86 Studies are under way to examine the misclassification of race for Asian/Pacific Islander subpopulations (Dr. Holly L. Howe, NAACCR, personal communication, August 2005).
Hispanics
Data for Hispanics were included for the first time in United States Cancer Statistics: 2001 Incidence and Mortality;23 The Office of Management and Budget defines Hispanics (or Latinos) as persons of Cuban, Mexican, Puerto Rican, South or Central American, or other Spanish culture or origin regardless of race.87 Hispanics have one of the highest growth rates among minority groups in the U.S. with approximately 41.3 million Hispanics in 2004, a population similar in size to the U.S. black population.80,88,89 The three largest Hispanic subpopulations in the U.S. are Mexican, Puerto Rican, and Cuban. States with 1 million or more Hispanics include California, Texas, New York, Florida, Illinois, Arizona, and New Jersey.88
NAACCR convened an expert panel to develop a best-practices approach to improving Hispanic identification and is addressing the misclassification of Hispanic origin in central cancer registries. NPCR registries assigned Hispanic ethnicity through the standardized use of the NAACCR Hispanic Identification Algorithm (NHIA), version 2 (NHIAv2).90 NHIAv2 uses a combination of NAACCR variables to directly or indirectly classify cancer cases as Hispanic for analytic purposes. If desired, following the application of these specific options, a registry can exclude counties from the surname-match portion of the algorithm when the proportion of Hispanic/Latino residents in the 2000 U.S. Census population estimate of the county falls below 5%. Cases reported as having Spanish/Hispanic origin (as indicated by NAACCR data element 190 with values 1–6)20 are directly identified as Hispanic in the dataset. Cases reported as non-Spanish/non-Hispanic, Spanish surname only, or unknown whether Spanish (NAACCR data element 190 with a value of 0, 7, or 9)20 are evaluated for possible Hispanic ethnicity through indirect identification. The ultimate goal of the algorithm is to classify these cases as Hispanic or non-Hispanic on the basis of an evaluation of the strength of the associations of birthplace, race, and/or surname with Hispanic ethnicity. After applying the NHIA, cases not
classified as Hispanic are classified as non-Hispanic, leaving no cases with unknown Hispanic status. More detailed information on the algorithm is available at http://www.naaccr.org.91
In this report, NHIA-classified case counts and incidence rates for Hispanics are presented for 38 NPCR registries, 3 NPCR/SEER registries, and 9 SEER registries. The following NPCR registries have opted not to present state-specific, NHIA-classified Hispanic counts and rates: Florida, Kentucky, Pennsylvania, and South Carolina. Quality reviews of NHIA and the data elements that make up this algorithm, including but not limited to Hispanic ethnicity, race, birthplace, surname, and maiden name for women, have been conducted.91 The national rates presented in this report include data for registries that opted not to present state-specific, NHIA-classified Hispanic counts and incidence rates. Preliminary data analyses showed that exclusion of these registry data did not appreciably change the overall incidence rates. Death counts and rates for Hispanics are presented at the national and state levels for all 50 states and for the District of Columbia. Hispanic origin is assigned to cancer mortality data on the basis of information collected from death certificates.
The overall agreement of Hispanic ethnicity collected by SEER registries compared with self-reported ethnicity from the U.S. Census was substantial (k=0.61). Hispanics were found to be under-classified in the SEER data compared to self-reports.86 The National Longitudinal Mortality Study examined the reliability of Hispanic origin and reported a 89.7% record-by-record agreement and a net underreporting of Hispanic origin on death certificates by 7% compared with self-reports on the surveys.76 Death rates for the Hispanic-origin population are also affected by under-coverage of this population group in the census and the resultant population estimates; the estimated net correction, taking into account both sources of bias, is 1.6%.78
American Indians/Alaska Natives
Data for American Indians/Alaska Natives were included for the first time in United States Cancer Statistics: 2002 Incidence and Mortality.24 Over 560 American Indian tribes are recognized by individual states and the federal government.9,92,93 The American Indian/Alaska Native population in

��
United States Cancer Statistics: 2004 Incidence and Mortality
the U.S. is approximately 2.8 million, or 1.0% of the 2004 U.S. population, substantially smaller than the white or black populations and smaller than the Asian/Pacific Islander population.80 The American Indian/Alaska Native population is concentrated in several states: California, Arizona, Oklahoma, New Mexico, Texas, Alaska, New York, North Carolina, and Washington.80 Also, NCI-SEER registries provide complete coverage for special populations whose data are reported to their respective state registries: Alaska Natives, 16%; and Arizona Indians, 5%.
Previous studies have found racial misclassification to contribute to lower death rates and lower cancer incidence rates among the American Indian/Alaska Native population. Based on a comparison of race reported on death certificates from 1979–1989 with nine Current Population Survey files for the years 1973–1985 from the National Longitudinal Mortality Study conducted by the U.S. Bureau of the Census, record-by-record agreement was only 57% for American Indians.76 When the net agreement of counts by race was examined between the two sources, almost 40% more persons were reported as American Indian/Alaska Native in the Current Population Survey files than on the death certificates.76 The range of underestimation of cancer incidence rates among this population are similar. Studies that estimate misclassification among American Indians/Alaska Natives using cancer registry data report these rates are underreported by 40%–57%, depending on the region of the country.93-
95
Studies measuring racial misclassification in cancer registry data have linked cases with Indian Health Service (IHS) administrative records.93-95 IHS provides medical services to American Indians/Alaska Natives who are members of federally recognized tribes, estimated to be approximately 55% of the American Indian/Alaska Native population (Dr. David Espey, IHS, personal communication, July 2005). IHS coverage of these populations varies by region, does not include American Indians/Alaska Natives who are members of non-federally recognized tribes, and underrepresents those who live in certain urban areas. American Indians/Alaska Natives who live outside of service counties may, however, continue to receive IHS services or may have received services before moving. To address American Indians/Alaska Natives misclassification in cancer registry data, in 2006 all NPCR and SEER registries linked their data
to the IHS administrative records database for cases diagnosed from 1995 to 2004 and 1988 to 2004, respectively. Results of the linkage were captured in a new data element, IHS Link (NAACCR data element 192),20 that was sent back to state cancer registries. California opted not to present state-specific American Indian/Alaska Native case counts, incidence rates, death counts, and death rates.
National death counts and rates for American Indians/Alaska Natives are based on data obtained from all 50 states and the District of Columbia. Classification as American Indian/Alaska Native is obtained from information on the death certificate.
United States Cancer Statistics on the Web (http://www.cdc.gov/uscs)
The USCS Web site is a comprehensive source of 2004 incidence and mortality data. All the tables and figures in this report are available on the USCS Web site.
In addition to the data published in this report, the following data for all years (1999, 2000, 2001, 2002, 2003, 2004, and 2002-2004) are only available on the Web:
• Cancer incidence and death rates for 2002-2004.
Combining years of data adds stability to the rates and allows for less suppression of smaller cancer sites or smaller racial populations. The population coverage for incidence data for these combined years is 93% of the U.S. population. The methods for calculating rates and their confidence intervals, as well as the suppression of data at the state, regional, division, and national levels, are the same for single years and combined years of data. See “Statistical Methods” for more information.
• Crude incidence and death rates for Tables 1 and 2.
• Age-specific incidence and death rates for 27 cancer sites that are listed in the “Cancer Incidence and Mortality by U.S. Census Region

Technical Notes
��
and Division, State, and Metropolitan Area” section.
• Cancer incidence and death rates for men and women combined.
• State rankings of incidence and mortality of selected major cancers.
• State versus national comparisons of incidence and death rates for the most common cancers.
Previously published data based on 1999–2003 cancer cases as reported to CDC as of January 31, 2007, and as reported to NCI as of November 1, 2006, and made available through the SEER Program public use file (see “Interpreting the Data: Incidence Data”) have been updated. All updated data are coded and classified according to current standards (i.e., ICD–O–3 and 2000 U.S. standard population) to be comparable across diagnosis years. The population coverage (% of the U.S population) for incidence rates is as follows:
⌂ 1999 incidence: 92%
⌂ 2000 incidence: 92%
⌂ 2001 incidence: 92%
⌂ 2002 incidence: 93%
⌂ 2003 incidence: 96%
⌂ 2004 incidence: 98%
⌂ 2002-2004 combined incidence: 93%
All data presented on the Web can be downloaded for use in other applications. A portable document file (PDF) that mirrors this report is also available for download.
References
1. American Cancer Society. Cancer Facts and Figures 2007. Atlanta (GA): American Cancer Society; 2007. Available at http://www.cancer.org [Accessed October 2007].
2. Centers for Disease Control and Prevention. The Burden of Chronic Diseases and Their Risk Factors: National and State Perspectives 2004. Atlanta (GA): Centers for Disease Control and Prevention;
2005. Available at http://www.cdc.gov/nccdphp/burdenbook2004/index.htm [Accessed October 2007].
3. Ries LAG, Eisner MP, Kosary CL, Hankey BF, Miller BA, Clegg L, Mariotto A, Feuer EJ, Edwards BK. SEER Cancer Statistics Review, 1975-2004. Bethesda (MD): National Cancer Institute; 2004. Available at http://seer.cancer.gov/csr/1975_2004 [Accessed October 2007].
4. Espey DK, Wu XC, Swan J, Wiggins C, Jim M, Ward E, Wingo PA, Howe HL, Ries LAG, Miller BA, Jemal A, Ahmed F, Jiles RB, Cobb N, Kaur JS, Edwards BK. Annual report to the nation on the status of cancer, 1975-2004, featuring cancer in American Indians and Alaska Natives. Cancer 2007;110(10):2119-2152.
5. Edwards BK, Howe HL, Ries LA, Thun MJ, Rosenberg HM, Yancik R, Wingo PA, Jemal A, Feigal EG. Annual report to the nation on the status of cancer, 1973–1999, featuring implications of age and aging on U.S. cancer burden. Cancer 2002;94(10):2766-2792.
6. National Cancer Institute. 2006 Fact Book. Bethesda (MD): National Cancer Institute; 2007. Available at http://obf.cancer.gov/financial/attachments/06factbk.pdf [Accessed October 2007].
7. National Heart, Lung, and Blood Institute. NHLBI Fact Book, Fiscal Year 2006. Bethesda (MD): National Heart, Lung, and Blood Institute; 2007. Available at http://www.nhlbi.nih.gov/about/factbook/chapter4.htm [Accessed October 2007].
8. Curry SJ, Byers T, Hewitt M. Fulfilling the Potential of Cancer Prevention and Control. Washington (DC): The National Academies Press; 2003.
9. Haynes MA, Smedley BD. The Unequal Burden of Cancer: An Assessment of NIH Research and Programs for Ethnic Minorities and the Medically Underserved. Washington (DC): The National Academies Press; 1999.
10. American College of Surgeons Commission on Cancer. Standards of the Commission on Cancer. vol II: Registry Operations and Data Standards (ROADS). Chicago (IL): American College of Surgeons; 1998.
11. Fritz A, Ries LAG. The SEER Program Code Manual. 3rd ed. Bethesda (MD): National Cancer Institute; 1998.

��
United States Cancer Statistics: 2004 Incidence and Mortality
12. U.S. Department of Health and Human Services. Healthy People 2010. 2nd ed., 2 vols. Washington (DC): U.S. Government Printing Office; 2000. Available at http://www.healthypeople.gov/document [Accessed October 2007].
13. The National Cancer Act of 1971, Public Law No. 92-218, Stat. 1828 (December 23, 1971). Available at http://legislative.cancer.gov/history/phsa/1971 [Accessed October 2007].
14. Hankey BF, Ries LA, Edwards BK. The Surveillance, Epidemiology, and End Results Program: a national resource. Cancer Epidemiology Biomarkers and Prevention 1999;8(12):1117-1121.
15. Cancer Registries Amendment Act, Public Law No. 102-515, Stat. 3312 (October 22, 1992). Available at http://www.cdc.gov/cancer/npcr/npcrpdfs/publaw.pdf [Accessed October 2007].
16. Centers for Disease Control and Prevention. Program Announcement #00027, National Program of Cancer Registries. Atlanta (GA): Centers for Disease Control and Prevention; 1999.
17. North American Association of Central Cancer Registries. NAACCR Registry Certification. Springfield (IL): North American Association of Central Cancer Registries; 2005. Available at http://www.naaccr.org/index.asp?Col_SectionKey=11&Col_ContentID=54 [Accessed October 2007].
18. Tucker TC, Howe HL, Weir HK. Certification of population-based cancer registries. Journal of Registry Management 1999;26(1):24-27.
19. Tucker TC, Howe HL. Measuring the quality of population-based cancer registries: the NAACCR perspective. Journal of Registry Management 2001;28(1):41-44.
20. Havener L, Hulstrom D. Standards for Cancer Registries. vol II: : Data Standards and Data Dictionary. 10th ed., version 11. Springfield (IL): North American Association of Central Cancer Registries; 2004.
21. Fritz A, Percy C, Jack A, Shanmugaratnam K, Sobin L, Parkin DM, Whelan S. International Classification of Diseases for Oncology. 3rd ed.Geneva, Switzerland: World Health Organization; 2000.
22. DeVita VT, Hellman S, Rosenberg SA. Cancer: Principles & Practice of Oncology. 7th ed. Philadelphia (PA): Lippincott, Williams, & Wilkins; 2005.
23. U.S. Cancer Statistics Working Group. United States Cancer Statistics: 2001 Incidence and Mortality. Atlanta (GA): U.S. Department of Health and Human Services, Centers for Disease Control and Prevention and National Cancer Institute; 2004.
24. U.S. Cancer Statistics Working Group. United States Cancer Statistics: 2002 Incidence and Mortality. Atlanta (GA): U.S. Department of Health and Human Services, Centers for Disease Control and Prevention and National Cancer Institute; 2005.
25. Wu XC, McLaughlin CC, Lake A, Firth R, Leonfellner S, Cormier M, Cardinez C, Kosary C, Roney D, Howe HL (eds). Cancer in North America, 2000-2004. vol I: Incidence. Springfield (IL): North American Association of Central Cancer Registries, Inc. May 2007. Available at http://www.naaccr.org/index.asp?Col_SectionKey=11&Col_ContentID=50 [Accessed October 2007].
26. Steliarova-Foucher E, Stiller C, Lacour B, Kaatsch P. International Classification of Childhood Cancer, third edition. Cancer 2005;103(7):1457-1467.
27. McCarthy BJ, Kruchko C, and the Central Brain Tumor Registry of the United States. Consensus conference on cancer registration of brain and central nervous system tumors. Neuro-oncology 2005;7(2):196-201.
28. CBTRUS (2005). Statistical Report: Primary Brain Tumors in the United States, 1998-2002. Published by the Central Brain Tumor Registry of the United States
29. National Center for Health Statistics. 2003 revision of the U.S. Standard Certificate of Death. 2003. Hyattsville (MD): National Center for Health Statistics; 2006. Available at http://www.cdc.gov/nchs/data/dvs/DEATH11-03final-acc.pdf [Accessed October 2007].
30. Tolson GC, Barnes JM, Gay GA, Kowaleski JL. The 1989 revision of the U.S. Standard Certificates and Reports. Vital and Health Statistics, Series 4 1991(28):1-34.
31. National Center for Health Statistics. Technical appendix. Vital Statistics of the United States, 1989. vol II, part A. Washington (DC): Public Health Service; 1992.
Technical Notes
��
32. National Center for Health Statistics. Report of the Panel to Evaluate the U.S. Standard Certificates. Hyattsville (MD): National Center for Health Statistics; 2000. Available at http://www.cdc.gov/nchs/data/dvs/panelreport_acc.pdf [Accessed October 2007].
33. World Health Organization. International Statistical Classification of Diseases and Related Health Problems, Tenth Revision. Geneva, Switzerland: World Health Organization; 1992.
34. National Center for Health Statistics. National Vital Statistics System Instruction Manual, Part 2a—Instructions for Classifying the Underlying Cause of Death, ICD–10, 2007. Hyattsville (MD): National Center for Health Statistics; 2005. Available at http://www.cdc.gov/nchs/about/major/dvs/im.htm [Accessed October 2007].
35. National Center for Health Statistics. National Vital Statistics System Instruction Manual, Part 2b—Instructions for Classifying Multiple Causes of Death, ICD–10, 2005. Hyattsville (MD): National Center for Health Statistics; 2007. Available at http://www.cdc.gov/nchs/about/major/dvs/im.htm [Accessed October 2007].
36. National Center for Health Statistics. Mortality Data, Multiple Cause-of-Death Public-Use Data Files. Hyattsville (MD): National Center for Health Statistics; 2007. Available at http://www.cdc.gov/nchs/products/elec_prods/subject/mortmcd.htm#content [Accessed October 2007].
37. Chamblee RF, Evans MC. TRANSAX: the NCHS system for producing multiple cause-of-death statistics, 1968–78. Vital and Health Statistics, Series 1 1986;(20):1-83.
38. Israel RA, Rosenberg HM, Curtin LR. Analytical potential for multiple cause-of-death data. American Journal of Epidemiology 1986;124(2):161-179.
39. National Center for Health Statistics. National Vital Statistics System Instruction Manual, Part 2c—ICD–9 ACME Decision Tables for Classifying Underlying Cause of Death. Hyattsville (MD): National Center for Health Statistics; 2007. Available at http://www.cdc.gov/nchs/about/major/dvs/im.htm [Accessed October 2007].
40. National Center for Health Statistics. National Vital Statistics System Instruction Manual, Part 2g—Data Entry Instructions for the Mortality Medical Indexing,
Classification, and Retrieval System (MICAR), 1996–1997, ICD–9. Hyattsville (MD): National Center for Health Statistics; 1996. Available at http://www.cdc.gov/nchs/about/major/dvs/im.htm [Accessed October 2007].
41. National Center for Health Statistics. National Vital Statistics System Instruction Manual, Part 2h—Dictionary of Valid Terms for MICAR. Hyattsville (MD): National Center for Health Statistics; 1996.
42. Miniño AM, Heron MP, Murphy SL, Kochanek KD. Deaths: Final data for 2004. National Vital Statistics Reports 2007;55(19):1-119.
43. Becker TM, Wiggins CL, Key CR, Samet JM. Symptoms, signs, and ill-defined conditions: a leading cause of death among minorities. American Journal of Epidemiology 1990;131(4):664-668.
44. Howe HL. Conclusions of the Workgroup for High-Quality Criteria for Data Use: The NAACCR Narrative. Springfield (IL): North American Association of Central Cancer Registries; 2001.
45. Havener L. Standards for Cancer Registries. vol III: Standards for Completeness, Quality, Analysis, and Management of Data. Springfield (IL): North American Association of Central Cancer Registries; 2004.
46. Menck HR, Phillips JL. Central cancer registries. In: Hutchinson CL, Menck HR, Burch M, Gottschalk R, editors. Cancer Registry Management: Principles and Practice. 2nd ed. Dubuque (IA): Kendall/Hunt Publishing Company; 2004.
47. Seiffert JE, Hoyler SS, McKeen K, Potts M. Casefinding, abstracting, and death clearance. In: Menck HR, Smart C, editors. Central Cancer Registries: Design, Management, and Use. Chur, Switzerland: Harwood Academic Publishers; 1994.
48. Anderson RN, Rosenberg HM. Report of the Second Workshop on Age Adjustment. Vital and Health Statistics, Series 4 1998;(30):1-37.
49. Anderson RN, Rosenberg HM. Age standardization of death rates: implementation of the year 2000 standard. National Vital Statistics Reports 1998;47(3):1-16, 20.
50. Breslow NE, Day NE. Statistical Methods in Cancer Research. vol. II: The Design and Analysis of Cohort Studies. Lyon, France: International Agency for Cancer Research; 1987.

United States Cancer Statistics: 2004 Incidence and Mortality
�0
51. Särndal C-E, Swennson B, Wretman J. Model-Assisted Survey Sampling. New York (NY): Springer-Verlag; 1992.
52. Brillinger DR. The natural variability of vital rates and associated statistics. Biometrics 1986;42(4):693-734.
53. Tiwari RC, Clegg LX, Zou Z. Efficient interval estimation for age-adjusted cancer rates. Statistical Methods in Medical Research 2006;15(6):547-569.
54. Fay MP, Feuer EJ. Confidence intervals for directly standardized rates: a method based on the gamma distribution. Statistics in Medicine 1997;16(7):791-801.
55. Schenker N, Gentleman JF. On judging the significance of differences by examining the overlap between confidence intervals. The American Statistician 2001;55(3):182-186.
56. Federal Committee on Statistical Methodology. Report on Statistical Disclosure Limitations Methodology (Statistical Working Paper 22). Washington (DC): Office of Management and Budget; 2005. Available at http://www.fcsm.gov/working-papers/spwp22.html [Accessed October 2007].
57. Doyle P, Lane JI, Theeuwes JM, Zayatz LM. Confidentiality, Disclosure, and Data Access: Theory and Practical Applications for Statistical Agencies. Amsterdam, The Netherlands: Elsevier Science; 2001.
58. National Center for Health Statistics. NCHS Staff Manual on Confidentiality. Hyattsville (MD): National Center for Health Statistics; 1997. Available at http://www.cdc.gov/nchs/data/misc/staffmanual2004.pdf [Accessed July 2007].
59. Fritz A. The SEER Program’s commitment to data quality. Journal of Registry Management 2001;28(1):35-40.
60. Hutton MD, Simpson LD, Miller DS, Weir HK, McDavid K, Hall HI. Progress toward nationwide cancer surveillance: an evaluation of the National Program of Cancer Registries, 1994–1999. Journal of Registry Management 2001;28(3):113-120.
61. Clegg LX, Feuer EJ, Midthune DN, Fay MP, Hankey BF. Impact of reporting delay and reporting error on cancer incidence rates and trends. Journal of the National Cancer Institute 2002;94(20):1537-1545.
62. Centers for Disease Control and Prevention. Behavioral Risk Factor Surveillance System Operational and User’s Guide. Version 3.0. Atlanta (GA): Centers for Disease Control and Prevention; 2005. Available at http://www.cdc.gov/brfss/pubs/index.htm#users [Accessed October 2007].
63. Devesa SS, Grauman DJ, Blot WJ, Pennello GA, Hoover RN. Atlas of Cancer Mortality in the United States, 1950–1994. Bethesda (MD): National Cancer Institute; 1999. Available at http://www3.cancer.gov/atlasplus [Accessed October 2007].
64. Howe HL, Keller JE, Lehnherr M. Relation between population density and cancer incidence, Illinois, 1986–1990. American Journal of Epidemiology 1993;138(1):29-36.
65. Wingo PA, Jamison PM, Hiatt RA, Weir HK, Gargiullo PM, Hutton M, Lee NC, Hall HI. Building the infrastructure for nationwide cancer surveillance and control—a comparison between the National Program of Cancer Registries (NPCR) and the Surveillance, Epidemiology, and End Results (SEER) Program (United States). Cancer Causes and Control 2003;14(2):175-193.
66. Kircher T, Nelson J, Burdo H. The autopsy as a measure of accuracy of the death certificate. The New England Journal of Medicine 1985;313(20):1263-1269.
67. Engel LW, Strauchen JA, Chiazze L Jr, Heid M. Accuracy of death certification in an autopsied population with specific attention to malignant neoplasms and vascular diseases. American Journal of Epidemiology 1980;111(1):99-112.
68. Schottenfeld D, Eaton M, Sommers SC, Alonso DR, Wilkinson C. The autopsy as a measure of accuracy of the death certificate. Bulletin of the New York Academy of Medicine 1982;58(9):778-794.
69. Sinard JH. Factors affecting autopsy rates, autopsy request rates, and autopsy findings at a large academic medical center. Experimental and Molecular Pathology 2001;70(3):333-343.
70. Gittelsohn A, Senning J. Studies on the reliability of vital and health records: I. Comparison of cause of death and hospital record diagnoses. American Journal of Public Health 1979;69(7):680-689.
71. Percy C, Stanek E III, Gloeckler L. Accuracy of cancer death certificates and its effect on cancer

Technical Notes
��
mortality statistics. American Journal of Public Health 1981;71(3):242-250.
72. Percy CL, Miller BA, Gloeckler Ries LA. Effect of changes in cancer classification and the accuracy of cancer death certificates on trends in cancer mortality. Annals of the New York Academy of Sciences 1990;609:87-97.
73. Hoffman RM, Stone SN, Hunt WC, Key CR, Gilliland FD. Effects of misattribution in assigning cause of death on prostate cancer mortality rates. Annals of Epidemiology 2003;13(6):450-454.
74. National Center for Health Statistics. 2003 Revisions of the U.S. Standard Certificate of Live Birth and Death and the Fetal Death Report. Hyattsville (MD): National Center for Health Statistics; 2005. Available at http://www.cdc.gov/nchs/vital_certs_rev.htm [Accessed October 2007].
75. O’Malley C, Hu KU, West DW. North American Association of Central Cancer Registries: Race and Ethnicity Identifier Assessment Project. Springfield (IL): North American Association of Central Cancer Registries; 2001. Available at http://www.naaccr.org/filesystem/pdf/FinalReportofJune82001meeting.pdf [Accessed October 2007].
76. Rosenberg HM, Maurer JD, Sorlie PD, Johnson NJ, MacDorman MF, Hoyert DL, Spitler JF, Scott C. Quality of death rates by race and Hispanic origin: a summary of current research, 1999. Vital and Health Statistics, Series 2 1999;(128):1-13.
77. National Center for Health Statistics. Vital Statistics of the United States: Mortality 1999. The Technical Appendix. Hyattsville (MD): National Center for Health Statistics; 2004. Available at http://www.cdc.gov/nchs/data/statab/techap99.pdf [Accessed October 2007].
78. Hogan H. The 1990 post-enumeration survey: operations and results. Journal of the American Statistical Association 1993;88(423):1047-1060.
79. U.S. Cancer Statistics Working Group. United States Cancer Statistics: 2000 Incidence. Atlanta (GA): U.S. Department of Health and Human Services, Centers for Disease Control and Prevention and National Cancer Institute; 2003.
80. U.S. Bureau of the Census. Statistical Abstract of the United States: 2007. Washington (DC): U.S. Bureau of the Census; 2007. Available at http://www.census.
gov/prod/2006pubs/07statab/pop.pdf [Accessed October 2007].
81. U.S. Bureau of the Census. The Native Hawaiian and Other Pacific Islander Population. Census 2000 Brief. Washington (DC): U.S. Bureau of the Census; 2001. Available at http://www.census.gov/prod/2001pubs/c2kbr01-14.pdf [Accessed October 2007].
82. U.S. Bureau of the Census. The Asian Population. Census 2000 Brief. Washington (DC): U.S. Bureau of the Census; 2002. Available at http://www.census.gov/prod/2002pubs/c2kbr01-16.pdf [Accessed October 2007].
83. Srinivasan S, Guillermo T. Toward improved health: disaggregating Asian American and Native Hawaiian/Pacific Islander data. American Journal of Public Health 2000;90(11):1731-1734.
84. Poe GS, Powell-Griner E, McLaughlin JK, Placek PJ, Thompson GB, Robinson K. Comparability of the death certificate and the 1986 National Mortality Followback Survey. Vital and Health Statistics, Series 2 1993(118):1-53.
85. Sorlie PD, Rogot E, Johnson NJ. Validity of demographic characteristics on the death certificate. Epidemiology 1992;3(2):181-184.
86. Clegg LX, Reichman ME, Hankey BF, Miller BA, Lin YD, Johnson NJ, Schwartz SM, Bernstein L, Chen VW, Goodman MT, Gomez SL, Graff JJ, Lynch CF, Lin CC, Edwards BK. Quality of race, Hispanic ethnicity, and immigrant status in population-based cancer registry data: implications for health disparity studies. Cancer Causes and Control 2007;18(2):177-187.
87. U.S. Bureau of the Census. Overview of Race and Hispanic Origin. Census 2000 Brief. Washington (DC): U.S. Bureau of the Census; 2001. Available at http://www.census.gov/prod/2001pubs/c2kbr01-1.pdf [Accessed October 2007].
88. U.S. Bureau of the Census. The Hispanic Population. Census 2000 Brief. Washington (DC): U.S. Bureau of the Census; 2001. Available at http://www.census.gov/prod/2001pubs/c2kbr01-3.pdf [Accessed October 2007].
89. U.S. Bureau of the Census. Hispanics and Asian Americans Increasing Faster Than Overall Population. Washington (DC): U.S. Bureau of the Census; 2005. Available at http://www.census.gov/Press-Release/

United States Cancer Statistics: 2004 Incidence and Mortality
��
www/releases/archives/race/001839.html [Accessed October 2007].
90. NAACCR Latino Research Work Group. NAACCR Guideline for Enhancing Hispanic/Latino Identification: Revised NAACCR Hispanic/Latino Identification Algorithm [NHIA v2]. Springfield (IL): North American Association of Central Cancer Registries; 2005. Available at http://www.naaccr.org/filesystem/pdf/NHIA%20v2%2009-21-05.pdf [Accessed October 2007].
91. NAACCR Expert Panel in Hispanic Identification. Report of the NAACCR Expert Panel on Hispanic Identification. Springfield (IL): North American Association of Central Cancer Registries; 2003. Available at http://www.naaccr.org/filesystem/pdf/Hispanic%20Identification%20Report%202003rev%2010-07-03.pdf [Accessed October 2007].
92. U.S. Department of the Interior. Bureau of Indian Affairs. Washington (DC): U.S. Department of the Interior; 2005. Available at http://www.doi.gov/bureau-indian-affairs.html [Accessed October 2007].
93. Sugarman JR, Holliday M, Ross A, Castorina J, Hui Y. Improving American Indian cancer data in the Washington State Cancer Registry using linkages with the Indian Health Service and tribal records. Cancer 1996;78(7 Suppl):1564-1568.
94. Frost F, Taylor V, Fries E. Racial misclassification of Native Americans in a Surveillance, Epidemiology, and End Results cancer registry. Journal of the National Cancer Institute 1992;84(12):957-962.
95. Kwong SL, Perkins CL, Snipes KP, Wright WF. Improving American Indian cancer data in the California Cancer Registry by linkage with the Indian Health Service. Journal of Registry Management 1998;25(1):17-20.

Cancer Incidence and Mortality for All Ages:
All Areas Combined
Table 1.1.1.1M
Consecutive numbering based on table seriesIn the series, the second digit indicates all cancer sites for all ages.
Specific types or categorization of rates
M = malesF = femalesIf no M or F, then table presents both sexes.
1 = incidence rate2 = death rate
1 = U.S. ratesOrganized by cancer site


Cancer Incidence and M
ortality for All A
ges: All A
reas Com
bined��
Figure 1: State and Metropolitan-AreaCancer Registries, by Affiliation in Federal
Cancer Surveillance Programs
National Program of Cancer Registries (NPCR)
Surveillance, Epidemiology, & End Results (SEER) Program
NPCR/SEER

United
States Cancer Statistics: 2004 Incid
ence and M
ortality
��
continued
Table 1.1.1.1M: Age-Adjusted Invasive Cancer Incidence Rates∗ and 95% Confidence Intervals, by Primary Site and Race andEthnicity, United States†‡
Males, 2004
Asian/Pacific American Indian/
Primary Site All Races White Black Islander§ Alaska Native§ Hispanic§
All Sites 537.6 (536.3-538.8) 527.2 (525.8-528.5) 607.3 (602.5-612.0) 325.8 (320.3-331.5) 288.6 (276.6-300.8) 415.5 (411.1-420.0)
All Sites (excl. newly classified as malignant)¶ 530.1 (528.8-531.3) 519.6 (518.2-520.9) 602.0 (597.3-606.8) 320.7 (315.1-326.2) 285.5 (273.6-297.7) 410.1 (405.7-414.5)
Oral Cavity and Pharynx 15.7 ( 15.5- 15.9) 15.5 ( 15.3- 15.7) 17.6 ( 16.9- 18.4) 9.5 ( 8.7- 10.4) 9.2 ( 7.3- 11.5) 10.4 ( 9.8- 11.1)
Lip 1.2 ( 1.1- 1.2) 1.3 ( 1.2- 1.3) 0.1 ( 0.1- 0.2) ∼ ∼ 0.5 ( 0.3- 0.6)
Tongue 4.2 ( 4.1- 4.3) 4.3 ( 4.2- 4.4) 3.8 ( 3.5- 4.2) 1.7 ( 1.3- 2.1) ∼ 2.5 ( 2.2- 2.8)
Salivary Gland 1.5 ( 1.5- 1.6) 1.6 ( 1.5- 1.6) 1.1 ( 0.9- 1.3) 0.9 ( 0.7- 1.3) ∼ 1.0 ( 0.8- 1.2)
Floor of Mouth 1.0 ( 0.9- 1.0) 1.0 ( 0.9- 1.0) 1.3 ( 1.1- 1.5) 0.3 ( 0.2- 0.5) ∼ 0.8 ( 0.6- 1.0)
Gum and Other Mouth 1.9 ( 1.8- 2.0) 1.8 ( 1.8- 1.9) 2.4 ( 2.1- 2.7) 1.1 ( 0.8- 1.4) ∼ 1.5 ( 1.2- 1.7)
Nasopharynx 0.8 ( 0.7- 0.8) 0.6 ( 0.5- 0.6) 1.3 ( 1.1- 1.5) 3.6 ( 3.2- 4.2) ∼ 0.5 ( 0.4- 0.7)
Tonsil 2.7 ( 2.6- 2.8) 2.7 ( 2.6- 2.8) 3.1 ( 2.8- 3.4) 0.9 ( 0.6- 1.2) 1.5 ( 0.9- 2.4) 1.8 ( 1.5- 2.1)
Oropharynx 0.7 ( 0.7- 0.8) 0.7 ( 0.6- 0.7) 1.4 ( 1.2- 1.7) ∼ ∼ 0.6 ( 0.4- 0.8)
Hypopharynx 1.3 ( 1.3- 1.4) 1.2 ( 1.1- 1.3) 2.5 ( 2.2- 2.8) 0.8 ( 0.5- 1.1) ∼ 1.0 ( 0.8- 1.3)
Other Oral Cavity and Pharynx 0.4 ( 0.4- 0.4) 0.4 ( 0.4- 0.4) 0.7 ( 0.6- 0.9) ∼ ∼ 0.3 ( 0.2- 0.4)
Digestive System 105.3 (104.7-105.9) 101.6 (101.0-102.2) 131.2 (128.9-133.4) 100.3 ( 97.2-103.4) 68.9 ( 63.1- 74.9) 104.3 (102.1-106.6)
Esophagus 8.7 ( 8.5- 8.9) 8.6 ( 8.4- 8.8) 10.2 ( 9.6- 10.9) 4.9 ( 4.2- 5.6) 3.9 ( 2.7- 5.4) 5.7 ( 5.1- 6.2)
Stomach 9.7 ( 9.6- 9.9) 8.7 ( 8.5- 8.9) 16.1 ( 15.3- 16.9) 17.5 ( 16.2- 18.9) 9.5 ( 7.5- 12.0) 14.5 ( 13.6- 15.3)
Small Intestine 2.2 ( 2.1- 2.3) 2.1 ( 2.0- 2.2) 3.3 ( 3.0- 3.7) 1.2 ( 0.9- 1.6) ∼ 1.5 ( 1.3- 1.8)
Colon and Rectum 58.2 ( 57.8- 58.6) 57.0 ( 56.6- 57.5) 67.6 ( 66.0- 69.3) 42.0 ( 40.0- 44.0) 32.6 ( 28.5- 36.9) 50.3 ( 48.7- 51.9)
Colon excluding Rectum 41.1 ( 40.7- 41.4) 40.0 ( 39.7- 40.4) 50.9 ( 49.5- 52.4) 27.4 ( 25.8- 29.1) 22.2 ( 18.8- 25.9) 34.1 ( 32.8- 35.4)
Rectum and Rectosigmoid Junction 17.1 ( 16.9- 17.4) 17.0 ( 16.8- 17.2) 16.7 ( 15.9- 17.5) 14.5 ( 13.4- 15.7) 10.4 ( 8.3- 12.8) 16.2 ( 15.4- 17.1)
Anus, Anal Canal and Anorectum 1.3 ( 1.2- 1.3) 1.2 ( 1.1- 1.3) 1.7 ( 1.5- 2.0) 0.5 ( 0.3- 0.7) ∼ 0.8 ( 0.6- 1.0)
Liver and Intrahepatic Bile Duct 8.7 ( 8.6- 8.9) 7.7 ( 7.5- 7.9) 12.5 ( 11.9- 13.1) 20.9 ( 19.5- 22.3) 9.6 ( 7.6- 11.8) 15.5 ( 14.7- 16.4)
Gallbladder 0.8 ( 0.7- 0.8) 0.7 ( 0.7- 0.8) 1.1 ( 0.9- 1.3) 1.0 ( 0.7- 1.4) 2.0 ( 1.1- 3.2) 1.2 ( 1.0- 1.5)
Other Biliary 2.1 ( 2.0- 2.1) 2.0 ( 2.0- 2.1) 1.8 ( 1.5- 2.1) 2.4 ( 1.9- 2.9) ∼ 2.3 ( 1.9- 2.6)
Pancreas 12.8 ( 12.6- 13.0) 12.5 ( 12.3- 12.7) 15.8 ( 15.0- 16.6) 9.4 ( 8.4- 10.4) 7.7 ( 5.9- 9.9) 11.3 ( 10.6- 12.1)
Retroperitoneum 0.4 ( 0.4- 0.4) 0.4 ( 0.4- 0.4) 0.4 ( 0.3- 0.5) ∼ ∼ 0.5 ( 0.4- 0.7)
Peritoneum, Omentum and Mesentery 0.1 ( 0.1- 0.1) 0.1 ( 0.1- 0.1) ∼ ∼ ∼ ∼Other Digestive Organs 0.4 ( 0.3- 0.4) 0.4 ( 0.3- 0.4) 0.5 ( 0.4- 0.7) ∼ ∼ 0.6 ( 0.4- 0.8)
Respiratory System 93.7 ( 93.1- 94.2) 92.4 ( 91.8- 93.0) 117.6 (115.5-119.7) 53.3 ( 51.0- 55.6) 54.9 ( 49.7- 60.6) 55.4 ( 53.7- 57.1)
Nose, Nasal Cavity and Middle Ear 0.9 ( 0.8- 0.9) 0.8 ( 0.8- 0.9) 0.9 ( 0.8- 1.2) 0.8 ( 0.6- 1.1) ∼ 0.9 ( 0.7- 1.1)
Larynx 7.2 ( 7.0- 7.3) 6.8 ( 6.7- 7.0) 11.8 ( 11.2- 12.5) 2.4 ( 2.0- 3.0) 2.6 ( 1.6- 3.9) 5.7 ( 5.2- 6.2)
Lung and Bronchus 85.3 ( 84.8- 85.8) 84.4 ( 83.9- 85.0) 104.5 (102.5-106.5) 49.7 ( 47.5- 52.0) 51.1 ( 46.0- 56.5) 48.5 ( 46.9- 50.1)
Pleura 0.1 ( 0.0- 0.1) 0.1 ( 0.0- 0.1) ∼ ∼ ∼ ∼Trachea, Mediastinum and Other Respiratory Organs 0.3 ( 0.2- 0.3) 0.3 ( 0.2- 0.3) 0.3 ( 0.2- 0.4) 0.3 ( 0.2- 0.5) ∼ 0.3 ( 0.2- 0.4)
Bones and Joints 1.0 ( 0.9- 1.1) 1.0 ( 1.0- 1.1) 0.9 ( 0.7- 1.0) 0.6 ( 0.4- 0.9) ∼ 0.8 ( 0.7- 1.0)
Soft Tissue including Heart 3.6 ( 3.5- 3.7) 3.6 ( 3.5- 3.7) 3.3 ( 3.0- 3.6) 2.9 ( 2.4- 3.4) 1.2 ( 0.7- 2.0) 3.3 ( 3.0- 3.7)
Skin excluding Basal and Squamous 23.4 ( 23.1- 23.6) 25.4 ( 25.1- 25.7) 2.0 ( 1.7- 2.3) 2.3 ( 1.9- 2.8) 4.4 ( 3.1- 6.1) 5.2 ( 4.7- 5.7)
Melanomas of the Skin 21.5 ( 21.3- 21.8) 23.5 ( 23.2- 23.7) 1.2 ( 1.0- 1.4) 1.6 ( 1.2- 2.0) 3.8 ( 2.6- 5.4) 4.3 ( 3.9- 4.8)
Other Non-Epithelial Skin 1.9 ( 1.8- 1.9) 1.9 ( 1.8- 2.0) 0.8 ( 0.7- 1.0) 0.7 ( 0.5- 1.0) ∼ 0.8 ( 0.6- 1.0)
Breast 1.4 ( 1.3- 1.5) 1.4 ( 1.3- 1.4) 1.8 ( 1.6- 2.1) 0.5 ( 0.3- 0.8) ∼ 0.9 ( 0.7- 1.1)
Male Genital System 151.6 (150.9-152.2) 141.5 (140.8-142.2) 219.7 (216.9-222.6) 82.0 ( 79.2- 84.9) 79.8 ( 73.5- 86.5) 126.9 (124.5-129.4)
Prostate 145.3 (144.6-145.9) 134.5 (133.8-135.2) 217.5 (214.6-220.3) 79.8 ( 77.0- 82.7) 76.6 ( 70.4- 83.2) 121.9 (119.5-124.4)
Testis 5.3 ( 5.2- 5.4) 6.0 ( 5.9- 6.2) 1.1 ( 1.0- 1.3) 1.6 ( 1.3- 1.9) 2.5 ( 1.8- 3.4) 3.7 ( 3.4- 3.9)
Penis 0.8 ( 0.7- 0.8) 0.8 ( 0.7- 0.8) 1.0 ( 0.8- 1.2) 0.4 ( 0.2- 0.7) ∼ 1.2 ( 1.0- 1.4)

Cancer Incidence and M
ortality for All A
ges: All A
reas Com
bined��
Table 1.1.1.1M: Age-Adjusted Invasive Cancer Incidence Rates∗ and 95% Confidence Intervals, by Primary Site and Race andEthnicity, United States†‡ (continued)
Males, 2004
Asian/Pacific American Indian/
Primary Site All Races White Black Islander§ Alaska Native§ Hispanic§
Other Male Genital Organs 0.2 ( 0.2- 0.2) 0.2 ( 0.2- 0.2) 0.1 ( 0.1- 0.2) ∼ ∼ 0.1 ( 0.1- 0.2)
Urinary System 57.7 ( 57.2- 58.1) 59.7 ( 59.3- 60.2) 39.0 ( 37.8- 40.3) 24.2 ( 22.7- 25.8) 27.1 ( 23.6- 31.0) 38.9 ( 37.6- 40.3)
Urinary Bladder∗∗ 37.3 ( 37.0- 37.7) 39.3 ( 38.9- 39.6) 18.4 ( 17.5- 19.3) 14.4 ( 13.2- 15.7) 10.6 ( 8.3- 13.3) 20.6 ( 19.5- 21.7)
Kidney and Renal Pelvis 19.1 ( 18.9- 19.4) 19.2 ( 19.0- 19.5) 19.9 ( 19.1- 20.8) 8.8 ( 7.9- 9.7) 16.3 ( 13.7- 19.2) 17.7 ( 16.8- 18.6)
Ureter 0.8 ( 0.8- 0.9) 0.9 ( 0.8- 0.9) 0.3 ( 0.2- 0.5) 0.7 ( 0.5- 1.0) ∼ 0.4 ( 0.3- 0.6)
Other Urinary Organs 0.4 ( 0.3- 0.4) 0.4 ( 0.3- 0.4) 0.4 ( 0.3- 0.5) ∼ ∼ 0.3 ( 0.2- 0.4)
Eye and Orbit 0.9 ( 0.9- 1.0) 1.0 ( 1.0- 1.1) 0.3 ( 0.2- 0.4) 0.3 ( 0.2- 0.5) ∼ 0.6 ( 0.5- 0.8)
Brain and Other Nervous System 7.8 ( 7.6- 7.9) 8.3 ( 8.1- 8.4) 4.5 ( 4.1- 4.8) 3.6 ( 3.1- 4.2) 2.7 ( 1.8- 3.7) 6.1 ( 5.6- 6.6)
Brain 7.3 ( 7.2- 7.5) 7.8 ( 7.7- 8.0) 4.0 ( 3.7- 4.4) 3.3 ( 2.8- 3.9) 2.5 ( 1.7- 3.5) 5.7 ( 5.3- 6.2)
Cranial Nerves and Other Nervous System 0.4 ( 0.4- 0.5) 0.4 ( 0.4- 0.5) 0.4 ( 0.3- 0.6) 0.3 ( 0.2- 0.5) ∼ 0.4 ( 0.3- 0.5)
Endocrine System 5.4 ( 5.3- 5.5) 5.6 ( 5.5- 5.8) 3.3 ( 2.9- 3.6) 5.1 ( 4.5- 5.7) 2.0 ( 1.2- 3.1) 4.2 ( 3.8- 4.6)
Thyroid 4.6 ( 4.5- 4.7) 4.8 ( 4.7- 5.0) 2.4 ( 2.1- 2.7) 4.3 ( 3.7- 4.9) 2.0 ( 1.2- 3.1) 3.5 ( 3.2- 3.9)
Other Endocrine including Thymus 0.8 ( 0.7- 0.8) 0.8 ( 0.7- 0.8) 0.9 ( 0.7- 1.1) 0.8 ( 0.6- 1.1) ∼ 0.7 ( 0.5- 0.8)
Lymphomas 25.7 ( 25.4- 25.9) 26.2 ( 25.9- 26.5) 19.4 ( 18.6- 20.2) 15.5 ( 14.4- 16.8) 10.8 ( 8.7- 13.3) 22.6 ( 21.6- 23.6)
Hodgkin Lymphoma 3.0 ( 3.0- 3.1) 3.1 ( 3.0- 3.2) 2.9 ( 2.6- 3.2) 1.3 ( 1.0- 1.6) 1.5 ( 0.8- 2.5) 2.8 ( 2.5- 3.1)
Non-Hodgkin Lymphoma 22.6 ( 22.4- 22.9) 23.1 ( 22.8- 23.3) 16.5 ( 15.7- 17.2) 14.2 ( 13.1- 15.4) 9.4 ( 7.3- 11.7) 19.8 ( 18.9- 20.8)
Myeloma 6.8 ( 6.6- 6.9) 6.2 ( 6.0- 6.3) 13.1 ( 12.4- 13.8) 3.7 ( 3.1- 4.3) 4.9 ( 3.4- 6.7) 6.4 ( 5.9- 7.0)
Leukemias 15.2 ( 15.0- 15.4) 15.4 ( 15.2- 15.6) 11.8 ( 11.1- 12.5) 9.0 ( 8.1- 10.0) 9.5 ( 7.5- 11.8) 10.8 ( 10.2- 11.5)
Acute Lymphocytic 1.7 ( 1.6- 1.8) 1.8 ( 1.7- 1.9) 1.1 ( 0.9- 1.3) 1.4 ( 1.1- 1.8) 1.5 ( 0.9- 2.3) 2.3 ( 2.1- 2.5)
Chronic Lymphocytic 5.1 ( 5.0- 5.3) 5.1 ( 5.0- 5.3) 3.7 ( 3.3- 4.1) 1.3 ( 1.0- 1.8) 2.0 ( 1.1- 3.3) 2.2 ( 1.8- 2.5)
Acute Myeloid 4.4 ( 4.2- 4.5) 4.4 ( 4.3- 4.6) 3.5 ( 3.2- 3.9) 3.6 ( 3.0- 4.2) 3.0 ( 2.0- 4.5) 3.4 ( 3.0- 3.8)
Chronic Myeloid 1.8 ( 1.7- 1.9) 1.8 ( 1.7- 1.9) 1.6 ( 1.4- 1.9) 1.3 ( 1.0- 1.7) ∼ 1.5 ( 1.2- 1.7)
Other Leukemias 2.2 ( 2.1- 2.3) 2.2 ( 2.1- 2.3) 1.9 ( 1.6- 2.2) 1.3 ( 1.0- 1.7) 2.1 ( 1.2- 3.4) 1.6 ( 1.3- 1.8)
Mesothelioma 2.0 ( 1.9- 2.0) 2.1 ( 2.0- 2.2) 1.1 ( 0.9- 1.3) 0.6 ( 0.4- 0.9) ∼ 1.4 ( 1.1- 1.7)
Kaposi Sarcoma 0.8 ( 0.8- 0.9) 0.7 ( 0.6- 0.7) 1.6 ( 1.4- 1.9) 0.3 ( 0.2- 0.5) ∼ 1.6 ( 1.4- 1.9)
Miscellaneous 19.7 ( 19.5- 20.0) 19.7 ( 19.4- 20.0) 19.3 ( 18.4- 20.2) 12.1 ( 11.0- 13.3) 10.9 ( 8.7- 13.4) 15.7 ( 14.8- 16.6)
∗ Rates are per 100,000 persons and are age-adjusted to the 2000 U.S. standard population (19 age groups - Census P25-1130).† Data are from all state and metropolitan area cancer registries, except Maryland. Included data cover approximately 98% of the population and met data quality criteria for
all invasive cancer sites combined. See Appendix B for registry-specific data quality information.‡ Excludes basal and squamous cell carcinomas of the skin except when these occur on the skin of the genital organs, and in situ cancers except urinary bladder.
§ Data for specified racial or ethnic populations other than white and black should be interpreted with caution. See Technical Notes.
Hispanic origin is not mutually exclusive from race categories (white, black, Asian/Pacific Islander, American Indian/Alaska Native).
¶ Excludes some endometrial cancers; papillary ependymomas and papillary meningiomas; chronic myeloproliferative diseases; and myelodysplastic syndromes. These cancers are
newly classified and reported as malignant cancers according to ICD-O-3, beginning with 2001 diagnoses. See Technical Notes.∗∗ Includes invasive and in situ.
∼ Rates are suppressed if fewer than 16 cases were reported in a specific category (site, race, ethnicity).

United
States Cancer Statistics: 2004 Incid
ence and M
ortality
��
continued
Table 1.1.1.1F: Age-Adjusted Invasive Cancer Incidence Rates∗ and 95% Confidence Intervals, by Primary Site and Race andEthnicity, United States†‡
Females, 2004
Asian/Pacific American Indian/
Primary Site All Races White Black Islander§ Alaska Native§ Hispanic§
All Sites 403.1 (402.1-404.1) 405.9 (404.9-407.0) 379.7 (376.6-382.7) 267.4 (263.2-271.7) 242.2 (232.9-251.8) 318.6 (315.4-321.8)
All Sites (excl. newly classified as malignant)¶ 398.4 (397.4-399.4) 401.2 (400.2-402.3) 376.1 (373.1-379.1) 264.0 (259.8-268.2) 239.3 (230.1-248.8) 314.5 (311.3-317.7)
Oral Cavity and Pharynx 5.9 ( 5.7- 6.0) 5.8 ( 5.7- 5.9) 5.3 ( 4.9- 5.6) 5.0 ( 4.4- 5.6) 3.6 ( 2.6- 4.9) 3.7 ( 3.4- 4.1)
Lip 0.3 ( 0.3- 0.3) 0.3 ( 0.3- 0.3) ∼ ∼ ∼ 0.1 ( 0.1- 0.2)
Tongue 1.6 ( 1.5- 1.6) 1.6 ( 1.5- 1.7) 1.1 ( 0.9- 1.2) 1.4 ( 1.1- 1.7) ∼ 1.1 ( 0.9- 1.3)
Salivary Gland 0.9 ( 0.9- 1.0) 0.9 ( 0.9- 1.0) 0.9 ( 0.8- 1.0) 0.7 ( 0.5- 1.0) ∼ 0.8 ( 0.7- 1.0)
Floor of Mouth 0.4 ( 0.3- 0.4) 0.4 ( 0.3- 0.4) 0.3 ( 0.3- 0.4) ∼ ∼ 0.2 ( 0.1- 0.3)
Gum and Other Mouth 1.2 ( 1.1- 1.2) 1.2 ( 1.1- 1.2) 1.1 ( 1.0- 1.3) 0.9 ( 0.6- 1.2) ∼ 0.7 ( 0.5- 0.8)
Nasopharynx 0.3 ( 0.3- 0.3) 0.2 ( 0.2- 0.3) 0.4 ( 0.3- 0.5) 1.3 ( 1.1- 1.6) ∼ 0.2 ( 0.1- 0.3)
Tonsil 0.6 ( 0.6- 0.6) 0.6 ( 0.6- 0.6) 0.6 ( 0.5- 0.7) ∼ ∼ 0.4 ( 0.3- 0.5)
Oropharynx 0.2 ( 0.2- 0.2) 0.2 ( 0.2- 0.2) 0.3 ( 0.2- 0.3) ∼ ∼ ∼Hypopharynx 0.3 ( 0.3- 0.3) 0.3 ( 0.3- 0.3) 0.4 ( 0.3- 0.5) ∼ ∼ ∼Other Oral Cavity and Pharynx 0.1 ( 0.1- 0.1) 0.1 ( 0.1- 0.1) 0.2 ( 0.1- 0.2) ∼ ∼ ∼
Digestive System 69.9 ( 69.5- 70.3) 67.3 ( 66.9- 67.7) 86.7 ( 85.2- 88.1) 63.4 ( 61.2- 65.5) 52.9 ( 48.5- 57.6) 68.2 ( 66.7- 69.8)
Esophagus 2.0 ( 1.9- 2.1) 1.9 ( 1.8- 2.0) 3.1 ( 2.9- 3.4) 1.3 ( 1.0- 1.6) ∼ 1.4 ( 1.2- 1.7)
Stomach 4.7 ( 4.6- 4.8) 4.1 ( 4.0- 4.2) 7.8 ( 7.4- 8.3) 9.3 ( 8.4- 10.1) 4.1 ( 3.0- 5.5) 8.6 ( 8.0- 9.2)
Small Intestine 1.6 ( 1.5- 1.7) 1.5 ( 1.5- 1.6) 2.4 ( 2.2- 2.6) 0.8 ( 0.6- 1.0) ∼ 1.3 ( 1.1- 1.6)
Colon and Rectum 42.7 ( 42.4- 43.1) 41.6 ( 41.3- 41.9) 50.6 ( 49.5- 51.7) 32.1 ( 30.6- 33.7) 28.7 ( 25.5- 32.2) 34.2 ( 33.1- 35.3)
Colon excluding Rectum 32.3 ( 32.0- 32.6) 31.3 ( 31.0- 31.6) 40.0 ( 39.0- 41.0) 23.1 ( 21.8- 24.4) 21.0 ( 18.3- 24.1) 25.2 ( 24.3- 26.2)
Rectum and Rectosigmoid Junction 10.4 ( 10.3- 10.6) 10.3 ( 10.1- 10.4) 10.6 ( 10.1- 11.1) 9.0 ( 8.3- 9.9) 7.7 ( 6.1- 9.5) 9.0 ( 8.4- 9.5)
Anus, Anal Canal and Anorectum 1.7 ( 1.7- 1.8) 1.8 ( 1.7- 1.9) 1.6 ( 1.4- 1.8) 0.4 ( 0.2- 0.5) ∼ 1.6 ( 1.3- 1.8)
Liver and Intrahepatic Bile Duct 3.0 ( 2.9- 3.1) 2.6 ( 2.6- 2.7) 3.8 ( 3.5- 4.1) 7.5 ( 6.8- 8.3) 5.5 ( 4.1- 7.2) 6.0 ( 5.5- 6.5)
Gallbladder 1.3 ( 1.3- 1.4) 1.3 ( 1.2- 1.3) 1.9 ( 1.7- 2.1) 1.4 ( 1.1- 1.7) 1.9 ( 1.1- 2.9) 2.6 ( 2.3- 2.9)
Other Biliary 1.3 ( 1.2- 1.4) 1.3 ( 1.2- 1.3) 1.2 ( 1.0- 1.3) 2.0 ( 1.6- 2.4) ∼ 1.7 ( 1.4- 1.9)
Pancreas 9.7 ( 9.6- 9.9) 9.4 ( 9.3- 9.6) 12.9 ( 12.3- 13.4) 7.6 ( 6.9- 8.4) 7.8 ( 6.1- 9.8) 9.4 ( 8.8- 10.0)
Retroperitoneum 0.3 ( 0.3- 0.4) 0.3 ( 0.3- 0.4) 0.4 ( 0.3- 0.5) 0.3 ( 0.2- 0.5) ∼ 0.5 ( 0.4- 0.6)
Peritoneum, Omentum and Mesentery 1.0 ( 1.0- 1.1) 1.1 ( 1.1- 1.2) 0.6 ( 0.5- 0.7) 0.4 ( 0.3- 0.6) ∼ 0.7 ( 0.5- 0.9)
Other Digestive Organs 0.3 ( 0.3- 0.4) 0.3 ( 0.3- 0.3) 0.4 ( 0.3- 0.5) 0.3 ( 0.2- 0.5) ∼ 0.4 ( 0.3- 0.5)
Respiratory System 56.4 ( 56.0- 56.8) 57.6 ( 57.2- 58.0) 53.1 ( 51.9- 54.2) 27.8 ( 26.4- 29.3) 36.5 ( 32.8- 40.4) 28.1 ( 27.1- 29.1)
Nose, Nasal Cavity and Middle Ear 0.5 ( 0.5- 0.5) 0.5 ( 0.5- 0.5) 0.4 ( 0.3- 0.5) 0.4 ( 0.2- 0.6) ∼ 0.4 ( 0.3- 0.6)
Larynx 1.5 ( 1.5- 1.6) 1.5 ( 1.5- 1.6) 2.0 ( 1.8- 2.3) 0.4 ( 0.3- 0.6) ∼ 0.9 ( 0.7- 1.0)
Lung and Bronchus 54.2 ( 53.8- 54.6) 55.5 ( 55.1- 55.8) 50.4 ( 49.3- 51.6) 26.9 ( 25.5- 28.4) 35.3 ( 31.7- 39.2) 26.7 ( 25.7- 27.7)
Pleura 0.0 ( 0.0- 0.0) 0.0 ( 0.0- 0.0) ∼ ∼ ∼ ∼Trachea, Mediastinum and Other Respiratory Organs 0.1 ( 0.1- 0.1) 0.1 ( 0.1- 0.1) 0.1 ( 0.1- 0.2) ∼ ∼ 0.1 ( 0.1- 0.2)
Bones and Joints 0.8 ( 0.8- 0.9) 0.8 ( 0.8- 0.9) 0.8 ( 0.6- 0.9) 0.5 ( 0.3- 0.7) ∼ 1.0 ( 0.9- 1.2)
Soft Tissue including Heart 2.6 ( 2.6- 2.7) 2.6 ( 2.5- 2.6) 3.2 ( 3.0- 3.5) 2.0 ( 1.7- 2.4) 1.5 ( 0.9- 2.4) 2.6 ( 2.3- 2.8)
Skin excluding Basal and Squamous 15.2 ( 15.0- 15.4) 16.7 ( 16.5- 17.0) 1.9 ( 1.7- 2.1) 2.0 ( 1.6- 2.3) 3.6 ( 2.6- 4.9) 5.0 ( 4.6- 5.4)
Melanomas of the Skin 14.0 ( 13.8- 14.2) 15.6 ( 15.4- 15.9) 1.0 ( 0.8- 1.2) 1.4 ( 1.1- 1.7) 3.0 ( 2.1- 4.2) 4.1 ( 3.8- 4.5)
Other Non-Epithelial Skin 1.1 ( 1.1- 1.2) 1.1 ( 1.0- 1.2) 0.9 ( 0.7- 1.0) 0.6 ( 0.4- 0.8) ∼ 0.8 ( 0.7- 1.0)
Breast 117.7 (117.2-118.2) 118.6 (118.0-119.2) 110.3 (108.7-112.0) 79.7 ( 77.5- 81.9) 59.5 ( 55.1- 64.2) 86.2 ( 84.6- 87.9)
Female Genital System 47.1 ( 46.8- 47.5) 47.5 ( 47.1- 47.8) 43.8 ( 42.8- 44.8) 33.5 ( 32.1- 35.0) 27.3 ( 24.4- 30.5) 45.3 ( 44.2- 46.5)
Cervix 7.9 ( 7.8- 8.1) 7.5 ( 7.3- 7.7) 10.8 ( 10.3- 11.3) 7.4 ( 6.7- 8.1) 6.4 ( 5.1- 7.9) 12.2 ( 11.6- 12.8)
Corpus 22.4 ( 22.1- 22.6) 22.7 ( 22.5- 23.0) 19.0 ( 18.3- 19.7) 15.2 ( 14.3- 16.2) 11.8 ( 9.9- 14.0) 18.1 ( 17.3- 18.9)
Uterus, NOS 0.7 ( 0.7- 0.8) 0.6 ( 0.6- 0.7) 1.4 ( 1.2- 1.6) 0.4 ( 0.2- 0.5) ∼ 0.7 ( 0.5- 0.8)
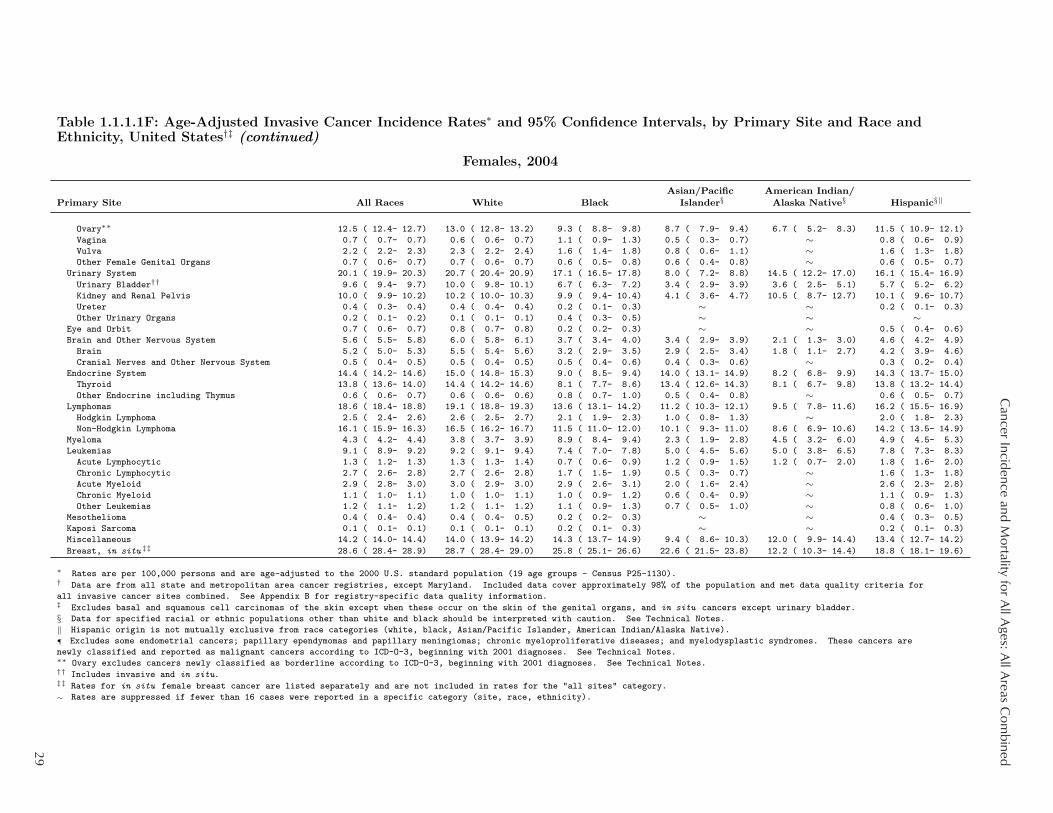
Cancer Incidence and M
ortality for All A
ges: All A
reas Com
bined��
Table 1.1.1.1F: Age-Adjusted Invasive Cancer Incidence Rates∗ and 95% Confidence Intervals, by Primary Site and Race andEthnicity, United States†‡ (continued)
Females, 2004
Asian/Pacific American Indian/
Primary Site All Races White Black Islander§ Alaska Native§ Hispanic§
Ovary∗∗ 12.5 ( 12.4- 12.7) 13.0 ( 12.8- 13.2) 9.3 ( 8.8- 9.8) 8.7 ( 7.9- 9.4) 6.7 ( 5.2- 8.3) 11.5 ( 10.9- 12.1)
Vagina 0.7 ( 0.7- 0.7) 0.6 ( 0.6- 0.7) 1.1 ( 0.9- 1.3) 0.5 ( 0.3- 0.7) ∼ 0.8 ( 0.6- 0.9)
Vulva 2.2 ( 2.2- 2.3) 2.3 ( 2.2- 2.4) 1.6 ( 1.4- 1.8) 0.8 ( 0.6- 1.1) ∼ 1.6 ( 1.3- 1.8)
Other Female Genital Organs 0.7 ( 0.6- 0.7) 0.7 ( 0.6- 0.7) 0.6 ( 0.5- 0.8) 0.6 ( 0.4- 0.8) ∼ 0.6 ( 0.5- 0.7)
Urinary System 20.1 ( 19.9- 20.3) 20.7 ( 20.4- 20.9) 17.1 ( 16.5- 17.8) 8.0 ( 7.2- 8.8) 14.5 ( 12.2- 17.0) 16.1 ( 15.4- 16.9)
Urinary Bladder†† 9.6 ( 9.4- 9.7) 10.0 ( 9.8- 10.1) 6.7 ( 6.3- 7.2) 3.4 ( 2.9- 3.9) 3.6 ( 2.5- 5.1) 5.7 ( 5.2- 6.2)
Kidney and Renal Pelvis 10.0 ( 9.9- 10.2) 10.2 ( 10.0- 10.3) 9.9 ( 9.4- 10.4) 4.1 ( 3.6- 4.7) 10.5 ( 8.7- 12.7) 10.1 ( 9.6- 10.7)
Ureter 0.4 ( 0.3- 0.4) 0.4 ( 0.4- 0.4) 0.2 ( 0.1- 0.3) ∼ ∼ 0.2 ( 0.1- 0.3)
Other Urinary Organs 0.2 ( 0.1- 0.2) 0.1 ( 0.1- 0.1) 0.4 ( 0.3- 0.5) ∼ ∼ ∼Eye and Orbit 0.7 ( 0.6- 0.7) 0.8 ( 0.7- 0.8) 0.2 ( 0.2- 0.3) ∼ ∼ 0.5 ( 0.4- 0.6)
Brain and Other Nervous System 5.6 ( 5.5- 5.8) 6.0 ( 5.8- 6.1) 3.7 ( 3.4- 4.0) 3.4 ( 2.9- 3.9) 2.1 ( 1.3- 3.0) 4.6 ( 4.2- 4.9)
Brain 5.2 ( 5.0- 5.3) 5.5 ( 5.4- 5.6) 3.2 ( 2.9- 3.5) 2.9 ( 2.5- 3.4) 1.8 ( 1.1- 2.7) 4.2 ( 3.9- 4.6)
Cranial Nerves and Other Nervous System 0.5 ( 0.4- 0.5) 0.5 ( 0.4- 0.5) 0.5 ( 0.4- 0.6) 0.4 ( 0.3- 0.6) ∼ 0.3 ( 0.2- 0.4)
Endocrine System 14.4 ( 14.2- 14.6) 15.0 ( 14.8- 15.3) 9.0 ( 8.5- 9.4) 14.0 ( 13.1- 14.9) 8.2 ( 6.8- 9.9) 14.3 ( 13.7- 15.0)
Thyroid 13.8 ( 13.6- 14.0) 14.4 ( 14.2- 14.6) 8.1 ( 7.7- 8.6) 13.4 ( 12.6- 14.3) 8.1 ( 6.7- 9.8) 13.8 ( 13.2- 14.4)
Other Endocrine including Thymus 0.6 ( 0.6- 0.7) 0.6 ( 0.6- 0.6) 0.8 ( 0.7- 1.0) 0.5 ( 0.4- 0.8) ∼ 0.6 ( 0.5- 0.7)
Lymphomas 18.6 ( 18.4- 18.8) 19.1 ( 18.8- 19.3) 13.6 ( 13.1- 14.2) 11.2 ( 10.3- 12.1) 9.5 ( 7.8- 11.6) 16.2 ( 15.5- 16.9)
Hodgkin Lymphoma 2.5 ( 2.4- 2.6) 2.6 ( 2.5- 2.7) 2.1 ( 1.9- 2.3) 1.0 ( 0.8- 1.3) ∼ 2.0 ( 1.8- 2.3)
Non-Hodgkin Lymphoma 16.1 ( 15.9- 16.3) 16.5 ( 16.2- 16.7) 11.5 ( 11.0- 12.0) 10.1 ( 9.3- 11.0) 8.6 ( 6.9- 10.6) 14.2 ( 13.5- 14.9)
Myeloma 4.3 ( 4.2- 4.4) 3.8 ( 3.7- 3.9) 8.9 ( 8.4- 9.4) 2.3 ( 1.9- 2.8) 4.5 ( 3.2- 6.0) 4.9 ( 4.5- 5.3)
Leukemias 9.1 ( 8.9- 9.2) 9.2 ( 9.1- 9.4) 7.4 ( 7.0- 7.8) 5.0 ( 4.5- 5.6) 5.0 ( 3.8- 6.5) 7.8 ( 7.3- 8.3)
Acute Lymphocytic 1.3 ( 1.2- 1.3) 1.3 ( 1.3- 1.4) 0.7 ( 0.6- 0.9) 1.2 ( 0.9- 1.5) 1.2 ( 0.7- 2.0) 1.8 ( 1.6- 2.0)
Chronic Lymphocytic 2.7 ( 2.6- 2.8) 2.7 ( 2.6- 2.8) 1.7 ( 1.5- 1.9) 0.5 ( 0.3- 0.7) ∼ 1.6 ( 1.3- 1.8)
Acute Myeloid 2.9 ( 2.8- 3.0) 3.0 ( 2.9- 3.0) 2.9 ( 2.6- 3.1) 2.0 ( 1.6- 2.4) ∼ 2.6 ( 2.3- 2.8)
Chronic Myeloid 1.1 ( 1.0- 1.1) 1.0 ( 1.0- 1.1) 1.0 ( 0.9- 1.2) 0.6 ( 0.4- 0.9) ∼ 1.1 ( 0.9- 1.3)
Other Leukemias 1.2 ( 1.1- 1.2) 1.2 ( 1.1- 1.2) 1.1 ( 0.9- 1.3) 0.7 ( 0.5- 1.0) ∼ 0.8 ( 0.6- 1.0)
Mesothelioma 0.4 ( 0.4- 0.4) 0.4 ( 0.4- 0.5) 0.2 ( 0.2- 0.3) ∼ ∼ 0.4 ( 0.3- 0.5)
Kaposi Sarcoma 0.1 ( 0.1- 0.1) 0.1 ( 0.1- 0.1) 0.2 ( 0.1- 0.3) ∼ ∼ 0.2 ( 0.1- 0.3)
Miscellaneous 14.2 ( 14.0- 14.4) 14.0 ( 13.9- 14.2) 14.3 ( 13.7- 14.9) 9.4 ( 8.6- 10.3) 12.0 ( 9.9- 14.4) 13.4 ( 12.7- 14.2)
Breast, in situ ‡‡ 28.6 ( 28.4- 28.9) 28.7 ( 28.4- 29.0) 25.8 ( 25.1- 26.6) 22.6 ( 21.5- 23.8) 12.2 ( 10.3- 14.4) 18.8 ( 18.1- 19.6)
∗ Rates are per 100,000 persons and are age-adjusted to the 2000 U.S. standard population (19 age groups - Census P25-1130).† Data are from all state and metropolitan area cancer registries, except Maryland. Included data cover approximately 98% of the population and met data quality criteria for
all invasive cancer sites combined. See Appendix B for registry-specific data quality information.‡ Excludes basal and squamous cell carcinomas of the skin except when these occur on the skin of the genital organs, and in situ cancers except urinary bladder.
§ Data for specified racial or ethnic populations other than white and black should be interpreted with caution. See Technical Notes.
Hispanic origin is not mutually exclusive from race categories (white, black, Asian/Pacific Islander, American Indian/Alaska Native).
¶ Excludes some endometrial cancers; papillary ependymomas and papillary meningiomas; chronic myeloproliferative diseases; and myelodysplastic syndromes. These cancers are
newly classified and reported as malignant cancers according to ICD-O-3, beginning with 2001 diagnoses. See Technical Notes.∗∗ Ovary excludes cancers newly classified as borderline according to ICD-O-3, beginning with 2001 diagnoses. See Technical Notes.†† Includes invasive and in situ.‡‡ Rates for in situ female breast cancer are listed separately and are not included in rates for the "all sites" category.
∼ Rates are suppressed if fewer than 16 cases were reported in a specific category (site, race, ethnicity).
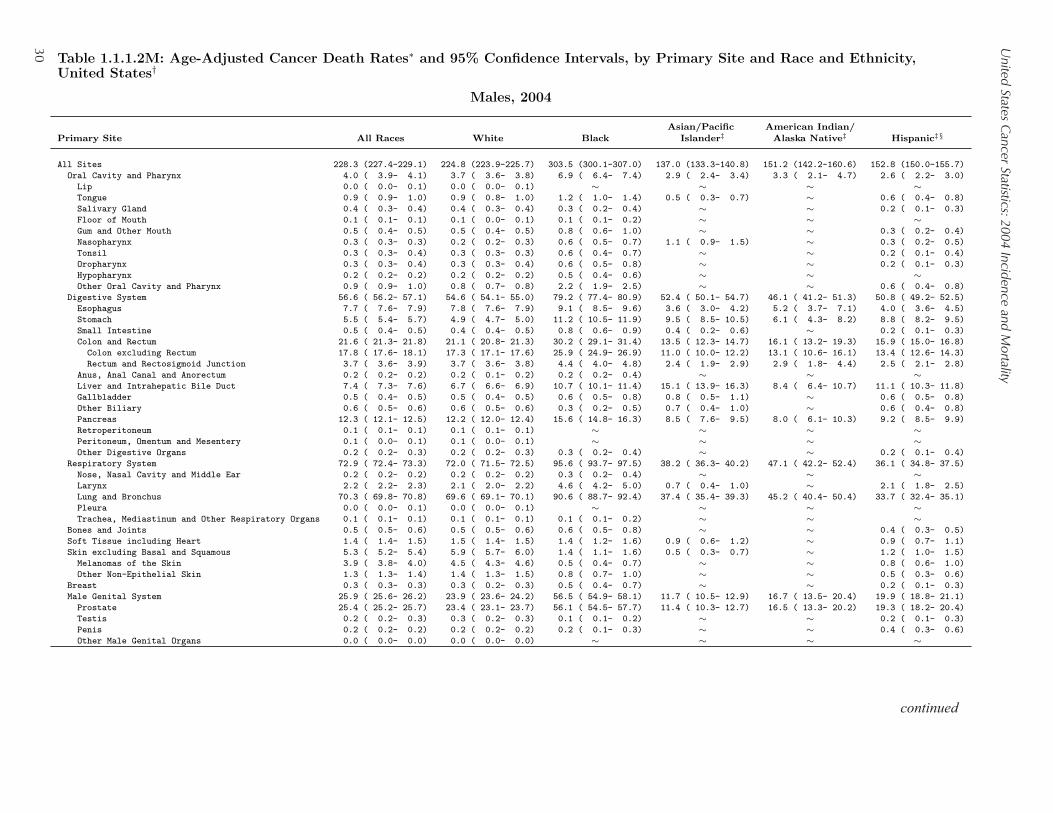
United
States Cancer Statistics: 2004 Incid
ence and M
ortality
30
continued
Table 1.1.1.2M: Age-Adjusted Cancer Death Rates∗ and 95% Confidence Intervals, by Primary Site and Race and Ethnicity,United States†
Males, 2004
Asian/Pacific American Indian/Primary Site All Races White Black Islander‡ Alaska Native‡ Hispanic‡§
All Sites 228.3 (227.4-229.1) 224.8 (223.9-225.7) 303.5 (300.1-307.0) 137.0 (133.3-140.8) 151.2 (142.2-160.6) 152.8 (150.0-155.7)
Oral Cavity and Pharynx 4.0 ( 3.9- 4.1) 3.7 ( 3.6- 3.8) 6.9 ( 6.4- 7.4) 2.9 ( 2.4- 3.4) 3.3 ( 2.1- 4.7) 2.6 ( 2.2- 3.0)
Lip 0.0 ( 0.0- 0.1) 0.0 ( 0.0- 0.1) ∼ ∼ ∼ ∼Tongue 0.9 ( 0.9- 1.0) 0.9 ( 0.8- 1.0) 1.2 ( 1.0- 1.4) 0.5 ( 0.3- 0.7) ∼ 0.6 ( 0.4- 0.8)
Salivary Gland 0.4 ( 0.3- 0.4) 0.4 ( 0.3- 0.4) 0.3 ( 0.2- 0.4) ∼ ∼ 0.2 ( 0.1- 0.3)
Floor of Mouth 0.1 ( 0.1- 0.1) 0.1 ( 0.0- 0.1) 0.1 ( 0.1- 0.2) ∼ ∼ ∼Gum and Other Mouth 0.5 ( 0.4- 0.5) 0.5 ( 0.4- 0.5) 0.8 ( 0.6- 1.0) ∼ ∼ 0.3 ( 0.2- 0.4)
Nasopharynx 0.3 ( 0.3- 0.3) 0.2 ( 0.2- 0.3) 0.6 ( 0.5- 0.7) 1.1 ( 0.9- 1.5) ∼ 0.3 ( 0.2- 0.5)
Tonsil 0.3 ( 0.3- 0.4) 0.3 ( 0.3- 0.3) 0.6 ( 0.4- 0.7) ∼ ∼ 0.2 ( 0.1- 0.4)
Oropharynx 0.3 ( 0.3- 0.4) 0.3 ( 0.3- 0.4) 0.6 ( 0.5- 0.8) ∼ ∼ 0.2 ( 0.1- 0.3)
Hypopharynx 0.2 ( 0.2- 0.2) 0.2 ( 0.2- 0.2) 0.5 ( 0.4- 0.6) ∼ ∼ ∼Other Oral Cavity and Pharynx 0.9 ( 0.9- 1.0) 0.8 ( 0.7- 0.8) 2.2 ( 1.9- 2.5) ∼ ∼ 0.6 ( 0.4- 0.8)
Digestive System 56.6 ( 56.2- 57.1) 54.6 ( 54.1- 55.0) 79.2 ( 77.4- 80.9) 52.4 ( 50.1- 54.7) 46.1 ( 41.2- 51.3) 50.8 ( 49.2- 52.5)
Esophagus 7.7 ( 7.6- 7.9) 7.8 ( 7.6- 7.9) 9.1 ( 8.5- 9.6) 3.6 ( 3.0- 4.2) 5.2 ( 3.7- 7.1) 4.0 ( 3.6- 4.5)
Stomach 5.5 ( 5.4- 5.7) 4.9 ( 4.7- 5.0) 11.2 ( 10.5- 11.9) 9.5 ( 8.5- 10.5) 6.1 ( 4.3- 8.2) 8.8 ( 8.2- 9.5)
Small Intestine 0.5 ( 0.4- 0.5) 0.4 ( 0.4- 0.5) 0.8 ( 0.6- 0.9) 0.4 ( 0.2- 0.6) ∼ 0.2 ( 0.1- 0.3)
Colon and Rectum 21.6 ( 21.3- 21.8) 21.1 ( 20.8- 21.3) 30.2 ( 29.1- 31.4) 13.5 ( 12.3- 14.7) 16.1 ( 13.2- 19.3) 15.9 ( 15.0- 16.8)
Colon excluding Rectum 17.8 ( 17.6- 18.1) 17.3 ( 17.1- 17.6) 25.9 ( 24.9- 26.9) 11.0 ( 10.0- 12.2) 13.1 ( 10.6- 16.1) 13.4 ( 12.6- 14.3)
Rectum and Rectosigmoid Junction 3.7 ( 3.6- 3.9) 3.7 ( 3.6- 3.8) 4.4 ( 4.0- 4.8) 2.4 ( 1.9- 2.9) 2.9 ( 1.8- 4.4) 2.5 ( 2.1- 2.8)
Anus, Anal Canal and Anorectum 0.2 ( 0.2- 0.2) 0.2 ( 0.1- 0.2) 0.2 ( 0.2- 0.4) ∼ ∼ ∼Liver and Intrahepatic Bile Duct 7.4 ( 7.3- 7.6) 6.7 ( 6.6- 6.9) 10.7 ( 10.1- 11.4) 15.1 ( 13.9- 16.3) 8.4 ( 6.4- 10.7) 11.1 ( 10.3- 11.8)
Gallbladder 0.5 ( 0.4- 0.5) 0.5 ( 0.4- 0.5) 0.6 ( 0.5- 0.8) 0.8 ( 0.5- 1.1) ∼ 0.6 ( 0.5- 0.8)
Other Biliary 0.6 ( 0.5- 0.6) 0.6 ( 0.5- 0.6) 0.3 ( 0.2- 0.5) 0.7 ( 0.4- 1.0) ∼ 0.6 ( 0.4- 0.8)
Pancreas 12.3 ( 12.1- 12.5) 12.2 ( 12.0- 12.4) 15.6 ( 14.8- 16.3) 8.5 ( 7.6- 9.5) 8.0 ( 6.1- 10.3) 9.2 ( 8.5- 9.9)
Retroperitoneum 0.1 ( 0.1- 0.1) 0.1 ( 0.1- 0.1) ∼ ∼ ∼ ∼Peritoneum, Omentum and Mesentery 0.1 ( 0.0- 0.1) 0.1 ( 0.0- 0.1) ∼ ∼ ∼ ∼Other Digestive Organs 0.2 ( 0.2- 0.3) 0.2 ( 0.2- 0.3) 0.3 ( 0.2- 0.4) ∼ ∼ 0.2 ( 0.1- 0.4)
Respiratory System 72.9 ( 72.4- 73.3) 72.0 ( 71.5- 72.5) 95.6 ( 93.7- 97.5) 38.2 ( 36.3- 40.2) 47.1 ( 42.2- 52.4) 36.1 ( 34.8- 37.5)
Nose, Nasal Cavity and Middle Ear 0.2 ( 0.2- 0.2) 0.2 ( 0.2- 0.2) 0.3 ( 0.2- 0.4) ∼ ∼ ∼Larynx 2.2 ( 2.2- 2.3) 2.1 ( 2.0- 2.2) 4.6 ( 4.2- 5.0) 0.7 ( 0.4- 1.0) ∼ 2.1 ( 1.8- 2.5)
Lung and Bronchus 70.3 ( 69.8- 70.8) 69.6 ( 69.1- 70.1) 90.6 ( 88.7- 92.4) 37.4 ( 35.4- 39.3) 45.2 ( 40.4- 50.4) 33.7 ( 32.4- 35.1)
Pleura 0.0 ( 0.0- 0.1) 0.0 ( 0.0- 0.1) ∼ ∼ ∼ ∼Trachea, Mediastinum and Other Respiratory Organs 0.1 ( 0.1- 0.1) 0.1 ( 0.1- 0.1) 0.1 ( 0.1- 0.2) ∼ ∼ ∼
Bones and Joints 0.5 ( 0.5- 0.6) 0.5 ( 0.5- 0.6) 0.6 ( 0.5- 0.8) ∼ ∼ 0.4 ( 0.3- 0.5)
Soft Tissue including Heart 1.4 ( 1.4- 1.5) 1.5 ( 1.4- 1.5) 1.4 ( 1.2- 1.6) 0.9 ( 0.6- 1.2) ∼ 0.9 ( 0.7- 1.1)
Skin excluding Basal and Squamous 5.3 ( 5.2- 5.4) 5.9 ( 5.7- 6.0) 1.4 ( 1.1- 1.6) 0.5 ( 0.3- 0.7) ∼ 1.2 ( 1.0- 1.5)
Melanomas of the Skin 3.9 ( 3.8- 4.0) 4.5 ( 4.3- 4.6) 0.5 ( 0.4- 0.7) ∼ ∼ 0.8 ( 0.6- 1.0)
Other Non-Epithelial Skin 1.3 ( 1.3- 1.4) 1.4 ( 1.3- 1.5) 0.8 ( 0.7- 1.0) ∼ ∼ 0.5 ( 0.3- 0.6)
Breast 0.3 ( 0.3- 0.3) 0.3 ( 0.2- 0.3) 0.5 ( 0.4- 0.7) ∼ ∼ 0.2 ( 0.1- 0.3)
Male Genital System 25.9 ( 25.6- 26.2) 23.9 ( 23.6- 24.2) 56.5 ( 54.9- 58.1) 11.7 ( 10.5- 12.9) 16.7 ( 13.5- 20.4) 19.9 ( 18.8- 21.1)
Prostate 25.4 ( 25.2- 25.7) 23.4 ( 23.1- 23.7) 56.1 ( 54.5- 57.7) 11.4 ( 10.3- 12.7) 16.5 ( 13.3- 20.2) 19.3 ( 18.2- 20.4)
Testis 0.2 ( 0.2- 0.3) 0.3 ( 0.2- 0.3) 0.1 ( 0.1- 0.2) ∼ ∼ 0.2 ( 0.1- 0.3)
Penis 0.2 ( 0.2- 0.2) 0.2 ( 0.2- 0.2) 0.2 ( 0.1- 0.3) ∼ ∼ 0.4 ( 0.3- 0.6)
Other Male Genital Organs 0.0 ( 0.0- 0.0) 0.0 ( 0.0- 0.0) ∼ ∼ ∼ ∼

Cancer Incidence and M
ortality for All A
ges: All A
reas Com
bined3�
Table 1.1.1.2M: Age-Adjusted Cancer Death Rates∗ and 95% Confidence Intervals, by Primary Site and Race and Ethnicity,United States† (continued)
Males, 2004
Asian/Pacific American Indian/Primary Site All Races White Black Islander‡ Alaska Native‡ Hispanic‡§
Urinary System 13.8 ( 13.5- 14.0) 14.3 ( 14.1- 14.5) 11.0 ( 10.3- 11.7) 4.8 ( 4.1- 5.6) 8.8 ( 6.8- 11.2) 9.1 ( 8.4- 9.8)
Urinary Bladder 7.6 ( 7.4- 7.7) 8.0 ( 7.8- 8.2) 5.0 ( 4.5- 5.5) 2.7 ( 2.2- 3.3) ∼ 3.5 ( 3.0- 4.0)
Kidney and Renal Pelvis 5.9 ( 5.8- 6.0) 6.1 ( 5.9- 6.2) 5.8 ( 5.4- 6.3) 2.0 ( 1.6- 2.5) 6.8 ( 5.1- 8.9) 5.6 ( 5.0- 6.1)
Ureter 0.1 ( 0.1- 0.2) 0.2 ( 0.1- 0.2) ∼ ∼ ∼ ∼Other Urinary Organs 0.1 ( 0.1- 0.1) 0.1 ( 0.1- 0.1) ∼ ∼ ∼ ∼
Eye and Orbit 0.1 ( 0.1- 0.1) 0.1 ( 0.1- 0.1) ∼ ∼ ∼ ∼Brain and Other Nervous System 5.2 ( 5.1- 5.3) 5.6 ( 5.4- 5.7) 3.0 ( 2.7- 3.3) 2.5 ( 2.1- 3.0) 2.0 ( 1.2- 3.1) 3.1 ( 2.7- 3.5)
Endocrine System 0.8 ( 0.7- 0.8) 0.8 ( 0.7- 0.9) 0.6 ( 0.5- 0.8) 0.9 ( 0.6- 1.2) ∼ 0.7 ( 0.5- 0.9)
Thyroid 0.5 ( 0.4- 0.5) 0.5 ( 0.4- 0.5) 0.4 ( 0.3- 0.5) 0.5 ( 0.3- 0.8) ∼ 0.5 ( 0.4- 0.7)
Other Endocrine including Thymus 0.3 ( 0.3- 0.3) 0.3 ( 0.3- 0.4) 0.3 ( 0.2- 0.4) 0.4 ( 0.2- 0.6) ∼ 0.2 ( 0.1- 0.3)
Lymphoma 9.4 ( 9.2- 9.6) 9.8 ( 9.6- 9.9) 6.7 ( 6.2- 7.2) 5.8 ( 5.1- 6.6) 4.9 ( 3.4- 6.7) 7.0 ( 6.4- 7.6)
Hodgkin Lymphoma 0.5 ( 0.5- 0.6) 0.6 ( 0.5- 0.6) 0.5 ( 0.4- 0.6) ∼ ∼ 0.5 ( 0.4- 0.7)
Non-Hodgkin Lymphoma 8.8 ( 8.7- 9.0) 9.2 ( 9.0- 9.4) 6.2 ( 5.7- 6.7) 5.6 ( 4.9- 6.4) 4.6 ( 3.2- 6.4) 6.5 ( 5.9- 7.0)
Myeloma 4.4 ( 4.3- 4.5) 4.1 ( 4.0- 4.3) 8.2 ( 7.6- 8.8) 2.0 ( 1.6- 2.5) 3.5 ( 2.2- 5.1) 3.3 ( 2.9- 3.8)
Leukemias 9.7 ( 9.5- 9.9) 9.9 ( 9.7- 10.1) 8.8 ( 8.2- 9.4) 5.4 ( 4.7- 6.2) 4.7 ( 3.3- 6.5) 6.0 ( 5.5- 6.5)
Acute Lymphocytic 0.5 ( 0.5- 0.6) 0.6 ( 0.5- 0.6) 0.4 ( 0.3- 0.6) 0.4 ( 0.3- 0.6) ∼ 0.8 ( 0.7- 1.0)
Chronic Lymphocytic 2.1 ( 2.0- 2.2) 2.2 ( 2.1- 2.3) 2.3 ( 2.0- 2.6) 0.4 ( 0.2- 0.7) ∼ 0.6 ( 0.4- 0.8)
Acute Myeloid 3.6 ( 3.5- 3.7) 3.7 ( 3.6- 3.8) 2.8 ( 2.5- 3.1) 2.6 ( 2.1- 3.1) ∼ 2.2 ( 1.9- 2.5)
Chronic Myeloid 0.5 ( 0.5- 0.6) 0.5 ( 0.5- 0.6) 0.5 ( 0.4- 0.7) 0.3 ( 0.2- 0.5) ∼ 0.4 ( 0.3- 0.6)
Other Leukemias 3.0 ( 2.9- 3.1) 3.0 ( 2.9- 3.1) 2.8 ( 2.4- 3.1) 1.7 ( 1.3- 2.2) ∼ 2.0 ( 1.7- 2.3)
Mesothelioma 1.6 ( 1.6- 1.7) 1.8 ( 1.7- 1.8) 0.7 ( 0.6- 0.9) ∼ ∼ 0.8 ( 0.6- 1.0)
Miscellaneous 16.3 ( 16.1- 16.6) 16.0 ( 15.8- 16.3) 22.3 ( 21.4- 23.3) 8.5 ( 7.6- 9.4) 10.6 ( 8.3- 13.2) 10.6 ( 9.9- 11.4)
∗ Rates are per 100,000 persons and are age-adjusted to the 2000 U.S. standard population (19 age groups - Census P25-1130).† Data are from the National Vital Statistics System (NVSS).‡ Data for specified racial or ethnic populations other than white and black should be interpreted with caution. See Technical Notes.
§ Hispanic origin is not mutually exclusive from race categories (white, black, Asian/Pacific Islander, American Indian/Alaska Native).
∼ Rates are suppressed if fewer than 16 cases were reported in a specific category (site, race, ethnicity).
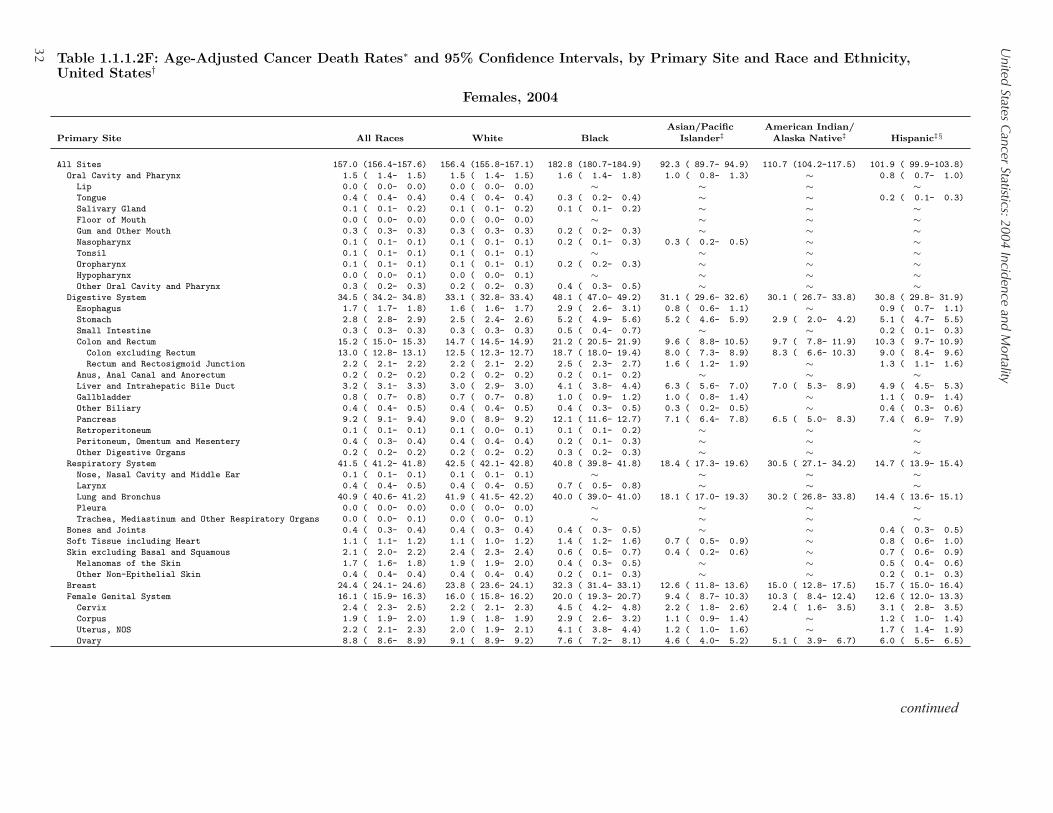
United
States Cancer Statistics: 2004 Incid
ence and M
ortality
3�
continued
Table 1.1.1.2F: Age-Adjusted Cancer Death Rates∗ and 95% Confidence Intervals, by Primary Site and Race and Ethnicity,United States†
Females, 2004
Asian/Pacific American Indian/Primary Site All Races White Black Islander‡ Alaska Native‡ Hispanic‡§
All Sites 157.0 (156.4-157.6) 156.4 (155.8-157.1) 182.8 (180.7-184.9) 92.3 ( 89.7- 94.9) 110.7 (104.2-117.5) 101.9 ( 99.9-103.8)
Oral Cavity and Pharynx 1.5 ( 1.4- 1.5) 1.5 ( 1.4- 1.5) 1.6 ( 1.4- 1.8) 1.0 ( 0.8- 1.3) ∼ 0.8 ( 0.7- 1.0)
Lip 0.0 ( 0.0- 0.0) 0.0 ( 0.0- 0.0) ∼ ∼ ∼ ∼Tongue 0.4 ( 0.4- 0.4) 0.4 ( 0.4- 0.4) 0.3 ( 0.2- 0.4) ∼ ∼ 0.2 ( 0.1- 0.3)
Salivary Gland 0.1 ( 0.1- 0.2) 0.1 ( 0.1- 0.2) 0.1 ( 0.1- 0.2) ∼ ∼ ∼Floor of Mouth 0.0 ( 0.0- 0.0) 0.0 ( 0.0- 0.0) ∼ ∼ ∼ ∼Gum and Other Mouth 0.3 ( 0.3- 0.3) 0.3 ( 0.3- 0.3) 0.2 ( 0.2- 0.3) ∼ ∼ ∼Nasopharynx 0.1 ( 0.1- 0.1) 0.1 ( 0.1- 0.1) 0.2 ( 0.1- 0.3) 0.3 ( 0.2- 0.5) ∼ ∼Tonsil 0.1 ( 0.1- 0.1) 0.1 ( 0.1- 0.1) ∼ ∼ ∼ ∼Oropharynx 0.1 ( 0.1- 0.1) 0.1 ( 0.1- 0.1) 0.2 ( 0.2- 0.3) ∼ ∼ ∼Hypopharynx 0.0 ( 0.0- 0.1) 0.0 ( 0.0- 0.1) ∼ ∼ ∼ ∼Other Oral Cavity and Pharynx 0.3 ( 0.2- 0.3) 0.2 ( 0.2- 0.3) 0.4 ( 0.3- 0.5) ∼ ∼ ∼
Digestive System 34.5 ( 34.2- 34.8) 33.1 ( 32.8- 33.4) 48.1 ( 47.0- 49.2) 31.1 ( 29.6- 32.6) 30.1 ( 26.7- 33.8) 30.8 ( 29.8- 31.9)
Esophagus 1.7 ( 1.7- 1.8) 1.6 ( 1.6- 1.7) 2.9 ( 2.6- 3.1) 0.8 ( 0.6- 1.1) ∼ 0.9 ( 0.7- 1.1)
Stomach 2.8 ( 2.8- 2.9) 2.5 ( 2.4- 2.6) 5.2 ( 4.9- 5.6) 5.2 ( 4.6- 5.9) 2.9 ( 2.0- 4.2) 5.1 ( 4.7- 5.5)
Small Intestine 0.3 ( 0.3- 0.3) 0.3 ( 0.3- 0.3) 0.5 ( 0.4- 0.7) ∼ ∼ 0.2 ( 0.1- 0.3)
Colon and Rectum 15.2 ( 15.0- 15.3) 14.7 ( 14.5- 14.9) 21.2 ( 20.5- 21.9) 9.6 ( 8.8- 10.5) 9.7 ( 7.8- 11.9) 10.3 ( 9.7- 10.9)
Colon excluding Rectum 13.0 ( 12.8- 13.1) 12.5 ( 12.3- 12.7) 18.7 ( 18.0- 19.4) 8.0 ( 7.3- 8.9) 8.3 ( 6.6- 10.3) 9.0 ( 8.4- 9.6)
Rectum and Rectosigmoid Junction 2.2 ( 2.1- 2.2) 2.2 ( 2.1- 2.2) 2.5 ( 2.3- 2.7) 1.6 ( 1.2- 1.9) ∼ 1.3 ( 1.1- 1.6)
Anus, Anal Canal and Anorectum 0.2 ( 0.2- 0.2) 0.2 ( 0.2- 0.2) 0.2 ( 0.1- 0.2) ∼ ∼ ∼Liver and Intrahepatic Bile Duct 3.2 ( 3.1- 3.3) 3.0 ( 2.9- 3.0) 4.1 ( 3.8- 4.4) 6.3 ( 5.6- 7.0) 7.0 ( 5.3- 8.9) 4.9 ( 4.5- 5.3)
Gallbladder 0.8 ( 0.7- 0.8) 0.7 ( 0.7- 0.8) 1.0 ( 0.9- 1.2) 1.0 ( 0.8- 1.4) ∼ 1.1 ( 0.9- 1.4)
Other Biliary 0.4 ( 0.4- 0.5) 0.4 ( 0.4- 0.5) 0.4 ( 0.3- 0.5) 0.3 ( 0.2- 0.5) ∼ 0.4 ( 0.3- 0.6)
Pancreas 9.2 ( 9.1- 9.4) 9.0 ( 8.9- 9.2) 12.1 ( 11.6- 12.7) 7.1 ( 6.4- 7.8) 6.5 ( 5.0- 8.3) 7.4 ( 6.9- 7.9)
Retroperitoneum 0.1 ( 0.1- 0.1) 0.1 ( 0.0- 0.1) 0.1 ( 0.1- 0.2) ∼ ∼ ∼Peritoneum, Omentum and Mesentery 0.4 ( 0.3- 0.4) 0.4 ( 0.4- 0.4) 0.2 ( 0.1- 0.3) ∼ ∼ ∼Other Digestive Organs 0.2 ( 0.2- 0.2) 0.2 ( 0.2- 0.2) 0.3 ( 0.2- 0.3) ∼ ∼ ∼
Respiratory System 41.5 ( 41.2- 41.8) 42.5 ( 42.1- 42.8) 40.8 ( 39.8- 41.8) 18.4 ( 17.3- 19.6) 30.5 ( 27.1- 34.2) 14.7 ( 13.9- 15.4)
Nose, Nasal Cavity and Middle Ear 0.1 ( 0.1- 0.1) 0.1 ( 0.1- 0.1) ∼ ∼ ∼ ∼Larynx 0.4 ( 0.4- 0.5) 0.4 ( 0.4- 0.5) 0.7 ( 0.5- 0.8) ∼ ∼ ∼Lung and Bronchus 40.9 ( 40.6- 41.2) 41.9 ( 41.5- 42.2) 40.0 ( 39.0- 41.0) 18.1 ( 17.0- 19.3) 30.2 ( 26.8- 33.8) 14.4 ( 13.6- 15.1)
Pleura 0.0 ( 0.0- 0.0) 0.0 ( 0.0- 0.0) ∼ ∼ ∼ ∼Trachea, Mediastinum and Other Respiratory Organs 0.0 ( 0.0- 0.1) 0.0 ( 0.0- 0.1) ∼ ∼ ∼ ∼
Bones and Joints 0.4 ( 0.3- 0.4) 0.4 ( 0.3- 0.4) 0.4 ( 0.3- 0.5) ∼ ∼ 0.4 ( 0.3- 0.5)
Soft Tissue including Heart 1.1 ( 1.1- 1.2) 1.1 ( 1.0- 1.2) 1.4 ( 1.2- 1.6) 0.7 ( 0.5- 0.9) ∼ 0.8 ( 0.6- 1.0)
Skin excluding Basal and Squamous 2.1 ( 2.0- 2.2) 2.4 ( 2.3- 2.4) 0.6 ( 0.5- 0.7) 0.4 ( 0.2- 0.6) ∼ 0.7 ( 0.6- 0.9)
Melanomas of the Skin 1.7 ( 1.6- 1.8) 1.9 ( 1.9- 2.0) 0.4 ( 0.3- 0.5) ∼ ∼ 0.5 ( 0.4- 0.6)
Other Non-Epithelial Skin 0.4 ( 0.4- 0.4) 0.4 ( 0.4- 0.4) 0.2 ( 0.1- 0.3) ∼ ∼ 0.2 ( 0.1- 0.3)
Breast 24.4 ( 24.1- 24.6) 23.8 ( 23.6- 24.1) 32.3 ( 31.4- 33.1) 12.6 ( 11.8- 13.6) 15.0 ( 12.8- 17.5) 15.7 ( 15.0- 16.4)
Female Genital System 16.1 ( 15.9- 16.3) 16.0 ( 15.8- 16.2) 20.0 ( 19.3- 20.7) 9.4 ( 8.7- 10.3) 10.3 ( 8.4- 12.4) 12.6 ( 12.0- 13.3)
Cervix 2.4 ( 2.3- 2.5) 2.2 ( 2.1- 2.3) 4.5 ( 4.2- 4.8) 2.2 ( 1.8- 2.6) 2.4 ( 1.6- 3.5) 3.1 ( 2.8- 3.5)
Corpus 1.9 ( 1.9- 2.0) 1.9 ( 1.8- 1.9) 2.9 ( 2.6- 3.2) 1.1 ( 0.9- 1.4) ∼ 1.2 ( 1.0- 1.4)
Uterus, NOS 2.2 ( 2.1- 2.3) 2.0 ( 1.9- 2.1) 4.1 ( 3.8- 4.4) 1.2 ( 1.0- 1.6) ∼ 1.7 ( 1.4- 1.9)
Ovary 8.8 ( 8.6- 8.9) 9.1 ( 8.9- 9.2) 7.6 ( 7.2- 8.1) 4.6 ( 4.0- 5.2) 5.1 ( 3.9- 6.7) 6.0 ( 5.5- 6.5)
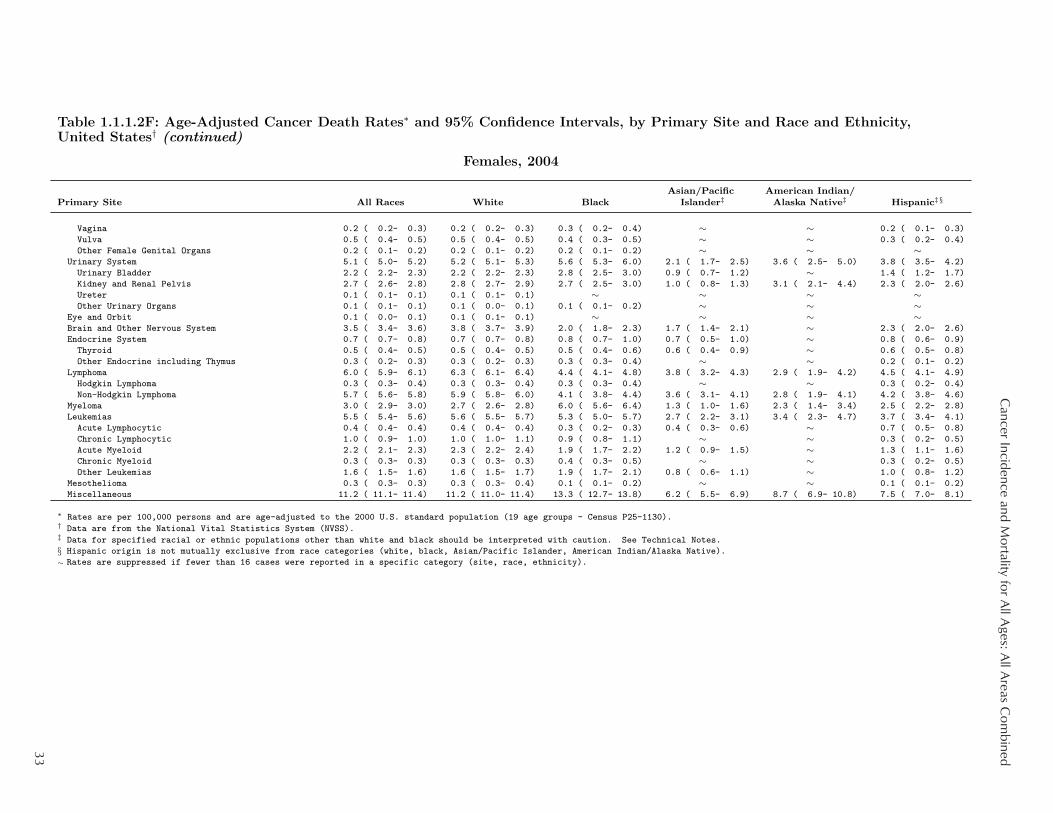
Cancer Incidence and M
ortality for All A
ges: All A
reas Com
bined33
Table 1.1.1.2F: Age-Adjusted Cancer Death Rates∗ and 95% Confidence Intervals, by Primary Site and Race and Ethnicity,United States† (continued)
Females, 2004
Asian/Pacific American Indian/Primary Site All Races White Black Islander‡ Alaska Native‡ Hispanic‡§
Vagina 0.2 ( 0.2- 0.3) 0.2 ( 0.2- 0.3) 0.3 ( 0.2- 0.4) ∼ ∼ 0.2 ( 0.1- 0.3)
Vulva 0.5 ( 0.4- 0.5) 0.5 ( 0.4- 0.5) 0.4 ( 0.3- 0.5) ∼ ∼ 0.3 ( 0.2- 0.4)
Other Female Genital Organs 0.2 ( 0.1- 0.2) 0.2 ( 0.1- 0.2) 0.2 ( 0.1- 0.2) ∼ ∼ ∼Urinary System 5.1 ( 5.0- 5.2) 5.2 ( 5.1- 5.3) 5.6 ( 5.3- 6.0) 2.1 ( 1.7- 2.5) 3.6 ( 2.5- 5.0) 3.8 ( 3.5- 4.2)
Urinary Bladder 2.2 ( 2.2- 2.3) 2.2 ( 2.2- 2.3) 2.8 ( 2.5- 3.0) 0.9 ( 0.7- 1.2) ∼ 1.4 ( 1.2- 1.7)
Kidney and Renal Pelvis 2.7 ( 2.6- 2.8) 2.8 ( 2.7- 2.9) 2.7 ( 2.5- 3.0) 1.0 ( 0.8- 1.3) 3.1 ( 2.1- 4.4) 2.3 ( 2.0- 2.6)
Ureter 0.1 ( 0.1- 0.1) 0.1 ( 0.1- 0.1) ∼ ∼ ∼ ∼Other Urinary Organs 0.1 ( 0.1- 0.1) 0.1 ( 0.0- 0.1) 0.1 ( 0.1- 0.2) ∼ ∼ ∼
Eye and Orbit 0.1 ( 0.0- 0.1) 0.1 ( 0.1- 0.1) ∼ ∼ ∼ ∼Brain and Other Nervous System 3.5 ( 3.4- 3.6) 3.8 ( 3.7- 3.9) 2.0 ( 1.8- 2.3) 1.7 ( 1.4- 2.1) ∼ 2.3 ( 2.0- 2.6)
Endocrine System 0.7 ( 0.7- 0.8) 0.7 ( 0.7- 0.8) 0.8 ( 0.7- 1.0) 0.7 ( 0.5- 1.0) ∼ 0.8 ( 0.6- 0.9)
Thyroid 0.5 ( 0.4- 0.5) 0.5 ( 0.4- 0.5) 0.5 ( 0.4- 0.6) 0.6 ( 0.4- 0.9) ∼ 0.6 ( 0.5- 0.8)
Other Endocrine including Thymus 0.3 ( 0.2- 0.3) 0.3 ( 0.2- 0.3) 0.3 ( 0.3- 0.4) ∼ ∼ 0.2 ( 0.1- 0.2)
Lymphoma 6.0 ( 5.9- 6.1) 6.3 ( 6.1- 6.4) 4.4 ( 4.1- 4.8) 3.8 ( 3.2- 4.3) 2.9 ( 1.9- 4.2) 4.5 ( 4.1- 4.9)
Hodgkin Lymphoma 0.3 ( 0.3- 0.4) 0.3 ( 0.3- 0.4) 0.3 ( 0.3- 0.4) ∼ ∼ 0.3 ( 0.2- 0.4)
Non-Hodgkin Lymphoma 5.7 ( 5.6- 5.8) 5.9 ( 5.8- 6.0) 4.1 ( 3.8- 4.4) 3.6 ( 3.1- 4.1) 2.8 ( 1.9- 4.1) 4.2 ( 3.8- 4.6)
Myeloma 3.0 ( 2.9- 3.0) 2.7 ( 2.6- 2.8) 6.0 ( 5.6- 6.4) 1.3 ( 1.0- 1.6) 2.3 ( 1.4- 3.4) 2.5 ( 2.2- 2.8)
Leukemias 5.5 ( 5.4- 5.6) 5.6 ( 5.5- 5.7) 5.3 ( 5.0- 5.7) 2.7 ( 2.2- 3.1) 3.4 ( 2.3- 4.7) 3.7 ( 3.4- 4.1)
Acute Lymphocytic 0.4 ( 0.4- 0.4) 0.4 ( 0.4- 0.4) 0.3 ( 0.2- 0.3) 0.4 ( 0.3- 0.6) ∼ 0.7 ( 0.5- 0.8)
Chronic Lymphocytic 1.0 ( 0.9- 1.0) 1.0 ( 1.0- 1.1) 0.9 ( 0.8- 1.1) ∼ ∼ 0.3 ( 0.2- 0.5)
Acute Myeloid 2.2 ( 2.1- 2.3) 2.3 ( 2.2- 2.4) 1.9 ( 1.7- 2.2) 1.2 ( 0.9- 1.5) ∼ 1.3 ( 1.1- 1.6)
Chronic Myeloid 0.3 ( 0.3- 0.3) 0.3 ( 0.3- 0.3) 0.4 ( 0.3- 0.5) ∼ ∼ 0.3 ( 0.2- 0.5)
Other Leukemias 1.6 ( 1.5- 1.6) 1.6 ( 1.5- 1.7) 1.9 ( 1.7- 2.1) 0.8 ( 0.6- 1.1) ∼ 1.0 ( 0.8- 1.2)
Mesothelioma 0.3 ( 0.3- 0.3) 0.3 ( 0.3- 0.4) 0.1 ( 0.1- 0.2) ∼ ∼ 0.1 ( 0.1- 0.2)
Miscellaneous 11.2 ( 11.1- 11.4) 11.2 ( 11.0- 11.4) 13.3 ( 12.7- 13.8) 6.2 ( 5.5- 6.9) 8.7 ( 6.9- 10.8) 7.5 ( 7.0- 8.1)
∗ Rates are per 100,000 persons and are age-adjusted to the 2000 U.S. standard population (19 age groups - Census P25-1130).† Data are from the National Vital Statistics System (NVSS).‡ Data for specified racial or ethnic populations other than white and black should be interpreted with caution. See Technical Notes.
§ Hispanic origin is not mutually exclusive from race categories (white, black, Asian/Pacific Islander, American Indian/Alaska Native).
∼ Rates are suppressed if fewer than 16 cases were reported in a specific category (site, race, ethnicity).

United
States Cancer Statistics: 2004 Incid
ence and M
ortality
3�
continued
Table 1.1.2.1M: All Cancer Sites Combined. Invasive Cancer Incidence Rates∗ and 95% Confidence Intervals by Age andRace and Ethnicity, United States†‡
Males, 2004
Asian/Pacific American Indian/
Age at Diagnosis(years) All Races White Black Islander§ Alaska Native§ Hispanic§
<1 25.5 ( 23.3- 27.8) 26.5 ( 24.0- 29.1) 19.2 ( 14.7- 24.6) 17.6 ( 10.4- 27.8) ∼ 24.8 ( 20.5- 29.8)
1-4 22.6 ( 21.6- 23.7) 23.4 ( 22.2- 24.6) 15.2 ( 13.1- 17.5) 18.5 ( 14.5- 23.4) 24.7 ( 15.5- 37.5) 23.2 ( 21.0- 25.6)
5-9 12.3 ( 11.7- 13.1) 12.8 ( 12.0- 13.7) 8.9 ( 7.4- 10.5) 9.7 ( 7.1- 13.0) ∼ 12.4 ( 10.9- 14.1)
10-14 13.3 ( 12.6- 14.0) 13.4 ( 12.6- 14.2) 11.8 ( 10.3- 13.6) 10.3 ( 7.6- 13.7) ∼ 14.0 ( 12.3- 15.7)
15-19 22.0 ( 21.1- 22.9) 23.4 ( 22.3- 24.4) 14.8 ( 13.0- 16.8) 14.2 ( 11.0- 18.1) ∼ 20.8 ( 18.7- 23.1)
20-24 30.9 ( 29.9- 32.0) 33.0 ( 31.8- 34.3) 18.2 ( 16.1- 20.5) 18.2 ( 14.8- 22.3) 13.7 ( 8.4- 21.2) 27.9 ( 25.7- 30.3)
25-29 43.8 ( 42.5- 45.2) 46.4 ( 44.9- 47.9) 29.3 ( 26.4- 32.4) 22.4 ( 18.6- 26.6) 25.6 ( 17.5- 36.2) 30.2 ( 28.0- 32.7)
30-34 62.2 ( 60.7- 63.8) 64.6 ( 62.9- 66.4) 47.2 ( 43.5- 51.1) 33.0 ( 28.7- 37.7) 30.1 ( 21.0- 41.9) 42.6 ( 39.7- 45.5)
35-39 87.4 ( 85.6- 89.2) 89.1 ( 87.1- 91.1) 76.7 ( 72.0- 81.7) 52.5 ( 46.7- 58.8) 44.5 ( 33.0- 58.6) 60.9 ( 57.3- 64.7)
40-44 149.1 ( 146.9- 151.4) 147.1 ( 144.7- 149.6) 157.8 ( 151.1- 164.8) 91.5 ( 83.5- 100.1) 86.6 ( 70.5- 105.2) 99.0 ( 94.0- 104.2)
45-49 280.8 ( 277.7- 284.0) 270.9 ( 267.5- 274.3) 356.2 ( 345.6- 367.1) 160.1 ( 148.8- 172.1) 139.4 ( 117.6- 164.0) 192.7 ( 184.7- 200.9)
50-54 551.5 ( 546.8- 556.3) 528.1 ( 523.0- 533.2) 745.5 ( 728.4- 762.8) 285.8 ( 269.2- 303.0) 300.1 ( 264.4- 339.2) 378.0 ( 365.1- 391.3)
55-59 940.8 ( 934.0- 947.6) 901.4 ( 894.2- 908.6) 1305.5 (1279.3-1332.2) 488.0 ( 463.5- 513.5) 535.9 ( 481.5- 594.7) 657.7 ( 637.7- 678.1)
60-64 1504.3 (1494.4-1514.2) 1454.8 (1444.4-1465.3) 1995.9 (1957.3-2035.0) 766.1 ( 729.8- 803.7) 739.2 ( 662.2- 822.6) 1104.0 (1072.8-1136.0)
65-69 2212.8 (2199.2-2226.5) 2164.1 (2149.6-2178.6) 2652.3 (2601.8-2703.6) 1274.4 (1220.7-1329.8) 1185.9 (1069.7-1311.3) 1755.5 (1710.1-1801.8)
70-74 2708.8 (2692.1-2725.5) 2670.5 (2652.9-2688.2) 2932.4 (2871.1-2994.8) 1651.8 (1580.3-1725.8) 1615.9 (1453.3-1791.8) 2206.1 (2147.2-2266.2)
75-79 3072.9 (3053.3-3092.6) 3029.7 (3009.1-3050.4) 3136.6 (3061.6-3213.0) 2085.2 (1990.2-2183.4) 1632.8 (1435.5-1849.7) 2513.4 (2439.3-2589.2)
80-84 3124.9 (3100.9-3149.0) 3088.3 (3063.3-3113.5) 3022.2 (2929.9-3116.7) 2118.2 (2000.0-2241.6) 1785.3 (1521.0-2082.4) 2571.1 (2475.3-2669.7)
85+ 2872.4 (2845.1-2899.8) 2853.4 (2824.8-2882.1) 2723.3 (2620.3-2829.3) 2081.9 (1941.4-2230.0) 1201.7 ( 949.9-1499.7) 2215.9 (2108.1-2327.9)
∗ Rates are per 100,000 persons.† Data are from all state and metropolitan area cancer registries, except Maryland. Included data cover approximately 98% of the population and met data quality criteria
for all invasive cancer sites combined. See Appendix B for registry-specific data quality information.‡ Excludes basal and squamous cell carcinomas of the skin except when these occur on the skin of the genital organs, and in situ cancers except urinary bladder.
§ Data for specified racial or ethnic populations other than white and black should be interpreted with caution. See Technical Notes.
Hispanic origin is not mutually exclusive from race categories (white, black, Asian/Pacific Islander, American Indian/Alaska Native).
∼ Rates are suppressed if fewer than 16 cases were reported in a specific category (age, race, ethnicity).

Cancer Incidence and M
ortality for All A
ges: All A
reas Com
bined3�
Table 1.1.2.1F: All Cancer Sites Combined. Invasive Cancer Incidence Rates∗ and 95% Confidence Intervals by Age andRace and Ethnicity, United States†‡
Females, 2004
Asian/Pacific American Indian/
Age at Diagnosis(years) All Races White Black Islander§ Alaska Native§ Hispanic§
<1 23.4 ( 21.4- 25.7) 24.0 ( 21.6- 26.6) 17.0 ( 12.7- 22.3) 20.8 ( 12.7- 32.2) ∼ 23.2 ( 19.0- 28.1)
1-4 19.5 ( 18.5- 20.5) 20.3 ( 19.2- 21.5) 13.1 ( 11.1- 15.3) 18.6 ( 14.5- 23.6) ∼ 19.9 ( 17.8- 22.1)
5-9 10.4 ( 9.8- 11.1) 10.4 ( 9.7- 11.2) 9.8 ( 8.3- 11.5) 6.9 ( 4.7- 9.8) ∼ 11.7 ( 10.2- 13.4)
10-14 12.6 ( 11.9- 13.3) 12.9 ( 12.2- 13.8) 10.8 ( 9.3- 12.5) 8.0 ( 5.5- 11.1) ∼ 13.1 ( 11.5- 14.8)
15-19 19.9 ( 19.0- 20.7) 20.6 ( 19.6- 21.7) 14.2 ( 12.4- 16.2) 13.5 ( 10.3- 17.4) 15.2 ( 9.5- 23.0) 18.4 ( 16.4- 20.7)
20-24 35.1 ( 34.0- 36.3) 36.6 ( 35.2- 37.9) 24.2 ( 21.8- 26.8) 24.7 ( 20.6- 29.4) 16.9 ( 10.7- 25.3) 28.1 ( 25.6- 30.8)
25-29 60.2 ( 58.6- 61.8) 62.5 ( 60.7- 64.3) 45.2 ( 41.8- 49.0) 36.0 ( 31.3- 41.2) 40.3 ( 29.5- 53.8) 46.0 ( 42.8- 49.3)
30-34 107.5 ( 105.5- 109.6) 109.4 ( 107.1- 111.8) 93.0 ( 88.0- 98.2) 69.7 ( 63.5- 76.3) 65.4 ( 51.2- 82.3) 83.3 ( 79.0- 87.8)
35-39 167.8 ( 165.3- 170.3) 168.8 ( 166.0- 171.6) 154.2 ( 147.8- 160.8) 126.3 ( 117.5- 135.7) 94.6 ( 77.3- 114.6) 135.7 ( 129.9- 141.7)
40-44 273.4 ( 270.4- 276.5) 275.0 ( 271.6- 278.4) 255.9 ( 247.9- 264.2) 208.5 ( 196.8- 220.8) 148.7 ( 127.7- 172.2) 222.0 ( 214.1- 230.0)
45-49 416.8 ( 413.0- 420.6) 416.8 ( 412.6- 421.0) 397.9 ( 387.4- 408.6) 328.3 ( 312.8- 344.3) 223.2 ( 196.1- 252.9) 337.2 ( 326.5- 348.1)
50-54 561.9 ( 557.2- 566.7) 564.3 ( 559.1- 569.5) 547.5 ( 534.1- 561.2) 394.7 ( 376.5- 413.5) 304.8 ( 270.0- 342.9) 457.8 ( 443.8- 472.2)
55-59 766.8 ( 760.8- 772.7) 767.3 ( 760.8- 773.8) 776.5 ( 758.1- 795.2) 496.2 ( 473.2- 520.0) 438.2 ( 390.7- 489.8) 614.3 ( 595.6- 633.4)
60-64 1032.0 (1024.2-1039.9) 1035.7 (1027.3-1044.3) 1020.5 ( 996.2-1045.3) 640.0 ( 609.0- 672.3) 709.3 ( 637.0- 787.5) 772.8 ( 748.3- 797.8)
65-69 1337.2 (1327.3-1347.1) 1347.7 (1337.0-1358.6) 1296.5 (1266.1-1327.4) 830.7 ( 791.0- 872.0) 882.3 ( 788.4- 984.3) 998.9 ( 967.8-1030.8)
70-74 1582.4 (1571.0-1593.9) 1602.8 (1590.5-1615.3) 1457.7 (1422.1-1493.9) 959.4 ( 912.4-1008.3) 994.1 ( 879.0-1120.0) 1219.6 (1181.1-1259.0)
75-79 1820.9 (1808.1-1833.8) 1838.0 (1824.3-1851.8) 1685.6 (1643.3-1728.7) 1097.6 (1040.2-1157.3) 1097.6 ( 957.7-1252.3) 1422.9 (1375.9-1471.1)
80-84 1919.3 (1904.5-1934.1) 1932.5 (1916.9-1948.2) 1700.5 (1650.2-1752.0) 1312.8 (1234.8-1394.4) 1163.8 ( 991.0-1358.1) 1555.2 (1494.6-1617.5)
85+ 1729.3 (1715.2-1743.6) 1734.4 (1719.5-1749.5) 1599.5 (1549.8-1650.4) 1198.1 (1114.5-1286.4) 984.9 ( 825.2-1166.4) 1434.2 (1371.9-1498.7)
∗ Rates are per 100,000 persons.† Data are from all state and metropolitan area cancer registries, except Maryland. Included data cover approximately 98% of the population and met data quality criteria
for all invasive cancer sites combined. See Appendix B for registry-specific data quality information.‡ Excludes basal and squamous cell carcinomas of the skin except when these occur on the skin of the genital organs, and in situ cancers except urinary bladder.
§ Data for specified racial or ethnic populations other than white and black should be interpreted with caution. See Technical Notes.
Hispanic origin is not mutually exclusive from race categories (white, black, Asian/Pacific Islander, American Indian/Alaska Native).
∼ Rates are suppressed if fewer than 16 cases were reported in a specific category (age, race, ethnicity).

United
States Cancer Statistics: 2004 Incid
ence and M
ortality
3�
continued
Table 1.1.2.2M: All Cancer Sites Combined. Cancer Death Rates∗ and 95% Confidence Intervals by Age and Race andEthnicity, United States†
Males, 2004
Asian/Pacific American Indian/Age at Diagnosis(years) All Races White Black Islander‡ Alaska Native§ Hispanic‡§
<1 1.8 ( 1.2- 2.4) 1.9 ( 1.3- 2.7) ∼ ∼ ∼ ∼1-4 2.6 ( 2.3- 3.0) 2.5 ( 2.2- 2.9) 2.8 ( 2.0- 3.9) ∼ ∼ 1.6 ( 1.1- 2.4)
5-9 3.0 ( 2.7- 3.4) 3.1 ( 2.7- 3.5) 2.5 ( 1.8- 3.4) ∼ ∼ 2.9 ( 2.2- 3.8)
10-14 2.5 ( 2.2- 2.8) 2.5 ( 2.2- 2.9) 2.4 ( 1.8- 3.3) ∼ ∼ 3.1 ( 2.4- 4.0)
15-19 4.1 ( 3.7- 4.5) 4.2 ( 3.8- 4.7) 4.1 ( 3.2- 5.2) ∼ ∼ 5.5 ( 4.4- 6.7)
20-24 5.5 ( 5.0- 5.9) 5.3 ( 4.8- 5.8) 6.8 ( 5.5- 8.2) 5.5 ( 3.7- 7.8) ∼ 5.5 ( 4.5- 6.6)
25-29 6.8 ( 6.3- 7.3) 6.8 ( 6.3- 7.4) 7.9 ( 6.4- 9.5) 4.6 ( 3.1- 6.7) ∼ 4.8 ( 3.9- 5.8)
30-34 10.4 ( 9.7- 11.0) 10.4 ( 9.7- 11.1) 12.2 ( 10.3- 14.2) 7.0 ( 5.1- 9.3) ∼ 8.2 ( 7.0- 9.5)
35-39 18.1 ( 17.3- 18.9) 18.0 ( 17.2- 19.0) 19.7 ( 17.4- 22.3) 15.5 ( 12.5- 19.1) ∼ 13.0 ( 11.4- 14.9)
40-44 39.2 ( 38.1- 40.4) 37.4 ( 36.1- 38.6) 56.2 ( 52.3- 60.3) 32.3 ( 27.7- 37.5) 23.0 ( 15.1- 33.4) 25.1 ( 22.6- 27.8)
45-49 86.1 ( 84.3- 87.8) 81.1 ( 79.2- 82.9) 133.9 ( 127.6- 140.5) 58.9 ( 52.2- 66.3) 65.8 ( 51.2- 83.3) 52.3 ( 48.2- 56.6)
50-54 168.2 ( 165.6- 170.8) 158.7 ( 156.0- 161.5) 274.6 ( 264.5- 285.0) 98.5 ( 89.0- 108.7) 112.8 ( 91.5- 137.6) 111.2 ( 104.3- 118.4)
55-59 289.9 ( 286.2- 293.7) 278.2 ( 274.3- 282.2) 456.0 ( 440.9- 471.4) 160.2 ( 146.5- 175.0) 216.2 ( 182.3- 254.6) 181.5 ( 171.1- 192.3)
60-64 492.6 ( 487.0- 498.2) 479.9 ( 474.0- 485.9) 729.3 ( 706.6- 752.5) 248.9 ( 228.6- 270.5) 351.2 ( 299.0- 409.8) 322.6 ( 305.8- 340.0)
65-69 756.6 ( 748.7- 764.5) 745.1 ( 736.7- 753.6) 1034.4 (1003.6-1065.9) 386.7 ( 357.7- 417.4) 572.7 ( 493.1- 661.4) 480.4 ( 456.9- 504.9)
70-74 1089.7 (1079.3-1100.3) 1076.0 (1064.9-1087.2) 1440.3 (1398.4-1483.3) 642.5 ( 598.6- 688.8) 770.8 ( 660.3- 894.7) 724.1 ( 690.6- 758.8)
75-79 1500.5 (1486.9-1514.2) 1487.9 (1473.6-1502.3) 1920.9 (1863.5-1979.7) 924.2 ( 862.0- 989.8) 1069.6 ( 911.7-1246.9) 1049.4 (1001.9-1098.7)
80-84 1892.9 (1874.4-1911.5) 1886.0 (1866.6-1905.5) 2338.9 (2259.4-2420.6) 1164.7 (1078.1-1256.3) 1117.6 ( 911.2-1356.6) 1369.7 (1300.2-1441.9)
85+ 2350.2 (2325.8-2374.8) 2350.1 (2324.4-2376.0) 2749.7 (2648.2-2854.1) 1540.5 (1420.8-1667.5) 1146.3 ( 901.6-1436.9) 1498.7 (1410.5-1590.9)
∗ Rates are per 100,000 persons.† Data are from the National Vital Statistics System (NVSS).‡ Data for specified racial or ethnic populations other than white and black should be interpreted with caution. See Technical Notes.
§ Hispanic origin is not mutually exclusive from race categories (white, black, Asian/Pacific Islander, American Indian/Alaska Native).
∼ Rates are suppressed if fewer than 16 cases were reported in a specific category (age, race, ethnicity).

Cancer Incidence and M
ortality for All A
ges: All A
reas Com
bined3�
Table 1.1.2.2F: All Cancer Sites Combined. Cancer Death Rates∗ and 95% Confidence Intervals by Age and Race andEthnicity, United States†
Females, 2004
Asian/Pacific American Indian/Age at Diagnosis(years) All Races White Black Islander‡ Alaska Native§ Hispanic‡§
<1 1.9 ( 1.3- 2.6) 2.1 ( 1.4- 2.9) ∼ ∼ ∼ ∼1-4 2.4 ( 2.1- 2.8) 2.5 ( 2.1- 2.9) 2.2 ( 1.5- 3.2) ∼ ∼ 2.4 ( 1.7- 3.3)
5-9 2.3 ( 2.0- 2.7) 2.3 ( 2.0- 2.7) 2.5 ( 1.8- 3.4) ∼ ∼ 2.2 ( 1.6- 2.9)
10-14 2.2 ( 1.9- 2.5) 2.1 ( 1.8- 2.4) 2.7 ( 2.0- 3.6) ∼ ∼ 2.8 ( 2.1- 3.7)
15-19 2.9 ( 2.6- 3.3) 2.9 ( 2.6- 3.3) 3.5 ( 2.7- 4.5) ∼ ∼ 2.7 ( 1.9- 3.6)
20-24 3.8 ( 3.4- 4.2) 3.7 ( 3.3- 4.1) 5.0 ( 3.9- 6.2) ∼ ∼ 3.3 ( 2.5- 4.2)
25-29 6.3 ( 5.9- 6.9) 6.0 ( 5.4- 6.6) 9.9 ( 8.4- 11.7) 3.3 ( 2.0- 5.1) ∼ 5.3 ( 4.3- 6.5)
30-34 12.6 ( 11.9- 13.3) 11.9 ( 11.2- 12.7) 17.8 ( 15.7- 20.1) 9.5 ( 7.3- 12.1) ∼ 9.7 ( 8.3- 11.3)
35-39 24.9 ( 23.9- 25.9) 23.7 ( 22.7- 24.8) 36.2 ( 33.2- 39.4) 14.8 ( 11.9- 18.2) 19.8 ( 12.4- 30.0) 19.1 ( 17.0- 21.5)
40-44 49.2 ( 48.0- 50.5) 46.7 ( 45.3- 48.1) 71.2 ( 67.1- 75.5) 34.2 ( 29.6- 39.3) 34.8 ( 25.1- 47.0) 32.3 ( 29.4- 35.4)
45-49 87.4 ( 85.7- 89.2) 83.4 ( 81.6- 85.3) 125.8 ( 120.1- 131.8) 57.9 ( 51.6- 64.8) 56.9 ( 43.7- 72.8) 57.5 ( 53.1- 62.1)
50-54 143.5 ( 141.1- 145.9) 137.9 ( 135.4- 140.4) 202.6 ( 194.7- 210.8) 98.6 ( 89.7- 108.1) 91.3 ( 72.8- 113.1) 93.9 ( 87.6- 100.5)
55-59 234.8 ( 231.6- 238.1) 230.5 ( 227.0- 234.1) 312.3 ( 301.0- 323.9) 135.4 ( 123.6- 148.0) 165.9 ( 137.3- 198.6) 152.9 ( 143.7- 162.5)
60-64 368.5 ( 363.9- 373.2) 367.8 ( 362.8- 372.9) 446.0 ( 430.3- 462.1) 190.2 ( 173.6- 207.9) 282.4 ( 237.7- 333.1) 224.2 ( 211.2- 237.9)
65-69 534.1 ( 527.9- 540.3) 534.4 ( 527.7- 541.1) 630.0 ( 609.3- 651.2) 281.3 ( 258.6- 305.5) 425.6 ( 361.5- 497.9) 328.6 ( 310.9- 347.1)
70-74 731.2 ( 723.5- 738.9) 737.5 ( 729.2- 745.9) 798.0 ( 772.3- 824.4) 417.5 ( 386.9- 449.8) 570.3 ( 484.3- 667.1) 444.9 ( 421.8- 468.9)
75-79 932.9 ( 923.8- 942.0) 941.0 ( 931.2- 950.8) 1015.9 ( 983.8-1048.9) 499.4 ( 461.2- 539.9) 596.8 ( 495.2- 713.1) 593.2 ( 563.0- 624.5)
80-84 1134.5 (1123.3-1145.8) 1143.7 (1131.8-1155.7) 1175.1 (1134.2-1217.2) 699.7 ( 643.6- 759.4) 897.7 ( 747.3-1069.6) 766.9 ( 724.7- 810.9)
85+ 1336.8 (1324.5-1349.3) 1345.5 (1332.4-1358.6) 1385.1 (1339.8-1431.6) 872.0 ( 801.5- 947.1) 728.3 ( 592.6- 885.8) 931.8 ( 881.9- 983.9)
∗ Rates are per 100,000 persons.† Data are from the National Vital Statistics System (NVSS).‡ Data for specified racial or ethnic populations other than white and black should be interpreted with caution. See Technical Notes.
§ Hispanic origin is not mutually exclusive from race categories (white, black, Asian/Pacific Islander, American Indian/Alaska Native).
∼ Rates are suppressed if fewer than 16 cases were reported in a specific category (age, race, ethnicity).

United
States Cancer Statistics: 2004 Incid
ence and M
ortality
3�
continued
Table 1.2.1.1M: Age-Adjusted Invasive Cancer Incidence Rates∗ and 95% Confidence Intervals for Ages 0-19 by InternationalClassification of Childhood Cancer (ICCC†) Group and Subgroup, and Race and Ethnicity, United States‡
Males, 2004
Asian/Pacific American Indian/
ICCC Group and Subgroup All Races White Black Islander§ Alaska Native§ Hispanic§
All ICCC Groups Combined 176.2 (172.2-180.3) 183.1 (178.5-187.9) 128.3 (119.7-137.3) 130.9 (115.0-148.3) 108.3 ( 81.6-140.8) 176.2 (167.0-185.7)
I Leukemias, myeloproliferative & myelodysplastic
diseases 50.1 ( 48.0- 52.3) 52.9 ( 50.4- 55.5) 31.1 ( 27.0- 35.7) 45.5 ( 36.4- 56.2) 42.3 ( 26.1- 64.7) 62.5 ( 57.2- 68.3)
I(a) Lymphoid leukemias 36.4 ( 34.6- 38.3) 39.3 ( 37.2- 41.6) 19.0 ( 15.8- 22.7) 27.0 ( 20.1- 35.5) 35.8 ( 21.1- 56.6) 46.5 ( 41.9- 51.5)
I(b) Acute myeloid leukemias 9.0 ( 8.1- 9.9) 9.0 ( 8.0- 10.1) 7.8 ( 5.8- 10.3) 11.2 ( 6.9- 17.1) ∼ 10.8 ( 8.6- 13.3)
I(c) Chronic myeloproliferative diseases 2.0 ( 1.6- 2.5) 1.9 ( 1.4- 2.4) ∼ ∼ ∼ ∼I(d) Myelodysplastic syndrome and other
myeloproliferative diseases 1.4 ( 1.1- 1.8) 1.4 ( 1.0- 1.9) ∼ ∼ ∼ ∼I(e) Unspecified and other specified leukemias 1.3 ( 1.0- 1.7) 1.2 ( 0.9- 1.7) ∼ ∼ ∼ ∼
II Lymphomas and reticuloendothelial neoplasms 27.2 ( 25.7- 28.9) 27.5 ( 25.7- 29.3) 25.9 ( 22.1- 30.1) 17.9 ( 12.3- 25.1) ∼ 26.2 ( 22.6- 30.1)
II(a) Hodgkin lymphomas 11.8 ( 10.8- 12.9) 12.2 ( 11.0- 13.4) 9.8 ( 7.5- 12.6) 8.6 ( 4.9- 14.0) ∼ 9.8 ( 7.7- 12.4)
II(b) Non-Hodgkin lymphomas (except Burkitt
lymphoma) 10.4 ( 9.4- 11.4) 9.9 ( 8.8- 11.1) 12.6 ( 10.1- 15.7) ∼ ∼ 10.9 ( 8.7- 13.6)
II(c) Burkitt lymphoma 3.5 ( 2.9- 4.1) 3.8 ( 3.2- 4.6) ∼ ∼ ∼ 3.4 ( 2.3- 5.0)
II(d) Miscellaneous lymphoreticular neoplasms 1.0 ( 0.7- 1.4) 1.0 ( 0.7- 1.5) ∼ ∼ ∼ ∼II(e) Unspecified lymphomas 0.5 ( 0.3- 0.8) 0.5 ( 0.3- 0.8) ∼ ∼ ∼ ∼
III CNS and misc intracranial and intraspinal
neoplasms 30.6 ( 28.9- 32.3) 31.7 ( 29.8- 33.7) 24.0 ( 20.4- 28.1) 16.5 ( 11.2- 23.4) ∼ 24.2 ( 21.0- 27.9)
III(a) Ependymomas and choroid plexus tumor 2.8 ( 2.3- 3.4) 2.9 ( 2.3- 3.5) 2.6 ( 1.5- 4.2) ∼ ∼ 2.9 ( 1.9- 4.3)
III(b) Astrocytomas 14.6 ( 13.5- 15.8) 15.3 ( 13.9- 16.7) 10.5 ( 8.1- 13.3) ∼ ∼ 9.9 ( 7.9- 12.4)
III(c) Intracranial and intraspinal embryonal
tumors 7.2 ( 6.4- 8.1) 7.7 ( 6.8- 8.8) 4.6 ( 3.1- 6.5) ∼ ∼ 7.0 ( 5.3- 9.0)
III(d) Other gliomas 4.7 ( 4.1- 5.4) 4.7 ( 4.0- 5.5) 4.3 ( 2.9- 6.3) ∼ ∼ 3.7 ( 2.5- 5.3)
III(e) Other specified intracranial &
intraspinal neoplasms 0.8 ( 0.6- 1.2) 0.8 ( 0.5- 1.2) ∼ ∼ ∼ ∼III(f) Unspecified intracranial and intraspinal
neoplasms 0.4 ( 0.2- 0.6) ∼ ∼ ∼ ∼ ∼IV Neuroblastoma and other peripheral nervous
cell tumors 8.4 ( 7.5- 9.3) 8.8 ( 7.8- 9.9) 6.2 ( 4.5- 8.5) ∼ ∼ 6.6 ( 5.0- 8.5)
IV(a) Neuroblastoma and ganglioneuroblastoma 8.2 ( 7.3- 9.1) 8.6 ( 7.7- 9.7) 6.1 ( 4.3- 8.3) ∼ ∼ 6.3 ( 4.8- 8.2)
IV(b) Other peripheral nervous cell tumors ∼ ∼ ∼ ∼ ∼ ∼V Retinoblastoma 3.0 ( 2.5- 3.5) 2.8 ( 2.3- 3.5) 2.6 ( 1.5- 4.1) ∼ ∼ 3.5 ( 2.4- 5.0)
VI Renal tumors 6.0 ( 5.3- 6.8) 5.8 ( 5.0- 6.7) 7.5 ( 5.6- 10.0) ∼ ∼ 4.1 ( 2.8- 5.6)
VI(a) Nephroblastoma and other nonepithelial
renal tumors 5.5 ( 4.8- 6.2) 5.5 ( 4.7- 6.3) 5.7 ( 4.0- 7.8) ∼ ∼ 3.9 ( 2.7- 5.5)
VI(b) Renal carcinomas 0.5 ( 0.3- 0.8) ∼ ∼ ∼ ∼ ∼VI(c) Unspecified malignant renal tumors ∼ ∼ ∼ ∼ ∼ ∼
VII Hepatic tumors 2.6 ( 2.1- 3.2) 2.6 ( 2.1- 3.3) ∼ ∼ ∼ 3.7 ( 2.5- 5.3)
VII(a) Hepatoblastoma 1.9 ( 1.5- 2.4) 1.9 ( 1.5- 2.4) ∼ ∼ ∼ 2.1 ( 1.3- 3.3)
VII(b) Hepatic carcinomas 0.6 ( 0.4- 0.9) 0.6 ( 0.4- 1.0) ∼ ∼ ∼ ∼VII(c) Unspecified malignant hepatic tumors ∼ ∼ ∼ ∼ ∼ ∼
VIII Malignant bone tumors 9.0 ( 8.1- 10.0) 8.9 ( 7.9- 10.0) 8.8 ( 6.7- 11.4) ∼ ∼ 8.9 ( 6.9- 11.3)
VIII(a) Osteosarcomas 5.0 ( 4.4- 5.8) 4.5 ( 3.8- 5.3) 6.8 ( 4.9- 9.1) ∼ ∼ 5.2 ( 3.7- 7.1)
VIII(b) Chondrosarcomas 0.7 ( 0.4- 1.0) 0.7 ( 0.4- 1.0) ∼ ∼ ∼ ∼

Cancer Incidence and M
ortality for All A
ges: All A
reas Com
bined3�
Table 1.2.1.1M: Age-Adjusted Invasive Cancer Incidence Rates∗ and 95% Confidence Intervals for Ages 0-19 by InternationalClassification of Childhood Cancer (ICCC†) Group and Subgroup, and Race and Ethnicity, United States‡ (continued)
Males, 2004
Asian/Pacific American Indian/
ICCC Group and Subgroup All Races White Black Islander§ Alaska Native§ Hispanic§
VIII(c) Ewing tumor and related sarcomas of bone 2.7 ( 2.3- 3.3) 3.2 ( 2.6- 3.9) ∼ ∼ ∼ 2.9 ( 1.8- 4.4)
VIII(d) Other specified malignant bone tumors 0.4 ( 0.2- 0.6) ∼ ∼ ∼ ∼ ∼VIII(e) Unspecified malignant bone tumors ∼ ∼ ∼ ∼ ∼ ∼
IX Soft tissue and other extraosseous sarcomas 12.1 ( 11.0- 13.2) 12.5 ( 11.3- 13.8) 9.3 ( 7.1- 12.0) 9.1 ( 5.3- 14.6) ∼ 13.3 ( 10.9- 16.2)
IX(a) Rhabdomyosarcomas 4.8 ( 4.2- 5.5) 5.1 ( 4.4- 6.0) 2.9 ( 1.8- 4.6) ∼ ∼ 4.9 ( 3.5- 6.7)
IX(b) Fibrosarcomas, peripheral nerve sheath
tumors & other fibrous neoplams 1.1 ( 0.8- 1.4) 0.9 ( 0.6- 1.3) ∼ ∼ ∼ ∼IX(c) Kaposi sarcoma ∼ ∼ ∼ ∼ ∼ ∼IX(d) Other specified soft tissue sarcomas 5.0 ( 4.4- 5.8) 5.3 ( 4.5- 6.1) 3.7 ( 2.4- 5.5) ∼ ∼ 6.5 ( 4.8- 8.6)
IX(e) Unspecified soft tissue sarcomas 1.1 ( 0.8- 1.5) 1.2 ( 0.8- 1.6) ∼ ∼ ∼ ∼X Germ cell, trophoblastic tumors & neoplasms of
gonads 13.6 ( 12.5- 14.8) 15.3 ( 14.0- 16.7) 2.9 ( 1.8- 4.6) 14.4 ( 9.5- 20.9) ∼ 15.0 ( 12.3- 18.1)
X(a) Intracranial & intraspinal germ cell tumors 2.4 ( 2.0- 3.0) 2.6 ( 2.1- 3.3) ∼ ∼ ∼ 3.4 ( 2.2- 5.0)
X(b) Malignant extracranial & extragonadal germ
cell tumors 1.1 ( 0.8- 1.5) 1.1 ( 0.8- 1.5) ∼ ∼ ∼ ∼X(c) Malignant gonadal germ cell tumors 9.9 ( 9.0- 11.0) 11.4 ( 10.2- 12.6) ∼ ∼ ∼ 9.9 ( 7.7- 12.5)
X(d) Gonadal carcinomas ∼ ∼ ∼ ∼ ∼ ∼X(e) Other and unspecified malignant gonadal
tumors ∼ ∼ ∼ ∼ ∼ ∼XI Other malignant epithelial neoplasms and
malignant melanomas 12.6 ( 11.5- 13.7) 13.4 ( 12.2- 14.7) 7.2 ( 5.3- 9.6) ∼ ∼ 7.4 ( 5.5- 9.6)
XI(a) Adrenocortical carcinomas ∼ ∼ ∼ ∼ ∼ ∼XI(b) Thyroid carcinomas 2.4 ( 1.9- 2.9) 2.7 ( 2.2- 3.4) ∼ ∼ ∼ ∼XI(c) Nasopharyngeal carcinomas 0.7 ( 0.5- 1.1) ∼ 2.4 ( 1.4- 3.9) ∼ ∼ ∼XI(d) Malignant melanomas 5.7 ( 5.0- 6.5) 6.5 ( 5.7- 7.5) ∼ ∼ ∼ ∼XI(e) Skin carcinomas ∼ ∼ ∼ ∼ ∼ ∼XI(f) Other and unspecified carcinomas 3.5 ( 3.0- 4.2) 3.5 ( 2.9- 4.2) 3.5 ( 2.2- 5.3) ∼ ∼ 3.4 ( 2.2- 5.0)
XII Other and unspecified malignant neoplasms 0.7 ( 0.4- 0.9) 0.7 ( 0.4- 1.0) ∼ ∼ ∼ ∼XII(a) Other specified malignant tumors ∼ ∼ ∼ ∼ ∼ ∼XII(b) Other unspecified malignant tumors ∼ ∼ ∼ ∼ ∼ ∼
Not classified by ICCC ∼ ∼ ∼ ∼ ∼ ∼∗ Rates are per 1,000,000 persons and are age-adjusted to the 2000 U.S. standard population (19 age groups - Census P25-1130).† 2005 International Classification of Childhood Cancer based on ICD-O-3. See Technical Notes and Appendix C.‡ Data are from all state and metropolitan area cancer registries, except Maryland. Included data cover approximately 98% of the population and met data quality criteria for
all invasive cancer sites combined. See Appendix B for registry-specific data quality information.
§ Data for specified racial or ethnic populations other than white and black should be interpreted with caution. See Technical Notes.
Hispanic origin is not mutually exclusive from race categories (white, black, Asian/Pacific Islander, American Indian/Alaska Native).
∼ Rates are suppressed if fewer than 16 cases were reported in a specific category (site, race, ethnicity).
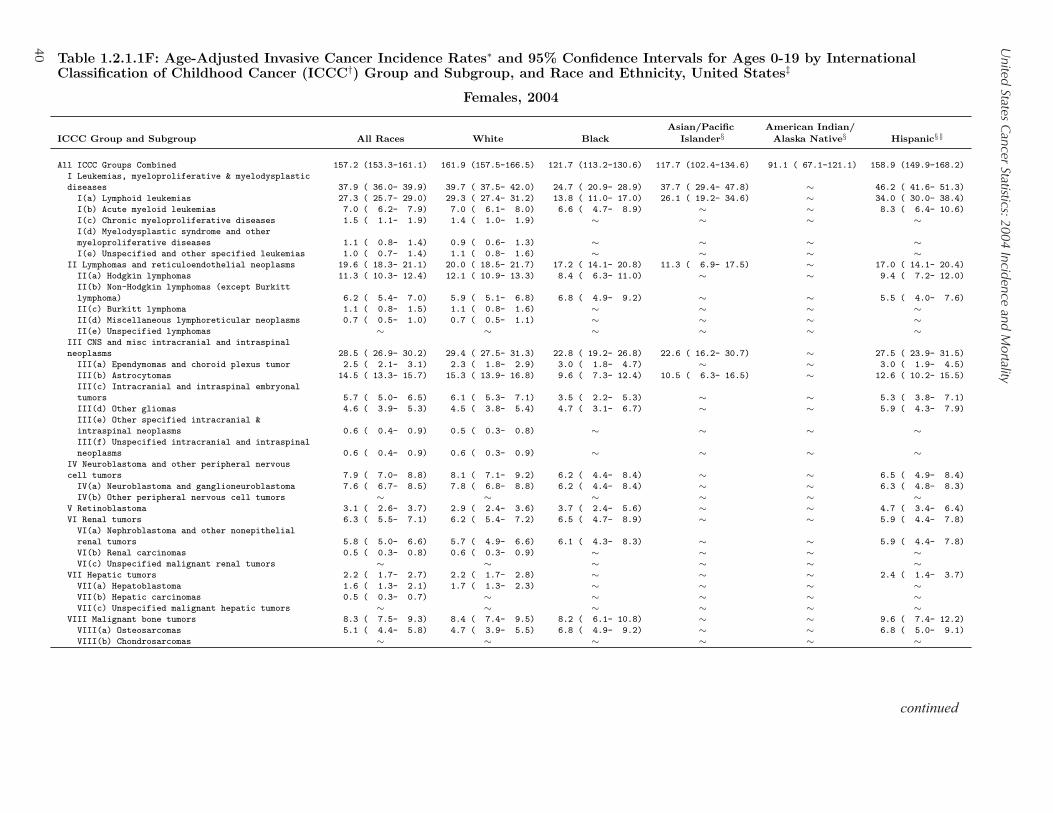
United
States Cancer Statistics: 2004 Incid
ence and M
ortality
�0
continued
Table 1.2.1.1F: Age-Adjusted Invasive Cancer Incidence Rates∗ and 95% Confidence Intervals for Ages 0-19 by InternationalClassification of Childhood Cancer (ICCC†) Group and Subgroup, and Race and Ethnicity, United States‡
Females, 2004
Asian/Pacific American Indian/
ICCC Group and Subgroup All Races White Black Islander§ Alaska Native§ Hispanic§
All ICCC Groups Combined 157.2 (153.3-161.1) 161.9 (157.5-166.5) 121.7 (113.2-130.6) 117.7 (102.4-134.6) 91.1 ( 67.1-121.1) 158.9 (149.9-168.2)
I Leukemias, myeloproliferative & myelodysplastic
diseases 37.9 ( 36.0- 39.9) 39.7 ( 37.5- 42.0) 24.7 ( 20.9- 28.9) 37.7 ( 29.4- 47.8) ∼ 46.2 ( 41.6- 51.3)
I(a) Lymphoid leukemias 27.3 ( 25.7- 29.0) 29.3 ( 27.4- 31.2) 13.8 ( 11.0- 17.0) 26.1 ( 19.2- 34.6) ∼ 34.0 ( 30.0- 38.4)
I(b) Acute myeloid leukemias 7.0 ( 6.2- 7.9) 7.0 ( 6.1- 8.0) 6.6 ( 4.7- 8.9) ∼ ∼ 8.3 ( 6.4- 10.6)
I(c) Chronic myeloproliferative diseases 1.5 ( 1.1- 1.9) 1.4 ( 1.0- 1.9) ∼ ∼ ∼ ∼I(d) Myelodysplastic syndrome and other
myeloproliferative diseases 1.1 ( 0.8- 1.4) 0.9 ( 0.6- 1.3) ∼ ∼ ∼ ∼I(e) Unspecified and other specified leukemias 1.0 ( 0.7- 1.4) 1.1 ( 0.8- 1.6) ∼ ∼ ∼ ∼
II Lymphomas and reticuloendothelial neoplasms 19.6 ( 18.3- 21.1) 20.0 ( 18.5- 21.7) 17.2 ( 14.1- 20.8) 11.3 ( 6.9- 17.5) ∼ 17.0 ( 14.1- 20.4)
II(a) Hodgkin lymphomas 11.3 ( 10.3- 12.4) 12.1 ( 10.9- 13.3) 8.4 ( 6.3- 11.0) ∼ ∼ 9.4 ( 7.2- 12.0)
II(b) Non-Hodgkin lymphomas (except Burkitt
lymphoma) 6.2 ( 5.4- 7.0) 5.9 ( 5.1- 6.8) 6.8 ( 4.9- 9.2) ∼ ∼ 5.5 ( 4.0- 7.6)
II(c) Burkitt lymphoma 1.1 ( 0.8- 1.5) 1.1 ( 0.8- 1.6) ∼ ∼ ∼ ∼II(d) Miscellaneous lymphoreticular neoplasms 0.7 ( 0.5- 1.0) 0.7 ( 0.5- 1.1) ∼ ∼ ∼ ∼II(e) Unspecified lymphomas ∼ ∼ ∼ ∼ ∼ ∼
III CNS and misc intracranial and intraspinal
neoplasms 28.5 ( 26.9- 30.2) 29.4 ( 27.5- 31.3) 22.8 ( 19.2- 26.8) 22.6 ( 16.2- 30.7) ∼ 27.5 ( 23.9- 31.5)
III(a) Ependymomas and choroid plexus tumor 2.5 ( 2.1- 3.1) 2.3 ( 1.8- 2.9) 3.0 ( 1.8- 4.7) ∼ ∼ 3.0 ( 1.9- 4.5)
III(b) Astrocytomas 14.5 ( 13.3- 15.7) 15.3 ( 13.9- 16.8) 9.6 ( 7.3- 12.4) 10.5 ( 6.3- 16.5) ∼ 12.6 ( 10.2- 15.5)
III(c) Intracranial and intraspinal embryonal
tumors 5.7 ( 5.0- 6.5) 6.1 ( 5.3- 7.1) 3.5 ( 2.2- 5.3) ∼ ∼ 5.3 ( 3.8- 7.1)
III(d) Other gliomas 4.6 ( 3.9- 5.3) 4.5 ( 3.8- 5.4) 4.7 ( 3.1- 6.7) ∼ ∼ 5.9 ( 4.3- 7.9)
III(e) Other specified intracranial &
intraspinal neoplasms 0.6 ( 0.4- 0.9) 0.5 ( 0.3- 0.8) ∼ ∼ ∼ ∼III(f) Unspecified intracranial and intraspinal
neoplasms 0.6 ( 0.4- 0.9) 0.6 ( 0.3- 0.9) ∼ ∼ ∼ ∼IV Neuroblastoma and other peripheral nervous
cell tumors 7.9 ( 7.0- 8.8) 8.1 ( 7.1- 9.2) 6.2 ( 4.4- 8.4) ∼ ∼ 6.5 ( 4.9- 8.4)
IV(a) Neuroblastoma and ganglioneuroblastoma 7.6 ( 6.7- 8.5) 7.8 ( 6.8- 8.8) 6.2 ( 4.4- 8.4) ∼ ∼ 6.3 ( 4.8- 8.3)
IV(b) Other peripheral nervous cell tumors ∼ ∼ ∼ ∼ ∼ ∼V Retinoblastoma 3.1 ( 2.6- 3.7) 2.9 ( 2.4- 3.6) 3.7 ( 2.4- 5.6) ∼ ∼ 4.7 ( 3.4- 6.4)
VI Renal tumors 6.3 ( 5.5- 7.1) 6.2 ( 5.4- 7.2) 6.5 ( 4.7- 8.9) ∼ ∼ 5.9 ( 4.4- 7.8)
VI(a) Nephroblastoma and other nonepithelial
renal tumors 5.8 ( 5.0- 6.6) 5.7 ( 4.9- 6.6) 6.1 ( 4.3- 8.3) ∼ ∼ 5.9 ( 4.4- 7.8)
VI(b) Renal carcinomas 0.5 ( 0.3- 0.8) 0.6 ( 0.3- 0.9) ∼ ∼ ∼ ∼VI(c) Unspecified malignant renal tumors ∼ ∼ ∼ ∼ ∼ ∼
VII Hepatic tumors 2.2 ( 1.7- 2.7) 2.2 ( 1.7- 2.8) ∼ ∼ ∼ 2.4 ( 1.4- 3.7)
VII(a) Hepatoblastoma 1.6 ( 1.3- 2.1) 1.7 ( 1.3- 2.3) ∼ ∼ ∼ ∼VII(b) Hepatic carcinomas 0.5 ( 0.3- 0.7) ∼ ∼ ∼ ∼ ∼VII(c) Unspecified malignant hepatic tumors ∼ ∼ ∼ ∼ ∼ ∼
VIII Malignant bone tumors 8.3 ( 7.5- 9.3) 8.4 ( 7.4- 9.5) 8.2 ( 6.1- 10.8) ∼ ∼ 9.6 ( 7.4- 12.2)
VIII(a) Osteosarcomas 5.1 ( 4.4- 5.8) 4.7 ( 3.9- 5.5) 6.8 ( 4.9- 9.2) ∼ ∼ 6.8 ( 5.0- 9.1)
VIII(b) Chondrosarcomas ∼ ∼ ∼ ∼ ∼ ∼

Cancer Incidence and M
ortality for All A
ges: All A
reas Com
bined��
Table 1.2.1.1F: Age-Adjusted Invasive Cancer Incidence Rates∗ and 95% Confidence Intervals for Ages 0-19 by InternationalClassification of Childhood Cancer (ICCC†) Group and Subgroup, and Race and Ethnicity, United States‡ (continued)
Females, 2004
Asian/Pacific American Indian/
ICCC Group and Subgroup All Races White Black Islander§ Alaska Native§ Hispanic§
VIII(c) Ewing tumor and related sarcomas of bone 2.4 ( 1.9- 2.9) 2.7 ( 2.1- 3.3) ∼ ∼ ∼ ∼VIII(d) Other specified malignant bone tumors 0.6 ( 0.4- 0.8) 0.7 ( 0.4- 1.0) ∼ ∼ ∼ ∼VIII(e) Unspecified malignant bone tumors ∼ ∼ ∼ ∼ ∼ ∼
IX Soft tissue and other extraosseous sarcomas 11.2 ( 10.2- 12.3) 11.1 ( 10.0- 12.4) 13.6 ( 10.8- 16.8) ∼ ∼ 10.0 ( 7.8- 12.6)
IX(a) Rhabdomyosarcomas 3.6 ( 3.0- 4.2) 3.6 ( 3.0- 4.3) 4.3 ( 2.9- 6.3) ∼ ∼ 2.4 ( 1.5- 3.8)
IX(b) Fibrosarcomas, peripheral nerve sheath
tumors & other fibrous neoplams 1.5 ( 1.1- 1.9) 1.4 ( 1.0- 1.9) ∼ ∼ ∼ ∼IX(c) Kaposi sarcoma ∼ ∼ ∼ ∼ ∼ ∼IX(d) Other specified soft tissue sarcomas 4.8 ( 4.2- 5.6) 4.8 ( 4.0- 5.6) 5.7 ( 4.0- 7.8) ∼ ∼ 3.9 ( 2.5- 5.6)
IX(e) Unspecified soft tissue sarcomas 1.3 ( 1.0- 1.7) 1.3 ( 0.9- 1.8) ∼ ∼ ∼ ∼X Germ cell, trophoblastic tumors & neoplasms of
gonads 8.2 ( 7.3- 9.2) 7.9 ( 7.0- 9.0) 8.1 ( 6.0- 10.6) 11.2 ( 6.9- 17.4) ∼ 11.1 ( 8.7- 13.8)
X(a) Intracranial & intraspinal germ cell tumors 1.1 ( 0.8- 1.4) 1.1 ( 0.7- 1.5) ∼ ∼ ∼ ∼X(b) Malignant extracranial & extragonadal germ
cell tumors 1.4 ( 1.1- 1.8) 1.3 ( 0.9- 1.7) ∼ ∼ ∼ ∼X(c) Malignant gonadal germ cell tumors 4.6 ( 3.9- 5.3) 4.3 ( 3.6- 5.1) 5.2 ( 3.6- 7.4) ∼ ∼ 7.7 ( 5.7- 10.0)
X(d) Gonadal carcinomas 0.7 ( 0.4- 1.0) 0.7 ( 0.4- 1.0) ∼ ∼ ∼ ∼X(e) Other and unspecified malignant gonadal
tumors 0.5 ( 0.3- 0.8) 0.6 ( 0.3- 0.9) ∼ ∼ ∼ ∼XI Other malignant epithelial neoplasms and
malignant melanomas 22.7 ( 21.2- 24.3) 24.8 ( 23.0- 26.6) 8.6 ( 6.5- 11.3) 10.9 ( 6.6- 17.1) ∼ 16.5 ( 13.5- 19.8)
XI(a) Adrenocortical carcinomas ∼ ∼ ∼ ∼ ∼ ∼XI(b) Thyroid carcinomas 11.0 ( 9.9- 12.0) 12.4 ( 11.2- 13.7) ∼ ∼ ∼ 10.9 ( 8.5- 13.7)
XI(c) Nasopharyngeal carcinomas ∼ ∼ ∼ ∼ ∼ ∼XI(d) Malignant melanomas 6.8 ( 6.0- 7.7) 7.9 ( 6.9- 9.0) ∼ ∼ ∼ ∼XI(e) Skin carcinomas ∼ ∼ ∼ ∼ ∼ ∼XI(f) Other and unspecified carcinomas 4.1 ( 3.5- 4.8) 3.8 ( 3.1- 4.5) 4.8 ( 3.2- 6.8) ∼ ∼ 2.6 ( 1.6- 4.2)
XII Other and unspecified malignant neoplasms 0.7 ( 0.5- 1.1) 0.7 ( 0.4- 1.1) ∼ ∼ ∼ ∼XII(a) Other specified malignant tumors ∼ ∼ ∼ ∼ ∼ ∼XII(b) Other unspecified malignant tumors ∼ ∼ ∼ ∼ ∼ ∼
Not classified by ICCC 0.5 ( 0.3- 0.7) 0.6 ( 0.3- 0.9) ∼ ∼ ∼ ∼∗ Rates are per 1,000,000 persons and are age-adjusted to the 2000 U.S. standard population (19 age groups - Census P25-1130).† 2005 International Classification of Childhood Cancer based on ICD-O-3. See Technical Notes and Appendix C.‡ Data are from all state and metropolitan area cancer registries, except Maryland. Included data cover approximately 98% of the population and met data quality criteria for
all invasive cancer sites combined. See Appendix B for registry-specific data quality information.
§ Data for specified racial or ethnic populations other than white and black should be interpreted with caution. See Technical Notes.
Hispanic origin is not mutually exclusive from race categories (white, black, Asian/Pacific Islander, American Indian/Alaska Native).
∼ Rates are suppressed if fewer than 16 cases were reported in a specific category (site, race, ethnicity).

United
States Cancer Statistics: 2004 Incid
ence and M
ortality
��
continued
Table 1.2.2.1 : Age-Adjusted Invasive Cancer Incidence Rates∗ and 95% Confidence Intervals by InternationalClassification of Childhood Cancer (ICCC†) Group and Subgroup, and Age, United States‡
All Races, Males and Females, 2004
Age (years)
ICCC Group and Subgroup 0-14 0-19
All ICCC Groups Combined 152.7 (149.5-155.8) 166.9 (164.1-169.8)
I Leukemias, myeloproliferative & myelodysplastic diseases 49.0 ( 47.3- 50.8) 44.2 ( 42.7- 45.6)
I(a) Lymphoid leukemias 37.3 ( 35.8- 38.9) 32.0 ( 30.7- 33.2)
I(b) Acute myeloid leukemias 7.7 ( 7.0- 8.4) 8.0 ( 7.4- 8.7)
I(c) Chronic myeloproliferative diseases 1.4 ( 1.1- 1.7) 1.8 ( 1.5- 2.1)
I(d) Myelodysplastic syndrome and other myeloproliferative diseases 1.4 ( 1.1- 1.7) 1.2 ( 1.0- 1.5)
I(e) Unspecified and other specified leukemias 1.3 ( 1.0- 1.6) 1.2 ( 1.0- 1.5)
II Lymphomas and reticuloendothelial neoplasms 15.7 ( 14.7- 16.8) 23.5 ( 22.5- 24.6)
II(a) Hodgkin lymphomas 5.2 ( 4.7- 5.8) 11.6 ( 10.9- 12.4)
II(b) Non-Hodgkin lymphomas (except Burkitt lymphoma) 6.7 ( 6.1- 7.4) 8.3 ( 7.7- 9.0)
II(c) Burkitt lymphoma 2.4 ( 2.0- 2.8) 2.3 ( 2.0- 2.7)
II(d) Miscellaneous lymphoreticular neoplasms 1.1 ( 0.8- 1.4) 0.9 ( 0.7- 1.1)
II(e) Unspecified lymphomas 0.3 ( 0.2- 0.5) 0.4 ( 0.3- 0.6)
III CNS and misc intracranial and intraspinal neoplasms 32.0 ( 30.6- 33.5) 29.6 ( 28.4- 30.8)
III(a) Ependymomas and choroid plexus tumor 2.9 ( 2.5- 3.4) 2.7 ( 2.3- 3.1)
III(b) Astrocytomas 15.1 ( 14.2- 16.2) 14.6 ( 13.7- 15.4)
III(c) Intracranial and intraspinal embryonal tumors 7.6 ( 6.9- 8.4) 6.5 ( 5.9- 7.0)
III(d) Other gliomas 5.0 ( 4.4- 5.6) 4.6 ( 4.2- 5.1)
III(e) Other specified intracranial & intraspinal neoplasms 0.8 ( 0.6- 1.1) 0.7 ( 0.6- 1.0)
III(f) Unspecified intracranial and intraspinal neoplasms 0.5 ( 0.4- 0.8) 0.5 ( 0.3- 0.7)
IV Neuroblastoma and other peripheral nervous cell tumors 10.6 ( 9.8- 11.4) 8.1 ( 7.5- 8.8)
IV(a) Neuroblastoma and ganglioneuroblastoma 10.4 ( 9.6- 11.2) 7.9 ( 7.3- 8.5)
IV(b) Other peripheral nervous cell tumors ∼ 0.3 ( 0.2- 0.4)
V Retinoblastoma 4.1 ( 3.6- 4.6) 3.0 ( 2.7- 3.4)
VI Renal tumors 7.7 ( 7.0- 8.5) 6.2 ( 5.6- 6.7)
VI(a) Nephroblastoma and other nonepithelial renal tumors 7.4 ( 6.7- 8.1) 5.6 ( 5.1- 6.2)
VI(b) Renal carcinomas 0.3 ( 0.2- 0.5) 0.5 ( 0.4- 0.7)
VI(c) Unspecified malignant renal tumors ∼ ∼VII Hepatic tumors 2.7 ( 2.3- 3.1) 2.4 ( 2.1- 2.8)
VII(a) Hepatoblastoma 2.4 ( 2.0- 2.8) 1.8 ( 1.5- 2.1)
VII(b) Hepatic carcinomas ∼ 0.5 ( 0.4- 0.7)
VII(c) Unspecified malignant hepatic tumors ∼ ∼VIII Malignant bone tumors 6.8 ( 6.1- 7.5) 8.7 ( 8.1- 9.4)
VIII(a) Osteosarcomas 4.0 ( 3.5- 4.6) 5.0 ( 4.6- 5.6)
VIII(b) Chondrosarcomas ∼ 0.5 ( 0.3- 0.7)
VIII(c) Ewing tumor and related sarcomas of bone 2.2 ( 1.8- 2.6) 2.6 ( 2.2- 2.9)
VIII(d) Other specified malignant bone tumors 0.3 ( 0.2- 0.5) 0.5 ( 0.3- 0.6)
VIII(e) Unspecified malignant bone tumors ∼ ∼IX Soft tissue and other extraosseous sarcomas 10.2 ( 9.4- 11.1) 11.7 ( 10.9- 12.4)
IX(a) Rhabdomyosarcomas 4.5 ( 4.0- 5.1) 4.2 ( 3.8- 4.7)
IX(b) Fibrosarcomas, peripheral nerve sheath tumors & other fibrous neoplams 1.2 ( 0.9- 1.5) 1.3 ( 1.0- 1.5)
IX(c) Kaposi sarcoma ∼ ∼IX(d) Other specified soft tissue sarcomas 3.5 ( 3.0- 4.0) 4.9 ( 4.5- 5.4)
IX(e) Unspecified soft tissue sarcomas 1.0 ( 0.8- 1.3) 1.2 ( 1.0- 1.5)

Cancer Incidence and M
ortality for All A
ges: All A
reas Com
bined�3
Table 1.2.2.1 : Age-Adjusted Invasive Cancer Incidence Rates∗ and 95% Confidence Intervals by InternationalClassification of Childhood Cancer (ICCC†) Group and Subgroup, and Age, United States‡(continued)
All Races, Males and Females, 2004
Age (years)
ICCC Group and Subgroup 0-14 0-19
X Germ cell, trophoblastic tumors & neoplasms of gonads 5.5 ( 5.0- 6.2) 11.0 ( 10.3- 11.7)
X(a) Intracranial & intraspinal germ cell tumors 1.6 ( 1.3- 1.9) 1.8 ( 1.5- 2.1)
X(b) Malignant extracranial & extragonadal germ cell tumors 1.3 ( 1.0- 1.6) 1.2 ( 1.0- 1.5)
X(c) Malignant gonadal germ cell tumors 2.5 ( 2.1- 2.9) 7.3 ( 6.7- 7.9)
X(d) Gonadal carcinomas ∼ 0.4 ( 0.3- 0.5)
X(e) Other and unspecified malignant gonadal tumors ∼ 0.3 ( 0.2- 0.4)
XI Other malignant epithelial neoplasms and malignant melanomas 7.3 ( 6.6- 8.0) 17.5 ( 16.6- 18.4)
XI(a) Adrenocortical carcinomas ∼ 0.2 ( 0.1- 0.3)
XI(b) Thyroid carcinomas 2.5 ( 2.1- 2.9) 6.5 ( 6.0- 7.1)
XI(c) Nasopharyngeal carcinomas 0.4 ( 0.2- 0.5) 0.5 ( 0.4- 0.7)
XI(d) Malignant melanomas 2.4 ( 2.1- 2.9) 6.3 ( 5.7- 6.8)
XI(e) Skin carcinomas ∼ ∼XI(f) Other and unspecified carcinomas 1.6 ( 1.3- 2.0) 3.8 ( 3.4- 4.3)
XII Other and unspecified malignant neoplasms 0.6 ( 0.4- 0.8) 0.7 ( 0.5- 0.9)
XII(a) Other specified malignant tumors 0.3 ( 0.2- 0.5) 0.4 ( 0.2- 0.5)
XII(b) Other unspecified malignant tumors 0.3 ( 0.2- 0.5) 0.3 ( 0.2- 0.5)
Not classified by ICCC 0.4 ( 0.2- 0.5) 0.4 ( 0.3- 0.6)
∗ Rates are per 1,000,000 persons and are age-adjusted to the 2000 U.S. standard population (19 age groups - Census P25-1130).† 2005 International Classification of Childhood Cancer based on ICD-O-3. See Technical Notes and Appendix C.‡ Data are from all state and metropolitan area cancer registries, except Maryland. Included data cover approximately 98% of the population and met
data quality criteria for all invasive cancer sites combined. See Appendix B for registry-specific data quality information.
∼ Rates are suppressed if fewer than 16 cases were reported in a specific category (site, age).

United
States Cancer Statistics: 2004 Incid
ence and M
ortality
��
continued
Table 1.2.3.1 : Invasive Cancer Incidence Rates∗ and 95% Confidence Intervals by International Classification ofChildhood Cancer (ICCC†) Group and Subgroup, and Age, United States‡
All Races, Males and Females, 2004
Age (years)
ICCC Group and Subgroup <1 1-4 5-9 10-14 15-19
All ICCC Groups Combined 244.8 (229.7-260.6) 210.6 (203.5-217.9) 114.1 (109.4-119.0) 129.6 (124.8-134.6) 209.4 (203.1-215.7)
I Leukemias, myeloproliferative & myelodysplastic
diseases 46.9 ( 40.4- 54.1) 89.3 ( 84.7- 94.1) 39.3 ( 36.6- 42.2) 28.5 ( 26.3- 30.9) 29.7 ( 27.4- 32.2)
I(a) Lymphoid leukemias 19.7 ( 15.6- 24.6) 74.2 ( 70.0- 78.6) 31.7 ( 29.2- 34.3) 18.2 ( 16.4- 20.1) 16.1 ( 14.4- 17.9)
I(b) Acute myeloid leukemias 16.7 ( 13.0- 21.2) 10.1 ( 8.6- 11.8) 5.0 ( 4.0- 6.1) 6.8 ( 5.7- 8.0) 9.1 ( 7.8- 10.5)
I(c) Chronic myeloproliferative diseases ∼ ∼ 1.0 ( 0.6- 1.5) 1.9 ( 1.3- 2.6) 2.9 ( 2.2- 3.7)
I(d) Myelodysplastic syndrome and other
myeloproliferative diseases 4.5 ( 2.7- 7.1) 2.4 ( 1.7- 3.3) 0.8 ( 0.5- 1.4) ∼ 0.8 ( 0.5- 1.3)
I(e) Unspecified and other specified leukemias ∼ 1.7 ( 1.1- 2.4) 0.8 ( 0.5- 1.4) 1.2 ( 0.7- 1.7) 0.9 ( 0.5- 1.4)
II Lymphomas and reticuloendothelial neoplasms 8.2 ( 5.7- 11.6) 9.5 ( 8.0- 11.2) 13.2 ( 11.7- 15.0) 24.3 ( 22.2- 26.5) 46.7 ( 43.8- 49.8)
II(a) Hodgkin lymphomas ∼ ∼ 3.5 ( 2.7- 4.5) 11.2 ( 9.8- 12.8) 30.5 ( 28.2- 33.0)
II(b) Non-Hodgkin lymphomas (except Burkitt
lymphoma) ∼ 4.2 ( 3.3- 5.4) 6.0 ( 4.9- 7.2) 10.2 ( 8.9- 11.7) 13.1 ( 11.6- 14.8)
II(c) Burkitt lymphoma ∼ 2.2 ( 1.6- 3.1) 2.9 ( 2.2- 3.8) 2.4 ( 1.7- 3.1) 2.1 ( 1.5- 2.8)
II(d) Miscellaneous lymphoreticular neoplasms 5.2 ( 3.2- 8.0) 2.0 ( 1.3- 2.8) ∼ ∼ ∼II(e) Unspecified lymphomas ∼ ∼ ∼ ∼ ∼
III CNS and misc intracranial and intraspinal
neoplasms 34.7 ( 29.2- 41.0) 40.3 ( 37.2- 43.6) 32.9 ( 30.4- 35.6) 24.4 ( 22.3- 26.6) 22.2 ( 20.2- 24.3)
III(a) Ependymomas and choroid plexus tumor 6.0 ( 3.8- 8.9) 4.9 ( 3.9- 6.1) 2.2 ( 1.6- 3.0) 1.5 ( 1.1- 2.2) 1.9 ( 1.4- 2.6)
III(b) Astrocytomas 13.5 ( 10.1- 17.6) 18.0 ( 15.9- 20.2) 15.4 ( 13.7- 17.3) 13.0 ( 11.5- 14.6) 12.8 ( 11.3- 14.5)
III(c) Intracranial and intraspinal embryonal
tumors 10.2 ( 7.3- 13.9) 11.1 ( 9.5- 12.9) 7.6 ( 6.4- 8.9) 4.5 ( 3.7- 5.6) 3.0 ( 2.3- 3.9)
III(d) Other gliomas ∼ 4.7 ( 3.6- 5.9) 6.6 ( 5.5- 7.9) 4.2 ( 3.4- 5.2) 3.6 ( 2.9- 4.6)
III(e) Other specified intracranial &
intraspinal neoplasms ∼ 1.0 ( 0.6- 1.7) ∼ 0.8 ( 0.4- 1.3) ∼III(f) Unspecified intracranial and intraspinal
neoplasms ∼ ∼ ∼ ∼ ∼IV Neuroblastoma and other peripheral nervous
cell tumors 57.6 ( 50.5- 65.6) 21.2 ( 19.0- 23.6) 3.2 ( 2.5- 4.1) 1.0 ( 0.6- 1.5) 0.8 ( 0.5- 1.3)
IV(a) Neuroblastoma and ganglioneuroblastoma 56.9 ( 49.8- 64.8) 21.1 ( 18.9- 23.5) 3.2 ( 2.5- 4.1) ∼ ∼IV(b) Other peripheral nervous cell tumors ∼ ∼ ∼ ∼ ∼
V Retinoblastoma 25.5 ( 20.8- 30.9) 8.9 ( 7.5- 10.5) ∼ ∼ ∼VI Renal tumors 12.7 ( 9.5- 16.7) 18.9 ( 16.8- 21.2) 4.6 ( 3.7- 5.7) 1.4 ( 0.9- 2.0) 1.5 ( 1.0- 2.1)
VI(a) Nephroblastoma and other nonepithelial
renal tumors 12.5 ( 9.3- 16.5) 18.8 ( 16.7- 21.0) 4.5 ( 3.6- 5.5) ∼ ∼VI(b) Renal carcinomas ∼ ∼ ∼ ∼ 1.1 ( 0.7- 1.6)
VI(c) Unspecified malignant renal tumors ∼ ∼ ∼ ∼ ∼VII Hepatic tumors 14.2 ( 10.8- 18.4) 5.4 ( 4.3- 6.6) ∼ ∼ 1.6 ( 1.1- 2.2)
VII(a) Hepatoblastoma 13.2 ( 9.9- 17.3) 5.2 ( 4.1- 6.4) ∼ ∼ ∼VII(b) Hepatic carcinomas ∼ ∼ ∼ ∼ 1.6 ( 1.1- 2.2)
VII(c) Unspecified malignant hepatic tumors ∼ ∼ ∼ ∼ ∼VIII Malignant bone tumors ∼ 1.3 ( 0.8- 2.0) 5.1 ( 4.1- 6.2) 13.8 ( 12.2- 15.4) 14.4 ( 12.8- 16.1)
VIII(a) Osteosarcomas ∼ ∼ 3.1 ( 2.3- 4.0) 8.6 ( 7.4- 9.9) 8.0 ( 6.8- 9.3)
VIII(b) Chondrosarcomas ∼ ∼ ∼ ∼ 1.2 ( 0.8- 1.8)

Cancer Incidence and M
ortality for All A
ges: All A
reas Com
bined��
Table 1.2.3.1 : Invasive Cancer Incidence Rates∗ and 95% Confidence Intervals by International Classification ofChildhood Cancer (ICCC†) Group and Subgroup, and Age, United States‡ (continued)
All Races, Males and Females, 2004
Age (years)
ICCC Group and Subgroup <1 1-4 5-9 10-14 15-19
VIII(c) Ewing tumor and related sarcomas of bone ∼ ∼ 1.7 ( 1.1- 2.3) 4.0 ( 3.1- 4.9) 3.7 ( 2.9- 4.7)
VIII(d) Other specified malignant bone tumors ∼ ∼ ∼ ∼ 1.0 ( 0.6- 1.6)
VIII(e) Unspecified malignant bone tumors ∼ ∼ ∼ ∼ ∼IX Soft tissue and other extraosseous sarcomas 17.7 ( 13.8- 22.3) 9.3 ( 7.9- 11.0) 7.2 ( 6.1- 8.5) 12.5 ( 11.0- 14.1) 15.9 ( 14.2- 17.8)
IX(a) Rhabdomyosarcomas 4.0 ( 2.3- 6.5) 7.0 ( 5.8- 8.5) 3.8 ( 3.0- 4.8) 3.5 ( 2.7- 4.4) 3.3 ( 2.6- 4.2)
IX(b) Fibrosarcomas, peripheral nerve sheath
tumors & other fibrous neoplams 6.2 ( 4.0- 9.2) ∼ ∼ 1.8 ( 1.3- 2.5) 1.5 ( 1.0- 2.1)
IX(c) Kaposi sarcoma ∼ ∼ ∼ ∼ ∼IX(d) Other specified soft tissue sarcomas 5.2 ( 3.2- 8.0) 1.8 ( 1.2- 2.6) 2.3 ( 1.7- 3.1) 5.6 ( 4.6- 6.7) 9.3 ( 8.0- 10.7)
IX(e) Unspecified soft tissue sarcomas ∼ ∼ ∼ 1.6 ( 1.1- 2.2) 1.7 ( 1.2- 2.4)
X Germ cell, trophoblastic tumors & neoplasms of
gonads 18.0 ( 14.1- 22.6) 3.1 ( 2.3- 4.1) 2.1 ( 1.5- 2.9) 8.4 ( 7.2- 9.8) 27.2 ( 25.0- 29.6)
X(a) Intracranial & intraspinal germ cell tumors ∼ ∼ 0.9 ( 0.6- 1.5) 2.9 ( 2.2- 3.7) 2.4 ( 1.7- 3.1)
X(b) Malignant extracranial & extragonadal germ
cell tumors 11.0 ( 8.0- 14.7) 1.6 ( 1.0- 2.4) ∼ ∼ 1.2 ( 0.8- 1.8)
X(c) Malignant gonadal germ cell tumors 4.2 ( 2.5- 6.8) 1.1 ( 0.7- 1.8) 1.0 ( 0.6- 1.5) 4.6 ( 3.7- 5.6) 21.8 ( 19.8- 23.9)
X(d) Gonadal carcinomas ∼ ∼ ∼ ∼ 1.1 ( 0.7- 1.7)
X(e) Other and unspecified malignant gonadal
tumors ∼ ∼ ∼ ∼ ∼XI Other malignant epithelial neoplasms and
malignant melanomas 5.7 ( 3.6- 8.6) 2.4 ( 1.7- 3.3) 4.8 ( 3.9- 5.9) 13.8 ( 12.2- 15.4) 47.9 ( 45.0- 51.0)
XI(a) Adrenocortical carcinomas ∼ ∼ ∼ ∼ ∼XI(b) Thyroid carcinomas ∼ ∼ 1.7 ( 1.2- 2.4) 5.4 ( 4.4- 6.5) 18.6 ( 16.8- 20.6)
XI(c) Nasopharyngeal carcinomas ∼ ∼ ∼ 1.0 ( 0.6- 1.5) 1.1 ( 0.7- 1.6)
XI(d) Malignant melanomas ∼ 1.3 ( 0.8- 2.0) 1.8 ( 1.3- 2.5) 4.0 ( 3.1- 4.9) 17.7 ( 15.9- 19.6)
XI(e) Skin carcinomas ∼ ∼ ∼ ∼ ∼XI(f) Other and unspecified carcinomas ∼ ∼ 1.1 ( 0.7- 1.7) 3.0 ( 2.3- 3.9) 10.4 ( 9.0- 11.9)
XII Other and unspecified malignant neoplasms ∼ ∼ ∼ ∼ 0.9 ( 0.6- 1.5)
XII(a) Other specified malignant tumors ∼ ∼ ∼ ∼ ∼XII(b) Other unspecified malignant tumors ∼ ∼ ∼ ∼ ∼
Not classified by ICCC ∼ ∼ ∼ ∼ ∼∗ Rates are per 1,000,000 persons.† 2005 International Classification of Childhood Cancer based on ICD-O-3. See Technical Notes and Appendix C.‡ Data are from all state and metropolitan area cancer registries, except Maryland. Included data cover approximately 98% of the population and met data quality
criteria for all invasive cancer sites combined. See Appendix B for registry-specific data quality information.
∼ Rates are suppressed if fewer than 16 cases were reported in a specific category (site, age).

United
States Cancer Statistics: 2004 Incid
ence and M
ortality
��
continued
Table 1.2.4.1M: Childhood Age-Adjusted Invasive Cancer Incidence Rates∗ and 95% Confidence Intervals forAges 0-19 by Primary Site and Race and Ethnicity, United States†
Males, 2004
Asian/Pacific American Indian/Primary Site All Races White Black Islander‡ Alaska Native‡ Hispanic‡§
All Sites 17.6 (17.2-18.0) 18.3 (17.9-18.8) 12.8 (12.0-13.7) 13.1 (11.5-14.8) 10.8 ( 8.2-14.1) 17.6 (16.7-18.6)
Bones and Joints 0.9 ( 0.8- 1.0) 0.9 ( 0.8- 1.0) 0.9 ( 0.7- 1.2) ∼ ∼ 1.0 ( 0.7- 1.2)
Brain and Other Nervous System 3.1 ( 2.9- 3.3) 3.2 ( 3.0- 3.4) 2.4 ( 2.0- 2.8) 1.6 ( 1.1- 2.3) ∼ 2.5 ( 2.1- 2.8)
Hodgkin Lymphoma 1.2 ( 1.1- 1.3) 1.2 ( 1.1- 1.3) 1.0 ( 0.8- 1.3) 0.9 ( 0.5- 1.4) ∼ 1.0 ( 0.8- 1.2)
Kidney and Renal Pelvis 0.6 ( 0.6- 0.7) 0.6 ( 0.5- 0.7) 0.8 ( 0.6- 1.0) ∼ ∼ 0.4 ( 0.3- 0.6)
Leukemia 4.8 ( 4.6- 5.1) 5.1 ( 4.9- 5.4) 3.0 ( 2.6- 3.4) 4.3 ( 3.4- 5.4) 4.2 ( 2.6- 6.5) 6.1 ( 5.5- 6.6)
Acute Lymphocytic 3.6 ( 3.4- 3.8) 3.9 ( 3.7- 4.1) 1.9 ( 1.6- 2.2) 2.6 ( 2.0- 3.5) 3.4 ( 2.0- 5.4) 4.6 ( 4.1- 5.1)
Acute Myeloid 0.8 ( 0.7- 0.9) 0.8 ( 0.7- 0.9) 0.7 ( 0.5- 1.0) 1.1 ( 0.7- 1.7) ∼ 1.0 ( 0.8- 1.3)
Non-Hodgkin Lymphoma 1.4 ( 1.3- 1.6) 1.4 ( 1.3- 1.6) 1.5 ( 1.2- 1.8) 0.9 ( 0.5- 1.5) ∼ 1.5 ( 1.2- 1.8)
Soft Tissue 1.0 ( 0.9- 1.1) 1.0 ( 0.9- 1.1) 0.8 ( 0.6- 1.0) 1.0 ( 0.6- 1.5) ∼ 1.1 ( 0.8- 1.3)
Other 4.5 ( 4.3- 4.7) 4.8 ( 4.5- 5.0) 2.6 ( 2.2- 3.0) 3.4 ( 2.6- 4.3) ∼ 4.2 ( 3.7- 4.7)
∗ Rates are per 100,000 persons and are age-adjusted to the 2000 U.S. standard population (19 age groups - Census P25-1130).† Data are from all state and metropolitan area cancer registries, except Maryland. Included data cover approximately 98% of the population and met data
quality criteria for all invasive cancer sites combined. See Appendix B for registry-specific data quality information.‡ Data for specified racial or ethnic populations other than white and black should be interpreted with caution. See Technical Notes.
§ Hispanic origin is not mutually exclusive from race categories (white, black, Asian/Pacific Islander, American Indian/Alaska Native).
∼ Rates are suppressed if fewer than 16 cases were reported in a specific category (site, race, ethnicity).
Table 1.2.4.2M: Childhood Age-Adjusted Cancer Death Rates∗ and 95% Confidence Intervals for Ages 0-19 byPrimary Site and Race and Ethnicity, United States†
Males, 2004
Asian/Pacific American Indian/Primary Site All Races White Black Islander‡ Alaska Native‡ Hispanic‡§
All Sites 3.0 ( 2.8- 3.2) 3.1 ( 2.9- 3.3) 2.9 ( 2.5- 3.3) 2.9 ( 2.2- 3.8) ∼ 3.3 ( 2.9- 3.7)
Bones and Joints 0.3 ( 0.2- 0.3) 0.3 ( 0.2- 0.3) 0.3 ( 0.2- 0.5) ∼ ∼ 0.4 ( 0.2- 0.5)
Brain and Other Nervous System 0.7 ( 0.6- 0.8) 0.7 ( 0.7- 0.8) 0.6 ( 0.4- 0.8) ∼ ∼ 0.6 ( 0.5- 0.8)
Hodgkin Lymphoma ∼ ∼ ∼ ∼ ∼ ∼Kidney and Renal Pelvis 0.1 ( 0.0- 0.1) 0.1 ( 0.0- 0.1) ∼ ∼ ∼ ∼Leukemia 0.9 ( 0.8- 1.0) 1.0 ( 0.8- 1.1) 0.8 ( 0.6- 1.1) 0.9 ( 0.6- 1.5) ∼ 1.5 ( 1.2- 1.8)
Acute Lymphocytic 0.4 ( 0.4- 0.5) 0.5 ( 0.4- 0.5) ∼ ∼ ∼ 0.8 ( 0.6- 1.0)
Acute Myeloid 0.3 ( 0.2- 0.3) 0.3 ( 0.2- 0.3) 0.4 ( 0.2- 0.5) ∼ ∼ 0.3 ( 0.2- 0.5)
Non-Hodgkin Lymphoma 0.2 ( 0.1- 0.2) 0.2 ( 0.1- 0.2) ∼ ∼ ∼ ∼Soft Tissue 0.2 ( 0.2- 0.2) 0.2 ( 0.1- 0.2) 0.3 ( 0.1- 0.4) ∼ ∼ ∼Other 0.6 ( 0.6- 0.7) 0.6 ( 0.5- 0.7) 0.7 ( 0.5- 0.9) ∼ ∼ 0.4 ( 0.2- 0.5)
∗ Rates are per 100,000 persons and are age-adjusted to the 2000 U.S. standard population (19 age groups - Census P25-1130).† Data are from the National Vital Statistics System (NVSS).‡ Data for specified racial or ethnic populations other than white and black should be interpreted with caution. See Technical Notes.
§ Hispanic origin is not mutually exclusive from race categories (white, black, Asian/Pacific Islander, American Indian/Alaska Native).
∼ Rates are suppressed if fewer than 16 cases were reported in a specific category (site, race, ethnicity).

Cancer Incidence and M
ortality for All A
ges: All A
reas Com
bined��
Table 1.2.4.1F: Childhood Age-Adjusted Invasive Cancer Incidence Rates∗ and 95% Confidence Intervals forAges 0-19 by Primary Site and Race and Ethnicity, United States†
Females, 2004
Asian/Pacific American Indian/Primary Site All Races White Black Islander‡ Alaska Native‡ Hispanic‡§
All Sites 15.7 (15.3-16.1) 16.2 (15.7-16.7) 12.2 (11.3-13.1) 11.8 (10.2-13.5) 9.1 ( 6.7-12.1) 15.9 (15.0-16.8)
Bones and Joints 0.9 ( 0.8- 0.9) 0.8 ( 0.7- 1.0) 0.9 ( 0.7- 1.2) ∼ ∼ 1.0 ( 0.8- 1.2)
Brain and Other Nervous System 2.9 ( 2.8- 3.1) 3.0 ( 2.8- 3.2) 2.2 ( 1.9- 2.6) 2.4 ( 1.8- 3.2) ∼ 2.9 ( 2.5- 3.3)
Hodgkin Lymphoma 1.1 ( 1.0- 1.2) 1.2 ( 1.1- 1.3) 0.8 ( 0.6- 1.1) ∼ ∼ 0.9 ( 0.7- 1.2)
Kidney and Renal Pelvis 0.6 ( 0.6- 0.7) 0.6 ( 0.6- 0.7) 0.7 ( 0.5- 0.9) ∼ ∼ 0.6 ( 0.4- 0.8)
Leukemia 3.6 ( 3.5- 3.8) 3.8 ( 3.6- 4.1) 2.3 ( 1.9- 2.7) 3.6 ( 2.8- 4.6) ∼ 4.5 ( 4.0- 5.0)
Acute Lymphocytic 2.7 ( 2.5- 2.9) 2.9 ( 2.7- 3.1) 1.3 ( 1.1- 1.7) 2.6 ( 1.9- 3.5) ∼ 3.4 ( 3.0- 3.8)
Acute Myeloid 0.6 ( 0.5- 0.7) 0.6 ( 0.5- 0.7) 0.5 ( 0.4- 0.7) ∼ ∼ 0.8 ( 0.6- 1.0)
Non-Hodgkin Lymphoma 0.8 ( 0.7- 0.8) 0.7 ( 0.6- 0.8) 0.9 ( 0.6- 1.1) ∼ ∼ 0.6 ( 0.5- 0.8)
Soft Tissue 1.0 ( 0.9- 1.1) 1.0 ( 0.9- 1.1) 1.2 ( 0.9- 1.5) ∼ ∼ 0.9 ( 0.7- 1.2)
Other 4.7 ( 4.5- 5.0) 4.9 ( 4.7- 5.2) 3.2 ( 2.8- 3.7) 3.3 ( 2.5- 4.3) ∼ 4.5 ( 4.0- 5.0)
∗ Rates are per 100,000 persons and are age-adjusted to the 2000 U.S. standard population (19 age groups - Census P25-1130).† Data are from all state and metropolitan area cancer registries, except Maryland. Included data cover approximately 98% of the population and met data
quality criteria for all invasive cancer sites combined. See Appendix B for registry-specific data quality information.‡ Data for specified racial or ethnic populations other than white and black should be interpreted with caution. See Technical Notes.
§ Hispanic origin is not mutually exclusive from race categories (white, black, Asian/Pacific Islander, American Indian/Alaska Native).
∼ Rates are suppressed if fewer than 16 cases were reported in a specific category (site, race, ethnicity).
Table 1.2.4.2F: Childhood Age-Adjusted Cancer Death Rates∗ and 95% Confidence Intervals for Ages 0-19 byPrimary Site and Race and Ethnicity, United States†
Females, 2004
Asian/Pacific American Indian/Primary Site All Races White Black Islander‡ Alaska Native‡ Hispanic‡§
All Sites 2.4 ( 2.3- 2.6) 2.4 ( 2.3- 2.6) 2.7 ( 2.3- 3.1) 1.9 ( 1.3- 2.6) ∼ 2.5 ( 2.2- 2.9)
Bones and Joints 0.2 ( 0.1- 0.2) 0.2 ( 0.1- 0.2) ∼ ∼ ∼ ∼Brain and Other Nervous System 0.6 ( 0.6- 0.7) 0.6 ( 0.6- 0.7) 0.7 ( 0.5- 0.9) ∼ ∼ 0.7 ( 0.5- 0.9)
Hodgkin Lymphoma ∼ ∼ ∼ ∼ ∼ ∼Kidney and Renal Pelvis 0.1 ( 0.1- 0.1) 0.1 ( 0.1- 0.1) ∼ ∼ ∼ ∼Leukemia 0.7 ( 0.6- 0.8) 0.7 ( 0.6- 0.8) 0.7 ( 0.5- 0.9) ∼ ∼ 1.0 ( 0.7- 1.2)
Acute Lymphocytic 0.3 ( 0.2- 0.4) 0.3 ( 0.3- 0.4) ∼ ∼ ∼ 0.6 ( 0.4- 0.8)
Acute Myeloid 0.2 ( 0.2- 0.3) 0.2 ( 0.2- 0.3) 0.4 ( 0.2- 0.5) ∼ ∼ ∼Non-Hodgkin Lymphoma 0.1 ( 0.1- 0.1) 0.1 ( 0.1- 0.1) ∼ ∼ ∼ ∼Soft Tissue 0.2 ( 0.2- 0.3) 0.2 ( 0.1- 0.2) 0.3 ( 0.2- 0.5) ∼ ∼ ∼Other 0.5 ( 0.4- 0.6) 0.5 ( 0.4- 0.6) 0.6 ( 0.5- 0.9) ∼ ∼ 0.4 ( 0.3- 0.6)
∗ Rates are per 100,000 persons and are age-adjusted to the 2000 U.S. standard population (19 age groups - Census P25-1130).† Data are from the National Vital Statistics System (NVSS).‡ Data for specified racial or ethnic populations other than white and black should be interpreted with caution. See Technical Notes.
§ Hispanic origin is not mutually exclusive from race categories (white, black, Asian/Pacific Islander, American Indian/Alaska Native).
∼ Rates are suppressed if fewer than 16 cases were reported in a specific category (site, race, ethnicity).

United
States Cancer Statistics: 2004 Incid
ence and M
ortality
��
continued
Table 1.2.5.1: Childhood Age-Adjusted Invasive Cancer Incidence Rates∗ and 95% ConfidenceIntervals by Primary Site and Age, United States†
All Races, Males and Females, 2004
Age (years)
Primary Site 0-14 0-19
All Sites 15.3 (15.0-15.6) 16.7 (16.4-17.0)
Bones and Joints 0.7 ( 0.6- 0.8) 0.9 ( 0.8- 1.0)
Brain and Other Nervous System 3.3 ( 3.1- 3.4) 3.0 ( 2.9- 3.1)
Hodgkin Lymphoma 0.5 ( 0.5- 0.6) 1.2 ( 1.1- 1.2)
Kidney and Renal Pelvis 0.8 ( 0.7- 0.9) 0.6 ( 0.6- 0.7)
Leukemia 4.8 ( 4.6- 4.9) 4.3 ( 4.1- 4.4)
Acute Lymphocytic 3.7 ( 3.6- 3.9) 3.2 ( 3.0- 3.3)
Acute Myeloid 0.7 ( 0.6- 0.7) 0.7 ( 0.7- 0.8)
Non-Hodgkin Lymphoma 0.9 ( 0.9- 1.0) 1.1 ( 1.0- 1.2)
Soft Tissue 1.0 ( 0.9- 1.0) 1.0 ( 0.9- 1.1)
Other 3.3 ( 3.2- 3.5) 4.6 ( 4.5- 4.8)
∗ Rates are per 100,000 persons and are age-adjusted to the 2000 U.S. standard population (19 age groups - Census P25-1130).† Data are from all state and metropolitan area cancer registries, except Maryland. Included data cover approximately 98% of the
population and met data quality criteria for all invasive cancer sites combined. See Appendix B for registry-specific data quality
information.
∼ Rates are suppressed if fewer than 16 cases were reported in a specific category (site, age).
Table 1.2.5.2: Childhood Age-Adjusted Cancer Death Rates∗ and 95% Confidence Intervals byPrimary Site and Age, United States†
All Races, Males and Females, 2004
Age (years)
Primary Site 0-14 0-19
All Sites 2.5 (2.3-2.6) 2.7 (2.6-2.8)
Bones and Joints 0.1 (0.1-0.2) 0.2 (0.2-0.3)
Brain and Other Nervous System 0.7 (0.7-0.8) 0.7 (0.6-0.7)
Hodgkin Lymphoma ∼ 0.0 (0.0-0.0)
Kidney and Renal Pelvis 0.1 (0.1-0.1) 0.1 (0.1-0.1)
Leukemia 0.7 (0.7-0.8) 0.8 (0.8-0.9)
Acute Lymphocytic 0.3 (0.3-0.4) 0.4 (0.3-0.4)
Acute Myeloid 0.2 (0.2-0.3) 0.3 (0.2-0.3)
Non-Hodgkin Lymphoma 0.1 (0.1-0.1) 0.1 (0.1-0.1)
Soft Tissue 0.2 (0.1-0.2) 0.2 (0.2-0.2)
Other 0.5 (0.5-0.6) 0.6 (0.5-0.6)
∗ Rates are per 100,000 persons and are age-adjusted to the 2000 U.S. standard population (19 age groups - Census P25-1130).† Data are from the National Vital Statistics System (NVSS).
∼ Rates are suppressed if fewer than 16 cases were reported in a specific category (site, age).

Cancer Incidence and M
ortality for All A
ges: All A
reas Com
bined��
Table 1.2.6.1: Childhood Invasive Cancer Incidence Rates∗ and 95% Confidence Intervals by PrimarySite and Age, United States†
All Races, Males and Females, 2004
Age (years)
Primary Site <1 1-4 5-9 10-14 15-19
All Sites 24.5 (23.0-26.1) 21.1 (20.3-21.8) 11.4 (10.9-11.9) 13.0 (12.5-13.5) 20.9 (20.3-21.6)
Bones and Joints ∼ 0.2 ( 0.1- 0.3) 0.5 ( 0.4- 0.6) 1.4 ( 1.2- 1.6) 1.5 ( 1.3- 1.6)
Brain and Other Nervous System 4.0 ( 3.4- 4.6) 4.1 ( 3.8- 4.4) 3.3 ( 3.0- 3.6) 2.5 ( 2.3- 2.8) 2.2 ( 2.0- 2.4)
Hodgkin Lymphoma ∼ ∼ 0.4 ( 0.3- 0.4) 1.1 ( 1.0- 1.3) 3.1 ( 2.8- 3.3)
Kidney and Renal Pelvis 1.2 ( 0.9- 1.6) 2.0 ( 1.7- 2.2) 0.5 ( 0.4- 0.6) 0.2 ( 0.1- 0.2) 0.2 ( 0.1- 0.2)
Leukemia 4.2 ( 3.6- 4.9) 8.7 ( 8.3- 9.2) 3.8 ( 3.5- 4.1) 2.8 ( 2.5- 3.0) 2.8 ( 2.6- 3.0)
Acute Lymphocytic 1.9 ( 1.5- 2.4) 7.4 ( 7.0- 7.8) 3.1 ( 2.9- 3.4) 1.8 ( 1.6- 2.0) 1.6 ( 1.4- 1.8)
Acute Myeloid 1.3 ( 1.0- 1.8) 0.9 ( 0.7- 1.0) 0.4 ( 0.3- 0.5) 0.6 ( 0.5- 0.7) 0.8 ( 0.7- 1.0)
Non-Hodgkin Lymphoma ∼ 0.7 ( 0.5- 0.8) 0.9 ( 0.8- 1.1) 1.3 ( 1.1- 1.4) 1.6 ( 1.4- 1.8)
Soft Tissue 3.1 ( 2.6- 3.7) 1.1 ( 0.9- 1.2) 0.5 ( 0.4- 0.6) 0.9 ( 0.8- 1.1) 1.2 ( 1.0- 1.3)
Other 11.6 (10.5-12.7) 4.3 ( 4.0- 4.6) 1.5 ( 1.4- 1.7) 2.8 ( 2.6- 3.0) 8.5 ( 8.1- 8.9)
∗ Rates are per 100,000 persons.† Data are from all state and metropolitan area cancer registries, except Maryland. Included data cover approximately 98% of the population and met
data quality criteria for all invasive cancer sites combined. See Appendix B for registry-specific data quality information.
∼ Rates are suppressed if fewer than 16 cases were reported in a specific category (site, age).
Table 1.2.6.2: Childhood Cancer Death Rates∗ and 95% Confidence Intervals by Primary Site and Age,United States†
All Races, Males and Females, 2004
Age (years)
Primary Site <1 1-4 5-9 10-14 15-19
All Sites 1.8 (1.4-2.3) 2.5 (2.3-2.8) 2.7 (2.5-2.9) 2.3 (2.1-2.5) 3.5 (3.3-3.8)
Bones and Joints ∼ ∼ ∼ 0.3 (0.2-0.3) 0.6 (0.5-0.7)
Brain and Other Nervous System 0.5 (0.3-0.7) 0.6 (0.5-0.8) 0.9 (0.8-1.1) 0.7 (0.6-0.8) 0.5 (0.4-0.6)
Hodgkin Lymphoma ∼ ∼ ∼ ∼ 0.1 (0.0-0.1)
Kidney and Renal Pelvis ∼ 0.1 (0.1-0.2) 0.1 (0.1-0.2) ∼ ∼Leukemia 0.6 (0.4-0.8) 0.8 (0.6-0.9) 0.8 (0.7-0.9) 0.7 (0.6-0.9) 1.0 (0.9-1.2)
Acute Lymphocytic ∼ 0.3 (0.2-0.4) 0.4 (0.3-0.5) 0.3 (0.3-0.4) 0.4 (0.4-0.5)
Acute Myeloid ∼ 0.3 (0.3-0.4) 0.2 (0.1-0.2) 0.2 (0.2-0.3) 0.3 (0.2-0.4)
Non-Hodgkin Lymphoma ∼ ∼ 0.1 (0.1-0.2) 0.1 (0.1-0.1) 0.3 (0.2-0.4)
Soft Tissue ∼ 0.2 (0.1-0.2) 0.1 (0.1-0.2) 0.2 (0.1-0.3) 0.3 (0.2-0.4)
Other 0.5 (0.3-0.8) 0.8 (0.7-1.0) 0.5 (0.4-0.6) 0.3 (0.3-0.4) 0.7 (0.6-0.9)
∗ Rates are per 100,000 persons.† Data are from the National Vital Statistics System (NVSS).
∼ Rates are suppressed if fewer than 16 cases were reported in a specific category (site, age).
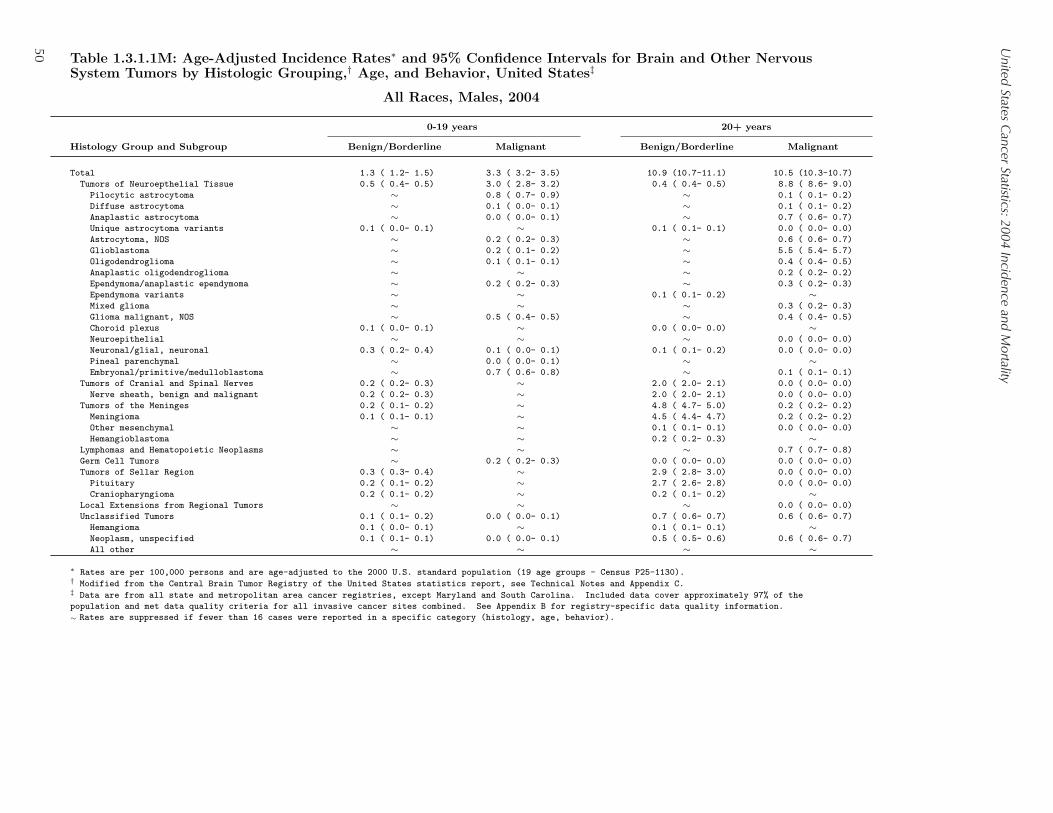
United
States Cancer Statistics: 2004 Incid
ence and M
ortality
�0
continued
Table 1.3.1.1M: Age-Adjusted Incidence Rates∗ and 95% Confidence Intervals for Brain and Other NervousSystem Tumors by Histologic Grouping,† Age, and Behavior, United States‡
All Races, Males, 2004
0-19 years 20+ years
Histology Group and Subgroup Benign/Borderline Malignant Benign/Borderline Malignant
Total 1.3 ( 1.2- 1.5) 3.3 ( 3.2- 3.5) 10.9 (10.7-11.1) 10.5 (10.3-10.7)
Tumors of Neuroepthelial Tissue 0.5 ( 0.4- 0.5) 3.0 ( 2.8- 3.2) 0.4 ( 0.4- 0.5) 8.8 ( 8.6- 9.0)
Pilocytic astrocytoma ∼ 0.8 ( 0.7- 0.9) ∼ 0.1 ( 0.1- 0.2)
Diffuse astrocytoma ∼ 0.1 ( 0.0- 0.1) ∼ 0.1 ( 0.1- 0.2)
Anaplastic astrocytoma ∼ 0.0 ( 0.0- 0.1) ∼ 0.7 ( 0.6- 0.7)
Unique astrocytoma variants 0.1 ( 0.0- 0.1) ∼ 0.1 ( 0.1- 0.1) 0.0 ( 0.0- 0.0)
Astrocytoma, NOS ∼ 0.2 ( 0.2- 0.3) ∼ 0.6 ( 0.6- 0.7)
Glioblastoma ∼ 0.2 ( 0.1- 0.2) ∼ 5.5 ( 5.4- 5.7)
Oligodendroglioma ∼ 0.1 ( 0.1- 0.1) ∼ 0.4 ( 0.4- 0.5)
Anaplastic oligodendroglioma ∼ ∼ ∼ 0.2 ( 0.2- 0.2)
Ependymoma/anaplastic ependymoma ∼ 0.2 ( 0.2- 0.3) ∼ 0.3 ( 0.2- 0.3)
Ependymoma variants ∼ ∼ 0.1 ( 0.1- 0.2) ∼Mixed glioma ∼ ∼ ∼ 0.3 ( 0.2- 0.3)
Glioma malignant, NOS ∼ 0.5 ( 0.4- 0.5) ∼ 0.4 ( 0.4- 0.5)
Choroid plexus 0.1 ( 0.0- 0.1) ∼ 0.0 ( 0.0- 0.0) ∼Neuroepithelial ∼ ∼ ∼ 0.0 ( 0.0- 0.0)
Neuronal/glial, neuronal 0.3 ( 0.2- 0.4) 0.1 ( 0.0- 0.1) 0.1 ( 0.1- 0.2) 0.0 ( 0.0- 0.0)
Pineal parenchymal ∼ 0.0 ( 0.0- 0.1) ∼ ∼Embryonal/primitive/medulloblastoma ∼ 0.7 ( 0.6- 0.8) ∼ 0.1 ( 0.1- 0.1)
Tumors of Cranial and Spinal Nerves 0.2 ( 0.2- 0.3) ∼ 2.0 ( 2.0- 2.1) 0.0 ( 0.0- 0.0)
Nerve sheath, benign and malignant 0.2 ( 0.2- 0.3) ∼ 2.0 ( 2.0- 2.1) 0.0 ( 0.0- 0.0)
Tumors of the Meninges 0.2 ( 0.1- 0.2) ∼ 4.8 ( 4.7- 5.0) 0.2 ( 0.2- 0.2)
Meningioma 0.1 ( 0.1- 0.1) ∼ 4.5 ( 4.4- 4.7) 0.2 ( 0.2- 0.2)
Other mesenchymal ∼ ∼ 0.1 ( 0.1- 0.1) 0.0 ( 0.0- 0.0)
Hemangioblastoma ∼ ∼ 0.2 ( 0.2- 0.3) ∼Lymphomas and Hematopoietic Neoplasms ∼ ∼ ∼ 0.7 ( 0.7- 0.8)
Germ Cell Tumors ∼ 0.2 ( 0.2- 0.3) 0.0 ( 0.0- 0.0) 0.0 ( 0.0- 0.0)
Tumors of Sellar Region 0.3 ( 0.3- 0.4) ∼ 2.9 ( 2.8- 3.0) 0.0 ( 0.0- 0.0)
Pituitary 0.2 ( 0.1- 0.2) ∼ 2.7 ( 2.6- 2.8) 0.0 ( 0.0- 0.0)
Craniopharyngioma 0.2 ( 0.1- 0.2) ∼ 0.2 ( 0.1- 0.2) ∼Local Extensions from Regional Tumors ∼ ∼ ∼ 0.0 ( 0.0- 0.0)
Unclassified Tumors 0.1 ( 0.1- 0.2) 0.0 ( 0.0- 0.1) 0.7 ( 0.6- 0.7) 0.6 ( 0.6- 0.7)
Hemangioma 0.1 ( 0.0- 0.1) ∼ 0.1 ( 0.1- 0.1) ∼Neoplasm, unspecified 0.1 ( 0.1- 0.1) 0.0 ( 0.0- 0.1) 0.5 ( 0.5- 0.6) 0.6 ( 0.6- 0.7)
All other ∼ ∼ ∼ ∼∗ Rates are per 100,000 persons and are age-adjusted to the 2000 U.S. standard population (19 age groups - Census P25-1130).† Modified from the Central Brain Tumor Registry of the United States statistics report, see Technical Notes and Appendix C.‡ Data are from all state and metropolitan area cancer registries, except Maryland and South Carolina. Included data cover approximately 97% of the
population and met data quality criteria for all invasive cancer sites combined. See Appendix B for registry-specific data quality information.
∼ Rates are suppressed if fewer than 16 cases were reported in a specific category (histology, age, behavior).
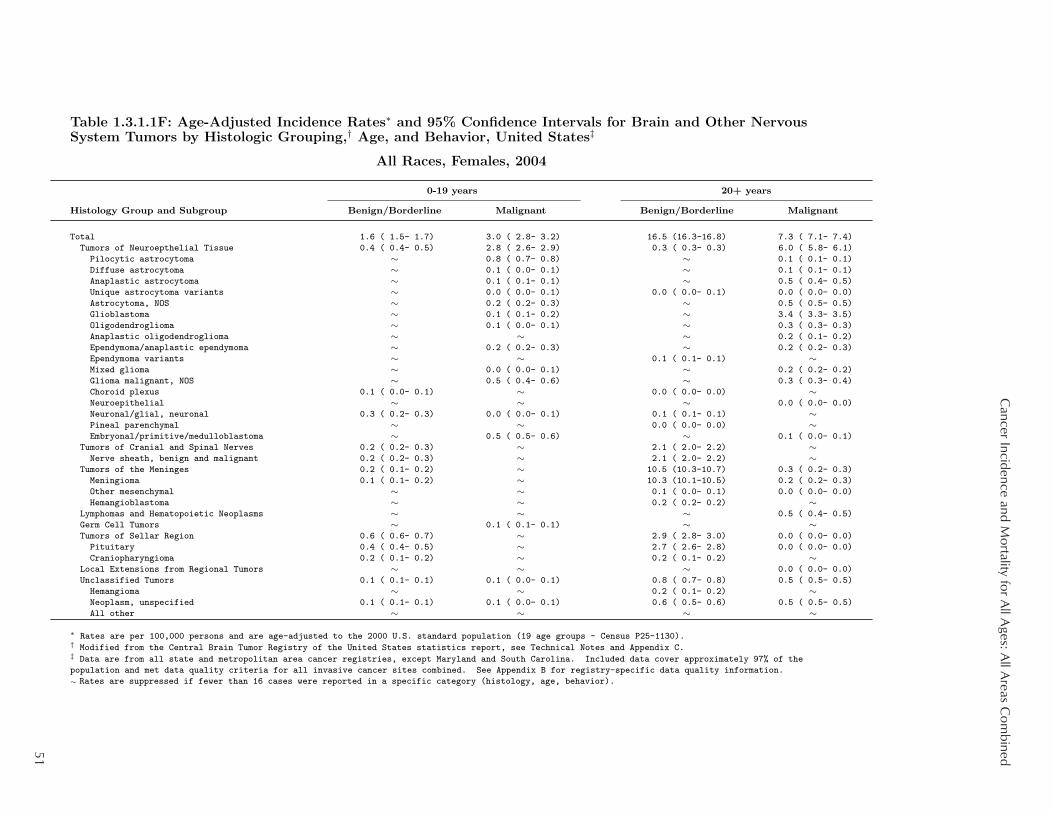
Cancer Incidence and M
ortality for All A
ges: All A
reas Com
bined��
Table 1.3.1.1F: Age-Adjusted Incidence Rates∗ and 95% Confidence Intervals for Brain and Other NervousSystem Tumors by Histologic Grouping,† Age, and Behavior, United States‡
All Races, Females, 2004
0-19 years 20+ years
Histology Group and Subgroup Benign/Borderline Malignant Benign/Borderline Malignant
Total 1.6 ( 1.5- 1.7) 3.0 ( 2.8- 3.2) 16.5 (16.3-16.8) 7.3 ( 7.1- 7.4)
Tumors of Neuroepthelial Tissue 0.4 ( 0.4- 0.5) 2.8 ( 2.6- 2.9) 0.3 ( 0.3- 0.3) 6.0 ( 5.8- 6.1)
Pilocytic astrocytoma ∼ 0.8 ( 0.7- 0.8) ∼ 0.1 ( 0.1- 0.1)
Diffuse astrocytoma ∼ 0.1 ( 0.0- 0.1) ∼ 0.1 ( 0.1- 0.1)
Anaplastic astrocytoma ∼ 0.1 ( 0.1- 0.1) ∼ 0.5 ( 0.4- 0.5)
Unique astrocytoma variants ∼ 0.0 ( 0.0- 0.1) 0.0 ( 0.0- 0.1) 0.0 ( 0.0- 0.0)
Astrocytoma, NOS ∼ 0.2 ( 0.2- 0.3) ∼ 0.5 ( 0.5- 0.5)
Glioblastoma ∼ 0.1 ( 0.1- 0.2) ∼ 3.4 ( 3.3- 3.5)
Oligodendroglioma ∼ 0.1 ( 0.0- 0.1) ∼ 0.3 ( 0.3- 0.3)
Anaplastic oligodendroglioma ∼ ∼ ∼ 0.2 ( 0.1- 0.2)
Ependymoma/anaplastic ependymoma ∼ 0.2 ( 0.2- 0.3) ∼ 0.2 ( 0.2- 0.3)
Ependymoma variants ∼ ∼ 0.1 ( 0.1- 0.1) ∼Mixed glioma ∼ 0.0 ( 0.0- 0.1) ∼ 0.2 ( 0.2- 0.2)
Glioma malignant, NOS ∼ 0.5 ( 0.4- 0.6) ∼ 0.3 ( 0.3- 0.4)
Choroid plexus 0.1 ( 0.0- 0.1) ∼ 0.0 ( 0.0- 0.0) ∼Neuroepithelial ∼ ∼ ∼ 0.0 ( 0.0- 0.0)
Neuronal/glial, neuronal 0.3 ( 0.2- 0.3) 0.0 ( 0.0- 0.1) 0.1 ( 0.1- 0.1) ∼Pineal parenchymal ∼ ∼ 0.0 ( 0.0- 0.0) ∼Embryonal/primitive/medulloblastoma ∼ 0.5 ( 0.5- 0.6) ∼ 0.1 ( 0.0- 0.1)
Tumors of Cranial and Spinal Nerves 0.2 ( 0.2- 0.3) ∼ 2.1 ( 2.0- 2.2) ∼Nerve sheath, benign and malignant 0.2 ( 0.2- 0.3) ∼ 2.1 ( 2.0- 2.2) ∼
Tumors of the Meninges 0.2 ( 0.1- 0.2) ∼ 10.5 (10.3-10.7) 0.3 ( 0.2- 0.3)
Meningioma 0.1 ( 0.1- 0.2) ∼ 10.3 (10.1-10.5) 0.2 ( 0.2- 0.3)
Other mesenchymal ∼ ∼ 0.1 ( 0.0- 0.1) 0.0 ( 0.0- 0.0)
Hemangioblastoma ∼ ∼ 0.2 ( 0.2- 0.2) ∼Lymphomas and Hematopoietic Neoplasms ∼ ∼ ∼ 0.5 ( 0.4- 0.5)
Germ Cell Tumors ∼ 0.1 ( 0.1- 0.1) ∼ ∼Tumors of Sellar Region 0.6 ( 0.6- 0.7) ∼ 2.9 ( 2.8- 3.0) 0.0 ( 0.0- 0.0)
Pituitary 0.4 ( 0.4- 0.5) ∼ 2.7 ( 2.6- 2.8) 0.0 ( 0.0- 0.0)
Craniopharyngioma 0.2 ( 0.1- 0.2) ∼ 0.2 ( 0.1- 0.2) ∼Local Extensions from Regional Tumors ∼ ∼ ∼ 0.0 ( 0.0- 0.0)
Unclassified Tumors 0.1 ( 0.1- 0.1) 0.1 ( 0.0- 0.1) 0.8 ( 0.7- 0.8) 0.5 ( 0.5- 0.5)
Hemangioma ∼ ∼ 0.2 ( 0.1- 0.2) ∼Neoplasm, unspecified 0.1 ( 0.1- 0.1) 0.1 ( 0.0- 0.1) 0.6 ( 0.5- 0.6) 0.5 ( 0.5- 0.5)
All other ∼ ∼ ∼ ∼∗ Rates are per 100,000 persons and are age-adjusted to the 2000 U.S. standard population (19 age groups - Census P25-1130).† Modified from the Central Brain Tumor Registry of the United States statistics report, see Technical Notes and Appendix C.‡ Data are from all state and metropolitan area cancer registries, except Maryland and South Carolina. Included data cover approximately 97% of the
population and met data quality criteria for all invasive cancer sites combined. See Appendix B for registry-specific data quality information.
∼ Rates are suppressed if fewer than 16 cases were reported in a specific category (histology, age, behavior).

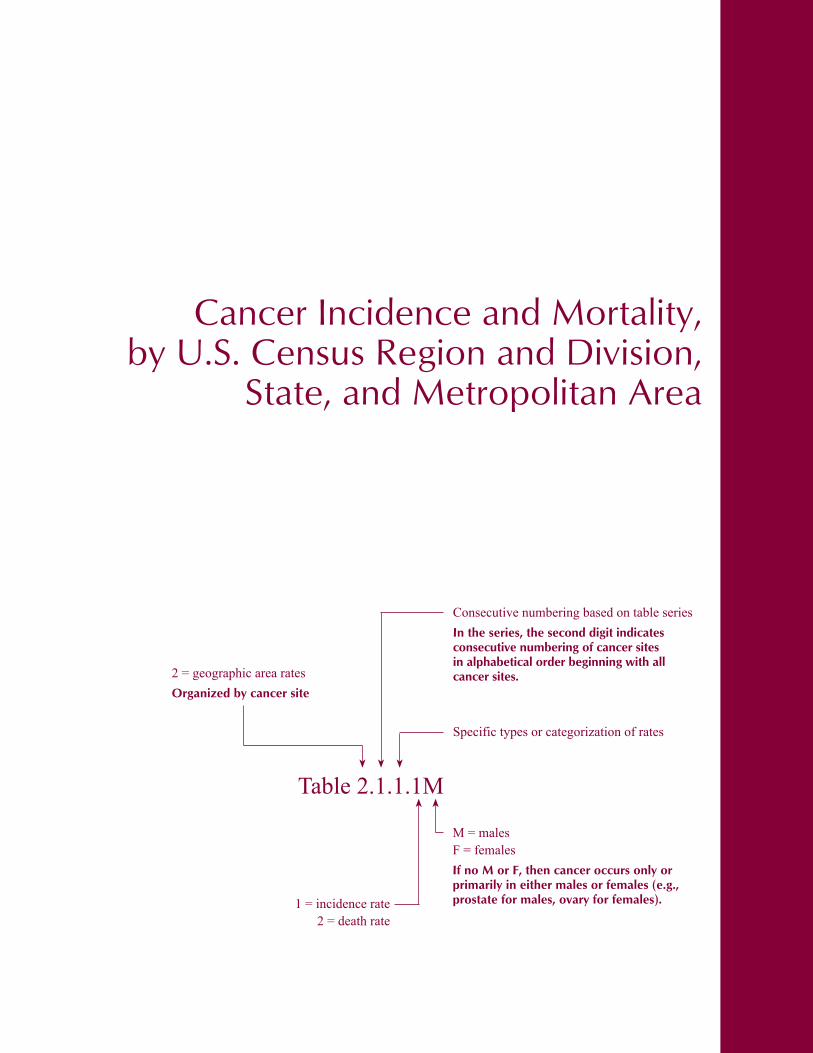
Cancer Incidence and Mortality, by U.S. Census Region and Di�ision,
State, and Metropolitan Area
Table 2.1.1.1M
Consecutive numbering based on table seriesIn the series, the second digit indicates consecutive numbering of cancer sites in alphabetical order beginning with all cancer sites.
Specific types or categorization of rates
M = malesF = femalesIf no M or F, then cancer occurs only or primarily in either males or females (e.g., prostate for males, ovary for females).1 = incidence rate
2 = death rate
2 = geographic area ratesOrganized by cancer site


Cancer Incidence and M
ortality, by U.S. C
ensus Region and D
i�ision, State, and Metropolitan A
rea
��
Figure 2: Geographic Areas Contributing Data to United States Cancer Statistics: 2004 Incidence and Mortality,
by U.S. Census Region and Division
State contributingmortality data only
State contributingincidence and mortality data
Note: Incidence data are from all state and metropolitan area cancer registries, except Maryland, and met the following data quality criteriafor cancer incidence: case ascertainment is at least 90% complete; > 97% of cases pass a standard set of computerized edits; < 5%of cases were ascertained by death certificate only; < 3% of cases are missing information on sex; < 5% of cases are missing informationon race; < 3% of cases are missing information on age. See Appendix B for registry-specific data quality information. Incidence datacover approximately 98% of the U.S. population. Mortality data are from the National Vital Statistics System and cover 100% of the U.S. population.
All U.S. Census regions and divisions met criteria for display of region-specific incidence and death rates.

United
States Cancer Statistics: 2004 Incid
ence and M
ortality
��
continued
Table 2.1.1.1M: All Cancer Sites Combined. Age-Adjusted Invasive Cancer Incidence Rates∗ and 95% ConfidenceIntervals, by U.S. Census Region and Division, State and Metropolitan Area, and Race and Ethnicity, UnitedStates†‡
Males, 2004
Area All Races White Black Hispanic§
United States 537.6 (536.3- 538.8) 527.2 (525.8- 528.5) 607.3 (602.5- 612.0) 415.5 (411.1- 420.0)
United States (excl. newly classified as malignant)¶ 530.1 (528.8- 531.3) 519.6 (518.2- 520.9) 602.0 (597.3- 606.8) 410.1 (405.7- 414.5)
Northeast 565.8 (562.9- 568.7) 560.1 (557.0- 563.2) 601.3 (590.7- 612.1) 495.2 (482.8- 507.9)
New England 569.5 (563.8- 575.3) 566.1 (560.3- 572.0) 589.7 (558.0- 622.5) 527.2 (491.5- 564.4)
Connecticut 545.1 (533.8- 556.6) 541.0 (529.3- 552.9) 626.0 (575.9- 679.0) 539.7 (482.3- 601.4)
Maine 618.6 (600.0- 637.7) 613.0 (594.4- 632.1) ∼ ∼Massachusetts 570.6 (562.0- 579.3) 567.7 (558.8- 576.7) 578.9 (534.3- 626.0) 492.0 (442.1- 545.4)
New Hampshire 569.4 (550.2- 589.0) 558.0 (538.9- 577.6) ∼ 422.9 (225.9- 700.2)
Rhode Island 593.3 (572.2- 614.9) 592.6 (570.9- 614.9) 567.6 (452.7- 699.9) 699.6 (568.9- 847.6)
Vermont 548.5 (522.4- 575.7) 549.7 (523.4- 577.0) ∼ ∼Middle Atlantic 564.5 (561.1- 567.9) 557.7 (554.1- 561.4) 603.1 (591.9- 614.5) 490.9 (477.6- 504.4)
New Jersey 575.4 (567.8- 583.0) 568.1 (560.0- 576.3) 632.8 (607.2- 659.1) 529.3 (501.8- 557.9)
New York 558.1 (553.1- 563.1) 556.1 (550.6- 561.6) 567.6 (553.1- 582.4) 479.0 (463.0- 495.4)
Pennsylvania 567.3 (561.4- 573.2) 553.9 (547.8- 560.0) 666.9 (642.5- 691.8) -
Midwest 543.5 (540.9- 546.2) 522.9 (520.2- 525.7) 620.0 (609.1- 631.0) 342.9 (327.8- 358.4)
East North Central 541.4 (538.2- 544.6) 517.7 (514.4- 521.1) 621.4 (609.5- 633.4) 366.4 (349.0- 384.4)
Illinois 560.6 (554.2- 567.0) 543.0 (536.2- 549.8) 613.5 (593.3- 634.1) 368.6 (345.4- 392.7)
Indiana 525.2 (516.6- 534.0) 519.9 (511.0- 528.9) 548.7 (513.1- 585.9) 304.1 (255.2- 358.6)
Michigan 568.5 (561.5- 575.6) 536.3 (529.1- 543.6) 690.3 (666.0- 715.2) 319.6 (278.3- 364.7)
Detroit 628.3 (616.4- 640.3) 604.9 (591.7- 618.3) 725.0 (696.1- 754.7) 481.4 (404.8- 567.0)
Ohio 520.0 (513.8- 526.2) 483.9 (477.6- 490.2) 566.2 (544.3- 588.7) 454.5 (398.0- 516.1)
Wisconsin 515.9 (507.1- 524.8) 504.8 (495.9- 513.8) 758.8 (693.8- 827.7) 414.9 (347.2- 490.5)
West North Central 548.1 (543.3- 552.9) 533.6 (528.7- 538.4) 611.3 (583.8- 639.7) 246.4 (218.2- 276.8)
Iowa 542.6 (530.7- 554.7) 532.5 (520.6- 544.6) 578.1 (465.7- 707.0) 287.2 (201.9- 391.9)
Kansas 551.7 (538.7- 564.9) 537.6 (524.4- 551.0) 615.1 (543.9- 692.3) ∼Minnesota 582.6 (572.6- 592.7) 553.1 (543.2- 563.2) 600.1 (515.6- 693.0) 342.9 (265.9- 432.8)
Missouri 520.3 (511.7- 529.0) 512.4 (503.4- 521.5) 613.1 (578.5- 649.0) 351.4 (283.8- 428.6)
Nebraska 548.2 (532.2- 564.6) 532.3 (516.2- 548.8) 614.9 (505.6- 739.0) 468.3 (362.7- 591.1)
North Dakota 518.3 (493.7- 543.9) 514.0 (489.1- 539.9) ∼ ∼South Dakota 571.3 (547.4- 595.9) 570.4 (546.0- 595.5) ∼ ∼
South 537.8 (535.6- 540.0) 523.5 (521.2- 525.8) 614.1 (607.4- 620.9) 411.6 (404.6- 418.8)
South Atlantic 531.4 (528.4- 534.4) 518.9 (515.7- 522.1) 603.9 (595.0- 612.8) 434.9 (424.0- 446.0)
Delaware 578.8 (555.1- 603.3) 561.7 (536.4- 587.9) 668.4 (596.6- 745.8) 586.2 (405.9- 809.5)
District of Columbia 532.2 (502.9- 562.8) 360.3 (320.4- 403.7) 600.1 (560.4- 641.9) 320.9 (210.8- 463.0)
Florida 518.1 (513.6- 522.7) 513.9 (509.2- 518.7) 555.3 (538.2- 572.7) -
Georgia 560.8 (552.3- 569.3) 545.5 (536.1- 554.9) 635.9 (615.6- 656.5) 301.2 (258.6- 348.1)
Atlanta 524.3 (509.1- 539.9) 505.7 (488.1- 523.7) 613.8 (579.7- 649.3) 322.4 (253.5- 401.9)
Maryland
North Carolina 541.8 (534.2- 549.4) 525.2 (516.9- 533.5) 626.7 (606.1- 647.7) 283.6 (238.5- 333.8)
South Carolina 561.4 (550.6- 572.4) 537.5 (525.5- 549.8) 628.6 (603.7- 654.2) -
Virginia 508.2 (500.3- 516.3) 491.4 (482.7- 500.1) 599.3 (577.0- 622.2) 348.5 (298.4- 403.6)
West Virginia 546.9 (531.9- 562.1) 548.1 (533.0- 563.7) 527.4 (435.1- 632.4) 345.1 (199.4- 549.9)
East South Central 550.6 (545.3- 555.9) 536.1 (530.5- 541.8) 600.5 (585.6- 615.7) 296.9 (255.5- 342.3)
Alabama 559.2 (548.9- 569.6) 542.0 (530.7- 553.4) 622.3 (597.1- 648.3) 318.3 (239.2- 412.5)
Kentucky 584.9 (573.8- 596.2) 567.3 (556.0- 578.8) 628.7 (578.4- 682.0) -
Mississippi 550.7 (537.4- 564.1) 519.8 (504.8- 535.1) 626.9 (598.8- 655.9) 312.8 (216.1- 434.4)

Cancer Incidence and M
ortality, by U.S. C
ensus Region and D
i�ision, State, and Metropolitan A
rea
��
Table 2.1.1.1M: All Cancer Sites Combined. Age-Adjusted Invasive Cancer Incidence Rates∗ and 95% ConfidenceIntervals, by U.S. Census Region and Division, State and Metropolitan Area, and Race and Ethnicity, UnitedStates†‡ (continued)
Males, 2004
Area All Races White Black Hispanic§
Tennessee 520.3 (511.5- 529.3) 515.5 (506.2- 524.9) 531.0 (503.8- 559.3) 272.1 (206.4- 349.6)
West South Central 543.3 (539.2- 547.3) 525.9 (521.6- 530.2) 647.4 (633.6- 661.5) 398.1 (388.5- 407.8)
Arkansas 543.0 (530.4- 555.8) 536.8 (523.5- 550.3) 583.5 (541.8- 627.4) 145.3 ( 96.4- 208.8)
Louisiana 612.5 (601.2- 624.0) 587.3 (574.5- 600.3) 711.7 (686.3- 737.7) 397.4 (332.9- 469.7)
Oklahoma 529.4 (518.2- 540.8) 519.8 (508.0- 531.8) 597.1 (542.4- 655.4) 320.8 (259.9- 390.1)
Texas 530.9 (525.9- 535.9) 513.7 (508.5- 519.0) 626.3 (607.5- 645.6) 402.0 (392.2- 412.0)
West 506.6 (504.0- 509.3) 508.9 (506.0- 511.8) 559.8 (545.2- 574.6) 402.8 (395.8- 409.9)
Mountain 477.9 (473.3- 482.7) 475.9 (471.1- 480.8) 438.8 (408.2- 470.9) 385.0 (371.7- 398.5)
Arizona 435.0 (427.0- 443.1) 431.2 (423.0- 439.5) 446.3 (389.3- 508.5) 358.6 (335.5- 382.7)
Colorado 486.6 (476.2- 497.1) 473.6 (463.0- 484.2) 441.5 (384.6- 503.8) 402.0 (372.3- 433.1)
Idaho 533.3 (514.9- 552.2) 536.4 (517.8- 555.5) ∼ 438.4 (332.2- 563.3)
Montana 528.4 (507.7- 549.7) 520.2 (499.3- 541.7) ∼ 409.3 (230.7- 658.0)
Nevada 505.1 (491.1- 519.4) 506.5 (491.7- 521.7) 456.1 (400.2- 517.2) 373.1 (330.4- 419.2)
New Mexico 469.3 (454.9- 484.2) 489.3 (473.8- 505.2) 327.5 (240.3- 434.2) 409.7 (385.7- 434.7)
Utah 494.0 (478.7- 509.5) 496.3 (480.8- 512.2) 524.4 (318.4- 798.7) 355.4 (290.9- 428.2)
Wyoming 512.6 (483.9- 542.6) 498.3 (469.6- 528.2) ∼ 458.8 (329.9- 617.9)
Pacific 519.3 (516.1- 522.5) 525.6 (522.0- 529.2) 585.9 (569.5- 602.6) 409.4 (401.2- 417.7)
Alaska 522.2 (488.7- 557.2) 516.2 (478.6- 555.7) 740.9 (484.2-1068.0) 276.5 (132.2- 508.2)
California 509.8 (506.1- 513.6) 516.4 (512.2- 520.6) 585.7 (568.4- 603.3) 410.1 (401.7- 418.6)
San Francisco-Oakland 503.3 (493.0- 513.8) 522.0 (509.4- 534.8) 581.3 (543.4- 621.0) 368.9 (340.5- 398.9)
San Jose-Monterey 500.0 (485.5- 514.8) 536.9 (519.8- 554.3) 619.3 (499.0- 756.6) 381.6 (348.4- 416.8)
Los Angeles 502.4 (495.1- 509.9) 499.6 (491.1- 508.2) 619.3 (592.7- 646.7) 402.2 (388.5- 416.1)
Hawaii 491.5 (474.0- 509.5) 641.2 (602.1- 682.2) 306.5 (189.3- 464.3) 498.8 (392.5- 622.0)
Oregon 535.6 (524.6- 546.8) 530.7 (519.5- 542.1) 536.9 (430.2- 659.6) 355.5 (297.2- 420.4)
Washington 567.1 (558.0- 576.2) 559.7 (550.3- 569.2) 635.7 (568.4- 708.0) 409.4 (359.9- 462.9)
Seattle-Puget Sound 580.1 (569.0- 591.5) 593.7 (581.8- 605.8) 667.6 (594.0- 746.9) 461.6 (387.1- 544.6)
∗ Rates are per 100,000 persons and are age-adjusted to the 2000 U.S. standard population (19 age groups - Census P25-1130).† Data are from all state and metropolitan area cancer registries, except Maryland. Included data cover approximately 98% of the population and met data quality
criteria for all invasive cancer sites combined. See Appendix B for registry-specific data quality information.‡ Excludes basal and squamous cell carcinomas of the skin except when these occur on the skin of the genital organs, and in situ cancers except urinary bladder.
§ Data for specified racial or ethnic populations other than white and black should be interpreted with caution. See Technical Notes.
Hispanic origin is not mutually exclusive from race categories (white, black).
¶ Excludes some endometrial cancers; papillary ependymomas and papillary meningiomas; chronic myeloproliferative diseases; and myelodysplastic syndromes. These
cancers are newly classified and reported as malignant cancers according to ICD-O-3, beginning with 2001 diagnoses. See Technical Notes.
∼ Rates are suppressed if fewer than 16 cases were reported in a specific category (area, race, ethnicity).
- Rates are suppressed at the state’s or metropolitan area’s request. See Technical Notes.
Notes: Cases from suppressed rates are included in the U.S. and region/division rates. U.S. rates are as presented in Table 1.1.1.1M. Michigan, Georgia, California,
and Washington state rates each include cases from the SEER metropolitan areas.

United
States Cancer Statistics: 2004 Incid
ence and M
ortality
��
continued
Table 2.1.1.1F: All Cancer Sites Combined. Age-Adjusted Invasive Cancer Incidence Rates∗ and 95% ConfidenceIntervals, by U.S. Census Region and Division, State and Metropolitan Area, and Race and Ethnicity, UnitedStates†‡
Females, 2004
Area All Races White Black Hispanic§
United States 403.1 (402.1- 404.1) 405.9 (404.9- 407.0) 379.7 (376.6- 382.7) 318.6 (315.4- 321.8)
United States (excl. newly classified as malignant)¶ 398.4 (397.4- 399.4) 401.2 (400.2- 402.3) 376.1 (373.1- 379.1) 314.5 (311.3- 317.7)
Northeast 436.3 (434.0- 438.6) 442.6 (440.1- 445.1) 375.8 (369.2- 382.5) 351.4 (343.1- 359.8)
New England 446.9 (442.4- 451.5) 449.6 (444.9- 454.4) 360.5 (340.8- 381.1) 365.0 (341.4- 389.7)
Connecticut 432.3 (423.3- 441.3) 438.4 (428.9- 448.1) 387.7 (356.5- 420.9) 375.3 (337.6- 415.8)
Maine 456.0 (441.5- 470.9) 452.3 (437.8- 467.3) ∼ ∼Massachusetts 455.6 (448.7- 462.5) 461.0 (453.9- 468.3) 339.2 (312.1- 367.9) 359.7 (325.2- 396.6)
New Hampshire 447.2 (431.9- 462.9) 442.0 (426.7- 457.8) ∼ 379.1 (236.2- 569.4)
Rhode Island 449.6 (433.2- 466.5) 440.2 (423.4- 457.6) 394.8 (317.2- 484.5) 403.5 (327.8- 490.0)
Vermont 423.6 (402.6- 445.3) 427.0 (405.9- 449.0) ∼ ∼Middle Atlantic 432.6 (430.0- 435.3) 439.9 (437.0- 442.9) 377.7 (370.7- 384.8) 349.4 (340.5- 358.4)
New Jersey 444.8 (439.0- 450.7) 459.1 (452.5- 465.7) 390.5 (374.5- 406.9) 389.9 (370.9- 409.6)
New York 427.1 (423.3- 430.9) 438.5 (434.1- 442.9) 355.9 (347.0- 365.0) 337.5 (327.0- 348.2)
Pennsylvania 433.7 (429.0- 438.4) 431.1 (426.2- 436.1) 425.5 (409.7- 441.7) -
Midwest 406.7 (404.6- 408.8) 402.0 (399.8- 404.2) 397.9 (390.8- 405.1) 307.3 (294.9- 320.0)
East North Central 405.6 (403.2- 408.1) 400.7 (398.1- 403.4) 397.4 (389.7- 405.2) 324.6 (310.4- 339.2)
Illinois 414.8 (410.0- 419.7) 415.1 (409.8- 420.4) 401.0 (388.0- 414.4) 321.0 (302.6- 340.2)
Indiana 392.3 (385.7- 399.0) 393.2 (386.3- 400.2) 358.9 (335.1- 383.9) 300.1 (255.3- 349.8)
Michigan 414.9 (409.5- 420.3) 410.8 (405.1- 416.6) 417.2 (401.8- 433.1) 320.8 (283.7- 360.9)
Detroit 442.0 (433.3- 450.7) 450.3 (440.2- 460.6) 429.6 (411.6- 448.1) 419.6 (354.9- 491.9)
Ohio 402.6 (397.8- 407.5) 389.6 (384.6- 394.7) 380.0 (365.2- 395.2) 365.2 (320.8- 413.6)
Wisconsin 390.4 (383.5- 397.5) 387.1 (380.0- 394.3) 438.9 (399.2- 481.3) 337.3 (283.9- 397.0)
West North Central 409.3 (405.6- 413.1) 404.9 (401.1- 408.8) 401.4 (383.4- 420.1) 236.4 (212.1- 262.4)
Iowa 416.8 (407.3- 426.5) 414.8 (405.2- 424.6) 351.5 (276.5- 439.2) 263.1 (191.2- 350.7)
Kansas 411.1 (400.9- 421.6) 406.9 (396.3- 417.7) 389.7 (343.3- 440.4) ∼Minnesota 424.8 (417.0- 432.6) 411.6 (403.8- 419.5) 371.9 (317.0- 432.8) 302.9 (237.3- 379.3)
Missouri 400.4 (393.7- 407.3) 401.1 (393.9- 408.4) 410.1 (387.5- 433.6) 400.9 (337.9- 471.3)
Nebraska 404.1 (391.6- 417.0) 400.2 (387.4- 413.3) 425.7 (349.2- 512.9) 340.8 (263.5- 431.8)
North Dakota 396.2 (376.0- 417.3) 391.1 (370.6- 412.5) ∼ ∼South Dakota 372.2 (354.3- 390.8) 372.2 (353.7- 391.4) ∼ 532.0 (289.8- 875.1)
South 391.1 (389.5- 392.8) 393.8 (391.9- 395.6) 374.3 (370.1- 378.5) 317.6 (312.3- 322.9)
South Atlantic 393.1 (390.8- 395.4) 398.1 (395.5- 400.7) 369.3 (363.8- 374.9) 337.3 (329.1- 345.7)
Delaware 420.2 (402.0- 439.1) 418.4 (398.2- 439.4) 416.3 (370.3- 466.1) 481.5 (346.7- 647.0)
District of Columbia 402.6 (380.4- 425.8) 332.5 (295.7- 372.6) 419.7 (391.9- 449.0) 429.3 (326.1- 553.0)
Florida 395.5 (391.7- 399.2) 401.3 (397.2- 405.4) 355.3 (344.2- 366.7) -
Georgia 395.9 (390.0- 401.9) 405.4 (398.4- 412.5) 373.9 (362.2- 386.0) 328.9 (290.8- 370.2)
Atlanta 394.2 (383.6- 405.1) 412.2 (398.8- 426.0) 378.4 (358.8- 398.6) 305.1 (252.8- 364.0)
Maryland
North Carolina 386.8 (381.2- 392.5) 392.3 (385.9- 398.7) 369.5 (356.9- 382.4) 310.5 (268.2- 357.1)
South Carolina 382.2 (374.4- 390.2) 386.9 (377.7- 396.3) 362.3 (347.1- 378.0) -
Virginia 386.4 (380.4- 392.6) 388.5 (381.6- 395.4) 374.1 (359.8- 388.7) 286.5 (251.7- 324.4)
West Virginia 421.5 (409.7- 433.7) 422.2 (410.1- 434.5) 369.7 (305.5- 443.6) 354.9 (218.8- 542.1)
East South Central 393.7 (389.8- 397.6) 395.1 (390.8- 399.4) 374.7 (365.3- 384.2) 245.4 (212.8- 281.2)
Alabama 376.5 (369.1- 384.0) 382.3 (373.7- 390.9) 358.8 (343.5- 374.5) 245.8 (184.7- 319.1)
Kentucky 445.5 (437.0- 454.1) 437.8 (429.1- 446.7) 464.4 (429.2- 501.5) -
Mississippi 377.8 (368.3- 387.5) 378.1 (366.6- 389.8) 374.5 (357.1- 392.5) 221.6 (147.8- 317.2)
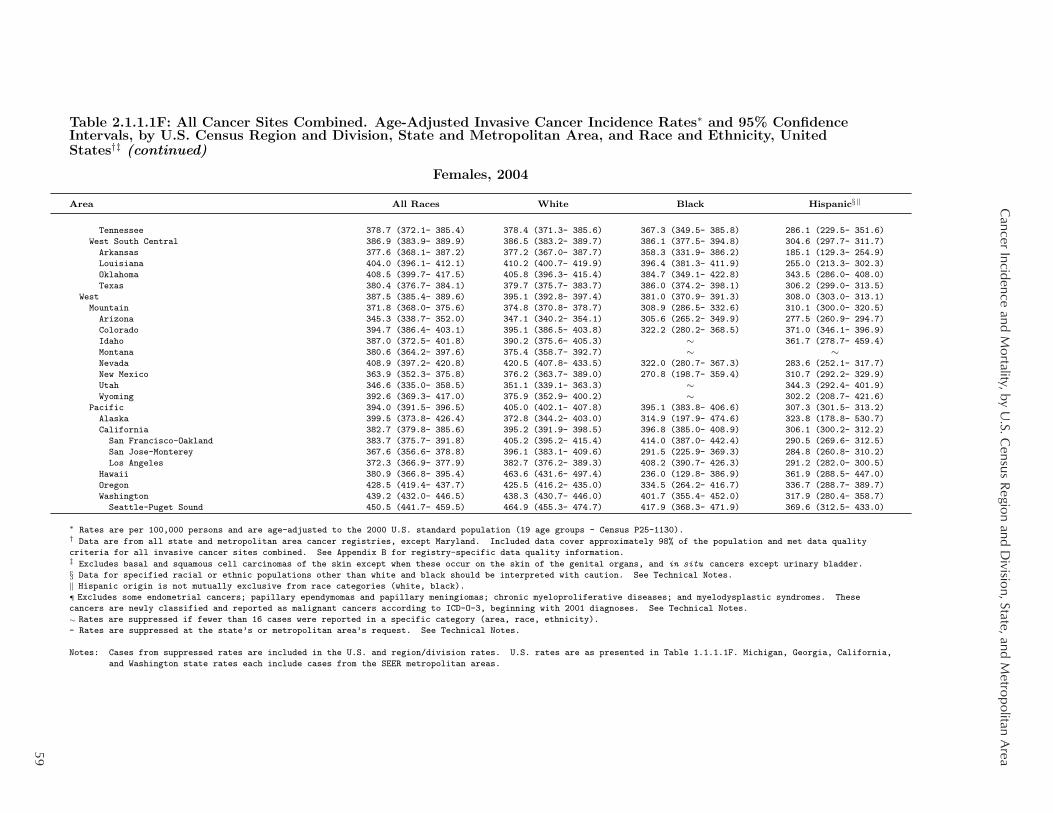
Cancer Incidence and M
ortality, by U.S. C
ensus Region and D
i�ision, State, and Metropolitan A
rea
��
Table 2.1.1.1F: All Cancer Sites Combined. Age-Adjusted Invasive Cancer Incidence Rates∗ and 95% ConfidenceIntervals, by U.S. Census Region and Division, State and Metropolitan Area, and Race and Ethnicity, UnitedStates†‡ (continued)
Females, 2004
Area All Races White Black Hispanic§
Tennessee 378.7 (372.1- 385.4) 378.4 (371.3- 385.6) 367.3 (349.5- 385.8) 286.1 (229.5- 351.6)
West South Central 386.9 (383.9- 389.9) 386.5 (383.2- 389.7) 386.1 (377.5- 394.8) 304.6 (297.7- 311.7)
Arkansas 377.6 (368.1- 387.2) 377.2 (367.0- 387.7) 358.3 (331.9- 386.2) 185.1 (129.3- 254.9)
Louisiana 404.0 (396.1- 412.1) 410.2 (400.7- 419.9) 396.4 (381.3- 411.9) 255.0 (213.3- 302.3)
Oklahoma 408.5 (399.7- 417.5) 405.8 (396.3- 415.4) 384.7 (349.1- 422.8) 343.5 (286.0- 408.0)
Texas 380.4 (376.7- 384.1) 379.7 (375.7- 383.7) 386.0 (374.2- 398.1) 306.2 (299.0- 313.5)
West 387.5 (385.4- 389.6) 395.1 (392.8- 397.4) 381.0 (370.9- 391.3) 308.0 (303.0- 313.1)
Mountain 371.8 (368.0- 375.6) 374.8 (370.8- 378.7) 308.9 (286.5- 332.6) 310.1 (300.0- 320.5)
Arizona 345.3 (338.7- 352.0) 347.1 (340.2- 354.1) 305.6 (265.2- 349.9) 277.5 (260.9- 294.7)
Colorado 394.7 (386.4- 403.1) 395.1 (386.5- 403.8) 322.2 (280.2- 368.5) 371.0 (346.1- 396.9)
Idaho 387.0 (372.5- 401.8) 390.2 (375.6- 405.3) ∼ 361.7 (278.7- 459.4)
Montana 380.6 (364.2- 397.6) 375.4 (358.7- 392.7) ∼ ∼Nevada 408.9 (397.2- 420.8) 420.5 (407.8- 433.5) 322.0 (280.7- 367.3) 283.6 (252.1- 317.7)
New Mexico 363.9 (352.3- 375.8) 376.2 (363.7- 389.0) 270.8 (198.7- 359.4) 310.7 (292.2- 329.9)
Utah 346.6 (335.0- 358.5) 351.1 (339.1- 363.3) ∼ 344.3 (292.4- 401.9)
Wyoming 392.6 (369.3- 417.0) 375.9 (352.9- 400.2) ∼ 302.2 (208.7- 421.6)
Pacific 394.0 (391.5- 396.5) 405.0 (402.1- 407.8) 395.1 (383.8- 406.6) 307.3 (301.5- 313.2)
Alaska 399.5 (373.8- 426.4) 372.8 (344.2- 403.0) 314.9 (197.9- 474.6) 323.8 (178.8- 530.7)
California 382.7 (379.8- 385.6) 395.2 (391.9- 398.5) 396.8 (385.0- 408.9) 306.1 (300.2- 312.2)
San Francisco-Oakland 383.7 (375.7- 391.8) 405.2 (395.2- 415.4) 414.0 (387.0- 442.4) 290.5 (269.6- 312.5)
San Jose-Monterey 367.6 (356.6- 378.8) 396.1 (383.1- 409.6) 291.5 (225.9- 369.3) 284.8 (260.8- 310.2)
Los Angeles 372.3 (366.9- 377.9) 382.7 (376.2- 389.3) 408.2 (390.7- 426.3) 291.2 (282.0- 300.5)
Hawaii 380.9 (366.8- 395.4) 463.6 (431.6- 497.4) 236.0 (129.8- 386.9) 361.9 (288.5- 447.0)
Oregon 428.5 (419.4- 437.7) 425.5 (416.2- 435.0) 334.5 (264.2- 416.7) 336.7 (288.7- 389.7)
Washington 439.2 (432.0- 446.5) 438.3 (430.7- 446.0) 401.7 (355.4- 452.0) 317.9 (280.4- 358.7)
Seattle-Puget Sound 450.5 (441.7- 459.5) 464.9 (455.3- 474.7) 417.9 (368.3- 471.9) 369.6 (312.5- 433.0)
∗ Rates are per 100,000 persons and are age-adjusted to the 2000 U.S. standard population (19 age groups - Census P25-1130).† Data are from all state and metropolitan area cancer registries, except Maryland. Included data cover approximately 98% of the population and met data quality
criteria for all invasive cancer sites combined. See Appendix B for registry-specific data quality information.‡ Excludes basal and squamous cell carcinomas of the skin except when these occur on the skin of the genital organs, and in situ cancers except urinary bladder.
§ Data for specified racial or ethnic populations other than white and black should be interpreted with caution. See Technical Notes.
Hispanic origin is not mutually exclusive from race categories (white, black).
¶ Excludes some endometrial cancers; papillary ependymomas and papillary meningiomas; chronic myeloproliferative diseases; and myelodysplastic syndromes. These
cancers are newly classified and reported as malignant cancers according to ICD-O-3, beginning with 2001 diagnoses. See Technical Notes.
∼ Rates are suppressed if fewer than 16 cases were reported in a specific category (area, race, ethnicity).
- Rates are suppressed at the state’s or metropolitan area’s request. See Technical Notes.
Notes: Cases from suppressed rates are included in the U.S. and region/division rates. U.S. rates are as presented in Table 1.1.1.1F. Michigan, Georgia, California,
and Washington state rates each include cases from the SEER metropolitan areas.
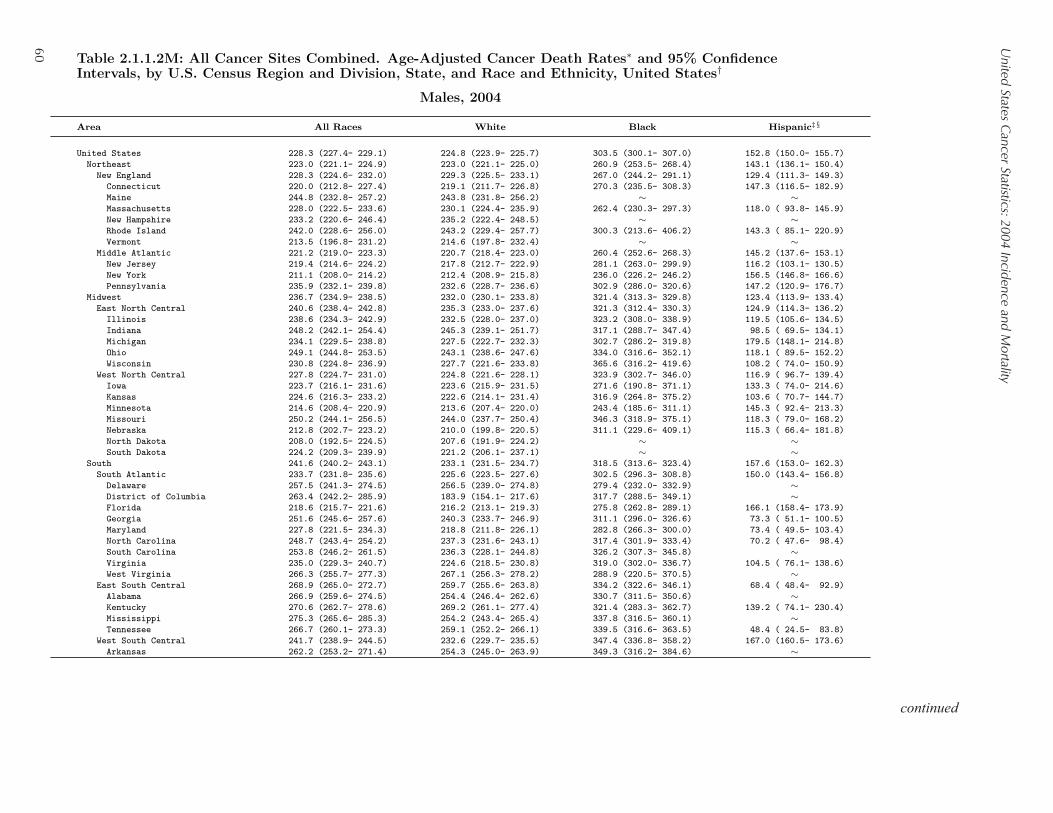
United
States Cancer Statistics: 2004 Incid
ence and M
ortality
�0
continued
Table 2.1.1.2M: All Cancer Sites Combined. Age-Adjusted Cancer Death Rates∗ and 95% ConfidenceIntervals, by U.S. Census Region and Division, State, and Race and Ethnicity, United States†
Males, 2004
Area All Races White Black Hispanic‡§
United States 228.3 (227.4- 229.1) 224.8 (223.9- 225.7) 303.5 (300.1- 307.0) 152.8 (150.0- 155.7)
Northeast 223.0 (221.1- 224.9) 223.0 (221.1- 225.0) 260.9 (253.5- 268.4) 143.1 (136.1- 150.4)
New England 228.3 (224.6- 232.0) 229.3 (225.5- 233.1) 267.0 (244.2- 291.1) 129.4 (111.3- 149.3)
Connecticut 220.0 (212.8- 227.4) 219.1 (211.7- 226.8) 270.3 (235.5- 308.3) 147.3 (116.5- 182.9)
Maine 244.8 (232.8- 257.2) 243.8 (231.8- 256.2) ∼ ∼Massachusetts 228.0 (222.5- 233.6) 230.1 (224.4- 235.9) 262.4 (230.3- 297.3) 118.0 ( 93.8- 145.9)
New Hampshire 233.2 (220.6- 246.4) 235.2 (222.4- 248.5) ∼ ∼Rhode Island 242.0 (228.6- 256.0) 243.2 (229.4- 257.7) 300.3 (213.6- 406.2) 143.3 ( 85.1- 220.9)
Vermont 213.5 (196.8- 231.2) 214.6 (197.8- 232.4) ∼ ∼Middle Atlantic 221.2 (219.0- 223.3) 220.7 (218.4- 223.0) 260.4 (252.6- 268.3) 145.2 (137.6- 153.1)
New Jersey 219.4 (214.6- 224.2) 217.8 (212.7- 222.9) 281.1 (263.0- 299.9) 116.2 (103.1- 130.5)
New York 211.1 (208.0- 214.2) 212.4 (208.9- 215.8) 236.0 (226.2- 246.2) 156.5 (146.8- 166.6)
Pennsylvania 235.9 (232.1- 239.8) 232.6 (228.7- 236.6) 302.9 (286.0- 320.6) 147.2 (120.9- 176.7)
Midwest 236.7 (234.9- 238.5) 232.0 (230.1- 233.8) 321.4 (313.3- 329.8) 123.4 (113.9- 133.4)
East North Central 240.6 (238.4- 242.8) 235.3 (233.0- 237.6) 321.3 (312.4- 330.3) 124.9 (114.3- 136.2)
Illinois 238.6 (234.3- 242.9) 232.5 (228.0- 237.0) 323.2 (308.0- 338.9) 119.5 (105.6- 134.5)
Indiana 248.2 (242.1- 254.4) 245.3 (239.1- 251.7) 317.1 (288.7- 347.4) 98.5 ( 69.5- 134.1)
Michigan 234.1 (229.5- 238.8) 227.5 (222.7- 232.3) 302.7 (286.2- 319.8) 179.5 (148.1- 214.8)
Ohio 249.1 (244.8- 253.5) 243.1 (238.6- 247.6) 334.0 (316.6- 352.1) 118.1 ( 89.5- 152.2)
Wisconsin 230.8 (224.8- 236.9) 227.7 (221.6- 233.8) 365.6 (316.2- 419.6) 108.2 ( 74.0- 150.9)
West North Central 227.8 (224.7- 231.0) 224.8 (221.6- 228.1) 323.9 (302.7- 346.0) 116.9 ( 96.7- 139.4)
Iowa 223.7 (216.1- 231.6) 223.6 (215.9- 231.5) 271.6 (190.8- 371.1) 133.3 ( 74.0- 214.6)
Kansas 224.6 (216.3- 233.2) 222.6 (214.1- 231.4) 316.9 (264.8- 375.2) 103.6 ( 70.7- 144.7)
Minnesota 214.6 (208.4- 220.9) 213.6 (207.4- 220.0) 243.4 (185.6- 311.1) 145.3 ( 92.4- 213.3)
Missouri 250.2 (244.1- 256.5) 244.0 (237.7- 250.4) 346.3 (318.9- 375.1) 118.3 ( 79.0- 168.2)
Nebraska 212.8 (202.7- 223.2) 210.0 (199.8- 220.5) 311.1 (229.6- 409.1) 115.3 ( 66.4- 181.8)
North Dakota 208.0 (192.5- 224.5) 207.6 (191.9- 224.2) ∼ ∼South Dakota 224.2 (209.3- 239.9) 221.2 (206.1- 237.1) ∼ ∼
South 241.6 (240.2- 243.1) 233.1 (231.5- 234.7) 318.5 (313.6- 323.4) 157.6 (153.0- 162.3)
South Atlantic 233.7 (231.8- 235.6) 225.6 (223.5- 227.6) 302.5 (296.3- 308.8) 150.0 (143.4- 156.8)
Delaware 257.5 (241.3- 274.5) 256.5 (239.0- 274.8) 279.4 (232.0- 332.9) ∼District of Columbia 263.4 (242.2- 285.9) 183.9 (154.1- 217.6) 317.7 (288.5- 349.1) ∼Florida 218.6 (215.7- 221.6) 216.2 (213.1- 219.3) 275.8 (262.8- 289.1) 166.1 (158.4- 173.9)
Georgia 251.6 (245.6- 257.6) 240.3 (233.7- 246.9) 311.1 (296.0- 326.6) 73.3 ( 51.1- 100.5)
Maryland 227.8 (221.5- 234.3) 218.8 (211.8- 226.1) 282.8 (266.3- 300.0) 73.4 ( 49.5- 103.4)
North Carolina 248.7 (243.4- 254.2) 237.3 (231.6- 243.1) 317.4 (301.9- 333.4) 70.2 ( 47.6- 98.4)
South Carolina 253.8 (246.2- 261.5) 236.3 (228.1- 244.8) 326.2 (307.3- 345.8) ∼Virginia 235.0 (229.3- 240.7) 224.6 (218.5- 230.8) 319.0 (302.0- 336.7) 104.5 ( 76.1- 138.6)
West Virginia 266.3 (255.7- 277.3) 267.1 (256.3- 278.2) 288.9 (220.5- 370.5) ∼East South Central 268.9 (265.0- 272.7) 259.7 (255.6- 263.8) 334.2 (322.6- 346.1) 68.4 ( 48.4- 92.9)
Alabama 266.9 (259.6- 274.5) 254.4 (246.4- 262.6) 330.7 (311.5- 350.6) ∼Kentucky 270.6 (262.7- 278.6) 269.2 (261.1- 277.4) 321.4 (283.3- 362.7) 139.2 ( 74.1- 230.4)
Mississippi 275.3 (265.6- 285.3) 254.2 (243.4- 265.4) 337.8 (316.5- 360.1) ∼Tennessee 266.7 (260.1- 273.3) 259.1 (252.2- 266.1) 339.5 (316.6- 363.5) 48.4 ( 24.5- 83.8)
West South Central 241.7 (238.9- 244.5) 232.6 (229.7- 235.5) 347.4 (336.8- 358.2) 167.0 (160.5- 173.6)
Arkansas 262.2 (253.2- 271.4) 254.3 (245.0- 263.9) 349.3 (316.2- 384.6) ∼

Cancer Incidence and M
ortality, by U.S. C
ensus Region and D
i�ision, State, and Metropolitan A
rea
��
Table 2.1.1.2M: All Cancer Sites Combined. Age-Adjusted Cancer Death Rates∗ and 95% ConfidenceIntervals, by U.S. Census Region and Division, State, and Race and Ethnicity, United States† (continued)
Males, 2004
Area All Races White Black Hispanic‡§
Louisiana 282.5 (274.6- 290.5) 254.0 (245.3- 262.8) 382.2 (363.1- 401.9) 103.1 ( 68.8- 146.6)
Oklahoma 248.0 (240.2- 256.0) 246.3 (238.0- 254.8) 326.6 (284.4- 372.7) 115.8 ( 79.5- 161.0)
Texas 228.2 (224.7- 231.6) 222.4 (218.9- 226.1) 328.2 (313.9- 343.0) 170.4 (163.7- 177.3)
West 202.3 (200.5- 204.0) 205.1 (203.3- 207.0) 270.1 (259.4- 281.2) 157.0 (152.4- 161.7)
Mountain 197.4 (194.3- 200.5) 198.8 (195.6- 202.1) 238.2 (213.5- 264.6) 182.9 (173.1- 193.0)
Arizona 202.3 (196.8- 208.0) 204.9 (199.1- 210.7) 244.4 (197.8- 297.3) 192.5 (174.4- 211.8)
Colorado 189.7 (182.9- 196.7) 189.8 (182.8- 196.9) 231.7 (186.5- 283.4) 181.4 (160.0- 204.5)
Idaho 201.0 (189.5- 213.0) 202.3 (190.6- 214.4) ∼ 195.3 (128.2- 280.9)
Montana 212.5 (199.1- 226.5) 210.5 (197.0- 224.7) ∼ ∼Nevada 217.1 (207.6- 227.0) 220.3 (210.1- 230.9) 244.2 (202.1- 291.7) 147.8 (118.4- 181.2)
New Mexico 194.8 (185.2- 204.8) 198.3 (188.2- 208.8) 265.7 (179.9- 374.2) 192.8 (175.7- 210.9)
Utah 167.4 (158.2- 176.8) 168.7 (159.4- 178.4) ∼ 131.1 ( 92.2- 178.9)
Wyoming 198.4 (179.9- 218.2) 199.8 (181.1- 219.9) ∼ ∼Pacific 204.6 (202.5- 206.6) 208.5 (206.2- 210.8) 276.9 (264.9- 289.1) 148.3 (143.1- 153.5)
Alaska 228.5 (203.9- 254.8) 213.1 (186.9- 241.6) ∼ ∼California 200.0 (197.6- 202.4) 203.4 (200.7- 206.1) 281.7 (269.1- 294.7) 148.3 (143.0- 153.7)
Hawaii 191.3 (180.4- 202.6) 212.1 (189.0- 237.2) ∼ 360.1 (267.6- 470.5)
Oregon 224.8 (217.6- 232.2) 224.9 (217.5- 232.4) 309.4 (222.8- 414.4) 104.7 ( 72.0- 145.2)
Washington 218.5 (212.8- 224.4) 221.5 (215.4- 227.6) 220.1 (178.6- 267.3) 124.3 ( 95.4- 157.8)
∗ Rates are per 100,000 persons and are age-adjusted to the 2000 U.S. standard population (19 age groups - Census P25-1130).† Data are from the National Vital Statistics System (NVSS).‡ Data for specified racial or ethnic populations other than white and black should be interpreted with caution. See Technical Notes.
§ Hispanic origin is not mutually exclusive from race categories (white, black).
∼ Rates are suppressed if fewer than 16 cases were reported in a specific category (area, race, ethnicity).
Note: U.S. rates are as presented in Table 1.1.1.2M.

United
States Cancer Statistics: 2004 Incid
ence and M
ortality
��
continued
Table 2.1.1.2F: All Cancer Sites Combined. Age-Adjusted Cancer Death Rates∗ and 95% ConfidenceIntervals, by U.S. Census Region and Division, State, and Race and Ethnicity, United States†
Females, 2004
Area All Races White Black Hispanic‡§
United States 157.0 (156.4- 157.6) 156.4 (155.8- 157.1) 182.8 (180.7- 184.9) 101.9 ( 99.9- 103.8)
Northeast 159.8 (158.5- 161.1) 161.7 (160.2- 163.1) 165.6 (161.2- 170.1) 93.7 ( 89.2- 98.3)
New England 161.6 (159.0- 164.3) 163.5 (160.7- 166.2) 148.0 (135.1- 161.8) 78.3 ( 67.0- 90.9)
Connecticut 155.9 (150.7- 161.3) 157.6 (152.2- 163.3) 151.9 (131.9- 173.8) 84.3 ( 65.6- 106.1)
Maine 169.5 (161.0- 178.4) 169.8 (161.2- 178.7) ∼ ∼Massachusetts 163.7 (159.7- 167.7) 166.5 (162.3- 170.7) 142.4 (124.6- 161.9) 74.3 ( 58.4- 92.8)
New Hampshire 162.9 (153.8- 172.3) 164.2 (155.0- 173.7) ∼ ∼Rhode Island 162.8 (153.3- 172.7) 162.6 (152.9- 172.8) 191.2 (134.7- 261.4) 91.4 ( 56.1- 138.4)
Vermont 151.9 (139.6- 164.9) 152.3 (140.0- 165.4) ∼ ∼Middle Atlantic 159.2 (157.7- 160.8) 161.1 (159.4- 162.8) 167.7 (163.0- 172.5) 95.8 ( 91.0- 100.8)
New Jersey 163.0 (159.6- 166.5) 164.7 (160.9- 168.5) 179.7 (168.8- 191.1) 86.9 ( 77.7- 96.9)
New York 152.7 (150.4- 154.9) 157.3 (154.8- 159.8) 150.3 (144.5- 156.3) 99.3 ( 93.4- 105.4)
Pennsylvania 166.2 (163.4- 169.0) 163.8 (160.9- 166.7) 202.5 (191.7- 213.7) 93.6 ( 76.1- 113.5)
Midwest 161.5 (160.2- 162.7) 158.8 (157.4- 160.1) 201.3 (196.2- 206.5) 90.2 ( 83.0- 97.7)
East North Central 164.1 (162.5- 165.6) 161.1 (159.5- 162.7) 201.1 (195.6- 206.8) 88.9 ( 81.0- 97.3)
Illinois 164.3 (161.4- 167.3) 160.2 (157.0- 163.4) 209.0 (199.4- 218.8) 85.0 ( 74.9- 95.9)
Indiana 167.5 (163.3- 171.9) 166.0 (161.6- 170.5) 196.5 (178.8- 215.5) 83.6 ( 58.7- 114.4)
Michigan 160.5 (157.2- 163.8) 157.3 (153.9- 160.8) 189.4 (178.9- 200.3) 127.6 (103.4- 155.3)
Ohio 169.8 (166.7- 172.9) 166.8 (163.6- 170.0) 206.2 (195.3- 217.6) 83.4 ( 61.8- 109.3)
Wisconsin 153.7 (149.4- 158.0) 152.1 (147.7- 156.5) 188.8 (162.1- 218.4) 57.5 ( 35.3- 86.9)
West North Central 155.4 (153.1- 157.7) 153.7 (151.4- 156.0) 203.3 (190.2- 217.0) 95.4 ( 79.0- 113.7)
Iowa 153.4 (147.8- 159.1) 153.2 (147.6- 159.0) 214.9 (156.5- 286.4) ∼Kansas 153.5 (147.5- 159.7) 152.3 (146.1- 158.7) 203.2 (169.5- 241.3) 123.0 ( 90.4- 162.2)
Minnesota 152.1 (147.6- 156.7) 151.7 (147.1- 156.4) 168.0 (130.5- 211.9) 69.4 ( 39.0- 111.4)
Missouri 166.7 (162.5- 171.1) 163.9 (159.5- 168.5) 205.8 (189.6- 222.9) 103.9 ( 70.8- 145.5)
Nebraska 145.9 (138.6- 153.4) 144.3 (137.0- 152.0) 206.6 (153.5- 270.8) 90.0 ( 48.4- 148.5)
North Dakota 139.3 (128.0- 151.5) 136.9 (125.5- 149.1) ∼ ∼South Dakota 142.1 (131.6- 153.3) 137.9 (127.3- 149.3) ∼ ∼
South 158.6 (157.5- 159.6) 155.4 (154.3- 156.5) 183.0 (180.1- 185.8) 102.9 ( 99.8- 106.0)
South Atlantic 156.1 (154.8- 157.5) 153.1 (151.6- 154.6) 176.5 (172.9- 180.2) 94.2 ( 89.8- 98.7)
Delaware 171.9 (160.5- 183.8) 172.1 (159.7- 185.3) 178.4 (147.8- 213.2) ∼District of Columbia 170.2 (156.2- 185.1) 118.7 ( 97.9- 142.9) 196.8 (178.4- 216.6) ∼Florida 149.5 (147.3- 151.7) 148.5 (146.1- 150.8) 165.7 (157.9- 173.7) 99.3 ( 94.3- 104.4)
Georgia 159.0 (155.2- 162.9) 155.5 (151.2- 159.9) 173.9 (165.6- 182.4) 84.3 ( 63.6- 108.9)
Maryland 163.2 (158.7- 167.8) 161.1 (155.8- 166.4) 180.8 (170.8- 191.2) 56.7 ( 40.1- 77.3)
North Carolina 160.0 (156.5- 163.6) 155.5 (151.6- 159.5) 182.7 (173.8- 191.9) 46.0 ( 29.5- 67.4)
South Carolina 155.9 (151.0- 160.9) 149.4 (143.8- 155.1) 174.9 (164.4- 186.0) ∼Virginia 156.1 (152.3- 160.0) 152.7 (148.5- 157.0) 181.6 (171.6- 192.1) 102.2 ( 80.3- 127.6)
West Virginia 177.4 (170.0- 185.0) 177.9 (170.4- 185.7) 195.3 (150.3- 249.9) ∼East South Central 170.2 (167.7- 172.8) 166.8 (164.0- 169.5) 190.8 (184.1- 197.7) 77.9 ( 59.0- 100.4)
Alabama 163.0 (158.2- 167.8) 160.5 (155.1- 165.9) 175.1 (164.5- 186.2) ∼Kentucky 180.6 (175.3- 186.1) 179.2 (173.7- 184.8) 215.8 (191.9- 241.8) 160.1 (102.4- 235.9)
Mississippi 167.1 (160.9- 173.5) 157.6 (150.5- 165.1) 190.4 (177.9- 203.4) ∼Tennessee 170.2 (165.9- 174.7) 165.8 (161.2- 170.5) 204.2 (190.7- 218.4) 53.7 ( 29.5- 88.0)
West South Central 156.4 (154.5- 158.3) 153.0 (151.0- 155.0) 193.6 (187.4- 199.8) 110.9 (106.5- 115.4)
Arkansas 172.3 (166.1- 178.7) 171.5 (164.8- 178.3) 186.2 (167.3- 206.6) 79.7 ( 44.2- 130.0)

Cancer Incidence and M
ortality, by U.S. C
ensus Region and D
i�ision, State, and Metropolitan A
rea
�3
Table 2.1.1.2F: All Cancer Sites Combined. Age-Adjusted Cancer Death Rates∗ and 95% ConfidenceIntervals, by U.S. Census Region and Division, State, and Race and Ethnicity, United States† (continued)
Females, 2004
Area All Races White Black Hispanic‡§
Louisiana 173.2 (168.1- 178.5) 163.8 (158.0- 169.9) 201.8 (190.9- 213.1) 39.5 ( 24.1- 60.7)
Oklahoma 159.0 (153.6- 164.6) 158.8 (153.0- 164.7) 183.2 (158.3- 210.7) 112.4 ( 77.0- 156.3)
Texas 149.6 (147.3- 152.0) 146.9 (144.5- 149.4) 191.5 (183.0- 200.3) 112.9 (108.3- 117.6)
West 146.5 (145.2- 147.8) 150.4 (149.0- 151.8) 181.7 (174.6- 189.0) 106.1 (103.0- 109.3)
Mountain 143.5 (141.2- 145.9) 144.7 (142.3- 147.2) 153.4 (137.1- 170.9) 115.9 (109.4- 122.7)
Arizona 140.4 (136.3- 144.6) 141.1 (136.8- 145.5) 172.6 (141.6- 207.8) 109.8 ( 98.9- 121.4)
Colorado 140.7 (135.8- 145.8) 142.1 (137.0- 147.4) 127.2 (100.3- 158.6) 129.5 (114.2- 146.1)
Idaho 144.6 (135.9- 153.7) 145.7 (136.9- 155.0) ∼ 118.5 ( 70.9- 182.5)
Montana 157.5 (147.3- 168.3) 156.6 (146.2- 167.6) ∼ ∼Nevada 176.3 (168.6- 184.3) 181.1 (172.8- 189.8) 168.4 (137.9- 203.1) 75.8 ( 58.4- 96.3)
New Mexico 137.4 (130.4- 144.7) 141.4 (134.0- 149.2) 124.6 ( 76.6- 189.7) 125.5 (113.5- 138.3)
Utah 117.6 (110.8- 124.6) 118.0 (111.2- 125.2) ∼ 97.3 ( 68.3- 133.1)
Wyoming 153.3 (139.0- 168.7) 151.6 (137.2- 167.1) ∼ 170.8 ( 96.8- 274.5)
Pacific 147.8 (146.3- 149.3) 153.2 (151.4- 154.9) 187.3 (179.4- 195.4) 102.9 ( 99.4- 106.5)
Alaska 150.2 (133.4- 168.4) 143.1 (124.1- 163.9) ∼ ∼California 145.0 (143.3- 146.8) 149.6 (147.6- 151.6) 190.9 (182.6- 199.5) 102.7 ( 99.1- 106.4)
Hawaii 116.2 (108.7- 124.2) 138.7 (121.5- 157.7) ∼ 210.3 (151.4- 282.2)
Oregon 165.4 (159.9- 171.1) 167.4 (161.7- 173.2) 189.5 (136.6- 254.6) 104.2 ( 75.3- 139.3)
Washington 160.2 (155.9- 164.6) 163.4 (158.8- 168.1) 154.2 (124.5- 188.1) 86.4 ( 65.9- 110.4)
∗ Rates are per 100,000 persons and are age-adjusted to the 2000 U.S. standard population (19 age groups - Census P25-1130).† Data are from the National Vital Statistics System (NVSS).‡ Data for specified racial or ethnic populations other than white and black should be interpreted with caution. See Technical Notes.
§ Hispanic origin is not mutually exclusive from race categories (white, black).
∼ Rates are suppressed if fewer than 16 cases were reported in a specific category (area, race, ethnicity).
Note: U.S. rates are as presented in Table 1.1.1.2F.
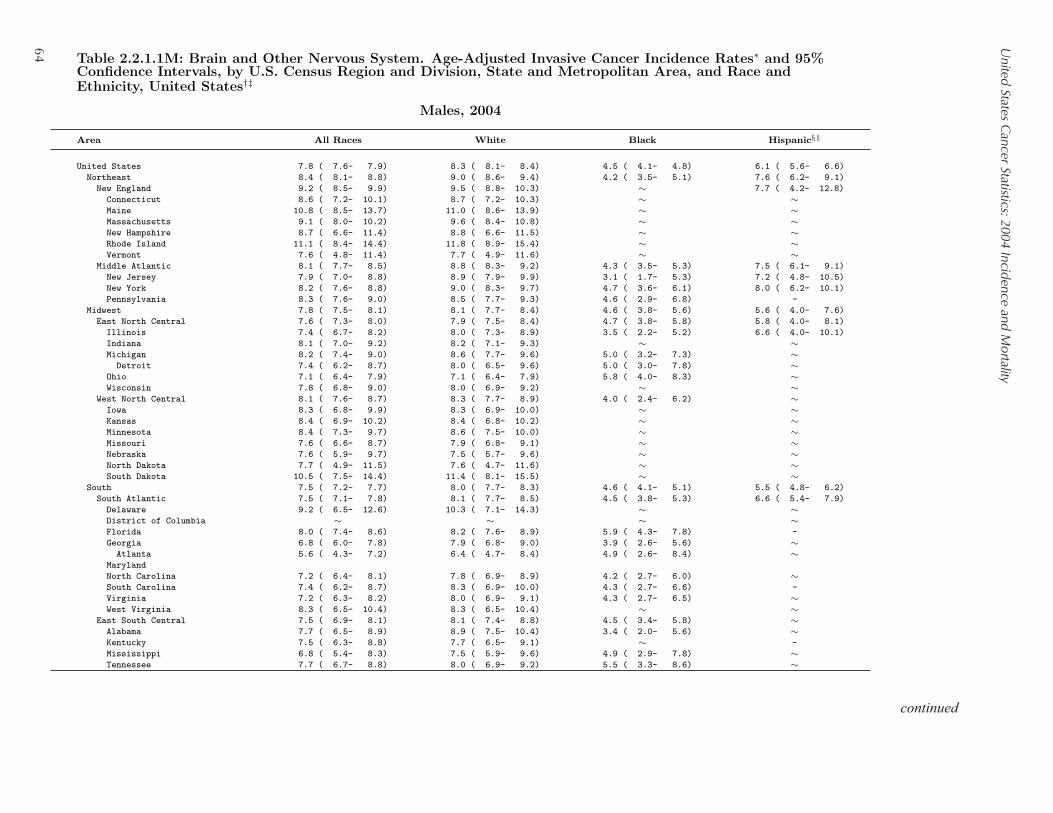
United
States Cancer Statistics: 2004 Incid
ence and M
ortality
��
continued
Table 2.2.1.1M: Brain and Other Nervous System. Age-Adjusted Invasive Cancer Incidence Rates∗ and 95%Confidence Intervals, by U.S. Census Region and Division, State and Metropolitan Area, and Race andEthnicity, United States†‡
Males, 2004
Area All Races White Black Hispanic§
United States 7.8 ( 7.6- 7.9) 8.3 ( 8.1- 8.4) 4.5 ( 4.1- 4.8) 6.1 ( 5.6- 6.6)
Northeast 8.4 ( 8.1- 8.8) 9.0 ( 8.6- 9.4) 4.2 ( 3.5- 5.1) 7.6 ( 6.2- 9.1)
New England 9.2 ( 8.5- 9.9) 9.5 ( 8.8- 10.3) ∼ 7.7 ( 4.2- 12.8)
Connecticut 8.6 ( 7.2- 10.1) 8.7 ( 7.2- 10.3) ∼ ∼Maine 10.8 ( 8.5- 13.7) 11.0 ( 8.6- 13.9) ∼ ∼Massachusetts 9.1 ( 8.0- 10.2) 9.6 ( 8.4- 10.8) ∼ ∼New Hampshire 8.7 ( 6.6- 11.4) 8.8 ( 6.6- 11.5) ∼ ∼Rhode Island 11.1 ( 8.4- 14.4) 11.8 ( 8.9- 15.4) ∼ ∼Vermont 7.6 ( 4.8- 11.4) 7.7 ( 4.9- 11.6) ∼ ∼
Middle Atlantic 8.1 ( 7.7- 8.5) 8.8 ( 8.3- 9.2) 4.3 ( 3.5- 5.3) 7.5 ( 6.1- 9.1)
New Jersey 7.9 ( 7.0- 8.8) 8.9 ( 7.9- 9.9) 3.1 ( 1.7- 5.3) 7.2 ( 4.8- 10.5)
New York 8.2 ( 7.6- 8.8) 9.0 ( 8.3- 9.7) 4.7 ( 3.6- 6.1) 8.0 ( 6.2- 10.1)
Pennsylvania 8.3 ( 7.6- 9.0) 8.5 ( 7.7- 9.3) 4.6 ( 2.9- 6.8) -
Midwest 7.8 ( 7.5- 8.1) 8.1 ( 7.7- 8.4) 4.6 ( 3.8- 5.6) 5.6 ( 4.0- 7.6)
East North Central 7.6 ( 7.3- 8.0) 7.9 ( 7.5- 8.4) 4.7 ( 3.8- 5.8) 5.8 ( 4.0- 8.1)
Illinois 7.4 ( 6.7- 8.2) 8.0 ( 7.3- 8.9) 3.5 ( 2.2- 5.2) 6.6 ( 4.0- 10.1)
Indiana 8.1 ( 7.0- 9.2) 8.2 ( 7.1- 9.3) ∼ ∼Michigan 8.2 ( 7.4- 9.0) 8.6 ( 7.7- 9.6) 5.0 ( 3.2- 7.3) ∼
Detroit 7.4 ( 6.2- 8.7) 8.0 ( 6.5- 9.6) 5.0 ( 3.0- 7.8) ∼Ohio 7.1 ( 6.4- 7.9) 7.1 ( 6.4- 7.9) 5.8 ( 4.0- 8.3) ∼Wisconsin 7.8 ( 6.8- 9.0) 8.0 ( 6.9- 9.2) ∼ ∼
West North Central 8.1 ( 7.6- 8.7) 8.3 ( 7.7- 8.9) 4.0 ( 2.4- 6.2) ∼Iowa 8.3 ( 6.8- 9.9) 8.3 ( 6.9- 10.0) ∼ ∼Kansas 8.4 ( 6.9- 10.2) 8.4 ( 6.8- 10.2) ∼ ∼Minnesota 8.4 ( 7.3- 9.7) 8.6 ( 7.5- 10.0) ∼ ∼Missouri 7.6 ( 6.6- 8.7) 7.9 ( 6.8- 9.1) ∼ ∼Nebraska 7.6 ( 5.9- 9.7) 7.5 ( 5.7- 9.6) ∼ ∼North Dakota 7.7 ( 4.9- 11.5) 7.6 ( 4.7- 11.6) ∼ ∼South Dakota 10.5 ( 7.5- 14.4) 11.4 ( 8.1- 15.5) ∼ ∼
South 7.5 ( 7.2- 7.7) 8.0 ( 7.7- 8.3) 4.6 ( 4.1- 5.1) 5.5 ( 4.8- 6.2)
South Atlantic 7.5 ( 7.1- 7.8) 8.1 ( 7.7- 8.5) 4.5 ( 3.8- 5.3) 6.6 ( 5.4- 7.9)
Delaware 9.2 ( 6.5- 12.6) 10.3 ( 7.1- 14.3) ∼ ∼District of Columbia ∼ ∼ ∼ ∼Florida 8.0 ( 7.4- 8.6) 8.2 ( 7.6- 8.9) 5.9 ( 4.3- 7.8) -
Georgia 6.8 ( 6.0- 7.8) 7.9 ( 6.8- 9.0) 3.9 ( 2.6- 5.6) ∼Atlanta 5.6 ( 4.3- 7.2) 6.4 ( 4.7- 8.4) 4.9 ( 2.6- 8.4) ∼
Maryland
North Carolina 7.2 ( 6.4- 8.1) 7.8 ( 6.9- 8.9) 4.2 ( 2.7- 6.0) ∼South Carolina 7.4 ( 6.2- 8.7) 8.3 ( 6.9- 10.0) 4.3 ( 2.7- 6.6) -
Virginia 7.2 ( 6.3- 8.2) 8.0 ( 6.9- 9.1) 4.3 ( 2.7- 6.5) ∼West Virginia 8.3 ( 6.5- 10.4) 8.3 ( 6.5- 10.4) ∼ ∼
East South Central 7.5 ( 6.9- 8.1) 8.1 ( 7.4- 8.8) 4.5 ( 3.4- 5.8) ∼Alabama 7.7 ( 6.5- 8.9) 8.9 ( 7.5- 10.4) 3.4 ( 2.0- 5.6) ∼Kentucky 7.5 ( 6.3- 8.8) 7.7 ( 6.5- 9.1) ∼ -
Mississippi 6.8 ( 5.4- 8.3) 7.5 ( 5.9- 9.6) 4.9 ( 2.9- 7.8) ∼Tennessee 7.7 ( 6.7- 8.8) 8.0 ( 6.9- 9.2) 5.5 ( 3.3- 8.6) ∼

Cancer Incidence and M
ortality, by U.S. C
ensus Region and D
i�ision, State, and Metropolitan A
rea
��
Table 2.2.1.1M: Brain and Other Nervous System. Age-Adjusted Invasive Cancer Incidence Rates∗ and 95%Confidence Intervals, by U.S. Census Region and Division, State and Metropolitan Area, and Race andEthnicity, United States†‡ (continued)
Males, 2004
Area All Races White Black Hispanic§
West South Central 7.5 ( 7.1- 8.0) 8.0 ( 7.5- 8.5) 4.8 ( 3.8- 6.0) 4.6 ( 3.8- 5.6)
Arkansas 8.0 ( 6.5- 9.7) 8.1 ( 6.5- 9.9) ∼ ∼Louisiana 7.3 ( 6.1- 8.6) 8.5 ( 7.0- 10.2) 4.1 ( 2.5- 6.3) ∼Oklahoma 8.3 ( 7.0- 9.8) 8.5 ( 7.0- 10.1) ∼ ∼Texas 7.4 ( 6.8- 7.9) 7.7 ( 7.1- 8.4) 4.7 ( 3.4- 6.4) 4.8 ( 3.9- 5.8)
West 7.6 ( 7.3- 7.9) 8.2 ( 7.9- 8.6) 4.1 ( 3.1- 5.5) 6.3 ( 5.5- 7.1)
Mountain 7.5 ( 6.9- 8.1) 7.8 ( 7.2- 8.4) ∼ 5.2 ( 3.9- 6.8)
Arizona 7.4 ( 6.4- 8.5) 7.8 ( 6.7- 9.0) ∼ 5.4 ( 3.0- 8.9)
Colorado 7.1 ( 6.0- 8.3) 7.4 ( 6.2- 8.7) ∼ 7.9 ( 4.7- 12.2)
Idaho 8.0 ( 5.9- 10.5) 8.2 ( 6.1- 10.8) ∼ ∼Montana 8.6 ( 6.2- 11.7) 9.0 ( 6.5- 12.3) ∼ ∼Nevada 7.2 ( 5.7- 9.0) 7.7 ( 6.1- 9.7) ∼ ∼New Mexico 6.8 ( 5.2- 8.8) 7.1 ( 5.4- 9.2) ∼ ∼Utah 7.6 ( 6.0- 9.6) 7.9 ( 6.1- 9.9) ∼ ∼Wyoming 8.7 ( 5.4- 13.3) 7.8 ( 4.6- 12.3) ∼ ∼
Pacific 7.7 ( 7.3- 8.1) 8.5 ( 8.0- 8.9) 4.6 ( 3.3- 6.1) 6.6 ( 5.7- 7.6)
Alaska 7.8 ( 4.7- 12.3) 8.1 ( 4.4- 13.5) ∼ ∼California 7.5 ( 7.1- 7.9) 8.3 ( 7.8- 8.8) 4.9 ( 3.5- 6.6) 6.7 ( 5.8- 7.7)
San Francisco-Oakland 7.7 ( 6.6- 9.1) 9.0 ( 7.5- 10.8) ∼ 8.4 ( 4.9- 13.3)
San Jose-Monterey 5.9 ( 4.5- 7.5) 6.6 ( 4.9- 8.6) ∼ 7.4 ( 3.8- 12.9)
Los Angeles 7.0 ( 6.2- 7.9) 7.9 ( 6.9- 9.0) 6.1 ( 3.8- 9.2) 7.3 ( 5.7- 9.1)
Hawaii 4.1 ( 2.7- 6.0) ∼ ∼ ∼Oregon 9.1 ( 7.7- 10.6) 9.2 ( 7.8- 10.8) ∼ ∼Washington 8.8 ( 7.7- 9.9) 9.0 ( 7.9- 10.3) ∼ ∼
Seattle-Puget Sound 9.1 ( 7.8- 10.5) 9.8 ( 8.4- 11.4) ∼ ∼∗ Rates are per 100,000 persons and are age-adjusted to the 2000 U.S. standard population (19 age groups - Census P25-1130).† Data are from all state and metropolitan area cancer registries, except Maryland. Included data cover approximately 98% of the population and met data
quality criteria for all invasive cancer sites combined. See Appendix B for registry-specific data quality information.‡ Invasive cancers only.
§ Data for specified racial or ethnic populations other than white and black should be interpreted with caution. See Technical Notes.
Hispanic origin is not mutually exclusive from race categories (white, black).
∼ Rates are suppressed if fewer than 16 cases were reported in a specific category (area, race, ethnicity).
- Rates are suppressed at the state’s or metropolitan area’s request. See Technical Notes.
Notes: Cases from suppressed rates are included in the U.S. and region/division rates. U.S. rates are as presented in Table 1.1.1.1M. Michigan, Georgia,
California, and Washington state rates each include cases from the SEER metropolitan areas.

United
States Cancer Statistics: 2004 Incid
ence and M
ortality
��
continued
Table 2.2.1.1F: Brain and Other Nervous System. Age-Adjusted Invasive Cancer Incidence Rates∗ and 95%Confidence Intervals, by U.S. Census Region and Division, State and Metropolitan Area, and Race andEthnicity, United States†‡
Females, 2004
Area All Races White Black Hispanic§
United States 5.6 ( 5.5- 5.8) 6.0 ( 5.8- 6.1) 3.7 ( 3.4- 4.0) 4.6 ( 4.2- 4.9)
Northeast 5.8 ( 5.5- 6.1) 6.2 ( 5.9- 6.5) 3.2 ( 2.6- 3.8) 4.8 ( 3.9- 5.8)
New England 5.7 ( 5.2- 6.3) 6.0 ( 5.5- 6.6) ∼ 5.5 ( 3.3- 8.6)
Connecticut 5.6 ( 4.6- 6.8) 6.1 ( 5.0- 7.4) ∼ ∼Maine 7.6 ( 5.7- 9.9) 7.6 ( 5.7- 9.9) ∼ ∼Massachusetts 5.4 ( 4.6- 6.2) 5.7 ( 4.9- 6.6) ∼ ∼New Hampshire 6.8 ( 5.0- 9.1) 6.6 ( 4.8- 9.0) ∼ ∼Rhode Island 5.5 ( 3.8- 7.8) 5.9 ( 4.1- 8.4) ∼ ∼Vermont ∼ ∼ ∼ ∼
Middle Atlantic 5.8 ( 5.5- 6.2) 6.2 ( 5.9- 6.6) 3.4 ( 2.7- 4.1) 4.7 ( 3.7- 5.8)
New Jersey 6.6 ( 5.9- 7.4) 7.0 ( 6.2- 7.9) 3.7 ( 2.4- 5.5) 5.5 ( 3.4- 8.2)
New York 5.5 ( 5.0- 6.0) 5.9 ( 5.4- 6.5) 3.5 ( 2.7- 4.5) 4.6 ( 3.5- 5.9)
Pennsylvania 5.9 ( 5.3- 6.5) 6.2 ( 5.6- 6.8) 2.6 ( 1.6- 4.2) -
Midwest 5.7 ( 5.4- 6.0) 5.9 ( 5.6- 6.2) 3.7 ( 3.1- 4.4) 4.5 ( 3.1- 6.1)
East North Central 5.7 ( 5.4- 6.0) 5.9 ( 5.6- 6.2) 3.8 ( 3.1- 4.6) 4.5 ( 3.1- 6.4)
Illinois 5.8 ( 5.2- 6.4) 6.2 ( 5.5- 6.9) 3.8 ( 2.6- 5.2) 4.9 ( 3.0- 7.5)
Indiana 5.7 ( 4.9- 6.5) 5.9 ( 5.1- 6.9) ∼ ∼Michigan 5.8 ( 5.2- 6.5) 5.9 ( 5.2- 6.6) 5.3 ( 3.8- 7.4) ∼
Detroit 5.3 ( 4.4- 6.4) 5.5 ( 4.4- 6.8) 5.0 ( 3.3- 7.4) ∼Ohio 5.4 ( 4.9- 6.0) 5.7 ( 5.1- 6.4) 2.9 ( 1.8- 4.5) ∼Wisconsin 5.8 ( 5.0- 6.7) 5.7 ( 4.8- 6.7) ∼ ∼
West North Central 5.7 ( 5.3- 6.2) 5.9 ( 5.4- 6.4) 3.2 ( 1.9- 5.2) ∼Iowa 5.9 ( 4.7- 7.2) 5.9 ( 4.7- 7.2) ∼ ∼Kansas 5.7 ( 4.5- 7.1) 5.5 ( 4.3- 6.9) ∼ ∼Minnesota 5.5 ( 4.6- 6.5) 5.7 ( 4.8- 6.8) ∼ ∼Missouri 6.1 ( 5.3- 7.1) 6.5 ( 5.5- 7.5) ∼ ∼Nebraska 5.1 ( 3.8- 6.8) 5.2 ( 3.8- 6.9) ∼ ∼North Dakota 5.8 ( 3.5- 8.9) 5.7 ( 3.5- 9.0) ∼ ∼South Dakota 5.0 ( 3.1- 7.7) 5.5 ( 3.3- 8.4) ∼ ∼
South 5.7 ( 5.5- 5.9) 6.1 ( 5.8- 6.3) 4.0 ( 3.6- 4.4) 5.0 ( 4.4- 5.7)
South Atlantic 5.7 ( 5.4- 6.0) 6.1 ( 5.8- 6.4) 4.1 ( 3.5- 4.7) 5.4 ( 4.4- 6.5)
Delaware 6.3 ( 4.1- 9.2) 7.6 ( 4.8- 11.3) ∼ ∼District of Columbia ∼ ∼ ∼ ∼Florida 5.6 ( 5.1- 6.1) 5.7 ( 5.2- 6.3) 4.3 ( 3.2- 5.6) -
Georgia 6.2 ( 5.5- 7.0) 6.7 ( 5.8- 7.7) 4.9 ( 3.6- 6.3) ∼Atlanta 5.9 ( 4.6- 7.3) 6.9 ( 5.2- 8.9) 3.9 ( 2.1- 6.4) ∼
Maryland
North Carolina 5.9 ( 5.2- 6.6) 6.4 ( 5.6- 7.3) 3.8 ( 2.6- 5.3) ∼South Carolina 5.2 ( 4.3- 6.3) 6.0 ( 4.8- 7.3) 3.5 ( 2.1- 5.3) -
Virginia 5.5 ( 4.8- 6.2) 5.8 ( 5.0- 6.8) 3.2 ( 2.1- 4.8) ∼West Virginia 6.6 ( 5.1- 8.5) 6.7 ( 5.2- 8.6) ∼ ∼
East South Central 5.9 ( 5.4- 6.4) 6.3 ( 5.7- 6.8) 3.8 ( 3.0- 4.9) ∼Alabama 5.8 ( 4.9- 6.8) 6.6 ( 5.5- 7.9) 2.9 ( 1.8- 4.6) ∼Kentucky 5.9 ( 4.9- 7.0) 6.0 ( 5.0- 7.2) ∼ -
Mississippi 5.3 ( 4.2- 6.5) 5.5 ( 4.1- 7.2) 4.7 ( 3.0- 7.1) ∼Tennessee 6.2 ( 5.4- 7.2) 6.5 ( 5.5- 7.5) 4.0 ( 2.4- 6.3) ∼

Cancer Incidence and M
ortality, by U.S. C
ensus Region and D
i�ision, State, and Metropolitan A
rea
��
Table 2.2.1.1F: Brain and Other Nervous System. Age-Adjusted Invasive Cancer Incidence Rates∗ and 95%Confidence Intervals, by U.S. Census Region and Division, State and Metropolitan Area, and Race andEthnicity, United States†‡ (continued)
Females, 2004
Area All Races White Black Hispanic§
West South Central 5.5 ( 5.2- 5.9) 5.9 ( 5.5- 6.3) 3.8 ( 3.1- 4.7) 4.7 ( 3.9- 5.5)
Arkansas 4.1 ( 3.2- 5.3) 4.4 ( 3.4- 5.8) ∼ ∼Louisiana 4.5 ( 3.7- 5.5) 5.1 ( 4.0- 6.3) 3.2 ( 2.1- 4.8) ∼Oklahoma 6.2 ( 5.1- 7.5) 5.9 ( 4.8- 7.3) ∼ ∼Texas 5.9 ( 5.4- 6.3) 6.3 ( 5.8- 6.8) 3.8 ( 2.8- 5.2) 4.6 ( 3.9- 5.5)
West 5.3 ( 5.1- 5.6) 5.8 ( 5.5- 6.0) 3.0 ( 2.2- 4.0) 4.1 ( 3.6- 4.7)
Mountain 5.9 ( 5.4- 6.4) 6.1 ( 5.6- 6.7) ∼ 4.0 ( 3.1- 5.2)
Arizona 6.2 ( 5.4- 7.2) 6.5 ( 5.6- 7.6) ∼ 4.9 ( 3.1- 7.3)
Colorado 5.7 ( 4.7- 6.8) 5.8 ( 4.8- 6.9) ∼ ∼Idaho 6.5 ( 4.7- 8.6) 6.5 ( 4.8- 8.8) ∼ ∼Montana 5.2 ( 3.4- 7.7) 5.4 ( 3.5- 8.0) ∼ ∼Nevada 5.8 ( 4.5- 7.4) 6.1 ( 4.6- 7.8) ∼ ∼New Mexico 4.6 ( 3.3- 6.1) 5.1 ( 3.7- 6.8) ∼ ∼Utah 6.7 ( 5.2- 8.5) 7.0 ( 5.5- 8.9) ∼ ∼Wyoming ∼ ∼ ∼ ∼
Pacific 5.1 ( 4.8- 5.4) 5.6 ( 5.3- 5.9) 3.0 ( 2.1- 4.1) 4.1 ( 3.5- 4.8)
Alaska ∼ ∼ ∼ ∼California 4.9 ( 4.6- 5.3) 5.4 ( 5.0- 5.8) 3.3 ( 2.3- 4.5) 4.2 ( 3.6- 4.9)
San Francisco-Oakland 4.8 ( 3.9- 5.8) 5.6 ( 4.5- 7.0) ∼ ∼San Jose-Monterey 5.4 ( 4.2- 7.0) 5.6 ( 4.1- 7.4) ∼ ∼Los Angeles 4.2 ( 3.6- 4.8) 4.9 ( 4.2- 5.7) 3.4 ( 2.0- 5.4) 4.4 ( 3.4- 5.5)
Hawaii 3.7 ( 2.4- 5.4) ∼ ∼ ∼Oregon 6.1 ( 5.0- 7.3) 6.1 ( 5.0- 7.4) ∼ ∼Washington 6.1 ( 5.3- 7.0) 6.4 ( 5.5- 7.4) ∼ ∼
Seattle-Puget Sound 6.3 ( 5.3- 7.5) 7.0 ( 5.9- 8.3) ∼ ∼∗ Rates are per 100,000 persons and are age-adjusted to the 2000 U.S. standard population (19 age groups - Census P25-1130).† Data are from all state and metropolitan area cancer registries, except Maryland. Included data cover approximately 98% of the population and met data
quality criteria for all invasive cancer sites combined. See Appendix B for registry-specific data quality information.‡ Invasive cancers only.
§ Data for specified racial or ethnic populations other than white and black should be interpreted with caution. See Technical Notes.
Hispanic origin is not mutually exclusive from race categories (white, black).
∼ Rates are suppressed if fewer than 16 cases were reported in a specific category (area, race, ethnicity).
- Rates are suppressed at the state’s or metropolitan area’s request. See Technical Notes.
Notes: Cases from suppressed rates are included in the U.S. and region/division rates. U.S. rates are as presented in Table 1.1.1.1F. Michigan, Georgia,
California, and Washington state rates each include cases from the SEER metropolitan areas.
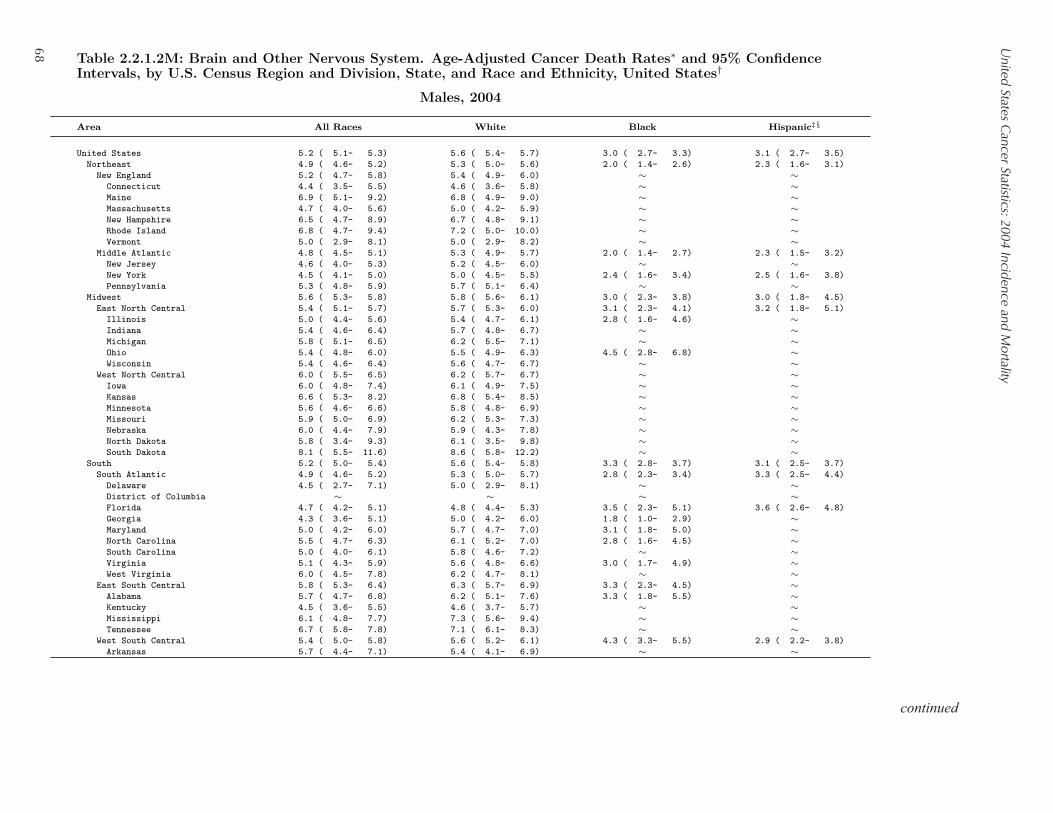
United
States Cancer Statistics: 2004 Incid
ence and M
ortality
��
continued
Table 2.2.1.2M: Brain and Other Nervous System. Age-Adjusted Cancer Death Rates∗ and 95% ConfidenceIntervals, by U.S. Census Region and Division, State, and Race and Ethnicity, United States†
Males, 2004
Area All Races White Black Hispanic‡§
United States 5.2 ( 5.1- 5.3) 5.6 ( 5.4- 5.7) 3.0 ( 2.7- 3.3) 3.1 ( 2.7- 3.5)
Northeast 4.9 ( 4.6- 5.2) 5.3 ( 5.0- 5.6) 2.0 ( 1.4- 2.6) 2.3 ( 1.6- 3.1)
New England 5.2 ( 4.7- 5.8) 5.4 ( 4.9- 6.0) ∼ ∼Connecticut 4.4 ( 3.5- 5.5) 4.6 ( 3.6- 5.8) ∼ ∼Maine 6.9 ( 5.1- 9.2) 6.8 ( 4.9- 9.0) ∼ ∼Massachusetts 4.7 ( 4.0- 5.6) 5.0 ( 4.2- 5.9) ∼ ∼New Hampshire 6.5 ( 4.7- 8.9) 6.7 ( 4.8- 9.1) ∼ ∼Rhode Island 6.8 ( 4.7- 9.4) 7.2 ( 5.0- 10.0) ∼ ∼Vermont 5.0 ( 2.9- 8.1) 5.0 ( 2.9- 8.2) ∼ ∼
Middle Atlantic 4.8 ( 4.5- 5.1) 5.3 ( 4.9- 5.7) 2.0 ( 1.4- 2.7) 2.3 ( 1.5- 3.2)
New Jersey 4.6 ( 4.0- 5.3) 5.2 ( 4.5- 6.0) ∼ ∼New York 4.5 ( 4.1- 5.0) 5.0 ( 4.5- 5.5) 2.4 ( 1.6- 3.4) 2.5 ( 1.6- 3.8)
Pennsylvania 5.3 ( 4.8- 5.9) 5.7 ( 5.1- 6.4) ∼ ∼Midwest 5.6 ( 5.3- 5.8) 5.8 ( 5.6- 6.1) 3.0 ( 2.3- 3.8) 3.0 ( 1.8- 4.5)
East North Central 5.4 ( 5.1- 5.7) 5.7 ( 5.3- 6.0) 3.1 ( 2.3- 4.1) 3.2 ( 1.8- 5.1)
Illinois 5.0 ( 4.4- 5.6) 5.4 ( 4.7- 6.1) 2.8 ( 1.6- 4.6) ∼Indiana 5.4 ( 4.6- 6.4) 5.7 ( 4.8- 6.7) ∼ ∼Michigan 5.8 ( 5.1- 6.5) 6.2 ( 5.5- 7.1) ∼ ∼Ohio 5.4 ( 4.8- 6.0) 5.5 ( 4.9- 6.3) 4.5 ( 2.8- 6.8) ∼Wisconsin 5.4 ( 4.6- 6.4) 5.6 ( 4.7- 6.7) ∼ ∼
West North Central 6.0 ( 5.5- 6.5) 6.2 ( 5.7- 6.7) ∼ ∼Iowa 6.0 ( 4.8- 7.4) 6.1 ( 4.9- 7.5) ∼ ∼Kansas 6.6 ( 5.3- 8.2) 6.8 ( 5.4- 8.5) ∼ ∼Minnesota 5.6 ( 4.6- 6.6) 5.8 ( 4.8- 6.9) ∼ ∼Missouri 5.9 ( 5.0- 6.9) 6.2 ( 5.3- 7.3) ∼ ∼Nebraska 6.0 ( 4.4- 7.9) 5.9 ( 4.3- 7.8) ∼ ∼North Dakota 5.8 ( 3.4- 9.3) 6.1 ( 3.5- 9.8) ∼ ∼South Dakota 8.1 ( 5.5- 11.6) 8.6 ( 5.8- 12.2) ∼ ∼
South 5.2 ( 5.0- 5.4) 5.6 ( 5.4- 5.8) 3.3 ( 2.8- 3.7) 3.1 ( 2.5- 3.7)
South Atlantic 4.9 ( 4.6- 5.2) 5.3 ( 5.0- 5.7) 2.8 ( 2.3- 3.4) 3.3 ( 2.5- 4.4)
Delaware 4.5 ( 2.7- 7.1) 5.0 ( 2.9- 8.1) ∼ ∼District of Columbia ∼ ∼ ∼ ∼Florida 4.7 ( 4.2- 5.1) 4.8 ( 4.4- 5.3) 3.5 ( 2.3- 5.1) 3.6 ( 2.6- 4.8)
Georgia 4.3 ( 3.6- 5.1) 5.0 ( 4.2- 6.0) 1.8 ( 1.0- 2.9) ∼Maryland 5.0 ( 4.2- 6.0) 5.7 ( 4.7- 7.0) 3.1 ( 1.8- 5.0) ∼North Carolina 5.5 ( 4.7- 6.3) 6.1 ( 5.2- 7.0) 2.8 ( 1.6- 4.5) ∼South Carolina 5.0 ( 4.0- 6.1) 5.8 ( 4.6- 7.2) ∼ ∼Virginia 5.1 ( 4.3- 5.9) 5.6 ( 4.8- 6.6) 3.0 ( 1.7- 4.9) ∼West Virginia 6.0 ( 4.5- 7.8) 6.2 ( 4.7- 8.1) ∼ ∼
East South Central 5.8 ( 5.3- 6.4) 6.3 ( 5.7- 6.9) 3.3 ( 2.3- 4.5) ∼Alabama 5.7 ( 4.7- 6.8) 6.2 ( 5.1- 7.6) 3.3 ( 1.8- 5.5) ∼Kentucky 4.5 ( 3.6- 5.5) 4.6 ( 3.7- 5.7) ∼ ∼Mississippi 6.1 ( 4.8- 7.7) 7.3 ( 5.6- 9.4) ∼ ∼Tennessee 6.7 ( 5.8- 7.8) 7.1 ( 6.1- 8.3) ∼ ∼
West South Central 5.4 ( 5.0- 5.8) 5.6 ( 5.2- 6.1) 4.3 ( 3.3- 5.5) 2.9 ( 2.2- 3.8)
Arkansas 5.7 ( 4.4- 7.1) 5.4 ( 4.1- 6.9) ∼ ∼

Cancer Incidence and M
ortality, by U.S. C
ensus Region and D
i�ision, State, and Metropolitan A
rea
��
Table 2.2.1.2M: Brain and Other Nervous System. Age-Adjusted Cancer Death Rates∗ and 95% ConfidenceIntervals, by U.S. Census Region and Division, State, and Race and Ethnicity, United States† (continued)
Males, 2004
Area All Races White Black Hispanic‡§
Louisiana 6.0 ( 5.0- 7.2) 5.8 ( 4.6- 7.3) 6.1 ( 4.1- 8.8) ∼Oklahoma 5.9 ( 4.8- 7.1) 6.2 ( 5.0- 7.7) ∼ ∼Texas 5.1 ( 4.7- 5.6) 5.5 ( 5.0- 6.1) 2.7 ( 1.7- 4.1) 3.0 ( 2.3- 3.9)
West 5.2 ( 4.9- 5.5) 5.6 ( 5.3- 5.9) 3.6 ( 2.6- 5.0) 3.4 ( 2.8- 4.1)
Mountain 4.8 ( 4.3- 5.3) 5.0 ( 4.5- 5.5) ∼ 2.5 ( 1.6- 3.6)
Arizona 4.3 ( 3.5- 5.1) 4.5 ( 3.7- 5.4) ∼ ∼Colorado 4.8 ( 3.8- 5.9) 5.1 ( 4.1- 6.2) ∼ ∼Idaho 5.8 ( 4.0- 7.9) 5.9 ( 4.1- 8.1) ∼ ∼Montana 5.5 ( 3.6- 8.0) 5.3 ( 3.5- 7.9) ∼ ∼Nevada 4.4 ( 3.2- 5.8) 4.8 ( 3.5- 6.4) ∼ ∼New Mexico 4.9 ( 3.5- 6.6) 4.8 ( 3.4- 6.6) ∼ ∼Utah 5.0 ( 3.6- 6.7) 5.1 ( 3.7- 6.9) ∼ ∼Wyoming 6.6 ( 3.7- 10.8) 6.8 ( 3.8- 11.1) ∼ ∼
Pacific 5.4 ( 5.1- 5.7) 5.9 ( 5.5- 6.3) 4.0 ( 2.8- 5.6) 3.8 ( 3.0- 4.6)
Alaska 6.4 ( 3.5- 10.7) 8.1 ( 4.5- 13.6) ∼ ∼California 5.1 ( 4.8- 5.5) 5.6 ( 5.2- 6.0) 4.2 ( 2.9- 5.9) 3.9 ( 3.2- 4.8)
Hawaii 4.1 ( 2.7- 6.0) ∼ ∼ ∼Oregon 6.4 ( 5.3- 7.7) 6.5 ( 5.3- 7.8) ∼ ∼Washington 6.2 ( 5.3- 7.2) 6.6 ( 5.6- 7.7) ∼ ∼
∗ Rates are per 100,000 persons and are age-adjusted to the 2000 U.S. standard population (19 age groups - Census P25-1130).† Data are from the National Vital Statistics System (NVSS).‡ Data for specified racial or ethnic populations other than white and black should be interpreted with caution. See Technical Notes.
§ Hispanic origin is not mutually exclusive from race categories (white, black).
∼ Rates are suppressed if fewer than 16 cases were reported in a specific category (area, race, ethnicity).
Note: U.S. rates are as presented in Table 1.1.1.2M.

United
States Cancer Statistics: 2004 Incid
ence and M
ortality
�0
continued
Table 2.2.1.2F: Brain and Other Nervous System. Age-Adjusted Cancer Death Rates∗ and 95% ConfidenceIntervals, by U.S. Census Region and Division, State, and Race and Ethnicity, United States†
Females, 2004
Area All Races White Black Hispanic‡§
United States 3.5 ( 3.4- 3.6) 3.8 ( 3.7- 3.9) 2.0 ( 1.8- 2.3) 2.3 ( 2.0- 2.6)
Northeast 3.3 ( 3.1- 3.5) 3.6 ( 3.3- 3.8) 1.5 ( 1.1- 2.0) 1.6 ( 1.1- 2.2)
New England 3.5 ( 3.1- 3.9) 3.6 ( 3.2- 4.1) ∼ ∼Connecticut 3.6 ( 2.9- 4.6) 3.8 ( 2.9- 4.8) ∼ ∼Maine 3.5 ( 2.4- 5.1) 3.6 ( 2.4- 5.2) ∼ ∼Massachusetts 3.3 ( 2.8- 4.0) 3.6 ( 3.0- 4.3) ∼ ∼New Hampshire 4.1 ( 2.8- 5.9) 4.2 ( 2.8- 6.0) ∼ ∼Rhode Island 3.2 ( 2.0- 5.0) 3.2 ( 1.9- 5.0) ∼ ∼Vermont ∼ ∼ ∼ ∼
Middle Atlantic 3.2 ( 3.0- 3.5) 3.5 ( 3.3- 3.8) 1.6 ( 1.2- 2.1) 1.7 ( 1.1- 2.4)
New Jersey 3.3 ( 2.8- 3.8) 3.6 ( 3.0- 4.3) ∼ ∼New York 3.0 ( 2.7- 3.4) 3.4 ( 3.0- 3.8) 1.7 ( 1.2- 2.5) 1.6 ( 0.9- 2.5)
Pennsylvania 3.4 ( 3.0- 3.9) 3.7 ( 3.2- 4.2) ∼ ∼Midwest 3.7 ( 3.5- 3.9) 3.9 ( 3.7- 4.1) 2.0 ( 1.5- 2.6) 2.5 ( 1.4- 3.9)
East North Central 3.6 ( 3.4- 3.8) 3.8 ( 3.6- 4.1) 1.9 ( 1.4- 2.5) ∼Illinois 3.4 ( 3.0- 3.9) 3.8 ( 3.3- 4.3) 2.0 ( 1.1- 3.1) ∼Indiana 3.9 ( 3.2- 4.6) 4.1 ( 3.4- 4.9) ∼ ∼Michigan 3.5 ( 3.1- 4.1) 3.7 ( 3.2- 4.3) 3.0 ( 1.8- 4.7) ∼Ohio 3.8 ( 3.4- 4.3) 4.2 ( 3.7- 4.7) ∼ ∼Wisconsin 3.2 ( 2.6- 3.9) 3.3 ( 2.7- 4.1) ∼ ∼
West North Central 3.9 ( 3.5- 4.3) 4.0 ( 3.6- 4.4) ∼ ∼Iowa 3.9 ( 3.1- 5.0) 4.0 ( 3.1- 5.1) ∼ ∼Kansas 4.5 ( 3.5- 5.7) 4.6 ( 3.5- 5.9) ∼ ∼Minnesota 3.6 ( 2.9- 4.4) 3.6 ( 2.9- 4.5) ∼ ∼Missouri 3.7 ( 3.1- 4.5) 3.8 ( 3.1- 4.6) ∼ ∼Nebraska 4.5 ( 3.2- 6.0) 4.6 ( 3.3- 6.2) ∼ ∼North Dakota ∼ ∼ ∼ ∼South Dakota 3.9 ( 2.3- 6.2) 4.1 ( 2.4- 6.6) ∼ ∼
South 3.5 ( 3.4- 3.7) 3.8 ( 3.6- 4.0) 2.2 ( 1.9- 2.5) 2.2 ( 1.8- 2.7)
South Atlantic 3.4 ( 3.2- 3.6) 3.7 ( 3.4- 3.9) 2.2 ( 1.8- 2.6) 2.5 ( 1.8- 3.3)
Delaware ∼ ∼ ∼ ∼District of Columbia ∼ ∼ ∼ ∼Florida 3.4 ( 3.0- 3.7) 3.5 ( 3.2- 4.0) 2.4 ( 1.6- 3.5) 2.7 ( 1.9- 3.6)
Georgia 3.0 ( 2.5- 3.5) 3.5 ( 2.8- 4.2) 1.6 ( 0.9- 2.5) ∼Maryland 3.7 ( 3.1- 4.5) 4.4 ( 3.5- 5.4) ∼ ∼North Carolina 3.3 ( 2.8- 3.9) 3.7 ( 3.1- 4.3) 1.8 ( 1.0- 2.9) ∼South Carolina 4.3 ( 3.5- 5.2) 4.3 ( 3.4- 5.5) 4.2 ( 2.7- 6.2) ∼Virginia 3.0 ( 2.5- 3.6) 3.2 ( 2.6- 3.9) ∼ ∼West Virginia 3.6 ( 2.6- 4.9) 3.7 ( 2.7- 5.1) ∼ ∼
East South Central 4.1 ( 3.7- 4.5) 4.5 ( 4.1- 5.0) 2.1 ( 1.5- 2.9) ∼Alabama 3.5 ( 2.8- 4.3) 4.2 ( 3.4- 5.2) ∼ ∼Kentucky 3.4 ( 2.6- 4.2) 3.2 ( 2.5- 4.0) ∼ ∼Mississippi 4.1 ( 3.1- 5.2) 4.8 ( 3.6- 6.4) ∼ ∼Tennessee 5.1 ( 4.4- 5.9) 5.6 ( 4.8- 6.5) ∼ ∼
West South Central 3.4 ( 3.2- 3.7) 3.6 ( 3.3- 4.0) 2.2 ( 1.6- 2.9) 2.0 ( 1.5- 2.7)
Arkansas 4.3 ( 3.4- 5.5) 4.7 ( 3.7- 6.1) ∼ ∼

Cancer Incidence and M
ortality, by U.S. C
ensus Region and D
i�ision, State, and Metropolitan A
rea
��
Table 2.2.1.2F: Brain and Other Nervous System. Age-Adjusted Cancer Death Rates∗ and 95% ConfidenceIntervals, by U.S. Census Region and Division, State, and Race and Ethnicity, United States† (continued)
Females, 2004
Area All Races White Black Hispanic‡§
Louisiana 3.1 ( 2.4- 3.9) 3.7 ( 2.8- 4.7) ∼ ∼Oklahoma 3.3 ( 2.6- 4.2) 3.5 ( 2.7- 4.5) ∼ ∼Texas 3.4 ( 3.0- 3.7) 3.5 ( 3.1- 3.9) 2.6 ( 1.7- 3.8) 2.0 ( 1.4- 2.6)
West 3.6 ( 3.4- 3.8) 4.0 ( 3.8- 4.2) 2.5 ( 1.7- 3.4) 2.7 ( 2.2- 3.2)
Mountain 3.7 ( 3.3- 4.1) 3.8 ( 3.4- 4.2) ∼ 3.3 ( 2.3- 4.6)
Arizona 3.6 ( 3.0- 4.4) 3.9 ( 3.2- 4.7) ∼ 4.2 ( 2.4- 6.7)
Colorado 3.7 ( 2.9- 4.6) 3.7 ( 2.9- 4.6) ∼ ∼Idaho 4.6 ( 3.2- 6.6) 4.8 ( 3.3- 6.7) ∼ ∼Montana 3.6 ( 2.1- 5.7) 3.8 ( 2.2- 6.0) ∼ ∼Nevada 3.8 ( 2.8- 5.1) 3.7 ( 2.6- 5.1) ∼ ∼New Mexico 3.3 ( 2.3- 4.7) 3.6 ( 2.5- 5.0) ∼ ∼Utah 3.6 ( 2.5- 5.0) 3.7 ( 2.6- 5.1) ∼ ∼Wyoming ∼ ∼ ∼ ∼
Pacific 3.6 ( 3.4- 3.9) 4.1 ( 3.8- 4.4) 2.4 ( 1.6- 3.4) 2.4 ( 2.0- 3.0)
Alaska ∼ ∼ ∼ ∼California 3.4 ( 3.1- 3.7) 3.8 ( 3.5- 4.1) 2.4 ( 1.6- 3.4) 2.5 ( 2.0- 3.1)
Hawaii ∼ ∼ ∼ ∼Oregon 4.3 ( 3.4- 5.3) 4.4 ( 3.5- 5.5) ∼ ∼Washington 5.0 ( 4.3- 5.8) 5.3 ( 4.5- 6.3) ∼ ∼
∗ Rates are per 100,000 persons and are age-adjusted to the 2000 U.S. standard population (19 age groups - Census P25-1130).† Data are from the National Vital Statistics System (NVSS).‡ Data for specified racial or ethnic populations other than white and black should be interpreted with caution. See Technical Notes.
§ Hispanic origin is not mutually exclusive from race categories (white, black).
∼ Rates are suppressed if fewer than 16 cases were reported in a specific category (area, race, ethnicity).
Note: U.S. rates are as presented in Table 1.1.1.2F.

United
States Cancer Statistics: 2004 Incid
ence and M
ortality
��
continued
Table 2.3.1.1: Breast. Age-Adjusted Invasive Cancer Incidence Rates∗ and 95% Confidence Intervals, by U.S.Census Region and Division, State and Metropolitan Area, and Race and Ethnicity, United States†‡
Females, 2004
Area All Races White Black Hispanic§
United States 117.7 (117.2- 118.2) 118.6 (118.0- 119.2) 110.3 (108.7- 112.0) 86.2 ( 84.6- 87.9)
Northeast 125.9 (124.7- 127.2) 128.2 (126.9- 129.6) 104.3 (100.8- 107.8) 92.9 ( 88.8- 97.2)
New England 130.6 (128.2- 133.1) 131.8 (129.2- 134.4) 106.8 ( 96.4- 117.9) 106.2 ( 94.0- 119.4)
Connecticut 129.9 (125.0- 135.0) 132.5 (127.3- 138.0) 113.5 ( 97.3- 131.7) 115.5 ( 95.1- 138.7)
Maine 123.0 (115.5- 130.8) 121.0 (113.6- 128.9) ∼ ∼Massachusetts 134.0 (130.2- 137.8) 136.1 (132.2- 140.1) 104.9 ( 90.5- 120.9) 103.0 ( 85.8- 122.4)
New Hampshire 127.9 (119.8- 136.4) 128.2 (120.0- 136.7) ∼ ∼Rhode Island 130.1 (121.3- 139.5) 128.4 (119.3- 138.0) 84.7 ( 52.1- 129.3) 96.6 ( 63.2- 140.3)
Vermont 127.6 (116.3- 139.7) 128.0 (116.6- 140.3) ∼ ∼Middle Atlantic 124.3 (122.9- 125.7) 126.8 (125.3- 128.4) 103.9 (100.3- 107.7) 91.2 ( 86.8- 95.7)
New Jersey 129.5 (126.3- 132.7) 135.8 (132.2- 139.4) 102.7 ( 94.7- 111.1) 97.7 ( 88.8- 107.3)
New York 122.8 (120.8- 124.9) 125.6 (123.2- 128.0) 99.4 ( 94.7- 104.2) 89.8 ( 84.6- 95.3)
Pennsylvania 123.1 (120.6- 125.6) 123.1 (120.5- 125.8) 118.1 (109.8- 126.7) -
Midwest 117.7 (116.6- 118.8) 116.9 (115.7- 118.1) 111.6 (107.9- 115.4) 80.4 ( 74.5- 86.7)
East North Central 116.7 (115.4- 118.1) 115.8 (114.4- 117.3) 110.8 (106.8- 114.9) 84.3 ( 77.6- 91.5)
Illinois 117.9 (115.3- 120.5) 118.9 (116.1- 121.8) 108.2 (101.6- 115.1) 78.8 ( 70.3- 87.9)
Indiana 108.1 (104.6- 111.7) 109.1 (105.5- 112.9) 92.2 ( 80.5- 105.1) 99.2 ( 74.8- 128.5)
Michigan 119.0 (116.2- 121.9) 118.5 (115.4- 121.6) 118.1 (110.0- 126.6) 82.1 ( 64.9- 102.3)
Detroit 126.0 (121.4- 130.7) 128.9 (123.5- 134.5) 120.2 (110.9- 130.1) 124.5 ( 91.6- 164.7)
Ohio 118.9 (116.2- 121.5) 114.7 (112.0- 117.5) 115.7 (107.7- 124.2) 98.3 ( 76.8- 123.7)
Wisconsin 114.9 (111.2- 118.8) 115.0 (111.1- 119.0) 103.4 ( 85.1- 124.3) 103.1 ( 76.2- 135.8)
West North Central 119.8 (117.8- 121.9) 119.2 (117.1- 121.4) 115.9 (106.4- 125.9) 64.3 ( 52.4- 77.8)
Iowa 119.5 (114.4- 124.8) 120.1 (114.9- 125.5) 96.7 ( 59.4- 147.1) ∼Kansas 119.1 (113.6- 124.8) 117.3 (111.6- 123.2) 123.5 ( 98.1- 153.1) ∼Minnesota 123.7 (119.6- 128.0) 121.6 (117.4- 125.9) 96.2 ( 70.6- 127.5) 73.8 ( 43.5- 115.0)
Missouri 117.5 (113.9- 121.3) 117.5 (113.6- 121.6) 117.7 (105.9- 130.4) 131.9 ( 97.6- 173.5)
Nebraska 123.7 (116.7- 131.0) 123.9 (116.7- 131.4) 122.1 ( 83.8- 170.9) 77.3 ( 48.3- 117.8)
North Dakota 121.2 (110.1- 133.2) 120.1 (108.9- 132.3) ∼ ∼South Dakota 109.4 ( 99.7- 119.9) 111.2 (101.1- 122.2) ∼ ∼
South 113.2 (112.3- 114.1) 113.2 (112.3- 114.2) 111.8 (109.6- 114.1) 85.8 ( 83.1- 88.6)
South Atlantic 114.7 (113.4- 115.9) 115.2 (113.8- 116.6) 110.9 (107.9- 113.9) 94.0 ( 89.6- 98.4)
Delaware 115.7 (106.2- 125.9) 112.1 (101.8- 123.3) 123.7 (100.2- 150.9) ∼District of Columbia 129.4 (116.8- 143.0) 127.0 (104.5- 153.1) 124.1 (109.0- 140.7) 122.4 ( 68.8- 198.1)
Florida 109.2 (107.2- 111.3) 111.1 (108.9- 113.3) 95.2 ( 89.6- 101.1) -
Georgia 121.5 (118.2- 124.8) 123.3 (119.5- 127.3) 116.8 (110.4- 123.4) 100.2 ( 80.6- 122.8)
Atlanta 126.3 (120.4- 132.3) 131.0 (123.6- 138.7) 121.7 (111.2- 132.8) 84.9 ( 59.4- 116.9)
Maryland
North Carolina 115.8 (112.8- 119.0) 116.4 (112.9- 120.0) 114.8 (107.9- 122.0) 85.8 ( 65.4- 110.2)
South Carolina 112.5 (108.2- 116.9) 113.6 (108.6- 118.7) 105.2 ( 97.2- 113.7) -
Virginia 121.1 (117.8- 124.6) 120.6 (116.8- 124.5) 123.4 (115.3- 131.8) 90.5 ( 71.9- 112.1)
West Virginia 114.2 (108.0- 120.6) 114.7 (108.4- 121.3) 92.7 ( 61.7- 133.9) ∼East South Central 110.7 (108.7- 112.8) 110.7 (108.4- 113.0) 107.9 (103.0- 113.0) 74.7 ( 57.2- 95.4)
Alabama 109.1 (105.1- 113.2) 109.8 (105.2- 114.5) 103.9 ( 95.8- 112.5) 85.9 ( 50.6- 134.2)
Kentucky 116.5 (112.1- 120.9) 115.2 (110.7- 119.8) 118.8 (101.5- 138.1) -
Mississippi 108.5 (103.4- 113.8) 107.4 (101.2- 113.8) 109.7 (100.4- 119.5) ∼Tennessee 109.3 (105.8- 112.9) 109.2 (105.4- 113.1) 108.5 ( 99.0- 118.5) 98.5 ( 67.1- 138.6)

Cancer Incidence and M
ortality, by U.S. C
ensus Region and D
i�ision, State, and Metropolitan A
rea
�3
Table 2.3.1.1: Breast. Age-Adjusted Invasive Cancer Incidence Rates∗ and 95% Confidence Intervals, by U.S.Census Region and Division, State and Metropolitan Area, and Race and Ethnicity, United States†‡(continued)
Females, 2004
Area All Races White Black Hispanic§
West South Central 112.5 (110.9- 114.1) 111.8 (110.0- 113.5) 117.3 (112.6- 122.0) 79.5 ( 76.1- 83.0)
Arkansas 106.1 (101.1- 111.4) 104.2 ( 98.8- 109.9) 105.5 ( 91.5- 120.9) ∼Louisiana 120.0 (115.7- 124.5) 117.9 (112.8- 123.2) 126.1 (117.7- 134.9) 69.5 ( 48.8- 95.7)
Oklahoma 125.0 (120.1- 130.0) 125.9 (120.6- 131.4) 126.2 (106.5- 148.3) 120.2 ( 87.0- 160.7)
Texas 109.5 (107.5- 111.5) 109.1 (107.0- 111.3) 113.5 (107.3- 120.0) 79.4 ( 75.9- 83.0)
West 117.4 (116.2- 118.5) 120.0 (118.7- 121.3) 112.7 (107.3- 118.2) 84.7 ( 82.2- 87.3)
Mountain 109.2 (107.2- 111.3) 110.8 (108.7- 113.0) 82.2 ( 71.2- 94.3) 87.6 ( 82.4- 93.0)
Arizona 102.9 ( 99.3- 106.6) 104.1 (100.3- 108.0) 80.3 ( 61.1- 103.3) 78.7 ( 70.4- 87.7)
Colorado 118.1 (113.7- 122.7) 118.8 (114.1- 123.5) 80.4 ( 60.6- 104.4) 101.7 ( 89.1- 115.3)
Idaho 105.1 ( 97.6- 112.9) 106.1 ( 98.5- 114.1) ∼ 71.6 ( 37.8- 120.6)
Montana 111.5 (102.7- 120.9) 111.6 (102.6- 121.2) ∼ ∼Nevada 106.4 (100.6- 112.6) 108.4 (102.0- 115.1) 97.2 ( 75.9- 122.4) 68.7 ( 55.2- 84.4)
New Mexico 108.2 (101.9- 114.8) 114.1 (107.2- 121.2) ∼ 92.7 ( 82.8- 103.4)
Utah 113.7 (107.0- 120.6) 115.5 (108.7- 122.7) ∼ 103.9 ( 77.7- 135.7)
Wyoming 113.3 (101.1- 126.6) 108.2 ( 96.1- 121.4) ∼ ∼Pacific 120.7 (119.3- 122.1) 124.4 (122.8- 126.0) 118.6 (112.6- 124.8) 83.8 ( 80.9- 86.8)
Alaska 113.1 (100.2- 127.2) 108.9 ( 94.3- 125.2) ∼ ∼California 117.9 (116.3- 119.5) 122.5 (120.7- 124.4) 118.7 (112.4- 125.2) 83.5 ( 80.5- 86.6)
San Francisco-Oakland 122.3 (117.9- 126.9) 130.5 (124.8- 136.3) 127.4 (112.8- 143.4) 79.4 ( 68.9- 91.0)
San Jose-Monterey 112.3 (106.4- 118.6) 123.2 (116.0- 130.8) 60.2 ( 36.0- 95.3) 78.9 ( 66.8- 92.3)
Los Angeles 113.0 (110.0- 116.0) 116.4 (112.8- 120.0) 120.2 (110.9- 130.1) 78.3 ( 73.7- 83.1)
Hawaii 119.9 (111.9- 128.3) 145.7 (128.0- 165.3) ∼ 111.8 ( 75.4- 159.1)
Oregon 131.5 (126.5- 136.7) 130.2 (125.1- 135.5) 89.3 ( 55.8- 134.5) 88.0 ( 65.8- 115.0)
Washington 130.7 (126.8- 134.7) 129.5 (125.4- 133.7) 128.3 (103.6- 156.9) 88.3 ( 69.6- 110.0)
Seattle-Puget Sound 135.8 (131.0- 140.7) 139.3 (134.1- 144.7) 132.7 (106.5- 163.1) 107.9 ( 78.0- 144.3)
∗ Rates are per 100,000 persons and are age-adjusted to the 2000 U.S. standard population (19 age groups - Census P25-1130).† Data are from all state and metropolitan area cancer registries, except Maryland. Included data cover approximately 98% of the population and met data
quality criteria for all invasive cancer sites combined. See Appendix B for registry-specific data quality information.‡ Invasive cancers only.
§ Data for specified racial or ethnic populations other than white and black should be interpreted with caution. See Technical Notes.
Hispanic origin is not mutually exclusive from race categories (white, black).
∼ Rates are suppressed if fewer than 16 cases were reported in a specific category (area, race, ethnicity).
- Rates are suppressed at the state’s or metropolitan area’s request. See Technical Notes.
Notes: Cases from suppressed rates are included in the U.S. and region/division rates. U.S. rates are as presented in Table 1.1.1.1F. Michigan, Georgia,
California, and Washington state rates each include cases from the SEER metropolitan areas.

United
States Cancer Statistics: 2004 Incid
ence and M
ortality
��
continued
Table 2.3.1.2: Breast. Age-Adjusted Cancer Death Rates∗ and 95% Confidence Intervals, by U.S. CensusRegion and Division, State, and Race and Ethnicity, United States†
Females, 2004
Area All Races White Black Hispanic‡§
United States 24.4 ( 24.1- 24.6) 23.8 ( 23.6- 24.1) 32.3 ( 31.4- 33.1) 15.7 ( 15.0- 16.4)
Northeast 25.1 ( 24.6- 25.7) 25.1 ( 24.6- 25.7) 28.5 ( 26.7- 30.4) 15.1 ( 13.5- 17.0)
New England 23.7 ( 22.7- 24.8) 24.1 ( 23.1- 25.2) 18.8 ( 14.6- 23.7) 11.5 ( 7.5- 16.6)
Connecticut 24.7 ( 22.7- 26.9) 25.0 ( 22.8- 27.3) 20.6 ( 14.0- 29.1) ∼Maine 21.2 ( 18.2- 24.5) 21.3 ( 18.3- 24.7) ∼ ∼Massachusetts 24.1 ( 22.6- 25.7) 24.9 ( 23.3- 26.6) 17.0 ( 11.6- 24.0) ∼New Hampshire 23.5 ( 20.2- 27.3) 23.8 ( 20.4- 27.6) ∼ ∼Rhode Island 21.6 ( 18.2- 25.5) 21.5 ( 18.0- 25.5) ∼ ∼Vermont 24.2 ( 19.5- 29.7) 24.4 ( 19.7- 30.0) ∼ ∼
Middle Atlantic 25.6 ( 25.0- 26.3) 25.5 ( 24.8- 26.2) 29.6 ( 27.7- 31.6) 15.7 ( 13.8- 17.7)
New Jersey 25.9 ( 24.5- 27.3) 25.6 ( 24.1- 27.1) 33.1 ( 28.6- 38.1) 12.2 ( 9.1- 16.0)
New York 24.3 ( 23.5- 25.3) 24.3 ( 23.4- 25.4) 27.7 ( 25.2- 30.3) 16.9 ( 14.6- 19.5)
Pennsylvania 27.3 ( 26.2- 28.5) 27.0 ( 25.8- 28.2) 31.7 ( 27.5- 36.3) 15.7 ( 9.4- 24.3)
Midwest 24.6 ( 24.1- 25.1) 23.7 ( 23.2- 24.2) 35.2 ( 33.1- 37.4) 11.3 ( 8.9- 14.0)
East North Central 25.1 ( 24.5- 25.8) 24.0 ( 23.4- 24.7) 35.5 ( 33.2- 37.9) 12.0 ( 9.3- 15.2)
Illinois 25.4 ( 24.2- 26.6) 23.4 ( 22.2- 24.7) 39.1 ( 35.1- 43.4) 10.4 ( 7.3- 14.3)
Indiana 24.0 ( 22.4- 25.7) 23.8 ( 22.2- 25.5) 28.3 ( 21.9- 35.9) ∼Michigan 24.3 ( 23.0- 25.6) 23.0 ( 21.7- 24.4) 33.5 ( 29.2- 38.2) 18.3 ( 10.1- 30.0)
Ohio 27.0 ( 25.8- 28.3) 25.9 ( 24.6- 27.2) 37.4 ( 32.9- 42.4) ∼Wisconsin 23.4 ( 21.8- 25.2) 23.5 ( 21.8- 25.3) 22.8 ( 14.4- 33.9) ∼
West North Central 23.3 ( 22.5- 24.2) 23.0 ( 22.1- 23.9) 33.6 ( 28.6- 39.3) ∼Iowa 22.2 ( 20.1- 24.5) 22.2 ( 20.1- 24.5) ∼ ∼Kansas 22.4 ( 20.2- 24.9) 22.0 ( 19.6- 24.5) 36.7 ( 23.4- 54.5) ∼Minnesota 22.4 ( 20.7- 24.2) 22.3 ( 20.6- 24.2) 39.1 ( 23.0- 61.4) ∼Missouri 25.5 ( 23.8- 27.2) 24.9 ( 23.2- 26.7) 31.0 ( 25.1- 37.8) ∼Nebraska 23.4 ( 20.5- 26.6) 22.7 ( 19.8- 25.9) ∼ ∼North Dakota 21.7 ( 17.3- 27.0) 22.4 ( 17.8- 27.8) ∼ ∼South Dakota 22.0 ( 17.9- 26.8) 21.8 ( 17.6- 26.7) ∼ ∼
South 24.6 ( 24.2- 25.0) 23.2 ( 22.8- 23.6) 32.7 ( 31.6- 33.9) 16.6 ( 15.5- 17.9)
South Atlantic 24.8 ( 24.3- 25.3) 23.5 ( 22.9- 24.1) 31.3 ( 29.8- 32.8) 16.6 ( 14.8- 18.5)
Delaware 26.2 ( 21.9- 31.2) 25.9 ( 21.2- 31.4) 28.8 ( 17.6- 44.0) ∼District of Columbia 27.6 ( 22.1- 34.0) 25.0 ( 16.2- 37.2) 30.0 ( 23.0- 38.6) ∼Florida 23.5 ( 22.6- 24.4) 22.9 ( 22.0- 23.9) 29.4 ( 26.3- 32.8) 17.6 ( 15.6- 19.9)
Georgia 26.0 ( 24.5- 27.5) 24.9 ( 23.2- 26.7) 29.8 ( 26.6- 33.3) ∼Maryland 26.9 ( 25.1- 28.8) 25.3 ( 23.3- 27.5) 32.9 ( 28.9- 37.3) ∼North Carolina 25.6 ( 24.2- 27.1) 23.6 ( 22.1- 25.2) 33.9 ( 30.2- 38.0) ∼South Carolina 23.1 ( 21.2- 25.1) 20.4 ( 18.4- 22.6) 30.4 ( 26.2- 35.2) ∼Virginia 25.4 ( 23.9- 27.0) 23.9 ( 22.2- 25.6) 33.9 ( 29.8- 38.5) 20.1 ( 11.7- 31.8)
West Virginia 24.7 ( 22.0- 27.7) 24.6 ( 21.8- 27.6) ∼ ∼East South Central 25.2 ( 24.3- 26.2) 23.7 ( 22.7- 24.8) 33.0 ( 30.3- 35.9) ∼Alabama 24.1 ( 22.3- 26.1) 23.1 ( 21.1- 25.3) 27.4 ( 23.3- 32.0) ∼Kentucky 24.3 ( 22.4- 26.4) 23.7 ( 21.7- 25.8) 36.0 ( 26.8- 47.2) ∼Mississippi 27.3 ( 24.8- 30.0) 23.9 ( 21.1- 26.9) 35.4 ( 30.3- 41.2) ∼Tennessee 25.7 ( 24.1- 27.5) 24.0 ( 22.3- 25.8) 37.1 ( 31.6- 43.3) ∼
West South Central 23.9 ( 23.2- 24.7) 22.4 ( 21.6- 23.2) 36.2 ( 33.6- 38.9) 16.9 ( 15.3- 18.7)
Arkansas 24.9 ( 22.5- 27.4) 23.6 ( 21.1- 26.2) 31.5 ( 24.2- 40.3) ∼

Cancer Incidence and M
ortality, by U.S. C
ensus Region and D
i�ision, State, and Metropolitan A
rea
��
Table 2.3.1.2: Breast. Age-Adjusted Cancer Death Rates∗ and 95% Confidence Intervals, by U.S. CensusRegion and Division, State, and Race and Ethnicity, United States† (continued)
Females, 2004
Area All Races White Black Hispanic‡§
Louisiana 27.6 ( 25.6- 29.8) 22.7 ( 20.6- 25.1) 39.3 ( 34.7- 44.4) ∼Oklahoma 22.5 ( 20.5- 24.7) 21.8 ( 19.6- 24.1) 36.2 ( 25.6- 49.4) ∼Texas 23.2 ( 22.3- 24.1) 22.2 ( 21.3- 23.2) 35.3 ( 31.8- 39.0) 17.2 ( 15.5- 19.0)
West 22.9 ( 22.4- 23.5) 23.6 ( 23.0- 24.1) 31.5 ( 28.7- 34.6) 15.8 ( 14.6- 17.0)
Mountain 22.9 ( 22.0- 23.9) 23.2 ( 22.3- 24.2) 21.7 ( 16.0- 28.5) 17.4 ( 15.0- 20.0)
Arizona 21.9 ( 20.3- 23.6) 22.0 ( 20.3- 23.8) 27.4 ( 16.5- 42.5) 15.6 ( 11.9- 20.0)
Colorado 22.8 ( 20.8- 24.9) 23.1 ( 21.1- 25.3) ∼ 15.9 ( 11.1- 21.9)
Idaho 21.9 ( 18.6- 25.6) 21.8 ( 18.5- 25.5) ∼ ∼Montana 24.3 ( 20.4- 28.9) 24.2 ( 20.1- 28.8) ∼ ∼Nevada 25.8 ( 22.9- 29.0) 26.8 ( 23.6- 30.2) 24.5 ( 14.0- 39.4) ∼New Mexico 23.5 ( 20.7- 26.7) 24.8 ( 21.7- 28.2) ∼ 21.2 ( 16.6- 26.8)
Utah 22.7 ( 19.8- 25.9) 22.7 ( 19.8- 26.0) ∼ ∼Wyoming 24.5 ( 19.1- 31.1) 24.7 ( 19.2- 31.4) ∼ ∼
Pacific 23.0 ( 22.4- 23.6) 23.8 ( 23.1- 24.5) 33.5 ( 30.3- 36.9) 15.2 ( 13.9- 16.6)
Alaska 18.7 ( 13.3- 25.4) 16.3 ( 10.5- 23.9) ∼ ∼California 23.2 ( 22.5- 23.9) 23.7 ( 22.9- 24.5) 34.7 ( 31.3- 38.4) 15.4 ( 14.1- 16.8)
Hawaii 15.6 ( 12.9- 18.8) 21.7 ( 15.3- 30.1) ∼ ∼Oregon 24.1 ( 22.1- 26.4) 24.7 ( 22.6- 27.1) ∼ ∼Washington 23.3 ( 21.7- 25.0) 24.2 ( 22.4- 26.0) 21.0 ( 11.9- 34.1) ∼
∗ Rates are per 100,000 persons and are age-adjusted to the 2000 U.S. standard population (19 age groups - Census P25-1130).† Data are from the National Vital Statistics System (NVSS).‡ Data for specified racial or ethnic populations other than white and black should be interpreted with caution. See Technical Notes.
§ Hispanic origin is not mutually exclusive from race categories (white, black).
∼ Rates are suppressed if fewer than 16 cases were reported in a specific category (area, race, ethnicity).
Note: U.S. rates are as presented in Table 1.1.1.2F.

United
States Cancer Statistics: 2004 Incid
ence and M
ortality
��
continued
Table 2.4.1.1: Breast, In Situ . Age-Adjusted Cancer Incidence Rates∗ and 95% Confidence Intervals, by U.S.Census Region and Division, State and Metropolitan Area, and Race and Ethnicity, United States†‡
Females, 2004
Area All Races White Black Hispanic§
United States 28.6 ( 28.4- 28.9) 28.7 ( 28.4- 29.0) 25.8 ( 25.1- 26.6) 18.8 ( 18.1- 19.6)
Northeast 35.5 ( 34.9- 36.2) 36.0 ( 35.3- 36.7) 27.6 ( 25.9- 29.4) 24.7 ( 22.6- 26.8)
New England 40.2 ( 38.8- 41.6) 40.7 ( 39.3- 42.2) 30.9 ( 25.4- 37.2) 31.8 ( 25.7- 38.8)
Connecticut 40.4 ( 37.7- 43.3) 40.8 ( 37.9- 43.9) 34.9 ( 26.0- 45.7) 35.9 ( 25.6- 48.8)
Maine 30.9 ( 27.2- 35.1) 31.0 ( 27.3- 35.1) ∼ ∼Massachusetts 44.8 ( 42.6- 47.0) 46.1 ( 43.8- 48.5) 30.0 ( 22.5- 39.2) 31.5 ( 23.0- 42.1)
New Hampshire 35.2 ( 31.0- 39.7) 35.5 ( 31.3- 40.1) ∼ ∼Rhode Island 37.8 ( 33.1- 43.1) 37.3 ( 32.4- 42.7) ∼ ∼Vermont 28.5 ( 23.3- 34.5) 28.9 ( 23.7- 35.1) ∼ ∼
Middle Atlantic 33.9 ( 33.1- 34.6) 34.1 ( 33.2- 34.9) 27.3 ( 25.4- 29.2) 23.5 ( 21.3- 25.8)
New Jersey 36.0 ( 34.3- 37.7) 38.1 ( 36.1- 40.0) 26.4 ( 22.5- 30.8) 23.7 ( 19.4- 28.6)
New York 34.6 ( 33.5- 35.7) 34.5 ( 33.3- 35.8) 25.8 ( 23.5- 28.3) 24.3 ( 21.6- 27.2)
Pennsylvania 31.2 ( 29.9- 32.5) 31.0 ( 29.6- 32.4) 32.2 ( 28.0- 36.8) -
Midwest 28.4 ( 27.9- 29.0) 28.0 ( 27.5- 28.6) 28.2 ( 26.3- 30.1) 20.4 ( 17.4- 23.6)
East North Central 29.1 ( 28.5- 29.8) 28.7 ( 28.0- 29.4) 29.0 ( 26.9- 31.1) 20.5 ( 17.3- 24.2)
Illinois 30.4 ( 29.1- 31.7) 30.5 ( 29.1- 32.0) 28.8 ( 25.5- 32.5) 20.1 ( 15.9- 24.9)
Indiana 25.4 ( 23.7- 27.1) 24.8 ( 23.1- 26.6) 28.7 ( 22.3- 36.2) ∼Michigan 30.4 ( 29.0- 31.9) 30.5 ( 29.0- 32.2) 28.7 ( 24.8- 33.0) 20.7 ( 12.8- 31.5)
Detroit 33.2 ( 30.8- 35.7) 35.0 ( 32.2- 38.0) 29.0 ( 24.5- 34.1) ∼Ohio 28.2 ( 26.9- 29.5) 27.2 ( 25.9- 28.6) 27.1 ( 23.3- 31.4) 24.8 ( 14.9- 38.6)
Wisconsin 30.0 ( 28.1- 32.1) 29.3 ( 27.4- 31.4) 39.9 ( 29.6- 52.5) 37.4 ( 20.3- 61.5)
West North Central 26.9 ( 25.9- 27.8) 26.6 ( 25.6- 27.6) 23.7 ( 19.6- 28.5) 19.9 ( 13.3- 28.4)
Iowa 27.4 ( 25.0- 30.0) 27.2 ( 24.7- 29.8) ∼ ∼Kansas 28.4 ( 25.7- 31.2) 28.0 ( 25.3- 31.0) ∼ ∼Minnesota 29.0 ( 27.0- 31.1) 28.0 ( 26.0- 30.1) 31.9 ( 18.1- 51.5) ∼Missouri 24.8 ( 23.1- 26.6) 24.8 ( 23.0- 26.7) 25.0 ( 19.8- 31.2) ∼Nebraska 27.3 ( 24.1- 30.9) 27.8 ( 24.5- 31.5) ∼ ∼North Dakota 23.9 ( 19.0- 29.6) 23.4 ( 18.5- 29.2) ∼ ∼South Dakota 22.8 ( 18.5- 27.8) 22.4 ( 18.0- 27.6) ∼ ∼
South 25.7 ( 25.3- 26.1) 25.7 ( 25.2- 26.2) 24.5 ( 23.4- 25.5) 17.4 ( 16.2- 18.6)
South Atlantic 27.7 ( 27.1- 28.3) 28.1 ( 27.4- 28.8) 25.2 ( 23.8- 26.7) 22.3 ( 20.2- 24.5)
Delaware 36.0 ( 30.8- 41.8) 37.0 ( 31.1- 43.7) 24.1 ( 14.6- 37.4) ∼District of Columbia 36.8 ( 30.2- 44.5) 40.2 ( 28.2- 55.8) 32.3 ( 24.7- 41.4) ∼Florida 27.0 ( 26.0- 28.0) 27.6 ( 26.5- 28.7) 22.1 ( 19.5- 25.0) -
Georgia 29.0 ( 27.4- 30.6) 29.6 ( 27.7- 31.6) 27.5 ( 24.5- 30.9) 20.9 ( 12.3- 32.6)
Atlanta 33.7 ( 30.7- 36.9) 34.8 ( 31.0- 38.9) 32.8 ( 27.5- 38.8) ∼Maryland
North Carolina 26.0 ( 24.5- 27.5) 26.6 ( 24.9- 28.3) 23.4 ( 20.3- 26.8) ∼South Carolina 25.0 ( 23.1- 27.1) 26.2 ( 23.8- 28.7) 22.1 ( 18.5- 26.2) -
Virginia 30.1 ( 28.5- 31.9) 29.5 ( 27.7- 31.5) 30.7 ( 26.7- 35.0) 19.3 ( 12.2- 29.0)
West Virginia 25.4 ( 22.6- 28.6) 25.6 ( 22.6- 28.8) ∼ ∼East South Central 23.2 ( 22.3- 24.2) 23.2 ( 22.1- 24.2) 23.4 ( 21.1- 25.8) ∼Alabama 25.6 ( 23.7- 27.6) 25.4 ( 23.3- 27.8) 27.0 ( 23.0- 31.6) ∼Kentucky 23.4 ( 21.4- 25.4) 22.9 ( 20.9- 25.0) 26.7 ( 18.9- 36.7) -
Mississippi 21.4 ( 19.1- 23.8) 20.8 ( 18.1- 23.7) 22.5 ( 18.5- 27.2) ∼Tennessee 22.1 ( 20.6- 23.8) 22.7 ( 21.0- 24.5) 18.3 ( 14.5- 22.7) ∼

Cancer Incidence and M
ortality, by U.S. C
ensus Region and D
i�ision, State, and Metropolitan A
rea
��
Table 2.4.1.1: Breast, In Situ . Age-Adjusted Cancer Incidence Rates∗ and 95% Confidence Intervals, by U.S.Census Region and Division, State and Metropolitan Area, and Race and Ethnicity, United States†‡ (continued)
Females, 2004
Area All Races White Black Hispanic§
West South Central 23.8 ( 23.1- 24.6) 23.4 ( 22.6- 24.3) 23.6 ( 21.6- 25.8) 14.0 ( 12.6- 15.5)
Arkansas 21.1 ( 18.9- 23.5) 20.7 ( 18.3- 23.3) 20.8 ( 14.9- 28.3) ∼Louisiana 23.7 ( 21.8- 25.7) 24.8 ( 22.5- 27.3) 21.9 ( 18.5- 25.8) ∼Oklahoma 27.1 ( 24.8- 29.5) 27.3 ( 24.8- 29.9) 21.3 ( 13.9- 31.2) ∼Texas 23.6 ( 22.7- 24.6) 22.8 ( 21.9- 23.8) 25.3 ( 22.4- 28.5) 14.1 ( 12.7- 15.7)
West 27.2 ( 26.7- 27.8) 27.4 ( 26.7- 28.0) 24.6 ( 22.1- 27.2) 17.4 ( 16.3- 18.6)
Mountain 25.1 ( 24.1- 26.1) 25.3 ( 24.3- 26.4) 17.0 ( 12.1- 23.2) 16.9 ( 14.7- 19.3)
Arizona 21.1 ( 19.5- 22.8) 21.6 ( 19.9- 23.5) ∼ 14.9 ( 11.5- 18.9)
Colorado 32.2 ( 29.9- 34.7) 31.1 ( 28.7- 33.5) ∼ 21.3 ( 16.1- 27.6)
Idaho 26.4 ( 22.8- 30.5) 26.8 ( 23.1- 31.0) ∼ ∼Montana 30.9 ( 26.3- 36.0) 30.3 ( 25.7- 35.6) ∼ ∼Nevada 20.1 ( 17.6- 22.8) 20.7 ( 18.0- 23.7) ∼ 13.5 ( 7.9- 21.4)
New Mexico 24.1 ( 21.2- 27.3) 25.9 ( 22.7- 29.5) ∼ 19.5 ( 15.2- 24.6)
Utah 23.4 ( 20.4- 26.6) 23.7 ( 20.7- 27.1) ∼ ∼Wyoming 25.5 ( 20.0- 32.2) 24.5 ( 19.0- 31.2) ∼ ∼
Pacific 28.1 ( 27.4- 28.8) 28.3 ( 27.6- 29.1) 26.1 ( 23.3- 29.1) 17.6 ( 16.3- 19.0)
Alaska 35.3 ( 28.3- 43.5) 37.3 ( 29.1- 47.1) ∼ ∼California 26.7 ( 26.0- 27.5) 27.2 ( 26.3- 28.1) 26.4 ( 23.4- 29.5) 17.5 ( 16.2- 19.0)
San Francisco-Oakland 30.5 ( 28.3- 32.8) 31.6 ( 28.8- 34.5) 27.7 ( 21.1- 35.7) 18.1 ( 13.2- 24.0)
San Jose-Monterey 29.5 ( 26.5- 32.8) 29.0 ( 25.5- 32.8) ∼ 16.3 ( 11.2- 22.8)
Los Angeles 23.6 ( 22.2- 25.0) 24.0 ( 22.4- 25.7) 27.9 ( 23.5- 32.9) 14.8 ( 12.9- 17.0)
Hawaii 34.2 ( 30.0- 38.8) 33.5 ( 25.3- 43.7) ∼ ∼Oregon 27.8 ( 25.5- 30.3) 27.4 ( 25.0- 29.9) ∼ ∼Washington 33.8 ( 31.9- 35.9) 33.4 ( 31.3- 35.5) 23.4 ( 13.3- 37.6) 16.5 ( 9.5- 26.5)
Seattle-Puget Sound 37.6 ( 35.1- 40.2) 38.5 ( 35.7- 41.3) 26.3 ( 14.9- 42.2) 29.0 ( 15.9- 48.0)
∗ Rates are per 100,000 persons and are age-adjusted to the 2000 U.S. standard population (19 age groups - Census P25-1130).† Data are from all state and metropolitan area cancer registries, except Maryland. Included data cover approximately 98% of the population and met data
quality criteria for all invasive cancer sites combined. See Appendix B for registry-specific data quality information.‡ In situ cancers only.
§ Data for specified racial or ethnic populations other than white and black should be interpreted with caution. See Technical Notes.
Hispanic origin is not mutually exclusive from race categories (white, black).
∼ Rates are suppressed if fewer than 16 cases were reported in a specific category (area, race, ethnicity).
- Rates are suppressed at the state’s or metropolitan area’s request. See Technical Notes.
Notes: Cases from suppressed rates are included in the U.S. and region/division rates. U.S. rates are as presented in Table 1.1.1.1F. Michigan, Georgia,
California, and Washington state rates each include cases from the SEER metropolitan areas.

United
States Cancer Statistics: 2004 Incid
ence and M
ortality
��
continued
Table 2.5.1.1: Cervix Uteri. Age-Adjusted Invasive Cancer Incidence Rates∗ and 95% Confidence Intervals,by U.S. Census Region and Division, State and Metropolitan Area, and Race and Ethnicity, United States†‡
Females, 2004
Area All Races White Black Hispanic§
United States 7.9 ( 7.8- 8.1) 7.5 ( 7.3- 7.7) 10.8 ( 10.3- 11.3) 12.2 ( 11.6- 12.8)
Northeast 8.0 ( 7.6- 8.3) 7.3 ( 7.0- 7.6) 12.2 ( 11.0- 13.4) 12.5 ( 11.1- 14.1)
New England 7.4 ( 6.8- 8.0) 7.0 ( 6.4- 7.7) 12.1 ( 8.8- 16.1) 11.7 ( 8.2- 16.3)
Connecticut 7.2 ( 6.1- 8.6) 6.9 ( 5.6- 8.3) 12.7 ( 7.8- 19.5) 12.4 ( 7.0- 20.4)
Maine 9.1 ( 7.0- 11.7) 8.9 ( 6.8- 11.4) ∼ ∼Massachusetts 7.1 ( 6.2- 8.0) 6.8 ( 6.0- 7.8) 10.8 ( 6.6- 16.5) 10.1 ( 5.4- 17.0)
New Hampshire 4.9 ( 3.4- 6.9) 5.1 ( 3.5- 7.1) ∼ ∼Rhode Island 10.8 ( 8.3- 13.9) 9.1 ( 6.7- 12.1) ∼ ∼Vermont 6.8 ( 4.3- 10.3) 7.0 ( 4.4- 10.5) ∼ ∼
Middle Atlantic 8.2 ( 7.8- 8.6) 7.4 ( 7.0- 7.8) 12.2 ( 11.0- 13.5) 12.6 ( 11.1- 14.3)
New Jersey 9.3 ( 8.5- 10.2) 8.9 ( 8.0- 9.9) 14.1 ( 11.4- 17.4) 16.3 ( 12.9- 20.4)
New York 8.0 ( 7.5- 8.6) 6.9 ( 6.3- 7.5) 11.8 ( 10.3- 13.5) 10.9 ( 9.2- 12.9)
Pennsylvania 7.7 ( 7.1- 8.4) 7.2 ( 6.5- 8.0) 11.2 ( 8.8- 14.1) -
Midwest 7.4 ( 7.1- 7.7) 6.9 ( 6.6- 7.2) 11.1 ( 9.9- 12.3) 11.7 ( 9.6- 14.0)
East North Central 7.5 ( 7.2- 7.9) 7.0 ( 6.6- 7.3) 10.8 ( 9.6- 12.2) 11.7 ( 9.4- 14.5)
Illinois 8.4 ( 7.7- 9.1) 7.5 ( 6.8- 8.3) 12.6 ( 10.4- 15.1) 13.4 ( 10.2- 17.1)
Indiana 7.9 ( 6.9- 8.9) 7.8 ( 6.8- 8.9) 8.2 ( 5.1- 12.6) ∼Michigan 6.8 ( 6.1- 7.5) 6.0 ( 5.3- 6.8) 10.9 ( 8.6- 13.6) ∼
Detroit 7.8 ( 6.7- 9.1) 6.4 ( 5.1- 7.8) 12.4 ( 9.6- 15.8) ∼Ohio 7.4 ( 6.8- 8.2) 7.2 ( 6.5- 7.9) 7.4 ( 5.5- 9.8) ∼Wisconsin 7.0 ( 6.0- 8.0) 6.2 ( 5.2- 7.2) 20.7 ( 13.6- 30.2) ∼
West North Central 7.2 ( 6.7- 7.7) 6.7 ( 6.2- 7.2) 12.1 ( 9.3- 15.5) 11.3 ( 7.4- 16.7)
Iowa 6.2 ( 5.0- 7.6) 6.1 ( 4.9- 7.5) ∼ ∼Kansas 7.6 ( 6.2- 9.2) 7.7 ( 6.2- 9.5) ∼ ∼Minnesota 6.3 ( 5.4- 7.4) 5.5 ( 4.6- 6.6) ∼ ∼Missouri 8.5 ( 7.5- 9.6) 7.9 ( 6.9- 9.1) 13.6 ( 9.9- 18.2) ∼Nebraska 7.0 ( 5.3- 9.0) 6.6 ( 4.9- 8.6) ∼ ∼North Dakota 6.1 ( 3.6- 9.5) 5.8 ( 3.3- 9.4) ∼ ∼South Dakota 6.9 ( 4.5- 10.1) 6.0 ( 3.7- 9.2) ∼ ∼
South 8.6 ( 8.4- 8.9) 8.2 ( 7.9- 8.4) 11.0 ( 10.3- 11.7) 13.0 ( 12.0- 14.1)
South Atlantic 8.2 ( 7.8- 8.5) 7.7 ( 7.4- 8.1) 10.2 ( 9.3- 11.1) 12.5 ( 11.0- 14.1)
Delaware 8.3 ( 5.8- 11.4) 8.5 ( 5.6- 12.3) ∼ ∼District of Columbia 13.2 ( 9.4- 18.1) ∼ 13.5 ( 8.7- 20.0) ∼Florida 8.8 ( 8.2- 9.4) 8.7 ( 8.0- 9.4) 10.7 ( 8.9- 12.8) -
Georgia 8.1 ( 7.3- 9.0) 7.5 ( 6.5- 8.5) 10.6 ( 8.8- 12.7) 13.7 ( 8.4- 21.4)
Atlanta 8.2 ( 6.8- 9.8) 7.1 ( 5.5- 9.1) 11.4 ( 8.3- 15.2) ∼Maryland
North Carolina 8.4 ( 7.5- 9.3) 7.8 ( 6.9- 8.8) 10.7 ( 8.7- 13.0) 25.9 ( 15.1- 40.9)
South Carolina 7.9 ( 6.8- 9.2) 6.3 ( 5.1- 7.7) 11.5 ( 9.0- 14.5) -
Virginia 6.3 ( 5.6- 7.2) 6.0 ( 5.2- 7.0) 6.4 ( 4.7- 8.5) 14.4 ( 8.4- 23.0)
West Virginia 9.4 ( 7.5- 11.5) 8.9 ( 7.0- 11.0) ∼ ∼East South Central 8.8 ( 8.2- 9.4) 7.9 ( 7.2- 8.6) 12.7 ( 11.0- 14.5) ∼Alabama 8.1 ( 7.0- 9.3) 6.5 ( 5.3- 7.8) 12.2 ( 9.6- 15.4) ∼Kentucky 9.8 ( 8.5- 11.2) 9.6 ( 8.3- 11.1) 13.7 ( 8.4- 20.9) -
Mississippi 9.2 ( 7.7- 10.9) 6.8 ( 5.2- 8.7) 13.8 ( 10.6- 17.5) ∼Tennessee 8.5 ( 7.5- 9.6) 7.8 ( 6.8- 9.0) 11.8 ( 8.9- 15.3) ∼
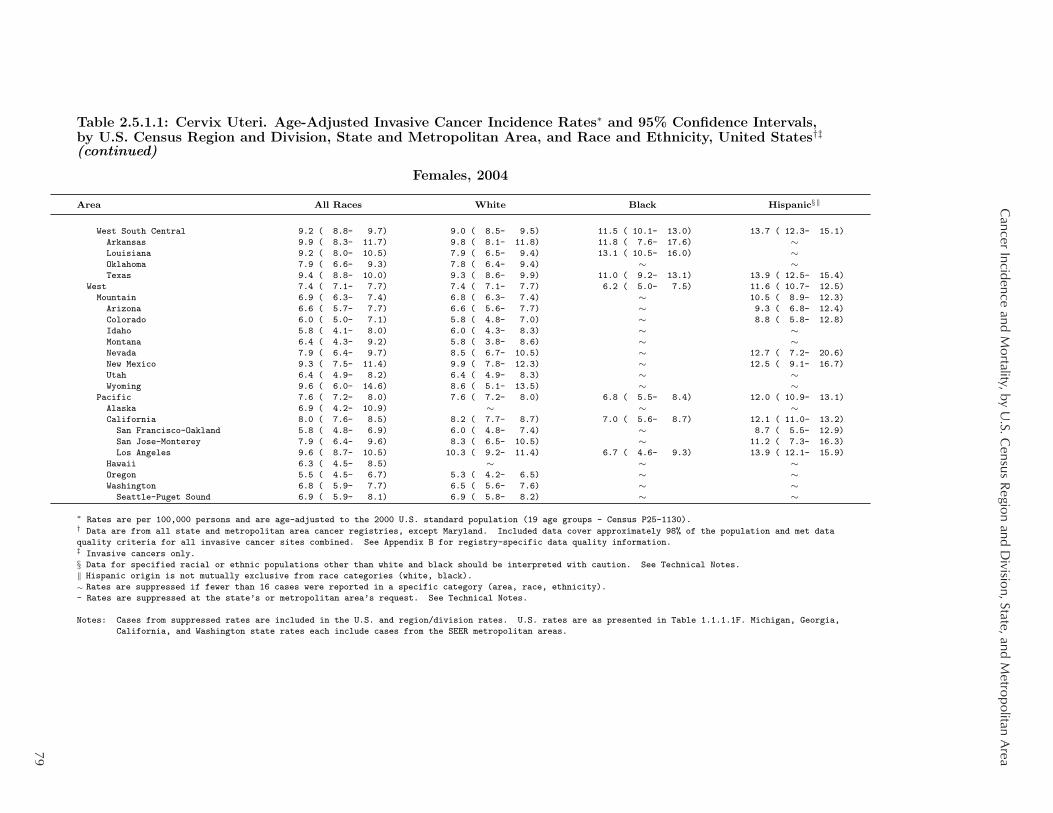
Cancer Incidence and M
ortality, by U.S. C
ensus Region and D
i�ision, State, and Metropolitan A
rea
��
Table 2.5.1.1: Cervix Uteri. Age-Adjusted Invasive Cancer Incidence Rates∗ and 95% Confidence Intervals,by U.S. Census Region and Division, State and Metropolitan Area, and Race and Ethnicity, United States†‡(continued)
Females, 2004
Area All Races White Black Hispanic§
West South Central 9.2 ( 8.8- 9.7) 9.0 ( 8.5- 9.5) 11.5 ( 10.1- 13.0) 13.7 ( 12.3- 15.1)
Arkansas 9.9 ( 8.3- 11.7) 9.8 ( 8.1- 11.8) 11.8 ( 7.6- 17.6) ∼Louisiana 9.2 ( 8.0- 10.5) 7.9 ( 6.5- 9.4) 13.1 ( 10.5- 16.0) ∼Oklahoma 7.9 ( 6.6- 9.3) 7.8 ( 6.4- 9.4) ∼ ∼Texas 9.4 ( 8.8- 10.0) 9.3 ( 8.6- 9.9) 11.0 ( 9.2- 13.1) 13.9 ( 12.5- 15.4)
West 7.4 ( 7.1- 7.7) 7.4 ( 7.1- 7.7) 6.2 ( 5.0- 7.5) 11.6 ( 10.7- 12.5)
Mountain 6.9 ( 6.3- 7.4) 6.8 ( 6.3- 7.4) ∼ 10.5 ( 8.9- 12.3)
Arizona 6.6 ( 5.7- 7.7) 6.6 ( 5.6- 7.7) ∼ 9.3 ( 6.8- 12.4)
Colorado 6.0 ( 5.0- 7.1) 5.8 ( 4.8- 7.0) ∼ 8.8 ( 5.8- 12.8)
Idaho 5.8 ( 4.1- 8.0) 6.0 ( 4.3- 8.3) ∼ ∼Montana 6.4 ( 4.3- 9.2) 5.8 ( 3.8- 8.6) ∼ ∼Nevada 7.9 ( 6.4- 9.7) 8.5 ( 6.7- 10.5) ∼ 12.7 ( 7.2- 20.6)
New Mexico 9.3 ( 7.5- 11.4) 9.9 ( 7.8- 12.3) ∼ 12.5 ( 9.1- 16.7)
Utah 6.4 ( 4.9- 8.2) 6.4 ( 4.9- 8.3) ∼ ∼Wyoming 9.6 ( 6.0- 14.6) 8.6 ( 5.1- 13.5) ∼ ∼
Pacific 7.6 ( 7.2- 8.0) 7.6 ( 7.2- 8.0) 6.8 ( 5.5- 8.4) 12.0 ( 10.9- 13.1)
Alaska 6.9 ( 4.2- 10.9) ∼ ∼ ∼California 8.0 ( 7.6- 8.5) 8.2 ( 7.7- 8.7) 7.0 ( 5.6- 8.7) 12.1 ( 11.0- 13.2)
San Francisco-Oakland 5.8 ( 4.8- 6.9) 6.0 ( 4.8- 7.4) ∼ 8.7 ( 5.5- 12.9)
San Jose-Monterey 7.9 ( 6.4- 9.6) 8.3 ( 6.5- 10.5) ∼ 11.2 ( 7.3- 16.3)
Los Angeles 9.6 ( 8.7- 10.5) 10.3 ( 9.2- 11.4) 6.7 ( 4.6- 9.3) 13.9 ( 12.1- 15.9)
Hawaii 6.3 ( 4.5- 8.5) ∼ ∼ ∼Oregon 5.5 ( 4.5- 6.7) 5.3 ( 4.2- 6.5) ∼ ∼Washington 6.8 ( 5.9- 7.7) 6.5 ( 5.6- 7.6) ∼ ∼
Seattle-Puget Sound 6.9 ( 5.9- 8.1) 6.9 ( 5.8- 8.2) ∼ ∼∗ Rates are per 100,000 persons and are age-adjusted to the 2000 U.S. standard population (19 age groups - Census P25-1130).† Data are from all state and metropolitan area cancer registries, except Maryland. Included data cover approximately 98% of the population and met data
quality criteria for all invasive cancer sites combined. See Appendix B for registry-specific data quality information.‡ Invasive cancers only.
§ Data for specified racial or ethnic populations other than white and black should be interpreted with caution. See Technical Notes.
Hispanic origin is not mutually exclusive from race categories (white, black).
∼ Rates are suppressed if fewer than 16 cases were reported in a specific category (area, race, ethnicity).
- Rates are suppressed at the state’s or metropolitan area’s request. See Technical Notes.
Notes: Cases from suppressed rates are included in the U.S. and region/division rates. U.S. rates are as presented in Table 1.1.1.1F. Michigan, Georgia,
California, and Washington state rates each include cases from the SEER metropolitan areas.
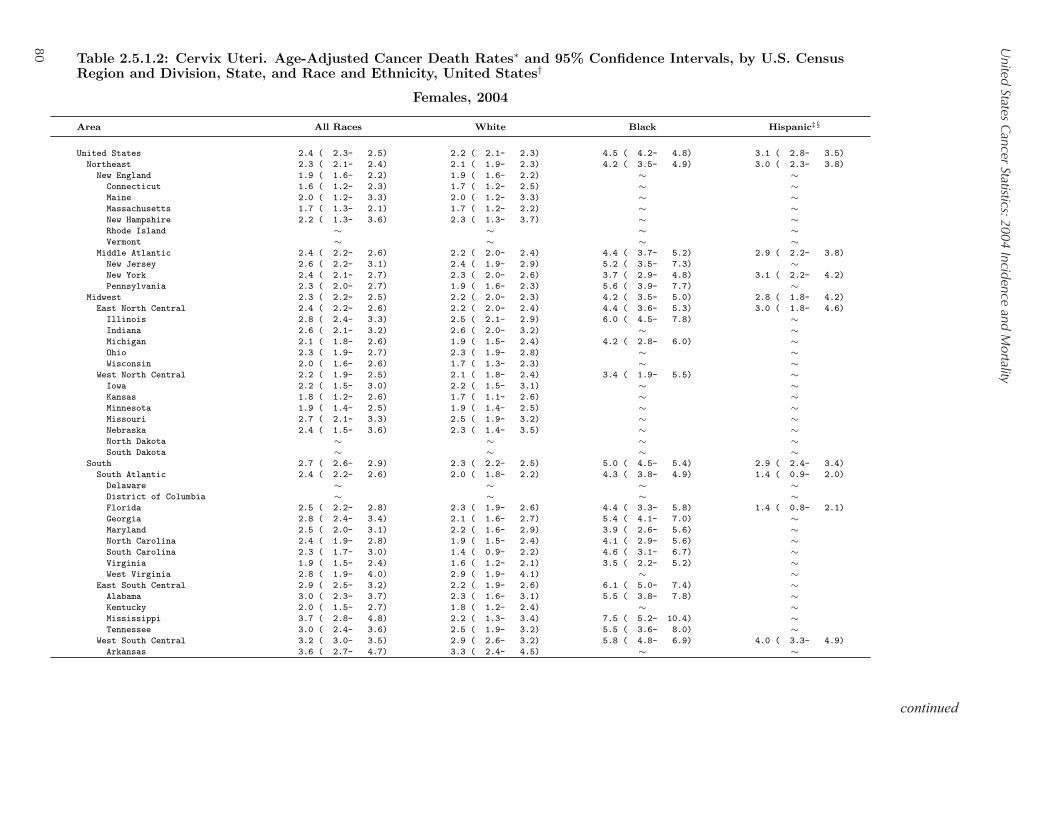
United
States Cancer Statistics: 2004 Incid
ence and M
ortality
�0
continued
Table 2.5.1.2: Cervix Uteri. Age-Adjusted Cancer Death Rates∗ and 95% Confidence Intervals, by U.S. CensusRegion and Division, State, and Race and Ethnicity, United States†
Females, 2004
Area All Races White Black Hispanic‡§
United States 2.4 ( 2.3- 2.5) 2.2 ( 2.1- 2.3) 4.5 ( 4.2- 4.8) 3.1 ( 2.8- 3.5)
Northeast 2.3 ( 2.1- 2.4) 2.1 ( 1.9- 2.3) 4.2 ( 3.5- 4.9) 3.0 ( 2.3- 3.8)
New England 1.9 ( 1.6- 2.2) 1.9 ( 1.6- 2.2) ∼ ∼Connecticut 1.6 ( 1.2- 2.3) 1.7 ( 1.2- 2.5) ∼ ∼Maine 2.0 ( 1.2- 3.3) 2.0 ( 1.2- 3.3) ∼ ∼Massachusetts 1.7 ( 1.3- 2.1) 1.7 ( 1.2- 2.2) ∼ ∼New Hampshire 2.2 ( 1.3- 3.6) 2.3 ( 1.3- 3.7) ∼ ∼Rhode Island ∼ ∼ ∼ ∼Vermont ∼ ∼ ∼ ∼
Middle Atlantic 2.4 ( 2.2- 2.6) 2.2 ( 2.0- 2.4) 4.4 ( 3.7- 5.2) 2.9 ( 2.2- 3.8)
New Jersey 2.6 ( 2.2- 3.1) 2.4 ( 1.9- 2.9) 5.2 ( 3.5- 7.3) ∼New York 2.4 ( 2.1- 2.7) 2.3 ( 2.0- 2.6) 3.7 ( 2.9- 4.8) 3.1 ( 2.2- 4.2)
Pennsylvania 2.3 ( 2.0- 2.7) 1.9 ( 1.6- 2.3) 5.6 ( 3.9- 7.7) ∼Midwest 2.3 ( 2.2- 2.5) 2.2 ( 2.0- 2.3) 4.2 ( 3.5- 5.0) 2.8 ( 1.8- 4.2)
East North Central 2.4 ( 2.2- 2.6) 2.2 ( 2.0- 2.4) 4.4 ( 3.6- 5.3) 3.0 ( 1.8- 4.6)
Illinois 2.8 ( 2.4- 3.3) 2.5 ( 2.1- 2.9) 6.0 ( 4.5- 7.8) ∼Indiana 2.6 ( 2.1- 3.2) 2.6 ( 2.0- 3.2) ∼ ∼Michigan 2.1 ( 1.8- 2.6) 1.9 ( 1.5- 2.4) 4.2 ( 2.8- 6.0) ∼Ohio 2.3 ( 1.9- 2.7) 2.3 ( 1.9- 2.8) ∼ ∼Wisconsin 2.0 ( 1.6- 2.6) 1.7 ( 1.3- 2.3) ∼ ∼
West North Central 2.2 ( 1.9- 2.5) 2.1 ( 1.8- 2.4) 3.4 ( 1.9- 5.5) ∼Iowa 2.2 ( 1.5- 3.0) 2.2 ( 1.5- 3.1) ∼ ∼Kansas 1.8 ( 1.2- 2.6) 1.7 ( 1.1- 2.6) ∼ ∼Minnesota 1.9 ( 1.4- 2.5) 1.9 ( 1.4- 2.5) ∼ ∼Missouri 2.7 ( 2.1- 3.3) 2.5 ( 1.9- 3.2) ∼ ∼Nebraska 2.4 ( 1.5- 3.6) 2.3 ( 1.4- 3.5) ∼ ∼North Dakota ∼ ∼ ∼ ∼South Dakota ∼ ∼ ∼ ∼
South 2.7 ( 2.6- 2.9) 2.3 ( 2.2- 2.5) 5.0 ( 4.5- 5.4) 2.9 ( 2.4- 3.4)
South Atlantic 2.4 ( 2.2- 2.6) 2.0 ( 1.8- 2.2) 4.3 ( 3.8- 4.9) 1.4 ( 0.9- 2.0)
Delaware ∼ ∼ ∼ ∼District of Columbia ∼ ∼ ∼ ∼Florida 2.5 ( 2.2- 2.8) 2.3 ( 1.9- 2.6) 4.4 ( 3.3- 5.8) 1.4 ( 0.8- 2.1)
Georgia 2.8 ( 2.4- 3.4) 2.1 ( 1.6- 2.7) 5.4 ( 4.1- 7.0) ∼Maryland 2.5 ( 2.0- 3.1) 2.2 ( 1.6- 2.9) 3.9 ( 2.6- 5.6) ∼North Carolina 2.4 ( 1.9- 2.8) 1.9 ( 1.5- 2.4) 4.1 ( 2.9- 5.6) ∼South Carolina 2.3 ( 1.7- 3.0) 1.4 ( 0.9- 2.2) 4.6 ( 3.1- 6.7) ∼Virginia 1.9 ( 1.5- 2.4) 1.6 ( 1.2- 2.1) 3.5 ( 2.2- 5.2) ∼West Virginia 2.8 ( 1.9- 4.0) 2.9 ( 1.9- 4.1) ∼ ∼
East South Central 2.9 ( 2.5- 3.2) 2.2 ( 1.9- 2.6) 6.1 ( 5.0- 7.4) ∼Alabama 3.0 ( 2.3- 3.7) 2.3 ( 1.6- 3.1) 5.5 ( 3.8- 7.8) ∼Kentucky 2.0 ( 1.5- 2.7) 1.8 ( 1.2- 2.4) ∼ ∼Mississippi 3.7 ( 2.8- 4.8) 2.2 ( 1.3- 3.4) 7.5 ( 5.2- 10.4) ∼Tennessee 3.0 ( 2.4- 3.6) 2.5 ( 1.9- 3.2) 5.5 ( 3.6- 8.0) ∼
West South Central 3.2 ( 3.0- 3.5) 2.9 ( 2.6- 3.2) 5.8 ( 4.8- 6.9) 4.0 ( 3.3- 4.9)
Arkansas 3.6 ( 2.7- 4.7) 3.3 ( 2.4- 4.5) ∼ ∼

Cancer Incidence and M
ortality, by U.S. C
ensus Region and D
i�ision, State, and Metropolitan A
rea
��
Table 2.5.1.2: Cervix Uteri. Age-Adjusted Cancer Death Rates∗ and 95% Confidence Intervals, by U.S. CensusRegion and Division, State, and Race and Ethnicity, United States† (continued)
Females, 2004
Area All Races White Black Hispanic‡§
Louisiana 2.9 ( 2.2- 3.6) 1.6 ( 1.1- 2.4) 5.9 ( 4.2- 8.0) ∼Oklahoma 2.6 ( 1.9- 3.4) 2.4 ( 1.6- 3.3) ∼ ∼Texas 3.4 ( 3.1- 3.8) 3.2 ( 2.8- 3.6) 5.7 ( 4.4- 7.3) 4.2 ( 3.4- 5.1)
West 2.1 ( 2.0- 2.3) 2.0 ( 1.9- 2.2) 2.9 ( 2.1- 3.9) 3.5 ( 3.0- 4.1)
Mountain 2.0 ( 1.7- 2.3) 2.0 ( 1.7- 2.3) ∼ 3.7 ( 2.7- 4.9)
Arizona 2.3 ( 1.7- 2.9) 2.2 ( 1.7- 2.9) ∼ 4.9 ( 3.0- 7.4)
Colorado 1.6 ( 1.1- 2.2) 1.5 ( 1.0- 2.1) ∼ ∼Idaho ∼ ∼ ∼ ∼Montana ∼ ∼ ∼ ∼Nevada 2.8 ( 2.0- 4.0) 3.0 ( 2.0- 4.3) ∼ ∼New Mexico 2.6 ( 1.7- 3.8) 2.7 ( 1.8- 4.1) ∼ ∼Utah ∼ ∼ ∼ ∼Wyoming ∼ ∼ ∼ ∼
Pacific 2.2 ( 2.0- 2.4) 2.1 ( 1.9- 2.3) 3.0 ( 2.2- 4.2) 3.5 ( 2.9- 4.2)
Alaska ∼ ∼ ∼ ∼California 2.3 ( 2.1- 2.6) 2.2 ( 2.0- 2.5) 3.3 ( 2.3- 4.5) 3.6 ( 3.0- 4.3)
Hawaii ∼ ∼ ∼ ∼Oregon 1.5 ( 1.0- 2.1) 1.4 ( 0.9- 2.0) ∼ ∼Washington 1.7 ( 1.3- 2.2) 1.6 ( 1.2- 2.2) ∼ ∼
∗ Rates are per 100,000 persons and are age-adjusted to the 2000 U.S. standard population (19 age groups - Census P25-1130).† Data are from the National Vital Statistics System (NVSS).‡ Data for specified racial or ethnic populations other than white and black should be interpreted with caution. See Technical Notes.
§ Hispanic origin is not mutually exclusive from race categories (white, black).
∼ Rates are suppressed if fewer than 16 cases were reported in a specific category (area, race, ethnicity).
Note: U.S. rates are as presented in Table 1.1.1.2F.
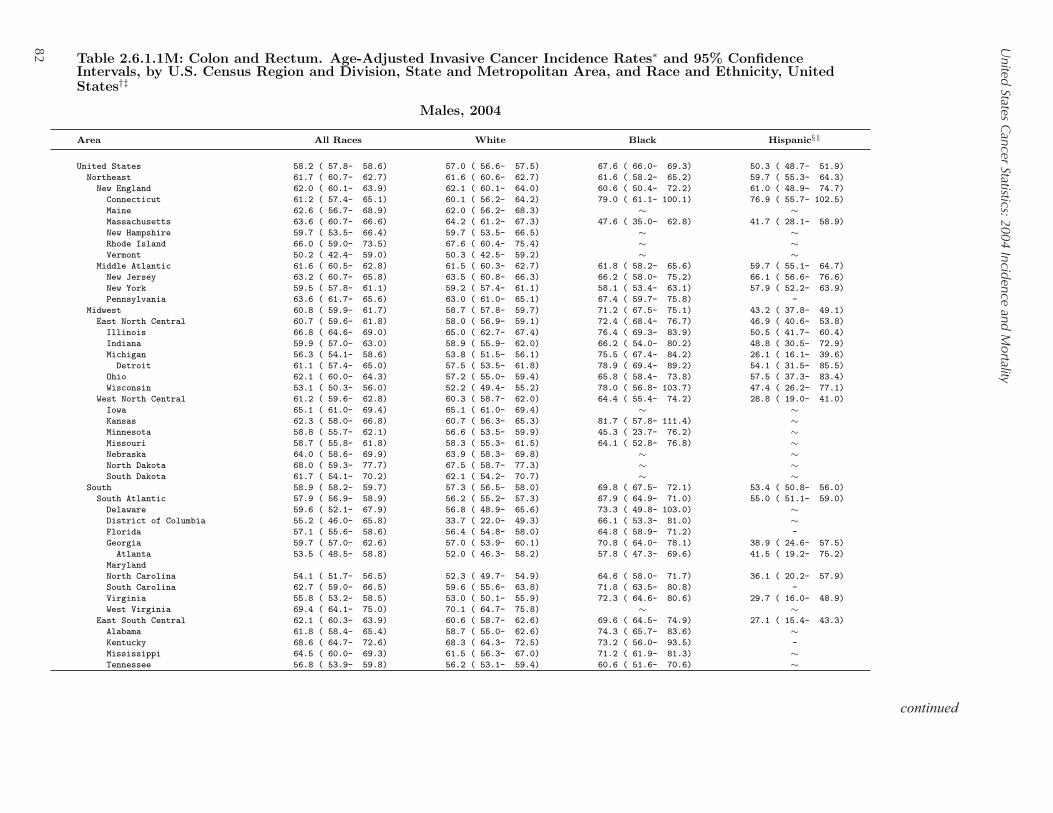
United
States Cancer Statistics: 2004 Incid
ence and M
ortality
��
continued
Table 2.6.1.1M: Colon and Rectum. Age-Adjusted Invasive Cancer Incidence Rates∗ and 95% ConfidenceIntervals, by U.S. Census Region and Division, State and Metropolitan Area, and Race and Ethnicity, UnitedStates†‡
Males, 2004
Area All Races White Black Hispanic§
United States 58.2 ( 57.8- 58.6) 57.0 ( 56.6- 57.5) 67.6 ( 66.0- 69.3) 50.3 ( 48.7- 51.9)
Northeast 61.7 ( 60.7- 62.7) 61.6 ( 60.6- 62.7) 61.6 ( 58.2- 65.2) 59.7 ( 55.3- 64.3)
New England 62.0 ( 60.1- 63.9) 62.1 ( 60.1- 64.0) 60.6 ( 50.4- 72.2) 61.0 ( 48.9- 74.7)
Connecticut 61.2 ( 57.4- 65.1) 60.1 ( 56.2- 64.2) 79.0 ( 61.1- 100.1) 76.9 ( 55.7- 102.5)
Maine 62.6 ( 56.7- 68.9) 62.0 ( 56.2- 68.3) ∼ ∼Massachusetts 63.6 ( 60.7- 66.6) 64.2 ( 61.2- 67.3) 47.6 ( 35.0- 62.8) 41.7 ( 28.1- 58.9)
New Hampshire 59.7 ( 53.5- 66.4) 59.7 ( 53.5- 66.5) ∼ ∼Rhode Island 66.0 ( 59.0- 73.5) 67.6 ( 60.4- 75.4) ∼ ∼Vermont 50.2 ( 42.4- 59.0) 50.3 ( 42.5- 59.2) ∼ ∼
Middle Atlantic 61.6 ( 60.5- 62.8) 61.5 ( 60.3- 62.7) 61.8 ( 58.2- 65.6) 59.7 ( 55.1- 64.7)
New Jersey 63.2 ( 60.7- 65.8) 63.5 ( 60.8- 66.3) 66.2 ( 58.0- 75.2) 66.1 ( 56.6- 76.6)
New York 59.5 ( 57.8- 61.1) 59.2 ( 57.4- 61.1) 58.1 ( 53.4- 63.1) 57.9 ( 52.2- 63.9)
Pennsylvania 63.6 ( 61.7- 65.6) 63.0 ( 61.0- 65.1) 67.4 ( 59.7- 75.8) -
Midwest 60.8 ( 59.9- 61.7) 58.7 ( 57.8- 59.7) 71.2 ( 67.5- 75.1) 43.2 ( 37.8- 49.1)
East North Central 60.7 ( 59.6- 61.8) 58.0 ( 56.9- 59.1) 72.4 ( 68.4- 76.7) 46.9 ( 40.6- 53.8)
Illinois 66.8 ( 64.6- 69.0) 65.0 ( 62.7- 67.4) 76.4 ( 69.3- 83.9) 50.5 ( 41.7- 60.4)
Indiana 59.9 ( 57.0- 63.0) 58.9 ( 55.9- 62.0) 66.2 ( 54.0- 80.2) 48.8 ( 30.5- 72.9)
Michigan 56.3 ( 54.1- 58.6) 53.8 ( 51.5- 56.1) 75.5 ( 67.4- 84.2) 26.1 ( 16.1- 39.6)
Detroit 61.1 ( 57.4- 65.0) 57.5 ( 53.5- 61.8) 78.9 ( 69.4- 89.2) 54.1 ( 31.5- 85.5)
Ohio 62.1 ( 60.0- 64.3) 57.2 ( 55.0- 59.4) 65.8 ( 58.4- 73.8) 57.5 ( 37.3- 83.4)
Wisconsin 53.1 ( 50.3- 56.0) 52.2 ( 49.4- 55.2) 78.0 ( 56.8- 103.7) 47.4 ( 26.2- 77.1)
West North Central 61.2 ( 59.6- 62.8) 60.3 ( 58.7- 62.0) 64.4 ( 55.4- 74.2) 28.8 ( 19.0- 41.0)
Iowa 65.1 ( 61.0- 69.4) 65.1 ( 61.0- 69.4) ∼ ∼Kansas 62.3 ( 58.0- 66.8) 60.7 ( 56.3- 65.3) 81.7 ( 57.8- 111.4) ∼Minnesota 58.8 ( 55.7- 62.1) 56.6 ( 53.5- 59.9) 45.3 ( 23.7- 76.2) ∼Missouri 58.7 ( 55.8- 61.8) 58.3 ( 55.3- 61.5) 64.1 ( 52.8- 76.8) ∼Nebraska 64.0 ( 58.6- 69.9) 63.9 ( 58.3- 69.8) ∼ ∼North Dakota 68.0 ( 59.3- 77.7) 67.5 ( 58.7- 77.3) ∼ ∼South Dakota 61.7 ( 54.1- 70.2) 62.1 ( 54.2- 70.7) ∼ ∼
South 58.9 ( 58.2- 59.7) 57.3 ( 56.5- 58.0) 69.8 ( 67.5- 72.1) 53.4 ( 50.8- 56.0)
South Atlantic 57.9 ( 56.9- 58.9) 56.2 ( 55.2- 57.3) 67.9 ( 64.9- 71.0) 55.0 ( 51.1- 59.0)
Delaware 59.6 ( 52.1- 67.9) 56.8 ( 48.9- 65.6) 73.3 ( 49.8- 103.0) ∼District of Columbia 55.2 ( 46.0- 65.8) 33.7 ( 22.0- 49.3) 66.1 ( 53.3- 81.0) ∼Florida 57.1 ( 55.6- 58.6) 56.4 ( 54.8- 58.0) 64.8 ( 58.9- 71.2) -
Georgia 59.7 ( 57.0- 62.6) 57.0 ( 53.9- 60.1) 70.8 ( 64.0- 78.1) 38.9 ( 24.6- 57.5)
Atlanta 53.5 ( 48.5- 58.8) 52.0 ( 46.3- 58.2) 57.8 ( 47.3- 69.6) 41.5 ( 19.2- 75.2)
Maryland
North Carolina 54.1 ( 51.7- 56.5) 52.3 ( 49.7- 54.9) 64.6 ( 58.0- 71.7) 36.1 ( 20.2- 57.9)
South Carolina 62.7 ( 59.0- 66.5) 59.6 ( 55.6- 63.8) 71.8 ( 63.5- 80.8) -
Virginia 55.8 ( 53.2- 58.5) 53.0 ( 50.1- 55.9) 72.3 ( 64.6- 80.6) 29.7 ( 16.0- 48.9)
West Virginia 69.4 ( 64.1- 75.0) 70.1 ( 64.7- 75.8) ∼ ∼East South Central 62.1 ( 60.3- 63.9) 60.6 ( 58.7- 62.6) 69.6 ( 64.5- 74.9) 27.1 ( 15.4- 43.3)
Alabama 61.8 ( 58.4- 65.4) 58.7 ( 55.0- 62.6) 74.3 ( 65.7- 83.6) ∼Kentucky 68.6 ( 64.7- 72.6) 68.3 ( 64.3- 72.5) 73.2 ( 56.0- 93.5) -
Mississippi 64.5 ( 60.0- 69.3) 61.5 ( 56.3- 67.0) 71.2 ( 61.9- 81.3) ∼Tennessee 56.8 ( 53.9- 59.8) 56.2 ( 53.1- 59.4) 60.6 ( 51.6- 70.6) ∼

Cancer Incidence and M
ortality, by U.S. C
ensus Region and D
i�ision, State, and Metropolitan A
rea
�3
Table 2.6.1.1M: Colon and Rectum. Age-Adjusted Invasive Cancer Incidence Rates∗ and 95% ConfidenceIntervals, by U.S. Census Region and Division, State and Metropolitan Area, and Race and Ethnicity, UnitedStates†‡ (continued)
Males, 2004
Area All Races White Black Hispanic§
West South Central 59.0 ( 57.7- 60.4) 57.2 ( 55.7- 58.6) 74.1 ( 69.4- 78.9) 52.8 ( 49.3- 56.3)
Arkansas 59.6 ( 55.4- 63.9) 58.5 ( 54.1- 63.1) 69.7 ( 55.7- 85.8) ∼Louisiana 64.8 ( 61.1- 68.6) 63.2 ( 59.0- 67.5) 74.3 ( 66.0- 83.2) 49.7 ( 27.7- 80.4)
Oklahoma 57.7 ( 54.0- 61.5) 56.7 ( 52.8- 60.8) 64.0 ( 46.7- 85.0) ∼Texas 58.0 ( 56.3- 59.7) 56.0 ( 54.2- 57.7) 75.5 ( 69.0- 82.3) 53.6 ( 50.0- 57.3)
West 51.0 ( 50.1- 51.9) 50.6 ( 49.7- 51.5) 61.2 ( 56.3- 66.3) 45.2 ( 42.9- 47.6)
Mountain 49.5 ( 48.0- 51.1) 49.8 ( 48.2- 51.4) 43.1 ( 34.2- 53.6) 49.2 ( 44.5- 54.2)
Arizona 46.5 ( 43.9- 49.3) 46.7 ( 44.0- 49.6) 33.2 ( 19.6- 52.1) 47.0 ( 38.9- 56.2)
Colorado 51.9 ( 48.5- 55.4) 51.7 ( 48.2- 55.3) 42.2 ( 27.6- 61.9) 54.5 ( 44.0- 66.5)
Idaho 49.9 ( 44.3- 55.9) 50.1 ( 44.5- 56.2) ∼ ∼Montana 50.8 ( 44.4- 57.8) 50.8 ( 44.3- 57.9) ∼ ∼Nevada 52.0 ( 47.5- 56.8) 52.6 ( 47.8- 57.7) 57.3 ( 38.1- 82.0) 47.8 ( 32.5- 66.9)
New Mexico 51.0 ( 46.2- 56.1) 52.2 ( 47.2- 57.6) ∼ 49.3 ( 41.1- 58.5)
Utah 47.5 ( 42.8- 52.5) 48.5 ( 43.7- 53.7) ∼ 53.7 ( 30.1- 86.1)
Wyoming 53.0 ( 44.0- 63.4) 49.7 ( 40.8- 59.9) ∼ ∼Pacific 51.6 ( 50.6- 52.7) 51.0 ( 49.9- 52.2) 64.9 ( 59.4- 70.7) 43.8 ( 41.1- 46.6)
Alaska 60.2 ( 48.8- 73.3) 57.6 ( 44.7- 72.7) ∼ ∼California 50.5 ( 49.3- 51.7) 50.1 ( 48.8- 51.5) 65.8 ( 60.0- 72.1) 44.3 ( 41.5- 47.2)
San Francisco-Oakland 52.2 ( 48.9- 55.6) 52.1 ( 48.1- 56.2) 66.6 ( 53.8- 81.3) 44.1 ( 34.7- 55.1)
San Jose-Monterey 45.7 ( 41.3- 50.3) 43.7 ( 38.9- 48.9) ∼ 47.2 ( 35.7- 60.7)
Los Angeles 50.7 ( 48.4- 53.1) 49.2 ( 46.5- 51.9) 70.8 ( 61.8- 80.7) 39.8 ( 35.6- 44.4)
Hawaii 59.5 ( 53.5- 65.9) 55.0 ( 43.9- 68.0) ∼ ∼Oregon 56.0 ( 52.4- 59.7) 55.2 ( 51.6- 58.9) ∼ 41.1 ( 22.8- 66.4)
Washington 52.8 ( 50.0- 55.6) 52.1 ( 49.2- 55.0) 55.8 ( 38.4- 78.0) 30.6 ( 18.6- 46.7)
Seattle-Puget Sound 53.3 ( 49.9- 56.8) 54.1 ( 50.5- 57.9) 63.7 ( 43.2- 89.7) ∼∗ Rates are per 100,000 persons and are age-adjusted to the 2000 U.S. standard population (19 age groups - Census P25-1130).† Data are from all state and metropolitan area cancer registries, except Maryland. Included data cover approximately 98% of the population and met data
quality criteria for all invasive cancer sites combined. See Appendix B for registry-specific data quality information.‡ Invasive cancers only.
§ Data for specified racial or ethnic populations other than white and black should be interpreted with caution. See Technical Notes.
Hispanic origin is not mutually exclusive from race categories (white, black).
∼ Rates are suppressed if fewer than 16 cases were reported in a specific category (area, race, ethnicity).
- Rates are suppressed at the state’s or metropolitan area’s request. See Technical Notes.
Notes: Cases from suppressed rates are included in the U.S. and region/division rates. U.S. rates are as presented in Table 1.1.1.1M. Michigan, Georgia,
California, and Washington state rates each include cases from the SEER metropolitan areas.

United
States Cancer Statistics: 2004 Incid
ence and M
ortality
��
continued
Table 2.6.1.1F: Colon and Rectum. Age-Adjusted Invasive Cancer Incidence Rates∗ and 95% ConfidenceIntervals, by U.S. Census Region and Division, State and Metropolitan Area, and Race and Ethnicity, UnitedStates†‡
Females, 2004
Area All Races White Black Hispanic§
United States 42.7 ( 42.4- 43.1) 41.6 ( 41.3- 41.9) 50.6 ( 49.5- 51.7) 34.2 ( 33.1- 35.3)
Northeast 46.2 ( 45.5- 46.9) 45.7 ( 45.0- 46.5) 47.0 ( 44.7- 49.4) 41.2 ( 38.3- 44.3)
New England 46.0 ( 44.6- 47.4) 45.7 ( 44.3- 47.2) 42.5 ( 35.7- 50.1) 42.8 ( 34.7- 52.1)
Connecticut 46.1 ( 43.2- 49.0) 45.4 ( 42.5- 48.5) 46.0 ( 35.4- 58.6) 51.3 ( 37.6- 68.1)
Maine 50.0 ( 45.4- 55.0) 49.4 ( 44.8- 54.4) ∼ ∼Massachusetts 46.5 ( 44.4- 48.7) 46.5 ( 44.3- 48.8) 36.8 ( 28.2- 47.2) 37.8 ( 26.8- 51.3)
New Hampshire 42.7 ( 38.1- 47.7) 42.4 ( 37.8- 47.5) ∼ ∼Rhode Island 44.8 ( 39.9- 50.1) 44.2 ( 39.2- 49.7) ∼ ∼Vermont 40.0 ( 33.8- 47.0) 40.0 ( 33.8- 47.1) ∼ ∼
Middle Atlantic 46.3 ( 45.4- 47.1) 45.7 ( 44.8- 46.6) 47.6 ( 45.1- 50.1) 40.9 ( 37.8- 44.2)
New Jersey 45.5 ( 43.7- 47.4) 45.3 ( 43.3- 47.3) 48.3 ( 42.7- 54.3) 41.0 ( 34.7- 48.0)
New York 46.0 ( 44.8- 47.3) 45.5 ( 44.1- 46.8) 46.3 ( 43.1- 49.7) 41.6 ( 37.9- 45.6)
Pennsylvania 47.1 ( 45.6- 48.6) 46.3 ( 44.7- 47.8) 50.4 ( 45.0- 56.1) -
Midwest 44.0 ( 43.3- 44.7) 42.5 ( 41.8- 43.2) 52.2 ( 49.6- 54.9) 31.4 ( 27.3- 35.9)
East North Central 44.1 ( 43.3- 44.9) 42.3 ( 41.4- 43.1) 52.3 ( 49.5- 55.3) 32.4 ( 27.8- 37.6)
Illinois 48.4 ( 46.8- 50.0) 46.8 ( 45.1- 48.6) 57.9 ( 52.9- 63.2) 32.9 ( 26.8- 39.9)
Indiana 43.0 ( 40.9- 45.2) 42.2 ( 40.1- 44.5) 51.0 ( 42.2- 61.0) ∼Michigan 40.6 ( 39.0- 42.3) 39.1 ( 37.3- 40.8) 50.3 ( 45.0- 56.1) 34.3 ( 22.1- 49.9)
Detroit 43.2 ( 40.6- 46.0) 40.5 ( 37.6- 43.6) 53.8 ( 47.5- 60.7) ∼Ohio 44.1 ( 42.6- 45.7) 41.2 ( 39.6- 42.8) 46.3 ( 41.2- 51.8) 33.1 ( 20.4- 50.1)
Wisconsin 41.8 ( 39.6- 44.1) 40.7 ( 38.5- 43.1) 60.7 ( 45.9- 78.4) 40.9 ( 23.4- 65.1)
West North Central 43.8 ( 42.6- 45.0) 43.0 ( 41.7- 44.2) 51.1 ( 44.7- 58.2) 27.1 ( 18.8- 37.5)
Iowa 47.7 ( 44.7- 51.0) 47.9 ( 44.8- 51.1) ∼ ∼Kansas 43.0 ( 39.8- 46.4) 41.7 ( 38.5- 45.2) 44.2 ( 29.7- 62.9) ∼Minnesota 44.3 ( 41.9- 46.9) 43.0 ( 40.5- 45.5) 31.3 ( 16.7- 52.4) ∼Missouri 42.7 ( 40.5- 44.9) 41.7 ( 39.4- 44.0) 56.2 ( 47.9- 65.4) 50.6 ( 28.3- 81.8)
Nebraska 44.6 ( 40.7- 48.9) 43.6 ( 39.6- 47.9) ∼ ∼North Dakota 40.0 ( 34.1- 46.6) 39.4 ( 33.5- 46.2) ∼ ∼South Dakota 38.3 ( 32.9- 44.3) 38.2 ( 32.8- 44.4) ∼ ∼
South 42.5 ( 42.0- 43.0) 40.7 ( 40.1- 41.3) 51.8 ( 50.2- 53.4) 34.7 ( 32.9- 36.5)
South Atlantic 42.6 ( 41.9- 43.4) 40.7 ( 39.9- 41.5) 51.4 ( 49.3- 53.5) 40.6 ( 37.7- 43.7)
Delaware 39.9 ( 34.5- 45.9) 37.8 ( 32.0- 44.3) 47.7 ( 32.6- 66.9) ∼District of Columbia 46.9 ( 39.6- 55.1) 30.9 ( 20.8- 44.4) 53.2 ( 43.9- 64.0) ∼Florida 41.6 ( 40.5- 42.8) 40.6 ( 39.4- 41.9) 48.4 ( 44.2- 52.8) -
Georgia 43.9 ( 42.0- 46.0) 40.0 ( 37.8- 42.3) 56.3 ( 51.7- 61.2) 33.0 ( 20.5- 49.4)
Atlanta 39.6 ( 36.2- 43.2) 34.3 ( 30.5- 38.5) 53.6 ( 46.1- 62.0) ∼Maryland
North Carolina 41.2 ( 39.4- 43.1) 38.7 ( 36.7- 40.7) 51.4 ( 46.8- 56.4) 27.7 ( 15.6- 44.6)
South Carolina 44.3 ( 41.6- 47.0) 42.4 ( 39.5- 45.6) 48.7 ( 43.2- 54.7) -
Virginia 42.8 ( 40.8- 44.9) 41.2 ( 39.0- 43.4) 50.8 ( 45.6- 56.5) 26.0 ( 16.4- 38.8)
West Virginia 49.2 ( 45.4- 53.4) 48.8 ( 44.9- 53.0) 62.4 ( 38.4- 96.3) ∼East South Central 44.9 ( 43.6- 46.2) 42.9 ( 41.6- 44.4) 53.9 ( 50.3- 57.6) 29.7 ( 18.7- 44.2)
Alabama 42.1 ( 39.7- 44.7) 39.7 ( 37.0- 42.5) 51.9 ( 46.2- 58.1) ∼Kentucky 50.6 ( 47.8- 53.5) 49.6 ( 46.7- 52.6) 59.8 ( 47.4- 74.2) -
Mississippi 47.4 ( 44.2- 50.9) 43.1 ( 39.4- 47.1) 56.6 ( 49.9- 63.9) ∼Tennessee 41.9 ( 39.8- 44.1) 40.3 ( 38.0- 42.7) 51.8 ( 45.1- 59.1) ∼

Cancer Incidence and M
ortality, by U.S. C
ensus Region and D
i�ision, State, and Metropolitan A
rea
��
Table 2.6.1.1F: Colon and Rectum. Age-Adjusted Invasive Cancer Incidence Rates∗ and 95% ConfidenceIntervals, by U.S. Census Region and Division, State and Metropolitan Area, and Race and Ethnicity, UnitedStates†‡ (continued)
Females, 2004
Area All Races White Black Hispanic§
West South Central 40.9 ( 39.9- 41.9) 39.4 ( 38.4- 40.4) 51.2 ( 48.0- 54.5) 30.0 ( 27.7- 32.3)
Arkansas 42.1 ( 39.0- 45.3) 41.4 ( 38.2- 44.8) 45.1 ( 36.0- 55.6) ∼Louisiana 45.4 ( 42.8- 48.2) 44.6 ( 41.5- 47.8) 49.1 ( 43.9- 54.9) ∼Oklahoma 43.4 ( 40.6- 46.4) 41.3 ( 38.4- 44.4) 58.3 ( 44.6- 74.7) 41.5 ( 22.7- 68.2)
Texas 39.1 ( 37.9- 40.3) 37.7 ( 36.4- 39.0) 52.6 ( 48.2- 57.3) 30.0 ( 27.7- 32.4)
West 38.2 ( 37.5- 38.8) 37.6 ( 36.9- 38.3) 48.9 ( 45.3- 52.8) 31.2 ( 29.6- 33.0)
Mountain 37.3 ( 36.1- 38.5) 37.1 ( 35.9- 38.4) 49.1 ( 40.1- 59.4) 32.8 ( 29.4- 36.4)
Arizona 33.7 ( 31.7- 35.8) 33.5 ( 31.4- 35.6) 51.1 ( 35.0- 71.5) 25.8 ( 20.6- 31.8)
Colorado 42.5 ( 39.8- 45.3) 42.3 ( 39.5- 45.2) 56.9 ( 39.5- 78.8) 44.5 ( 36.0- 54.3)
Idaho 39.4 ( 34.9- 44.3) 39.9 ( 35.3- 44.9) ∼ ∼Montana 37.8 ( 32.9- 43.3) 37.6 ( 32.6- 43.3) ∼ ∼Nevada 44.5 ( 40.7- 48.6) 44.7 ( 40.6- 49.1) 48.8 ( 33.2- 68.8) 38.2 ( 26.0- 53.5)
New Mexico 34.4 ( 30.9- 38.2) 34.4 ( 30.7- 38.3) ∼ 31.5 ( 25.7- 38.1)
Utah 29.0 ( 25.7- 32.6) 29.4 ( 26.0- 33.1) ∼ ∼Wyoming 40.2 ( 33.1- 48.6) 37.7 ( 30.7- 46.0) ∼ ∼
Pacific 38.5 ( 37.8- 39.3) 37.8 ( 37.0- 38.7) 48.9 ( 44.9- 53.2) 30.7 ( 28.8- 32.7)
Alaska 45.5 ( 36.8- 55.5) 31.7 ( 23.5- 41.8) ∼ ∼California 37.9 ( 37.0- 38.8) 37.5 ( 36.5- 38.5) 49.0 ( 44.8- 53.4) 30.5 ( 28.6- 32.6)
San Francisco-Oakland 40.0 ( 37.4- 42.6) 38.6 ( 35.6- 41.8) 49.1 ( 40.2- 59.5) 29.4 ( 22.8- 37.1)
San Jose-Monterey 34.9 ( 31.6- 38.5) 36.7 ( 32.8- 40.9) ∼ 30.2 ( 22.4- 39.6)
Los Angeles 38.6 ( 36.9- 40.4) 37.3 ( 35.3- 39.4) 53.2 ( 46.9- 60.0) 28.6 ( 25.6- 31.7)
Hawaii 44.2 ( 39.6- 49.2) 49.6 ( 39.9- 61.3) ∼ ∼Oregon 39.3 ( 36.7- 42.2) 38.1 ( 35.4- 40.9) ∼ 42.0 ( 25.5- 64.0)
Washington 39.7 ( 37.5- 41.9) 38.8 ( 36.6- 41.1) 55.3 ( 38.7- 76.1) 29.0 ( 18.1- 43.3)
Seattle-Puget Sound 41.1 ( 38.4- 43.8) 40.7 ( 37.9- 43.6) 61.0 ( 42.6- 84.1) 39.6 ( 22.1- 64.1)
∗ Rates are per 100,000 persons and are age-adjusted to the 2000 U.S. standard population (19 age groups - Census P25-1130).† Data are from all state and metropolitan area cancer registries, except Maryland. Included data cover approximately 98% of the population and met data
quality criteria for all invasive cancer sites combined. See Appendix B for registry-specific data quality information.‡ Invasive cancers only.
§ Data for specified racial or ethnic populations other than white and black should be interpreted with caution. See Technical Notes.
Hispanic origin is not mutually exclusive from race categories (white, black).
∼ Rates are suppressed if fewer than 16 cases were reported in a specific category (area, race, ethnicity).
- Rates are suppressed at the state’s or metropolitan area’s request. See Technical Notes.
Notes: Cases from suppressed rates are included in the U.S. and region/division rates. U.S. rates are as presented in Table 1.1.1.1F. Michigan, Georgia,
California, and Washington state rates each include cases from the SEER metropolitan areas.

United
States Cancer Statistics: 2004 Incid
ence and M
ortality
��
continued
Table 2.6.1.2M: Colon and Rectum. Age-Adjusted Cancer Death Rates∗ and 95% Confidence Intervals, byU.S. Census Region and Division, State, and Race and Ethnicity, United States†
Males, 2004
Area All Races White Black Hispanic‡§
United States 21.6 ( 21.3- 21.8) 21.1 ( 20.8- 21.3) 30.2 ( 29.1- 31.4) 15.9 ( 15.0- 16.8)
Northeast 21.9 ( 21.4- 22.5) 21.8 ( 21.2- 22.5) 26.8 ( 24.4- 29.2) 16.4 ( 14.0- 18.9)
New England 20.5 ( 19.4- 21.6) 20.6 ( 19.4- 21.7) 25.2 ( 18.5- 33.2) 14.4 ( 8.8- 21.8)
Connecticut 19.9 ( 17.7- 22.2) 19.4 ( 17.2- 21.7) 31.0 ( 19.9- 45.4) ∼Maine 17.7 ( 14.6- 21.3) 17.6 ( 14.4- 21.2) ∼ ∼Massachusetts 21.0 ( 19.4- 22.7) 21.3 ( 19.6- 23.1) 20.2 ( 12.2- 31.0) ∼New Hampshire 22.3 ( 18.5- 26.7) 22.6 ( 18.7- 27.1) ∼ ∼Rhode Island 21.2 ( 17.4- 25.7) 21.7 ( 17.7- 26.3) ∼ ∼Vermont 21.6 ( 16.5- 27.8) 21.8 ( 16.7- 28.0) ∼ ∼
Middle Atlantic 22.4 ( 21.8- 23.1) 22.3 ( 21.6- 23.1) 27.0 ( 24.5- 29.6) 16.7 ( 14.2- 19.5)
New Jersey 22.7 ( 21.2- 24.3) 22.5 ( 20.9- 24.2) 28.3 ( 22.7- 34.7) 13.7 ( 9.4- 19.1)
New York 21.8 ( 20.8- 22.8) 21.7 ( 20.6- 22.8) 26.4 ( 23.1- 29.9) 18.2 ( 15.0- 21.9)
Pennsylvania 23.2 ( 22.0- 24.4) 23.0 ( 21.8- 24.3) 28.0 ( 23.1- 33.6) ∼Midwest 22.7 ( 22.1- 23.2) 22.0 ( 21.5- 22.6) 33.6 ( 31.0- 36.4) 9.5 ( 7.1- 12.3)
East North Central 23.3 ( 22.6- 24.0) 22.5 ( 21.8- 23.2) 34.5 ( 31.6- 37.6) 9.3 ( 6.6- 12.5)
Illinois 24.2 ( 22.9- 25.6) 23.3 ( 21.8- 24.7) 35.9 ( 30.9- 41.3) 9.1 ( 5.6- 13.7)
Indiana 24.0 ( 22.1- 26.0) 23.6 ( 21.7- 25.7) 32.3 ( 23.3- 43.1) ∼Michigan 21.6 ( 20.2- 23.1) 20.7 ( 19.3- 22.2) 31.1 ( 25.8- 36.9) ∼Ohio 24.7 ( 23.4- 26.1) 23.8 ( 22.4- 25.3) 36.6 ( 30.9- 42.9) ∼Wisconsin 20.2 ( 18.5- 22.1) 19.9 ( 18.2- 21.8) 38.3 ( 22.4- 59.5) ∼
West North Central 21.3 ( 20.4- 22.3) 21.1 ( 20.1- 22.1) 28.7 ( 22.6- 35.8) ∼Iowa 23.1 ( 20.7- 25.8) 23.2 ( 20.7- 25.8) ∼ ∼Kansas 21.4 ( 18.9- 24.2) 21.5 ( 18.9- 24.3) ∼ ∼Minnesota 17.1 ( 15.4- 19.0) 17.0 ( 15.3- 18.9) ∼ ∼Missouri 24.0 ( 22.1- 26.0) 23.7 ( 21.7- 25.7) 31.0 ( 23.1- 40.6) ∼Nebraska 21.8 ( 18.6- 25.3) 21.2 ( 18.0- 24.7) ∼ ∼North Dakota 19.7 ( 15.1- 25.2) 19.7 ( 15.1- 25.2) ∼ ∼South Dakota 19.1 ( 14.9- 24.1) 18.4 ( 14.3- 23.4) ∼ ∼
South 22.1 ( 21.6- 22.5) 21.1 ( 20.6- 21.5) 30.6 ( 29.1- 32.2) 16.9 ( 15.4- 18.5)
South Atlantic 21.2 ( 20.6- 21.8) 20.1 ( 19.5- 20.7) 29.7 ( 27.8- 31.7) 15.5 ( 13.4- 17.8)
Delaware 22.2 ( 17.6- 27.6) 21.0 ( 16.1- 26.8) ∼ ∼District of Columbia 21.3 ( 15.6- 28.4) ∼ 27.4 ( 19.3- 37.6) ∼Florida 19.6 ( 18.7- 20.5) 18.9 ( 18.1- 19.9) 29.9 ( 25.8- 34.5) 17.4 ( 15.0- 20.1)
Georgia 21.9 ( 20.1- 23.7) 20.2 ( 18.3- 22.3) 29.8 ( 25.2- 34.8) ∼Maryland 22.9 ( 20.9- 25.0) 21.7 ( 19.5- 24.0) 30.7 ( 25.3- 36.9) ∼North Carolina 21.4 ( 19.9- 23.1) 20.5 ( 18.9- 22.3) 26.7 ( 22.4- 31.5) ∼South Carolina 21.1 ( 19.0- 23.4) 18.9 ( 16.6- 21.4) 30.7 ( 25.1- 37.1) ∼Virginia 22.9 ( 21.2- 24.8) 21.6 ( 19.7- 23.6) 32.4 ( 27.2- 38.2) ∼West Virginia 27.3 ( 23.9- 30.9) 27.3 ( 23.9- 31.0) ∼ ∼
East South Central 23.9 ( 22.8- 25.1) 22.6 ( 21.4- 23.8) 33.6 ( 30.0- 37.5) ∼Alabama 24.5 ( 22.3- 26.9) 22.0 ( 19.7- 24.6) 37.2 ( 31.0- 44.2) ∼Kentucky 23.1 ( 20.8- 25.6) 22.9 ( 20.5- 25.4) 28.7 ( 18.3- 42.3) ∼Mississippi 25.7 ( 22.8- 28.9) 24.0 ( 20.7- 27.6) 31.5 ( 25.2- 38.7) ∼Tennessee 23.3 ( 21.4- 25.4) 22.3 ( 20.3- 24.5) 32.7 ( 25.8- 40.6) ∼
West South Central 22.7 ( 21.9- 23.6) 22.1 ( 21.2- 23.0) 30.7 ( 27.6- 34.0) 18.2 ( 16.1- 20.5)
Arkansas 25.5 ( 22.7- 28.4) 25.3 ( 22.4- 28.4) 29.7 ( 20.6- 41.2) ∼

Cancer Incidence and M
ortality, by U.S. C
ensus Region and D
i�ision, State, and Metropolitan A
rea
��
Table 2.6.1.2M: Colon and Rectum. Age-Adjusted Cancer Death Rates∗ and 95% Confidence Intervals, byU.S. Census Region and Division, State, and Race and Ethnicity, United States† (continued)
Males, 2004
Area All Races White Black Hispanic‡§
Louisiana 26.4 ( 24.0- 28.9) 24.9 ( 22.2- 27.8) 31.2 ( 25.9- 37.3) ∼Oklahoma 24.0 ( 21.6- 26.6) 23.2 ( 20.7- 25.9) 45.4 ( 30.3- 64.6) ∼Texas 21.3 ( 20.2- 22.3) 20.9 ( 19.8- 22.0) 28.8 ( 24.7- 33.3) 18.6 ( 16.5- 21.0)
West 19.2 ( 18.6- 19.7) 19.2 ( 18.6- 19.8) 28.2 ( 24.8- 32.0) 15.8 ( 14.3- 17.3)
Mountain 19.7 ( 18.7- 20.7) 19.6 ( 18.6- 20.7) 33.1 ( 24.0- 44.2) 22.0 ( 18.7- 25.8)
Arizona 18.8 ( 17.1- 20.6) 18.7 ( 17.0- 20.5) 37.6 ( 21.0- 60.6) 14.0 ( 9.4- 19.7)
Colorado 20.3 ( 18.1- 22.6) 20.5 ( 18.2- 22.9) ∼ 33.9 ( 24.8- 45.0)
Idaho 17.1 ( 13.8- 20.8) 17.2 ( 14.0- 21.0) ∼ ∼Montana 17.4 ( 13.7- 21.7) 17.3 ( 13.6- 21.7) ∼ ∼Nevada 25.2 ( 21.9- 28.9) 24.9 ( 21.5- 28.8) 48.6 ( 29.4- 74.2) ∼New Mexico 22.4 ( 19.3- 26.0) 22.3 ( 19.0- 26.1) ∼ 26.8 ( 20.7- 34.0)
Utah 15.0 ( 12.4- 18.0) 15.5 ( 12.8- 18.6) ∼ ∼Wyoming 21.7 ( 15.8- 29.0) 21.6 ( 15.7- 28.9) ∼ ∼
Pacific 19.0 ( 18.4- 19.6) 19.0 ( 18.3- 19.7) 27.4 ( 23.8- 31.5) 13.7 ( 12.1- 15.3)
Alaska 20.7 ( 13.7- 29.6) 20.7 ( 13.0- 30.8) ∼ ∼California 18.9 ( 18.2- 19.7) 18.9 ( 18.1- 19.7) 28.1 ( 24.2- 32.4) 13.6 ( 12.0- 15.3)
Hawaii 18.5 ( 15.2- 22.2) 15.8 ( 10.1- 23.5) ∼ ∼Oregon 20.2 ( 18.1- 22.5) 19.9 ( 17.7- 22.2) ∼ ∼Washington 18.7 ( 17.1- 20.5) 19.0 ( 17.3- 20.9) ∼ ∼
∗ Rates are per 100,000 persons and are age-adjusted to the 2000 U.S. standard population (19 age groups - Census P25-1130).† Data are from the National Vital Statistics System (NVSS).‡ Data for specified racial or ethnic populations other than white and black should be interpreted with caution. See Technical Notes.
§ Hispanic origin is not mutually exclusive from race categories (white, black).
∼ Rates are suppressed if fewer than 16 cases were reported in a specific category (area, race, ethnicity).
Note: U.S. rates are as presented in Table 1.1.1.2M.

United
States Cancer Statistics: 2004 Incid
ence and M
ortality
��
continued
Table 2.6.1.2F: Colon and Rectum. Age-Adjusted Cancer Death Rates∗ and 95% Confidence Intervals, byU.S. Census Region and Division, State, and Race and Ethnicity, United States†
Females, 2004
Area All Races White Black Hispanic‡§
United States 15.2 ( 15.0- 15.3) 14.7 ( 14.5- 14.9) 21.2 ( 20.5- 21.9) 10.3 ( 9.7- 10.9)
Northeast 15.8 ( 15.4- 16.2) 15.7 ( 15.3- 16.1) 18.4 ( 16.9- 19.9) 10.9 ( 9.4- 12.6)
New England 15.1 ( 14.3- 15.9) 15.1 ( 14.3- 15.9) 15.8 ( 11.7- 20.7) ∼Connecticut 14.4 ( 12.9- 16.0) 13.9 ( 12.4- 15.6) 22.2 ( 14.9- 31.6) ∼Maine 17.8 ( 15.1- 20.8) 17.4 ( 14.8- 20.5) ∼ ∼Massachusetts 15.4 ( 14.2- 16.6) 15.7 ( 14.4- 17.0) 11.2 ( 6.7- 17.5) ∼New Hampshire 12.5 ( 10.1- 15.2) 12.5 ( 10.1- 15.2) ∼ ∼Rhode Island 15.2 ( 12.5- 18.4) 15.5 ( 12.7- 18.9) ∼ ∼Vermont 15.8 ( 12.0- 20.3) 15.9 ( 12.1- 20.5) ∼ ∼
Middle Atlantic 16.1 ( 15.6- 16.6) 15.9 ( 15.4- 16.5) 18.7 ( 17.1- 20.3) 11.7 ( 10.1- 13.6)
New Jersey 16.2 ( 15.1- 17.3) 16.2 ( 15.1- 17.4) 18.6 ( 15.2- 22.5) 8.8 ( 6.0- 12.3)
New York 15.7 ( 15.0- 16.4) 15.5 ( 14.7- 16.3) 18.0 ( 16.0- 20.2) 12.8 ( 10.8- 15.2)
Pennsylvania 16.5 ( 15.7- 17.4) 16.4 ( 15.5- 17.3) 20.1 ( 16.8- 23.8) ∼Midwest 15.8 ( 15.4- 16.1) 15.3 ( 14.9- 15.7) 22.2 ( 20.5- 24.0) 9.5 ( 7.1- 12.3)
East North Central 16.0 ( 15.6- 16.5) 15.5 ( 15.0- 16.0) 21.9 ( 20.1- 23.8) 8.6 ( 6.2- 11.6)
Illinois 16.8 ( 15.9- 17.8) 16.0 ( 15.0- 17.0) 25.1 ( 21.9- 28.7) 6.6 ( 3.8- 10.3)
Indiana 16.8 ( 15.5- 18.2) 16.3 ( 15.0- 17.7) 24.9 ( 18.8- 32.2) ∼Michigan 15.1 ( 14.1- 16.1) 14.6 ( 13.6- 15.6) 19.6 ( 16.3- 23.3) ∼Ohio 16.4 ( 15.5- 17.4) 16.1 ( 15.1- 17.1) 20.6 ( 17.2- 24.4) ∼Wisconsin 14.1 ( 12.9- 15.4) 14.2 ( 12.9- 15.5) ∼ ∼
West North Central 15.1 ( 14.4- 15.8) 14.9 ( 14.2- 15.6) 23.7 ( 19.3- 28.7) 12.8 ( 7.1- 20.6)
Iowa 15.5 ( 13.8- 17.3) 15.6 ( 13.9- 17.5) ∼ ∼Kansas 15.2 ( 13.4- 17.2) 14.7 ( 12.9- 16.7) 31.6 ( 19.2- 48.5) ∼Minnesota 13.7 ( 12.4- 15.1) 13.6 ( 12.3- 15.1) ∼ ∼Missouri 16.0 ( 14.7- 17.4) 15.4 ( 14.1- 16.8) 24.9 ( 19.5- 31.3) ∼Nebraska 16.4 ( 14.1- 18.9) 16.4 ( 14.1- 19.1) ∼ ∼North Dakota 12.9 ( 9.9- 16.8) 13.2 ( 10.1- 17.1) ∼ ∼South Dakota 14.6 ( 11.5- 18.3) 15.1 ( 11.9- 19.0) ∼ ∼
South 15.3 ( 15.0- 15.6) 14.3 ( 14.0- 14.6) 21.8 ( 20.8- 22.8) 10.7 ( 9.8- 11.8)
South Atlantic 14.9 ( 14.5- 15.3) 13.8 ( 13.3- 14.2) 21.1 ( 19.9- 22.4) 10.2 ( 8.8- 11.8)
Delaware 15.1 ( 11.9- 19.0) 14.8 ( 11.4- 19.1) ∼ ∼District of Columbia 17.9 ( 13.7- 23.1) ∼ 22.9 ( 17.1- 30.2) ∼Florida 13.9 ( 13.2- 14.6) 13.4 ( 12.7- 14.1) 19.8 ( 17.2- 22.8) 11.5 ( 9.8- 13.3)
Georgia 15.4 ( 14.3- 16.6) 13.5 ( 12.2- 14.8) 22.4 ( 19.5- 25.6) ∼Maryland 15.9 ( 14.5- 17.3) 14.4 ( 12.9- 16.0) 21.6 ( 18.2- 25.5) ∼North Carolina 15.6 ( 14.5- 16.7) 14.0 ( 12.9- 15.3) 22.4 ( 19.3- 25.7) ∼South Carolina 14.7 ( 13.2- 16.3) 13.9 ( 12.2- 15.7) 17.6 ( 14.4- 21.4) ∼Virginia 14.4 ( 13.3- 15.6) 13.2 ( 12.0- 14.5) 21.4 ( 18.0- 25.2) ∼West Virginia 18.4 ( 16.1- 20.9) 18.0 ( 15.7- 20.6) ∼ ∼
East South Central 16.8 ( 16.0- 17.6) 15.5 ( 14.7- 16.4) 24.2 ( 21.8- 26.7) ∼Alabama 15.2 ( 13.8- 16.7) 13.4 ( 11.9- 15.0) 22.4 ( 18.7- 26.6) ∼Kentucky 18.3 ( 16.7- 20.1) 18.1 ( 16.4- 19.9) 24.6 ( 17.0- 34.3) ∼Mississippi 17.6 ( 15.6- 19.7) 14.3 ( 12.2- 16.6) 24.9 ( 20.5- 29.9) ∼Tennessee 16.7 ( 15.4- 18.1) 15.6 ( 14.2- 17.1) 25.7 ( 21.0- 31.1) ∼
West South Central 15.2 ( 14.6- 15.8) 14.5 ( 13.9- 15.2) 21.6 ( 19.6- 23.8) 11.2 ( 9.8- 12.7)
Arkansas 16.6 ( 14.8- 18.7) 15.8 ( 13.9- 18.0) 25.0 ( 18.4- 33.2) ∼

Cancer Incidence and M
ortality, by U.S. C
ensus Region and D
i�ision, State, and Metropolitan A
rea
��
Table 2.6.1.2F: Colon and Rectum. Age-Adjusted Cancer Death Rates∗ and 95% Confidence Intervals, byU.S. Census Region and Division, State, and Race and Ethnicity, United States† (continued)
Females, 2004
Area All Races White Black Hispanic‡§
Louisiana 18.0 ( 16.4- 19.8) 16.4 ( 14.6- 18.4) 23.4 ( 19.8- 27.5) ∼Oklahoma 15.9 ( 14.2- 17.7) 15.8 ( 14.0- 17.7) 20.7 ( 12.9- 31.2) ∼Texas 14.2 ( 13.5- 15.0) 13.7 ( 13.0- 14.5) 20.1 ( 17.4- 23.1) 11.5 ( 10.1- 13.1)
West 13.5 ( 13.1- 13.9) 13.4 ( 13.0- 13.8) 21.4 ( 19.0- 24.0) 9.7 ( 8.8- 10.8)
Mountain 13.1 ( 12.4- 13.9) 13.2 ( 12.5- 14.0) 15.1 ( 10.2- 21.3) 12.2 ( 10.1- 14.6)
Arizona 12.5 ( 11.3- 13.8) 12.7 ( 11.5- 14.1) ∼ 10.2 ( 7.0- 14.2)
Colorado 14.0 ( 12.4- 15.6) 14.0 ( 12.4- 15.7) ∼ 14.1 ( 9.3- 20.1)
Idaho 12.6 ( 10.2- 15.5) 12.7 ( 10.3- 15.6) ∼ ∼Montana 11.4 ( 8.9- 14.6) 11.7 ( 9.0- 15.0) ∼ ∼Nevada 18.5 ( 16.1- 21.2) 18.6 ( 16.0- 21.5) ∼ ∼New Mexico 11.8 ( 9.8- 14.1) 12.1 ( 10.0- 14.5) ∼ 11.9 ( 8.4- 16.2)
Utah 9.7 ( 7.8- 11.8) 9.7 ( 7.8- 11.9) ∼ ∼Wyoming 13.2 ( 9.2- 18.2) 13.4 ( 9.4- 18.6) ∼ ∼
Pacific 13.6 ( 13.2- 14.1) 13.5 ( 13.0- 14.0) 22.6 ( 19.9- 25.5) 8.9 ( 7.9- 10.1)
Alaska 12.7 ( 8.0- 18.9) ∼ ∼ ∼California 13.7 ( 13.2- 14.3) 13.4 ( 12.9- 14.0) 23.0 ( 20.2- 26.2) 8.9 ( 7.9- 10.1)
Hawaii 9.4 ( 7.4- 11.8) 10.0 ( 6.0- 15.9) ∼ ∼Oregon 13.7 ( 12.2- 15.4) 14.0 ( 12.4- 15.7) ∼ ∼Washington 14.3 ( 13.0- 15.6) 13.9 ( 12.6- 15.3) ∼ ∼
∗ Rates are per 100,000 persons and are age-adjusted to the 2000 U.S. standard population (19 age groups - Census P25-1130).† Data are from the National Vital Statistics System (NVSS).‡ Data for specified racial or ethnic populations other than white and black should be interpreted with caution. See Technical Notes.
§ Hispanic origin is not mutually exclusive from race categories (white, black).
∼ Rates are suppressed if fewer than 16 cases were reported in a specific category (area, race, ethnicity).
Note: U.S. rates are as presented in Table 1.1.1.2F.

United
States Cancer Statistics: 2004 Incid
ence and M
ortality
�0
continued
Table 2.7.1.1: Corpus and Uterus, NOS. Age-Adjusted Invasive Cancer Incidence Rates∗ and 95% ConfidenceIntervals, by U.S. Census Region and Division, State and Metropolitan Area, and Race and Ethnicity, UnitedStates†‡
Females, 2004
Area All Races White Black Hispanic§
United States 23.1 ( 22.8- 23.3) 23.4 ( 23.1- 23.7) 20.4 ( 19.7- 21.1) 18.8 ( 18.0- 19.5)
Northeast 28.6 ( 28.0- 29.2) 29.3 ( 28.6- 29.9) 22.9 ( 21.3- 24.6) 23.0 ( 20.9- 25.1)
New England 28.2 ( 27.1- 29.4) 28.2 ( 27.0- 29.4) 20.4 ( 15.9- 25.7) 23.6 ( 18.2- 29.9)
Connecticut 26.9 ( 24.7- 29.2) 27.3 ( 25.0- 29.9) 21.2 ( 14.5- 29.8) 20.1 ( 13.1- 29.7)
Maine 26.9 ( 23.5- 30.7) 27.3 ( 23.8- 31.1) ∼ ∼Massachusetts 29.3 ( 27.6- 31.1) 29.8 ( 28.0- 31.7) 20.3 ( 14.0- 28.4) 24.7 ( 16.8- 34.9)
New Hampshire 28.4 ( 24.7- 32.6) 28.5 ( 24.8- 32.7) ∼ ∼Rhode Island 27.4 ( 23.4- 31.8) 21.8 ( 18.2- 26.0) ∼ ∼Vermont 30.2 ( 24.8- 36.3) 30.5 ( 25.2- 36.8) ∼ ∼
Middle Atlantic 28.7 ( 28.0- 29.4) 29.6 ( 28.9- 30.4) 23.2 ( 21.5- 25.0) 22.7 ( 20.5- 25.0)
New Jersey 27.5 ( 26.1- 29.0) 29.1 ( 27.5- 30.8) 19.4 ( 16.0- 23.4) 20.8 ( 16.7- 25.6)
New York 28.6 ( 27.6- 29.6) 29.5 ( 28.4- 30.7) 24.7 ( 22.4- 27.1) 22.2 ( 19.6- 25.1)
Pennsylvania 29.7 ( 28.5- 30.9) 30.2 ( 29.0- 31.6) 22.7 ( 19.1- 26.6) -
Midwest 25.6 ( 25.1- 26.1) 25.8 ( 25.2- 26.3) 19.8 ( 18.2- 21.5) 20.2 ( 17.3- 23.5)
East North Central 25.4 ( 24.7- 26.0) 25.5 ( 24.8- 26.2) 20.1 ( 18.4- 21.9) 22.5 ( 19.0- 26.4)
Illinois 24.9 ( 23.7- 26.1) 25.4 ( 24.1- 26.8) 20.2 ( 17.3- 23.3) 22.4 ( 18.0- 27.5)
Indiana 24.9 ( 23.3- 26.6) 24.9 ( 23.2- 26.7) 19.8 ( 14.4- 26.3) ∼Michigan 25.7 ( 24.4- 27.1) 26.3 ( 24.8- 27.7) 20.7 ( 17.4- 24.4) 24.7 ( 15.3- 37.3)
Detroit 26.8 ( 24.7- 29.1) 28.7 ( 26.1- 31.3) 21.8 ( 17.9- 26.3) 50.8 ( 29.7- 79.9)
Ohio 25.8 ( 24.6- 27.0) 25.4 ( 24.1- 26.7) 18.0 ( 14.8- 21.5) ∼Wisconsin 25.4 ( 23.7- 27.3) 25.2 ( 23.4- 27.1) 32.5 ( 22.1- 45.9) ∼
West North Central 26.2 ( 25.2- 27.2) 26.4 ( 25.4- 27.4) 18.2 ( 14.5- 22.5) 10.8 ( 6.5- 16.8)
Iowa 28.1 ( 25.6- 30.7) 28.4 ( 25.9- 31.1) ∼ ∼Kansas 23.9 ( 21.5- 26.5) 24.2 ( 21.7- 26.9) ∼ ∼Minnesota 28.4 ( 26.5- 30.5) 27.6 ( 25.6- 29.7) ∼ ∼Missouri 24.1 ( 22.5- 25.8) 24.8 ( 23.1- 26.7) 18.3 ( 13.8- 23.9) ∼Nebraska 29.0 ( 25.7- 32.6) 29.3 ( 25.9- 33.0) ∼ ∼North Dakota 27.1 ( 22.0- 33.0) 27.1 ( 21.9- 33.3) ∼ ∼South Dakota 22.2 ( 17.9- 27.2) 22.7 ( 18.3- 28.0) ∼ ∼
South 19.3 ( 18.9- 19.6) 19.3 ( 18.8- 19.7) 19.9 ( 18.9- 20.9) 18.2 ( 16.9- 19.4)
South Atlantic 20.2 ( 19.7- 20.7) 20.1 ( 19.6- 20.7) 21.1 ( 19.8- 22.4) 21.0 ( 18.9- 23.2)
Delaware 25.0 ( 20.7- 29.9) 25.6 ( 20.9- 31.2) 25.3 ( 14.9- 39.9) ∼District of Columbia 28.1 ( 22.5- 34.7) ∼ 31.1 ( 23.9- 39.9) ∼Florida 19.7 ( 18.9- 20.6) 19.6 ( 18.7- 20.5) 22.2 ( 19.5- 25.2) -
Georgia 17.1 ( 15.9- 18.4) 16.7 ( 15.3- 18.1) 18.6 ( 16.0- 21.5) 17.7 ( 10.0- 28.7)
Atlanta 18.6 ( 16.4- 21.1) 19.9 ( 17.1- 23.1) 16.2 ( 12.4- 20.7) ∼Maryland
North Carolina 20.9 ( 19.6- 22.2) 21.0 ( 19.5- 22.5) 21.2 ( 18.3- 24.5) ∼South Carolina 18.4 ( 16.7- 20.2) 16.4 ( 14.5- 18.4) 24.9 ( 21.0- 29.3) -
Virginia 21.7 ( 20.3- 23.1) 22.9 ( 21.3- 24.6) 16.9 ( 14.0- 20.3) 16.7 ( 9.0- 27.8)
West Virginia 28.4 ( 25.3- 31.7) 28.2 ( 25.1- 31.6) ∼ ∼East South Central 19.2 ( 18.4- 20.1) 19.3 ( 18.3- 20.3) 19.3 ( 17.2- 21.6) ∼Alabama 16.8 ( 15.3- 18.5) 16.4 ( 14.7- 18.3) 19.6 ( 16.2- 23.6) ∼Kentucky 23.9 ( 21.9- 25.9) 23.9 ( 21.8- 26.0) 20.0 ( 13.3- 28.8) -
Mississippi 18.2 ( 16.2- 20.4) 16.9 ( 14.6- 19.6) 21.8 ( 17.7- 26.6) ∼Tennessee 18.3 ( 16.9- 19.8) 18.7 ( 17.1- 20.3) 15.8 ( 12.3- 20.0) ∼

Cancer Incidence and M
ortality, by U.S. C
ensus Region and D
i�ision, State, and Metropolitan A
rea
��
Table 2.7.1.1: Corpus and Uterus, NOS. Age-Adjusted Invasive Cancer Incidence Rates∗ and 95% ConfidenceIntervals, by U.S. Census Region and Division, State and Metropolitan Area, and Race and Ethnicity, UnitedStates†‡ (continued)
Females, 2004
Area All Races White Black Hispanic§
West South Central 17.7 ( 17.0- 18.3) 17.7 ( 17.0- 18.4) 17.5 ( 15.7- 19.5) 16.0 ( 14.5- 17.6)
Arkansas 15.8 ( 14.0- 17.9) 15.8 ( 13.8- 18.1) 15.1 ( 10.0- 21.8) ∼Louisiana 16.8 ( 15.2- 18.5) 16.9 ( 15.0- 19.0) 17.7 ( 14.6- 21.2) ∼Oklahoma 18.2 ( 16.4- 20.2) 18.1 ( 16.1- 20.2) 17.0 ( 10.0- 26.7) ∼Texas 18.0 ( 17.2- 18.8) 18.0 ( 17.2- 18.9) 17.9 ( 15.4- 20.7) 16.1 ( 14.6- 17.8)
West 21.4 ( 20.9- 21.9) 21.8 ( 21.2- 22.3) 18.5 ( 16.4- 20.9) 17.2 ( 16.0- 18.4)
Mountain 19.7 ( 18.9- 20.6) 19.9 ( 19.0- 20.8) 12.8 ( 8.7- 18.2) 15.8 ( 13.6- 18.2)
Arizona 18.6 ( 17.1- 20.2) 18.4 ( 16.8- 20.1) ∼ 12.7 ( 9.5- 16.5)
Colorado 20.4 ( 18.6- 22.4) 20.4 ( 18.5- 22.5) ∼ 14.8 ( 10.4- 20.5)
Idaho 22.0 ( 18.6- 25.7) 22.1 ( 18.7- 25.9) ∼ ∼Montana 23.7 ( 19.8- 28.1) 23.4 ( 19.5- 28.0) ∼ ∼Nevada 18.2 ( 15.9- 20.8) 19.3 ( 16.7- 22.2) ∼ 12.8 ( 7.0- 21.3)
New Mexico 19.2 ( 16.6- 22.0) 19.9 ( 17.1- 23.0) ∼ 19.3 ( 15.0- 24.5)
Utah 21.7 ( 18.9- 24.9) 22.2 ( 19.2- 25.4) ∼ ∼Wyoming 15.9 ( 11.6- 21.4) 15.5 ( 11.3- 21.0) ∼ ∼
Pacific 22.2 ( 21.6- 22.8) 22.7 ( 22.0- 23.4) 19.7 ( 17.2- 22.3) 17.6 ( 16.3- 19.0)
Alaska 22.9 ( 17.3- 29.7) 26.6 ( 19.6- 35.3) ∼ ∼California 21.0 ( 20.4- 21.7) 21.8 ( 21.1- 22.6) 19.9 ( 17.3- 22.7) 17.6 ( 16.3- 19.1)
San Francisco-Oakland 23.2 ( 21.3- 25.3) 24.8 ( 22.4- 27.4) 18.1 ( 12.8- 24.7) 18.0 ( 13.0- 24.1)
San Jose-Monterey 19.7 ( 17.2- 22.4) 22.0 ( 19.0- 25.4) ∼ 14.0 ( 9.2- 20.1)
Los Angeles 21.3 ( 20.0- 22.7) 22.6 ( 21.0- 24.2) 20.3 ( 16.6- 24.6) 18.5 ( 16.3- 20.8)
Hawaii 26.9 ( 23.2- 31.0) 21.0 ( 14.8- 29.1) ∼ ∼Oregon 25.3 ( 23.2- 27.6) 24.8 ( 22.6- 27.1) ∼ ∼Washington 25.6 ( 23.9- 27.4) 25.4 ( 23.6- 27.3) ∼ 17.6 ( 9.7- 28.6)
Seattle-Puget Sound 25.2 ( 23.1- 27.3) 26.3 ( 24.1- 28.7) ∼ ∼∗ Rates are per 100,000 persons and are age-adjusted to the 2000 U.S. standard population (19 age groups - Census P25-1130).† Data are from all state and metropolitan area cancer registries, except Maryland. Included data cover approximately 98% of the population and met data
quality criteria for all invasive cancer sites combined. See Appendix B for registry-specific data quality information.‡ Invasive cancers only.
§ Data for specified racial or ethnic populations other than white and black should be interpreted with caution. See Technical Notes.
Hispanic origin is not mutually exclusive from race categories (white, black).
∼ Rates are suppressed if fewer than 16 cases were reported in a specific category (area, race, ethnicity).
- Rates are suppressed at the state’s or metropolitan area’s request. See Technical Notes.
Notes: Cases from suppressed rates are included in the U.S. and region/division rates. U.S. rates are as presented in Table 1.1.1.1F. Michigan, Georgia,
California, and Washington state rates each include cases from the SEER metropolitan areas.

United
States Cancer Statistics: 2004 Incid
ence and M
ortality
��
continued
Table 2.7.1.2: Corpus and Uterus, NOS. Age-Adjusted Cancer Death Rates∗ and 95% Confidence Intervals,by U.S. Census Region and Division, State, and Race and Ethnicity, United States†
Females, 2004
Area All Races White Black Hispanic‡§
United States 4.1 ( 4.0- 4.2) 3.9 ( 3.8- 4.0) 7.0 ( 6.6- 7.4) 2.9 ( 2.6- 3.2)
Northeast 4.7 ( 4.5- 5.0) 4.6 ( 4.3- 4.8) 7.1 ( 6.2- 8.0) 3.2 ( 2.4- 4.1)
New England 4.5 ( 4.1- 5.0) 4.5 ( 4.1- 5.0) 6.0 ( 3.6- 9.3) ∼Connecticut 4.6 ( 3.8- 5.6) 4.5 ( 3.6- 5.5) ∼ ∼Maine 5.0 ( 3.6- 6.8) 5.1 ( 3.6- 6.9) ∼ ∼Massachusetts 4.3 ( 3.6- 5.0) 4.4 ( 3.7- 5.1) ∼ ∼New Hampshire 4.2 ( 2.8- 6.0) 4.2 ( 2.9- 6.0) ∼ ∼Rhode Island 4.6 ( 3.1- 6.5) 4.2 ( 2.8- 6.2) ∼ ∼Vermont 5.7 ( 3.6- 8.7) 5.7 ( 3.6- 8.7) ∼ ∼
Middle Atlantic 4.8 ( 4.5- 5.1) 4.6 ( 4.3- 4.9) 7.2 ( 6.2- 8.2) 3.3 ( 2.5- 4.3)
New Jersey 4.9 ( 4.3- 5.6) 4.9 ( 4.2- 5.6) 6.5 ( 4.5- 8.9) ∼New York 4.7 ( 4.3- 5.1) 4.4 ( 4.0- 4.8) 7.6 ( 6.3- 9.0) 3.2 ( 2.2- 4.4)
Pennsylvania 4.8 ( 4.4- 5.3) 4.6 ( 4.2- 5.2) 7.0 ( 5.1- 9.4) ∼Midwest 4.5 ( 4.3- 4.7) 4.2 ( 4.0- 4.5) 7.4 ( 6.4- 8.4) 3.2 ( 2.0- 4.8)
East North Central 4.5 ( 4.2- 4.7) 4.2 ( 3.9- 4.4) 7.5 ( 6.5- 8.7) 3.3 ( 1.9- 5.1)
Illinois 4.4 ( 3.9- 4.9) 3.8 ( 3.3- 4.4) 8.7 ( 6.8- 10.9) ∼Indiana 5.0 ( 4.3- 5.8) 4.9 ( 4.2- 5.7) ∼ ∼Michigan 4.6 ( 4.0- 5.1) 4.3 ( 3.7- 4.9) 6.3 ( 4.5- 8.6) ∼Ohio 4.6 ( 4.1- 5.1) 4.4 ( 3.9- 4.9) 6.5 ( 4.7- 8.8) ∼Wisconsin 3.8 ( 3.1- 4.5) 3.5 ( 2.8- 4.2) ∼ ∼
West North Central 4.5 ( 4.1- 4.9) 4.4 ( 4.0- 4.8) 6.6 ( 4.4- 9.5) ∼Iowa 4.5 ( 3.6- 5.5) 4.5 ( 3.6- 5.6) ∼ ∼Kansas 4.1 ( 3.1- 5.2) 4.3 ( 3.3- 5.5) ∼ ∼Minnesota 4.7 ( 3.9- 5.5) 4.6 ( 3.9- 5.5) ∼ ∼Missouri 4.4 ( 3.7- 5.1) 4.0 ( 3.3- 4.8) 8.6 ( 5.5- 12.7) ∼Nebraska 5.4 ( 4.0- 7.0) 5.5 ( 4.2- 7.2) ∼ ∼North Dakota 4.3 ( 2.6- 6.8) 4.3 ( 2.6- 6.9) ∼ ∼South Dakota 3.9 ( 2.3- 6.2) 3.9 ( 2.3- 6.4) ∼ ∼
South 3.8 ( 3.7- 4.0) 3.4 ( 3.2- 3.5) 6.8 ( 6.2- 7.4) 2.9 ( 2.4- 3.5)
South Atlantic 4.0 ( 3.8- 4.2) 3.5 ( 3.2- 3.7) 7.2 ( 6.5- 8.0) 2.6 ( 2.0- 3.5)
Delaware 5.7 ( 3.8- 8.3) 4.8 ( 2.9- 7.6) ∼ ∼District of Columbia 5.7 ( 3.4- 9.1) ∼ 7.1 ( 4.0- 11.8) ∼Florida 3.4 ( 3.1- 3.8) 3.0 ( 2.7- 3.4) 7.9 ( 6.3- 9.8) 2.6 ( 1.9- 3.6)
Georgia 3.8 ( 3.2- 4.4) 3.2 ( 2.6- 3.9) 6.1 ( 4.6- 8.0) ∼Maryland 4.8 ( 4.1- 5.7) 4.0 ( 3.2- 4.9) 7.9 ( 5.9- 10.3) ∼North Carolina 4.0 ( 3.4- 4.6) 3.6 ( 3.0- 4.3) 6.1 ( 4.5- 8.0) ∼South Carolina 4.7 ( 3.9- 5.7) 3.2 ( 2.4- 4.2) 9.5 ( 7.1- 12.5) ∼Virginia 4.3 ( 3.6- 4.9) 3.9 ( 3.3- 4.7) 6.3 ( 4.5- 8.4) ∼West Virginia 4.9 ( 3.8- 6.4) 5.1 ( 3.9- 6.6) ∼ ∼
East South Central 3.6 ( 3.2- 4.0) 3.2 ( 2.8- 3.6) 6.0 ( 4.8- 7.3) ∼Alabama 3.7 ( 3.0- 4.4) 3.3 ( 2.6- 4.2) 5.2 ( 3.5- 7.4) ∼Kentucky 3.5 ( 2.8- 4.3) 3.6 ( 2.9- 4.5) ∼ ∼Mississippi 3.9 ( 3.0- 5.0) 2.8 ( 1.9- 3.9) 7.2 ( 4.9- 10.1) ∼Tennessee 3.4 ( 2.8- 4.1) 2.9 ( 2.3- 3.6) 6.9 ( 4.5- 9.9) ∼
West South Central 3.6 ( 3.3- 3.9) 3.3 ( 3.0- 3.6) 6.4 ( 5.3- 7.6) 3.1 ( 2.4- 3.9)
Arkansas 3.5 ( 2.7- 4.6) 3.2 ( 2.4- 4.3) ∼ ∼

Cancer Incidence and M
ortality, by U.S. C
ensus Region and D
i�ision, State, and Metropolitan A
rea
�3
Table 2.7.1.2: Corpus and Uterus, NOS. Age-Adjusted Cancer Death Rates∗ and 95% Confidence Intervals,by U.S. Census Region and Division, State, and Race and Ethnicity, United States† (continued)
Females, 2004
Area All Races White Black Hispanic‡§
Louisiana 3.8 ( 3.1- 4.7) 2.7 ( 2.0- 3.6) 7.4 ( 5.4- 9.8) ∼Oklahoma 4.0 ( 3.2- 5.0) 4.1 ( 3.2- 5.1) ∼ ∼Texas 3.5 ( 3.1- 3.9) 3.3 ( 2.9- 3.7) 5.9 ( 4.4- 7.6) 3.2 ( 2.5- 4.0)
West 3.6 ( 3.4- 3.8) 3.6 ( 3.4- 3.8) 7.0 ( 5.7- 8.6) 2.7 ( 2.2- 3.2)
Mountain 3.2 ( 2.8- 3.6) 3.1 ( 2.8- 3.5) ∼ 2.3 ( 1.4- 3.3)
Arizona 3.1 ( 2.5- 3.8) 2.9 ( 2.3- 3.6) ∼ ∼Colorado 3.1 ( 2.4- 3.9) 2.9 ( 2.2- 3.8) ∼ ∼Idaho 2.5 ( 1.5- 4.0) 2.4 ( 1.4- 3.9) ∼ ∼Montana 5.3 ( 3.5- 7.6) 5.3 ( 3.5- 7.7) ∼ ∼Nevada 2.3 ( 1.5- 3.3) 2.4 ( 1.5- 3.6) ∼ ∼New Mexico 3.5 ( 2.5- 4.9) 3.7 ( 2.6- 5.2) ∼ ∼Utah 4.0 ( 2.8- 5.4) 4.0 ( 2.8- 5.5) ∼ ∼Wyoming ∼ ∼ ∼ ∼
Pacific 3.8 ( 3.6- 4.1) 3.8 ( 3.5- 4.1) 7.3 ( 5.8- 9.0) 2.8 ( 2.2- 3.4)
Alaska ∼ ∼ ∼ ∼California 3.8 ( 3.5- 4.1) 3.7 ( 3.4- 4.1) 7.3 ( 5.7- 9.1) 2.7 ( 2.2- 3.3)
Hawaii 3.4 ( 2.2- 5.0) ∼ ∼ ∼Oregon 3.6 ( 2.8- 4.5) 3.7 ( 2.9- 4.6) ∼ ∼Washington 4.3 ( 3.6- 5.1) 4.3 ( 3.6- 5.1) ∼ ∼
∗ Rates are per 100,000 persons and are age-adjusted to the 2000 U.S. standard population (19 age groups - Census P25-1130).† Data are from the National Vital Statistics System (NVSS).‡ Data for specified racial or ethnic populations other than white and black should be interpreted with caution. See Technical Notes.
§ Hispanic origin is not mutually exclusive from race categories (white, black).
∼ Rates are suppressed if fewer than 16 cases were reported in a specific category (area, race, ethnicity).
Note: U.S. rates are as presented in Table 1.1.1.2F.

United
States Cancer Statistics: 2004 Incid
ence and M
ortality
��
continued
Table 2.8.1.1M: Esophagus. Age-Adjusted Invasive Cancer Incidence Rates∗ and 95% Confidence Intervals, byU.S. Census Region and Division, State and Metropolitan Area, and Race and Ethnicity, United States†‡
Males, 2004
Area All Races White Black Hispanic§
United States 8.7 ( 8.5- 8.9) 8.6 ( 8.4- 8.8) 10.2 ( 9.6- 10.9) 5.7 ( 5.1- 6.2)
Northeast 9.8 ( 9.4- 10.2) 9.9 ( 9.5- 10.3) 9.8 ( 8.5- 11.2) 8.0 ( 6.5- 9.7)
New England 11.3 ( 10.5- 12.2) 11.4 ( 10.6- 12.2) 12.2 ( 8.0- 17.6) ∼Connecticut 10.5 ( 9.0- 12.2) 10.2 ( 8.6- 11.9) 17.2 ( 9.9- 27.4) ∼Maine 13.0 ( 10.5- 16.0) 13.0 ( 10.5- 16.0) ∼ ∼Massachusetts 12.2 ( 11.0- 13.5) 12.4 ( 11.2- 13.8) ∼ ∼New Hampshire 10.2 ( 7.7- 13.1) 10.2 ( 7.7- 13.2) ∼ ∼Rhode Island 10.3 ( 7.7- 13.5) 10.6 ( 7.9- 14.0) ∼ ∼Vermont 7.6 ( 4.8- 11.5) 7.7 ( 4.8- 11.6) ∼ ∼
Middle Atlantic 9.2 ( 8.8- 9.7) 9.3 ( 8.8- 9.8) 9.5 ( 8.1- 11.0) 8.5 ( 6.8- 10.4)
New Jersey 9.2 ( 8.3- 10.2) 9.2 ( 8.2- 10.3) 10.6 ( 7.6- 14.2) 9.4 ( 6.0- 13.8)
New York 8.6 ( 8.0- 9.2) 8.6 ( 7.9- 9.3) 9.2 ( 7.4- 11.2) 8.0 ( 6.1- 10.3)
Pennsylvania 10.1 ( 9.3- 10.9) 10.3 ( 9.4- 11.1) 8.9 ( 6.2- 12.3) -
Midwest 9.5 ( 9.1- 9.8) 9.3 ( 8.9- 9.6) 10.1 ( 8.8- 11.6) 4.6 ( 3.1- 6.5)
East North Central 9.8 ( 9.3- 10.2) 9.5 ( 9.1- 10.0) 10.2 ( 8.8- 11.8) 4.9 ( 3.1- 7.1)
Illinois 9.3 ( 8.5- 10.2) 9.3 ( 8.5- 10.2) 10.4 ( 8.0- 13.3) ∼Indiana 8.9 ( 7.8- 10.1) 9.0 ( 7.9- 10.3) ∼ ∼Michigan 10.0 ( 9.1- 11.0) 9.9 ( 8.9- 10.9) 10.5 ( 7.8- 13.9) ∼
Detroit 9.3 ( 7.9- 10.9) 9.2 ( 7.7- 11.0) 10.2 ( 7.1- 14.2) ∼Ohio 10.2 ( 9.4- 11.1) 9.6 ( 8.8- 10.6) 9.6 ( 6.9- 13.0) ∼Wisconsin 10.2 ( 9.0- 11.5) 9.8 ( 8.6- 11.1) 19.2 ( 10.1- 32.6) ∼
West North Central 8.8 ( 8.2- 9.4) 8.7 ( 8.1- 9.3) 9.9 ( 6.7- 14.0) ∼Iowa 9.5 ( 8.0- 11.2) 9.4 ( 7.9- 11.1) ∼ ∼Kansas 5.9 ( 4.6- 7.4) 5.9 ( 4.6- 7.4) ∼ ∼Minnesota 8.7 ( 7.5- 10.0) 8.6 ( 7.4- 9.9) ∼ ∼Missouri 9.5 ( 8.4- 10.8) 9.4 ( 8.2- 10.7) 11.5 ( 7.3- 17.1) ∼Nebraska 9.7 ( 7.7- 12.1) 9.7 ( 7.6- 12.1) ∼ ∼North Dakota 6.1 ( 3.7- 9.5) 5.7 ( 3.3- 9.0) ∼ ∼South Dakota 10.6 ( 7.6- 14.5) 10.3 ( 7.3- 14.3) ∼ ∼
South 8.2 ( 7.9- 8.4) 7.7 ( 7.5- 8.0) 11.1 ( 10.3- 12.0) 4.6 ( 3.9- 5.5)
South Atlantic 8.5 ( 8.1- 8.9) 8.0 ( 7.6- 8.4) 11.5 ( 10.4- 12.8) 3.5 ( 2.6- 4.6)
Delaware 10.2 ( 7.3- 13.8) 10.8 ( 7.6- 15.0) ∼ ∼District of Columbia 13.4 ( 9.2- 18.9) ∼ 18.9 ( 12.6- 27.4) ∼Florida 8.4 ( 7.8- 9.0) 8.3 ( 7.7- 9.0) 9.5 ( 7.4- 12.0) -
Georgia 8.7 ( 7.7- 9.8) 7.7 ( 6.6- 8.9) 12.9 ( 10.2- 16.0) ∼Atlanta 6.5 ( 5.0- 8.3) 6.6 ( 4.8- 8.8) 6.2 ( 3.5- 10.0) ∼
Maryland
North Carolina 8.1 ( 7.3- 9.1) 7.8 ( 6.8- 8.8) 10.1 ( 7.7- 13.0) ∼South Carolina 9.3 ( 8.0- 10.8) 7.4 ( 6.1- 8.9) 16.6 ( 12.8- 21.2) -
Virginia 8.0 ( 7.0- 9.0) 7.9 ( 6.9- 9.1) 8.9 ( 6.5- 11.8) ∼West Virginia 8.1 ( 6.4- 10.2) 8.0 ( 6.2- 10.1) ∼ ∼
East South Central 8.5 ( 7.8- 9.1) 7.7 ( 7.1- 8.4) 12.2 ( 10.2- 14.5) ∼Alabama 8.8 ( 7.6- 10.2) 7.8 ( 6.5- 9.3) 12.5 ( 9.1- 16.6) ∼Kentucky 8.6 ( 7.3- 10.0) 8.7 ( 7.3- 10.1) ∼ -
Mississippi 9.9 ( 8.3- 11.8) 7.8 ( 6.1- 9.8) 15.2 ( 11.3- 20.0) ∼Tennessee 7.4 ( 6.4- 8.5) 7.0 ( 6.0- 8.1) 9.8 ( 6.6- 14.0) ∼

Cancer Incidence and M
ortality, by U.S. C
ensus Region and D
i�ision, State, and Metropolitan A
rea
��
Table 2.8.1.1M: Esophagus. Age-Adjusted Invasive Cancer Incidence Rates∗ and 95% Confidence Intervals, byU.S. Census Region and Division, State and Metropolitan Area, and Race and Ethnicity, United States†‡(continued)
Males, 2004
Area All Races White Black Hispanic§
West South Central 7.4 ( 6.9- 7.9) 7.2 ( 6.7- 7.7) 9.4 ( 7.8- 11.2) 5.6 ( 4.5- 6.8)
Arkansas 6.7 ( 5.3- 8.2) 6.1 ( 4.8- 7.7) ∼ ∼Louisiana 8.5 ( 7.2- 9.9) 7.8 ( 6.4- 9.4) 10.6 ( 7.8- 14.0) ∼Oklahoma 7.6 ( 6.3- 9.0) 7.7 ( 6.3- 9.3) ∼ ∼Texas 7.2 ( 6.7- 7.8) 7.2 ( 6.6- 7.8) 8.1 ( 6.0- 10.5) 5.7 ( 4.6- 7.0)
West 7.8 ( 7.5- 8.1) 8.1 ( 7.7- 8.5) 6.8 ( 5.2- 8.7) 5.9 ( 5.0- 6.8)
Mountain 7.9 ( 7.3- 8.5) 8.0 ( 7.4- 8.6) ∼ 5.5 ( 4.0- 7.3)
Arizona 7.6 ( 6.6- 8.7) 7.7 ( 6.7- 8.9) ∼ 5.4 ( 2.9- 9.0)
Colorado 8.2 ( 6.9- 9.6) 8.1 ( 6.8- 9.6) ∼ ∼Idaho 8.3 ( 6.2- 11.0) 8.5 ( 6.3- 11.2) ∼ ∼Montana 7.3 ( 5.1- 10.2) 7.4 ( 5.2- 10.4) ∼ ∼Nevada 8.1 ( 6.4- 10.0) 8.1 ( 6.4- 10.2) ∼ ∼New Mexico 9.3 ( 7.4- 11.5) 9.8 ( 7.7- 12.2) ∼ 6.8 ( 4.0- 10.6)
Utah 5.9 ( 4.4- 7.8) 6.0 ( 4.4- 7.9) ∼ ∼Wyoming 10.5 ( 6.7- 15.6) 10.3 ( 6.6- 15.5) ∼ ∼
Pacific 7.7 ( 7.4- 8.2) 8.2 ( 7.7- 8.6) 6.8 ( 5.0- 8.9) 6.1 ( 5.1- 7.2)
Alaska 7.1 ( 4.1- 11.4) ∼ ∼ ∼California 7.2 ( 6.7- 7.6) 7.6 ( 7.1- 8.2) 6.9 ( 5.0- 9.1) 5.9 ( 4.9- 7.1)
San Francisco-Oakland 7.2 ( 6.0- 8.6) 8.1 ( 6.6- 9.9) ∼ ∼San Jose-Monterey 5.7 ( 4.2- 7.5) 6.4 ( 4.7- 8.6) ∼ ∼Los Angeles 6.6 ( 5.8- 7.6) 7.0 ( 6.0- 8.1) 7.3 ( 4.6- 10.9) 5.5 ( 3.9- 7.3)
Hawaii 7.8 ( 5.8- 10.3) 9.0 ( 5.1- 14.9) ∼ ∼Oregon 9.4 ( 8.0- 11.0) 9.2 ( 7.8- 10.8) ∼ ∼Washington 9.7 ( 8.5- 11.0) 9.8 ( 8.5- 11.1) ∼ ∼
Seattle-Puget Sound 9.7 ( 8.3- 11.3) 10.0 ( 8.5- 11.7) ∼ ∼∗ Rates are per 100,000 persons and are age-adjusted to the 2000 U.S. standard population (19 age groups - Census P25-1130).† Data are from all state and metropolitan area cancer registries, except Maryland. Included data cover approximately 98% of the population and met data
quality criteria for all invasive cancer sites combined. See Appendix B for registry-specific data quality information.‡ Invasive cancers only.
§ Data for specified racial or ethnic populations other than white and black should be interpreted with caution. See Technical Notes.
Hispanic origin is not mutually exclusive from race categories (white, black).
∼ Rates are suppressed if fewer than 16 cases were reported in a specific category (area, race, ethnicity).
- Rates are suppressed at the state’s or metropolitan area’s request. See Technical Notes.
Notes: Cases from suppressed rates are included in the U.S. and region/division rates. U.S. rates are as presented in Table 1.1.1.1M. Michigan, Georgia,
California, and Washington state rates each include cases from the SEER metropolitan areas.

United
States Cancer Statistics: 2004 Incid
ence and M
ortality
��
continued
Table 2.8.1.1F: Esophagus. Age-Adjusted Invasive Cancer Incidence Rates∗ and 95% Confidence Intervals, byU.S. Census Region and Division, State and Metropolitan Area, and Race and Ethnicity, United States†‡
Females, 2004
Area All Races White Black Hispanic§
United States 2.0 ( 1.9- 2.1) 1.9 ( 1.8- 2.0) 3.1 ( 2.9- 3.4) 1.4 ( 1.2- 1.7)
Northeast 2.2 ( 2.1- 2.4) 2.1 ( 1.9- 2.3) 3.4 ( 2.8- 4.1) 2.3 ( 1.6- 3.1)
New England 2.4 ( 2.1- 2.7) 2.4 ( 2.1- 2.8) ∼ ∼Connecticut 2.4 ( 1.8- 3.2) 2.4 ( 1.8- 3.2) ∼ ∼Maine 1.8 ( 1.1- 3.1) ∼ ∼ ∼Massachusetts 2.3 ( 1.8- 2.8) 2.4 ( 1.9- 2.9) ∼ ∼New Hampshire 4.1 ( 2.8- 5.9) 4.1 ( 2.7- 5.8) ∼ ∼Rhode Island 2.5 ( 1.4- 4.0) ∼ ∼ ∼Vermont ∼ ∼ ∼ ∼
Middle Atlantic 2.2 ( 2.0- 2.3) 2.0 ( 1.8- 2.2) 3.5 ( 2.8- 4.3) 2.3 ( 1.6- 3.2)
New Jersey 2.0 ( 1.7- 2.5) 1.9 ( 1.5- 2.4) 2.8 ( 1.6- 4.6) ∼New York 2.3 ( 2.0- 2.6) 2.1 ( 1.8- 2.4) 3.8 ( 2.9- 4.8) 1.8 ( 1.1- 2.8)
Pennsylvania 2.0 ( 1.7- 2.4) 1.9 ( 1.6- 2.3) 3.4 ( 2.1- 5.1) -
Midwest 2.2 ( 2.0- 2.3) 2.0 ( 1.9- 2.2) 3.9 ( 3.2- 4.7) ∼East North Central 2.3 ( 2.1- 2.5) 2.1 ( 1.9- 2.3) 3.8 ( 3.0- 4.6) ∼Illinois 2.5 ( 2.1- 2.9) 2.2 ( 1.8- 2.6) 4.6 ( 3.3- 6.3) ∼Indiana 1.8 ( 1.3- 2.3) 1.7 ( 1.3- 2.2) ∼ ∼Michigan 2.6 ( 2.2- 3.1) 2.5 ( 2.1- 3.0) 3.3 ( 2.0- 5.0) ∼
Detroit 3.0 ( 2.3- 3.8) 2.7 ( 2.0- 3.6) 4.2 ( 2.6- 6.4) ∼Ohio 2.2 ( 1.8- 2.5) 1.8 ( 1.5- 2.2) 3.6 ( 2.3- 5.4) ∼Wisconsin 2.4 ( 1.9- 3.1) 2.4 ( 1.9- 3.0) ∼ ∼
West North Central 1.9 ( 1.7- 2.2) 1.8 ( 1.5- 2.1) 4.7 ( 2.9- 7.1) ∼Iowa 1.9 ( 1.4- 2.7) 2.0 ( 1.4- 2.7) ∼ ∼Kansas 1.3 ( 0.8- 2.0) 1.2 ( 0.7- 1.9) ∼ ∼Minnesota 2.3 ( 1.8- 3.0) 2.3 ( 1.8- 3.0) ∼ ∼Missouri 2.0 ( 1.5- 2.5) 1.7 ( 1.3- 2.3) ∼ ∼Nebraska ∼ ∼ ∼ ∼North Dakota ∼ ∼ ∼ ∼South Dakota ∼ ∼ ∼ ∼
South 1.9 ( 1.8- 2.0) 1.8 ( 1.6- 1.9) 2.8 ( 2.5- 3.2) 1.3 ( 0.9- 1.7)
South Atlantic 2.0 ( 1.9- 2.2) 1.8 ( 1.6- 2.0) 3.2 ( 2.7- 3.7) ∼Delaware 3.4 ( 2.0- 5.5) ∼ ∼ ∼District of Columbia ∼ ∼ ∼ ∼Florida 1.9 ( 1.7- 2.2) 1.8 ( 1.6- 2.1) 3.1 ( 2.1- 4.3) -
Georgia 2.2 ( 1.7- 2.7) 1.7 ( 1.3- 2.2) 3.7 ( 2.6- 5.1) ∼Atlanta 3.2 ( 2.2- 4.4) 2.6 ( 1.6- 3.9) 4.5 ( 2.4- 7.3) ∼
Maryland
North Carolina 1.9 ( 1.6- 2.4) 1.8 ( 1.4- 2.3) 2.4 ( 1.5- 3.6) ∼South Carolina 1.7 ( 1.3- 2.4) 1.2 ( 0.8- 1.9) 3.3 ( 2.0- 5.1) -
Virginia 2.2 ( 1.8- 2.7) 2.1 ( 1.6- 2.6) 3.1 ( 1.9- 4.7) ∼West Virginia 2.2 ( 1.4- 3.2) 2.2 ( 1.4- 3.2) ∼ ∼
East South Central 1.8 ( 1.6- 2.1) 1.6 ( 1.4- 1.9) 2.6 ( 1.9- 3.5) ∼Alabama 1.5 ( 1.1- 2.0) 1.4 ( 1.0- 2.0) ∼ ∼Kentucky 2.4 ( 1.8- 3.1) 2.3 ( 1.7- 3.0) ∼ -
Mississippi 1.9 ( 1.3- 2.8) 1.5 ( 0.9- 2.4) ∼ ∼Tennessee 1.6 ( 1.2- 2.1) 1.3 ( 0.9- 1.8) ∼ ∼

Cancer Incidence and M
ortality, by U.S. C
ensus Region and D
i�ision, State, and Metropolitan A
rea
��
Table 2.8.1.1F: Esophagus. Age-Adjusted Invasive Cancer Incidence Rates∗ and 95% Confidence Intervals, byU.S. Census Region and Division, State and Metropolitan Area, and Race and Ethnicity, United States†‡(continued)
Females, 2004
Area All Races White Black Hispanic§
West South Central 1.8 ( 1.6- 2.0) 1.8 ( 1.5- 2.0) 2.3 ( 1.7- 3.1) 1.7 ( 1.2- 2.4)
Arkansas 1.9 ( 1.3- 2.7) 2.0 ( 1.3- 2.8) ∼ ∼Louisiana 2.0 ( 1.5- 2.7) 1.9 ( 1.3- 2.7) 2.4 ( 1.4- 4.0) ∼Oklahoma 1.9 ( 1.4- 2.7) 1.8 ( 1.3- 2.6) ∼ ∼Texas 1.7 ( 1.5- 2.0) 1.7 ( 1.4- 2.0) 2.1 ( 1.3- 3.2) 1.7 ( 1.2- 2.4)
West 1.8 ( 1.7- 2.0) 1.8 ( 1.7- 2.0) 2.5 ( 1.7- 3.5) 1.2 ( 0.9- 1.5)
Mountain 1.6 ( 1.3- 1.8) 1.5 ( 1.3- 1.8) ∼ ∼Arizona 1.5 ( 1.1- 2.0) 1.5 ( 1.1- 2.0) ∼ ∼Colorado 1.6 ( 1.1- 2.3) 1.5 ( 1.0- 2.2) ∼ ∼Idaho ∼ ∼ ∼ ∼Montana ∼ ∼ ∼ ∼Nevada 1.6 ( 1.0- 2.5) 1.6 ( 0.9- 2.6) ∼ ∼New Mexico 2.3 ( 1.5- 3.5) 2.5 ( 1.6- 3.7) ∼ ∼Utah ∼ ∼ ∼ ∼Wyoming ∼ ∼ ∼ ∼
Pacific 1.9 ( 1.7- 2.1) 1.9 ( 1.7- 2.1) 2.6 ( 1.7- 3.7) 1.2 ( 0.8- 1.6)
Alaska ∼ ∼ ∼ ∼California 1.8 ( 1.6- 2.0) 1.8 ( 1.6- 2.1) 2.4 ( 1.5- 3.5) 1.2 ( 0.9- 1.7)
San Francisco-Oakland 2.1 ( 1.5- 2.8) 2.4 ( 1.7- 3.3) ∼ ∼San Jose-Monterey 2.0 ( 1.3- 3.1) 1.8 ( 1.0- 2.9) ∼ ∼Los Angeles 1.9 ( 1.6- 2.4) 2.0 ( 1.5- 2.5) ∼ 1.3 ( 0.7- 2.2)
Hawaii ∼ ∼ ∼ ∼Oregon 2.1 ( 1.5- 2.9) 2.1 ( 1.5- 2.9) ∼ ∼Washington 2.3 ( 1.8- 2.9) 2.4 ( 1.9- 3.0) ∼ ∼
Seattle-Puget Sound 2.8 ( 2.1- 3.5) 2.9 ( 2.2- 3.8) ∼ ∼∗ Rates are per 100,000 persons and are age-adjusted to the 2000 U.S. standard population (19 age groups - Census P25-1130).† Data are from all state and metropolitan area cancer registries, except Maryland. Included data cover approximately 98% of the population and met data
quality criteria for all invasive cancer sites combined. See Appendix B for registry-specific data quality information.‡ Invasive cancers only.
§ Data for specified racial or ethnic populations other than white and black should be interpreted with caution. See Technical Notes.
Hispanic origin is not mutually exclusive from race categories (white, black).
∼ Rates are suppressed if fewer than 16 cases were reported in a specific category (area, race, ethnicity).
- Rates are suppressed at the state’s or metropolitan area’s request. See Technical Notes.
Notes: Cases from suppressed rates are included in the U.S. and region/division rates. U.S. rates are as presented in Table 1.1.1.1F. Michigan, Georgia,
California, and Washington state rates each include cases from the SEER metropolitan areas.

United
States Cancer Statistics: 2004 Incid
ence and M
ortality
��
continued
Table 2.8.1.2M: Esophagus. Age-Adjusted Cancer Death Rates∗ and 95% Confidence Intervals, by U.S. CensusRegion and Division, State, and Race and Ethnicity, United States†
Males, 2004
Area All Races White Black Hispanic‡§
United States 7.7 ( 7.6- 7.9) 7.8 ( 7.6- 7.9) 9.1 ( 8.5- 9.6) 4.0 ( 3.6- 4.5)
Northeast 8.2 ( 7.9- 8.6) 8.4 ( 8.0- 8.8) 8.6 ( 7.3- 9.9) 4.4 ( 3.3- 5.7)
New England 8.7 ( 8.0- 9.4) 8.7 ( 8.0- 9.5) 9.1 ( 5.7- 13.8) ∼Connecticut 7.5 ( 6.2- 9.0) 7.5 ( 6.2- 9.0) ∼ ∼Maine 10.6 ( 8.3- 13.3) 10.4 ( 8.1- 13.2) ∼ ∼Massachusetts 9.2 ( 8.1- 10.3) 9.3 ( 8.2- 10.5) ∼ ∼New Hampshire 8.5 ( 6.2- 11.3) 8.6 ( 6.3- 11.4) ∼ ∼Rhode Island 9.1 ( 6.7- 12.2) 9.4 ( 6.9- 12.6) ∼ ∼Vermont 5.6 ( 3.3- 8.9) 5.6 ( 3.3- 9.0) ∼ ∼
Middle Atlantic 8.1 ( 7.7- 8.5) 8.2 ( 7.8- 8.7) 8.5 ( 7.2- 9.9) 4.3 ( 3.2- 5.7)
New Jersey 7.0 ( 6.2- 7.9) 7.1 ( 6.2- 8.1) 8.1 ( 5.5- 11.4) ∼New York 7.7 ( 7.2- 8.3) 7.9 ( 7.3- 8.6) 8.2 ( 6.5- 10.2) 4.4 ( 3.0- 6.1)
Pennsylvania 9.2 ( 8.4- 9.9) 9.2 ( 8.5- 10.1) 9.3 ( 6.5- 12.7) ∼Midwest 8.5 ( 8.1- 8.8) 8.5 ( 8.2- 8.9) 8.9 ( 7.6- 10.3) 3.7 ( 2.2- 5.7)
East North Central 8.6 ( 8.2- 9.1) 8.7 ( 8.3- 9.2) 8.9 ( 7.5- 10.4) 4.1 ( 2.3- 6.6)
Illinois 7.9 ( 7.2- 8.7) 8.0 ( 7.2- 8.9) 9.5 ( 7.1- 12.4) ∼Indiana 8.3 ( 7.2- 9.5) 8.4 ( 7.3- 9.7) ∼ ∼Michigan 8.8 ( 7.9- 9.7) 8.9 ( 8.0- 9.9) 7.2 ( 4.9- 10.1) ∼Ohio 9.0 ( 8.2- 9.8) 9.1 ( 8.3- 10.0) 8.4 ( 5.9- 11.6) ∼Wisconsin 9.6 ( 8.5- 10.9) 9.3 ( 8.1- 10.6) 22.0 ( 11.5- 37.2) ∼
West North Central 8.1 ( 7.5- 8.7) 8.1 ( 7.5- 8.7) 8.9 ( 5.9- 12.7) ∼Iowa 8.2 ( 6.8- 9.8) 8.2 ( 6.8- 9.8) ∼ ∼Kansas 6.9 ( 5.5- 8.5) 6.9 ( 5.5- 8.6) ∼ ∼Minnesota 8.4 ( 7.2- 9.7) 8.5 ( 7.3- 9.8) ∼ ∼Missouri 8.0 ( 7.0- 9.2) 7.9 ( 6.9- 9.1) 10.0 ( 6.1- 15.3) ∼Nebraska 8.5 ( 6.6- 10.8) 8.5 ( 6.6- 10.9) ∼ ∼North Dakota 7.7 ( 5.0- 11.4) 7.2 ( 4.5- 10.8) ∼ ∼South Dakota 8.4 ( 5.8- 11.9) 8.2 ( 5.5- 11.8) ∼ ∼
South 7.5 ( 7.2- 7.7) 7.2 ( 7.0- 7.5) 9.6 ( 8.9- 10.5) 3.7 ( 3.1- 4.5)
South Atlantic 7.7 ( 7.4- 8.0) 7.5 ( 7.1- 7.9) 9.5 ( 8.5- 10.6) 3.0 ( 2.2- 4.1)
Delaware 11.9 ( 8.6- 15.9) 11.9 ( 8.4- 16.3) ∼ ∼District of Columbia 10.0 ( 6.4- 14.9) ∼ 14.9 ( 9.3- 22.6) ∼Florida 7.3 ( 6.8- 7.9) 7.4 ( 6.8- 8.0) 6.9 ( 5.1- 9.0) 3.5 ( 2.5- 4.8)
Georgia 8.1 ( 7.2- 9.2) 7.5 ( 6.4- 8.7) 11.4 ( 8.9- 14.3) ∼Maryland 7.8 ( 6.7- 9.1) 8.0 ( 6.7- 9.4) 8.2 ( 5.7- 11.4) ∼North Carolina 7.4 ( 6.5- 8.3) 6.9 ( 6.0- 7.9) 10.3 ( 7.8- 13.3) ∼South Carolina 8.4 ( 7.2- 9.9) 7.5 ( 6.1- 9.1) 12.4 ( 9.1- 16.3) ∼Virginia 7.4 ( 6.4- 8.4) 7.4 ( 6.4- 8.6) 7.5 ( 5.3- 10.4) ∼West Virginia 7.6 ( 5.9- 9.5) 7.7 ( 6.0- 9.7) ∼ ∼
East South Central 7.7 ( 7.1- 8.4) 7.3 ( 6.7- 8.0) 10.2 ( 8.4- 12.3) ∼Alabama 8.1 ( 6.9- 9.4) 7.6 ( 6.3- 9.0) 10.3 ( 7.3- 14.2) ∼Kentucky 7.7 ( 6.5- 9.0) 7.4 ( 6.2- 8.8) ∼ ∼Mississippi 7.5 ( 6.0- 9.1) 6.2 ( 4.7- 8.1) 10.3 ( 7.2- 14.2) ∼Tennessee 7.6 ( 6.6- 8.8) 7.5 ( 6.4- 8.8) 8.7 ( 5.5- 12.9) ∼
West South Central 6.9 ( 6.5- 7.4) 6.7 ( 6.2- 7.2) 9.5 ( 7.9- 11.4) 4.4 ( 3.4- 5.6)
Arkansas 6.2 ( 4.9- 7.7) 6.0 ( 4.6- 7.6) ∼ ∼

Cancer Incidence and M
ortality, by U.S. C
ensus Region and D
i�ision, State, and Metropolitan A
rea
��
Table 2.8.1.2M: Esophagus. Age-Adjusted Cancer Death Rates∗ and 95% Confidence Intervals, by U.S. CensusRegion and Division, State, and Race and Ethnicity, United States† (continued)
Males, 2004
Area All Races White Black Hispanic‡§
Louisiana 8.4 ( 7.1- 9.9) 7.8 ( 6.3- 9.5) 10.9 ( 8.0- 14.5) ∼Oklahoma 7.1 ( 5.9- 8.5) 7.1 ( 5.8- 8.6) ∼ ∼Texas 6.7 ( 6.1- 7.2) 6.5 ( 5.9- 7.1) 9.2 ( 7.0- 11.9) 4.5 ( 3.5- 5.7)
West 6.9 ( 6.6- 7.2) 7.3 ( 6.9- 7.6) 7.0 ( 5.4- 8.9) 4.2 ( 3.5- 5.0)
Mountain 7.2 ( 6.6- 7.8) 7.3 ( 6.7- 7.9) 8.4 ( 4.8- 13.4) 5.4 ( 3.8- 7.3)
Arizona 7.2 ( 6.2- 8.3) 7.5 ( 6.5- 8.6) ∼ ∼Colorado 7.4 ( 6.1- 8.7) 7.1 ( 5.8- 8.5) ∼ ∼Idaho 7.0 ( 5.1- 9.3) 6.9 ( 5.0- 9.3) ∼ ∼Montana 7.5 ( 5.2- 10.5) 7.4 ( 5.1- 10.4) ∼ ∼Nevada 6.7 ( 5.1- 8.5) 6.3 ( 4.7- 8.2) ∼ ∼New Mexico 7.4 ( 5.7- 9.6) 7.9 ( 6.0- 10.1) ∼ 6.7 ( 3.9- 10.5)
Utah 6.7 ( 5.0- 8.7) 6.8 ( 5.1- 8.9) ∼ ∼Wyoming 9.9 ( 6.4- 14.6) 10.1 ( 6.5- 15.0) ∼ ∼
Pacific 6.8 ( 6.4- 7.2) 7.3 ( 6.9- 7.7) 6.7 ( 4.9- 8.7) 3.8 ( 3.0- 4.7)
Alaska ∼ ∼ ∼ ∼California 6.3 ( 5.9- 6.7) 6.7 ( 6.3- 7.2) 7.2 ( 5.3- 9.5) 3.9 ( 3.1- 4.8)
Hawaii 4.7 ( 3.2- 6.8) ∼ ∼ ∼Oregon 9.7 ( 8.2- 11.3) 9.8 ( 8.3- 11.5) ∼ ∼Washington 7.9 ( 6.9- 9.1) 8.2 ( 7.1- 9.5) ∼ ∼
∗ Rates are per 100,000 persons and are age-adjusted to the 2000 U.S. standard population (19 age groups - Census P25-1130).† Data are from the National Vital Statistics System (NVSS).‡ Data for specified racial or ethnic populations other than white and black should be interpreted with caution. See Technical Notes.
§ Hispanic origin is not mutually exclusive from race categories (white, black).
∼ Rates are suppressed if fewer than 16 cases were reported in a specific category (area, race, ethnicity).
Note: U.S. rates are as presented in Table 1.1.1.2M.

United
States Cancer Statistics: 2004 Incid
ence and M
ortality
�00
continued
Table 2.8.1.2F: Esophagus. Age-Adjusted Cancer Death Rates∗ and 95% Confidence Intervals, by U.S. CensusRegion and Division, State, and Race and Ethnicity, United States†
Females, 2004
Area All Races White Black Hispanic‡§
United States 1.7 ( 1.7- 1.8) 1.6 ( 1.6- 1.7) 2.9 ( 2.6- 3.1) 0.9 ( 0.7- 1.1)
Northeast 1.9 ( 1.8- 2.1) 1.9 ( 1.7- 2.0) 3.0 ( 2.4- 3.6) 1.3 ( 0.8- 2.0)
New England 2.0 ( 1.8- 2.4) 2.0 ( 1.7- 2.3) ∼ ∼Connecticut 1.7 ( 1.2- 2.4) 1.8 ( 1.2- 2.5) ∼ ∼Maine 1.8 ( 1.1- 3.0) 1.8 ( 1.1- 3.0) ∼ ∼Massachusetts 2.1 ( 1.6- 2.6) 2.0 ( 1.6- 2.5) ∼ ∼New Hampshire 2.8 ( 1.7- 4.4) 2.7 ( 1.7- 4.3) ∼ ∼Rhode Island 2.5 ( 1.5- 4.1) 2.5 ( 1.4- 4.1) ∼ ∼Vermont ∼ ∼ ∼ ∼
Middle Atlantic 1.9 ( 1.7- 2.1) 1.8 ( 1.6- 2.0) 3.0 ( 2.4- 3.7) 1.4 ( 0.9- 2.2)
New Jersey 1.9 ( 1.5- 2.3) 1.9 ( 1.5- 2.4) ∼ ∼New York 1.9 ( 1.7- 2.2) 1.8 ( 1.5- 2.0) 3.3 ( 2.4- 4.3) ∼Pennsylvania 2.0 ( 1.7- 2.3) 1.9 ( 1.6- 2.2) 3.4 ( 2.1- 5.2) ∼
Midwest 1.8 ( 1.6- 1.9) 1.6 ( 1.5- 1.8) 3.1 ( 2.5- 3.8) ∼East North Central 1.9 ( 1.7- 2.1) 1.8 ( 1.6- 2.0) 2.9 ( 2.3- 3.7) ∼Illinois 1.9 ( 1.6- 2.2) 1.6 ( 1.3- 2.0) 3.6 ( 2.5- 5.1) ∼Indiana 2.0 ( 1.5- 2.5) 1.9 ( 1.5- 2.5) ∼ ∼Michigan 1.7 ( 1.4- 2.1) 1.6 ( 1.3- 2.0) ∼ ∼Ohio 2.1 ( 1.8- 2.5) 2.0 ( 1.7- 2.4) 3.1 ( 1.9- 4.8) ∼Wisconsin 1.8 ( 1.4- 2.3) 1.8 ( 1.3- 2.3) ∼ ∼
West North Central 1.4 ( 1.2- 1.7) 1.3 ( 1.1- 1.5) 3.9 ( 2.3- 6.2) ∼Iowa 1.2 ( 0.8- 1.9) 1.3 ( 0.8- 1.9) ∼ ∼Kansas 1.6 ( 1.0- 2.4) 1.4 ( 0.9- 2.2) ∼ ∼Minnesota 1.3 ( 0.9- 1.8) 1.3 ( 0.9- 1.8) ∼ ∼Missouri 1.7 ( 1.3- 2.2) 1.5 ( 1.1- 1.9) ∼ ∼Nebraska ∼ ∼ ∼ ∼North Dakota ∼ ∼ ∼ ∼South Dakota ∼ ∼ ∼ ∼
South 1.6 ( 1.5- 1.7) 1.4 ( 1.3- 1.5) 2.8 ( 2.4- 3.1) 0.9 ( 0.7- 1.3)
South Atlantic 1.7 ( 1.6- 1.9) 1.5 ( 1.4- 1.7) 2.8 ( 2.4- 3.3) ∼Delaware 3.2 ( 1.8- 5.2) ∼ ∼ ∼District of Columbia ∼ ∼ ∼ ∼Florida 1.6 ( 1.4- 1.8) 1.5 ( 1.2- 1.7) 2.6 ( 1.7- 3.8) ∼Georgia 1.8 ( 1.4- 2.2) 1.3 ( 1.0- 1.8) 3.3 ( 2.2- 4.7) ∼Maryland 1.4 ( 1.0- 1.9) 1.1 ( 0.7- 1.6) 2.3 ( 1.3- 3.7) ∼North Carolina 2.1 ( 1.7- 2.5) 1.9 ( 1.5- 2.4) 3.0 ( 2.0- 4.4) ∼South Carolina 2.0 ( 1.5- 2.7) 1.7 ( 1.1- 2.4) 2.9 ( 1.7- 4.6) ∼Virginia 1.7 ( 1.3- 2.1) 1.5 ( 1.1- 2.0) 2.9 ( 1.8- 4.6) ∼West Virginia 1.8 ( 1.1- 2.7) 1.7 ( 1.0- 2.6) ∼ ∼
East South Central 1.5 ( 1.2- 1.7) 1.2 ( 1.0- 1.4) 2.9 ( 2.1- 3.8) ∼Alabama 1.5 ( 1.1- 2.1) 1.1 ( 0.7- 1.7) 3.0 ( 1.8- 4.8) ∼Kentucky 1.7 ( 1.2- 2.3) 1.6 ( 1.2- 2.3) ∼ ∼Mississippi 1.5 ( 1.0- 2.3) ∼ ∼ ∼Tennessee 1.2 ( 0.9- 1.7) 1.0 ( 0.6- 1.4) ∼ ∼
West South Central 1.5 ( 1.3- 1.7) 1.4 ( 1.2- 1.6) 2.5 ( 1.8- 3.3) 1.3 ( 0.9- 1.9)
Arkansas 1.4 ( 0.9- 2.1) 1.3 ( 0.8- 2.0) ∼ ∼
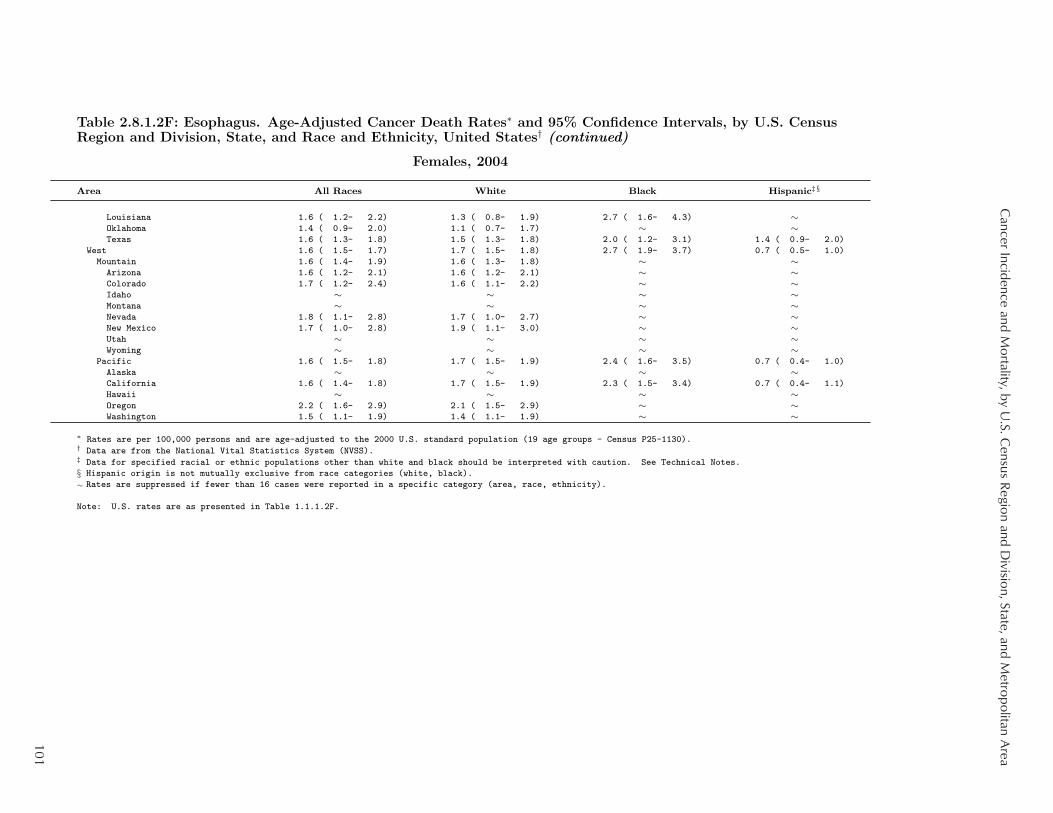
Cancer Incidence and M
ortality, by U.S. C
ensus Region and D
i�ision, State, and Metropolitan A
rea
�0�
Table 2.8.1.2F: Esophagus. Age-Adjusted Cancer Death Rates∗ and 95% Confidence Intervals, by U.S. CensusRegion and Division, State, and Race and Ethnicity, United States† (continued)
Females, 2004
Area All Races White Black Hispanic‡§
Louisiana 1.6 ( 1.2- 2.2) 1.3 ( 0.8- 1.9) 2.7 ( 1.6- 4.3) ∼Oklahoma 1.4 ( 0.9- 2.0) 1.1 ( 0.7- 1.7) ∼ ∼Texas 1.6 ( 1.3- 1.8) 1.5 ( 1.3- 1.8) 2.0 ( 1.2- 3.1) 1.4 ( 0.9- 2.0)
West 1.6 ( 1.5- 1.7) 1.7 ( 1.5- 1.8) 2.7 ( 1.9- 3.7) 0.7 ( 0.5- 1.0)
Mountain 1.6 ( 1.4- 1.9) 1.6 ( 1.3- 1.8) ∼ ∼Arizona 1.6 ( 1.2- 2.1) 1.6 ( 1.2- 2.1) ∼ ∼Colorado 1.7 ( 1.2- 2.4) 1.6 ( 1.1- 2.2) ∼ ∼Idaho ∼ ∼ ∼ ∼Montana ∼ ∼ ∼ ∼Nevada 1.8 ( 1.1- 2.8) 1.7 ( 1.0- 2.7) ∼ ∼New Mexico 1.7 ( 1.0- 2.8) 1.9 ( 1.1- 3.0) ∼ ∼Utah ∼ ∼ ∼ ∼Wyoming ∼ ∼ ∼ ∼
Pacific 1.6 ( 1.5- 1.8) 1.7 ( 1.5- 1.9) 2.4 ( 1.6- 3.5) 0.7 ( 0.4- 1.0)
Alaska ∼ ∼ ∼ ∼California 1.6 ( 1.4- 1.8) 1.7 ( 1.5- 1.9) 2.3 ( 1.5- 3.4) 0.7 ( 0.4- 1.1)
Hawaii ∼ ∼ ∼ ∼Oregon 2.2 ( 1.6- 2.9) 2.1 ( 1.5- 2.9) ∼ ∼Washington 1.5 ( 1.1- 1.9) 1.4 ( 1.1- 1.9) ∼ ∼
∗ Rates are per 100,000 persons and are age-adjusted to the 2000 U.S. standard population (19 age groups - Census P25-1130).† Data are from the National Vital Statistics System (NVSS).‡ Data for specified racial or ethnic populations other than white and black should be interpreted with caution. See Technical Notes.
§ Hispanic origin is not mutually exclusive from race categories (white, black).
∼ Rates are suppressed if fewer than 16 cases were reported in a specific category (area, race, ethnicity).
Note: U.S. rates are as presented in Table 1.1.1.2F.

United
States Cancer Statistics: 2004 Incid
ence and M
ortality
�0�
continued
Table 2.9.1.1M: Hodgkin Lymphoma. Age-Adjusted Cancer Incidence Rates∗ and 95% Confidence Intervals,by U.S. Census Region and Division, State and Metropolitan Area, and Race and Ethnicity, United States†‡
Males, 2004
Area All Races White Black Hispanic§
United States 3.0 ( 3.0- 3.1) 3.1 ( 3.0- 3.2) 2.9 ( 2.6- 3.2) 2.8 ( 2.5- 3.1)
Northeast 3.7 ( 3.5- 4.0) 3.9 ( 3.6- 4.1) 3.1 ( 2.5- 3.8) 3.3 ( 2.6- 4.2)
New England 3.7 ( 3.3- 4.2) 4.0 ( 3.5- 4.5) ∼ 4.0 ( 1.9- 7.3)
Connecticut 3.4 ( 2.5- 4.4) 3.5 ( 2.6- 4.6) ∼ ∼Maine 4.0 ( 2.6- 5.8) 4.1 ( 2.7- 6.0) ∼ ∼Massachusetts 3.8 ( 3.1- 4.5) 4.1 ( 3.3- 4.9) ∼ ∼New Hampshire 4.3 ( 2.8- 6.3) 4.4 ( 2.9- 6.5) ∼ ∼Rhode Island 4.0 ( 2.5- 6.2) 4.1 ( 2.5- 6.4) ∼ ∼Vermont ∼ ∼ ∼ ∼
Middle Atlantic 3.7 ( 3.4- 4.0) 3.8 ( 3.5- 4.1) 3.3 ( 2.7- 4.1) 3.2 ( 2.4- 4.1)
New Jersey 3.4 ( 2.9- 4.0) 3.4 ( 2.8- 4.1) 4.5 ( 3.0- 6.7) 2.9 ( 1.5- 5.1)
New York 3.6 ( 3.2- 4.0) 3.8 ( 3.4- 4.3) 2.8 ( 2.0- 3.8) 3.3 ( 2.4- 4.6)
Pennsylvania 4.1 ( 3.6- 4.7) 4.1 ( 3.6- 4.7) 3.5 ( 2.1- 5.3) -
Midwest 3.1 ( 2.9- 3.3) 3.1 ( 2.9- 3.3) 3.3 ( 2.7- 4.0) 3.2 ( 2.0- 4.8)
East North Central 3.2 ( 2.9- 3.4) 3.2 ( 2.9- 3.4) 3.4 ( 2.7- 4.2) 3.5 ( 2.2- 5.4)
Illinois 3.5 ( 3.0- 4.0) 3.5 ( 3.0- 4.0) 4.3 ( 3.0- 6.1) 3.9 ( 1.9- 6.9)
Indiana 3.3 ( 2.7- 4.0) 3.4 ( 2.7- 4.2) ∼ ∼Michigan 3.0 ( 2.5- 3.5) 3.0 ( 2.5- 3.6) 2.7 ( 1.6- 4.2) ∼
Detroit 2.9 ( 2.2- 3.8) 3.2 ( 2.3- 4.3) ∼ ∼Ohio 3.0 ( 2.6- 3.5) 2.9 ( 2.5- 3.4) 2.9 ( 1.7- 4.8) ∼Wisconsin 3.1 ( 2.5- 3.9) 3.2 ( 2.5- 3.9) ∼ ∼
West North Central 3.0 ( 2.7- 3.4) 3.0 ( 2.6- 3.4) 2.8 ( 1.6- 4.7) ∼Iowa 2.9 ( 2.1- 3.9) 2.9 ( 2.1- 3.9) ∼ ∼Kansas 2.5 ( 1.8- 3.6) 2.6 ( 1.8- 3.7) ∼ ∼Minnesota 3.4 ( 2.7- 4.2) 3.4 ( 2.7- 4.3) ∼ ∼Missouri 3.0 ( 2.4- 3.7) 2.9 ( 2.2- 3.7) ∼ ∼Nebraska 3.4 ( 2.3- 4.9) 3.1 ( 2.0- 4.6) ∼ ∼North Dakota ∼ ∼ ∼ ∼South Dakota ∼ ∼ ∼ ∼
South 2.8 ( 2.7- 3.0) 2.9 ( 2.7- 3.1) 2.6 ( 2.3- 3.0) 2.7 ( 2.2- 3.2)
South Atlantic 2.8 ( 2.6- 3.0) 2.9 ( 2.7- 3.1) 2.5 ( 2.1- 3.0) 2.9 ( 2.2- 3.8)
Delaware ∼ ∼ ∼ ∼District of Columbia ∼ ∼ ∼ ∼Florida 2.9 ( 2.6- 3.3) 3.1 ( 2.7- 3.5) 2.5 ( 1.6- 3.8) -
Georgia 2.4 ( 2.0- 2.9) 2.4 ( 1.9- 3.0) 2.6 ( 1.7- 3.8) ∼Atlanta 2.2 ( 1.6- 3.1) 2.0 ( 1.3- 3.2) 2.8 ( 1.6- 4.9) ∼
Maryland
North Carolina 3.3 ( 2.7- 3.9) 3.5 ( 2.9- 4.2) 2.5 ( 1.6- 3.9) ∼South Carolina 2.4 ( 1.8- 3.2) 2.4 ( 1.7- 3.4) ∼ -
Virginia 2.7 ( 2.2- 3.3) 2.9 ( 2.3- 3.6) 2.4 ( 1.4- 3.9) ∼West Virginia ∼ ∼ ∼ ∼
East South Central 2.6 ( 2.3- 3.0) 2.7 ( 2.3- 3.2) 2.3 ( 1.6- 3.2) ∼Alabama 2.7 ( 2.0- 3.4) 2.8 ( 2.0- 3.7) ∼ ∼Kentucky 3.0 ( 2.3- 3.9) 3.1 ( 2.3- 4.0) ∼ -
Mississippi 2.9 ( 2.1- 4.0) 3.0 ( 1.9- 4.4) ∼ ∼Tennessee 2.2 ( 1.7- 2.9) 2.4 ( 1.8- 3.1) ∼ ∼

Cancer Incidence and M
ortality, by U.S. C
ensus Region and D
i�ision, State, and Metropolitan A
rea
�03
Table 2.9.1.1M: Hodgkin Lymphoma. Age-Adjusted Cancer Incidence Rates∗ and 95% Confidence Intervals,by U.S. Census Region and Division, State and Metropolitan Area, and Race and Ethnicity, United States†‡(continued)
Males, 2004
Area All Races White Black Hispanic§
West South Central 3.1 ( 2.8- 3.4) 3.1 ( 2.8- 3.4) 3.0 ( 2.3- 3.9) 2.6 ( 2.0- 3.3)
Arkansas 4.0 ( 3.0- 5.3) 3.8 ( 2.8- 5.1) ∼ ∼Louisiana 3.8 ( 3.0- 4.8) 4.2 ( 3.2- 5.5) 2.6 ( 1.5- 4.3) ∼Oklahoma 3.2 ( 2.4- 4.1) 3.3 ( 2.4- 4.4) ∼ ∼Texas 2.8 ( 2.5- 3.2) 2.8 ( 2.5- 3.2) 2.7 ( 1.9- 3.9) 2.6 ( 1.9- 3.3)
West 2.7 ( 2.5- 2.9) 2.8 ( 2.6- 3.0) 3.1 ( 2.3- 4.2) 2.6 ( 2.1- 3.1)
Mountain 2.6 ( 2.3- 3.0) 2.6 ( 2.3- 3.0) ∼ 2.2 ( 1.5- 3.2)
Arizona 1.9 ( 1.5- 2.5) 2.0 ( 1.5- 2.7) ∼ ∼Colorado 3.3 ( 2.6- 4.2) 3.3 ( 2.6- 4.2) ∼ ∼Idaho ∼ ∼ ∼ ∼Montana ∼ ∼ ∼ ∼Nevada 3.3 ( 2.3- 4.5) 3.0 ( 2.0- 4.2) ∼ ∼New Mexico 2.8 ( 1.8- 4.2) 3.0 ( 1.9- 4.5) ∼ ∼Utah 2.6 ( 1.7- 3.8) 2.7 ( 1.7- 4.0) ∼ ∼Wyoming ∼ ∼ ∼ ∼
Pacific 2.8 ( 2.5- 3.0) 2.9 ( 2.7- 3.2) 3.1 ( 2.2- 4.3) 2.7 ( 2.2- 3.3)
Alaska ∼ ∼ ∼ ∼California 2.6 ( 2.4- 2.9) 2.8 ( 2.6- 3.1) 2.9 ( 1.9- 4.1) 2.7 ( 2.2- 3.3)
San Francisco-Oakland 2.8 ( 2.1- 3.6) 3.1 ( 2.2- 4.1) ∼ ∼San Jose-Monterey 3.0 ( 2.0- 4.2) 3.5 ( 2.4- 5.1) ∼ ∼Los Angeles 2.5 ( 2.1- 3.0) 2.8 ( 2.3- 3.4) ∼ 2.1 ( 1.4- 3.0)
Hawaii 2.5 ( 1.4- 4.1) ∼ ∼ ∼Oregon 3.3 ( 2.5- 4.3) 3.4 ( 2.6- 4.4) ∼ ∼Washington 3.1 ( 2.5- 3.8) 3.0 ( 2.4- 3.7) ∼ ∼
Seattle-Puget Sound 3.5 ( 2.7- 4.4) 3.5 ( 2.7- 4.5) ∼ ∼∗ Rates are per 100,000 persons and are age-adjusted to the 2000 U.S. standard population (19 age groups - Census P25-1130).† Data are from all state and metropolitan area cancer registries, except Maryland. Included data cover approximately 98% of the population and met data
quality criteria for all invasive cancer sites combined. See Appendix B for registry-specific data quality information.‡ Invasive cancers only.
§ Data for specified racial or ethnic populations other than white and black should be interpreted with caution. See Technical Notes.
Hispanic origin is not mutually exclusive from race categories (white, black).
∼ Rates are suppressed if fewer than 16 cases were reported in a specific category (area, race, ethnicity).
- Rates are suppressed at the state’s or metropolitan area’s request. See Technical Notes.
Notes: Cases from suppressed rates are included in the U.S. and region/division rates. U.S. rates are as presented in Table 1.1.1.1M. Michigan, Georgia,
California, and Washington state rates each include cases from the SEER metropolitan areas.

United
States Cancer Statistics: 2004 Incid
ence and M
ortality
�0�
continued
Table 2.9.1.1F: Hodgkin Lymphoma. Age-Adjusted Cancer Incidence Rates∗ and 95% Confidence Intervals,by U.S. Census Region and Division, State and Metropolitan Area, and Race and Ethnicity, United States†‡
Females, 2004
Area All Races White Black Hispanic§
United States 2.5 ( 2.4- 2.6) 2.6 ( 2.5- 2.7) 2.1 ( 1.9- 2.3) 2.0 ( 1.8- 2.3)
Northeast 2.9 ( 2.7- 3.1) 3.2 ( 2.9- 3.4) 2.2 ( 1.7- 2.7) 2.6 ( 2.0- 3.4)
New England 2.8 ( 2.4- 3.2) 3.0 ( 2.6- 3.4) ∼ ∼Connecticut 3.3 ( 2.5- 4.2) 3.5 ( 2.6- 4.7) ∼ ∼Maine 2.6 ( 1.5- 4.1) 2.7 ( 1.6- 4.2) ∼ ∼Massachusetts 2.8 ( 2.2- 3.4) 3.0 ( 2.4- 3.7) ∼ ∼New Hampshire ∼ ∼ ∼ ∼Rhode Island ∼ ∼ ∼ ∼Vermont ∼ ∼ ∼ ∼
Middle Atlantic 3.0 ( 2.8- 3.2) 3.2 ( 3.0- 3.5) 2.2 ( 1.8- 2.8) 2.7 ( 2.0- 3.5)
New Jersey 2.9 ( 2.4- 3.5) 3.1 ( 2.5- 3.8) 2.7 ( 1.6- 4.3) ∼New York 3.1 ( 2.7- 3.4) 3.4 ( 3.0- 3.9) 2.3 ( 1.7- 3.1) 3.0 ( 2.2- 4.1)
Pennsylvania 2.9 ( 2.5- 3.3) 3.1 ( 2.6- 3.6) ∼ -
Midwest 2.6 ( 2.4- 2.8) 2.7 ( 2.5- 2.9) 2.0 ( 1.6- 2.6) 2.4 ( 1.5- 3.6)
East North Central 2.6 ( 2.4- 2.8) 2.7 ( 2.5- 2.9) 2.0 ( 1.5- 2.6) 2.8 ( 1.7- 4.4)
Illinois 2.2 ( 1.9- 2.6) 2.3 ( 1.9- 2.8) 1.5 ( 0.9- 2.5) ∼Indiana 2.3 ( 1.8- 2.9) 2.3 ( 1.8- 2.9) ∼ ∼Michigan 3.0 ( 2.5- 3.5) 3.1 ( 2.6- 3.7) 2.7 ( 1.6- 4.2) ∼
Detroit 3.7 ( 2.9- 4.6) 4.2 ( 3.2- 5.5) ∼ ∼Ohio 2.7 ( 2.3- 3.1) 2.7 ( 2.3- 3.2) 2.2 ( 1.2- 3.5) ∼Wisconsin 2.8 ( 2.2- 3.5) 3.0 ( 2.4- 3.8) ∼ ∼
West North Central 2.6 ( 2.3- 3.0) 2.7 ( 2.4- 3.1) ∼ ∼Iowa 2.6 ( 1.9- 3.6) 2.6 ( 1.9- 3.6) ∼ ∼Kansas 2.6 ( 1.8- 3.6) 2.6 ( 1.8- 3.7) ∼ ∼Minnesota 2.8 ( 2.2- 3.5) 2.8 ( 2.2- 3.6) ∼ ∼Missouri 2.2 ( 1.7- 2.8) 2.2 ( 1.7- 2.9) ∼ ∼Nebraska 3.6 ( 2.5- 5.1) 3.9 ( 2.6- 5.5) ∼ ∼North Dakota ∼ ∼ ∼ ∼South Dakota ∼ ∼ ∼ ∼
South 2.2 ( 2.1- 2.4) 2.3 ( 2.2- 2.5) 2.0 ( 1.8- 2.3) 1.8 ( 1.5- 2.2)
South Atlantic 2.3 ( 2.2- 2.5) 2.4 ( 2.2- 2.6) 2.3 ( 1.9- 2.7) 1.8 ( 1.3- 2.5)
Delaware ∼ ∼ ∼ ∼District of Columbia ∼ ∼ ∼ ∼Florida 2.3 ( 1.9- 2.6) 2.4 ( 2.0- 2.8) 1.8 ( 1.2- 2.7) -
Georgia 2.4 ( 2.0- 2.9) 2.6 ( 2.0- 3.2) 2.1 ( 1.4- 3.0) ∼Atlanta 2.9 ( 2.1- 3.9) 3.3 ( 2.2- 4.8) 2.6 ( 1.5- 4.2) ∼
Maryland
North Carolina 2.3 ( 1.8- 2.8) 2.5 ( 2.0- 3.1) 1.6 ( 0.9- 2.6) ∼South Carolina 2.5 ( 1.9- 3.3) 2.5 ( 1.8- 3.5) ∼ -
Virginia 2.4 ( 2.0- 3.0) 2.1 ( 1.6- 2.7) 3.5 ( 2.3- 5.1) ∼West Virginia 2.2 ( 1.3- 3.4) 2.3 ( 1.4- 3.6) ∼ ∼
East South Central 2.0 ( 1.7- 2.3) 1.9 ( 1.6- 2.3) 2.1 ( 1.5- 2.9) ∼Alabama 1.8 ( 1.3- 2.4) 1.9 ( 1.3- 2.7) ∼ ∼Kentucky 2.1 ( 1.6- 2.8) 2.0 ( 1.5- 2.8) ∼ -
Mississippi 1.8 ( 1.2- 2.7) 1.7 ( 0.9- 2.7) ∼ ∼Tennessee 2.1 ( 1.6- 2.7) 2.0 ( 1.4- 2.6) ∼ ∼

Cancer Incidence and M
ortality, by U.S. C
ensus Region and D
i�ision, State, and Metropolitan A
rea
�0�
Table 2.9.1.1F: Hodgkin Lymphoma. Age-Adjusted Cancer Incidence Rates∗ and 95% Confidence Intervals,by U.S. Census Region and Division, State and Metropolitan Area, and Race and Ethnicity, United States†‡(continued)
Females, 2004
Area All Races White Black Hispanic§
West South Central 2.3 ( 2.1- 2.5) 2.4 ( 2.2- 2.7) 1.4 ( 1.0- 2.0) 1.9 ( 1.5- 2.5)
Arkansas 1.8 ( 1.1- 2.6) 1.6 ( 1.0- 2.5) ∼ ∼Louisiana 2.3 ( 1.7- 3.0) 2.8 ( 2.0- 3.8) ∼ ∼Oklahoma 2.1 ( 1.4- 2.8) 2.4 ( 1.6- 3.3) ∼ ∼Texas 2.4 ( 2.1- 2.7) 2.5 ( 2.2- 2.8) 1.6 ( 1.0- 2.5) 1.9 ( 1.5- 2.5)
West 2.3 ( 2.2- 2.5) 2.5 ( 2.3- 2.7) 2.7 ( 2.0- 3.6) 1.9 ( 1.6- 2.3)
Mountain 2.1 ( 1.8- 2.4) 2.2 ( 1.9- 2.5) ∼ 1.6 ( 1.0- 2.4)
Arizona 1.4 ( 1.0- 1.9) 1.4 ( 1.0- 1.9) ∼ ∼Colorado 2.4 ( 1.8- 3.1) 2.5 ( 1.9- 3.3) ∼ ∼Idaho 2.6 ( 1.5- 4.1) 2.7 ( 1.6- 4.2) ∼ ∼Montana ∼ ∼ ∼ ∼Nevada 2.4 ( 1.6- 3.4) 2.5 ( 1.6- 3.7) ∼ ∼New Mexico 1.8 ( 1.1- 2.8) 1.9 ( 1.1- 3.1) ∼ ∼Utah 3.0 ( 2.1- 4.2) 3.1 ( 2.2- 4.4) ∼ ∼Wyoming ∼ ∼ ∼ ∼
Pacific 2.5 ( 2.3- 2.7) 2.6 ( 2.4- 2.9) 2.7 ( 1.9- 3.7) 2.1 ( 1.7- 2.5)
Alaska ∼ ∼ ∼ ∼California 2.4 ( 2.2- 2.6) 2.6 ( 2.4- 2.9) 2.6 ( 1.8- 3.6) 2.1 ( 1.6- 2.5)
San Francisco-Oakland 2.4 ( 1.8- 3.1) 2.8 ( 2.0- 3.9) ∼ ∼San Jose-Monterey 2.4 ( 1.6- 3.5) 2.4 ( 1.4- 3.7) ∼ ∼Los Angeles 2.3 ( 1.9- 2.8) 2.6 ( 2.1- 3.2) ∼ 2.2 ( 1.5- 3.1)
Hawaii 2.5 ( 1.4- 4.1) ∼ ∼ ∼Oregon 2.7 ( 2.0- 3.6) 2.8 ( 2.0- 3.7) ∼ ∼Washington 2.7 ( 2.1- 3.3) 2.7 ( 2.1- 3.4) ∼ ∼
Seattle-Puget Sound 2.7 ( 2.0- 3.5) 2.8 ( 2.1- 3.7) ∼ ∼∗ Rates are per 100,000 persons and are age-adjusted to the 2000 U.S. standard population (19 age groups - Census P25-1130).† Data are from all state and metropolitan area cancer registries, except Maryland. Included data cover approximately 98% of the population and met data
quality criteria for all invasive cancer sites combined. See Appendix B for registry-specific data quality information.‡ Invasive cancers only.
§ Data for specified racial or ethnic populations other than white and black should be interpreted with caution. See Technical Notes.
Hispanic origin is not mutually exclusive from race categories (white, black).
∼ Rates are suppressed if fewer than 16 cases were reported in a specific category (area, race, ethnicity).
- Rates are suppressed at the state’s or metropolitan area’s request. See Technical Notes.
Notes: Cases from suppressed rates are included in the U.S. and region/division rates. U.S. rates are as presented in Table 1.1.1.1F. Michigan, Georgia,
California, and Washington state rates each include cases from the SEER metropolitan areas.
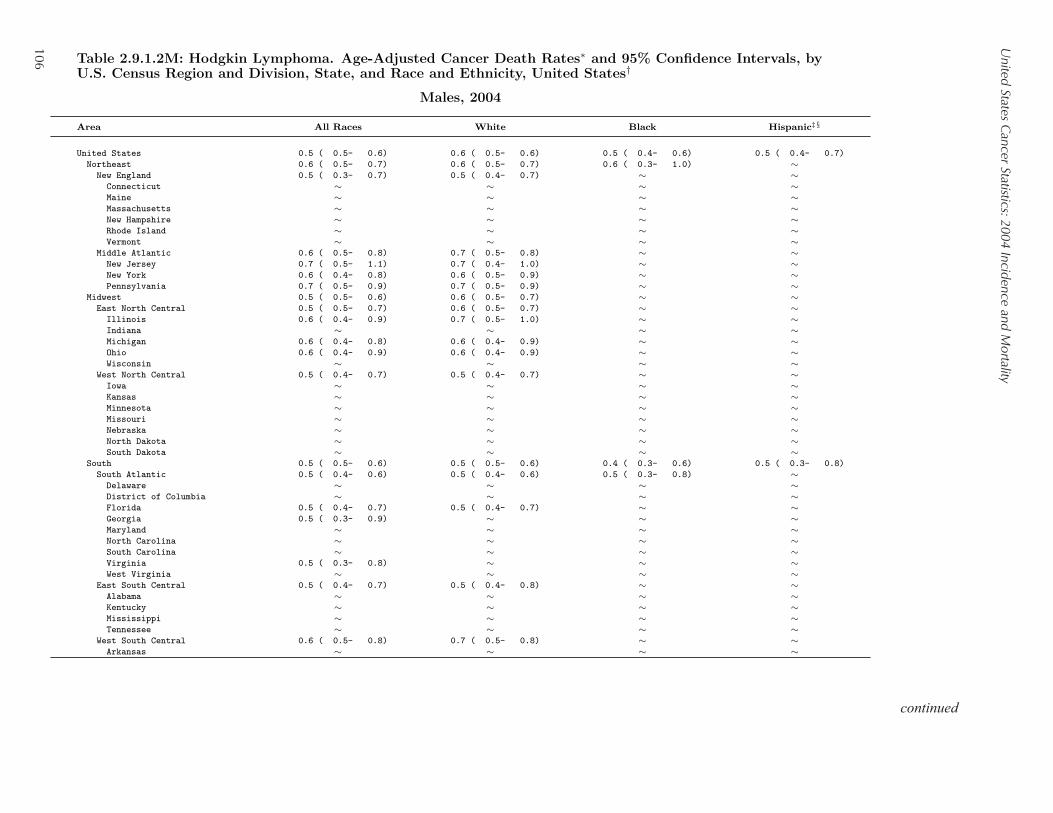
United
States Cancer Statistics: 2004 Incid
ence and M
ortality
�0�
continued
Table 2.9.1.2M: Hodgkin Lymphoma. Age-Adjusted Cancer Death Rates∗ and 95% Confidence Intervals, byU.S. Census Region and Division, State, and Race and Ethnicity, United States†
Males, 2004
Area All Races White Black Hispanic‡§
United States 0.5 ( 0.5- 0.6) 0.6 ( 0.5- 0.6) 0.5 ( 0.4- 0.6) 0.5 ( 0.4- 0.7)
Northeast 0.6 ( 0.5- 0.7) 0.6 ( 0.5- 0.7) 0.6 ( 0.3- 1.0) ∼New England 0.5 ( 0.3- 0.7) 0.5 ( 0.4- 0.7) ∼ ∼Connecticut ∼ ∼ ∼ ∼Maine ∼ ∼ ∼ ∼Massachusetts ∼ ∼ ∼ ∼New Hampshire ∼ ∼ ∼ ∼Rhode Island ∼ ∼ ∼ ∼Vermont ∼ ∼ ∼ ∼
Middle Atlantic 0.6 ( 0.5- 0.8) 0.7 ( 0.5- 0.8) ∼ ∼New Jersey 0.7 ( 0.5- 1.1) 0.7 ( 0.4- 1.0) ∼ ∼New York 0.6 ( 0.4- 0.8) 0.6 ( 0.5- 0.9) ∼ ∼Pennsylvania 0.7 ( 0.5- 0.9) 0.7 ( 0.5- 0.9) ∼ ∼
Midwest 0.5 ( 0.5- 0.6) 0.6 ( 0.5- 0.7) ∼ ∼East North Central 0.5 ( 0.5- 0.7) 0.6 ( 0.5- 0.7) ∼ ∼Illinois 0.6 ( 0.4- 0.9) 0.7 ( 0.5- 1.0) ∼ ∼Indiana ∼ ∼ ∼ ∼Michigan 0.6 ( 0.4- 0.8) 0.6 ( 0.4- 0.9) ∼ ∼Ohio 0.6 ( 0.4- 0.9) 0.6 ( 0.4- 0.9) ∼ ∼Wisconsin ∼ ∼ ∼ ∼
West North Central 0.5 ( 0.4- 0.7) 0.5 ( 0.4- 0.7) ∼ ∼Iowa ∼ ∼ ∼ ∼Kansas ∼ ∼ ∼ ∼Minnesota ∼ ∼ ∼ ∼Missouri ∼ ∼ ∼ ∼Nebraska ∼ ∼ ∼ ∼North Dakota ∼ ∼ ∼ ∼South Dakota ∼ ∼ ∼ ∼
South 0.5 ( 0.5- 0.6) 0.5 ( 0.5- 0.6) 0.4 ( 0.3- 0.6) 0.5 ( 0.3- 0.8)
South Atlantic 0.5 ( 0.4- 0.6) 0.5 ( 0.4- 0.6) 0.5 ( 0.3- 0.8) ∼Delaware ∼ ∼ ∼ ∼District of Columbia ∼ ∼ ∼ ∼Florida 0.5 ( 0.4- 0.7) 0.5 ( 0.4- 0.7) ∼ ∼Georgia 0.5 ( 0.3- 0.9) ∼ ∼ ∼Maryland ∼ ∼ ∼ ∼North Carolina ∼ ∼ ∼ ∼South Carolina ∼ ∼ ∼ ∼Virginia 0.5 ( 0.3- 0.8) ∼ ∼ ∼West Virginia ∼ ∼ ∼ ∼
East South Central 0.5 ( 0.4- 0.7) 0.5 ( 0.4- 0.8) ∼ ∼Alabama ∼ ∼ ∼ ∼Kentucky ∼ ∼ ∼ ∼Mississippi ∼ ∼ ∼ ∼Tennessee ∼ ∼ ∼ ∼
West South Central 0.6 ( 0.5- 0.8) 0.7 ( 0.5- 0.8) ∼ ∼Arkansas ∼ ∼ ∼ ∼

Cancer Incidence and M
ortality, by U.S. C
ensus Region and D
i�ision, State, and Metropolitan A
rea
�0�
Table 2.9.1.2M: Hodgkin Lymphoma. Age-Adjusted Cancer Death Rates∗ and 95% Confidence Intervals, byU.S. Census Region and Division, State, and Race and Ethnicity, United States† (continued)
Males, 2004
Area All Races White Black Hispanic‡§
Louisiana ∼ ∼ ∼ ∼Oklahoma ∼ ∼ ∼ ∼Texas 0.6 ( 0.5- 0.8) 0.6 ( 0.5- 0.8) ∼ ∼
West 0.5 ( 0.4- 0.6) 0.6 ( 0.5- 0.7) ∼ 0.6 ( 0.3- 0.8)
Mountain 0.5 ( 0.4- 0.7) 0.5 ( 0.4- 0.7) ∼ ∼Arizona ∼ ∼ ∼ ∼Colorado ∼ ∼ ∼ ∼Idaho ∼ ∼ ∼ ∼Montana ∼ ∼ ∼ ∼Nevada ∼ ∼ ∼ ∼New Mexico ∼ ∼ ∼ ∼Utah ∼ ∼ ∼ ∼Wyoming ∼ ∼ ∼ ∼
Pacific 0.5 ( 0.4- 0.6) 0.6 ( 0.5- 0.7) ∼ 0.6 ( 0.3- 1.0)
Alaska ∼ ∼ ∼ ∼California 0.6 ( 0.4- 0.7) 0.6 ( 0.5- 0.8) ∼ 0.6 ( 0.3- 1.0)
Hawaii ∼ ∼ ∼ ∼Oregon ∼ ∼ ∼ ∼Washington ∼ ∼ ∼ ∼
∗ Rates are per 100,000 persons and are age-adjusted to the 2000 U.S. standard population (19 age groups - Census P25-1130).† Data are from the National Vital Statistics System (NVSS).‡ Data for specified racial or ethnic populations other than white and black should be interpreted with caution. See Technical Notes.
§ Hispanic origin is not mutually exclusive from race categories (white, black).
∼ Rates are suppressed if fewer than 16 cases were reported in a specific category (area, race, ethnicity).
Note: U.S. rates are as presented in Table 1.1.1.2M.

United
States Cancer Statistics: 2004 Incid
ence and M
ortality
�0�
continued
Table 2.9.1.2F: Hodgkin Lymphoma. Age-Adjusted Cancer Death Rates∗ and 95% Confidence Intervals, byU.S. Census Region and Division, State, and Race and Ethnicity, United States†
Females, 2004
Area All Races White Black Hispanic‡§
United States 0.3 ( 0.3- 0.4) 0.3 ( 0.3- 0.4) 0.3 ( 0.3- 0.4) 0.3 ( 0.2- 0.4)
Northeast 0.3 ( 0.3- 0.4) 0.4 ( 0.3- 0.5) ∼ ∼New England 0.3 ( 0.2- 0.5) 0.4 ( 0.2- 0.5) ∼ ∼Connecticut ∼ ∼ ∼ ∼Maine ∼ ∼ ∼ ∼Massachusetts ∼ ∼ ∼ ∼New Hampshire ∼ ∼ ∼ ∼Rhode Island ∼ ∼ ∼ ∼Vermont ∼ ∼ ∼ ∼
Middle Atlantic 0.3 ( 0.3- 0.4) 0.4 ( 0.3- 0.5) ∼ ∼New Jersey 0.4 ( 0.3- 0.7) 0.5 ( 0.3- 0.8) ∼ ∼New York 0.3 ( 0.2- 0.4) 0.3 ( 0.2- 0.5) ∼ ∼Pennsylvania 0.4 ( 0.2- 0.5) 0.3 ( 0.2- 0.5) ∼ ∼
Midwest 0.3 ( 0.3- 0.4) 0.3 ( 0.3- 0.4) ∼ ∼East North Central 0.3 ( 0.3- 0.4) 0.3 ( 0.2- 0.4) ∼ ∼Illinois 0.3 ( 0.2- 0.4) ∼ ∼ ∼Indiana ∼ ∼ ∼ ∼Michigan 0.4 ( 0.2- 0.6) 0.3 ( 0.2- 0.6) ∼ ∼Ohio 0.4 ( 0.3- 0.6) 0.4 ( 0.3- 0.6) ∼ ∼Wisconsin ∼ ∼ ∼ ∼
West North Central 0.3 ( 0.2- 0.5) 0.4 ( 0.2- 0.5) ∼ ∼Iowa ∼ ∼ ∼ ∼Kansas ∼ ∼ ∼ ∼Minnesota ∼ ∼ ∼ ∼Missouri ∼ ∼ ∼ ∼Nebraska ∼ ∼ ∼ ∼North Dakota ∼ ∼ ∼ ∼South Dakota ∼ ∼ ∼ ∼
South 0.4 ( 0.3- 0.4) 0.4 ( 0.3- 0.4) 0.4 ( 0.3- 0.5) ∼South Atlantic 0.3 ( 0.3- 0.4) 0.3 ( 0.3- 0.4) 0.4 ( 0.3- 0.6) ∼Delaware ∼ ∼ ∼ ∼District of Columbia ∼ ∼ ∼ ∼Florida 0.3 ( 0.2- 0.5) 0.4 ( 0.2- 0.5) ∼ ∼Georgia 0.4 ( 0.2- 0.6) ∼ ∼ ∼Maryland ∼ ∼ ∼ ∼North Carolina ∼ ∼ ∼ ∼South Carolina ∼ ∼ ∼ ∼Virginia ∼ ∼ ∼ ∼West Virginia ∼ ∼ ∼ ∼
East South Central 0.4 ( 0.3- 0.6) 0.4 ( 0.3- 0.6) ∼ ∼Alabama ∼ ∼ ∼ ∼Kentucky ∼ ∼ ∼ ∼Mississippi ∼ ∼ ∼ ∼Tennessee ∼ ∼ ∼ ∼
West South Central 0.4 ( 0.3- 0.5) 0.4 ( 0.3- 0.5) ∼ ∼Arkansas ∼ ∼ ∼ ∼

Cancer Incidence and M
ortality, by U.S. C
ensus Region and D
i�ision, State, and Metropolitan A
rea
�0�
Table 2.9.1.2F: Hodgkin Lymphoma. Age-Adjusted Cancer Death Rates∗ and 95% Confidence Intervals, byU.S. Census Region and Division, State, and Race and Ethnicity, United States† (continued)
Females, 2004
Area All Races White Black Hispanic‡§
Louisiana ∼ ∼ ∼ ∼Oklahoma ∼ ∼ ∼ ∼Texas 0.3 ( 0.2- 0.4) 0.3 ( 0.2- 0.5) ∼ ∼
West 0.3 ( 0.2- 0.4) 0.3 ( 0.3- 0.4) ∼ 0.4 ( 0.2- 0.6)
Mountain 0.2 ( 0.1- 0.4) 0.2 ( 0.2- 0.4) ∼ ∼Arizona ∼ ∼ ∼ ∼Colorado ∼ ∼ ∼ ∼Idaho ∼ ∼ ∼ ∼Montana ∼ ∼ ∼ ∼Nevada ∼ ∼ ∼ ∼New Mexico ∼ ∼ ∼ ∼Utah ∼ ∼ ∼ ∼Wyoming ∼ ∼ ∼ ∼
Pacific 0.3 ( 0.3- 0.4) 0.4 ( 0.3- 0.5) ∼ ∼Alaska ∼ ∼ ∼ ∼California 0.3 ( 0.3- 0.4) 0.4 ( 0.3- 0.5) ∼ ∼Hawaii ∼ ∼ ∼ ∼Oregon ∼ ∼ ∼ ∼Washington ∼ ∼ ∼ ∼
∗ Rates are per 100,000 persons and are age-adjusted to the 2000 U.S. standard population (19 age groups - Census P25-1130).† Data are from the National Vital Statistics System (NVSS).‡ Data for specified racial or ethnic populations other than white and black should be interpreted with caution. See Technical Notes.
§ Hispanic origin is not mutually exclusive from race categories (white, black).
∼ Rates are suppressed if fewer than 16 cases were reported in a specific category (area, race, ethnicity).
Note: U.S. rates are as presented in Table 1.1.1.2F.

United
States Cancer Statistics: 2004 Incid
ence and M
ortality
��0
continued
Table 2.10.1.1M: Kaposi Sarcoma. Age-Adjusted Invasive Cancer Incidence Rates∗ and 95% ConfidenceIntervals, by U.S. Census Region and Division, State and Metropolitan Area, and Race and Ethnicity,United States†‡
Males, 2004
Area All Races White Black Hispanic§
United States 0.8 ( 0.8- 0.9) 0.7 ( 0.6- 0.7) 1.6 ( 1.4- 1.9) 1.6 ( 1.4- 1.9)
Northeast 1.0 ( 0.9- 1.2) 0.8 ( 0.6- 0.9) 2.7 ( 2.1- 3.4) 2.7 ( 2.0- 3.7)
New England 0.9 ( 0.6- 1.1) 0.7 ( 0.5- 0.9) ∼ ∼Connecticut ∼ ∼ ∼ ∼Maine ∼ ∼ ∼ ∼Massachusetts 1.0 ( 0.6- 1.4) 0.8 ( 0.5- 1.2) ∼ ∼New Hampshire ∼ ∼ ∼ ∼Rhode Island ∼ ∼ ∼ ∼Vermont ∼ ∼ ∼ ∼
Middle Atlantic 1.1 ( 0.9- 1.3) 0.8 ( 0.6- 0.9) 2.8 ( 2.2- 3.5) 3.0 ( 2.2- 4.1)
New Jersey 1.0 ( 0.8- 1.4) 0.8 ( 0.5- 1.2) ∼ ∼New York 1.5 ( 1.3- 1.8) 1.1 ( 0.8- 1.3) 3.4 ( 2.5- 4.5) 3.1 ( 2.1- 4.5)
Pennsylvania 0.5 ( 0.4- 0.8) 0.4 ( 0.3- 0.6) ∼ -
Midwest 0.4 ( 0.4- 0.5) 0.3 ( 0.2- 0.3) 1.4 ( 1.0- 2.0) ∼East North Central 0.4 ( 0.3- 0.5) 0.2 ( 0.2- 0.3) 1.5 ( 1.0- 2.0) ∼Illinois 0.8 ( 0.5- 1.0) 0.4 ( 0.3- 0.7) 2.0 ( 1.2- 3.2) ∼Indiana ∼ ∼ ∼ ∼Michigan 0.4 ( 0.3- 0.7) ∼ ∼ ∼Detroit ∼ ∼ ∼ ∼
Ohio 0.3 ( 0.2- 0.5) ∼ ∼ ∼Wisconsin ∼ ∼ ∼ ∼
West North Central 0.4 ( 0.3- 0.6) 0.3 ( 0.2- 0.5) ∼ ∼Iowa ∼ ∼ ∼ ∼Kansas ∼ ∼ ∼ ∼Minnesota ∼ ∼ ∼ ∼Missouri ∼ ∼ ∼ ∼Nebraska ∼ ∼ ∼ ∼North Dakota ∼ ∼ ∼ ∼South Dakota ∼ ∼ ∼ ∼
South 0.8 ( 0.7- 0.8) 0.6 ( 0.5- 0.7) 1.3 ( 1.0- 1.6) 1.3 ( 1.0- 1.7)
South Atlantic 0.9 ( 0.8- 1.0) 0.7 ( 0.6- 0.8) 1.5 ( 1.1- 1.9) 1.6 ( 1.1- 2.3)
Delaware ∼ ∼ ∼ ∼District of Columbia ∼ ∼ ∼ ∼Florida 1.3 ( 1.0- 1.5) 1.2 ( 1.0- 1.5) 1.5 ( 0.9- 2.4) -
Georgia 1.2 ( 0.9- 1.6) 0.8 ( 0.5- 1.2) 2.2 ( 1.5- 3.3) ∼Atlanta 2.6 ( 1.9- 3.6) 1.7 ( 1.0- 2.9) 4.3 ( 2.8- 6.5) ∼
Maryland
North Carolina 0.5 ( 0.3- 0.8) ∼ ∼ ∼South Carolina ∼ ∼ ∼ -
Virginia ∼ ∼ ∼ ∼West Virginia ∼ ∼ ∼ ∼
East South Central 0.4 ( 0.3- 0.6) 0.3 ( 0.2- 0.5) ∼ ∼Alabama ∼ ∼ ∼ ∼Kentucky ∼ ∼ ∼ -
Mississippi ∼ ∼ ∼ ∼Tennessee ∼ ∼ ∼ ∼

Cancer Incidence and M
ortality, by U.S. C
ensus Region and D
i�ision, State, and Metropolitan A
rea
���
Table 2.10.1.1M: Kaposi Sarcoma. Age-Adjusted Invasive Cancer Incidence Rates∗ and 95% ConfidenceIntervals, by U.S. Census Region and Division, State and Metropolitan Area, and Race and Ethnicity,United States†‡ (continued)
Males, 2004
Area All Races White Black Hispanic§
West South Central 0.8 ( 0.6- 0.9) 0.6 ( 0.5- 0.8) 1.4 ( 0.9- 2.1) 1.2 ( 0.8- 1.8)
Arkansas ∼ ∼ ∼ ∼Louisiana 0.9 ( 0.5- 1.4) ∼ ∼ ∼Oklahoma ∼ ∼ ∼ ∼Texas 0.8 ( 0.6- 1.0) 0.7 ( 0.5- 0.9) 1.7 ( 1.0- 2.8) 1.3 ( 0.8- 1.9)
West 1.1 ( 1.0- 1.2) 1.1 ( 1.0- 1.2) 1.8 ( 1.2- 2.6) 1.6 ( 1.3- 2.0)
Mountain 0.5 ( 0.4- 0.7) 0.4 ( 0.3- 0.6) ∼ 1.1 ( 0.6- 1.8)
Arizona ∼ ∼ ∼ ∼Colorado ∼ ∼ ∼ ∼Idaho ∼ ∼ ∼ ∼Montana ∼ ∼ ∼ ∼Nevada ∼ ∼ ∼ ∼New Mexico ∼ ∼ ∼ ∼Utah ∼ ∼ ∼ ∼Wyoming ∼ ∼ ∼ ∼
Pacific 1.3 ( 1.2- 1.5) 1.4 ( 1.2- 1.5) 1.9 ( 1.3- 2.8) 1.8 ( 1.4- 2.3)
Alaska ∼ ∼ ∼ ∼California 1.5 ( 1.4- 1.7) 1.6 ( 1.4- 1.8) 2.1 ( 1.4- 3.2) 1.9 ( 1.4- 2.4)
San Francisco-Oakland 2.3 ( 1.7- 3.0) 2.6 ( 1.9- 3.6) ∼ ∼San Jose-Monterey ∼ ∼ ∼ ∼Los Angeles 2.4 ( 2.0- 2.9) 2.5 ( 2.0- 3.1) ∼ 2.2 ( 1.5- 3.2)
Hawaii ∼ ∼ ∼ ∼Oregon ∼ ∼ ∼ ∼Washington 0.8 ( 0.5- 1.2) 0.8 ( 0.5- 1.3) ∼ ∼
Seattle-Puget Sound 1.0 ( 0.7- 1.6) 1.1 ( 0.6- 1.7) ∼ ∼∗ Rates are per 100,000 persons and are age-adjusted to the 2000 U.S. standard population (19 age groups - Census P25-1130).† Data are from all state and metropolitan area cancer registries, except Maryland. Included data cover approximately 98% of the population and met data
quality criteria for all invasive cancer sites combined. See Appendix B for registry-specific data quality information.‡ Invasive cancers only.
§ Data for specified racial or ethnic populations other than white and black should be interpreted with caution. See Technical Notes.
Hispanic origin is not mutually exclusive from race categories (white, black).
∼ Rates are suppressed if fewer than 16 cases were reported in a specific category (area, race, ethnicity).
- Rates are suppressed at the state’s or metropolitan area’s request. See Technical Notes.
Notes: Cases from suppressed rates are included in the U.S. and region/division rates. U.S. rates are as presented in Table 1.1.1.1M. Michigan, Georgia,
California, and Washington state rates each include cases from the SEER metropolitan areas.

United
States Cancer Statistics: 2004 Incid
ence and M
ortality
���
continued
Table 2.10.1.1F: Kaposi Sarcoma. Age-Adjusted Invasive Cancer Incidence Rates∗ and 95% ConfidenceIntervals, by U.S. Census Region and Division, State and Metropolitan Area, and Race and Ethnicity,United States†‡
Females, 2004
Area All Races White Black Hispanic§
United States 0.1 ( 0.1- 0.1) 0.1 ( 0.1- 0.1) 0.2 ( 0.1- 0.3) 0.2 ( 0.1- 0.3)
Northeast 0.1 ( 0.1- 0.2) 0.1 ( 0.0- 0.1) ∼ ∼New England ∼ ∼ ∼ ∼Connecticut ∼ ∼ ∼ ∼Maine ∼ ∼ ∼ ∼Massachusetts ∼ ∼ ∼ ∼New Hampshire ∼ ∼ ∼ ∼Rhode Island ∼ ∼ ∼ ∼Vermont ∼ ∼ ∼ ∼
Middle Atlantic 0.2 ( 0.1- 0.2) 0.1 ( 0.0- 0.1) ∼ ∼New Jersey ∼ ∼ ∼ ∼New York 0.2 ( 0.1- 0.3) ∼ ∼ ∼Pennsylvania ∼ ∼ ∼ -
Midwest 0.0 ( 0.0- 0.1) ∼ ∼ ∼East North Central ∼ ∼ ∼ ∼Illinois ∼ ∼ ∼ ∼Indiana ∼ ∼ ∼ ∼Michigan ∼ ∼ ∼ ∼Detroit ∼ ∼ ∼ ∼
Ohio ∼ ∼ ∼ ∼Wisconsin ∼ ∼ ∼ ∼
West North Central ∼ ∼ ∼ ∼Iowa ∼ ∼ ∼ ∼Kansas ∼ ∼ ∼ ∼Minnesota ∼ ∼ ∼ ∼Missouri ∼ ∼ ∼ ∼Nebraska ∼ ∼ ∼ ∼North Dakota ∼ ∼ ∼ ∼South Dakota ∼ ∼ ∼ ∼
South 0.1 ( 0.1- 0.1) 0.1 ( 0.1- 0.1) ∼ ∼South Atlantic 0.1 ( 0.0- 0.1) ∼ ∼ ∼Delaware ∼ ∼ ∼ ∼District of Columbia ∼ ∼ ∼ ∼Florida ∼ ∼ ∼ -
Georgia ∼ ∼ ∼ ∼Atlanta ∼ ∼ ∼ ∼
Maryland
North Carolina ∼ ∼ ∼ ∼South Carolina ∼ ∼ ∼ -
Virginia ∼ ∼ ∼ ∼West Virginia ∼ ∼ ∼ ∼
East South Central ∼ ∼ ∼ ∼Alabama ∼ ∼ ∼ ∼Kentucky ∼ ∼ ∼ -
Mississippi ∼ ∼ ∼ ∼Tennessee ∼ ∼ ∼ ∼
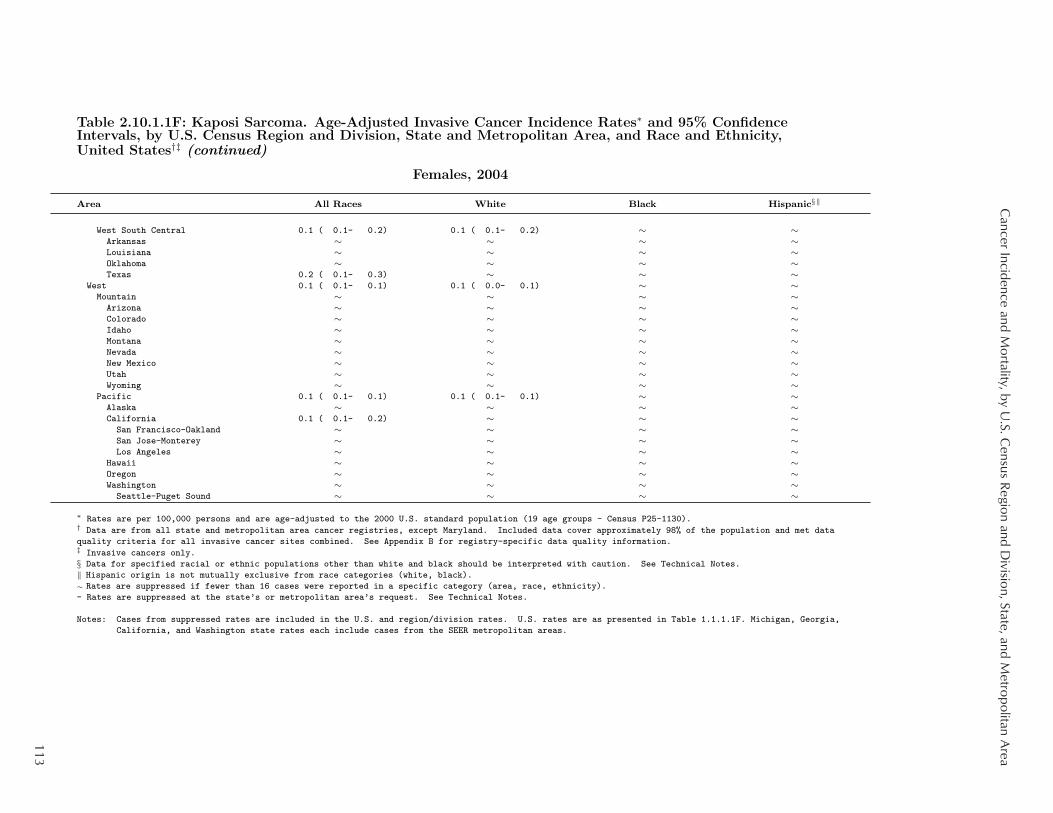
Cancer Incidence and M
ortality, by U.S. C
ensus Region and D
i�ision, State, and Metropolitan A
rea
��3
Table 2.10.1.1F: Kaposi Sarcoma. Age-Adjusted Invasive Cancer Incidence Rates∗ and 95% ConfidenceIntervals, by U.S. Census Region and Division, State and Metropolitan Area, and Race and Ethnicity,United States†‡ (continued)
Females, 2004
Area All Races White Black Hispanic§
West South Central 0.1 ( 0.1- 0.2) 0.1 ( 0.1- 0.2) ∼ ∼Arkansas ∼ ∼ ∼ ∼Louisiana ∼ ∼ ∼ ∼Oklahoma ∼ ∼ ∼ ∼Texas 0.2 ( 0.1- 0.3) ∼ ∼ ∼
West 0.1 ( 0.1- 0.1) 0.1 ( 0.0- 0.1) ∼ ∼Mountain ∼ ∼ ∼ ∼Arizona ∼ ∼ ∼ ∼Colorado ∼ ∼ ∼ ∼Idaho ∼ ∼ ∼ ∼Montana ∼ ∼ ∼ ∼Nevada ∼ ∼ ∼ ∼New Mexico ∼ ∼ ∼ ∼Utah ∼ ∼ ∼ ∼Wyoming ∼ ∼ ∼ ∼
Pacific 0.1 ( 0.1- 0.1) 0.1 ( 0.1- 0.1) ∼ ∼Alaska ∼ ∼ ∼ ∼California 0.1 ( 0.1- 0.2) ∼ ∼ ∼
San Francisco-Oakland ∼ ∼ ∼ ∼San Jose-Monterey ∼ ∼ ∼ ∼Los Angeles ∼ ∼ ∼ ∼
Hawaii ∼ ∼ ∼ ∼Oregon ∼ ∼ ∼ ∼Washington ∼ ∼ ∼ ∼Seattle-Puget Sound ∼ ∼ ∼ ∼
∗ Rates are per 100,000 persons and are age-adjusted to the 2000 U.S. standard population (19 age groups - Census P25-1130).† Data are from all state and metropolitan area cancer registries, except Maryland. Included data cover approximately 98% of the population and met data
quality criteria for all invasive cancer sites combined. See Appendix B for registry-specific data quality information.‡ Invasive cancers only.
§ Data for specified racial or ethnic populations other than white and black should be interpreted with caution. See Technical Notes.
Hispanic origin is not mutually exclusive from race categories (white, black).
∼ Rates are suppressed if fewer than 16 cases were reported in a specific category (area, race, ethnicity).
- Rates are suppressed at the state’s or metropolitan area’s request. See Technical Notes.
Notes: Cases from suppressed rates are included in the U.S. and region/division rates. U.S. rates are as presented in Table 1.1.1.1F. Michigan, Georgia,
California, and Washington state rates each include cases from the SEER metropolitan areas.

United
States Cancer Statistics: 2004 Incid
ence and M
ortality
���
continued
Table 2.11.1.1M: Kidney and Renal Pelvis. Age-Adjusted Invasive Cancer Incidence Rates∗ and 95%Confidence Intervals, by U.S. Census Region and Division, State and Metropolitan Area, and Race andEthnicity, United States†‡
Males, 2004
Area All Races White Black Hispanic§
United States 19.1 ( 18.9- 19.4) 19.2 ( 19.0- 19.5) 19.9 ( 19.1- 20.8) 17.7 ( 16.8- 18.6)
Northeast 20.4 ( 19.8- 20.9) 20.8 ( 20.2- 21.4) 17.9 ( 16.1- 19.7) 14.3 ( 12.4- 16.4)
New England 19.3 ( 18.3- 20.4) 19.3 ( 18.3- 20.4) 21.6 ( 16.0- 28.3) 12.5 ( 8.0- 18.3)
Connecticut 18.3 ( 16.3- 20.5) 18.2 ( 16.2- 20.5) 19.8 ( 12.2- 30.3) ∼Maine 18.2 ( 15.2- 21.6) 18.1 ( 15.1- 21.6) ∼ ∼Massachusetts 19.5 ( 18.0- 21.1) 19.7 ( 18.1- 21.4) 22.7 ( 14.7- 33.1) ∼New Hampshire 18.5 ( 15.2- 22.2) 18.2 ( 14.9- 21.9) ∼ ∼Rhode Island 23.5 ( 19.4- 28.1) 23.1 ( 19.0- 27.9) ∼ ∼Vermont 19.7 ( 15.0- 25.3) 19.9 ( 15.2- 25.6) ∼ ∼
Middle Atlantic 20.8 ( 20.1- 21.4) 21.3 ( 20.6- 22.0) 17.4 ( 15.6- 19.3) 14.5 ( 12.5- 16.8)
New Jersey 20.5 ( 19.1- 22.0) 21.4 ( 19.9- 23.1) 16.7 ( 12.9- 21.2) 16.4 ( 12.3- 21.4)
New York 20.3 ( 19.4- 21.3) 21.5 ( 20.4- 22.6) 14.9 ( 12.7- 17.3) 13.5 ( 11.0- 16.2)
Pennsylvania 21.5 ( 20.3- 22.6) 21.1 ( 19.9- 22.3) 24.3 ( 19.9- 29.3) -
Midwest 19.3 ( 18.8- 19.8) 19.0 ( 18.5- 19.5) 21.0 ( 19.1- 23.0) 13.8 ( 11.1- 16.8)
East North Central 19.3 ( 18.7- 19.9) 19.0 ( 18.4- 19.6) 21.1 ( 19.0- 23.3) 14.1 ( 11.1- 17.6)
Illinois 20.7 ( 19.5- 22.0) 21.2 ( 19.9- 22.6) 19.0 ( 15.7- 22.8) 15.3 ( 11.1- 20.3)
Indiana 22.6 ( 20.9- 24.5) 22.5 ( 20.7- 24.4) 22.1 ( 15.6- 30.2) ∼Michigan 18.2 ( 17.0- 19.4) 17.5 ( 16.3- 18.9) 22.7 ( 18.6- 27.4) ∼
Detroit 19.7 ( 17.6- 21.8) 19.5 ( 17.2- 22.0) 21.6 ( 17.0- 27.0) ∼Ohio 17.6 ( 16.5- 18.8) 16.9 ( 15.7- 18.1) 21.3 ( 17.3- 25.9) ∼Wisconsin 18.3 ( 16.7- 20.0) 18.0 ( 16.4- 19.7) 23.3 ( 13.4- 37.2) ∼
West North Central 19.4 ( 18.5- 20.3) 19.1 ( 18.2- 20.0) 19.8 ( 15.5- 24.8) 12.2 ( 7.1- 19.3)
Iowa 20.1 ( 17.9- 22.5) 20.0 ( 17.7- 22.4) ∼ ∼Kansas 17.2 ( 15.0- 19.6) 17.0 ( 14.7- 19.4) ∼ ∼Minnesota 20.3 ( 18.5- 22.2) 19.6 ( 17.8- 21.5) ∼ ∼Missouri 19.9 ( 18.2- 21.6) 19.8 ( 18.1- 21.7) 17.5 ( 12.6- 23.6) ∼Nebraska 17.8 ( 15.0- 20.9) 17.4 ( 14.6- 20.6) ∼ ∼North Dakota 19.5 ( 15.1- 25.0) 18.5 ( 14.1- 23.8) ∼ ∼South Dakota 18.6 ( 14.6- 23.5) 18.2 ( 14.1- 23.1) ∼ ∼
South 19.7 ( 19.3- 20.1) 19.7 ( 19.3- 20.2) 20.2 ( 19.0- 21.4) 19.0 ( 17.5- 20.5)
South Atlantic 18.8 ( 18.2- 19.3) 18.8 ( 18.2- 19.4) 18.7 ( 17.2- 20.3) 15.4 ( 13.5- 17.6)
Delaware 19.2 ( 15.1- 24.1) 19.2 ( 14.7- 24.5) ∼ ∼District of Columbia 10.5 ( 6.8- 15.4) ∼ 11.3 ( 6.5- 18.1) ∼Florida 18.3 ( 17.5- 19.2) 18.5 ( 17.6- 19.4) 17.2 ( 14.5- 20.4) -
Georgia 18.4 ( 16.9- 19.9) 18.7 ( 17.0- 20.5) 18.5 ( 15.3- 22.1) ∼Atlanta 16.8 ( 14.2- 19.6) 17.3 ( 14.2- 20.8) 17.5 ( 12.5- 23.7) ∼
Maryland
North Carolina 22.8 ( 21.3- 24.4) 22.4 ( 20.8- 24.2) 23.8 ( 20.1- 27.9) ∼South Carolina 17.2 ( 15.4- 19.2) 17.5 ( 15.4- 19.7) 16.3 ( 12.6- 20.7) -
Virginia 17.8 ( 16.4- 19.4) 17.7 ( 16.1- 19.4) 19.9 ( 16.2- 24.3) ∼West Virginia 19.0 ( 16.4- 22.0) 19.0 ( 16.3- 22.0) ∼ ∼
East South Central 19.4 ( 18.4- 20.4) 19.4 ( 18.3- 20.4) 19.7 ( 17.2- 22.5) ∼Alabama 19.8 ( 18.0- 21.8) 19.9 ( 17.8- 22.2) 19.3 ( 15.2- 24.0) ∼Kentucky 19.1 ( 17.1- 21.2) 18.7 ( 16.7- 20.9) 26.6 ( 17.6- 38.5) -
Mississippi 19.7 ( 17.2- 22.3) 19.7 ( 16.9- 22.9) 18.9 ( 14.5- 24.3) ∼Tennessee 19.2 ( 17.6- 20.9) 19.3 ( 17.6- 21.2) 18.9 ( 14.2- 24.6) ∼

Cancer Incidence and M
ortality, by U.S. C
ensus Region and D
i�ision, State, and Metropolitan A
rea
���
Table 2.11.1.1M: Kidney and Renal Pelvis. Age-Adjusted Invasive Cancer Incidence Rates∗ and 95%Confidence Intervals, by U.S. Census Region and Division, State and Metropolitan Area, and Race andEthnicity, United States†‡ (continued)
Males, 2004
Area All Races White Black Hispanic§
West South Central 21.6 ( 20.8- 22.4) 21.4 ( 20.6- 22.3) 23.8 ( 21.3- 26.5) 21.8 ( 19.8- 24.0)
Arkansas 20.4 ( 18.1- 23.0) 20.5 ( 18.0- 23.3) 20.8 ( 13.8- 29.8) ∼Louisiana 22.9 ( 20.8- 25.2) 22.7 ( 20.3- 25.3) 24.0 ( 19.6- 29.0) ∼Oklahoma 19.3 ( 17.2- 21.5) 18.7 ( 16.5- 21.0) ∼ ∼Texas 21.9 ( 20.9- 22.9) 21.9 ( 20.8- 23.0) 25.4 ( 21.9- 29.3) 22.3 ( 20.1- 24.5)
West 17.0 ( 16.5- 17.5) 17.4 ( 16.9- 17.9) 21.1 ( 18.5- 24.1) 18.5 ( 17.1- 20.0)
Mountain 16.1 ( 15.3- 17.0) 16.0 ( 15.2- 16.9) 13.4 ( 8.8- 19.3) 18.1 ( 15.5- 21.0)
Arizona 16.0 ( 14.5- 17.6) 15.5 ( 14.0- 17.1) ∼ 17.2 ( 12.9- 22.4)
Colorado 17.1 ( 15.2- 19.1) 17.3 ( 15.4- 19.4) ∼ 23.0 ( 16.6- 30.7)
Idaho 18.1 ( 14.9- 21.8) 18.4 ( 15.1- 22.2) ∼ ∼Montana 17.1 ( 13.6- 21.3) 17.1 ( 13.5- 21.4) ∼ ∼Nevada 16.4 ( 14.0- 19.0) 16.4 ( 13.9- 19.3) ∼ ∼New Mexico 15.8 ( 13.2- 18.6) 15.7 ( 13.1- 18.8) ∼ 16.5 ( 12.1- 21.9)
Utah 13.5 ( 11.1- 16.3) 13.9 ( 11.4- 16.7) ∼ ∼Wyoming 13.7 ( 9.6- 19.1) 13.5 ( 9.4- 18.8) ∼ ∼
Pacific 17.4 ( 16.8- 18.0) 18.1 ( 17.4- 18.7) 22.8 ( 19.7- 26.2) 18.6 ( 17.0- 20.4)
Alaska 20.7 ( 14.3- 28.7) 19.8 ( 12.8- 28.9) ∼ ∼California 17.1 ( 16.4- 17.8) 18.1 ( 17.3- 18.8) 21.7 ( 18.6- 25.3) 18.6 ( 16.9- 20.4)
San Francisco-Oakland 16.4 ( 14.6- 18.3) 17.5 ( 15.3- 19.9) 26.5 ( 18.8- 36.0) 13.5 ( 8.6- 19.9)
San Jose-Monterey 17.6 ( 15.1- 20.4) 18.0 ( 15.1- 21.2) ∼ 22.9 ( 15.6- 32.2)
Los Angeles 15.6 ( 14.4- 16.9) 17.0 ( 15.5- 18.6) 16.9 ( 12.8- 21.8) 16.8 ( 14.2- 19.7)
Hawaii 14.2 ( 11.4- 17.4) 19.5 ( 13.4- 27.6) ∼ ∼Oregon 17.6 ( 15.7- 19.7) 17.4 ( 15.4- 19.5) ∼ ∼Washington 19.6 ( 18.0- 21.4) 18.7 ( 17.1- 20.5) 33.2 ( 20.6- 50.2) 25.3 ( 14.1- 40.7)
Seattle-Puget Sound 19.9 ( 18.0- 22.1) 19.8 ( 17.7- 22.1) 33.5 ( 20.2- 52.0) ∼∗ Rates are per 100,000 persons and are age-adjusted to the 2000 U.S. standard population (19 age groups - Census P25-1130).† Data are from all state and metropolitan area cancer registries, except Maryland. Included data cover approximately 98% of the population and met data
quality criteria for all invasive cancer sites combined. See Appendix B for registry-specific data quality information.‡ Invasive cancers only.
§ Data for specified racial or ethnic populations other than white and black should be interpreted with caution. See Technical Notes.
Hispanic origin is not mutually exclusive from race categories (white, black).
∼ Rates are suppressed if fewer than 16 cases were reported in a specific category (area, race, ethnicity).
- Rates are suppressed at the state’s or metropolitan area’s request. See Technical Notes.
Notes: Cases from suppressed rates are included in the U.S. and region/division rates. U.S. rates are as presented in Table 1.1.1.1M. Michigan, Georgia,
California, and Washington state rates each include cases from the SEER metropolitan areas.

United
States Cancer Statistics: 2004 Incid
ence and M
ortality
���
continued
Table 2.11.1.1F: Kidney and Renal Pelvis. Age-Adjusted Invasive Cancer Incidence Rates∗ and 95%Confidence Intervals, by U.S. Census Region and Division, State and Metropolitan Area, and Race andEthnicity, United States†‡
Females, 2004
Area All Races White Black Hispanic§
United States 10.0 ( 9.9- 10.2) 10.2 ( 10.0- 10.3) 9.9 ( 9.4- 10.4) 10.1 ( 9.6- 10.7)
Northeast 10.3 ( 10.0- 10.7) 10.7 ( 10.3- 11.1) 9.0 ( 8.0- 10.1) 9.2 ( 7.9- 10.6)
New England 10.3 ( 9.7- 11.1) 10.6 ( 9.9- 11.4) 7.3 ( 4.7- 10.8) 7.8 ( 4.7- 12.0)
Connecticut 9.9 ( 8.5- 11.3) 10.1 ( 8.7- 11.7) ∼ ∼Maine 12.3 ( 10.0- 15.0) 12.4 ( 10.0- 15.1) ∼ ∼Massachusetts 9.7 ( 8.7- 10.8) 10.1 ( 9.0- 11.2) ∼ ∼New Hampshire 10.2 ( 8.0- 12.9) 10.0 ( 7.8- 12.7) ∼ ∼Rhode Island 14.0 ( 11.2- 17.2) 14.3 ( 11.4- 17.8) ∼ ∼Vermont 8.3 ( 5.6- 11.9) 8.4 ( 5.7- 12.1) ∼ ∼
Middle Atlantic 10.3 ( 9.9- 10.7) 10.7 ( 10.2- 11.1) 9.2 ( 8.2- 10.4) 9.4 ( 8.0- 11.0)
New Jersey 10.7 ( 9.8- 11.6) 11.2 ( 10.2- 12.3) 9.4 ( 7.1- 12.2) 9.6 ( 6.8- 13.1)
New York 10.0 ( 9.4- 10.6) 10.6 ( 10.0- 11.4) 7.9 ( 6.6- 9.4) 9.4 ( 7.7- 11.3)
Pennsylvania 10.6 ( 9.9- 11.4) 10.4 ( 9.6- 11.2) 12.5 ( 9.9- 15.6) -
Midwest 10.7 ( 10.3- 11.0) 10.7 ( 10.3- 11.0) 10.2 ( 9.1- 11.4) 10.0 ( 7.9- 12.5)
East North Central 10.8 ( 10.4- 11.2) 10.9 ( 10.5- 11.3) 9.9 ( 8.7- 11.2) 10.8 ( 8.3- 13.8)
Illinois 11.3 ( 10.6- 12.2) 11.7 ( 10.8- 12.6) 10.0 ( 8.0- 12.2) 7.3 ( 4.8- 10.5)
Indiana 12.3 ( 11.2- 13.5) 12.5 ( 11.3- 13.8) 9.2 ( 5.7- 13.9) ∼Michigan 9.8 ( 9.0- 10.6) 9.8 ( 9.0- 10.8) 9.5 ( 7.3- 12.2) ∼
Detroit 11.3 ( 9.9- 12.7) 11.4 ( 9.8- 13.1) 11.5 ( 8.7- 14.8) ∼Ohio 10.7 ( 9.9- 11.5) 10.5 ( 9.7- 11.4) 10.1 ( 7.8- 12.9) ∼Wisconsin 10.1 ( 9.0- 11.3) 10.0 ( 8.9- 11.2) ∼ ∼
West North Central 10.3 ( 9.8- 11.0) 10.2 ( 9.6- 10.9) 11.9 ( 9.0- 15.5) ∼Iowa 10.8 ( 9.3- 12.4) 10.5 ( 9.0- 12.1) ∼ ∼Kansas 9.7 ( 8.1- 11.4) 9.7 ( 8.1- 11.4) ∼ ∼Minnesota 10.1 ( 9.0- 11.4) 9.9 ( 8.7- 11.2) ∼ ∼Missouri 10.7 ( 9.6- 11.9) 10.6 ( 9.4- 11.8) 13.2 ( 9.4- 18.0) ∼Nebraska 10.2 ( 8.3- 12.4) 10.5 ( 8.5- 12.8) ∼ ∼North Dakota 9.7 ( 6.8- 13.4) 10.0 ( 7.0- 14.0) ∼ ∼South Dakota 10.3 ( 7.5- 13.9) 10.1 ( 7.3- 13.8) ∼ ∼
South 10.3 ( 10.1- 10.6) 10.4 ( 10.1- 10.7) 10.2 ( 9.5- 10.9) 10.8 ( 9.9- 11.8)
South Atlantic 9.6 ( 9.3- 10.0) 9.6 ( 9.2- 10.0) 9.8 ( 8.9- 10.8) 8.5 ( 7.3- 10.0)
Delaware 12.8 ( 9.9- 16.5) 12.3 ( 9.1- 16.4) ∼ ∼District of Columbia 6.7 ( 4.1- 10.3) ∼ 7.8 ( 4.5- 12.7) ∼Florida 9.3 ( 8.7- 9.9) 9.5 ( 8.9- 10.1) 8.2 ( 6.6- 10.1) -
Georgia 9.6 ( 8.6- 10.5) 9.5 ( 8.5- 10.6) 9.9 ( 8.1- 12.1) ∼Atlanta 8.9 ( 7.3- 10.6) 8.7 ( 6.8- 10.9) 9.5 ( 6.8- 13.0) ∼
Maryland
North Carolina 10.2 ( 9.3- 11.1) 10.0 ( 9.0- 11.1) 11.1 ( 9.0- 13.5) ∼South Carolina 9.8 ( 8.6- 11.1) 9.1 ( 7.8- 10.7) 11.6 ( 9.0- 14.7) -
Virginia 9.3 ( 8.4- 10.3) 9.3 ( 8.3- 10.5) 8.8 ( 6.7- 11.2) ∼West Virginia 10.7 ( 8.9- 12.8) 10.4 ( 8.6- 12.5) ∼ ∼
East South Central 10.8 ( 10.1- 11.4) 10.9 ( 10.2- 11.7) 10.2 ( 8.7- 11.9) ∼Alabama 10.4 ( 9.3- 11.7) 10.5 ( 9.2- 12.0) 10.7 ( 8.2- 13.8) ∼Kentucky 11.3 ( 10.0- 12.8) 11.2 ( 9.8- 12.7) 12.8 ( 7.6- 20.2) -
Mississippi 11.8 ( 10.2- 13.6) 12.7 ( 10.7- 15.0) 10.0 ( 7.3- 13.3) ∼Tennessee 10.1 ( 9.1- 11.3) 10.3 ( 9.2- 11.6) 8.9 ( 6.3- 12.2) ∼

Cancer Incidence and M
ortality, by U.S. C
ensus Region and D
i�ision, State, and Metropolitan A
rea
���
Table 2.11.1.1F: Kidney and Renal Pelvis. Age-Adjusted Invasive Cancer Incidence Rates∗ and 95%Confidence Intervals, by U.S. Census Region and Division, State and Metropolitan Area, and Race andEthnicity, United States†‡ (continued)
Females, 2004
Area All Races White Black Hispanic§
West South Central 11.3 ( 10.8- 11.8) 11.4 ( 10.9- 12.0) 11.0 ( 9.6- 12.5) 12.6 ( 11.2- 14.2)
Arkansas 8.9 ( 7.5- 10.5) 9.0 ( 7.5- 10.8) 8.4 ( 4.8- 13.6) ∼Louisiana 11.9 ( 10.5- 13.3) 12.6 ( 11.0- 14.4) 10.1 ( 7.8- 12.9) ∼Oklahoma 12.0 ( 10.6- 13.7) 11.5 ( 9.9- 13.2) ∼ ∼Texas 11.5 ( 10.8- 12.1) 11.6 ( 10.9- 12.3) 12.0 ( 10.0- 14.3) 12.8 ( 11.4- 14.4)
West 8.5 ( 8.2- 8.8) 8.9 ( 8.5- 9.2) 9.3 ( 7.7- 11.0) 9.9 ( 9.0- 10.9)
Mountain 8.8 ( 8.2- 9.4) 8.8 ( 8.2- 9.4) 9.1 ( 5.7- 13.8) 11.3 ( 9.4- 13.5)
Arizona 8.7 ( 7.7- 9.9) 8.7 ( 7.7- 9.9) ∼ 13.5 ( 9.9- 17.9)
Colorado 9.1 ( 7.9- 10.5) 9.2 ( 8.0- 10.6) ∼ 14.4 ( 9.7- 20.3)
Idaho 9.7 ( 7.5- 12.3) 9.9 ( 7.7- 12.6) ∼ ∼Montana 9.5 ( 7.0- 12.6) 8.6 ( 6.2- 11.6) ∼ ∼Nevada 9.3 ( 7.6- 11.2) 9.4 ( 7.6- 11.5) ∼ ∼New Mexico 8.4 ( 6.7- 10.4) 8.2 ( 6.5- 10.3) ∼ 8.8 ( 5.9- 12.6)
Utah 7.1 ( 5.5- 9.0) 7.2 ( 5.5- 9.1) ∼ ∼Wyoming 7.8 ( 4.9- 11.9) 8.0 ( 5.0- 12.2) ∼ ∼
Pacific 8.4 ( 8.0- 8.8) 8.9 ( 8.5- 9.4) 9.3 ( 7.6- 11.2) 9.5 ( 8.5- 10.6)
Alaska 10.0 ( 6.4- 14.9) 8.7 ( 4.9- 14.2) ∼ ∼California 8.0 ( 7.6- 8.4) 8.6 ( 8.1- 9.1) 9.6 ( 7.8- 11.6) 9.6 ( 8.5- 10.7)
San Francisco-Oakland 7.5 ( 6.4- 8.7) 7.3 ( 6.1- 8.8) 10.5 ( 6.6- 16.0) 6.9 ( 4.0- 10.8)
San Jose-Monterey 8.2 ( 6.7- 10.1) 9.9 ( 7.9- 12.2) ∼ 10.9 ( 6.7- 16.7)
Los Angeles 7.3 ( 6.5- 8.1) 7.9 ( 7.0- 8.9) 9.9 ( 7.3- 13.1) 7.5 ( 6.1- 9.1)
Hawaii 7.2 ( 5.4- 9.5) ∼ ∼ ∼Oregon 10.3 ( 8.9- 11.8) 10.1 ( 8.7- 11.7) ∼ ∼Washington 9.6 ( 8.5- 10.7) 9.9 ( 8.8- 11.1) ∼ ∼
Seattle-Puget Sound 9.3 ( 8.0- 10.6) 10.0 ( 8.6- 11.6) ∼ ∼∗ Rates are per 100,000 persons and are age-adjusted to the 2000 U.S. standard population (19 age groups - Census P25-1130).† Data are from all state and metropolitan area cancer registries, except Maryland. Included data cover approximately 98% of the population and met data
quality criteria for all invasive cancer sites combined. See Appendix B for registry-specific data quality information.‡ Invasive cancers only.
§ Data for specified racial or ethnic populations other than white and black should be interpreted with caution. See Technical Notes.
Hispanic origin is not mutually exclusive from race categories (white, black).
∼ Rates are suppressed if fewer than 16 cases were reported in a specific category (area, race, ethnicity).
- Rates are suppressed at the state’s or metropolitan area’s request. See Technical Notes.
Notes: Cases from suppressed rates are included in the U.S. and region/division rates. U.S. rates are as presented in Table 1.1.1.1F. Michigan, Georgia,
California, and Washington state rates each include cases from the SEER metropolitan areas.
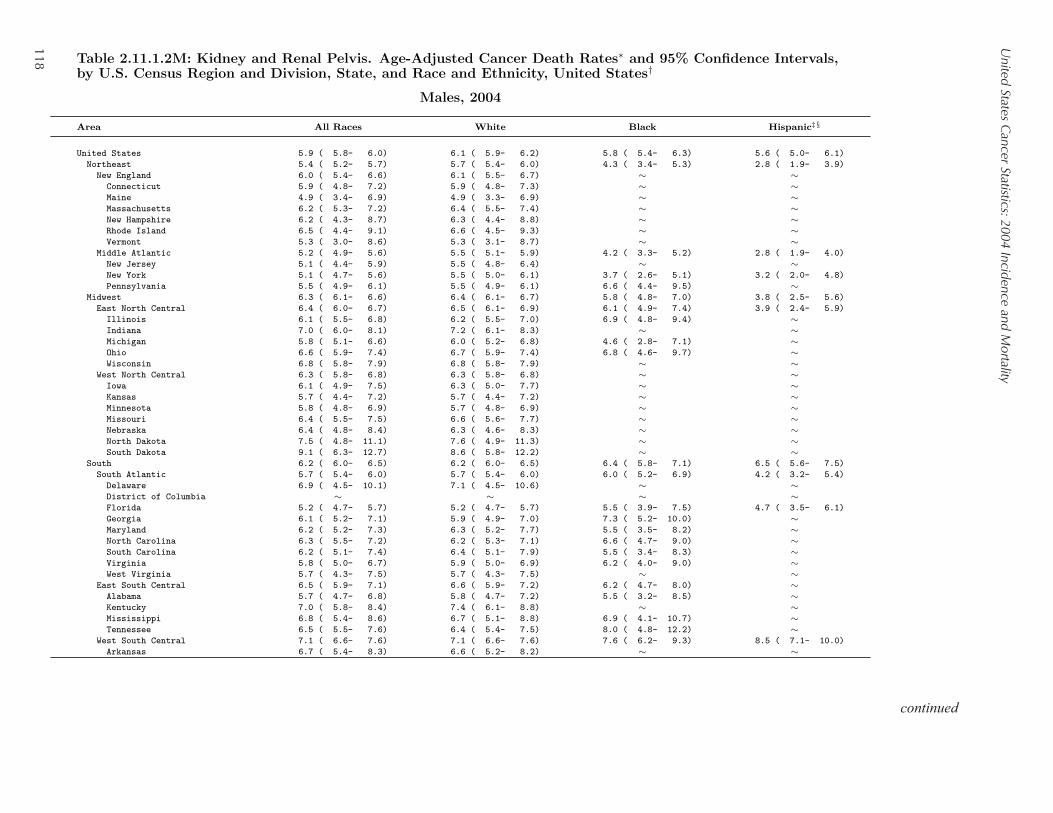
United
States Cancer Statistics: 2004 Incid
ence and M
ortality
���
continued
Table 2.11.1.2M: Kidney and Renal Pelvis. Age-Adjusted Cancer Death Rates∗ and 95% Confidence Intervals,by U.S. Census Region and Division, State, and Race and Ethnicity, United States†
Males, 2004
Area All Races White Black Hispanic‡§
United States 5.9 ( 5.8- 6.0) 6.1 ( 5.9- 6.2) 5.8 ( 5.4- 6.3) 5.6 ( 5.0- 6.1)
Northeast 5.4 ( 5.2- 5.7) 5.7 ( 5.4- 6.0) 4.3 ( 3.4- 5.3) 2.8 ( 1.9- 3.9)
New England 6.0 ( 5.4- 6.6) 6.1 ( 5.5- 6.7) ∼ ∼Connecticut 5.9 ( 4.8- 7.2) 5.9 ( 4.8- 7.3) ∼ ∼Maine 4.9 ( 3.4- 6.9) 4.9 ( 3.3- 6.9) ∼ ∼Massachusetts 6.2 ( 5.3- 7.2) 6.4 ( 5.5- 7.4) ∼ ∼New Hampshire 6.2 ( 4.3- 8.7) 6.3 ( 4.4- 8.8) ∼ ∼Rhode Island 6.5 ( 4.4- 9.1) 6.6 ( 4.5- 9.3) ∼ ∼Vermont 5.3 ( 3.0- 8.6) 5.3 ( 3.1- 8.7) ∼ ∼
Middle Atlantic 5.2 ( 4.9- 5.6) 5.5 ( 5.1- 5.9) 4.2 ( 3.3- 5.2) 2.8 ( 1.9- 4.0)
New Jersey 5.1 ( 4.4- 5.9) 5.5 ( 4.8- 6.4) ∼ ∼New York 5.1 ( 4.7- 5.6) 5.5 ( 5.0- 6.1) 3.7 ( 2.6- 5.1) 3.2 ( 2.0- 4.8)
Pennsylvania 5.5 ( 4.9- 6.1) 5.5 ( 4.9- 6.1) 6.6 ( 4.4- 9.5) ∼Midwest 6.3 ( 6.1- 6.6) 6.4 ( 6.1- 6.7) 5.8 ( 4.8- 7.0) 3.8 ( 2.5- 5.6)
East North Central 6.4 ( 6.0- 6.7) 6.5 ( 6.1- 6.9) 6.1 ( 4.9- 7.4) 3.9 ( 2.4- 5.9)
Illinois 6.1 ( 5.5- 6.8) 6.2 ( 5.5- 7.0) 6.9 ( 4.8- 9.4) ∼Indiana 7.0 ( 6.0- 8.1) 7.2 ( 6.1- 8.3) ∼ ∼Michigan 5.8 ( 5.1- 6.6) 6.0 ( 5.2- 6.8) 4.6 ( 2.8- 7.1) ∼Ohio 6.6 ( 5.9- 7.4) 6.7 ( 5.9- 7.4) 6.8 ( 4.6- 9.7) ∼Wisconsin 6.8 ( 5.8- 7.9) 6.8 ( 5.8- 7.9) ∼ ∼
West North Central 6.3 ( 5.8- 6.8) 6.3 ( 5.8- 6.8) ∼ ∼Iowa 6.1 ( 4.9- 7.5) 6.3 ( 5.0- 7.7) ∼ ∼Kansas 5.7 ( 4.4- 7.2) 5.7 ( 4.4- 7.2) ∼ ∼Minnesota 5.8 ( 4.8- 6.9) 5.7 ( 4.8- 6.9) ∼ ∼Missouri 6.4 ( 5.5- 7.5) 6.6 ( 5.6- 7.7) ∼ ∼Nebraska 6.4 ( 4.8- 8.4) 6.3 ( 4.6- 8.3) ∼ ∼North Dakota 7.5 ( 4.8- 11.1) 7.6 ( 4.9- 11.3) ∼ ∼South Dakota 9.1 ( 6.3- 12.7) 8.6 ( 5.8- 12.2) ∼ ∼
South 6.2 ( 6.0- 6.5) 6.2 ( 6.0- 6.5) 6.4 ( 5.8- 7.1) 6.5 ( 5.6- 7.5)
South Atlantic 5.7 ( 5.4- 6.0) 5.7 ( 5.4- 6.0) 6.0 ( 5.2- 6.9) 4.2 ( 3.2- 5.4)
Delaware 6.9 ( 4.5- 10.1) 7.1 ( 4.5- 10.6) ∼ ∼District of Columbia ∼ ∼ ∼ ∼Florida 5.2 ( 4.7- 5.7) 5.2 ( 4.7- 5.7) 5.5 ( 3.9- 7.5) 4.7 ( 3.5- 6.1)
Georgia 6.1 ( 5.2- 7.1) 5.9 ( 4.9- 7.0) 7.3 ( 5.2- 10.0) ∼Maryland 6.2 ( 5.2- 7.3) 6.3 ( 5.2- 7.7) 5.5 ( 3.5- 8.2) ∼North Carolina 6.3 ( 5.5- 7.2) 6.2 ( 5.3- 7.1) 6.6 ( 4.7- 9.0) ∼South Carolina 6.2 ( 5.1- 7.4) 6.4 ( 5.1- 7.9) 5.5 ( 3.4- 8.3) ∼Virginia 5.8 ( 5.0- 6.7) 5.9 ( 5.0- 6.9) 6.2 ( 4.0- 9.0) ∼West Virginia 5.7 ( 4.3- 7.5) 5.7 ( 4.3- 7.5) ∼ ∼
East South Central 6.5 ( 5.9- 7.1) 6.6 ( 5.9- 7.2) 6.2 ( 4.7- 8.0) ∼Alabama 5.7 ( 4.7- 6.8) 5.8 ( 4.7- 7.2) 5.5 ( 3.2- 8.5) ∼Kentucky 7.0 ( 5.8- 8.4) 7.4 ( 6.1- 8.8) ∼ ∼Mississippi 6.8 ( 5.4- 8.6) 6.7 ( 5.1- 8.8) 6.9 ( 4.1- 10.7) ∼Tennessee 6.5 ( 5.5- 7.6) 6.4 ( 5.4- 7.5) 8.0 ( 4.8- 12.2) ∼
West South Central 7.1 ( 6.6- 7.6) 7.1 ( 6.6- 7.6) 7.6 ( 6.2- 9.3) 8.5 ( 7.1- 10.0)
Arkansas 6.7 ( 5.4- 8.3) 6.6 ( 5.2- 8.2) ∼ ∼

Cancer Incidence and M
ortality, by U.S. C
ensus Region and D
i�ision, State, and Metropolitan A
rea
���
Table 2.11.1.2M: Kidney and Renal Pelvis. Age-Adjusted Cancer Death Rates∗ and 95% Confidence Intervals,by U.S. Census Region and Division, State, and Race and Ethnicity, United States† (continued)
Males, 2004
Area All Races White Black Hispanic‡§
Louisiana 8.0 ( 6.7- 9.4) 7.8 ( 6.4- 9.4) 8.9 ( 6.3- 12.1) ∼Oklahoma 7.8 ( 6.5- 9.3) 7.8 ( 6.4- 9.4) ∼ ∼Texas 6.8 ( 6.3- 7.4) 6.9 ( 6.3- 7.6) 7.0 ( 5.1- 9.4) 8.7 ( 7.2- 10.2)
West 5.4 ( 5.1- 5.6) 5.7 ( 5.4- 6.0) 5.7 ( 4.3- 7.5) 6.0 ( 5.2- 6.9)
Mountain 5.3 ( 4.8- 5.9) 5.4 ( 4.9- 5.9) ∼ 7.2 ( 5.4- 9.3)
Arizona 5.6 ( 4.8- 6.6) 5.7 ( 4.8- 6.8) ∼ 9.4 ( 5.9- 13.8)
Colorado 5.4 ( 4.3- 6.7) 5.5 ( 4.4- 6.8) ∼ ∼Idaho 5.3 ( 3.6- 7.4) 5.4 ( 3.7- 7.6) ∼ ∼Montana 6.0 ( 3.9- 8.7) 6.2 ( 4.1- 9.0) ∼ ∼Nevada 5.9 ( 4.4- 7.6) 5.7 ( 4.2- 7.6) ∼ ∼New Mexico 5.2 ( 3.8- 7.0) 5.1 ( 3.6- 7.0) ∼ 6.0 ( 3.5- 9.5)
Utah 3.6 ( 2.4- 5.2) 3.8 ( 2.5- 5.4) ∼ ∼Wyoming ∼ ∼ ∼ ∼
Pacific 5.4 ( 5.0- 5.7) 5.8 ( 5.4- 6.2) 6.0 ( 4.4- 8.0) 5.6 ( 4.6- 6.7)
Alaska ∼ ∼ ∼ ∼California 5.2 ( 4.8- 5.6) 5.6 ( 5.2- 6.1) 6.5 ( 4.7- 8.6) 5.7 ( 4.7- 6.8)
Hawaii ∼ ∼ ∼ ∼Oregon 5.9 ( 4.8- 7.2) 6.1 ( 4.9- 7.4) ∼ ∼Washington 6.6 ( 5.6- 7.7) 6.8 ( 5.8- 7.9) ∼ ∼
∗ Rates are per 100,000 persons and are age-adjusted to the 2000 U.S. standard population (19 age groups - Census P25-1130).† Data are from the National Vital Statistics System (NVSS).‡ Data for specified racial or ethnic populations other than white and black should be interpreted with caution. See Technical Notes.
§ Hispanic origin is not mutually exclusive from race categories (white, black).
∼ Rates are suppressed if fewer than 16 cases were reported in a specific category (area, race, ethnicity).
Note: U.S. rates are as presented in Table 1.1.1.2M.

United
States Cancer Statistics: 2004 Incid
ence and M
ortality
��0
continued
Table 2.11.1.2F: Kidney and Renal Pelvis. Age-Adjusted Cancer Death Rates∗ and 95% Confidence Intervals,by U.S. Census Region and Division, State, and Race and Ethnicity, United States†
Females, 2004
Area All Races White Black Hispanic‡§
United States 2.7 ( 2.6- 2.8) 2.8 ( 2.7- 2.9) 2.7 ( 2.5- 3.0) 2.3 ( 2.0- 2.6)
Northeast 2.6 ( 2.5- 2.8) 2.7 ( 2.6- 2.9) 2.1 ( 1.7- 2.7) 1.2 ( 0.7- 1.8)
New England 2.7 ( 2.4- 3.1) 2.7 ( 2.4- 3.1) ∼ ∼Connecticut 2.7 ( 2.0- 3.5) 2.7 ( 2.0- 3.5) ∼ ∼Maine 2.3 ( 1.4- 3.5) 2.3 ( 1.4- 3.6) ∼ ∼Massachusetts 2.4 ( 2.0- 3.0) 2.4 ( 1.9- 2.9) ∼ ∼New Hampshire 3.5 ( 2.3- 5.2) 3.6 ( 2.3- 5.3) ∼ ∼Rhode Island 3.1 ( 1.9- 4.8) 3.3 ( 2.0- 5.1) ∼ ∼Vermont 4.2 ( 2.4- 7.0) 4.2 ( 2.4- 7.0) ∼ ∼
Middle Atlantic 2.6 ( 2.4- 2.8) 2.8 ( 2.5- 3.0) 2.1 ( 1.6- 2.7) 1.2 ( 0.7- 1.9)
New Jersey 2.2 ( 1.9- 2.7) 2.3 ( 1.9- 2.8) ∼ ∼New York 2.4 ( 2.1- 2.7) 2.6 ( 2.3- 2.9) 1.8 ( 1.2- 2.6) 1.5 ( 0.8- 2.4)
Pennsylvania 3.2 ( 2.8- 3.6) 3.2 ( 2.8- 3.6) 3.0 ( 1.8- 4.7) ∼Midwest 3.1 ( 2.9- 3.3) 3.1 ( 2.9- 3.3) 3.1 ( 2.5- 3.8) 3.1 ( 2.0- 4.7)
East North Central 3.1 ( 2.9- 3.3) 3.1 ( 2.9- 3.3) 3.2 ( 2.5- 3.9) 2.6 ( 1.5- 4.1)
Illinois 2.9 ( 2.5- 3.3) 2.9 ( 2.5- 3.4) 3.1 ( 2.1- 4.5) ∼Indiana 3.7 ( 3.1- 4.4) 3.6 ( 3.0- 4.3) ∼ ∼Michigan 2.9 ( 2.5- 3.4) 3.0 ( 2.6- 3.6) 2.5 ( 1.4- 4.0) ∼Ohio 3.0 ( 2.6- 3.4) 3.0 ( 2.6- 3.5) 2.7 ( 1.6- 4.3) ∼Wisconsin 3.2 ( 2.6- 3.9) 3.1 ( 2.5- 3.8) ∼ ∼
West North Central 3.1 ( 2.8- 3.4) 3.1 ( 2.8- 3.4) ∼ ∼Iowa 2.8 ( 2.1- 3.6) 2.8 ( 2.1- 3.7) ∼ ∼Kansas 2.7 ( 2.0- 3.7) 2.7 ( 1.9- 3.7) ∼ ∼Minnesota 3.1 ( 2.4- 3.8) 3.0 ( 2.4- 3.8) ∼ ∼Missouri 3.2 ( 2.6- 3.8) 3.2 ( 2.6- 3.9) ∼ ∼Nebraska 4.1 ( 3.0- 5.5) 4.1 ( 3.0- 5.5) ∼ ∼North Dakota 4.1 ( 2.3- 6.7) 3.9 ( 2.2- 6.5) ∼ ∼South Dakota ∼ ∼ ∼ ∼
South 2.7 ( 2.6- 2.8) 2.7 ( 2.6- 2.9) 2.7 ( 2.4- 3.1) 2.1 ( 1.7- 2.6)
South Atlantic 2.4 ( 2.2- 2.6) 2.4 ( 2.2- 2.6) 2.5 ( 2.1- 3.0) 1.5 ( 1.0- 2.2)
Delaware ∼ ∼ ∼ ∼District of Columbia ∼ ∼ ∼ ∼Florida 2.2 ( 1.9- 2.5) 2.2 ( 1.9- 2.5) 2.1 ( 1.3- 3.2) 1.8 ( 1.2- 2.6)
Georgia 3.1 ( 2.5- 3.6) 3.4 ( 2.8- 4.1) 2.1 ( 1.3- 3.1) ∼Maryland 2.1 ( 1.6- 2.7) 2.1 ( 1.5- 2.8) ∼ ∼North Carolina 2.6 ( 2.2- 3.1) 2.5 ( 2.0- 3.0) 3.5 ( 2.4- 5.0) ∼South Carolina 2.8 ( 2.2- 3.5) 2.7 ( 2.0- 3.5) 3.3 ( 2.0- 5.1) ∼Virginia 2.0 ( 1.6- 2.5) 2.0 ( 1.6- 2.6) ∼ ∼West Virginia 3.5 ( 2.6- 4.8) 3.6 ( 2.6- 4.9) ∼ ∼
East South Central 2.9 ( 2.6- 3.3) 2.9 ( 2.6- 3.3) 2.9 ( 2.1- 3.9) ∼Alabama 2.5 ( 1.9- 3.2) 2.4 ( 1.8- 3.1) 3.1 ( 1.9- 5.0) ∼Kentucky 3.1 ( 2.4- 3.9) 3.2 ( 2.5- 4.0) ∼ ∼Mississippi 3.3 ( 2.5- 4.3) 3.5 ( 2.5- 4.8) ∼ ∼Tennessee 2.9 ( 2.3- 3.5) 2.9 ( 2.3- 3.6) ∼ ∼
West South Central 3.1 ( 2.8- 3.4) 3.1 ( 2.9- 3.4) 3.1 ( 2.3- 3.9) 2.6 ( 1.9- 3.3)
Arkansas 3.7 ( 2.8- 4.7) 3.6 ( 2.7- 4.7) ∼ ∼

Cancer Incidence and M
ortality, by U.S. C
ensus Region and D
i�ision, State, and Metropolitan A
rea
���
Table 2.11.1.2F: Kidney and Renal Pelvis. Age-Adjusted Cancer Death Rates∗ and 95% Confidence Intervals,by U.S. Census Region and Division, State, and Race and Ethnicity, United States† (continued)
Females, 2004
Area All Races White Black Hispanic‡§
Louisiana 3.6 ( 2.9- 4.4) 3.4 ( 2.6- 4.4) 4.4 ( 2.9- 6.4) ∼Oklahoma 3.2 ( 2.5- 4.1) 3.0 ( 2.3- 4.0) ∼ ∼Texas 2.8 ( 2.5- 3.2) 3.0 ( 2.7- 3.4) 1.7 ( 1.0- 2.7) 2.6 ( 2.0- 3.4)
West 2.5 ( 2.3- 2.6) 2.5 ( 2.4- 2.7) 3.1 ( 2.2- 4.2) 2.8 ( 2.3- 3.3)
Mountain 2.4 ( 2.1- 2.8) 2.4 ( 2.1- 2.8) ∼ 3.3 ( 2.3- 4.6)
Arizona 2.4 ( 1.9- 3.0) 2.4 ( 1.9- 3.0) ∼ ∼Colorado 1.8 ( 1.3- 2.5) 1.9 ( 1.4- 2.6) ∼ ∼Idaho 3.2 ( 2.1- 4.8) 3.3 ( 2.1- 4.9) ∼ ∼Montana 2.7 ( 1.6- 4.5) ∼ ∼ ∼Nevada 3.0 ( 2.1- 4.2) 3.1 ( 2.1- 4.4) ∼ ∼New Mexico 3.0 ( 2.0- 4.3) 3.0 ( 2.0- 4.3) ∼ 4.9 ( 2.8- 7.9)
Utah 2.1 ( 1.3- 3.2) 2.1 ( 1.3- 3.3) ∼ ∼Wyoming ∼ ∼ ∼ ∼
Pacific 2.5 ( 2.3- 2.7) 2.6 ( 2.4- 2.8) 3.3 ( 2.4- 4.6) 2.6 ( 2.1- 3.3)
Alaska ∼ ∼ ∼ ∼California 2.5 ( 2.2- 2.7) 2.6 ( 2.3- 2.9) 3.5 ( 2.4- 4.8) 2.7 ( 2.2- 3.4)
Hawaii ∼ ∼ ∼ ∼Oregon 2.6 ( 2.0- 3.5) 2.7 ( 2.0- 3.5) ∼ ∼Washington 2.6 ( 2.1- 3.2) 2.7 ( 2.1- 3.3) ∼ ∼
∗ Rates are per 100,000 persons and are age-adjusted to the 2000 U.S. standard population (19 age groups - Census P25-1130).† Data are from the National Vital Statistics System (NVSS).‡ Data for specified racial or ethnic populations other than white and black should be interpreted with caution. See Technical Notes.
§ Hispanic origin is not mutually exclusive from race categories (white, black).
∼ Rates are suppressed if fewer than 16 cases were reported in a specific category (area, race, ethnicity).
Note: U.S. rates are as presented in Table 1.1.1.2F.

United
States Cancer Statistics: 2004 Incid
ence and M
ortality
���
continued
Table 2.12.1.1M: Larynx. Age-Adjusted Invasive Cancer Incidence Rates∗ and 95% Confidence Intervals, byU.S. Census Region and Division, State and Metropolitan Area, and Race and Ethnicity, United States†‡
Males, 2004
Area All Races White Black Hispanic§
United States 7.2 ( 7.0- 7.3) 6.8 ( 6.7- 7.0) 11.8 ( 11.2- 12.5) 5.7 ( 5.2- 6.2)
Northeast 7.4 ( 7.1- 7.7) 7.2 ( 6.9- 7.6) 10.7 ( 9.3- 12.2) 8.0 ( 6.5- 9.6)
New England 7.1 ( 6.5- 7.8) 7.2 ( 6.5- 7.8) 7.4 ( 4.3- 11.8) ∼Connecticut 6.6 ( 5.4- 8.0) 6.1 ( 4.9- 7.5) ∼ ∼Maine 7.4 ( 5.5- 9.7) 7.4 ( 5.5- 9.8) ∼ ∼Massachusetts 7.0 ( 6.1- 8.0) 7.2 ( 6.2- 8.3) ∼ ∼New Hampshire 7.0 ( 5.2- 9.4) 7.2 ( 5.3- 9.6) ∼ ∼Rhode Island 8.0 ( 5.8- 10.8) 8.5 ( 6.2- 11.5) ∼ ∼Vermont 8.4 ( 5.5- 12.3) 8.5 ( 5.6- 12.5) ∼ ∼
Middle Atlantic 7.5 ( 7.1- 7.9) 7.2 ( 6.8- 7.7) 11.1 ( 9.6- 12.7) 8.2 ( 6.6- 10.0)
New Jersey 6.6 ( 5.8- 7.4) 6.3 ( 5.5- 7.2) 11.9 ( 8.6- 16.0) 7.2 ( 4.3- 11.0)
New York 7.3 ( 6.8- 7.9) 7.2 ( 6.6- 7.9) 9.1 ( 7.4- 11.0) 8.7 ( 6.7- 10.9)
Pennsylvania 8.3 ( 7.6- 9.0) 7.8 ( 7.1- 8.5) 15.3 ( 11.8- 19.4) -
Midwest 7.3 ( 7.0- 7.7) 6.9 ( 6.6- 7.2) 12.3 ( 10.8- 13.9) 4.0 ( 2.6- 5.9)
East North Central 7.6 ( 7.2- 8.0) 7.1 ( 6.7- 7.4) 12.0 ( 10.5- 13.8) 3.8 ( 2.2- 6.0)
Illinois 7.6 ( 6.9- 8.4) 7.1 ( 6.3- 7.9) 11.9 ( 9.3- 15.0) ∼Indiana 8.1 ( 7.0- 9.2) 7.8 ( 6.8- 9.0) 13.1 ( 8.1- 20.0) ∼Michigan 7.5 ( 6.8- 8.4) 7.1 ( 6.3- 8.0) 11.8 ( 8.8- 15.4) ∼
Detroit 9.1 ( 7.7- 10.6) 8.0 ( 6.5- 9.6) 13.9 ( 10.1- 18.4) ∼Ohio 7.6 ( 6.9- 8.4) 6.8 ( 6.1- 7.6) 11.1 ( 8.3- 14.5) ∼Wisconsin 7.1 ( 6.1- 8.2) 6.6 ( 5.7- 7.7) ∼ ∼
West North Central 6.8 ( 6.3- 7.3) 6.5 ( 6.0- 7.1) 13.6 ( 9.7- 18.3) ∼Iowa 7.3 ( 6.0- 8.8) 7.3 ( 5.9- 8.8) ∼ ∼Kansas 5.8 ( 4.6- 7.3) 5.7 ( 4.5- 7.3) ∼ ∼Minnesota 6.0 ( 5.1- 7.2) 5.7 ( 4.7- 6.8) ∼ ∼Missouri 7.9 ( 6.9- 9.0) 7.5 ( 6.5- 8.7) 13.3 ( 8.6- 19.4) ∼Nebraska 6.9 ( 5.2- 8.9) 6.3 ( 4.6- 8.3) ∼ ∼North Dakota 4.8 ( 2.8- 7.9) ∼ ∼ ∼South Dakota 6.2 ( 4.0- 9.3) 6.5 ( 4.2- 9.7) ∼ ∼
South 8.4 ( 8.1- 8.7) 7.8 ( 7.5- 8.1) 13.0 ( 12.1- 14.0) 6.8 ( 5.9- 7.8)
South Atlantic 8.3 ( 8.0- 8.7) 7.7 ( 7.3- 8.1) 12.5 ( 11.3- 13.8) 8.1 ( 6.7- 9.7)
Delaware 9.7 ( 6.9- 13.3) 7.4 ( 4.8- 10.9) ∼ ∼District of Columbia 9.2 ( 5.8- 13.9) ∼ 12.5 ( 7.5- 19.6) ∼Florida 8.4 ( 7.8- 9.0) 8.1 ( 7.5- 8.7) 12.0 ( 9.6- 14.7) -
Georgia 8.2 ( 7.3- 9.3) 7.5 ( 6.5- 8.6) 11.2 ( 8.8- 14.0) ∼Atlanta 4.9 ( 3.6- 6.5) 3.7 ( 2.4- 5.5) 8.1 ( 4.7- 12.8) ∼
Maryland
North Carolina 8.5 ( 7.6- 9.5) 7.8 ( 6.8- 8.9) 12.7 ( 10.0- 15.9) ∼South Carolina 9.3 ( 8.0- 10.7) 7.4 ( 6.1- 8.9) 15.8 ( 12.3- 20.0) -
Virginia 7.4 ( 6.5- 8.4) 6.9 ( 6.0- 8.0) 11.1 ( 8.3- 14.5) ∼West Virginia 7.9 ( 6.2- 9.8) 7.9 ( 6.2- 9.9) ∼ ∼
East South Central 9.5 ( 8.8- 10.2) 8.8 ( 8.1- 9.5) 13.3 ( 11.3- 15.6) ∼Alabama 9.5 ( 8.3- 10.9) 8.4 ( 7.1- 9.9) 13.9 ( 10.5- 18.0) ∼Kentucky 9.7 ( 8.4- 11.2) 9.2 ( 7.8- 10.7) 20.1 ( 12.2- 30.8) -
Mississippi 8.8 ( 7.3- 10.6) 7.1 ( 5.5- 9.1) 12.5 ( 9.2- 16.7) ∼Tennessee 9.6 ( 8.5- 10.9) 9.4 ( 8.2- 10.7) 11.3 ( 7.6- 16.0) ∼
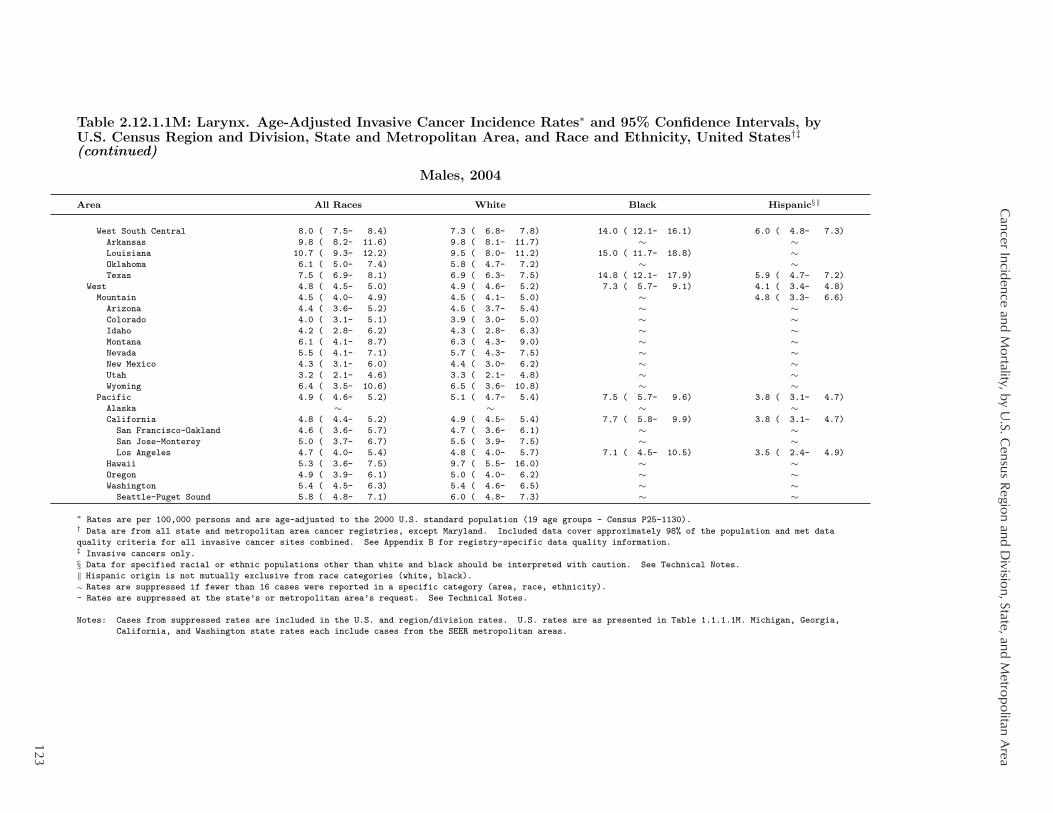
Cancer Incidence and M
ortality, by U.S. C
ensus Region and D
i�ision, State, and Metropolitan A
rea
��3
Table 2.12.1.1M: Larynx. Age-Adjusted Invasive Cancer Incidence Rates∗ and 95% Confidence Intervals, byU.S. Census Region and Division, State and Metropolitan Area, and Race and Ethnicity, United States†‡(continued)
Males, 2004
Area All Races White Black Hispanic§
West South Central 8.0 ( 7.5- 8.4) 7.3 ( 6.8- 7.8) 14.0 ( 12.1- 16.1) 6.0 ( 4.8- 7.3)
Arkansas 9.8 ( 8.2- 11.6) 9.8 ( 8.1- 11.7) ∼ ∼Louisiana 10.7 ( 9.3- 12.2) 9.5 ( 8.0- 11.2) 15.0 ( 11.7- 18.8) ∼Oklahoma 6.1 ( 5.0- 7.4) 5.8 ( 4.7- 7.2) ∼ ∼Texas 7.5 ( 6.9- 8.1) 6.9 ( 6.3- 7.5) 14.8 ( 12.1- 17.9) 5.9 ( 4.7- 7.2)
West 4.8 ( 4.5- 5.0) 4.9 ( 4.6- 5.2) 7.3 ( 5.7- 9.1) 4.1 ( 3.4- 4.8)
Mountain 4.5 ( 4.0- 4.9) 4.5 ( 4.1- 5.0) ∼ 4.8 ( 3.3- 6.6)
Arizona 4.4 ( 3.6- 5.2) 4.5 ( 3.7- 5.4) ∼ ∼Colorado 4.0 ( 3.1- 5.1) 3.9 ( 3.0- 5.0) ∼ ∼Idaho 4.2 ( 2.8- 6.2) 4.3 ( 2.8- 6.3) ∼ ∼Montana 6.1 ( 4.1- 8.7) 6.3 ( 4.3- 9.0) ∼ ∼Nevada 5.5 ( 4.1- 7.1) 5.7 ( 4.3- 7.5) ∼ ∼New Mexico 4.3 ( 3.1- 6.0) 4.4 ( 3.0- 6.2) ∼ ∼Utah 3.2 ( 2.1- 4.6) 3.3 ( 2.1- 4.8) ∼ ∼Wyoming 6.4 ( 3.5- 10.6) 6.5 ( 3.6- 10.8) ∼ ∼
Pacific 4.9 ( 4.6- 5.2) 5.1 ( 4.7- 5.4) 7.5 ( 5.7- 9.6) 3.8 ( 3.1- 4.7)
Alaska ∼ ∼ ∼ ∼California 4.8 ( 4.4- 5.2) 4.9 ( 4.5- 5.4) 7.7 ( 5.8- 9.9) 3.8 ( 3.1- 4.7)
San Francisco-Oakland 4.6 ( 3.6- 5.7) 4.7 ( 3.6- 6.1) ∼ ∼San Jose-Monterey 5.0 ( 3.7- 6.7) 5.5 ( 3.9- 7.5) ∼ ∼Los Angeles 4.7 ( 4.0- 5.4) 4.8 ( 4.0- 5.7) 7.1 ( 4.5- 10.5) 3.5 ( 2.4- 4.9)
Hawaii 5.3 ( 3.6- 7.5) 9.7 ( 5.5- 16.0) ∼ ∼Oregon 4.9 ( 3.9- 6.1) 5.0 ( 4.0- 6.2) ∼ ∼Washington 5.4 ( 4.5- 6.3) 5.4 ( 4.6- 6.5) ∼ ∼
Seattle-Puget Sound 5.8 ( 4.8- 7.1) 6.0 ( 4.8- 7.3) ∼ ∼∗ Rates are per 100,000 persons and are age-adjusted to the 2000 U.S. standard population (19 age groups - Census P25-1130).† Data are from all state and metropolitan area cancer registries, except Maryland. Included data cover approximately 98% of the population and met data
quality criteria for all invasive cancer sites combined. See Appendix B for registry-specific data quality information.‡ Invasive cancers only.
§ Data for specified racial or ethnic populations other than white and black should be interpreted with caution. See Technical Notes.
Hispanic origin is not mutually exclusive from race categories (white, black).
∼ Rates are suppressed if fewer than 16 cases were reported in a specific category (area, race, ethnicity).
- Rates are suppressed at the state’s or metropolitan area’s request. See Technical Notes.
Notes: Cases from suppressed rates are included in the U.S. and region/division rates. U.S. rates are as presented in Table 1.1.1.1M. Michigan, Georgia,
California, and Washington state rates each include cases from the SEER metropolitan areas.

United
States Cancer Statistics: 2004 Incid
ence and M
ortality
���
continued
Table 2.12.1.1F: Larynx. Age-Adjusted Invasive Cancer Incidence Rates∗ and 95% Confidence Intervals, byU.S. Census Region and Division, State and Metropolitan Area, and Race and Ethnicity, United States†‡
Females, 2004
Area All Races White Black Hispanic§
United States 1.5 ( 1.5- 1.6) 1.5 ( 1.5- 1.6) 2.0 ( 1.8- 2.3) 0.9 ( 0.7- 1.0)
Northeast 1.6 ( 1.5- 1.7) 1.6 ( 1.5- 1.8) 1.8 ( 1.3- 2.3) 1.2 ( 0.7- 1.8)
New England 1.6 ( 1.3- 1.9) 1.6 ( 1.3- 1.9) ∼ ∼Connecticut 1.4 ( 0.9- 2.0) 1.4 ( 0.9- 2.0) ∼ ∼Maine 2.0 ( 1.2- 3.3) 2.1 ( 1.2- 3.4) ∼ ∼Massachusetts 1.6 ( 1.2- 2.1) 1.6 ( 1.2- 2.1) ∼ ∼New Hampshire ∼ ∼ ∼ ∼Rhode Island ∼ ∼ ∼ ∼Vermont ∼ ∼ ∼ ∼
Middle Atlantic 1.6 ( 1.5- 1.8) 1.6 ( 1.5- 1.8) 1.7 ( 1.3- 2.3) 1.2 ( 0.7- 1.8)
New Jersey 1.4 ( 1.1- 1.8) 1.5 ( 1.1- 1.9) ∼ ∼New York 1.4 ( 1.2- 1.6) 1.4 ( 1.2- 1.7) 1.4 ( 0.9- 2.1) ∼Pennsylvania 2.0 ( 1.7- 2.4) 2.0 ( 1.7- 2.4) 2.7 ( 1.5- 4.2) -
Midwest 1.7 ( 1.6- 1.8) 1.6 ( 1.5- 1.7) 2.9 ( 2.3- 3.5) ∼East North Central 1.7 ( 1.6- 1.9) 1.6 ( 1.5- 1.8) 2.6 ( 2.0- 3.3) ∼Illinois 1.5 ( 1.2- 1.8) 1.2 ( 1.0- 1.6) 2.8 ( 1.9- 4.2) ∼Indiana 1.8 ( 1.4- 2.3) 1.8 ( 1.4- 2.4) ∼ ∼Michigan 1.9 ( 1.5- 2.3) 1.8 ( 1.4- 2.2) 2.7 ( 1.6- 4.2) ∼
Detroit 2.3 ( 1.7- 3.0) 2.0 ( 1.4- 2.8) 3.3 ( 1.9- 5.3) ∼Ohio 2.1 ( 1.8- 2.5) 1.9 ( 1.6- 2.3) 2.9 ( 1.8- 4.5) ∼Wisconsin 1.3 ( 0.9- 1.7) 1.3 ( 0.9- 1.8) ∼ ∼
West North Central 1.6 ( 1.4- 1.9) 1.5 ( 1.3- 1.7) 4.4 ( 2.7- 6.8) ∼Iowa 1.5 ( 1.0- 2.2) 1.4 ( 0.9- 2.1) ∼ ∼Kansas 2.0 ( 1.3- 2.9) 1.8 ( 1.1- 2.7) ∼ ∼Minnesota 1.3 ( 0.9- 1.8) 1.1 ( 0.8- 1.6) ∼ ∼Missouri 1.8 ( 1.3- 2.3) 1.7 ( 1.2- 2.2) ∼ ∼Nebraska ∼ ∼ ∼ ∼North Dakota ∼ ∼ ∼ ∼South Dakota ∼ ∼ ∼ ∼
South 1.7 ( 1.6- 1.8) 1.7 ( 1.6- 1.8) 2.0 ( 1.7- 2.3) 0.8 ( 0.6- 1.1)
South Atlantic 1.6 ( 1.5- 1.8) 1.6 ( 1.5- 1.8) 1.7 ( 1.4- 2.2) 1.1 ( 0.7- 1.7)
Delaware ∼ ∼ ∼ ∼District of Columbia ∼ ∼ ∼ ∼Florida 1.6 ( 1.4- 1.9) 1.8 ( 1.5- 2.1) ∼ -
Georgia 1.5 ( 1.2- 1.9) 1.7 ( 1.3- 2.2) ∼ ∼Atlanta 1.1 ( 0.6- 1.8) ∼ ∼ ∼
Maryland
North Carolina 2.0 ( 1.6- 2.4) 1.9 ( 1.5- 2.4) 2.6 ( 1.6- 3.8) ∼South Carolina 1.7 ( 1.2- 2.3) 1.1 ( 0.6- 1.7) 3.7 ( 2.3- 5.6) -
Virginia 1.2 ( 0.9- 1.6) 1.1 ( 0.8- 1.6) ∼ ∼West Virginia 2.1 ( 1.3- 3.1) 2.2 ( 1.4- 3.2) ∼ ∼
East South Central 2.2 ( 1.9- 2.5) 2.1 ( 1.8- 2.5) 2.4 ( 1.7- 3.2) ∼Alabama 2.4 ( 1.8- 3.1) 2.5 ( 1.9- 3.3) ∼ ∼Kentucky 2.6 ( 2.0- 3.3) 2.5 ( 1.9- 3.3) ∼ -
Mississippi 1.6 ( 1.1- 2.4) 1.8 ( 1.1- 2.8) ∼ ∼Tennessee 1.9 ( 1.5- 2.5) 1.7 ( 1.3- 2.3) ∼ ∼

Cancer Incidence and M
ortality, by U.S. C
ensus Region and D
i�ision, State, and Metropolitan A
rea
���
Table 2.12.1.1F: Larynx. Age-Adjusted Invasive Cancer Incidence Rates∗ and 95% Confidence Intervals, byU.S. Census Region and Division, State and Metropolitan Area, and Race and Ethnicity, United States†‡(continued)
Females, 2004
Area All Races White Black Hispanic§
West South Central 1.6 ( 1.4- 1.8) 1.5 ( 1.3- 1.7) 2.1 ( 1.5- 2.8) 0.6 ( 0.3- 1.0)
Arkansas 2.2 ( 1.6- 3.1) 2.0 ( 1.4- 3.0) ∼ ∼Louisiana 2.3 ( 1.7- 2.9) 2.3 ( 1.7- 3.2) ∼ ∼Oklahoma 2.0 ( 1.5- 2.8) 1.9 ( 1.3- 2.6) ∼ ∼Texas 1.3 ( 1.1- 1.5) 1.2 ( 1.0- 1.5) 1.8 ( 1.1- 2.8) ∼
West 1.1 ( 1.0- 1.2) 1.2 ( 1.0- 1.3) 1.3 ( 0.8- 2.0) 0.7 ( 0.5- 1.0)
Mountain 1.2 ( 1.0- 1.4) 1.2 ( 1.0- 1.5) ∼ ∼Arizona 1.0 ( 0.6- 1.4) 0.9 ( 0.6- 1.4) ∼ ∼Colorado 1.3 ( 0.9- 1.9) 1.4 ( 0.9- 2.0) ∼ ∼Idaho ∼ ∼ ∼ ∼Montana ∼ ∼ ∼ ∼Nevada 2.3 ( 1.5- 3.3) 2.5 ( 1.6- 3.8) ∼ ∼New Mexico ∼ ∼ ∼ ∼Utah ∼ ∼ ∼ ∼Wyoming ∼ ∼ ∼ ∼
Pacific 1.1 ( 0.9- 1.2) 1.1 ( 1.0- 1.3) 1.5 ( 0.8- 2.3) 0.6 ( 0.4- 0.9)
Alaska ∼ ∼ ∼ ∼California 1.0 ( 0.8- 1.1) 1.0 ( 0.9- 1.2) 1.6 ( 0.9- 2.5) 0.5 ( 0.3- 0.8)
San Francisco-Oakland 1.0 ( 0.6- 1.5) 1.0 ( 0.6- 1.7) ∼ ∼San Jose-Monterey ∼ ∼ ∼ ∼Los Angeles 0.9 ( 0.6- 1.2) 0.9 ( 0.6- 1.3) ∼ ∼
Hawaii ∼ ∼ ∼ ∼Oregon 1.5 ( 1.0- 2.1) 1.4 ( 0.9- 2.1) ∼ ∼Washington 1.4 ( 1.0- 1.9) 1.3 ( 0.9- 1.8) ∼ ∼
Seattle-Puget Sound 1.4 ( 1.0- 2.0) 1.4 ( 1.0- 2.1) ∼ ∼∗ Rates are per 100,000 persons and are age-adjusted to the 2000 U.S. standard population (19 age groups - Census P25-1130).† Data are from all state and metropolitan area cancer registries, except Maryland. Included data cover approximately 98% of the population and met data
quality criteria for all invasive cancer sites combined. See Appendix B for registry-specific data quality information.‡ Invasive cancers only.
§ Data for specified racial or ethnic populations other than white and black should be interpreted with caution. See Technical Notes.
Hispanic origin is not mutually exclusive from race categories (white, black).
∼ Rates are suppressed if fewer than 16 cases were reported in a specific category (area, race, ethnicity).
- Rates are suppressed at the state’s or metropolitan area’s request. See Technical Notes.
Notes: Cases from suppressed rates are included in the U.S. and region/division rates. U.S. rates are as presented in Table 1.1.1.1F. Michigan, Georgia,
California, and Washington state rates each include cases from the SEER metropolitan areas.
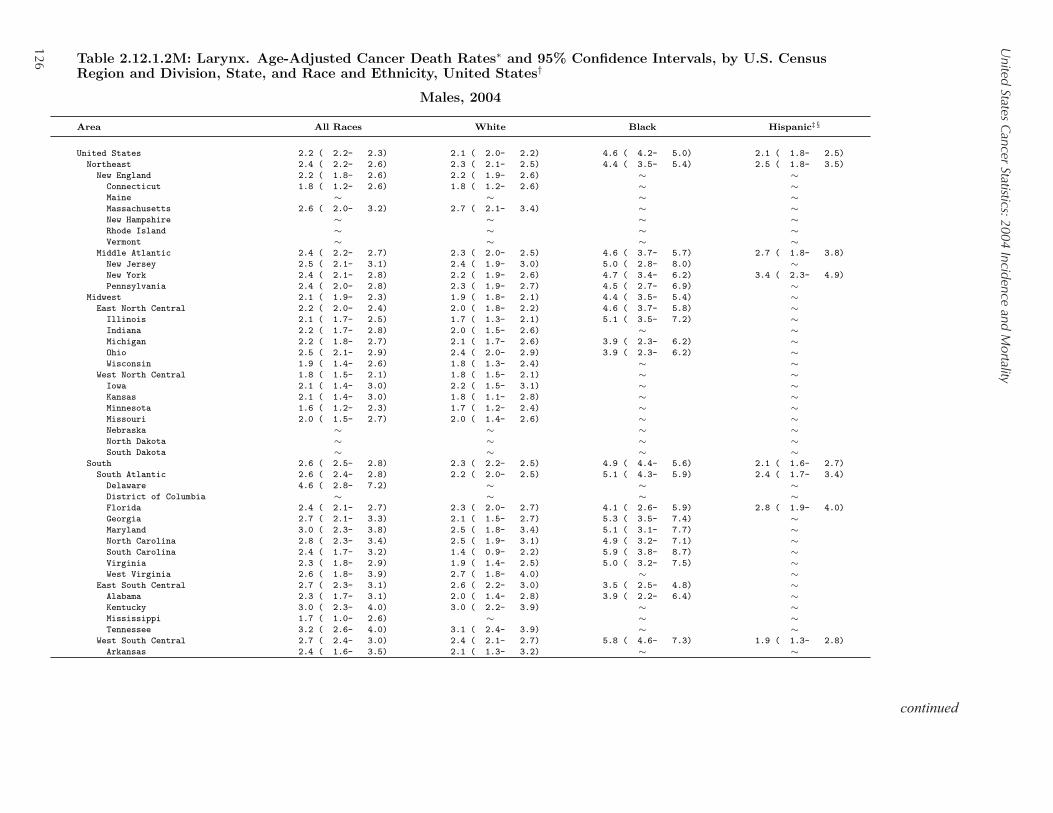
United
States Cancer Statistics: 2004 Incid
ence and M
ortality
���
continued
Table 2.12.1.2M: Larynx. Age-Adjusted Cancer Death Rates∗ and 95% Confidence Intervals, by U.S. CensusRegion and Division, State, and Race and Ethnicity, United States†
Males, 2004
Area All Races White Black Hispanic‡§
United States 2.2 ( 2.2- 2.3) 2.1 ( 2.0- 2.2) 4.6 ( 4.2- 5.0) 2.1 ( 1.8- 2.5)
Northeast 2.4 ( 2.2- 2.6) 2.3 ( 2.1- 2.5) 4.4 ( 3.5- 5.4) 2.5 ( 1.8- 3.5)
New England 2.2 ( 1.8- 2.6) 2.2 ( 1.9- 2.6) ∼ ∼Connecticut 1.8 ( 1.2- 2.6) 1.8 ( 1.2- 2.6) ∼ ∼Maine ∼ ∼ ∼ ∼Massachusetts 2.6 ( 2.0- 3.2) 2.7 ( 2.1- 3.4) ∼ ∼New Hampshire ∼ ∼ ∼ ∼Rhode Island ∼ ∼ ∼ ∼Vermont ∼ ∼ ∼ ∼
Middle Atlantic 2.4 ( 2.2- 2.7) 2.3 ( 2.0- 2.5) 4.6 ( 3.7- 5.7) 2.7 ( 1.8- 3.8)
New Jersey 2.5 ( 2.1- 3.1) 2.4 ( 1.9- 3.0) 5.0 ( 2.8- 8.0) ∼New York 2.4 ( 2.1- 2.8) 2.2 ( 1.9- 2.6) 4.7 ( 3.4- 6.2) 3.4 ( 2.3- 4.9)
Pennsylvania 2.4 ( 2.0- 2.8) 2.3 ( 1.9- 2.7) 4.5 ( 2.7- 6.9) ∼Midwest 2.1 ( 1.9- 2.3) 1.9 ( 1.8- 2.1) 4.4 ( 3.5- 5.4) ∼
East North Central 2.2 ( 2.0- 2.4) 2.0 ( 1.8- 2.2) 4.6 ( 3.7- 5.8) ∼Illinois 2.1 ( 1.7- 2.5) 1.7 ( 1.3- 2.1) 5.1 ( 3.5- 7.2) ∼Indiana 2.2 ( 1.7- 2.8) 2.0 ( 1.5- 2.6) ∼ ∼Michigan 2.2 ( 1.8- 2.7) 2.1 ( 1.7- 2.6) 3.9 ( 2.3- 6.2) ∼Ohio 2.5 ( 2.1- 2.9) 2.4 ( 2.0- 2.9) 3.9 ( 2.3- 6.2) ∼Wisconsin 1.9 ( 1.4- 2.6) 1.8 ( 1.3- 2.4) ∼ ∼
West North Central 1.8 ( 1.5- 2.1) 1.8 ( 1.5- 2.1) ∼ ∼Iowa 2.1 ( 1.4- 3.0) 2.2 ( 1.5- 3.1) ∼ ∼Kansas 2.1 ( 1.4- 3.0) 1.8 ( 1.1- 2.8) ∼ ∼Minnesota 1.6 ( 1.2- 2.3) 1.7 ( 1.2- 2.4) ∼ ∼Missouri 2.0 ( 1.5- 2.7) 2.0 ( 1.4- 2.6) ∼ ∼Nebraska ∼ ∼ ∼ ∼North Dakota ∼ ∼ ∼ ∼South Dakota ∼ ∼ ∼ ∼
South 2.6 ( 2.5- 2.8) 2.3 ( 2.2- 2.5) 4.9 ( 4.4- 5.6) 2.1 ( 1.6- 2.7)
South Atlantic 2.6 ( 2.4- 2.8) 2.2 ( 2.0- 2.5) 5.1 ( 4.3- 5.9) 2.4 ( 1.7- 3.4)
Delaware 4.6 ( 2.8- 7.2) ∼ ∼ ∼District of Columbia ∼ ∼ ∼ ∼Florida 2.4 ( 2.1- 2.7) 2.3 ( 2.0- 2.7) 4.1 ( 2.6- 5.9) 2.8 ( 1.9- 4.0)
Georgia 2.7 ( 2.1- 3.3) 2.1 ( 1.5- 2.7) 5.3 ( 3.5- 7.4) ∼Maryland 3.0 ( 2.3- 3.8) 2.5 ( 1.8- 3.4) 5.1 ( 3.1- 7.7) ∼North Carolina 2.8 ( 2.3- 3.4) 2.5 ( 1.9- 3.1) 4.9 ( 3.2- 7.1) ∼South Carolina 2.4 ( 1.7- 3.2) 1.4 ( 0.9- 2.2) 5.9 ( 3.8- 8.7) ∼Virginia 2.3 ( 1.8- 2.9) 1.9 ( 1.4- 2.5) 5.0 ( 3.2- 7.5) ∼West Virginia 2.6 ( 1.8- 3.9) 2.7 ( 1.8- 4.0) ∼ ∼
East South Central 2.7 ( 2.3- 3.1) 2.6 ( 2.2- 3.0) 3.5 ( 2.5- 4.8) ∼Alabama 2.3 ( 1.7- 3.1) 2.0 ( 1.4- 2.8) 3.9 ( 2.2- 6.4) ∼Kentucky 3.0 ( 2.3- 4.0) 3.0 ( 2.2- 3.9) ∼ ∼Mississippi 1.7 ( 1.0- 2.6) ∼ ∼ ∼Tennessee 3.2 ( 2.6- 4.0) 3.1 ( 2.4- 3.9) ∼ ∼
West South Central 2.7 ( 2.4- 3.0) 2.4 ( 2.1- 2.7) 5.8 ( 4.6- 7.3) 1.9 ( 1.3- 2.8)
Arkansas 2.4 ( 1.6- 3.5) 2.1 ( 1.3- 3.2) ∼ ∼

Cancer Incidence and M
ortality, by U.S. C
ensus Region and D
i�ision, State, and Metropolitan A
rea
���
Table 2.12.1.2M: Larynx. Age-Adjusted Cancer Death Rates∗ and 95% Confidence Intervals, by U.S. CensusRegion and Division, State, and Race and Ethnicity, United States† (continued)
Males, 2004
Area All Races White Black Hispanic‡§
Louisiana 3.9 ( 3.0- 4.9) 2.9 ( 2.1- 3.9) 7.2 ( 4.9- 10.2) ∼Oklahoma 2.1 ( 1.4- 2.9) 2.0 ( 1.3- 2.9) ∼ ∼Texas 2.6 ( 2.3- 3.0) 2.4 ( 2.1- 2.8) 5.5 ( 3.8- 7.5) 2.0 ( 1.4- 2.9)
West 1.6 ( 1.5- 1.8) 1.7 ( 1.5- 1.8) 3.3 ( 2.3- 4.7) 2.0 ( 1.5- 2.6)
Mountain 1.5 ( 1.2- 1.8) 1.5 ( 1.3- 1.8) ∼ 2.4 ( 1.4- 3.7)
Arizona 1.8 ( 1.3- 2.4) 1.8 ( 1.3- 2.4) ∼ ∼Colorado 1.3 ( 0.8- 2.0) 1.2 ( 0.8- 1.9) ∼ ∼Idaho ∼ ∼ ∼ ∼Montana ∼ ∼ ∼ ∼Nevada ∼ ∼ ∼ ∼New Mexico 2.3 ( 1.4- 3.6) 2.5 ( 1.5- 3.9) ∼ ∼Utah ∼ ∼ ∼ ∼Wyoming ∼ ∼ ∼ ∼
Pacific 1.7 ( 1.5- 1.9) 1.7 ( 1.5- 2.0) 3.5 ( 2.3- 5.0) 1.8 ( 1.3- 2.5)
Alaska ∼ ∼ ∼ ∼California 1.8 ( 1.5- 2.0) 1.8 ( 1.5- 2.0) 3.8 ( 2.5- 5.5) 1.8 ( 1.2- 2.4)
Hawaii ∼ ∼ ∼ ∼Oregon 1.5 ( 1.0- 2.2) 1.5 ( 0.9- 2.2) ∼ ∼Washington 1.8 ( 1.3- 2.4) 1.8 ( 1.3- 2.5) ∼ ∼
∗ Rates are per 100,000 persons and are age-adjusted to the 2000 U.S. standard population (19 age groups - Census P25-1130).† Data are from the National Vital Statistics System (NVSS).‡ Data for specified racial or ethnic populations other than white and black should be interpreted with caution. See Technical Notes.
§ Hispanic origin is not mutually exclusive from race categories (white, black).
∼ Rates are suppressed if fewer than 16 cases were reported in a specific category (area, race, ethnicity).
Note: U.S. rates are as presented in Table 1.1.1.2M.

United
States Cancer Statistics: 2004 Incid
ence and M
ortality
���
continued
Table 2.12.1.2F: Larynx. Age-Adjusted Cancer Death Rates∗ and 95% Confidence Intervals, by U.S. CensusRegion and Division, State, and Race and Ethnicity, United States†
Females, 2004
Area All Races White Black Hispanic‡§
United States 0.4 ( 0.4- 0.5) 0.4 ( 0.4- 0.5) 0.7 ( 0.5- 0.8) ∼Northeast 0.5 ( 0.4- 0.5) 0.4 ( 0.4- 0.5) 0.7 ( 0.5- 1.1) ∼New England 0.4 ( 0.3- 0.6) 0.5 ( 0.3- 0.6) ∼ ∼
Connecticut ∼ ∼ ∼ ∼Maine ∼ ∼ ∼ ∼Massachusetts 0.5 ( 0.3- 0.8) 0.5 ( 0.3- 0.9) ∼ ∼New Hampshire ∼ ∼ ∼ ∼Rhode Island ∼ ∼ ∼ ∼Vermont ∼ ∼ ∼ ∼
Middle Atlantic 0.5 ( 0.4- 0.6) 0.4 ( 0.4- 0.5) 0.8 ( 0.5- 1.2) ∼New Jersey 0.4 ( 0.3- 0.6) 0.4 ( 0.2- 0.6) ∼ ∼New York 0.4 ( 0.3- 0.6) 0.4 ( 0.3- 0.6) ∼ ∼Pennsylvania 0.6 ( 0.4- 0.8) 0.5 ( 0.4- 0.7) ∼ ∼
Midwest 0.5 ( 0.4- 0.5) 0.4 ( 0.4- 0.5) 0.8 ( 0.5- 1.2) ∼East North Central 0.5 ( 0.4- 0.6) 0.5 ( 0.4- 0.6) 0.8 ( 0.5- 1.2) ∼
Illinois 0.5 ( 0.3- 0.7) 0.5 ( 0.3- 0.7) ∼ ∼Indiana ∼ ∼ ∼ ∼Michigan 0.5 ( 0.3- 0.7) 0.4 ( 0.2- 0.6) ∼ ∼Ohio 0.5 ( 0.4- 0.8) 0.6 ( 0.4- 0.8) ∼ ∼Wisconsin 0.6 ( 0.4- 1.0) 0.6 ( 0.3- 0.9) ∼ ∼
West North Central 0.4 ( 0.3- 0.5) 0.4 ( 0.2- 0.5) ∼ ∼Iowa ∼ ∼ ∼ ∼Kansas ∼ ∼ ∼ ∼Minnesota ∼ ∼ ∼ ∼Missouri ∼ ∼ ∼ ∼Nebraska ∼ ∼ ∼ ∼North Dakota ∼ ∼ ∼ ∼South Dakota ∼ ∼ ∼ ∼
South 0.5 ( 0.4- 0.5) 0.4 ( 0.4- 0.5) 0.6 ( 0.5- 0.8) ∼South Atlantic 0.5 ( 0.4- 0.6) 0.5 ( 0.4- 0.6) 0.6 ( 0.4- 0.9) ∼
Delaware ∼ ∼ ∼ ∼District of Columbia ∼ ∼ ∼ ∼Florida 0.5 ( 0.4- 0.7) 0.6 ( 0.4- 0.7) ∼ ∼Georgia 0.5 ( 0.3- 0.7) ∼ ∼ ∼Maryland ∼ ∼ ∼ ∼North Carolina 0.5 ( 0.3- 0.7) ∼ ∼ ∼South Carolina ∼ ∼ ∼ ∼Virginia 0.4 ( 0.2- 0.6) ∼ ∼ ∼West Virginia ∼ ∼ ∼ ∼
East South Central 0.4 ( 0.3- 0.5) 0.4 ( 0.3- 0.5) ∼ ∼Alabama ∼ ∼ ∼ ∼Kentucky ∼ ∼ ∼ ∼Mississippi ∼ ∼ ∼ ∼Tennessee ∼ ∼ ∼ ∼
West South Central 0.5 ( 0.4- 0.6) 0.4 ( 0.3- 0.5) 0.9 ( 0.5- 1.4) ∼Arkansas ∼ ∼ ∼ ∼

Cancer Incidence and M
ortality, by U.S. C
ensus Region and D
i�ision, State, and Metropolitan A
rea
���
Table 2.12.1.2F: Larynx. Age-Adjusted Cancer Death Rates∗ and 95% Confidence Intervals, by U.S. CensusRegion and Division, State, and Race and Ethnicity, United States† (continued)
Females, 2004
Area All Races White Black Hispanic‡§
Louisiana ∼ ∼ ∼ ∼Oklahoma ∼ ∼ ∼ ∼Texas 0.4 ( 0.3- 0.6) 0.4 ( 0.2- 0.5) ∼ ∼
West 0.3 ( 0.3- 0.4) 0.4 ( 0.3- 0.4) ∼ ∼Mountain 0.3 ( 0.2- 0.5) 0.3 ( 0.2- 0.5) ∼ ∼Arizona ∼ ∼ ∼ ∼Colorado ∼ ∼ ∼ ∼Idaho ∼ ∼ ∼ ∼Montana ∼ ∼ ∼ ∼Nevada ∼ ∼ ∼ ∼New Mexico ∼ ∼ ∼ ∼Utah ∼ ∼ ∼ ∼Wyoming ∼ ∼ ∼ ∼
Pacific 0.3 ( 0.3- 0.4) 0.4 ( 0.3- 0.5) ∼ ∼Alaska ∼ ∼ ∼ ∼California 0.3 ( 0.2- 0.4) 0.3 ( 0.2- 0.4) ∼ ∼Hawaii ∼ ∼ ∼ ∼Oregon 0.8 ( 0.5- 1.3) 0.8 ( 0.5- 1.3) ∼ ∼Washington ∼ ∼ ∼ ∼
∗ Rates are per 100,000 persons and are age-adjusted to the 2000 U.S. standard population (19 age groups - Census P25-1130).† Data are from the National Vital Statistics System (NVSS).‡ Data for specified racial or ethnic populations other than white and black should be interpreted with caution. See Technical Notes.
§ Hispanic origin is not mutually exclusive from race categories (white, black).
∼ Rates are suppressed if fewer than 16 cases were reported in a specific category (area, race, ethnicity).
Note: U.S. rates are as presented in Table 1.1.1.2F.

United
States Cancer Statistics: 2004 Incid
ence and M
ortality
�30
continued
Table 2.13.1.1M: Leukemias. Age-Adjusted Cancer Incidence Rates∗ and 95% Confidence Intervals, by U.S.Census Region and Division, State and Metropolitan Area, and Race and Ethnicity, United States†‡
Males, 2004
Area All Races White Black Hispanic§
United States 15.2 ( 15.0- 15.4) 15.4 ( 15.2- 15.6) 11.8 ( 11.1- 12.5) 10.8 ( 10.2- 11.5)
Northeast 16.0 ( 15.5- 16.5) 16.3 ( 15.8- 16.8) 11.9 ( 10.4- 13.4) 11.2 ( 9.5- 13.2)
New England 15.4 ( 14.5- 16.4) 15.6 ( 14.6- 16.6) 11.8 ( 7.6- 17.3) 9.4 ( 5.7- 14.7)
Connecticut 12.2 ( 10.6- 14.0) 12.3 ( 10.6- 14.2) ∼ ∼Maine 19.2 ( 15.9- 23.0) 18.9 ( 15.6- 22.7) ∼ ∼Massachusetts 15.5 ( 14.1- 17.0) 15.8 ( 14.3- 17.4) ∼ ∼New Hampshire 16.0 ( 12.9- 19.6) 15.7 ( 12.6- 19.3) ∼ ∼Rhode Island 15.8 ( 12.6- 19.7) 15.8 ( 12.4- 19.8) ∼ ∼Vermont 22.2 ( 17.0- 28.3) 22.5 ( 17.3- 28.8) ∼ ∼
Middle Atlantic 16.2 ( 15.6- 16.8) 16.6 ( 15.9- 17.2) 11.9 ( 10.4- 13.5) 11.5 ( 9.6- 13.6)
New Jersey 16.8 ( 15.5- 18.1) 16.8 ( 15.5- 18.3) 13.0 ( 9.5- 17.2) 11.9 ( 8.2- 16.5)
New York 16.0 ( 15.2- 16.9) 17.0 ( 16.0- 18.0) 11.2 ( 9.3- 13.4) 11.6 ( 9.3- 14.2)
Pennsylvania 16.1 ( 15.1- 17.2) 15.9 ( 14.9- 17.0) 13.1 ( 10.0- 16.9) -
Midwest 16.3 ( 15.8- 16.7) 16.1 ( 15.7- 16.6) 11.7 ( 10.3- 13.3) 9.8 ( 7.4- 12.5)
East North Central 15.3 ( 14.8- 15.9) 15.3 ( 14.8- 15.9) 11.3 ( 9.8- 13.0) 10.3 ( 7.6- 13.6)
Illinois 16.6 ( 15.5- 17.7) 16.6 ( 15.4- 17.8) 9.7 ( 7.3- 12.5) 9.0 ( 5.8- 13.1)
Indiana 14.8 ( 13.4- 16.3) 15.2 ( 13.6- 16.8) 8.8 ( 5.0- 14.4) ∼Michigan 16.5 ( 15.4- 17.8) 16.2 ( 14.9- 17.5) 16.8 ( 13.2- 21.1) ∼
Detroit 18.6 ( 16.6- 20.8) 18.6 ( 16.3- 21.1) 18.9 ( 14.4- 24.1) ∼Ohio 13.0 ( 12.0- 14.0) 13.2 ( 12.2- 14.3) 9.3 ( 6.7- 12.6) ∼Wisconsin 15.9 ( 14.4- 17.6) 16.1 ( 14.5- 17.8) ∼ ∼
West North Central 18.4 ( 17.5- 19.3) 17.8 ( 16.9- 18.7) 14.0 ( 10.1- 18.7) 7.8 ( 4.0- 13.7)
Iowa 16.6 ( 14.6- 18.9) 16.4 ( 14.4- 18.7) ∼ ∼Kansas 18.0 ( 15.7- 20.5) 17.4 ( 15.1- 19.9) ∼ ∼Minnesota 22.7 ( 20.7- 24.7) 21.1 ( 19.2- 23.1) ∼ ∼Missouri 16.4 ( 14.9- 18.1) 16.6 ( 15.0- 18.3) 14.2 ( 9.3- 20.6) ∼Nebraska 17.6 ( 14.8- 20.7) 17.0 ( 14.2- 20.1) ∼ ∼North Dakota 15.5 ( 11.5- 20.5) 14.8 ( 10.9- 19.8) ∼ ∼South Dakota 19.5 ( 15.3- 24.5) 18.7 ( 14.4- 23.7) ∼ ∼
South 14.6 ( 14.3- 15.0) 14.9 ( 14.5- 15.3) 11.9 ( 10.9- 12.8) 11.3 ( 10.2- 12.4)
South Atlantic 14.1 ( 13.6- 14.6) 14.5 ( 14.0- 15.1) 11.7 ( 10.4- 13.0) 11.8 ( 10.1- 13.6)
Delaware 11.5 ( 8.3- 15.5) 12.4 ( 8.8- 17.1) ∼ ∼District of Columbia 7.7 ( 4.4- 12.3) ∼ ∼ ∼Florida 14.7 ( 13.9- 15.5) 15.0 ( 14.1- 15.8) 12.8 ( 10.3- 15.8) -
Georgia 15.4 ( 14.0- 16.9) 16.0 ( 14.4- 17.8) 13.3 ( 10.5- 16.4) 11.2 ( 4.7- 21.8)
Atlanta 15.6 ( 13.0- 18.6) 17.2 ( 14.0- 20.9) 12.3 ( 8.1- 17.8) ∼Maryland
North Carolina 13.3 ( 12.1- 14.5) 14.0 ( 12.7- 15.5) 9.1 ( 6.8- 11.9) ∼South Carolina 14.9 ( 13.2- 16.8) 16.0 ( 13.9- 18.3) 11.6 ( 8.3- 15.6) -
Virginia 12.3 ( 11.0- 13.6) 12.0 ( 10.7- 13.5) 11.9 ( 8.9- 15.4) ∼West Virginia 16.0 ( 13.5- 18.9) 15.7 ( 13.2- 18.5) ∼ ∼
East South Central 14.3 ( 13.5- 15.2) 14.4 ( 13.4- 15.3) 11.9 ( 9.9- 14.1) 11.4 ( 5.1- 21.5)
Alabama 13.9 ( 12.3- 15.7) 14.8 ( 13.0- 16.9) 10.6 ( 7.5- 14.4) ∼Kentucky 16.5 ( 14.6- 18.5) 15.7 ( 13.8- 17.8) ∼ -
Mississippi 12.0 ( 10.1- 14.2) 11.2 ( 9.0- 13.7) 13.5 ( 9.8- 18.1) ∼Tennessee 14.3 ( 12.8- 15.9) 14.3 ( 12.7- 16.0) 11.8 ( 8.0- 16.5) ∼

Cancer Incidence and M
ortality, by U.S. C
ensus Region and D
i�ision, State, and Metropolitan A
rea
�3�
Table 2.13.1.1M: Leukemias. Age-Adjusted Cancer Incidence Rates∗ and 95% Confidence Intervals, by U.S.Census Region and Division, State and Metropolitan Area, and Race and Ethnicity, United States†‡(continued)
Males, 2004
Area All Races White Black Hispanic§
West South Central 15.8 ( 15.1- 16.5) 15.9 ( 15.2- 16.7) 12.3 ( 10.5- 14.4) 10.7 ( 9.4- 12.3)
Arkansas 14.4 ( 12.3- 16.6) 14.7 ( 12.5- 17.1) ∼ ∼Louisiana 14.5 ( 12.8- 16.4) 15.3 ( 13.3- 17.6) 13.2 ( 9.9- 17.1) ∼Oklahoma 16.5 ( 14.6- 18.7) 15.9 ( 13.8- 18.1) ∼ ∼Texas 16.2 ( 15.3- 17.1) 16.1 ( 15.2- 17.1) 12.1 ( 9.5- 15.0) 10.7 ( 9.3- 12.2)
West 14.3 ( 13.9- 14.8) 14.6 ( 14.1- 15.1) 11.5 ( 9.5- 13.7) 10.5 ( 9.5- 11.6)
Mountain 13.9 ( 13.1- 14.7) 13.8 ( 13.0- 14.7) 9.0 ( 5.0- 14.8) 9.8 ( 7.9- 11.9)
Arizona 9.9 ( 8.7- 11.2) 9.8 ( 8.6- 11.1) ∼ 9.1 ( 6.0- 13.0)
Colorado 17.4 ( 15.5- 19.5) 16.9 ( 14.9- 19.0) ∼ 9.5 ( 5.7- 14.7)
Idaho 16.1 ( 13.1- 19.7) 15.9 ( 12.8- 19.4) ∼ ∼Montana 16.2 ( 12.7- 20.4) 16.1 ( 12.5- 20.4) ∼ ∼Nevada 15.6 ( 13.1- 18.4) 16.3 ( 13.6- 19.3) ∼ ∼New Mexico 14.4 ( 12.0- 17.3) 15.4 ( 12.7- 18.5) ∼ 11.5 ( 7.9- 16.0)
Utah 14.8 ( 12.3- 17.7) 14.8 ( 12.2- 17.7) ∼ ∼Wyoming 12.8 ( 8.6- 18.3) 11.4 ( 7.4- 16.8) ∼ ∼
Pacific 14.5 ( 14.0- 15.0) 14.9 ( 14.3- 15.5) 12.0 ( 9.8- 14.6) 10.7 ( 9.6- 12.0)
Alaska 14.7 ( 9.3- 21.8) 15.0 ( 8.8- 23.5) ∼ ∼California 14.1 ( 13.5- 14.7) 14.6 ( 13.9- 15.3) 11.9 ( 9.6- 14.6) 10.8 ( 9.6- 12.1)
San Francisco-Oakland 13.1 ( 11.5- 14.9) 13.9 ( 11.9- 16.1) ∼ 7.8 ( 4.4- 12.7)
San Jose-Monterey 15.4 ( 12.9- 18.1) 16.2 ( 13.4- 19.5) ∼ 11.5 ( 6.8- 18.0)
Los Angeles 13.8 ( 12.7- 15.1) 14.7 ( 13.3- 16.2) 15.4 ( 11.5- 20.1) 12.0 ( 9.8- 14.4)
Hawaii 12.3 ( 9.7- 15.4) 13.8 ( 8.5- 21.2) ∼ ∼Oregon 12.7 ( 11.1- 14.6) 12.8 ( 11.1- 14.7) ∼ ∼Washington 18.1 ( 16.5- 19.8) 18.1 ( 16.4- 19.9) ∼ 12.6 ( 5.5- 23.8)
Seattle-Puget Sound 18.5 ( 16.5- 20.6) 19.0 ( 16.9- 21.3) ∼ ∼∗ Rates are per 100,000 persons and are age-adjusted to the 2000 U.S. standard population (19 age groups - Census P25-1130).† Data are from all state and metropolitan area cancer registries, except Maryland. Included data cover approximately 98% of the population and met data
quality criteria for all invasive cancer sites combined. See Appendix B for registry-specific data quality information.‡ Invasive cancers only.
§ Data for specified racial or ethnic populations other than white and black should be interpreted with caution. See Technical Notes.
Hispanic origin is not mutually exclusive from race categories (white, black).
∼ Rates are suppressed if fewer than 16 cases were reported in a specific category (area, race, ethnicity).
- Rates are suppressed at the state’s or metropolitan area’s request. See Technical Notes.
Notes: Cases from suppressed rates are included in the U.S. and region/division rates. U.S. rates are as presented in Table 1.1.1.1M. Michigan, Georgia,
California, and Washington state rates each include cases from the SEER metropolitan areas.

United
States Cancer Statistics: 2004 Incid
ence and M
ortality
�3�
continued
Table 2.13.1.1F: Leukemias. Age-Adjusted Cancer Incidence Rates∗ and 95% Confidence Intervals, by U.S.Census Region and Division, State and Metropolitan Area, and Race and Ethnicity, United States†‡
Females, 2004
Area All Races White Black Hispanic§
United States 9.1 ( 8.9- 9.2) 9.2 ( 9.1- 9.4) 7.4 ( 7.0- 7.8) 7.8 ( 7.3- 8.3)
Northeast 9.5 ( 9.1- 9.8) 9.7 ( 9.3- 10.1) 6.8 ( 5.9- 7.7) 7.5 ( 6.3- 8.7)
New England 9.5 ( 8.8- 10.2) 9.6 ( 8.9- 10.4) 6.4 ( 4.0- 9.5) 10.4 ( 6.8- 15.1)
Connecticut 7.8 ( 6.6- 9.1) 8.1 ( 6.8- 9.5) ∼ ∼Maine 11.4 ( 9.2- 14.1) 11.4 ( 9.1- 14.0) ∼ ∼Massachusetts 9.4 ( 8.4- 10.5) 9.5 ( 8.5- 10.7) ∼ 12.0 ( 6.5- 19.9)
New Hampshire 10.6 ( 8.3- 13.3) 10.2 ( 7.9- 13.0) ∼ ∼Rhode Island 12.1 ( 9.5- 15.1) 12.6 ( 9.8- 15.9) ∼ ∼Vermont 8.2 ( 5.4- 12.1) 8.4 ( 5.5- 12.3) ∼ ∼
Middle Atlantic 9.5 ( 9.1- 9.9) 9.7 ( 9.3- 10.2) 6.9 ( 5.9- 7.9) 7.0 ( 5.9- 8.4)
New Jersey 9.6 ( 8.8- 10.5) 9.5 ( 8.6- 10.5) 7.8 ( 5.7- 10.4) 8.5 ( 5.9- 11.6)
New York 9.7 ( 9.1- 10.3) 10.5 ( 9.8- 11.2) 6.3 ( 5.2- 7.6) 6.8 ( 5.4- 8.4)
Pennsylvania 9.1 ( 8.5- 9.9) 9.1 ( 8.4- 9.8) 7.6 ( 5.7- 10.1) -
Midwest 9.5 ( 9.2- 9.9) 9.5 ( 9.1- 9.8) 7.7 ( 6.7- 8.7) 7.3 ( 5.6- 9.3)
East North Central 9.2 ( 8.9- 9.6) 9.1 ( 8.7- 9.5) 7.8 ( 6.8- 9.0) 7.9 ( 5.9- 10.3)
Illinois 10.4 ( 9.6- 11.1) 10.2 ( 9.4- 11.0) 8.6 ( 6.8- 10.8) 9.3 ( 6.6- 12.8)
Indiana 7.9 ( 7.0- 8.9) 7.9 ( 7.0- 9.0) 6.6 ( 3.9- 10.5) ∼Michigan 9.9 ( 9.1- 10.8) 9.9 ( 9.0- 10.8) 7.0 ( 5.1- 9.3) ∼
Detroit 10.2 ( 9.0- 11.7) 10.5 ( 9.0- 12.2) 8.4 ( 6.1- 11.3) ∼Ohio 7.9 ( 7.2- 8.6) 7.8 ( 7.1- 8.5) 8.0 ( 5.9- 10.4) ∼Wisconsin 9.8 ( 8.7- 11.0) 9.9 ( 8.8- 11.2) ∼ ∼
West North Central 10.2 ( 9.6- 10.8) 10.1 ( 9.5- 10.7) 6.7 ( 4.6- 9.4) 5.2 ( 2.7- 9.3)
Iowa 10.8 ( 9.4- 12.5) 10.6 ( 9.1- 12.3) ∼ ∼Kansas 10.3 ( 8.8- 12.1) 10.1 ( 8.5- 11.9) ∼ ∼Minnesota 12.2 ( 11.0- 13.6) 11.8 ( 10.5- 13.2) ∼ ∼Missouri 8.4 ( 7.4- 9.4) 8.7 ( 7.7- 9.8) 5.4 ( 3.1- 8.7) ∼Nebraska 9.3 ( 7.5- 11.4) 9.2 ( 7.3- 11.3) ∼ ∼North Dakota 8.4 ( 5.7- 12.0) 8.6 ( 5.7- 12.4) ∼ ∼South Dakota 11.7 ( 8.7- 15.4) 12.1 ( 9.0- 16.0) ∼ ∼
South 8.8 ( 8.5- 9.0) 8.9 ( 8.6- 9.2) 7.7 ( 7.1- 8.3) 7.9 ( 7.2- 8.8)
South Atlantic 8.3 ( 8.0- 8.7) 8.4 ( 8.0- 8.8) 8.0 ( 7.2- 8.8) 7.6 ( 6.5- 8.9)
Delaware 8.0 ( 5.6- 11.0) 8.0 ( 5.4- 11.6) ∼ ∼District of Columbia 8.3 ( 5.4- 12.3) ∼ 8.4 ( 4.9- 13.6) ∼Florida 8.3 ( 7.8- 8.9) 8.4 ( 7.9- 9.1) 8.1 ( 6.5- 10.0) -
Georgia 9.5 ( 8.6- 10.5) 10.0 ( 8.9- 11.1) 7.9 ( 6.3- 9.8) 11.7 ( 6.0- 20.3)
Atlanta 8.8 ( 7.3- 10.6) 9.0 ( 7.1- 11.3) 9.1 ( 6.3- 12.6) ∼Maryland
North Carolina 8.1 ( 7.3- 9.0) 8.0 ( 7.1- 9.0) 8.8 ( 7.0- 11.0) ∼South Carolina 8.8 ( 7.7- 10.1) 9.6 ( 8.1- 11.2) 7.1 ( 5.1- 9.6) -
Virginia 7.0 ( 6.2- 7.9) 6.6 ( 5.7- 7.5) 8.1 ( 6.2- 10.5) ∼West Virginia 8.2 ( 6.7- 10.1) 8.4 ( 6.7- 10.3) ∼ ∼
East South Central 8.9 ( 8.3- 9.5) 8.9 ( 8.3- 9.6) 7.7 ( 6.4- 9.1) ∼Alabama 8.4 ( 7.3- 9.6) 8.6 ( 7.3- 10.0) 8.1 ( 5.9- 10.7) ∼Kentucky 9.4 ( 8.2- 10.7) 8.6 ( 7.4- 9.9) ∼ -
Mississippi 8.4 ( 7.1- 10.0) 8.6 ( 7.0- 10.5) 8.3 ( 5.8- 11.4) ∼Tennessee 9.3 ( 8.3- 10.4) 9.5 ( 8.4- 10.8) 7.2 ( 4.9- 10.1) ∼

Cancer Incidence and M
ortality, by U.S. C
ensus Region and D
i�ision, State, and Metropolitan A
rea
�33
Table 2.13.1.1F: Leukemias. Age-Adjusted Cancer Incidence Rates∗ and 95% Confidence Intervals, by U.S.Census Region and Division, State and Metropolitan Area, and Race and Ethnicity, United States†‡(continued)
Females, 2004
Area All Races White Black Hispanic§
West South Central 9.5 ( 9.0- 9.9) 9.7 ( 9.2- 10.2) 7.1 ( 6.0- 8.3) 8.0 ( 7.0- 9.2)
Arkansas 8.4 ( 7.0- 10.0) 8.3 ( 6.8- 10.0) 10.0 ( 6.0- 15.5) ∼Louisiana 8.7 ( 7.5- 9.9) 9.1 ( 7.7- 10.7) 7.9 ( 6.0- 10.4) ∼Oklahoma 9.4 ( 8.1- 10.9) 9.9 ( 8.5- 11.6) ∼ ∼Texas 9.8 ( 9.2- 10.4) 10.0 ( 9.3- 10.6) 6.3 ( 4.9- 8.0) 8.2 ( 7.1- 9.4)
West 8.8 ( 8.5- 9.1) 9.0 ( 8.6- 9.3) 6.6 ( 5.3- 8.0) 7.9 ( 7.1- 8.7)
Mountain 9.1 ( 8.5- 9.7) 9.1 ( 8.4- 9.7) 5.5 ( 3.2- 8.8) 7.0 ( 5.7- 8.6)
Arizona 6.9 ( 6.0- 7.9) 7.1 ( 6.2- 8.2) ∼ 4.8 ( 3.0- 7.2)
Colorado 10.3 ( 9.0- 11.7) 9.8 ( 8.5- 11.3) ∼ 9.6 ( 6.2- 14.1)
Idaho 9.9 ( 7.7- 12.5) 10.0 ( 7.8- 12.7) ∼ ∼Montana 9.4 ( 6.9- 12.4) 8.9 ( 6.5- 12.0) ∼ ∼Nevada 10.9 ( 9.1- 13.0) 10.8 ( 8.9- 13.1) ∼ 8.5 ( 4.3- 15.0)
New Mexico 10.5 ( 8.6- 12.7) 10.6 ( 8.6- 13.0) ∼ 6.9 ( 4.4- 10.1)
Utah 10.0 ( 8.1- 12.1) 10.0 ( 8.1- 12.2) ∼ ∼Wyoming 7.6 ( 4.7- 11.7) 7.4 ( 4.5- 11.6) ∼ ∼
Pacific 8.6 ( 8.3- 9.0) 8.9 ( 8.5- 9.3) 6.7 ( 5.3- 8.3) 8.2 ( 7.3- 9.1)
Alaska ∼ ∼ ∼ ∼California 8.5 ( 8.1- 8.9) 8.8 ( 8.3- 9.3) 6.9 ( 5.4- 8.7) 8.1 ( 7.2- 9.1)
San Francisco-Oakland 8.7 ( 7.5- 10.0) 9.6 ( 8.1- 11.3) ∼ 7.9 ( 4.9- 12.1)
San Jose-Monterey 8.2 ( 6.6- 10.0) 8.3 ( 6.5- 10.4) ∼ 7.4 ( 4.0- 12.3)
Los Angeles 8.8 ( 8.0- 9.7) 9.4 ( 8.4- 10.5) 8.3 ( 5.9- 11.2) 7.9 ( 6.5- 9.5)
Hawaii 8.1 ( 6.1- 10.5) ∼ ∼ ∼Oregon 7.8 ( 6.6- 9.1) 7.8 ( 6.6- 9.2) ∼ ∼Washington 10.2 ( 9.1- 11.4) 10.4 ( 9.2- 11.6) ∼ ∼
Seattle-Puget Sound 10.4 ( 9.1- 11.9) 11.1 ( 9.7- 12.8) ∼ ∼∗ Rates are per 100,000 persons and are age-adjusted to the 2000 U.S. standard population (19 age groups - Census P25-1130).† Data are from all state and metropolitan area cancer registries, except Maryland. Included data cover approximately 98% of the population and met data
quality criteria for all invasive cancer sites combined. See Appendix B for registry-specific data quality information.‡ Invasive cancers only.
§ Data for specified racial or ethnic populations other than white and black should be interpreted with caution. See Technical Notes.
Hispanic origin is not mutually exclusive from race categories (white, black).
∼ Rates are suppressed if fewer than 16 cases were reported in a specific category (area, race, ethnicity).
- Rates are suppressed at the state’s or metropolitan area’s request. See Technical Notes.
Notes: Cases from suppressed rates are included in the U.S. and region/division rates. U.S. rates are as presented in Table 1.1.1.1F. Michigan, Georgia,
California, and Washington state rates each include cases from the SEER metropolitan areas.

United
States Cancer Statistics: 2004 Incid
ence and M
ortality
�3�
continued
Table 2.13.1.2M: Leukemias. Age-Adjusted Cancer Death Rates∗ and 95% Confidence Intervals, by U.S. CensusRegion and Division, State, and Race and Ethnicity, United States†
Males, 2004
Area All Races White Black Hispanic‡§
United States 9.7 ( 9.5- 9.9) 9.9 ( 9.7- 10.1) 8.8 ( 8.2- 9.4) 6.0 ( 5.5- 6.5)
Northeast 9.4 ( 9.1- 9.8) 9.7 ( 9.3- 10.1) 8.4 ( 7.1- 9.9) 5.8 ( 4.5- 7.3)
New England 8.6 ( 7.9- 9.4) 8.7 ( 7.9- 9.4) 9.8 ( 5.6- 15.6) ∼Connecticut 7.7 ( 6.4- 9.2) 7.9 ( 6.5- 9.4) ∼ ∼Maine 9.2 ( 6.9- 11.9) 9.2 ( 7.0- 12.0) ∼ ∼Massachusetts 9.0 ( 7.9- 10.1) 8.9 ( 7.8- 10.1) ∼ ∼New Hampshire 9.9 ( 7.5- 13.0) 9.9 ( 7.4- 13.0) ∼ ∼Rhode Island 8.3 ( 6.0- 11.3) 8.2 ( 5.8- 11.2) ∼ ∼Vermont 7.5 ( 4.6- 11.5) 7.6 ( 4.7- 11.6) ∼ ∼
Middle Atlantic 9.7 ( 9.3- 10.2) 10.1 ( 9.6- 10.6) 8.3 ( 7.0- 9.8) 6.1 ( 4.7- 7.8)
New Jersey 9.5 ( 8.6- 10.6) 9.9 ( 8.8- 11.0) 7.6 ( 4.9- 11.1) ∼New York 9.5 ( 8.8- 10.2) 10.1 ( 9.3- 10.9) 7.1 ( 5.5- 9.0) 6.8 ( 5.0- 9.1)
Pennsylvania 10.2 ( 9.4- 11.1) 10.3 ( 9.4- 11.1) 11.6 ( 8.4- 15.4) ∼Midwest 10.4 ( 10.0- 10.8) 10.5 ( 10.1- 10.9) 9.1 ( 7.8- 10.5) 6.9 ( 4.8- 9.4)
East North Central 10.4 ( 10.0- 10.9) 10.6 ( 10.2- 11.1) 9.1 ( 7.7- 10.7) 6.4 ( 4.2- 9.2)
Illinois 10.5 ( 9.6- 11.4) 11.0 ( 10.1- 12.1) 7.7 ( 5.5- 10.5) 6.8 ( 3.9- 10.8)
Indiana 10.8 ( 9.5- 12.2) 11.0 ( 9.7- 12.5) ∼ ∼Michigan 9.7 ( 8.8- 10.7) 9.8 ( 8.8- 10.8) 9.8 ( 7.0- 13.2) ∼Ohio 10.3 ( 9.4- 11.2) 10.4 ( 9.4- 11.3) 10.6 ( 7.7- 14.1) ∼Wisconsin 11.5 ( 10.2- 12.9) 11.5 ( 10.1- 12.9) ∼ ∼
West North Central 10.2 ( 9.5- 10.9) 10.3 ( 9.6- 11.0) 8.7 ( 5.6- 12.6) ∼Iowa 10.8 ( 9.1- 12.6) 10.8 ( 9.2- 12.7) ∼ ∼Kansas 10.4 ( 8.6- 12.3) 10.6 ( 8.8- 12.7) ∼ ∼Minnesota 10.7 ( 9.4- 12.2) 10.7 ( 9.3- 12.2) ∼ ∼Missouri 10.2 ( 9.0- 11.5) 10.2 ( 8.9- 11.6) 9.7 ( 5.8- 15.1) ∼Nebraska 9.6 ( 7.6- 12.1) 9.8 ( 7.7- 12.3) ∼ ∼North Dakota 6.0 ( 3.6- 9.4) 6.2 ( 3.7- 9.7) ∼ ∼South Dakota 9.1 ( 6.3- 12.7) 9.5 ( 6.5- 13.3) ∼ ∼
South 9.7 ( 9.4- 10.0) 9.9 ( 9.6- 10.2) 8.8 ( 8.0- 9.7) 5.8 ( 5.0- 6.7)
South Atlantic 9.4 ( 9.0- 9.8) 9.6 ( 9.1- 10.0) 8.4 ( 7.4- 9.5) 6.1 ( 4.8- 7.5)
Delaware 9.5 ( 6.5- 13.3) 10.2 ( 6.9- 14.5) ∼ ∼District of Columbia 10.4 ( 6.5- 15.6) ∼ ∼ ∼Florida 9.1 ( 8.5- 9.7) 9.1 ( 8.4- 9.7) 8.9 ( 6.8- 11.4) 6.6 ( 5.2- 8.3)
Georgia 9.9 ( 8.8- 11.2) 10.4 ( 9.1- 11.9) 8.2 ( 6.0- 10.9) ∼Maryland 9.5 ( 8.2- 10.9) 10.0 ( 8.6- 11.7) 7.5 ( 5.2- 10.4) ∼North Carolina 9.2 ( 8.2- 10.3) 9.4 ( 8.3- 10.7) 8.1 ( 5.8- 10.9) ∼South Carolina 9.9 ( 8.4- 11.6) 10.5 ( 8.7- 12.4) 8.4 ( 5.6- 12.0) ∼Virginia 9.7 ( 8.6- 10.9) 9.9 ( 8.7- 11.3) 9.2 ( 6.6- 12.4) ∼West Virginia 9.8 ( 7.9- 12.1) 9.9 ( 7.9- 12.3) ∼ ∼
East South Central 10.3 ( 9.6- 11.1) 10.7 ( 9.9- 11.6) 8.7 ( 6.9- 10.8) ∼Alabama 11.1 ( 9.6- 12.7) 12.1 ( 10.3- 14.0) 7.7 ( 4.9- 11.3) ∼Kentucky 9.1 ( 7.7- 10.7) 9.2 ( 7.7- 10.8) ∼ ∼Mississippi 9.0 ( 7.3- 10.9) 8.9 ( 7.0- 11.2) 9.3 ( 6.1- 13.4) ∼Tennessee 11.3 ( 10.0- 12.8) 11.6 ( 10.2- 13.2) 9.8 ( 6.1- 14.6) ∼
West South Central 10.0 ( 9.4- 10.6) 10.1 ( 9.5- 10.8) 10.0 ( 8.3- 11.9) 5.6 ( 4.6- 6.8)
Arkansas 10.4 ( 8.6- 12.4) 10.1 ( 8.3- 12.2) 13.7 ( 7.7- 22.0) ∼

Cancer Incidence and M
ortality, by U.S. C
ensus Region and D
i�ision, State, and Metropolitan A
rea
�3�
Table 2.13.1.2M: Leukemias. Age-Adjusted Cancer Death Rates∗ and 95% Confidence Intervals, by U.S. CensusRegion and Division, State, and Race and Ethnicity, United States† (continued)
Males, 2004
Area All Races White Black Hispanic‡§
Louisiana 9.7 ( 8.3- 11.2) 9.6 ( 8.0- 11.5) 9.8 ( 7.0- 13.2) ∼Oklahoma 10.8 ( 9.2- 12.6) 10.8 ( 9.1- 12.7) ∼ ∼Texas 9.8 ( 9.1- 10.6) 10.0 ( 9.3- 10.8) 9.5 ( 7.2- 12.1) 5.7 ( 4.7- 6.9)
West 9.2 ( 8.8- 9.6) 9.6 ( 9.2- 10.0) 8.9 ( 7.1- 11.0) 6.0 ( 5.2- 6.9)
Mountain 9.0 ( 8.4- 9.7) 9.2 ( 8.5- 9.9) ∼ 7.2 ( 5.5- 9.2)
Arizona 8.6 ( 7.5- 9.8) 8.8 ( 7.7- 10.1) ∼ 6.8 ( 4.0- 10.6)
Colorado 9.5 ( 8.0- 11.2) 9.7 ( 8.2- 11.5) ∼ 12.9 ( 7.8- 19.6)
Idaho 10.5 ( 8.0- 13.5) 10.6 ( 8.1- 13.6) ∼ ∼Montana 8.8 ( 6.2- 12.1) 8.7 ( 6.1- 12.1) ∼ ∼Nevada 9.2 ( 7.3- 11.4) 9.3 ( 7.3- 11.7) ∼ ∼New Mexico 8.4 ( 6.5- 10.7) 8.5 ( 6.5- 11.0) ∼ 6.0 ( 3.4- 9.7)
Utah 8.6 ( 6.7- 10.9) 8.8 ( 6.8- 11.2) ∼ ∼Wyoming 9.9 ( 6.1- 15.3) 10.1 ( 6.2- 15.5) ∼ ∼
Pacific 9.3 ( 8.8- 9.7) 9.8 ( 9.3- 10.3) 9.2 ( 7.2- 11.5) 5.6 ( 4.7- 6.6)
Alaska 7.9 ( 4.3- 13.1) ∼ ∼ ∼California 9.0 ( 8.5- 9.5) 9.5 ( 9.0- 10.1) 8.5 ( 6.5- 10.9) 5.6 ( 4.7- 6.6)
Hawaii 7.3 ( 5.3- 9.7) ∼ ∼ ∼Oregon 9.5 ( 8.0- 11.1) 9.4 ( 7.9- 11.0) ∼ ∼Washington 11.3 ( 10.0- 12.7) 11.2 ( 9.9- 12.6) ∼ ∼
∗ Rates are per 100,000 persons and are age-adjusted to the 2000 U.S. standard population (19 age groups - Census P25-1130).† Data are from the National Vital Statistics System (NVSS).‡ Data for specified racial or ethnic populations other than white and black should be interpreted with caution. See Technical Notes.
§ Hispanic origin is not mutually exclusive from race categories (white, black).
∼ Rates are suppressed if fewer than 16 cases were reported in a specific category (area, race, ethnicity).
Note: U.S. rates are as presented in Table 1.1.1.2M.

United
States Cancer Statistics: 2004 Incid
ence and M
ortality
�3�
continued
Table 2.13.1.2F: Leukemias. Age-Adjusted Cancer Death Rates∗ and 95% Confidence Intervals, by U.S. CensusRegion and Division, State, and Race and Ethnicity, United States†
Females, 2004
Area All Races White Black Hispanic‡§
United States 5.5 ( 5.4- 5.6) 5.6 ( 5.5- 5.7) 5.3 ( 5.0- 5.7) 3.7 ( 3.4- 4.1)
Northeast 5.5 ( 5.3- 5.8) 5.7 ( 5.5- 6.0) 4.5 ( 3.8- 5.3) 2.9 ( 2.2- 3.7)
New England 5.5 ( 5.0- 6.0) 5.5 ( 5.0- 6.0) 5.9 ( 3.6- 9.1) ∼Connecticut 4.9 ( 4.0- 5.9) 4.7 ( 3.8- 5.8) ∼ ∼Maine 4.8 ( 3.4- 6.5) 4.7 ( 3.4- 6.5) ∼ ∼Massachusetts 5.8 ( 5.1- 6.7) 6.0 ( 5.2- 6.8) ∼ ∼New Hampshire 4.1 ( 2.8- 5.8) 4.1 ( 2.8- 5.9) ∼ ∼Rhode Island 7.4 ( 5.5- 9.8) 7.5 ( 5.5- 10.0) ∼ ∼Vermont 5.7 ( 3.5- 8.8) 5.8 ( 3.5- 9.0) ∼ ∼
Middle Atlantic 5.5 ( 5.3- 5.8) 5.8 ( 5.5- 6.2) 4.3 ( 3.6- 5.2) 3.0 ( 2.2- 4.0)
New Jersey 5.7 ( 5.1- 6.4) 5.9 ( 5.2- 6.6) 4.9 ( 3.2- 7.0) ∼New York 5.4 ( 5.0- 5.9) 5.9 ( 5.4- 6.4) 4.1 ( 3.2- 5.2) 3.1 ( 2.2- 4.3)
Pennsylvania 5.6 ( 5.1- 6.1) 5.7 ( 5.2- 6.3) 4.6 ( 3.1- 6.5) ∼Midwest 5.8 ( 5.5- 6.0) 5.8 ( 5.6- 6.1) 5.4 ( 4.6- 6.3) 3.0 ( 1.8- 4.5)
East North Central 5.7 ( 5.5- 6.0) 5.8 ( 5.5- 6.1) 5.4 ( 4.5- 6.4) 2.4 ( 1.3- 4.0)
Illinois 5.5 ( 5.0- 6.1) 5.8 ( 5.2- 6.4) 4.7 ( 3.4- 6.4) ∼Indiana 5.7 ( 5.0- 6.6) 5.8 ( 5.0- 6.7) ∼ ∼Michigan 5.9 ( 5.3- 6.5) 5.9 ( 5.3- 6.6) 5.5 ( 3.8- 7.6) ∼Ohio 5.6 ( 5.1- 6.2) 5.6 ( 5.0- 6.2) 6.2 ( 4.5- 8.4) ∼Wisconsin 6.3 ( 5.5- 7.2) 6.3 ( 5.5- 7.3) ∼ ∼
West North Central 5.8 ( 5.4- 6.3) 5.9 ( 5.4- 6.3) 5.6 ( 3.6- 8.2) ∼Iowa 6.9 ( 5.8- 8.2) 6.9 ( 5.8- 8.2) ∼ ∼Kansas 5.9 ( 4.7- 7.2) 6.2 ( 5.0- 7.6) ∼ ∼Minnesota 5.8 ( 4.9- 6.8) 5.8 ( 5.0- 6.8) ∼ ∼Missouri 5.6 ( 4.8- 6.4) 5.5 ( 4.7- 6.4) 6.2 ( 3.6- 9.7) ∼Nebraska 5.1 ( 3.9- 6.7) 5.2 ( 3.9- 6.8) ∼ ∼North Dakota ∼ ∼ ∼ ∼South Dakota 6.7 ( 4.6- 9.4) 6.7 ( 4.6- 9.5) ∼ ∼
South 5.5 ( 5.3- 5.7) 5.5 ( 5.3- 5.7) 5.8 ( 5.3- 6.3) 4.2 ( 3.6- 4.8)
South Atlantic 5.3 ( 5.1- 5.6) 5.2 ( 4.9- 5.5) 6.0 ( 5.4- 6.7) 3.9 ( 3.1- 4.9)
Delaware 6.5 ( 4.4- 9.2) 6.9 ( 4.6- 10.1) ∼ ∼District of Columbia 5.9 ( 3.5- 9.3) ∼ ∼ ∼Florida 5.2 ( 4.8- 5.7) 5.1 ( 4.7- 5.6) 6.0 ( 4.6- 7.7) 4.1 ( 3.1- 5.2)
Georgia 6.5 ( 5.7- 7.3) 6.6 ( 5.7- 7.5) 6.2 ( 4.7- 7.9) ∼Maryland 5.4 ( 4.6- 6.3) 5.5 ( 4.6- 6.6) 5.5 ( 3.9- 7.6) ∼North Carolina 4.8 ( 4.2- 5.4) 4.3 ( 3.7- 5.0) 6.5 ( 4.9- 8.4) ∼South Carolina 5.2 ( 4.3- 6.2) 5.3 ( 4.3- 6.5) 4.8 ( 3.2- 6.9) ∼Virginia 5.2 ( 4.5- 5.9) 4.8 ( 4.1- 5.6) 6.6 ( 4.8- 8.8) ∼West Virginia 5.3 ( 4.1- 6.8) 5.3 ( 4.0- 6.8) ∼ ∼
East South Central 6.1 ( 5.6- 6.6) 6.1 ( 5.6- 6.6) 6.1 ( 5.0- 7.4) ∼Alabama 5.7 ( 4.8- 6.7) 5.7 ( 4.7- 6.8) 5.7 ( 4.0- 8.0) ∼Kentucky 6.2 ( 5.2- 7.3) 6.2 ( 5.3- 7.4) ∼ ∼Mississippi 6.5 ( 5.3- 7.8) 6.2 ( 4.8- 7.8) 7.3 ( 5.0- 10.2) ∼Tennessee 6.2 ( 5.4- 7.1) 6.2 ( 5.3- 7.2) 5.6 ( 3.7- 8.3) ∼
West South Central 5.6 ( 5.2- 6.0) 5.8 ( 5.4- 6.2) 5.1 ( 4.1- 6.2) 4.5 ( 3.7- 5.5)
Arkansas 6.4 ( 5.2- 7.7) 6.6 ( 5.3- 8.0) ∼ ∼

Cancer Incidence and M
ortality, by U.S. C
ensus Region and D
i�ision, State, and Metropolitan A
rea
�3�
Table 2.13.1.2F: Leukemias. Age-Adjusted Cancer Death Rates∗ and 95% Confidence Intervals, by U.S. CensusRegion and Division, State, and Race and Ethnicity, United States† (continued)
Females, 2004
Area All Races White Black Hispanic‡§
Louisiana 5.4 ( 4.5- 6.4) 5.4 ( 4.4- 6.6) 5.7 ( 4.0- 7.8) ∼Oklahoma 5.7 ( 4.7- 6.8) 6.0 ( 5.0- 7.3) ∼ ∼Texas 5.5 ( 5.1- 6.0) 5.7 ( 5.2- 6.2) 4.7 ( 3.4- 6.2) 4.6 ( 3.8- 5.6)
West 5.0 ( 4.7- 5.2) 5.2 ( 5.0- 5.5) 4.2 ( 3.2- 5.4) 3.7 ( 3.2- 4.3)
Mountain 4.9 ( 4.5- 5.4) 5.0 ( 4.6- 5.5) ∼ 3.3 ( 2.3- 4.6)
Arizona 4.5 ( 3.8- 5.3) 4.6 ( 3.8- 5.4) ∼ ∼Colorado 4.3 ( 3.4- 5.2) 4.4 ( 3.5- 5.4) ∼ ∼Idaho 7.5 ( 5.6- 9.8) 7.6 ( 5.7- 10.0) ∼ ∼Montana 5.3 ( 3.6- 7.6) 5.2 ( 3.4- 7.5) ∼ ∼Nevada 5.3 ( 4.1- 6.9) 5.1 ( 3.8- 6.8) ∼ ∼New Mexico 4.4 ( 3.2- 5.8) 4.6 ( 3.3- 6.2) ∼ 4.7 ( 2.6- 7.6)
Utah 5.8 ( 4.4- 7.5) 5.9 ( 4.5- 7.7) ∼ ∼Wyoming ∼ ∼ ∼ ∼
Pacific 5.0 ( 4.7- 5.3) 5.4 ( 5.0- 5.7) 4.3 ( 3.2- 5.6) 3.9 ( 3.2- 4.6)
Alaska ∼ ∼ ∼ ∼California 5.0 ( 4.6- 5.3) 5.3 ( 4.9- 5.7) 4.5 ( 3.3- 6.0) 3.8 ( 3.2- 4.5)
Hawaii 2.5 ( 1.5- 4.1) ∼ ∼ ∼Oregon 5.2 ( 4.3- 6.3) 5.4 ( 4.4- 6.5) ∼ ∼Washington 5.8 ( 5.0- 6.7) 6.0 ( 5.2- 7.0) ∼ ∼
∗ Rates are per 100,000 persons and are age-adjusted to the 2000 U.S. standard population (19 age groups - Census P25-1130).† Data are from the National Vital Statistics System (NVSS).‡ Data for specified racial or ethnic populations other than white and black should be interpreted with caution. See Technical Notes.
§ Hispanic origin is not mutually exclusive from race categories (white, black).
∼ Rates are suppressed if fewer than 16 cases were reported in a specific category (area, race, ethnicity).
Note: U.S. rates are as presented in Table 1.1.1.2F.

United
States Cancer Statistics: 2004 Incid
ence and M
ortality
�3�
continued
Table 2.14.1.1M: Liver and Intrahepatic Bile Duct. Age-Adjusted Invasive Cancer Incidence Rates∗ and 95%Confidence Intervals, by U.S. Census Region and Division, State and Metropolitan Area, and Race and Ethnicity,United States†‡
Males, 2004
Area All Races White Black Hispanic§
United States 8.7 ( 8.6- 8.9) 7.7 ( 7.5- 7.9) 12.5 ( 11.9- 13.1) 15.5 ( 14.7- 16.4)
Northeast 9.6 ( 9.3- 10.0) 8.4 ( 8.1- 8.8) 15.2 ( 13.7- 16.9) 17.8 ( 15.7- 20.2)
New England 8.9 ( 8.2- 9.6) 8.2 ( 7.5- 8.9) 13.5 ( 9.5- 18.6) 17.3 ( 11.9- 24.1)
Connecticut 9.4 ( 8.0- 11.0) 8.8 ( 7.3- 10.4) ∼ 15.7 ( 8.6- 26.3)
Maine 7.9 ( 6.0- 10.4) 7.5 ( 5.6- 9.9) ∼ ∼Massachusetts 9.4 ( 8.3- 10.5) 8.5 ( 7.4- 9.6) 15.1 ( 9.3- 23.2) 15.5 ( 8.7- 25.4)
New Hampshire 4.8 ( 3.3- 6.9) 4.3 ( 2.9- 6.3) ∼ ∼Rhode Island 12.8 ( 9.9- 16.4) 12.3 ( 9.4- 15.9) ∼ ∼Vermont 5.6 ( 3.4- 8.8) 5.7 ( 3.4- 8.9) ∼ ∼
Middle Atlantic 9.9 ( 9.5- 10.4) 8.5 ( 8.1- 9.0) 15.4 ( 13.8- 17.2) 17.9 ( 15.6- 20.4)
New Jersey 9.5 ( 8.5- 10.5) 8.2 ( 7.3- 9.2) 14.1 ( 10.7- 18.2) 13.6 ( 9.6- 18.5)
New York 11.1 ( 10.5- 11.9) 9.5 ( 8.8- 10.2) 15.1 ( 12.9- 17.5) 20.0 ( 17.1- 23.3)
Pennsylvania 8.5 ( 7.8- 9.2) 7.5 ( 6.9- 8.3) 17.7 ( 14.1- 21.9) -
Midwest 7.1 ( 6.8- 7.4) 6.2 ( 6.0- 6.5) 14.8 ( 13.2- 16.4) 11.1 ( 8.7- 14.0)
East North Central 7.3 ( 7.0- 7.7) 6.5 ( 6.1- 6.9) 13.3 ( 11.7- 15.0) 11.3 ( 8.6- 14.6)
Illinois 8.3 ( 7.6- 9.1) 7.6 ( 6.9- 8.5) 11.4 ( 8.8- 14.4) 11.8 ( 8.1- 16.4)
Indiana 6.3 ( 5.4- 7.3) 5.8 ( 4.9- 6.8) 11.8 ( 7.4- 17.9) ∼Michigan 8.0 ( 7.2- 8.9) 6.9 ( 6.1- 7.7) 15.3 ( 12.1- 19.1) ∼
Detroit 10.6 ( 9.2- 12.2) 8.8 ( 7.3- 10.5) 17.2 ( 13.3- 21.9) ∼Ohio 5.8 ( 5.2- 6.5) 5.1 ( 4.4- 5.7) 11.7 ( 8.8- 15.1) ∼Wisconsin 8.3 ( 7.2- 9.5) 7.2 ( 6.2- 8.4) 30.3 ( 19.0- 45.5) ∼
West North Central 6.6 ( 6.1- 7.2) 5.7 ( 5.2- 6.2) 22.6 ( 17.8- 28.2) 10.5 ( 5.8- 17.3)
Iowa 6.2 ( 5.0- 7.6) 5.8 ( 4.7- 7.2) ∼ ∼Kansas 5.0 ( 3.9- 6.4) 4.5 ( 3.4- 5.9) ∼ ∼Minnesota 6.4 ( 5.4- 7.5) 5.6 ( 4.7- 6.7) ∼ ∼Missouri 8.8 ( 7.7- 10.0) 7.0 ( 6.0- 8.1) 27.3 ( 20.7- 35.2) ∼Nebraska 5.9 ( 4.4- 7.8) 5.6 ( 4.1- 7.5) ∼ ∼North Dakota ∼ ∼ ∼ ∼South Dakota 4.3 ( 2.4- 7.0) ∼ ∼ ∼
South 8.7 ( 8.4- 9.0) 8.1 ( 7.8- 8.4) 10.4 ( 9.6- 11.2) 16.0 ( 14.7- 17.5)
South Atlantic 7.8 ( 7.5- 8.2) 7.3 ( 6.9- 7.7) 9.2 ( 8.2- 10.3) 11.2 ( 9.5- 13.0)
Delaware 8.9 ( 6.3- 12.3) 9.2 ( 6.3- 13.0) ∼ ∼District of Columbia 10.2 ( 6.5- 15.1) ∼ 14.8 ( 9.2- 22.5) ∼Florida 8.7 ( 8.1- 9.3) 8.1 ( 7.5- 8.8) 12.1 ( 9.8- 14.7) -
Georgia 7.9 ( 7.0- 8.9) 7.6 ( 6.5- 8.7) 7.4 ( 5.5- 9.7) ∼Atlanta 7.8 ( 6.0- 9.8) 6.2 ( 4.4- 8.5) 9.8 ( 6.0- 14.8) ∼
Maryland
North Carolina 7.5 ( 6.6- 8.4) 7.1 ( 6.2- 8.1) 7.7 ( 5.7- 10.1) ∼South Carolina 6.6 ( 5.5- 7.9) 6.5 ( 5.3- 8.0) 6.4 ( 4.2- 9.2) -
Virginia 7.2 ( 6.3- 8.2) 6.0 ( 5.1- 7.1) 9.8 ( 7.3- 12.8) ∼West Virginia 5.7 ( 4.3- 7.4) 5.4 ( 4.0- 7.2) ∼ ∼
East South Central 6.7 ( 6.1- 7.3) 6.3 ( 5.8- 7.0) 7.7 ( 6.2- 9.4) ∼Alabama 6.7 ( 5.7- 7.9) 6.2 ( 5.1- 7.5) 7.7 ( 5.2- 10.9) ∼Kentucky 6.9 ( 5.7- 8.2) 6.7 ( 5.5- 8.1) ∼ -
Mississippi 7.4 ( 5.9- 9.1) 7.3 ( 5.6- 9.4) 6.8 ( 4.4- 10.0) ∼Tennessee 6.2 ( 5.3- 7.2) 5.8 ( 4.9- 6.9) 8.2 ( 5.4- 11.9) ∼
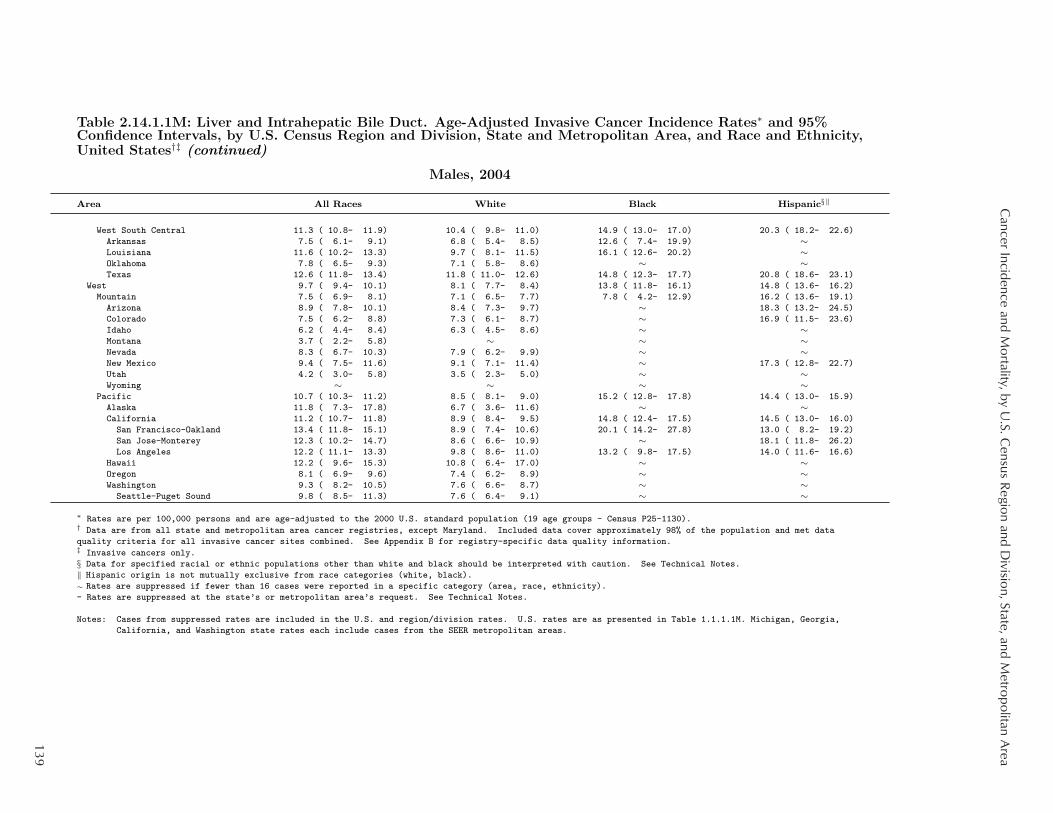
Cancer Incidence and M
ortality, by U.S. C
ensus Region and D
i�ision, State, and Metropolitan A
rea
�3�
Table 2.14.1.1M: Liver and Intrahepatic Bile Duct. Age-Adjusted Invasive Cancer Incidence Rates∗ and 95%Confidence Intervals, by U.S. Census Region and Division, State and Metropolitan Area, and Race and Ethnicity,United States†‡ (continued)
Males, 2004
Area All Races White Black Hispanic§
West South Central 11.3 ( 10.8- 11.9) 10.4 ( 9.8- 11.0) 14.9 ( 13.0- 17.0) 20.3 ( 18.2- 22.6)
Arkansas 7.5 ( 6.1- 9.1) 6.8 ( 5.4- 8.5) 12.6 ( 7.4- 19.9) ∼Louisiana 11.6 ( 10.2- 13.3) 9.7 ( 8.1- 11.5) 16.1 ( 12.6- 20.2) ∼Oklahoma 7.8 ( 6.5- 9.3) 7.1 ( 5.8- 8.6) ∼ ∼Texas 12.6 ( 11.8- 13.4) 11.8 ( 11.0- 12.6) 14.8 ( 12.3- 17.7) 20.8 ( 18.6- 23.1)
West 9.7 ( 9.4- 10.1) 8.1 ( 7.7- 8.4) 13.8 ( 11.8- 16.1) 14.8 ( 13.6- 16.2)
Mountain 7.5 ( 6.9- 8.1) 7.1 ( 6.5- 7.7) 7.8 ( 4.2- 12.9) 16.2 ( 13.6- 19.1)
Arizona 8.9 ( 7.8- 10.1) 8.4 ( 7.3- 9.7) ∼ 18.3 ( 13.2- 24.5)
Colorado 7.5 ( 6.2- 8.8) 7.3 ( 6.1- 8.7) ∼ 16.9 ( 11.5- 23.6)
Idaho 6.2 ( 4.4- 8.4) 6.3 ( 4.5- 8.6) ∼ ∼Montana 3.7 ( 2.2- 5.8) ∼ ∼ ∼Nevada 8.3 ( 6.7- 10.3) 7.9 ( 6.2- 9.9) ∼ ∼New Mexico 9.4 ( 7.5- 11.6) 9.1 ( 7.1- 11.4) ∼ 17.3 ( 12.8- 22.7)
Utah 4.2 ( 3.0- 5.8) 3.5 ( 2.3- 5.0) ∼ ∼Wyoming ∼ ∼ ∼ ∼
Pacific 10.7 ( 10.3- 11.2) 8.5 ( 8.1- 9.0) 15.2 ( 12.8- 17.8) 14.4 ( 13.0- 15.9)
Alaska 11.8 ( 7.3- 17.8) 6.7 ( 3.6- 11.6) ∼ ∼California 11.2 ( 10.7- 11.8) 8.9 ( 8.4- 9.5) 14.8 ( 12.4- 17.5) 14.5 ( 13.0- 16.0)
San Francisco-Oakland 13.4 ( 11.8- 15.1) 8.9 ( 7.4- 10.6) 20.1 ( 14.2- 27.8) 13.0 ( 8.2- 19.2)
San Jose-Monterey 12.3 ( 10.2- 14.7) 8.6 ( 6.6- 10.9) ∼ 18.1 ( 11.8- 26.2)
Los Angeles 12.2 ( 11.1- 13.3) 9.8 ( 8.6- 11.0) 13.2 ( 9.8- 17.5) 14.0 ( 11.6- 16.6)
Hawaii 12.2 ( 9.6- 15.3) 10.8 ( 6.4- 17.0) ∼ ∼Oregon 8.1 ( 6.9- 9.6) 7.4 ( 6.2- 8.9) ∼ ∼Washington 9.3 ( 8.2- 10.5) 7.6 ( 6.6- 8.7) ∼ ∼
Seattle-Puget Sound 9.8 ( 8.5- 11.3) 7.6 ( 6.4- 9.1) ∼ ∼∗ Rates are per 100,000 persons and are age-adjusted to the 2000 U.S. standard population (19 age groups - Census P25-1130).† Data are from all state and metropolitan area cancer registries, except Maryland. Included data cover approximately 98% of the population and met data
quality criteria for all invasive cancer sites combined. See Appendix B for registry-specific data quality information.‡ Invasive cancers only.
§ Data for specified racial or ethnic populations other than white and black should be interpreted with caution. See Technical Notes.
Hispanic origin is not mutually exclusive from race categories (white, black).
∼ Rates are suppressed if fewer than 16 cases were reported in a specific category (area, race, ethnicity).
- Rates are suppressed at the state’s or metropolitan area’s request. See Technical Notes.
Notes: Cases from suppressed rates are included in the U.S. and region/division rates. U.S. rates are as presented in Table 1.1.1.1M. Michigan, Georgia,
California, and Washington state rates each include cases from the SEER metropolitan areas.

United
States Cancer Statistics: 2004 Incid
ence and M
ortality
��0
continued
Table 2.14.1.1F: Liver and Intrahepatic Bile Duct. Age-Adjusted Invasive Cancer Incidence Rates∗ and 95%Confidence Intervals, by U.S. Census Region and Division, State and Metropolitan Area, and Race and Ethnicity,United States†‡
Females, 2004
Area All Races White Black Hispanic§
United States 3.0 ( 2.9- 3.1) 2.6 ( 2.6- 2.7) 3.8 ( 3.5- 4.1) 6.0 ( 5.5- 6.5)
Northeast 2.9 ( 2.7- 3.1) 2.6 ( 2.4- 2.8) 4.4 ( 3.7- 5.2) 6.1 ( 5.0- 7.3)
New England 2.4 ( 2.1- 2.8) 2.2 ( 1.9- 2.6) ∼ ∼Connecticut 2.3 ( 1.7- 3.1) 2.1 ( 1.5- 2.8) ∼ ∼Maine 1.9 ( 1.1- 3.1) ∼ ∼ ∼Massachusetts 2.6 ( 2.1- 3.1) 2.5 ( 2.0- 3.0) ∼ ∼New Hampshire ∼ ∼ ∼ ∼Rhode Island 3.6 ( 2.3- 5.4) 3.4 ( 2.2- 5.2) ∼ ∼Vermont ∼ ∼ ∼ ∼
Middle Atlantic 3.1 ( 2.9- 3.3) 2.7 ( 2.5- 2.9) 4.6 ( 3.8- 5.4) 6.3 ( 5.1- 7.7)
New Jersey 3.2 ( 2.7- 3.7) 2.8 ( 2.4- 3.4) 4.4 ( 2.8- 6.4) 6.9 ( 4.4- 10.1)
New York 3.4 ( 3.1- 3.8) 3.0 ( 2.6- 3.3) 4.6 ( 3.7- 5.8) 6.4 ( 5.0- 8.0)
Pennsylvania 2.6 ( 2.3- 3.0) 2.3 ( 2.0- 2.7) 4.7 ( 3.2- 6.6) -
Midwest 2.6 ( 2.4- 2.7) 2.3 ( 2.2- 2.5) 4.3 ( 3.6- 5.2) 4.7 ( 3.1- 6.6)
East North Central 2.8 ( 2.6- 3.0) 2.5 ( 2.3- 2.8) 4.2 ( 3.4- 5.1) 5.1 ( 3.3- 7.4)
Illinois 3.0 ( 2.6- 3.5) 2.8 ( 2.3- 3.2) 4.2 ( 3.0- 5.8) 6.4 ( 3.8- 9.9)
Indiana 2.4 ( 1.9- 2.9) 2.2 ( 1.7- 2.8) ∼ ∼Michigan 3.2 ( 2.7- 3.7) 2.8 ( 2.4- 3.4) 4.7 ( 3.2- 6.7) ∼
Detroit 3.7 ( 3.0- 4.6) 3.2 ( 2.4- 4.2) 4.6 ( 2.9- 6.9) ∼Ohio 2.2 ( 1.9- 2.6) 2.0 ( 1.7- 2.4) 3.4 ( 2.1- 5.2) ∼Wisconsin 3.3 ( 2.7- 4.0) 3.0 ( 2.4- 3.7) ∼ ∼
West North Central 2.1 ( 1.8- 2.4) 1.9 ( 1.6- 2.1) 5.2 ( 3.3- 7.7) ∼Iowa 1.9 ( 1.3- 2.6) 1.8 ( 1.3- 2.6) ∼ ∼Kansas 2.0 ( 1.4- 2.8) 1.9 ( 1.3- 2.7) ∼ ∼Minnesota 1.8 ( 1.3- 2.4) 1.6 ( 1.2- 2.2) ∼ ∼Missouri 2.6 ( 2.1- 3.2) 2.2 ( 1.7- 2.8) 6.4 ( 3.8- 10.0) ∼Nebraska 1.9 ( 1.1- 3.0) 1.8 ( 1.0- 2.9) ∼ ∼North Dakota ∼ ∼ ∼ ∼South Dakota ∼ ∼ ∼ ∼
South 2.9 ( 2.8- 3.1) 2.8 ( 2.6- 2.9) 3.2 ( 2.8- 3.6) 6.3 ( 5.6- 7.2)
South Atlantic 2.5 ( 2.3- 2.6) 2.2 ( 2.0- 2.4) 2.9 ( 2.4- 3.4) 3.5 ( 2.6- 4.4)
Delaware ∼ ∼ ∼ ∼District of Columbia 5.0 ( 2.9- 8.2) ∼ ∼ ∼Florida 2.7 ( 2.4- 3.0) 2.4 ( 2.1- 2.7) 4.0 ( 2.9- 5.3) -
Georgia 2.7 ( 2.2- 3.3) 2.4 ( 1.9- 3.0) 2.9 ( 2.0- 4.1) ∼Atlanta 2.9 ( 2.0- 4.0) 2.3 ( 1.4- 3.6) ∼ ∼
Maryland
North Carolina 2.0 ( 1.6- 2.5) 1.8 ( 1.4- 2.3) 2.2 ( 1.3- 3.3) ∼South Carolina 1.3 ( 0.9- 1.8) 1.4 ( 0.9- 2.2) ∼ -
Virginia 2.5 ( 2.1- 3.1) 2.3 ( 1.8- 2.9) 2.7 ( 1.6- 4.3) ∼West Virginia 3.0 ( 2.1- 4.1) 2.9 ( 2.0- 4.1) ∼ ∼
East South Central 2.6 ( 2.3- 2.9) 2.6 ( 2.3- 3.0) 2.3 ( 1.6- 3.2) ∼Alabama 3.2 ( 2.6- 4.0) 3.3 ( 2.6- 4.2) ∼ ∼Kentucky 2.2 ( 1.7- 2.9) 2.2 ( 1.6- 2.9) ∼ -
Mississippi 3.0 ( 2.2- 4.0) 3.3 ( 2.4- 4.6) ∼ ∼Tennessee 2.2 ( 1.7- 2.7) 2.1 ( 1.6- 2.7) ∼ ∼

Cancer Incidence and M
ortality, by U.S. C
ensus Region and D
i�ision, State, and Metropolitan A
rea
���
Table 2.14.1.1F: Liver and Intrahepatic Bile Duct. Age-Adjusted Invasive Cancer Incidence Rates∗ and 95%Confidence Intervals, by U.S. Census Region and Division, State and Metropolitan Area, and Race and Ethnicity,United States†‡ (continued)
Females, 2004
Area All Races White Black Hispanic§
West South Central 4.0 ( 3.7- 4.3) 3.8 ( 3.5- 4.1) 4.4 ( 3.5- 5.4) 8.9 ( 7.7- 10.3)
Arkansas 2.3 ( 1.6- 3.1) 2.1 ( 1.4- 3.0) ∼ ∼Louisiana 3.1 ( 2.4- 3.9) 2.6 ( 1.9- 3.5) 4.3 ( 2.8- 6.2) ∼Oklahoma 3.6 ( 2.8- 4.5) 3.1 ( 2.4- 4.1) ∼ ∼Texas 4.6 ( 4.2- 5.1) 4.4 ( 4.0- 4.9) 4.6 ( 3.4- 6.1) 9.2 ( 7.9- 10.6)
West 3.5 ( 3.3- 3.8) 2.9 ( 2.7- 3.1) 4.9 ( 3.8- 6.3) 5.9 ( 5.1- 6.6)
Mountain 2.8 ( 2.5- 3.2) 2.5 ( 2.2- 2.9) ∼ 5.1 ( 3.8- 6.6)
Arizona 3.0 ( 2.4- 3.7) 2.7 ( 2.1- 3.4) ∼ 4.3 ( 2.4- 7.0)
Colorado 2.9 ( 2.2- 3.7) 2.5 ( 1.9- 3.3) ∼ ∼Idaho 2.2 ( 1.3- 3.6) 2.2 ( 1.2- 3.6) ∼ ∼Montana ∼ ∼ ∼ ∼Nevada 3.1 ( 2.2- 4.3) 2.8 ( 1.8- 4.1) ∼ ∼New Mexico 4.6 ( 3.4- 6.1) 4.2 ( 3.0- 5.7) ∼ 5.4 ( 3.2- 8.4)
Utah ∼ ∼ ∼ ∼Wyoming ∼ ∼ ∼ ∼
Pacific 3.8 ( 3.6- 4.1) 3.1 ( 2.8- 3.3) 5.5 ( 4.2- 7.1) 6.1 ( 5.3- 7.0)
Alaska 7.5 ( 4.1- 12.2) ∼ ∼ ∼California 3.9 ( 3.7- 4.3) 3.2 ( 2.9- 3.5) 5.6 ( 4.3- 7.3) 6.1 ( 5.2- 7.0)
San Francisco-Oakland 3.7 ( 3.0- 4.6) 2.5 ( 1.8- 3.4) ∼ ∼San Jose-Monterey 3.6 ( 2.6- 4.9) 2.5 ( 1.6- 3.8) ∼ ∼Los Angeles 4.9 ( 4.3- 5.6) 4.0 ( 3.4- 4.8) 4.7 ( 3.0- 7.1) 6.0 ( 4.7- 7.5)
Hawaii 5.0 ( 3.5- 6.9) ∼ ∼ ∼Oregon 2.6 ( 2.0- 3.5) 2.3 ( 1.6- 3.1) ∼ ∼Washington 3.6 ( 2.9- 4.3) 3.2 ( 2.5- 3.9) ∼ ∼
Seattle-Puget Sound 3.7 ( 2.9- 4.6) 3.2 ( 2.5- 4.2) ∼ ∼∗ Rates are per 100,000 persons and are age-adjusted to the 2000 U.S. standard population (19 age groups - Census P25-1130).† Data are from all state and metropolitan area cancer registries, except Maryland. Included data cover approximately 98% of the population and met data
quality criteria for all invasive cancer sites combined. See Appendix B for registry-specific data quality information.‡ Invasive cancers only.
§ Data for specified racial or ethnic populations other than white and black should be interpreted with caution. See Technical Notes.
Hispanic origin is not mutually exclusive from race categories (white, black).
∼ Rates are suppressed if fewer than 16 cases were reported in a specific category (area, race, ethnicity).
- Rates are suppressed at the state’s or metropolitan area’s request. See Technical Notes.
Notes: Cases from suppressed rates are included in the U.S. and region/division rates. U.S. rates are as presented in Table 1.1.1.1F. Michigan, Georgia,
California, and Washington state rates each include cases from the SEER metropolitan areas.

United
States Cancer Statistics: 2004 Incid
ence and M
ortality
���
continued
Table 2.14.1.2M: Liver and Intrahepatic Bile Duct. Age-Adjusted Cancer Death Rates∗ and 95% ConfidenceIntervals, by U.S. Census Region and Division, State, and Race and Ethnicity, United States†
Males, 2004
Area All Races White Black Hispanic‡§
United States 7.4 ( 7.3- 7.6) 6.7 ( 6.6- 6.9) 10.7 ( 10.1- 11.4) 11.1 ( 10.3- 11.8)
Northeast 7.3 ( 7.0- 7.7) 6.7 ( 6.3- 7.0) 11.3 ( 9.9- 12.8) 10.9 ( 9.2- 12.9)
New England 7.2 ( 6.6- 7.9) 6.8 ( 6.2- 7.5) 12.4 ( 8.4- 17.7) 13.2 ( 8.1- 19.9)
Connecticut 7.7 ( 6.4- 9.2) 7.5 ( 6.2- 9.1) ∼ ∼Maine 6.0 ( 4.3- 8.2) 5.9 ( 4.2- 8.1) ∼ ∼Massachusetts 7.2 ( 6.2- 8.2) 6.7 ( 5.8- 7.7) 13.1 ( 7.5- 21.1) ∼New Hampshire 6.0 ( 4.1- 8.4) 6.1 ( 4.2- 8.5) ∼ ∼Rhode Island 9.9 ( 7.3- 13.0) 8.8 ( 6.4- 11.9) ∼ ∼Vermont 6.0 ( 3.5- 9.4) 5.8 ( 3.4- 9.2) ∼ ∼
Middle Atlantic 7.4 ( 7.0- 7.8) 6.6 ( 6.2- 7.0) 11.2 ( 9.7- 12.8) 10.7 ( 8.9- 12.8)
New Jersey 7.2 ( 6.4- 8.1) 6.5 ( 5.7- 7.4) 11.6 ( 8.5- 15.6) 5.9 ( 3.2- 9.6)
New York 7.7 ( 7.1- 8.3) 6.8 ( 6.2- 7.4) 10.5 ( 8.6- 12.6) 13.2 ( 10.7- 16.0)
Pennsylvania 7.0 ( 6.4- 7.7) 6.4 ( 5.8- 7.1) 12.7 ( 9.7- 16.4) ∼Midwest 6.4 ( 6.1- 6.7) 5.8 ( 5.5- 6.1) 12.4 ( 10.9- 14.0) 7.0 ( 5.0- 9.4)
East North Central 6.7 ( 6.3- 7.0) 6.0 ( 5.7- 6.4) 12.0 ( 10.5- 13.8) 7.3 ( 5.0- 10.1)
Illinois 6.9 ( 6.2- 7.6) 6.2 ( 5.5- 6.9) 11.0 ( 8.5- 14.0) 6.1 ( 3.5- 9.6)
Indiana 6.6 ( 5.7- 7.7) 6.1 ( 5.2- 7.1) 14.6 ( 9.1- 21.9) ∼Michigan 6.7 ( 6.0- 7.5) 5.9 ( 5.2- 6.7) 11.9 ( 9.1- 15.3) ∼Ohio 6.0 ( 5.4- 6.7) 5.4 ( 4.8- 6.1) 11.5 ( 8.6- 15.0) ∼Wisconsin 7.4 ( 6.4- 8.5) 6.9 ( 5.9- 8.1) ∼ ∼
West North Central 5.9 ( 5.4- 6.4) 5.4 ( 4.9- 5.9) 14.1 ( 10.4- 18.8) ∼Iowa 5.7 ( 4.5- 7.0) 5.3 ( 4.2- 6.6) ∼ ∼Kansas 4.5 ( 3.4- 5.8) 4.3 ( 3.2- 5.6) ∼ ∼Minnesota 5.2 ( 4.3- 6.2) 4.7 ( 3.9- 5.8) ∼ ∼Missouri 7.6 ( 6.5- 8.7) 6.6 ( 5.6- 7.7) 16.5 ( 11.6- 22.8) ∼Nebraska 6.2 ( 4.6- 8.1) 5.9 ( 4.4- 7.9) ∼ ∼North Dakota ∼ ∼ ∼ ∼South Dakota 6.5 ( 4.2- 9.7) 6.8 ( 4.3- 10.1) ∼ ∼
South 7.7 ( 7.4- 8.0) 7.2 ( 6.9- 7.4) 10.1 ( 9.3- 10.9) 11.4 ( 10.2- 12.6)
South Atlantic 6.8 ( 6.5- 7.1) 6.4 ( 6.0- 6.7) 8.5 ( 7.6- 9.6) 7.0 ( 5.7- 8.5)
Delaware 7.4 ( 5.0- 10.7) 7.4 ( 4.8- 11.0) ∼ ∼District of Columbia 9.2 ( 5.6- 14.0) ∼ 13.3 ( 8.0- 20.8) ∼Florida 7.4 ( 6.9- 8.0) 7.2 ( 6.7- 7.8) 8.5 ( 6.5- 10.9) 7.4 ( 5.9- 9.2)
Georgia 6.0 ( 5.2- 7.0) 5.5 ( 4.6- 6.5) 7.3 ( 5.3- 9.7) ∼Maryland 6.3 ( 5.3- 7.4) 5.4 ( 4.4- 6.6) 8.4 ( 5.9- 11.5) ∼North Carolina 6.3 ( 5.5- 7.2) 6.3 ( 5.4- 7.2) 6.4 ( 4.6- 8.7) ∼South Carolina 6.9 ( 5.8- 8.3) 6.1 ( 4.8- 7.5) 10.0 ( 7.1- 13.6) ∼Virginia 6.7 ( 5.8- 7.6) 5.7 ( 4.8- 6.7) 10.5 ( 7.8- 13.8) ∼West Virginia 5.8 ( 4.4- 7.6) 5.7 ( 4.2- 7.5) ∼ ∼
East South Central 7.2 ( 6.6- 7.8) 6.7 ( 6.1- 7.4) 9.1 ( 7.4- 11.1) ∼Alabama 7.5 ( 6.4- 8.8) 7.0 ( 5.8- 8.4) 8.5 ( 5.8- 11.8) ∼Kentucky 6.1 ( 5.0- 7.4) 5.8 ( 4.7- 7.1) ∼ ∼Mississippi 8.3 ( 6.7- 10.1) 7.5 ( 5.8- 9.6) 9.1 ( 6.0- 13.1) ∼Tennessee 7.2 ( 6.2- 8.3) 6.8 ( 5.8- 8.0) 9.1 ( 6.1- 13.1) ∼
West South Central 9.8 ( 9.3- 10.4) 9.0 ( 8.5- 9.6) 14.7 ( 12.8- 16.8) 15.4 ( 13.6- 17.4)
Arkansas 9.0 ( 7.4- 10.7) 8.9 ( 7.3- 10.8) ∼ ∼

Cancer Incidence and M
ortality, by U.S. C
ensus Region and D
i�ision, State, and Metropolitan A
rea
��3
Table 2.14.1.2M: Liver and Intrahepatic Bile Duct. Age-Adjusted Cancer Death Rates∗ and 95% ConfidenceIntervals, by U.S. Census Region and Division, State, and Race and Ethnicity, United States† (continued)
Males, 2004
Area All Races White Black Hispanic‡§
Louisiana 10.6 ( 9.2- 12.2) 8.1 ( 6.6- 9.8) 17.3 ( 13.6- 21.5) ∼Oklahoma 6.1 ( 5.0- 7.5) 5.6 ( 4.4- 6.9) ∼ ∼Texas 10.5 ( 9.8- 11.2) 9.9 ( 9.2- 10.7) 14.9 ( 12.2- 17.9) 15.9 ( 13.9- 18.0)
West 8.1 ( 7.8- 8.4) 7.0 ( 6.7- 7.4) 10.4 ( 8.5- 12.6) 11.5 ( 10.4- 12.8)
Mountain 6.7 ( 6.2- 7.3) 6.5 ( 5.9- 7.1) ∼ 14.0 ( 11.6- 16.7)
Arizona 7.8 ( 6.8- 9.0) 7.7 ( 6.6- 8.9) ∼ 14.3 ( 9.9- 19.8)
Colorado 5.5 ( 4.5- 6.8) 5.2 ( 4.1- 6.4) ∼ 10.1 ( 6.2- 15.5)
Idaho 5.4 ( 3.7- 7.6) 5.5 ( 3.8- 7.7) ∼ ∼Montana ∼ ∼ ∼ ∼Nevada 9.1 ( 7.3- 11.2) 8.6 ( 6.7- 10.8) ∼ ∼New Mexico 9.2 ( 7.3- 11.5) 9.5 ( 7.5- 11.9) ∼ 18.9 ( 14.2- 24.7)
Utah 4.2 ( 2.9- 5.8) 4.1 ( 2.8- 5.7) ∼ ∼Wyoming ∼ ∼ ∼ ∼
Pacific 8.7 ( 8.3- 9.1) 7.3 ( 6.9- 7.7) 11.2 ( 9.0- 13.6) 10.7 ( 9.4- 12.1)
Alaska 9.7 ( 5.5- 15.4) ∼ ∼ ∼California 8.9 ( 8.5- 9.4) 7.5 ( 7.0- 8.0) 11.2 ( 8.9- 13.8) 10.7 ( 9.4- 12.2)
Hawaii 11.4 ( 8.9- 14.4) 9.2 ( 5.1- 15.4) ∼ ∼Oregon 6.6 ( 5.5- 8.0) 6.0 ( 4.9- 7.3) ∼ ∼Washington 8.2 ( 7.2- 9.4) 7.3 ( 6.3- 8.4) ∼ ∼
∗ Rates are per 100,000 persons and are age-adjusted to the 2000 U.S. standard population (19 age groups - Census P25-1130).† Data are from the National Vital Statistics System (NVSS).‡ Data for specified racial or ethnic populations other than white and black should be interpreted with caution. See Technical Notes.
§ Hispanic origin is not mutually exclusive from race categories (white, black).
∼ Rates are suppressed if fewer than 16 cases were reported in a specific category (area, race, ethnicity).
Note: U.S. rates are as presented in Table 1.1.1.2M.

United
States Cancer Statistics: 2004 Incid
ence and M
ortality
���
continued
Table 2.14.1.2F: Liver and Intrahepatic Bile Duct. Age-Adjusted Cancer Death Rates∗ and 95% ConfidenceIntervals, by U.S. Census Region and Division, State, and Race and Ethnicity, United States†
Females, 2004
Area All Races White Black Hispanic‡§
United States 3.2 ( 3.1- 3.3) 3.0 ( 2.9- 3.0) 4.1 ( 3.8- 4.4) 4.9 ( 4.5- 5.3)
Northeast 3.1 ( 2.9- 3.3) 3.0 ( 2.8- 3.2) 4.2 ( 3.5- 5.0) 4.1 ( 3.2- 5.2)
New England 2.7 ( 2.4- 3.1) 2.7 ( 2.4- 3.1) ∼ ∼Connecticut 2.5 ( 1.9- 3.2) 2.6 ( 1.9- 3.4) ∼ ∼Maine 2.4 ( 1.5- 3.7) 2.4 ( 1.5- 3.8) ∼ ∼Massachusetts 3.0 ( 2.5- 3.6) 2.9 ( 2.4- 3.5) ∼ ∼New Hampshire 2.5 ( 1.5- 4.0) 2.6 ( 1.5- 4.1) ∼ ∼Rhode Island 2.6 ( 1.6- 4.1) 2.4 ( 1.4- 3.9) ∼ ∼Vermont ∼ ∼ ∼ ∼
Middle Atlantic 3.3 ( 3.1- 3.5) 3.1 ( 2.8- 3.3) 4.4 ( 3.7- 5.3) 4.3 ( 3.3- 5.5)
New Jersey 3.4 ( 2.9- 4.0) 3.3 ( 2.8- 3.9) 3.1 ( 1.8- 4.9) 4.9 ( 2.8- 7.7)
New York 3.4 ( 3.1- 3.7) 3.0 ( 2.7- 3.4) 4.9 ( 3.9- 6.1) 4.0 ( 2.9- 5.4)
Pennsylvania 3.1 ( 2.7- 3.5) 2.9 ( 2.6- 3.3) 4.6 ( 3.1- 6.5) ∼Midwest 3.0 ( 2.9- 3.2) 2.9 ( 2.7- 3.0) 4.3 ( 3.6- 5.1) 4.9 ( 3.4- 6.9)
East North Central 3.2 ( 3.0- 3.4) 3.0 ( 2.8- 3.2) 4.3 ( 3.5- 5.2) 5.3 ( 3.5- 7.5)
Illinois 3.6 ( 3.1- 4.0) 3.2 ( 2.7- 3.6) 5.7 ( 4.2- 7.5) 5.3 ( 3.0- 8.4)
Indiana 2.8 ( 2.2- 3.4) 2.8 ( 2.3- 3.4) ∼ ∼Michigan 3.5 ( 3.0- 4.0) 3.3 ( 2.9- 3.9) 3.9 ( 2.5- 5.7) ∼Ohio 3.0 ( 2.6- 3.4) 3.0 ( 2.6- 3.4) 3.4 ( 2.1- 5.1) ∼Wisconsin 2.7 ( 2.2- 3.3) 2.5 ( 2.0- 3.1) ∼ ∼
West North Central 2.7 ( 2.4- 3.0) 2.5 ( 2.2- 2.8) 4.6 ( 2.8- 7.0) ∼Iowa 2.5 ( 1.8- 3.3) 2.5 ( 1.8- 3.3) ∼ ∼Kansas 2.0 ( 1.4- 2.8) 2.0 ( 1.4- 2.9) ∼ ∼Minnesota 3.2 ( 2.5- 3.9) 2.8 ( 2.2- 3.6) ∼ ∼Missouri 2.8 ( 2.3- 3.4) 2.6 ( 2.1- 3.3) ∼ ∼Nebraska 2.3 ( 1.4- 3.5) 2.1 ( 1.3- 3.3) ∼ ∼North Dakota 4.0 ( 2.2- 6.6) ∼ ∼ ∼South Dakota ∼ ∼ ∼ ∼
South 3.2 ( 3.0- 3.3) 3.0 ( 2.8- 3.1) 4.0 ( 3.6- 4.5) 5.0 ( 4.3- 5.8)
South Atlantic 2.7 ( 2.5- 2.9) 2.5 ( 2.3- 2.7) 3.3 ( 2.8- 3.8) 3.4 ( 2.6- 4.3)
Delaware ∼ ∼ ∼ ∼District of Columbia ∼ ∼ ∼ ∼Florida 2.5 ( 2.3- 2.8) 2.4 ( 2.1- 2.7) 3.6 ( 2.5- 4.9) 3.3 ( 2.5- 4.4)
Georgia 2.7 ( 2.2- 3.3) 2.6 ( 2.1- 3.2) 2.9 ( 1.9- 4.2) ∼Maryland 2.9 ( 2.3- 3.6) 2.9 ( 2.3- 3.7) 2.6 ( 1.6- 4.1) ∼North Carolina 2.7 ( 2.3- 3.2) 2.5 ( 2.1- 3.1) 3.1 ( 2.0- 4.4) ∼South Carolina 2.6 ( 2.0- 3.4) 2.3 ( 1.6- 3.1) 3.3 ( 2.0- 5.1) ∼Virginia 2.7 ( 2.2- 3.3) 2.4 ( 1.9- 3.0) 3.5 ( 2.2- 5.2) ∼West Virginia 3.4 ( 2.5- 4.6) 3.4 ( 2.4- 4.6) ∼ ∼
East South Central 3.6 ( 3.3- 4.0) 3.5 ( 3.1- 3.9) 4.4 ( 3.4- 5.6) ∼Alabama 3.8 ( 3.1- 4.6) 3.8 ( 3.1- 4.8) 3.5 ( 2.1- 5.4) ∼Kentucky 3.9 ( 3.1- 4.7) 3.7 ( 3.0- 4.6) ∼ ∼Mississippi 3.9 ( 3.0- 5.0) 3.7 ( 2.7- 5.0) 4.6 ( 2.8- 7.0) ∼Tennessee 3.2 ( 2.6- 3.8) 2.9 ( 2.3- 3.6) 5.0 ( 3.0- 7.7) ∼
West South Central 3.9 ( 3.6- 4.3) 3.6 ( 3.3- 4.0) 5.7 ( 4.7- 6.9) 6.6 ( 5.5- 7.8)
Arkansas 4.0 ( 3.1- 5.0) 3.6 ( 2.7- 4.7) ∼ ∼

Cancer Incidence and M
ortality, by U.S. C
ensus Region and D
i�ision, State, and Metropolitan A
rea
���
Table 2.14.1.2F: Liver and Intrahepatic Bile Duct. Age-Adjusted Cancer Death Rates∗ and 95% ConfidenceIntervals, by U.S. Census Region and Division, State, and Race and Ethnicity, United States† (continued)
Females, 2004
Area All Races White Black Hispanic‡§
Louisiana 4.3 ( 3.6- 5.2) 3.7 ( 2.9- 4.8) 6.0 ( 4.3- 8.3) ∼Oklahoma 2.8 ( 2.2- 3.7) 2.4 ( 1.7- 3.2) ∼ ∼Texas 4.1 ( 3.7- 4.5) 3.9 ( 3.5- 4.3) 5.3 ( 4.0- 7.0) 6.6 ( 5.5- 7.8)
West 3.5 ( 3.3- 3.7) 3.1 ( 2.9- 3.3) 3.7 ( 2.8- 4.9) 5.1 ( 4.4- 5.8)
Mountain 3.2 ( 2.9- 3.6) 2.9 ( 2.6- 3.3) ∼ 5.1 ( 3.8- 6.7)
Arizona 3.2 ( 2.6- 3.9) 2.9 ( 2.3- 3.6) ∼ ∼Colorado 3.6 ( 2.9- 4.5) 3.3 ( 2.6- 4.2) ∼ 9.2 ( 5.4- 14.4)
Idaho ∼ ∼ ∼ ∼Montana 3.4 ( 2.0- 5.4) 3.2 ( 1.8- 5.2) ∼ ∼Nevada 3.0 ( 2.1- 4.3) 2.4 ( 1.5- 3.6) ∼ ∼New Mexico 4.3 ( 3.2- 5.8) 3.9 ( 2.7- 5.4) ∼ 4.9 ( 2.8- 7.8)
Utah 2.3 ( 1.4- 3.5) 2.3 ( 1.4- 3.4) ∼ ∼Wyoming ∼ ∼ ∼ ∼
Pacific 3.7 ( 3.4- 3.9) 3.2 ( 2.9- 3.4) 4.0 ( 2.9- 5.3) 5.1 ( 4.3- 5.9)
Alaska ∼ ∼ ∼ ∼California 3.7 ( 3.5- 4.0) 3.3 ( 3.0- 3.6) 4.1 ( 3.0- 5.6) 5.1 ( 4.3- 5.9)
Hawaii 5.1 ( 3.6- 7.0) ∼ ∼ ∼Oregon 2.8 ( 2.1- 3.7) 2.7 ( 2.0- 3.5) ∼ ∼Washington 3.4 ( 2.8- 4.1) 2.9 ( 2.4- 3.6) ∼ ∼
∗ Rates are per 100,000 persons and are age-adjusted to the 2000 U.S. standard population (19 age groups - Census P25-1130).† Data are from the National Vital Statistics System (NVSS).‡ Data for specified racial or ethnic populations other than white and black should be interpreted with caution. See Technical Notes.
§ Hispanic origin is not mutually exclusive from race categories (white, black).
∼ Rates are suppressed if fewer than 16 cases were reported in a specific category (area, race, ethnicity).
Note: U.S. rates are as presented in Table 1.1.1.2F.

United
States Cancer Statistics: 2004 Incid
ence and M
ortality
���
continued
Table 2.15.1.1M: Lung and Bronchus. Age-Adjusted Invasive Cancer Incidence Rates∗ and 95% ConfidenceIntervals, by U.S. Census Region and Division, State and Metropolitan Area, and Race and Ethnicity, UnitedStates†‡
Males, 2004
Area All Races White Black Hispanic§
United States 85.3 ( 84.8- 85.8) 84.4 ( 83.9- 85.0) 104.5 (102.5- 106.5) 48.5 ( 46.9- 50.1)
Northeast 81.0 ( 79.9- 82.1) 81.1 ( 79.9- 82.2) 86.9 ( 82.9- 91.1) 56.3 ( 51.9- 60.8)
New England 82.8 ( 80.7- 85.1) 82.9 ( 80.6- 85.2) 85.4 ( 73.2- 98.9) 70.4 ( 57.3- 85.3)
Connecticut 78.8 ( 74.5- 83.3) 79.0 ( 74.5- 83.7) 91.1 ( 71.8- 113.5) 84.4 ( 61.3- 112.2)
Maine 99.0 ( 91.6- 106.8) 98.4 ( 91.0- 106.3) ∼ ∼Massachusetts 79.6 ( 76.4- 82.9) 80.0 ( 76.6- 83.4) 84.3 ( 67.5- 103.6) 52.6 ( 37.2- 71.7)
New Hampshire 83.9 ( 76.6- 91.7) 80.9 ( 73.7- 88.6) ∼ ∼Rhode Island 95.7 ( 87.3- 104.7) 96.5 ( 87.9- 105.8) ∼ 110.2 ( 60.4- 179.3)
Vermont 77.1 ( 67.4- 87.7) 76.8 ( 67.1- 87.5) ∼ ∼Middle Atlantic 80.4 ( 79.1- 81.7) 80.4 ( 79.0- 81.8) 87.2 ( 82.9- 91.7) 54.3 ( 49.8- 59.1)
New Jersey 74.1 ( 71.4- 76.9) 74.5 ( 71.6- 77.5) 85.5 ( 76.1- 95.6) 62.2 ( 52.6- 72.9)
New York 78.2 ( 76.3- 80.1) 79.0 ( 77.0- 81.1) 77.0 ( 71.7- 82.6) 49.4 ( 44.1- 55.1)
Pennsylvania 87.4 ( 85.1- 89.8) 85.5 ( 83.1- 87.9) 114.4 (104.4- 125.1) -
Midwest 88.6 ( 87.5- 89.7) 86.3 ( 85.2- 87.5) 116.9 (112.1- 121.8) 42.2 ( 36.8- 48.0)
East North Central 89.6 ( 88.3- 91.0) 87.0 ( 85.7- 88.4) 116.3 (111.2- 121.7) 44.9 ( 38.7- 51.7)
Illinois 87.5 ( 84.9- 90.1) 84.6 ( 82.0- 87.4) 116.8 (107.9- 126.1) 40.2 ( 32.6- 48.8)
Indiana 98.0 ( 94.2- 101.8) 97.2 ( 93.4- 101.2) 114.0 ( 97.9- 131.8) 38.0 ( 21.1- 61.5)
Michigan 88.2 ( 85.4- 91.1) 85.9 ( 83.0- 88.9) 111.5 (101.8- 121.8) 44.1 ( 28.8- 63.7)
Detroit 95.0 ( 90.4- 99.8) 91.8 ( 86.6- 97.1) 116.2 (104.7- 128.5) ∼Ohio 93.7 ( 91.1- 96.4) 90.1 ( 87.4- 92.9) 115.9 (106.0- 126.4) 66.6 ( 45.1- 93.8)
Wisconsin 79.5 ( 76.0- 83.1) 76.7 ( 73.3- 80.3) 155.0 (125.8- 188.4) 59.0 ( 35.5- 90.5)
West North Central 86.2 ( 84.3- 88.1) 84.9 ( 82.9- 86.8) 120.1 (107.7- 133.3) 31.3 ( 21.4- 43.7)
Iowa 86.1 ( 81.4- 91.0) 85.6 ( 80.8- 90.5) 125.8 ( 75.7- 193.4) ∼Kansas 85.3 ( 80.2- 90.6) 85.1 ( 79.8- 90.5) 109.7 ( 80.3- 145.4) ∼Minnesota 70.4 ( 66.9- 74.0) 69.2 ( 65.7- 72.9) 74.8 ( 47.1- 111.3) ∼Missouri 101.6 ( 97.8- 105.5) 99.8 ( 95.8- 103.8) 128.1 (112.3- 145.4) 59.3 ( 33.3- 95.5)
Nebraska 89.0 ( 82.6- 95.8) 88.9 ( 82.4- 95.8) 116.6 ( 68.7- 181.5) ∼North Dakota 69.2 ( 60.3- 79.0) 67.1 ( 58.3- 77.0) ∼ ∼South Dakota 81.1 ( 72.3- 90.7) 79.9 ( 71.0- 89.7) ∼ ∼
South 97.9 ( 97.0- 98.9) 96.6 ( 95.6- 97.6) 110.6 (107.7- 113.5) 54.9 ( 52.2- 57.6)
South Atlantic 94.2 ( 92.9- 95.4) 93.5 ( 92.1- 94.8) 101.4 ( 97.8- 105.2) 62.7 ( 58.5- 67.1)
Delaware 102.4 ( 92.5- 113.0) 102.5 ( 91.9- 114.0) 108.5 ( 80.6- 142.3) ∼District of Columbia 77.7 ( 66.6- 90.0) 33.4 ( 21.7- 49.0) 104.1 ( 87.9- 122.4) ∼Florida 89.7 ( 87.9- 91.6) 90.0 ( 88.0- 92.0) 92.0 ( 84.9- 99.4) -
Georgia 101.4 ( 97.7- 105.1) 100.7 ( 96.6- 104.9) 108.8 (100.2- 117.8) 37.1 ( 23.0- 55.6)
Atlanta 76.9 ( 70.9- 83.2) 71.2 ( 64.5- 78.4) 100.0 ( 85.6- 115.9) ∼Maryland
North Carolina 99.7 ( 96.4- 103.0) 98.3 ( 94.7- 101.9) 107.0 ( 98.4- 116.0) 36.5 ( 20.8- 58.0)
South Carolina 96.8 ( 92.3- 101.4) 96.1 ( 91.1- 101.4) 98.2 ( 88.4- 108.7) -
Virginia 88.6 ( 85.3- 92.1) 87.0 ( 83.3- 90.8) 105.3 ( 95.9- 115.3) 34.0 ( 18.9- 54.9)
West Virginia 116.1 (109.2- 123.2) 117.0 (110.0- 124.3) 89.5 ( 52.8- 139.9) ∼East South Central 117.4 (114.9- 119.8) 116.8 (114.1- 119.4) 122.5 (115.7- 129.5) 59.4 ( 40.3- 83.3)
Alabama 110.4 (105.9- 115.1) 109.3 (104.3- 114.5) 117.7 (106.8- 129.3) ∼Kentucky 133.2 (127.9- 138.7) 132.9 (127.5- 138.6) 144.0 (119.7- 171.5) -
Mississippi 110.2 (104.3- 116.3) 104.7 ( 98.1- 111.7) 124.4 (111.8- 137.9) ∼Tennessee 115.2 (111.1- 119.5) 114.8 (110.4- 119.3) 119.5 (106.5- 133.5) 80.8 ( 43.3- 132.8)

Cancer Incidence and M
ortality, by U.S. C
ensus Region and D
i�ision, State, and Metropolitan A
rea
���
Table 2.15.1.1M: Lung and Bronchus. Age-Adjusted Invasive Cancer Incidence Rates∗ and 95% ConfidenceIntervals, by U.S. Census Region and Division, State and Metropolitan Area, and Race and Ethnicity, UnitedStates†‡ (continued)
Males, 2004
Area All Races White Black Hispanic§
West South Central 93.4 ( 91.7- 95.1) 90.4 ( 88.6- 92.2) 122.1 (116.0- 128.3) 48.8 ( 45.3- 52.4)
Arkansas 105.3 ( 99.8- 111.0) 104.5 ( 98.7- 110.5) 115.4 ( 97.2- 135.8) ∼Louisiana 110.8 (106.0- 115.8) 105.6 (100.2- 111.2) 128.4 (117.7- 139.7) ∼Oklahoma 99.6 ( 94.8- 104.5) 97.1 ( 92.1- 102.3) 121.3 ( 97.3- 149.0) 55.0 ( 31.5- 87.3)
Texas 86.6 ( 84.6- 88.7) 84.1 ( 82.0- 86.3) 120.0 (111.7- 128.8) 49.0 ( 45.4- 52.7)
West 66.0 ( 65.0- 67.0) 66.3 ( 65.3- 67.4) 83.3 ( 77.6- 89.3) 40.5 ( 38.2- 42.9)
Mountain 62.6 ( 60.9- 64.3) 63.1 ( 61.3- 64.9) 71.2 ( 58.7- 85.4) 42.6 ( 38.1- 47.4)
Arizona 66.9 ( 63.8- 70.1) 67.8 ( 64.6- 71.2) 79.4 ( 54.8- 110.1) 49.5 ( 40.8- 59.2)
Colorado 57.3 ( 53.6- 61.1) 57.6 ( 53.9- 61.5) 60.3 ( 40.1- 86.3) 38.8 ( 29.7- 49.5)
Idaho 70.3 ( 63.7- 77.4) 69.2 ( 62.6- 76.4) ∼ ∼Montana 71.4 ( 63.9- 79.6) 69.5 ( 61.9- 77.7) ∼ ∼Nevada 78.7 ( 73.2- 84.6) 80.8 ( 74.9- 87.1) 72.5 ( 51.1- 99.3) 50.4 ( 34.7- 70.0)
New Mexico 54.3 ( 49.3- 59.5) 56.8 ( 51.5- 62.4) ∼ 39.5 ( 32.0- 48.0)
Utah 37.5 ( 33.4- 42.0) 37.1 ( 32.9- 41.6) ∼ ∼Wyoming 64.4 ( 54.5- 75.6) 65.3 ( 55.3- 76.7) ∼ ∼
Pacific 67.5 ( 66.3- 68.7) 68.0 ( 66.7- 69.3) 86.1 ( 79.8- 92.8) 39.8 ( 37.1- 42.6)
Alaska 84.1 ( 70.4- 99.5) 77.2 ( 62.6- 94.1) ∼ ∼California 63.8 ( 62.4- 65.1) 63.9 ( 62.4- 65.4) 85.9 ( 79.3- 93.0) 39.2 ( 36.4- 42.0)
San Francisco-Oakland 60.6 ( 57.0- 64.3) 57.3 ( 53.1- 61.7) 83.3 ( 69.3- 99.3) 35.0 ( 26.3- 45.5)
San Jose-Monterey 55.1 ( 50.2- 60.3) 56.7 ( 51.1- 62.7) ∼ 30.0 ( 20.7- 41.4)
Los Angeles 58.3 ( 55.8- 60.9) 54.4 ( 51.5- 57.3) 95.3 ( 85.0- 106.5) 33.1 ( 29.1- 37.5)
Hawaii 71.6 ( 65.0- 78.7) 81.5 ( 67.7- 97.4) ∼ ∼Oregon 79.7 ( 75.4- 84.1) 80.0 ( 75.6- 84.5) ∼ 46.6 ( 25.9- 75.0)
Washington 77.4 ( 74.0- 80.9) 77.6 ( 74.1- 81.2) 100.4 ( 73.8- 132.5) 47.8 ( 31.5- 68.4)
Seattle-Puget Sound 76.8 ( 72.6- 81.0) 77.0 ( 72.7- 81.6) 102.7 ( 74.1- 137.4) 49.3 ( 27.2- 80.2)
∗ Rates are per 100,000 persons and are age-adjusted to the 2000 U.S. standard population (19 age groups - Census P25-1130).† Data are from all state and metropolitan area cancer registries, except Maryland. Included data cover approximately 98% of the population and met data
quality criteria for all invasive cancer sites combined. See Appendix B for registry-specific data quality information.‡ Invasive cancers only.
§ Data for specified racial or ethnic populations other than white and black should be interpreted with caution. See Technical Notes.
Hispanic origin is not mutually exclusive from race categories (white, black).
∼ Rates are suppressed if fewer than 16 cases were reported in a specific category (area, race, ethnicity).
- Rates are suppressed at the state’s or metropolitan area’s request. See Technical Notes.
Notes: Cases from suppressed rates are included in the U.S. and region/division rates. U.S. rates are as presented in Table 1.1.1.1M. Michigan, Georgia,
California, and Washington state rates each include cases from the SEER metropolitan areas.

United
States Cancer Statistics: 2004 Incid
ence and M
ortality
���
continued
Table 2.15.1.1F: Lung and Bronchus. Age-Adjusted Invasive Cancer Incidence Rates∗ and 95% ConfidenceIntervals, by U.S. Census Region and Division, State and Metropolitan Area, and Race and Ethnicity, UnitedStates†‡
Females, 2004
Area All Races White Black Hispanic§
United States 54.2 ( 53.8- 54.6) 55.5 ( 55.1- 55.8) 50.4 ( 49.3- 51.6) 26.7 ( 25.7- 27.7)
Northeast 55.3 ( 54.5- 56.1) 56.8 ( 55.9- 57.7) 48.6 ( 46.2- 51.0) 29.4 ( 26.9- 32.1)
New England 60.0 ( 58.4- 61.7) 61.1 ( 59.4- 62.8) 41.7 ( 35.0- 49.2) 26.6 ( 19.9- 34.6)
Connecticut 54.1 ( 51.0- 57.3) 55.9 ( 52.6- 59.4) 35.7 ( 26.5- 46.9) 28.4 ( 17.9- 42.1)
Maine 64.7 ( 59.4- 70.4) 64.7 ( 59.4- 70.5) ∼ ∼Massachusetts 63.1 ( 60.6- 65.7) 64.7 ( 62.0- 67.4) 46.5 ( 36.5- 58.2) 25.4 ( 16.0- 37.8)
New Hampshire 61.5 ( 55.9- 67.6) 59.3 ( 53.7- 65.3) ∼ ∼Rhode Island 57.7 ( 52.0- 63.9) 58.3 ( 52.4- 64.7) ∼ ∼Vermont 52.3 ( 45.1- 60.3) 52.8 ( 45.5- 60.9) ∼ ∼
Middle Atlantic 53.7 ( 52.8- 54.6) 55.2 ( 54.2- 56.2) 49.4 ( 46.8- 52.0) 29.9 ( 27.2- 32.8)
New Jersey 53.8 ( 51.8- 55.8) 54.8 ( 52.6- 57.0) 56.2 ( 50.1- 62.7) 37.5 ( 31.4- 44.3)
New York 53.2 ( 51.9- 54.6) 57.0 ( 55.5- 58.6) 40.1 ( 37.1- 43.3) 27.3 ( 24.2- 30.6)
Pennsylvania 54.5 ( 52.9- 56.1) 53.3 ( 51.6- 55.0) 67.9 ( 61.6- 74.6) -
Midwest 55.7 ( 54.9- 56.5) 54.9 ( 54.2- 55.7) 63.8 ( 60.9- 66.7) 29.8 ( 25.8- 34.2)
East North Central 57.2 ( 56.3- 58.1) 56.6 ( 55.6- 57.6) 62.9 ( 59.8- 66.1) 31.5 ( 26.9- 36.6)
Illinois 56.4 ( 54.6- 58.2) 56.7 ( 54.8- 58.7) 60.3 ( 55.3- 65.7) 31.5 ( 25.5- 38.4)
Indiana 60.4 ( 57.8- 63.0) 60.6 ( 57.9- 63.4) 57.0 ( 47.6- 67.6) ∼Michigan 59.2 ( 57.2- 61.3) 58.1 ( 56.0- 60.3) 66.7 ( 60.6- 73.3) 29.0 ( 18.3- 43.1)
Detroit 66.6 ( 63.3- 70.1) 68.0 ( 64.1- 72.1) 65.0 ( 58.1- 72.5) ∼Ohio 58.0 ( 56.2- 59.8) 56.5 ( 54.6- 58.4) 63.4 ( 57.4- 69.8) 45.3 ( 30.0- 65.0)
Wisconsin 50.3 ( 47.8- 52.8) 49.6 ( 47.1- 52.2) 67.8 ( 52.6- 85.8) ∼West North Central 52.3 ( 51.0- 53.7) 51.6 ( 50.2- 52.9) 69.0 ( 61.4- 77.1) 22.7 ( 15.1- 32.3)
Iowa 50.2 ( 47.0- 53.6) 49.9 ( 46.7- 53.3) ∼ ∼Kansas 50.5 ( 46.9- 54.2) 50.9 ( 47.2- 54.7) 52.9 ( 36.6- 73.8) ∼Minnesota 50.2 ( 47.5- 52.9) 49.3 ( 46.6- 52.1) 60.8 ( 39.2- 88.9) ∼Missouri 59.7 ( 57.1- 62.3) 58.9 ( 56.2- 61.6) 72.3 ( 62.9- 82.7) ∼Nebraska 47.3 ( 43.1- 51.8) 46.5 ( 42.3- 51.1) 80.7 ( 48.5- 124.5) ∼North Dakota 47.4 ( 40.7- 54.9) 45.2 ( 38.5- 52.7) ∼ ∼South Dakota 41.5 ( 35.7- 47.9) 39.6 ( 33.9- 46.1) ∼ ∼
South 56.4 ( 55.8- 57.0) 58.5 ( 57.8- 59.2) 45.5 ( 44.1- 47.0) 25.8 ( 24.2- 27.4)
South Atlantic 56.4 ( 55.6- 57.3) 59.4 ( 58.5- 60.4) 42.0 ( 40.1- 44.0) 29.3 ( 26.8- 31.9)
Delaware 62.8 ( 55.9- 70.3) 62.7 ( 55.2- 70.9) 70.3 ( 51.6- 93.3) ∼District of Columbia 42.0 ( 35.0- 49.9) 27.4 ( 17.8- 40.6) 49.1 ( 40.0- 59.7) ∼Florida 61.4 ( 60.0- 62.9) 63.8 ( 62.2- 65.3) 40.6 ( 36.9- 44.7) -
Georgia 52.8 ( 50.6- 55.1) 57.1 ( 54.5- 59.8) 40.8 ( 36.8- 45.0) 26.1 ( 15.8- 40.1)
Atlanta 47.7 ( 43.9- 51.8) 50.4 ( 45.7- 55.6) 43.0 ( 36.3- 50.4) ∼Maryland
North Carolina 53.6 ( 51.6- 55.7) 57.1 ( 54.7- 59.5) 39.0 ( 34.9- 43.4) ∼South Carolina 49.5 ( 46.7- 52.4) 53.3 ( 49.9- 56.7) 37.0 ( 32.2- 42.3) -
Virginia 51.9 ( 49.7- 54.2) 53.3 ( 50.8- 55.9) 49.5 ( 44.3- 55.2) 20.4 ( 11.2- 33.2)
West Virginia 63.8 ( 59.3- 68.5) 64.7 ( 60.2- 69.6) ∼ ∼East South Central 60.1 ( 58.6- 61.7) 62.2 ( 60.5- 63.9) 50.0 ( 46.6- 53.6) 26.9 ( 16.1- 41.6)
Alabama 52.8 ( 50.1- 55.6) 56.3 ( 53.1- 59.6) 41.1 ( 36.0- 46.7) ∼Kentucky 75.5 ( 72.0- 79.0) 74.7 ( 71.1- 78.3) 90.6 ( 75.2- 108.0) -
Mississippi 54.2 ( 50.7- 57.9) 58.2 ( 53.9- 62.8) 44.2 ( 38.3- 50.7) ∼Tennessee 58.1 ( 55.6- 60.7) 58.7 ( 56.0- 61.5) 55.0 ( 48.1- 62.6) ∼

Cancer Incidence and M
ortality, by U.S. C
ensus Region and D
i�ision, State, and Metropolitan A
rea
���
Table 2.15.1.1F: Lung and Bronchus. Age-Adjusted Invasive Cancer Incidence Rates∗ and 95% ConfidenceIntervals, by U.S. Census Region and Division, State and Metropolitan Area, and Race and Ethnicity, UnitedStates†‡ (continued)
Females, 2004
Area All Races White Black Hispanic§
West South Central 54.1 ( 52.9- 55.2) 54.8 ( 53.6- 56.1) 50.1 ( 47.0- 53.4) 23.2 ( 21.2- 25.3)
Arkansas 60.5 ( 56.8- 64.3) 61.6 ( 57.6- 65.8) 49.9 ( 40.3- 61.1) ∼Louisiana 57.5 ( 54.6- 60.6) 60.7 ( 57.1- 64.4) 49.3 ( 44.0- 55.1) ∼Oklahoma 62.8 ( 59.4- 66.3) 62.8 ( 59.2- 66.6) 51.4 ( 38.9- 66.4) ∼Texas 50.7 ( 49.3- 52.1) 51.2 ( 49.7- 52.7) 50.7 ( 46.4- 55.3) 23.0 ( 20.9- 25.2)
West 48.1 ( 47.4- 48.9) 50.1 ( 49.3- 50.9) 55.0 ( 51.1- 59.1) 26.0 ( 24.4- 27.6)
Mountain 46.0 ( 44.7- 47.4) 46.8 ( 45.4- 48.2) 47.3 ( 38.5- 57.4) 26.0 ( 22.9- 29.3)
Arizona 46.5 ( 44.2- 49.0) 47.3 ( 44.9- 49.9) 66.0 ( 47.1- 89.3) 20.0 ( 15.4- 25.4)
Colorado 46.5 ( 43.6- 49.5) 47.2 ( 44.3- 50.4) 38.4 ( 24.8- 56.5) 39.8 ( 31.6- 49.3)
Idaho 47.8 ( 42.8- 53.2) 47.9 ( 42.8- 53.4) ∼ ∼Montana 54.3 ( 48.3- 60.9) 53.4 ( 47.3- 60.1) ∼ ∼Nevada 67.9 ( 63.2- 72.8) 72.1 ( 66.9- 77.5) 44.2 ( 29.6- 63.2) 28.4 ( 18.2- 41.6)
New Mexico 38.4 ( 34.7- 42.3) 40.1 ( 36.1- 44.3) ∼ 24.5 ( 19.4- 30.5)
Utah 20.6 ( 17.8- 23.7) 20.5 ( 17.7- 23.7) ∼ ∼Wyoming 44.4 ( 36.8- 53.2) 43.5 ( 35.9- 52.2) ∼ ∼
Pacific 49.0 ( 48.1- 49.9) 51.7 ( 50.7- 52.7) 56.4 ( 52.1- 61.0) 26.0 ( 24.2- 27.8)
Alaska 59.5 ( 49.2- 71.1) 52.6 ( 41.6- 65.3) ∼ ∼California 46.0 ( 45.0- 47.1) 48.6 ( 47.4- 49.7) 56.8 ( 52.3- 61.5) 25.7 ( 23.9- 27.6)
San Francisco-Oakland 43.5 ( 40.8- 46.3) 47.1 ( 43.7- 50.7) 66.9 ( 56.1- 79.1) 21.8 ( 16.2- 28.5)
San Jose-Monterey 39.8 ( 36.3- 43.7) 43.7 ( 39.4- 48.3) ∼ 26.5 ( 19.2- 35.4)
Los Angeles 39.7 ( 37.9- 41.6) 39.6 ( 37.5- 41.8) 60.5 ( 53.8- 67.8) 21.6 ( 19.0- 24.4)
Hawaii 40.8 ( 36.4- 45.7) 51.4 ( 41.2- 63.6) ∼ ∼Oregon 59.9 ( 56.5- 63.4) 60.9 ( 57.4- 64.5) ∼ 37.2 ( 21.1- 59.4)
Washington 59.6 ( 56.9- 62.4) 60.7 ( 57.8- 63.6) 61.0 ( 43.1- 83.3) 26.2 ( 15.5- 40.6)
Seattle-Puget Sound 61.0 ( 57.8- 64.4) 62.6 ( 59.1- 66.3) 60.4 ( 41.8- 83.9) 41.1 ( 22.5- 67.1)
∗ Rates are per 100,000 persons and are age-adjusted to the 2000 U.S. standard population (19 age groups - Census P25-1130).† Data are from all state and metropolitan area cancer registries, except Maryland. Included data cover approximately 98% of the population and met data
quality criteria for all invasive cancer sites combined. See Appendix B for registry-specific data quality information.‡ Invasive cancers only.
§ Data for specified racial or ethnic populations other than white and black should be interpreted with caution. See Technical Notes.
Hispanic origin is not mutually exclusive from race categories (white, black).
∼ Rates are suppressed if fewer than 16 cases were reported in a specific category (area, race, ethnicity).
- Rates are suppressed at the state’s or metropolitan area’s request. See Technical Notes.
Notes: Cases from suppressed rates are included in the U.S. and region/division rates. U.S. rates are as presented in Table 1.1.1.1F. Michigan, Georgia,
California, and Washington state rates each include cases from the SEER metropolitan areas.

United
States Cancer Statistics: 2004 Incid
ence and M
ortality
��0
continued
Table 2.15.1.2M: Lung and Bronchus. Age-Adjusted Cancer Death Rates∗ and 95% Confidence Intervals, byU.S. Census Region and Division, State, and Race and Ethnicity, United States†
Males, 2004
Area All Races White Black Hispanic‡§
United States 70.3 ( 69.8- 70.8) 69.6 ( 69.1- 70.1) 90.6 ( 88.7- 92.4) 33.7 ( 32.4- 35.1)
Northeast 64.3 ( 63.3- 65.3) 64.6 ( 63.6- 65.7) 71.6 ( 67.8- 75.5) 31.8 ( 28.5- 35.3)
New England 67.4 ( 65.4- 69.5) 68.1 ( 66.1- 70.2) 69.0 ( 57.7- 81.7) 32.7 ( 23.6- 43.5)
Connecticut 65.0 ( 61.1- 69.1) 65.3 ( 61.2- 69.5) 75.3 ( 57.4- 96.5) 39.4 ( 23.7- 60.3)
Maine 78.0 ( 71.4- 85.0) 78.2 ( 71.6- 85.3) ∼ ∼Massachusetts 65.3 ( 62.3- 68.3) 66.1 ( 63.1- 69.3) 69.0 ( 53.0- 87.7) 27.7 ( 16.6- 42.5)
New Hampshire 68.3 ( 61.6- 75.4) 68.9 ( 62.1- 76.1) ∼ ∼Rhode Island 74.4 ( 67.1- 82.4) 75.9 ( 68.2- 84.1) ∼ ∼Vermont 64.1 ( 55.3- 74.0) 64.8 ( 55.8- 74.7) ∼ ∼
Middle Atlantic 63.2 ( 62.0- 64.4) 63.3 ( 62.1- 64.6) 72.0 ( 68.0- 76.1) 31.7 ( 28.2- 35.5)
New Jersey 61.1 ( 58.6- 63.6) 60.8 ( 58.2- 63.6) 78.3 ( 69.0- 88.3) 24.4 ( 18.5- 31.2)
New York 58.6 ( 57.0- 60.2) 59.7 ( 57.9- 61.5) 58.9 ( 54.2- 64.0) 34.2 ( 29.8- 39.1)
Pennsylvania 70.6 ( 68.6- 72.8) 69.1 ( 67.0- 71.3) 97.9 ( 88.4- 108.0) 35.5 ( 22.8- 51.8)
Midwest 75.2 ( 74.2- 76.2) 73.7 ( 72.6- 74.7) 101.6 ( 97.2- 106.3) 32.0 ( 27.1- 37.3)
East North Central 75.8 ( 74.6- 77.1) 74.1 ( 72.9- 75.4) 101.0 ( 96.2- 106.0) 34.7 ( 29.1- 41.0)
Illinois 73.3 ( 71.0- 75.7) 71.6 ( 69.1- 74.1) 97.7 ( 89.6- 106.3) 31.1 ( 24.1- 39.2)
Indiana 83.0 ( 79.5- 86.5) 82.4 ( 78.8- 86.1) 100.9 ( 85.6- 117.9) ∼Michigan 74.9 ( 72.3- 77.5) 72.4 ( 69.7- 75.1) 99.9 ( 90.7- 109.7) 55.1 ( 37.7- 76.9)
Ohio 80.1 ( 77.6- 82.5) 78.6 ( 76.1- 81.2) 101.8 ( 92.4- 111.8) 32.3 ( 18.3- 51.8)
Wisconsin 66.5 ( 63.3- 69.8) 64.6 ( 61.4- 67.9) 137.4 (108.8- 170.5) ∼West North Central 73.7 ( 71.9- 75.5) 72.7 ( 70.9- 74.5) 105.5 ( 93.8- 118.2) 19.5 ( 12.0- 29.4)
Iowa 73.4 ( 69.0- 77.9) 73.3 ( 69.0- 77.9) ∼ ∼Kansas 72.9 ( 68.2- 77.8) 72.3 ( 67.5- 77.4) 96.0 ( 68.8- 129.3) ∼Minnesota 59.5 ( 56.2- 62.8) 59.3 ( 56.0- 62.7) 56.6 ( 31.1- 91.9) ∼Missouri 89.9 ( 86.3- 93.6) 88.2 ( 84.4- 92.0) 117.1 (101.7- 133.9) ∼Nebraska 66.2 ( 60.7- 72.1) 65.2 ( 59.6- 71.2) 101.7 ( 58.8- 160.8) ∼North Dakota 66.7 ( 58.0- 76.4) 66.1 ( 57.4- 75.9) ∼ ∼South Dakota 68.7 ( 60.5- 77.6) 66.8 ( 58.6- 75.8) ∼ ∼
South 80.1 ( 79.3- 81.0) 78.6 ( 77.7- 79.5) 96.6 ( 94.0- 99.3) 35.9 ( 33.7- 38.1)
South Atlantic 75.7 ( 74.6- 76.8) 74.6 ( 73.4- 75.8) 87.5 ( 84.2- 90.8) 36.8 ( 33.6- 40.2)
Delaware 85.6 ( 76.5- 95.5) 85.8 ( 75.9- 96.5) 87.1 ( 62.7- 117.3) ∼District of Columbia 72.8 ( 62.0- 84.9) 50.6 ( 35.8- 69.4) 88.8 ( 73.8- 105.9) ∼Florida 68.6 ( 67.0- 70.3) 68.6 ( 66.9- 70.3) 75.8 ( 69.3- 82.7) 40.3 ( 36.7- 44.3)
Georgia 86.1 ( 82.7- 89.5) 86.7 ( 82.9- 90.6) 89.1 ( 81.4- 97.3) 25.6 ( 13.0- 43.6)
Maryland 67.9 ( 64.5- 71.4) 65.8 ( 62.0- 69.8) 84.4 ( 75.7- 93.7) ∼North Carolina 84.3 ( 81.2- 87.4) 82.4 ( 79.1- 85.7) 93.9 ( 85.7- 102.6) ∼South Carolina 84.6 ( 80.3- 89.0) 84.4 ( 79.6- 89.4) 86.6 ( 77.3- 96.7) ∼Virginia 75.0 ( 71.9- 78.2) 72.0 ( 68.6- 75.5) 101.9 ( 92.5- 112.0) ∼West Virginia 92.0 ( 85.9- 98.5) 92.7 ( 86.4- 99.2) 83.8 ( 49.0- 132.1) ∼
East South Central 98.6 ( 96.3- 100.9) 97.4 ( 95.0- 99.9) 108.5 (102.1- 115.3) ∼Alabama 91.8 ( 87.6- 96.1) 91.5 ( 86.8- 96.3) 95.0 ( 85.0- 105.6) ∼Kentucky 106.0 (101.2- 111.0) 106.1 (101.2- 111.2) 114.8 ( 92.9- 140.0) ∼Mississippi 100.4 ( 94.7- 106.4) 95.4 ( 89.0- 102.2) 115.8 (103.6- 128.9) ∼Tennessee 98.0 ( 94.1- 102.0) 96.1 ( 92.1- 100.3) 117.1 (104.1- 131.2) ∼
West South Central 78.2 ( 76.6- 79.7) 75.5 ( 73.8- 77.1) 111.2 (105.4- 117.2) 35.7 ( 32.7- 38.8)
Arkansas 96.1 ( 90.8- 101.7) 95.3 ( 89.7- 101.1) 110.9 ( 93.1- 130.8) ∼
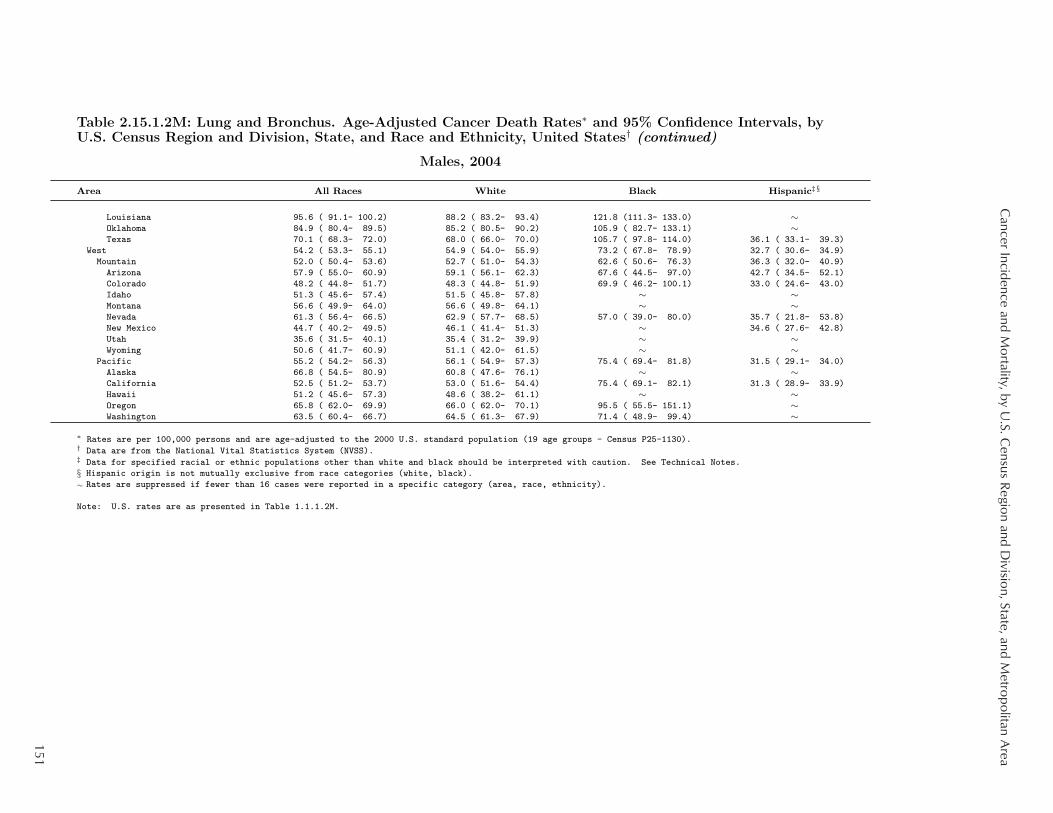
Cancer Incidence and M
ortality, by U.S. C
ensus Region and D
i�ision, State, and Metropolitan A
rea
���
Table 2.15.1.2M: Lung and Bronchus. Age-Adjusted Cancer Death Rates∗ and 95% Confidence Intervals, byU.S. Census Region and Division, State, and Race and Ethnicity, United States† (continued)
Males, 2004
Area All Races White Black Hispanic‡§
Louisiana 95.6 ( 91.1- 100.2) 88.2 ( 83.2- 93.4) 121.8 (111.3- 133.0) ∼Oklahoma 84.9 ( 80.4- 89.5) 85.2 ( 80.5- 90.2) 105.9 ( 82.7- 133.1) ∼Texas 70.1 ( 68.3- 72.0) 68.0 ( 66.0- 70.0) 105.7 ( 97.8- 114.0) 36.1 ( 33.1- 39.3)
West 54.2 ( 53.3- 55.1) 54.9 ( 54.0- 55.9) 73.2 ( 67.8- 78.9) 32.7 ( 30.6- 34.9)
Mountain 52.0 ( 50.4- 53.6) 52.7 ( 51.0- 54.3) 62.6 ( 50.6- 76.3) 36.3 ( 32.0- 40.9)
Arizona 57.9 ( 55.0- 60.9) 59.1 ( 56.1- 62.3) 67.6 ( 44.5- 97.0) 42.7 ( 34.5- 52.1)
Colorado 48.2 ( 44.8- 51.7) 48.3 ( 44.8- 51.9) 69.9 ( 46.2- 100.1) 33.0 ( 24.6- 43.0)
Idaho 51.3 ( 45.6- 57.4) 51.5 ( 45.8- 57.8) ∼ ∼Montana 56.6 ( 49.9- 64.0) 56.6 ( 49.8- 64.1) ∼ ∼Nevada 61.3 ( 56.4- 66.5) 62.9 ( 57.7- 68.5) 57.0 ( 39.0- 80.0) 35.7 ( 21.8- 53.8)
New Mexico 44.7 ( 40.2- 49.5) 46.1 ( 41.4- 51.3) ∼ 34.6 ( 27.6- 42.8)
Utah 35.6 ( 31.5- 40.1) 35.4 ( 31.2- 39.9) ∼ ∼Wyoming 50.6 ( 41.7- 60.9) 51.1 ( 42.0- 61.5) ∼ ∼
Pacific 55.2 ( 54.2- 56.3) 56.1 ( 54.9- 57.3) 75.4 ( 69.4- 81.8) 31.5 ( 29.1- 34.0)
Alaska 66.8 ( 54.5- 80.9) 60.8 ( 47.6- 76.1) ∼ ∼California 52.5 ( 51.2- 53.7) 53.0 ( 51.6- 54.4) 75.4 ( 69.1- 82.1) 31.3 ( 28.9- 33.9)
Hawaii 51.2 ( 45.6- 57.3) 48.6 ( 38.2- 61.1) ∼ ∼Oregon 65.8 ( 62.0- 69.9) 66.0 ( 62.0- 70.1) 95.5 ( 55.5- 151.1) ∼Washington 63.5 ( 60.4- 66.7) 64.5 ( 61.3- 67.9) 71.4 ( 48.9- 99.4) ∼
∗ Rates are per 100,000 persons and are age-adjusted to the 2000 U.S. standard population (19 age groups - Census P25-1130).† Data are from the National Vital Statistics System (NVSS).‡ Data for specified racial or ethnic populations other than white and black should be interpreted with caution. See Technical Notes.
§ Hispanic origin is not mutually exclusive from race categories (white, black).
∼ Rates are suppressed if fewer than 16 cases were reported in a specific category (area, race, ethnicity).
Note: U.S. rates are as presented in Table 1.1.1.2M.
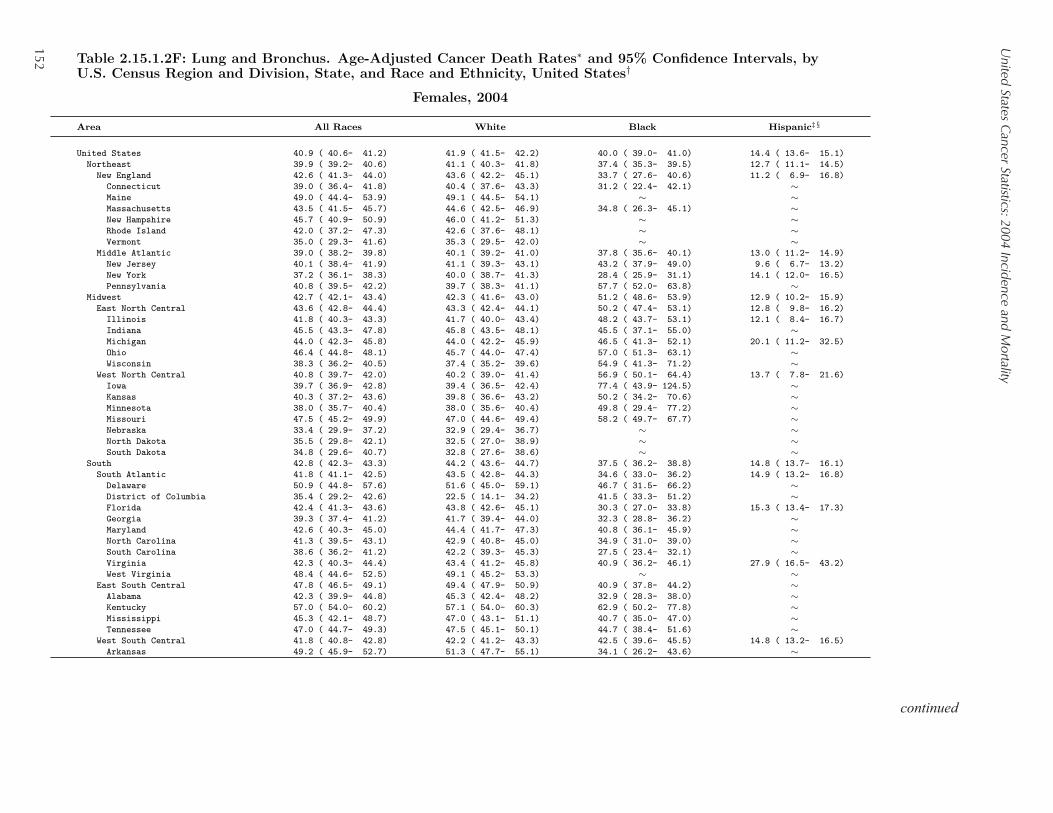
United
States Cancer Statistics: 2004 Incid
ence and M
ortality
���
continued
Table 2.15.1.2F: Lung and Bronchus. Age-Adjusted Cancer Death Rates∗ and 95% Confidence Intervals, byU.S. Census Region and Division, State, and Race and Ethnicity, United States†
Females, 2004
Area All Races White Black Hispanic‡§
United States 40.9 ( 40.6- 41.2) 41.9 ( 41.5- 42.2) 40.0 ( 39.0- 41.0) 14.4 ( 13.6- 15.1)
Northeast 39.9 ( 39.2- 40.6) 41.1 ( 40.3- 41.8) 37.4 ( 35.3- 39.5) 12.7 ( 11.1- 14.5)
New England 42.6 ( 41.3- 44.0) 43.6 ( 42.2- 45.1) 33.7 ( 27.6- 40.6) 11.2 ( 6.9- 16.8)
Connecticut 39.0 ( 36.4- 41.8) 40.4 ( 37.6- 43.3) 31.2 ( 22.4- 42.1) ∼Maine 49.0 ( 44.4- 53.9) 49.1 ( 44.5- 54.1) ∼ ∼Massachusetts 43.5 ( 41.5- 45.7) 44.6 ( 42.5- 46.9) 34.8 ( 26.3- 45.1) ∼New Hampshire 45.7 ( 40.9- 50.9) 46.0 ( 41.2- 51.3) ∼ ∼Rhode Island 42.0 ( 37.2- 47.3) 42.6 ( 37.6- 48.1) ∼ ∼Vermont 35.0 ( 29.3- 41.6) 35.3 ( 29.5- 42.0) ∼ ∼
Middle Atlantic 39.0 ( 38.2- 39.8) 40.1 ( 39.2- 41.0) 37.8 ( 35.6- 40.1) 13.0 ( 11.2- 14.9)
New Jersey 40.1 ( 38.4- 41.9) 41.1 ( 39.3- 43.1) 43.2 ( 37.9- 49.0) 9.6 ( 6.7- 13.2)
New York 37.2 ( 36.1- 38.3) 40.0 ( 38.7- 41.3) 28.4 ( 25.9- 31.1) 14.1 ( 12.0- 16.5)
Pennsylvania 40.8 ( 39.5- 42.2) 39.7 ( 38.3- 41.1) 57.7 ( 52.0- 63.8) ∼Midwest 42.7 ( 42.1- 43.4) 42.3 ( 41.6- 43.0) 51.2 ( 48.6- 53.9) 12.9 ( 10.2- 15.9)
East North Central 43.6 ( 42.8- 44.4) 43.3 ( 42.4- 44.1) 50.2 ( 47.4- 53.1) 12.8 ( 9.8- 16.2)
Illinois 41.8 ( 40.3- 43.3) 41.7 ( 40.0- 43.4) 48.2 ( 43.7- 53.1) 12.1 ( 8.4- 16.7)
Indiana 45.5 ( 43.3- 47.8) 45.8 ( 43.5- 48.1) 45.5 ( 37.1- 55.0) ∼Michigan 44.0 ( 42.3- 45.8) 44.0 ( 42.2- 45.9) 46.5 ( 41.3- 52.1) 20.1 ( 11.2- 32.5)
Ohio 46.4 ( 44.8- 48.1) 45.7 ( 44.0- 47.4) 57.0 ( 51.3- 63.1) ∼Wisconsin 38.3 ( 36.2- 40.5) 37.4 ( 35.2- 39.6) 54.9 ( 41.3- 71.2) ∼
West North Central 40.8 ( 39.7- 42.0) 40.2 ( 39.0- 41.4) 56.9 ( 50.1- 64.4) 13.7 ( 7.8- 21.6)
Iowa 39.7 ( 36.9- 42.8) 39.4 ( 36.5- 42.4) 77.4 ( 43.9- 124.5) ∼Kansas 40.3 ( 37.2- 43.6) 39.8 ( 36.6- 43.2) 50.2 ( 34.2- 70.6) ∼Minnesota 38.0 ( 35.7- 40.4) 38.0 ( 35.6- 40.4) 49.8 ( 29.4- 77.2) ∼Missouri 47.5 ( 45.2- 49.9) 47.0 ( 44.6- 49.4) 58.2 ( 49.7- 67.7) ∼Nebraska 33.4 ( 29.9- 37.2) 32.9 ( 29.4- 36.7) ∼ ∼North Dakota 35.5 ( 29.8- 42.1) 32.5 ( 27.0- 38.9) ∼ ∼South Dakota 34.8 ( 29.6- 40.7) 32.8 ( 27.6- 38.6) ∼ ∼
South 42.8 ( 42.3- 43.3) 44.2 ( 43.6- 44.7) 37.5 ( 36.2- 38.8) 14.8 ( 13.7- 16.1)
South Atlantic 41.8 ( 41.1- 42.5) 43.5 ( 42.8- 44.3) 34.6 ( 33.0- 36.2) 14.9 ( 13.2- 16.8)
Delaware 50.9 ( 44.8- 57.6) 51.6 ( 45.0- 59.1) 46.7 ( 31.5- 66.2) ∼District of Columbia 35.4 ( 29.2- 42.6) 22.5 ( 14.1- 34.2) 41.5 ( 33.3- 51.2) ∼Florida 42.4 ( 41.3- 43.6) 43.8 ( 42.6- 45.1) 30.3 ( 27.0- 33.8) 15.3 ( 13.4- 17.3)
Georgia 39.3 ( 37.4- 41.2) 41.7 ( 39.4- 44.0) 32.3 ( 28.8- 36.2) ∼Maryland 42.6 ( 40.3- 45.0) 44.4 ( 41.7- 47.3) 40.8 ( 36.1- 45.9) ∼North Carolina 41.3 ( 39.5- 43.1) 42.9 ( 40.8- 45.0) 34.9 ( 31.0- 39.0) ∼South Carolina 38.6 ( 36.2- 41.2) 42.2 ( 39.3- 45.3) 27.5 ( 23.4- 32.1) ∼Virginia 42.3 ( 40.3- 44.4) 43.4 ( 41.2- 45.8) 40.9 ( 36.2- 46.1) 27.9 ( 16.5- 43.2)
West Virginia 48.4 ( 44.6- 52.5) 49.1 ( 45.2- 53.3) ∼ ∼East South Central 47.8 ( 46.5- 49.1) 49.4 ( 47.9- 50.9) 40.9 ( 37.8- 44.2) ∼Alabama 42.3 ( 39.9- 44.8) 45.3 ( 42.4- 48.2) 32.9 ( 28.3- 38.0) ∼Kentucky 57.0 ( 54.0- 60.2) 57.1 ( 54.0- 60.3) 62.9 ( 50.2- 77.8) ∼Mississippi 45.3 ( 42.1- 48.7) 47.0 ( 43.1- 51.1) 40.7 ( 35.0- 47.0) ∼Tennessee 47.0 ( 44.7- 49.3) 47.5 ( 45.1- 50.1) 44.7 ( 38.4- 51.6) ∼
West South Central 41.8 ( 40.8- 42.8) 42.2 ( 41.2- 43.3) 42.5 ( 39.6- 45.5) 14.8 ( 13.2- 16.5)
Arkansas 49.2 ( 45.9- 52.7) 51.3 ( 47.7- 55.1) 34.1 ( 26.2- 43.6) ∼
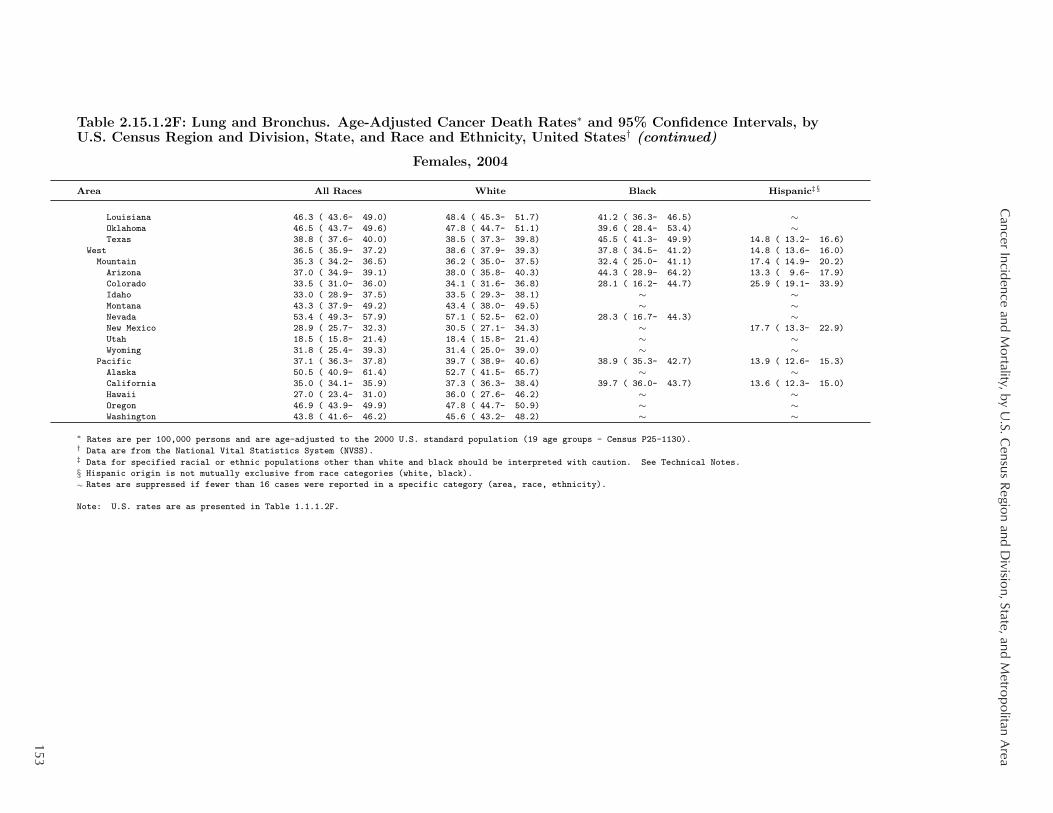
Cancer Incidence and M
ortality, by U.S. C
ensus Region and D
i�ision, State, and Metropolitan A
rea
��3
Table 2.15.1.2F: Lung and Bronchus. Age-Adjusted Cancer Death Rates∗ and 95% Confidence Intervals, byU.S. Census Region and Division, State, and Race and Ethnicity, United States† (continued)
Females, 2004
Area All Races White Black Hispanic‡§
Louisiana 46.3 ( 43.6- 49.0) 48.4 ( 45.3- 51.7) 41.2 ( 36.3- 46.5) ∼Oklahoma 46.5 ( 43.7- 49.6) 47.8 ( 44.7- 51.1) 39.6 ( 28.4- 53.4) ∼Texas 38.8 ( 37.6- 40.0) 38.5 ( 37.3- 39.8) 45.5 ( 41.3- 49.9) 14.8 ( 13.2- 16.6)
West 36.5 ( 35.9- 37.2) 38.6 ( 37.9- 39.3) 37.8 ( 34.5- 41.2) 14.8 ( 13.6- 16.0)
Mountain 35.3 ( 34.2- 36.5) 36.2 ( 35.0- 37.5) 32.4 ( 25.0- 41.1) 17.4 ( 14.9- 20.2)
Arizona 37.0 ( 34.9- 39.1) 38.0 ( 35.8- 40.3) 44.3 ( 28.9- 64.2) 13.3 ( 9.6- 17.9)
Colorado 33.5 ( 31.0- 36.0) 34.1 ( 31.6- 36.8) 28.1 ( 16.2- 44.7) 25.9 ( 19.1- 33.9)
Idaho 33.0 ( 28.9- 37.5) 33.5 ( 29.3- 38.1) ∼ ∼Montana 43.3 ( 37.9- 49.2) 43.4 ( 38.0- 49.5) ∼ ∼Nevada 53.4 ( 49.3- 57.9) 57.1 ( 52.5- 62.0) 28.3 ( 16.7- 44.3) ∼New Mexico 28.9 ( 25.7- 32.3) 30.5 ( 27.1- 34.3) ∼ 17.7 ( 13.3- 22.9)
Utah 18.5 ( 15.8- 21.4) 18.4 ( 15.8- 21.4) ∼ ∼Wyoming 31.8 ( 25.4- 39.3) 31.4 ( 25.0- 39.0) ∼ ∼
Pacific 37.1 ( 36.3- 37.8) 39.7 ( 38.9- 40.6) 38.9 ( 35.3- 42.7) 13.9 ( 12.6- 15.3)
Alaska 50.5 ( 40.9- 61.4) 52.7 ( 41.5- 65.7) ∼ ∼California 35.0 ( 34.1- 35.9) 37.3 ( 36.3- 38.4) 39.7 ( 36.0- 43.7) 13.6 ( 12.3- 15.0)
Hawaii 27.0 ( 23.4- 31.0) 36.0 ( 27.6- 46.2) ∼ ∼Oregon 46.9 ( 43.9- 49.9) 47.8 ( 44.7- 50.9) ∼ ∼Washington 43.8 ( 41.6- 46.2) 45.6 ( 43.2- 48.2) ∼ ∼
∗ Rates are per 100,000 persons and are age-adjusted to the 2000 U.S. standard population (19 age groups - Census P25-1130).† Data are from the National Vital Statistics System (NVSS).‡ Data for specified racial or ethnic populations other than white and black should be interpreted with caution. See Technical Notes.
§ Hispanic origin is not mutually exclusive from race categories (white, black).
∼ Rates are suppressed if fewer than 16 cases were reported in a specific category (area, race, ethnicity).
Note: U.S. rates are as presented in Table 1.1.1.2F.
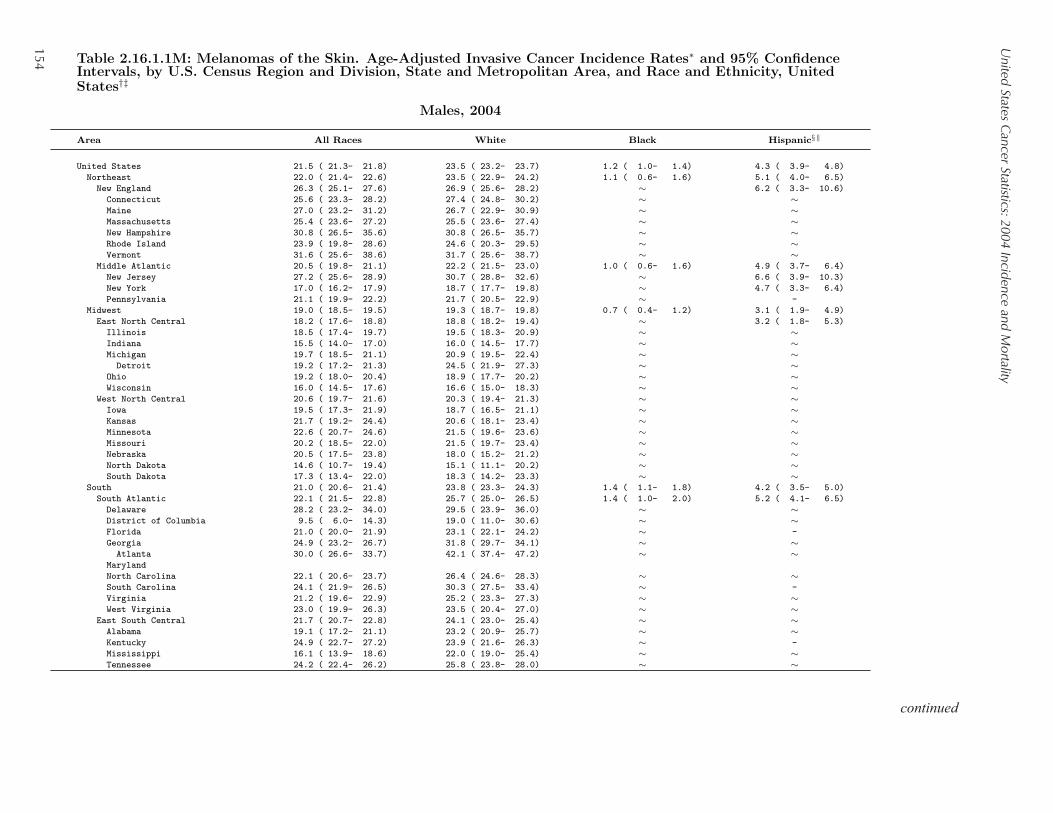
United
States Cancer Statistics: 2004 Incid
ence and M
ortality
���
continued
Table 2.16.1.1M: Melanomas of the Skin. Age-Adjusted Invasive Cancer Incidence Rates∗ and 95% ConfidenceIntervals, by U.S. Census Region and Division, State and Metropolitan Area, and Race and Ethnicity, UnitedStates†‡
Males, 2004
Area All Races White Black Hispanic§
United States 21.5 ( 21.3- 21.8) 23.5 ( 23.2- 23.7) 1.2 ( 1.0- 1.4) 4.3 ( 3.9- 4.8)
Northeast 22.0 ( 21.4- 22.6) 23.5 ( 22.9- 24.2) 1.1 ( 0.6- 1.6) 5.1 ( 4.0- 6.5)
New England 26.3 ( 25.1- 27.6) 26.9 ( 25.6- 28.2) ∼ 6.2 ( 3.3- 10.6)
Connecticut 25.6 ( 23.3- 28.2) 27.4 ( 24.8- 30.2) ∼ ∼Maine 27.0 ( 23.2- 31.2) 26.7 ( 22.9- 30.9) ∼ ∼Massachusetts 25.4 ( 23.6- 27.2) 25.5 ( 23.6- 27.4) ∼ ∼New Hampshire 30.8 ( 26.5- 35.6) 30.8 ( 26.5- 35.7) ∼ ∼Rhode Island 23.9 ( 19.8- 28.6) 24.6 ( 20.3- 29.5) ∼ ∼Vermont 31.6 ( 25.6- 38.6) 31.7 ( 25.6- 38.7) ∼ ∼
Middle Atlantic 20.5 ( 19.8- 21.1) 22.2 ( 21.5- 23.0) 1.0 ( 0.6- 1.6) 4.9 ( 3.7- 6.4)
New Jersey 27.2 ( 25.6- 28.9) 30.7 ( 28.8- 32.6) ∼ 6.6 ( 3.9- 10.3)
New York 17.0 ( 16.2- 17.9) 18.7 ( 17.7- 19.8) ∼ 4.7 ( 3.3- 6.4)
Pennsylvania 21.1 ( 19.9- 22.2) 21.7 ( 20.5- 22.9) ∼ -
Midwest 19.0 ( 18.5- 19.5) 19.3 ( 18.7- 19.8) 0.7 ( 0.4- 1.2) 3.1 ( 1.9- 4.9)
East North Central 18.2 ( 17.6- 18.8) 18.8 ( 18.2- 19.4) ∼ 3.2 ( 1.8- 5.3)
Illinois 18.5 ( 17.4- 19.7) 19.5 ( 18.3- 20.9) ∼ ∼Indiana 15.5 ( 14.0- 17.0) 16.0 ( 14.5- 17.7) ∼ ∼Michigan 19.7 ( 18.5- 21.1) 20.9 ( 19.5- 22.4) ∼ ∼
Detroit 19.2 ( 17.2- 21.3) 24.5 ( 21.9- 27.3) ∼ ∼Ohio 19.2 ( 18.0- 20.4) 18.9 ( 17.7- 20.2) ∼ ∼Wisconsin 16.0 ( 14.5- 17.6) 16.6 ( 15.0- 18.3) ∼ ∼
West North Central 20.6 ( 19.7- 21.6) 20.3 ( 19.4- 21.3) ∼ ∼Iowa 19.5 ( 17.3- 21.9) 18.7 ( 16.5- 21.1) ∼ ∼Kansas 21.7 ( 19.2- 24.4) 20.6 ( 18.1- 23.4) ∼ ∼Minnesota 22.6 ( 20.7- 24.6) 21.5 ( 19.6- 23.6) ∼ ∼Missouri 20.2 ( 18.5- 22.0) 21.5 ( 19.7- 23.4) ∼ ∼Nebraska 20.5 ( 17.5- 23.8) 18.0 ( 15.2- 21.2) ∼ ∼North Dakota 14.6 ( 10.7- 19.4) 15.1 ( 11.1- 20.2) ∼ ∼South Dakota 17.3 ( 13.4- 22.0) 18.3 ( 14.2- 23.3) ∼ ∼
South 21.0 ( 20.6- 21.4) 23.8 ( 23.3- 24.3) 1.4 ( 1.1- 1.8) 4.2 ( 3.5- 5.0)
South Atlantic 22.1 ( 21.5- 22.8) 25.7 ( 25.0- 26.5) 1.4 ( 1.0- 2.0) 5.2 ( 4.1- 6.5)
Delaware 28.2 ( 23.2- 34.0) 29.5 ( 23.9- 36.0) ∼ ∼District of Columbia 9.5 ( 6.0- 14.3) 19.0 ( 11.0- 30.6) ∼ ∼Florida 21.0 ( 20.0- 21.9) 23.1 ( 22.1- 24.2) ∼ -
Georgia 24.9 ( 23.2- 26.7) 31.8 ( 29.7- 34.1) ∼ ∼Atlanta 30.0 ( 26.6- 33.7) 42.1 ( 37.4- 47.2) ∼ ∼
Maryland
North Carolina 22.1 ( 20.6- 23.7) 26.4 ( 24.6- 28.3) ∼ ∼South Carolina 24.1 ( 21.9- 26.5) 30.3 ( 27.5- 33.4) ∼ -
Virginia 21.2 ( 19.6- 22.9) 25.2 ( 23.3- 27.3) ∼ ∼West Virginia 23.0 ( 19.9- 26.3) 23.5 ( 20.4- 27.0) ∼ ∼
East South Central 21.7 ( 20.7- 22.8) 24.1 ( 23.0- 25.4) ∼ ∼Alabama 19.1 ( 17.2- 21.1) 23.2 ( 20.9- 25.7) ∼ ∼Kentucky 24.9 ( 22.7- 27.2) 23.9 ( 21.6- 26.3) ∼ -
Mississippi 16.1 ( 13.9- 18.6) 22.0 ( 19.0- 25.4) ∼ ∼Tennessee 24.2 ( 22.4- 26.2) 25.8 ( 23.8- 28.0) ∼ ∼

Cancer Incidence and M
ortality, by U.S. C
ensus Region and D
i�ision, State, and Metropolitan A
rea
���
Table 2.16.1.1M: Melanomas of the Skin. Age-Adjusted Invasive Cancer Incidence Rates∗ and 95% ConfidenceIntervals, by U.S. Census Region and Division, State and Metropolitan Area, and Race and Ethnicity, UnitedStates†‡ (continued)
Males, 2004
Area All Races White Black Hispanic§
West South Central 18.6 ( 17.8- 19.3) 20.5 ( 19.6- 21.3) 1.6 ( 0.9- 2.4) 3.4 ( 2.5- 4.3)
Arkansas 16.5 ( 14.4- 18.9) 18.3 ( 15.9- 20.9) ∼ ∼Louisiana 17.3 ( 15.4- 19.3) 22.2 ( 19.7- 24.8) ∼ ∼Oklahoma 20.6 ( 18.5- 23.0) 22.3 ( 19.9- 24.9) ∼ ∼Texas 18.8 ( 17.9- 19.8) 20.2 ( 19.2- 21.2) ∼ 3.4 ( 2.5- 4.4)
West 24.6 ( 24.0- 25.2) 27.5 ( 26.9- 28.2) ∼ 4.4 ( 3.7- 5.1)
Mountain 22.4 ( 21.4- 23.4) 23.1 ( 22.1- 24.2) ∼ 3.0 ( 2.0- 4.4)
Arizona 19.4 ( 17.7- 21.1) 18.9 ( 17.2- 20.7) ∼ ∼Colorado 22.3 ( 20.2- 24.6) 23.5 ( 21.2- 25.8) ∼ ∼Idaho 31.4 ( 27.1- 36.2) 32.2 ( 27.7- 37.0) ∼ ∼Montana 18.3 ( 14.6- 22.7) 17.6 ( 13.9- 21.9) ∼ ∼Nevada 19.9 ( 17.2- 22.9) 22.5 ( 19.5- 25.8) ∼ ∼New Mexico 20.0 ( 17.1- 23.2) 21.7 ( 18.5- 25.2) ∼ ∼Utah 31.0 ( 27.4- 35.0) 32.0 ( 28.2- 36.1) ∼ ∼Wyoming 25.4 ( 19.4- 32.7) 24.9 ( 18.9- 32.3) ∼ ∼
Pacific 25.6 ( 24.9- 26.3) 29.7 ( 28.9- 30.6) ∼ 4.8 ( 4.0- 5.8)
Alaska 9.3 ( 5.6- 14.4) 11.5 ( 6.8- 18.1) ∼ ∼California 24.8 ( 24.0- 25.6) 28.8 ( 27.8- 29.8) ∼ 4.7 ( 3.8- 5.6)
San Francisco-Oakland 18.7 ( 16.8- 20.7) 25.3 ( 22.6- 28.1) ∼ ∼San Jose-Monterey 20.7 ( 17.8- 23.8) 25.6 ( 22.1- 29.6) ∼ ∼Los Angeles 19.0 ( 17.6- 20.4) 24.8 ( 22.9- 26.7) ∼ 3.8 ( 2.6- 5.3)
Hawaii 26.7 ( 22.8- 31.0) 89.3 ( 75.4- 105.1) ∼ ∼Oregon 28.5 ( 26.0- 31.1) 29.5 ( 27.0- 32.3) ∼ ∼Washington 29.5 ( 27.5- 31.6) 31.9 ( 29.7- 34.2) ∼ ∼
Seattle-Puget Sound 31.3 ( 28.9- 34.0) 35.4 ( 32.6- 38.4) ∼ ∼∗ Rates are per 100,000 persons and are age-adjusted to the 2000 U.S. standard population (19 age groups - Census P25-1130).† Data are from all state and metropolitan area cancer registries, except Maryland. Included data cover approximately 98% of the population and met data
quality criteria for all invasive cancer sites combined. See Appendix B for registry-specific data quality information.‡ Invasive cancers only.
§ Data for specified racial or ethnic populations other than white and black should be interpreted with caution. See Technical Notes.
Hispanic origin is not mutually exclusive from race categories (white, black).
∼ Rates are suppressed if fewer than 16 cases were reported in a specific category (area, race, ethnicity).
- Rates are suppressed at the state’s or metropolitan area’s request. See Technical Notes.
Notes: Cases from suppressed rates are included in the U.S. and region/division rates. U.S. rates are as presented in Table 1.1.1.1M. Michigan, Georgia,
California, and Washington state rates each include cases from the SEER metropolitan areas.

United
States Cancer Statistics: 2004 Incid
ence and M
ortality
���
continued
Table 2.16.1.1F: Melanomas of the Skin. Age-Adjusted Invasive Cancer Incidence Rates∗ and 95% ConfidenceIntervals, by U.S. Census Region and Division, State and Metropolitan Area, and Race and Ethnicity, UnitedStates†‡
Females, 2004
Area All Races White Black Hispanic§
United States 14.0 ( 13.8- 14.2) 15.6 ( 15.4- 15.9) 1.0 ( 0.8- 1.2) 4.1 ( 3.8- 4.5)
Northeast 14.8 ( 14.3- 15.2) 16.0 ( 15.6- 16.5) 0.9 ( 0.6- 1.3) 4.0 ( 3.2- 5.0)
New England 19.4 ( 18.5- 20.4) 20.1 ( 19.0- 21.1) ∼ ∼Connecticut 16.9 ( 15.2- 18.9) 18.6 ( 16.6- 20.7) ∼ ∼Maine 18.4 ( 15.4- 21.8) 17.9 ( 14.9- 21.3) ∼ ∼Massachusetts 18.7 ( 17.3- 20.2) 18.9 ( 17.4- 20.4) ∼ ∼New Hampshire 26.5 ( 22.8- 30.7) 26.3 ( 22.5- 30.5) ∼ ∼Rhode Island 19.6 ( 16.2- 23.5) 20.5 ( 16.9- 24.6) ∼ ∼Vermont 28.5 ( 23.1- 34.8) 29.0 ( 23.5- 35.4) ∼ ∼
Middle Atlantic 13.1 ( 12.7- 13.6) 14.5 ( 13.9- 15.0) 0.8 ( 0.5- 1.2) 4.2 ( 3.3- 5.3)
New Jersey 15.9 ( 14.8- 17.1) 18.8 ( 17.4- 20.2) ∼ 6.5 ( 4.3- 9.4)
New York 11.2 ( 10.6- 11.9) 12.1 ( 11.4- 12.9) ∼ 3.4 ( 2.5- 4.6)
Pennsylvania 14.3 ( 13.4- 15.2) 14.9 ( 14.0- 16.0) ∼ -
Midwest 13.3 ( 12.9- 13.7) 13.8 ( 13.3- 14.2) 0.8 ( 0.5- 1.2) 4.0 ( 2.8- 5.6)
East North Central 12.7 ( 12.3- 13.2) 13.4 ( 12.9- 13.9) 0.9 ( 0.6- 1.4) 4.3 ( 2.9- 6.1)
Illinois 11.1 ( 10.3- 11.9) 12.1 ( 11.2- 13.0) ∼ 3.3 ( 1.8- 5.5)
Indiana 10.3 ( 9.2- 11.5) 11.0 ( 9.9- 12.3) ∼ ∼Michigan 14.0 ( 13.0- 15.0) 15.1 ( 14.0- 16.3) ∼ ∼
Detroit 12.6 ( 11.1- 14.2) 16.9 ( 14.8- 19.1) ∼ ∼Ohio 15.3 ( 14.3- 16.3) 15.4 ( 14.4- 16.5) ∼ ∼Wisconsin 11.4 ( 10.3- 12.7) 11.9 ( 10.7- 13.3) ∼ ∼
West North Central 14.6 ( 13.9- 15.4) 14.5 ( 13.7- 15.3) ∼ ∼Iowa 15.2 ( 13.3- 17.2) 14.3 ( 12.5- 16.3) ∼ ∼Kansas 16.1 ( 14.1- 18.3) 15.3 ( 13.3- 17.6) ∼ ∼Minnesota 16.7 ( 15.2- 18.4) 15.8 ( 14.3- 17.5) ∼ ∼Missouri 12.2 ( 11.0- 13.5) 13.6 ( 12.3- 15.1) ∼ ∼Nebraska 14.7 ( 12.3- 17.4) 13.1 ( 10.8- 15.9) ∼ ∼North Dakota 12.6 ( 9.0- 17.2) 13.4 ( 9.6- 18.3) ∼ ∼South Dakota 13.4 ( 10.0- 17.5) 14.0 ( 10.4- 18.4) ∼ ∼
South 12.9 ( 12.6- 13.2) 15.3 ( 14.9- 15.6) 1.1 ( 0.8- 1.3) 3.5 ( 3.0- 4.1)
South Atlantic 14.0 ( 13.6- 14.5) 17.3 ( 16.8- 17.9) 1.1 ( 0.8- 1.5) 4.9 ( 3.9- 5.9)
Delaware 16.2 ( 12.7- 20.3) 17.6 ( 13.5- 22.6) ∼ ∼District of Columbia ∼ ∼ ∼ ∼Florida 12.9 ( 12.2- 13.6) 14.9 ( 14.1- 15.8) ∼ -
Georgia 15.5 ( 14.3- 16.7) 21.3 ( 19.7- 23.0) ∼ ∼Atlanta 17.4 ( 15.3- 19.7) 27.8 ( 24.5- 31.5) ∼ ∼
Maryland
North Carolina 13.2 ( 12.1- 14.3) 16.7 ( 15.4- 18.1) ∼ ∼South Carolina 17.1 ( 15.5- 18.9) 23.2 ( 20.9- 25.7) ∼ -
Virginia 14.3 ( 13.2- 15.5) 17.7 ( 16.2- 19.3) ∼ ∼West Virginia 15.9 ( 13.5- 18.5) 16.1 ( 13.7- 18.8) ∼ ∼
East South Central 14.1 ( 13.3- 14.8) 16.1 ( 15.2- 17.0) 1.0 ( 0.6- 1.6) ∼Alabama 12.0 ( 10.7- 13.5) 15.6 ( 13.8- 17.5) ∼ ∼Kentucky 18.1 ( 16.4- 20.0) 17.2 ( 15.4- 19.1) ∼ -
Mississippi 10.9 ( 9.3- 12.6) 16.1 ( 13.7- 18.8) ∼ ∼Tennessee 14.3 ( 13.1- 15.7) 15.6 ( 14.1- 17.1) ∼ ∼

Cancer Incidence and M
ortality, by U.S. C
ensus Region and D
i�ision, State, and Metropolitan A
rea
���
Table 2.16.1.1F: Melanomas of the Skin. Age-Adjusted Invasive Cancer Incidence Rates∗ and 95% ConfidenceIntervals, by U.S. Census Region and Division, State and Metropolitan Area, and Race and Ethnicity, UnitedStates†‡ (continued)
Females, 2004
Area All Races White Black Hispanic§
West South Central 10.4 ( 9.9- 10.9) 11.7 ( 11.1- 12.3) 0.9 ( 0.6- 1.5) 2.5 ( 1.9- 3.2)
Arkansas 10.4 ( 8.8- 12.2) 12.0 ( 10.2- 14.1) ∼ ∼Louisiana 8.8 ( 7.6- 10.1) 12.0 ( 10.4- 13.8) ∼ ∼Oklahoma 15.2 ( 13.5- 17.1) 16.7 ( 14.7- 18.9) ∼ ∼Texas 9.9 ( 9.3- 10.5) 10.7 ( 10.0- 11.4) ∼ 2.5 ( 1.9- 3.2)
West 16.0 ( 15.5- 16.4) 17.9 ( 17.4- 18.4) 1.1 ( 0.6- 1.8) 4.8 ( 4.2- 5.4)
Mountain 14.3 ( 13.6- 15.1) 15.0 ( 14.2- 15.8) ∼ 3.9 ( 2.9- 5.2)
Arizona 10.0 ( 8.9- 11.2) 9.4 ( 8.3- 10.6) ∼ ∼Colorado 16.4 ( 14.8- 18.2) 17.4 ( 15.6- 19.2) ∼ 5.6 ( 3.2- 9.1)
Idaho 21.9 ( 18.5- 25.7) 22.4 ( 18.9- 26.3) ∼ ∼Montana 12.8 ( 9.9- 16.4) 12.8 ( 9.7- 16.5) ∼ ∼Nevada 12.3 ( 10.4- 14.5) 14.4 ( 12.1- 17.0) ∼ ∼New Mexico 12.8 ( 10.7- 15.3) 14.3 ( 11.8- 17.0) ∼ ∼Utah 20.0 ( 17.3- 23.0) 20.7 ( 17.9- 23.7) ∼ ∼Wyoming 18.0 ( 13.2- 24.1) 18.7 ( 13.6- 25.0) ∼ ∼
Pacific 16.6 ( 16.1- 17.1) 19.3 ( 18.7- 20.0) ∼ 5.1 ( 4.4- 5.8)
Alaska 10.0 ( 6.5- 14.8) 12.5 ( 7.9- 18.8) ∼ ∼California 14.8 ( 14.3- 15.4) 17.1 ( 16.4- 17.8) ∼ 4.9 ( 4.2- 5.7)
San Francisco-Oakland 12.4 ( 11.0- 13.9) 15.8 ( 13.9- 18.0) ∼ ∼San Jose-Monterey 14.1 ( 12.0- 16.4) 18.6 ( 15.9- 21.8) ∼ ∼Los Angeles 9.9 ( 9.0- 10.8) 13.0 ( 11.9- 14.3) ∼ 3.6 ( 2.7- 4.7)
Hawaii 16.3 ( 13.4- 19.7) 56.8 ( 45.8- 69.8) ∼ ∼Oregon 24.2 ( 22.0- 26.6) 25.7 ( 23.3- 28.2) ∼ ∼Washington 23.0 ( 21.4- 24.8) 25.4 ( 23.5- 27.3) ∼ ∼
Seattle-Puget Sound 24.5 ( 22.5- 26.7) 28.4 ( 26.1- 31.0) ∼ ∼∗ Rates are per 100,000 persons and are age-adjusted to the 2000 U.S. standard population (19 age groups - Census P25-1130).† Data are from all state and metropolitan area cancer registries, except Maryland. Included data cover approximately 98% of the population and met data
quality criteria for all invasive cancer sites combined. See Appendix B for registry-specific data quality information.‡ Invasive cancers only.
§ Data for specified racial or ethnic populations other than white and black should be interpreted with caution. See Technical Notes.
Hispanic origin is not mutually exclusive from race categories (white, black).
∼ Rates are suppressed if fewer than 16 cases were reported in a specific category (area, race, ethnicity).
- Rates are suppressed at the state’s or metropolitan area’s request. See Technical Notes.
Notes: Cases from suppressed rates are included in the U.S. and region/division rates. U.S. rates are as presented in Table 1.1.1.1F. Michigan, Georgia,
California, and Washington state rates each include cases from the SEER metropolitan areas.

United
States Cancer Statistics: 2004 Incid
ence and M
ortality
���
continued
Table 2.16.1.2M: Melanomas of the Skin. Age-Adjusted Cancer Death Rates∗ and 95% Confidence Intervals,by U.S. Census Region and Division, State, and Race and Ethnicity, United States†
Males, 2004
Area All Races White Black Hispanic‡§
United States 3.9 ( 3.8- 4.0) 4.5 ( 4.3- 4.6) 0.5 ( 0.4- 0.7) 0.8 ( 0.6- 1.0)
Northeast 3.8 ( 3.6- 4.1) 4.3 ( 4.0- 4.6) ∼ ∼New England 4.6 ( 4.1- 5.1) 4.8 ( 4.3- 5.4) ∼ ∼Connecticut 4.9 ( 3.9- 6.1) 5.1 ( 4.0- 6.4) ∼ ∼Maine 4.1 ( 2.7- 6.0) 3.9 ( 2.6- 5.8) ∼ ∼Massachusetts 4.2 ( 3.5- 5.0) 4.5 ( 3.7- 5.4) ∼ ∼New Hampshire 5.1 ( 3.4- 7.2) 5.1 ( 3.5- 7.4) ∼ ∼Rhode Island 6.4 ( 4.4- 9.1) 6.8 ( 4.7- 9.6) ∼ ∼Vermont ∼ ∼ ∼ ∼
Middle Atlantic 3.6 ( 3.3- 3.8) 4.1 ( 3.8- 4.4) ∼ ∼New Jersey 3.8 ( 3.2- 4.5) 4.4 ( 3.7- 5.2) ∼ ∼New York 3.0 ( 2.6- 3.3) 3.5 ( 3.1- 4.0) ∼ ∼Pennsylvania 4.3 ( 3.8- 4.8) 4.6 ( 4.1- 5.2) ∼ ∼
Midwest 3.8 ( 3.6- 4.0) 4.1 ( 3.9- 4.4) ∼ ∼East North Central 3.8 ( 3.5- 4.0) 4.1 ( 3.8- 4.4) ∼ ∼Illinois 3.7 ( 3.2- 4.3) 4.3 ( 3.7- 4.9) ∼ ∼Indiana 4.3 ( 3.5- 5.1) 4.6 ( 3.8- 5.5) ∼ ∼Michigan 3.7 ( 3.1- 4.3) 4.1 ( 3.5- 4.8) ∼ ∼Ohio 3.6 ( 3.1- 4.2) 4.0 ( 3.4- 4.6) ∼ ∼Wisconsin 3.6 ( 2.9- 4.4) 3.8 ( 3.0- 4.6) ∼ ∼
West North Central 3.9 ( 3.5- 4.3) 4.0 ( 3.6- 4.5) ∼ ∼Iowa 3.5 ( 2.6- 4.6) 3.6 ( 2.7- 4.7) ∼ ∼Kansas 4.4 ( 3.3- 5.8) 4.7 ( 3.5- 6.1) ∼ ∼Minnesota 3.2 ( 2.5- 4.1) 3.3 ( 2.6- 4.2) ∼ ∼Missouri 4.8 ( 4.0- 5.8) 5.2 ( 4.3- 6.2) ∼ ∼Nebraska 3.6 ( 2.4- 5.2) 3.6 ( 2.4- 5.2) ∼ ∼North Dakota ∼ ∼ ∼ ∼South Dakota ∼ ∼ ∼ ∼
South 4.1 ( 3.9- 4.3) 4.7 ( 4.5- 5.0) 0.6 ( 0.4- 0.9) 0.9 ( 0.6- 1.3)
South Atlantic 4.1 ( 3.9- 4.4) 4.8 ( 4.5- 5.1) 0.5 ( 0.3- 0.8) ∼Delaware 4.6 ( 2.7- 7.2) 5.4 ( 3.3- 8.6) ∼ ∼District of Columbia ∼ ∼ ∼ ∼Florida 4.4 ( 3.9- 4.8) 4.8 ( 4.4- 5.3) ∼ ∼Georgia 3.9 ( 3.2- 4.6) 4.9 ( 4.1- 5.9) ∼ ∼Maryland 3.9 ( 3.1- 4.8) 5.0 ( 4.0- 6.2) ∼ ∼North Carolina 4.0 ( 3.4- 4.8) 4.8 ( 4.0- 5.6) ∼ ∼South Carolina 3.4 ( 2.6- 4.3) 4.3 ( 3.3- 5.6) ∼ ∼Virginia 4.4 ( 3.6- 5.2) 5.2 ( 4.4- 6.3) ∼ ∼West Virginia 4.5 ( 3.2- 6.1) 4.6 ( 3.3- 6.3) ∼ ∼
East South Central 4.1 ( 3.6- 4.6) 4.7 ( 4.2- 5.3) ∼ ∼Alabama 3.3 ( 2.5- 4.2) 4.0 ( 3.0- 5.1) ∼ ∼Kentucky 4.7 ( 3.7- 5.8) 4.9 ( 3.9- 6.1) ∼ ∼Mississippi 3.3 ( 2.3- 4.6) 4.3 ( 3.0- 6.1) ∼ ∼Tennessee 4.7 ( 3.9- 5.6) 5.3 ( 4.4- 6.4) ∼ ∼
West South Central 4.1 ( 3.7- 4.4) 4.6 ( 4.2- 5.0) ∼ 0.8 ( 0.5- 1.4)
Arkansas 4.6 ( 3.5- 6.0) 4.9 ( 3.7- 6.4) ∼ ∼

Cancer Incidence and M
ortality, by U.S. C
ensus Region and D
i�ision, State, and Metropolitan A
rea
���
Table 2.16.1.2M: Melanomas of the Skin. Age-Adjusted Cancer Death Rates∗ and 95% Confidence Intervals,by U.S. Census Region and Division, State, and Race and Ethnicity, United States† (continued)
Males, 2004
Area All Races White Black Hispanic‡§
Louisiana 3.0 ( 2.3- 3.9) 3.8 ( 2.8- 5.0) ∼ ∼Oklahoma 4.1 ( 3.2- 5.2) 4.6 ( 3.6- 5.9) ∼ ∼Texas 4.2 ( 3.8- 4.7) 4.7 ( 4.2- 5.2) ∼ 0.9 ( 0.5- 1.5)
West 4.0 ( 3.7- 4.2) 4.6 ( 4.3- 4.8) ∼ 0.7 ( 0.4- 1.0)
Mountain 3.9 ( 3.5- 4.4) 4.1 ( 3.7- 4.6) ∼ ∼Arizona 4.1 ( 3.3- 4.9) 4.3 ( 3.5- 5.2) ∼ ∼Colorado 4.1 ( 3.1- 5.1) 4.2 ( 3.3- 5.3) ∼ ∼Idaho 4.9 ( 3.3- 7.0) 5.0 ( 3.3- 7.2) ∼ ∼Montana ∼ ∼ ∼ ∼Nevada 4.2 ( 3.0- 5.6) 4.7 ( 3.4- 6.4) ∼ ∼New Mexico 2.7 ( 1.6- 4.0) 2.9 ( 1.8- 4.4) ∼ ∼Utah 4.3 ( 3.0- 6.0) 4.5 ( 3.1- 6.2) ∼ ∼Wyoming ∼ ∼ ∼ ∼
Pacific 4.0 ( 3.7- 4.3) 4.8 ( 4.4- 5.1) ∼ 0.7 ( 0.4- 1.1)
Alaska ∼ ∼ ∼ ∼California 3.9 ( 3.5- 4.2) 4.7 ( 4.3- 5.1) ∼ 0.6 ( 0.4- 1.0)
Hawaii ∼ ∼ ∼ ∼Oregon 4.3 ( 3.4- 5.4) 4.5 ( 3.5- 5.7) ∼ ∼Washington 4.9 ( 4.1- 5.8) 5.3 ( 4.5- 6.3) ∼ ∼
∗ Rates are per 100,000 persons and are age-adjusted to the 2000 U.S. standard population (19 age groups - Census P25-1130).† Data are from the National Vital Statistics System (NVSS).‡ Data for specified racial or ethnic populations other than white and black should be interpreted with caution. See Technical Notes.
§ Hispanic origin is not mutually exclusive from race categories (white, black).
∼ Rates are suppressed if fewer than 16 cases were reported in a specific category (area, race, ethnicity).
Note: U.S. rates are as presented in Table 1.1.1.2M.

United
States Cancer Statistics: 2004 Incid
ence and M
ortality
��0
continued
Table 2.16.1.2F: Melanomas of the Skin. Age-Adjusted Cancer Death Rates∗ and 95% Confidence Intervals,by U.S. Census Region and Division, State, and Race and Ethnicity, United States†
Females, 2004
Area All Races White Black Hispanic‡§
United States 1.7 ( 1.6- 1.8) 1.9 ( 1.9- 2.0) 0.4 ( 0.3- 0.5) 0.5 ( 0.4- 0.6)
Northeast 1.7 ( 1.6- 1.9) 2.0 ( 1.8- 2.2) ∼ ∼New England 1.8 ( 1.5- 2.1) 1.9 ( 1.6- 2.3) ∼ ∼Connecticut 2.1 ( 1.5- 2.8) 2.3 ( 1.7- 3.1) ∼ ∼Maine 1.8 ( 1.0- 3.0) 1.8 ( 1.0- 3.1) ∼ ∼Massachusetts 1.7 ( 1.3- 2.2) 1.8 ( 1.4- 2.3) ∼ ∼New Hampshire 2.3 ( 1.3- 3.7) 2.3 ( 1.4- 3.8) ∼ ∼Rhode Island ∼ ∼ ∼ ∼Vermont ∼ ∼ ∼ ∼
Middle Atlantic 1.7 ( 1.6- 1.9) 2.0 ( 1.8- 2.2) ∼ ∼New Jersey 1.8 ( 1.4- 2.2) 2.0 ( 1.6- 2.5) ∼ ∼New York 1.6 ( 1.4- 1.8) 2.0 ( 1.7- 2.3) ∼ ∼Pennsylvania 1.9 ( 1.6- 2.2) 2.1 ( 1.7- 2.4) ∼ ∼
Midwest 1.8 ( 1.6- 1.9) 1.9 ( 1.8- 2.1) ∼ ∼East North Central 1.7 ( 1.5- 1.8) 1.8 ( 1.7- 2.0) ∼ ∼Illinois 1.8 ( 1.5- 2.2) 2.1 ( 1.7- 2.5) ∼ ∼Indiana 2.1 ( 1.6- 2.6) 2.2 ( 1.7- 2.8) ∼ ∼Michigan 1.4 ( 1.1- 1.7) 1.5 ( 1.2- 1.9) ∼ ∼Ohio 1.7 ( 1.4- 2.0) 1.9 ( 1.5- 2.3) ∼ ∼Wisconsin 1.3 ( 1.0- 1.8) 1.4 ( 1.0- 1.9) ∼ ∼
West North Central 2.0 ( 1.7- 2.3) 2.1 ( 1.8- 2.4) ∼ ∼Iowa 1.8 ( 1.2- 2.6) 1.8 ( 1.2- 2.6) ∼ ∼Kansas 2.2 ( 1.5- 3.1) 2.2 ( 1.5- 3.1) ∼ ∼Minnesota 2.2 ( 1.7- 2.8) 2.3 ( 1.7- 3.0) ∼ ∼Missouri 1.9 ( 1.5- 2.5) 2.1 ( 1.6- 2.7) ∼ ∼Nebraska 2.3 ( 1.4- 3.5) 2.4 ( 1.5- 3.7) ∼ ∼North Dakota ∼ ∼ ∼ ∼South Dakota ∼ ∼ ∼ ∼
South 1.6 ( 1.5- 1.7) 1.9 ( 1.8- 2.0) 0.5 ( 0.4- 0.7) 0.6 ( 0.4- 0.8)
South Atlantic 1.7 ( 1.6- 1.9) 2.0 ( 1.9- 2.2) 0.4 ( 0.3- 0.7) ∼Delaware ∼ ∼ ∼ ∼District of Columbia ∼ ∼ ∼ ∼Florida 1.9 ( 1.6- 2.1) 2.1 ( 1.8- 2.4) ∼ ∼Georgia 1.7 ( 1.3- 2.1) 2.2 ( 1.7- 2.7) ∼ ∼Maryland 1.8 ( 1.3- 2.3) 2.4 ( 1.8- 3.1) ∼ ∼North Carolina 1.7 ( 1.3- 2.1) 2.0 ( 1.6- 2.5) ∼ ∼South Carolina 1.7 ( 1.2- 2.3) 2.1 ( 1.5- 3.0) ∼ ∼Virginia 1.6 ( 1.2- 2.0) 1.9 ( 1.5- 2.5) ∼ ∼West Virginia 1.4 ( 0.8- 2.2) 1.4 ( 0.8- 2.3) ∼ ∼
East South Central 1.6 ( 1.4- 1.9) 1.9 ( 1.6- 2.2) ∼ ∼Alabama 1.5 ( 1.0- 2.0) 1.7 ( 1.1- 2.3) ∼ ∼Kentucky 1.9 ( 1.4- 2.5) 2.0 ( 1.5- 2.7) ∼ ∼Mississippi 1.2 ( 0.7- 1.9) 1.6 ( 1.0- 2.6) ∼ ∼Tennessee 1.8 ( 1.4- 2.3) 2.0 ( 1.5- 2.6) ∼ ∼
West South Central 1.5 ( 1.3- 1.7) 1.7 ( 1.5- 1.9) ∼ ∼Arkansas 1.0 ( 0.6- 1.7) 1.2 ( 0.7- 1.9) ∼ ∼

Cancer Incidence and M
ortality, by U.S. C
ensus Region and D
i�ision, State, and Metropolitan A
rea
���
Table 2.16.1.2F: Melanomas of the Skin. Age-Adjusted Cancer Death Rates∗ and 95% Confidence Intervals,by U.S. Census Region and Division, State, and Race and Ethnicity, United States† (continued)
Females, 2004
Area All Races White Black Hispanic‡§
Louisiana 1.1 ( 0.7- 1.6) 1.4 ( 0.9- 2.1) ∼ ∼Oklahoma 2.0 ( 1.4- 2.7) 2.2 ( 1.5- 3.0) ∼ ∼Texas 1.6 ( 1.4- 1.9) 1.7 ( 1.5- 2.0) ∼ ∼
West 1.7 ( 1.6- 1.8) 2.0 ( 1.8- 2.2) ∼ 0.3 ( 0.2- 0.5)
Mountain 2.0 ( 1.7- 2.3) 2.2 ( 1.9- 2.5) ∼ ∼Arizona 1.6 ( 1.2- 2.1) 1.8 ( 1.3- 2.3) ∼ ∼Colorado 2.3 ( 1.7- 3.0) 2.4 ( 1.8- 3.2) ∼ ∼Idaho 2.2 ( 1.3- 3.6) 2.3 ( 1.3- 3.7) ∼ ∼Montana ∼ ∼ ∼ ∼Nevada 1.8 ( 1.1- 2.8) 2.1 ( 1.3- 3.3) ∼ ∼New Mexico 2.0 ( 1.2- 3.0) 2.2 ( 1.4- 3.4) ∼ ∼Utah 1.8 ( 1.1- 2.8) 1.9 ( 1.1- 2.9) ∼ ∼Wyoming ∼ ∼ ∼ ∼
Pacific 1.6 ( 1.4- 1.7) 1.9 ( 1.7- 2.1) ∼ ∼Alaska ∼ ∼ ∼ ∼California 1.5 ( 1.3- 1.7) 1.8 ( 1.6- 2.1) ∼ ∼Hawaii ∼ ∼ ∼ ∼Oregon 2.2 ( 1.6- 3.0) 2.3 ( 1.7- 3.1) ∼ ∼Washington 1.9 ( 1.4- 2.4) 2.0 ( 1.5- 2.6) ∼ ∼
∗ Rates are per 100,000 persons and are age-adjusted to the 2000 U.S. standard population (19 age groups - Census P25-1130).† Data are from the National Vital Statistics System (NVSS).‡ Data for specified racial or ethnic populations other than white and black should be interpreted with caution. See Technical Notes.
§ Hispanic origin is not mutually exclusive from race categories (white, black).
∼ Rates are suppressed if fewer than 16 cases were reported in a specific category (area, race, ethnicity).
Note: U.S. rates are as presented in Table 1.1.1.2F.
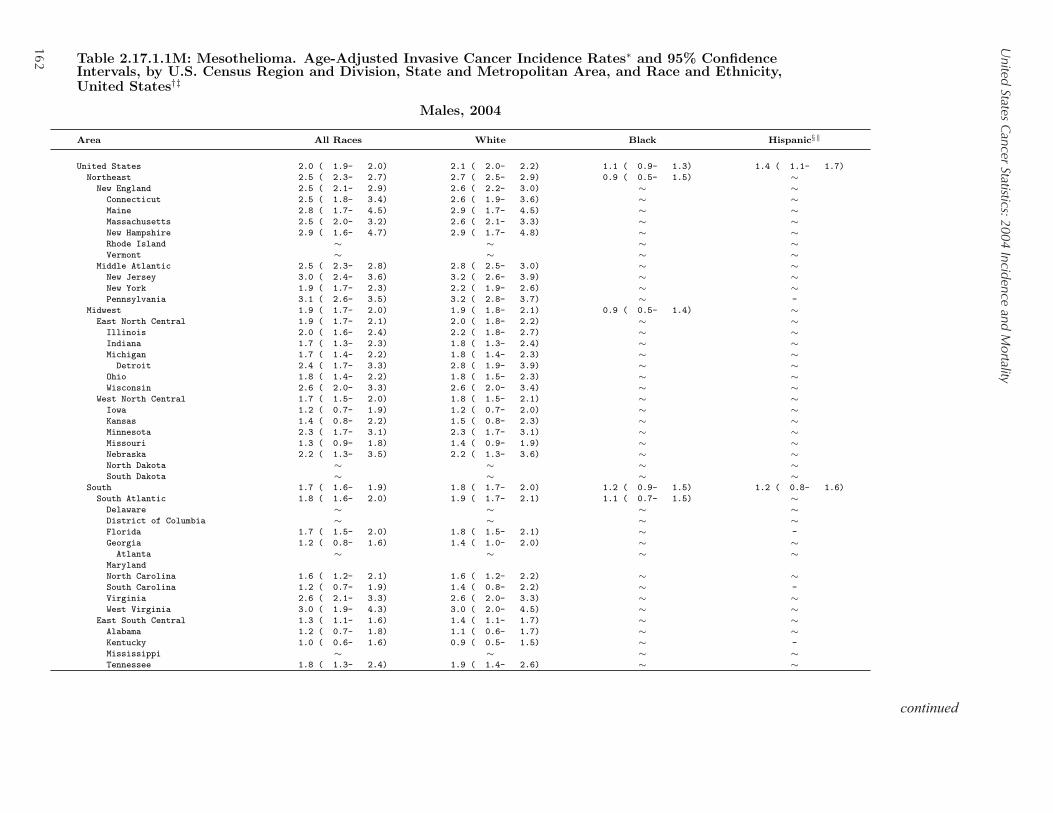
United
States Cancer Statistics: 2004 Incid
ence and M
ortality
���
continued
Table 2.17.1.1M: Mesothelioma. Age-Adjusted Invasive Cancer Incidence Rates∗ and 95% ConfidenceIntervals, by U.S. Census Region and Division, State and Metropolitan Area, and Race and Ethnicity,United States†‡
Males, 2004
Area All Races White Black Hispanic§
United States 2.0 ( 1.9- 2.0) 2.1 ( 2.0- 2.2) 1.1 ( 0.9- 1.3) 1.4 ( 1.1- 1.7)
Northeast 2.5 ( 2.3- 2.7) 2.7 ( 2.5- 2.9) 0.9 ( 0.5- 1.5) ∼New England 2.5 ( 2.1- 2.9) 2.6 ( 2.2- 3.0) ∼ ∼Connecticut 2.5 ( 1.8- 3.4) 2.6 ( 1.9- 3.6) ∼ ∼Maine 2.8 ( 1.7- 4.5) 2.9 ( 1.7- 4.5) ∼ ∼Massachusetts 2.5 ( 2.0- 3.2) 2.6 ( 2.1- 3.3) ∼ ∼New Hampshire 2.9 ( 1.6- 4.7) 2.9 ( 1.7- 4.8) ∼ ∼Rhode Island ∼ ∼ ∼ ∼Vermont ∼ ∼ ∼ ∼
Middle Atlantic 2.5 ( 2.3- 2.8) 2.8 ( 2.5- 3.0) ∼ ∼New Jersey 3.0 ( 2.4- 3.6) 3.2 ( 2.6- 3.9) ∼ ∼New York 1.9 ( 1.7- 2.3) 2.2 ( 1.9- 2.6) ∼ ∼Pennsylvania 3.1 ( 2.6- 3.5) 3.2 ( 2.8- 3.7) ∼ -
Midwest 1.9 ( 1.7- 2.0) 1.9 ( 1.8- 2.1) 0.9 ( 0.5- 1.4) ∼East North Central 1.9 ( 1.7- 2.1) 2.0 ( 1.8- 2.2) ∼ ∼Illinois 2.0 ( 1.6- 2.4) 2.2 ( 1.8- 2.7) ∼ ∼Indiana 1.7 ( 1.3- 2.3) 1.8 ( 1.3- 2.4) ∼ ∼Michigan 1.7 ( 1.4- 2.2) 1.8 ( 1.4- 2.3) ∼ ∼
Detroit 2.4 ( 1.7- 3.3) 2.8 ( 1.9- 3.9) ∼ ∼Ohio 1.8 ( 1.4- 2.2) 1.8 ( 1.5- 2.3) ∼ ∼Wisconsin 2.6 ( 2.0- 3.3) 2.6 ( 2.0- 3.4) ∼ ∼
West North Central 1.7 ( 1.5- 2.0) 1.8 ( 1.5- 2.1) ∼ ∼Iowa 1.2 ( 0.7- 1.9) 1.2 ( 0.7- 2.0) ∼ ∼Kansas 1.4 ( 0.8- 2.2) 1.5 ( 0.8- 2.3) ∼ ∼Minnesota 2.3 ( 1.7- 3.1) 2.3 ( 1.7- 3.1) ∼ ∼Missouri 1.3 ( 0.9- 1.8) 1.4 ( 0.9- 1.9) ∼ ∼Nebraska 2.2 ( 1.3- 3.5) 2.2 ( 1.3- 3.6) ∼ ∼North Dakota ∼ ∼ ∼ ∼South Dakota ∼ ∼ ∼ ∼
South 1.7 ( 1.6- 1.9) 1.8 ( 1.7- 2.0) 1.2 ( 0.9- 1.5) 1.2 ( 0.8- 1.6)
South Atlantic 1.8 ( 1.6- 2.0) 1.9 ( 1.7- 2.1) 1.1 ( 0.7- 1.5) ∼Delaware ∼ ∼ ∼ ∼District of Columbia ∼ ∼ ∼ ∼Florida 1.7 ( 1.5- 2.0) 1.8 ( 1.5- 2.1) ∼ -
Georgia 1.2 ( 0.8- 1.6) 1.4 ( 1.0- 2.0) ∼ ∼Atlanta ∼ ∼ ∼ ∼
Maryland
North Carolina 1.6 ( 1.2- 2.1) 1.6 ( 1.2- 2.2) ∼ ∼South Carolina 1.2 ( 0.7- 1.9) 1.4 ( 0.8- 2.2) ∼ -
Virginia 2.6 ( 2.1- 3.3) 2.6 ( 2.0- 3.3) ∼ ∼West Virginia 3.0 ( 1.9- 4.3) 3.0 ( 2.0- 4.5) ∼ ∼
East South Central 1.3 ( 1.1- 1.6) 1.4 ( 1.1- 1.7) ∼ ∼Alabama 1.2 ( 0.7- 1.8) 1.1 ( 0.6- 1.7) ∼ ∼Kentucky 1.0 ( 0.6- 1.6) 0.9 ( 0.5- 1.5) ∼ -
Mississippi ∼ ∼ ∼ ∼Tennessee 1.8 ( 1.3- 2.4) 1.9 ( 1.4- 2.6) ∼ ∼

Cancer Incidence and M
ortality, by U.S. C
ensus Region and D
i�ision, State, and Metropolitan A
rea
��3
Table 2.17.1.1M: Mesothelioma. Age-Adjusted Invasive Cancer Incidence Rates∗ and 95% ConfidenceIntervals, by U.S. Census Region and Division, State and Metropolitan Area, and Race and Ethnicity,United States†‡ (continued)
Males, 2004
Area All Races White Black Hispanic§
West South Central 1.9 ( 1.7- 2.2) 2.0 ( 1.7- 2.3) 1.6 ( 1.0- 2.5) 1.5 ( 0.9- 2.2)
Arkansas 1.6 ( 1.0- 2.5) 1.7 ( 1.0- 2.6) ∼ ∼Louisiana 2.8 ( 2.0- 3.7) 2.9 ( 2.1- 4.0) ∼ ∼Oklahoma 1.4 ( 0.8- 2.1) 1.3 ( 0.8- 2.1) ∼ ∼Texas 1.9 ( 1.6- 2.2) 2.0 ( 1.7- 2.3) ∼ 1.5 ( 1.0- 2.3)
West 1.8 ( 1.7- 2.0) 2.0 ( 1.8- 2.2) ∼ 1.7 ( 1.3- 2.2)
Mountain 1.7 ( 1.4- 2.0) 1.7 ( 1.4- 2.0) ∼ 2.0 ( 1.1- 3.2)
Arizona 1.8 ( 1.3- 2.4) 1.8 ( 1.3- 2.5) ∼ ∼Colorado 1.5 ( 0.9- 2.2) 1.5 ( 0.9- 2.2) ∼ ∼Idaho ∼ ∼ ∼ ∼Montana ∼ ∼ ∼ ∼Nevada ∼ ∼ ∼ ∼New Mexico ∼ ∼ ∼ ∼Utah ∼ ∼ ∼ ∼Wyoming ∼ ∼ ∼ ∼
Pacific 1.9 ( 1.7- 2.1) 2.1 ( 1.9- 2.4) ∼ 1.6 ( 1.1- 2.2)
Alaska ∼ ∼ ∼ ∼California 1.9 ( 1.7- 2.2) 2.2 ( 1.9- 2.5) ∼ 1.6 ( 1.1- 2.3)
San Francisco-Oakland 2.1 ( 1.5- 3.0) 2.8 ( 1.9- 3.9) ∼ ∼San Jose-Monterey 1.8 ( 1.0- 2.9) 2.3 ( 1.3- 3.8) ∼ ∼Los Angeles 1.6 ( 1.2- 2.1) 1.8 ( 1.3- 2.4) ∼ ∼
Hawaii ∼ ∼ ∼ ∼Oregon 1.6 ( 1.0- 2.3) 1.6 ( 1.0- 2.3) ∼ ∼Washington 2.4 ( 1.8- 3.1) 2.5 ( 1.9- 3.2) ∼ ∼
Seattle-Puget Sound 2.7 ( 2.0- 3.6) 2.8 ( 2.1- 3.8) ∼ ∼∗ Rates are per 100,000 persons and are age-adjusted to the 2000 U.S. standard population (19 age groups - Census P25-1130).† Data are from all state and metropolitan area cancer registries, except Maryland. Included data cover approximately 98% of the population and met data
quality criteria for all invasive cancer sites combined. See Appendix B for registry-specific data quality information.‡ Invasive cancers only.
§ Data for specified racial or ethnic populations other than white and black should be interpreted with caution. See Technical Notes.
Hispanic origin is not mutually exclusive from race categories (white, black).
∼ Rates are suppressed if fewer than 16 cases were reported in a specific category (area, race, ethnicity).
- Rates are suppressed at the state’s or metropolitan area’s request. See Technical Notes.
Notes: Cases from suppressed rates are included in the U.S. and region/division rates. U.S. rates are as presented in Table 1.1.1.1M. Michigan, Georgia,
California, and Washington state rates each include cases from the SEER metropolitan areas.

United
States Cancer Statistics: 2004 Incid
ence and M
ortality
���
continued
Table 2.17.1.1F: Mesothelioma. Age-Adjusted Invasive Cancer Incidence Rates∗ and 95% ConfidenceIntervals, by U.S. Census Region and Division, State and Metropolitan Area, and Race and Ethnicity,United States†‡
Females, 2004
Area All Races White Black Hispanic§
United States 0.4 ( 0.4- 0.4) 0.4 ( 0.4- 0.5) 0.2 ( 0.2- 0.3) 0.4 ( 0.3- 0.5)
Northeast 0.5 ( 0.4- 0.5) 0.5 ( 0.4- 0.6) ∼ ∼New England 0.4 ( 0.3- 0.6) 0.4 ( 0.3- 0.6) ∼ ∼Connecticut ∼ ∼ ∼ ∼Maine ∼ ∼ ∼ ∼Massachusetts ∼ ∼ ∼ ∼New Hampshire ∼ ∼ ∼ ∼Rhode Island ∼ ∼ ∼ ∼Vermont ∼ ∼ ∼ ∼
Middle Atlantic 0.5 ( 0.4- 0.6) 0.5 ( 0.4- 0.6) ∼ ∼New Jersey 0.5 ( 0.3- 0.7) 0.5 ( 0.3- 0.7) ∼ ∼New York 0.4 ( 0.3- 0.6) 0.5 ( 0.3- 0.6) ∼ ∼Pennsylvania 0.5 ( 0.4- 0.7) 0.6 ( 0.4- 0.8) ∼ -
Midwest 0.5 ( 0.4- 0.5) 0.5 ( 0.4- 0.5) ∼ ∼East North Central 0.5 ( 0.4- 0.5) 0.5 ( 0.4- 0.6) ∼ ∼Illinois 0.5 ( 0.4- 0.7) 0.5 ( 0.4- 0.8) ∼ ∼Indiana 0.5 ( 0.3- 0.8) 0.5 ( 0.3- 0.9) ∼ ∼Michigan 0.4 ( 0.3- 0.7) 0.5 ( 0.3- 0.7) ∼ ∼
Detroit ∼ ∼ ∼ ∼Ohio 0.3 ( 0.2- 0.4) 0.3 ( 0.2- 0.5) ∼ ∼Wisconsin 0.6 ( 0.4- 1.0) 0.6 ( 0.4- 1.0) ∼ ∼
West North Central 0.5 ( 0.4- 0.6) 0.5 ( 0.3- 0.6) ∼ ∼Iowa ∼ ∼ ∼ ∼Kansas ∼ ∼ ∼ ∼Minnesota 0.6 ( 0.3- 1.0) 0.6 ( 0.4- 1.0) ∼ ∼Missouri ∼ ∼ ∼ ∼Nebraska ∼ ∼ ∼ ∼North Dakota ∼ ∼ ∼ ∼South Dakota ∼ ∼ ∼ ∼
South 0.3 ( 0.3- 0.4) 0.4 ( 0.3- 0.4) 0.2 ( 0.1- 0.3) ∼South Atlantic 0.3 ( 0.3- 0.4) 0.4 ( 0.3- 0.5) ∼ ∼Delaware ∼ ∼ ∼ ∼District of Columbia ∼ ∼ ∼ ∼Florida 0.3 ( 0.2- 0.5) 0.4 ( 0.3- 0.5) ∼ -
Georgia ∼ ∼ ∼ ∼Atlanta ∼ ∼ ∼ ∼
Maryland
North Carolina 0.3 ( 0.2- 0.6) ∼ ∼ ∼South Carolina ∼ ∼ ∼ -
Virginia ∼ ∼ ∼ ∼West Virginia ∼ ∼ ∼ ∼
East South Central 0.3 ( 0.2- 0.5) 0.4 ( 0.2- 0.5) ∼ ∼Alabama ∼ ∼ ∼ ∼Kentucky ∼ ∼ ∼ -
Mississippi ∼ ∼ ∼ ∼Tennessee ∼ ∼ ∼ ∼

Cancer Incidence and M
ortality, by U.S. C
ensus Region and D
i�ision, State, and Metropolitan A
rea
���
Table 2.17.1.1F: Mesothelioma. Age-Adjusted Invasive Cancer Incidence Rates∗ and 95% ConfidenceIntervals, by U.S. Census Region and Division, State and Metropolitan Area, and Race and Ethnicity,United States†‡ (continued)
Females, 2004
Area All Races White Black Hispanic§
West South Central 0.4 ( 0.3- 0.5) 0.4 ( 0.3- 0.5) ∼ ∼Arkansas ∼ ∼ ∼ ∼Louisiana ∼ ∼ ∼ ∼Oklahoma ∼ ∼ ∼ ∼Texas 0.3 ( 0.2- 0.5) 0.4 ( 0.3- 0.5) ∼ ∼
West 0.4 ( 0.3- 0.4) 0.4 ( 0.3- 0.5) ∼ 0.4 ( 0.2- 0.7)
Mountain 0.4 ( 0.2- 0.5) 0.4 ( 0.2- 0.5) ∼ ∼Arizona ∼ ∼ ∼ ∼Colorado ∼ ∼ ∼ ∼Idaho ∼ ∼ ∼ ∼Montana ∼ ∼ ∼ ∼Nevada ∼ ∼ ∼ ∼New Mexico ∼ ∼ ∼ ∼Utah ∼ ∼ ∼ ∼Wyoming ∼ ∼ ∼ ∼
Pacific 0.4 ( 0.3- 0.4) 0.4 ( 0.3- 0.5) ∼ ∼Alaska ∼ ∼ ∼ ∼California 0.3 ( 0.2- 0.4) 0.4 ( 0.3- 0.5) ∼ ∼
San Francisco-Oakland ∼ ∼ ∼ ∼San Jose-Monterey ∼ ∼ ∼ ∼Los Angeles ∼ ∼ ∼ ∼
Hawaii ∼ ∼ ∼ ∼Oregon ∼ ∼ ∼ ∼Washington 0.7 ( 0.5- 1.1) 0.7 ( 0.5- 1.1) ∼ ∼Seattle-Puget Sound 0.8 ( 0.5- 1.3) 0.8 ( 0.5- 1.4) ∼ ∼
∗ Rates are per 100,000 persons and are age-adjusted to the 2000 U.S. standard population (19 age groups - Census P25-1130).† Data are from all state and metropolitan area cancer registries, except Maryland. Included data cover approximately 98% of the population and met data
quality criteria for all invasive cancer sites combined. See Appendix B for registry-specific data quality information.‡ Invasive cancers only.
§ Data for specified racial or ethnic populations other than white and black should be interpreted with caution. See Technical Notes.
Hispanic origin is not mutually exclusive from race categories (white, black).
∼ Rates are suppressed if fewer than 16 cases were reported in a specific category (area, race, ethnicity).
- Rates are suppressed at the state’s or metropolitan area’s request. See Technical Notes.
Notes: Cases from suppressed rates are included in the U.S. and region/division rates. U.S. rates are as presented in Table 1.1.1.1F. Michigan, Georgia,
California, and Washington state rates each include cases from the SEER metropolitan areas.
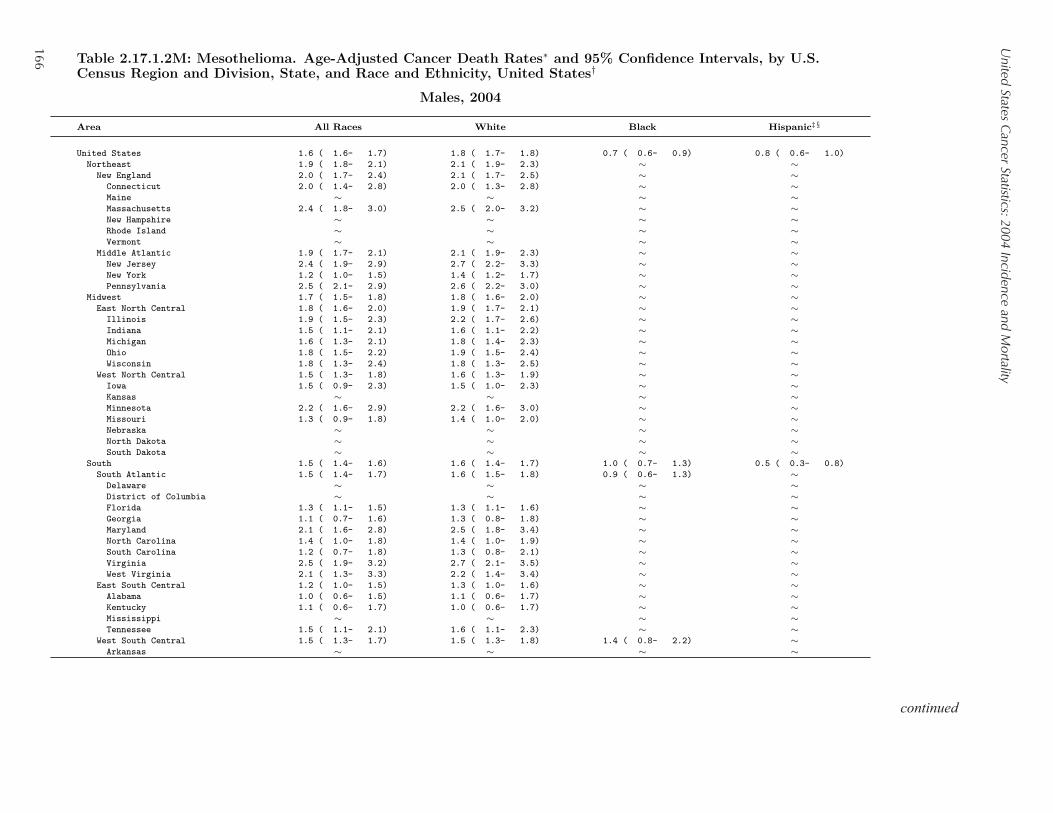
United
States Cancer Statistics: 2004 Incid
ence and M
ortality
���
continued
Table 2.17.1.2M: Mesothelioma. Age-Adjusted Cancer Death Rates∗ and 95% Confidence Intervals, by U.S.Census Region and Division, State, and Race and Ethnicity, United States†
Males, 2004
Area All Races White Black Hispanic‡§
United States 1.6 ( 1.6- 1.7) 1.8 ( 1.7- 1.8) 0.7 ( 0.6- 0.9) 0.8 ( 0.6- 1.0)
Northeast 1.9 ( 1.8- 2.1) 2.1 ( 1.9- 2.3) ∼ ∼New England 2.0 ( 1.7- 2.4) 2.1 ( 1.7- 2.5) ∼ ∼Connecticut 2.0 ( 1.4- 2.8) 2.0 ( 1.3- 2.8) ∼ ∼Maine ∼ ∼ ∼ ∼Massachusetts 2.4 ( 1.8- 3.0) 2.5 ( 2.0- 3.2) ∼ ∼New Hampshire ∼ ∼ ∼ ∼Rhode Island ∼ ∼ ∼ ∼Vermont ∼ ∼ ∼ ∼
Middle Atlantic 1.9 ( 1.7- 2.1) 2.1 ( 1.9- 2.3) ∼ ∼New Jersey 2.4 ( 1.9- 2.9) 2.7 ( 2.2- 3.3) ∼ ∼New York 1.2 ( 1.0- 1.5) 1.4 ( 1.2- 1.7) ∼ ∼Pennsylvania 2.5 ( 2.1- 2.9) 2.6 ( 2.2- 3.0) ∼ ∼
Midwest 1.7 ( 1.5- 1.8) 1.8 ( 1.6- 2.0) ∼ ∼East North Central 1.8 ( 1.6- 2.0) 1.9 ( 1.7- 2.1) ∼ ∼Illinois 1.9 ( 1.5- 2.3) 2.2 ( 1.7- 2.6) ∼ ∼Indiana 1.5 ( 1.1- 2.1) 1.6 ( 1.1- 2.2) ∼ ∼Michigan 1.6 ( 1.3- 2.1) 1.8 ( 1.4- 2.3) ∼ ∼Ohio 1.8 ( 1.5- 2.2) 1.9 ( 1.5- 2.4) ∼ ∼Wisconsin 1.8 ( 1.3- 2.4) 1.8 ( 1.3- 2.5) ∼ ∼
West North Central 1.5 ( 1.3- 1.8) 1.6 ( 1.3- 1.9) ∼ ∼Iowa 1.5 ( 0.9- 2.3) 1.5 ( 1.0- 2.3) ∼ ∼Kansas ∼ ∼ ∼ ∼Minnesota 2.2 ( 1.6- 2.9) 2.2 ( 1.6- 3.0) ∼ ∼Missouri 1.3 ( 0.9- 1.8) 1.4 ( 1.0- 2.0) ∼ ∼Nebraska ∼ ∼ ∼ ∼North Dakota ∼ ∼ ∼ ∼South Dakota ∼ ∼ ∼ ∼
South 1.5 ( 1.4- 1.6) 1.6 ( 1.4- 1.7) 1.0 ( 0.7- 1.3) 0.5 ( 0.3- 0.8)
South Atlantic 1.5 ( 1.4- 1.7) 1.6 ( 1.5- 1.8) 0.9 ( 0.6- 1.3) ∼Delaware ∼ ∼ ∼ ∼District of Columbia ∼ ∼ ∼ ∼Florida 1.3 ( 1.1- 1.5) 1.3 ( 1.1- 1.6) ∼ ∼Georgia 1.1 ( 0.7- 1.6) 1.3 ( 0.8- 1.8) ∼ ∼Maryland 2.1 ( 1.6- 2.8) 2.5 ( 1.8- 3.4) ∼ ∼North Carolina 1.4 ( 1.0- 1.8) 1.4 ( 1.0- 1.9) ∼ ∼South Carolina 1.2 ( 0.7- 1.8) 1.3 ( 0.8- 2.1) ∼ ∼Virginia 2.5 ( 1.9- 3.2) 2.7 ( 2.1- 3.5) ∼ ∼West Virginia 2.1 ( 1.3- 3.3) 2.2 ( 1.4- 3.4) ∼ ∼
East South Central 1.2 ( 1.0- 1.5) 1.3 ( 1.0- 1.6) ∼ ∼Alabama 1.0 ( 0.6- 1.5) 1.1 ( 0.6- 1.7) ∼ ∼Kentucky 1.1 ( 0.6- 1.7) 1.0 ( 0.6- 1.7) ∼ ∼Mississippi ∼ ∼ ∼ ∼Tennessee 1.5 ( 1.1- 2.1) 1.6 ( 1.1- 2.3) ∼ ∼
West South Central 1.5 ( 1.3- 1.7) 1.5 ( 1.3- 1.8) 1.4 ( 0.8- 2.2) ∼Arkansas ∼ ∼ ∼ ∼

Cancer Incidence and M
ortality, by U.S. C
ensus Region and D
i�ision, State, and Metropolitan A
rea
���
Table 2.17.1.2M: Mesothelioma. Age-Adjusted Cancer Death Rates∗ and 95% Confidence Intervals, by U.S.Census Region and Division, State, and Race and Ethnicity, United States† (continued)
Males, 2004
Area All Races White Black Hispanic‡§
Louisiana 2.3 ( 1.6- 3.1) 2.5 ( 1.7- 3.6) ∼ ∼Oklahoma 1.1 ( 0.7- 1.8) 1.2 ( 0.7- 1.9) ∼ ∼Texas 1.5 ( 1.2- 1.8) 1.5 ( 1.2- 1.8) ∼ ∼
West 1.6 ( 1.4- 1.7) 1.8 ( 1.6- 1.9) ∼ 1.2 ( 0.8- 1.6)
Mountain 1.4 ( 1.2- 1.7) 1.5 ( 1.2- 1.8) ∼ ∼Arizona 1.1 ( 0.7- 1.6) 1.2 ( 0.8- 1.7) ∼ ∼Colorado 1.5 ( 0.9- 2.2) 1.5 ( 1.0- 2.3) ∼ ∼Idaho ∼ ∼ ∼ ∼Montana ∼ ∼ ∼ ∼Nevada ∼ ∼ ∼ ∼New Mexico ∼ ∼ ∼ ∼Utah ∼ ∼ ∼ ∼Wyoming ∼ ∼ ∼ ∼
Pacific 1.6 ( 1.4- 1.8) 1.9 ( 1.7- 2.1) ∼ 1.1 ( 0.7- 1.6)
Alaska ∼ ∼ ∼ ∼California 1.4 ( 1.2- 1.6) 1.7 ( 1.4- 1.9) ∼ 1.1 ( 0.7- 1.6)
Hawaii ∼ ∼ ∼ ∼Oregon 2.1 ( 1.5- 3.0) 2.2 ( 1.5- 3.1) ∼ ∼Washington 2.5 ( 1.9- 3.2) 2.6 ( 2.0- 3.4) ∼ ∼
∗ Rates are per 100,000 persons and are age-adjusted to the 2000 U.S. standard population (19 age groups - Census P25-1130).† Data are from the National Vital Statistics System (NVSS).‡ Data for specified racial or ethnic populations other than white and black should be interpreted with caution. See Technical Notes.
§ Hispanic origin is not mutually exclusive from race categories (white, black).
∼ Rates are suppressed if fewer than 16 cases were reported in a specific category (area, race, ethnicity).
Note: U.S. rates are as presented in Table 1.1.1.2M.
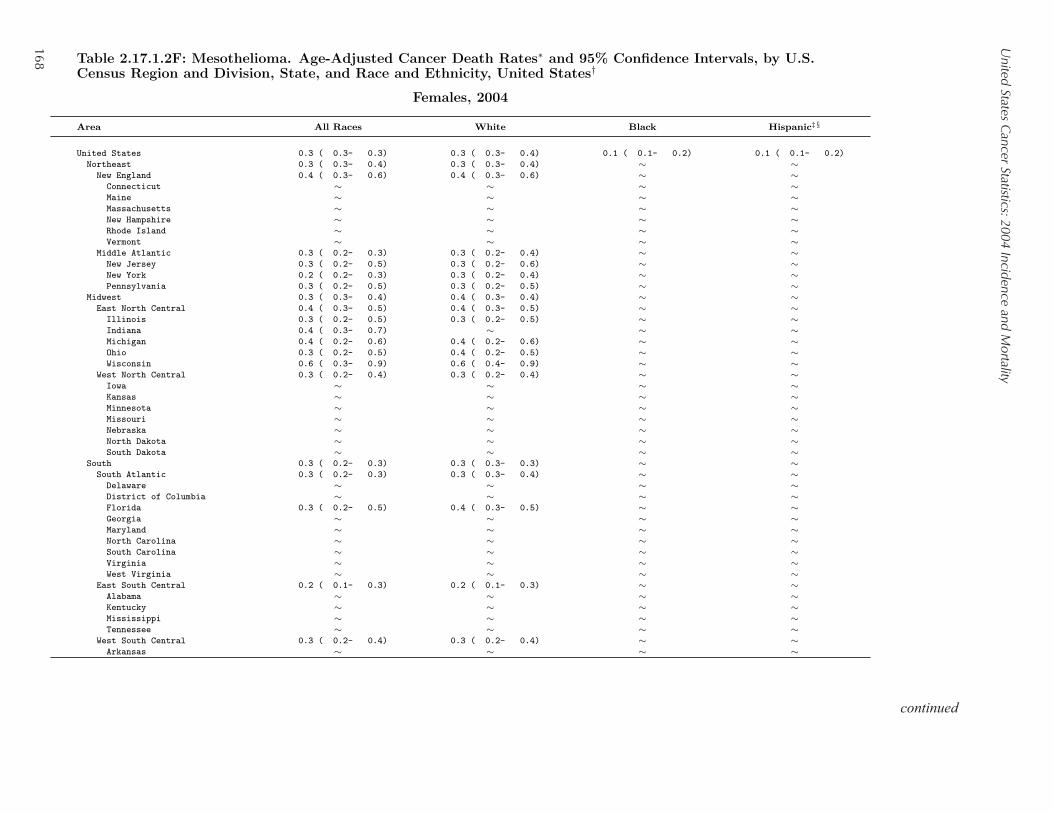
United
States Cancer Statistics: 2004 Incid
ence and M
ortality
���
continued
Table 2.17.1.2F: Mesothelioma. Age-Adjusted Cancer Death Rates∗ and 95% Confidence Intervals, by U.S.Census Region and Division, State, and Race and Ethnicity, United States†
Females, 2004
Area All Races White Black Hispanic‡§
United States 0.3 ( 0.3- 0.3) 0.3 ( 0.3- 0.4) 0.1 ( 0.1- 0.2) 0.1 ( 0.1- 0.2)
Northeast 0.3 ( 0.3- 0.4) 0.3 ( 0.3- 0.4) ∼ ∼New England 0.4 ( 0.3- 0.6) 0.4 ( 0.3- 0.6) ∼ ∼Connecticut ∼ ∼ ∼ ∼Maine ∼ ∼ ∼ ∼Massachusetts ∼ ∼ ∼ ∼New Hampshire ∼ ∼ ∼ ∼Rhode Island ∼ ∼ ∼ ∼Vermont ∼ ∼ ∼ ∼
Middle Atlantic 0.3 ( 0.2- 0.3) 0.3 ( 0.2- 0.4) ∼ ∼New Jersey 0.3 ( 0.2- 0.5) 0.3 ( 0.2- 0.6) ∼ ∼New York 0.2 ( 0.2- 0.3) 0.3 ( 0.2- 0.4) ∼ ∼Pennsylvania 0.3 ( 0.2- 0.5) 0.3 ( 0.2- 0.5) ∼ ∼
Midwest 0.3 ( 0.3- 0.4) 0.4 ( 0.3- 0.4) ∼ ∼East North Central 0.4 ( 0.3- 0.5) 0.4 ( 0.3- 0.5) ∼ ∼Illinois 0.3 ( 0.2- 0.5) 0.3 ( 0.2- 0.5) ∼ ∼Indiana 0.4 ( 0.3- 0.7) ∼ ∼ ∼Michigan 0.4 ( 0.2- 0.6) 0.4 ( 0.2- 0.6) ∼ ∼Ohio 0.3 ( 0.2- 0.5) 0.4 ( 0.2- 0.5) ∼ ∼Wisconsin 0.6 ( 0.3- 0.9) 0.6 ( 0.4- 0.9) ∼ ∼
West North Central 0.3 ( 0.2- 0.4) 0.3 ( 0.2- 0.4) ∼ ∼Iowa ∼ ∼ ∼ ∼Kansas ∼ ∼ ∼ ∼Minnesota ∼ ∼ ∼ ∼Missouri ∼ ∼ ∼ ∼Nebraska ∼ ∼ ∼ ∼North Dakota ∼ ∼ ∼ ∼South Dakota ∼ ∼ ∼ ∼
South 0.3 ( 0.2- 0.3) 0.3 ( 0.3- 0.3) ∼ ∼South Atlantic 0.3 ( 0.2- 0.3) 0.3 ( 0.3- 0.4) ∼ ∼Delaware ∼ ∼ ∼ ∼District of Columbia ∼ ∼ ∼ ∼Florida 0.3 ( 0.2- 0.5) 0.4 ( 0.3- 0.5) ∼ ∼Georgia ∼ ∼ ∼ ∼Maryland ∼ ∼ ∼ ∼North Carolina ∼ ∼ ∼ ∼South Carolina ∼ ∼ ∼ ∼Virginia ∼ ∼ ∼ ∼West Virginia ∼ ∼ ∼ ∼
East South Central 0.2 ( 0.1- 0.3) 0.2 ( 0.1- 0.3) ∼ ∼Alabama ∼ ∼ ∼ ∼Kentucky ∼ ∼ ∼ ∼Mississippi ∼ ∼ ∼ ∼Tennessee ∼ ∼ ∼ ∼
West South Central 0.3 ( 0.2- 0.4) 0.3 ( 0.2- 0.4) ∼ ∼Arkansas ∼ ∼ ∼ ∼

Cancer Incidence and M
ortality, by U.S. C
ensus Region and D
i�ision, State, and Metropolitan A
rea
���
Table 2.17.1.2F: Mesothelioma. Age-Adjusted Cancer Death Rates∗ and 95% Confidence Intervals, by U.S.Census Region and Division, State, and Race and Ethnicity, United States† (continued)
Females, 2004
Area All Races White Black Hispanic‡§
Louisiana ∼ ∼ ∼ ∼Oklahoma ∼ ∼ ∼ ∼Texas 0.3 ( 0.2- 0.4) 0.3 ( 0.2- 0.4) ∼ ∼
West 0.3 ( 0.2- 0.3) 0.3 ( 0.2- 0.3) ∼ ∼Mountain 0.2 ( 0.1- 0.3) 0.2 ( 0.1- 0.3) ∼ ∼Arizona ∼ ∼ ∼ ∼Colorado ∼ ∼ ∼ ∼Idaho ∼ ∼ ∼ ∼Montana ∼ ∼ ∼ ∼Nevada ∼ ∼ ∼ ∼New Mexico ∼ ∼ ∼ ∼Utah ∼ ∼ ∼ ∼Wyoming ∼ ∼ ∼ ∼
Pacific 0.3 ( 0.2- 0.3) 0.3 ( 0.2- 0.4) ∼ ∼Alaska ∼ ∼ ∼ ∼California 0.2 ( 0.2- 0.3) 0.3 ( 0.2- 0.4) ∼ ∼Hawaii ∼ ∼ ∼ ∼Oregon ∼ ∼ ∼ ∼Washington 0.5 ( 0.3- 0.8) ∼ ∼ ∼
∗ Rates are per 100,000 persons and are age-adjusted to the 2000 U.S. standard population (19 age groups - Census P25-1130).† Data are from the National Vital Statistics System (NVSS).‡ Data for specified racial or ethnic populations other than white and black should be interpreted with caution. See Technical Notes.
§ Hispanic origin is not mutually exclusive from race categories (white, black).
∼ Rates are suppressed if fewer than 16 cases were reported in a specific category (area, race, ethnicity).
Note: U.S. rates are as presented in Table 1.1.1.2F.

United
States Cancer Statistics: 2004 Incid
ence and M
ortality
��0
continued
Table 2.18.1.1M: Myeloma. Age-Adjusted Cancer Incidence Rates∗ and 95% Confidence Intervals, by U.S.Census Region and Division, State and Metropolitan Area, and Race and Ethnicity, United States†‡
Males, 2004
Area All Races White Black Hispanic§
United States 6.8 ( 6.6- 6.9) 6.2 ( 6.0- 6.3) 13.1 ( 12.4- 13.8) 6.4 ( 5.9- 7.0)
Northeast 6.9 ( 6.5- 7.2) 6.4 ( 6.1- 6.7) 12.1 ( 10.6- 13.7) 9.3 ( 7.7- 11.2)
New England 6.1 ( 5.5- 6.7) 5.9 ( 5.3- 6.5) 12.0 ( 8.1- 17.1) 9.8 ( 5.5- 15.9)
Connecticut 5.3 ( 4.2- 6.5) 4.7 ( 3.7- 6.0) ∼ ∼Maine 4.6 ( 3.2- 6.6) 4.5 ( 3.1- 6.4) ∼ ∼Massachusetts 6.9 ( 6.0- 7.9) 6.6 ( 5.7- 7.6) 12.7 ( 7.1- 20.6) ∼New Hampshire 6.2 ( 4.3- 8.6) 6.3 ( 4.4- 8.7) ∼ ∼Rhode Island 5.9 ( 4.0- 8.4) 5.8 ( 3.8- 8.4) ∼ ∼Vermont 7.2 ( 4.4- 11.0) 7.2 ( 4.4- 11.1) ∼ ∼
Middle Atlantic 7.1 ( 6.7- 7.5) 6.6 ( 6.2- 7.0) 12.0 ( 10.4- 13.8) 9.2 ( 7.5- 11.2)
New Jersey 7.5 ( 6.7- 8.4) 6.8 ( 5.9- 7.7) 15.3 ( 11.3- 20.1) 10.6 ( 7.1- 15.1)
New York 7.4 ( 6.8- 7.9) 6.9 ( 6.3- 7.5) 11.1 ( 9.1- 13.3) 8.5 ( 6.4- 10.9)
Pennsylvania 6.5 ( 5.9- 7.2) 6.1 ( 5.5- 6.7) 11.5 ( 8.5- 15.2) -
Midwest 6.9 ( 6.6- 7.2) 6.3 ( 6.0- 6.6) 13.2 ( 11.6- 14.9) 3.7 ( 2.3- 5.6)
East North Central 6.7 ( 6.4- 7.1) 6.0 ( 5.7- 6.4) 13.6 ( 11.9- 15.5) 4.1 ( 2.5- 6.4)
Illinois 6.8 ( 6.1- 7.6) 6.0 ( 5.3- 6.8) 13.5 ( 10.7- 16.9) ∼Indiana 6.4 ( 5.4- 7.4) 6.1 ( 5.1- 7.1) 10.8 ( 6.1- 17.4) ∼Michigan 7.5 ( 6.7- 8.3) 6.4 ( 5.6- 7.2) 17.1 ( 13.4- 21.5) ∼
Detroit 8.9 ( 7.5- 10.4) 7.4 ( 6.0- 9.0) 15.5 ( 11.4- 20.3) ∼Ohio 6.0 ( 5.4- 6.7) 5.5 ( 4.8- 6.2) 11.0 ( 8.1- 14.5) ∼Wisconsin 7.1 ( 6.1- 8.3) 6.7 ( 5.7- 7.8) ∼ ∼
West North Central 7.1 ( 6.6- 7.7) 6.9 ( 6.4- 7.5) 11.0 ( 7.5- 15.4) ∼Iowa 6.0 ( 4.8- 7.4) 5.9 ( 4.7- 7.3) ∼ ∼Kansas 7.6 ( 6.1- 9.3) 7.4 ( 5.9- 9.1) ∼ ∼Minnesota 6.9 ( 5.9- 8.1) 6.8 ( 5.8- 8.0) ∼ ∼Missouri 7.8 ( 6.8- 8.9) 7.4 ( 6.4- 8.6) 12.0 ( 7.5- 18.0) ∼Nebraska 6.8 ( 5.1- 8.8) 6.5 ( 4.9- 8.6) ∼ ∼North Dakota 5.5 ( 3.2- 8.8) 5.6 ( 3.2- 9.0) ∼ ∼South Dakota 8.9 ( 6.1- 12.4) 8.4 ( 5.7- 12.0) ∼ ∼
South 6.9 ( 6.7- 7.2) 5.9 ( 5.7- 6.2) 13.4 ( 12.5- 14.5) 5.8 ( 5.0- 6.7)
South Atlantic 6.6 ( 6.2- 6.9) 5.6 ( 5.2- 5.9) 12.8 ( 11.5- 14.2) 5.4 ( 4.2- 6.7)
Delaware 8.8 ( 6.1- 12.3) 8.7 ( 5.8- 12.5) ∼ ∼District of Columbia 14.1 ( 9.7- 19.9) ∼ 19.2 ( 12.6- 28.0) ∼Florida 6.2 ( 5.7- 6.7) 5.4 ( 4.9- 5.9) 12.7 ( 10.2- 15.5) -
Georgia 7.2 ( 6.2- 8.2) 5.6 ( 4.6- 6.6) 13.9 ( 11.0- 17.3) ∼Atlanta 5.7 ( 4.3- 7.5) 3.4 ( 2.2- 5.1) 13.6 ( 8.9- 19.6) ∼
Maryland
North Carolina 7.1 ( 6.2- 8.0) 5.8 ( 4.9- 6.7) 13.8 ( 10.8- 17.3) ∼South Carolina 6.7 ( 5.6- 8.1) 6.2 ( 4.9- 7.7) 9.2 ( 6.3- 12.8) -
Virginia 5.8 ( 5.0- 6.8) 4.9 ( 4.1- 5.8) 10.7 ( 7.7- 14.3) ∼West Virginia 6.7 ( 5.0- 8.6) 6.5 ( 4.9- 8.4) ∼ ∼
East South Central 7.3 ( 6.7- 7.9) 6.2 ( 5.6- 6.9) 13.3 ( 11.2- 15.8) ∼Alabama 8.6 ( 7.4- 10.0) 6.9 ( 5.7- 8.3) 15.3 ( 11.5- 19.9) ∼Kentucky 6.8 ( 5.6- 8.1) 6.5 ( 5.3- 7.8) ∼ -
Mississippi 7.7 ( 6.3- 9.4) 6.5 ( 4.9- 8.4) 12.3 ( 8.6- 16.9) ∼Tennessee 6.3 ( 5.4- 7.4) 5.4 ( 4.5- 6.5) 13.8 ( 9.7- 19.0) ∼

Cancer Incidence and M
ortality, by U.S. C
ensus Region and D
i�ision, State, and Metropolitan A
rea
���
Table 2.18.1.1M: Myeloma. Age-Adjusted Cancer Incidence Rates∗ and 95% Confidence Intervals, by U.S.Census Region and Division, State and Metropolitan Area, and Race and Ethnicity, United States†‡(continued)
Males, 2004
Area All Races White Black Hispanic§
West South Central 7.4 ( 6.9- 7.9) 6.3 ( 5.9- 6.8) 15.0 ( 12.9- 17.3) 6.3 ( 5.1- 7.6)
Arkansas 6.5 ( 5.2- 8.0) 5.4 ( 4.2- 6.9) 15.5 ( 9.2- 24.2) ∼Louisiana 7.9 ( 6.7- 9.4) 5.1 ( 4.0- 6.5) 17.3 ( 13.5- 21.9) ∼Oklahoma 7.1 ( 5.8- 8.5) 6.4 ( 5.2- 7.9) ∼ ∼Texas 7.5 ( 6.9- 8.1) 6.7 ( 6.1- 7.4) 13.4 ( 10.8- 16.5) 6.1 ( 5.0- 7.5)
West 6.4 ( 6.1- 6.7) 6.2 ( 5.9- 6.6) 12.9 ( 10.8- 15.4) 6.4 ( 5.5- 7.3)
Mountain 5.8 ( 5.2- 6.3) 5.6 ( 5.1- 6.2) 11.5 ( 6.6- 18.2) 4.9 ( 3.5- 6.6)
Arizona 4.7 ( 3.9- 5.6) 4.5 ( 3.7- 5.4) ∼ 5.1 ( 2.8- 8.3)
Colorado 6.3 ( 5.1- 7.6) 5.9 ( 4.7- 7.2) ∼ ∼Idaho 8.5 ( 6.3- 11.2) 8.7 ( 6.4- 11.4) ∼ ∼Montana 6.7 ( 4.5- 9.6) 6.7 ( 4.5- 9.7) ∼ ∼Nevada 6.1 ( 4.6- 7.8) 5.8 ( 4.4- 7.6) ∼ ∼New Mexico 5.6 ( 4.1- 7.5) 5.9 ( 4.3- 7.9) ∼ 6.6 ( 3.8- 10.4)
Utah 5.0 ( 3.5- 6.7) 5.0 ( 3.5- 6.8) ∼ ∼Wyoming 7.0 ( 4.1- 11.4) 6.8 ( 3.9- 11.2) ∼ ∼
Pacific 6.6 ( 6.3- 7.0) 6.6 ( 6.2- 7.0) 13.3 ( 10.9- 16.1) 6.9 ( 5.9- 8.1)
Alaska 7.9 ( 4.3- 13.0) ∼ ∼ ∼California 6.6 ( 6.2- 7.1) 6.4 ( 6.0- 6.9) 13.3 ( 10.8- 16.2) 6.9 ( 5.8- 8.0)
San Francisco-Oakland 7.1 ( 5.9- 8.4) 6.8 ( 5.4- 8.4) 14.1 ( 8.8- 21.2) ∼San Jose-Monterey 8.0 ( 6.2- 10.1) 8.2 ( 6.2- 10.7) ∼ ∼Los Angeles 6.5 ( 5.7- 7.4) 5.8 ( 4.9- 6.8) 14.5 ( 10.7- 19.2) 6.0 ( 4.4- 7.9)
Hawaii 5.8 ( 4.1- 8.1) 11.3 ( 6.5- 18.2) ∼ ∼Oregon 6.0 ( 4.9- 7.2) 6.0 ( 4.9- 7.3) ∼ ∼Washington 7.4 ( 6.4- 8.5) 7.1 ( 6.1- 8.3) ∼ ∼
Seattle-Puget Sound 7.8 ( 6.6- 9.3) 7.4 ( 6.2- 8.9) ∼ ∼∗ Rates are per 100,000 persons and are age-adjusted to the 2000 U.S. standard population (19 age groups - Census P25-1130).† Data are from all state and metropolitan area cancer registries, except Maryland. Included data cover approximately 98% of the population and met data
quality criteria for all invasive cancer sites combined. See Appendix B for registry-specific data quality information.‡ Invasive cancers only.
§ Data for specified racial or ethnic populations other than white and black should be interpreted with caution. See Technical Notes.
Hispanic origin is not mutually exclusive from race categories (white, black).
∼ Rates are suppressed if fewer than 16 cases were reported in a specific category (area, race, ethnicity).
- Rates are suppressed at the state’s or metropolitan area’s request. See Technical Notes.
Notes: Cases from suppressed rates are included in the U.S. and region/division rates. U.S. rates are as presented in Table 1.1.1.1M. Michigan, Georgia,
California, and Washington state rates each include cases from the SEER metropolitan areas.
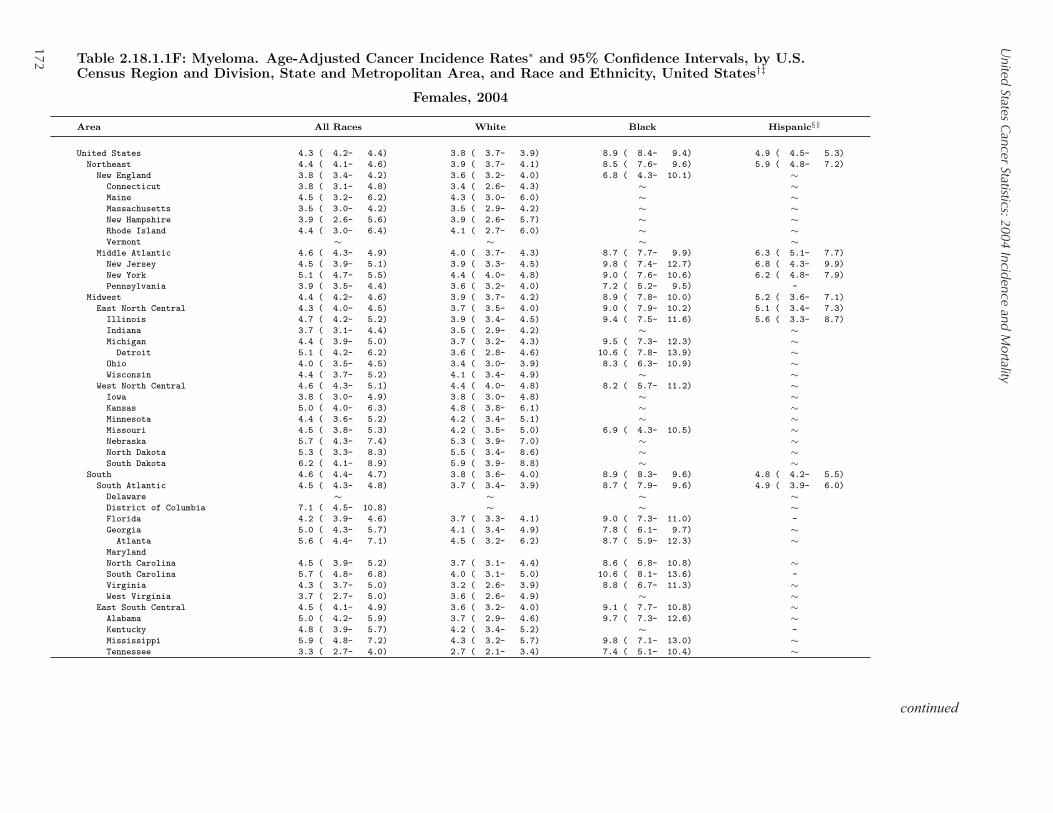
United
States Cancer Statistics: 2004 Incid
ence and M
ortality
���
continued
Table 2.18.1.1F: Myeloma. Age-Adjusted Cancer Incidence Rates∗ and 95% Confidence Intervals, by U.S.Census Region and Division, State and Metropolitan Area, and Race and Ethnicity, United States†‡
Females, 2004
Area All Races White Black Hispanic§
United States 4.3 ( 4.2- 4.4) 3.8 ( 3.7- 3.9) 8.9 ( 8.4- 9.4) 4.9 ( 4.5- 5.3)
Northeast 4.4 ( 4.1- 4.6) 3.9 ( 3.7- 4.1) 8.5 ( 7.6- 9.6) 5.9 ( 4.8- 7.2)
New England 3.8 ( 3.4- 4.2) 3.6 ( 3.2- 4.0) 6.8 ( 4.3- 10.1) ∼Connecticut 3.8 ( 3.1- 4.8) 3.4 ( 2.6- 4.3) ∼ ∼Maine 4.5 ( 3.2- 6.2) 4.3 ( 3.0- 6.0) ∼ ∼Massachusetts 3.5 ( 3.0- 4.2) 3.5 ( 2.9- 4.2) ∼ ∼New Hampshire 3.9 ( 2.6- 5.6) 3.9 ( 2.6- 5.7) ∼ ∼Rhode Island 4.4 ( 3.0- 6.4) 4.1 ( 2.7- 6.0) ∼ ∼Vermont ∼ ∼ ∼ ∼
Middle Atlantic 4.6 ( 4.3- 4.9) 4.0 ( 3.7- 4.3) 8.7 ( 7.7- 9.9) 6.3 ( 5.1- 7.7)
New Jersey 4.5 ( 3.9- 5.1) 3.9 ( 3.3- 4.5) 9.8 ( 7.4- 12.7) 6.8 ( 4.3- 9.9)
New York 5.1 ( 4.7- 5.5) 4.4 ( 4.0- 4.8) 9.0 ( 7.6- 10.6) 6.2 ( 4.8- 7.9)
Pennsylvania 3.9 ( 3.5- 4.4) 3.6 ( 3.2- 4.0) 7.2 ( 5.2- 9.5) -
Midwest 4.4 ( 4.2- 4.6) 3.9 ( 3.7- 4.2) 8.9 ( 7.8- 10.0) 5.2 ( 3.6- 7.1)
East North Central 4.3 ( 4.0- 4.5) 3.7 ( 3.5- 4.0) 9.0 ( 7.9- 10.2) 5.1 ( 3.4- 7.3)
Illinois 4.7 ( 4.2- 5.2) 3.9 ( 3.4- 4.5) 9.4 ( 7.5- 11.6) 5.6 ( 3.3- 8.7)
Indiana 3.7 ( 3.1- 4.4) 3.5 ( 2.9- 4.2) ∼ ∼Michigan 4.4 ( 3.9- 5.0) 3.7 ( 3.2- 4.3) 9.5 ( 7.3- 12.3) ∼
Detroit 5.1 ( 4.2- 6.2) 3.6 ( 2.8- 4.6) 10.6 ( 7.8- 13.9) ∼Ohio 4.0 ( 3.5- 4.5) 3.4 ( 3.0- 3.9) 8.3 ( 6.3- 10.9) ∼Wisconsin 4.4 ( 3.7- 5.2) 4.1 ( 3.4- 4.9) ∼ ∼
West North Central 4.6 ( 4.3- 5.1) 4.4 ( 4.0- 4.8) 8.2 ( 5.7- 11.2) ∼Iowa 3.8 ( 3.0- 4.9) 3.8 ( 3.0- 4.8) ∼ ∼Kansas 5.0 ( 4.0- 6.3) 4.8 ( 3.8- 6.1) ∼ ∼Minnesota 4.4 ( 3.6- 5.2) 4.2 ( 3.4- 5.1) ∼ ∼Missouri 4.5 ( 3.8- 5.3) 4.2 ( 3.5- 5.0) 6.9 ( 4.3- 10.5) ∼Nebraska 5.7 ( 4.3- 7.4) 5.3 ( 3.9- 7.0) ∼ ∼North Dakota 5.3 ( 3.3- 8.3) 5.5 ( 3.4- 8.6) ∼ ∼South Dakota 6.2 ( 4.1- 8.9) 5.9 ( 3.9- 8.8) ∼ ∼
South 4.6 ( 4.4- 4.7) 3.8 ( 3.6- 4.0) 8.9 ( 8.3- 9.6) 4.8 ( 4.2- 5.5)
South Atlantic 4.5 ( 4.3- 4.8) 3.7 ( 3.4- 3.9) 8.7 ( 7.9- 9.6) 4.9 ( 3.9- 6.0)
Delaware ∼ ∼ ∼ ∼District of Columbia 7.1 ( 4.5- 10.8) ∼ ∼ ∼Florida 4.2 ( 3.9- 4.6) 3.7 ( 3.3- 4.1) 9.0 ( 7.3- 11.0) -
Georgia 5.0 ( 4.3- 5.7) 4.1 ( 3.4- 4.9) 7.8 ( 6.1- 9.7) ∼Atlanta 5.6 ( 4.4- 7.1) 4.5 ( 3.2- 6.2) 8.7 ( 5.9- 12.3) ∼
Maryland
North Carolina 4.5 ( 3.9- 5.2) 3.7 ( 3.1- 4.4) 8.6 ( 6.8- 10.8) ∼South Carolina 5.7 ( 4.8- 6.8) 4.0 ( 3.1- 5.0) 10.6 ( 8.1- 13.6) -
Virginia 4.3 ( 3.7- 5.0) 3.2 ( 2.6- 3.9) 8.8 ( 6.7- 11.3) ∼West Virginia 3.7 ( 2.7- 5.0) 3.6 ( 2.6- 4.9) ∼ ∼
East South Central 4.5 ( 4.1- 4.9) 3.6 ( 3.2- 4.0) 9.1 ( 7.7- 10.8) ∼Alabama 5.0 ( 4.2- 5.9) 3.7 ( 2.9- 4.6) 9.7 ( 7.3- 12.6) ∼Kentucky 4.8 ( 3.9- 5.7) 4.2 ( 3.4- 5.2) ∼ -
Mississippi 5.9 ( 4.8- 7.2) 4.3 ( 3.2- 5.7) 9.8 ( 7.1- 13.0) ∼Tennessee 3.3 ( 2.7- 4.0) 2.7 ( 2.1- 3.4) 7.4 ( 5.1- 10.4) ∼
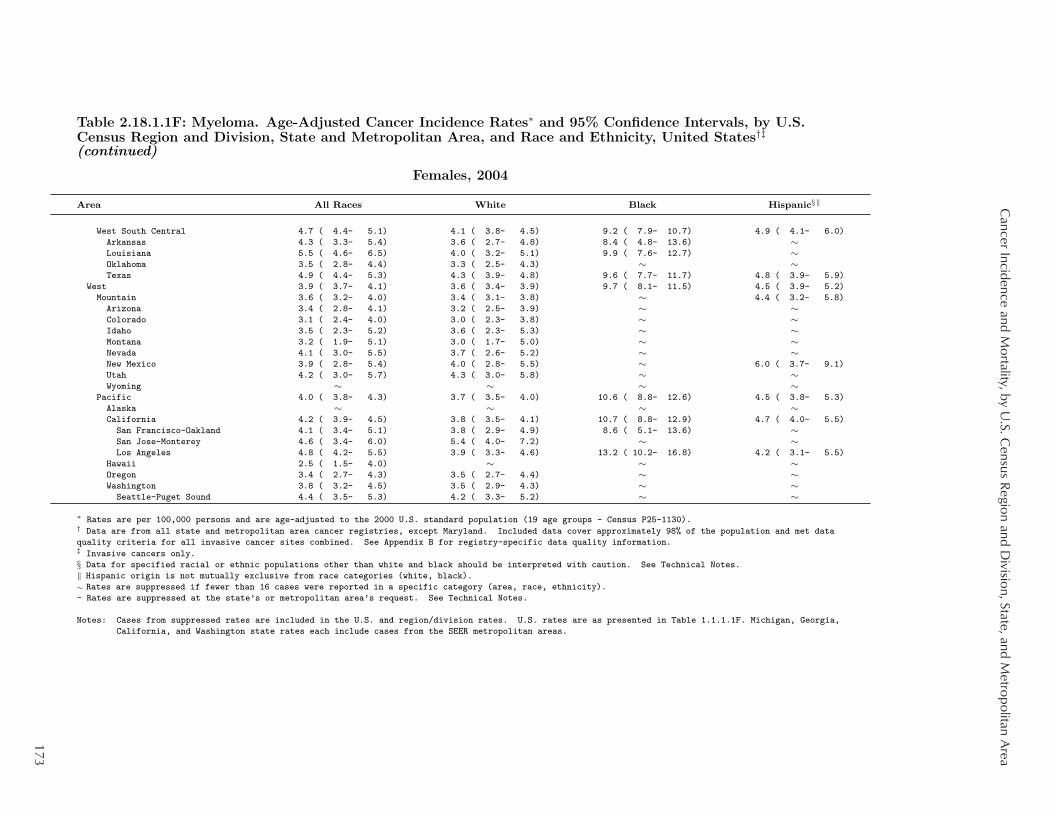
Cancer Incidence and M
ortality, by U.S. C
ensus Region and D
i�ision, State, and Metropolitan A
rea
��3
Table 2.18.1.1F: Myeloma. Age-Adjusted Cancer Incidence Rates∗ and 95% Confidence Intervals, by U.S.Census Region and Division, State and Metropolitan Area, and Race and Ethnicity, United States†‡(continued)
Females, 2004
Area All Races White Black Hispanic§
West South Central 4.7 ( 4.4- 5.1) 4.1 ( 3.8- 4.5) 9.2 ( 7.9- 10.7) 4.9 ( 4.1- 6.0)
Arkansas 4.3 ( 3.3- 5.4) 3.6 ( 2.7- 4.8) 8.4 ( 4.8- 13.6) ∼Louisiana 5.5 ( 4.6- 6.5) 4.0 ( 3.2- 5.1) 9.9 ( 7.6- 12.7) ∼Oklahoma 3.5 ( 2.8- 4.4) 3.3 ( 2.5- 4.3) ∼ ∼Texas 4.9 ( 4.4- 5.3) 4.3 ( 3.9- 4.8) 9.6 ( 7.7- 11.7) 4.8 ( 3.9- 5.9)
West 3.9 ( 3.7- 4.1) 3.6 ( 3.4- 3.9) 9.7 ( 8.1- 11.5) 4.5 ( 3.9- 5.2)
Mountain 3.6 ( 3.2- 4.0) 3.4 ( 3.1- 3.8) ∼ 4.4 ( 3.2- 5.8)
Arizona 3.4 ( 2.8- 4.1) 3.2 ( 2.5- 3.9) ∼ ∼Colorado 3.1 ( 2.4- 4.0) 3.0 ( 2.3- 3.8) ∼ ∼Idaho 3.5 ( 2.3- 5.2) 3.6 ( 2.3- 5.3) ∼ ∼Montana 3.2 ( 1.9- 5.1) 3.0 ( 1.7- 5.0) ∼ ∼Nevada 4.1 ( 3.0- 5.5) 3.7 ( 2.6- 5.2) ∼ ∼New Mexico 3.9 ( 2.8- 5.4) 4.0 ( 2.8- 5.5) ∼ 6.0 ( 3.7- 9.1)
Utah 4.2 ( 3.0- 5.7) 4.3 ( 3.0- 5.8) ∼ ∼Wyoming ∼ ∼ ∼ ∼
Pacific 4.0 ( 3.8- 4.3) 3.7 ( 3.5- 4.0) 10.6 ( 8.8- 12.6) 4.5 ( 3.8- 5.3)
Alaska ∼ ∼ ∼ ∼California 4.2 ( 3.9- 4.5) 3.8 ( 3.5- 4.1) 10.7 ( 8.8- 12.9) 4.7 ( 4.0- 5.5)
San Francisco-Oakland 4.1 ( 3.4- 5.1) 3.8 ( 2.9- 4.9) 8.6 ( 5.1- 13.6) ∼San Jose-Monterey 4.6 ( 3.4- 6.0) 5.4 ( 4.0- 7.2) ∼ ∼Los Angeles 4.8 ( 4.2- 5.5) 3.9 ( 3.3- 4.6) 13.2 ( 10.2- 16.8) 4.2 ( 3.1- 5.5)
Hawaii 2.5 ( 1.5- 4.0) ∼ ∼ ∼Oregon 3.4 ( 2.7- 4.3) 3.5 ( 2.7- 4.4) ∼ ∼Washington 3.8 ( 3.2- 4.5) 3.5 ( 2.9- 4.3) ∼ ∼
Seattle-Puget Sound 4.4 ( 3.5- 5.3) 4.2 ( 3.3- 5.2) ∼ ∼∗ Rates are per 100,000 persons and are age-adjusted to the 2000 U.S. standard population (19 age groups - Census P25-1130).† Data are from all state and metropolitan area cancer registries, except Maryland. Included data cover approximately 98% of the population and met data
quality criteria for all invasive cancer sites combined. See Appendix B for registry-specific data quality information.‡ Invasive cancers only.
§ Data for specified racial or ethnic populations other than white and black should be interpreted with caution. See Technical Notes.
Hispanic origin is not mutually exclusive from race categories (white, black).
∼ Rates are suppressed if fewer than 16 cases were reported in a specific category (area, race, ethnicity).
- Rates are suppressed at the state’s or metropolitan area’s request. See Technical Notes.
Notes: Cases from suppressed rates are included in the U.S. and region/division rates. U.S. rates are as presented in Table 1.1.1.1F. Michigan, Georgia,
California, and Washington state rates each include cases from the SEER metropolitan areas.

United
States Cancer Statistics: 2004 Incid
ence and M
ortality
���
continued
Table 2.18.1.2M: Myeloma. Age-Adjusted Cancer Death Rates∗ and 95% Confidence Intervals, by U.S. CensusRegion and Division, State, and Race and Ethnicity, United States†
Males, 2004
Area All Races White Black Hispanic‡§
United States 4.4 ( 4.3- 4.5) 4.1 ( 4.0- 4.3) 8.2 ( 7.6- 8.8) 3.3 ( 2.9- 3.8)
Northeast 4.0 ( 3.7- 4.2) 3.8 ( 3.6- 4.1) 6.8 ( 5.7- 8.1) 2.6 ( 1.7- 3.8)
New England 4.2 ( 3.7- 4.8) 4.1 ( 3.7- 4.7) 8.2 ( 4.8- 13.0) ∼Connecticut 4.2 ( 3.3- 5.4) 4.3 ( 3.3- 5.5) ∼ ∼Maine 4.9 ( 3.3- 6.9) 4.9 ( 3.3- 6.9) ∼ ∼Massachusetts 4.2 ( 3.5- 5.0) 4.0 ( 3.3- 4.8) ∼ ∼New Hampshire 4.5 ( 2.9- 6.6) 4.6 ( 3.0- 6.7) ∼ ∼Rhode Island 3.2 ( 1.9- 5.2) 3.2 ( 1.8- 5.2) ∼ ∼Vermont ∼ ∼ ∼ ∼
Middle Atlantic 3.9 ( 3.6- 4.2) 3.7 ( 3.4- 4.0) 6.7 ( 5.5- 8.0) 2.7 ( 1.7- 3.9)
New Jersey 3.7 ( 3.1- 4.3) 3.5 ( 2.9- 4.2) 7.5 ( 4.7- 11.1) ∼New York 4.0 ( 3.6- 4.4) 3.8 ( 3.3- 4.2) 6.8 ( 5.2- 8.6) 3.1 ( 1.8- 4.9)
Pennsylvania 3.8 ( 3.4- 4.4) 3.7 ( 3.2- 4.2) 5.7 ( 3.6- 8.6) ∼Midwest 4.7 ( 4.5- 5.0) 4.4 ( 4.1- 4.7) 9.9 ( 8.5- 11.4) 3.8 ( 2.3- 5.8)
East North Central 4.7 ( 4.4- 5.0) 4.3 ( 4.0- 4.6) 9.6 ( 8.1- 11.3) 3.8 ( 2.1- 6.0)
Illinois 4.3 ( 3.8- 5.0) 4.0 ( 3.4- 4.6) 8.4 ( 6.0- 11.3) ∼Indiana 4.2 ( 3.5- 5.1) 4.0 ( 3.2- 4.8) ∼ ∼Michigan 5.2 ( 4.5- 5.9) 4.5 ( 3.9- 5.3) 11.2 ( 8.2- 14.8) ∼Ohio 4.7 ( 4.1- 5.3) 4.2 ( 3.7- 4.9) 10.2 ( 7.4- 13.8) ∼Wisconsin 4.8 ( 4.0- 5.8) 4.8 ( 4.0- 5.8) ∼ ∼
West North Central 4.8 ( 4.4- 5.3) 4.6 ( 4.2- 5.1) 11.4 ( 7.7- 16.3) ∼Iowa 4.6 ( 3.6- 5.8) 4.3 ( 3.3- 5.6) ∼ ∼Kansas 5.1 ( 3.9- 6.5) 4.7 ( 3.5- 6.1) ∼ ∼Minnesota 4.7 ( 3.8- 5.7) 4.6 ( 3.7- 5.6) ∼ ∼Missouri 4.8 ( 4.0- 5.8) 4.6 ( 3.8- 5.6) ∼ ∼Nebraska 4.4 ( 3.1- 6.1) 4.2 ( 2.8- 5.9) ∼ ∼North Dakota 6.0 ( 3.6- 9.4) 5.8 ( 3.4- 9.2) ∼ ∼South Dakota 5.8 ( 3.6- 8.8) 6.0 ( 3.8- 9.1) ∼ ∼
South 4.6 ( 4.4- 4.8) 4.1 ( 3.9- 4.3) 8.2 ( 7.4- 9.0) 2.8 ( 2.2- 3.4)
South Atlantic 4.5 ( 4.3- 4.8) 4.1 ( 3.8- 4.4) 7.8 ( 6.8- 8.9) 2.9 ( 2.0- 3.9)
Delaware 4.8 ( 2.8- 7.6) 4.9 ( 2.8- 8.1) ∼ ∼District of Columbia ∼ ∼ ∼ ∼Florida 4.2 ( 3.8- 4.7) 4.1 ( 3.7- 4.6) 6.0 ( 4.2- 8.2) 3.3 ( 2.3- 4.6)
Georgia 4.4 ( 3.6- 5.2) 3.8 ( 3.1- 4.7) 6.9 ( 4.8- 9.5) ∼Maryland 4.4 ( 3.5- 5.3) 4.1 ( 3.2- 5.2) 5.6 ( 3.5- 8.2) ∼North Carolina 5.3 ( 4.6- 6.2) 4.5 ( 3.7- 5.4) 10.4 ( 7.7- 13.6) ∼South Carolina 5.3 ( 4.2- 6.5) 4.2 ( 3.1- 5.5) 9.8 ( 6.6- 13.7) ∼Virginia 4.5 ( 3.7- 5.3) 3.6 ( 2.9- 4.5) 9.4 ( 6.5- 13.0) ∼West Virginia 4.8 ( 3.5- 6.5) 4.6 ( 3.3- 6.3) ∼ ∼
East South Central 4.7 ( 4.2- 5.2) 4.1 ( 3.6- 4.7) 8.4 ( 6.7- 10.4) ∼Alabama 5.1 ( 4.2- 6.3) 4.3 ( 3.3- 5.5) 9.3 ( 6.3- 13.1) ∼Kentucky 4.5 ( 3.5- 5.7) 4.3 ( 3.3- 5.5) ∼ ∼Mississippi 3.3 ( 2.4- 4.5) 2.8 ( 1.8- 4.2) 4.9 ( 2.8- 8.0) ∼Tennessee 5.0 ( 4.2- 6.0) 4.5 ( 3.6- 5.5) 10.8 ( 7.2- 15.6) ∼
West South Central 4.5 ( 4.1- 4.9) 4.0 ( 3.6- 4.4) 9.1 ( 7.5- 11.0) 2.8 ( 2.0- 3.6)
Arkansas 4.8 ( 3.6- 6.2) 3.8 ( 2.8- 5.2) 14.7 ( 8.4- 23.4) ∼

Cancer Incidence and M
ortality, by U.S. C
ensus Region and D
i�ision, State, and Metropolitan A
rea
���
Table 2.18.1.2M: Myeloma. Age-Adjusted Cancer Death Rates∗ and 95% Confidence Intervals, by U.S. CensusRegion and Division, State, and Race and Ethnicity, United States† (continued)
Males, 2004
Area All Races White Black Hispanic‡§
Louisiana 4.8 ( 3.9- 6.0) 3.7 ( 2.7- 4.8) 8.9 ( 6.2- 12.3) ∼Oklahoma 4.9 ( 3.8- 6.1) 4.4 ( 3.4- 5.7) ∼ ∼Texas 4.3 ( 3.8- 4.8) 4.0 ( 3.5- 4.5) 8.1 ( 6.0- 10.7) 2.8 ( 2.1- 3.7)
West 4.2 ( 4.0- 4.5) 4.3 ( 4.0- 4.6) 7.9 ( 6.1- 10.0) 4.1 ( 3.4- 4.9)
Mountain 4.4 ( 4.0- 4.9) 4.5 ( 4.0- 5.0) ∼ 4.0 ( 2.7- 5.6)
Arizona 4.5 ( 3.7- 5.5) 4.5 ( 3.7- 5.4) ∼ ∼Colorado 3.2 ( 2.4- 4.3) 3.2 ( 2.4- 4.3) ∼ ∼Idaho 7.9 ( 5.7- 10.6) 8.0 ( 5.8- 10.7) ∼ ∼Montana 7.6 ( 5.2- 10.7) 7.4 ( 5.0- 10.5) ∼ ∼Nevada 4.3 ( 3.1- 5.8) 4.4 ( 3.1- 6.0) ∼ ∼New Mexico 3.5 ( 2.3- 5.0) 3.5 ( 2.3- 5.2) ∼ ∼Utah 3.9 ( 2.6- 5.5) 4.0 ( 2.7- 5.7) ∼ ∼Wyoming ∼ ∼ ∼ ∼
Pacific 4.1 ( 3.8- 4.4) 4.2 ( 3.9- 4.5) 8.4 ( 6.4- 10.7) 4.1 ( 3.3- 5.1)
Alaska ∼ ∼ ∼ ∼California 4.1 ( 3.8- 4.5) 4.1 ( 3.8- 4.5) 8.6 ( 6.5- 11.1) 4.2 ( 3.3- 5.2)
Hawaii 3.2 ( 1.9- 4.9) ∼ ∼ ∼Oregon 4.3 ( 3.3- 5.4) 4.2 ( 3.2- 5.3) ∼ ∼Washington 4.6 ( 3.8- 5.6) 4.7 ( 3.8- 5.6) ∼ ∼
∗ Rates are per 100,000 persons and are age-adjusted to the 2000 U.S. standard population (19 age groups - Census P25-1130).† Data are from the National Vital Statistics System (NVSS).‡ Data for specified racial or ethnic populations other than white and black should be interpreted with caution. See Technical Notes.
§ Hispanic origin is not mutually exclusive from race categories (white, black).
∼ Rates are suppressed if fewer than 16 cases were reported in a specific category (area, race, ethnicity).
Note: U.S. rates are as presented in Table 1.1.1.2M.

United
States Cancer Statistics: 2004 Incid
ence and M
ortality
���
continued
Table 2.18.1.2F: Myeloma. Age-Adjusted Cancer Death Rates∗ and 95% Confidence Intervals, by U.S. CensusRegion and Division, State, and Race and Ethnicity, United States†
Females, 2004
Area All Races White Black Hispanic‡§
United States 3.0 ( 2.9- 3.0) 2.7 ( 2.6- 2.8) 6.0 ( 5.6- 6.4) 2.5 ( 2.2- 2.8)
Northeast 2.8 ( 2.6- 3.0) 2.6 ( 2.4- 2.8) 5.1 ( 4.3- 5.9) 2.5 ( 1.8- 3.3)
New England 2.7 ( 2.4- 3.1) 2.7 ( 2.3- 3.0) 5.2 ( 2.9- 8.3) ∼Connecticut 2.8 ( 2.2- 3.6) 2.6 ( 2.0- 3.4) ∼ ∼Maine 3.3 ( 2.3- 4.8) 3.4 ( 2.3- 4.9) ∼ ∼Massachusetts 2.5 ( 2.0- 3.0) 2.5 ( 2.0- 3.0) ∼ ∼New Hampshire 2.6 ( 1.6- 4.0) 2.6 ( 1.6- 4.1) ∼ ∼Rhode Island 2.9 ( 1.8- 4.5) 2.8 ( 1.7- 4.4) ∼ ∼Vermont ∼ ∼ ∼ ∼
Middle Atlantic 2.8 ( 2.6- 3.0) 2.6 ( 2.4- 2.8) 5.1 ( 4.3- 6.0) 2.5 ( 1.7- 3.4)
New Jersey 2.9 ( 2.4- 3.4) 2.5 ( 2.1- 3.0) 5.9 ( 4.0- 8.3) ∼New York 2.6 ( 2.3- 2.9) 2.3 ( 2.0- 2.6) 4.6 ( 3.6- 5.8) 2.3 ( 1.5- 3.4)
Pennsylvania 3.1 ( 2.8- 3.5) 3.0 ( 2.6- 3.4) 5.5 ( 3.8- 7.6) ∼Midwest 3.1 ( 2.9- 3.3) 2.9 ( 2.7- 3.0) 6.1 ( 5.2- 7.1) 2.3 ( 1.3- 3.6)
East North Central 3.0 ( 2.8- 3.2) 2.7 ( 2.5- 2.9) 6.3 ( 5.3- 7.3) ∼Illinois 3.0 ( 2.6- 3.4) 2.7 ( 2.3- 3.1) 5.4 ( 4.0- 7.2) ∼Indiana 3.1 ( 2.6- 3.7) 2.8 ( 2.3- 3.5) 7.5 ( 4.4- 12.0) ∼Michigan 2.7 ( 2.3- 3.1) 2.2 ( 1.8- 2.7) 6.4 ( 4.6- 8.6) ∼Ohio 3.4 ( 2.9- 3.8) 3.1 ( 2.6- 3.5) 6.6 ( 4.8- 8.9) ∼Wisconsin 2.9 ( 2.4- 3.6) 2.8 ( 2.2- 3.4) ∼ ∼
West North Central 3.2 ( 2.9- 3.5) 3.1 ( 2.8- 3.5) 5.3 ( 3.4- 8.0) ∼Iowa 2.8 ( 2.1- 3.7) 2.7 ( 2.0- 3.6) ∼ ∼Kansas 4.0 ( 3.1- 5.1) 4.0 ( 3.1- 5.1) ∼ ∼Minnesota 2.8 ( 2.2- 3.5) 2.8 ( 2.2- 3.5) ∼ ∼Missouri 3.5 ( 2.9- 4.1) 3.3 ( 2.7- 4.0) 5.6 ( 3.2- 9.0) ∼Nebraska 2.7 ( 1.8- 3.9) 2.7 ( 1.8- 3.9) ∼ ∼North Dakota ∼ ∼ ∼ ∼South Dakota 4.1 ( 2.5- 6.3) 4.0 ( 2.4- 6.3) ∼ ∼
South 3.2 ( 3.1- 3.3) 2.7 ( 2.6- 2.9) 6.3 ( 5.7- 6.8) 2.6 ( 2.1- 3.1)
South Atlantic 3.1 ( 2.9- 3.3) 2.5 ( 2.4- 2.7) 6.2 ( 5.5- 6.9) 2.4 ( 1.7- 3.2)
Delaware ∼ ∼ ∼ ∼District of Columbia ∼ ∼ ∼ ∼Florida 2.6 ( 2.3- 2.9) 2.2 ( 2.0- 2.5) 6.2 ( 4.7- 7.9) 2.6 ( 1.8- 3.5)
Georgia 3.6 ( 3.0- 4.2) 2.8 ( 2.3- 3.5) 6.0 ( 4.5- 7.8) ∼Maryland 3.5 ( 2.8- 4.2) 3.0 ( 2.3- 3.8) 5.6 ( 3.9- 7.7) ∼North Carolina 3.5 ( 3.0- 4.1) 2.8 ( 2.3- 3.4) 7.1 ( 5.4- 9.1) ∼South Carolina 3.9 ( 3.1- 4.7) 2.8 ( 2.1- 3.7) 7.3 ( 5.2- 9.8) ∼Virginia 3.2 ( 2.7- 3.8) 2.9 ( 2.3- 3.5) 5.6 ( 3.9- 7.7) ∼West Virginia 2.8 ( 1.9- 3.9) 2.7 ( 1.8- 3.8) ∼ ∼
East South Central 3.8 ( 3.5- 4.2) 3.4 ( 3.0- 3.8) 6.5 ( 5.3- 7.9) ∼Alabama 4.4 ( 3.7- 5.3) 3.5 ( 2.8- 4.4) 8.1 ( 5.9- 10.8) ∼Kentucky 3.2 ( 2.5- 4.0) 3.2 ( 2.5- 4.0) ∼ ∼Mississippi 3.8 ( 2.9- 4.8) 3.2 ( 2.3- 4.4) 5.3 ( 3.4- 7.9) ∼Tennessee 3.8 ( 3.2- 4.6) 3.5 ( 2.9- 4.3) 6.3 ( 4.0- 9.2) ∼
West South Central 3.0 ( 2.8- 3.3) 2.7 ( 2.4- 3.0) 6.2 ( 5.1- 7.4) 2.8 ( 2.2- 3.6)
Arkansas 3.3 ( 2.5- 4.3) 3.0 ( 2.2- 4.0) ∼ ∼

Cancer Incidence and M
ortality, by U.S. C
ensus Region and D
i�ision, State, and Metropolitan A
rea
���
Table 2.18.1.2F: Myeloma. Age-Adjusted Cancer Death Rates∗ and 95% Confidence Intervals, by U.S. CensusRegion and Division, State, and Race and Ethnicity, United States† (continued)
Females, 2004
Area All Races White Black Hispanic‡§
Louisiana 3.3 ( 2.6- 4.1) 2.8 ( 2.1- 3.7) 5.1 ( 3.5- 7.2) ∼Oklahoma 2.0 ( 1.5- 2.7) 1.7 ( 1.2- 2.5) ∼ ∼Texas 3.1 ( 2.8- 3.5) 2.8 ( 2.5- 3.2) 6.9 ( 5.3- 8.7) 3.0 ( 2.3- 3.8)
West 2.6 ( 2.4- 2.8) 2.5 ( 2.3- 2.7) 6.5 ( 5.2- 8.0) 2.5 ( 2.0- 3.0)
Mountain 2.7 ( 2.4- 3.0) 2.6 ( 2.3- 2.9) ∼ 2.5 ( 1.6- 3.6)
Arizona 2.4 ( 1.9- 3.1) 2.3 ( 1.8- 3.0) ∼ ∼Colorado 2.4 ( 1.8- 3.1) 2.3 ( 1.7- 3.1) ∼ ∼Idaho 3.3 ( 2.1- 4.9) 3.3 ( 2.1- 5.0) ∼ ∼Montana ∼ ∼ ∼ ∼Nevada 2.4 ( 1.6- 3.5) 2.1 ( 1.3- 3.2) ∼ ∼New Mexico 2.9 ( 1.9- 4.1) 2.7 ( 1.8- 4.0) ∼ ∼Utah 3.5 ( 2.4- 4.9) 3.5 ( 2.4- 5.0) ∼ ∼Wyoming ∼ ∼ ∼ ∼
Pacific 2.5 ( 2.3- 2.7) 2.4 ( 2.2- 2.7) 6.5 ( 5.1- 8.2) 2.5 ( 2.0- 3.1)
Alaska ∼ ∼ ∼ ∼California 2.5 ( 2.3- 2.7) 2.3 ( 2.1- 2.6) 6.8 ( 5.3- 8.6) 2.5 ( 2.0- 3.2)
Hawaii ∼ ∼ ∼ ∼Oregon 3.2 ( 2.5- 4.1) 3.2 ( 2.5- 4.1) ∼ ∼Washington 2.5 ( 2.0- 3.1) 2.5 ( 2.0- 3.1) ∼ ∼
∗ Rates are per 100,000 persons and are age-adjusted to the 2000 U.S. standard population (19 age groups - Census P25-1130).† Data are from the National Vital Statistics System (NVSS).‡ Data for specified racial or ethnic populations other than white and black should be interpreted with caution. See Technical Notes.
§ Hispanic origin is not mutually exclusive from race categories (white, black).
∼ Rates are suppressed if fewer than 16 cases were reported in a specific category (area, race, ethnicity).
Note: U.S. rates are as presented in Table 1.1.1.2F.

United
States Cancer Statistics: 2004 Incid
ence and M
ortality
���
continued
Table 2.19.1.1M: Non-Hodgkin Lymphoma. Age-Adjusted Cancer Incidence Rates∗ and 95% ConfidenceIntervals, by U.S. Census Region and Division, State and Metropolitan Area, and Race and Ethnicity, UnitedStates†‡
Males, 2004
Area All Races White Black Hispanic§
United States 22.6 ( 22.4- 22.9) 23.1 ( 22.8- 23.3) 16.5 ( 15.7- 17.2) 19.8 ( 18.9- 20.8)
Northeast 24.3 ( 23.7- 24.9) 24.8 ( 24.1- 25.4) 17.3 ( 15.6- 19.1) 23.6 ( 21.0- 26.4)
New England 24.2 ( 23.0- 25.4) 24.2 ( 23.0- 25.5) 17.8 ( 13.0- 23.8) 18.8 ( 13.1- 26.0)
Connecticut 25.8 ( 23.4- 28.4) 26.2 ( 23.7- 28.9) 20.4 ( 12.3- 31.5) 26.1 ( 15.2- 41.3)
Maine 27.0 ( 23.2- 31.3) 26.2 ( 22.4- 30.4) ∼ ∼Massachusetts 23.2 ( 21.5- 25.0) 23.2 ( 21.4- 25.1) 17.1 ( 10.8- 25.6) 14.0 ( 7.6- 23.4)
New Hampshire 24.9 ( 21.2- 29.2) 24.8 ( 20.9- 29.1) ∼ ∼Rhode Island 21.1 ( 17.3- 25.4) 21.6 ( 17.7- 26.2) ∼ ∼Vermont 22.5 ( 17.5- 28.5) 22.4 ( 17.4- 28.4) ∼ ∼
Middle Atlantic 24.3 ( 23.6- 25.0) 25.0 ( 24.2- 25.8) 17.2 ( 15.4- 19.1) 24.4 ( 21.6- 27.4)
New Jersey 25.0 ( 23.5- 26.6) 25.8 ( 24.1- 27.6) 19.2 ( 15.2- 23.9) 22.9 ( 17.7- 29.0)
New York 24.2 ( 23.1- 25.2) 25.3 ( 24.2- 26.5) 16.5 ( 14.2- 19.1) 24.6 ( 21.2- 28.4)
Pennsylvania 24.0 ( 22.8- 25.2) 24.0 ( 22.8- 25.4) 17.1 ( 13.6- 21.2) -
Midwest 23.7 ( 23.2- 24.3) 23.7 ( 23.1- 24.3) 17.1 ( 15.4- 18.9) 19.6 ( 16.2- 23.5)
East North Central 23.4 ( 22.7- 24.0) 23.4 ( 22.7- 24.1) 17.4 ( 15.5- 19.4) 22.4 ( 18.3- 27.1)
Illinois 24.9 ( 23.6- 26.3) 25.4 ( 24.0- 27.0) 17.7 ( 14.5- 21.4) 23.1 ( 17.5- 29.7)
Indiana 22.4 ( 20.7- 24.3) 23.5 ( 21.6- 25.5) ∼ ∼Michigan 24.4 ( 23.0- 25.9) 23.8 ( 22.3- 25.4) 24.1 ( 19.9- 28.9) ∼
Detroit 26.3 ( 24.0- 28.9) 27.5 ( 24.8- 30.4) 22.9 ( 18.2- 28.4) ∼Ohio 22.2 ( 20.9- 23.5) 21.9 ( 20.6- 23.2) 15.0 ( 11.7- 18.9) 29.8 ( 17.3- 47.3)
Wisconsin 21.8 ( 20.0- 23.7) 21.9 ( 20.0- 23.8) ∼ ∼West North Central 24.4 ( 23.4- 25.5) 24.3 ( 23.3- 25.4) 15.1 ( 11.3- 19.7) 8.8 ( 4.5- 15.3)
Iowa 24.1 ( 21.6- 26.8) 23.6 ( 21.2- 26.3) ∼ ∼Kansas 25.4 ( 22.7- 28.4) 25.6 ( 22.8- 28.7) ∼ ∼Minnesota 27.7 ( 25.6- 30.0) 26.7 ( 24.6- 29.0) ∼ ∼Missouri 21.8 ( 20.0- 23.6) 22.5 ( 20.6- 24.4) 13.3 ( 8.8- 19.3) ∼Nebraska 24.8 ( 21.5- 28.5) 24.6 ( 21.2- 28.3) ∼ ∼North Dakota 25.7 ( 20.4- 31.8) 25.8 ( 20.4- 32.1) ∼ ∼South Dakota 19.0 ( 14.9- 24.0) 18.2 ( 14.1- 23.2) ∼ ∼
South 21.2 ( 20.8- 21.6) 21.7 ( 21.2- 22.2) 16.2 ( 15.2- 17.3) 19.2 ( 17.7- 20.8)
South Atlantic 20.9 ( 20.3- 21.5) 21.3 ( 20.7- 22.0) 16.1 ( 14.8- 17.5) 21.3 ( 18.9- 23.7)
Delaware 24.2 ( 19.6- 29.7) 24.1 ( 19.0- 30.1) ∼ ∼District of Columbia 25.2 ( 19.2- 32.5) 20.3 ( 11.8- 32.6) 25.0 ( 17.4- 34.8) ∼Florida 21.0 ( 20.1- 21.9) 21.2 ( 20.2- 22.2) 14.8 ( 12.4- 17.4) -
Georgia 21.7 ( 20.1- 23.4) 22.1 ( 20.3- 24.1) 19.2 ( 16.1- 22.7) 18.8 ( 9.9- 31.8)
Atlanta 26.0 ( 22.6- 29.7) 25.3 ( 21.3- 29.7) 27.8 ( 21.4- 35.4) ∼Maryland
North Carolina 20.5 ( 19.0- 22.0) 21.3 ( 19.7- 23.1) 15.3 ( 12.4- 18.7) ∼South Carolina 20.3 ( 18.3- 22.5) 21.2 ( 18.8- 23.8) 15.4 ( 11.9- 19.6) -
Virginia 19.5 ( 17.9- 21.1) 20.6 ( 18.9- 22.5) 12.9 ( 10.0- 16.4) 20.6 ( 9.3- 37.6)
West Virginia 22.0 ( 19.1- 25.2) 22.4 ( 19.4- 25.7) ∼ ∼East South Central 21.1 ( 20.0- 22.1) 21.8 ( 20.7- 23.0) 15.3 ( 13.1- 17.8) ∼Alabama 21.4 ( 19.5- 23.6) 23.2 ( 20.9- 25.7) 13.4 ( 10.1- 17.4) ∼Kentucky 23.9 ( 21.7- 26.3) 23.7 ( 21.4- 26.2) 24.5 ( 15.3- 36.7) -
Mississippi 21.5 ( 18.9- 24.3) 22.5 ( 19.4- 25.9) 18.2 ( 13.8- 23.5) ∼Tennessee 18.6 ( 17.0- 20.4) 19.2 ( 17.5- 21.1) 11.5 ( 8.1- 15.8) ∼

Cancer Incidence and M
ortality, by U.S. C
ensus Region and D
i�ision, State, and Metropolitan A
rea
���
Table 2.19.1.1M: Non-Hodgkin Lymphoma. Age-Adjusted Cancer Incidence Rates∗ and 95% ConfidenceIntervals, by U.S. Census Region and Division, State and Metropolitan Area, and Race and Ethnicity, UnitedStates†‡ (continued)
Males, 2004
Area All Races White Black Hispanic§
West South Central 21.9 ( 21.1- 22.8) 22.4 ( 21.5- 23.3) 17.2 ( 15.1- 19.4) 17.8 ( 15.9- 19.9)
Arkansas 20.4 ( 18.0- 23.0) 21.3 ( 18.7- 24.2) ∼ ∼Louisiana 22.6 ( 20.5- 24.9) 23.8 ( 21.3- 26.5) 18.7 ( 14.9- 23.1) ∼Oklahoma 21.8 ( 19.5- 24.2) 22.9 ( 20.5- 25.6) ∼ ∼Texas 22.1 ( 21.0- 23.1) 22.2 ( 21.1- 23.3) 18.5 ( 15.5- 21.8) 18.0 ( 16.0- 20.2)
West 22.2 ( 21.7- 22.8) 22.9 ( 22.3- 23.5) 14.7 ( 12.6- 17.0) 19.0 ( 17.6- 20.5)
Mountain 20.3 ( 19.3- 21.3) 20.4 ( 19.4- 21.4) 15.1 ( 9.9- 22.0) 16.1 ( 13.5- 19.0)
Arizona 18.6 ( 17.0- 20.4) 18.5 ( 16.8- 20.3) ∼ 17.2 ( 12.2- 23.2)
Colorado 20.3 ( 18.2- 22.5) 20.0 ( 17.9- 22.3) ∼ 17.5 ( 11.9- 24.6)
Idaho 21.2 ( 17.7- 25.3) 21.5 ( 17.9- 25.7) ∼ ∼Montana 22.3 ( 18.2- 27.1) 22.3 ( 18.0- 27.2) ∼ ∼Nevada 21.6 ( 18.8- 24.7) 21.7 ( 18.7- 25.0) ∼ 16.4 ( 9.9- 25.8)
New Mexico 16.5 ( 13.8- 19.6) 17.7 ( 14.8- 21.0) ∼ 13.4 ( 9.4- 18.5)
Utah 24.1 ( 20.8- 27.7) 24.5 ( 21.2- 28.2) ∼ ∼Wyoming 22.5 ( 16.8- 29.6) 21.9 ( 16.2- 29.1) ∼ ∼
Pacific 23.1 ( 22.4- 23.8) 24.1 ( 23.3- 24.8) 14.7 ( 12.5- 17.2) 20.0 ( 18.3- 21.8)
Alaska 20.4 ( 14.2- 28.1) 20.8 ( 13.8- 29.9) ∼ ∼California 22.2 ( 21.4- 23.0) 23.1 ( 22.2- 24.0) 15.0 ( 12.6- 17.8) 19.5 ( 17.8- 21.3)
San Francisco-Oakland 26.0 ( 23.7- 28.4) 27.7 ( 24.9- 30.8) 17.1 ( 11.5- 24.6) 24.3 ( 17.5- 32.6)
San Jose-Monterey 25.0 ( 21.9- 28.5) 28.0 ( 24.2- 32.2) ∼ 21.0 ( 13.8- 30.1)
Los Angeles 21.7 ( 20.2- 23.2) 23.2 ( 21.4- 25.0) 17.0 ( 13.1- 21.7) 18.9 ( 16.2- 22.0)
Hawaii 16.5 ( 13.4- 20.1) 22.8 ( 15.8- 31.8) ∼ ∼Oregon 26.4 ( 24.0- 29.0) 26.7 ( 24.2- 29.3) ∼ 28.1 ( 13.5- 50.0)
Washington 27.3 ( 25.3- 29.3) 27.4 ( 25.4- 29.6) ∼ 31.8 ( 18.4- 49.7)
Seattle-Puget Sound 27.5 ( 25.1- 30.0) 28.4 ( 25.8- 31.1) ∼ 39.3 ( 18.4- 70.2)
∗ Rates are per 100,000 persons and are age-adjusted to the 2000 U.S. standard population (19 age groups - Census P25-1130).† Data are from all state and metropolitan area cancer registries, except Maryland. Included data cover approximately 98% of the population and met data
quality criteria for all invasive cancer sites combined. See Appendix B for registry-specific data quality information.‡ Invasive cancers only.
§ Data for specified racial or ethnic populations other than white and black should be interpreted with caution. See Technical Notes.
Hispanic origin is not mutually exclusive from race categories (white, black).
∼ Rates are suppressed if fewer than 16 cases were reported in a specific category (area, race, ethnicity).
- Rates are suppressed at the state’s or metropolitan area’s request. See Technical Notes.
Notes: Cases from suppressed rates are included in the U.S. and region/division rates. U.S. rates are as presented in Table 1.1.1.1M. Michigan, Georgia,
California, and Washington state rates each include cases from the SEER metropolitan areas.
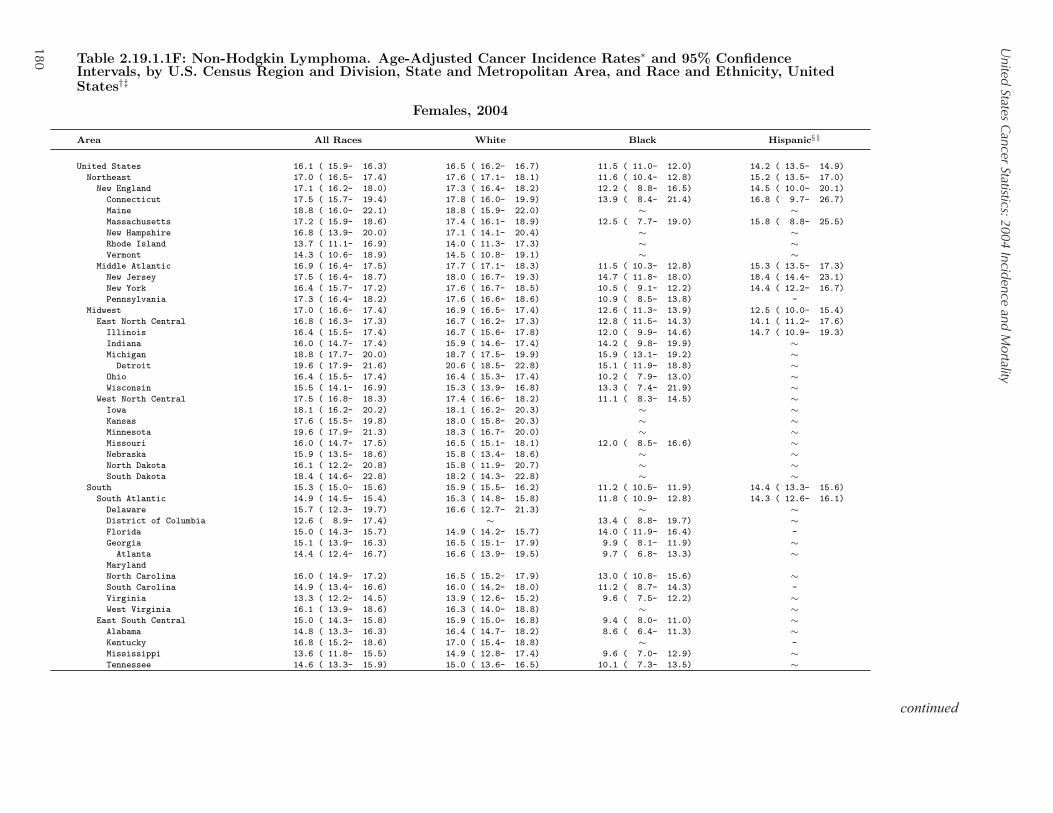
United
States Cancer Statistics: 2004 Incid
ence and M
ortality
��0
continued
Table 2.19.1.1F: Non-Hodgkin Lymphoma. Age-Adjusted Cancer Incidence Rates∗ and 95% ConfidenceIntervals, by U.S. Census Region and Division, State and Metropolitan Area, and Race and Ethnicity, UnitedStates†‡
Females, 2004
Area All Races White Black Hispanic§
United States 16.1 ( 15.9- 16.3) 16.5 ( 16.2- 16.7) 11.5 ( 11.0- 12.0) 14.2 ( 13.5- 14.9)
Northeast 17.0 ( 16.5- 17.4) 17.6 ( 17.1- 18.1) 11.6 ( 10.4- 12.8) 15.2 ( 13.5- 17.0)
New England 17.1 ( 16.2- 18.0) 17.3 ( 16.4- 18.2) 12.2 ( 8.8- 16.5) 14.5 ( 10.0- 20.1)
Connecticut 17.5 ( 15.7- 19.4) 17.8 ( 16.0- 19.9) 13.9 ( 8.4- 21.4) 16.8 ( 9.7- 26.7)
Maine 18.8 ( 16.0- 22.1) 18.8 ( 15.9- 22.0) ∼ ∼Massachusetts 17.2 ( 15.9- 18.6) 17.4 ( 16.1- 18.9) 12.5 ( 7.7- 19.0) 15.8 ( 8.8- 25.5)
New Hampshire 16.8 ( 13.9- 20.0) 17.1 ( 14.1- 20.4) ∼ ∼Rhode Island 13.7 ( 11.1- 16.9) 14.0 ( 11.3- 17.3) ∼ ∼Vermont 14.3 ( 10.6- 18.9) 14.5 ( 10.8- 19.1) ∼ ∼
Middle Atlantic 16.9 ( 16.4- 17.5) 17.7 ( 17.1- 18.3) 11.5 ( 10.3- 12.8) 15.3 ( 13.5- 17.3)
New Jersey 17.5 ( 16.4- 18.7) 18.0 ( 16.7- 19.3) 14.7 ( 11.8- 18.0) 18.4 ( 14.4- 23.1)
New York 16.4 ( 15.7- 17.2) 17.6 ( 16.7- 18.5) 10.5 ( 9.1- 12.2) 14.4 ( 12.2- 16.7)
Pennsylvania 17.3 ( 16.4- 18.2) 17.6 ( 16.6- 18.6) 10.9 ( 8.5- 13.8) -
Midwest 17.0 ( 16.6- 17.4) 16.9 ( 16.5- 17.4) 12.6 ( 11.3- 13.9) 12.5 ( 10.0- 15.4)
East North Central 16.8 ( 16.3- 17.3) 16.7 ( 16.2- 17.3) 12.8 ( 11.5- 14.3) 14.1 ( 11.2- 17.6)
Illinois 16.4 ( 15.5- 17.4) 16.7 ( 15.6- 17.8) 12.0 ( 9.9- 14.6) 14.7 ( 10.9- 19.3)
Indiana 16.0 ( 14.7- 17.4) 15.9 ( 14.6- 17.4) 14.2 ( 9.8- 19.9) ∼Michigan 18.8 ( 17.7- 20.0) 18.7 ( 17.5- 19.9) 15.9 ( 13.1- 19.2) ∼
Detroit 19.6 ( 17.9- 21.6) 20.6 ( 18.5- 22.8) 15.1 ( 11.9- 18.8) ∼Ohio 16.4 ( 15.5- 17.4) 16.4 ( 15.3- 17.4) 10.2 ( 7.9- 13.0) ∼Wisconsin 15.5 ( 14.1- 16.9) 15.3 ( 13.9- 16.8) 13.3 ( 7.4- 21.9) ∼
West North Central 17.5 ( 16.8- 18.3) 17.4 ( 16.6- 18.2) 11.1 ( 8.3- 14.5) ∼Iowa 18.1 ( 16.2- 20.2) 18.1 ( 16.2- 20.3) ∼ ∼Kansas 17.6 ( 15.5- 19.8) 18.0 ( 15.8- 20.3) ∼ ∼Minnesota 19.6 ( 17.9- 21.3) 18.3 ( 16.7- 20.0) ∼ ∼Missouri 16.0 ( 14.7- 17.5) 16.5 ( 15.1- 18.1) 12.0 ( 8.5- 16.6) ∼Nebraska 15.9 ( 13.5- 18.6) 15.8 ( 13.4- 18.6) ∼ ∼North Dakota 16.1 ( 12.2- 20.8) 15.8 ( 11.9- 20.7) ∼ ∼South Dakota 18.4 ( 14.6- 22.8) 18.2 ( 14.3- 22.8) ∼ ∼
South 15.3 ( 15.0- 15.6) 15.9 ( 15.5- 16.2) 11.2 ( 10.5- 11.9) 14.4 ( 13.3- 15.6)
South Atlantic 14.9 ( 14.5- 15.4) 15.3 ( 14.8- 15.8) 11.8 ( 10.9- 12.8) 14.3 ( 12.6- 16.1)
Delaware 15.7 ( 12.3- 19.7) 16.6 ( 12.7- 21.3) ∼ ∼District of Columbia 12.6 ( 8.9- 17.4) ∼ 13.4 ( 8.8- 19.7) ∼Florida 15.0 ( 14.3- 15.7) 14.9 ( 14.2- 15.7) 14.0 ( 11.9- 16.4) -
Georgia 15.1 ( 13.9- 16.3) 16.5 ( 15.1- 17.9) 9.9 ( 8.1- 11.9) ∼Atlanta 14.4 ( 12.4- 16.7) 16.6 ( 13.9- 19.5) 9.7 ( 6.8- 13.3) ∼
Maryland
North Carolina 16.0 ( 14.9- 17.2) 16.5 ( 15.2- 17.9) 13.0 ( 10.8- 15.6) ∼South Carolina 14.9 ( 13.4- 16.6) 16.0 ( 14.2- 18.0) 11.2 ( 8.7- 14.3) -
Virginia 13.3 ( 12.2- 14.5) 13.9 ( 12.6- 15.2) 9.6 ( 7.5- 12.2) ∼West Virginia 16.1 ( 13.9- 18.6) 16.3 ( 14.0- 18.8) ∼ ∼
East South Central 15.0 ( 14.3- 15.8) 15.9 ( 15.0- 16.8) 9.4 ( 8.0- 11.0) ∼Alabama 14.8 ( 13.3- 16.3) 16.4 ( 14.7- 18.2) 8.6 ( 6.4- 11.3) ∼Kentucky 16.8 ( 15.2- 18.6) 17.0 ( 15.4- 18.8) ∼ -
Mississippi 13.6 ( 11.8- 15.5) 14.9 ( 12.8- 17.4) 9.6 ( 7.0- 12.9) ∼Tennessee 14.6 ( 13.3- 15.9) 15.0 ( 13.6- 16.5) 10.1 ( 7.3- 13.5) ∼

Cancer Incidence and M
ortality, by U.S. C
ensus Region and D
i�ision, State, and Metropolitan A
rea
���
Table 2.19.1.1F: Non-Hodgkin Lymphoma. Age-Adjusted Cancer Incidence Rates∗ and 95% ConfidenceIntervals, by U.S. Census Region and Division, State and Metropolitan Area, and Race and Ethnicity, UnitedStates†‡ (continued)
Females, 2004
Area All Races White Black Hispanic§
West South Central 16.2 ( 15.6- 16.9) 16.7 ( 16.1- 17.4) 11.0 ( 9.6- 12.6) 14.8 ( 13.2- 16.4)
Arkansas 16.0 ( 14.1- 18.0) 16.8 ( 14.7- 19.1) ∼ ∼Louisiana 17.7 ( 16.0- 19.4) 19.3 ( 17.3- 21.5) 13.3 ( 10.7- 16.4) ∼Oklahoma 16.3 ( 14.6- 18.1) 16.9 ( 15.0- 18.9) ∼ ∼Texas 15.9 ( 15.1- 16.7) 16.2 ( 15.4- 17.0) 11.0 ( 9.1- 13.2) 14.8 ( 13.3- 16.5)
West 15.5 ( 15.1- 16.0) 15.8 ( 15.4- 16.3) 11.1 ( 9.5- 13.0) 13.8 ( 12.8- 15.0)
Mountain 14.9 ( 14.1- 15.6) 14.8 ( 14.0- 15.6) 9.9 ( 6.1- 15.0) 11.1 ( 9.3- 13.2)
Arizona 12.0 ( 10.8- 13.3) 12.4 ( 11.1- 13.7) ∼ 9.0 ( 6.3- 12.3)
Colorado 16.6 ( 14.9- 18.4) 15.9 ( 14.2- 17.8) ∼ 11.7 ( 7.7- 17.0)
Idaho 18.0 ( 15.0- 21.4) 17.9 ( 14.9- 21.3) ∼ ∼Montana 13.8 ( 10.9- 17.4) 13.7 ( 10.7- 17.3) ∼ ∼Nevada 16.0 ( 13.7- 18.5) 16.1 ( 13.7- 18.8) ∼ ∼New Mexico 14.5 ( 12.3- 17.0) 14.5 ( 12.1- 17.1) ∼ 10.4 ( 7.2- 14.4)
Utah 16.8 ( 14.3- 19.6) 16.7 ( 14.2- 19.5) ∼ ∼Wyoming 17.0 ( 12.5- 22.6) 15.3 ( 11.0- 20.8) ∼ ∼
Pacific 15.8 ( 15.3- 16.3) 16.3 ( 15.7- 16.9) 11.4 ( 9.6- 13.5) 14.7 ( 13.4- 16.1)
Alaska 12.5 ( 8.1- 18.2) 13.5 ( 8.3- 20.5) ∼ ∼California 15.4 ( 14.8- 16.0) 16.0 ( 15.4- 16.7) 11.0 ( 9.1- 13.1) 14.8 ( 13.5- 16.2)
San Francisco-Oakland 16.2 ( 14.6- 17.9) 17.9 ( 15.8- 20.1) 14.9 ( 10.1- 21.0) 18.1 ( 13.2- 24.2)
San Jose-Monterey 16.9 ( 14.6- 19.5) 17.7 ( 15.0- 20.7) ∼ 13.1 ( 8.3- 19.4)
Los Angeles 15.4 ( 14.3- 16.5) 16.4 ( 15.0- 17.8) 11.0 ( 8.2- 14.3) 14.3 ( 12.2- 16.5)
Hawaii 13.4 ( 10.9- 16.3) 15.4 ( 10.1- 22.7) ∼ ∼Oregon 16.5 ( 14.8- 18.4) 16.1 ( 14.3- 18.0) ∼ ∼Washington 18.5 ( 17.0- 20.0) 18.2 ( 16.6- 19.8) 19.6 ( 10.8- 32.3) ∼
Seattle-Puget Sound 18.2 ( 16.5- 20.1) 18.6 ( 16.7- 20.6) ∼ ∼∗ Rates are per 100,000 persons and are age-adjusted to the 2000 U.S. standard population (19 age groups - Census P25-1130).† Data are from all state and metropolitan area cancer registries, except Maryland. Included data cover approximately 98% of the population and met data
quality criteria for all invasive cancer sites combined. See Appendix B for registry-specific data quality information.‡ Invasive cancers only.
§ Data for specified racial or ethnic populations other than white and black should be interpreted with caution. See Technical Notes.
Hispanic origin is not mutually exclusive from race categories (white, black).
∼ Rates are suppressed if fewer than 16 cases were reported in a specific category (area, race, ethnicity).
- Rates are suppressed at the state’s or metropolitan area’s request. See Technical Notes.
Notes: Cases from suppressed rates are included in the U.S. and region/division rates. U.S. rates are as presented in Table 1.1.1.1F. Michigan, Georgia,
California, and Washington state rates each include cases from the SEER metropolitan areas.

United
States Cancer Statistics: 2004 Incid
ence and M
ortality
���
continued
Table 2.19.1.2M: Non-Hodgkin Lymphoma. Age-Adjusted Cancer Death Rates∗ and 95% Confidence Intervals,by U.S. Census Region and Division, State, and Race and Ethnicity, United States†
Males, 2004
Area All Races White Black Hispanic‡§
United States 8.8 ( 8.7- 9.0) 9.2 ( 9.0- 9.4) 6.2 ( 5.7- 6.7) 6.5 ( 5.9- 7.0)
Northeast 8.7 ( 8.3- 9.1) 9.0 ( 8.6- 9.4) 5.7 ( 4.7- 6.9) 6.1 ( 4.7- 7.6)
New England 8.6 ( 7.9- 9.3) 8.6 ( 7.9- 9.4) ∼ ∼Connecticut 8.0 ( 6.6- 9.5) 8.0 ( 6.7- 9.6) ∼ ∼Maine 9.8 ( 7.5- 12.6) 9.5 ( 7.2- 12.2) ∼ ∼Massachusetts 8.8 ( 7.7- 9.9) 8.9 ( 7.8- 10.1) ∼ ∼New Hampshire 9.1 ( 6.7- 12.1) 9.0 ( 6.7- 12.0) ∼ ∼Rhode Island 7.7 ( 5.5- 10.6) 8.2 ( 5.8- 11.2) ∼ ∼Vermont 8.4 ( 5.4- 12.6) 8.1 ( 5.1- 12.3) ∼ ∼
Middle Atlantic 8.7 ( 8.3- 9.2) 9.2 ( 8.7- 9.6) 5.8 ( 4.7- 7.0) 6.7 ( 5.2- 8.5)
New Jersey 9.3 ( 8.4- 10.3) 9.7 ( 8.7- 10.8) 7.4 ( 4.9- 10.7) 6.8 ( 4.0- 10.6)
New York 7.8 ( 7.2- 8.4) 8.3 ( 7.6- 9.0) 5.5 ( 4.2- 7.1) 6.4 ( 4.7- 8.6)
Pennsylvania 9.5 ( 8.8- 10.3) 9.9 ( 9.1- 10.8) 4.7 ( 2.8- 7.4) ∼Midwest 9.4 ( 9.1- 9.8) 9.6 ( 9.3- 10.0) 6.7 ( 5.6- 8.0) 5.7 ( 3.9- 8.0)
East North Central 9.5 ( 9.1- 9.9) 9.8 ( 9.4- 10.3) 6.1 ( 5.0- 7.4) 6.0 ( 3.9- 8.7)
Illinois 9.3 ( 8.5- 10.2) 9.9 ( 9.0- 10.9) 5.2 ( 3.5- 7.4) 7.3 ( 4.3- 11.4)
Indiana 9.7 ( 8.5- 11.0) 10.0 ( 8.8- 11.4) ∼ ∼Michigan 9.6 ( 8.6- 10.5) 9.9 ( 8.9- 11.0) 6.6 ( 4.4- 9.5) ∼Ohio 9.5 ( 8.6- 10.3) 9.6 ( 8.8- 10.6) 8.2 ( 5.7- 11.3) ∼Wisconsin 9.4 ( 8.3- 10.7) 9.7 ( 8.5- 11.0) ∼ ∼
West North Central 9.2 ( 8.6- 9.9) 9.2 ( 8.6- 9.9) 10.0 ( 6.7- 14.4) ∼Iowa 8.6 ( 7.2- 10.2) 8.6 ( 7.2- 10.3) ∼ ∼Kansas 10.1 ( 8.3- 12.0) 10.0 ( 8.2- 12.0) ∼ ∼Minnesota 10.1 ( 8.8- 11.6) 10.0 ( 8.7- 11.5) ∼ ∼Missouri 9.1 ( 8.0- 10.4) 9.2 ( 8.0- 10.5) 9.2 ( 5.2- 14.8) ∼Nebraska 7.9 ( 6.1- 10.2) 7.9 ( 6.0- 10.2) ∼ ∼North Dakota 7.4 ( 4.7- 11.0) 6.9 ( 4.3- 10.6) ∼ ∼South Dakota 9.5 ( 6.6- 13.1) 9.6 ( 6.7- 13.4) ∼ ∼
South 8.8 ( 8.5- 9.1) 9.2 ( 8.9- 9.5) 6.1 ( 5.4- 6.7) 6.6 ( 5.7- 7.5)
South Atlantic 8.6 ( 8.2- 9.0) 9.0 ( 8.6- 9.4) 5.8 ( 5.0- 6.7) 6.8 ( 5.5- 8.3)
Delaware 10.2 ( 7.1- 14.1) 11.2 ( 7.8- 15.7) ∼ ∼District of Columbia ∼ ∼ ∼ ∼Florida 8.9 ( 8.4- 9.6) 9.2 ( 8.6- 9.8) 5.6 ( 4.1- 7.6) 7.9 ( 6.3- 9.6)
Georgia 9.0 ( 7.8- 10.2) 9.6 ( 8.3- 11.1) 6.1 ( 4.3- 8.4) ∼Maryland 8.1 ( 7.0- 9.4) 8.7 ( 7.4- 10.3) 4.9 ( 3.2- 7.2) ∼North Carolina 8.7 ( 7.7- 9.7) 9.2 ( 8.1- 10.4) 6.3 ( 4.3- 8.7) ∼South Carolina 7.4 ( 6.2- 8.8) 7.6 ( 6.2- 9.3) 6.4 ( 4.1- 9.4) ∼Virginia 8.3 ( 7.3- 9.5) 8.9 ( 7.7- 10.2) 6.1 ( 4.0- 8.9) ∼West Virginia 10.7 ( 8.6- 13.2) 10.9 ( 8.8- 13.4) ∼ ∼
East South Central 9.1 ( 8.4- 9.9) 9.7 ( 8.9- 10.5) 5.7 ( 4.3- 7.3) ∼Alabama 8.6 ( 7.3- 10.1) 9.4 ( 7.9- 11.1) 5.6 ( 3.3- 8.6) ∼Kentucky 8.9 ( 7.5- 10.5) 9.2 ( 7.7- 10.9) ∼ ∼Mississippi 8.9 ( 7.2- 10.8) 9.8 ( 7.7- 12.2) 6.3 ( 3.8- 9.8) ∼Tennessee 9.8 ( 8.5- 11.1) 10.1 ( 8.8- 11.6) 5.8 ( 3.4- 9.2) ∼
West South Central 9.0 ( 8.4- 9.5) 9.2 ( 8.6- 9.8) 6.9 ( 5.5- 8.6) 6.5 ( 5.2- 7.9)
Arkansas 9.0 ( 7.4- 10.8) 9.5 ( 7.8- 11.6) ∼ ∼

Cancer Incidence and M
ortality, by U.S. C
ensus Region and D
i�ision, State, and Metropolitan A
rea
��3
Table 2.19.1.2M: Non-Hodgkin Lymphoma. Age-Adjusted Cancer Death Rates∗ and 95% Confidence Intervals,by U.S. Census Region and Division, State, and Race and Ethnicity, United States† (continued)
Males, 2004
Area All Races White Black Hispanic‡§
Louisiana 9.7 ( 8.2- 11.2) 10.8 ( 9.1- 12.7) 6.3 ( 4.2- 9.1) ∼Oklahoma 10.3 ( 8.7- 12.0) 10.6 ( 8.9- 12.4) ∼ ∼Texas 8.6 ( 7.9- 9.3) 8.6 ( 7.9- 9.4) 8.7 ( 6.4- 11.4) 6.8 ( 5.5- 8.3)
West 8.5 ( 8.2- 8.9) 8.9 ( 8.5- 9.3) 6.7 ( 5.3- 8.4) 6.6 ( 5.7- 7.6)
Mountain 8.1 ( 7.5- 8.8) 8.3 ( 7.7- 9.0) ∼ 6.7 ( 5.0- 8.8)
Arizona 8.4 ( 7.3- 9.6) 8.7 ( 7.5- 9.9) ∼ 9.8 ( 6.2- 14.5)
Colorado 8.3 ( 6.9- 9.8) 8.3 ( 6.9- 9.9) ∼ ∼Idaho 8.7 ( 6.5- 11.5) 8.6 ( 6.3- 11.3) ∼ ∼Montana 10.0 ( 7.3- 13.5) 9.8 ( 7.0- 13.3) ∼ ∼Nevada 7.5 ( 5.8- 9.5) 8.1 ( 6.2- 10.3) ∼ ∼New Mexico 5.9 ( 4.3- 7.8) 6.1 ( 4.5- 8.2) ∼ ∼Utah 9.3 ( 7.3- 11.7) 9.4 ( 7.4- 11.9) ∼ ∼Wyoming 7.6 ( 4.3- 12.4) 7.7 ( 4.3- 12.7) ∼ ∼
Pacific 8.7 ( 8.3- 9.1) 9.2 ( 8.7- 9.7) 6.8 ( 5.2- 8.7) 6.6 ( 5.6- 7.7)
Alaska ∼ ∼ ∼ ∼California 8.3 ( 7.9- 8.8) 8.7 ( 8.2- 9.3) 7.0 ( 5.3- 9.0) 6.5 ( 5.5- 7.7)
Hawaii 6.6 ( 4.7- 9.0) ∼ ∼ ∼Oregon 11.1 ( 9.5- 12.8) 11.2 ( 9.6- 13.0) ∼ ∼Washington 9.8 ( 8.6- 11.1) 10.3 ( 9.0- 11.7) ∼ ∼
∗ Rates are per 100,000 persons and are age-adjusted to the 2000 U.S. standard population (19 age groups - Census P25-1130).† Data are from the National Vital Statistics System (NVSS).‡ Data for specified racial or ethnic populations other than white and black should be interpreted with caution. See Technical Notes.
§ Hispanic origin is not mutually exclusive from race categories (white, black).
∼ Rates are suppressed if fewer than 16 cases were reported in a specific category (area, race, ethnicity).
Note: U.S. rates are as presented in Table 1.1.1.2M.

United
States Cancer Statistics: 2004 Incid
ence and M
ortality
���
continued
Table 2.19.1.2F: Non-Hodgkin Lymphoma. Age-Adjusted Cancer Death Rates∗ and 95% Confidence Intervals,by U.S. Census Region and Division, State, and Race and Ethnicity, United States†
Females, 2004
Area All Races White Black Hispanic‡§
United States 5.7 ( 5.6- 5.8) 5.9 ( 5.8- 6.0) 4.1 ( 3.8- 4.4) 4.2 ( 3.8- 4.6)
Northeast 5.9 ( 5.6- 6.1) 6.2 ( 5.9- 6.5) 3.6 ( 2.9- 4.3) 3.8 ( 3.0- 4.9)
New England 5.9 ( 5.5- 6.5) 6.0 ( 5.5- 6.5) 4.9 ( 2.8- 7.9) ∼Connecticut 5.7 ( 4.8- 6.8) 6.0 ( 5.0- 7.2) ∼ ∼Maine 7.2 ( 5.5- 9.2) 7.2 ( 5.6- 9.3) ∼ ∼Massachusetts 6.1 ( 5.3- 6.9) 5.9 ( 5.2- 6.8) ∼ ∼New Hampshire 5.6 ( 4.1- 7.6) 5.7 ( 4.1- 7.7) ∼ ∼Rhode Island 5.2 ( 3.7- 7.1) 5.4 ( 3.9- 7.5) ∼ ∼Vermont 5.2 ( 3.2- 8.2) 5.3 ( 3.2- 8.3) ∼ ∼
Middle Atlantic 5.8 ( 5.6- 6.2) 6.3 ( 5.9- 6.6) 3.4 ( 2.8- 4.2) 3.9 ( 2.9- 5.0)
New Jersey 5.8 ( 5.2- 6.5) 6.2 ( 5.5- 6.9) 3.2 ( 1.9- 5.1) ∼New York 5.4 ( 5.0- 5.9) 5.9 ( 5.4- 6.4) 3.5 ( 2.7- 4.6) 3.8 ( 2.8- 5.1)
Pennsylvania 6.5 ( 5.9- 7.0) 6.8 ( 6.2- 7.4) 3.2 ( 1.9- 4.9) ∼Midwest 6.1 ( 5.8- 6.3) 6.3 ( 6.0- 6.5) 3.7 ( 3.0- 4.4) 4.3 ( 2.9- 6.2)
East North Central 6.1 ( 5.8- 6.4) 6.3 ( 6.0- 6.6) 3.9 ( 3.1- 4.7) 3.7 ( 2.3- 5.7)
Illinois 6.2 ( 5.6- 6.8) 6.6 ( 6.0- 7.3) 3.3 ( 2.2- 4.7) ∼Indiana 6.6 ( 5.8- 7.5) 6.6 ( 5.8- 7.6) ∼ ∼Michigan 6.1 ( 5.5- 6.8) 6.4 ( 5.7- 7.1) 4.2 ( 2.8- 6.1) ∼Ohio 5.6 ( 5.1- 6.2) 5.8 ( 5.2- 6.4) 3.4 ( 2.2- 5.2) ∼Wisconsin 6.1 ( 5.3- 7.0) 6.2 ( 5.4- 7.1) ∼ ∼
West North Central 6.0 ( 5.6- 6.4) 6.1 ( 5.7- 6.6) ∼ ∼Iowa 6.4 ( 5.3- 7.6) 6.4 ( 5.3- 7.6) ∼ ∼Kansas 6.1 ( 5.0- 7.4) 6.2 ( 5.0- 7.6) ∼ ∼Minnesota 6.2 ( 5.3- 7.2) 6.2 ( 5.3- 7.2) ∼ ∼Missouri 5.9 ( 5.1- 6.7) 6.2 ( 5.4- 7.1) ∼ ∼Nebraska 5.9 ( 4.5- 7.5) 6.1 ( 4.7- 7.8) ∼ ∼North Dakota 4.4 ( 2.7- 7.0) 4.5 ( 2.8- 7.2) ∼ ∼South Dakota 5.5 ( 3.6- 8.0) 5.6 ( 3.7- 8.3) ∼ ∼
South 5.5 ( 5.3- 5.7) 5.8 ( 5.6- 6.0) 4.2 ( 3.8- 4.7) 4.2 ( 3.6- 4.9)
South Atlantic 5.4 ( 5.2- 5.7) 5.6 ( 5.4- 5.9) 4.3 ( 3.7- 4.9) 3.9 ( 3.1- 4.9)
Delaware 6.4 ( 4.4- 9.1) 6.4 ( 4.2- 9.4) ∼ ∼District of Columbia 5.1 ( 2.9- 8.4) ∼ ∼ ∼Florida 5.3 ( 4.9- 5.7) 5.4 ( 4.9- 5.8) 4.3 ( 3.1- 5.7) 4.1 ( 3.2- 5.3)
Georgia 5.3 ( 4.6- 6.0) 5.7 ( 4.9- 6.6) 3.6 ( 2.5- 5.0) ∼Maryland 5.3 ( 4.5- 6.2) 5.9 ( 4.9- 7.0) 3.7 ( 2.3- 5.4) ∼North Carolina 6.0 ( 5.4- 6.8) 6.2 ( 5.4- 7.0) 5.7 ( 4.2- 7.6) ∼South Carolina 5.3 ( 4.5- 6.3) 5.3 ( 4.3- 6.5) 5.1 ( 3.4- 7.3) ∼Virginia 5.4 ( 4.7- 6.2) 5.9 ( 5.2- 6.8) 2.6 ( 1.5- 4.1) ∼West Virginia 5.6 ( 4.4- 7.2) 5.6 ( 4.3- 7.1) ∼ ∼
East South Central 5.7 ( 5.2- 6.2) 6.0 ( 5.5- 6.6) 3.7 ( 2.8- 4.7) ∼Alabama 6.2 ( 5.3- 7.2) 6.8 ( 5.8- 8.1) 4.0 ( 2.6- 6.0) ∼Kentucky 6.1 ( 5.2- 7.2) 6.3 ( 5.3- 7.4) ∼ ∼Mississippi 4.6 ( 3.6- 5.8) 5.2 ( 4.0- 6.7) ∼ ∼Tennessee 5.5 ( 4.8- 6.4) 5.6 ( 4.8- 6.6) 4.4 ( 2.6- 6.8) ∼
West South Central 5.7 ( 5.3- 6.0) 5.9 ( 5.5- 6.3) 4.6 ( 3.7- 5.6) 4.5 ( 3.6- 5.5)
Arkansas 6.0 ( 4.9- 7.3) 6.7 ( 5.4- 8.2) ∼ ∼
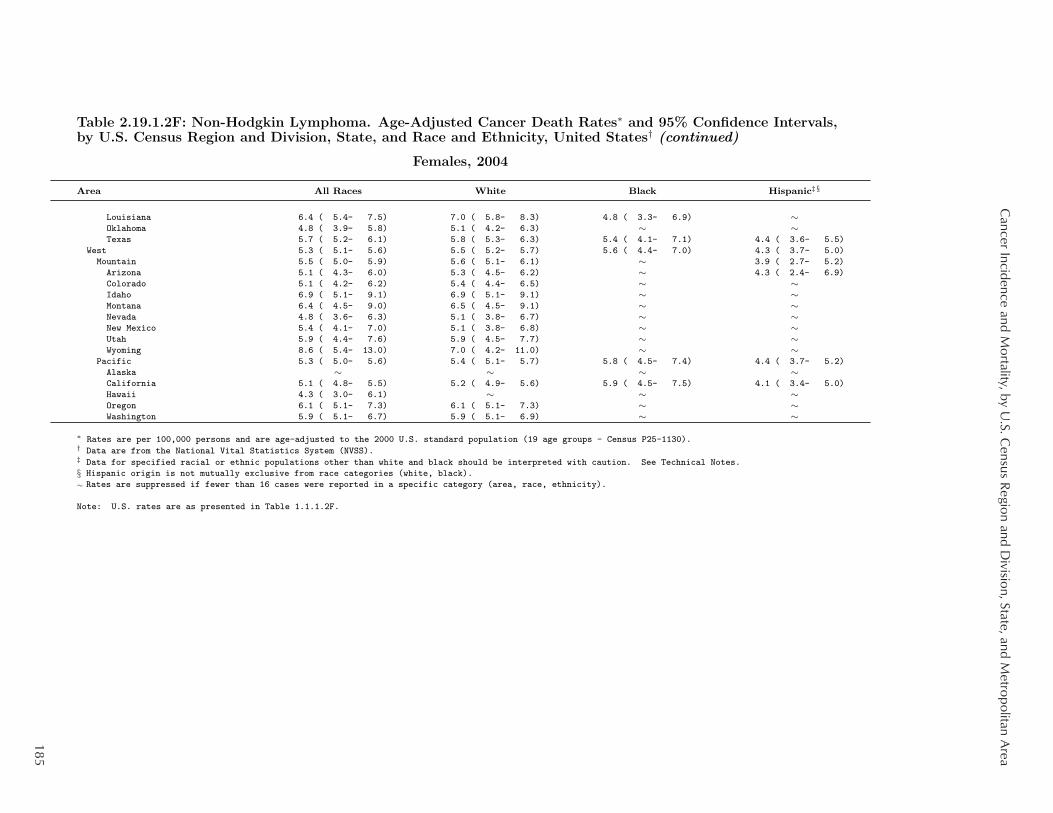
Cancer Incidence and M
ortality, by U.S. C
ensus Region and D
i�ision, State, and Metropolitan A
rea
���
Table 2.19.1.2F: Non-Hodgkin Lymphoma. Age-Adjusted Cancer Death Rates∗ and 95% Confidence Intervals,by U.S. Census Region and Division, State, and Race and Ethnicity, United States† (continued)
Females, 2004
Area All Races White Black Hispanic‡§
Louisiana 6.4 ( 5.4- 7.5) 7.0 ( 5.8- 8.3) 4.8 ( 3.3- 6.9) ∼Oklahoma 4.8 ( 3.9- 5.8) 5.1 ( 4.2- 6.3) ∼ ∼Texas 5.7 ( 5.2- 6.1) 5.8 ( 5.3- 6.3) 5.4 ( 4.1- 7.1) 4.4 ( 3.6- 5.5)
West 5.3 ( 5.1- 5.6) 5.5 ( 5.2- 5.7) 5.6 ( 4.4- 7.0) 4.3 ( 3.7- 5.0)
Mountain 5.5 ( 5.0- 5.9) 5.6 ( 5.1- 6.1) ∼ 3.9 ( 2.7- 5.2)
Arizona 5.1 ( 4.3- 6.0) 5.3 ( 4.5- 6.2) ∼ 4.3 ( 2.4- 6.9)
Colorado 5.1 ( 4.2- 6.2) 5.4 ( 4.4- 6.5) ∼ ∼Idaho 6.9 ( 5.1- 9.1) 6.9 ( 5.1- 9.1) ∼ ∼Montana 6.4 ( 4.5- 9.0) 6.5 ( 4.5- 9.1) ∼ ∼Nevada 4.8 ( 3.6- 6.3) 5.1 ( 3.8- 6.7) ∼ ∼New Mexico 5.4 ( 4.1- 7.0) 5.1 ( 3.8- 6.8) ∼ ∼Utah 5.9 ( 4.4- 7.6) 5.9 ( 4.5- 7.7) ∼ ∼Wyoming 8.6 ( 5.4- 13.0) 7.0 ( 4.2- 11.0) ∼ ∼
Pacific 5.3 ( 5.0- 5.6) 5.4 ( 5.1- 5.7) 5.8 ( 4.5- 7.4) 4.4 ( 3.7- 5.2)
Alaska ∼ ∼ ∼ ∼California 5.1 ( 4.8- 5.5) 5.2 ( 4.9- 5.6) 5.9 ( 4.5- 7.5) 4.1 ( 3.4- 5.0)
Hawaii 4.3 ( 3.0- 6.1) ∼ ∼ ∼Oregon 6.1 ( 5.1- 7.3) 6.1 ( 5.1- 7.3) ∼ ∼Washington 5.9 ( 5.1- 6.7) 5.9 ( 5.1- 6.9) ∼ ∼
∗ Rates are per 100,000 persons and are age-adjusted to the 2000 U.S. standard population (19 age groups - Census P25-1130).† Data are from the National Vital Statistics System (NVSS).‡ Data for specified racial or ethnic populations other than white and black should be interpreted with caution. See Technical Notes.
§ Hispanic origin is not mutually exclusive from race categories (white, black).
∼ Rates are suppressed if fewer than 16 cases were reported in a specific category (area, race, ethnicity).
Note: U.S. rates are as presented in Table 1.1.1.2F.

United
States Cancer Statistics: 2004 Incid
ence and M
ortality
���
continued
Table 2.20.1.1M: Oral Cavity and Pharynx. Age-Adjusted Invasive Cancer Incidence Rates∗ and 95% ConfidenceIntervals, by U.S. Census Region and Division, State and Metropolitan Area, and Race and Ethnicity, UnitedStates†‡
Males, 2004
Area All Races White Black Hispanic§
United States 15.7 ( 15.5- 15.9) 15.5 ( 15.3- 15.7) 17.6 ( 16.9- 18.4) 10.4 ( 9.8- 11.1)
Northeast 15.0 ( 14.5- 15.4) 14.7 ( 14.2- 15.2) 17.3 ( 15.6- 19.1) 14.4 ( 12.4- 16.5)
New England 15.4 ( 14.5- 16.4) 15.3 ( 14.4- 16.3) 19.0 ( 13.7- 25.6) 14.4 ( 9.4- 20.8)
Connecticut 13.9 ( 12.2- 15.8) 13.2 ( 11.5- 15.2) 26.2 ( 16.7- 38.6) ∼Maine 19.7 ( 16.5- 23.3) 19.7 ( 16.5- 23.3) ∼ ∼Massachusetts 15.5 ( 14.2- 17.0) 15.7 ( 14.3- 17.2) ∼ 14.9 ( 8.3- 24.4)
New Hampshire 14.0 ( 11.2- 17.2) 13.8 ( 11.1- 17.0) ∼ ∼Rhode Island 15.3 ( 12.1- 19.0) 14.6 ( 11.4- 18.4) ∼ ∼Vermont 16.3 ( 12.2- 21.5) 16.5 ( 12.3- 21.8) ∼ ∼
Middle Atlantic 14.8 ( 14.3- 15.3) 14.4 ( 13.9- 15.0) 17.1 ( 15.3- 19.0) 14.3 ( 12.2- 16.7)
New Jersey 14.1 ( 13.0- 15.3) 13.6 ( 12.4- 14.9) 22.4 ( 17.9- 27.5) 14.3 ( 10.2- 19.3)
New York 15.0 ( 14.2- 15.8) 14.6 ( 13.7- 15.5) 15.8 ( 13.6- 18.3) 14.7 ( 12.1- 17.7)
Pennsylvania 15.0 ( 14.0- 15.9) 14.8 ( 13.8- 15.8) 15.5 ( 12.2- 19.5) -
Midwest 15.6 ( 15.2- 16.1) 15.0 ( 14.5- 15.4) 19.0 ( 17.2- 20.9) 9.3 ( 7.1- 11.9)
East North Central 15.5 ( 15.0- 16.1) 14.8 ( 14.2- 15.3) 19.2 ( 17.2- 21.2) 10.1 ( 7.6- 13.1)
Illinois 16.8 ( 15.8- 17.9) 15.4 ( 14.3- 16.5) 23.5 ( 20.0- 27.5) 8.7 ( 5.7- 12.7)
Indiana 14.8 ( 13.4- 16.3) 14.6 ( 13.2- 16.2) 17.4 ( 11.8- 24.6) ∼Michigan 15.3 ( 14.2- 16.4) 14.5 ( 13.4- 15.7) 17.9 ( 14.4- 22.0) ∼Detroit 17.4 ( 15.5- 19.4) 17.5 ( 15.4- 19.8) 16.7 ( 12.8- 21.3) ∼
Ohio 14.8 ( 13.8- 15.8) 14.3 ( 13.3- 15.4) 15.1 ( 11.8- 19.0) ∼Wisconsin 15.5 ( 14.0- 17.1) 15.2 ( 13.7- 16.8) 20.5 ( 11.1- 34.2) ∼
West North Central 15.8 ( 15.0- 16.6) 15.3 ( 14.5- 16.2) 18.1 ( 13.9- 23.1) ∼Iowa 17.0 ( 15.0- 19.3) 16.5 ( 14.4- 18.7) ∼ ∼Kansas 16.2 ( 14.1- 18.5) 15.9 ( 13.7- 18.3) ∼ ∼Minnesota 15.7 ( 14.1- 17.4) 14.6 ( 13.1- 16.3) 33.9 ( 17.2- 58.8) ∼Missouri 15.2 ( 13.7- 16.7) 15.1 ( 13.6- 16.7) 15.7 ( 10.9- 21.9) ∼Nebraska 14.4 ( 12.0- 17.3) 14.4 ( 11.9- 17.3) ∼ ∼North Dakota 15.1 ( 11.2- 20.0) 15.3 ( 11.3- 20.3) ∼ ∼South Dakota 18.2 ( 14.2- 23.0) 17.6 ( 13.5- 22.4) ∼ ∼
South 16.9 ( 16.6- 17.3) 16.7 ( 16.3- 17.1) 18.0 ( 17.0- 19.1) 10.6 ( 9.6- 11.7)
South Atlantic 17.0 ( 16.5- 17.6) 16.7 ( 16.1- 17.3) 19.0 ( 17.6- 20.5) 13.3 ( 11.5- 15.2)
Delaware 17.4 ( 13.7- 21.9) 17.5 ( 13.3- 22.5) ∼ ∼District of Columbia 19.6 ( 14.3- 26.1) ∼ 23.9 ( 16.6- 33.3) ∼Florida 18.0 ( 17.1- 18.9) 18.1 ( 17.2- 19.0) 17.9 ( 15.2- 21.0) -
Georgia 16.8 ( 15.5- 18.2) 17.4 ( 15.9- 19.1) 14.5 ( 11.9- 17.6) ∼Atlanta 14.5 ( 12.3- 17.0) 14.2 ( 11.6- 17.1) 15.8 ( 11.0- 21.9) ∼
Maryland
North Carolina 17.5 ( 16.2- 18.9) 16.3 ( 14.9- 17.8) 22.8 ( 19.3- 26.7) ∼South Carolina 19.1 ( 17.3- 21.1) 17.5 ( 15.4- 19.7) 24.4 ( 20.1- 29.3) -
Virginia 14.1 ( 12.9- 15.5) 13.6 ( 12.3- 15.1) 16.8 ( 13.4- 20.8) ∼West Virginia 14.4 ( 12.1- 17.0) 14.3 ( 12.0- 16.9) ∼ ∼
East South Central 17.3 ( 16.4- 18.2) 16.9 ( 16.0- 17.9) 18.0 ( 15.7- 20.6) ∼Alabama 18.2 ( 16.4- 20.1) 19.0 ( 16.9- 21.2) 14.7 ( 11.2- 18.8) ∼Kentucky 17.7 ( 15.9- 19.7) 17.1 ( 15.3- 19.2) 18.0 ( 11.0- 27.5) -
Mississippi 18.2 ( 15.9- 20.7) 17.3 ( 14.7- 20.2) 20.5 ( 16.0- 25.9) ∼Tennessee 15.8 ( 14.4- 17.3) 15.2 ( 13.7- 16.9) 19.5 ( 15.0- 25.0) ∼

Cancer Incidence and M
ortality, by U.S. C
ensus Region and D
i�ision, State, and Metropolitan A
rea
���
Table 2.20.1.1M: Oral Cavity and Pharynx. Age-Adjusted Invasive Cancer Incidence Rates∗ and 95% ConfidenceIntervals, by U.S. Census Region and Division, State and Metropolitan Area, and Race and Ethnicity, UnitedStates†‡ (continued)
Males, 2004
Area All Races White Black Hispanic§
West South Central 16.6 ( 16.0- 17.3) 16.7 ( 16.0- 17.5) 15.7 ( 13.8- 17.8) 8.6 ( 7.3- 10.0)
Arkansas 16.8 ( 14.6- 19.1) 16.8 ( 14.6- 19.4) 12.4 ( 7.3- 19.7) ∼Louisiana 20.2 ( 18.3- 22.3) 19.8 ( 17.6- 22.3) 22.1 ( 18.2- 26.7) ∼Oklahoma 17.0 ( 15.1- 19.1) 16.6 ( 14.5- 18.8) ∼ ∼Texas 15.8 ( 14.9- 16.6) 16.2 ( 15.3- 17.1) 12.5 ( 10.2- 15.1) 8.6 ( 7.3- 10.1)
West 14.7 ( 14.2- 15.1) 15.0 ( 14.6- 15.5) 14.0 ( 11.9- 16.4) 9.0 ( 8.1- 10.1)
Mountain 13.6 ( 12.9- 14.4) 13.8 ( 13.0- 14.6) 10.5 ( 6.3- 16.1) 9.9 ( 7.9- 12.2)
Arizona 12.6 ( 11.3- 14.0) 12.4 ( 11.0- 13.8) ∼ 8.6 ( 5.5- 12.6)
Colorado 13.1 ( 11.5- 14.8) 13.4 ( 11.8- 15.2) ∼ 11.1 ( 6.6- 17.1)
Idaho 17.1 ( 14.0- 20.6) 17.3 ( 14.2- 20.9) ∼ ∼Montana 16.3 ( 12.9- 20.3) 16.0 ( 12.6- 20.1) ∼ ∼Nevada 13.9 ( 11.7- 16.4) 14.4 ( 12.0- 17.1) ∼ ∼New Mexico 14.7 ( 12.3- 17.4) 15.3 ( 12.8- 18.3) ∼ 12.0 ( 8.4- 16.6)
Utah 11.7 ( 9.5- 14.2) 11.7 ( 9.5- 14.3) ∼ ∼Wyoming 16.9 ( 11.9- 23.2) 17.2 ( 12.2- 23.7) ∼ ∼
Pacific 15.1 ( 14.6- 15.7) 15.7 ( 15.1- 16.3) 14.9 ( 12.5- 17.5) 8.7 ( 7.6- 9.9)
Alaska 13.5 ( 8.8- 19.7) 15.9 ( 10.1- 23.8) ∼ ∼California 14.7 ( 14.1- 15.3) 15.3 ( 14.6- 16.0) 14.7 ( 12.2- 17.5) 8.6 ( 7.4- 9.8)
San Francisco-Oakland 15.2 ( 13.6- 17.1) 15.9 ( 13.8- 18.2) 12.6 ( 7.8- 19.2) 8.8 ( 4.9- 14.3)
San Jose-Monterey 12.9 ( 10.7- 15.3) 13.6 ( 11.1- 16.5) ∼ ∼Los Angeles 12.9 ( 11.8- 14.1) 13.2 ( 11.9- 14.6) 15.5 ( 11.7- 20.1) 9.1 ( 7.2- 11.3)
Hawaii 15.3 ( 12.4- 18.7) 23.3 ( 16.8- 31.8) ∼ ∼Oregon 15.8 ( 14.0- 17.7) 15.9 ( 14.0- 17.9) ∼ ∼Washington 17.1 ( 15.6- 18.7) 16.8 ( 15.3- 18.5) ∼ ∼Seattle-Puget Sound 16.8 ( 15.0- 18.8) 17.5 ( 15.6- 19.6) ∼ ∼
∗ Rates are per 100,000 persons and are age-adjusted to the 2000 U.S. standard population (19 age groups - Census P25-1130).† Data are from all state and metropolitan area cancer registries, except Maryland. Included data cover approximately 98% of the population and met data
quality criteria for all invasive cancer sites combined. See Appendix B for registry-specific data quality information.‡ Invasive cancers only.
§ Data for specified racial or ethnic populations other than white and black should be interpreted with caution. See Technical Notes.
Hispanic origin is not mutually exclusive from race categories (white, black).
∼ Rates are suppressed if fewer than 16 cases were reported in a specific category (area, race, ethnicity).
- Rates are suppressed at the state’s or metropolitan area’s request. See Technical Notes.
Notes: Cases from suppressed rates are included in the U.S. and region/division rates. U.S. rates are as presented in Table 1.1.1.1M. Michigan, Georgia,
California, and Washington state rates each include cases from the SEER metropolitan areas.

United
States Cancer Statistics: 2004 Incid
ence and M
ortality
���
continued
Table 2.20.1.1F: Oral Cavity and Pharynx. Age-Adjusted Invasive Cancer Incidence Rates∗ and 95% ConfidenceIntervals, by U.S. Census Region and Division, State and Metropolitan Area, and Race and Ethnicity, UnitedStates†‡
Females, 2004
Area All Races White Black Hispanic§
United States 5.9 ( 5.7- 6.0) 5.8 ( 5.7- 5.9) 5.3 ( 4.9- 5.6) 3.7 ( 3.4- 4.1)
Northeast 5.8 ( 5.6- 6.1) 5.7 ( 5.4- 6.0) 5.6 ( 4.8- 6.4) 5.1 ( 4.1- 6.2)
New England 6.0 ( 5.4- 6.5) 5.7 ( 5.1- 6.2) 9.0 ( 6.2- 12.7) ∼Connecticut 5.8 ( 4.8- 7.0) 5.4 ( 4.4- 6.6) 10.5 ( 5.9- 17.1) ∼Maine 5.7 ( 4.1- 7.6) 5.4 ( 3.9- 7.4) ∼ ∼Massachusetts 6.4 ( 5.6- 7.3) 6.2 ( 5.4- 7.1) ∼ ∼New Hampshire 5.6 ( 4.0- 7.6) 5.6 ( 4.0- 7.6) ∼ ∼Rhode Island 4.7 ( 3.1- 6.8) 3.8 ( 2.4- 5.9) ∼ ∼Vermont 5.6 ( 3.5- 8.7) 5.7 ( 3.5- 8.8) ∼ ∼
Middle Atlantic 5.8 ( 5.5- 6.1) 5.7 ( 5.4- 6.1) 5.2 ( 4.4- 6.1) 5.1 ( 4.1- 6.4)
New Jersey 6.3 ( 5.6- 7.0) 6.6 ( 5.8- 7.5) 4.3 ( 2.8- 6.3) 4.5 ( 2.6- 7.1)
New York 5.9 ( 5.5- 6.4) 5.8 ( 5.3- 6.4) 5.5 ( 4.5- 6.7) 5.6 ( 4.3- 7.2)
Pennsylvania 5.3 ( 4.8- 5.8) 5.1 ( 4.6- 5.7) 5.4 ( 3.8- 7.6) -
Midwest 5.7 ( 5.5- 6.0) 5.6 ( 5.4- 5.9) 5.4 ( 4.6- 6.2) 2.8 ( 1.8- 4.2)
East North Central 5.5 ( 5.3- 5.8) 5.4 ( 5.1- 5.7) 5.3 ( 4.4- 6.2) 2.7 ( 1.6- 4.3)
Illinois 6.0 ( 5.4- 6.6) 5.9 ( 5.3- 6.6) 5.4 ( 4.0- 7.1) ∼Indiana 5.3 ( 4.5- 6.1) 5.3 ( 4.5- 6.1) ∼ ∼Michigan 5.5 ( 4.9- 6.2) 5.3 ( 4.7- 6.0) 5.4 ( 3.8- 7.4) ∼Detroit 6.1 ( 5.1- 7.2) 6.2 ( 5.0- 7.5) 5.6 ( 3.8- 8.1) ∼
Ohio 5.0 ( 4.5- 5.6) 4.8 ( 4.2- 5.4) 4.8 ( 3.3- 6.8) ∼Wisconsin 5.9 ( 5.1- 6.9) 5.9 ( 5.0- 6.8) ∼ ∼
West North Central 6.2 ( 5.7- 6.7) 6.1 ( 5.6- 6.6) 6.0 ( 4.0- 8.7) ∼Iowa 5.9 ( 4.8- 7.1) 5.5 ( 4.5- 6.8) ∼ ∼Kansas 5.8 ( 4.6- 7.2) 5.9 ( 4.7- 7.3) ∼ ∼Minnesota 7.8 ( 6.7- 8.9) 7.5 ( 6.5- 8.6) ∼ ∼Missouri 5.4 ( 4.6- 6.2) 5.4 ( 4.6- 6.3) 6.1 ( 3.7- 9.6) ∼Nebraska 6.6 ( 5.1- 8.5) 6.6 ( 5.0- 8.5) ∼ ∼North Dakota 6.1 ( 3.8- 9.3) 5.5 ( 3.3- 8.7) ∼ ∼South Dakota 5.2 ( 3.3- 8.0) 5.6 ( 3.5- 8.5) ∼ ∼
South 6.0 ( 5.8- 6.2) 6.1 ( 5.9- 6.3) 5.1 ( 4.7- 5.6) 3.9 ( 3.3- 4.5)
South Atlantic 6.2 ( 5.9- 6.5) 6.3 ( 6.0- 6.6) 5.4 ( 4.7- 6.1) 4.9 ( 4.0- 6.0)
Delaware 5.0 ( 3.2- 7.6) 4.9 ( 2.9- 7.7) ∼ ∼District of Columbia 5.2 ( 2.9- 8.5) ∼ ∼ ∼Florida 6.7 ( 6.2- 7.2) 6.7 ( 6.2- 7.2) 6.5 ( 5.1- 8.1) -
Georgia 6.0 ( 5.3- 6.8) 6.3 ( 5.4- 7.2) 5.5 ( 4.1- 7.1) ∼Atlanta 5.6 ( 4.4- 7.0) 5.6 ( 4.2- 7.4) 5.7 ( 3.5- 8.7) ∼
Maryland
North Carolina 6.3 ( 5.6- 7.1) 6.5 ( 5.7- 7.4) 5.3 ( 3.9- 7.1) ∼South Carolina 6.1 ( 5.2- 7.2) 6.3 ( 5.2- 7.6) 5.2 ( 3.6- 7.4) -
Virginia 5.5 ( 4.8- 6.3) 5.6 ( 4.8- 6.5) 3.8 ( 2.5- 5.5) ∼West Virginia 5.6 ( 4.3- 7.1) 5.7 ( 4.4- 7.3) ∼ ∼
East South Central 5.9 ( 5.4- 6.4) 6.1 ( 5.6- 6.7) 4.4 ( 3.4- 5.5) ∼Alabama 6.5 ( 5.6- 7.6) 7.1 ( 6.0- 8.4) 4.3 ( 2.8- 6.2) ∼Kentucky 6.2 ( 5.2- 7.2) 6.1 ( 5.1- 7.2) ∼ -
Mississippi 5.2 ( 4.1- 6.4) 5.1 ( 3.9- 6.6) 4.8 ( 3.0- 7.2) ∼Tennessee 5.6 ( 4.9- 6.5) 5.7 ( 4.8- 6.7) 4.3 ( 2.6- 6.8) ∼

Cancer Incidence and M
ortality, by U.S. C
ensus Region and D
i�ision, State, and Metropolitan A
rea
���
Table 2.20.1.1F: Oral Cavity and Pharynx. Age-Adjusted Invasive Cancer Incidence Rates∗ and 95% ConfidenceIntervals, by U.S. Census Region and Division, State and Metropolitan Area, and Race and Ethnicity, UnitedStates†‡ (continued)
Females, 2004
Area All Races White Black Hispanic§
West South Central 5.7 ( 5.4- 6.1) 5.8 ( 5.4- 6.2) 5.2 ( 4.3- 6.3) 3.2 ( 2.5- 4.0)
Arkansas 6.2 ( 5.0- 7.5) 6.3 ( 5.1- 7.8) ∼ ∼Louisiana 6.3 ( 5.4- 7.4) 6.9 ( 5.7- 8.2) 5.0 ( 3.4- 7.0) ∼Oklahoma 5.9 ( 4.9- 7.1) 5.7 ( 4.6- 6.9) ∼ ∼Texas 5.5 ( 5.0- 5.9) 5.5 ( 5.0- 6.0) 5.3 ( 4.0- 6.9) 3.2 ( 2.5- 4.0)
West 5.8 ( 5.6- 6.1) 5.8 ( 5.5- 6.1) 5.3 ( 4.2- 6.7) 3.1 ( 2.6- 3.7)
Mountain 5.3 ( 4.8- 5.7) 5.3 ( 4.8- 5.8) ∼ 2.5 ( 1.7- 3.6)
Arizona 5.0 ( 4.3- 5.9) 5.0 ( 4.2- 5.9) ∼ ∼Colorado 5.1 ( 4.2- 6.1) 5.1 ( 4.1- 6.2) ∼ ∼Idaho 4.9 ( 3.4- 6.8) 5.0 ( 3.5- 7.0) ∼ ∼Montana 5.7 ( 3.8- 8.1) 5.8 ( 3.8- 8.4) ∼ ∼Nevada 5.5 ( 4.2- 7.1) 5.8 ( 4.4- 7.5) ∼ ∼New Mexico 5.2 ( 3.9- 6.8) 5.3 ( 3.9- 7.0) ∼ ∼Utah 5.4 ( 4.1- 7.1) 5.3 ( 3.9- 7.0) ∼ ∼Wyoming 9.6 ( 6.3- 14.0) 9.4 ( 6.1- 13.9) ∼ ∼
Pacific 6.1 ( 5.8- 6.4) 6.1 ( 5.7- 6.4) 5.6 ( 4.4- 7.1) 3.3 ( 2.7- 4.0)
Alaska 7.2 ( 4.1- 11.8) ∼ ∼ ∼California 5.9 ( 5.6- 6.3) 5.9 ( 5.5- 6.3) 6.1 ( 4.7- 7.8) 3.1 ( 2.5- 3.8)
San Francisco-Oakland 6.9 ( 5.9- 8.1) 7.2 ( 6.0- 8.7) ∼ ∼San Jose-Monterey 6.4 ( 5.1- 8.0) 6.3 ( 4.8- 8.2) ∼ ∼Los Angeles 5.4 ( 4.7- 6.1) 5.3 ( 4.5- 6.1) 6.3 ( 4.3- 8.9) 3.3 ( 2.4- 4.4)
Hawaii 6.1 ( 4.4- 8.2) ∼ ∼ ∼Oregon 6.5 ( 5.4- 7.7) 6.5 ( 5.4- 7.8) ∼ ∼Washington 6.6 ( 5.8- 7.6) 6.5 ( 5.6- 7.5) ∼ ∼Seattle-Puget Sound 6.5 ( 5.5- 7.7) 6.8 ( 5.7- 8.1) ∼ ∼
∗ Rates are per 100,000 persons and are age-adjusted to the 2000 U.S. standard population (19 age groups - Census P25-1130).† Data are from all state and metropolitan area cancer registries, except Maryland. Included data cover approximately 98% of the population and met data
quality criteria for all invasive cancer sites combined. See Appendix B for registry-specific data quality information.‡ Invasive cancers only.
§ Data for specified racial or ethnic populations other than white and black should be interpreted with caution. See Technical Notes.
Hispanic origin is not mutually exclusive from race categories (white, black).
∼ Rates are suppressed if fewer than 16 cases were reported in a specific category (area, race, ethnicity).
- Rates are suppressed at the state’s or metropolitan area’s request. See Technical Notes.
Notes: Cases from suppressed rates are included in the U.S. and region/division rates. U.S. rates are as presented in Table 1.1.1.1F. Michigan, Georgia,
California, and Washington state rates each include cases from the SEER metropolitan areas.
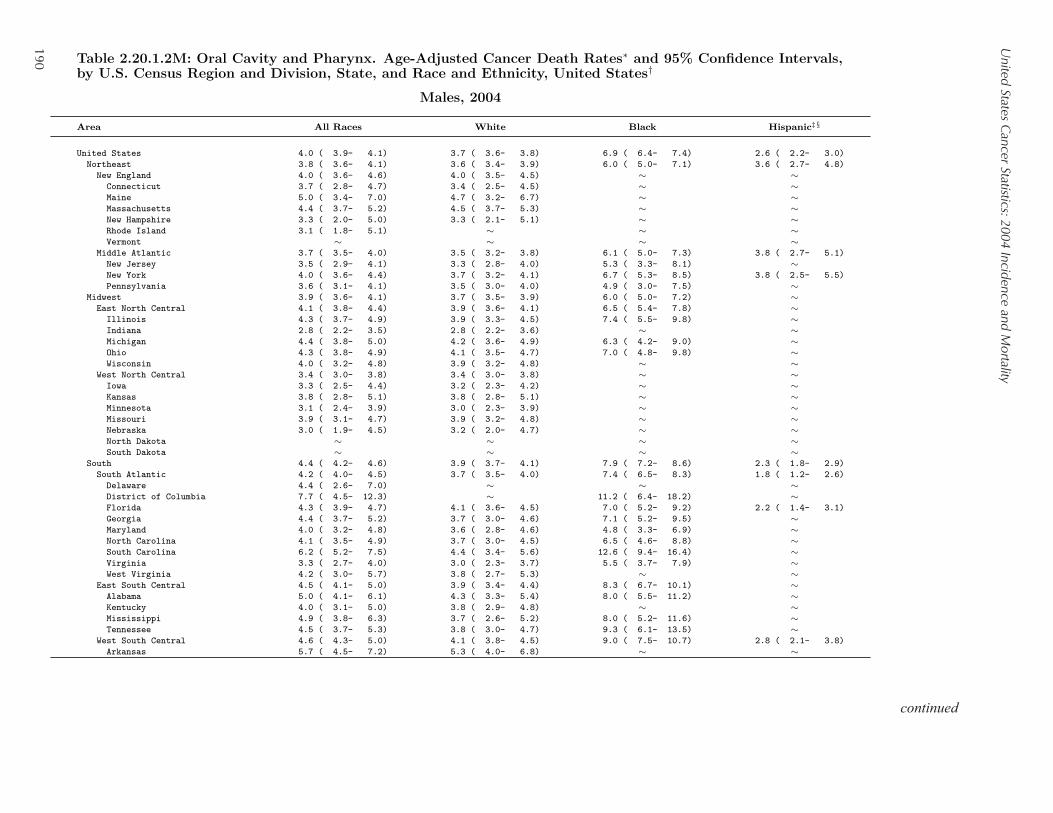
United
States Cancer Statistics: 2004 Incid
ence and M
ortality
��0
continued
Table 2.20.1.2M: Oral Cavity and Pharynx. Age-Adjusted Cancer Death Rates∗ and 95% Confidence Intervals,by U.S. Census Region and Division, State, and Race and Ethnicity, United States†
Males, 2004
Area All Races White Black Hispanic‡§
United States 4.0 ( 3.9- 4.1) 3.7 ( 3.6- 3.8) 6.9 ( 6.4- 7.4) 2.6 ( 2.2- 3.0)
Northeast 3.8 ( 3.6- 4.1) 3.6 ( 3.4- 3.9) 6.0 ( 5.0- 7.1) 3.6 ( 2.7- 4.8)
New England 4.0 ( 3.6- 4.6) 4.0 ( 3.5- 4.5) ∼ ∼Connecticut 3.7 ( 2.8- 4.7) 3.4 ( 2.5- 4.5) ∼ ∼Maine 5.0 ( 3.4- 7.0) 4.7 ( 3.2- 6.7) ∼ ∼Massachusetts 4.4 ( 3.7- 5.2) 4.5 ( 3.7- 5.3) ∼ ∼New Hampshire 3.3 ( 2.0- 5.0) 3.3 ( 2.1- 5.1) ∼ ∼Rhode Island 3.1 ( 1.8- 5.1) ∼ ∼ ∼Vermont ∼ ∼ ∼ ∼
Middle Atlantic 3.7 ( 3.5- 4.0) 3.5 ( 3.2- 3.8) 6.1 ( 5.0- 7.3) 3.8 ( 2.7- 5.1)
New Jersey 3.5 ( 2.9- 4.1) 3.3 ( 2.8- 4.0) 5.3 ( 3.3- 8.1) ∼New York 4.0 ( 3.6- 4.4) 3.7 ( 3.2- 4.1) 6.7 ( 5.3- 8.5) 3.8 ( 2.5- 5.5)
Pennsylvania 3.6 ( 3.1- 4.1) 3.5 ( 3.0- 4.0) 4.9 ( 3.0- 7.5) ∼Midwest 3.9 ( 3.6- 4.1) 3.7 ( 3.5- 3.9) 6.0 ( 5.0- 7.2) ∼
East North Central 4.1 ( 3.8- 4.4) 3.9 ( 3.6- 4.1) 6.5 ( 5.4- 7.8) ∼Illinois 4.3 ( 3.7- 4.9) 3.9 ( 3.3- 4.5) 7.4 ( 5.5- 9.8) ∼Indiana 2.8 ( 2.2- 3.5) 2.8 ( 2.2- 3.6) ∼ ∼Michigan 4.4 ( 3.8- 5.0) 4.2 ( 3.6- 4.9) 6.3 ( 4.2- 9.0) ∼Ohio 4.3 ( 3.8- 4.9) 4.1 ( 3.5- 4.7) 7.0 ( 4.8- 9.8) ∼Wisconsin 4.0 ( 3.2- 4.8) 3.9 ( 3.2- 4.8) ∼ ∼
West North Central 3.4 ( 3.0- 3.8) 3.4 ( 3.0- 3.8) ∼ ∼Iowa 3.3 ( 2.5- 4.4) 3.2 ( 2.3- 4.2) ∼ ∼Kansas 3.8 ( 2.8- 5.1) 3.8 ( 2.8- 5.1) ∼ ∼Minnesota 3.1 ( 2.4- 3.9) 3.0 ( 2.3- 3.9) ∼ ∼Missouri 3.9 ( 3.1- 4.7) 3.9 ( 3.2- 4.8) ∼ ∼Nebraska 3.0 ( 1.9- 4.5) 3.2 ( 2.0- 4.7) ∼ ∼North Dakota ∼ ∼ ∼ ∼South Dakota ∼ ∼ ∼ ∼
South 4.4 ( 4.2- 4.6) 3.9 ( 3.7- 4.1) 7.9 ( 7.2- 8.6) 2.3 ( 1.8- 2.9)
South Atlantic 4.2 ( 4.0- 4.5) 3.7 ( 3.5- 4.0) 7.4 ( 6.5- 8.3) 1.8 ( 1.2- 2.6)
Delaware 4.4 ( 2.6- 7.0) ∼ ∼ ∼District of Columbia 7.7 ( 4.5- 12.3) ∼ 11.2 ( 6.4- 18.2) ∼Florida 4.3 ( 3.9- 4.7) 4.1 ( 3.6- 4.5) 7.0 ( 5.2- 9.2) 2.2 ( 1.4- 3.1)
Georgia 4.4 ( 3.7- 5.2) 3.7 ( 3.0- 4.6) 7.1 ( 5.2- 9.5) ∼Maryland 4.0 ( 3.2- 4.8) 3.6 ( 2.8- 4.6) 4.8 ( 3.3- 6.9) ∼North Carolina 4.1 ( 3.5- 4.9) 3.7 ( 3.0- 4.5) 6.5 ( 4.6- 8.8) ∼South Carolina 6.2 ( 5.2- 7.5) 4.4 ( 3.4- 5.6) 12.6 ( 9.4- 16.4) ∼Virginia 3.3 ( 2.7- 4.0) 3.0 ( 2.3- 3.7) 5.5 ( 3.7- 7.9) ∼West Virginia 4.2 ( 3.0- 5.7) 3.8 ( 2.7- 5.3) ∼ ∼
East South Central 4.5 ( 4.1- 5.0) 3.9 ( 3.4- 4.4) 8.3 ( 6.7- 10.1) ∼Alabama 5.0 ( 4.1- 6.1) 4.3 ( 3.3- 5.4) 8.0 ( 5.5- 11.2) ∼Kentucky 4.0 ( 3.1- 5.0) 3.8 ( 2.9- 4.8) ∼ ∼Mississippi 4.9 ( 3.8- 6.3) 3.7 ( 2.6- 5.2) 8.0 ( 5.2- 11.6) ∼Tennessee 4.5 ( 3.7- 5.3) 3.8 ( 3.0- 4.7) 9.3 ( 6.1- 13.5) ∼
West South Central 4.6 ( 4.3- 5.0) 4.1 ( 3.8- 4.5) 9.0 ( 7.5- 10.7) 2.8 ( 2.1- 3.8)
Arkansas 5.7 ( 4.5- 7.2) 5.3 ( 4.0- 6.8) ∼ ∼

Cancer Incidence and M
ortality, by U.S. C
ensus Region and D
i�ision, State, and Metropolitan A
rea
���
Table 2.20.1.2M: Oral Cavity and Pharynx. Age-Adjusted Cancer Death Rates∗ and 95% Confidence Intervals,by U.S. Census Region and Division, State, and Race and Ethnicity, United States† (continued)
Males, 2004
Area All Races White Black Hispanic‡§
Louisiana 5.5 ( 4.5- 6.6) 4.1 ( 3.1- 5.3) 10.4 ( 7.6- 13.9) ∼Oklahoma 4.3 ( 3.4- 5.5) 4.0 ( 3.0- 5.2) ∼ ∼Texas 4.3 ( 3.9- 4.8) 4.0 ( 3.5- 4.5) 8.3 ( 6.4- 10.6) 2.9 ( 2.1- 3.9)
West 3.6 ( 3.4- 3.8) 3.5 ( 3.3- 3.8) 4.8 ( 3.6- 6.4) 2.5 ( 2.0- 3.1)
Mountain 3.2 ( 2.9- 3.7) 3.2 ( 2.8- 3.6) ∼ 3.3 ( 2.2- 4.9)
Arizona 3.3 ( 2.6- 4.0) 3.4 ( 2.7- 4.2) ∼ ∼Colorado 2.7 ( 2.0- 3.7) 2.7 ( 1.9- 3.6) ∼ ∼Idaho 3.1 ( 1.9- 4.9) 3.2 ( 1.9- 5.0) ∼ ∼Montana 3.6 ( 2.1- 5.9) ∼ ∼ ∼Nevada 4.7 ( 3.5- 6.3) 4.8 ( 3.4- 6.5) ∼ ∼New Mexico 3.1 ( 2.0- 4.5) 3.2 ( 2.1- 4.8) ∼ ∼Utah 2.7 ( 1.7- 4.1) 2.5 ( 1.5- 3.8) ∼ ∼Wyoming ∼ ∼ ∼ ∼
Pacific 3.7 ( 3.5- 4.0) 3.7 ( 3.4- 4.0) 5.1 ( 3.7- 6.8) 2.2 ( 1.6- 2.9)
Alaska ∼ ∼ ∼ ∼California 3.8 ( 3.5- 4.1) 3.7 ( 3.4- 4.1) 5.6 ( 4.0- 7.5) 2.3 ( 1.7- 3.0)
Hawaii 3.6 ( 2.2- 5.4) ∼ ∼ ∼Oregon 3.4 ( 2.5- 4.3) 3.3 ( 2.5- 4.3) ∼ ∼Washington 4.1 ( 3.3- 4.9) 4.1 ( 3.3- 5.0) ∼ ∼
∗ Rates are per 100,000 persons and are age-adjusted to the 2000 U.S. standard population (19 age groups - Census P25-1130).† Data are from the National Vital Statistics System (NVSS).‡ Data for specified racial or ethnic populations other than white and black should be interpreted with caution. See Technical Notes.
§ Hispanic origin is not mutually exclusive from race categories (white, black).
∼ Rates are suppressed if fewer than 16 cases were reported in a specific category (area, race, ethnicity).
Note: U.S. rates are as presented in Table 1.1.1.2M.

United
States Cancer Statistics: 2004 Incid
ence and M
ortality
���
continued
Table 2.20.1.2F: Oral Cavity and Pharynx. Age-Adjusted Cancer Death Rates∗ and 95% Confidence Intervals,by U.S. Census Region and Division, State, and Race and Ethnicity, United States†
Females, 2004
Area All Races White Black Hispanic‡§
United States 1.5 ( 1.4- 1.5) 1.5 ( 1.4- 1.5) 1.6 ( 1.4- 1.8) 0.8 ( 0.7- 1.0)
Northeast 1.4 ( 1.3- 1.5) 1.4 ( 1.3- 1.5) 1.6 ( 1.2- 2.0) 1.3 ( 0.8- 1.9)
New England 1.5 ( 1.2- 1.8) 1.5 ( 1.3- 1.8) ∼ ∼Connecticut 0.9 ( 0.5- 1.4) 0.8 ( 0.5- 1.3) ∼ ∼Maine 1.8 ( 1.1- 3.0) 1.9 ( 1.1- 3.1) ∼ ∼Massachusetts 1.6 ( 1.2- 2.0) 1.6 ( 1.2- 2.1) ∼ ∼New Hampshire 2.9 ( 1.8- 4.5) 3.0 ( 1.8- 4.5) ∼ ∼Rhode Island ∼ ∼ ∼ ∼Vermont ∼ ∼ ∼ ∼
Middle Atlantic 1.4 ( 1.2- 1.5) 1.3 ( 1.2- 1.5) 1.6 ( 1.2- 2.1) 1.4 ( 0.9- 2.1)
New Jersey 1.4 ( 1.1- 1.8) 1.3 ( 1.0- 1.7) ∼ ∼New York 1.5 ( 1.3- 1.7) 1.5 ( 1.3- 1.8) 1.4 ( 0.9- 2.0) ∼Pennsylvania 1.2 ( 1.0- 1.4) 1.1 ( 0.9- 1.4) ∼ ∼
Midwest 1.4 ( 1.3- 1.5) 1.4 ( 1.3- 1.5) 1.6 ( 1.2- 2.1) ∼East North Central 1.5 ( 1.3- 1.6) 1.4 ( 1.3- 1.6) 1.7 ( 1.2- 2.3) ∼Illinois 1.3 ( 1.1- 1.6) 1.3 ( 1.0- 1.6) ∼ ∼Indiana 1.3 ( 1.0- 1.8) 1.2 ( 0.8- 1.6) ∼ ∼Michigan 1.4 ( 1.1- 1.8) 1.3 ( 1.0- 1.7) ∼ ∼Ohio 1.6 ( 1.4- 2.0) 1.7 ( 1.4- 2.0) ∼ ∼Wisconsin 1.5 ( 1.1- 2.0) 1.5 ( 1.1- 2.0) ∼ ∼
West North Central 1.3 ( 1.1- 1.5) 1.3 ( 1.1- 1.5) ∼ ∼Iowa 1.6 ( 1.1- 2.3) 1.7 ( 1.1- 2.4) ∼ ∼Kansas 1.3 ( 0.8- 2.0) 1.4 ( 0.9- 2.1) ∼ ∼Minnesota 1.4 ( 1.0- 1.9) 1.4 ( 1.0- 1.9) ∼ ∼Missouri 1.3 ( 0.9- 1.7) 1.3 ( 0.9- 1.8) ∼ ∼Nebraska ∼ ∼ ∼ ∼North Dakota ∼ ∼ ∼ ∼South Dakota ∼ ∼ ∼ ∼
South 1.5 ( 1.4- 1.6) 1.5 ( 1.4- 1.6) 1.6 ( 1.4- 1.9) 0.9 ( 0.6- 1.2)
South Atlantic 1.5 ( 1.4- 1.7) 1.5 ( 1.4- 1.6) 1.7 ( 1.4- 2.1) 1.0 ( 0.6- 1.5)
Delaware ∼ ∼ ∼ ∼District of Columbia ∼ ∼ ∼ ∼Florida 1.6 ( 1.4- 1.9) 1.6 ( 1.4- 1.8) 2.3 ( 1.4- 3.4) 1.1 ( 0.6- 1.7)
Georgia 1.7 ( 1.3- 2.1) 1.4 ( 1.0- 1.9) 2.6 ( 1.7- 3.8) ∼Maryland 1.3 ( 0.9- 1.8) 1.2 ( 0.8- 1.8) ∼ ∼North Carolina 1.8 ( 1.4- 2.2) 1.8 ( 1.4- 2.3) ∼ ∼South Carolina 1.3 ( 0.9- 1.9) 1.4 ( 0.9- 2.1) ∼ ∼Virginia 1.1 ( 0.8- 1.5) 1.2 ( 0.9- 1.7) ∼ ∼West Virginia 1.4 ( 0.8- 2.3) 1.3 ( 0.7- 2.1) ∼ ∼
East South Central 1.8 ( 1.5- 2.1) 1.8 ( 1.5- 2.1) 1.9 ( 1.2- 2.6) ∼Alabama 2.0 ( 1.5- 2.6) 1.9 ( 1.3- 2.6) ∼ ∼Kentucky 2.0 ( 1.4- 2.6) 2.0 ( 1.5- 2.7) ∼ ∼Mississippi 1.3 ( 0.8- 2.0) 1.4 ( 0.8- 2.3) ∼ ∼Tennessee 1.7 ( 1.3- 2.2) 1.7 ( 1.2- 2.2) ∼ ∼
West South Central 1.4 ( 1.2- 1.6) 1.4 ( 1.3- 1.7) 1.3 ( 0.8- 1.9) 0.8 ( 0.5- 1.3)
Arkansas 1.7 ( 1.1- 2.4) 1.7 ( 1.1- 2.5) ∼ ∼

Cancer Incidence and M
ortality, by U.S. C
ensus Region and D
i�ision, State, and Metropolitan A
rea
��3
Table 2.20.1.2F: Oral Cavity and Pharynx. Age-Adjusted Cancer Death Rates∗ and 95% Confidence Intervals,by U.S. Census Region and Division, State, and Race and Ethnicity, United States† (continued)
Females, 2004
Area All Races White Black Hispanic‡§
Louisiana 1.7 ( 1.2- 2.3) 1.5 ( 1.0- 2.2) ∼ ∼Oklahoma 1.2 ( 0.7- 1.7) 1.2 ( 0.8- 1.9) ∼ ∼Texas 1.4 ( 1.1- 1.6) 1.4 ( 1.2- 1.7) ∼ 0.9 ( 0.5- 1.4)
West 1.5 ( 1.4- 1.6) 1.5 ( 1.4- 1.6) 1.7 ( 1.1- 2.5) 0.7 ( 0.5- 1.0)
Mountain 1.4 ( 1.1- 1.6) 1.3 ( 1.1- 1.6) ∼ ∼Arizona 1.3 ( 0.9- 1.8) 1.3 ( 0.9- 1.8) ∼ ∼Colorado 1.6 ( 1.1- 2.3) 1.6 ( 1.1- 2.2) ∼ ∼Idaho ∼ ∼ ∼ ∼Montana ∼ ∼ ∼ ∼Nevada 1.9 ( 1.2- 2.9) ∼ ∼ ∼New Mexico ∼ ∼ ∼ ∼Utah ∼ ∼ ∼ ∼Wyoming ∼ ∼ ∼ ∼
Pacific 1.5 ( 1.4- 1.7) 1.6 ( 1.4- 1.8) 1.6 ( 1.0- 2.5) 0.8 ( 0.5- 1.2)
Alaska ∼ ∼ ∼ ∼California 1.4 ( 1.2- 1.6) 1.4 ( 1.2- 1.6) 1.8 ( 1.1- 2.7) 0.8 ( 0.5- 1.2)
Hawaii ∼ ∼ ∼ ∼Oregon 1.7 ( 1.2- 2.3) 1.7 ( 1.2- 2.4) ∼ ∼Washington 1.9 ( 1.5- 2.5) 2.1 ( 1.6- 2.7) ∼ ∼
∗ Rates are per 100,000 persons and are age-adjusted to the 2000 U.S. standard population (19 age groups - Census P25-1130).† Data are from the National Vital Statistics System (NVSS).‡ Data for specified racial or ethnic populations other than white and black should be interpreted with caution. See Technical Notes.
§ Hispanic origin is not mutually exclusive from race categories (white, black).
∼ Rates are suppressed if fewer than 16 cases were reported in a specific category (area, race, ethnicity).
Note: U.S. rates are as presented in Table 1.1.1.2F.
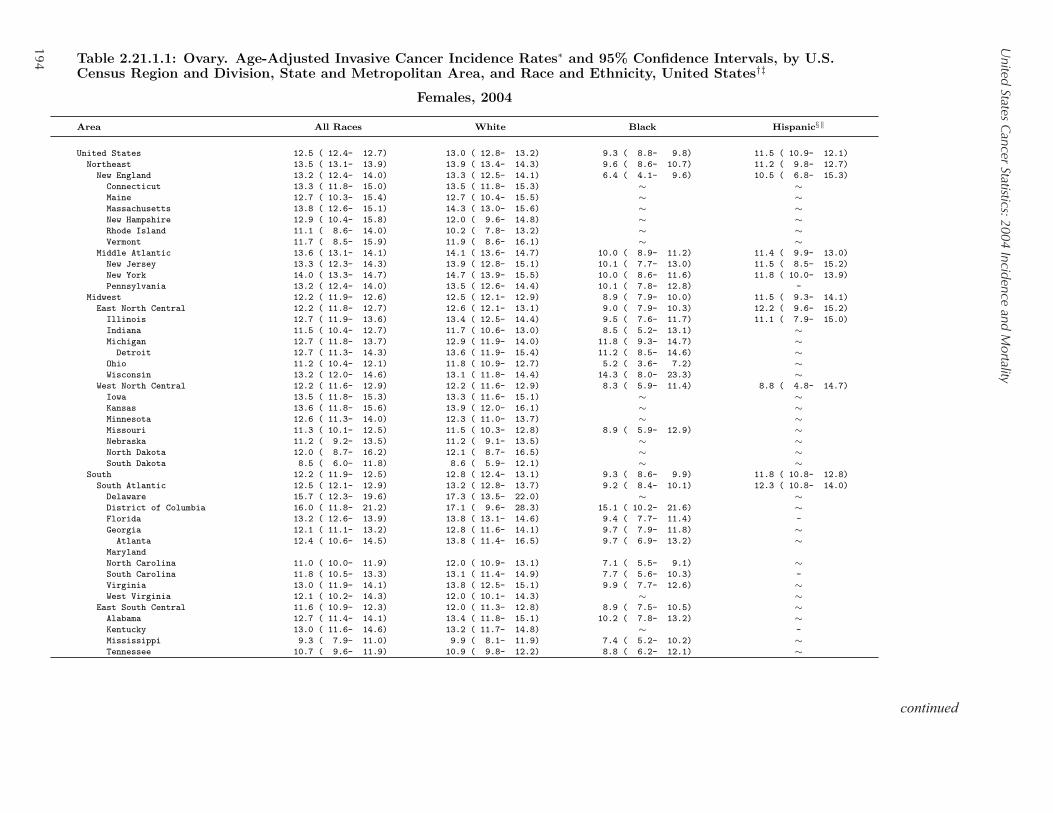
United
States Cancer Statistics: 2004 Incid
ence and M
ortality
���
continued
Table 2.21.1.1: Ovary. Age-Adjusted Invasive Cancer Incidence Rates∗ and 95% Confidence Intervals, by U.S.Census Region and Division, State and Metropolitan Area, and Race and Ethnicity, United States†‡
Females, 2004
Area All Races White Black Hispanic§
United States 12.5 ( 12.4- 12.7) 13.0 ( 12.8- 13.2) 9.3 ( 8.8- 9.8) 11.5 ( 10.9- 12.1)
Northeast 13.5 ( 13.1- 13.9) 13.9 ( 13.4- 14.3) 9.6 ( 8.6- 10.7) 11.2 ( 9.8- 12.7)
New England 13.2 ( 12.4- 14.0) 13.3 ( 12.5- 14.1) 6.4 ( 4.1- 9.6) 10.5 ( 6.8- 15.3)
Connecticut 13.3 ( 11.8- 15.0) 13.5 ( 11.8- 15.3) ∼ ∼Maine 12.7 ( 10.3- 15.4) 12.7 ( 10.4- 15.5) ∼ ∼Massachusetts 13.8 ( 12.6- 15.1) 14.3 ( 13.0- 15.6) ∼ ∼New Hampshire 12.9 ( 10.4- 15.8) 12.0 ( 9.6- 14.8) ∼ ∼Rhode Island 11.1 ( 8.6- 14.0) 10.2 ( 7.8- 13.2) ∼ ∼Vermont 11.7 ( 8.5- 15.9) 11.9 ( 8.6- 16.1) ∼ ∼
Middle Atlantic 13.6 ( 13.1- 14.1) 14.1 ( 13.6- 14.7) 10.0 ( 8.9- 11.2) 11.4 ( 9.9- 13.0)
New Jersey 13.3 ( 12.3- 14.3) 13.9 ( 12.8- 15.1) 10.1 ( 7.7- 13.0) 11.5 ( 8.5- 15.2)
New York 14.0 ( 13.3- 14.7) 14.7 ( 13.9- 15.5) 10.0 ( 8.6- 11.6) 11.8 ( 10.0- 13.9)
Pennsylvania 13.2 ( 12.4- 14.0) 13.5 ( 12.6- 14.4) 10.1 ( 7.8- 12.8) -
Midwest 12.2 ( 11.9- 12.6) 12.5 ( 12.1- 12.9) 8.9 ( 7.9- 10.0) 11.5 ( 9.3- 14.1)
East North Central 12.2 ( 11.8- 12.7) 12.6 ( 12.1- 13.1) 9.0 ( 7.9- 10.3) 12.2 ( 9.6- 15.2)
Illinois 12.7 ( 11.9- 13.6) 13.4 ( 12.5- 14.4) 9.5 ( 7.6- 11.7) 11.1 ( 7.9- 15.0)
Indiana 11.5 ( 10.4- 12.7) 11.7 ( 10.6- 13.0) 8.5 ( 5.2- 13.1) ∼Michigan 12.7 ( 11.8- 13.7) 12.9 ( 11.9- 14.0) 11.8 ( 9.3- 14.7) ∼Detroit 12.7 ( 11.3- 14.3) 13.6 ( 11.9- 15.4) 11.2 ( 8.5- 14.6) ∼
Ohio 11.2 ( 10.4- 12.1) 11.8 ( 10.9- 12.7) 5.2 ( 3.6- 7.2) ∼Wisconsin 13.2 ( 12.0- 14.6) 13.1 ( 11.8- 14.4) 14.3 ( 8.0- 23.3) ∼
West North Central 12.2 ( 11.6- 12.9) 12.2 ( 11.6- 12.9) 8.3 ( 5.9- 11.4) 8.8 ( 4.8- 14.7)
Iowa 13.5 ( 11.8- 15.3) 13.3 ( 11.6- 15.1) ∼ ∼Kansas 13.6 ( 11.8- 15.6) 13.9 ( 12.0- 16.1) ∼ ∼Minnesota 12.6 ( 11.3- 14.0) 12.3 ( 11.0- 13.7) ∼ ∼Missouri 11.3 ( 10.1- 12.5) 11.5 ( 10.3- 12.8) 8.9 ( 5.9- 12.9) ∼Nebraska 11.2 ( 9.2- 13.5) 11.2 ( 9.1- 13.5) ∼ ∼North Dakota 12.0 ( 8.7- 16.2) 12.1 ( 8.7- 16.5) ∼ ∼South Dakota 8.5 ( 6.0- 11.8) 8.6 ( 5.9- 12.1) ∼ ∼
South 12.2 ( 11.9- 12.5) 12.8 ( 12.4- 13.1) 9.3 ( 8.6- 9.9) 11.8 ( 10.8- 12.8)
South Atlantic 12.5 ( 12.1- 12.9) 13.2 ( 12.8- 13.7) 9.2 ( 8.4- 10.1) 12.3 ( 10.8- 14.0)
Delaware 15.7 ( 12.3- 19.6) 17.3 ( 13.5- 22.0) ∼ ∼District of Columbia 16.0 ( 11.8- 21.2) 17.1 ( 9.6- 28.3) 15.1 ( 10.2- 21.6) ∼Florida 13.2 ( 12.6- 13.9) 13.8 ( 13.1- 14.6) 9.4 ( 7.7- 11.4) -
Georgia 12.1 ( 11.1- 13.2) 12.8 ( 11.6- 14.1) 9.7 ( 7.9- 11.8) ∼Atlanta 12.4 ( 10.6- 14.5) 13.8 ( 11.4- 16.5) 9.7 ( 6.9- 13.2) ∼
Maryland
North Carolina 11.0 ( 10.0- 11.9) 12.0 ( 10.9- 13.1) 7.1 ( 5.5- 9.1) ∼South Carolina 11.8 ( 10.5- 13.3) 13.1 ( 11.4- 14.9) 7.7 ( 5.6- 10.3) -
Virginia 13.0 ( 11.9- 14.1) 13.8 ( 12.5- 15.1) 9.9 ( 7.7- 12.6) ∼West Virginia 12.1 ( 10.2- 14.3) 12.0 ( 10.1- 14.3) ∼ ∼
East South Central 11.6 ( 10.9- 12.3) 12.0 ( 11.3- 12.8) 8.9 ( 7.5- 10.5) ∼Alabama 12.7 ( 11.4- 14.1) 13.4 ( 11.8- 15.1) 10.2 ( 7.8- 13.2) ∼Kentucky 13.0 ( 11.6- 14.6) 13.2 ( 11.7- 14.8) ∼ -
Mississippi 9.3 ( 7.9- 11.0) 9.9 ( 8.1- 11.9) 7.4 ( 5.2- 10.2) ∼Tennessee 10.7 ( 9.6- 11.9) 10.9 ( 9.8- 12.2) 8.8 ( 6.2- 12.1) ∼

Cancer Incidence and M
ortality, by U.S. C
ensus Region and D
i�ision, State, and Metropolitan A
rea
���
Table 2.21.1.1: Ovary. Age-Adjusted Invasive Cancer Incidence Rates∗ and 95% Confidence Intervals, by U.S.Census Region and Division, State and Metropolitan Area, and Race and Ethnicity, United States†‡ (continued)
Females, 2004
Area All Races White Black Hispanic§
West South Central 12.0 ( 11.5- 12.5) 12.4 ( 11.8- 13.0) 9.7 ( 8.4- 11.2) 11.6 ( 10.3- 13.0)
Arkansas 11.7 ( 10.1- 13.5) 12.0 ( 10.2- 14.0) 8.4 ( 4.8- 13.6) ∼Louisiana 10.6 ( 9.4- 12.0) 11.5 ( 9.9- 13.2) 8.8 ( 6.7- 11.3) ∼Oklahoma 12.2 ( 10.7- 13.9) 12.2 ( 10.6- 14.0) ∼ ∼Texas 12.2 ( 11.6- 12.9) 12.6 ( 11.9- 13.4) 10.6 ( 8.7- 12.8) 11.7 ( 10.4- 13.2)
West 12.6 ( 12.2- 13.0) 13.1 ( 12.7- 13.5) 9.6 ( 8.0- 11.3) 11.4 ( 10.4- 12.4)
Mountain 12.1 ( 11.4- 12.8) 12.3 ( 11.6- 13.1) 6.6 ( 3.8- 10.7) 11.1 ( 9.2- 13.1)
Arizona 12.1 ( 10.9- 13.4) 12.3 ( 11.1- 13.7) ∼ 12.4 ( 9.0- 16.4)
Colorado 13.2 ( 11.8- 14.8) 13.6 ( 12.1- 15.3) ∼ 10.6 ( 7.0- 15.3)
Idaho 10.7 ( 8.4- 13.4) 10.7 ( 8.3- 13.4) ∼ ∼Montana 13.1 ( 10.3- 16.6) 13.0 ( 10.0- 16.5) ∼ ∼Nevada 11.6 ( 9.7- 13.8) 12.3 ( 10.2- 14.7) ∼ ∼New Mexico 10.7 ( 8.8- 12.8) 10.6 ( 8.6- 12.9) ∼ 9.7 ( 6.6- 13.6)
Utah 11.0 ( 9.0- 13.3) 11.2 ( 9.1- 13.5) ∼ ∼Wyoming 14.9 ( 10.7- 20.3) 14.8 ( 10.6- 20.2) ∼ ∼
Pacific 12.8 ( 12.4- 13.3) 13.4 ( 12.9- 13.9) 10.2 ( 8.4- 12.1) 11.5 ( 10.4- 12.6)
Alaska 9.6 ( 6.2- 14.2) 10.2 ( 6.1- 15.9) ∼ ∼California 12.6 ( 12.1- 13.2) 13.3 ( 12.7- 13.9) 10.3 ( 8.4- 12.3) 11.3 ( 10.1- 12.4)
San Francisco-Oakland 12.1 ( 10.8- 13.6) 12.8 ( 11.1- 14.7) 7.3 ( 4.2- 11.9) 9.5 ( 6.1- 14.1)
San Jose-Monterey 10.9 ( 9.1- 13.0) 11.0 ( 8.9- 13.4) ∼ 9.8 ( 5.8- 15.3)
Los Angeles 12.7 ( 11.7- 13.7) 13.7 ( 12.5- 15.0) 11.9 ( 9.1- 15.3) 10.7 ( 9.0- 12.5)
Hawaii 10.6 ( 8.3- 13.3) 12.1 ( 7.7- 18.4) ∼ ∼Oregon 13.8 ( 12.2- 15.5) 13.5 ( 11.9- 15.3) ∼ ∼Washington 14.1 ( 12.8- 15.4) 14.1 ( 12.8- 15.5) ∼ 20.5 ( 11.7- 32.8)
Seattle-Puget Sound 14.4 ( 12.9- 16.1) 15.1 ( 13.4- 17.0) ∼ ∼∗ Rates are per 100,000 persons and are age-adjusted to the 2000 U.S. standard population (19 age groups - Census P25-1130).† Data are from all state and metropolitan area cancer registries, except Maryland. Included data cover approximately 98% of the population and met data
quality criteria for all invasive cancer sites combined. See Appendix B for registry-specific data quality information.‡ Invasive cancers only.
§ Data for specified racial or ethnic populations other than white and black should be interpreted with caution. See Technical Notes.
Hispanic origin is not mutually exclusive from race categories (white, black).
∼ Rates are suppressed if fewer than 16 cases were reported in a specific category (area, race, ethnicity).
- Rates are suppressed at the state’s or metropolitan area’s request. See Technical Notes.
Notes: Cases from suppressed rates are included in the U.S. and region/division rates. U.S. rates are as presented in Table 1.1.1.1F. Michigan, Georgia,
California, and Washington state rates each include cases from the SEER metropolitan areas.
Excludes cancers newly classified as borderline according to ICD-O-3, beginning with 2001 diagnoses. See Technical Notes.

United
States Cancer Statistics: 2004 Incid
ence and M
ortality
���
continued
Table 2.21.1.2: Ovary. Age-Adjusted Cancer Death Rates∗ and 95% Confidence Intervals, by U.S. CensusRegion and Division, State, and Race and Ethnicity, United States†
Females, 2004
Area All Races White Black Hispanic‡§
United States 8.8 ( 8.6- 8.9) 9.1 ( 8.9- 9.2) 7.6 ( 7.2- 8.1) 6.0 ( 5.5- 6.5)
Northeast 8.7 ( 8.4- 9.0) 9.1 ( 8.7- 9.4) 6.9 ( 6.0- 7.9) 4.6 ( 3.7- 5.7)
New England 8.7 ( 8.1- 9.4) 8.9 ( 8.2- 9.6) 7.0 ( 4.5- 10.4) ∼Connecticut 7.8 ( 6.7- 9.1) 8.0 ( 6.8- 9.4) ∼ ∼Maine 6.8 ( 5.2- 8.8) 6.9 ( 5.2- 8.9) ∼ ∼Massachusetts 9.3 ( 8.3- 10.3) 9.5 ( 8.5- 10.6) ∼ ∼New Hampshire 10.1 ( 7.9- 12.7) 10.1 ( 7.9- 12.7) ∼ ∼Rhode Island 10.6 ( 8.2- 13.4) 10.3 ( 7.9- 13.2) ∼ ∼Vermont 8.2 ( 5.6- 11.7) 8.3 ( 5.6- 11.8) ∼ ∼
Middle Atlantic 8.7 ( 8.3- 9.0) 9.1 ( 8.7- 9.6) 6.9 ( 5.9- 7.9) 4.8 ( 3.8- 6.0)
New Jersey 8.6 ( 7.8- 9.4) 9.1 ( 8.2- 10.1) 7.1 ( 5.1- 9.7) ∼New York 8.5 ( 8.0- 9.1) 9.2 ( 8.6- 9.9) 6.4 ( 5.2- 7.7) 5.6 ( 4.3- 7.2)
Pennsylvania 8.9 ( 8.3- 9.6) 9.1 ( 8.4- 9.8) 8.0 ( 5.9- 10.5) ∼Midwest 8.9 ( 8.6- 9.2) 9.0 ( 8.7- 9.4) 7.8 ( 6.8- 8.9) 5.2 ( 3.6- 7.2)
East North Central 9.0 ( 8.6- 9.3) 9.2 ( 8.8- 9.6) 7.9 ( 6.8- 9.1) 5.3 ( 3.5- 7.6)
Illinois 8.8 ( 8.1- 9.5) 9.1 ( 8.3- 9.9) 8.0 ( 6.2- 10.1) 4.6 ( 2.5- 7.6)
Indiana 8.7 ( 7.8- 9.8) 8.9 ( 7.9- 10.0) ∼ ∼Michigan 8.8 ( 8.1- 9.7) 9.1 ( 8.3- 10.0) 7.9 ( 5.8- 10.4) ∼Ohio 9.4 ( 8.7- 10.2) 9.5 ( 8.7- 10.3) 9.1 ( 6.9- 11.7) ∼Wisconsin 9.0 ( 7.9- 10.1) 9.2 ( 8.1- 10.3) ∼ ∼
West North Central 8.7 ( 8.1- 9.2) 8.8 ( 8.2- 9.3) 7.2 ( 4.9- 10.2) ∼Iowa 9.5 ( 8.1- 11.0) 9.5 ( 8.2- 11.1) ∼ ∼Kansas 9.8 ( 8.3- 11.5) 10.0 ( 8.4- 11.7) ∼ ∼Minnesota 8.8 ( 7.8- 10.0) 9.0 ( 7.9- 10.2) ∼ ∼Missouri 8.4 ( 7.4- 9.4) 8.6 ( 7.6- 9.7) 6.9 ( 4.2- 10.7) ∼Nebraska 7.4 ( 5.9- 9.3) 7.1 ( 5.5- 8.9) ∼ ∼North Dakota 6.6 ( 4.2- 9.9) 6.8 ( 4.4- 10.3) ∼ ∼South Dakota 7.0 ( 4.8- 9.9) 6.5 ( 4.4- 9.5) ∼ ∼
South 8.4 ( 8.2- 8.7) 8.6 ( 8.4- 8.9) 7.9 ( 7.3- 8.5) 5.7 ( 5.0- 6.4)
South Atlantic 8.5 ( 8.2- 8.9) 8.8 ( 8.5- 9.2) 7.6 ( 6.9- 8.4) 5.5 ( 4.5- 6.6)
Delaware 10.1 ( 7.5- 13.3) 10.0 ( 7.2- 13.6) ∼ ∼District of Columbia 8.5 ( 5.6- 12.5) ∼ 7.5 ( 4.3- 12.3) ∼Florida 7.9 ( 7.4- 8.4) 8.0 ( 7.5- 8.6) 7.2 ( 5.7- 9.0) 5.6 ( 4.5- 6.9)
Georgia 9.2 ( 8.3- 10.2) 9.7 ( 8.6- 10.8) 8.0 ( 6.3- 10.0) ∼Maryland 8.5 ( 7.5- 9.6) 9.3 ( 8.1- 10.7) 6.8 ( 5.1- 9.0) ∼North Carolina 8.6 ( 7.8- 9.5) 9.4 ( 8.4- 10.4) 5.8 ( 4.3- 7.6) ∼South Carolina 8.7 ( 7.6- 10.0) 8.6 ( 7.3- 10.0) 9.0 ( 6.7- 11.8) ∼Virginia 9.2 ( 8.3- 10.2) 9.2 ( 8.2- 10.4) 9.7 ( 7.4- 12.3) ∼West Virginia 10.8 ( 9.0- 12.8) 10.9 ( 9.1- 13.0) ∼ ∼
East South Central 8.9 ( 8.3- 9.5) 9.1 ( 8.5- 9.8) 7.8 ( 6.5- 9.3) ∼Alabama 9.9 ( 8.8- 11.2) 10.6 ( 9.3- 12.1) 7.3 ( 5.3- 9.9) ∼Kentucky 8.5 ( 7.4- 9.8) 8.7 ( 7.5- 10.0) ∼ ∼Mississippi 7.9 ( 6.5- 9.4) 8.0 ( 6.4- 9.8) 7.4 ( 5.1- 10.3) ∼Tennessee 8.9 ( 7.9- 9.9) 8.8 ( 7.8- 9.9) 9.1 ( 6.5- 12.5) ∼
West South Central 7.9 ( 7.5- 8.3) 7.9 ( 7.4- 8.4) 8.6 ( 7.4- 10.0) 5.6 ( 4.7- 6.7)
Arkansas 8.8 ( 7.4- 10.3) 9.0 ( 7.5- 10.7) 8.4 ( 4.9- 13.5) ∼

Cancer Incidence and M
ortality, by U.S. C
ensus Region and D
i�ision, State, and Metropolitan A
rea
���
Table 2.21.1.2: Ovary. Age-Adjusted Cancer Death Rates∗ and 95% Confidence Intervals, by U.S. CensusRegion and Division, State, and Race and Ethnicity, United States† (continued)
Females, 2004
Area All Races White Black Hispanic‡§
Louisiana 8.3 ( 7.2- 9.5) 8.3 ( 7.1- 9.8) 8.1 ( 6.0- 10.6) ∼Oklahoma 8.4 ( 7.2- 9.8) 8.7 ( 7.4- 10.2) ∼ ∼Texas 7.6 ( 7.1- 8.1) 7.5 ( 6.9- 8.1) 9.6 ( 7.7- 11.7) 5.7 ( 4.7- 6.8)
West 9.3 ( 9.0- 9.6) 9.9 ( 9.5- 10.3) 7.6 ( 6.2- 9.3) 7.0 ( 6.3- 7.9)
Mountain 9.0 ( 8.4- 9.6) 9.2 ( 8.6- 9.8) ∼ 7.4 ( 5.8- 9.2)
Arizona 9.1 ( 8.1- 10.3) 9.1 ( 8.1- 10.3) ∼ 11.4 ( 8.1- 15.4)
Colorado 9.0 ( 7.7- 10.3) 9.4 ( 8.1- 10.8) ∼ ∼Idaho 9.1 ( 7.0- 11.7) 9.0 ( 6.9- 11.6) ∼ ∼Montana 9.0 ( 6.7- 11.8) 9.1 ( 6.8- 12.1) ∼ ∼Nevada 9.5 ( 7.8- 11.5) 10.2 ( 8.3- 12.4) ∼ ∼New Mexico 6.9 ( 5.4- 8.7) 6.8 ( 5.3- 8.7) ∼ 6.0 ( 3.6- 9.4)
Utah 9.4 ( 7.6- 11.6) 9.5 ( 7.6- 11.6) ∼ ∼Wyoming 12.3 ( 8.5- 17.3) 12.2 ( 8.4- 17.3) ∼ ∼
Pacific 9.4 ( 9.0- 9.8) 10.2 ( 9.8- 10.7) 7.8 ( 6.3- 9.6) 6.9 ( 6.0- 7.9)
Alaska ∼ ∼ ∼ ∼California 9.1 ( 8.7- 9.6) 10.0 ( 9.5- 10.5) 7.4 ( 5.8- 9.2) 7.0 ( 6.1- 8.0)
Hawaii 7.5 ( 5.7- 9.8) 11.8 ( 7.2- 18.4) ∼ ∼Oregon 11.4 ( 10.0- 12.9) 11.5 ( 10.1- 13.1) ∼ ∼Washington 10.6 ( 9.5- 11.7) 10.7 ( 9.6- 12.0) ∼ ∼
∗ Rates are per 100,000 persons and are age-adjusted to the 2000 U.S. standard population (19 age groups - Census P25-1130).† Data are from the National Vital Statistics System (NVSS).‡ Data for specified racial or ethnic populations other than white and black should be interpreted with caution. See Technical Notes.
§ Hispanic origin is not mutually exclusive from race categories (white, black).
∼ Rates are suppressed if fewer than 16 cases were reported in a specific category (area, race, ethnicity).
Note: U.S. rates are as presented in Table 1.1.1.2F.
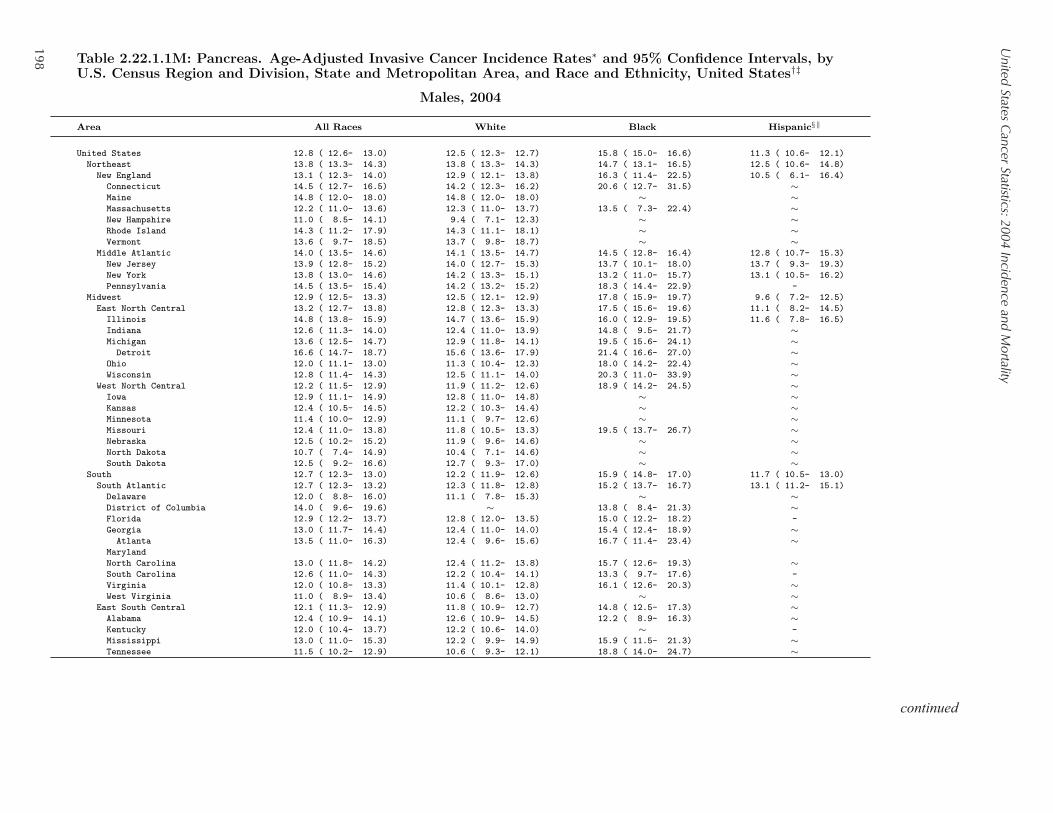
United
States Cancer Statistics: 2004 Incid
ence and M
ortality
���
continued
Table 2.22.1.1M: Pancreas. Age-Adjusted Invasive Cancer Incidence Rates∗ and 95% Confidence Intervals, byU.S. Census Region and Division, State and Metropolitan Area, and Race and Ethnicity, United States†‡
Males, 2004
Area All Races White Black Hispanic§
United States 12.8 ( 12.6- 13.0) 12.5 ( 12.3- 12.7) 15.8 ( 15.0- 16.6) 11.3 ( 10.6- 12.1)
Northeast 13.8 ( 13.3- 14.3) 13.8 ( 13.3- 14.3) 14.7 ( 13.1- 16.5) 12.5 ( 10.6- 14.8)
New England 13.1 ( 12.3- 14.0) 12.9 ( 12.1- 13.8) 16.3 ( 11.4- 22.5) 10.5 ( 6.1- 16.4)
Connecticut 14.5 ( 12.7- 16.5) 14.2 ( 12.3- 16.2) 20.6 ( 12.7- 31.5) ∼Maine 14.8 ( 12.0- 18.0) 14.8 ( 12.0- 18.0) ∼ ∼Massachusetts 12.2 ( 11.0- 13.6) 12.3 ( 11.0- 13.7) 13.5 ( 7.3- 22.4) ∼New Hampshire 11.0 ( 8.5- 14.1) 9.4 ( 7.1- 12.3) ∼ ∼Rhode Island 14.3 ( 11.2- 17.9) 14.3 ( 11.1- 18.1) ∼ ∼Vermont 13.6 ( 9.7- 18.5) 13.7 ( 9.8- 18.7) ∼ ∼
Middle Atlantic 14.0 ( 13.5- 14.6) 14.1 ( 13.5- 14.7) 14.5 ( 12.8- 16.4) 12.8 ( 10.7- 15.3)
New Jersey 13.9 ( 12.8- 15.2) 14.0 ( 12.7- 15.3) 13.7 ( 10.1- 18.0) 13.7 ( 9.3- 19.3)
New York 13.8 ( 13.0- 14.6) 14.2 ( 13.3- 15.1) 13.2 ( 11.0- 15.7) 13.1 ( 10.5- 16.2)
Pennsylvania 14.5 ( 13.5- 15.4) 14.2 ( 13.2- 15.2) 18.3 ( 14.4- 22.9) -
Midwest 12.9 ( 12.5- 13.3) 12.5 ( 12.1- 12.9) 17.8 ( 15.9- 19.7) 9.6 ( 7.2- 12.5)
East North Central 13.2 ( 12.7- 13.8) 12.8 ( 12.3- 13.3) 17.5 ( 15.6- 19.6) 11.1 ( 8.2- 14.5)
Illinois 14.8 ( 13.8- 15.9) 14.7 ( 13.6- 15.9) 16.0 ( 12.9- 19.5) 11.6 ( 7.8- 16.5)
Indiana 12.6 ( 11.3- 14.0) 12.4 ( 11.0- 13.9) 14.8 ( 9.5- 21.7) ∼Michigan 13.6 ( 12.5- 14.7) 12.9 ( 11.8- 14.1) 19.5 ( 15.6- 24.1) ∼
Detroit 16.6 ( 14.7- 18.7) 15.6 ( 13.6- 17.9) 21.4 ( 16.6- 27.0) ∼Ohio 12.0 ( 11.1- 13.0) 11.3 ( 10.4- 12.3) 18.0 ( 14.2- 22.4) ∼Wisconsin 12.8 ( 11.4- 14.3) 12.5 ( 11.1- 14.0) 20.3 ( 11.0- 33.9) ∼
West North Central 12.2 ( 11.5- 12.9) 11.9 ( 11.2- 12.6) 18.9 ( 14.2- 24.5) ∼Iowa 12.9 ( 11.1- 14.9) 12.8 ( 11.0- 14.8) ∼ ∼Kansas 12.4 ( 10.5- 14.5) 12.2 ( 10.3- 14.4) ∼ ∼Minnesota 11.4 ( 10.0- 12.9) 11.1 ( 9.7- 12.6) ∼ ∼Missouri 12.4 ( 11.0- 13.8) 11.8 ( 10.5- 13.3) 19.5 ( 13.7- 26.7) ∼Nebraska 12.5 ( 10.2- 15.2) 11.9 ( 9.6- 14.6) ∼ ∼North Dakota 10.7 ( 7.4- 14.9) 10.4 ( 7.1- 14.6) ∼ ∼South Dakota 12.5 ( 9.2- 16.6) 12.7 ( 9.3- 17.0) ∼ ∼
South 12.7 ( 12.3- 13.0) 12.2 ( 11.9- 12.6) 15.9 ( 14.8- 17.0) 11.7 ( 10.5- 13.0)
South Atlantic 12.7 ( 12.3- 13.2) 12.3 ( 11.8- 12.8) 15.2 ( 13.7- 16.7) 13.1 ( 11.2- 15.1)
Delaware 12.0 ( 8.8- 16.0) 11.1 ( 7.8- 15.3) ∼ ∼District of Columbia 14.0 ( 9.6- 19.6) ∼ 13.8 ( 8.4- 21.3) ∼Florida 12.9 ( 12.2- 13.7) 12.8 ( 12.0- 13.5) 15.0 ( 12.2- 18.2) -
Georgia 13.0 ( 11.7- 14.4) 12.4 ( 11.0- 14.0) 15.4 ( 12.4- 18.9) ∼Atlanta 13.5 ( 11.0- 16.3) 12.4 ( 9.6- 15.6) 16.7 ( 11.4- 23.4) ∼
Maryland
North Carolina 13.0 ( 11.8- 14.2) 12.4 ( 11.2- 13.8) 15.7 ( 12.6- 19.3) ∼South Carolina 12.6 ( 11.0- 14.3) 12.2 ( 10.4- 14.1) 13.3 ( 9.7- 17.6) -
Virginia 12.0 ( 10.8- 13.3) 11.4 ( 10.1- 12.8) 16.1 ( 12.6- 20.3) ∼West Virginia 11.0 ( 8.9- 13.4) 10.6 ( 8.6- 13.0) ∼ ∼
East South Central 12.1 ( 11.3- 12.9) 11.8 ( 10.9- 12.7) 14.8 ( 12.5- 17.3) ∼Alabama 12.4 ( 10.9- 14.1) 12.6 ( 10.9- 14.5) 12.2 ( 8.9- 16.3) ∼Kentucky 12.0 ( 10.4- 13.7) 12.2 ( 10.6- 14.0) ∼ -
Mississippi 13.0 ( 11.0- 15.3) 12.2 ( 9.9- 14.9) 15.9 ( 11.5- 21.3) ∼Tennessee 11.5 ( 10.2- 12.9) 10.6 ( 9.3- 12.1) 18.8 ( 14.0- 24.7) ∼

Cancer Incidence and M
ortality, by U.S. C
ensus Region and D
i�ision, State, and Metropolitan A
rea
���
Table 2.22.1.1M: Pancreas. Age-Adjusted Invasive Cancer Incidence Rates∗ and 95% Confidence Intervals, byU.S. Census Region and Division, State and Metropolitan Area, and Race and Ethnicity, United States†‡(continued)
Males, 2004
Area All Races White Black Hispanic§
West South Central 12.9 ( 12.3- 13.6) 12.4 ( 11.7- 13.0) 18.4 ( 16.1- 20.9) 10.7 ( 9.2- 12.4)
Arkansas 10.9 ( 9.1- 12.8) 10.7 ( 8.9- 12.8) 13.5 ( 7.6- 21.7) ∼Louisiana 14.0 ( 12.3- 15.8) 12.9 ( 11.0- 14.9) 18.1 ( 14.2- 22.6) ∼Oklahoma 12.5 ( 10.8- 14.4) 11.7 ( 10.0- 13.7) 23.0 ( 13.1- 36.8) ∼Texas 13.1 ( 12.3- 13.9) 12.6 ( 11.8- 13.5) 19.1 ( 15.8- 22.8) 10.9 ( 9.3- 12.6)
West 11.7 ( 11.3- 12.2) 11.8 ( 11.4- 12.2) 13.8 ( 11.6- 16.3) 10.8 ( 9.7- 12.1)
Mountain 11.2 ( 10.5- 11.9) 11.3 ( 10.5- 12.1) 6.9 ( 3.9- 11.4) 12.1 ( 9.8- 14.7)
Arizona 10.4 ( 9.2- 11.7) 10.5 ( 9.2- 11.9) ∼ 10.5 ( 6.6- 15.5)
Colorado 11.4 ( 9.9- 13.1) 11.4 ( 9.8- 13.2) ∼ 15.8 ( 10.3- 23.0)
Idaho 13.9 ( 11.0- 17.2) 14.0 ( 11.1- 17.4) ∼ ∼Montana 13.6 ( 10.4- 17.4) 13.1 ( 10.0- 17.0) ∼ ∼Nevada 10.0 ( 8.1- 12.3) 10.2 ( 8.2- 12.6) ∼ ∼New Mexico 10.7 ( 8.6- 13.2) 11.2 ( 8.9- 13.8) ∼ 12.0 ( 8.3- 16.7)
Utah 12.2 ( 9.8- 14.9) 12.2 ( 9.8- 15.0) ∼ ∼Wyoming 11.0 ( 6.9- 16.4) 11.2 ( 7.1- 16.7) ∼ ∼
Pacific 12.0 ( 11.5- 12.5) 12.1 ( 11.5- 12.6) 15.1 ( 12.5- 18.0) 10.4 ( 9.1- 11.8)
Alaska 13.6 ( 8.5- 20.3) 12.1 ( 6.9- 19.5) ∼ ∼California 11.9 ( 11.4- 12.5) 12.1 ( 11.5- 12.8) 14.8 ( 12.2- 17.9) 10.3 ( 9.0- 11.7)
San Francisco-Oakland 13.0 ( 11.4- 14.8) 13.0 ( 11.1- 15.2) 15.5 ( 10.1- 22.8) 11.2 ( 6.6- 17.4)
San Jose-Monterey 11.6 ( 9.5- 14.0) 11.9 ( 9.5- 14.8) ∼ 11.8 ( 6.9- 18.6)
Los Angeles 11.8 ( 10.7- 13.0) 11.7 ( 10.4- 13.1) 14.5 ( 10.6- 19.2) 9.1 ( 7.1- 11.4)
Hawaii 11.6 ( 9.1- 14.6) ∼ ∼ ∼Oregon 11.8 ( 10.2- 13.6) 11.5 ( 9.9- 13.3) ∼ ∼Washington 12.2 ( 10.9- 13.6) 12.3 ( 10.9- 13.8) ∼ ∼
Seattle-Puget Sound 12.6 ( 11.0- 14.4) 12.6 ( 10.9- 14.5) ∼ ∼∗ Rates are per 100,000 persons and are age-adjusted to the 2000 U.S. standard population (19 age groups - Census P25-1130).† Data are from all state and metropolitan area cancer registries, except Maryland. Included data cover approximately 98% of the population and met data
quality criteria for all invasive cancer sites combined. See Appendix B for registry-specific data quality information.‡ Invasive cancers only.
§ Data for specified racial or ethnic populations other than white and black should be interpreted with caution. See Technical Notes.
Hispanic origin is not mutually exclusive from race categories (white, black).
∼ Rates are suppressed if fewer than 16 cases were reported in a specific category (area, race, ethnicity).
- Rates are suppressed at the state’s or metropolitan area’s request. See Technical Notes.
Notes: Cases from suppressed rates are included in the U.S. and region/division rates. U.S. rates are as presented in Table 1.1.1.1M. Michigan, Georgia,
California, and Washington state rates each include cases from the SEER metropolitan areas.

United
States Cancer Statistics: 2004 Incid
ence and M
ortality
�00
continued
Table 2.22.1.1F: Pancreas. Age-Adjusted Invasive Cancer Incidence Rates∗ and 95% Confidence Intervals, byU.S. Census Region and Division, State and Metropolitan Area, and Race and Ethnicity, United States†‡
Females, 2004
Area All Races White Black Hispanic§
United States 9.7 ( 9.6- 9.9) 9.4 ( 9.3- 9.6) 12.9 ( 12.3- 13.4) 9.4 ( 8.8- 10.0)
Northeast 10.9 ( 10.6- 11.3) 10.8 ( 10.4- 11.2) 12.7 ( 11.5- 14.0) 10.3 ( 8.8- 11.9)
New England 10.5 ( 9.8- 11.2) 10.5 ( 9.8- 11.2) 10.1 ( 6.9- 14.1) 10.4 ( 6.6- 15.4)
Connecticut 11.2 ( 9.8- 12.7) 11.2 ( 9.7- 12.8) 13.1 ( 7.8- 20.5) ∼Maine 10.7 ( 8.7- 13.1) 10.8 ( 8.8- 13.2) ∼ ∼Massachusetts 9.9 ( 9.0- 11.0) 10.0 ( 9.0- 11.1) ∼ ∼New Hampshire 11.3 ( 9.0- 14.0) 10.5 ( 8.3- 13.2) ∼ ∼Rhode Island 10.5 ( 8.2- 13.3) 10.7 ( 8.3- 13.7) ∼ ∼Vermont 11.5 ( 8.3- 15.6) 11.6 ( 8.4- 15.7) ∼ ∼
Middle Atlantic 11.0 ( 10.6- 11.5) 10.9 ( 10.4- 11.3) 13.0 ( 11.7- 14.4) 10.2 ( 8.6- 11.9)
New Jersey 11.1 ( 10.3- 12.1) 11.0 ( 10.1- 12.1) 13.5 ( 10.6- 17.0) 13.4 ( 9.9- 17.7)
New York 11.2 ( 10.6- 11.9) 11.3 ( 10.7- 12.0) 11.8 ( 10.2- 13.6) 8.9 ( 7.2- 10.9)
Pennsylvania 10.8 ( 10.1- 11.5) 10.2 ( 9.5- 11.0) 15.8 ( 12.9- 19.1) -
Midwest 9.2 ( 8.9- 9.6) 8.9 ( 8.6- 9.2) 13.2 ( 11.9- 14.6) 8.3 ( 6.2- 10.8)
East North Central 9.4 ( 9.1- 9.8) 9.0 ( 8.7- 9.4) 13.4 ( 12.0- 14.9) 8.0 ( 5.8- 10.7)
Illinois 10.1 ( 9.4- 10.9) 9.8 ( 9.1- 10.6) 13.0 ( 10.7- 15.7) 10.6 ( 7.3- 14.7)
Indiana 9.5 ( 8.6- 10.6) 9.1 ( 8.1- 10.2) 14.5 ( 10.0- 20.4) ∼Michigan 9.8 ( 9.0- 10.6) 9.5 ( 8.6- 10.4) 12.8 ( 10.2- 15.9) ∼
Detroit 10.9 ( 9.6- 12.3) 10.5 ( 9.0- 12.1) 12.6 ( 9.6- 16.2) ∼Ohio 8.5 ( 7.8- 9.2) 7.9 ( 7.2- 8.6) 13.7 ( 11.0- 16.9) ∼Wisconsin 9.2 ( 8.2- 10.3) 9.0 ( 8.0- 10.2) 17.2 ( 9.6- 27.8) ∼
West North Central 8.9 ( 8.3- 9.4) 8.7 ( 8.1- 9.2) 11.6 ( 8.6- 15.2) ∼Iowa 9.7 ( 8.3- 11.2) 9.5 ( 8.2- 11.0) ∼ ∼Kansas 9.1 ( 7.7- 10.7) 8.8 ( 7.3- 10.4) ∼ ∼Minnesota 7.5 ( 6.5- 8.6) 7.4 ( 6.4- 8.5) ∼ ∼Missouri 9.4 ( 8.4- 10.5) 9.2 ( 8.2- 10.3) 11.5 ( 7.9- 16.0) ∼Nebraska 7.4 ( 5.9- 9.3) 7.2 ( 5.7- 9.1) ∼ ∼North Dakota 11.6 ( 8.5- 15.6) 11.3 ( 8.1- 15.3) ∼ ∼South Dakota 10.0 ( 7.3- 13.4) 8.9 ( 6.4- 12.3) ∼ ∼
South 9.5 ( 9.2- 9.7) 8.9 ( 8.7- 9.2) 12.4 ( 11.7- 13.2) 8.6 ( 7.7- 9.5)
South Atlantic 9.4 ( 9.1- 9.8) 8.9 ( 8.5- 9.3) 12.1 ( 11.1- 13.1) 9.0 ( 7.7- 10.5)
Delaware 12.2 ( 9.3- 15.7) 11.8 ( 8.8- 15.7) ∼ ∼District of Columbia 11.5 ( 8.1- 15.9) ∼ 12.2 ( 8.0- 18.0) ∼Florida 9.2 ( 8.7- 9.8) 8.9 ( 8.4- 9.5) 11.8 ( 9.8- 14.0) -
Georgia 9.4 ( 8.5- 10.4) 8.5 ( 7.5- 9.6) 12.8 ( 10.6- 15.3) ∼Atlanta 8.9 ( 7.3- 10.8) 9.5 ( 7.5- 11.8) 8.7 ( 5.6- 12.6) ∼
Maryland
North Carolina 9.5 ( 8.6- 10.4) 8.8 ( 7.9- 9.8) 12.8 ( 10.5- 15.4) ∼South Carolina 9.1 ( 8.0- 10.4) 8.5 ( 7.2- 10.0) 10.6 ( 8.2- 13.6) -
Virginia 9.6 ( 8.7- 10.6) 9.0 ( 8.0- 10.1) 12.1 ( 9.6- 15.0) ∼West Virginia 9.9 ( 8.2- 11.8) 9.8 ( 8.1- 11.7) ∼ ∼
East South Central 9.0 ( 8.4- 9.6) 8.5 ( 7.9- 9.2) 11.4 ( 9.8- 13.2) ∼Alabama 9.6 ( 8.5- 10.9) 9.3 ( 8.0- 10.6) 11.3 ( 8.8- 14.4) ∼Kentucky 9.1 ( 7.9- 10.4) 8.7 ( 7.5- 10.0) 14.7 ( 9.1- 22.5) -
Mississippi 8.6 ( 7.2- 10.1) 8.4 ( 6.8- 10.3) 9.3 ( 6.7- 12.6) ∼Tennessee 8.5 ( 7.6- 9.6) 8.0 ( 7.0- 9.1) 12.8 ( 9.6- 16.8) ∼

Cancer Incidence and M
ortality, by U.S. C
ensus Region and D
i�ision, State, and Metropolitan A
rea
�0�
Table 2.22.1.1F: Pancreas. Age-Adjusted Invasive Cancer Incidence Rates∗ and 95% Confidence Intervals, byU.S. Census Region and Division, State and Metropolitan Area, and Race and Ethnicity, United States†‡(continued)
Females, 2004
Area All Races White Black Hispanic§
West South Central 9.8 ( 9.4- 10.3) 9.2 ( 8.7- 9.7) 14.0 ( 12.4- 15.8) 8.4 ( 7.3- 9.8)
Arkansas 8.9 ( 7.5- 10.4) 8.5 ( 7.1- 10.2) 11.7 ( 7.3- 17.7) ∼Louisiana 12.3 ( 11.0- 13.8) 11.4 ( 9.9- 13.1) 14.6 ( 11.8- 17.9) ∼Oklahoma 9.5 ( 8.2- 10.9) 8.8 ( 7.5- 10.3) ∼ ∼Texas 9.5 ( 8.9- 10.1) 9.0 ( 8.4- 9.6) 14.4 ( 12.2- 17.0) 8.6 ( 7.4- 10.0)
West 9.6 ( 9.3- 9.9) 9.5 ( 9.1- 9.8) 15.2 ( 13.2- 17.5) 9.9 ( 9.0- 10.9)
Mountain 8.9 ( 8.3- 9.5) 8.9 ( 8.3- 9.5) 10.7 ( 6.8- 16.0) 10.0 ( 8.1- 12.1)
Arizona 7.7 ( 6.7- 8.7) 7.8 ( 6.8- 8.8) ∼ 7.3 ( 4.7- 10.7)
Colorado 10.1 ( 8.8- 11.6) 9.9 ( 8.6- 11.4) ∼ 18.3 ( 12.8- 25.1)
Idaho 10.8 ( 8.6- 13.4) 10.7 ( 8.5- 13.4) ∼ ∼Montana 9.2 ( 6.9- 12.1) 9.4 ( 7.0- 12.4) ∼ ∼Nevada 10.5 ( 8.7- 12.6) 10.6 ( 8.7- 12.8) ∼ ∼New Mexico 7.7 ( 6.1- 9.6) 8.0 ( 6.3- 10.0) ∼ 8.8 ( 5.9- 12.6)
Utah 7.8 ( 6.1- 9.8) 7.8 ( 6.1- 9.8) ∼ ∼Wyoming 7.8 ( 4.9- 12.0) 7.6 ( 4.7- 11.7) ∼ ∼
Pacific 9.9 ( 9.5- 10.3) 9.7 ( 9.3- 10.2) 16.0 ( 13.7- 18.6) 9.9 ( 8.8- 11.1)
Alaska 7.8 ( 4.3- 12.7) ∼ ∼ ∼California 9.7 ( 9.3- 10.2) 9.6 ( 9.1- 10.1) 15.8 ( 13.5- 18.5) 9.7 ( 8.6- 10.9)
San Francisco-Oakland 9.9 ( 8.6- 11.2) 9.9 ( 8.4- 11.6) 16.3 ( 11.3- 22.8) 11.0 ( 7.2- 16.0)
San Jose-Monterey 11.0 ( 9.2- 13.1) 11.1 ( 9.1- 13.6) ∼ ∼Los Angeles 9.7 ( 8.8- 10.6) 9.2 ( 8.2- 10.3) 16.5 ( 13.0- 20.6) 8.0 ( 6.4- 9.8)
Hawaii 10.8 ( 8.6- 13.4) 9.6 ( 5.4- 15.9) ∼ ∼Oregon 9.7 ( 8.4- 11.2) 9.6 ( 8.3- 11.1) ∼ ∼Washington 10.8 ( 9.7- 12.0) 10.8 ( 9.7- 12.1) ∼ ∼
Seattle-Puget Sound 9.8 ( 8.5- 11.2) 9.8 ( 8.4- 11.3) ∼ ∼∗ Rates are per 100,000 persons and are age-adjusted to the 2000 U.S. standard population (19 age groups - Census P25-1130).† Data are from all state and metropolitan area cancer registries, except Maryland. Included data cover approximately 98% of the population and met data
quality criteria for all invasive cancer sites combined. See Appendix B for registry-specific data quality information.‡ Invasive cancers only.
§ Data for specified racial or ethnic populations other than white and black should be interpreted with caution. See Technical Notes.
Hispanic origin is not mutually exclusive from race categories (white, black).
∼ Rates are suppressed if fewer than 16 cases were reported in a specific category (area, race, ethnicity).
- Rates are suppressed at the state’s or metropolitan area’s request. See Technical Notes.
Notes: Cases from suppressed rates are included in the U.S. and region/division rates. U.S. rates are as presented in Table 1.1.1.1F. Michigan, Georgia,
California, and Washington state rates each include cases from the SEER metropolitan areas.

United
States Cancer Statistics: 2004 Incid
ence and M
ortality
�0�
continued
Table 2.22.1.2M: Pancreas. Age-Adjusted Cancer Death Rates∗ and 95% Confidence Intervals, by U.S. CensusRegion and Division, State, and Race and Ethnicity, United States†
Males, 2004
Area All Races White Black Hispanic‡§
United States 12.3 ( 12.1- 12.5) 12.2 ( 12.0- 12.4) 15.6 ( 14.8- 16.3) 9.2 ( 8.5- 9.9)
Northeast 12.9 ( 12.5- 13.4) 13.0 ( 12.5- 13.5) 14.8 ( 13.1- 16.6) 7.6 ( 6.1- 9.3)
New England 12.5 ( 11.6- 13.4) 12.5 ( 11.6- 13.4) 18.6 ( 13.0- 25.4) ∼Connecticut 12.7 ( 11.0- 14.6) 12.2 ( 10.5- 14.1) 23.5 ( 14.3- 35.9) ∼Maine 13.1 ( 10.5- 16.2) 13.2 ( 10.6- 16.4) ∼ ∼Massachusetts 12.7 ( 11.4- 14.0) 12.8 ( 11.5- 14.2) 14.5 ( 8.0- 23.7) ∼New Hampshire 11.7 ( 9.0- 15.0) 11.3 ( 8.7- 14.5) ∼ ∼Rhode Island 12.4 ( 9.6- 15.9) 12.9 ( 9.9- 16.5) ∼ ∼Vermont 11.4 ( 7.8- 16.1) 11.5 ( 7.9- 16.3) ∼ ∼
Middle Atlantic 13.1 ( 12.6- 13.6) 13.2 ( 12.6- 13.8) 14.3 ( 12.6- 16.3) 8.0 ( 6.4- 9.9)
New Jersey 12.7 ( 11.6- 13.9) 12.7 ( 11.5- 14.0) 15.8 ( 11.8- 20.6) 6.4 ( 3.7- 10.1)
New York 12.9 ( 12.1- 13.7) 13.1 ( 12.2- 14.0) 13.5 ( 11.2- 16.0) 8.6 ( 6.5- 11.2)
Pennsylvania 13.6 ( 12.7- 14.6) 13.6 ( 12.7- 14.6) 15.2 ( 11.7- 19.5) ∼Midwest 12.7 ( 12.3- 13.1) 12.4 ( 11.9- 12.8) 18.3 ( 16.5- 20.3) 8.5 ( 6.2- 11.3)
East North Central 13.0 ( 12.5- 13.5) 12.6 ( 12.0- 13.1) 18.4 ( 16.4- 20.5) 8.8 ( 6.2- 11.9)
Illinois 13.6 ( 12.6- 14.6) 13.1 ( 12.1- 14.2) 18.3 ( 15.0- 22.1) 9.6 ( 6.0- 14.4)
Indiana 12.7 ( 11.3- 14.1) 12.3 ( 11.0- 13.8) 16.9 ( 11.1- 24.4) ∼Michigan 12.7 ( 11.6- 13.8) 12.2 ( 11.1- 13.4) 17.6 ( 13.8- 22.0) ∼Ohio 13.1 ( 12.1- 14.1) 12.6 ( 11.6- 13.6) 19.5 ( 15.6- 24.1) ∼Wisconsin 12.4 ( 11.1- 13.9) 12.3 ( 11.0- 13.8) ∼ ∼
West North Central 12.1 ( 11.4- 12.9) 11.9 ( 11.2- 12.7) 18.3 ( 13.6- 24.0) ∼Iowa 12.0 ( 10.3- 13.9) 12.0 ( 10.2- 13.9) ∼ ∼Kansas 12.7 ( 10.8- 14.9) 12.8 ( 10.9- 15.0) ∼ ∼Minnesota 12.5 ( 11.0- 14.1) 12.3 ( 10.8- 13.9) ∼ ∼Missouri 11.8 ( 10.5- 13.1) 11.4 ( 10.1- 12.8) 16.8 ( 11.4- 23.6) ∼Nebraska 11.9 ( 9.6- 14.5) 11.5 ( 9.2- 14.1) ∼ ∼North Dakota 9.2 ( 6.2- 13.2) 8.7 ( 5.8- 12.7) ∼ ∼South Dakota 13.9 ( 10.4- 18.2) 13.9 ( 10.3- 18.3) ∼ ∼
South 12.2 ( 11.9- 12.5) 11.8 ( 11.5- 12.2) 15.3 ( 14.3- 16.4) 9.4 ( 8.3- 10.6)
South Atlantic 12.4 ( 12.0- 12.8) 12.1 ( 11.6- 12.5) 14.8 ( 13.5- 16.2) 9.7 ( 8.1- 11.5)
Delaware 9.7 ( 6.9- 13.4) 9.3 ( 6.3- 13.3) ∼ ∼District of Columbia 13.5 ( 9.1- 19.2) ∼ 15.3 ( 9.4- 23.4) ∼Florida 11.7 ( 11.0- 12.4) 11.7 ( 11.0- 12.4) 11.6 ( 9.2- 14.4) 10.9 ( 9.0- 12.9)
Georgia 13.4 ( 12.0- 14.8) 13.4 ( 11.9- 15.1) 13.9 ( 11.0- 17.2) ∼Maryland 12.6 ( 11.1- 14.2) 11.6 ( 10.1- 13.4) 16.8 ( 13.0- 21.2) ∼North Carolina 13.4 ( 12.2- 14.7) 12.8 ( 11.5- 14.2) 17.1 ( 13.9- 20.9) ∼South Carolina 12.9 ( 11.2- 14.7) 12.1 ( 10.3- 14.1) 15.5 ( 11.7- 20.2) ∼Virginia 12.5 ( 11.3- 13.9) 12.1 ( 10.8- 13.6) 15.6 ( 12.1- 19.7) ∼West Virginia 13.2 ( 11.0- 15.8) 13.3 ( 11.0- 15.9) ∼ ∼
East South Central 12.1 ( 11.3- 13.0) 11.9 ( 11.1- 12.8) 13.8 ( 11.6- 16.3) ∼Alabama 11.4 ( 9.9- 13.0) 11.9 ( 10.2- 13.7) 9.7 ( 6.8- 13.4) ∼Kentucky 11.3 ( 9.7- 13.0) 11.2 ( 9.6- 13.0) ∼ ∼Mississippi 14.1 ( 12.0- 16.5) 13.0 ( 10.6- 15.7) 18.0 ( 13.3- 23.7) ∼Tennessee 12.4 ( 11.0- 13.9) 12.1 ( 10.7- 13.7) 14.5 ( 10.3- 19.6) ∼
West South Central 11.9 ( 11.3- 12.5) 11.4 ( 10.7- 12.0) 17.9 ( 15.6- 20.4) 9.5 ( 8.0- 11.2)
Arkansas 10.8 ( 9.0- 12.8) 10.5 ( 8.6- 12.6) 15.5 ( 9.1- 24.5) ∼
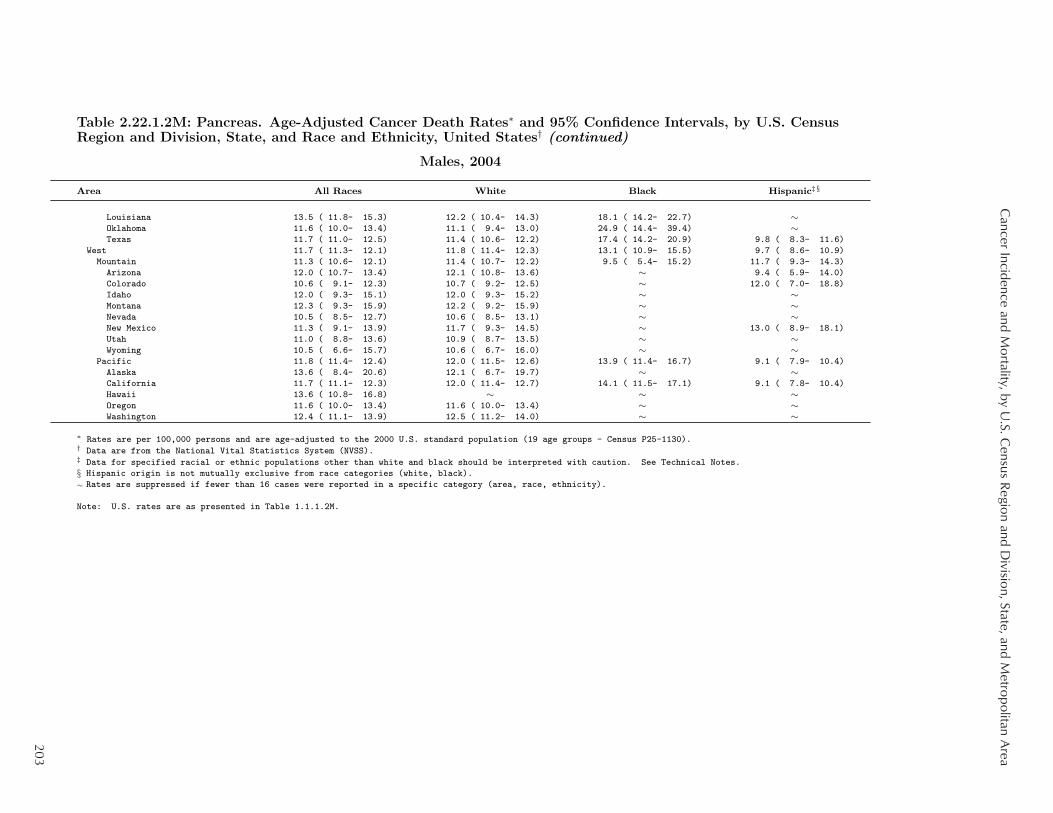
Cancer Incidence and M
ortality, by U.S. C
ensus Region and D
i�ision, State, and Metropolitan A
rea
�03
Table 2.22.1.2M: Pancreas. Age-Adjusted Cancer Death Rates∗ and 95% Confidence Intervals, by U.S. CensusRegion and Division, State, and Race and Ethnicity, United States† (continued)
Males, 2004
Area All Races White Black Hispanic‡§
Louisiana 13.5 ( 11.8- 15.3) 12.2 ( 10.4- 14.3) 18.1 ( 14.2- 22.7) ∼Oklahoma 11.6 ( 10.0- 13.4) 11.1 ( 9.4- 13.0) 24.9 ( 14.4- 39.4) ∼Texas 11.7 ( 11.0- 12.5) 11.4 ( 10.6- 12.2) 17.4 ( 14.2- 20.9) 9.8 ( 8.3- 11.6)
West 11.7 ( 11.3- 12.1) 11.8 ( 11.4- 12.3) 13.1 ( 10.9- 15.5) 9.7 ( 8.6- 10.9)
Mountain 11.3 ( 10.6- 12.1) 11.4 ( 10.7- 12.2) 9.5 ( 5.4- 15.2) 11.7 ( 9.3- 14.3)
Arizona 12.0 ( 10.7- 13.4) 12.1 ( 10.8- 13.6) ∼ 9.4 ( 5.9- 14.0)
Colorado 10.6 ( 9.1- 12.3) 10.7 ( 9.2- 12.5) ∼ 12.0 ( 7.0- 18.8)
Idaho 12.0 ( 9.3- 15.1) 12.0 ( 9.3- 15.2) ∼ ∼Montana 12.3 ( 9.3- 15.9) 12.2 ( 9.2- 15.9) ∼ ∼Nevada 10.5 ( 8.5- 12.7) 10.6 ( 8.5- 13.1) ∼ ∼New Mexico 11.3 ( 9.1- 13.9) 11.7 ( 9.3- 14.5) ∼ 13.0 ( 8.9- 18.1)
Utah 11.0 ( 8.8- 13.6) 10.9 ( 8.7- 13.5) ∼ ∼Wyoming 10.5 ( 6.6- 15.7) 10.6 ( 6.7- 16.0) ∼ ∼
Pacific 11.8 ( 11.4- 12.4) 12.0 ( 11.5- 12.6) 13.9 ( 11.4- 16.7) 9.1 ( 7.9- 10.4)
Alaska 13.6 ( 8.4- 20.6) 12.1 ( 6.7- 19.7) ∼ ∼California 11.7 ( 11.1- 12.3) 12.0 ( 11.4- 12.7) 14.1 ( 11.5- 17.1) 9.1 ( 7.8- 10.4)
Hawaii 13.6 ( 10.8- 16.8) ∼ ∼ ∼Oregon 11.6 ( 10.0- 13.4) 11.6 ( 10.0- 13.4) ∼ ∼Washington 12.4 ( 11.1- 13.9) 12.5 ( 11.2- 14.0) ∼ ∼
∗ Rates are per 100,000 persons and are age-adjusted to the 2000 U.S. standard population (19 age groups - Census P25-1130).† Data are from the National Vital Statistics System (NVSS).‡ Data for specified racial or ethnic populations other than white and black should be interpreted with caution. See Technical Notes.
§ Hispanic origin is not mutually exclusive from race categories (white, black).
∼ Rates are suppressed if fewer than 16 cases were reported in a specific category (area, race, ethnicity).
Note: U.S. rates are as presented in Table 1.1.1.2M.

United
States Cancer Statistics: 2004 Incid
ence and M
ortality
�0�
continued
Table 2.22.1.2F: Pancreas. Age-Adjusted Cancer Death Rates∗ and 95% Confidence Intervals, by U.S. CensusRegion and Division, State, and Race and Ethnicity, United States†
Females, 2004
Area All Races White Black Hispanic‡§
United States 9.2 ( 9.1- 9.4) 9.0 ( 8.9- 9.2) 12.1 ( 11.6- 12.7) 7.4 ( 6.9- 7.9)
Northeast 9.7 ( 9.4- 10.1) 9.8 ( 9.4- 10.1) 10.9 ( 9.8- 12.1) 6.5 ( 5.3- 7.8)
New England 10.3 ( 9.6- 10.9) 10.4 ( 9.7- 11.1) 9.1 ( 6.0- 13.0) ∼Connecticut 10.8 ( 9.5- 12.3) 10.9 ( 9.5- 12.4) 12.2 ( 7.0- 19.5) ∼Maine 9.9 ( 7.9- 12.2) 10.0 ( 8.0- 12.3) ∼ ∼Massachusetts 10.1 ( 9.1- 11.1) 10.3 ( 9.3- 11.4) ∼ ∼New Hampshire 11.4 ( 9.1- 14.1) 11.5 ( 9.2- 14.2) ∼ ∼Rhode Island 9.3 ( 7.1- 11.9) 9.3 ( 7.1- 12.1) ∼ ∼Vermont 9.5 ( 6.6- 13.3) 9.6 ( 6.7- 13.4) ∼ ∼
Middle Atlantic 9.6 ( 9.2- 10.0) 9.5 ( 9.1- 10.0) 11.1 ( 9.9- 12.4) 6.4 ( 5.2- 7.8)
New Jersey 10.1 ( 9.3- 11.0) 10.0 ( 9.1- 11.0) 12.7 ( 9.9- 16.1) 8.1 ( 5.4- 11.6)
New York 9.6 ( 9.1- 10.2) 9.8 ( 9.2- 10.5) 9.8 ( 8.3- 11.4) 5.8 ( 4.4- 7.4)
Pennsylvania 9.2 ( 8.6- 9.9) 9.0 ( 8.3- 9.6) 13.2 ( 10.6- 16.3) ∼Midwest 9.2 ( 8.9- 9.5) 8.9 ( 8.6- 9.2) 12.6 ( 11.3- 14.0) 6.4 ( 4.5- 8.7)
East North Central 9.3 ( 9.0- 9.7) 9.0 ( 8.7- 9.4) 12.5 ( 11.1- 14.0) 5.9 ( 3.9- 8.4)
Illinois 9.5 ( 8.8- 10.3) 9.3 ( 8.6- 10.1) 11.9 ( 9.7- 14.5) 6.4 ( 3.8- 9.9)
Indiana 9.9 ( 8.9- 11.0) 9.7 ( 8.7- 10.8) 13.3 ( 9.0- 18.8) ∼Michigan 9.1 ( 8.4- 9.9) 8.8 ( 8.0- 9.7) 11.8 ( 9.3- 14.8) ∼Ohio 8.9 ( 8.3- 9.7) 8.5 ( 7.8- 9.2) 13.5 ( 10.8- 16.7) ∼Wisconsin 9.4 ( 8.4- 10.5) 9.4 ( 8.3- 10.5) ∼ ∼
West North Central 8.8 ( 8.3- 9.3) 8.6 ( 8.1- 9.2) 13.1 ( 9.9- 16.9) ∼Iowa 9.2 ( 7.9- 10.7) 9.1 ( 7.7- 10.5) ∼ ∼Kansas 9.5 ( 8.1- 11.1) 9.4 ( 8.0- 11.1) ∼ ∼Minnesota 7.9 ( 6.9- 9.0) 7.7 ( 6.7- 8.8) ∼ ∼Missouri 9.1 ( 8.1- 10.1) 8.9 ( 7.9- 10.0) 11.7 ( 8.1- 16.3) ∼Nebraska 7.5 ( 5.9- 9.3) 7.2 ( 5.7- 9.1) ∼ ∼North Dakota 10.5 ( 7.5- 14.3) 10.6 ( 7.6- 14.5) ∼ ∼South Dakota 10.0 ( 7.4- 13.4) 9.4 ( 6.8- 12.8) ∼ ∼
South 9.1 ( 8.8- 9.3) 8.6 ( 8.3- 8.9) 12.1 ( 11.4- 12.9) 6.9 ( 6.1- 7.8)
South Atlantic 8.8 ( 8.5- 9.2) 8.3 ( 8.0- 8.7) 11.9 ( 10.9- 12.9) 6.1 ( 5.0- 7.3)
Delaware 9.8 ( 7.3- 13.0) 9.6 ( 6.9- 13.1) ∼ ∼District of Columbia 9.6 ( 6.6- 13.7) ∼ 10.3 ( 6.5- 15.6) ∼Florida 8.4 ( 7.9- 8.9) 8.0 ( 7.5- 8.5) 12.3 ( 10.2- 14.6) 6.5 ( 5.3- 7.9)
Georgia 8.8 ( 7.9- 9.8) 8.0 ( 7.0- 9.0) 11.9 ( 9.8- 14.4) ∼Maryland 10.1 ( 9.0- 11.3) 9.1 ( 7.9- 10.4) 13.3 ( 10.7- 16.4) ∼North Carolina 8.9 ( 8.1- 9.8) 8.5 ( 7.6- 9.4) 11.8 ( 9.6- 14.3) ∼South Carolina 9.3 ( 8.1- 10.6) 8.5 ( 7.3- 10.0) 11.3 ( 8.7- 14.3) ∼Virginia 8.9 ( 8.0- 9.9) 8.7 ( 7.7- 9.7) 11.2 ( 8.8- 14.1) ∼West Virginia 9.1 ( 7.5- 11.0) 9.2 ( 7.6- 11.1) ∼ ∼
East South Central 9.5 ( 8.9- 10.1) 9.2 ( 8.6- 9.8) 11.6 ( 10.0- 13.4) ∼Alabama 9.5 ( 8.4- 10.7) 9.1 ( 7.9- 10.5) 11.4 ( 8.8- 14.5) ∼Kentucky 9.4 ( 8.2- 10.7) 9.0 ( 7.8- 10.4) 14.8 ( 9.1- 22.6) ∼Mississippi 8.5 ( 7.2- 10.0) 7.6 ( 6.1- 9.3) 11.0 ( 8.2- 14.5) ∼Tennessee 10.2 ( 9.1- 11.3) 10.0 ( 9.0- 11.2) 11.5 ( 8.4- 15.3) ∼
West South Central 9.2 ( 8.7- 9.7) 8.7 ( 8.3- 9.2) 13.2 ( 11.6- 14.9) 7.6 ( 6.5- 8.8)
Arkansas 9.8 ( 8.4- 11.4) 9.7 ( 8.2- 11.4) 10.8 ( 6.7- 16.6) ∼

Cancer Incidence and M
ortality, by U.S. C
ensus Region and D
i�ision, State, and Metropolitan A
rea
�0�
Table 2.22.1.2F: Pancreas. Age-Adjusted Cancer Death Rates∗ and 95% Confidence Intervals, by U.S. CensusRegion and Division, State, and Race and Ethnicity, United States† (continued)
Females, 2004
Area All Races White Black Hispanic‡§
Louisiana 10.9 ( 9.7- 12.3) 9.9 ( 8.6- 11.5) 14.0 ( 11.2- 17.2) ∼Oklahoma 8.6 ( 7.4- 10.0) 8.2 ( 6.9- 9.6) 17.0 ( 10.0- 26.7) ∼Texas 8.8 ( 8.2- 9.4) 8.5 ( 7.9- 9.1) 12.7 ( 10.5- 15.1) 7.8 ( 6.6- 9.1)
West 9.1 ( 8.8- 9.4) 9.1 ( 8.7- 9.4) 14.1 ( 12.1- 16.2) 8.5 ( 7.6- 9.5)
Mountain 8.8 ( 8.2- 9.4) 8.8 ( 8.2- 9.4) 10.3 ( 6.5- 15.5) 9.1 ( 7.3- 11.2)
Arizona 7.7 ( 6.8- 8.7) 7.6 ( 6.6- 8.6) ∼ 5.4 ( 3.2- 8.6)
Colorado 8.6 ( 7.4- 10.0) 8.6 ( 7.3- 9.9) ∼ 14.2 ( 9.4- 20.3)
Idaho 10.7 ( 8.5- 13.3) 10.7 ( 8.5- 13.4) ∼ ∼Montana 9.3 ( 7.0- 12.2) 9.4 ( 7.1- 12.4) ∼ ∼Nevada 10.3 ( 8.5- 12.3) 10.5 ( 8.5- 12.7) ∼ ∼New Mexico 9.0 ( 7.3- 11.1) 9.6 ( 7.7- 11.7) ∼ 10.7 ( 7.4- 14.9)
Utah 8.0 ( 6.3- 9.9) 7.9 ( 6.2- 9.9) ∼ ∼Wyoming 10.8 ( 7.3- 15.4) 10.0 ( 6.6- 14.6) ∼ ∼
Pacific 9.2 ( 8.9- 9.6) 9.2 ( 8.8- 9.6) 14.7 ( 12.5- 17.1) 8.3 ( 7.3- 9.4)
Alaska 7.7 ( 4.3- 12.5) ∼ ∼ ∼California 8.8 ( 8.4- 9.3) 8.7 ( 8.3- 9.2) 14.6 ( 12.3- 17.1) 8.3 ( 7.3- 9.4)
Hawaii 10.3 ( 8.1- 12.8) ∼ ∼ ∼Oregon 10.7 ( 9.3- 12.2) 10.6 ( 9.2- 12.1) ∼ ∼Washington 10.5 ( 9.4- 11.7) 10.7 ( 9.6- 12.0) ∼ ∼
∗ Rates are per 100,000 persons and are age-adjusted to the 2000 U.S. standard population (19 age groups - Census P25-1130).† Data are from the National Vital Statistics System (NVSS).‡ Data for specified racial or ethnic populations other than white and black should be interpreted with caution. See Technical Notes.
§ Hispanic origin is not mutually exclusive from race categories (white, black).
∼ Rates are suppressed if fewer than 16 cases were reported in a specific category (area, race, ethnicity).
Note: U.S. rates are as presented in Table 1.1.1.2F.

United
States Cancer Statistics: 2004 Incid
ence and M
ortality
�0�
continued
Table 2.23.1.1: Prostate. Age-Adjusted Invasive Cancer Incidence Rates∗ and 95% Confidence Intervals, byU.S. Census Region and Division, State and Metropolitan Area, and Race and Ethnicity, United States†‡
Males, 2004
Area All Races White Black Hispanic§
United States 145.3 (144.6- 145.9) 134.5 (133.8- 135.2) 217.5 (214.6- 220.3) 121.9 (119.5- 124.4)
Northeast 151.6 (150.1- 153.2) 141.9 (140.3- 143.4) 234.4 (227.8- 241.1) 154.9 (147.9- 162.0)
New England 152.1 (149.1- 155.1) 147.1 (144.2- 150.2) 222.7 (203.6- 242.9) 181.4 (160.0- 204.4)
Connecticut 143.0 (137.3- 149.0) 137.9 (132.0- 143.9) 215.5 (186.9- 246.9) 159.8 (128.3- 195.7)
Maine 167.4 (157.9- 177.3) 164.7 (155.3- 174.6) ∼ ∼Massachusetts 154.5 (150.0- 159.0) 148.3 (143.8- 152.9) 241.1 (212.6- 271.9) 190.8 (159.2- 226.2)
New Hampshire 158.0 (148.1- 168.4) 152.9 (143.1- 163.2) ∼ ∼Rhode Island 143.6 (133.4- 154.5) 137.6 (127.3- 148.6) 187.1 (127.0- 263.7) 226.8 (155.0- 316.2)
Vermont 148.6 (135.3- 162.9) 148.9 (135.6- 163.3) ∼ ∼Middle Atlantic 151.5 (149.7- 153.2) 139.7 (137.9- 141.5) 235.8 (228.8- 243.0) 151.2 (143.8- 158.8)
New Jersey 157.8 (153.8- 161.8) 143.6 (139.5- 147.7) 242.6 (226.9- 259.0) 157.7 (142.9- 173.5)
New York 153.9 (151.3- 156.5) 141.8 (139.0- 144.6) 232.4 (223.1- 242.0) 151.8 (142.8- 161.1)
Pennsylvania 144.5 (141.5- 147.5) 135.0 (132.1- 138.0) 239.3 (224.8- 254.5) -
Midwest 147.9 (146.5- 149.3) 134.7 (133.4- 136.1) 208.6 (202.3- 215.0) 97.8 ( 89.7- 106.3)
East North Central 146.7 (145.1- 148.4) 131.0 (129.4- 132.7) 211.6 (204.7- 218.6) 104.9 ( 95.6- 114.7)
Illinois 148.0 (144.7- 151.3) 133.6 (130.3- 137.0) 206.1 (194.5- 218.3) 106.5 ( 94.2- 119.6)
Indiana 128.7 (124.4- 133.0) 123.3 (119.0- 127.7) 176.5 (156.8- 197.8) 84.9 ( 59.9- 115.8)
Michigan 170.7 (166.9- 174.6) 147.3 (143.6- 151.2) 248.9 (234.3- 264.0) 98.8 ( 76.0- 125.4)
Detroit 196.6 (190.0- 203.4) 173.4 (166.4- 180.7) 271.8 (254.2- 290.3) 135.3 ( 94.9- 185.3)
Ohio 133.4 (130.3- 136.6) 113.1 (110.1- 116.2) 183.2 (170.9- 196.2) 126.0 ( 96.8- 160.4)
Wisconsin 148.6 (144.0- 153.4) 142.7 (138.0- 147.5) 272.5 (235.4- 313.4) 100.3 ( 68.1- 140.7)
West North Central 150.4 (147.9- 153.0) 142.5 (140.0- 145.0) 192.1 (176.8- 208.2) 67.4 ( 52.8- 84.4)
Iowa 140.3 (134.3- 146.5) 134.3 (128.4- 140.4) 177.9 (121.3- 250.1) ∼Kansas 162.8 (155.8- 170.1) 153.5 (146.4- 160.7) 211.3 (169.6- 259.1) ∼Minnesota 184.6 (179.0- 190.4) 169.5 (164.0- 175.1) 211.4 (163.5- 267.7) 107.0 ( 65.9- 161.3)
Missouri 117.2 (113.2- 121.4) 111.5 (107.4- 115.8) 185.4 (166.9- 205.4) 75.6 ( 44.7- 117.2)
Nebraska 150.0 (141.7- 158.7) 141.5 (133.3- 150.1) 176.9 (119.8- 249.4) 130.5 ( 78.4- 200.0)
North Dakota 152.1 (138.9- 166.2) 151.7 (138.3- 166.0) ∼ ∼South Dakota 180.1 (166.9- 194.2) 181.0 (167.5- 195.4) ∼ ∼
South 138.1 (137.0- 139.2) 123.9 (122.7- 125.0) 216.9 (212.9- 220.9) 105.6 (102.0- 109.3)
South Atlantic 137.3 (135.8- 138.8) 122.5 (121.0- 124.1) 222.9 (217.5- 228.3) 114.3 (108.8- 120.1)
Delaware 153.2 (141.3- 165.9) 136.3 (124.1- 149.4) 251.0 (208.1- 299.6) ∼District of Columbia 173.6 (157.0- 191.5) 106.5 ( 85.4- 131.3) 197.2 (174.7- 221.7) ∼Florida 121.9 (119.8- 124.1) 114.1 (111.9- 116.3) 194.4 (184.4- 204.7) -
Georgia 156.6 (152.2- 161.0) 134.4 (129.8- 139.1) 245.4 (232.8- 258.3) 100.1 ( 75.4- 129.3)
Atlanta 157.7 (149.6- 166.2) 131.9 (123.2- 141.1) 244.3 (223.1- 266.7) 97.4 ( 59.7- 146.8)
Maryland
North Carolina 148.8 (144.9- 152.8) 131.2 (127.2- 135.4) 239.0 (226.3- 252.2) 63.0 ( 42.6- 88.6)
South Carolina 163.5 (157.7- 169.3) 138.2 (132.3- 144.4) 243.2 (227.8- 259.3) -
Virginia 139.3 (135.2- 143.5) 123.5 (119.3- 127.9) 211.2 (198.2- 224.9) 125.1 ( 96.1- 159.1)
West Virginia 122.9 (116.0- 130.2) 121.3 (114.3- 128.7) 177.2 (125.9- 241.3) ∼East South Central 134.4 (131.8- 137.1) 119.8 (117.1- 122.4) 200.8 (192.1- 209.7) 86.8 ( 64.3- 113.7)
Alabama 149.5 (144.2- 154.9) 129.2 (123.8- 134.8) 224.8 (209.6- 240.8) 108.1 ( 62.4- 170.2)
Kentucky 129.7 (124.5- 135.0) 116.8 (111.7- 122.0) 188.5 (161.7- 218.2) -
Mississippi 152.7 (145.8- 159.8) 127.0 (119.8- 134.5) 218.6 (202.0- 236.1) 131.7 ( 71.8- 217.3)
Tennessee 117.5 (113.4- 121.7) 112.3 (108.1- 116.7) 151.8 (137.2- 167.3) ∼

Cancer Incidence and M
ortality, by U.S. C
ensus Region and D
i�ision, State, and Metropolitan A
rea
�0�
Table 2.23.1.1: Prostate. Age-Adjusted Invasive Cancer Incidence Rates∗ and 95% Confidence Intervals, byU.S. Census Region and Division, State and Metropolitan Area, and Race and Ethnicity, United States†‡(continued)
Males, 2004
Area All Races White Black Hispanic§
West South Central 142.6 (140.6- 144.7) 129.5 (127.4- 131.6) 215.6 (207.6- 223.8) 100.0 ( 95.1- 105.0)
Arkansas 148.2 (141.7- 154.9) 142.8 (136.1- 149.7) 188.0 (164.5- 213.6) ∼Louisiana 168.9 (163.0- 174.9) 145.7 (139.4- 152.1) 250.3 (235.2- 266.0) 79.3 ( 51.6- 115.3)
Oklahoma 137.5 (131.8- 143.3) 132.1 (126.2- 138.2) 201.5 (170.0- 236.7) 91.8 ( 60.0- 132.6)
Texas 136.8 (134.3- 139.4) 123.5 (121.0- 126.1) 201.2 (190.5- 212.3) 101.3 ( 96.3- 106.5)
West 148.9 (147.5- 150.4) 145.0 (143.5- 146.6) 204.7 (196.1- 213.6) 129.6 (125.6- 133.7)
Mountain 140.1 (137.6- 142.6) 135.3 (132.8- 137.9) 159.9 (142.1- 179.1) 109.9 (102.8- 117.3)
Arizona 109.7 (105.8- 113.8) 105.0 (101.0- 109.0) 169.6 (136.6- 207.6) 81.1 ( 70.5- 92.7)
Colorado 147.1 (141.5- 152.9) 132.4 (126.9- 138.1) 173.8 (139.5- 213.6) 111.7 ( 96.0- 129.1)
Idaho 162.4 (152.3- 172.9) 163.1 (152.9- 173.8) ∼ 140.1 ( 81.8- 218.4)
Montana 173.5 (161.9- 185.6) 171.4 (159.7- 183.7) ∼ ∼Nevada 135.7 (128.6- 143.2) 128.9 (121.6- 136.6) 151.3 (120.6- 187.1) 124.3 (100.3- 151.7)
New Mexico 143.0 (135.1- 151.1) 148.6 (140.2- 157.3) 115.5 ( 69.3- 180.2) 127.5 (114.3- 141.8)
Utah 186.3 (177.0- 196.0) 186.0 (176.5- 195.8) ∼ 127.2 ( 89.1- 174.2)
Wyoming 163.4 (147.5- 180.6) 157.5 (141.8- 174.5) ∼ 215.0 (130.4- 330.3)
Pacific 153.0 (151.3- 154.8) 150.2 (148.3- 152.1) 214.4 (204.6- 224.5) 136.9 (132.1- 141.8)
Alaska 140.4 (123.7- 158.6) 148.6 (129.4- 169.6) ∼ ∼California 152.5 (150.4- 154.5) 149.3 (147.1- 151.6) 215.5 (205.2- 226.1) 137.6 (132.7- 142.7)
San Francisco-Oakland 149.8 (144.2- 155.5) 155.5 (148.7- 162.5) 197.7 (176.1- 221.2) 110.0 ( 94.6- 127.0)
San Jose-Monterey 161.9 (153.7- 170.4) 179.1 (169.4- 189.2) 210.5 (146.8- 290.1) 124.7 (106.1- 145.3)
Los Angeles 159.3 (155.2- 163.5) 150.6 (145.9- 155.4) 226.8 (210.9- 243.5) 149.8 (141.3- 158.5)
Hawaii 136.0 (126.8- 145.7) 167.5 (147.7- 189.3) ∼ 142.6 ( 86.8- 216.7)
Oregon 147.8 (142.1- 153.7) 143.7 (137.9- 149.6) 189.3 (131.6- 261.9) 108.9 ( 77.5- 147.4)
Washington 163.8 (159.0- 168.8) 157.9 (153.0- 163.0) 218.6 (179.6- 262.6) 127.7 (100.4- 159.2)
Seattle-Puget Sound 168.0 (162.0- 174.1) 172.2 (165.8- 178.8) 236.7 (193.5- 285.7) 138.1 ( 98.9- 185.8)
∗ Rates are per 100,000 persons and are age-adjusted to the 2000 U.S. standard population (19 age groups - Census P25-1130).† Data are from all state and metropolitan area cancer registries, except Maryland. Included data cover approximately 98% of the population and met data
quality criteria for all invasive cancer sites combined. See Appendix B for registry-specific data quality information.‡ Invasive cancers only.
§ Data for specified racial or ethnic populations other than white and black should be interpreted with caution. See Technical Notes.
Hispanic origin is not mutually exclusive from race categories (white, black).
∼ Rates are suppressed if fewer than 16 cases were reported in a specific category (area, race, ethnicity).
- Rates are suppressed at the state’s or metropolitan area’s request. See Technical Notes.
Notes: Cases from suppressed rates are included in the U.S. and region/division rates. U.S. rates are as presented in Table 1.1.1.1M. Michigan, Georgia,
California, and Washington state rates each include cases from the SEER metropolitan areas.

United
States Cancer Statistics: 2004 Incid
ence and M
ortality
�0�
continued
Table 2.23.1.2: Prostate. Age-Adjusted Cancer Death Rates∗ and 95% Confidence Intervals, by U.S. CensusRegion and Division, State, and Race and Ethnicity, United States†
Males, 2004
Area All Races White Black Hispanic‡§
United States 25.4 ( 25.2- 25.7) 23.4 ( 23.1- 23.7) 56.1 ( 54.5- 57.7) 19.3 ( 18.2- 20.4)
Northeast 24.4 ( 23.8- 25.1) 22.9 ( 22.3- 23.6) 48.4 ( 45.0- 52.0) 18.6 ( 15.9- 21.7)
New England 25.1 ( 23.9- 26.4) 24.7 ( 23.5- 26.0) 47.5 ( 37.4- 59.2) 15.8 ( 9.2- 24.6)
Connecticut 25.4 ( 23.0- 28.0) 24.8 ( 22.3- 27.5) 41.9 ( 27.8- 59.6) ∼Maine 26.6 ( 22.6- 31.1) 26.5 ( 22.4- 31.0) ∼ ∼Massachusetts 23.5 ( 21.7- 25.3) 23.0 ( 21.2- 24.9) 49.9 ( 35.4- 67.6) ∼New Hampshire 28.5 ( 24.0- 33.6) 28.8 ( 24.2- 33.9) ∼ ∼Rhode Island 26.9 ( 22.5- 31.8) 26.1 ( 21.7- 31.1) ∼ ∼Vermont 29.2 ( 23.0- 36.5) 29.4 ( 23.2- 36.8) ∼ ∼
Middle Atlantic 24.2 ( 23.4- 24.9) 22.3 ( 21.5- 23.0) 48.6 ( 45.0- 52.4) 18.9 ( 16.0- 22.2)
New Jersey 23.6 ( 22.0- 25.2) 21.1 ( 19.5- 22.8) 53.7 ( 45.3- 62.9) 14.3 ( 9.6- 20.2)
New York 24.4 ( 23.3- 25.5) 22.5 ( 21.3- 23.7) 46.2 ( 41.5- 51.2) 20.5 ( 16.7- 24.8)
Pennsylvania 24.2 ( 23.0- 25.5) 22.6 ( 21.4- 23.9) 50.9 ( 43.7- 58.8) ∼Midwest 26.0 ( 25.4- 26.6) 24.3 ( 23.7- 25.0) 54.6 ( 51.0- 58.3) 13.4 ( 10.1- 17.3)
East North Central 26.5 ( 25.8- 27.3) 24.4 ( 23.7- 25.2) 54.3 ( 50.4- 58.3) 11.5 ( 8.2- 15.6)
Illinois 26.1 ( 24.6- 27.6) 22.8 ( 21.4- 24.3) 60.5 ( 53.4- 68.1) 13.2 ( 8.4- 19.3)
Indiana 28.2 ( 26.1- 30.5) 26.3 ( 24.2- 28.5) 64.3 ( 51.2- 79.4) ∼Michigan 24.3 ( 22.7- 25.9) 22.1 ( 20.5- 23.7) 46.6 ( 39.8- 54.0) ∼Ohio 27.0 ( 25.5- 28.5) 24.9 ( 23.4- 26.4) 52.7 ( 45.5- 60.6) ∼Wisconsin 28.5 ( 26.3- 30.8) 28.3 ( 26.1- 30.6) 45.3 ( 26.9- 69.6) ∼
West North Central 25.0 ( 23.9- 26.1) 24.1 ( 23.1- 25.2) 56.4 ( 47.0- 66.8) 21.2 ( 12.2- 33.1)
Iowa 24.7 ( 22.1- 27.4) 24.6 ( 22.0- 27.3) ∼ ∼Kansas 23.0 ( 20.4- 26.0) 21.3 ( 18.7- 24.2) 76.7 ( 51.0- 109.4) ∼Minnesota 27.6 ( 25.3- 30.0) 27.4 ( 25.2- 29.8) ∼ ∼Missouri 23.4 ( 21.4- 25.4) 21.3 ( 19.4- 23.4) 54.2 ( 42.8- 67.5) ∼Nebraska 24.2 ( 20.9- 28.0) 24.1 ( 20.7- 27.9) ∼ ∼North Dakota 27.8 ( 22.3- 34.3) 28.2 ( 22.7- 34.8) ∼ ∼South Dakota 27.4 ( 22.3- 33.3) 27.3 ( 22.2- 33.2) ∼ ∼
South 26.4 ( 25.9- 26.9) 22.4 ( 21.9- 22.9) 60.3 ( 58.0- 62.7) 19.4 ( 17.7- 21.3)
South Atlantic 25.7 ( 25.0- 26.3) 21.5 ( 20.9- 22.2) 58.9 ( 55.9- 62.0) 19.8 ( 17.3- 22.6)
Delaware 31.1 ( 25.4- 37.6) 29.5 ( 23.5- 36.4) 45.8 ( 26.5- 72.1) ∼District of Columbia 44.8 ( 36.0- 54.9) 32.6 ( 20.3- 49.1) 53.4 ( 41.6- 67.5) ∼Florida 22.0 ( 21.1- 23.0) 20.1 ( 19.2- 21.1) 57.2 ( 50.7- 64.2) 21.4 ( 18.6- 24.6)
Georgia 29.3 ( 27.1- 31.7) 21.5 ( 19.4- 23.8) 65.3 ( 57.7- 73.5) ∼Maryland 28.0 ( 25.7- 30.5) 23.4 ( 21.0- 25.9) 52.4 ( 44.8- 60.8) ∼North Carolina 29.1 ( 27.1- 31.1) 23.2 ( 21.3- 25.2) 64.8 ( 57.2- 72.9) ∼South Carolina 32.6 ( 29.7- 35.7) 24.1 ( 21.3- 27.1) 67.7 ( 58.5- 77.7) ∼Virginia 25.7 ( 23.8- 27.8) 21.7 ( 19.7- 23.8) 52.2 ( 44.9- 60.2) ∼West Virginia 24.2 ( 20.8- 27.8) 23.9 ( 20.5- 27.6) ∼ ∼
East South Central 29.7 ( 28.3- 31.2) 24.4 ( 23.0- 25.8) 65.8 ( 60.3- 71.7) ∼Alabama 33.0 ( 30.2- 36.0) 25.0 ( 22.3- 27.9) 71.8 ( 62.4- 82.1) ∼Kentucky 27.3 ( 24.6- 30.2) 25.6 ( 22.9- 28.6) 62.4 ( 44.9- 83.6) ∼Mississippi 31.8 ( 28.2- 35.6) 20.7 ( 17.4- 24.4) 65.1 ( 55.2- 76.1) ∼Tennessee 27.9 ( 25.6- 30.3) 24.6 ( 22.3- 27.0) 59.0 ( 48.8- 70.5) ∼
West South Central 26.3 ( 25.3- 27.3) 23.2 ( 22.2- 24.2) 59.1 ( 54.4- 64.1) 19.8 ( 17.4- 22.5)
Arkansas 28.3 ( 25.3- 31.7) 24.6 ( 21.6- 27.9) 66.7 ( 51.8- 84.2) ∼

Cancer Incidence and M
ortality, by U.S. C
ensus Region and D
i�ision, State, and Metropolitan A
rea
�0�
Table 2.23.1.2: Prostate. Age-Adjusted Cancer Death Rates∗ and 95% Confidence Intervals, by U.S. CensusRegion and Division, State, and Race and Ethnicity, United States† (continued)
Males, 2004
Area All Races White Black Hispanic‡§
Louisiana 31.8 ( 29.0- 34.8) 23.8 ( 21.0- 26.8) 60.3 ( 52.3- 69.1) ∼Oklahoma 24.2 ( 21.6- 26.9) 23.0 ( 20.4- 25.9) 55.1 ( 37.6- 77.0) ∼Texas 25.1 ( 23.9- 26.3) 22.9 ( 21.7- 24.2) 57.0 ( 50.5- 64.0) 20.3 ( 17.7- 23.0)
West 24.3 ( 23.7- 25.0) 24.6 ( 23.9- 25.3) 50.7 ( 45.7- 56.1) 20.4 ( 18.6- 22.3)
Mountain 25.2 ( 24.0- 26.4) 25.0 ( 23.8- 26.2) 46.6 ( 34.8- 60.6) 23.8 ( 20.0- 28.0)
Arizona 23.6 ( 21.6- 25.6) 23.2 ( 21.2- 25.3) 49.2 ( 28.0- 77.6) 30.2 ( 22.4- 39.3)
Colorado 25.0 ( 22.4- 27.8) 24.4 ( 21.8- 27.2) 54.2 ( 31.7- 84.4) 19.5 ( 12.5- 28.3)
Idaho 29.2 ( 24.7- 34.2) 29.2 ( 24.7- 34.3) ∼ ∼Montana 31.1 ( 26.0- 37.0) 30.9 ( 25.7- 36.8) ∼ ∼Nevada 25.9 ( 22.4- 29.8) 26.3 ( 22.5- 30.4) ∼ ∼New Mexico 24.2 ( 20.7- 28.1) 24.2 ( 20.6- 28.3) ∼ 21.9 ( 15.9- 29.1)
Utah 24.2 ( 20.7- 28.2) 24.4 ( 20.8- 28.4) ∼ ∼Wyoming 26.6 ( 19.7- 35.1) 26.5 ( 19.5- 35.1) ∼ ∼
Pacific 24.0 ( 23.3- 24.7) 24.5 ( 23.7- 25.3) 51.6 ( 46.1- 57.5) 19.3 ( 17.3- 21.4)
Alaska 26.2 ( 17.2- 37.4) 25.8 ( 16.0- 38.4) ∼ ∼California 23.8 ( 23.0- 24.7) 23.9 ( 23.0- 24.9) 52.7 ( 46.9- 59.0) 19.2 ( 17.1- 21.3)
Hawaii 18.9 ( 15.6- 22.8) 30.5 ( 21.8- 41.4) ∼ ∼Oregon 25.8 ( 23.3- 28.4) 26.0 ( 23.5- 28.7) ∼ ∼Washington 25.0 ( 23.0- 27.1) 25.6 ( 23.5- 27.8) ∼ ∼
∗ Rates are per 100,000 persons and are age-adjusted to the 2000 U.S. standard population (19 age groups - Census P25-1130).† Data are from the National Vital Statistics System (NVSS).‡ Data for specified racial or ethnic populations other than white and black should be interpreted with caution. See Technical Notes.
§ Hispanic origin is not mutually exclusive from race categories (white, black).
∼ Rates are suppressed if fewer than 16 cases were reported in a specific category (area, race, ethnicity).
Note: U.S. rates are as presented in Table 1.1.1.2M.

United
States Cancer Statistics: 2004 Incid
ence and M
ortality
��0
continued
Table 2.24.1.1M: Stomach. Age-Adjusted Invasive Cancer Incidence Rates∗ and 95% Confidence Intervals, byU.S. Census Region and Division, State and Metropolitan Area, and Race and Ethnicity, United States†‡
Males, 2004
Area All Races White Black Hispanic§
United States 9.7 ( 9.6- 9.9) 8.7 ( 8.5- 8.9) 16.1 ( 15.3- 16.9) 14.5 ( 13.6- 15.3)
Northeast 11.7 ( 11.3- 12.2) 10.8 ( 10.4- 11.3) 16.6 ( 14.8- 18.6) 17.8 ( 15.5- 20.4)
New England 11.6 ( 10.8- 12.5) 11.3 ( 10.4- 12.1) 20.0 ( 14.1- 27.3) 18.3 ( 12.6- 25.6)
Connecticut 12.5 ( 10.8- 14.3) 12.3 ( 10.6- 14.2) ∼ 21.0 ( 11.8- 34.1)
Maine 9.5 ( 7.3- 12.1) 9.4 ( 7.2- 12.1) ∼ ∼Massachusetts 11.8 ( 10.6- 13.2) 11.3 ( 10.0- 12.6) 20.8 ( 12.7- 31.6) 20.3 ( 11.4- 32.8)
New Hampshire 10.2 ( 7.7- 13.2) 10.2 ( 7.7- 13.2) ∼ ∼Rhode Island 15.0 ( 11.8- 18.8) 14.5 ( 11.3- 18.3) ∼ ∼Vermont 7.0 ( 4.3- 10.8) 7.1 ( 4.3- 10.9) ∼ ∼
Middle Atlantic 11.8 ( 11.3- 12.3) 10.7 ( 10.2- 11.2) 16.2 ( 14.3- 18.3) 17.8 ( 15.2- 20.5)
New Jersey 12.7 ( 11.6- 13.8) 11.6 ( 10.5- 12.8) 17.1 ( 13.0- 22.1) 20.9 ( 15.7- 27.1)
New York 12.9 ( 12.2- 13.7) 11.7 ( 10.9- 12.5) 15.8 ( 13.3- 18.7) 16.9 ( 13.9- 20.3)
Pennsylvania 9.7 ( 8.9- 10.5) 8.9 ( 8.2- 9.7) 16.7 ( 13.0- 21.1) -
Midwest 9.0 ( 8.6- 9.3) 8.2 ( 7.9- 8.6) 15.3 ( 13.6- 17.1) 12.2 ( 9.5- 15.3)
East North Central 9.3 ( 8.9- 9.8) 8.5 ( 8.1- 9.0) 15.4 ( 13.5- 17.4) 13.0 ( 9.9- 16.6)
Illinois 11.1 ( 10.2- 12.0) 10.1 ( 9.1- 11.0) 17.4 ( 14.0- 21.3) 12.6 ( 8.9- 17.2)
Indiana 8.2 ( 7.1- 9.4) 7.7 ( 6.7- 8.9) 13.6 ( 8.4- 20.7) ∼Michigan 9.4 ( 8.5- 10.4) 8.6 ( 7.7- 9.6) 15.5 ( 11.9- 19.7) ∼
Detroit 12.2 ( 10.6- 14.0) 11.3 ( 9.6- 13.3) 15.7 ( 11.6- 20.7) ∼Ohio 8.8 ( 8.0- 9.7) 7.9 ( 7.1- 8.7) 13.9 ( 10.6- 17.8) ∼Wisconsin 7.9 ( 6.8- 9.1) 7.7 ( 6.7- 8.9) ∼ ∼
West North Central 8.1 ( 7.6- 8.8) 7.6 ( 7.1- 8.2) 14.6 ( 10.6- 19.5) ∼Iowa 8.7 ( 7.2- 10.4) 8.7 ( 7.2- 10.3) ∼ ∼Kansas 7.6 ( 6.1- 9.3) 7.2 ( 5.7- 8.9) ∼ ∼Minnesota 8.0 ( 6.9- 9.3) 7.2 ( 6.1- 8.4) ∼ ∼Missouri 8.6 ( 7.5- 9.8) 8.0 ( 6.9- 9.2) 15.7 ( 10.6- 22.3) ∼Nebraska 8.2 ( 6.3- 10.4) 8.0 ( 6.1- 10.2) ∼ ∼North Dakota 7.7 ( 5.0- 11.5) 7.6 ( 4.9- 11.4) ∼ ∼South Dakota 5.9 ( 3.7- 9.0) 4.9 ( 2.9- 7.8) ∼ ∼
South 9.0 ( 8.7- 9.3) 7.8 ( 7.5- 8.1) 16.4 ( 15.3- 17.6) 12.7 ( 11.4- 14.0)
South Atlantic 8.8 ( 8.4- 9.2) 7.7 ( 7.3- 8.1) 15.5 ( 14.0- 17.0) 10.5 ( 8.8- 12.4)
Delaware 8.9 ( 6.1- 12.4) 9.1 ( 6.1- 13.1) ∼ ∼District of Columbia 8.7 ( 5.2- 13.6) ∼ ∼ ∼Florida 8.6 ( 8.0- 9.2) 8.1 ( 7.5- 8.8) 13.2 ( 10.7- 16.2) -
Georgia 8.6 ( 7.5- 9.7) 6.9 ( 5.9- 8.1) 14.5 ( 11.5- 18.0) ∼Atlanta 7.8 ( 6.1- 9.9) 6.0 ( 4.2- 8.1) 12.3 ( 7.8- 18.2) ∼
Maryland
North Carolina 8.7 ( 7.7- 9.7) 7.4 ( 6.4- 8.4) 14.9 ( 11.7- 18.6) ∼South Carolina 11.3 ( 9.8- 13.0) 8.4 ( 6.9- 10.1) 21.7 ( 17.1- 27.0) -
Virginia 8.4 ( 7.4- 9.5) 6.1 ( 5.1- 7.1) 19.0 ( 15.0- 23.7) ∼West Virginia 9.1 ( 7.2- 11.3) 9.1 ( 7.2- 11.4) ∼ ∼
East South Central 8.0 ( 7.3- 8.7) 6.6 ( 6.0- 7.3) 15.9 ( 13.6- 18.6) ∼Alabama 8.2 ( 7.0- 9.6) 6.0 ( 4.8- 7.4) 17.7 ( 13.6- 22.7) ∼Kentucky 8.5 ( 7.2- 10.0) 8.0 ( 6.7- 9.5) ∼ -
Mississippi 9.7 ( 8.0- 11.7) 6.4 ( 4.8- 8.4) 18.3 ( 13.8- 23.7) ∼Tennessee 6.6 ( 5.6- 7.7) 6.0 ( 5.0- 7.1) 11.5 ( 7.9- 16.1) ∼

Cancer Incidence and M
ortality, by U.S. C
ensus Region and D
i�ision, State, and Metropolitan A
rea
���
Table 2.24.1.1M: Stomach. Age-Adjusted Invasive Cancer Incidence Rates∗ and 95% Confidence Intervals, byU.S. Census Region and Division, State and Metropolitan Area, and Race and Ethnicity, United States†‡(continued)
Males, 2004
Area All Races White Black Hispanic§
West South Central 9.8 ( 9.3- 10.4) 8.6 ( 8.0- 9.1) 18.9 ( 16.5- 21.5) 14.6 ( 12.8- 16.6)
Arkansas 8.0 ( 6.5- 9.6) 6.4 ( 5.1- 8.1) 21.3 ( 13.8- 31.2) ∼Louisiana 13.1 ( 11.5- 14.9) 9.9 ( 8.3- 11.7) 23.8 ( 19.2- 29.0) ∼Oklahoma 7.4 ( 6.1- 8.8) 6.5 ( 5.2- 7.9) ∼ ∼Texas 9.9 ( 9.2- 10.6) 9.1 ( 8.4- 9.8) 16.3 ( 13.1- 19.8) 14.8 ( 12.9- 16.8)
West 9.9 ( 9.5- 10.3) 8.7 ( 8.3- 9.1) 15.1 ( 12.7- 17.9) 15.3 ( 13.9- 16.7)
Mountain 8.0 ( 7.4- 8.7) 7.6 ( 7.0- 8.3) 16.5 ( 10.5- 24.3) 14.4 ( 11.9- 17.3)
Arizona 7.3 ( 6.3- 8.4) 6.9 ( 5.9- 8.1) ∼ 12.7 ( 8.5- 18.0)
Colorado 7.6 ( 6.4- 9.1) 7.6 ( 6.3- 9.1) ∼ 17.0 ( 11.1- 24.6)
Idaho 6.7 ( 4.8- 9.1) 6.7 ( 4.8- 9.1) ∼ ∼Montana 7.3 ( 5.0- 10.2) 6.5 ( 4.3- 9.4) ∼ ∼Nevada 9.3 ( 7.4- 11.5) 7.9 ( 6.1- 10.1) ∼ ∼New Mexico 11.0 ( 8.8- 13.5) 10.7 ( 8.5- 13.2) ∼ 15.6 ( 11.3- 21.0)
Utah 8.0 ( 6.1- 10.3) 8.0 ( 6.0- 10.3) ∼ ∼Wyoming 7.9 ( 4.6- 12.4) 7.3 ( 4.1- 11.9) ∼ ∼
Pacific 10.7 ( 10.2- 11.2) 9.3 ( 8.8- 9.7) 14.8 ( 12.1- 17.8) 15.6 ( 14.0- 17.3)
Alaska 11.8 ( 7.1- 18.3) ∼ ∼ ∼California 11.0 ( 10.4- 11.6) 9.7 ( 9.1- 10.3) 14.6 ( 11.8- 17.8) 15.7 ( 14.1- 17.5)
San Francisco-Oakland 11.7 ( 10.2- 13.4) 9.3 ( 7.7- 11.1) 20.0 ( 13.3- 28.9) 16.8 ( 11.1- 24.1)
San Jose-Monterey 8.9 ( 7.0- 11.1) 8.4 ( 6.3- 10.9) ∼ ∼Los Angeles 13.8 ( 12.6- 15.0) 11.4 ( 10.2- 12.8) 15.4 ( 11.2- 20.5) 16.3 ( 13.6- 19.4)
Hawaii 18.4 ( 15.1- 22.2) 11.3 ( 6.6- 18.1) ∼ ∼Oregon 8.1 ( 6.8- 9.5) 7.8 ( 6.5- 9.3) ∼ ∼Washington 9.1 ( 7.9- 10.3) 8.3 ( 7.1- 9.5) ∼ ∼
Seattle-Puget Sound 9.3 ( 7.9- 10.8) 8.5 ( 7.2- 10.1) ∼ ∼∗ Rates are per 100,000 persons and are age-adjusted to the 2000 U.S. standard population (19 age groups - Census P25-1130).† Data are from all state and metropolitan area cancer registries, except Maryland. Included data cover approximately 98% of the population and met data
quality criteria for all invasive cancer sites combined. See Appendix B for registry-specific data quality information.‡ Invasive cancers only.
§ Data for specified racial or ethnic populations other than white and black should be interpreted with caution. See Technical Notes.
Hispanic origin is not mutually exclusive from race categories (white, black).
∼ Rates are suppressed if fewer than 16 cases were reported in a specific category (area, race, ethnicity).
- Rates are suppressed at the state’s or metropolitan area’s request. See Technical Notes.
Notes: Cases from suppressed rates are included in the U.S. and region/division rates. U.S. rates are as presented in Table 1.1.1.1M. Michigan, Georgia,
California, and Washington state rates each include cases from the SEER metropolitan areas.
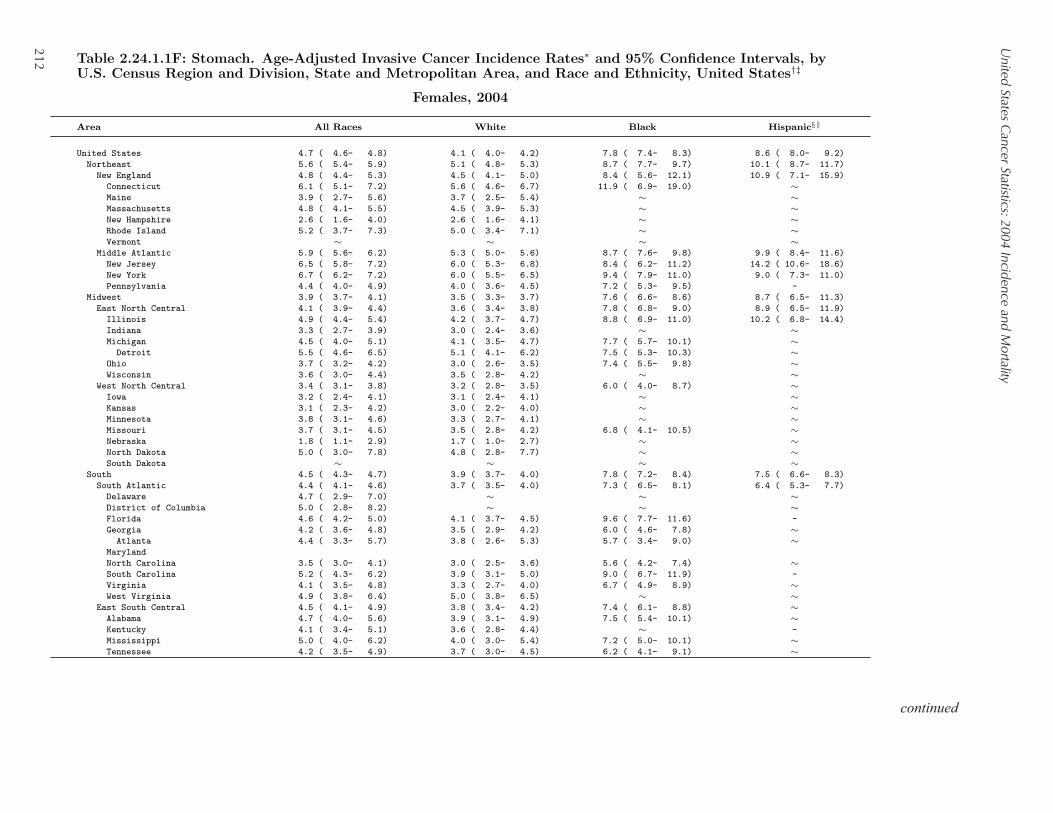
United
States Cancer Statistics: 2004 Incid
ence and M
ortality
���
continued
Table 2.24.1.1F: Stomach. Age-Adjusted Invasive Cancer Incidence Rates∗ and 95% Confidence Intervals, byU.S. Census Region and Division, State and Metropolitan Area, and Race and Ethnicity, United States†‡
Females, 2004
Area All Races White Black Hispanic§
United States 4.7 ( 4.6- 4.8) 4.1 ( 4.0- 4.2) 7.8 ( 7.4- 8.3) 8.6 ( 8.0- 9.2)
Northeast 5.6 ( 5.4- 5.9) 5.1 ( 4.8- 5.3) 8.7 ( 7.7- 9.7) 10.1 ( 8.7- 11.7)
New England 4.8 ( 4.4- 5.3) 4.5 ( 4.1- 5.0) 8.4 ( 5.6- 12.1) 10.9 ( 7.1- 15.9)
Connecticut 6.1 ( 5.1- 7.2) 5.6 ( 4.6- 6.7) 11.9 ( 6.9- 19.0) ∼Maine 3.9 ( 2.7- 5.6) 3.7 ( 2.5- 5.4) ∼ ∼Massachusetts 4.8 ( 4.1- 5.5) 4.5 ( 3.9- 5.3) ∼ ∼New Hampshire 2.6 ( 1.6- 4.0) 2.6 ( 1.6- 4.1) ∼ ∼Rhode Island 5.2 ( 3.7- 7.3) 5.0 ( 3.4- 7.1) ∼ ∼Vermont ∼ ∼ ∼ ∼
Middle Atlantic 5.9 ( 5.6- 6.2) 5.3 ( 5.0- 5.6) 8.7 ( 7.6- 9.8) 9.9 ( 8.4- 11.6)
New Jersey 6.5 ( 5.8- 7.2) 6.0 ( 5.3- 6.8) 8.4 ( 6.2- 11.2) 14.2 ( 10.6- 18.6)
New York 6.7 ( 6.2- 7.2) 6.0 ( 5.5- 6.5) 9.4 ( 7.9- 11.0) 9.0 ( 7.3- 11.0)
Pennsylvania 4.4 ( 4.0- 4.9) 4.0 ( 3.6- 4.5) 7.2 ( 5.3- 9.5) -
Midwest 3.9 ( 3.7- 4.1) 3.5 ( 3.3- 3.7) 7.6 ( 6.6- 8.6) 8.7 ( 6.5- 11.3)
East North Central 4.1 ( 3.9- 4.4) 3.6 ( 3.4- 3.8) 7.8 ( 6.8- 9.0) 8.9 ( 6.5- 11.9)
Illinois 4.9 ( 4.4- 5.4) 4.2 ( 3.7- 4.7) 8.8 ( 6.9- 11.0) 10.2 ( 6.8- 14.4)
Indiana 3.3 ( 2.7- 3.9) 3.0 ( 2.4- 3.6) ∼ ∼Michigan 4.5 ( 4.0- 5.1) 4.1 ( 3.5- 4.7) 7.7 ( 5.7- 10.1) ∼
Detroit 5.5 ( 4.6- 6.5) 5.1 ( 4.1- 6.2) 7.5 ( 5.3- 10.3) ∼Ohio 3.7 ( 3.2- 4.2) 3.0 ( 2.6- 3.5) 7.4 ( 5.5- 9.8) ∼Wisconsin 3.6 ( 3.0- 4.4) 3.5 ( 2.8- 4.2) ∼ ∼
West North Central 3.4 ( 3.1- 3.8) 3.2 ( 2.8- 3.5) 6.0 ( 4.0- 8.7) ∼Iowa 3.2 ( 2.4- 4.1) 3.1 ( 2.4- 4.1) ∼ ∼Kansas 3.1 ( 2.3- 4.2) 3.0 ( 2.2- 4.0) ∼ ∼Minnesota 3.8 ( 3.1- 4.6) 3.3 ( 2.7- 4.1) ∼ ∼Missouri 3.7 ( 3.1- 4.5) 3.5 ( 2.8- 4.2) 6.8 ( 4.1- 10.5) ∼Nebraska 1.8 ( 1.1- 2.9) 1.7 ( 1.0- 2.7) ∼ ∼North Dakota 5.0 ( 3.0- 7.8) 4.8 ( 2.8- 7.7) ∼ ∼South Dakota ∼ ∼ ∼ ∼
South 4.5 ( 4.3- 4.7) 3.9 ( 3.7- 4.0) 7.8 ( 7.2- 8.4) 7.5 ( 6.6- 8.3)
South Atlantic 4.4 ( 4.1- 4.6) 3.7 ( 3.5- 4.0) 7.3 ( 6.5- 8.1) 6.4 ( 5.3- 7.7)
Delaware 4.7 ( 2.9- 7.0) ∼ ∼ ∼District of Columbia 5.0 ( 2.8- 8.2) ∼ ∼ ∼Florida 4.6 ( 4.2- 5.0) 4.1 ( 3.7- 4.5) 9.6 ( 7.7- 11.6) -
Georgia 4.2 ( 3.6- 4.8) 3.5 ( 2.9- 4.2) 6.0 ( 4.6- 7.8) ∼Atlanta 4.4 ( 3.3- 5.7) 3.8 ( 2.6- 5.3) 5.7 ( 3.4- 9.0) ∼
Maryland
North Carolina 3.5 ( 3.0- 4.1) 3.0 ( 2.5- 3.6) 5.6 ( 4.2- 7.4) ∼South Carolina 5.2 ( 4.3- 6.2) 3.9 ( 3.1- 5.0) 9.0 ( 6.7- 11.9) -
Virginia 4.1 ( 3.5- 4.8) 3.3 ( 2.7- 4.0) 6.7 ( 4.9- 8.9) ∼West Virginia 4.9 ( 3.8- 6.4) 5.0 ( 3.8- 6.5) ∼ ∼
East South Central 4.5 ( 4.1- 4.9) 3.8 ( 3.4- 4.2) 7.4 ( 6.1- 8.8) ∼Alabama 4.7 ( 4.0- 5.6) 3.9 ( 3.1- 4.9) 7.5 ( 5.4- 10.1) ∼Kentucky 4.1 ( 3.4- 5.1) 3.6 ( 2.8- 4.4) ∼ -
Mississippi 5.0 ( 4.0- 6.2) 4.0 ( 3.0- 5.4) 7.2 ( 5.0- 10.1) ∼Tennessee 4.2 ( 3.5- 4.9) 3.7 ( 3.0- 4.5) 6.2 ( 4.1- 9.1) ∼

Cancer Incidence and M
ortality, by U.S. C
ensus Region and D
i�ision, State, and Metropolitan A
rea
��3
Table 2.24.1.1F: Stomach. Age-Adjusted Invasive Cancer Incidence Rates∗ and 95% Confidence Intervals, byU.S. Census Region and Division, State and Metropolitan Area, and Race and Ethnicity, United States†‡(continued)
Females, 2004
Area All Races White Black Hispanic§
West South Central 4.8 ( 4.5- 5.2) 4.2 ( 3.8- 4.5) 9.2 ( 7.9- 10.6) 8.4 ( 7.3- 9.7)
Arkansas 4.4 ( 3.4- 5.5) 3.4 ( 2.5- 4.5) 12.6 ( 8.0- 18.7) ∼Louisiana 5.3 ( 4.5- 6.3) 3.9 ( 3.0- 4.9) 9.4 ( 7.2- 12.1) ∼Oklahoma 4.4 ( 3.5- 5.4) 3.9 ( 3.1- 5.0) ∼ ∼Texas 4.9 ( 4.5- 5.3) 4.4 ( 3.9- 4.8) 8.7 ( 7.0- 10.7) 8.4 ( 7.2- 9.8)
West 5.1 ( 4.8- 5.3) 4.3 ( 4.1- 4.6) 6.9 ( 5.6- 8.5) 9.1 ( 8.2- 10.0)
Mountain 3.7 ( 3.4- 4.1) 3.5 ( 3.2- 3.9) ∼ 8.4 ( 6.7- 10.4)
Arizona 3.4 ( 2.8- 4.2) 3.3 ( 2.7- 4.1) ∼ 9.2 ( 6.3- 12.9)
Colorado 3.7 ( 2.9- 4.6) 3.4 ( 2.6- 4.3) ∼ 10.5 ( 6.4- 16.0)
Idaho 3.0 ( 1.8- 4.6) 2.8 ( 1.7- 4.4) ∼ ∼Montana 3.0 ( 1.7- 5.0) ∼ ∼ ∼Nevada 4.3 ( 3.2- 5.7) 4.5 ( 3.3- 6.1) ∼ ∼New Mexico 5.7 ( 4.3- 7.4) 5.3 ( 3.9- 7.0) ∼ 7.4 ( 4.7- 10.9)
Utah 3.5 ( 2.4- 4.9) 3.4 ( 2.3- 4.8) ∼ ∼Wyoming ∼ ∼ ∼ ∼
Pacific 5.6 ( 5.3- 5.9) 4.7 ( 4.4- 5.0) 7.4 ( 5.9- 9.1) 9.3 ( 8.2- 10.4)
Alaska ∼ ∼ ∼ ∼California 5.9 ( 5.6- 6.3) 5.1 ( 4.7- 5.5) 7.4 ( 5.8- 9.3) 9.3 ( 8.2- 10.4)
San Francisco-Oakland 6.1 ( 5.2- 7.2) 5.5 ( 4.4- 6.8) ∼ 11.2 ( 7.3- 16.1)
San Jose-Monterey 6.4 ( 5.0- 8.1) 5.6 ( 4.1- 7.4) ∼ 12.8 ( 8.0- 19.2)
Los Angeles 7.7 ( 7.0- 8.6) 6.2 ( 5.4- 7.1) 8.3 ( 5.9- 11.3) 9.5 ( 7.9- 11.3)
Hawaii 6.5 ( 4.8- 8.5) ∼ ∼ ∼Oregon 4.7 ( 3.8- 5.8) 4.1 ( 3.3- 5.2) ∼ ∼Washington 4.4 ( 3.7- 5.2) 3.7 ( 3.1- 4.5) ∼ ∼
Seattle-Puget Sound 4.9 ( 4.0- 5.9) 3.9 ( 3.0- 4.8) ∼ ∼∗ Rates are per 100,000 persons and are age-adjusted to the 2000 U.S. standard population (19 age groups - Census P25-1130).† Data are from all state and metropolitan area cancer registries, except Maryland. Included data cover approximately 98% of the population and met data
quality criteria for all invasive cancer sites combined. See Appendix B for registry-specific data quality information.‡ Invasive cancers only.
§ Data for specified racial or ethnic populations other than white and black should be interpreted with caution. See Technical Notes.
Hispanic origin is not mutually exclusive from race categories (white, black).
∼ Rates are suppressed if fewer than 16 cases were reported in a specific category (area, race, ethnicity).
- Rates are suppressed at the state’s or metropolitan area’s request. See Technical Notes.
Notes: Cases from suppressed rates are included in the U.S. and region/division rates. U.S. rates are as presented in Table 1.1.1.1F. Michigan, Georgia,
California, and Washington state rates each include cases from the SEER metropolitan areas.

United
States Cancer Statistics: 2004 Incid
ence and M
ortality
���
continued
Table 2.24.1.2M: Stomach. Age-Adjusted Cancer Death Rates∗ and 95% Confidence Intervals, by U.S. CensusRegion and Division, State, and Race and Ethnicity, United States†
Males, 2004
Area All Races White Black Hispanic‡§
United States 5.5 ( 5.4- 5.7) 4.9 ( 4.7- 5.0) 11.2 ( 10.5- 11.9) 8.8 ( 8.2- 9.5)
Northeast 6.1 ( 5.8- 6.5) 5.7 ( 5.4- 6.0) 10.1 ( 8.6- 11.6) 9.6 ( 7.8- 11.6)
New England 5.7 ( 5.1- 6.3) 5.5 ( 4.9- 6.1) 11.7 ( 7.4- 17.4) ∼Connecticut 6.3 ( 5.1- 7.6) 6.1 ( 4.9- 7.5) ∼ ∼Maine 4.4 ( 3.0- 6.3) 4.3 ( 2.9- 6.2) ∼ ∼Massachusetts 5.8 ( 5.0- 6.8) 5.6 ( 4.7- 6.5) ∼ ∼New Hampshire 3.4 ( 2.1- 5.3) 3.5 ( 2.1- 5.4) ∼ ∼Rhode Island 8.7 ( 6.3- 11.7) 8.7 ( 6.2- 11.7) ∼ ∼Vermont ∼ ∼ ∼ ∼
Middle Atlantic 6.3 ( 6.0- 6.7) 5.8 ( 5.4- 6.2) 9.9 ( 8.4- 11.5) 10.0 ( 8.0- 12.2)
New Jersey 6.8 ( 6.0- 7.7) 6.2 ( 5.4- 7.1) 11.0 ( 7.6- 15.3) 10.7 ( 6.8- 15.8)
New York 7.0 ( 6.4- 7.5) 6.5 ( 5.9- 7.1) 8.8 ( 7.0- 11.0) 9.5 ( 7.2- 12.2)
Pennsylvania 5.2 ( 4.7- 5.8) 4.7 ( 4.2- 5.3) 11.6 ( 8.5- 15.3) ∼Midwest 4.9 ( 4.7- 5.2) 4.5 ( 4.2- 4.7) 10.8 ( 9.4- 12.4) 6.9 ( 4.9- 9.3)
East North Central 5.1 ( 4.8- 5.5) 4.6 ( 4.2- 4.9) 10.9 ( 9.3- 12.7) 7.4 ( 5.2- 10.3)
Illinois 6.6 ( 5.9- 7.4) 5.7 ( 5.1- 6.5) 13.3 ( 10.5- 16.6) 6.9 ( 4.2- 10.5)
Indiana 4.0 ( 3.2- 4.8) 3.7 ( 2.9- 4.5) ∼ ∼Michigan 4.8 ( 4.2- 5.5) 4.2 ( 3.6- 4.9) 9.5 ( 6.7- 13.0) ∼Ohio 4.6 ( 4.0- 5.2) 4.1 ( 3.5- 4.7) 10.2 ( 7.3- 13.8) ∼Wisconsin 4.8 ( 4.0- 5.7) 4.6 ( 3.8- 5.6) ∼ ∼
West North Central 4.5 ( 4.1- 5.0) 4.3 ( 3.8- 4.7) 10.0 ( 6.8- 14.1) ∼Iowa 4.0 ( 3.0- 5.2) 4.0 ( 3.0- 5.2) ∼ ∼Kansas 4.0 ( 3.0- 5.3) 4.1 ( 3.0- 5.4) ∼ ∼Minnesota 5.2 ( 4.3- 6.3) 5.2 ( 4.2- 6.2) ∼ ∼Missouri 4.9 ( 4.1- 5.9) 4.4 ( 3.6- 5.3) 11.3 ( 7.1- 17.0) ∼Nebraska 3.6 ( 2.4- 5.2) 3.2 ( 2.0- 4.7) ∼ ∼North Dakota 5.3 ( 3.0- 8.5) ∼ ∼ ∼South Dakota ∼ ∼ ∼ ∼
South 5.6 ( 5.4- 5.8) 4.7 ( 4.4- 4.9) 11.8 ( 10.9- 12.8) 8.3 ( 7.3- 9.4)
South Atlantic 5.5 ( 5.2- 5.8) 4.5 ( 4.2- 4.8) 11.7 ( 10.5- 13.0) 6.3 ( 5.0- 7.8)
Delaware 5.7 ( 3.5- 8.7) 5.6 ( 3.3- 9.0) ∼ ∼District of Columbia 9.5 ( 5.9- 14.6) ∼ ∼ ∼Florida 5.2 ( 4.8- 5.7) 4.8 ( 4.4- 5.3) 10.1 ( 7.7- 12.8) 6.6 ( 5.2- 8.3)
Georgia 5.7 ( 4.9- 6.7) 3.8 ( 3.0- 4.7) 12.4 ( 9.7- 15.6) ∼Maryland 5.2 ( 4.3- 6.2) 3.4 ( 2.6- 4.4) 11.0 ( 7.9- 14.7) ∼North Carolina 5.3 ( 4.5- 6.1) 4.3 ( 3.6- 5.1) 10.2 ( 7.6- 13.3) ∼South Carolina 6.9 ( 5.7- 8.2) 4.4 ( 3.3- 5.6) 16.3 ( 12.4- 21.1) ∼Virginia 5.6 ( 4.7- 6.5) 4.2 ( 3.4- 5.2) 12.5 ( 9.3- 16.4) ∼West Virginia 5.0 ( 3.6- 6.8) 5.1 ( 3.7- 6.9) ∼ ∼
East South Central 5.1 ( 4.6- 5.6) 4.1 ( 3.6- 4.7) 11.1 ( 9.1- 13.5) ∼Alabama 6.0 ( 4.9- 7.2) 4.4 ( 3.4- 5.6) 12.4 ( 8.9- 16.7) ∼Kentucky 4.7 ( 3.7- 5.8) 4.8 ( 3.7- 6.0) ∼ ∼Mississippi 6.1 ( 4.7- 7.7) 3.8 ( 2.6- 5.5) 12.7 ( 8.9- 17.4) ∼Tennessee 4.2 ( 3.4- 5.1) 3.5 ( 2.8- 4.4) 10.7 ( 6.9- 15.7) ∼
West South Central 6.1 ( 5.6- 6.5) 5.3 ( 4.9- 5.8) 12.7 ( 10.7- 14.9) 10.2 ( 8.6- 11.8)
Arkansas 4.0 ( 3.0- 5.3) 3.6 ( 2.5- 4.9) ∼ ∼

Cancer Incidence and M
ortality, by U.S. C
ensus Region and D
i�ision, State, and Metropolitan A
rea
���
Table 2.24.1.2M: Stomach. Age-Adjusted Cancer Death Rates∗ and 95% Confidence Intervals, by U.S. CensusRegion and Division, State, and Race and Ethnicity, United States† (continued)
Males, 2004
Area All Races White Black Hispanic‡§
Louisiana 8.3 ( 7.0- 9.7) 5.6 ( 4.4- 7.0) 17.4 ( 13.4- 22.1) ∼Oklahoma 4.0 ( 3.1- 5.1) 3.7 ( 2.8- 4.9) ∼ ∼Texas 6.3 ( 5.8- 6.9) 5.9 ( 5.3- 6.5) 10.9 ( 8.4- 13.9) 10.0 ( 8.5- 11.7)
West 5.5 ( 5.2- 5.8) 4.8 ( 4.5- 5.1) 10.2 ( 8.2- 12.4) 9.4 ( 8.3- 10.6)
Mountain 4.6 ( 4.1- 5.1) 4.2 ( 3.8- 4.7) 12.4 ( 7.5- 19.1) 8.9 ( 6.8- 11.3)
Arizona 4.4 ( 3.6- 5.3) 4.0 ( 3.2- 4.9) ∼ 8.8 ( 5.3- 13.4)
Colorado 4.5 ( 3.5- 5.7) 4.4 ( 3.3- 5.5) ∼ 10.3 ( 5.9- 16.4)
Idaho 4.6 ( 3.1- 6.7) 4.7 ( 3.2- 6.8) ∼ ∼Montana 4.3 ( 2.6- 6.7) 4.3 ( 2.6- 6.7) ∼ ∼Nevada 4.1 ( 2.8- 5.7) 3.1 ( 2.0- 4.7) ∼ ∼New Mexico 7.4 ( 5.6- 9.5) 6.8 ( 5.1- 9.0) ∼ 9.2 ( 5.8- 13.8)
Utah 3.7 ( 2.4- 5.4) 3.6 ( 2.3- 5.3) ∼ ∼Wyoming ∼ ∼ ∼ ∼
Pacific 5.9 ( 5.6- 6.3) 5.1 ( 4.8- 5.5) 9.6 ( 7.6- 12.0) 9.7 ( 8.4- 11.0)
Alaska ∼ ∼ ∼ ∼California 6.2 ( 5.8- 6.7) 5.5 ( 5.1- 6.0) 10.0 ( 7.8- 12.6) 9.7 ( 8.4- 11.1)
Hawaii 10.6 ( 8.1- 13.5) ∼ ∼ ∼Oregon 3.8 ( 2.9- 4.8) 3.5 ( 2.6- 4.5) ∼ ∼Washington 4.3 ( 3.6- 5.2) 4.1 ( 3.3- 5.0) ∼ ∼
∗ Rates are per 100,000 persons and are age-adjusted to the 2000 U.S. standard population (19 age groups - Census P25-1130).† Data are from the National Vital Statistics System (NVSS).‡ Data for specified racial or ethnic populations other than white and black should be interpreted with caution. See Technical Notes.
§ Hispanic origin is not mutually exclusive from race categories (white, black).
∼ Rates are suppressed if fewer than 16 cases were reported in a specific category (area, race, ethnicity).
Note: U.S. rates are as presented in Table 1.1.1.2M.

United
States Cancer Statistics: 2004 Incid
ence and M
ortality
���
continued
Table 2.24.1.2F: Stomach. Age-Adjusted Cancer Death Rates∗ and 95% Confidence Intervals, by U.S. CensusRegion and Division, State, and Race and Ethnicity, United States†
Females, 2004
Area All Races White Black Hispanic‡§
United States 2.8 ( 2.8- 2.9) 2.5 ( 2.4- 2.6) 5.2 ( 4.9- 5.6) 5.1 ( 4.7- 5.5)
Northeast 3.2 ( 3.0- 3.4) 2.9 ( 2.7- 3.1) 5.2 ( 4.5- 6.1) 5.3 ( 4.3- 6.5)
New England 2.8 ( 2.5- 3.2) 2.7 ( 2.3- 3.0) ∼ ∼Connecticut 2.6 ( 2.0- 3.3) 2.4 ( 1.8- 3.2) ∼ ∼Maine 2.8 ( 1.8- 4.2) 2.7 ( 1.7- 4.1) ∼ ∼Massachusetts 3.0 ( 2.5- 3.6) 2.8 ( 2.3- 3.4) ∼ ∼New Hampshire ∼ ∼ ∼ ∼Rhode Island 4.0 ( 2.7- 5.8) 3.7 ( 2.4- 5.4) ∼ ∼Vermont ∼ ∼ ∼ ∼
Middle Atlantic 3.4 ( 3.1- 3.6) 3.0 ( 2.8- 3.2) 5.3 ( 4.5- 6.2) 5.5 ( 4.4- 6.7)
New Jersey 3.3 ( 2.8- 3.8) 3.0 ( 2.5- 3.6) 5.2 ( 3.5- 7.4) 5.4 ( 3.3- 8.3)
New York 3.9 ( 3.6- 4.3) 3.5 ( 3.1- 3.9) 5.5 ( 4.4- 6.7) 5.6 ( 4.3- 7.1)
Pennsylvania 2.6 ( 2.3- 3.0) 2.3 ( 2.0- 2.7) 5.0 ( 3.4- 7.0) ∼Midwest 2.5 ( 2.4- 2.7) 2.2 ( 2.1- 2.4) 5.6 ( 4.7- 6.5) 5.0 ( 3.4- 6.9)
East North Central 2.7 ( 2.5- 2.9) 2.4 ( 2.2- 2.6) 5.6 ( 4.7- 6.6) 5.3 ( 3.6- 7.6)
Illinois 3.1 ( 2.7- 3.6) 2.7 ( 2.3- 3.2) 6.1 ( 4.5- 8.0) 5.6 ( 3.4- 8.6)
Indiana 2.5 ( 2.0- 3.1) 2.2 ( 1.7- 2.8) ∼ ∼Michigan 2.5 ( 2.1- 3.0) 2.3 ( 1.9- 2.8) 4.7 ( 3.1- 6.6) ∼Ohio 2.4 ( 2.1- 2.8) 2.1 ( 1.7- 2.4) 6.0 ( 4.3- 8.3) ∼Wisconsin 2.6 ( 2.1- 3.2) 2.6 ( 2.0- 3.2) ∼ ∼
West North Central 2.2 ( 2.0- 2.5) 2.0 ( 1.7- 2.3) 5.5 ( 3.6- 8.0) ∼Iowa 1.9 ( 1.3- 2.6) 1.7 ( 1.2- 2.4) ∼ ∼Kansas 1.8 ( 1.3- 2.6) 1.6 ( 1.1- 2.4) ∼ ∼Minnesota 2.6 ( 2.1- 3.3) 2.5 ( 2.0- 3.2) ∼ ∼Missouri 2.4 ( 1.9- 3.0) 2.0 ( 1.5- 2.6) 5.4 ( 3.1- 8.7) ∼Nebraska 1.6 ( 0.9- 2.6) 1.5 ( 0.9- 2.5) ∼ ∼North Dakota ∼ ∼ ∼ ∼South Dakota ∼ ∼ ∼ ∼
South 2.7 ( 2.6- 2.8) 2.3 ( 2.1- 2.4) 5.1 ( 4.6- 5.6) 4.3 ( 3.7- 4.9)
South Atlantic 2.6 ( 2.4- 2.8) 2.1 ( 1.9- 2.3) 5.0 ( 4.4- 5.6) 2.9 ( 2.2- 3.8)
Delaware ∼ ∼ ∼ ∼District of Columbia ∼ ∼ ∼ ∼Florida 2.5 ( 2.2- 2.8) 2.2 ( 1.9- 2.5) 5.6 ( 4.2- 7.2) 2.9 ( 2.1- 3.8)
Georgia 2.5 ( 2.0- 3.0) 1.9 ( 1.5- 2.5) 4.4 ( 3.1- 5.9) ∼Maryland 3.2 ( 2.6- 3.9) 2.5 ( 1.9- 3.3) 5.3 ( 3.7- 7.4) ∼North Carolina 2.6 ( 2.2- 3.1) 2.0 ( 1.6- 2.5) 4.9 ( 3.5- 6.6) ∼South Carolina 2.9 ( 2.2- 3.6) 1.9 ( 1.4- 2.7) 5.6 ( 3.8- 7.8) ∼Virginia 2.1 ( 1.7- 2.6) 1.5 ( 1.1- 2.0) 4.3 ( 2.9- 6.2) ∼West Virginia 3.2 ( 2.3- 4.4) 3.2 ( 2.3- 4.5) ∼ ∼
East South Central 2.7 ( 2.4- 3.0) 2.3 ( 2.0- 2.6) 4.7 ( 3.7- 5.8) ∼Alabama 2.6 ( 2.1- 3.3) 2.2 ( 1.6- 3.0) 3.8 ( 2.4- 5.8) ∼Kentucky 2.1 ( 1.6- 2.7) 2.0 ( 1.4- 2.6) ∼ ∼Mississippi 3.4 ( 2.6- 4.5) 2.9 ( 2.0- 4.1) 4.8 ( 3.0- 7.2) ∼Tennessee 2.7 ( 2.2- 3.3) 2.3 ( 1.7- 2.9) 5.8 ( 3.7- 8.6) ∼
West South Central 3.0 ( 2.7- 3.3) 2.6 ( 2.3- 2.9) 5.6 ( 4.6- 6.8) 5.5 ( 4.5- 6.5)
Arkansas 3.2 ( 2.4- 4.1) 2.5 ( 1.8- 3.5) 8.5 ( 4.8- 13.7) ∼

Cancer Incidence and M
ortality, by U.S. C
ensus Region and D
i�ision, State, and Metropolitan A
rea
���
Table 2.24.1.2F: Stomach. Age-Adjusted Cancer Death Rates∗ and 95% Confidence Intervals, by U.S. CensusRegion and Division, State, and Race and Ethnicity, United States† (continued)
Females, 2004
Area All Races White Black Hispanic‡§
Louisiana 3.2 ( 2.6- 4.0) 2.1 ( 1.5- 2.8) 6.6 ( 4.7- 8.9) ∼Oklahoma 2.3 ( 1.7- 3.1) 2.1 ( 1.5- 2.9) ∼ ∼Texas 3.0 ( 2.7- 3.4) 2.8 ( 2.4- 3.1) 4.8 ( 3.6- 6.4) 5.7 ( 4.7- 6.8)
West 3.0 ( 2.8- 3.2) 2.7 ( 2.5- 2.9) 5.2 ( 4.0- 6.5) 5.8 ( 5.1- 6.6)
Mountain 2.4 ( 2.1- 2.7) 2.2 ( 1.9- 2.6) ∼ 6.0 ( 4.6- 7.7)
Arizona 2.5 ( 2.0- 3.2) 2.3 ( 1.8- 2.9) ∼ 8.3 ( 5.4- 12.0)
Colorado 2.7 ( 2.1- 3.5) 2.5 ( 1.8- 3.2) ∼ ∼Idaho 2.4 ( 1.4- 3.8) 2.4 ( 1.4- 3.9) ∼ ∼Montana ∼ ∼ ∼ ∼Nevada 1.9 ( 1.2- 3.0) 1.8 ( 1.0- 2.8) ∼ ∼New Mexico 3.5 ( 2.5- 4.9) 3.4 ( 2.4- 4.9) ∼ 6.2 ( 3.8- 9.5)
Utah ∼ ∼ ∼ ∼Wyoming ∼ ∼ ∼ ∼
Pacific 3.3 ( 3.0- 3.5) 2.9 ( 2.7- 3.1) 5.4 ( 4.1- 6.9) 5.8 ( 4.9- 6.6)
Alaska ∼ ∼ ∼ ∼California 3.4 ( 3.2- 3.7) 3.1 ( 2.8- 3.4) 5.5 ( 4.2- 7.1) 5.7 ( 4.9- 6.6)
Hawaii 3.5 ( 2.3- 5.1) ∼ ∼ ∼Oregon 2.7 ( 2.1- 3.6) 2.4 ( 1.8- 3.2) ∼ ∼Washington 2.8 ( 2.3- 3.4) 2.4 ( 1.9- 3.1) ∼ ∼
∗ Rates are per 100,000 persons and are age-adjusted to the 2000 U.S. standard population (19 age groups - Census P25-1130).† Data are from the National Vital Statistics System (NVSS).‡ Data for specified racial or ethnic populations other than white and black should be interpreted with caution. See Technical Notes.
§ Hispanic origin is not mutually exclusive from race categories (white, black).
∼ Rates are suppressed if fewer than 16 cases were reported in a specific category (area, race, ethnicity).
Note: U.S. rates are as presented in Table 1.1.1.2F.
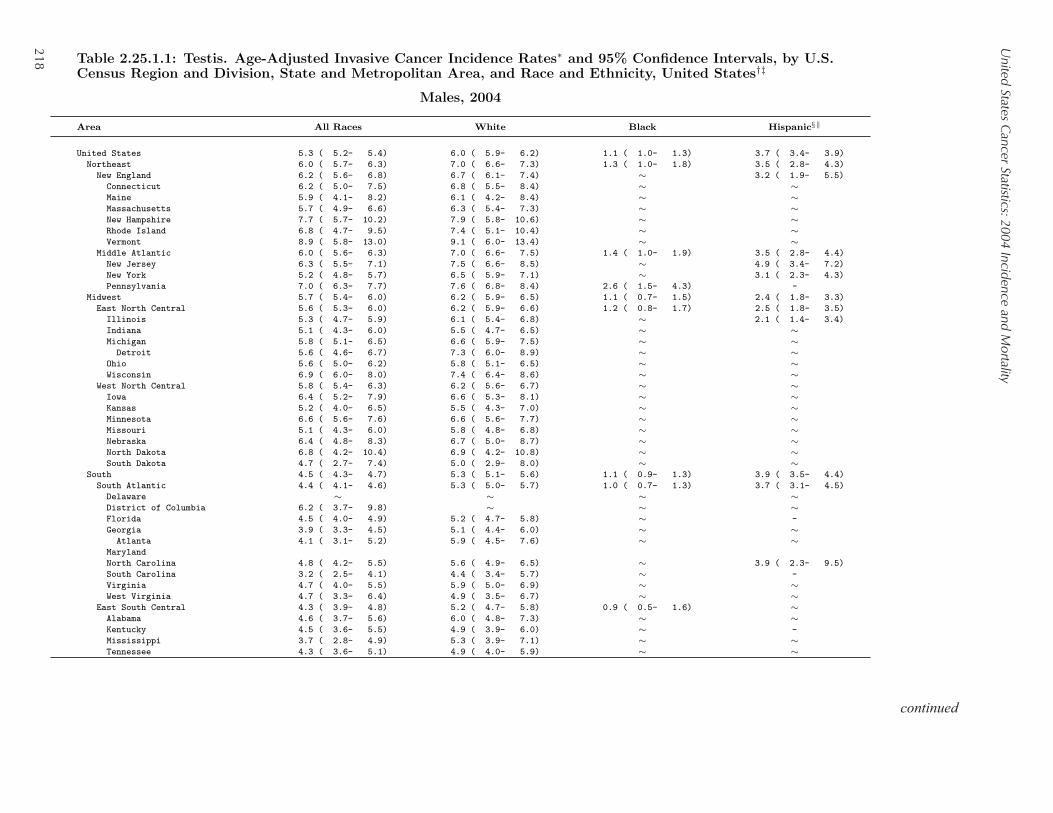
United
States Cancer Statistics: 2004 Incid
ence and M
ortality
���
continued
Table 2.25.1.1: Testis. Age-Adjusted Invasive Cancer Incidence Rates∗ and 95% Confidence Intervals, by U.S.Census Region and Division, State and Metropolitan Area, and Race and Ethnicity, United States†‡
Males, 2004
Area All Races White Black Hispanic§
United States 5.3 ( 5.2- 5.4) 6.0 ( 5.9- 6.2) 1.1 ( 1.0- 1.3) 3.7 ( 3.4- 3.9)
Northeast 6.0 ( 5.7- 6.3) 7.0 ( 6.6- 7.3) 1.3 ( 1.0- 1.8) 3.5 ( 2.8- 4.3)
New England 6.2 ( 5.6- 6.8) 6.7 ( 6.1- 7.4) ∼ 3.2 ( 1.9- 5.5)
Connecticut 6.2 ( 5.0- 7.5) 6.8 ( 5.5- 8.4) ∼ ∼Maine 5.9 ( 4.1- 8.2) 6.1 ( 4.2- 8.4) ∼ ∼Massachusetts 5.7 ( 4.9- 6.6) 6.3 ( 5.4- 7.3) ∼ ∼New Hampshire 7.7 ( 5.7- 10.2) 7.9 ( 5.8- 10.6) ∼ ∼Rhode Island 6.8 ( 4.7- 9.5) 7.4 ( 5.1- 10.4) ∼ ∼Vermont 8.9 ( 5.8- 13.0) 9.1 ( 6.0- 13.4) ∼ ∼
Middle Atlantic 6.0 ( 5.6- 6.3) 7.0 ( 6.6- 7.5) 1.4 ( 1.0- 1.9) 3.5 ( 2.8- 4.4)
New Jersey 6.3 ( 5.5- 7.1) 7.5 ( 6.6- 8.5) ∼ 4.9 ( 3.4- 7.2)
New York 5.2 ( 4.8- 5.7) 6.5 ( 5.9- 7.1) ∼ 3.1 ( 2.3- 4.3)
Pennsylvania 7.0 ( 6.3- 7.7) 7.6 ( 6.8- 8.4) 2.6 ( 1.5- 4.3) -
Midwest 5.7 ( 5.4- 6.0) 6.2 ( 5.9- 6.5) 1.1 ( 0.7- 1.5) 2.4 ( 1.8- 3.3)
East North Central 5.6 ( 5.3- 6.0) 6.2 ( 5.9- 6.6) 1.2 ( 0.8- 1.7) 2.5 ( 1.8- 3.5)
Illinois 5.3 ( 4.7- 5.9) 6.1 ( 5.4- 6.8) ∼ 2.1 ( 1.4- 3.4)
Indiana 5.1 ( 4.3- 6.0) 5.5 ( 4.7- 6.5) ∼ ∼Michigan 5.8 ( 5.1- 6.5) 6.6 ( 5.9- 7.5) ∼ ∼
Detroit 5.6 ( 4.6- 6.7) 7.3 ( 6.0- 8.9) ∼ ∼Ohio 5.6 ( 5.0- 6.2) 5.8 ( 5.1- 6.5) ∼ ∼Wisconsin 6.9 ( 6.0- 8.0) 7.4 ( 6.4- 8.6) ∼ ∼
West North Central 5.8 ( 5.4- 6.3) 6.2 ( 5.6- 6.7) ∼ ∼Iowa 6.4 ( 5.2- 7.9) 6.6 ( 5.3- 8.1) ∼ ∼Kansas 5.2 ( 4.0- 6.5) 5.5 ( 4.3- 7.0) ∼ ∼Minnesota 6.6 ( 5.6- 7.6) 6.6 ( 5.6- 7.7) ∼ ∼Missouri 5.1 ( 4.3- 6.0) 5.8 ( 4.8- 6.8) ∼ ∼Nebraska 6.4 ( 4.8- 8.3) 6.7 ( 5.0- 8.7) ∼ ∼North Dakota 6.8 ( 4.2- 10.4) 6.9 ( 4.2- 10.8) ∼ ∼South Dakota 4.7 ( 2.7- 7.4) 5.0 ( 2.9- 8.0) ∼ ∼
South 4.5 ( 4.3- 4.7) 5.3 ( 5.1- 5.6) 1.1 ( 0.9- 1.3) 3.9 ( 3.5- 4.4)
South Atlantic 4.4 ( 4.1- 4.6) 5.3 ( 5.0- 5.7) 1.0 ( 0.7- 1.3) 3.7 ( 3.1- 4.5)
Delaware ∼ ∼ ∼ ∼District of Columbia 6.2 ( 3.7- 9.8) ∼ ∼ ∼Florida 4.5 ( 4.0- 4.9) 5.2 ( 4.7- 5.8) ∼ -
Georgia 3.9 ( 3.3- 4.5) 5.1 ( 4.4- 6.0) ∼ ∼Atlanta 4.1 ( 3.1- 5.2) 5.9 ( 4.5- 7.6) ∼ ∼
Maryland
North Carolina 4.8 ( 4.2- 5.5) 5.6 ( 4.9- 6.5) ∼ 3.9 ( 2.3- 9.5)
South Carolina 3.2 ( 2.5- 4.1) 4.4 ( 3.4- 5.7) ∼ -
Virginia 4.7 ( 4.0- 5.5) 5.9 ( 5.0- 6.9) ∼ ∼West Virginia 4.7 ( 3.3- 6.4) 4.9 ( 3.5- 6.7) ∼ ∼
East South Central 4.3 ( 3.9- 4.8) 5.2 ( 4.7- 5.8) 0.9 ( 0.5- 1.6) ∼Alabama 4.6 ( 3.7- 5.6) 6.0 ( 4.8- 7.3) ∼ ∼Kentucky 4.5 ( 3.6- 5.5) 4.9 ( 3.9- 6.0) ∼ -
Mississippi 3.7 ( 2.8- 4.9) 5.3 ( 3.9- 7.1) ∼ ∼Tennessee 4.3 ( 3.6- 5.1) 4.9 ( 4.0- 5.9) ∼ ∼

Cancer Incidence and M
ortality, by U.S. C
ensus Region and D
i�ision, State, and Metropolitan A
rea
���
Table 2.25.1.1: Testis. Age-Adjusted Invasive Cancer Incidence Rates∗ and 95% Confidence Intervals, by U.S.Census Region and Division, State and Metropolitan Area, and Race and Ethnicity, United States†‡(continued)
Males, 2004
Area All Races White Black Hispanic§
West South Central 4.7 ( 4.4- 5.0) 5.4 ( 5.0- 5.8) 1.4 ( 0.9- 2.0) 4.1 ( 3.5- 4.8)
Arkansas 3.9 ( 2.9- 5.2) 4.5 ( 3.4- 6.0) ∼ ∼Louisiana 4.9 ( 4.0- 5.9) 6.8 ( 5.5- 8.3) ∼ ∼Oklahoma 4.8 ( 3.8- 6.0) 5.2 ( 4.0- 6.5) ∼ ∼Texas 4.7 ( 4.3- 5.1) 5.3 ( 4.8- 5.8) 1.4 ( 0.8- 2.3) 4.1 ( 3.5- 4.9)
West 5.5 ( 5.2- 5.7) 6.2 ( 5.9- 6.5) 1.2 ( 0.8- 1.9) 3.8 ( 3.4- 4.2)
Mountain 5.7 ( 5.3- 6.2) 6.0 ( 5.5- 6.6) ∼ 3.5 ( 2.7- 4.4)
Arizona 4.8 ( 4.0- 5.7) 5.1 ( 4.3- 6.1) ∼ 3.2 ( 2.1- 5.0)
Colorado 5.9 ( 5.0- 7.0) 6.0 ( 5.1- 7.2) ∼ 4.5 ( 2.8- 7.1)
Idaho 7.9 ( 6.0- 10.3) 8.1 ( 6.1- 10.6) ∼ ∼Montana 5.0 ( 3.1- 7.7) 5.5 ( 3.4- 8.4) ∼ ∼Nevada 4.6 ( 3.5- 6.0) 4.9 ( 3.6- 6.5) ∼ ∼New Mexico 5.2 ( 3.8- 6.9) 5.7 ( 4.2- 7.7) ∼ 4.1 ( 2.4- 6.6)
Utah 8.0 ( 6.4- 9.8) 8.3 ( 6.7- 10.2) ∼ ∼Wyoming ∼ ∼ ∼ ∼
Pacific 5.4 ( 5.1- 5.7) 6.3 ( 5.9- 6.6) 1.1 ( 0.7- 1.8) 3.9 ( 3.4- 4.3)
Alaska 4.8 ( 2.7- 8.0) ∼ ∼ ∼California 5.2 ( 4.9- 5.5) 6.1 ( 5.7- 6.5) 1.2 ( 0.7- 2.1) 4.1 ( 3.6- 4.6)
San Francisco-Oakland 5.2 ( 4.2- 6.2) 6.9 ( 5.6- 8.4) ∼ 3.8 ( 2.3- 6.3)
San Jose-Monterey 5.1 ( 3.9- 6.4) 6.5 ( 5.0- 8.4) ∼ 4.5 ( 2.6- 7.6)
Los Angeles 4.5 ( 4.0- 5.1) 5.3 ( 4.6- 6.1) ∼ 3.4 ( 2.8- 4.3)
Hawaii 4.3 ( 2.8- 6.3) ∼ ∼ ∼Oregon 6.5 ( 5.4- 7.8) 6.9 ( 5.7- 8.3) ∼ ∼Washington 6.2 ( 5.4- 7.1) 6.7 ( 5.8- 7.7) ∼ ∼
Seattle-Puget Sound 6.5 ( 5.5- 7.7) 7.6 ( 6.4- 9.0) ∼ ∼∗ Rates are per 100,000 persons and are age-adjusted to the 2000 U.S. standard population (19 age groups - Census P25-1130).† Data are from all state and metropolitan area cancer registries, except Maryland. Included data cover approximately 98% of the population and met data
quality criteria for all invasive cancer sites combined. See Appendix B for registry-specific data quality information.‡ Invasive cancers only.
§ Data for specified racial or ethnic populations other than white and black should be interpreted with caution. See Technical Notes.
Hispanic origin is not mutually exclusive from race categories (white, black).
∼ Rates are suppressed if fewer than 16 cases were reported in a specific category (area, race, ethnicity).
- Rates are suppressed at the state’s or metropolitan area’s request. See Technical Notes.
Notes: Cases from suppressed rates are included in the U.S. and region/division rates. U.S. rates are as presented in Table 1.1.1.1M. Michigan, Georgia,
California, and Washington state rates each include cases from the SEER metropolitan areas.

United
States Cancer Statistics: 2004 Incid
ence and M
ortality
��0
continued
Table 2.25.1.2: Testis. Age-Adjusted Cancer Death Rates∗ and 95% Confidence Intervals, by U.S. CensusRegion and Division, State, and Race and Ethnicity, United States†
Males, 2004
Area All Races White Black Hispanic‡§
United States 0.2 ( 0.2- 0.3) 0.3 ( 0.2- 0.3) 0.1 ( 0.1- 0.2) 0.2 ( 0.1- 0.3)
Northeast 0.3 ( 0.2- 0.3) 0.3 ( 0.2- 0.4) ∼ ∼New England 0.4 ( 0.2- 0.5) 0.4 ( 0.2- 0.6) ∼ ∼Connecticut ∼ ∼ ∼ ∼Maine ∼ ∼ ∼ ∼Massachusetts ∼ ∼ ∼ ∼New Hampshire ∼ ∼ ∼ ∼Rhode Island ∼ ∼ ∼ ∼Vermont ∼ ∼ ∼ ∼
Middle Atlantic 0.2 ( 0.2- 0.3) 0.3 ( 0.2- 0.4) ∼ ∼New Jersey ∼ ∼ ∼ ∼New York 0.2 ( 0.1- 0.3) 0.3 ( 0.1- 0.4) ∼ ∼Pennsylvania 0.3 ( 0.2- 0.5) 0.4 ( 0.2- 0.6) ∼ ∼
Midwest 0.2 ( 0.2- 0.3) 0.2 ( 0.2- 0.3) ∼ ∼East North Central 0.2 ( 0.2- 0.3) 0.3 ( 0.2- 0.4) ∼ ∼Illinois 0.3 ( 0.2- 0.5) 0.3 ( 0.2- 0.5) ∼ ∼Indiana ∼ ∼ ∼ ∼Michigan ∼ ∼ ∼ ∼Ohio ∼ ∼ ∼ ∼Wisconsin ∼ ∼ ∼ ∼
West North Central 0.2 ( 0.1- 0.3) ∼ ∼ ∼Iowa ∼ ∼ ∼ ∼Kansas ∼ ∼ ∼ ∼Minnesota ∼ ∼ ∼ ∼Missouri ∼ ∼ ∼ ∼Nebraska ∼ ∼ ∼ ∼North Dakota ∼ ∼ ∼ ∼South Dakota ∼ ∼ ∼ ∼
South 0.2 ( 0.2- 0.3) 0.3 ( 0.2- 0.3) 0.2 ( 0.1- 0.3) 0.3 ( 0.1- 0.5)
South Atlantic 0.2 ( 0.2- 0.3) 0.2 ( 0.2- 0.3) ∼ ∼Delaware ∼ ∼ ∼ ∼District of Columbia ∼ ∼ ∼ ∼Florida 0.2 ( 0.1- 0.3) ∼ ∼ ∼Georgia ∼ ∼ ∼ ∼Maryland ∼ ∼ ∼ ∼North Carolina ∼ ∼ ∼ ∼South Carolina ∼ ∼ ∼ ∼Virginia ∼ ∼ ∼ ∼West Virginia ∼ ∼ ∼ ∼
East South Central 0.2 ( 0.1- 0.3) ∼ ∼ ∼Alabama ∼ ∼ ∼ ∼Kentucky ∼ ∼ ∼ ∼Mississippi ∼ ∼ ∼ ∼Tennessee ∼ ∼ ∼ ∼
West South Central 0.3 ( 0.2- 0.4) 0.3 ( 0.2- 0.5) ∼ ∼Arkansas ∼ ∼ ∼ ∼

Cancer Incidence and M
ortality, by U.S. C
ensus Region and D
i�ision, State, and Metropolitan A
rea
���
Table 2.25.1.2: Testis. Age-Adjusted Cancer Death Rates∗ and 95% Confidence Intervals, by U.S. CensusRegion and Division, State, and Race and Ethnicity, United States† (continued)
Males, 2004
Area All Races White Black Hispanic‡§
Louisiana ∼ ∼ ∼ ∼Oklahoma ∼ ∼ ∼ ∼Texas 0.3 ( 0.2- 0.5) 0.3 ( 0.2- 0.5) ∼ ∼
West 0.3 ( 0.2- 0.3) 0.3 ( 0.2- 0.4) ∼ 0.2 ( 0.1- 0.4)
Mountain 0.2 ( 0.1- 0.4) 0.3 ( 0.2- 0.4) ∼ ∼Arizona ∼ ∼ ∼ ∼Colorado ∼ ∼ ∼ ∼Idaho ∼ ∼ ∼ ∼Montana ∼ ∼ ∼ ∼Nevada ∼ ∼ ∼ ∼New Mexico ∼ ∼ ∼ ∼Utah ∼ ∼ ∼ ∼Wyoming ∼ ∼ ∼ ∼
Pacific 0.3 ( 0.2- 0.4) 0.3 ( 0.3- 0.4) ∼ 0.3 ( 0.2- 0.5)
Alaska ∼ ∼ ∼ ∼California 0.3 ( 0.2- 0.4) 0.3 ( 0.2- 0.5) ∼ 0.3 ( 0.2- 0.5)
Hawaii ∼ ∼ ∼ ∼Oregon ∼ ∼ ∼ ∼Washington ∼ ∼ ∼ ∼
∗ Rates are per 100,000 persons and are age-adjusted to the 2000 U.S. standard population (19 age groups - Census P25-1130).† Data are from the National Vital Statistics System (NVSS).‡ Data for specified racial or ethnic populations other than white and black should be interpreted with caution. See Technical Notes.
§ Hispanic origin is not mutually exclusive from race categories (white, black).
∼ Rates are suppressed if fewer than 16 cases were reported in a specific category (area, race, ethnicity).
Note: U.S. rates are as presented in Table 1.1.1.2M.

United
States Cancer Statistics: 2004 Incid
ence and M
ortality
���
continued
Table 2.26.1.1M: Thyroid. Age-Adjusted Invasive Cancer Incidence Rates∗ and 95% Confidence Intervals, byU.S. Census Region and Division, State and Metropolitan Area, and Race and Ethnicity, United States†‡
Males, 2004
Area All Races White Black Hispanic§
United States 4.6 ( 4.5- 4.7) 4.8 ( 4.7- 5.0) 2.4 ( 2.1- 2.7) 3.5 ( 3.2- 3.9)
Northeast 5.8 ( 5.5- 6.1) 6.1 ( 5.7- 6.4) 2.9 ( 2.3- 3.7) 4.2 ( 3.3- 5.3)
New England 5.9 ( 5.4- 6.5) 6.0 ( 5.4- 6.6) ∼ 4.5 ( 2.3- 7.9)
Connecticut 6.5 ( 5.4- 7.8) 6.6 ( 5.4- 8.0) ∼ ∼Maine 4.9 ( 3.4- 6.9) 4.9 ( 3.3- 7.0) ∼ ∼Massachusetts 6.1 ( 5.3- 7.0) 6.1 ( 5.3- 7.1) ∼ ∼New Hampshire 5.7 ( 4.0- 8.0) 5.9 ( 4.1- 8.2) ∼ ∼Rhode Island 6.5 ( 4.5- 9.1) 7.0 ( 4.8- 9.8) ∼ ∼Vermont ∼ ∼ ∼ ∼
Middle Atlantic 5.8 ( 5.5- 6.1) 6.1 ( 5.7- 6.5) 2.8 ( 2.1- 3.6) 4.2 ( 3.1- 5.4)
New Jersey 6.3 ( 5.6- 7.2) 6.8 ( 5.9- 7.7) ∼ 5.1 ( 3.0- 8.1)
New York 5.4 ( 5.0- 5.9) 5.7 ( 5.2- 6.3) 2.5 ( 1.7- 3.7) 3.8 ( 2.6- 5.3)
Pennsylvania 6.0 ( 5.4- 6.6) 6.1 ( 5.5- 6.8) 3.5 ( 2.0- 5.5) -
Midwest 4.4 ( 4.2- 4.6) 4.5 ( 4.3- 4.8) 2.2 ( 1.7- 2.9) 2.3 ( 1.5- 3.4)
East North Central 4.2 ( 4.0- 4.5) 4.4 ( 4.1- 4.7) 2.0 ( 1.4- 2.7) 2.0 ( 1.2- 3.2)
Illinois 5.0 ( 4.4- 5.6) 5.4 ( 4.8- 6.1) ∼ 2.2 ( 1.2- 3.9)
Indiana 4.3 ( 3.6- 5.2) 4.5 ( 3.7- 5.3) ∼ ∼Michigan 4.0 ( 3.5- 4.6) 4.2 ( 3.6- 4.9) ∼ ∼
Detroit 5.2 ( 4.2- 6.3) 5.7 ( 4.5- 7.1) ∼ ∼Ohio 3.7 ( 3.2- 4.2) 3.7 ( 3.2- 4.3) ∼ ∼Wisconsin 4.2 ( 3.5- 5.1) 4.4 ( 3.6- 5.3) ∼ ∼
West North Central 4.7 ( 4.3- 5.2) 4.7 ( 4.3- 5.2) 3.5 ( 1.9- 5.8) ∼Iowa 5.2 ( 4.1- 6.5) 5.1 ( 4.0- 6.4) ∼ ∼Kansas 5.8 ( 4.6- 7.2) 5.7 ( 4.5- 7.2) ∼ ∼Minnesota 4.7 ( 3.9- 5.6) 4.4 ( 3.6- 5.3) ∼ ∼Missouri 4.7 ( 4.0- 5.6) 5.0 ( 4.1- 5.9) ∼ ∼Nebraska 3.7 ( 2.6- 5.3) 4.0 ( 2.7- 5.6) ∼ ∼North Dakota ∼ ∼ ∼ ∼South Dakota ∼ ∼ ∼ ∼
South 4.2 ( 4.0- 4.4) 4.5 ( 4.3- 4.7) 2.2 ( 1.9- 2.6) 3.5 ( 3.0- 4.2)
South Atlantic 4.2 ( 3.9- 4.4) 4.5 ( 4.2- 4.8) 2.4 ( 1.9- 3.0) 4.2 ( 3.3- 5.2)
Delaware 4.9 ( 3.0- 7.6) ∼ ∼ ∼District of Columbia ∼ ∼ ∼ ∼Florida 4.4 ( 4.0- 4.9) 4.7 ( 4.2- 5.2) 1.8 ( 1.0- 2.9) -
Georgia 4.3 ( 3.6- 5.0) 4.8 ( 4.1- 5.7) 3.1 ( 2.1- 4.6) ∼Atlanta 4.7 ( 3.5- 6.1) 5.7 ( 4.2- 7.6) ∼ ∼
Maryland
North Carolina 3.7 ( 3.1- 4.3) 4.0 ( 3.4- 4.8) ∼ ∼South Carolina 2.8 ( 2.1- 3.6) 3.4 ( 2.5- 4.5) ∼ -
Virginia 4.4 ( 3.7- 5.1) 4.9 ( 4.1- 5.8) ∼ ∼West Virginia 4.0 ( 2.8- 5.5) 4.1 ( 2.8- 5.6) ∼ ∼
East South Central 4.1 ( 3.7- 4.6) 4.5 ( 4.0- 5.1) 2.2 ( 1.4- 3.2) ∼Alabama 3.7 ( 2.9- 4.6) 4.0 ( 3.1- 5.1) ∼ ∼Kentucky 4.1 ( 3.2- 5.1) 4.2 ( 3.3- 5.3) ∼ -
Mississippi 3.3 ( 2.4- 4.4) 3.9 ( 2.7- 5.4) ∼ ∼Tennessee 4.8 ( 4.0- 5.7) 5.3 ( 4.5- 6.3) ∼ ∼

Cancer Incidence and M
ortality, by U.S. C
ensus Region and D
i�ision, State, and Metropolitan A
rea
��3
Table 2.26.1.1M: Thyroid. Age-Adjusted Invasive Cancer Incidence Rates∗ and 95% Confidence Intervals, byU.S. Census Region and Division, State and Metropolitan Area, and Race and Ethnicity, United States†‡(continued)
Males, 2004
Area All Races White Black Hispanic§
West South Central 4.3 ( 3.9- 4.6) 4.5 ( 4.2- 4.9) 1.9 ( 1.3- 2.7) 3.2 ( 2.5- 4.1)
Arkansas 3.0 ( 2.1- 4.1) 3.3 ( 2.4- 4.6) ∼ ∼Louisiana 4.3 ( 3.4- 5.3) 4.9 ( 3.8- 6.2) ∼ ∼Oklahoma 2.4 ( 1.7- 3.2) 2.4 ( 1.7- 3.3) ∼ ∼Texas 4.8 ( 4.3- 5.2) 5.0 ( 4.5- 5.5) 2.0 ( 1.1- 3.1) 3.3 ( 2.6- 4.2)
West 4.5 ( 4.3- 4.7) 4.7 ( 4.4- 4.9) 2.3 ( 1.5- 3.4) 3.5 ( 2.9- 4.1)
Mountain 5.3 ( 4.8- 5.7) 5.4 ( 4.9- 5.9) ∼ 4.6 ( 3.4- 6.0)
Arizona 5.3 ( 4.5- 6.2) 5.4 ( 4.5- 6.4) ∼ 4.4 ( 2.6- 6.9)
Colorado 5.2 ( 4.2- 6.3) 5.4 ( 4.4- 6.6) ∼ 7.0 ( 3.8- 11.7)
Idaho 4.7 ( 3.2- 6.7) 4.7 ( 3.1- 6.7) ∼ ∼Montana 4.5 ( 2.8- 6.8) 4.7 ( 3.0- 7.2) ∼ ∼Nevada 4.8 ( 3.7- 6.3) 5.5 ( 4.1- 7.1) ∼ ∼New Mexico 6.3 ( 4.7- 8.1) 6.8 ( 5.1- 8.8) ∼ ∼Utah 6.0 ( 4.5- 7.7) 5.8 ( 4.3- 7.6) ∼ ∼Wyoming ∼ ∼ ∼ ∼
Pacific 4.2 ( 3.9- 4.5) 4.3 ( 4.0- 4.6) 2.2 ( 1.4- 3.4) 3.1 ( 2.5- 3.8)
Alaska 4.7 ( 2.7- 8.0) ∼ ∼ ∼California 4.1 ( 3.7- 4.4) 4.3 ( 3.9- 4.7) 2.0 ( 1.1- 3.2) 3.1 ( 2.4- 3.8)
San Francisco-Oakland 3.0 ( 2.3- 3.9) 3.1 ( 2.3- 4.2) ∼ ∼San Jose-Monterey 3.8 ( 2.7- 5.1) 3.9 ( 2.6- 5.5) ∼ ∼Los Angeles 4.1 ( 3.5- 4.7) 4.3 ( 3.6- 5.1) ∼ 3.4 ( 2.4- 4.7)
Hawaii 5.6 ( 3.9- 7.7) ∼ ∼ ∼Oregon 4.1 ( 3.2- 5.2) 3.9 ( 3.1- 5.0) ∼ ∼Washington 4.6 ( 3.9- 5.4) 4.7 ( 3.9- 5.6) ∼ ∼
Seattle-Puget Sound 5.1 ( 4.1- 6.2) 5.2 ( 4.2- 6.3) ∼ ∼∗ Rates are per 100,000 persons and are age-adjusted to the 2000 U.S. standard population (19 age groups - Census P25-1130).† Data are from all state and metropolitan area cancer registries, except Maryland. Included data cover approximately 98% of the population and met data
quality criteria for all invasive cancer sites combined. See Appendix B for registry-specific data quality information.‡ Invasive cancers only.
§ Data for specified racial or ethnic populations other than white and black should be interpreted with caution. See Technical Notes.
Hispanic origin is not mutually exclusive from race categories (white, black).
∼ Rates are suppressed if fewer than 16 cases were reported in a specific category (area, race, ethnicity).
- Rates are suppressed at the state’s or metropolitan area’s request. See Technical Notes.
Notes: Cases from suppressed rates are included in the U.S. and region/division rates. U.S. rates are as presented in Table 1.1.1.1M. Michigan, Georgia,
California, and Washington state rates each include cases from the SEER metropolitan areas.

United
States Cancer Statistics: 2004 Incid
ence and M
ortality
���
continued
Table 2.26.1.1F: Thyroid. Age-Adjusted Invasive Cancer Incidence Rates∗ and 95% Confidence Intervals, byU.S. Census Region and Division, State and Metropolitan Area, and Race and Ethnicity, United States†‡
Females, 2004
Area All Races White Black Hispanic§
United States 13.8 ( 13.6- 14.0) 14.4 ( 14.2- 14.6) 8.1 ( 7.7- 8.6) 13.8 ( 13.2- 14.4)
Northeast 17.6 ( 17.2- 18.1) 18.5 ( 18.0- 19.1) 9.8 ( 8.8- 10.9) 16.0 ( 14.5- 17.7)
New England 17.5 ( 16.6- 18.5) 17.7 ( 16.7- 18.7) 12.9 ( 9.6- 16.9) 18.6 ( 14.1- 24.0)
Connecticut 18.0 ( 16.1- 20.1) 18.8 ( 16.7- 21.1) 11.2 ( 6.8- 17.5) 19.4 ( 12.3- 29.0)
Maine 13.4 ( 10.8- 16.4) 13.7 ( 11.0- 16.8) ∼ ∼Massachusetts 18.6 ( 17.2- 20.1) 18.5 ( 17.0- 20.1) 13.3 ( 8.7- 19.4) 19.4 ( 12.7- 28.3)
New Hampshire 17.0 ( 14.0- 20.4) 17.3 ( 14.2- 20.8) ∼ ∼Rhode Island 16.5 ( 13.2- 20.2) 16.7 ( 13.3- 20.7) ∼ ∼Vermont 16.8 ( 12.7- 21.9) 16.9 ( 12.7- 22.0) ∼ ∼
Middle Atlantic 17.7 ( 17.1- 18.3) 18.9 ( 18.2- 19.5) 9.4 ( 8.4- 10.6) 15.7 ( 14.1- 17.5)
New Jersey 18.8 ( 17.6- 20.1) 20.6 ( 19.2- 22.2) 9.0 ( 6.9- 11.7) 20.2 ( 16.5- 24.5)
New York 15.6 ( 14.8- 16.4) 16.7 ( 15.8- 17.7) 7.9 ( 6.6- 9.3) 14.0 ( 12.1- 16.0)
Pennsylvania 20.3 ( 19.2- 21.4) 20.8 ( 19.6- 22.0) 14.1 ( 11.4- 17.3) -
Midwest 13.2 ( 12.8- 13.6) 13.7 ( 13.3- 14.1) 7.1 ( 6.2- 8.1) 13.2 ( 11.1- 15.6)
East North Central 12.6 ( 12.2- 13.1) 13.2 ( 12.7- 13.7) 6.8 ( 5.9- 7.9) 13.6 ( 11.3- 16.3)
Illinois 14.2 ( 13.3- 15.1) 15.5 ( 14.4- 16.6) 6.4 ( 4.9- 8.2) 15.0 ( 11.9- 18.8)
Indiana 11.6 ( 10.5- 12.9) 12.2 ( 10.9- 13.5) ∼ ∼Michigan 12.1 ( 11.2- 13.1) 12.7 ( 11.6- 13.8) 8.5 ( 6.5- 10.9) 9.0 ( 5.0- 15.4)
Detroit 12.8 ( 11.3- 14.4) 14.6 ( 12.7- 16.7) 8.8 ( 6.4- 11.7) ∼Ohio 11.7 ( 10.8- 12.6) 11.8 ( 10.9- 12.8) 6.0 ( 4.3- 8.1) ∼Wisconsin 13.3 ( 12.0- 14.7) 13.6 ( 12.2- 15.1) ∼ ∼
West North Central 14.6 ( 13.8- 15.3) 14.7 ( 14.0- 15.5) 8.6 ( 6.3- 11.5) 11.4 ( 6.7- 17.7)
Iowa 14.6 ( 12.7- 16.7) 14.6 ( 12.7- 16.7) ∼ ∼Kansas 17.7 ( 15.5- 20.1) 18.1 ( 15.8- 20.6) ∼ ∼Minnesota 13.8 ( 12.4- 15.3) 13.2 ( 11.8- 14.7) ∼ ∼Missouri 13.9 ( 12.6- 15.3) 14.8 ( 13.3- 16.4) 8.7 ( 5.8- 12.6) ∼Nebraska 15.5 ( 13.0- 18.3) 15.8 ( 13.2- 18.8) ∼ ∼North Dakota 16.1 ( 11.8- 21.3) 15.4 ( 11.2- 20.8) ∼ ∼South Dakota 10.4 ( 7.4- 14.2) 10.7 ( 7.5- 14.7) ∼ ∼
South 11.8 ( 11.6- 12.1) 12.6 ( 12.3- 13.0) 7.9 ( 7.3- 8.5) 13.6 ( 12.6- 14.6)
South Atlantic 11.8 ( 11.4- 12.2) 12.7 ( 12.2- 13.2) 7.7 ( 7.0- 8.5) 15.2 ( 13.5- 16.9)
Delaware 16.5 ( 12.9- 20.8) 18.3 ( 14.0- 23.5) ∼ ∼District of Columbia 11.2 ( 7.7- 15.8) 17.0 ( 9.4- 28.5) 8.7 ( 4.9- 14.2) ∼Florida 13.0 ( 12.2- 13.7) 14.1 ( 13.2- 15.0) 6.6 ( 5.2- 8.2) -
Georgia 11.5 ( 10.6- 12.6) 13.1 ( 11.9- 14.5) 7.5 ( 6.1- 9.2) 12.5 ( 7.3- 20.3)
Atlanta 12.3 ( 10.6- 14.2) 15.2 ( 12.8- 18.0) 7.7 ( 5.5- 10.4) ∼Maryland
North Carolina 11.6 ( 10.6- 12.6) 12.2 ( 11.0- 13.4) 8.8 ( 7.0- 11.0) 13.8 ( 7.5- 23.5)
South Carolina 10.3 ( 9.0- 11.7) 10.5 ( 9.0- 12.3) 9.5 ( 7.2- 12.2) -
Virginia 10.1 ( 9.2- 11.2) 10.3 ( 9.1- 11.5) 6.2 ( 4.6- 8.3) 10.1 ( 5.4- 17.5)
West Virginia 11.8 ( 9.8- 14.2) 11.5 ( 9.5- 13.9) ∼ ∼East South Central 12.2 ( 11.5- 12.9) 12.9 ( 12.1- 13.7) 9.5 ( 8.1- 11.0) ∼Alabama 10.1 ( 8.9- 11.5) 11.1 ( 9.6- 12.8) 8.3 ( 6.1- 10.9) ∼Kentucky 14.5 ( 12.9- 16.2) 14.2 ( 12.6- 16.0) 17.2 ( 11.2- 25.2) -
Mississippi 11.7 ( 10.0- 13.6) 12.9 ( 10.7- 15.4) 9.3 ( 6.8- 12.3) ∼Tennessee 12.4 ( 11.2- 13.7) 13.0 ( 11.7- 14.5) 8.7 ( 6.3- 11.8) ∼
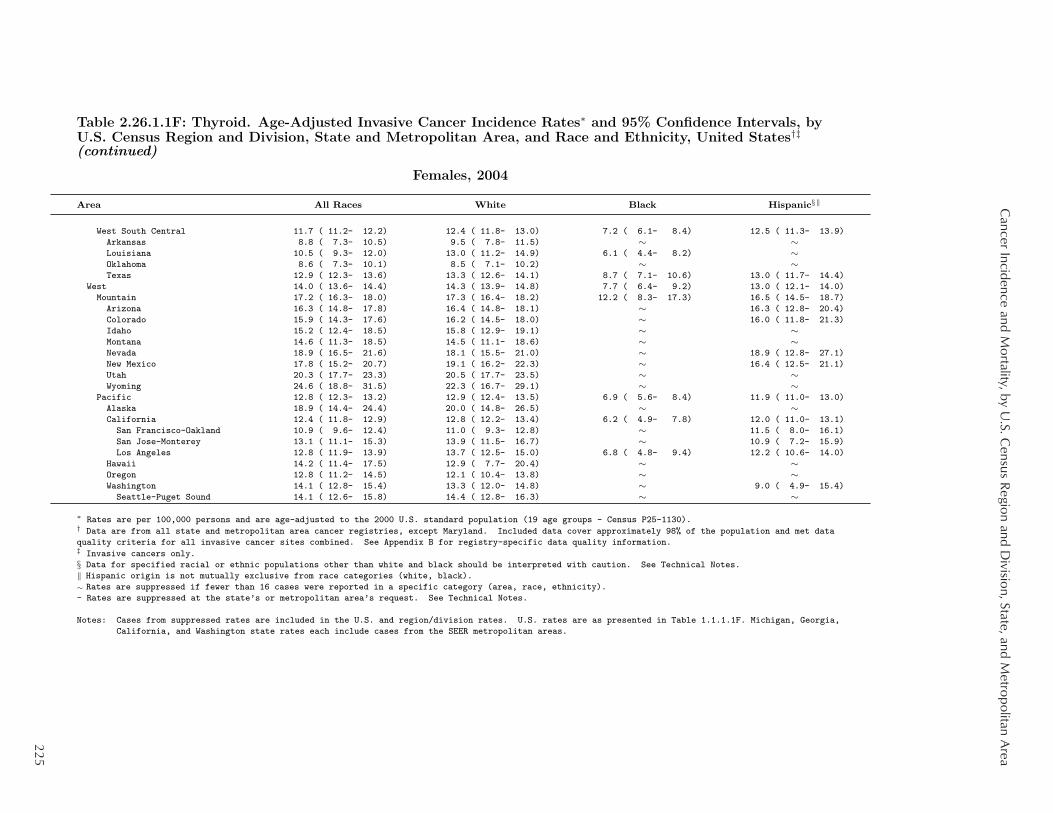
Cancer Incidence and M
ortality, by U.S. C
ensus Region and D
i�ision, State, and Metropolitan A
rea
���
Table 2.26.1.1F: Thyroid. Age-Adjusted Invasive Cancer Incidence Rates∗ and 95% Confidence Intervals, byU.S. Census Region and Division, State and Metropolitan Area, and Race and Ethnicity, United States†‡(continued)
Females, 2004
Area All Races White Black Hispanic§
West South Central 11.7 ( 11.2- 12.2) 12.4 ( 11.8- 13.0) 7.2 ( 6.1- 8.4) 12.5 ( 11.3- 13.9)
Arkansas 8.8 ( 7.3- 10.5) 9.5 ( 7.8- 11.5) ∼ ∼Louisiana 10.5 ( 9.3- 12.0) 13.0 ( 11.2- 14.9) 6.1 ( 4.4- 8.2) ∼Oklahoma 8.6 ( 7.3- 10.1) 8.5 ( 7.1- 10.2) ∼ ∼Texas 12.9 ( 12.3- 13.6) 13.3 ( 12.6- 14.1) 8.7 ( 7.1- 10.6) 13.0 ( 11.7- 14.4)
West 14.0 ( 13.6- 14.4) 14.3 ( 13.9- 14.8) 7.7 ( 6.4- 9.2) 13.0 ( 12.1- 14.0)
Mountain 17.2 ( 16.3- 18.0) 17.3 ( 16.4- 18.2) 12.2 ( 8.3- 17.3) 16.5 ( 14.5- 18.7)
Arizona 16.3 ( 14.8- 17.8) 16.4 ( 14.8- 18.1) ∼ 16.3 ( 12.8- 20.4)
Colorado 15.9 ( 14.3- 17.6) 16.2 ( 14.5- 18.0) ∼ 16.0 ( 11.8- 21.3)
Idaho 15.2 ( 12.4- 18.5) 15.8 ( 12.9- 19.1) ∼ ∼Montana 14.6 ( 11.3- 18.5) 14.5 ( 11.1- 18.6) ∼ ∼Nevada 18.9 ( 16.5- 21.6) 18.1 ( 15.5- 21.0) ∼ 18.9 ( 12.8- 27.1)
New Mexico 17.8 ( 15.2- 20.7) 19.1 ( 16.2- 22.3) ∼ 16.4 ( 12.5- 21.1)
Utah 20.3 ( 17.7- 23.3) 20.5 ( 17.7- 23.5) ∼ ∼Wyoming 24.6 ( 18.8- 31.5) 22.3 ( 16.7- 29.1) ∼ ∼
Pacific 12.8 ( 12.3- 13.2) 12.9 ( 12.4- 13.5) 6.9 ( 5.6- 8.4) 11.9 ( 11.0- 13.0)
Alaska 18.9 ( 14.4- 24.4) 20.0 ( 14.8- 26.5) ∼ ∼California 12.4 ( 11.8- 12.9) 12.8 ( 12.2- 13.4) 6.2 ( 4.9- 7.8) 12.0 ( 11.0- 13.1)
San Francisco-Oakland 10.9 ( 9.6- 12.4) 11.0 ( 9.3- 12.8) ∼ 11.5 ( 8.0- 16.1)
San Jose-Monterey 13.1 ( 11.1- 15.3) 13.9 ( 11.5- 16.7) ∼ 10.9 ( 7.2- 15.9)
Los Angeles 12.8 ( 11.9- 13.9) 13.7 ( 12.5- 15.0) 6.8 ( 4.8- 9.4) 12.2 ( 10.6- 14.0)
Hawaii 14.2 ( 11.4- 17.5) 12.9 ( 7.7- 20.4) ∼ ∼Oregon 12.8 ( 11.2- 14.5) 12.1 ( 10.4- 13.8) ∼ ∼Washington 14.1 ( 12.8- 15.4) 13.3 ( 12.0- 14.8) ∼ 9.0 ( 4.9- 15.4)
Seattle-Puget Sound 14.1 ( 12.6- 15.8) 14.4 ( 12.8- 16.3) ∼ ∼∗ Rates are per 100,000 persons and are age-adjusted to the 2000 U.S. standard population (19 age groups - Census P25-1130).† Data are from all state and metropolitan area cancer registries, except Maryland. Included data cover approximately 98% of the population and met data
quality criteria for all invasive cancer sites combined. See Appendix B for registry-specific data quality information.‡ Invasive cancers only.
§ Data for specified racial or ethnic populations other than white and black should be interpreted with caution. See Technical Notes.
Hispanic origin is not mutually exclusive from race categories (white, black).
∼ Rates are suppressed if fewer than 16 cases were reported in a specific category (area, race, ethnicity).
- Rates are suppressed at the state’s or metropolitan area’s request. See Technical Notes.
Notes: Cases from suppressed rates are included in the U.S. and region/division rates. U.S. rates are as presented in Table 1.1.1.1F. Michigan, Georgia,
California, and Washington state rates each include cases from the SEER metropolitan areas.

United
States Cancer Statistics: 2004 Incid
ence and M
ortality
���
continued
Table 2.26.1.2M: Thyroid. Age-Adjusted Cancer Death Rates∗ and 95% Confidence Intervals, by U.S. CensusRegion and Division, State, and Race and Ethnicity, United States†
Males, 2004
Area All Races White Black Hispanic‡§
United States 0.5 ( 0.4- 0.5) 0.5 ( 0.4- 0.5) 0.4 ( 0.3- 0.5) 0.5 ( 0.4- 0.7)
Northeast 0.5 ( 0.4- 0.6) 0.5 ( 0.4- 0.6) ∼ ∼New England 0.5 ( 0.4- 0.7) 0.5 ( 0.4- 0.7) ∼ ∼Connecticut ∼ ∼ ∼ ∼Maine ∼ ∼ ∼ ∼Massachusetts 0.7 ( 0.4- 1.0) 0.6 ( 0.4- 1.0) ∼ ∼New Hampshire ∼ ∼ ∼ ∼Rhode Island ∼ ∼ ∼ ∼Vermont ∼ ∼ ∼ ∼
Middle Atlantic 0.5 ( 0.4- 0.6) 0.5 ( 0.4- 0.6) ∼ ∼New Jersey 0.7 ( 0.5- 1.0) 0.7 ( 0.5- 1.1) ∼ ∼New York 0.5 ( 0.3- 0.6) 0.4 ( 0.3- 0.6) ∼ ∼Pennsylvania 0.4 ( 0.3- 0.6) 0.4 ( 0.3- 0.6) ∼ ∼
Midwest 0.4 ( 0.3- 0.5) 0.4 ( 0.4- 0.5) ∼ ∼East North Central 0.4 ( 0.3- 0.5) 0.4 ( 0.3- 0.5) ∼ ∼Illinois ∼ ∼ ∼ ∼Indiana ∼ ∼ ∼ ∼Michigan 0.4 ( 0.2- 0.6) 0.4 ( 0.2- 0.6) ∼ ∼Ohio 0.6 ( 0.4- 0.8) 0.6 ( 0.4- 0.8) ∼ ∼Wisconsin ∼ ∼ ∼ ∼
West North Central 0.4 ( 0.3- 0.6) 0.4 ( 0.3- 0.6) ∼ ∼Iowa ∼ ∼ ∼ ∼Kansas ∼ ∼ ∼ ∼Minnesota ∼ ∼ ∼ ∼Missouri ∼ ∼ ∼ ∼Nebraska ∼ ∼ ∼ ∼North Dakota ∼ ∼ ∼ ∼South Dakota ∼ ∼ ∼ ∼
South 0.5 ( 0.4- 0.5) 0.5 ( 0.4- 0.6) 0.3 ( 0.2- 0.5) 0.5 ( 0.3- 0.8)
South Atlantic 0.4 ( 0.4- 0.5) 0.5 ( 0.4- 0.6) ∼ ∼Delaware ∼ ∼ ∼ ∼District of Columbia ∼ ∼ ∼ ∼Florida 0.5 ( 0.4- 0.7) 0.5 ( 0.4- 0.7) ∼ ∼Georgia ∼ ∼ ∼ ∼Maryland ∼ ∼ ∼ ∼North Carolina 0.5 ( 0.3- 0.7) ∼ ∼ ∼South Carolina ∼ ∼ ∼ ∼Virginia ∼ ∼ ∼ ∼West Virginia ∼ ∼ ∼ ∼
East South Central 0.4 ( 0.3- 0.6) 0.5 ( 0.3- 0.7) ∼ ∼Alabama ∼ ∼ ∼ ∼Kentucky ∼ ∼ ∼ ∼Mississippi ∼ ∼ ∼ ∼Tennessee ∼ ∼ ∼ ∼
West South Central 0.5 ( 0.4- 0.6) 0.5 ( 0.4- 0.7) ∼ ∼Arkansas ∼ ∼ ∼ ∼

Cancer Incidence and M
ortality, by U.S. C
ensus Region and D
i�ision, State, and Metropolitan A
rea
���
Table 2.26.1.2M: Thyroid. Age-Adjusted Cancer Death Rates∗ and 95% Confidence Intervals, by U.S. CensusRegion and Division, State, and Race and Ethnicity, United States† (continued)
Males, 2004
Area All Races White Black Hispanic‡§
Louisiana ∼ ∼ ∼ ∼Oklahoma ∼ ∼ ∼ ∼Texas 0.5 ( 0.4- 0.7) 0.6 ( 0.4- 0.8) ∼ ∼
West 0.5 ( 0.4- 0.6) 0.5 ( 0.4- 0.6) ∼ 0.5 ( 0.3- 0.9)
Mountain 0.6 ( 0.4- 0.8) 0.6 ( 0.4- 0.8) ∼ ∼Arizona ∼ ∼ ∼ ∼Colorado ∼ ∼ ∼ ∼Idaho ∼ ∼ ∼ ∼Montana ∼ ∼ ∼ ∼Nevada ∼ ∼ ∼ ∼New Mexico ∼ ∼ ∼ ∼Utah ∼ ∼ ∼ ∼Wyoming ∼ ∼ ∼ ∼
Pacific 0.5 ( 0.4- 0.6) 0.4 ( 0.3- 0.6) ∼ ∼Alaska ∼ ∼ ∼ ∼California 0.5 ( 0.4- 0.6) 0.5 ( 0.4- 0.6) ∼ ∼Hawaii ∼ ∼ ∼ ∼Oregon ∼ ∼ ∼ ∼Washington ∼ ∼ ∼ ∼
∗ Rates are per 100,000 persons and are age-adjusted to the 2000 U.S. standard population (19 age groups - Census P25-1130).† Data are from the National Vital Statistics System (NVSS).‡ Data for specified racial or ethnic populations other than white and black should be interpreted with caution. See Technical Notes.
§ Hispanic origin is not mutually exclusive from race categories (white, black).
∼ Rates are suppressed if fewer than 16 cases were reported in a specific category (area, race, ethnicity).
Note: U.S. rates are as presented in Table 1.1.1.2M.

United
States Cancer Statistics: 2004 Incid
ence and M
ortality
���
continued
Table 2.26.1.2F: Thyroid. Age-Adjusted Cancer Death Rates∗ and 95% Confidence Intervals, by U.S. CensusRegion and Division, State, and Race and Ethnicity, United States†
Females, 2004
Area All Races White Black Hispanic‡§
United States 0.5 ( 0.4- 0.5) 0.5 ( 0.4- 0.5) 0.5 ( 0.4- 0.6) 0.6 ( 0.5- 0.8)
Northeast 0.5 ( 0.4- 0.5) 0.5 ( 0.4- 0.5) ∼ ∼New England 0.4 ( 0.3- 0.6) 0.4 ( 0.3- 0.6) ∼ ∼Connecticut ∼ ∼ ∼ ∼Maine ∼ ∼ ∼ ∼Massachusetts 0.4 ( 0.2- 0.6) ∼ ∼ ∼New Hampshire ∼ ∼ ∼ ∼Rhode Island ∼ ∼ ∼ ∼Vermont ∼ ∼ ∼ ∼
Middle Atlantic 0.5 ( 0.4- 0.6) 0.5 ( 0.4- 0.6) ∼ ∼New Jersey 0.7 ( 0.5- 1.0) 0.7 ( 0.5- 1.0) ∼ ∼New York 0.4 ( 0.3- 0.5) 0.4 ( 0.3- 0.5) ∼ ∼Pennsylvania 0.4 ( 0.3- 0.6) 0.4 ( 0.3- 0.6) ∼ ∼
Midwest 0.5 ( 0.4- 0.6) 0.5 ( 0.4- 0.6) ∼ ∼East North Central 0.5 ( 0.4- 0.6) 0.5 ( 0.4- 0.6) ∼ ∼Illinois 0.7 ( 0.5- 0.9) 0.6 ( 0.4- 0.8) ∼ ∼Indiana 0.4 ( 0.3- 0.7) 0.5 ( 0.3- 0.8) ∼ ∼Michigan 0.4 ( 0.3- 0.7) 0.5 ( 0.3- 0.7) ∼ ∼Ohio 0.5 ( 0.3- 0.7) 0.5 ( 0.3- 0.7) ∼ ∼Wisconsin 0.5 ( 0.3- 0.8) ∼ ∼ ∼
West North Central 0.5 ( 0.4- 0.7) 0.5 ( 0.4- 0.6) ∼ ∼Iowa ∼ ∼ ∼ ∼Kansas ∼ ∼ ∼ ∼Minnesota 0.5 ( 0.3- 0.9) ∼ ∼ ∼Missouri 0.6 ( 0.3- 0.9) 0.6 ( 0.3- 0.9) ∼ ∼Nebraska ∼ ∼ ∼ ∼North Dakota ∼ ∼ ∼ ∼South Dakota ∼ ∼ ∼ ∼
South 0.5 ( 0.4- 0.5) 0.4 ( 0.4- 0.5) 0.5 ( 0.3- 0.7) 0.7 ( 0.5- 1.1)
South Atlantic 0.4 ( 0.3- 0.5) 0.4 ( 0.3- 0.5) 0.4 ( 0.3- 0.7) ∼Delaware ∼ ∼ ∼ ∼District of Columbia ∼ ∼ ∼ ∼Florida 0.4 ( 0.3- 0.5) 0.4 ( 0.3- 0.6) ∼ ∼Georgia ∼ ∼ ∼ ∼Maryland 0.6 ( 0.4- 0.9) 0.6 ( 0.4- 1.1) ∼ ∼North Carolina ∼ ∼ ∼ ∼South Carolina ∼ ∼ ∼ ∼Virginia ∼ ∼ ∼ ∼West Virginia ∼ ∼ ∼ ∼
East South Central 0.5 ( 0.4- 0.7) 0.5 ( 0.4- 0.7) ∼ ∼Alabama ∼ ∼ ∼ ∼Kentucky ∼ ∼ ∼ ∼Mississippi ∼ ∼ ∼ ∼Tennessee 0.6 ( 0.4- 0.9) 0.6 ( 0.3- 0.9) ∼ ∼
West South Central 0.5 ( 0.4- 0.7) 0.5 ( 0.4- 0.6) ∼ 0.7 ( 0.4- 1.2)
Arkansas ∼ ∼ ∼ ∼
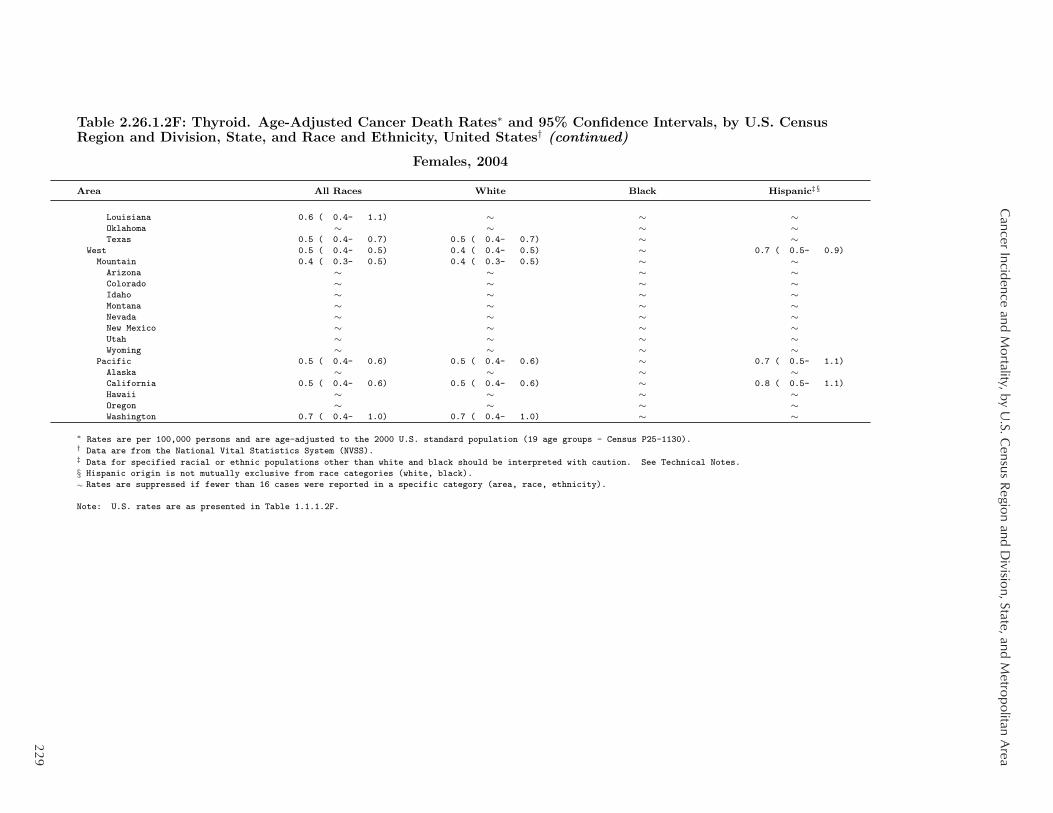
Cancer Incidence and M
ortality, by U.S. C
ensus Region and D
i�ision, State, and Metropolitan A
rea
���
Table 2.26.1.2F: Thyroid. Age-Adjusted Cancer Death Rates∗ and 95% Confidence Intervals, by U.S. CensusRegion and Division, State, and Race and Ethnicity, United States† (continued)
Females, 2004
Area All Races White Black Hispanic‡§
Louisiana 0.6 ( 0.4- 1.1) ∼ ∼ ∼Oklahoma ∼ ∼ ∼ ∼Texas 0.5 ( 0.4- 0.7) 0.5 ( 0.4- 0.7) ∼ ∼
West 0.5 ( 0.4- 0.5) 0.4 ( 0.4- 0.5) ∼ 0.7 ( 0.5- 0.9)
Mountain 0.4 ( 0.3- 0.5) 0.4 ( 0.3- 0.5) ∼ ∼Arizona ∼ ∼ ∼ ∼Colorado ∼ ∼ ∼ ∼Idaho ∼ ∼ ∼ ∼Montana ∼ ∼ ∼ ∼Nevada ∼ ∼ ∼ ∼New Mexico ∼ ∼ ∼ ∼Utah ∼ ∼ ∼ ∼Wyoming ∼ ∼ ∼ ∼
Pacific 0.5 ( 0.4- 0.6) 0.5 ( 0.4- 0.6) ∼ 0.7 ( 0.5- 1.1)
Alaska ∼ ∼ ∼ ∼California 0.5 ( 0.4- 0.6) 0.5 ( 0.4- 0.6) ∼ 0.8 ( 0.5- 1.1)
Hawaii ∼ ∼ ∼ ∼Oregon ∼ ∼ ∼ ∼Washington 0.7 ( 0.4- 1.0) 0.7 ( 0.4- 1.0) ∼ ∼
∗ Rates are per 100,000 persons and are age-adjusted to the 2000 U.S. standard population (19 age groups - Census P25-1130).† Data are from the National Vital Statistics System (NVSS).‡ Data for specified racial or ethnic populations other than white and black should be interpreted with caution. See Technical Notes.
§ Hispanic origin is not mutually exclusive from race categories (white, black).
∼ Rates are suppressed if fewer than 16 cases were reported in a specific category (area, race, ethnicity).
Note: U.S. rates are as presented in Table 1.1.1.2F.

United
States Cancer Statistics: 2004 Incid
ence and M
ortality
�30
continued
Table 2.27.1.1M: Urinary Bladder. Age-Adjusted Invasive Cancer Incidence Rates∗ and 95% ConfidenceIntervals, by U.S. Census Region and Division, State and Metropolitan Area, and Race and Ethnicity,United States†‡
Males, 2004
Area All Races White Black Hispanic§
United States 37.3 ( 37.0- 37.7) 39.3 ( 38.9- 39.6) 18.4 ( 17.5- 19.3) 20.6 ( 19.5- 21.7)
Northeast 44.7 ( 43.8- 45.5) 47.2 ( 46.3- 48.1) 19.2 ( 17.2- 21.3) 26.1 ( 23.1- 29.4)
New England 44.9 ( 43.2- 46.5) 45.9 ( 44.2- 47.6) 21.1 ( 15.2- 28.2) 33.4 ( 24.3- 44.4)
Connecticut 42.1 ( 39.0- 45.4) 43.5 ( 40.2- 47.0) 18.8 ( 10.9- 29.9) 39.9 ( 24.7- 59.9)
Maine 46.8 ( 41.7- 52.3) 46.5 ( 41.4- 52.0) ∼ ∼Massachusetts 43.7 ( 41.4- 46.2) 45.2 ( 42.7- 47.8) 23.5 ( 14.9- 34.8) 25.2 ( 14.0- 40.7)
New Hampshire 45.7 ( 40.2- 51.6) 46.0 ( 40.5- 52.0) ∼ ∼Rhode Island 54.6 ( 48.3- 61.5) 55.9 ( 49.4- 63.1) ∼ ∼Vermont 47.4 ( 39.8- 56.0) 46.1 ( 38.6- 54.7) ∼ ∼
Middle Atlantic 44.6 ( 43.6- 45.6) 47.7 ( 46.7- 48.8) 19.0 ( 16.9- 21.2) 25.1 ( 21.9- 28.6)
New Jersey 48.1 ( 45.9- 50.3) 50.9 ( 48.5- 53.4) 23.8 ( 18.9- 29.6) 33.0 ( 25.9- 41.3)
New York 42.7 ( 41.3- 44.1) 47.2 ( 45.6- 48.8) 16.4 ( 13.8- 19.2) 21.6 ( 18.0- 25.6)
Pennsylvania 45.1 ( 43.4- 46.8) 46.7 ( 44.9- 48.5) 21.2 ( 16.9- 26.2) -
Midwest 37.6 ( 36.9- 38.4) 38.3 ( 37.6- 39.1) 17.8 ( 15.9- 19.8) 15.3 ( 12.0- 19.1)
East North Central 37.5 ( 36.7- 38.4) 38.5 ( 37.6- 39.4) 17.2 ( 15.2- 19.4) 17.1 ( 13.2- 21.6)
Illinois 40.4 ( 38.6- 42.2) 42.6 ( 40.7- 44.6) 16.6 ( 13.3- 20.4) 19.3 ( 13.9- 25.8)
Indiana 36.2 ( 33.9- 38.6) 37.4 ( 35.0- 39.9) 12.7 ( 7.7- 19.4) ∼Michigan 38.1 ( 36.3- 40.0) 39.6 ( 37.6- 41.7) 20.7 ( 16.5- 25.6) ∼
Detroit 39.9 ( 36.9- 43.1) 44.7 ( 41.1- 48.5) 21.3 ( 16.4- 27.1) ∼Ohio 36.7 ( 35.1- 38.4) 36.5 ( 34.8- 38.3) 16.3 ( 12.6- 20.8) ∼Wisconsin 33.8 ( 31.5- 36.2) 34.2 ( 31.9- 36.6) ∼ ∼
West North Central 37.8 ( 36.6- 39.1) 38.0 ( 36.7- 39.3) 20.7 ( 15.7- 26.7) ∼Iowa 41.1 ( 37.9- 44.5) 40.8 ( 37.5- 44.3) ∼ ∼Kansas 35.5 ( 32.2- 39.0) 35.7 ( 32.4- 39.3) ∼ ∼Minnesota 42.8 ( 40.1- 45.7) 41.9 ( 39.2- 44.8) ∼ ∼Missouri 34.0 ( 31.8- 36.3) 35.0 ( 32.7- 37.5) 20.5 ( 14.3- 28.2) ∼Nebraska 37.4 ( 33.2- 41.8) 37.3 ( 33.1- 41.9) ∼ ∼North Dakota 37.0 ( 30.6- 44.3) 37.2 ( 30.7- 44.6) ∼ ∼South Dakota 33.3 ( 27.7- 39.6) 34.0 ( 28.3- 40.6) ∼ ∼
South 34.1 ( 33.6- 34.7) 36.3 ( 35.7- 36.9) 17.8 ( 16.6- 19.0) 21.5 ( 19.8- 23.2)
South Atlantic 35.8 ( 35.0- 36.6) 38.2 ( 37.4- 39.1) 18.9 ( 17.3- 20.7) 28.1 ( 25.3- 31.1)
Delaware 44.0 ( 37.5- 51.2) 45.3 ( 38.2- 53.2) 35.8 ( 19.9- 58.3) ∼District of Columbia 19.4 ( 14.1- 26.1) 25.2 ( 14.9- 39.6) 16.1 ( 10.3- 24.0) ∼Florida 37.4 ( 36.2- 38.6) 38.9 ( 37.7- 40.3) 16.7 ( 13.6- 20.3) -
Georgia 34.1 ( 32.0- 36.4) 38.0 ( 35.4- 40.6) 20.3 ( 16.5- 24.6) ∼Atlanta 29.9 ( 26.1- 34.0) 35.2 ( 30.5- 40.4) 17.3 ( 11.2- 25.0) ∼
Maryland
North Carolina 36.4 ( 34.4- 38.5) 39.3 ( 37.0- 41.6) 21.3 ( 17.5- 25.6) ∼South Carolina 30.8 ( 28.2- 33.5) 34.3 ( 31.2- 37.5) 17.2 ( 13.0- 22.1) -
Virginia 33.5 ( 31.4- 35.7) 35.9 ( 33.6- 38.4) 20.6 ( 16.5- 25.4) ∼West Virginia 37.5 ( 33.7- 41.7) 38.5 ( 34.6- 42.8) ∼ ∼
East South Central 32.6 ( 31.3- 34.0) 34.8 ( 33.3- 36.3) 17.0 ( 14.4- 19.9) ∼Alabama 29.3 ( 26.9- 31.9) 32.8 ( 30.0- 35.8) 13.7 ( 10.0- 18.2) ∼Kentucky 38.1 ( 35.2- 41.2) 38.4 ( 35.4- 41.6) 24.4 ( 14.9- 37.1) -
Mississippi 29.5 ( 26.4- 32.8) 33.9 ( 30.1- 38.1) 15.6 ( 11.1- 21.2) ∼Tennessee 32.9 ( 30.6- 35.3) 33.8 ( 31.3- 36.3) 20.7 ( 15.2- 27.4) ∼

Cancer Incidence and M
ortality, by U.S. C
ensus Region and D
i�ision, State, and Metropolitan A
rea
�3�
Table 2.27.1.1M: Urinary Bladder. Age-Adjusted Invasive Cancer Incidence Rates∗ and 95% ConfidenceIntervals, by U.S. Census Region and Division, State and Metropolitan Area, and Race and Ethnicity,United States†‡ (continued)
Males, 2004
Area All Races White Black Hispanic§
West South Central 32.1 ( 31.1- 33.1) 34.0 ( 32.9- 35.1) 15.7 ( 13.5- 18.0) 16.6 ( 14.6- 18.8)
Arkansas 33.1 ( 30.0- 36.5) 35.8 ( 32.4- 39.6) ∼ ∼Louisiana 38.0 ( 35.1- 41.0) 43.6 ( 40.1- 47.4) 19.4 ( 15.3- 24.1) ∼Oklahoma 35.4 ( 32.5- 38.5) 36.8 ( 33.6- 40.1) ∼ ∼Texas 30.0 ( 28.7- 31.2) 31.3 ( 30.0- 32.7) 14.2 ( 11.4- 17.5) 16.4 ( 14.4- 18.7)
West 35.4 ( 34.7- 36.1) 37.6 ( 36.8- 38.4) 21.1 ( 18.1- 24.3) 18.6 ( 17.0- 20.2)
Mountain 33.6 ( 32.3- 34.9) 34.6 ( 33.3- 35.9) 13.0 ( 7.7- 20.1) 17.0 ( 14.1- 20.2)
Arizona 34.2 ( 31.9- 36.5) 35.3 ( 33.0- 37.8) ∼ 18.5 ( 13.1- 25.1)
Colorado 32.8 ( 30.0- 35.7) 33.7 ( 30.8- 36.7) ∼ 14.7 ( 9.4- 21.7)
Idaho 35.1 ( 30.4- 40.4) 35.6 ( 30.8- 40.9) ∼ ∼Montana 41.8 ( 36.0- 48.2) 41.5 ( 35.7- 48.1) ∼ ∼Nevada 37.9 ( 34.0- 42.1) 39.8 ( 35.6- 44.3) ∼ ∼New Mexico 26.9 ( 23.4- 30.7) 29.0 ( 25.2- 33.1) ∼ 17.8 ( 12.9- 23.9)
Utah 27.1 ( 23.5- 31.1) 27.4 ( 23.7- 31.5) ∼ ∼Wyoming 37.6 ( 29.8- 46.6) 36.8 ( 29.1- 45.9) ∼ ∼
Pacific 36.2 ( 35.3- 37.0) 39.1 ( 38.1- 40.1) 22.8 ( 19.4- 26.5) 19.1 ( 17.3- 21.1)
Alaska 40.3 ( 31.3- 50.9) 44.6 ( 33.9- 57.5) ∼ ∼California 35.0 ( 34.0- 36.0) 38.3 ( 37.2- 39.5) 21.9 ( 18.4- 25.7) 19.3 ( 17.4- 21.4)
San Francisco-Oakland 31.6 ( 29.0- 34.4) 38.2 ( 34.8- 41.9) 20.1 ( 13.1- 29.3) 14.9 ( 9.3- 22.3)
San Jose-Monterey 36.0 ( 32.0- 40.2) 42.1 ( 37.3- 47.4) ∼ 25.1 ( 16.1- 36.6)
Los Angeles 33.1 ( 31.2- 35.1) 37.2 ( 34.8- 39.6) 23.9 ( 18.7- 30.0) 16.1 ( 13.4- 19.3)
Hawaii 27.4 ( 23.3- 31.9) 40.5 ( 30.9- 52.1) ∼ ∼Oregon 40.3 ( 37.2- 43.5) 39.8 ( 36.7- 43.1) ∼ ∼Washington 41.6 ( 39.1- 44.2) 41.9 ( 39.3- 44.6) 35.2 ( 20.0- 56.2) ∼
Seattle-Puget Sound 42.9 ( 39.8- 46.1) 45.4 ( 42.1- 48.9) 30.5 ( 16.3- 50.9) ∼∗ Rates are per 100,000 persons and are age-adjusted to the 2000 U.S. standard population (19 age groups - Census P25-1130).† Data are from all state and metropolitan area cancer registries, except Maryland. Included data cover approximately 98% of the population and met data
quality criteria for all invasive cancer sites combined. See Appendix B for registry-specific data quality information.‡ Includes invasive and in situ.
§ Data for specified racial or ethnic populations other than white and black should be interpreted with caution. See Technical Notes.
Hispanic origin is not mutually exclusive from race categories (white, black).
∼ Rates are suppressed if fewer than 16 cases were reported in a specific category (area, race, ethnicity).
- Rates are suppressed at the state’s or metropolitan area’s request. See Technical Notes.
Notes: Cases from suppressed rates are included in the U.S. and region/division rates. U.S. rates are as presented in Table 1.1.1.1M. Michigan, Georgia,
California, and Washington state rates each include cases from the SEER metropolitan areas.
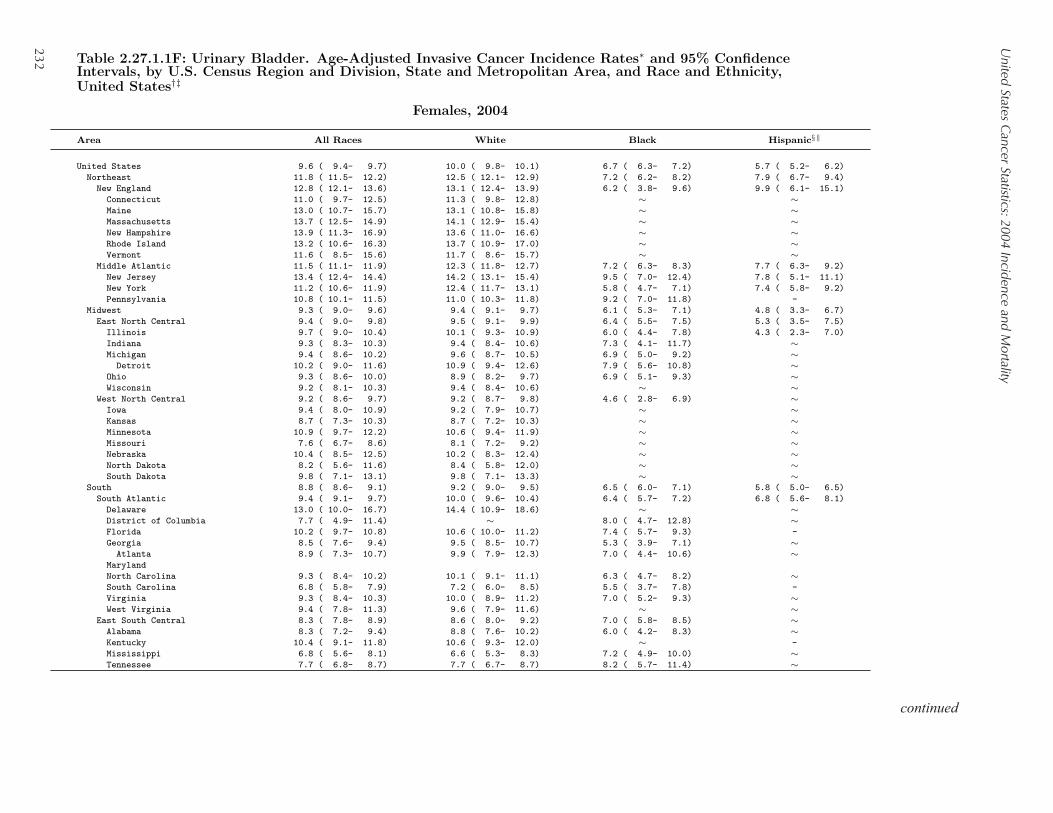
United
States Cancer Statistics: 2004 Incid
ence and M
ortality
�3�
continued
Table 2.27.1.1F: Urinary Bladder. Age-Adjusted Invasive Cancer Incidence Rates∗ and 95% ConfidenceIntervals, by U.S. Census Region and Division, State and Metropolitan Area, and Race and Ethnicity,United States†‡
Females, 2004
Area All Races White Black Hispanic§
United States 9.6 ( 9.4- 9.7) 10.0 ( 9.8- 10.1) 6.7 ( 6.3- 7.2) 5.7 ( 5.2- 6.2)
Northeast 11.8 ( 11.5- 12.2) 12.5 ( 12.1- 12.9) 7.2 ( 6.2- 8.2) 7.9 ( 6.7- 9.4)
New England 12.8 ( 12.1- 13.6) 13.1 ( 12.4- 13.9) 6.2 ( 3.8- 9.6) 9.9 ( 6.1- 15.1)
Connecticut 11.0 ( 9.7- 12.5) 11.3 ( 9.8- 12.8) ∼ ∼Maine 13.0 ( 10.7- 15.7) 13.1 ( 10.8- 15.8) ∼ ∼Massachusetts 13.7 ( 12.5- 14.9) 14.1 ( 12.9- 15.4) ∼ ∼New Hampshire 13.9 ( 11.3- 16.9) 13.6 ( 11.0- 16.6) ∼ ∼Rhode Island 13.2 ( 10.6- 16.3) 13.7 ( 10.9- 17.0) ∼ ∼Vermont 11.6 ( 8.5- 15.6) 11.7 ( 8.6- 15.7) ∼ ∼
Middle Atlantic 11.5 ( 11.1- 11.9) 12.3 ( 11.8- 12.7) 7.2 ( 6.3- 8.3) 7.7 ( 6.3- 9.2)
New Jersey 13.4 ( 12.4- 14.4) 14.2 ( 13.1- 15.4) 9.5 ( 7.0- 12.4) 7.8 ( 5.1- 11.1)
New York 11.2 ( 10.6- 11.9) 12.4 ( 11.7- 13.1) 5.8 ( 4.7- 7.1) 7.4 ( 5.8- 9.2)
Pennsylvania 10.8 ( 10.1- 11.5) 11.0 ( 10.3- 11.8) 9.2 ( 7.0- 11.8) -
Midwest 9.3 ( 9.0- 9.6) 9.4 ( 9.1- 9.7) 6.1 ( 5.3- 7.1) 4.8 ( 3.3- 6.7)
East North Central 9.4 ( 9.0- 9.8) 9.5 ( 9.1- 9.9) 6.4 ( 5.5- 7.5) 5.3 ( 3.5- 7.5)
Illinois 9.7 ( 9.0- 10.4) 10.1 ( 9.3- 10.9) 6.0 ( 4.4- 7.8) 4.3 ( 2.3- 7.0)
Indiana 9.3 ( 8.3- 10.3) 9.4 ( 8.4- 10.6) 7.3 ( 4.1- 11.7) ∼Michigan 9.4 ( 8.6- 10.2) 9.6 ( 8.7- 10.5) 6.9 ( 5.0- 9.2) ∼
Detroit 10.2 ( 9.0- 11.6) 10.9 ( 9.4- 12.6) 7.9 ( 5.6- 10.8) ∼Ohio 9.3 ( 8.6- 10.0) 8.9 ( 8.2- 9.7) 6.9 ( 5.1- 9.3) ∼Wisconsin 9.2 ( 8.1- 10.3) 9.4 ( 8.4- 10.6) ∼ ∼
West North Central 9.2 ( 8.6- 9.7) 9.2 ( 8.7- 9.8) 4.6 ( 2.8- 6.9) ∼Iowa 9.4 ( 8.0- 10.9) 9.2 ( 7.9- 10.7) ∼ ∼Kansas 8.7 ( 7.3- 10.3) 8.7 ( 7.2- 10.3) ∼ ∼Minnesota 10.9 ( 9.7- 12.2) 10.6 ( 9.4- 11.9) ∼ ∼Missouri 7.6 ( 6.7- 8.6) 8.1 ( 7.2- 9.2) ∼ ∼Nebraska 10.4 ( 8.5- 12.5) 10.2 ( 8.3- 12.4) ∼ ∼North Dakota 8.2 ( 5.6- 11.6) 8.4 ( 5.8- 12.0) ∼ ∼South Dakota 9.8 ( 7.1- 13.1) 9.8 ( 7.1- 13.3) ∼ ∼
South 8.8 ( 8.6- 9.1) 9.2 ( 9.0- 9.5) 6.5 ( 6.0- 7.1) 5.8 ( 5.0- 6.5)
South Atlantic 9.4 ( 9.1- 9.7) 10.0 ( 9.6- 10.4) 6.4 ( 5.7- 7.2) 6.8 ( 5.6- 8.1)
Delaware 13.0 ( 10.0- 16.7) 14.4 ( 10.9- 18.6) ∼ ∼District of Columbia 7.7 ( 4.9- 11.4) ∼ 8.0 ( 4.7- 12.8) ∼Florida 10.2 ( 9.7- 10.8) 10.6 ( 10.0- 11.2) 7.4 ( 5.7- 9.3) -
Georgia 8.5 ( 7.6- 9.4) 9.5 ( 8.5- 10.7) 5.3 ( 3.9- 7.1) ∼Atlanta 8.9 ( 7.3- 10.7) 9.9 ( 7.9- 12.3) 7.0 ( 4.4- 10.6) ∼
Maryland
North Carolina 9.3 ( 8.4- 10.2) 10.1 ( 9.1- 11.1) 6.3 ( 4.7- 8.2) ∼South Carolina 6.8 ( 5.8- 7.9) 7.2 ( 6.0- 8.5) 5.5 ( 3.7- 7.8) -
Virginia 9.3 ( 8.4- 10.3) 10.0 ( 8.9- 11.2) 7.0 ( 5.2- 9.3) ∼West Virginia 9.4 ( 7.8- 11.3) 9.6 ( 7.9- 11.6) ∼ ∼
East South Central 8.3 ( 7.8- 8.9) 8.6 ( 8.0- 9.2) 7.0 ( 5.8- 8.5) ∼Alabama 8.3 ( 7.2- 9.4) 8.8 ( 7.6- 10.2) 6.0 ( 4.2- 8.3) ∼Kentucky 10.4 ( 9.1- 11.8) 10.6 ( 9.3- 12.0) ∼ -
Mississippi 6.8 ( 5.6- 8.1) 6.6 ( 5.3- 8.3) 7.2 ( 4.9- 10.0) ∼Tennessee 7.7 ( 6.8- 8.7) 7.7 ( 6.7- 8.7) 8.2 ( 5.7- 11.4) ∼
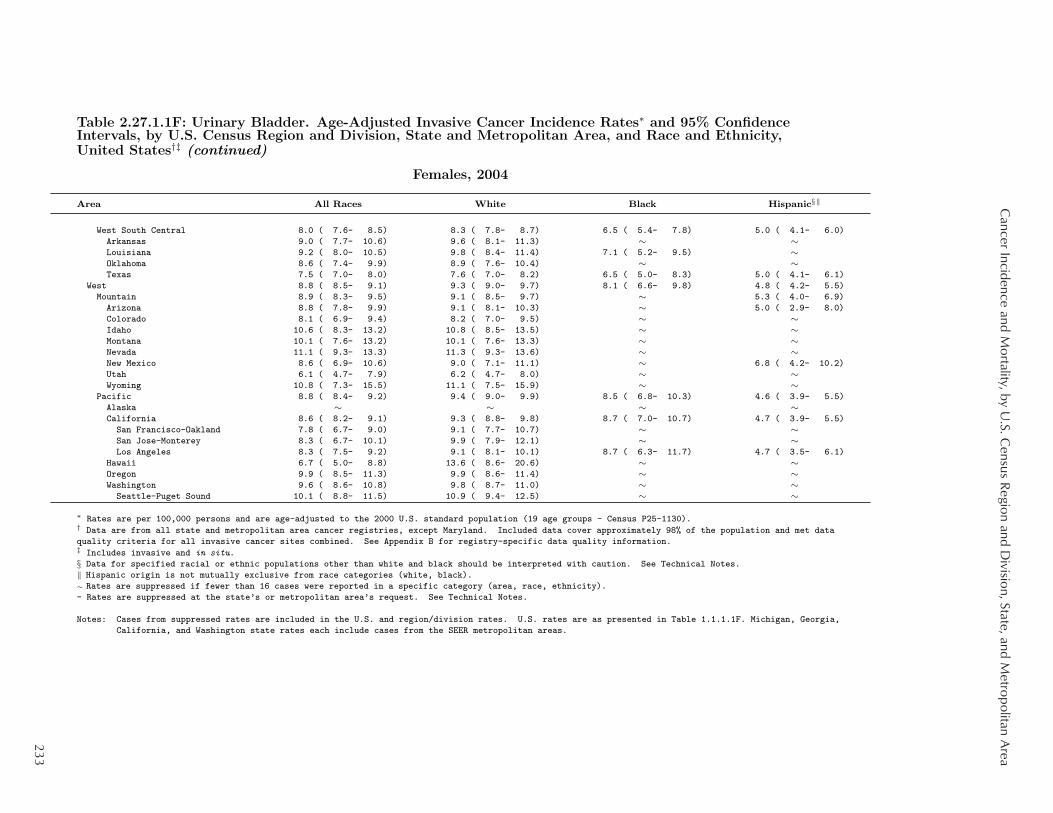
Cancer Incidence and M
ortality, by U.S. C
ensus Region and D
i�ision, State, and Metropolitan A
rea
�33
Table 2.27.1.1F: Urinary Bladder. Age-Adjusted Invasive Cancer Incidence Rates∗ and 95% ConfidenceIntervals, by U.S. Census Region and Division, State and Metropolitan Area, and Race and Ethnicity,United States†‡ (continued)
Females, 2004
Area All Races White Black Hispanic§
West South Central 8.0 ( 7.6- 8.5) 8.3 ( 7.8- 8.7) 6.5 ( 5.4- 7.8) 5.0 ( 4.1- 6.0)
Arkansas 9.0 ( 7.7- 10.6) 9.6 ( 8.1- 11.3) ∼ ∼Louisiana 9.2 ( 8.0- 10.5) 9.8 ( 8.4- 11.4) 7.1 ( 5.2- 9.5) ∼Oklahoma 8.6 ( 7.4- 9.9) 8.9 ( 7.6- 10.4) ∼ ∼Texas 7.5 ( 7.0- 8.0) 7.6 ( 7.0- 8.2) 6.5 ( 5.0- 8.3) 5.0 ( 4.1- 6.1)
West 8.8 ( 8.5- 9.1) 9.3 ( 9.0- 9.7) 8.1 ( 6.6- 9.8) 4.8 ( 4.2- 5.5)
Mountain 8.9 ( 8.3- 9.5) 9.1 ( 8.5- 9.7) ∼ 5.3 ( 4.0- 6.9)
Arizona 8.8 ( 7.8- 9.9) 9.1 ( 8.1- 10.3) ∼ 5.0 ( 2.9- 8.0)
Colorado 8.1 ( 6.9- 9.4) 8.2 ( 7.0- 9.5) ∼ ∼Idaho 10.6 ( 8.3- 13.2) 10.8 ( 8.5- 13.5) ∼ ∼Montana 10.1 ( 7.6- 13.2) 10.1 ( 7.6- 13.3) ∼ ∼Nevada 11.1 ( 9.3- 13.3) 11.3 ( 9.3- 13.6) ∼ ∼New Mexico 8.6 ( 6.9- 10.6) 9.0 ( 7.1- 11.1) ∼ 6.8 ( 4.2- 10.2)
Utah 6.1 ( 4.7- 7.9) 6.2 ( 4.7- 8.0) ∼ ∼Wyoming 10.8 ( 7.3- 15.5) 11.1 ( 7.5- 15.9) ∼ ∼
Pacific 8.8 ( 8.4- 9.2) 9.4 ( 9.0- 9.9) 8.5 ( 6.8- 10.3) 4.6 ( 3.9- 5.5)
Alaska ∼ ∼ ∼ ∼California 8.6 ( 8.2- 9.1) 9.3 ( 8.8- 9.8) 8.7 ( 7.0- 10.7) 4.7 ( 3.9- 5.5)
San Francisco-Oakland 7.8 ( 6.7- 9.0) 9.1 ( 7.7- 10.7) ∼ ∼San Jose-Monterey 8.3 ( 6.7- 10.1) 9.9 ( 7.9- 12.1) ∼ ∼Los Angeles 8.3 ( 7.5- 9.2) 9.1 ( 8.1- 10.1) 8.7 ( 6.3- 11.7) 4.7 ( 3.5- 6.1)
Hawaii 6.7 ( 5.0- 8.8) 13.6 ( 8.6- 20.6) ∼ ∼Oregon 9.9 ( 8.5- 11.3) 9.9 ( 8.6- 11.4) ∼ ∼Washington 9.6 ( 8.6- 10.8) 9.8 ( 8.7- 11.0) ∼ ∼
Seattle-Puget Sound 10.1 ( 8.8- 11.5) 10.9 ( 9.4- 12.5) ∼ ∼∗ Rates are per 100,000 persons and are age-adjusted to the 2000 U.S. standard population (19 age groups - Census P25-1130).† Data are from all state and metropolitan area cancer registries, except Maryland. Included data cover approximately 98% of the population and met data
quality criteria for all invasive cancer sites combined. See Appendix B for registry-specific data quality information.‡ Includes invasive and in situ.
§ Data for specified racial or ethnic populations other than white and black should be interpreted with caution. See Technical Notes.
Hispanic origin is not mutually exclusive from race categories (white, black).
∼ Rates are suppressed if fewer than 16 cases were reported in a specific category (area, race, ethnicity).
- Rates are suppressed at the state’s or metropolitan area’s request. See Technical Notes.
Notes: Cases from suppressed rates are included in the U.S. and region/division rates. U.S. rates are as presented in Table 1.1.1.1F. Michigan, Georgia,
California, and Washington state rates each include cases from the SEER metropolitan areas.

United
States Cancer Statistics: 2004 Incid
ence and M
ortality
�3�
continued
Table 2.27.1.2M: Urinary Bladder. Age-Adjusted Cancer Death Rates∗ and 95% Confidence Intervals, by U.S.Census Region and Division, State, and Race and Ethnicity, United States†
Males, 2004
Area All Races White Black Hispanic‡§
United States 7.6 ( 7.4- 7.7) 8.0 ( 7.8- 8.2) 5.0 ( 4.5- 5.5) 3.5 ( 3.0- 4.0)
Northeast 8.2 ( 7.9- 8.6) 8.7 ( 8.3- 9.1) 4.8 ( 3.9- 5.9) 3.3 ( 2.3- 4.6)
New England 9.0 ( 8.3- 9.8) 9.3 ( 8.5- 10.1) ∼ ∼Connecticut 7.6 ( 6.3- 9.0) 7.8 ( 6.4- 9.3) ∼ ∼Maine 11.7 ( 9.1- 14.7) 11.8 ( 9.2- 14.8) ∼ ∼Massachusetts 9.4 ( 8.3- 10.6) 9.7 ( 8.6- 11.0) ∼ ∼New Hampshire 9.2 ( 6.8- 12.2) 9.3 ( 6.9- 12.4) ∼ ∼Rhode Island 9.3 ( 6.8- 12.5) 9.7 ( 7.1- 13.0) ∼ ∼Vermont 7.4 ( 4.5- 11.4) 7.2 ( 4.4- 11.2) ∼ ∼
Middle Atlantic 7.9 ( 7.5- 8.4) 8.4 ( 8.0- 8.9) 4.9 ( 3.9- 6.1) 3.5 ( 2.4- 5.0)
New Jersey 8.3 ( 7.4- 9.3) 8.7 ( 7.7- 9.8) 6.0 ( 3.6- 9.3) ∼New York 7.7 ( 7.1- 8.4) 8.5 ( 7.8- 9.2) 4.2 ( 3.0- 5.8) 3.4 ( 2.1- 5.3)
Pennsylvania 8.0 ( 7.3- 8.8) 8.2 ( 7.5- 9.0) 5.5 ( 3.4- 8.3) ∼Midwest 8.1 ( 7.8- 8.5) 8.4 ( 8.0- 8.7) 5.6 ( 4.5- 6.8) ∼
East North Central 8.5 ( 8.1- 8.9) 8.8 ( 8.4- 9.3) 5.4 ( 4.3- 6.7) ∼Illinois 7.7 ( 6.9- 8.5) 8.3 ( 7.5- 9.2) 3.4 ( 2.1- 5.2) ∼Indiana 8.3 ( 7.2- 9.6) 8.5 ( 7.3- 9.8) ∼ ∼Michigan 8.2 ( 7.3- 9.1) 8.6 ( 7.6- 9.6) 4.7 ( 2.8- 7.2) ∼Ohio 9.3 ( 8.4- 10.2) 9.4 ( 8.5- 10.4) 8.1 ( 5.5- 11.5) ∼Wisconsin 9.3 ( 8.1- 10.6) 9.4 ( 8.2- 10.7) ∼ ∼
West North Central 7.4 ( 6.8- 8.0) 7.5 ( 6.9- 8.1) 6.6 ( 3.8- 10.6) ∼Iowa 7.4 ( 6.1- 9.0) 7.5 ( 6.2- 9.1) ∼ ∼Kansas 7.3 ( 5.8- 9.0) 7.5 ( 6.0- 9.3) ∼ ∼Minnesota 7.4 ( 6.3- 8.7) 7.6 ( 6.4- 8.9) ∼ ∼Missouri 7.3 ( 6.2- 8.4) 7.1 ( 6.1- 8.3) ∼ ∼Nebraska 7.0 ( 5.3- 9.2) 7.2 ( 5.4- 9.4) ∼ ∼North Dakota 8.1 ( 5.3- 11.9) 8.2 ( 5.4- 12.1) ∼ ∼South Dakota 8.0 ( 5.4- 11.4) 8.3 ( 5.6- 11.8) ∼ ∼
South 7.1 ( 6.8- 7.4) 7.5 ( 7.2- 7.8) 4.9 ( 4.3- 5.6) 4.0 ( 3.2- 4.8)
South Atlantic 7.4 ( 7.0- 7.7) 7.8 ( 7.4- 8.2) 5.1 ( 4.3- 6.0) 5.6 ( 4.3- 7.0)
Delaware 10.9 ( 7.6- 14.9) 10.7 ( 7.3- 15.0) ∼ ∼District of Columbia ∼ ∼ ∼ ∼Florida 7.9 ( 7.4- 8.5) 8.1 ( 7.5- 8.7) 5.7 ( 3.9- 8.0) 6.5 ( 5.0- 8.3)
Georgia 6.6 ( 5.6- 7.7) 7.1 ( 5.9- 8.4) 4.8 ( 3.0- 7.3) ∼Maryland 7.2 ( 6.1- 8.5) 7.8 ( 6.5- 9.3) 5.5 ( 3.2- 8.6) ∼North Carolina 7.0 ( 6.1- 8.1) 7.5 ( 6.5- 8.7) 4.8 ( 3.0- 7.2) ∼South Carolina 6.1 ( 5.0- 7.5) 7.0 ( 5.6- 8.7) ∼ ∼Virginia 7.3 ( 6.3- 8.4) 7.8 ( 6.6- 9.1) 5.8 ( 3.6- 8.8) ∼West Virginia 7.9 ( 6.2- 10.0) 8.0 ( 6.2- 10.1) ∼ ∼
East South Central 6.9 ( 6.3- 7.6) 7.4 ( 6.7- 8.2) 3.8 ( 2.6- 5.3) ∼Alabama 6.7 ( 5.6- 8.1) 7.6 ( 6.2- 9.2) ∼ ∼Kentucky 7.7 ( 6.3- 9.2) 7.8 ( 6.5- 9.4) ∼ ∼Mississippi 6.8 ( 5.3- 8.6) 8.4 ( 6.4- 10.7) ∼ ∼Tennessee 6.6 ( 5.5- 7.7) 6.7 ( 5.6- 7.9) ∼ ∼
West South Central 6.6 ( 6.2- 7.1) 6.9 ( 6.4- 7.5) 5.2 ( 3.9- 6.7) 2.8 ( 2.0- 3.8)
Arkansas 7.2 ( 5.7- 8.9) 7.9 ( 6.3- 9.8) ∼ ∼

Cancer Incidence and M
ortality, by U.S. C
ensus Region and D
i�ision, State, and Metropolitan A
rea
�3�
Table 2.27.1.2M: Urinary Bladder. Age-Adjusted Cancer Death Rates∗ and 95% Confidence Intervals, by U.S.Census Region and Division, State, and Race and Ethnicity, United States† (continued)
Males, 2004
Area All Races White Black Hispanic‡§
Louisiana 6.8 ( 5.6- 8.2) 6.9 ( 5.4- 8.5) 6.9 ( 4.4- 10.1) ∼Oklahoma 6.7 ( 5.4- 8.2) 6.9 ( 5.6- 8.5) ∼ ∼Texas 6.5 ( 5.9- 7.1) 6.7 ( 6.1- 7.4) 5.4 ( 3.6- 7.7) 2.8 ( 2.0- 3.9)
West 7.2 ( 6.8- 7.5) 7.7 ( 7.3- 8.1) 5.0 ( 3.5- 6.8) 3.1 ( 2.4- 3.8)
Mountain 6.8 ( 6.2- 7.4) 7.0 ( 6.4- 7.7) ∼ 3.4 ( 2.1- 4.9)
Arizona 6.6 ( 5.6- 7.8) 6.9 ( 5.8- 8.1) ∼ ∼Colorado 6.6 ( 5.4- 8.0) 6.9 ( 5.6- 8.3) ∼ ∼Idaho 6.7 ( 4.7- 9.3) 6.8 ( 4.8- 9.4) ∼ ∼Montana 8.9 ( 6.3- 12.2) 9.0 ( 6.3- 12.3) ∼ ∼Nevada 6.7 ( 5.0- 8.6) 7.3 ( 5.5- 9.5) ∼ ∼New Mexico 5.4 ( 3.9- 7.3) 5.9 ( 4.2- 8.0) ∼ ∼Utah 7.3 ( 5.5- 9.6) 7.4 ( 5.5- 9.6) ∼ ∼Wyoming 7.2 ( 4.0- 11.8) 7.3 ( 4.1- 12.0) ∼ ∼
Pacific 7.3 ( 6.9- 7.8) 8.0 ( 7.6- 8.5) 5.6 ( 3.9- 7.8) 3.0 ( 2.3- 3.8)
Alaska ∼ ∼ ∼ ∼California 7.1 ( 6.7- 7.6) 7.9 ( 7.4- 8.4) 5.8 ( 4.0- 8.0) 3.1 ( 2.3- 4.0)
Hawaii 5.0 ( 3.3- 7.1) ∼ ∼ ∼Oregon 8.5 ( 7.1- 10.0) 8.8 ( 7.4- 10.4) ∼ ∼Washington 8.1 ( 7.0- 9.3) 8.3 ( 7.2- 9.6) ∼ ∼
∗ Rates are per 100,000 persons and are age-adjusted to the 2000 U.S. standard population (19 age groups - Census P25-1130).† Data are from the National Vital Statistics System (NVSS).‡ Data for specified racial or ethnic populations other than white and black should be interpreted with caution. See Technical Notes.
§ Hispanic origin is not mutually exclusive from race categories (white, black).
∼ Rates are suppressed if fewer than 16 cases were reported in a specific category (area, race, ethnicity).
Note: U.S. rates are as presented in Table 1.1.1.2M.
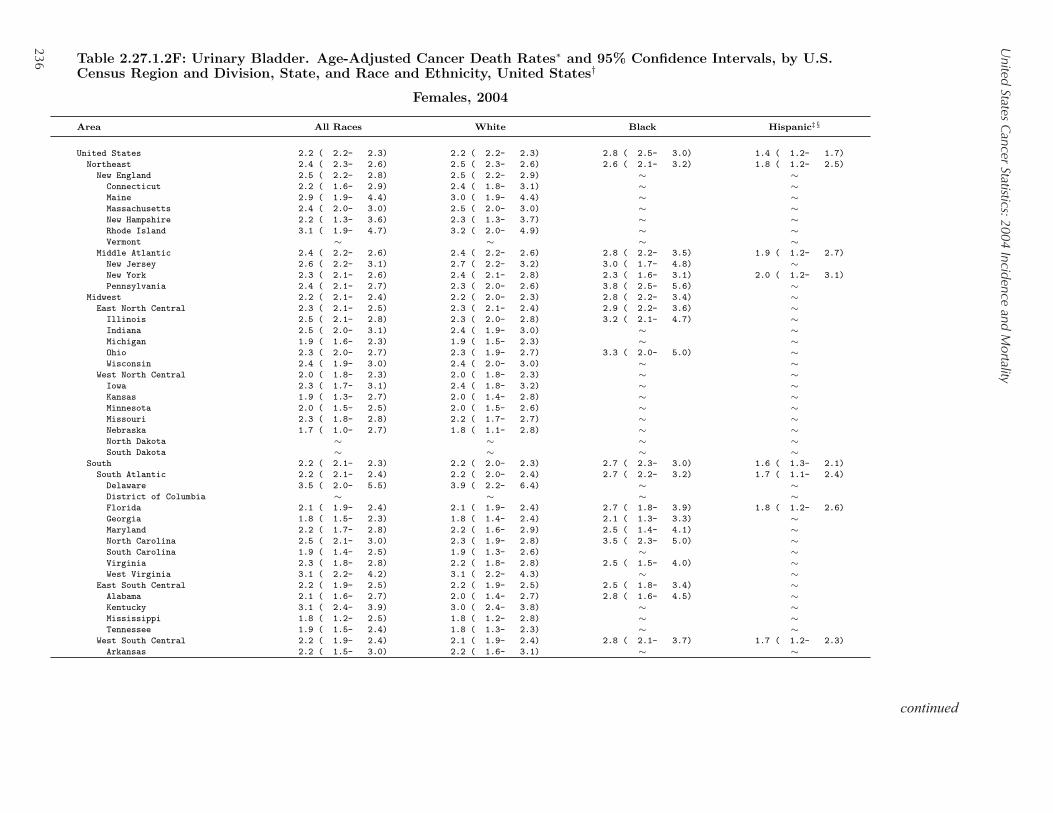
United
States Cancer Statistics: 2004 Incid
ence and M
ortality
�3�
continued
Table 2.27.1.2F: Urinary Bladder. Age-Adjusted Cancer Death Rates∗ and 95% Confidence Intervals, by U.S.Census Region and Division, State, and Race and Ethnicity, United States†
Females, 2004
Area All Races White Black Hispanic‡§
United States 2.2 ( 2.2- 2.3) 2.2 ( 2.2- 2.3) 2.8 ( 2.5- 3.0) 1.4 ( 1.2- 1.7)
Northeast 2.4 ( 2.3- 2.6) 2.5 ( 2.3- 2.6) 2.6 ( 2.1- 3.2) 1.8 ( 1.2- 2.5)
New England 2.5 ( 2.2- 2.8) 2.5 ( 2.2- 2.9) ∼ ∼Connecticut 2.2 ( 1.6- 2.9) 2.4 ( 1.8- 3.1) ∼ ∼Maine 2.9 ( 1.9- 4.4) 3.0 ( 1.9- 4.4) ∼ ∼Massachusetts 2.4 ( 2.0- 3.0) 2.5 ( 2.0- 3.0) ∼ ∼New Hampshire 2.2 ( 1.3- 3.6) 2.3 ( 1.3- 3.7) ∼ ∼Rhode Island 3.1 ( 1.9- 4.7) 3.2 ( 2.0- 4.9) ∼ ∼Vermont ∼ ∼ ∼ ∼
Middle Atlantic 2.4 ( 2.2- 2.6) 2.4 ( 2.2- 2.6) 2.8 ( 2.2- 3.5) 1.9 ( 1.2- 2.7)
New Jersey 2.6 ( 2.2- 3.1) 2.7 ( 2.2- 3.2) 3.0 ( 1.7- 4.8) ∼New York 2.3 ( 2.1- 2.6) 2.4 ( 2.1- 2.8) 2.3 ( 1.6- 3.1) 2.0 ( 1.2- 3.1)
Pennsylvania 2.4 ( 2.1- 2.7) 2.3 ( 2.0- 2.6) 3.8 ( 2.5- 5.6) ∼Midwest 2.2 ( 2.1- 2.4) 2.2 ( 2.0- 2.3) 2.8 ( 2.2- 3.4) ∼
East North Central 2.3 ( 2.1- 2.5) 2.3 ( 2.1- 2.4) 2.9 ( 2.2- 3.6) ∼Illinois 2.5 ( 2.1- 2.8) 2.3 ( 2.0- 2.8) 3.2 ( 2.1- 4.7) ∼Indiana 2.5 ( 2.0- 3.1) 2.4 ( 1.9- 3.0) ∼ ∼Michigan 1.9 ( 1.6- 2.3) 1.9 ( 1.5- 2.3) ∼ ∼Ohio 2.3 ( 2.0- 2.7) 2.3 ( 1.9- 2.7) 3.3 ( 2.0- 5.0) ∼Wisconsin 2.4 ( 1.9- 3.0) 2.4 ( 2.0- 3.0) ∼ ∼
West North Central 2.0 ( 1.8- 2.3) 2.0 ( 1.8- 2.3) ∼ ∼Iowa 2.3 ( 1.7- 3.1) 2.4 ( 1.8- 3.2) ∼ ∼Kansas 1.9 ( 1.3- 2.7) 2.0 ( 1.4- 2.8) ∼ ∼Minnesota 2.0 ( 1.5- 2.5) 2.0 ( 1.5- 2.6) ∼ ∼Missouri 2.3 ( 1.8- 2.8) 2.2 ( 1.7- 2.7) ∼ ∼Nebraska 1.7 ( 1.0- 2.7) 1.8 ( 1.1- 2.8) ∼ ∼North Dakota ∼ ∼ ∼ ∼South Dakota ∼ ∼ ∼ ∼
South 2.2 ( 2.1- 2.3) 2.2 ( 2.0- 2.3) 2.7 ( 2.3- 3.0) 1.6 ( 1.3- 2.1)
South Atlantic 2.2 ( 2.1- 2.4) 2.2 ( 2.0- 2.4) 2.7 ( 2.2- 3.2) 1.7 ( 1.1- 2.4)
Delaware 3.5 ( 2.0- 5.5) 3.9 ( 2.2- 6.4) ∼ ∼District of Columbia ∼ ∼ ∼ ∼Florida 2.1 ( 1.9- 2.4) 2.1 ( 1.9- 2.4) 2.7 ( 1.8- 3.9) 1.8 ( 1.2- 2.6)
Georgia 1.8 ( 1.5- 2.3) 1.8 ( 1.4- 2.4) 2.1 ( 1.3- 3.3) ∼Maryland 2.2 ( 1.7- 2.8) 2.2 ( 1.6- 2.9) 2.5 ( 1.4- 4.1) ∼North Carolina 2.5 ( 2.1- 3.0) 2.3 ( 1.9- 2.8) 3.5 ( 2.3- 5.0) ∼South Carolina 1.9 ( 1.4- 2.5) 1.9 ( 1.3- 2.6) ∼ ∼Virginia 2.3 ( 1.8- 2.8) 2.2 ( 1.8- 2.8) 2.5 ( 1.5- 4.0) ∼West Virginia 3.1 ( 2.2- 4.2) 3.1 ( 2.2- 4.3) ∼ ∼
East South Central 2.2 ( 1.9- 2.5) 2.2 ( 1.9- 2.5) 2.5 ( 1.8- 3.4) ∼Alabama 2.1 ( 1.6- 2.7) 2.0 ( 1.4- 2.7) 2.8 ( 1.6- 4.5) ∼Kentucky 3.1 ( 2.4- 3.9) 3.0 ( 2.4- 3.8) ∼ ∼Mississippi 1.8 ( 1.2- 2.5) 1.8 ( 1.2- 2.8) ∼ ∼Tennessee 1.9 ( 1.5- 2.4) 1.8 ( 1.3- 2.3) ∼ ∼
West South Central 2.2 ( 1.9- 2.4) 2.1 ( 1.9- 2.4) 2.8 ( 2.1- 3.7) 1.7 ( 1.2- 2.3)
Arkansas 2.2 ( 1.5- 3.0) 2.2 ( 1.6- 3.1) ∼ ∼

Cancer Incidence and M
ortality, by U.S. C
ensus Region and D
i�ision, State, and Metropolitan A
rea
�3�
Table 2.27.1.2F: Urinary Bladder. Age-Adjusted Cancer Death Rates∗ and 95% Confidence Intervals, by U.S.Census Region and Division, State, and Race and Ethnicity, United States† (continued)
Females, 2004
Area All Races White Black Hispanic‡§
Louisiana 2.4 ( 1.8- 3.1) 2.3 ( 1.6- 3.1) 2.8 ( 1.7- 4.5) ∼Oklahoma 2.3 ( 1.7- 3.1) 2.5 ( 1.9- 3.4) ∼ ∼Texas 2.1 ( 1.8- 2.4) 2.0 ( 1.7- 2.3) 3.1 ( 2.1- 4.4) 1.7 ( 1.1- 2.3)
West 2.2 ( 2.0- 2.3) 2.2 ( 2.1- 2.4) 3.7 ( 2.7- 4.9) 1.2 ( 0.9- 1.6)
Mountain 2.4 ( 2.1- 2.7) 2.4 ( 2.1- 2.7) ∼ 1.9 ( 1.1- 3.0)
Arizona 2.5 ( 2.0- 3.1) 2.6 ( 2.0- 3.2) ∼ ∼Colorado 2.2 ( 1.6- 2.9) 2.2 ( 1.6- 3.0) ∼ ∼Idaho ∼ ∼ ∼ ∼Montana 2.7 ( 1.5- 4.5) 2.8 ( 1.6- 4.7) ∼ ∼Nevada 3.0 ( 2.0- 4.2) 2.7 ( 1.8- 4.0) ∼ ∼New Mexico 3.3 ( 2.3- 4.6) 3.6 ( 2.5- 5.0) ∼ ∼Utah ∼ ∼ ∼ ∼Wyoming ∼ ∼ ∼ ∼
Pacific 2.1 ( 1.9- 2.3) 2.2 ( 2.0- 2.4) 3.6 ( 2.5- 4.9) 1.0 ( 0.7- 1.5)
Alaska ∼ ∼ ∼ ∼California 2.1 ( 1.9- 2.3) 2.1 ( 1.9- 2.4) 3.8 ( 2.7- 5.2) 1.0 ( 0.7- 1.4)
Hawaii ∼ ∼ ∼ ∼Oregon 2.4 ( 1.8- 3.2) 2.5 ( 1.9- 3.3) ∼ ∼Washington 2.2 ( 1.7- 2.8) 2.2 ( 1.7- 2.8) ∼ ∼
∗ Rates are per 100,000 persons and are age-adjusted to the 2000 U.S. standard population (19 age groups - Census P25-1130).† Data are from the National Vital Statistics System (NVSS).‡ Data for specified racial or ethnic populations other than white and black should be interpreted with caution. See Technical Notes.
§ Hispanic origin is not mutually exclusive from race categories (white, black).
∼ Rates are suppressed if fewer than 16 cases were reported in a specific category (area, race, ethnicity).
Note: U.S. rates are as presented in Table 1.1.1.2F.


State and Metropolitan-Area Incidence Rates and State Death Rates
for the Most Common Cancers
Figure 3.1.M1
Consecutive numbering of states in alphabetical order beginning with the United States
M = malesF = females
1 = incidence rate2 = death rate
3 = figures that display data for statesFigures 1 and 2 are maps of the United States.


Figures 3.�.M�–3.��.F�
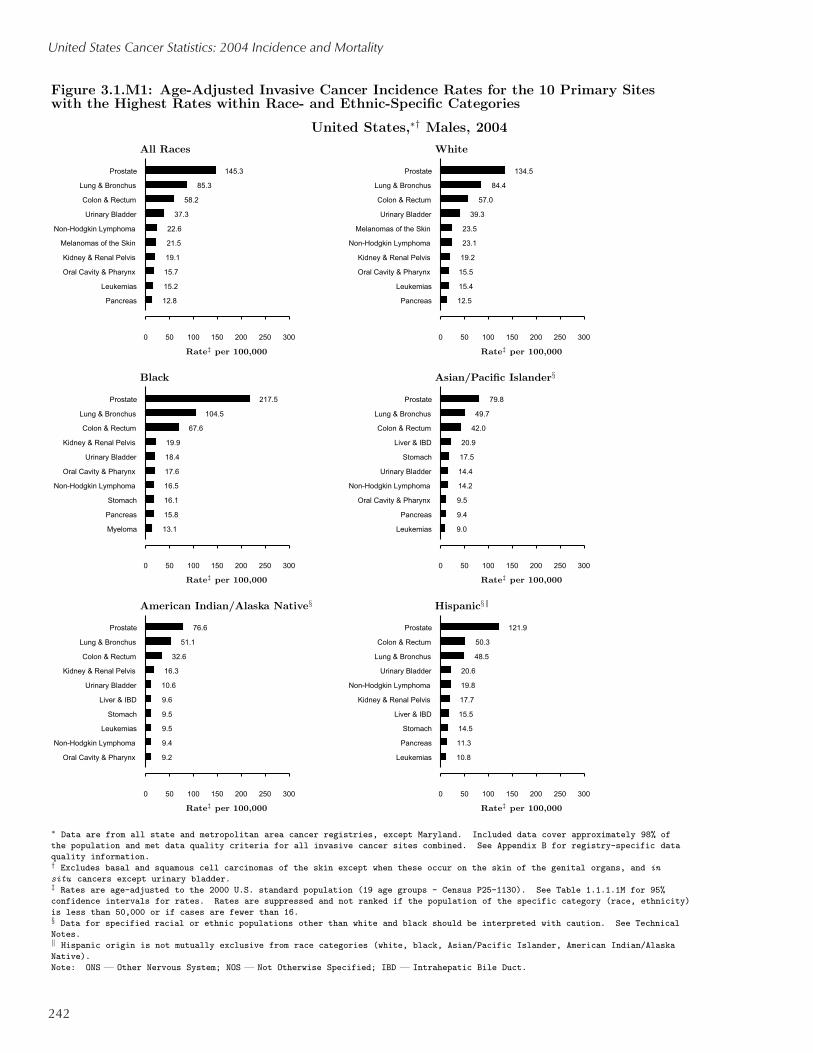
United States Cancer Statistics: 2004 Incidence and Mortality
���
Figure 3.1.M1: Age-Adjusted Invasive Cancer Incidence Rates for the 10 Primary Siteswith the Highest Rates within Race- and Ethnic-Specific Categories
United States,∗† Males, 2004
Pancreas
Leukemias
Oral Cavity & Pharynx
Kidney & Renal Pelvis
Melanomas of the Skin
Non-Hodgkin Lymphoma
Urinary Bladder
Colon & Rectum
Lung & Bronchus
Prostate
0 50 100 150 200 250 300
12.8
15.2
15.7
19.1
21.5
22.6
37.3
58.2
85.3
145.3
Pancreas
Leukemias
Oral Cavity & Pharynx
Kidney & Renal Pelvis
Non-Hodgkin Lymphoma
Melanomas of the Skin
Urinary Bladder
Colon & Rectum
Lung & Bronchus
Prostate
0 50 100 150 200 250 300
12.5
15.4
15.5
19.2
23.1
23.5
39.3
57.0
84.4
134.5
Myeloma
Pancreas
Stomach
Non-Hodgkin Lymphoma
Oral Cavity & Pharynx
Urinary Bladder
Kidney & Renal Pelvis
Colon & Rectum
Lung & Bronchus
Prostate
0 50 100 150 200 250 300
13.1
15.8
16.1
16.5
17.6
18.4
19.9
67.6
104.5
217.5
Leukemias
Pancreas
Oral Cavity & Pharynx
Non-Hodgkin Lymphoma
Urinary Bladder
Stomach
Liver & IBD
Colon & Rectum
Lung & Bronchus
Prostate
0 50 100 150 200 250 300
9.0
9.4
9.5
14.2
14.4
17.5
20.9
42.0
49.7
79.8
Oral Cavity & Pharynx
Non-Hodgkin Lymphoma
Leukemias
Stomach
Liver & IBD
Urinary Bladder
Kidney & Renal Pelvis
Colon & Rectum
Lung & Bronchus
Prostate
0 50 100 150 200 250 300
9.2
9.4
9.5
9.5
9.6
10.6
16.3
32.6
51.1
76.6
Leukemias
Pancreas
Stomach
Liver & IBD
Kidney & Renal Pelvis
Non-Hodgkin Lymphoma
Urinary Bladder
Lung & Bronchus
Colon & Rectum
Prostate
0 50 100 150 200 250 300
10.8
11.3
14.5
15.5
17.7
19.8
20.6
48.5
50.3
121.9
Rate‡ per 100,000Rate‡ per 100,000
Rate‡ per 100,000Rate‡ per 100,000
Rate‡ per 100,000Rate‡ per 100,000
All Races White
Black Asian/Pacific Islander§
American Indian/Alaska Native§ Hispanic§�
∗ Data are from all state and metropolitan area cancer registries, except Maryland. Included data cover approximately 98% of
the population and met data quality criteria for all invasive cancer sites combined. See Appendix B for registry-specific data
quality information.† Excludes basal and squamous cell carcinomas of the skin except when these occur on the skin of the genital organs, and in
situ cancers except urinary bladder.‡ Rates are age-adjusted to the 2000 U.S. standard population (19 age groups - Census P25-1130). See Table 1.1.1.1M for 95%
confidence intervals for rates. Rates are suppressed and not ranked if the population of the specific category (race, ethnicity)
is less than 50,000 or if cases are fewer than 16.§ Data for specified racial or ethnic populations other than white and black should be interpreted with caution. See Technical
Notes.� Hispanic origin is not mutually exclusive from race categories (white, black, Asian/Pacific Islander, American Indian/Alaska
Native).
Note: ONS — Other Nervous System; NOS — Not Otherwise Specified; IBD — Intrahepatic Bile Duct.

State and Metropolitan-Area Incidence Rates and State Death Rates for the Most Common Cancers
��3
Figure 3.1.M2: Age-Adjusted Cancer Death Rates for the 10 Primary Sites with theHighest Rates within Race- and Ethnic-Specific Categories
United States,∗ Males, 2004
Kidney & Renal Pelvis
Liver & IBD
Urinary Bladder
Esophagus
Non-Hodgkin Lymphoma
Leukemias
Pancreas
Colon & Rectum
Prostate
Lung & Bronchus
0 50 100 150
5.9
7.4
7.6
7.7
8.8
9.7
12.3
21.6
25.4
70.3
Kidney & Renal Pelvis
Liver & IBD
Esophagus
Urinary Bladder
Non-Hodgkin Lymphoma
Leukemias
Pancreas
Colon & Rectum
Prostate
Lung & Bronchus
0 50 100 150
6.1
6.7
7.8
8.0
9.2
9.9
12.2
21.1
23.4
69.6
Oral Cavity & Pharynx
Myeloma
Leukemias
Esophagus
Liver & IBD
Stomach
Pancreas
Colon & Rectum
Prostate
Lung & Bronchus
0 50 100 150
6.9
8.2
8.8
9.1
10.7
11.2
15.6
30.2
56.1
90.6
Oral Cavity & Pharynx
Esophagus
Leukemias
Non-Hodgkin Lymphoma
Pancreas
Stomach
Prostate
Colon & Rectum
Liver & IBD
Lung & Bronchus
0 50 100 150
2.9
3.6
5.4
5.6
8.5
9.5
11.4
13.5
15.1
37.4
Non-Hodgkin Lymphoma
Leukemias
Esophagus
Stomach
Kidney & Renal Pelvis
Pancreas
Liver & IBD
Colon & Rectum
Prostate
Lung & Bronchus
0 50 100 150
4.6
4.7
5.2
6.1
6.8
8.0
8.4
16.1
16.5
45.2
Esophagus
Kidney & Renal Pelvis
Leukemias
Non-Hodgkin Lymphoma
Stomach
Pancreas
Liver & IBD
Colon & Rectum
Prostate
Lung & Bronchus
0 50 100 150
4.0
5.6
6.0
6.5
8.8
9.2
11.1
15.9
19.3
33.7
Rate† per 100,000Rate† per 100,000
Rate† per 100,000Rate† per 100,000
Rate† per 100,000Rate† per 100,000
All Races White
Black Asian/Pacific Islander‡
American Indian/Alaska Native‡ Hispanic‡§
∗ Data are from the National Vital Statistics System (NVSS).† Rates are age-adjusted to the 2000 U.S. standard population (19 age groups - Census P25-1130). See Table 1.1.1.2M for 95%
confidence intervals for rates. Rates are suppressed and not ranked if the population of the specific category (race, ethnicity)
is less than 50,000 or if deaths are fewer than 16.‡ Data for specified racial or ethnic populations other than white and black should be interpreted with caution. See Technical
Notes.§ Hispanic origin is not mutually exclusive from race categories (white, black, Asian/Pacific Islander, American Indian/Alaska
Native).
Note: ONS — Other Nervous System; NOS — Not Otherwise Specified; IBD — Intrahepatic Bile Duct.

United States Cancer Statistics: 2004 Incidence and Mortality
���
Figure 3.1.F1: Age-Adjusted Invasive Cancer Incidence Rates for the 10 Primary Siteswith the Highest Rates within Race- and Ethnic-Specific Categories
United States,∗† Females, 2004
Pancreas
Kidney & Renal Pelvis
Ovary
Thyroid
Melanomas of the Skin
Non-Hodgkin Lymphoma
Corpus & Uterus, NOS
Colon & Rectum
Lung & Bronchus
Breast
0 50 100 150 200 250 300
9.7
10.0
12.5
13.8
14.0
16.1
23.1
42.7
54.2
117.7
Urinary Bladder
Kidney & Renal Pelvis
Ovary
Thyroid
Melanomas of the Skin
Non-Hodgkin Lymphoma
Corpus & Uterus, NOS
Colon & Rectum
Lung & Bronchus
Breast
0 50 100 150 200 250 300
10.0
10.2
13.0
14.4
15.6
16.5
23.4
41.6
55.5
118.6
Myeloma
Ovary
Kidney & Renal Pelvis
Cervix Uteri
Non-Hodgkin Lymphoma
Pancreas
Corpus & Uterus, NOS
Lung & Bronchus
Colon & Rectum
Breast
0 50 100 150 200 250 300
8.9
9.3
9.9
10.8
11.5
12.9
20.4
50.4
50.6
110.3
Liver & IBD
Pancreas
Ovary
Stomach
Non-Hodgkin Lymphoma
Thyroid
Corpus & Uterus, NOS
Lung & Bronchus
Colon & Rectum
Breast
0 50 100 150 200 250 300
7.5
7.6
8.7
9.3
10.1
13.4
15.6
26.9
32.1
79.7
Cervix Uteri
Ovary
Pancreas
Thyroid
Non-Hodgkin Lymphoma
Kidney & Renal Pelvis
Corpus & Uterus, NOS
Colon & Rectum
Lung & Bronchus
Breast
0 50 100 150 200 250 300
6.4
6.7
7.8
8.1
8.6
10.5
12.4
28.7
35.3
59.5
Pancreas
Kidney & Renal Pelvis
Ovary
Cervix Uteri
Thyroid
Non-Hodgkin Lymphoma
Corpus & Uterus, NOS
Lung & Bronchus
Colon & Rectum
Breast
0 50 100 150 200 250 300
9.4
10.1
11.5
12.2
13.8
14.2
18.8
26.7
34.2
86.2
Rate‡ per 100,000Rate‡ per 100,000
Rate‡ per 100,000Rate‡ per 100,000
Rate‡ per 100,000Rate‡ per 100,000
All Races White
Black Asian/Pacific Islander§
American Indian/Alaska Native§ Hispanic§�
∗ Data are from all state and metropolitan area cancer registries, except Maryland. Included data cover approximately 98% of
the population and met data quality criteria for all invasive cancer sites combined. See Appendix B for registry-specific data
quality information.† Excludes basal and squamous cell carcinomas of the skin except when these occur on the skin of the genital organs, and in
situ cancers except urinary bladder.‡ Rates are age-adjusted to the 2000 U.S. standard population (19 age groups - Census P25-1130). See Table 1.1.1.1F for 95%
confidence intervals for rates. Rates are suppressed and not ranked if the population of the specific category (race, ethnicity)
is less than 50,000 or if cases are fewer than 16.§ Data for specified racial or ethnic populations other than white and black should be interpreted with caution. See Technical
Notes.� Hispanic origin is not mutually exclusive from race categories (white, black, Asian/Pacific Islander, American Indian/Alaska
Native).
Note: ONS — Other Nervous System; NOS — Not Otherwise Specified; IBD — Intrahepatic Bile Duct. Ovary excludes cancers newly
classified as borderline according to ICD-O-3, beginning with 2001 diagnoses. See Technical Notes.

State and Metropolitan-Area Incidence Rates and State Death Rates for the Most Common Cancers
���
Figure 3.1.F2: Age-Adjusted Cancer Death Rates for the 10 Primary Sites with theHighest Rates within Race- and Ethnic-Specific Categories
United States,∗ Females, 2004
Liver & IBD
Brain & ONS
Corpus & Uterus, NOS
Leukemias
Non-Hodgkin Lymphoma
Ovary
Pancreas
Colon & Rectum
Breast
Lung & Bronchus
0 50 100 150
3.2
3.5
4.1
5.5
5.7
8.8
9.2
15.2
24.4
40.9
Liver & IBD
Brain & ONS
Corpus & Uterus, NOS
Leukemias
Non-Hodgkin Lymphoma
Pancreas
Ovary
Colon & Rectum
Breast
Lung & Bronchus
0 50 100 150
3.0
3.8
3.9
5.6
5.9
9.0
9.1
14.7
23.8
41.9
Cervix Uteri
Stomach
Leukemias
Myeloma
Corpus & Uterus, NOS
Ovary
Pancreas
Colon & Rectum
Breast
Lung & Bronchus
0 50 100 150
4.5
5.2
5.3
6.0
7.0
7.6
12.1
21.2
32.3
40.0
Corpus & Uterus, NOS
Leukemias
Non-Hodgkin Lymphoma
Ovary
Stomach
Liver & IBD
Pancreas
Colon & Rectum
Breast
Lung & Bronchus
0 50 100 150
2.4
2.7
3.6
4.6
5.2
6.3
7.1
9.6
12.6
18.1
Non-Hodgkin Lymphoma
Stomach
Kidney & Renal Pelvis
Leukemias
Ovary
Pancreas
Liver & IBD
Colon & Rectum
Breast
Lung & Bronchus
0 50 100 150
2.8
2.9
3.1
3.4
5.1
6.5
7.0
9.7
15.0
30.2
Cervix Uteri
Leukemias
Non-Hodgkin Lymphoma
Liver & IBD
Stomach
Ovary
Pancreas
Colon & Rectum
Lung & Bronchus
Breast
0 50 100 150
3.1
3.7
4.2
4.9
5.1
6.0
7.4
10.3
14.4
15.7
Rate† per 100,000Rate† per 100,000
Rate† per 100,000Rate† per 100,000
Rate† per 100,000Rate† per 100,000
All Races White
Black Asian/Pacific Islander‡
American Indian/Alaska Native‡ Hispanic‡§
∗ Data are from the National Vital Statistics System (NVSS).† Rates are age-adjusted to the 2000 U.S. standard population (19 age groups - Census P25-1130). See Table 1.1.1.2F for 95%
confidence intervals for rates. Rates are suppressed and not ranked if the population of the specific category (race, ethnicity)
is less than 50,000 or if deaths are fewer than 16.‡ Data for specified racial or ethnic populations other than white and black should be interpreted with caution. See Technical
Notes.§ Hispanic origin is not mutually exclusive from race categories (white, black, Asian/Pacific Islander, American Indian/Alaska
Native).
Note: ONS — Other Nervous System; NOS — Not Otherwise Specified; IBD — Intrahepatic Bile Duct.

United States Cancer Statistics: 2004 Incidence and Mortality
���
Figure 3.2.M1: Age-Adjusted Invasive Cancer Incidence Rates for the 10 Primary Siteswith the Highest Rates within Race- and Ethnic-Specific Categories
Alabama,∗† Males, 2004
Pancreas
Leukemias
Oral Cavity & Pharynx
Melanomas of the Skin
Kidney & Renal Pelvis
Non-Hodgkin Lymphoma
Urinary Bladder
Colon & Rectum
Lung & Bronchus
Prostate
0 50 100 150 200 250 300
12.4
13.9
18.2
19.1
19.8
21.4
29.3
61.8
110.4
149.5
Pancreas
Leukemias
Oral Cavity & Pharynx
Kidney & Renal Pelvis
Non-Hodgkin Lymphoma
Melanomas of the Skin
Urinary Bladder
Colon & Rectum
Lung & Bronchus
Prostate
0 50 100 150 200 250 300
12.6
14.8
19.0
19.9
23.2
23.2
32.8
58.7
109.3
129.2
Non-Hodgkin Lymphoma
Urinary Bladder
Larynx
Oral Cavity & Pharynx
Myeloma
Stomach
Kidney & Renal Pelvis
Colon & Rectum
Lung & Bronchus
Prostate
0 50 100 150 200 250 300
13.4
13.7
13.9
14.7
15.3
17.7
19.3
74.3
117.7
224.8
0 50 100 150 200 250 300
Incidence rates were notranked when the populationsize was less than 50,000or case counts were fewerthan 16 in each of the sitecategories.
0 50 100 150 200 250 300
Incidence rates were notranked when the populationsize was less than 50,000or case counts were fewerthan 16 in each of the sitecategories.
Prostate
0 50 100 150 200 250 300
108.1
Rate‡ per 100,000Rate‡ per 100,000
Rate‡ per 100,000Rate‡ per 100,000
Rate‡ per 100,000Rate‡ per 100,000
All Races White
Black Asian/Pacific Islander§
American Indian/Alaska Native§ Hispanic§�
∗ Data are from selected state and metropolitan area cancer registries that meet the data quality criteria for all invasive
cancer sites combined. See Appendix B for data quality criteria and registry-specific data quality information.† Excludes basal and squamous cell carcinomas of the skin except when these occur on the skin of the genital organs, and in
situ cancers except urinary bladder.‡ Rates are age-adjusted to the 2000 U.S. standard population (19 age groups - Census P25-1130). See Table 2.1.1.1M-2.27.1.1M
and Appendix F.1-F.2 for 95% confidence intervals for rates. Rates are suppressed and not ranked if the population of a specific
category (race, ethnicity) is less than 50,000 or if cases are fewer than 16.§ Data for specified racial or ethnic populations other than white and black should be interpreted with caution. See Technical
Notes.� Hispanic origin is not mutually exclusive from race categories (white, black, Asian/Pacific Islander, American Indian/Alaska
Native).
Note: ONS — Other Nervous System; NOS — Not Otherwise Specified; IBD — Intrahepatic Bile Duct.

State and Metropolitan-Area Incidence Rates and State Death Rates for the Most Common Cancers
���
Figure 3.2.M2: Age-Adjusted Cancer Death Rates for the 10 Primary Sites with theHighest Rates within Race- and Ethnic-Specific Categories
Alabama,∗ Males, 2004
Stomach
Urinary Bladder
Liver & IBD
Esophagus
Non-Hodgkin Lymphoma
Leukemias
Pancreas
Colon & Rectum
Prostate
Lung & Bronchus
0 50 100 150
6.0
6.7
7.5
8.1
8.6
11.1
11.4
24.5
33.0
91.8
Brain & ONS
Liver & IBD
Esophagus
Urinary Bladder
Non-Hodgkin Lymphoma
Pancreas
Leukemias
Colon & Rectum
Prostate
Lung & Bronchus
0 50 100 150
6.2
7.0
7.6
7.6
9.4
11.9
12.1
22.0
25.0
91.5
Leukemias
Oral Cavity & Pharynx
Liver & IBD
Myeloma
Pancreas
Esophagus
Stomach
Colon & Rectum
Prostate
Lung & Bronchus
0 50 100 150
7.7
8.0
8.5
9.3
9.7
10.3
12.4
37.2
71.8
95.0
0 50 100 150
Death rates were notranked when the populationsize was less than 50,000or case counts were fewerthan 16 in each of the sitecategories.
0 50 100 150
Death rates were notranked when the populationsize was less than 50,000or case counts were fewerthan 16 in each of the sitecategories.
0 50 100 150
Death rates were notranked when the populationsize was less than 50,000or case counts were fewerthan 16 in each of the sitecategories.
Rate† per 100,000Rate† per 100,000
Rate† per 100,000Rate† per 100,000
Rate† per 100,000Rate† per 100,000
All Races White
Black Asian/Pacific Islander‡
American Indian/Alaska Native‡ Hispanic‡§
∗ Data are from the National Vital Statistics System (NVSS).† Rates are age-adjusted to the 2000 U.S. standard population (19 age groups - Census P25-1130). See Table 2.1.1.2M-2.27.1.2M
and Appendix F.1-F.2 for 95% confidence intervals for rates. Rates are suppressed and not ranked if the population of a specific
category (race, ethnicity) is less than 50,000 or if deaths are fewer than 16.‡ Data for specified racial or ethnic populations other than white and black should be interpreted with caution. See Technical
Notes.§ Hispanic origin is not mutually exclusive from race categories (white, black, Asian/Pacific Islander, American Indian/Alaska
Native).
Note: ONS — Other Nervous System; NOS — Not Otherwise Specified; IBD — Intrahepatic Bile Duct.

United States Cancer Statistics: 2004 Incidence and Mortality
���
Figure 3.2.F1: Age-Adjusted Invasive Cancer Incidence Rates for the 10 Primary Siteswith the Highest Rates within Race- and Ethnic-Specific Categories
Alabama,∗† Females, 2004
Pancreas
Thyroid
Kidney & Renal Pelvis
Melanomas of the Skin
Ovary
Non-Hodgkin Lymphoma
Corpus & Uterus, NOS
Colon & Rectum
Lung & Bronchus
Breast
0 50 100 150 200 250 300
9.6
10.1
10.4
12.0
12.7
14.8
16.8
42.1
52.8
109.1
Pancreas
Kidney & Renal Pelvis
Thyroid
Ovary
Melanomas of the Skin
Non-Hodgkin Lymphoma
Corpus & Uterus, NOS
Colon & Rectum
Lung & Bronchus
Breast
0 50 100 150 200 250 300
9.3
10.5
11.1
13.4
15.6
16.4
16.4
39.7
56.3
109.8
Non-Hodgkin Lymphoma
Myeloma
Ovary
Kidney & Renal Pelvis
Pancreas
Cervix Uteri
Corpus & Uterus, NOS
Lung & Bronchus
Colon & Rectum
Breast
0 50 100 150 200 250 300
8.6
9.7
10.2
10.7
11.3
12.2
19.6
41.1
51.9
103.9
0 50 100 150 200 250 300
Incidence rates were notranked when the populationsize was less than 50,000or case counts were fewerthan 16 in each of the sitecategories.
0 50 100 150 200 250 300
Incidence rates were notranked when the populationsize was less than 50,000or case counts were fewerthan 16 in each of the sitecategories.
0 50 100 150 200 250 300
Incidence rates were notranked when the populationsize was less than 50,000or case counts were fewerthan 16 in each of the sitecategories.
Rate‡ per 100,000Rate‡ per 100,000
Rate‡ per 100,000Rate‡ per 100,000
Rate‡ per 100,000Rate‡ per 100,000
All Races White
Black Asian/Pacific Islander§
American Indian/Alaska Native§ Hispanic§�
∗ Data are from selected state and metropolitan area cancer registries that meet the data quality criteria for all invasive
cancer sites combined. See Appendix B for data quality criteria and registry-specific data quality information.† Excludes basal and squamous cell carcinomas of the skin except when these occur on the skin of the genital organs, and in
situ cancers except urinary bladder.‡ Rates are age-adjusted to the 2000 U.S. standard population (19 age groups - Census P25-1130). See Table 2.1.1.1F-2.27.1.1F
and Appendix F.1-F.2 for 95% confidence intervals for rates. Rates are suppressed and not ranked if the population of a specific
category (race, ethnicity) is less than 50,000 or if cases are fewer than 16.§ Data for specified racial or ethnic populations other than white and black should be interpreted with caution. See Technical
Notes.� Hispanic origin is not mutually exclusive from race categories (white, black, Asian/Pacific Islander, American Indian/Alaska
Native).
Note: ONS — Other Nervous System; NOS — Not Otherwise Specified; IBD — Intrahepatic Bile Duct. Ovary excludes cancers newly
classified as borderline according to ICD-O-3, beginning with 2001 diagnoses. See Technical Notes.

State and Metropolitan-Area Incidence Rates and State Death Rates for the Most Common Cancers
���
Figure 3.2.F2: Age-Adjusted Cancer Death Rates for the 10 Primary Sites with theHighest Rates within Race- and Ethnic-Specific Categories
Alabama,∗ Females, 2004
Corpus & Uterus, NOS
Liver & IBD
Myeloma
Leukemias
Non-Hodgkin Lymphoma
Pancreas
Ovary
Colon & Rectum
Breast
Lung & Bronchus
0 50 100 150
3.7
3.8
4.4
5.7
6.2
9.5
9.9
15.2
24.1
42.3
Myeloma
Liver & IBD
Brain & ONS
Leukemias
Non-Hodgkin Lymphoma
Pancreas
Ovary
Colon & Rectum
Breast
Lung & Bronchus
0 50 100 150
3.5
3.8
4.2
5.7
6.8
9.1
10.6
13.4
23.1
45.3
Non-Hodgkin Lymphoma
Corpus & Uterus, NOS
Cervix Uteri
Leukemias
Ovary
Myeloma
Pancreas
Colon & Rectum
Breast
Lung & Bronchus
0 50 100 150
4.0
5.2
5.5
5.7
7.3
8.1
11.4
22.4
27.4
32.9
0 50 100 150
Death rates were notranked when the populationsize was less than 50,000or case counts were fewerthan 16 in each of the sitecategories.
0 50 100 150
Death rates were notranked when the populationsize was less than 50,000or case counts were fewerthan 16 in each of the sitecategories.
0 50 100 150
Death rates were notranked when the populationsize was less than 50,000or case counts were fewerthan 16 in each of the sitecategories.
Rate† per 100,000Rate† per 100,000
Rate† per 100,000Rate† per 100,000
Rate† per 100,000Rate† per 100,000
All Races White
Black Asian/Pacific Islander‡
American Indian/Alaska Native‡ Hispanic‡§
∗ Data are from the National Vital Statistics System (NVSS).† Rates are age-adjusted to the 2000 U.S. standard population (19 age groups - Census P25-1130). See Table 2.1.1.2F-2.27.1.2F
and Appendix F.1-F.2 for 95% confidence intervals for rates. Rates are suppressed and not ranked if the population of a specific
category (race, ethnicity) is less than 50,000 or if deaths are fewer than 16.‡ Data for specified racial or ethnic populations other than white and black should be interpreted with caution. See Technical
Notes.§ Hispanic origin is not mutually exclusive from race categories (white, black, Asian/Pacific Islander, American Indian/Alaska
Native).
Note: ONS — Other Nervous System; NOS — Not Otherwise Specified; IBD — Intrahepatic Bile Duct.

United States Cancer Statistics: 2004 Incidence and Mortality
��0
Figure 3.3.M1: Age-Adjusted Invasive Cancer Incidence Rates for the 10 Primary Siteswith the Highest Rates within Race- and Ethnic-Specific Categories
Alaska,∗† Males, 2004
Stomach
Oral Cavity & Pharynx
Pancreas
Leukemias
Non-Hodgkin Lymphoma
Kidney & Renal Pelvis
Urinary Bladder
Colon & Rectum
Lung & Bronchus
Prostate
0 50 100 150 200 250 300
11.8
13.5
13.6
14.7
20.4
20.7
40.3
60.2
84.1
140.4
Melanomas of the Skin
Pancreas
Leukemias
Oral Cavity & Pharynx
Kidney & Renal Pelvis
Non-Hodgkin Lymphoma
Urinary Bladder
Colon & Rectum
Lung & Bronchus
Prostate
0 50 100 150 200 250 300
11.5
12.1
15.0
15.9
19.8
20.8
44.6
57.6
77.2
148.6
0 50 100 150 200 250 300
Incidence rates were notranked when the populationsize was less than 50,000or case counts were fewerthan 16 in each of the sitecategories.
0 50 100 150 200 250 300
Incidence rates were notranked when the populationsize was less than 50,000or case counts were fewerthan 16 in each of the sitecategories.
Prostate
Colon & Rectum
Lung & Bronchus
0 50 100 150 200 250 300
71.5
85.8
123.5
0 50 100 150 200 250 300
Incidence rates were notranked when the populationsize was less than 50,000or case counts were fewerthan 16 in each of the sitecategories.
Rate‡ per 100,000Rate‡ per 100,000
Rate‡ per 100,000Rate‡ per 100,000
Rate‡ per 100,000Rate‡ per 100,000
All Races White
Black Asian/Pacific Islander§
American Indian/Alaska Native§ Hispanic§�
∗ Data are from selected state and metropolitan area cancer registries that meet the data quality criteria for all invasive
cancer sites combined. See Appendix B for data quality criteria and registry-specific data quality information.† Excludes basal and squamous cell carcinomas of the skin except when these occur on the skin of the genital organs, and in
situ cancers except urinary bladder.‡ Rates are age-adjusted to the 2000 U.S. standard population (19 age groups - Census P25-1130). See Table 2.1.1.1M-2.27.1.1M
and Appendix F.1-F.2 for 95% confidence intervals for rates. Rates are suppressed and not ranked if the population of a specific
category (race, ethnicity) is less than 50,000 or if cases are fewer than 16.§ Data for specified racial or ethnic populations other than white and black should be interpreted with caution. See Technical
Notes.� Hispanic origin is not mutually exclusive from race categories (white, black, Asian/Pacific Islander, American Indian/Alaska
Native).
Note: ONS — Other Nervous System; NOS — Not Otherwise Specified; IBD — Intrahepatic Bile Duct.

State and Metropolitan-Area Incidence Rates and State Death Rates for the Most Common Cancers
���
Figure 3.3.M2: Age-Adjusted Cancer Death Rates for the 10 Primary Sites with theHighest Rates within Race- and Ethnic-Specific Categories
Alaska,∗ Males, 2004
Brain & ONS
Leukemias
Liver & IBD
Pancreas
Colon & Rectum
Prostate
Lung & Bronchus
0 50 100 150
6.4
7.9
9.7
13.6
20.7
26.2
66.8
Brain & ONS
Pancreas
Colon & Rectum
Prostate
Lung & Bronchus
0 50 100 150
8.1
12.1
20.7
25.8
60.8
0 50 100 150
Death rates were notranked when the populationsize was less than 50,000or case counts were fewerthan 16 in each of the sitecategories.
0 50 100 150
Death rates were notranked when the populationsize was less than 50,000or case counts were fewerthan 16 in each of the sitecategories.
Lung & Bronchus
0 50 100 150
92.5
0 50 100 150
Death rates were notranked when the populationsize was less than 50,000or case counts were fewerthan 16 in each of the sitecategories.
Rate† per 100,000Rate† per 100,000
Rate† per 100,000Rate† per 100,000
Rate† per 100,000Rate† per 100,000
All Races White
Black Asian/Pacific Islander‡
American Indian/Alaska Native‡ Hispanic‡§
∗ Data are from the National Vital Statistics System (NVSS).† Rates are age-adjusted to the 2000 U.S. standard population (19 age groups - Census P25-1130). See Table 2.1.1.2M-2.27.1.2M
and Appendix F.1-F.2 for 95% confidence intervals for rates. Rates are suppressed and not ranked if the population of a specific
category (race, ethnicity) is less than 50,000 or if deaths are fewer than 16.‡ Data for specified racial or ethnic populations other than white and black should be interpreted with caution. See Technical
Notes.§ Hispanic origin is not mutually exclusive from race categories (white, black, Asian/Pacific Islander, American Indian/Alaska
Native).
Note: ONS — Other Nervous System; NOS — Not Otherwise Specified; IBD — Intrahepatic Bile Duct.

United States Cancer Statistics: 2004 Incidence and Mortality
���
Figure 3.3.F1: Age-Adjusted Invasive Cancer Incidence Rates for the 10 Primary Siteswith the Highest Rates within Race- and Ethnic-Specific Categories
Alaska,∗† Females, 2004
Pancreas
Ovary
Melanomas of the Skin
Kidney & Renal Pelvis
Non-Hodgkin Lymphoma
Thyroid
Corpus & Uterus, NOS
Colon & Rectum
Lung & Bronchus
Breast
0 50 100 150 200 250 300
7.8
9.6
10.0
10.0
12.5
18.9
22.9
45.5
59.5
113.1
Kidney & Renal Pelvis
Ovary
Melanomas of the Skin
Non-Hodgkin Lymphoma
Thyroid
Corpus & Uterus, NOS
Colon & Rectum
Lung & Bronchus
Breast
0 50 100 150 200 250 300
8.7
10.2
12.5
13.5
20.0
26.6
31.7
52.6
108.9
0 50 100 150 200 250 300
Incidence rates were notranked when the populationsize was less than 50,000or case counts were fewerthan 16 in each of the sitecategories.
0 50 100 150 200 250 300
Incidence rates were notranked when the populationsize was less than 50,000or case counts were fewerthan 16 in each of the sitecategories.
Lung & Bronchus
Colon & Rectum
Breast
0 50 100 150 200 250 300
102.9
119.2
145.9
0 50 100 150 200 250 300
Incidence rates were notranked when the populationsize was less than 50,000or case counts were fewerthan 16 in each of the sitecategories.
Rate‡ per 100,000Rate‡ per 100,000
Rate‡ per 100,000Rate‡ per 100,000
Rate‡ per 100,000Rate‡ per 100,000
All Races White
Black Asian/Pacific Islander§
American Indian/Alaska Native§ Hispanic§�
∗ Data are from selected state and metropolitan area cancer registries that meet the data quality criteria for all invasive
cancer sites combined. See Appendix B for data quality criteria and registry-specific data quality information.† Excludes basal and squamous cell carcinomas of the skin except when these occur on the skin of the genital organs, and in
situ cancers except urinary bladder.‡ Rates are age-adjusted to the 2000 U.S. standard population (19 age groups - Census P25-1130). See Table 2.1.1.1F-2.27.1.1F
and Appendix F.1-F.2 for 95% confidence intervals for rates. Rates are suppressed and not ranked if the population of a specific
category (race, ethnicity) is less than 50,000 or if cases are fewer than 16.§ Data for specified racial or ethnic populations other than white and black should be interpreted with caution. See Technical
Notes.� Hispanic origin is not mutually exclusive from race categories (white, black, Asian/Pacific Islander, American Indian/Alaska
Native).
Note: ONS — Other Nervous System; NOS — Not Otherwise Specified; IBD — Intrahepatic Bile Duct. Ovary excludes cancers newly
classified as borderline according to ICD-O-3, beginning with 2001 diagnoses. See Technical Notes.

State and Metropolitan-Area Incidence Rates and State Death Rates for the Most Common Cancers
��3
Figure 3.3.F2: Age-Adjusted Cancer Death Rates for the 10 Primary Sites with theHighest Rates within Race- and Ethnic-Specific Categories
Alaska,∗ Females, 2004
Pancreas
Colon & Rectum
Breast
Lung & Bronchus
0 50 100 150
7.7
12.7
18.7
50.5
Breast
Lung & Bronchus
0 50 100 150
16.3
52.7
0 50 100 150
Death rates were notranked when the populationsize was less than 50,000or case counts were fewerthan 16 in each of the sitecategories.
0 50 100 150
Death rates were notranked when the populationsize was less than 50,000or case counts were fewerthan 16 in each of the sitecategories.
Lung & Bronchus
0 50 100 150
57.4
0 50 100 150
Death rates were notranked when the populationsize was less than 50,000or case counts were fewerthan 16 in each of the sitecategories.
Rate† per 100,000Rate† per 100,000
Rate† per 100,000Rate† per 100,000
Rate† per 100,000Rate† per 100,000
All Races White
Black Asian/Pacific Islander‡
American Indian/Alaska Native‡ Hispanic‡§
∗ Data are from the National Vital Statistics System (NVSS).† Rates are age-adjusted to the 2000 U.S. standard population (19 age groups - Census P25-1130). See Table 2.1.1.2F-2.27.1.2F
and Appendix F.1-F.2 for 95% confidence intervals for rates. Rates are suppressed and not ranked if the population of a specific
category (race, ethnicity) is less than 50,000 or if deaths are fewer than 16.‡ Data for specified racial or ethnic populations other than white and black should be interpreted with caution. See Technical
Notes.§ Hispanic origin is not mutually exclusive from race categories (white, black, Asian/Pacific Islander, American Indian/Alaska
Native).
Note: ONS — Other Nervous System; NOS — Not Otherwise Specified; IBD — Intrahepatic Bile Duct.

United States Cancer Statistics: 2004 Incidence and Mortality
���
Figure 3.4.M1: Age-Adjusted Invasive Cancer Incidence Rates for the 10 Primary Siteswith the Highest Rates within Race- and Ethnic-Specific Categories
Arizona,∗† Males, 2004
Leukemias
Pancreas
Oral Cavity & Pharynx
Kidney & Renal Pelvis
Non-Hodgkin Lymphoma
Melanomas of the Skin
Urinary Bladder
Colon & Rectum
Lung & Bronchus
Prostate
0 50 100 150 200 250 300
9.9
10.4
12.6
16.0
18.6
19.4
34.2
46.5
66.9
109.7
Leukemias
Pancreas
Oral Cavity & Pharynx
Kidney & Renal Pelvis
Non-Hodgkin Lymphoma
Melanomas of the Skin
Urinary Bladder
Colon & Rectum
Lung & Bronchus
Prostate
0 50 100 150 200 250 300
9.8
10.5
12.4
15.5
18.5
18.9
35.3
46.7
67.8
105.0
Colon & Rectum
Lung & Bronchus
Prostate
0 50 100 150 200 250 300
33.2
79.4
169.6 Prostate
0 50 100 150 200 250 300
52.0
Kidney & Renal Pelvis
Prostate
0 50 100 150 200 250 300
27.9
46.4
Leukemias
Pancreas
Stomach
Non-Hodgkin Lymphoma
Kidney & Renal Pelvis
Liver & IBD
Urinary Bladder
Colon & Rectum
Lung & Bronchus
Prostate
0 50 100 150 200 250 300
9.1
10.5
12.7
17.2
17.2
18.3
18.5
47.0
49.5
81.1
Rate‡ per 100,000Rate‡ per 100,000
Rate‡ per 100,000Rate‡ per 100,000
Rate‡ per 100,000Rate‡ per 100,000
All Races White
Black Asian/Pacific Islander§
American Indian/Alaska Native§ Hispanic§�
∗ Data are from selected state and metropolitan area cancer registries that meet the data quality criteria for all invasive
cancer sites combined. See Appendix B for data quality criteria and registry-specific data quality information.† Excludes basal and squamous cell carcinomas of the skin except when these occur on the skin of the genital organs, and in
situ cancers except urinary bladder.‡ Rates are age-adjusted to the 2000 U.S. standard population (19 age groups - Census P25-1130). See Table 2.1.1.1M-2.27.1.1M
and Appendix F.1-F.2 for 95% confidence intervals for rates. Rates are suppressed and not ranked if the population of a specific
category (race, ethnicity) is less than 50,000 or if cases are fewer than 16.§ Data for specified racial or ethnic populations other than white and black should be interpreted with caution. See Technical
Notes.� Hispanic origin is not mutually exclusive from race categories (white, black, Asian/Pacific Islander, American Indian/Alaska
Native).
Note: ONS — Other Nervous System; NOS — Not Otherwise Specified; IBD — Intrahepatic Bile Duct.

State and Metropolitan-Area Incidence Rates and State Death Rates for the Most Common Cancers
���
Figure 3.4.M2: Age-Adjusted Cancer Death Rates for the 10 Primary Sites with theHighest Rates within Race- and Ethnic-Specific Categories
Arizona,∗ Males, 2004
Kidney & Renal Pelvis
Urinary Bladder
Esophagus
Liver & IBD
Non-Hodgkin Lymphoma
Leukemias
Pancreas
Colon & Rectum
Prostate
Lung & Bronchus
0 50 100 150
5.6
6.6
7.2
7.8
8.4
8.6
12.0
18.8
23.6
57.9
Kidney & Renal Pelvis
Urinary Bladder
Esophagus
Liver & IBD
Non-Hodgkin Lymphoma
Leukemias
Pancreas
Colon & Rectum
Prostate
Lung & Bronchus
0 50 100 150
5.7
6.9
7.5
7.7
8.7
8.8
12.1
18.7
23.2
59.1
Colon & Rectum
Prostate
Lung & Bronchus
0 50 100 150
37.6
49.2
67.6
0 50 100 150
Death rates were notranked when the populationsize was less than 50,000or case counts were fewerthan 16 in each of the sitecategories.
Lung & Bronchus
Prostate
0 50 100 150
24.8
26.4
Leukemias
Stomach
Kidney & Renal Pelvis
Pancreas
Non-Hodgkin Lymphoma
Colon & Rectum
Liver & IBD
Prostate
Lung & Bronchus
0 50 100 150
6.8
8.8
9.4
9.4
9.8
14.0
14.3
30.2
42.7
Rate† per 100,000Rate† per 100,000
Rate† per 100,000Rate† per 100,000
Rate† per 100,000Rate† per 100,000
All Races White
Black Asian/Pacific Islander‡
American Indian/Alaska Native‡ Hispanic‡§
∗ Data are from the National Vital Statistics System (NVSS).† Rates are age-adjusted to the 2000 U.S. standard population (19 age groups - Census P25-1130). See Table 2.1.1.2M-2.27.1.2M
and Appendix F.1-F.2 for 95% confidence intervals for rates. Rates are suppressed and not ranked if the population of a specific
category (race, ethnicity) is less than 50,000 or if deaths are fewer than 16.‡ Data for specified racial or ethnic populations other than white and black should be interpreted with caution. See Technical
Notes.§ Hispanic origin is not mutually exclusive from race categories (white, black, Asian/Pacific Islander, American Indian/Alaska
Native).
Note: ONS — Other Nervous System; NOS — Not Otherwise Specified; IBD — Intrahepatic Bile Duct.

United States Cancer Statistics: 2004 Incidence and Mortality
���
Figure 3.4.F1: Age-Adjusted Invasive Cancer Incidence Rates for the 10 Primary Siteswith the Highest Rates within Race- and Ethnic-Specific Categories
Arizona,∗† Females, 2004
Kidney & Renal Pelvis
Urinary Bladder
Melanomas of the Skin
Non-Hodgkin Lymphoma
Ovary
Thyroid
Corpus & Uterus, NOS
Colon & Rectum
Lung & Bronchus
Breast
0 50 100 150 200 250 300
8.7
8.8
10.0
12.0
12.1
16.3
18.6
33.7
46.5
102.9
Kidney & Renal Pelvis
Urinary Bladder
Melanomas of the Skin
Ovary
Non-Hodgkin Lymphoma
Thyroid
Corpus & Uterus, NOS
Colon & Rectum
Lung & Bronchus
Breast
0 50 100 150 200 250 300
8.7
9.1
9.4
12.3
12.4
16.4
18.4
33.5
47.3
104.1
Colon & Rectum
Lung & Bronchus
Breast
0 50 100 150 200 250 300
51.1
66.0
80.3 Breast
0 50 100 150 200 250 300
66.6
Corpus & Uterus, NOS
Breast
0 50 100 150 200 250 300
15.6
48.0
Non-Hodgkin Lymphoma
Stomach
Cervix Uteri
Ovary
Corpus & Uterus, NOS
Kidney & Renal Pelvis
Thyroid
Lung & Bronchus
Colon & Rectum
Breast
0 50 100 150 200 250 300
9.0
9.2
9.3
12.4
12.7
13.5
16.3
20.0
25.8
78.7
Rate‡ per 100,000Rate‡ per 100,000
Rate‡ per 100,000Rate‡ per 100,000
Rate‡ per 100,000Rate‡ per 100,000
All Races White
Black Asian/Pacific Islander§
American Indian/Alaska Native§ Hispanic§�
∗ Data are from selected state and metropolitan area cancer registries that meet the data quality criteria for all invasive
cancer sites combined. See Appendix B for data quality criteria and registry-specific data quality information.† Excludes basal and squamous cell carcinomas of the skin except when these occur on the skin of the genital organs, and in
situ cancers except urinary bladder.‡ Rates are age-adjusted to the 2000 U.S. standard population (19 age groups - Census P25-1130). See Table 2.1.1.1F-2.27.1.1F
and Appendix F.1-F.2 for 95% confidence intervals for rates. Rates are suppressed and not ranked if the population of a specific
category (race, ethnicity) is less than 50,000 or if cases are fewer than 16.§ Data for specified racial or ethnic populations other than white and black should be interpreted with caution. See Technical
Notes.� Hispanic origin is not mutually exclusive from race categories (white, black, Asian/Pacific Islander, American Indian/Alaska
Native).
Note: ONS — Other Nervous System; NOS — Not Otherwise Specified; IBD — Intrahepatic Bile Duct. Ovary excludes cancers newly
classified as borderline according to ICD-O-3, beginning with 2001 diagnoses. See Technical Notes.

State and Metropolitan-Area Incidence Rates and State Death Rates for the Most Common Cancers
���
Figure 3.4.F2: Age-Adjusted Cancer Death Rates for the 10 Primary Sites with theHighest Rates within Race- and Ethnic-Specific Categories
Arizona,∗ Females, 2004
Corpus & Uterus, NOS
Liver & IBD
Brain & ONS
Leukemias
Non-Hodgkin Lymphoma
Pancreas
Ovary
Colon & Rectum
Breast
Lung & Bronchus
0 50 100 150
3.1
3.2
3.6
4.5
5.1
7.7
9.1
12.5
21.9
37.0
Corpus & Uterus, NOS
Liver & IBD
Brain & ONS
Leukemias
Non-Hodgkin Lymphoma
Pancreas
Ovary
Colon & Rectum
Breast
Lung & Bronchus
0 50 100 150
2.9
2.9
3.9
4.6
5.3
7.6
9.1
12.7
22.0
38.0
Breast
Lung & Bronchus
0 50 100 150
27.4
44.3
0 50 100 150
Death rates were notranked when the populationsize was less than 50,000or case counts were fewerthan 16 in each of the sitecategories.
Breast
0 50 100 150
15.5
Brain & ONS
Non-Hodgkin Lymphoma
Cervix Uteri
Pancreas
Stomach
Colon & Rectum
Ovary
Lung & Bronchus
Breast
0 50 100 150
4.2
4.3
4.9
5.4
8.3
10.2
11.4
13.3
15.6
Rate† per 100,000Rate† per 100,000
Rate† per 100,000Rate† per 100,000
Rate† per 100,000Rate† per 100,000
All Races White
Black Asian/Pacific Islander‡
American Indian/Alaska Native‡ Hispanic‡§
∗ Data are from the National Vital Statistics System (NVSS).† Rates are age-adjusted to the 2000 U.S. standard population (19 age groups - Census P25-1130). See Table 2.1.1.2F-2.27.1.2F
and Appendix F.1-F.2 for 95% confidence intervals for rates. Rates are suppressed and not ranked if the population of a specific
category (race, ethnicity) is less than 50,000 or if deaths are fewer than 16.‡ Data for specified racial or ethnic populations other than white and black should be interpreted with caution. See Technical
Notes.§ Hispanic origin is not mutually exclusive from race categories (white, black, Asian/Pacific Islander, American Indian/Alaska
Native).
Note: ONS — Other Nervous System; NOS — Not Otherwise Specified; IBD — Intrahepatic Bile Duct.

United States Cancer Statistics: 2004 Incidence and Mortality
���
Figure 3.5.M1: Age-Adjusted Invasive Cancer Incidence Rates for the 10 Primary Siteswith the Highest Rates within Race- and Ethnic-Specific Categories
Arkansas,∗† Males, 2004
Pancreas
Leukemias
Melanomas of the Skin
Oral Cavity & Pharynx
Non-Hodgkin Lymphoma
Kidney & Renal Pelvis
Urinary Bladder
Colon & Rectum
Lung & Bronchus
Prostate
0 50 100 150 200 250 300
10.9
14.4
16.5
16.8
20.4
20.4
33.1
59.6
105.3
148.2
Pancreas
Leukemias
Oral Cavity & Pharynx
Melanomas of the Skin
Kidney & Renal Pelvis
Non-Hodgkin Lymphoma
Urinary Bladder
Colon & Rectum
Lung & Bronchus
Prostate
0 50 100 150 200 250 300
10.7
14.7
16.8
18.3
20.5
21.3
35.8
58.5
104.5
142.8
Oral Cavity & Pharynx
Liver & IBD
Pancreas
Myeloma
Kidney & Renal Pelvis
Stomach
Colon & Rectum
Lung & Bronchus
Prostate
0 50 100 150 200 250 300
12.4
12.6
13.5
15.5
20.8
21.3
69.7
115.4
188.0
0 50 100 150 200 250 300
Incidence rates were notranked when the populationsize was less than 50,000or case counts were fewerthan 16 in each of the sitecategories.
0 50 100 150 200 250 300
Incidence rates were notranked when the populationsize was less than 50,000or case counts were fewerthan 16 in each of the sitecategories.
0 50 100 150 200 250 300
Incidence rates were notranked when the populationsize was less than 50,000or case counts were fewerthan 16 in each of the sitecategories.
Rate‡ per 100,000Rate‡ per 100,000
Rate‡ per 100,000Rate‡ per 100,000
Rate‡ per 100,000Rate‡ per 100,000
All Races White
Black Asian/Pacific Islander§
American Indian/Alaska Native§ Hispanic§�
∗ Data are from selected state and metropolitan area cancer registries that meet the data quality criteria for all invasive
cancer sites combined. See Appendix B for data quality criteria and registry-specific data quality information.† Excludes basal and squamous cell carcinomas of the skin except when these occur on the skin of the genital organs, and in
situ cancers except urinary bladder.‡ Rates are age-adjusted to the 2000 U.S. standard population (19 age groups - Census P25-1130). See Table 2.1.1.1M-2.27.1.1M
and Appendix F.1-F.2 for 95% confidence intervals for rates. Rates are suppressed and not ranked if the population of a specific
category (race, ethnicity) is less than 50,000 or if cases are fewer than 16.§ Data for specified racial or ethnic populations other than white and black should be interpreted with caution. See Technical
Notes.� Hispanic origin is not mutually exclusive from race categories (white, black, Asian/Pacific Islander, American Indian/Alaska
Native).
Note: ONS — Other Nervous System; NOS — Not Otherwise Specified; IBD — Intrahepatic Bile Duct.
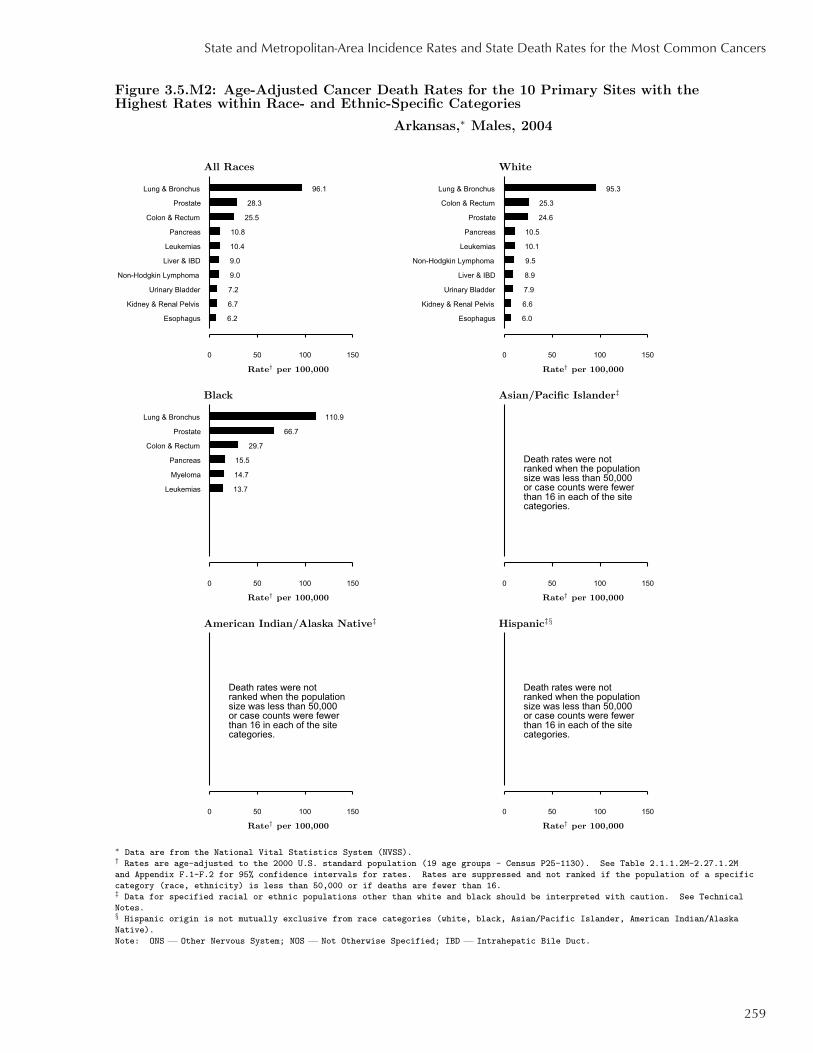
State and Metropolitan-Area Incidence Rates and State Death Rates for the Most Common Cancers
���
Figure 3.5.M2: Age-Adjusted Cancer Death Rates for the 10 Primary Sites with theHighest Rates within Race- and Ethnic-Specific Categories
Arkansas,∗ Males, 2004
Esophagus
Kidney & Renal Pelvis
Urinary Bladder
Non-Hodgkin Lymphoma
Liver & IBD
Leukemias
Pancreas
Colon & Rectum
Prostate
Lung & Bronchus
0 50 100 150
6.2
6.7
7.2
9.0
9.0
10.4
10.8
25.5
28.3
96.1
Esophagus
Kidney & Renal Pelvis
Urinary Bladder
Liver & IBD
Non-Hodgkin Lymphoma
Leukemias
Pancreas
Prostate
Colon & Rectum
Lung & Bronchus
0 50 100 150
6.0
6.6
7.9
8.9
9.5
10.1
10.5
24.6
25.3
95.3
Leukemias
Myeloma
Pancreas
Colon & Rectum
Prostate
Lung & Bronchus
0 50 100 150
13.7
14.7
15.5
29.7
66.7
110.9
0 50 100 150
Death rates were notranked when the populationsize was less than 50,000or case counts were fewerthan 16 in each of the sitecategories.
0 50 100 150
Death rates were notranked when the populationsize was less than 50,000or case counts were fewerthan 16 in each of the sitecategories.
0 50 100 150
Death rates were notranked when the populationsize was less than 50,000or case counts were fewerthan 16 in each of the sitecategories.
Rate† per 100,000Rate† per 100,000
Rate† per 100,000Rate† per 100,000
Rate† per 100,000Rate† per 100,000
All Races White
Black Asian/Pacific Islander‡
American Indian/Alaska Native‡ Hispanic‡§
∗ Data are from the National Vital Statistics System (NVSS).† Rates are age-adjusted to the 2000 U.S. standard population (19 age groups - Census P25-1130). See Table 2.1.1.2M-2.27.1.2M
and Appendix F.1-F.2 for 95% confidence intervals for rates. Rates are suppressed and not ranked if the population of a specific
category (race, ethnicity) is less than 50,000 or if deaths are fewer than 16.‡ Data for specified racial or ethnic populations other than white and black should be interpreted with caution. See Technical
Notes.§ Hispanic origin is not mutually exclusive from race categories (white, black, Asian/Pacific Islander, American Indian/Alaska
Native).
Note: ONS — Other Nervous System; NOS — Not Otherwise Specified; IBD — Intrahepatic Bile Duct.

United States Cancer Statistics: 2004 Incidence and Mortality
��0
Figure 3.5.F1: Age-Adjusted Invasive Cancer Incidence Rates for the 10 Primary Siteswith the Highest Rates within Race- and Ethnic-Specific Categories
Arkansas,∗† Females, 2004
Kidney & Renal Pelvis
Urinary Bladder
Cervix Uteri
Melanomas of the Skin
Ovary
Corpus & Uterus, NOS
Non-Hodgkin Lymphoma
Colon & Rectum
Lung & Bronchus
Breast
0 50 100 150 200 250 300
8.9
9.0
9.9
10.4
11.7
15.8
16.0
42.1
60.5
106.1
Thyroid
Urinary Bladder
Cervix Uteri
Ovary
Melanomas of the Skin
Corpus & Uterus, NOS
Non-Hodgkin Lymphoma
Colon & Rectum
Lung & Bronchus
Breast
0 50 100 150 200 250 300
9.5
9.6
9.8
12.0
12.0
15.8
16.8
41.4
61.6
104.2
Ovary
Kidney & Renal Pelvis
Leukemias
Pancreas
Cervix Uteri
Stomach
Corpus & Uterus, NOS
Colon & Rectum
Lung & Bronchus
Breast
0 50 100 150 200 250 300
8.4
8.4
10.0
11.7
11.8
12.6
15.1
45.1
49.9
105.5
0 50 100 150 200 250 300
Incidence rates were notranked when the populationsize was less than 50,000or case counts were fewerthan 16 in each of the sitecategories.
0 50 100 150 200 250 300
Incidence rates were notranked when the populationsize was less than 50,000or case counts were fewerthan 16 in each of the sitecategories.
0 50 100 150 200 250 300
Incidence rates were notranked when the populationsize was less than 50,000or case counts were fewerthan 16 in each of the sitecategories.
Rate‡ per 100,000Rate‡ per 100,000
Rate‡ per 100,000Rate‡ per 100,000
Rate‡ per 100,000Rate‡ per 100,000
All Races White
Black Asian/Pacific Islander§
American Indian/Alaska Native§ Hispanic§�
∗ Data are from selected state and metropolitan area cancer registries that meet the data quality criteria for all invasive
cancer sites combined. See Appendix B for data quality criteria and registry-specific data quality information.† Excludes basal and squamous cell carcinomas of the skin except when these occur on the skin of the genital organs, and in
situ cancers except urinary bladder.‡ Rates are age-adjusted to the 2000 U.S. standard population (19 age groups - Census P25-1130). See Table 2.1.1.1F-2.27.1.1F
and Appendix F.1-F.2 for 95% confidence intervals for rates. Rates are suppressed and not ranked if the population of a specific
category (race, ethnicity) is less than 50,000 or if cases are fewer than 16.§ Data for specified racial or ethnic populations other than white and black should be interpreted with caution. See Technical
Notes.� Hispanic origin is not mutually exclusive from race categories (white, black, Asian/Pacific Islander, American Indian/Alaska
Native).
Note: ONS — Other Nervous System; NOS — Not Otherwise Specified; IBD — Intrahepatic Bile Duct. Ovary excludes cancers newly
classified as borderline according to ICD-O-3, beginning with 2001 diagnoses. See Technical Notes.
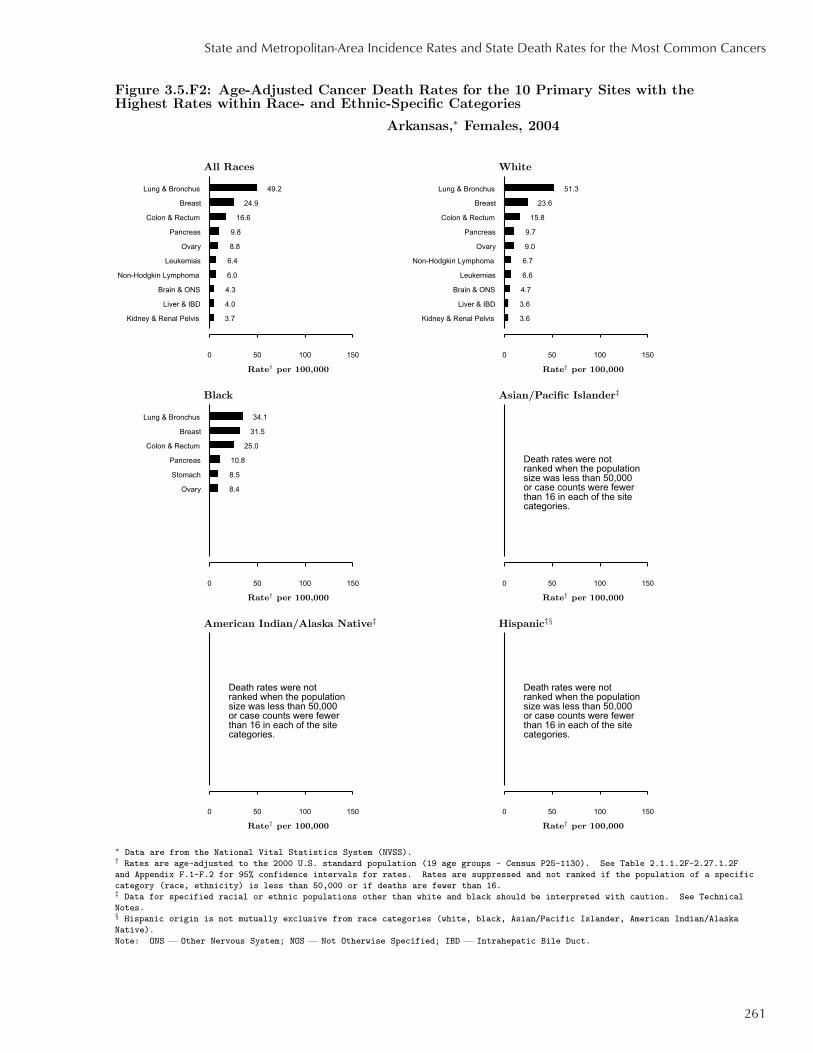
State and Metropolitan-Area Incidence Rates and State Death Rates for the Most Common Cancers
���
Figure 3.5.F2: Age-Adjusted Cancer Death Rates for the 10 Primary Sites with theHighest Rates within Race- and Ethnic-Specific Categories
Arkansas,∗ Females, 2004
Kidney & Renal Pelvis
Liver & IBD
Brain & ONS
Non-Hodgkin Lymphoma
Leukemias
Ovary
Pancreas
Colon & Rectum
Breast
Lung & Bronchus
0 50 100 150
3.7
4.0
4.3
6.0
6.4
8.8
9.8
16.6
24.9
49.2
Kidney & Renal Pelvis
Liver & IBD
Brain & ONS
Leukemias
Non-Hodgkin Lymphoma
Ovary
Pancreas
Colon & Rectum
Breast
Lung & Bronchus
0 50 100 150
3.6
3.6
4.7
6.6
6.7
9.0
9.7
15.8
23.6
51.3
Ovary
Stomach
Pancreas
Colon & Rectum
Breast
Lung & Bronchus
0 50 100 150
8.4
8.5
10.8
25.0
31.5
34.1
0 50 100 150
Death rates were notranked when the populationsize was less than 50,000or case counts were fewerthan 16 in each of the sitecategories.
0 50 100 150
Death rates were notranked when the populationsize was less than 50,000or case counts were fewerthan 16 in each of the sitecategories.
0 50 100 150
Death rates were notranked when the populationsize was less than 50,000or case counts were fewerthan 16 in each of the sitecategories.
Rate† per 100,000Rate† per 100,000
Rate† per 100,000Rate† per 100,000
Rate† per 100,000Rate† per 100,000
All Races White
Black Asian/Pacific Islander‡
American Indian/Alaska Native‡ Hispanic‡§
∗ Data are from the National Vital Statistics System (NVSS).† Rates are age-adjusted to the 2000 U.S. standard population (19 age groups - Census P25-1130). See Table 2.1.1.2F-2.27.1.2F
and Appendix F.1-F.2 for 95% confidence intervals for rates. Rates are suppressed and not ranked if the population of a specific
category (race, ethnicity) is less than 50,000 or if deaths are fewer than 16.‡ Data for specified racial or ethnic populations other than white and black should be interpreted with caution. See Technical
Notes.§ Hispanic origin is not mutually exclusive from race categories (white, black, Asian/Pacific Islander, American Indian/Alaska
Native).
Note: ONS — Other Nervous System; NOS — Not Otherwise Specified; IBD — Intrahepatic Bile Duct.

United States Cancer Statistics: 2004 Incidence and Mortality
���
Figure 3.6.M1: Age-Adjusted Invasive Cancer Incidence Rates for the 10 Primary Siteswith the Highest Rates within Race- and Ethnic-Specific Categories
California,∗† Males, 2004
Pancreas
Leukemias
Oral Cavity & Pharynx
Kidney & Renal Pelvis
Non-Hodgkin Lymphoma
Melanomas of the Skin
Urinary Bladder
Colon & Rectum
Lung & Bronchus
Prostate
0 50 100 150 200 250 300
11.9
14.1
14.7
17.1
22.2
24.8
35.0
50.5
63.8
152.5
Pancreas
Leukemias
Oral Cavity & Pharynx
Kidney & Renal Pelvis
Non-Hodgkin Lymphoma
Melanomas of the Skin
Urinary Bladder
Colon & Rectum
Lung & Bronchus
Prostate
0 50 100 150 200 250 300
12.1
14.6
15.3
18.1
23.1
28.8
38.3
50.1
63.9
149.3
Stomach
Oral Cavity & Pharynx
Liver & IBD
Pancreas
Non-Hodgkin Lymphoma
Kidney & Renal Pelvis
Urinary Bladder
Colon & Rectum
Lung & Bronchus
Prostate
0 50 100 150 200 250 300
14.6
14.7
14.8
14.8
15.0
21.7
21.9
65.8
85.9
215.5
Leukemias
Pancreas
Oral Cavity & Pharynx
Urinary Bladder
Non-Hodgkin Lymphoma
Stomach
Liver & IBD
Colon & Rectum
Lung & Bronchus
Prostate
0 50 100 150 200 250 300
9.0
9.4
10.0
14.8
16.8
18.2
23.8
43.1
52.4
85.8
0 50 100 150 200 250 300
Incidence rates aresuppressed and notranked at state’s request.
Pancreas
Leukemias
Liver & IBD
Stomach
Kidney & Renal Pelvis
Urinary Bladder
Non-Hodgkin Lymphoma
Lung & Bronchus
Colon & Rectum
Prostate
0 50 100 150 200 250 300
10.3
10.8
14.5
15.7
18.6
19.3
19.5
39.2
44.3
137.6
Rate‡ per 100,000Rate‡ per 100,000
Rate‡ per 100,000Rate‡ per 100,000
Rate‡ per 100,000Rate‡ per 100,000
All Races White
Black Asian/Pacific Islander§
American Indian/Alaska Native§ Hispanic§�
∗ Data are from selected state and metropolitan area cancer registries that meet the data quality criteria for all invasive
cancer sites combined. See Appendix B for data quality criteria and registry-specific data quality information.† Excludes basal and squamous cell carcinomas of the skin except when these occur on the skin of the genital organs, and in
situ cancers except urinary bladder.‡ Rates are age-adjusted to the 2000 U.S. standard population (19 age groups - Census P25-1130). See Table 2.1.1.1M-2.27.1.1M
and Appendix F.1-F.2 for 95% confidence intervals for rates. Rates are suppressed and not ranked if the population of a specific
category (race, ethnicity) is less than 50,000 or if cases are fewer than 16.§ Data for specified racial or ethnic populations other than white and black should be interpreted with caution. See Technical
Notes.� Hispanic origin is not mutually exclusive from race categories (white, black, Asian/Pacific Islander, American Indian/Alaska
Native).
Note: ONS — Other Nervous System; NOS — Not Otherwise Specified; IBD — Intrahepatic Bile Duct.

State and Metropolitan-Area Incidence Rates and State Death Rates for the Most Common Cancers
��3
Figure 3.6.M2: Age-Adjusted Cancer Death Rates for the 10 Primary Sites with theHighest Rates within Race- and Ethnic-Specific Categories
California,∗ Males, 2004
Stomach
Esophagus
Urinary Bladder
Non-Hodgkin Lymphoma
Liver & IBD
Leukemias
Pancreas
Colon & Rectum
Prostate
Lung & Bronchus
0 50 100 150
6.2
6.3
7.1
8.3
8.9
9.0
11.7
18.9
23.8
52.5
Kidney & Renal Pelvis
Esophagus
Liver & IBD
Urinary Bladder
Non-Hodgkin Lymphoma
Leukemias
Pancreas
Colon & Rectum
Prostate
Lung & Bronchus
0 50 100 150
5.6
6.7
7.5
7.9
8.7
9.5
12.0
18.9
23.9
53.0
Non-Hodgkin Lymphoma
Esophagus
Leukemias
Myeloma
Stomach
Liver & IBD
Pancreas
Colon & Rectum
Prostate
Lung & Bronchus
0 50 100 150
7.0
7.2
8.5
8.6
10.0
11.2
14.1
28.1
52.7
75.4
Oral Cavity & Pharynx
Esophagus
Leukemias
Non-Hodgkin Lymphoma
Pancreas
Stomach
Prostate
Colon & Rectum
Liver & IBD
Lung & Bronchus
0 50 100 150
3.2
3.6
5.4
6.3
8.1
9.5
12.3
15.7
17.4
40.1
0 50 100 150
Death rates are suppressedand not ranked at state’srequest.
Myeloma
Leukemias
Kidney & Renal Pelvis
Non-Hodgkin Lymphoma
Pancreas
Stomach
Liver & IBD
Colon & Rectum
Prostate
Lung & Bronchus
0 50 100 150
4.2
5.6
5.7
6.5
9.1
9.7
10.7
13.6
19.2
31.3
Rate† per 100,000Rate† per 100,000
Rate† per 100,000Rate† per 100,000
Rate† per 100,000Rate† per 100,000
All Races White
Black Asian/Pacific Islander‡
American Indian/Alaska Native‡ Hispanic‡§
∗ Data are from the National Vital Statistics System (NVSS).† Rates are age-adjusted to the 2000 U.S. standard population (19 age groups - Census P25-1130). See Table 2.1.1.2M-2.27.1.2M
and Appendix F.1-F.2 for 95% confidence intervals for rates. Rates are suppressed and not ranked if the population of a specific
category (race, ethnicity) is less than 50,000 or if deaths are fewer than 16.‡ Data for specified racial or ethnic populations other than white and black should be interpreted with caution. See Technical
Notes.§ Hispanic origin is not mutually exclusive from race categories (white, black, Asian/Pacific Islander, American Indian/Alaska
Native).
Note: ONS — Other Nervous System; NOS — Not Otherwise Specified; IBD — Intrahepatic Bile Duct.

United States Cancer Statistics: 2004 Incidence and Mortality
���
Figure 3.6.F1: Age-Adjusted Invasive Cancer Incidence Rates for the 10 Primary Siteswith the Highest Rates within Race- and Ethnic-Specific Categories
California,∗† Females, 2004
Urinary Bladder
Pancreas
Thyroid
Ovary
Melanomas of the Skin
Non-Hodgkin Lymphoma
Corpus & Uterus, NOS
Colon & Rectum
Lung & Bronchus
Breast
0 50 100 150 200 250 300
8.6
9.7
12.4
12.6
14.8
15.4
21.0
37.9
46.0
117.9
Urinary Bladder
Pancreas
Thyroid
Ovary
Non-Hodgkin Lymphoma
Melanomas of the Skin
Corpus & Uterus, NOS
Colon & Rectum
Lung & Bronchus
Breast
0 50 100 150 200 250 300
9.3
9.6
12.8
13.3
16.0
17.1
21.8
37.5
48.6
122.5
Urinary Bladder
Kidney & Renal Pelvis
Ovary
Myeloma
Non-Hodgkin Lymphoma
Pancreas
Corpus & Uterus, NOS
Colon & Rectum
Lung & Bronchus
Breast
0 50 100 150 200 250 300
8.7
9.6
10.3
10.7
11.0
15.8
19.9
49.0
56.8
118.7
Liver & IBD
Pancreas
Ovary
Non-Hodgkin Lymphoma
Stomach
Thyroid
Corpus & Uterus, NOS
Lung & Bronchus
Colon & Rectum
Breast
0 50 100 150 200 250 300
7.9
8.2
9.8
10.7
10.7
12.9
16.3
25.6
34.1
87.5
0 50 100 150 200 250 300
Incidence rates aresuppressed and notranked at state’s request.
Kidney & Renal Pelvis
Pancreas
Ovary
Thyroid
Cervix Uteri
Non-Hodgkin Lymphoma
Corpus & Uterus, NOS
Lung & Bronchus
Colon & Rectum
Breast
0 50 100 150 200 250 300
9.6
9.7
11.3
12.0
12.1
14.8
17.6
25.7
30.5
83.5
Rate‡ per 100,000Rate‡ per 100,000
Rate‡ per 100,000Rate‡ per 100,000
Rate‡ per 100,000Rate‡ per 100,000
All Races White
Black Asian/Pacific Islander§
American Indian/Alaska Native§ Hispanic§�
∗ Data are from selected state and metropolitan area cancer registries that meet the data quality criteria for all invasive
cancer sites combined. See Appendix B for data quality criteria and registry-specific data quality information.† Excludes basal and squamous cell carcinomas of the skin except when these occur on the skin of the genital organs, and in
situ cancers except urinary bladder.‡ Rates are age-adjusted to the 2000 U.S. standard population (19 age groups - Census P25-1130). See Table 2.1.1.1F-2.27.1.1F
and Appendix F.1-F.2 for 95% confidence intervals for rates. Rates are suppressed and not ranked if the population of a specific
category (race, ethnicity) is less than 50,000 or if cases are fewer than 16.§ Data for specified racial or ethnic populations other than white and black should be interpreted with caution. See Technical
Notes.� Hispanic origin is not mutually exclusive from race categories (white, black, Asian/Pacific Islander, American Indian/Alaska
Native).
Note: ONS — Other Nervous System; NOS — Not Otherwise Specified; IBD — Intrahepatic Bile Duct. Ovary excludes cancers newly
classified as borderline according to ICD-O-3, beginning with 2001 diagnoses. See Technical Notes.

State and Metropolitan-Area Incidence Rates and State Death Rates for the Most Common Cancers
���
Figure 3.6.F2: Age-Adjusted Cancer Death Rates for the 10 Primary Sites with theHighest Rates within Race- and Ethnic-Specific Categories
California,∗ Females, 2004
Stomach
Liver & IBD
Corpus & Uterus, NOS
Leukemias
Non-Hodgkin Lymphoma
Pancreas
Ovary
Colon & Rectum
Breast
Lung & Bronchus
0 50 100 150
3.4
3.7
3.8
5.0
5.1
8.8
9.1
13.7
23.2
35.0
Liver & IBD
Corpus & Uterus, NOS
Brain & ONS
Non-Hodgkin Lymphoma
Leukemias
Pancreas
Ovary
Colon & Rectum
Breast
Lung & Bronchus
0 50 100 150
3.3
3.7
3.8
5.2
5.3
8.7
10.0
13.4
23.7
37.3
Leukemias
Stomach
Non-Hodgkin Lymphoma
Myeloma
Corpus & Uterus, NOS
Ovary
Pancreas
Colon & Rectum
Breast
Lung & Bronchus
0 50 100 150
4.5
5.5
5.9
6.8
7.3
7.4
14.6
23.0
34.7
39.7
Cervix Uteri
Leukemias
Non-Hodgkin Lymphoma
Stomach
Ovary
Liver & IBD
Pancreas
Colon & Rectum
Breast
Lung & Bronchus
0 50 100 150
2.7
3.1
4.5
4.9
4.9
6.9
7.1
11.1
14.2
18.7
0 50 100 150
Death rates are suppressedand not ranked at state’srequest.
Cervix Uteri
Leukemias
Non-Hodgkin Lymphoma
Liver & IBD
Stomach
Ovary
Pancreas
Colon & Rectum
Lung & Bronchus
Breast
0 50 100 150
3.6
3.8
4.1
5.1
5.7
7.0
8.3
8.9
13.6
15.4
Rate† per 100,000Rate† per 100,000
Rate† per 100,000Rate† per 100,000
Rate† per 100,000Rate† per 100,000
All Races White
Black Asian/Pacific Islander‡
American Indian/Alaska Native‡ Hispanic‡§
∗ Data are from the National Vital Statistics System (NVSS).† Rates are age-adjusted to the 2000 U.S. standard population (19 age groups - Census P25-1130). See Table 2.1.1.2F-2.27.1.2F
and Appendix F.1-F.2 for 95% confidence intervals for rates. Rates are suppressed and not ranked if the population of a specific
category (race, ethnicity) is less than 50,000 or if deaths are fewer than 16.‡ Data for specified racial or ethnic populations other than white and black should be interpreted with caution. See Technical
Notes.§ Hispanic origin is not mutually exclusive from race categories (white, black, Asian/Pacific Islander, American Indian/Alaska
Native).
Note: ONS — Other Nervous System; NOS — Not Otherwise Specified; IBD — Intrahepatic Bile Duct.

United States Cancer Statistics: 2004 Incidence and Mortality
���
Figure 3.7.M1: Age-Adjusted Invasive Cancer Incidence Rates for the 10 Primary Siteswith the Highest Rates within Race- and Ethnic-Specific Categories
Los Angeles,∗† Males, 2004
Oral Cavity & Pharynx
Stomach
Leukemias
Kidney & Renal Pelvis
Melanomas of the Skin
Non-Hodgkin Lymphoma
Urinary Bladder
Colon & Rectum
Lung & Bronchus
Prostate
0 50 100 150 200 250 300
12.9
13.8
13.8
15.6
19.0
21.7
33.1
50.7
58.3
159.3
Pancreas
Oral Cavity & Pharynx
Leukemias
Kidney & Renal Pelvis
Non-Hodgkin Lymphoma
Melanomas of the Skin
Urinary Bladder
Colon & Rectum
Lung & Bronchus
Prostate
0 50 100 150 200 250 300
11.7
13.2
14.7
17.0
23.2
24.8
37.2
49.2
54.4
150.6
Myeloma
Leukemias
Stomach
Oral Cavity & Pharynx
Kidney & Renal Pelvis
Non-Hodgkin Lymphoma
Urinary Bladder
Colon & Rectum
Lung & Bronchus
Prostate
0 50 100 150 200 250 300
14.5
15.4
15.4
15.5
16.9
17.0
23.9
70.8
95.3
226.8
Kidney & Renal Pelvis
Oral Cavity & Pharynx
Pancreas
Non-Hodgkin Lymphoma
Urinary Bladder
Liver & IBD
Stomach
Colon & Rectum
Lung & Bronchus
Prostate
0 50 100 150 200 250 300
7.9
9.8
10.6
15.0
16.8
23.8
24.6
46.4
56.2
89.8
0 50 100 150 200 250 300
Incidence rates were notranked when the populationsize was less than 50,000or case counts were fewerthan 16 in each of the sitecategories.
Oral Cavity & Pharynx
Leukemias
Liver & IBD
Urinary Bladder
Stomach
Kidney & Renal Pelvis
Non-Hodgkin Lymphoma
Lung & Bronchus
Colon & Rectum
Prostate
0 50 100 150 200 250 300
9.1
12.0
14.0
16.1
16.3
16.8
18.9
33.1
39.8
149.8
Rate‡ per 100,000Rate‡ per 100,000
Rate‡ per 100,000Rate‡ per 100,000
Rate‡ per 100,000Rate‡ per 100,000
All Races White
Black Asian/Pacific Islander§
American Indian/Alaska Native§ Hispanic§�
∗ Data are from selected state and metropolitan area cancer registries that meet the data quality criteria for all invasive
cancer sites combined. See Appendix B for data quality criteria and registry-specific data quality information.† Excludes basal and squamous cell carcinomas of the skin except when these occur on the skin of the genital organs, and in
situ cancers except urinary bladder.‡ Rates are age-adjusted to the 2000 U.S. standard population (19 age groups - Census P25-1130). See Table 2.1.1.1M-2.27.1.1M
and Appendix F.1-F.2 for 95% confidence intervals for rates. Rates are suppressed and not ranked if the population of a specific
category (race, ethnicity) is less than 50,000 or if cases are fewer than 16.§ Data for specified racial or ethnic populations other than white and black should be interpreted with caution. See Technical
Notes.� Hispanic origin is not mutually exclusive from race categories (white, black, Asian/Pacific Islander, American Indian/Alaska
Native).
Note: ONS — Other Nervous System; NOS — Not Otherwise Specified; IBD — Intrahepatic Bile Duct.

State and Metropolitan-Area Incidence Rates and State Death Rates for the Most Common Cancers
���
Mortality data are not presented for metropolitan areas.

United States Cancer Statistics: 2004 Incidence and Mortality
���
Figure 3.7.F1: Age-Adjusted Invasive Cancer Incidence Rates for the 10 Primary Siteswith the Highest Rates within Race- and Ethnic-Specific Categories
Los Angeles,∗† Females, 2004
Cervix Uteri
Pancreas
Melanomas of the Skin
Ovary
Thyroid
Non-Hodgkin Lymphoma
Corpus & Uterus, NOS
Colon & Rectum
Lung & Bronchus
Breast
0 50 100 150 200 250 300
9.6
9.7
9.9
12.7
12.8
15.4
21.3
38.6
39.7
113.0
Leukemias
Cervix Uteri
Melanomas of the Skin
Thyroid
Ovary
Non-Hodgkin Lymphoma
Corpus & Uterus, NOS
Colon & Rectum
Lung & Bronchus
Breast
0 50 100 150 200 250 300
9.4
10.3
13.0
13.7
13.7
16.4
22.6
37.3
39.6
116.4
Urinary Bladder
Kidney & Renal Pelvis
Non-Hodgkin Lymphoma
Ovary
Myeloma
Pancreas
Corpus & Uterus, NOS
Colon & Rectum
Lung & Bronchus
Breast
0 50 100 150 200 250 300
8.7
9.9
11.0
11.9
13.2
16.5
20.3
53.2
60.5
120.2
Cervix Uteri
Liver & IBD
Ovary
Non-Hodgkin Lymphoma
Thyroid
Stomach
Corpus & Uterus, NOS
Lung & Bronchus
Colon & Rectum
Breast
0 50 100 150 200 250 300
8.5
9.5
9.6
11.5
13.0
14.9
17.4
26.9
35.4
94.2
0 50 100 150 200 250 300
Incidence rates were notranked when the populationsize was less than 50,000or case counts were fewerthan 16 in each of the sitecategories.
Pancreas
Stomach
Ovary
Thyroid
Cervix Uteri
Non-Hodgkin Lymphoma
Corpus & Uterus, NOS
Lung & Bronchus
Colon & Rectum
Breast
0 50 100 150 200 250 300
8.0
9.5
10.7
12.2
13.9
14.3
18.5
21.6
28.6
78.3
Rate‡ per 100,000Rate‡ per 100,000
Rate‡ per 100,000Rate‡ per 100,000
Rate‡ per 100,000Rate‡ per 100,000
All Races White
Black Asian/Pacific Islander§
American Indian/Alaska Native§ Hispanic§�
∗ Data are from selected state and metropolitan area cancer registries that meet the data quality criteria for all invasive
cancer sites combined. See Appendix B for data quality criteria and registry-specific data quality information.† Excludes basal and squamous cell carcinomas of the skin except when these occur on the skin of the genital organs, and in
situ cancers except urinary bladder.‡ Rates are age-adjusted to the 2000 U.S. standard population (19 age groups - Census P25-1130). See Table 2.1.1.1F-2.27.1.1F
and Appendix F.1-F.2 for 95% confidence intervals for rates. Rates are suppressed and not ranked if the population of a specific
category (race, ethnicity) is less than 50,000 or if cases are fewer than 16.§ Data for specified racial or ethnic populations other than white and black should be interpreted with caution. See Technical
Notes.� Hispanic origin is not mutually exclusive from race categories (white, black, Asian/Pacific Islander, American Indian/Alaska
Native).
Note: ONS — Other Nervous System; NOS — Not Otherwise Specified; IBD — Intrahepatic Bile Duct. Ovary excludes cancers newly
classified as borderline according to ICD-O-3, beginning with 2001 diagnoses. See Technical Notes.

State and Metropolitan-Area Incidence Rates and State Death Rates for the Most Common Cancers
���
Mortality data are not presented for metropolitan areas.

United States Cancer Statistics: 2004 Incidence and Mortality
��0
Figure 3.8.M1: Age-Adjusted Invasive Cancer Incidence Rates for the 10 Primary Siteswith the Highest Rates within Race- and Ethnic-Specific Categories
San Francisco-Oakland,∗† Males, 2004
Leukemias
Liver & IBD
Oral Cavity & Pharynx
Kidney & Renal Pelvis
Melanomas of the Skin
Non-Hodgkin Lymphoma
Urinary Bladder
Colon & Rectum
Lung & Bronchus
Prostate
0 50 100 150 200 250 300
13.1
13.4
15.2
16.4
18.7
26.0
31.6
52.2
60.6
149.8
Pancreas
Leukemias
Oral Cavity & Pharynx
Kidney & Renal Pelvis
Melanomas of the Skin
Non-Hodgkin Lymphoma
Urinary Bladder
Colon & Rectum
Lung & Bronchus
Prostate
0 50 100 150 200 250 300
13.0
13.9
15.9
17.5
25.3
27.7
38.2
52.1
57.3
155.5
Myeloma
Pancreas
Non-Hodgkin Lymphoma
Stomach
Urinary Bladder
Liver & IBD
Kidney & Renal Pelvis
Colon & Rectum
Lung & Bronchus
Prostate
0 50 100 150 200 250 300
14.1
15.5
17.1
20.0
20.1
20.1
26.5
66.6
83.3
197.7
Leukemias
Pancreas
Oral Cavity & Pharynx
Urinary Bladder
Stomach
Non-Hodgkin Lymphoma
Liver & IBD
Colon & Rectum
Lung & Bronchus
Prostate
0 50 100 150 200 250 300
10.9
11.4
12.8
14.1
15.5
20.4
24.6
42.2
59.5
83.7
0 50 100 150 200 250 300
Incidence rates were notranked when the populationsize was less than 50,000or case counts were fewerthan 16 in each of the sitecategories.
Oral Cavity & Pharynx
Pancreas
Liver & IBD
Kidney & Renal Pelvis
Urinary Bladder
Stomach
Non-Hodgkin Lymphoma
Lung & Bronchus
Colon & Rectum
Prostate
0 50 100 150 200 250 300
8.8
11.2
13.0
13.5
14.9
16.8
24.3
35.0
44.1
110.0
Rate‡ per 100,000Rate‡ per 100,000
Rate‡ per 100,000Rate‡ per 100,000
Rate‡ per 100,000Rate‡ per 100,000
All Races White
Black Asian/Pacific Islander§
American Indian/Alaska Native§ Hispanic§�
∗ Data are from selected state and metropolitan area cancer registries that meet the data quality criteria for all invasive
cancer sites combined. See Appendix B for data quality criteria and registry-specific data quality information.† Excludes basal and squamous cell carcinomas of the skin except when these occur on the skin of the genital organs, and in
situ cancers except urinary bladder.‡ Rates are age-adjusted to the 2000 U.S. standard population (19 age groups - Census P25-1130). See Table 2.1.1.1M-2.27.1.1M
and Appendix F.1-F.2 for 95% confidence intervals for rates. Rates are suppressed and not ranked if the population of a specific
category (race, ethnicity) is less than 50,000 or if cases are fewer than 16.§ Data for specified racial or ethnic populations other than white and black should be interpreted with caution. See Technical
Notes.� Hispanic origin is not mutually exclusive from race categories (white, black, Asian/Pacific Islander, American Indian/Alaska
Native).
Note: ONS — Other Nervous System; NOS — Not Otherwise Specified; IBD — Intrahepatic Bile Duct.

State and Metropolitan-Area Incidence Rates and State Death Rates for the Most Common Cancers
���
Mortality data are not presented for metropolitan areas.
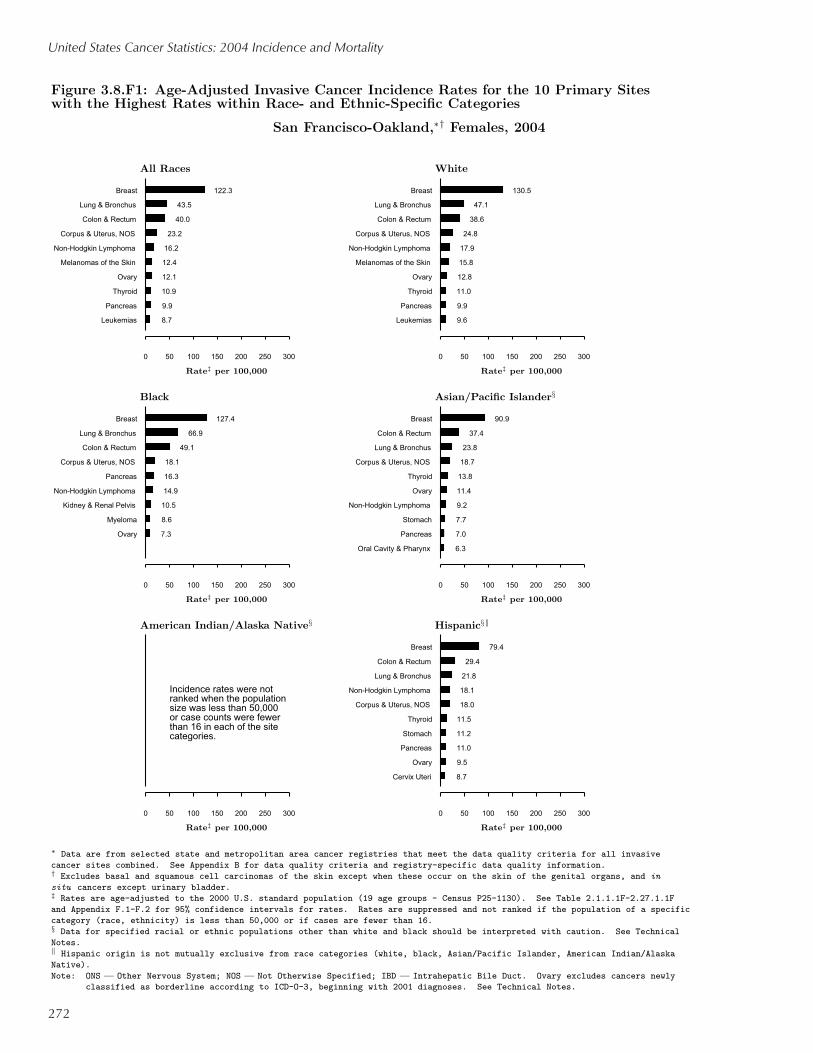
United States Cancer Statistics: 2004 Incidence and Mortality
���
Figure 3.8.F1: Age-Adjusted Invasive Cancer Incidence Rates for the 10 Primary Siteswith the Highest Rates within Race- and Ethnic-Specific Categories
San Francisco-Oakland,∗† Females, 2004
Leukemias
Pancreas
Thyroid
Ovary
Melanomas of the Skin
Non-Hodgkin Lymphoma
Corpus & Uterus, NOS
Colon & Rectum
Lung & Bronchus
Breast
0 50 100 150 200 250 300
8.7
9.9
10.9
12.1
12.4
16.2
23.2
40.0
43.5
122.3
Leukemias
Pancreas
Thyroid
Ovary
Melanomas of the Skin
Non-Hodgkin Lymphoma
Corpus & Uterus, NOS
Colon & Rectum
Lung & Bronchus
Breast
0 50 100 150 200 250 300
9.6
9.9
11.0
12.8
15.8
17.9
24.8
38.6
47.1
130.5
Ovary
Myeloma
Kidney & Renal Pelvis
Non-Hodgkin Lymphoma
Pancreas
Corpus & Uterus, NOS
Colon & Rectum
Lung & Bronchus
Breast
0 50 100 150 200 250 300
7.3
8.6
10.5
14.9
16.3
18.1
49.1
66.9
127.4
Oral Cavity & Pharynx
Pancreas
Stomach
Non-Hodgkin Lymphoma
Ovary
Thyroid
Corpus & Uterus, NOS
Lung & Bronchus
Colon & Rectum
Breast
0 50 100 150 200 250 300
6.3
7.0
7.7
9.2
11.4
13.8
18.7
23.8
37.4
90.9
0 50 100 150 200 250 300
Incidence rates were notranked when the populationsize was less than 50,000or case counts were fewerthan 16 in each of the sitecategories.
Cervix Uteri
Ovary
Pancreas
Stomach
Thyroid
Corpus & Uterus, NOS
Non-Hodgkin Lymphoma
Lung & Bronchus
Colon & Rectum
Breast
0 50 100 150 200 250 300
8.7
9.5
11.0
11.2
11.5
18.0
18.1
21.8
29.4
79.4
Rate‡ per 100,000Rate‡ per 100,000
Rate‡ per 100,000Rate‡ per 100,000
Rate‡ per 100,000Rate‡ per 100,000
All Races White
Black Asian/Pacific Islander§
American Indian/Alaska Native§ Hispanic§�
∗ Data are from selected state and metropolitan area cancer registries that meet the data quality criteria for all invasive
cancer sites combined. See Appendix B for data quality criteria and registry-specific data quality information.† Excludes basal and squamous cell carcinomas of the skin except when these occur on the skin of the genital organs, and in
situ cancers except urinary bladder.‡ Rates are age-adjusted to the 2000 U.S. standard population (19 age groups - Census P25-1130). See Table 2.1.1.1F-2.27.1.1F
and Appendix F.1-F.2 for 95% confidence intervals for rates. Rates are suppressed and not ranked if the population of a specific
category (race, ethnicity) is less than 50,000 or if cases are fewer than 16.§ Data for specified racial or ethnic populations other than white and black should be interpreted with caution. See Technical
Notes.� Hispanic origin is not mutually exclusive from race categories (white, black, Asian/Pacific Islander, American Indian/Alaska
Native).
Note: ONS — Other Nervous System; NOS — Not Otherwise Specified; IBD — Intrahepatic Bile Duct. Ovary excludes cancers newly
classified as borderline according to ICD-O-3, beginning with 2001 diagnoses. See Technical Notes.

State and Metropolitan-Area Incidence Rates and State Death Rates for the Most Common Cancers
��3
Mortality data are not presented for metropolitan areas.

United States Cancer Statistics: 2004 Incidence and Mortality
���
Figure 3.9.M1: Age-Adjusted Invasive Cancer Incidence Rates for the 10 Primary Siteswith the Highest Rates within Race- and Ethnic-Specific Categories
San Jose-Monterey,∗† Males, 2004
Liver & IBD
Oral Cavity & Pharynx
Leukemias
Kidney & Renal Pelvis
Melanomas of the Skin
Non-Hodgkin Lymphoma
Urinary Bladder
Colon & Rectum
Lung & Bronchus
Prostate
0 50 100 150 200 250 300
12.3
12.9
15.4
17.6
20.7
25.0
36.0
45.7
55.1
161.9
Pancreas
Oral Cavity & Pharynx
Leukemias
Kidney & Renal Pelvis
Melanomas of the Skin
Non-Hodgkin Lymphoma
Urinary Bladder
Colon & Rectum
Lung & Bronchus
Prostate
0 50 100 150 200 250 300
11.9
13.6
16.2
18.0
25.6
28.0
42.1
43.7
56.7
179.1
0 50 100 150 200 250 300
Incidence rates were notranked when the populationsize was less than 50,000or case counts were fewerthan 16 in each of the sitecategories.
Oral Cavity & Pharynx
Leukemias
Stomach
Non-Hodgkin Lymphoma
Kidney & Renal Pelvis
Urinary Bladder
Liver & IBD
Lung & Bronchus
Colon & Rectum
Prostate
0 50 100 150 200 250 300
10.2
10.7
11.1
13.0
14.0
14.2
24.3
45.5
47.9
79.1
0 50 100 150 200 250 300
Incidence rates were notranked when the populationsize was less than 50,000or case counts were fewerthan 16 in each of the sitecategories.
Brain & ONS
Leukemias
Pancreas
Liver & IBD
Non-Hodgkin Lymphoma
Kidney & Renal Pelvis
Urinary Bladder
Lung & Bronchus
Colon & Rectum
Prostate
0 50 100 150 200 250 300
7.4
11.5
11.8
18.1
21.0
22.9
25.1
30.0
47.2
124.7
Rate‡ per 100,000Rate‡ per 100,000
Rate‡ per 100,000Rate‡ per 100,000
Rate‡ per 100,000Rate‡ per 100,000
All Races White
Black Asian/Pacific Islander§
American Indian/Alaska Native§ Hispanic§�
∗ Data are from selected state and metropolitan area cancer registries that meet the data quality criteria for all invasive
cancer sites combined. See Appendix B for data quality criteria and registry-specific data quality information.† Excludes basal and squamous cell carcinomas of the skin except when these occur on the skin of the genital organs, and in
situ cancers except urinary bladder.‡ Rates are age-adjusted to the 2000 U.S. standard population (19 age groups - Census P25-1130). See Table 2.1.1.1M-2.27.1.1M
and Appendix F.1-F.2 for 95% confidence intervals for rates. Rates are suppressed and not ranked if the population of a specific
category (race, ethnicity) is less than 50,000 or if cases are fewer than 16.§ Data for specified racial or ethnic populations other than white and black should be interpreted with caution. See Technical
Notes.� Hispanic origin is not mutually exclusive from race categories (white, black, Asian/Pacific Islander, American Indian/Alaska
Native).
Note: ONS — Other Nervous System; NOS — Not Otherwise Specified; IBD — Intrahepatic Bile Duct.

State and Metropolitan-Area Incidence Rates and State Death Rates for the Most Common Cancers
���
Mortality data are not presented for metropolitan areas.

United States Cancer Statistics: 2004 Incidence and Mortality
���
Figure 3.9.F1: Age-Adjusted Invasive Cancer Incidence Rates for the 10 Primary Siteswith the Highest Rates within Race- and Ethnic-Specific Categories
San Jose-Monterey,∗† Females, 2004
Urinary Bladder
Ovary
Pancreas
Thyroid
Melanomas of the Skin
Non-Hodgkin Lymphoma
Corpus & Uterus, NOS
Colon & Rectum
Lung & Bronchus
Breast
0 50 100 150 200 250 300
8.3
10.9
11.0
13.1
14.1
16.9
19.7
34.9
39.8
112.3
Kidney & Renal Pelvis
Ovary
Pancreas
Thyroid
Non-Hodgkin Lymphoma
Melanomas of the Skin
Corpus & Uterus, NOS
Colon & Rectum
Lung & Bronchus
Breast
0 50 100 150 200 250 300
9.9
11.0
11.1
13.9
17.7
18.6
22.0
36.7
43.7
123.2
0 50 100 150 200 250 300
Incidence rates were notranked when the populationsize was less than 50,000or case counts were fewerthan 16 in each of the sitecategories.
Leukemias
Corpus & Uterus, NOS
Ovary
Stomach
Pancreas
Thyroid
Non-Hodgkin Lymphoma
Colon & Rectum
Lung & Bronchus
Breast
0 50 100 150 200 250 300
7.7
10.1
10.9
10.9
11.9
13.2
14.4
26.1
27.5
72.9
0 50 100 150 200 250 300
Incidence rates were notranked when the populationsize was less than 50,000or case counts were fewerthan 16 in each of the sitecategories.
Ovary
Thyroid
Kidney & Renal Pelvis
Cervix Uteri
Stomach
Non-Hodgkin Lymphoma
Corpus & Uterus, NOS
Lung & Bronchus
Colon & Rectum
Breast
0 50 100 150 200 250 300
9.8
10.9
10.9
11.2
12.8
13.1
14.0
26.5
30.2
78.9
Rate‡ per 100,000Rate‡ per 100,000
Rate‡ per 100,000Rate‡ per 100,000
Rate‡ per 100,000Rate‡ per 100,000
All Races White
Black Asian/Pacific Islander§
American Indian/Alaska Native§ Hispanic§�
∗ Data are from selected state and metropolitan area cancer registries that meet the data quality criteria for all invasive
cancer sites combined. See Appendix B for data quality criteria and registry-specific data quality information.† Excludes basal and squamous cell carcinomas of the skin except when these occur on the skin of the genital organs, and in
situ cancers except urinary bladder.‡ Rates are age-adjusted to the 2000 U.S. standard population (19 age groups - Census P25-1130). See Table 2.1.1.1F-2.27.1.1F
and Appendix F.1-F.2 for 95% confidence intervals for rates. Rates are suppressed and not ranked if the population of a specific
category (race, ethnicity) is less than 50,000 or if cases are fewer than 16.§ Data for specified racial or ethnic populations other than white and black should be interpreted with caution. See Technical
Notes.� Hispanic origin is not mutually exclusive from race categories (white, black, Asian/Pacific Islander, American Indian/Alaska
Native).
Note: ONS — Other Nervous System; NOS — Not Otherwise Specified; IBD — Intrahepatic Bile Duct. Ovary excludes cancers newly
classified as borderline according to ICD-O-3, beginning with 2001 diagnoses. See Technical Notes.

State and Metropolitan-Area Incidence Rates and State Death Rates for the Most Common Cancers
���
Mortality data are not presented for metropolitan areas.

United States Cancer Statistics: 2004 Incidence and Mortality
���
Figure 3.10.M1: Age-Adjusted Invasive Cancer Incidence Rates for the 10 Primary Siteswith the Highest Rates within Race- and Ethnic-Specific Categories
Colorado,∗† Males, 2004
Pancreas
Oral Cavity & Pharynx
Kidney & Renal Pelvis
Leukemias
Non-Hodgkin Lymphoma
Melanomas of the Skin
Urinary Bladder
Colon & Rectum
Lung & Bronchus
Prostate
0 50 100 150 200 250 300
11.4
13.1
17.1
17.4
20.3
22.3
32.8
51.9
57.3
147.1
Pancreas
Oral Cavity & Pharynx
Leukemias
Kidney & Renal Pelvis
Non-Hodgkin Lymphoma
Melanomas of the Skin
Urinary Bladder
Colon & Rectum
Lung & Bronchus
Prostate
0 50 100 150 200 250 300
11.4
13.4
16.9
17.3
20.0
23.5
33.7
51.7
57.6
132.4
Colon & Rectum
Lung & Bronchus
Prostate
0 50 100 150 200 250 300
42.2
60.3
173.8 Prostate
0 50 100 150 200 250 300
63.4
0 50 100 150 200 250 300
Incidence rates were notranked when the populationsize was less than 50,000or case counts were fewerthan 16 in each of the sitecategories.
Oral Cavity & Pharynx
Urinary Bladder
Pancreas
Liver & IBD
Stomach
Non-Hodgkin Lymphoma
Kidney & Renal Pelvis
Lung & Bronchus
Colon & Rectum
Prostate
0 50 100 150 200 250 300
11.1
14.7
15.8
16.9
17.0
17.5
23.0
38.8
54.5
111.7
Rate‡ per 100,000Rate‡ per 100,000
Rate‡ per 100,000Rate‡ per 100,000
Rate‡ per 100,000Rate‡ per 100,000
All Races White
Black Asian/Pacific Islander§
American Indian/Alaska Native§ Hispanic§�
∗ Data are from selected state and metropolitan area cancer registries that meet the data quality criteria for all invasive
cancer sites combined. See Appendix B for data quality criteria and registry-specific data quality information.† Excludes basal and squamous cell carcinomas of the skin except when these occur on the skin of the genital organs, and in
situ cancers except urinary bladder.‡ Rates are age-adjusted to the 2000 U.S. standard population (19 age groups - Census P25-1130). See Table 2.1.1.1M-2.27.1.1M
and Appendix F.1-F.2 for 95% confidence intervals for rates. Rates are suppressed and not ranked if the population of a specific
category (race, ethnicity) is less than 50,000 or if cases are fewer than 16.§ Data for specified racial or ethnic populations other than white and black should be interpreted with caution. See Technical
Notes.� Hispanic origin is not mutually exclusive from race categories (white, black, Asian/Pacific Islander, American Indian/Alaska
Native).
Note: ONS — Other Nervous System; NOS — Not Otherwise Specified; IBD — Intrahepatic Bile Duct.

State and Metropolitan-Area Incidence Rates and State Death Rates for the Most Common Cancers
���
Figure 3.10.M2: Age-Adjusted Cancer Death Rates for the 10 Primary Sites with theHighest Rates within Race- and Ethnic-Specific Categories
Colorado,∗ Males, 2004
Kidney & Renal Pelvis
Liver & IBD
Urinary Bladder
Esophagus
Non-Hodgkin Lymphoma
Leukemias
Pancreas
Colon & Rectum
Prostate
Lung & Bronchus
0 50 100 150
5.4
5.5
6.6
7.4
8.3
9.5
10.6
20.3
25.0
48.2
Liver & IBD
Kidney & Renal Pelvis
Urinary Bladder
Esophagus
Non-Hodgkin Lymphoma
Leukemias
Pancreas
Colon & Rectum
Prostate
Lung & Bronchus
0 50 100 150
5.2
5.5
6.9
7.1
8.3
9.7
10.7
20.5
24.4
48.3
Prostate
Lung & Bronchus
0 50 100 150
54.2
69.9
0 50 100 150
Death rates were notranked when the populationsize was less than 50,000or case counts were fewerthan 16 in each of the sitecategories.
0 50 100 150
Death rates were notranked when the populationsize was less than 50,000or case counts were fewerthan 16 in each of the sitecategories. Liver & IBD
Stomach
Pancreas
Leukemias
Prostate
Lung & Bronchus
Colon & Rectum
0 50 100 150
10.1
10.3
12.0
12.9
19.5
33.0
33.9
Rate† per 100,000Rate† per 100,000
Rate† per 100,000Rate† per 100,000
Rate† per 100,000Rate† per 100,000
All Races White
Black Asian/Pacific Islander‡
American Indian/Alaska Native‡ Hispanic‡§
∗ Data are from the National Vital Statistics System (NVSS).† Rates are age-adjusted to the 2000 U.S. standard population (19 age groups - Census P25-1130). See Table 2.1.1.2M-2.27.1.2M
and Appendix F.1-F.2 for 95% confidence intervals for rates. Rates are suppressed and not ranked if the population of a specific
category (race, ethnicity) is less than 50,000 or if deaths are fewer than 16.‡ Data for specified racial or ethnic populations other than white and black should be interpreted with caution. See Technical
Notes.§ Hispanic origin is not mutually exclusive from race categories (white, black, Asian/Pacific Islander, American Indian/Alaska
Native).
Note: ONS — Other Nervous System; NOS — Not Otherwise Specified; IBD — Intrahepatic Bile Duct.

United States Cancer Statistics: 2004 Incidence and Mortality
��0
Figure 3.10.F1: Age-Adjusted Invasive Cancer Incidence Rates for the 10 Primary Siteswith the Highest Rates within Race- and Ethnic-Specific Categories
Colorado,∗† Females, 2004
Pancreas
Leukemias
Ovary
Thyroid
Melanomas of the Skin
Non-Hodgkin Lymphoma
Corpus & Uterus, NOS
Colon & Rectum
Lung & Bronchus
Breast
0 50 100 150 200 250 300
10.1
10.3
13.2
15.9
16.4
16.6
20.4
42.5
46.5
118.1
Leukemias
Pancreas
Ovary
Non-Hodgkin Lymphoma
Thyroid
Melanomas of the Skin
Corpus & Uterus, NOS
Colon & Rectum
Lung & Bronchus
Breast
0 50 100 150 200 250 300
9.8
9.9
13.6
15.9
16.2
17.4
20.4
42.3
47.2
118.8
Lung & Bronchus
Colon & Rectum
Breast
0 50 100 150 200 250 300
38.4
56.9
80.4 Breast
0 50 100 150 200 250 300
57.3
0 50 100 150 200 250 300
Incidence rates were notranked when the populationsize was less than 50,000or case counts were fewerthan 16 in each of the sitecategories.
Stomach
Ovary
Non-Hodgkin Lymphoma
Kidney & Renal Pelvis
Corpus & Uterus, NOS
Thyroid
Pancreas
Lung & Bronchus
Colon & Rectum
Breast
0 50 100 150 200 250 300
10.5
10.6
11.7
14.4
14.8
16.0
18.3
39.8
44.5
101.7
Rate‡ per 100,000Rate‡ per 100,000
Rate‡ per 100,000Rate‡ per 100,000
Rate‡ per 100,000Rate‡ per 100,000
All Races White
Black Asian/Pacific Islander§
American Indian/Alaska Native§ Hispanic§�
∗ Data are from selected state and metropolitan area cancer registries that meet the data quality criteria for all invasive
cancer sites combined. See Appendix B for data quality criteria and registry-specific data quality information.† Excludes basal and squamous cell carcinomas of the skin except when these occur on the skin of the genital organs, and in
situ cancers except urinary bladder.‡ Rates are age-adjusted to the 2000 U.S. standard population (19 age groups - Census P25-1130). See Table 2.1.1.1F-2.27.1.1F
and Appendix F.1-F.2 for 95% confidence intervals for rates. Rates are suppressed and not ranked if the population of a specific
category (race, ethnicity) is less than 50,000 or if cases are fewer than 16.§ Data for specified racial or ethnic populations other than white and black should be interpreted with caution. See Technical
Notes.� Hispanic origin is not mutually exclusive from race categories (white, black, Asian/Pacific Islander, American Indian/Alaska
Native).
Note: ONS — Other Nervous System; NOS — Not Otherwise Specified; IBD — Intrahepatic Bile Duct. Ovary excludes cancers newly
classified as borderline according to ICD-O-3, beginning with 2001 diagnoses. See Technical Notes.
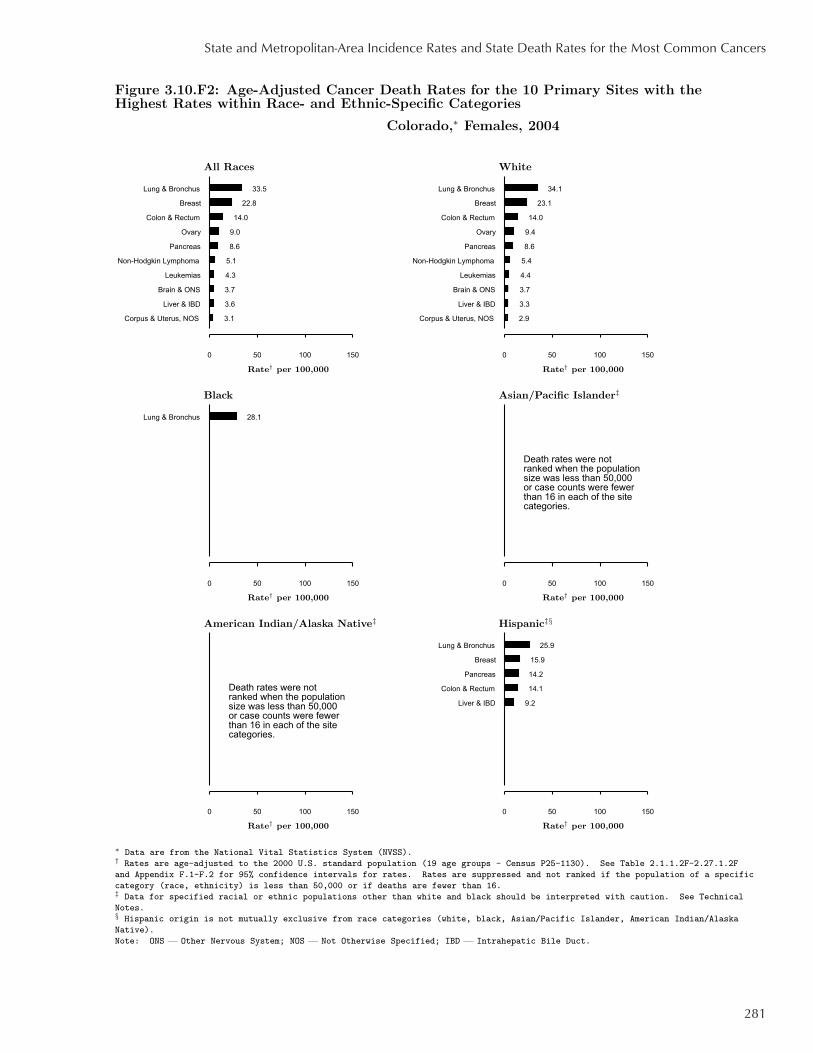
State and Metropolitan-Area Incidence Rates and State Death Rates for the Most Common Cancers
���
Figure 3.10.F2: Age-Adjusted Cancer Death Rates for the 10 Primary Sites with theHighest Rates within Race- and Ethnic-Specific Categories
Colorado,∗ Females, 2004
Corpus & Uterus, NOS
Liver & IBD
Brain & ONS
Leukemias
Non-Hodgkin Lymphoma
Pancreas
Ovary
Colon & Rectum
Breast
Lung & Bronchus
0 50 100 150
3.1
3.6
3.7
4.3
5.1
8.6
9.0
14.0
22.8
33.5
Corpus & Uterus, NOS
Liver & IBD
Brain & ONS
Leukemias
Non-Hodgkin Lymphoma
Pancreas
Ovary
Colon & Rectum
Breast
Lung & Bronchus
0 50 100 150
2.9
3.3
3.7
4.4
5.4
8.6
9.4
14.0
23.1
34.1
Lung & Bronchus
0 50 100 150
28.1
0 50 100 150
Death rates were notranked when the populationsize was less than 50,000or case counts were fewerthan 16 in each of the sitecategories.
0 50 100 150
Death rates were notranked when the populationsize was less than 50,000or case counts were fewerthan 16 in each of the sitecategories.
Liver & IBD
Colon & Rectum
Pancreas
Breast
Lung & Bronchus
0 50 100 150
9.2
14.1
14.2
15.9
25.9
Rate† per 100,000Rate† per 100,000
Rate† per 100,000Rate† per 100,000
Rate† per 100,000Rate† per 100,000
All Races White
Black Asian/Pacific Islander‡
American Indian/Alaska Native‡ Hispanic‡§
∗ Data are from the National Vital Statistics System (NVSS).† Rates are age-adjusted to the 2000 U.S. standard population (19 age groups - Census P25-1130). See Table 2.1.1.2F-2.27.1.2F
and Appendix F.1-F.2 for 95% confidence intervals for rates. Rates are suppressed and not ranked if the population of a specific
category (race, ethnicity) is less than 50,000 or if deaths are fewer than 16.‡ Data for specified racial or ethnic populations other than white and black should be interpreted with caution. See Technical
Notes.§ Hispanic origin is not mutually exclusive from race categories (white, black, Asian/Pacific Islander, American Indian/Alaska
Native).
Note: ONS — Other Nervous System; NOS — Not Otherwise Specified; IBD — Intrahepatic Bile Duct.

United States Cancer Statistics: 2004 Incidence and Mortality
���
Figure 3.11.M1: Age-Adjusted Invasive Cancer Incidence Rates for the 10 Primary Siteswith the Highest Rates within Race- and Ethnic-Specific Categories
Connecticut,∗† Males, 2004
Stomach
Oral Cavity & Pharynx
Pancreas
Kidney & Renal Pelvis
Melanomas of the Skin
Non-Hodgkin Lymphoma
Urinary Bladder
Colon & Rectum
Lung & Bronchus
Prostate
0 50 100 150 200 250 300
12.5
13.9
14.5
18.3
25.6
25.8
42.1
61.2
78.8
143.0
Leukemias
Oral Cavity & Pharynx
Pancreas
Kidney & Renal Pelvis
Non-Hodgkin Lymphoma
Melanomas of the Skin
Urinary Bladder
Colon & Rectum
Lung & Bronchus
Prostate
0 50 100 150 200 250 300
12.3
13.2
14.2
18.2
26.2
27.4
43.5
60.1
79.0
137.9
Esophagus
Urinary Bladder
Kidney & Renal Pelvis
Non-Hodgkin Lymphoma
Pancreas
Oral Cavity & Pharynx
Colon & Rectum
Lung & Bronchus
Prostate
0 50 100 150 200 250 300
17.2
18.8
19.8
20.4
20.6
26.2
79.0
91.1
215.5
0 50 100 150 200 250 300
Incidence rates were notranked when the populationsize was less than 50,000or case counts were fewerthan 16 in each of the sitecategories.
0 50 100 150 200 250 300
Incidence rates were notranked when the populationsize was less than 50,000or case counts were fewerthan 16 in each of the sitecategories. Liver & IBD
Stomach
Non-Hodgkin Lymphoma
Urinary Bladder
Colon & Rectum
Lung & Bronchus
Prostate
0 50 100 150 200 250 300
15.7
21.0
26.1
39.9
76.9
84.4
159.8
Rate‡ per 100,000Rate‡ per 100,000
Rate‡ per 100,000Rate‡ per 100,000
Rate‡ per 100,000Rate‡ per 100,000
All Races White
Black Asian/Pacific Islander§
American Indian/Alaska Native§ Hispanic§�
∗ Data are from selected state and metropolitan area cancer registries that meet the data quality criteria for all invasive
cancer sites combined. See Appendix B for data quality criteria and registry-specific data quality information.† Excludes basal and squamous cell carcinomas of the skin except when these occur on the skin of the genital organs, and in
situ cancers except urinary bladder.‡ Rates are age-adjusted to the 2000 U.S. standard population (19 age groups - Census P25-1130). See Table 2.1.1.1M-2.27.1.1M
and Appendix F.1-F.2 for 95% confidence intervals for rates. Rates are suppressed and not ranked if the population of a specific
category (race, ethnicity) is less than 50,000 or if cases are fewer than 16.§ Data for specified racial or ethnic populations other than white and black should be interpreted with caution. See Technical
Notes.� Hispanic origin is not mutually exclusive from race categories (white, black, Asian/Pacific Islander, American Indian/Alaska
Native).
Note: ONS — Other Nervous System; NOS — Not Otherwise Specified; IBD — Intrahepatic Bile Duct.

State and Metropolitan-Area Incidence Rates and State Death Rates for the Most Common Cancers
��3
Figure 3.11.M2: Age-Adjusted Cancer Death Rates for the 10 Primary Sites with theHighest Rates within Race- and Ethnic-Specific Categories
Connecticut,∗ Males, 2004
Stomach
Esophagus
Urinary Bladder
Liver & IBD
Leukemias
Non-Hodgkin Lymphoma
Pancreas
Colon & Rectum
Prostate
Lung & Bronchus
0 50 100 150
6.3
7.5
7.6
7.7
7.7
8.0
12.7
19.9
25.4
65.0
Stomach
Esophagus
Liver & IBD
Urinary Bladder
Leukemias
Non-Hodgkin Lymphoma
Pancreas
Colon & Rectum
Prostate
Lung & Bronchus
0 50 100 150
6.1
7.5
7.5
7.8
7.9
8.0
12.2
19.4
24.8
65.3
Pancreas
Colon & Rectum
Prostate
Lung & Bronchus
0 50 100 150
23.5
31.0
41.9
75.3
0 50 100 150
Death rates were notranked when the populationsize was less than 50,000or case counts were fewerthan 16 in each of the sitecategories.
0 50 100 150
Death rates were notranked when the populationsize was less than 50,000or case counts were fewerthan 16 in each of the sitecategories.
Lung & Bronchus
0 50 100 150
39.4
Rate† per 100,000Rate† per 100,000
Rate† per 100,000Rate† per 100,000
Rate† per 100,000Rate† per 100,000
All Races White
Black Asian/Pacific Islander‡
American Indian/Alaska Native‡ Hispanic‡§
∗ Data are from the National Vital Statistics System (NVSS).† Rates are age-adjusted to the 2000 U.S. standard population (19 age groups - Census P25-1130). See Table 2.1.1.2M-2.27.1.2M
and Appendix F.1-F.2 for 95% confidence intervals for rates. Rates are suppressed and not ranked if the population of a specific
category (race, ethnicity) is less than 50,000 or if deaths are fewer than 16.‡ Data for specified racial or ethnic populations other than white and black should be interpreted with caution. See Technical
Notes.§ Hispanic origin is not mutually exclusive from race categories (white, black, Asian/Pacific Islander, American Indian/Alaska
Native).
Note: ONS — Other Nervous System; NOS — Not Otherwise Specified; IBD — Intrahepatic Bile Duct.

United States Cancer Statistics: 2004 Incidence and Mortality
���
Figure 3.11.F1: Age-Adjusted Invasive Cancer Incidence Rates for the 10 Primary Siteswith the Highest Rates within Race- and Ethnic-Specific Categories
Connecticut,∗† Females, 2004
Urinary Bladder
Pancreas
Ovary
Melanomas of the Skin
Non-Hodgkin Lymphoma
Thyroid
Corpus & Uterus, NOS
Colon & Rectum
Lung & Bronchus
Breast
0 50 100 150 200 250 300
11.0
11.2
13.3
16.9
17.5
18.0
26.9
46.1
54.1
129.9
Pancreas
Urinary Bladder
Ovary
Non-Hodgkin Lymphoma
Melanomas of the Skin
Thyroid
Corpus & Uterus, NOS
Colon & Rectum
Lung & Bronchus
Breast
0 50 100 150 200 250 300
11.2
11.3
13.5
17.8
18.6
18.8
27.3
45.4
55.9
132.5
Oral Cavity & Pharynx
Thyroid
Stomach
Cervix Uteri
Pancreas
Non-Hodgkin Lymphoma
Corpus & Uterus, NOS
Lung & Bronchus
Colon & Rectum
Breast
0 50 100 150 200 250 300
10.5
11.2
11.9
12.7
13.1
13.9
21.2
35.7
46.0
113.5 Breast
0 50 100 150 200 250 300
51.5
0 50 100 150 200 250 300
Incidence rates were notranked when the populationsize was less than 50,000or case counts were fewerthan 16 in each of the sitecategories. Cervix Uteri
Non-Hodgkin Lymphoma
Thyroid
Corpus & Uterus, NOS
Lung & Bronchus
Colon & Rectum
Breast
0 50 100 150 200 250 300
12.4
16.8
19.4
20.1
28.4
51.3
115.5
Rate‡ per 100,000Rate‡ per 100,000
Rate‡ per 100,000Rate‡ per 100,000
Rate‡ per 100,000Rate‡ per 100,000
All Races White
Black Asian/Pacific Islander§
American Indian/Alaska Native§ Hispanic§�
∗ Data are from selected state and metropolitan area cancer registries that meet the data quality criteria for all invasive
cancer sites combined. See Appendix B for data quality criteria and registry-specific data quality information.† Excludes basal and squamous cell carcinomas of the skin except when these occur on the skin of the genital organs, and in
situ cancers except urinary bladder.‡ Rates are age-adjusted to the 2000 U.S. standard population (19 age groups - Census P25-1130). See Table 2.1.1.1F-2.27.1.1F
and Appendix F.1-F.2 for 95% confidence intervals for rates. Rates are suppressed and not ranked if the population of a specific
category (race, ethnicity) is less than 50,000 or if cases are fewer than 16.§ Data for specified racial or ethnic populations other than white and black should be interpreted with caution. See Technical
Notes.� Hispanic origin is not mutually exclusive from race categories (white, black, Asian/Pacific Islander, American Indian/Alaska
Native).
Note: ONS — Other Nervous System; NOS — Not Otherwise Specified; IBD — Intrahepatic Bile Duct. Ovary excludes cancers newly
classified as borderline according to ICD-O-3, beginning with 2001 diagnoses. See Technical Notes.

State and Metropolitan-Area Incidence Rates and State Death Rates for the Most Common Cancers
���
Figure 3.11.F2: Age-Adjusted Cancer Death Rates for the 10 Primary Sites with theHighest Rates within Race- and Ethnic-Specific Categories
Connecticut,∗ Females, 2004
Myeloma
Brain & ONS
Corpus & Uterus, NOS
Leukemias
Non-Hodgkin Lymphoma
Ovary
Pancreas
Colon & Rectum
Breast
Lung & Bronchus
0 50 100 150
2.8
3.6
4.6
4.9
5.7
7.8
10.8
14.4
24.7
39.0
Kidney & Renal Pelvis
Brain & ONS
Corpus & Uterus, NOS
Leukemias
Non-Hodgkin Lymphoma
Ovary
Pancreas
Colon & Rectum
Breast
Lung & Bronchus
0 50 100 150
2.7
3.8
4.5
4.7
6.0
8.0
10.9
13.9
25.0
40.4
Pancreas
Breast
Colon & Rectum
Lung & Bronchus
0 50 100 150
12.2
20.6
22.2
31.2
0 50 100 150
Death rates were notranked when the populationsize was less than 50,000or case counts were fewerthan 16 in each of the sitecategories.
0 50 100 150
Death rates were notranked when the populationsize was less than 50,000or case counts were fewerthan 16 in each of the sitecategories.
0 50 100 150
Death rates were notranked when the populationsize was less than 50,000or case counts were fewerthan 16 in each of the sitecategories.
Rate† per 100,000Rate† per 100,000
Rate† per 100,000Rate† per 100,000
Rate† per 100,000Rate† per 100,000
All Races White
Black Asian/Pacific Islander‡
American Indian/Alaska Native‡ Hispanic‡§
∗ Data are from the National Vital Statistics System (NVSS).† Rates are age-adjusted to the 2000 U.S. standard population (19 age groups - Census P25-1130). See Table 2.1.1.2F-2.27.1.2F
and Appendix F.1-F.2 for 95% confidence intervals for rates. Rates are suppressed and not ranked if the population of a specific
category (race, ethnicity) is less than 50,000 or if deaths are fewer than 16.‡ Data for specified racial or ethnic populations other than white and black should be interpreted with caution. See Technical
Notes.§ Hispanic origin is not mutually exclusive from race categories (white, black, Asian/Pacific Islander, American Indian/Alaska
Native).
Note: ONS — Other Nervous System; NOS — Not Otherwise Specified; IBD — Intrahepatic Bile Duct.

United States Cancer Statistics: 2004 Incidence and Mortality
���
Figure 3.12.M1: Age-Adjusted Invasive Cancer Incidence Rates for the 10 Primary Siteswith the Highest Rates within Race- and Ethnic-Specific Categories
Delaware,∗† Males, 2004
Leukemias
Pancreas
Oral Cavity & Pharynx
Kidney & Renal Pelvis
Non-Hodgkin Lymphoma
Melanomas of the Skin
Urinary Bladder
Colon & Rectum
Lung & Bronchus
Prostate
0 50 100 150 200 250 300
11.5
12.0
17.4
19.2
24.2
28.2
44.0
59.6
102.4
153.2
Pancreas
Leukemias
Oral Cavity & Pharynx
Kidney & Renal Pelvis
Non-Hodgkin Lymphoma
Melanomas of the Skin
Urinary Bladder
Colon & Rectum
Lung & Bronchus
Prostate
0 50 100 150 200 250 300
11.1
12.4
17.5
19.2
24.1
29.5
45.3
56.8
102.5
136.3
Urinary Bladder
Colon & Rectum
Lung & Bronchus
Prostate
0 50 100 150 200 250 300
35.8
73.3
108.5
251.0
0 50 100 150 200 250 300
Incidence rates were notranked when the populationsize was less than 50,000or case counts were fewerthan 16 in each of the sitecategories.
0 50 100 150 200 250 300
Incidence rates were notranked when the populationsize was less than 50,000or case counts were fewerthan 16 in each of the sitecategories.
0 50 100 150 200 250 300
Incidence rates were notranked when the populationsize was less than 50,000or case counts were fewerthan 16 in each of the sitecategories.
Rate‡ per 100,000Rate‡ per 100,000
Rate‡ per 100,000Rate‡ per 100,000
Rate‡ per 100,000Rate‡ per 100,000
All Races White
Black Asian/Pacific Islander§
American Indian/Alaska Native§ Hispanic§�
∗ Data are from selected state and metropolitan area cancer registries that meet the data quality criteria for all invasive
cancer sites combined. See Appendix B for data quality criteria and registry-specific data quality information.† Excludes basal and squamous cell carcinomas of the skin except when these occur on the skin of the genital organs, and in
situ cancers except urinary bladder.‡ Rates are age-adjusted to the 2000 U.S. standard population (19 age groups - Census P25-1130). See Table 2.1.1.1M-2.27.1.1M
and Appendix F.1-F.2 for 95% confidence intervals for rates. Rates are suppressed and not ranked if the population of a specific
category (race, ethnicity) is less than 50,000 or if cases are fewer than 16.§ Data for specified racial or ethnic populations other than white and black should be interpreted with caution. See Technical
Notes.� Hispanic origin is not mutually exclusive from race categories (white, black, Asian/Pacific Islander, American Indian/Alaska
Native).
Note: ONS — Other Nervous System; NOS — Not Otherwise Specified; IBD — Intrahepatic Bile Duct.

State and Metropolitan-Area Incidence Rates and State Death Rates for the Most Common Cancers
���
Figure 3.12.M2: Age-Adjusted Cancer Death Rates for the 10 Primary Sites with theHighest Rates within Race- and Ethnic-Specific Categories
Delaware,∗ Males, 2004
Kidney & Renal Pelvis
Liver & IBD
Leukemias
Pancreas
Non-Hodgkin Lymphoma
Urinary Bladder
Esophagus
Colon & Rectum
Prostate
Lung & Bronchus
0 50 100 150
6.9
7.4
9.5
9.7
10.2
10.9
11.9
22.2
31.1
85.6
Kidney & Renal Pelvis
Liver & IBD
Pancreas
Leukemias
Urinary Bladder
Non-Hodgkin Lymphoma
Esophagus
Colon & Rectum
Prostate
Lung & Bronchus
0 50 100 150
7.1
7.4
9.3
10.2
10.7
11.2
11.9
21.0
29.5
85.8
Prostate
Lung & Bronchus
0 50 100 150
45.8
87.1
0 50 100 150
Death rates were notranked when the populationsize was less than 50,000or case counts were fewerthan 16 in each of the sitecategories.
0 50 100 150
Death rates were notranked when the populationsize was less than 50,000or case counts were fewerthan 16 in each of the sitecategories.
0 50 100 150
Death rates were notranked when the populationsize was less than 50,000or case counts were fewerthan 16 in each of the sitecategories.
Rate† per 100,000Rate† per 100,000
Rate† per 100,000Rate† per 100,000
Rate† per 100,000Rate† per 100,000
All Races White
Black Asian/Pacific Islander‡
American Indian/Alaska Native‡ Hispanic‡§
∗ Data are from the National Vital Statistics System (NVSS).† Rates are age-adjusted to the 2000 U.S. standard population (19 age groups - Census P25-1130). See Table 2.1.1.2M-2.27.1.2M
and Appendix F.1-F.2 for 95% confidence intervals for rates. Rates are suppressed and not ranked if the population of a specific
category (race, ethnicity) is less than 50,000 or if deaths are fewer than 16.‡ Data for specified racial or ethnic populations other than white and black should be interpreted with caution. See Technical
Notes.§ Hispanic origin is not mutually exclusive from race categories (white, black, Asian/Pacific Islander, American Indian/Alaska
Native).
Note: ONS — Other Nervous System; NOS — Not Otherwise Specified; IBD — Intrahepatic Bile Duct.

United States Cancer Statistics: 2004 Incidence and Mortality
���
Figure 3.12.F1: Age-Adjusted Invasive Cancer Incidence Rates for the 10 Primary Siteswith the Highest Rates within Race- and Ethnic-Specific Categories
Delaware,∗† Females, 2004
Kidney & Renal Pelvis
Urinary Bladder
Non-Hodgkin Lymphoma
Ovary
Melanomas of the Skin
Thyroid
Corpus & Uterus, NOS
Colon & Rectum
Lung & Bronchus
Breast
0 50 100 150 200 250 300
12.8
13.0
15.7
15.7
16.2
16.5
25.0
39.9
62.8
115.7
Kidney & Renal Pelvis
Urinary Bladder
Non-Hodgkin Lymphoma
Ovary
Melanomas of the Skin
Thyroid
Corpus & Uterus, NOS
Colon & Rectum
Lung & Bronchus
Breast
0 50 100 150 200 250 300
12.3
14.4
16.6
17.3
17.6
18.3
25.6
37.8
62.7
112.1
Corpus & Uterus, NOS
Colon & Rectum
Lung & Bronchus
Breast
0 50 100 150 200 250 300
25.3
47.7
70.3
123.7
0 50 100 150 200 250 300
Incidence rates were notranked when the populationsize was less than 50,000or case counts were fewerthan 16 in each of the sitecategories.
0 50 100 150 200 250 300
Incidence rates were notranked when the populationsize was less than 50,000or case counts were fewerthan 16 in each of the sitecategories.
0 50 100 150 200 250 300
Incidence rates were notranked when the populationsize was less than 50,000or case counts were fewerthan 16 in each of the sitecategories.
Rate‡ per 100,000Rate‡ per 100,000
Rate‡ per 100,000Rate‡ per 100,000
Rate‡ per 100,000Rate‡ per 100,000
All Races White
Black Asian/Pacific Islander§
American Indian/Alaska Native§ Hispanic§�
∗ Data are from selected state and metropolitan area cancer registries that meet the data quality criteria for all invasive
cancer sites combined. See Appendix B for data quality criteria and registry-specific data quality information.† Excludes basal and squamous cell carcinomas of the skin except when these occur on the skin of the genital organs, and in
situ cancers except urinary bladder.‡ Rates are age-adjusted to the 2000 U.S. standard population (19 age groups - Census P25-1130). See Table 2.1.1.1F-2.27.1.1F
and Appendix F.1-F.2 for 95% confidence intervals for rates. Rates are suppressed and not ranked if the population of a specific
category (race, ethnicity) is less than 50,000 or if cases are fewer than 16.§ Data for specified racial or ethnic populations other than white and black should be interpreted with caution. See Technical
Notes.� Hispanic origin is not mutually exclusive from race categories (white, black, Asian/Pacific Islander, American Indian/Alaska
Native).
Note: ONS — Other Nervous System; NOS — Not Otherwise Specified; IBD — Intrahepatic Bile Duct. Ovary excludes cancers newly
classified as borderline according to ICD-O-3, beginning with 2001 diagnoses. See Technical Notes.

State and Metropolitan-Area Incidence Rates and State Death Rates for the Most Common Cancers
���
Figure 3.12.F2: Age-Adjusted Cancer Death Rates for the 10 Primary Sites with theHighest Rates within Race- and Ethnic-Specific Categories
Delaware,∗ Females, 2004
Esophagus
Urinary Bladder
Corpus & Uterus, NOS
Non-Hodgkin Lymphoma
Leukemias
Pancreas
Ovary
Colon & Rectum
Breast
Lung & Bronchus
0 50 100 150
3.2
3.5
5.7
6.4
6.5
9.8
10.1
15.1
26.2
50.9
Urinary Bladder
Corpus & Uterus, NOS
Non-Hodgkin Lymphoma
Leukemias
Pancreas
Ovary
Colon & Rectum
Breast
Lung & Bronchus
0 50 100 150
3.9
4.8
6.4
6.9
9.6
10.0
14.8
25.9
51.6
Breast
Lung & Bronchus
0 50 100 150
28.8
46.7
0 50 100 150
Death rates were notranked when the populationsize was less than 50,000or case counts were fewerthan 16 in each of the sitecategories.
0 50 100 150
Death rates were notranked when the populationsize was less than 50,000or case counts were fewerthan 16 in each of the sitecategories.
0 50 100 150
Death rates were notranked when the populationsize was less than 50,000or case counts were fewerthan 16 in each of the sitecategories.
Rate† per 100,000Rate† per 100,000
Rate† per 100,000Rate† per 100,000
Rate† per 100,000Rate† per 100,000
All Races White
Black Asian/Pacific Islander‡
American Indian/Alaska Native‡ Hispanic‡§
∗ Data are from the National Vital Statistics System (NVSS).† Rates are age-adjusted to the 2000 U.S. standard population (19 age groups - Census P25-1130). See Table 2.1.1.2F-2.27.1.2F
and Appendix F.1-F.2 for 95% confidence intervals for rates. Rates are suppressed and not ranked if the population of a specific
category (race, ethnicity) is less than 50,000 or if deaths are fewer than 16.‡ Data for specified racial or ethnic populations other than white and black should be interpreted with caution. See Technical
Notes.§ Hispanic origin is not mutually exclusive from race categories (white, black, Asian/Pacific Islander, American Indian/Alaska
Native).
Note: ONS — Other Nervous System; NOS — Not Otherwise Specified; IBD — Intrahepatic Bile Duct.

United States Cancer Statistics: 2004 Incidence and Mortality
��0
Figure 3.13.M1: Age-Adjusted Invasive Cancer Incidence Rates for the 10 Primary Siteswith the Highest Rates within Race- and Ethnic-Specific Categories
District of Columbia,∗† Males, 2004
Kidney & Renal Pelvis
Esophagus
Pancreas
Myeloma
Urinary Bladder
Oral Cavity & Pharynx
Non-Hodgkin Lymphoma
Colon & Rectum
Lung & Bronchus
Prostate
0 50 100 150 200 250 300
10.5
13.4
14.0
14.1
19.4
19.6
25.2
55.2
77.7
173.6
Melanomas of the Skin
Non-Hodgkin Lymphoma
Urinary Bladder
Lung & Bronchus
Colon & Rectum
Prostate
0 50 100 150 200 250 300
19.0
20.3
25.2
33.4
33.7
106.5
Pancreas
Liver & IBD
Urinary Bladder
Esophagus
Myeloma
Oral Cavity & Pharynx
Non-Hodgkin Lymphoma
Colon & Rectum
Lung & Bronchus
Prostate
0 50 100 150 200 250 300
13.8
14.8
16.1
18.9
19.2
23.9
25.0
66.1
104.1
197.2
0 50 100 150 200 250 300
Incidence rates were notranked when the populationsize was less than 50,000or case counts were fewerthan 16 in each of the sitecategories.
0 50 100 150 200 250 300
Incidence rates were notranked when the populationsize was less than 50,000or case counts were fewerthan 16 in each of the sitecategories.
0 50 100 150 200 250 300
Incidence rates were notranked when the populationsize was less than 50,000or case counts were fewerthan 16 in each of the sitecategories.
Rate‡ per 100,000Rate‡ per 100,000
Rate‡ per 100,000Rate‡ per 100,000
Rate‡ per 100,000Rate‡ per 100,000
All Races White
Black Asian/Pacific Islander§
American Indian/Alaska Native§ Hispanic§�
∗ Data are from selected state and metropolitan area cancer registries that meet the data quality criteria for all invasive
cancer sites combined. See Appendix B for data quality criteria and registry-specific data quality information.† Excludes basal and squamous cell carcinomas of the skin except when these occur on the skin of the genital organs, and in
situ cancers except urinary bladder.‡ Rates are age-adjusted to the 2000 U.S. standard population (19 age groups - Census P25-1130). See Table 2.1.1.1M-2.27.1.1M
and Appendix F.1-F.2 for 95% confidence intervals for rates. Rates are suppressed and not ranked if the population of a specific
category (race, ethnicity) is less than 50,000 or if cases are fewer than 16.§ Data for specified racial or ethnic populations other than white and black should be interpreted with caution. See Technical
Notes.� Hispanic origin is not mutually exclusive from race categories (white, black, Asian/Pacific Islander, American Indian/Alaska
Native).
Note: ONS — Other Nervous System; NOS — Not Otherwise Specified; IBD — Intrahepatic Bile Duct.

State and Metropolitan-Area Incidence Rates and State Death Rates for the Most Common Cancers
���
Figure 3.13.M2: Age-Adjusted Cancer Death Rates for the 10 Primary Sites with theHighest Rates within Race- and Ethnic-Specific Categories
District of Columbia,∗ Males, 2004
Oral Cavity & Pharynx
Liver & IBD
Stomach
Esophagus
Leukemias
Pancreas
Colon & Rectum
Prostate
Lung & Bronchus
0 50 100 150
7.7
9.2
9.5
10.0
10.4
13.5
21.3
44.8
72.8
Prostate
Lung & Bronchus
0 50 100 150
32.6
50.6
Oral Cavity & Pharynx
Liver & IBD
Esophagus
Pancreas
Colon & Rectum
Prostate
Lung & Bronchus
0 50 100 150
11.2
13.3
14.9
15.3
27.4
53.4
88.8
0 50 100 150
Death rates were notranked when the populationsize was less than 50,000or case counts were fewerthan 16 in each of the sitecategories.
0 50 100 150
Death rates were notranked when the populationsize was less than 50,000or case counts were fewerthan 16 in each of the sitecategories.
0 50 100 150
Death rates were notranked when the populationsize was less than 50,000or case counts were fewerthan 16 in each of the sitecategories.
Rate† per 100,000Rate† per 100,000
Rate† per 100,000Rate† per 100,000
Rate† per 100,000Rate† per 100,000
All Races White
Black Asian/Pacific Islander‡
American Indian/Alaska Native‡ Hispanic‡§
∗ Data are from the National Vital Statistics System (NVSS).† Rates are age-adjusted to the 2000 U.S. standard population (19 age groups - Census P25-1130). See Table 2.1.1.2M-2.27.1.2M
and Appendix F.1-F.2 for 95% confidence intervals for rates. Rates are suppressed and not ranked if the population of a specific
category (race, ethnicity) is less than 50,000 or if deaths are fewer than 16.‡ Data for specified racial or ethnic populations other than white and black should be interpreted with caution. See Technical
Notes.§ Hispanic origin is not mutually exclusive from race categories (white, black, Asian/Pacific Islander, American Indian/Alaska
Native).
Note: ONS — Other Nervous System; NOS — Not Otherwise Specified; IBD — Intrahepatic Bile Duct.

United States Cancer Statistics: 2004 Incidence and Mortality
���
Figure 3.13.F1: Age-Adjusted Invasive Cancer Incidence Rates for the 10 Primary Siteswith the Highest Rates within Race- and Ethnic-Specific Categories
District of Columbia,∗† Females, 2004
Leukemias
Thyroid
Pancreas
Non-Hodgkin Lymphoma
Cervix Uteri
Ovary
Corpus & Uterus, NOS
Lung & Bronchus
Colon & Rectum
Breast
0 50 100 150 200 250 300
8.3
11.2
11.5
12.6
13.2
16.0
28.1
42.0
46.9
129.4
Thyroid
Ovary
Lung & Bronchus
Colon & Rectum
Breast
0 50 100 150 200 250 300
17.0
17.1
27.4
30.9
127.0
Leukemias
Thyroid
Pancreas
Non-Hodgkin Lymphoma
Cervix Uteri
Ovary
Corpus & Uterus, NOS
Lung & Bronchus
Colon & Rectum
Breast
0 50 100 150 200 250 300
8.4
8.7
12.2
13.4
13.5
15.1
31.1
49.1
53.2
124.1
0 50 100 150 200 250 300
Incidence rates were notranked when the populationsize was less than 50,000or case counts were fewerthan 16 in each of the sitecategories.
0 50 100 150 200 250 300
Incidence rates were notranked when the populationsize was less than 50,000or case counts were fewerthan 16 in each of the sitecategories.
0 50 100 150 200 250 300
Incidence rates were notranked when the populationsize was less than 50,000or case counts were fewerthan 16 in each of the sitecategories.
Rate‡ per 100,000Rate‡ per 100,000
Rate‡ per 100,000Rate‡ per 100,000
Rate‡ per 100,000Rate‡ per 100,000
All Races White
Black Asian/Pacific Islander§
American Indian/Alaska Native§ Hispanic§�
∗ Data are from selected state and metropolitan area cancer registries that meet the data quality criteria for all invasive
cancer sites combined. See Appendix B for data quality criteria and registry-specific data quality information.† Excludes basal and squamous cell carcinomas of the skin except when these occur on the skin of the genital organs, and in
situ cancers except urinary bladder.‡ Rates are age-adjusted to the 2000 U.S. standard population (19 age groups - Census P25-1130). See Table 2.1.1.1F-2.27.1.1F
and Appendix F.1-F.2 for 95% confidence intervals for rates. Rates are suppressed and not ranked if the population of a specific
category (race, ethnicity) is less than 50,000 or if cases are fewer than 16.§ Data for specified racial or ethnic populations other than white and black should be interpreted with caution. See Technical
Notes.� Hispanic origin is not mutually exclusive from race categories (white, black, Asian/Pacific Islander, American Indian/Alaska
Native).
Note: ONS — Other Nervous System; NOS — Not Otherwise Specified; IBD — Intrahepatic Bile Duct. Ovary excludes cancers newly
classified as borderline according to ICD-O-3, beginning with 2001 diagnoses. See Technical Notes.
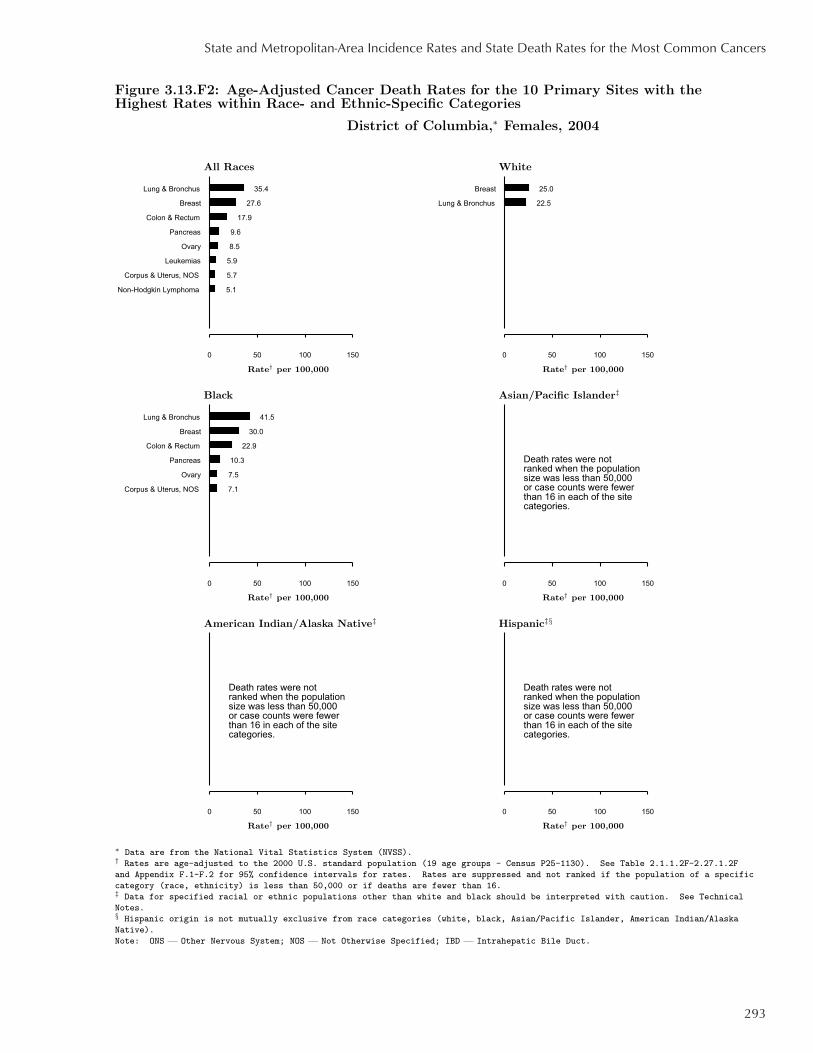
State and Metropolitan-Area Incidence Rates and State Death Rates for the Most Common Cancers
��3
Figure 3.13.F2: Age-Adjusted Cancer Death Rates for the 10 Primary Sites with theHighest Rates within Race- and Ethnic-Specific Categories
District of Columbia,∗ Females, 2004
Non-Hodgkin Lymphoma
Corpus & Uterus, NOS
Leukemias
Ovary
Pancreas
Colon & Rectum
Breast
Lung & Bronchus
0 50 100 150
5.1
5.7
5.9
8.5
9.6
17.9
27.6
35.4
Lung & Bronchus
Breast
0 50 100 150
22.5
25.0
Corpus & Uterus, NOS
Ovary
Pancreas
Colon & Rectum
Breast
Lung & Bronchus
0 50 100 150
7.1
7.5
10.3
22.9
30.0
41.5
0 50 100 150
Death rates were notranked when the populationsize was less than 50,000or case counts were fewerthan 16 in each of the sitecategories.
0 50 100 150
Death rates were notranked when the populationsize was less than 50,000or case counts were fewerthan 16 in each of the sitecategories.
0 50 100 150
Death rates were notranked when the populationsize was less than 50,000or case counts were fewerthan 16 in each of the sitecategories.
Rate† per 100,000Rate† per 100,000
Rate† per 100,000Rate† per 100,000
Rate† per 100,000Rate† per 100,000
All Races White
Black Asian/Pacific Islander‡
American Indian/Alaska Native‡ Hispanic‡§
∗ Data are from the National Vital Statistics System (NVSS).† Rates are age-adjusted to the 2000 U.S. standard population (19 age groups - Census P25-1130). See Table 2.1.1.2F-2.27.1.2F
and Appendix F.1-F.2 for 95% confidence intervals for rates. Rates are suppressed and not ranked if the population of a specific
category (race, ethnicity) is less than 50,000 or if deaths are fewer than 16.‡ Data for specified racial or ethnic populations other than white and black should be interpreted with caution. See Technical
Notes.§ Hispanic origin is not mutually exclusive from race categories (white, black, Asian/Pacific Islander, American Indian/Alaska
Native).
Note: ONS — Other Nervous System; NOS — Not Otherwise Specified; IBD — Intrahepatic Bile Duct.
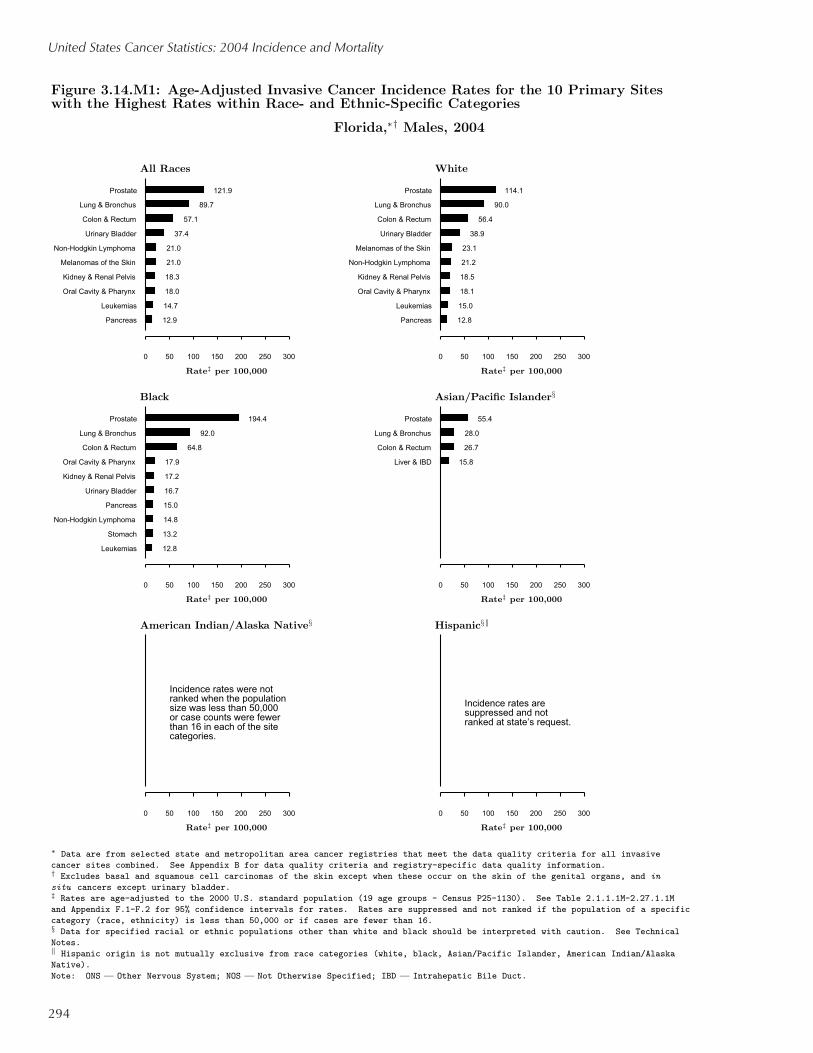
United States Cancer Statistics: 2004 Incidence and Mortality
���
Figure 3.14.M1: Age-Adjusted Invasive Cancer Incidence Rates for the 10 Primary Siteswith the Highest Rates within Race- and Ethnic-Specific Categories
Florida,∗† Males, 2004
Pancreas
Leukemias
Oral Cavity & Pharynx
Kidney & Renal Pelvis
Melanomas of the Skin
Non-Hodgkin Lymphoma
Urinary Bladder
Colon & Rectum
Lung & Bronchus
Prostate
0 50 100 150 200 250 300
12.9
14.7
18.0
18.3
21.0
21.0
37.4
57.1
89.7
121.9
Pancreas
Leukemias
Oral Cavity & Pharynx
Kidney & Renal Pelvis
Non-Hodgkin Lymphoma
Melanomas of the Skin
Urinary Bladder
Colon & Rectum
Lung & Bronchus
Prostate
0 50 100 150 200 250 300
12.8
15.0
18.1
18.5
21.2
23.1
38.9
56.4
90.0
114.1
Leukemias
Stomach
Non-Hodgkin Lymphoma
Pancreas
Urinary Bladder
Kidney & Renal Pelvis
Oral Cavity & Pharynx
Colon & Rectum
Lung & Bronchus
Prostate
0 50 100 150 200 250 300
12.8
13.2
14.8
15.0
16.7
17.2
17.9
64.8
92.0
194.4
Liver & IBD
Colon & Rectum
Lung & Bronchus
Prostate
0 50 100 150 200 250 300
15.8
26.7
28.0
55.4
0 50 100 150 200 250 300
Incidence rates were notranked when the populationsize was less than 50,000or case counts were fewerthan 16 in each of the sitecategories.
0 50 100 150 200 250 300
Incidence rates aresuppressed and notranked at state’s request.
Rate‡ per 100,000Rate‡ per 100,000
Rate‡ per 100,000Rate‡ per 100,000
Rate‡ per 100,000Rate‡ per 100,000
All Races White
Black Asian/Pacific Islander§
American Indian/Alaska Native§ Hispanic§�
∗ Data are from selected state and metropolitan area cancer registries that meet the data quality criteria for all invasive
cancer sites combined. See Appendix B for data quality criteria and registry-specific data quality information.† Excludes basal and squamous cell carcinomas of the skin except when these occur on the skin of the genital organs, and in
situ cancers except urinary bladder.‡ Rates are age-adjusted to the 2000 U.S. standard population (19 age groups - Census P25-1130). See Table 2.1.1.1M-2.27.1.1M
and Appendix F.1-F.2 for 95% confidence intervals for rates. Rates are suppressed and not ranked if the population of a specific
category (race, ethnicity) is less than 50,000 or if cases are fewer than 16.§ Data for specified racial or ethnic populations other than white and black should be interpreted with caution. See Technical
Notes.� Hispanic origin is not mutually exclusive from race categories (white, black, Asian/Pacific Islander, American Indian/Alaska
Native).
Note: ONS — Other Nervous System; NOS — Not Otherwise Specified; IBD — Intrahepatic Bile Duct.

State and Metropolitan-Area Incidence Rates and State Death Rates for the Most Common Cancers
���
Figure 3.14.M2: Age-Adjusted Cancer Death Rates for the 10 Primary Sites with theHighest Rates within Race- and Ethnic-Specific Categories
Florida,∗ Males, 2004
Stomach
Esophagus
Liver & IBD
Urinary Bladder
Non-Hodgkin Lymphoma
Leukemias
Pancreas
Colon & Rectum
Prostate
Lung & Bronchus
0 50 100 150
5.2
7.3
7.4
7.9
8.9
9.1
11.7
19.6
22.0
68.6
Kidney & Renal Pelvis
Liver & IBD
Esophagus
Urinary Bladder
Leukemias
Non-Hodgkin Lymphoma
Pancreas
Colon & Rectum
Prostate
Lung & Bronchus
0 50 100 150
5.2
7.2
7.4
8.1
9.1
9.2
11.7
18.9
20.1
68.6
Myeloma
Esophagus
Oral Cavity & Pharynx
Liver & IBD
Leukemias
Stomach
Pancreas
Colon & Rectum
Prostate
Lung & Bronchus
0 50 100 150
6.0
6.9
7.0
8.5
8.9
10.1
11.6
29.9
57.2
75.8 Lung & Bronchus
0 50 100 150
25.6
0 50 100 150
Death rates were notranked when the populationsize was less than 50,000or case counts were fewerthan 16 in each of the sitecategories.
Kidney & Renal Pelvis
Urinary Bladder
Leukemias
Stomach
Liver & IBD
Non-Hodgkin Lymphoma
Pancreas
Colon & Rectum
Prostate
Lung & Bronchus
0 50 100 150
4.7
6.5
6.6
6.6
7.4
7.9
10.9
17.4
21.4
40.3
Rate† per 100,000Rate† per 100,000
Rate† per 100,000Rate† per 100,000
Rate† per 100,000Rate† per 100,000
All Races White
Black Asian/Pacific Islander‡
American Indian/Alaska Native‡ Hispanic‡§
∗ Data are from the National Vital Statistics System (NVSS).† Rates are age-adjusted to the 2000 U.S. standard population (19 age groups - Census P25-1130). See Table 2.1.1.2M-2.27.1.2M
and Appendix F.1-F.2 for 95% confidence intervals for rates. Rates are suppressed and not ranked if the population of a specific
category (race, ethnicity) is less than 50,000 or if deaths are fewer than 16.‡ Data for specified racial or ethnic populations other than white and black should be interpreted with caution. See Technical
Notes.§ Hispanic origin is not mutually exclusive from race categories (white, black, Asian/Pacific Islander, American Indian/Alaska
Native).
Note: ONS — Other Nervous System; NOS — Not Otherwise Specified; IBD — Intrahepatic Bile Duct.

United States Cancer Statistics: 2004 Incidence and Mortality
���
Figure 3.14.F1: Age-Adjusted Invasive Cancer Incidence Rates for the 10 Primary Siteswith the Highest Rates within Race- and Ethnic-Specific Categories
Florida,∗† Females, 2004
Kidney & Renal Pelvis
Urinary Bladder
Melanomas of the Skin
Thyroid
Ovary
Non-Hodgkin Lymphoma
Corpus & Uterus, NOS
Colon & Rectum
Lung & Bronchus
Breast
0 50 100 150 200 250 300
9.3
10.2
12.9
13.0
13.2
15.0
19.7
41.6
61.4
109.2
Kidney & Renal Pelvis
Urinary Bladder
Ovary
Thyroid
Melanomas of the Skin
Non-Hodgkin Lymphoma
Corpus & Uterus, NOS
Colon & Rectum
Lung & Bronchus
Breast
0 50 100 150 200 250 300
9.5
10.6
13.8
14.1
14.9
14.9
19.6
40.6
63.8
111.1
Myeloma
Ovary
Stomach
Cervix Uteri
Pancreas
Non-Hodgkin Lymphoma
Corpus & Uterus, NOS
Lung & Bronchus
Colon & Rectum
Breast
0 50 100 150 200 250 300
9.0
9.4
9.6
10.7
11.8
14.0
22.2
40.6
48.4
95.2
Thyroid
Corpus & Uterus, NOS
Colon & Rectum
Lung & Bronchus
Breast
0 50 100 150 200 250 300
11.2
13.1
25.6
26.4
57.2
0 50 100 150 200 250 300
Incidence rates were notranked when the populationsize was less than 50,000or case counts were fewerthan 16 in each of the sitecategories.
0 50 100 150 200 250 300
Incidence rates aresuppressed and notranked at state’s request.
Rate‡ per 100,000Rate‡ per 100,000
Rate‡ per 100,000Rate‡ per 100,000
Rate‡ per 100,000Rate‡ per 100,000
All Races White
Black Asian/Pacific Islander§
American Indian/Alaska Native§ Hispanic§�
∗ Data are from selected state and metropolitan area cancer registries that meet the data quality criteria for all invasive
cancer sites combined. See Appendix B for data quality criteria and registry-specific data quality information.† Excludes basal and squamous cell carcinomas of the skin except when these occur on the skin of the genital organs, and in
situ cancers except urinary bladder.‡ Rates are age-adjusted to the 2000 U.S. standard population (19 age groups - Census P25-1130). See Table 2.1.1.1F-2.27.1.1F
and Appendix F.1-F.2 for 95% confidence intervals for rates. Rates are suppressed and not ranked if the population of a specific
category (race, ethnicity) is less than 50,000 or if cases are fewer than 16.§ Data for specified racial or ethnic populations other than white and black should be interpreted with caution. See Technical
Notes.� Hispanic origin is not mutually exclusive from race categories (white, black, Asian/Pacific Islander, American Indian/Alaska
Native).
Note: ONS — Other Nervous System; NOS — Not Otherwise Specified; IBD — Intrahepatic Bile Duct. Ovary excludes cancers newly
classified as borderline according to ICD-O-3, beginning with 2001 diagnoses. See Technical Notes.

State and Metropolitan-Area Incidence Rates and State Death Rates for the Most Common Cancers
���
Figure 3.14.F2: Age-Adjusted Cancer Death Rates for the 10 Primary Sites with theHighest Rates within Race- and Ethnic-Specific Categories
Florida,∗ Females, 2004
Myeloma
Brain & ONS
Corpus & Uterus, NOS
Leukemias
Non-Hodgkin Lymphoma
Ovary
Pancreas
Colon & Rectum
Breast
Lung & Bronchus
0 50 100 150
2.6
3.4
3.4
5.2
5.3
7.9
8.4
13.9
23.5
42.4
Liver & IBD
Corpus & Uterus, NOS
Brain & ONS
Leukemias
Non-Hodgkin Lymphoma
Pancreas
Ovary
Colon & Rectum
Breast
Lung & Bronchus
0 50 100 150
2.4
3.0
3.5
5.1
5.4
8.0
8.0
13.4
22.9
43.8
Cervix Uteri
Stomach
Leukemias
Myeloma
Ovary
Corpus & Uterus, NOS
Pancreas
Colon & Rectum
Breast
Lung & Bronchus
0 50 100 150
4.4
5.6
6.0
6.2
7.2
7.9
12.3
19.8
29.4
30.3 Lung & Bronchus
0 50 100 150
20.6
0 50 100 150
Death rates were notranked when the populationsize was less than 50,000or case counts were fewerthan 16 in each of the sitecategories.
Brain & ONS
Stomach
Liver & IBD
Leukemias
Non-Hodgkin Lymphoma
Ovary
Pancreas
Colon & Rectum
Lung & Bronchus
Breast
0 50 100 150
2.7
2.9
3.3
4.1
4.1
5.6
6.5
11.5
15.3
17.6
Rate† per 100,000Rate† per 100,000
Rate† per 100,000Rate† per 100,000
Rate† per 100,000Rate† per 100,000
All Races White
Black Asian/Pacific Islander‡
American Indian/Alaska Native‡ Hispanic‡§
∗ Data are from the National Vital Statistics System (NVSS).† Rates are age-adjusted to the 2000 U.S. standard population (19 age groups - Census P25-1130). See Table 2.1.1.2F-2.27.1.2F
and Appendix F.1-F.2 for 95% confidence intervals for rates. Rates are suppressed and not ranked if the population of a specific
category (race, ethnicity) is less than 50,000 or if deaths are fewer than 16.‡ Data for specified racial or ethnic populations other than white and black should be interpreted with caution. See Technical
Notes.§ Hispanic origin is not mutually exclusive from race categories (white, black, Asian/Pacific Islander, American Indian/Alaska
Native).
Note: ONS — Other Nervous System; NOS — Not Otherwise Specified; IBD — Intrahepatic Bile Duct.

United States Cancer Statistics: 2004 Incidence and Mortality
���
Figure 3.15.M1: Age-Adjusted Invasive Cancer Incidence Rates for the 10 Primary Siteswith the Highest Rates within Race- and Ethnic-Specific Categories
Georgia,∗† Males, 2004
Pancreas
Leukemias
Oral Cavity & Pharynx
Kidney & Renal Pelvis
Non-Hodgkin Lymphoma
Melanomas of the Skin
Urinary Bladder
Colon & Rectum
Lung & Bronchus
Prostate
0 50 100 150 200 250 300
13.0
15.4
16.8
18.4
21.7
24.9
34.1
59.7
101.4
156.6
Pancreas
Leukemias
Oral Cavity & Pharynx
Kidney & Renal Pelvis
Non-Hodgkin Lymphoma
Melanomas of the Skin
Urinary Bladder
Colon & Rectum
Lung & Bronchus
Prostate
0 50 100 150 200 250 300
12.4
16.0
17.4
18.7
22.1
31.8
38.0
57.0
100.7
134.4
Myeloma
Stomach
Oral Cavity & Pharynx
Pancreas
Kidney & Renal Pelvis
Non-Hodgkin Lymphoma
Urinary Bladder
Colon & Rectum
Lung & Bronchus
Prostate
0 50 100 150 200 250 300
13.9
14.5
14.5
15.4
18.5
19.2
20.3
70.8
108.8
245.4
Lung & Bronchus
Colon & Rectum
Prostate
0 50 100 150 200 250 300
34.5
47.6
81.1
0 50 100 150 200 250 300
Incidence rates were notranked when the populationsize was less than 50,000or case counts were fewerthan 16 in each of the sitecategories.
Leukemias
Non-Hodgkin Lymphoma
Lung & Bronchus
Colon & Rectum
Prostate
0 50 100 150 200 250 300
11.2
18.8
37.1
38.9
100.1
Rate‡ per 100,000Rate‡ per 100,000
Rate‡ per 100,000Rate‡ per 100,000
Rate‡ per 100,000Rate‡ per 100,000
All Races White
Black Asian/Pacific Islander§
American Indian/Alaska Native§ Hispanic§�
∗ Data are from selected state and metropolitan area cancer registries that meet the data quality criteria for all invasive
cancer sites combined. See Appendix B for data quality criteria and registry-specific data quality information.† Excludes basal and squamous cell carcinomas of the skin except when these occur on the skin of the genital organs, and in
situ cancers except urinary bladder.‡ Rates are age-adjusted to the 2000 U.S. standard population (19 age groups - Census P25-1130). See Table 2.1.1.1M-2.27.1.1M
and Appendix F.1-F.2 for 95% confidence intervals for rates. Rates are suppressed and not ranked if the population of a specific
category (race, ethnicity) is less than 50,000 or if cases are fewer than 16.§ Data for specified racial or ethnic populations other than white and black should be interpreted with caution. See Technical
Notes.� Hispanic origin is not mutually exclusive from race categories (white, black, Asian/Pacific Islander, American Indian/Alaska
Native).
Note: ONS — Other Nervous System; NOS — Not Otherwise Specified; IBD — Intrahepatic Bile Duct.

State and Metropolitan-Area Incidence Rates and State Death Rates for the Most Common Cancers
���
Figure 3.15.M2: Age-Adjusted Cancer Death Rates for the 10 Primary Sites with theHighest Rates within Race- and Ethnic-Specific Categories
Georgia,∗ Males, 2004
Liver & IBD
Kidney & Renal Pelvis
Urinary Bladder
Esophagus
Non-Hodgkin Lymphoma
Leukemias
Pancreas
Colon & Rectum
Prostate
Lung & Bronchus
0 50 100 150
6.0
6.1
6.6
8.1
9.0
9.9
13.4
21.9
29.3
86.1
Liver & IBD
Kidney & Renal Pelvis
Urinary Bladder
Esophagus
Non-Hodgkin Lymphoma
Leukemias
Pancreas
Colon & Rectum
Prostate
Lung & Bronchus
0 50 100 150
5.5
5.9
7.1
7.5
9.6
10.4
13.4
20.2
21.5
86.7
Oral Cavity & Pharynx
Liver & IBD
Kidney & Renal Pelvis
Leukemias
Esophagus
Stomach
Pancreas
Colon & Rectum
Prostate
Lung & Bronchus
0 50 100 150
7.1
7.3
7.3
8.2
11.4
12.4
13.9
29.8
65.3
89.1
0 50 100 150
Death rates were notranked when the populationsize was less than 50,000or case counts were fewerthan 16 in each of the sitecategories.
0 50 100 150
Death rates were notranked when the populationsize was less than 50,000or case counts were fewerthan 16 in each of the sitecategories.
Lung & Bronchus
0 50 100 150
25.6
Rate† per 100,000Rate† per 100,000
Rate† per 100,000Rate† per 100,000
Rate† per 100,000Rate† per 100,000
All Races White
Black Asian/Pacific Islander‡
American Indian/Alaska Native‡ Hispanic‡§
∗ Data are from the National Vital Statistics System (NVSS).† Rates are age-adjusted to the 2000 U.S. standard population (19 age groups - Census P25-1130). See Table 2.1.1.2M-2.27.1.2M
and Appendix F.1-F.2 for 95% confidence intervals for rates. Rates are suppressed and not ranked if the population of a specific
category (race, ethnicity) is less than 50,000 or if deaths are fewer than 16.‡ Data for specified racial or ethnic populations other than white and black should be interpreted with caution. See Technical
Notes.§ Hispanic origin is not mutually exclusive from race categories (white, black, Asian/Pacific Islander, American Indian/Alaska
Native).
Note: ONS — Other Nervous System; NOS — Not Otherwise Specified; IBD — Intrahepatic Bile Duct.

United States Cancer Statistics: 2004 Incidence and Mortality
300
Figure 3.15.F1: Age-Adjusted Invasive Cancer Incidence Rates for the 10 Primary Siteswith the Highest Rates within Race- and Ethnic-Specific Categories
Georgia,∗† Females, 2004
Leukemias
Kidney & Renal Pelvis
Thyroid
Ovary
Non-Hodgkin Lymphoma
Melanomas of the Skin
Corpus & Uterus, NOS
Colon & Rectum
Lung & Bronchus
Breast
0 50 100 150 200 250 300
9.5
9.6
11.5
12.1
15.1
15.5
17.1
43.9
52.8
121.5
Urinary Bladder
Leukemias
Ovary
Thyroid
Non-Hodgkin Lymphoma
Corpus & Uterus, NOS
Melanomas of the Skin
Colon & Rectum
Lung & Bronchus
Breast
0 50 100 150 200 250 300
9.5
10.0
12.8
13.1
16.5
16.7
21.3
40.0
57.1
123.3
Leukemias
Ovary
Non-Hodgkin Lymphoma
Kidney & Renal Pelvis
Cervix Uteri
Pancreas
Corpus & Uterus, NOS
Lung & Bronchus
Colon & Rectum
Breast
0 50 100 150 200 250 300
7.9
9.7
9.9
9.9
10.6
12.8
18.6
40.8
56.3
116.8
Colon & Rectum
Breast
0 50 100 150 200 250 300
33.5
72.4
0 50 100 150 200 250 300
Incidence rates were notranked when the populationsize was less than 50,000or case counts were fewerthan 16 in each of the sitecategories. Leukemias
Thyroid
Cervix Uteri
Corpus & Uterus, NOS
Lung & Bronchus
Colon & Rectum
Breast
0 50 100 150 200 250 300
11.7
12.5
13.7
17.7
26.1
33.0
100.2
Rate‡ per 100,000Rate‡ per 100,000
Rate‡ per 100,000Rate‡ per 100,000
Rate‡ per 100,000Rate‡ per 100,000
All Races White
Black Asian/Pacific Islander§
American Indian/Alaska Native§ Hispanic§�
∗ Data are from selected state and metropolitan area cancer registries that meet the data quality criteria for all invasive
cancer sites combined. See Appendix B for data quality criteria and registry-specific data quality information.† Excludes basal and squamous cell carcinomas of the skin except when these occur on the skin of the genital organs, and in
situ cancers except urinary bladder.‡ Rates are age-adjusted to the 2000 U.S. standard population (19 age groups - Census P25-1130). See Table 2.1.1.1F-2.27.1.1F
and Appendix F.1-F.2 for 95% confidence intervals for rates. Rates are suppressed and not ranked if the population of a specific
category (race, ethnicity) is less than 50,000 or if cases are fewer than 16.§ Data for specified racial or ethnic populations other than white and black should be interpreted with caution. See Technical
Notes.� Hispanic origin is not mutually exclusive from race categories (white, black, Asian/Pacific Islander, American Indian/Alaska
Native).
Note: ONS — Other Nervous System; NOS — Not Otherwise Specified; IBD — Intrahepatic Bile Duct. Ovary excludes cancers newly
classified as borderline according to ICD-O-3, beginning with 2001 diagnoses. See Technical Notes.
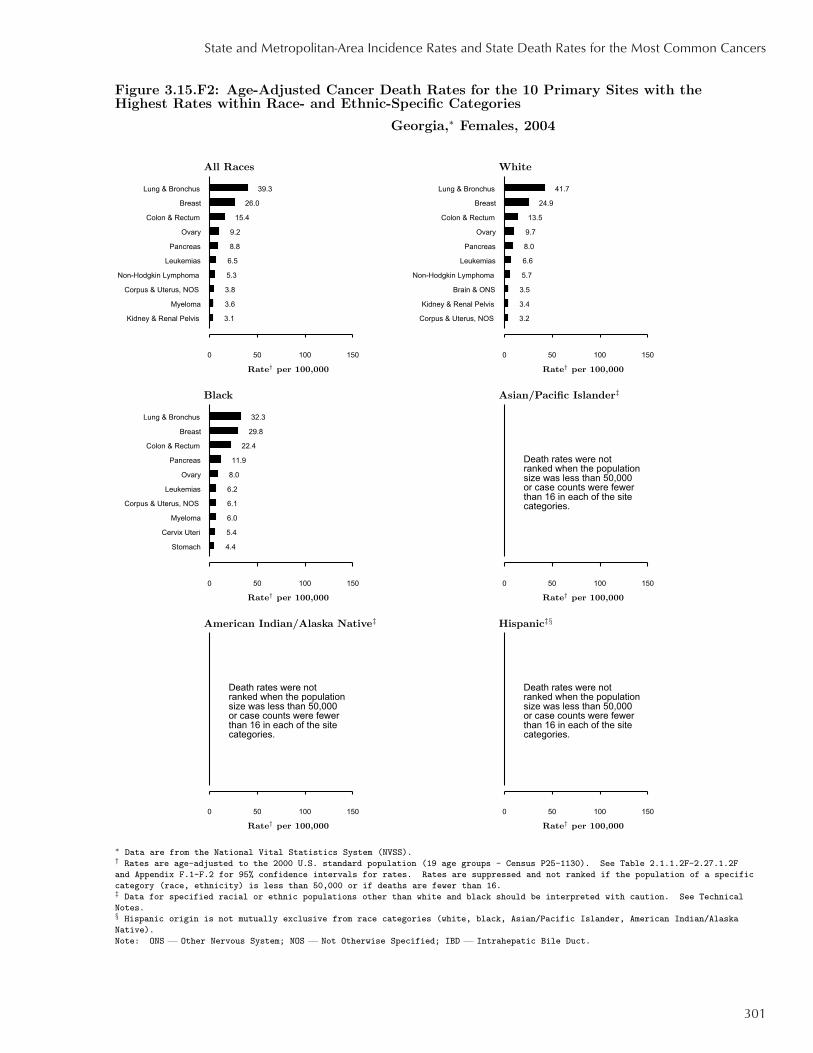
State and Metropolitan-Area Incidence Rates and State Death Rates for the Most Common Cancers
30�
Figure 3.15.F2: Age-Adjusted Cancer Death Rates for the 10 Primary Sites with theHighest Rates within Race- and Ethnic-Specific Categories
Georgia,∗ Females, 2004
Kidney & Renal Pelvis
Myeloma
Corpus & Uterus, NOS
Non-Hodgkin Lymphoma
Leukemias
Pancreas
Ovary
Colon & Rectum
Breast
Lung & Bronchus
0 50 100 150
3.1
3.6
3.8
5.3
6.5
8.8
9.2
15.4
26.0
39.3
Corpus & Uterus, NOS
Kidney & Renal Pelvis
Brain & ONS
Non-Hodgkin Lymphoma
Leukemias
Pancreas
Ovary
Colon & Rectum
Breast
Lung & Bronchus
0 50 100 150
3.2
3.4
3.5
5.7
6.6
8.0
9.7
13.5
24.9
41.7
Stomach
Cervix Uteri
Myeloma
Corpus & Uterus, NOS
Leukemias
Ovary
Pancreas
Colon & Rectum
Breast
Lung & Bronchus
0 50 100 150
4.4
5.4
6.0
6.1
6.2
8.0
11.9
22.4
29.8
32.3
0 50 100 150
Death rates were notranked when the populationsize was less than 50,000or case counts were fewerthan 16 in each of the sitecategories.
0 50 100 150
Death rates were notranked when the populationsize was less than 50,000or case counts were fewerthan 16 in each of the sitecategories.
0 50 100 150
Death rates were notranked when the populationsize was less than 50,000or case counts were fewerthan 16 in each of the sitecategories.
Rate† per 100,000Rate† per 100,000
Rate† per 100,000Rate† per 100,000
Rate† per 100,000Rate† per 100,000
All Races White
Black Asian/Pacific Islander‡
American Indian/Alaska Native‡ Hispanic‡§
∗ Data are from the National Vital Statistics System (NVSS).† Rates are age-adjusted to the 2000 U.S. standard population (19 age groups - Census P25-1130). See Table 2.1.1.2F-2.27.1.2F
and Appendix F.1-F.2 for 95% confidence intervals for rates. Rates are suppressed and not ranked if the population of a specific
category (race, ethnicity) is less than 50,000 or if deaths are fewer than 16.‡ Data for specified racial or ethnic populations other than white and black should be interpreted with caution. See Technical
Notes.§ Hispanic origin is not mutually exclusive from race categories (white, black, Asian/Pacific Islander, American Indian/Alaska
Native).
Note: ONS — Other Nervous System; NOS — Not Otherwise Specified; IBD — Intrahepatic Bile Duct.

United States Cancer Statistics: 2004 Incidence and Mortality
30�
Figure 3.16.M1: Age-Adjusted Invasive Cancer Incidence Rates for the 10 Primary Siteswith the Highest Rates within Race- and Ethnic-Specific Categories
Atlanta,∗† Males, 2004
Pancreas
Oral Cavity & Pharynx
Leukemias
Kidney & Renal Pelvis
Non-Hodgkin Lymphoma
Urinary Bladder
Melanomas of the Skin
Colon & Rectum
Lung & Bronchus
Prostate
0 50 100 150 200 250 300
13.5
14.5
15.6
16.8
26.0
29.9
30.0
53.5
76.9
157.7
Pancreas
Oral Cavity & Pharynx
Leukemias
Kidney & Renal Pelvis
Non-Hodgkin Lymphoma
Urinary Bladder
Melanomas of the Skin
Colon & Rectum
Lung & Bronchus
Prostate
0 50 100 150 200 250 300
12.4
14.2
17.2
17.3
25.3
35.2
42.1
52.0
71.2
131.9
Leukemias
Myeloma
Oral Cavity & Pharynx
Pancreas
Urinary Bladder
Kidney & Renal Pelvis
Non-Hodgkin Lymphoma
Colon & Rectum
Lung & Bronchus
Prostate
0 50 100 150 200 250 300
12.3
13.6
15.8
16.7
17.3
17.5
27.8
57.8
100.0
244.3
Colon & Rectum
Prostate
0 50 100 150 200 250 300
48.3
97.0
0 50 100 150 200 250 300
Incidence rates were notranked when the populationsize was less than 50,000or case counts were fewerthan 16 in each of the sitecategories.
Colon & Rectum
Prostate
0 50 100 150 200 250 300
41.5
97.4
Rate‡ per 100,000Rate‡ per 100,000
Rate‡ per 100,000Rate‡ per 100,000
Rate‡ per 100,000Rate‡ per 100,000
All Races White
Black Asian/Pacific Islander§
American Indian/Alaska Native§ Hispanic§�
∗ Data are from selected state and metropolitan area cancer registries that meet the data quality criteria for all invasive
cancer sites combined. See Appendix B for data quality criteria and registry-specific data quality information.† Excludes basal and squamous cell carcinomas of the skin except when these occur on the skin of the genital organs, and in
situ cancers except urinary bladder.‡ Rates are age-adjusted to the 2000 U.S. standard population (19 age groups - Census P25-1130). See Table 2.1.1.1M-2.27.1.1M
and Appendix F.1-F.2 for 95% confidence intervals for rates. Rates are suppressed and not ranked if the population of a specific
category (race, ethnicity) is less than 50,000 or if cases are fewer than 16.§ Data for specified racial or ethnic populations other than white and black should be interpreted with caution. See Technical
Notes.� Hispanic origin is not mutually exclusive from race categories (white, black, Asian/Pacific Islander, American Indian/Alaska
Native).
Note: ONS — Other Nervous System; NOS — Not Otherwise Specified; IBD — Intrahepatic Bile Duct.

State and Metropolitan-Area Incidence Rates and State Death Rates for the Most Common Cancers
303
Mortality data are not presented for metropolitan areas.

United States Cancer Statistics: 2004 Incidence and Mortality
30�
Figure 3.16.F1: Age-Adjusted Invasive Cancer Incidence Rates for the 10 Primary Siteswith the Highest Rates within Race- and Ethnic-Specific Categories
Atlanta,∗† Females, 2004
Urinary Bladder
Pancreas
Thyroid
Ovary
Non-Hodgkin Lymphoma
Melanomas of the Skin
Corpus & Uterus, NOS
Colon & Rectum
Lung & Bronchus
Breast
0 50 100 150 200 250 300
8.9
8.9
12.3
12.4
14.4
17.4
18.6
39.6
47.7
126.3
Pancreas
Urinary Bladder
Ovary
Thyroid
Non-Hodgkin Lymphoma
Corpus & Uterus, NOS
Melanomas of the Skin
Colon & Rectum
Lung & Bronchus
Breast
0 50 100 150 200 250 300
9.5
9.9
13.8
15.2
16.6
19.9
27.8
34.3
50.4
131.0
Myeloma
Leukemias
Kidney & Renal Pelvis
Non-Hodgkin Lymphoma
Ovary
Cervix Uteri
Corpus & Uterus, NOS
Lung & Bronchus
Colon & Rectum
Breast
0 50 100 150 200 250 300
8.7
9.1
9.5
9.7
9.7
11.4
16.2
43.0
53.6
121.7 Breast
0 50 100 150 200 250 300
70.7
0 50 100 150 200 250 300
Incidence rates were notranked when the populationsize was less than 50,000or case counts were fewerthan 16 in each of the sitecategories.
Breast
0 50 100 150 200 250 300
84.9
Rate‡ per 100,000Rate‡ per 100,000
Rate‡ per 100,000Rate‡ per 100,000
Rate‡ per 100,000Rate‡ per 100,000
All Races White
Black Asian/Pacific Islander§
American Indian/Alaska Native§ Hispanic§�
∗ Data are from selected state and metropolitan area cancer registries that meet the data quality criteria for all invasive
cancer sites combined. See Appendix B for data quality criteria and registry-specific data quality information.† Excludes basal and squamous cell carcinomas of the skin except when these occur on the skin of the genital organs, and in
situ cancers except urinary bladder.‡ Rates are age-adjusted to the 2000 U.S. standard population (19 age groups - Census P25-1130). See Table 2.1.1.1F-2.27.1.1F
and Appendix F.1-F.2 for 95% confidence intervals for rates. Rates are suppressed and not ranked if the population of a specific
category (race, ethnicity) is less than 50,000 or if cases are fewer than 16.§ Data for specified racial or ethnic populations other than white and black should be interpreted with caution. See Technical
Notes.� Hispanic origin is not mutually exclusive from race categories (white, black, Asian/Pacific Islander, American Indian/Alaska
Native).
Note: ONS — Other Nervous System; NOS — Not Otherwise Specified; IBD — Intrahepatic Bile Duct. Ovary excludes cancers newly
classified as borderline according to ICD-O-3, beginning with 2001 diagnoses. See Technical Notes.

State and Metropolitan-Area Incidence Rates and State Death Rates for the Most Common Cancers
30�
Mortality data are not presented for metropolitan areas.

United States Cancer Statistics: 2004 Incidence and Mortality
30�
Figure 3.17.M1: Age-Adjusted Invasive Cancer Incidence Rates for the 10 Primary Siteswith the Highest Rates within Race- and Ethnic-Specific Categories
Hawaii,∗† Males, 2004
Leukemias
Kidney & Renal Pelvis
Oral Cavity & Pharynx
Non-Hodgkin Lymphoma
Stomach
Melanomas of the Skin
Urinary Bladder
Colon & Rectum
Lung & Bronchus
Prostate
0 50 100 150 200 250 300
12.3
14.2
15.3
16.5
18.4
26.7
27.4
59.5
71.6
136.0
Myeloma
Leukemias
Kidney & Renal Pelvis
Non-Hodgkin Lymphoma
Oral Cavity & Pharynx
Urinary Bladder
Colon & Rectum
Lung & Bronchus
Melanomas of the Skin
Prostate
0 50 100 150 200 250 300
11.3
13.8
19.5
22.8
23.3
40.5
55.0
81.5
89.3
167.5
0 50 100 150 200 250 300
Incidence rates were notranked when the populationsize was less than 50,000or case counts were fewerthan 16 in each of the sitecategories.
Kidney & Renal Pelvis
Oral Cavity & Pharynx
Pancreas
Liver & IBD
Non-Hodgkin Lymphoma
Stomach
Urinary Bladder
Colon & Rectum
Lung & Bronchus
Prostate
0 50 100 150 200 250 300
11.6
12.0
12.6
12.7
14.4
21.0
22.7
60.8
69.0
121.0
0 50 100 150 200 250 300
Incidence rates were notranked when the populationsize was less than 50,000or case counts were fewerthan 16 in each of the sitecategories.
0 50 100 150 200 250 300
Incidence rates were notranked when the populationsize was less than 50,000or case counts were fewerthan 16 in each of the sitecategories.
Rate‡ per 100,000Rate‡ per 100,000
Rate‡ per 100,000Rate‡ per 100,000
Rate‡ per 100,000Rate‡ per 100,000
All Races White
Black Asian/Pacific Islander§
American Indian/Alaska Native§ Hispanic§�
∗ Data are from selected state and metropolitan area cancer registries that meet the data quality criteria for all invasive
cancer sites combined. See Appendix B for data quality criteria and registry-specific data quality information.† Excludes basal and squamous cell carcinomas of the skin except when these occur on the skin of the genital organs, and in
situ cancers except urinary bladder.‡ Rates are age-adjusted to the 2000 U.S. standard population (19 age groups - Census P25-1130). See Table 2.1.1.1M-2.27.1.1M
and Appendix F.1-F.2 for 95% confidence intervals for rates. Rates are suppressed and not ranked if the population of a specific
category (race, ethnicity) is less than 50,000 or if cases are fewer than 16.§ Data for specified racial or ethnic populations other than white and black should be interpreted with caution. See Technical
Notes.� Hispanic origin is not mutually exclusive from race categories (white, black, Asian/Pacific Islander, American Indian/Alaska
Native).
Note: ONS — Other Nervous System; NOS — Not Otherwise Specified; IBD — Intrahepatic Bile Duct.

State and Metropolitan-Area Incidence Rates and State Death Rates for the Most Common Cancers
30�
Figure 3.17.M2: Age-Adjusted Cancer Death Rates for the 10 Primary Sites with theHighest Rates within Race- and Ethnic-Specific Categories
Hawaii,∗ Males, 2004
Esophagus
Urinary Bladder
Non-Hodgkin Lymphoma
Leukemias
Stomach
Liver & IBD
Pancreas
Colon & Rectum
Prostate
Lung & Bronchus
0 50 100 150
4.7
5.0
6.6
7.3
10.6
11.4
13.6
18.5
18.9
51.2
Liver & IBD
Colon & Rectum
Prostate
Lung & Bronchus
0 50 100 150
9.2
15.8
30.5
48.6
0 50 100 150
Death rates were notranked when the populationsize was less than 50,000or case counts were fewerthan 16 in each of the sitecategories.
Esophagus
Urinary Bladder
Non-Hodgkin Lymphoma
Leukemias
Stomach
Liver & IBD
Pancreas
Prostate
Colon & Rectum
Lung & Bronchus
0 50 100 150
3.9
5.0
5.6
6.9
12.3
12.6
15.4
15.6
19.8
52.0
0 50 100 150
Death rates were notranked when the populationsize was less than 50,000or case counts were fewerthan 16 in each of the sitecategories.
0 50 100 150
Death rates were notranked when the populationsize was less than 50,000or case counts were fewerthan 16 in each of the sitecategories.
Rate† per 100,000Rate† per 100,000
Rate† per 100,000Rate† per 100,000
Rate† per 100,000Rate† per 100,000
All Races White
Black Asian/Pacific Islander‡
American Indian/Alaska Native‡ Hispanic‡§
∗ Data are from the National Vital Statistics System (NVSS).† Rates are age-adjusted to the 2000 U.S. standard population (19 age groups - Census P25-1130). See Table 2.1.1.2M-2.27.1.2M
and Appendix F.1-F.2 for 95% confidence intervals for rates. Rates are suppressed and not ranked if the population of a specific
category (race, ethnicity) is less than 50,000 or if deaths are fewer than 16.‡ Data for specified racial or ethnic populations other than white and black should be interpreted with caution. See Technical
Notes.§ Hispanic origin is not mutually exclusive from race categories (white, black, Asian/Pacific Islander, American Indian/Alaska
Native).
Note: ONS — Other Nervous System; NOS — Not Otherwise Specified; IBD — Intrahepatic Bile Duct.

United States Cancer Statistics: 2004 Incidence and Mortality
30�
Figure 3.17.F1: Age-Adjusted Invasive Cancer Incidence Rates for the 10 Primary Siteswith the Highest Rates within Race- and Ethnic-Specific Categories
Hawaii,∗† Females, 2004
Leukemias
Ovary
Pancreas
Non-Hodgkin Lymphoma
Thyroid
Melanomas of the Skin
Corpus & Uterus, NOS
Lung & Bronchus
Colon & Rectum
Breast
0 50 100 150 200 250 300
8.1
10.6
10.8
13.4
14.2
16.3
26.9
40.8
44.2
119.9
Pancreas
Ovary
Thyroid
Urinary Bladder
Non-Hodgkin Lymphoma
Corpus & Uterus, NOS
Colon & Rectum
Lung & Bronchus
Melanomas of the Skin
Breast
0 50 100 150 200 250 300
9.6
12.1
12.9
13.6
15.4
21.0
49.6
51.4
56.8
145.7
0 50 100 150 200 250 300
Incidence rates were notranked when the populationsize was less than 50,000or case counts were fewerthan 16 in each of the sitecategories.
Leukemias
Stomach
Ovary
Pancreas
Non-Hodgkin Lymphoma
Thyroid
Corpus & Uterus, NOS
Lung & Bronchus
Colon & Rectum
Breast
0 50 100 150 200 250 300
7.4
8.3
10.1
11.5
12.1
13.0
27.6
37.3
41.3
111.2
0 50 100 150 200 250 300
Incidence rates were notranked when the populationsize was less than 50,000or case counts were fewerthan 16 in each of the sitecategories.
0 50 100 150 200 250 300
Incidence rates were notranked when the populationsize was less than 50,000or case counts were fewerthan 16 in each of the sitecategories.
Rate‡ per 100,000Rate‡ per 100,000
Rate‡ per 100,000Rate‡ per 100,000
Rate‡ per 100,000Rate‡ per 100,000
All Races White
Black Asian/Pacific Islander§
American Indian/Alaska Native§ Hispanic§�
∗ Data are from selected state and metropolitan area cancer registries that meet the data quality criteria for all invasive
cancer sites combined. See Appendix B for data quality criteria and registry-specific data quality information.† Excludes basal and squamous cell carcinomas of the skin except when these occur on the skin of the genital organs, and in
situ cancers except urinary bladder.‡ Rates are age-adjusted to the 2000 U.S. standard population (19 age groups - Census P25-1130). See Table 2.1.1.1F-2.27.1.1F
and Appendix F.1-F.2 for 95% confidence intervals for rates. Rates are suppressed and not ranked if the population of a specific
category (race, ethnicity) is less than 50,000 or if cases are fewer than 16.§ Data for specified racial or ethnic populations other than white and black should be interpreted with caution. See Technical
Notes.� Hispanic origin is not mutually exclusive from race categories (white, black, Asian/Pacific Islander, American Indian/Alaska
Native).
Note: ONS — Other Nervous System; NOS — Not Otherwise Specified; IBD — Intrahepatic Bile Duct. Ovary excludes cancers newly
classified as borderline according to ICD-O-3, beginning with 2001 diagnoses. See Technical Notes.

State and Metropolitan-Area Incidence Rates and State Death Rates for the Most Common Cancers
30�
Figure 3.17.F2: Age-Adjusted Cancer Death Rates for the 10 Primary Sites with theHighest Rates within Race- and Ethnic-Specific Categories
Hawaii,∗ Females, 2004
Leukemias
Corpus & Uterus, NOS
Stomach
Non-Hodgkin Lymphoma
Liver & IBD
Ovary
Colon & Rectum
Pancreas
Breast
Lung & Bronchus
0 50 100 150
2.5
3.4
3.5
4.3
5.1
7.5
9.4
10.3
15.6
27.0
Colon & Rectum
Ovary
Breast
Lung & Bronchus
0 50 100 150
10.0
11.8
21.7
36.0
0 50 100 150
Death rates were notranked when the populationsize was less than 50,000or case counts were fewerthan 16 in each of the sitecategories.
Corpus & Uterus, NOS
Stomach
Non-Hodgkin Lymphoma
Liver & IBD
Ovary
Colon & Rectum
Pancreas
Breast
Lung & Bronchus
0 50 100 150
3.7
4.0
4.5
5.6
6.2
9.4
11.0
14.0
24.3
0 50 100 150
Death rates were notranked when the populationsize was less than 50,000or case counts were fewerthan 16 in each of the sitecategories.
0 50 100 150
Death rates were notranked when the populationsize was less than 50,000or case counts were fewerthan 16 in each of the sitecategories.
Rate† per 100,000Rate† per 100,000
Rate† per 100,000Rate† per 100,000
Rate† per 100,000Rate† per 100,000
All Races White
Black Asian/Pacific Islander‡
American Indian/Alaska Native‡ Hispanic‡§
∗ Data are from the National Vital Statistics System (NVSS).† Rates are age-adjusted to the 2000 U.S. standard population (19 age groups - Census P25-1130). See Table 2.1.1.2F-2.27.1.2F
and Appendix F.1-F.2 for 95% confidence intervals for rates. Rates are suppressed and not ranked if the population of a specific
category (race, ethnicity) is less than 50,000 or if deaths are fewer than 16.‡ Data for specified racial or ethnic populations other than white and black should be interpreted with caution. See Technical
Notes.§ Hispanic origin is not mutually exclusive from race categories (white, black, Asian/Pacific Islander, American Indian/Alaska
Native).
Note: ONS — Other Nervous System; NOS — Not Otherwise Specified; IBD — Intrahepatic Bile Duct.
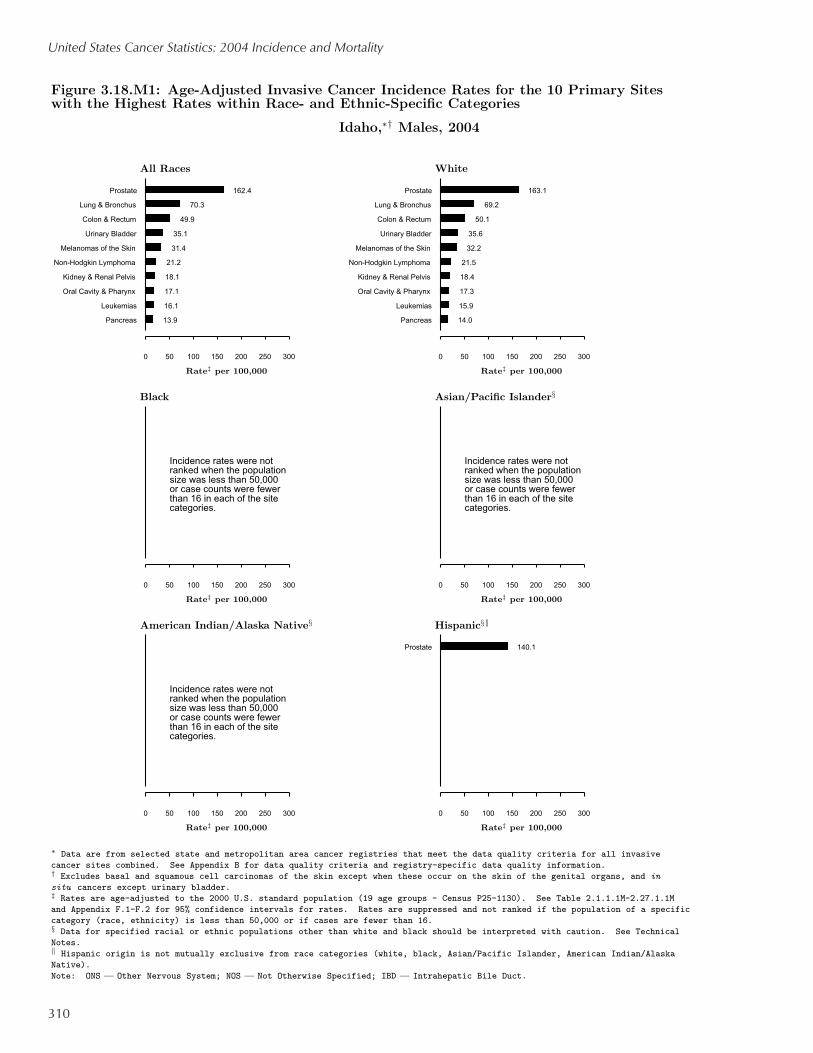
United States Cancer Statistics: 2004 Incidence and Mortality
3�0
Figure 3.18.M1: Age-Adjusted Invasive Cancer Incidence Rates for the 10 Primary Siteswith the Highest Rates within Race- and Ethnic-Specific Categories
Idaho,∗† Males, 2004
Pancreas
Leukemias
Oral Cavity & Pharynx
Kidney & Renal Pelvis
Non-Hodgkin Lymphoma
Melanomas of the Skin
Urinary Bladder
Colon & Rectum
Lung & Bronchus
Prostate
0 50 100 150 200 250 300
13.9
16.1
17.1
18.1
21.2
31.4
35.1
49.9
70.3
162.4
Pancreas
Leukemias
Oral Cavity & Pharynx
Kidney & Renal Pelvis
Non-Hodgkin Lymphoma
Melanomas of the Skin
Urinary Bladder
Colon & Rectum
Lung & Bronchus
Prostate
0 50 100 150 200 250 300
14.0
15.9
17.3
18.4
21.5
32.2
35.6
50.1
69.2
163.1
0 50 100 150 200 250 300
Incidence rates were notranked when the populationsize was less than 50,000or case counts were fewerthan 16 in each of the sitecategories.
0 50 100 150 200 250 300
Incidence rates were notranked when the populationsize was less than 50,000or case counts were fewerthan 16 in each of the sitecategories.
0 50 100 150 200 250 300
Incidence rates were notranked when the populationsize was less than 50,000or case counts were fewerthan 16 in each of the sitecategories.
Prostate
0 50 100 150 200 250 300
140.1
Rate‡ per 100,000Rate‡ per 100,000
Rate‡ per 100,000Rate‡ per 100,000
Rate‡ per 100,000Rate‡ per 100,000
All Races White
Black Asian/Pacific Islander§
American Indian/Alaska Native§ Hispanic§�
∗ Data are from selected state and metropolitan area cancer registries that meet the data quality criteria for all invasive
cancer sites combined. See Appendix B for data quality criteria and registry-specific data quality information.† Excludes basal and squamous cell carcinomas of the skin except when these occur on the skin of the genital organs, and in
situ cancers except urinary bladder.‡ Rates are age-adjusted to the 2000 U.S. standard population (19 age groups - Census P25-1130). See Table 2.1.1.1M-2.27.1.1M
and Appendix F.1-F.2 for 95% confidence intervals for rates. Rates are suppressed and not ranked if the population of a specific
category (race, ethnicity) is less than 50,000 or if cases are fewer than 16.§ Data for specified racial or ethnic populations other than white and black should be interpreted with caution. See Technical
Notes.� Hispanic origin is not mutually exclusive from race categories (white, black, Asian/Pacific Islander, American Indian/Alaska
Native).
Note: ONS — Other Nervous System; NOS — Not Otherwise Specified; IBD — Intrahepatic Bile Duct.

State and Metropolitan-Area Incidence Rates and State Death Rates for the Most Common Cancers
3��
Figure 3.18.M2: Age-Adjusted Cancer Death Rates for the 10 Primary Sites with theHighest Rates within Race- and Ethnic-Specific Categories
Idaho,∗ Males, 2004
Brain & ONS
Urinary Bladder
Esophagus
Myeloma
Non-Hodgkin Lymphoma
Leukemias
Pancreas
Colon & Rectum
Prostate
Lung & Bronchus
0 50 100 150
5.8
6.7
7.0
7.9
8.7
10.5
12.0
17.1
29.2
51.3
Brain & ONS
Urinary Bladder
Esophagus
Myeloma
Non-Hodgkin Lymphoma
Leukemias
Pancreas
Colon & Rectum
Prostate
Lung & Bronchus
0 50 100 150
5.9
6.8
6.9
8.0
8.6
10.6
12.0
17.2
29.2
51.5
0 50 100 150
Death rates were notranked when the populationsize was less than 50,000or case counts were fewerthan 16 in each of the sitecategories.
0 50 100 150
Death rates were notranked when the populationsize was less than 50,000or case counts were fewerthan 16 in each of the sitecategories.
0 50 100 150
Death rates were notranked when the populationsize was less than 50,000or case counts were fewerthan 16 in each of the sitecategories.
0 50 100 150
Death rates were notranked when the populationsize was less than 50,000or case counts were fewerthan 16 in each of the sitecategories.
Rate† per 100,000Rate† per 100,000
Rate† per 100,000Rate† per 100,000
Rate† per 100,000Rate† per 100,000
All Races White
Black Asian/Pacific Islander‡
American Indian/Alaska Native‡ Hispanic‡§
∗ Data are from the National Vital Statistics System (NVSS).† Rates are age-adjusted to the 2000 U.S. standard population (19 age groups - Census P25-1130). See Table 2.1.1.2M-2.27.1.2M
and Appendix F.1-F.2 for 95% confidence intervals for rates. Rates are suppressed and not ranked if the population of a specific
category (race, ethnicity) is less than 50,000 or if deaths are fewer than 16.‡ Data for specified racial or ethnic populations other than white and black should be interpreted with caution. See Technical
Notes.§ Hispanic origin is not mutually exclusive from race categories (white, black, Asian/Pacific Islander, American Indian/Alaska
Native).
Note: ONS — Other Nervous System; NOS — Not Otherwise Specified; IBD — Intrahepatic Bile Duct.

United States Cancer Statistics: 2004 Incidence and Mortality
3��
Figure 3.18.F1: Age-Adjusted Invasive Cancer Incidence Rates for the 10 Primary Siteswith the Highest Rates within Race- and Ethnic-Specific Categories
Idaho,∗† Females, 2004
Urinary Bladder
Ovary
Pancreas
Thyroid
Non-Hodgkin Lymphoma
Melanomas of the Skin
Corpus & Uterus, NOS
Colon & Rectum
Lung & Bronchus
Breast
0 50 100 150 200 250 300
10.6
10.7
10.8
15.2
18.0
21.9
22.0
39.4
47.8
105.1
Ovary
Pancreas
Urinary Bladder
Thyroid
Non-Hodgkin Lymphoma
Corpus & Uterus, NOS
Melanomas of the Skin
Colon & Rectum
Lung & Bronchus
Breast
0 50 100 150 200 250 300
10.7
10.7
10.8
15.8
17.9
22.1
22.4
39.9
47.9
106.1
0 50 100 150 200 250 300
Incidence rates were notranked when the populationsize was less than 50,000or case counts were fewerthan 16 in each of the sitecategories.
0 50 100 150 200 250 300
Incidence rates were notranked when the populationsize was less than 50,000or case counts were fewerthan 16 in each of the sitecategories.
0 50 100 150 200 250 300
Incidence rates were notranked when the populationsize was less than 50,000or case counts were fewerthan 16 in each of the sitecategories.
Breast
0 50 100 150 200 250 300
71.6
Rate‡ per 100,000Rate‡ per 100,000
Rate‡ per 100,000Rate‡ per 100,000
Rate‡ per 100,000Rate‡ per 100,000
All Races White
Black Asian/Pacific Islander§
American Indian/Alaska Native§ Hispanic§�
∗ Data are from selected state and metropolitan area cancer registries that meet the data quality criteria for all invasive
cancer sites combined. See Appendix B for data quality criteria and registry-specific data quality information.† Excludes basal and squamous cell carcinomas of the skin except when these occur on the skin of the genital organs, and in
situ cancers except urinary bladder.‡ Rates are age-adjusted to the 2000 U.S. standard population (19 age groups - Census P25-1130). See Table 2.1.1.1F-2.27.1.1F
and Appendix F.1-F.2 for 95% confidence intervals for rates. Rates are suppressed and not ranked if the population of a specific
category (race, ethnicity) is less than 50,000 or if cases are fewer than 16.§ Data for specified racial or ethnic populations other than white and black should be interpreted with caution. See Technical
Notes.� Hispanic origin is not mutually exclusive from race categories (white, black, Asian/Pacific Islander, American Indian/Alaska
Native).
Note: ONS — Other Nervous System; NOS — Not Otherwise Specified; IBD — Intrahepatic Bile Duct. Ovary excludes cancers newly
classified as borderline according to ICD-O-3, beginning with 2001 diagnoses. See Technical Notes.

State and Metropolitan-Area Incidence Rates and State Death Rates for the Most Common Cancers
3�3
Figure 3.18.F2: Age-Adjusted Cancer Death Rates for the 10 Primary Sites with theHighest Rates within Race- and Ethnic-Specific Categories
Idaho,∗ Females, 2004
Kidney & Renal Pelvis
Myeloma
Brain & ONS
Non-Hodgkin Lymphoma
Leukemias
Ovary
Pancreas
Colon & Rectum
Breast
Lung & Bronchus
0 50 100 150
3.2
3.3
4.6
6.9
7.5
9.1
10.7
12.6
21.9
33.0
Kidney & Renal Pelvis
Myeloma
Brain & ONS
Non-Hodgkin Lymphoma
Leukemias
Ovary
Pancreas
Colon & Rectum
Breast
Lung & Bronchus
0 50 100 150
3.3
3.3
4.8
6.9
7.6
9.0
10.7
12.7
21.8
33.5
0 50 100 150
Death rates were notranked when the populationsize was less than 50,000or case counts were fewerthan 16 in each of the sitecategories.
0 50 100 150
Death rates were notranked when the populationsize was less than 50,000or case counts were fewerthan 16 in each of the sitecategories.
0 50 100 150
Death rates were notranked when the populationsize was less than 50,000or case counts were fewerthan 16 in each of the sitecategories.
0 50 100 150
Death rates were notranked when the populationsize was less than 50,000or case counts were fewerthan 16 in each of the sitecategories.
Rate† per 100,000Rate† per 100,000
Rate† per 100,000Rate† per 100,000
Rate† per 100,000Rate† per 100,000
All Races White
Black Asian/Pacific Islander‡
American Indian/Alaska Native‡ Hispanic‡§
∗ Data are from the National Vital Statistics System (NVSS).† Rates are age-adjusted to the 2000 U.S. standard population (19 age groups - Census P25-1130). See Table 2.1.1.2F-2.27.1.2F
and Appendix F.1-F.2 for 95% confidence intervals for rates. Rates are suppressed and not ranked if the population of a specific
category (race, ethnicity) is less than 50,000 or if deaths are fewer than 16.‡ Data for specified racial or ethnic populations other than white and black should be interpreted with caution. See Technical
Notes.§ Hispanic origin is not mutually exclusive from race categories (white, black, Asian/Pacific Islander, American Indian/Alaska
Native).
Note: ONS — Other Nervous System; NOS — Not Otherwise Specified; IBD — Intrahepatic Bile Duct.

United States Cancer Statistics: 2004 Incidence and Mortality
3��
Figure 3.19.M1: Age-Adjusted Invasive Cancer Incidence Rates for the 10 Primary Siteswith the Highest Rates within Race- and Ethnic-Specific Categories
Illinois,∗† Males, 2004
Pancreas
Leukemias
Oral Cavity & Pharynx
Melanomas of the Skin
Kidney & Renal Pelvis
Non-Hodgkin Lymphoma
Urinary Bladder
Colon & Rectum
Lung & Bronchus
Prostate
0 50 100 150 200 250 300
14.8
16.6
16.8
18.5
20.7
24.9
40.4
66.8
87.5
148.0
Pancreas
Oral Cavity & Pharynx
Leukemias
Melanomas of the Skin
Kidney & Renal Pelvis
Non-Hodgkin Lymphoma
Urinary Bladder
Colon & Rectum
Lung & Bronchus
Prostate
0 50 100 150 200 250 300
14.7
15.4
16.6
19.5
21.2
25.4
42.6
65.0
84.6
133.6
Myeloma
Pancreas
Urinary Bladder
Stomach
Non-Hodgkin Lymphoma
Kidney & Renal Pelvis
Oral Cavity & Pharynx
Colon & Rectum
Lung & Bronchus
Prostate
0 50 100 150 200 250 300
13.5
16.0
16.6
17.4
17.7
19.0
23.5
76.4
116.8
206.1
Leukemias
Non-Hodgkin Lymphoma
Stomach
Liver & IBD
Urinary Bladder
Oral Cavity & Pharynx
Colon & Rectum
Lung & Bronchus
Prostate
0 50 100 150 200 250 300
8.6
11.7
12.6
13.3
14.8
14.9
41.3
45.0
55.8
0 50 100 150 200 250 300
Incidence rates were notranked when the populationsize was less than 50,000or case counts were fewerthan 16 in each of the sitecategories.
Leukemias
Pancreas
Liver & IBD
Stomach
Kidney & Renal Pelvis
Urinary Bladder
Non-Hodgkin Lymphoma
Lung & Bronchus
Colon & Rectum
Prostate
0 50 100 150 200 250 300
9.0
11.6
11.8
12.6
15.3
19.3
23.1
40.2
50.5
106.5
Rate‡ per 100,000Rate‡ per 100,000
Rate‡ per 100,000Rate‡ per 100,000
Rate‡ per 100,000Rate‡ per 100,000
All Races White
Black Asian/Pacific Islander§
American Indian/Alaska Native§ Hispanic§�
∗ Data are from selected state and metropolitan area cancer registries that meet the data quality criteria for all invasive
cancer sites combined. See Appendix B for data quality criteria and registry-specific data quality information.† Excludes basal and squamous cell carcinomas of the skin except when these occur on the skin of the genital organs, and in
situ cancers except urinary bladder.‡ Rates are age-adjusted to the 2000 U.S. standard population (19 age groups - Census P25-1130). See Table 2.1.1.1M-2.27.1.1M
and Appendix F.1-F.2 for 95% confidence intervals for rates. Rates are suppressed and not ranked if the population of a specific
category (race, ethnicity) is less than 50,000 or if cases are fewer than 16.§ Data for specified racial or ethnic populations other than white and black should be interpreted with caution. See Technical
Notes.� Hispanic origin is not mutually exclusive from race categories (white, black, Asian/Pacific Islander, American Indian/Alaska
Native).
Note: ONS — Other Nervous System; NOS — Not Otherwise Specified; IBD — Intrahepatic Bile Duct.

State and Metropolitan-Area Incidence Rates and State Death Rates for the Most Common Cancers
3��
Figure 3.19.M2: Age-Adjusted Cancer Death Rates for the 10 Primary Sites with theHighest Rates within Race- and Ethnic-Specific Categories
Illinois,∗ Males, 2004
Stomach
Liver & IBD
Urinary Bladder
Esophagus
Non-Hodgkin Lymphoma
Leukemias
Pancreas
Colon & Rectum
Prostate
Lung & Bronchus
0 50 100 150
6.6
6.9
7.7
7.9
9.3
10.5
13.6
24.2
26.1
73.3
Liver & IBD
Kidney & Renal Pelvis
Esophagus
Urinary Bladder
Non-Hodgkin Lymphoma
Leukemias
Pancreas
Prostate
Colon & Rectum
Lung & Bronchus
0 50 100 150
6.2
6.2
8.0
8.3
9.9
11.0
13.1
22.8
23.3
71.6
Oral Cavity & Pharynx
Leukemias
Myeloma
Esophagus
Liver & IBD
Stomach
Pancreas
Colon & Rectum
Prostate
Lung & Bronchus
0 50 100 150
7.4
7.7
8.4
9.5
11.0
13.3
18.3
35.9
60.5
97.7
Liver & IBD
Lung & Bronchus
0 50 100 150
11.2
33.9
0 50 100 150
Death rates were notranked when the populationsize was less than 50,000or case counts were fewerthan 16 in each of the sitecategories.
Liver & IBD
Leukemias
Stomach
Non-Hodgkin Lymphoma
Colon & Rectum
Pancreas
Prostate
Lung & Bronchus
0 50 100 150
6.1
6.8
6.9
7.3
9.1
9.6
13.2
31.1
Rate† per 100,000Rate† per 100,000
Rate† per 100,000Rate† per 100,000
Rate† per 100,000Rate† per 100,000
All Races White
Black Asian/Pacific Islander‡
American Indian/Alaska Native‡ Hispanic‡§
∗ Data are from the National Vital Statistics System (NVSS).† Rates are age-adjusted to the 2000 U.S. standard population (19 age groups - Census P25-1130). See Table 2.1.1.2M-2.27.1.2M
and Appendix F.1-F.2 for 95% confidence intervals for rates. Rates are suppressed and not ranked if the population of a specific
category (race, ethnicity) is less than 50,000 or if deaths are fewer than 16.‡ Data for specified racial or ethnic populations other than white and black should be interpreted with caution. See Technical
Notes.§ Hispanic origin is not mutually exclusive from race categories (white, black, Asian/Pacific Islander, American Indian/Alaska
Native).
Note: ONS — Other Nervous System; NOS — Not Otherwise Specified; IBD — Intrahepatic Bile Duct.

United States Cancer Statistics: 2004 Incidence and Mortality
3��
Figure 3.19.F1: Age-Adjusted Invasive Cancer Incidence Rates for the 10 Primary Siteswith the Highest Rates within Race- and Ethnic-Specific Categories
Illinois,∗† Females, 2004
Leukemias
Melanomas of the Skin
Kidney & Renal Pelvis
Ovary
Thyroid
Non-Hodgkin Lymphoma
Corpus & Uterus, NOS
Colon & Rectum
Lung & Bronchus
Breast
0 50 100 150 200 250 300
10.4
11.1
11.3
12.7
14.2
16.4
24.9
48.4
56.4
117.9
Leukemias
Kidney & Renal Pelvis
Melanomas of the Skin
Ovary
Thyroid
Non-Hodgkin Lymphoma
Corpus & Uterus, NOS
Colon & Rectum
Lung & Bronchus
Breast
0 50 100 150 200 250 300
10.2
11.7
12.1
13.4
15.5
16.7
25.4
46.8
56.7
118.9
Myeloma
Ovary
Kidney & Renal Pelvis
Non-Hodgkin Lymphoma
Cervix Uteri
Pancreas
Corpus & Uterus, NOS
Colon & Rectum
Lung & Bronchus
Breast
0 50 100 150 200 250 300
9.4
9.5
10.0
12.0
12.6
13.0
20.2
57.9
60.3
108.2
Leukemias
Non-Hodgkin Lymphoma
Thyroid
Corpus & Uterus, NOS
Lung & Bronchus
Colon & Rectum
Breast
0 50 100 150 200 250 300
7.4
8.2
12.9
14.5
18.8
23.8
71.0
0 50 100 150 200 250 300
Incidence rates were notranked when the populationsize was less than 50,000or case counts were fewerthan 16 in each of the sitecategories.
Stomach
Pancreas
Ovary
Cervix Uteri
Non-Hodgkin Lymphoma
Thyroid
Corpus & Uterus, NOS
Lung & Bronchus
Colon & Rectum
Breast
0 50 100 150 200 250 300
10.2
10.6
11.1
13.4
14.7
15.0
22.4
31.5
32.9
78.8
Rate‡ per 100,000Rate‡ per 100,000
Rate‡ per 100,000Rate‡ per 100,000
Rate‡ per 100,000Rate‡ per 100,000
All Races White
Black Asian/Pacific Islander§
American Indian/Alaska Native§ Hispanic§�
∗ Data are from selected state and metropolitan area cancer registries that meet the data quality criteria for all invasive
cancer sites combined. See Appendix B for data quality criteria and registry-specific data quality information.† Excludes basal and squamous cell carcinomas of the skin except when these occur on the skin of the genital organs, and in
situ cancers except urinary bladder.‡ Rates are age-adjusted to the 2000 U.S. standard population (19 age groups - Census P25-1130). See Table 2.1.1.1F-2.27.1.1F
and Appendix F.1-F.2 for 95% confidence intervals for rates. Rates are suppressed and not ranked if the population of a specific
category (race, ethnicity) is less than 50,000 or if cases are fewer than 16.§ Data for specified racial or ethnic populations other than white and black should be interpreted with caution. See Technical
Notes.� Hispanic origin is not mutually exclusive from race categories (white, black, Asian/Pacific Islander, American Indian/Alaska
Native).
Note: ONS — Other Nervous System; NOS — Not Otherwise Specified; IBD — Intrahepatic Bile Duct. Ovary excludes cancers newly
classified as borderline according to ICD-O-3, beginning with 2001 diagnoses. See Technical Notes.

State and Metropolitan-Area Incidence Rates and State Death Rates for the Most Common Cancers
3��
Figure 3.19.F2: Age-Adjusted Cancer Death Rates for the 10 Primary Sites with theHighest Rates within Race- and Ethnic-Specific Categories
Illinois,∗ Females, 2004
Brain & ONS
Liver & IBD
Corpus & Uterus, NOS
Leukemias
Non-Hodgkin Lymphoma
Ovary
Pancreas
Colon & Rectum
Breast
Lung & Bronchus
0 50 100 150
3.4
3.6
4.4
5.5
6.2
8.8
9.5
16.8
25.4
41.8
Liver & IBD
Brain & ONS
Corpus & Uterus, NOS
Leukemias
Non-Hodgkin Lymphoma
Ovary
Pancreas
Colon & Rectum
Breast
Lung & Bronchus
0 50 100 150
3.2
3.8
3.8
5.8
6.6
9.1
9.3
16.0
23.4
41.7
Myeloma
Liver & IBD
Cervix Uteri
Stomach
Ovary
Corpus & Uterus, NOS
Pancreas
Colon & Rectum
Breast
Lung & Bronchus
0 50 100 150
5.4
5.7
6.0
6.1
8.0
8.7
11.9
25.1
39.1
48.2
Breast
Lung & Bronchus
0 50 100 150
14.6
15.6
0 50 100 150
Death rates were notranked when the populationsize was less than 50,000or case counts were fewerthan 16 in each of the sitecategories. Ovary
Liver & IBD
Stomach
Pancreas
Colon & Rectum
Breast
Lung & Bronchus
0 50 100 150
4.6
5.3
5.6
6.4
6.6
10.4
12.1
Rate† per 100,000Rate† per 100,000
Rate† per 100,000Rate† per 100,000
Rate† per 100,000Rate† per 100,000
All Races White
Black Asian/Pacific Islander‡
American Indian/Alaska Native‡ Hispanic‡§
∗ Data are from the National Vital Statistics System (NVSS).† Rates are age-adjusted to the 2000 U.S. standard population (19 age groups - Census P25-1130). See Table 2.1.1.2F-2.27.1.2F
and Appendix F.1-F.2 for 95% confidence intervals for rates. Rates are suppressed and not ranked if the population of a specific
category (race, ethnicity) is less than 50,000 or if deaths are fewer than 16.‡ Data for specified racial or ethnic populations other than white and black should be interpreted with caution. See Technical
Notes.§ Hispanic origin is not mutually exclusive from race categories (white, black, Asian/Pacific Islander, American Indian/Alaska
Native).
Note: ONS — Other Nervous System; NOS — Not Otherwise Specified; IBD — Intrahepatic Bile Duct.

United States Cancer Statistics: 2004 Incidence and Mortality
3��
Figure 3.20.M1: Age-Adjusted Invasive Cancer Incidence Rates for the 10 Primary Siteswith the Highest Rates within Race- and Ethnic-Specific Categories
Indiana,∗† Males, 2004
Pancreas
Leukemias
Oral Cavity & Pharynx
Melanomas of the Skin
Non-Hodgkin Lymphoma
Kidney & Renal Pelvis
Urinary Bladder
Colon & Rectum
Lung & Bronchus
Prostate
0 50 100 150 200 250 300
12.6
14.8
14.8
15.5
22.4
22.6
36.2
59.9
98.0
128.7
Pancreas
Oral Cavity & Pharynx
Leukemias
Melanomas of the Skin
Kidney & Renal Pelvis
Non-Hodgkin Lymphoma
Urinary Bladder
Colon & Rectum
Lung & Bronchus
Prostate
0 50 100 150 200 250 300
12.4
14.6
15.2
16.0
22.5
23.5
37.4
58.9
97.2
123.3
Liver & IBD
Urinary Bladder
Larynx
Stomach
Pancreas
Oral Cavity & Pharynx
Kidney & Renal Pelvis
Colon & Rectum
Lung & Bronchus
Prostate
0 50 100 150 200 250 300
11.8
12.7
13.1
13.6
14.8
17.4
22.1
66.2
114.0
176.5
0 50 100 150 200 250 300
Incidence rates were notranked when the populationsize was less than 50,000or case counts were fewerthan 16 in each of the sitecategories.
0 50 100 150 200 250 300
Incidence rates were notranked when the populationsize was less than 50,000or case counts were fewerthan 16 in each of the sitecategories.
Lung & Bronchus
Colon & Rectum
Prostate
0 50 100 150 200 250 300
38.0
48.8
84.9
Rate‡ per 100,000Rate‡ per 100,000
Rate‡ per 100,000Rate‡ per 100,000
Rate‡ per 100,000Rate‡ per 100,000
All Races White
Black Asian/Pacific Islander§
American Indian/Alaska Native§ Hispanic§�
∗ Data are from selected state and metropolitan area cancer registries that meet the data quality criteria for all invasive
cancer sites combined. See Appendix B for data quality criteria and registry-specific data quality information.† Excludes basal and squamous cell carcinomas of the skin except when these occur on the skin of the genital organs, and in
situ cancers except urinary bladder.‡ Rates are age-adjusted to the 2000 U.S. standard population (19 age groups - Census P25-1130). See Table 2.1.1.1M-2.27.1.1M
and Appendix F.1-F.2 for 95% confidence intervals for rates. Rates are suppressed and not ranked if the population of a specific
category (race, ethnicity) is less than 50,000 or if cases are fewer than 16.§ Data for specified racial or ethnic populations other than white and black should be interpreted with caution. See Technical
Notes.� Hispanic origin is not mutually exclusive from race categories (white, black, Asian/Pacific Islander, American Indian/Alaska
Native).
Note: ONS — Other Nervous System; NOS — Not Otherwise Specified; IBD — Intrahepatic Bile Duct.
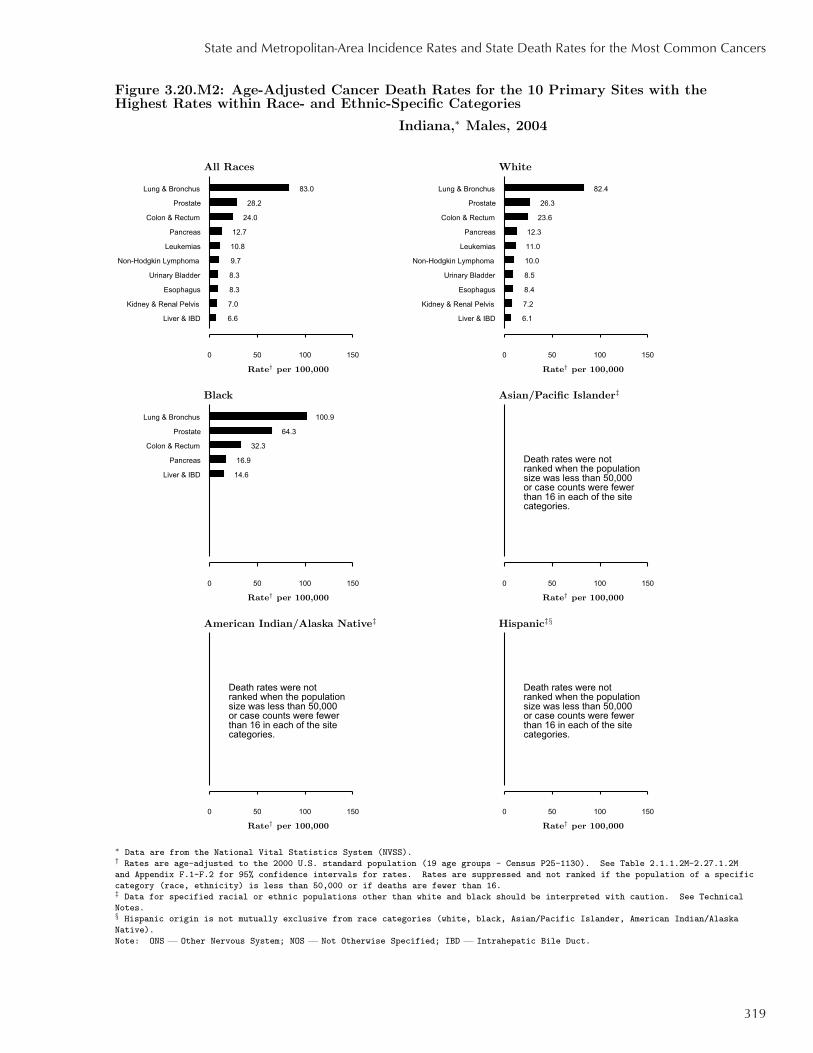
State and Metropolitan-Area Incidence Rates and State Death Rates for the Most Common Cancers
3��
Figure 3.20.M2: Age-Adjusted Cancer Death Rates for the 10 Primary Sites with theHighest Rates within Race- and Ethnic-Specific Categories
Indiana,∗ Males, 2004
Liver & IBD
Kidney & Renal Pelvis
Esophagus
Urinary Bladder
Non-Hodgkin Lymphoma
Leukemias
Pancreas
Colon & Rectum
Prostate
Lung & Bronchus
0 50 100 150
6.6
7.0
8.3
8.3
9.7
10.8
12.7
24.0
28.2
83.0
Liver & IBD
Kidney & Renal Pelvis
Esophagus
Urinary Bladder
Non-Hodgkin Lymphoma
Leukemias
Pancreas
Colon & Rectum
Prostate
Lung & Bronchus
0 50 100 150
6.1
7.2
8.4
8.5
10.0
11.0
12.3
23.6
26.3
82.4
Liver & IBD
Pancreas
Colon & Rectum
Prostate
Lung & Bronchus
0 50 100 150
14.6
16.9
32.3
64.3
100.9
0 50 100 150
Death rates were notranked when the populationsize was less than 50,000or case counts were fewerthan 16 in each of the sitecategories.
0 50 100 150
Death rates were notranked when the populationsize was less than 50,000or case counts were fewerthan 16 in each of the sitecategories.
0 50 100 150
Death rates were notranked when the populationsize was less than 50,000or case counts were fewerthan 16 in each of the sitecategories.
Rate† per 100,000Rate† per 100,000
Rate† per 100,000Rate† per 100,000
Rate† per 100,000Rate† per 100,000
All Races White
Black Asian/Pacific Islander‡
American Indian/Alaska Native‡ Hispanic‡§
∗ Data are from the National Vital Statistics System (NVSS).† Rates are age-adjusted to the 2000 U.S. standard population (19 age groups - Census P25-1130). See Table 2.1.1.2M-2.27.1.2M
and Appendix F.1-F.2 for 95% confidence intervals for rates. Rates are suppressed and not ranked if the population of a specific
category (race, ethnicity) is less than 50,000 or if deaths are fewer than 16.‡ Data for specified racial or ethnic populations other than white and black should be interpreted with caution. See Technical
Notes.§ Hispanic origin is not mutually exclusive from race categories (white, black, Asian/Pacific Islander, American Indian/Alaska
Native).
Note: ONS — Other Nervous System; NOS — Not Otherwise Specified; IBD — Intrahepatic Bile Duct.

United States Cancer Statistics: 2004 Incidence and Mortality
3�0
Figure 3.20.F1: Age-Adjusted Invasive Cancer Incidence Rates for the 10 Primary Siteswith the Highest Rates within Race- and Ethnic-Specific Categories
Indiana,∗† Females, 2004
Pancreas
Melanomas of the Skin
Ovary
Thyroid
Kidney & Renal Pelvis
Non-Hodgkin Lymphoma
Corpus & Uterus, NOS
Colon & Rectum
Lung & Bronchus
Breast
0 50 100 150 200 250 300
9.5
10.3
11.5
11.6
12.3
16.0
24.9
43.0
60.4
108.1
Urinary Bladder
Melanomas of the Skin
Ovary
Thyroid
Kidney & Renal Pelvis
Non-Hodgkin Lymphoma
Corpus & Uterus, NOS
Colon & Rectum
Lung & Bronchus
Breast
0 50 100 150 200 250 300
9.4
11.0
11.7
12.2
12.5
15.9
24.9
42.2
60.6
109.1
Urinary Bladder
Cervix Uteri
Ovary
Kidney & Renal Pelvis
Non-Hodgkin Lymphoma
Pancreas
Corpus & Uterus, NOS
Colon & Rectum
Lung & Bronchus
Breast
0 50 100 150 200 250 300
7.3
8.2
8.5
9.2
14.2
14.5
19.8
51.0
57.0
92.2
0 50 100 150 200 250 300
Incidence rates were notranked when the populationsize was less than 50,000or case counts were fewerthan 16 in each of the sitecategories.
0 50 100 150 200 250 300
Incidence rates were notranked when the populationsize was less than 50,000or case counts were fewerthan 16 in each of the sitecategories.
Breast
0 50 100 150 200 250 300
99.2
Rate‡ per 100,000Rate‡ per 100,000
Rate‡ per 100,000Rate‡ per 100,000
Rate‡ per 100,000Rate‡ per 100,000
All Races White
Black Asian/Pacific Islander§
American Indian/Alaska Native§ Hispanic§�
∗ Data are from selected state and metropolitan area cancer registries that meet the data quality criteria for all invasive
cancer sites combined. See Appendix B for data quality criteria and registry-specific data quality information.† Excludes basal and squamous cell carcinomas of the skin except when these occur on the skin of the genital organs, and in
situ cancers except urinary bladder.‡ Rates are age-adjusted to the 2000 U.S. standard population (19 age groups - Census P25-1130). See Table 2.1.1.1F-2.27.1.1F
and Appendix F.1-F.2 for 95% confidence intervals for rates. Rates are suppressed and not ranked if the population of a specific
category (race, ethnicity) is less than 50,000 or if cases are fewer than 16.§ Data for specified racial or ethnic populations other than white and black should be interpreted with caution. See Technical
Notes.� Hispanic origin is not mutually exclusive from race categories (white, black, Asian/Pacific Islander, American Indian/Alaska
Native).
Note: ONS — Other Nervous System; NOS — Not Otherwise Specified; IBD — Intrahepatic Bile Duct. Ovary excludes cancers newly
classified as borderline according to ICD-O-3, beginning with 2001 diagnoses. See Technical Notes.

State and Metropolitan-Area Incidence Rates and State Death Rates for the Most Common Cancers
3��
Figure 3.20.F2: Age-Adjusted Cancer Death Rates for the 10 Primary Sites with theHighest Rates within Race- and Ethnic-Specific Categories
Indiana,∗ Females, 2004
Kidney & Renal Pelvis
Brain & ONS
Corpus & Uterus, NOS
Leukemias
Non-Hodgkin Lymphoma
Ovary
Pancreas
Colon & Rectum
Breast
Lung & Bronchus
0 50 100 150
3.7
3.9
5.0
5.7
6.6
8.7
9.9
16.8
24.0
45.5
Kidney & Renal Pelvis
Brain & ONS
Corpus & Uterus, NOS
Leukemias
Non-Hodgkin Lymphoma
Ovary
Pancreas
Colon & Rectum
Breast
Lung & Bronchus
0 50 100 150
3.6
4.1
4.9
5.8
6.6
8.9
9.7
16.3
23.8
45.8
Myeloma
Pancreas
Colon & Rectum
Breast
Lung & Bronchus
0 50 100 150
7.5
13.3
24.9
28.3
45.5
0 50 100 150
Death rates were notranked when the populationsize was less than 50,000or case counts were fewerthan 16 in each of the sitecategories.
0 50 100 150
Death rates were notranked when the populationsize was less than 50,000or case counts were fewerthan 16 in each of the sitecategories.
0 50 100 150
Death rates were notranked when the populationsize was less than 50,000or case counts were fewerthan 16 in each of the sitecategories.
Rate† per 100,000Rate† per 100,000
Rate† per 100,000Rate† per 100,000
Rate† per 100,000Rate† per 100,000
All Races White
Black Asian/Pacific Islander‡
American Indian/Alaska Native‡ Hispanic‡§
∗ Data are from the National Vital Statistics System (NVSS).† Rates are age-adjusted to the 2000 U.S. standard population (19 age groups - Census P25-1130). See Table 2.1.1.2F-2.27.1.2F
and Appendix F.1-F.2 for 95% confidence intervals for rates. Rates are suppressed and not ranked if the population of a specific
category (race, ethnicity) is less than 50,000 or if deaths are fewer than 16.‡ Data for specified racial or ethnic populations other than white and black should be interpreted with caution. See Technical
Notes.§ Hispanic origin is not mutually exclusive from race categories (white, black, Asian/Pacific Islander, American Indian/Alaska
Native).
Note: ONS — Other Nervous System; NOS — Not Otherwise Specified; IBD — Intrahepatic Bile Duct.

United States Cancer Statistics: 2004 Incidence and Mortality
3��
Figure 3.21.M1: Age-Adjusted Invasive Cancer Incidence Rates for the 10 Primary Siteswith the Highest Rates within Race- and Ethnic-Specific Categories
Iowa,∗† Males, 2004
Pancreas
Leukemias
Oral Cavity & Pharynx
Melanomas of the Skin
Kidney & Renal Pelvis
Non-Hodgkin Lymphoma
Urinary Bladder
Colon & Rectum
Lung & Bronchus
Prostate
0 50 100 150 200 250 300
12.9
16.6
17.0
19.5
20.1
24.1
41.1
65.1
86.1
140.3
Pancreas
Leukemias
Oral Cavity & Pharynx
Melanomas of the Skin
Kidney & Renal Pelvis
Non-Hodgkin Lymphoma
Urinary Bladder
Colon & Rectum
Lung & Bronchus
Prostate
0 50 100 150 200 250 300
12.8
16.4
16.5
18.7
20.0
23.6
40.8
65.1
85.6
134.3
0 50 100 150 200 250 300
Incidence rates were notranked when the populationsize was less than 50,000or case counts were fewerthan 16 in each of the sitecategories.
0 50 100 150 200 250 300
Incidence rates were notranked when the populationsize was less than 50,000or case counts were fewerthan 16 in each of the sitecategories.
0 50 100 150 200 250 300
Incidence rates were notranked when the populationsize was less than 50,000or case counts were fewerthan 16 in each of the sitecategories.
0 50 100 150 200 250 300
Incidence rates were notranked when the populationsize was less than 50,000or case counts were fewerthan 16 in each of the sitecategories.
Rate‡ per 100,000Rate‡ per 100,000
Rate‡ per 100,000Rate‡ per 100,000
Rate‡ per 100,000Rate‡ per 100,000
All Races White
Black Asian/Pacific Islander§
American Indian/Alaska Native§ Hispanic§�
∗ Data are from selected state and metropolitan area cancer registries that meet the data quality criteria for all invasive
cancer sites combined. See Appendix B for data quality criteria and registry-specific data quality information.† Excludes basal and squamous cell carcinomas of the skin except when these occur on the skin of the genital organs, and in
situ cancers except urinary bladder.‡ Rates are age-adjusted to the 2000 U.S. standard population (19 age groups - Census P25-1130). See Table 2.1.1.1M-2.27.1.1M
and Appendix F.1-F.2 for 95% confidence intervals for rates. Rates are suppressed and not ranked if the population of a specific
category (race, ethnicity) is less than 50,000 or if cases are fewer than 16.§ Data for specified racial or ethnic populations other than white and black should be interpreted with caution. See Technical
Notes.� Hispanic origin is not mutually exclusive from race categories (white, black, Asian/Pacific Islander, American Indian/Alaska
Native).
Note: ONS — Other Nervous System; NOS — Not Otherwise Specified; IBD — Intrahepatic Bile Duct.

State and Metropolitan-Area Incidence Rates and State Death Rates for the Most Common Cancers
3�3
Figure 3.21.M2: Age-Adjusted Cancer Death Rates for the 10 Primary Sites with theHighest Rates within Race- and Ethnic-Specific Categories
Iowa,∗ Males, 2004
Brain & ONS
Kidney & Renal Pelvis
Urinary Bladder
Esophagus
Non-Hodgkin Lymphoma
Leukemias
Pancreas
Colon & Rectum
Prostate
Lung & Bronchus
0 50 100 150
6.0
6.1
7.4
8.2
8.6
10.8
12.0
23.1
24.7
73.4
Brain & ONS
Kidney & Renal Pelvis
Urinary Bladder
Esophagus
Non-Hodgkin Lymphoma
Leukemias
Pancreas
Colon & Rectum
Prostate
Lung & Bronchus
0 50 100 150
6.1
6.3
7.5
8.2
8.6
10.8
12.0
23.2
24.6
73.3
0 50 100 150
Death rates were notranked when the populationsize was less than 50,000or case counts were fewerthan 16 in each of the sitecategories.
0 50 100 150
Death rates were notranked when the populationsize was less than 50,000or case counts were fewerthan 16 in each of the sitecategories.
0 50 100 150
Death rates were notranked when the populationsize was less than 50,000or case counts were fewerthan 16 in each of the sitecategories.
0 50 100 150
Death rates were notranked when the populationsize was less than 50,000or case counts were fewerthan 16 in each of the sitecategories.
Rate† per 100,000Rate† per 100,000
Rate† per 100,000Rate† per 100,000
Rate† per 100,000Rate† per 100,000
All Races White
Black Asian/Pacific Islander‡
American Indian/Alaska Native‡ Hispanic‡§
∗ Data are from the National Vital Statistics System (NVSS).† Rates are age-adjusted to the 2000 U.S. standard population (19 age groups - Census P25-1130). See Table 2.1.1.2M-2.27.1.2M
and Appendix F.1-F.2 for 95% confidence intervals for rates. Rates are suppressed and not ranked if the population of a specific
category (race, ethnicity) is less than 50,000 or if deaths are fewer than 16.‡ Data for specified racial or ethnic populations other than white and black should be interpreted with caution. See Technical
Notes.§ Hispanic origin is not mutually exclusive from race categories (white, black, Asian/Pacific Islander, American Indian/Alaska
Native).
Note: ONS — Other Nervous System; NOS — Not Otherwise Specified; IBD — Intrahepatic Bile Duct.
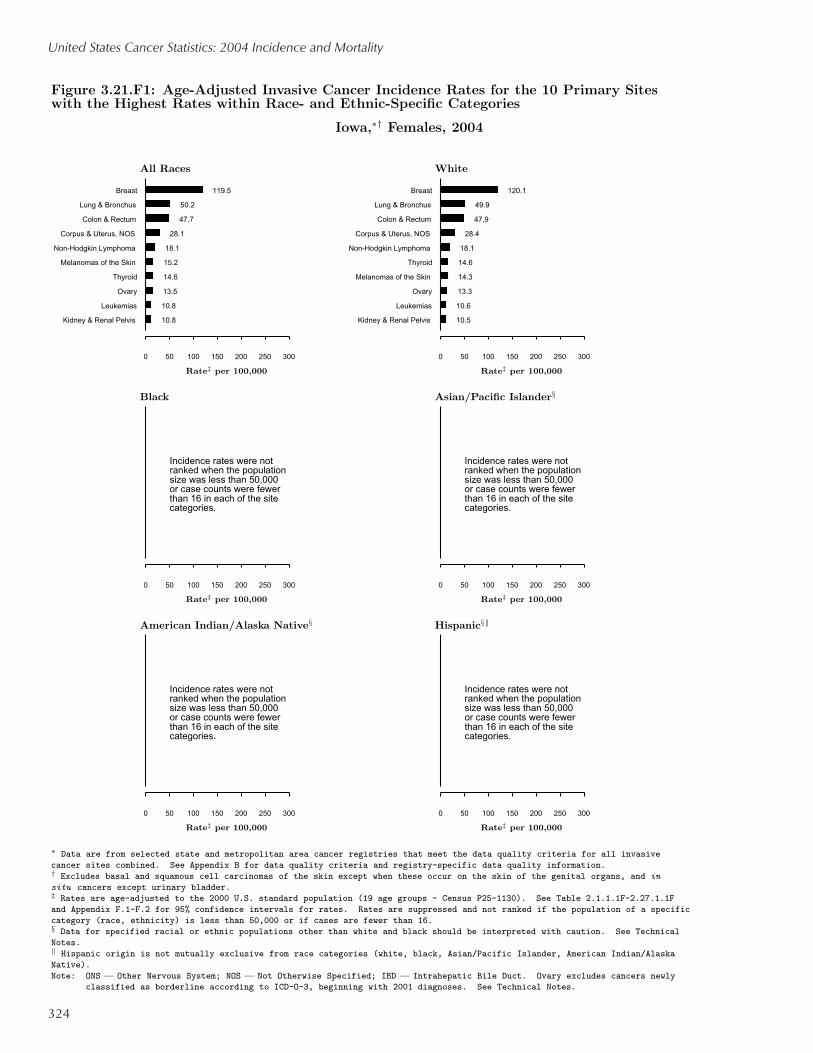
United States Cancer Statistics: 2004 Incidence and Mortality
3��
Figure 3.21.F1: Age-Adjusted Invasive Cancer Incidence Rates for the 10 Primary Siteswith the Highest Rates within Race- and Ethnic-Specific Categories
Iowa,∗† Females, 2004
Kidney & Renal Pelvis
Leukemias
Ovary
Thyroid
Melanomas of the Skin
Non-Hodgkin Lymphoma
Corpus & Uterus, NOS
Colon & Rectum
Lung & Bronchus
Breast
0 50 100 150 200 250 300
10.8
10.8
13.5
14.6
15.2
18.1
28.1
47.7
50.2
119.5
Kidney & Renal Pelvis
Leukemias
Ovary
Melanomas of the Skin
Thyroid
Non-Hodgkin Lymphoma
Corpus & Uterus, NOS
Colon & Rectum
Lung & Bronchus
Breast
0 50 100 150 200 250 300
10.5
10.6
13.3
14.3
14.6
18.1
28.4
47.9
49.9
120.1
0 50 100 150 200 250 300
Incidence rates were notranked when the populationsize was less than 50,000or case counts were fewerthan 16 in each of the sitecategories.
0 50 100 150 200 250 300
Incidence rates were notranked when the populationsize was less than 50,000or case counts were fewerthan 16 in each of the sitecategories.
0 50 100 150 200 250 300
Incidence rates were notranked when the populationsize was less than 50,000or case counts were fewerthan 16 in each of the sitecategories.
0 50 100 150 200 250 300
Incidence rates were notranked when the populationsize was less than 50,000or case counts were fewerthan 16 in each of the sitecategories.
Rate‡ per 100,000Rate‡ per 100,000
Rate‡ per 100,000Rate‡ per 100,000
Rate‡ per 100,000Rate‡ per 100,000
All Races White
Black Asian/Pacific Islander§
American Indian/Alaska Native§ Hispanic§�
∗ Data are from selected state and metropolitan area cancer registries that meet the data quality criteria for all invasive
cancer sites combined. See Appendix B for data quality criteria and registry-specific data quality information.† Excludes basal and squamous cell carcinomas of the skin except when these occur on the skin of the genital organs, and in
situ cancers except urinary bladder.‡ Rates are age-adjusted to the 2000 U.S. standard population (19 age groups - Census P25-1130). See Table 2.1.1.1F-2.27.1.1F
and Appendix F.1-F.2 for 95% confidence intervals for rates. Rates are suppressed and not ranked if the population of a specific
category (race, ethnicity) is less than 50,000 or if cases are fewer than 16.§ Data for specified racial or ethnic populations other than white and black should be interpreted with caution. See Technical
Notes.� Hispanic origin is not mutually exclusive from race categories (white, black, Asian/Pacific Islander, American Indian/Alaska
Native).
Note: ONS — Other Nervous System; NOS — Not Otherwise Specified; IBD — Intrahepatic Bile Duct. Ovary excludes cancers newly
classified as borderline according to ICD-O-3, beginning with 2001 diagnoses. See Technical Notes.

State and Metropolitan-Area Incidence Rates and State Death Rates for the Most Common Cancers
3��
Figure 3.21.F2: Age-Adjusted Cancer Death Rates for the 10 Primary Sites with theHighest Rates within Race- and Ethnic-Specific Categories
Iowa,∗ Females, 2004
Myeloma
Brain & ONS
Corpus & Uterus, NOS
Non-Hodgkin Lymphoma
Leukemias
Pancreas
Ovary
Colon & Rectum
Breast
Lung & Bronchus
0 50 100 150
2.8
3.9
4.5
6.4
6.9
9.2
9.5
15.5
22.2
39.7
Kidney & Renal Pelvis
Brain & ONS
Corpus & Uterus, NOS
Non-Hodgkin Lymphoma
Leukemias
Pancreas
Ovary
Colon & Rectum
Breast
Lung & Bronchus
0 50 100 150
2.8
4.0
4.5
6.4
6.9
9.1
9.5
15.6
22.2
39.4
0 50 100 150
Death rates were notranked when the populationsize was less than 50,000or case counts were fewerthan 16 in each of the sitecategories.
0 50 100 150
Death rates were notranked when the populationsize was less than 50,000or case counts were fewerthan 16 in each of the sitecategories.
0 50 100 150
Death rates were notranked when the populationsize was less than 50,000or case counts were fewerthan 16 in each of the sitecategories.
0 50 100 150
Death rates were notranked when the populationsize was less than 50,000or case counts were fewerthan 16 in each of the sitecategories.
Rate† per 100,000Rate† per 100,000
Rate† per 100,000Rate† per 100,000
Rate† per 100,000Rate† per 100,000
All Races White
Black Asian/Pacific Islander‡
American Indian/Alaska Native‡ Hispanic‡§
∗ Data are from the National Vital Statistics System (NVSS).† Rates are age-adjusted to the 2000 U.S. standard population (19 age groups - Census P25-1130). See Table 2.1.1.2F-2.27.1.2F
and Appendix F.1-F.2 for 95% confidence intervals for rates. Rates are suppressed and not ranked if the population of a specific
category (race, ethnicity) is less than 50,000 or if deaths are fewer than 16.‡ Data for specified racial or ethnic populations other than white and black should be interpreted with caution. See Technical
Notes.§ Hispanic origin is not mutually exclusive from race categories (white, black, Asian/Pacific Islander, American Indian/Alaska
Native).
Note: ONS — Other Nervous System; NOS — Not Otherwise Specified; IBD — Intrahepatic Bile Duct.

United States Cancer Statistics: 2004 Incidence and Mortality
3��
Figure 3.22.M1: Age-Adjusted Invasive Cancer Incidence Rates for the 10 Primary Siteswith the Highest Rates within Race- and Ethnic-Specific Categories
Kansas,∗† Males, 2004
Pancreas
Oral Cavity & Pharynx
Kidney & Renal Pelvis
Leukemias
Melanomas of the Skin
Non-Hodgkin Lymphoma
Urinary Bladder
Colon & Rectum
Lung & Bronchus
Prostate
0 50 100 150 200 250 300
12.4
16.2
17.2
18.0
21.7
25.4
35.5
62.3
85.3
162.8
Pancreas
Oral Cavity & Pharynx
Kidney & Renal Pelvis
Leukemias
Melanomas of the Skin
Non-Hodgkin Lymphoma
Urinary Bladder
Colon & Rectum
Lung & Bronchus
Prostate
0 50 100 150 200 250 300
12.2
15.9
17.0
17.4
20.6
25.6
35.7
60.7
85.1
153.5
Colon & Rectum
Lung & Bronchus
Prostate
0 50 100 150 200 250 300
81.7
109.7
211.3
0 50 100 150 200 250 300
Incidence rates were notranked when the populationsize was less than 50,000or case counts were fewerthan 16 in each of the sitecategories.
0 50 100 150 200 250 300
Incidence rates were notranked when the populationsize was less than 50,000or case counts were fewerthan 16 in each of the sitecategories.
0 50 100 150 200 250 300
Incidence rates were notranked when the populationsize was less than 50,000or case counts were fewerthan 16 in each of the sitecategories.
Rate‡ per 100,000Rate‡ per 100,000
Rate‡ per 100,000Rate‡ per 100,000
Rate‡ per 100,000Rate‡ per 100,000
All Races White
Black Asian/Pacific Islander§
American Indian/Alaska Native§ Hispanic§�
∗ Data are from selected state and metropolitan area cancer registries that meet the data quality criteria for all invasive
cancer sites combined. See Appendix B for data quality criteria and registry-specific data quality information.† Excludes basal and squamous cell carcinomas of the skin except when these occur on the skin of the genital organs, and in
situ cancers except urinary bladder.‡ Rates are age-adjusted to the 2000 U.S. standard population (19 age groups - Census P25-1130). See Table 2.1.1.1M-2.27.1.1M
and Appendix F.1-F.2 for 95% confidence intervals for rates. Rates are suppressed and not ranked if the population of a specific
category (race, ethnicity) is less than 50,000 or if cases are fewer than 16.§ Data for specified racial or ethnic populations other than white and black should be interpreted with caution. See Technical
Notes.� Hispanic origin is not mutually exclusive from race categories (white, black, Asian/Pacific Islander, American Indian/Alaska
Native).
Note: ONS — Other Nervous System; NOS — Not Otherwise Specified; IBD — Intrahepatic Bile Duct.

State and Metropolitan-Area Incidence Rates and State Death Rates for the Most Common Cancers
3��
Figure 3.22.M2: Age-Adjusted Cancer Death Rates for the 10 Primary Sites with theHighest Rates within Race- and Ethnic-Specific Categories
Kansas,∗ Males, 2004
Kidney & Renal Pelvis
Brain & ONS
Esophagus
Urinary Bladder
Non-Hodgkin Lymphoma
Leukemias
Pancreas
Colon & Rectum
Prostate
Lung & Bronchus
0 50 100 150
5.7
6.6
6.9
7.3
10.1
10.4
12.7
21.4
23.0
72.9
Kidney & Renal Pelvis
Brain & ONS
Esophagus
Urinary Bladder
Non-Hodgkin Lymphoma
Leukemias
Pancreas
Prostate
Colon & Rectum
Lung & Bronchus
0 50 100 150
5.7
6.8
6.9
7.5
10.0
10.6
12.8
21.3
21.5
72.3
Prostate
Lung & Bronchus
0 50 100 150
76.7
96.0
0 50 100 150
Death rates were notranked when the populationsize was less than 50,000or case counts were fewerthan 16 in each of the sitecategories.
0 50 100 150
Death rates were notranked when the populationsize was less than 50,000or case counts were fewerthan 16 in each of the sitecategories.
0 50 100 150
Death rates were notranked when the populationsize was less than 50,000or case counts were fewerthan 16 in each of the sitecategories.
Rate† per 100,000Rate† per 100,000
Rate† per 100,000Rate† per 100,000
Rate† per 100,000Rate† per 100,000
All Races White
Black Asian/Pacific Islander‡
American Indian/Alaska Native‡ Hispanic‡§
∗ Data are from the National Vital Statistics System (NVSS).† Rates are age-adjusted to the 2000 U.S. standard population (19 age groups - Census P25-1130). See Table 2.1.1.2M-2.27.1.2M
and Appendix F.1-F.2 for 95% confidence intervals for rates. Rates are suppressed and not ranked if the population of a specific
category (race, ethnicity) is less than 50,000 or if deaths are fewer than 16.‡ Data for specified racial or ethnic populations other than white and black should be interpreted with caution. See Technical
Notes.§ Hispanic origin is not mutually exclusive from race categories (white, black, Asian/Pacific Islander, American Indian/Alaska
Native).
Note: ONS — Other Nervous System; NOS — Not Otherwise Specified; IBD — Intrahepatic Bile Duct.

United States Cancer Statistics: 2004 Incidence and Mortality
3��
Figure 3.22.F1: Age-Adjusted Invasive Cancer Incidence Rates for the 10 Primary Siteswith the Highest Rates within Race- and Ethnic-Specific Categories
Kansas,∗† Females, 2004
Kidney & Renal Pelvis
Leukemias
Ovary
Melanomas of the Skin
Non-Hodgkin Lymphoma
Thyroid
Corpus & Uterus, NOS
Colon & Rectum
Lung & Bronchus
Breast
0 50 100 150 200 250 300
9.7
10.3
13.6
16.1
17.6
17.7
23.9
43.0
50.5
119.1
Kidney & Renal Pelvis
Leukemias
Ovary
Melanomas of the Skin
Non-Hodgkin Lymphoma
Thyroid
Corpus & Uterus, NOS
Colon & Rectum
Lung & Bronchus
Breast
0 50 100 150 200 250 300
9.7
10.1
13.9
15.3
18.0
18.1
24.2
41.7
50.9
117.3
Colon & Rectum
Lung & Bronchus
Breast
0 50 100 150 200 250 300
44.2
52.9
123.5
0 50 100 150 200 250 300
Incidence rates were notranked when the populationsize was less than 50,000or case counts were fewerthan 16 in each of the sitecategories.
0 50 100 150 200 250 300
Incidence rates were notranked when the populationsize was less than 50,000or case counts were fewerthan 16 in each of the sitecategories.
0 50 100 150 200 250 300
Incidence rates were notranked when the populationsize was less than 50,000or case counts were fewerthan 16 in each of the sitecategories.
Rate‡ per 100,000Rate‡ per 100,000
Rate‡ per 100,000Rate‡ per 100,000
Rate‡ per 100,000Rate‡ per 100,000
All Races White
Black Asian/Pacific Islander§
American Indian/Alaska Native§ Hispanic§�
∗ Data are from selected state and metropolitan area cancer registries that meet the data quality criteria for all invasive
cancer sites combined. See Appendix B for data quality criteria and registry-specific data quality information.† Excludes basal and squamous cell carcinomas of the skin except when these occur on the skin of the genital organs, and in
situ cancers except urinary bladder.‡ Rates are age-adjusted to the 2000 U.S. standard population (19 age groups - Census P25-1130). See Table 2.1.1.1F-2.27.1.1F
and Appendix F.1-F.2 for 95% confidence intervals for rates. Rates are suppressed and not ranked if the population of a specific
category (race, ethnicity) is less than 50,000 or if cases are fewer than 16.§ Data for specified racial or ethnic populations other than white and black should be interpreted with caution. See Technical
Notes.� Hispanic origin is not mutually exclusive from race categories (white, black, Asian/Pacific Islander, American Indian/Alaska
Native).
Note: ONS — Other Nervous System; NOS — Not Otherwise Specified; IBD — Intrahepatic Bile Duct. Ovary excludes cancers newly
classified as borderline according to ICD-O-3, beginning with 2001 diagnoses. See Technical Notes.

State and Metropolitan-Area Incidence Rates and State Death Rates for the Most Common Cancers
3��
Figure 3.22.F2: Age-Adjusted Cancer Death Rates for the 10 Primary Sites with theHighest Rates within Race- and Ethnic-Specific Categories
Kansas,∗ Females, 2004
Myeloma
Corpus & Uterus, NOS
Brain & ONS
Leukemias
Non-Hodgkin Lymphoma
Pancreas
Ovary
Colon & Rectum
Breast
Lung & Bronchus
0 50 100 150
4.0
4.1
4.5
5.9
6.1
9.5
9.8
15.2
22.4
40.3
Myeloma
Corpus & Uterus, NOS
Brain & ONS
Leukemias
Non-Hodgkin Lymphoma
Pancreas
Ovary
Colon & Rectum
Breast
Lung & Bronchus
0 50 100 150
4.0
4.3
4.6
6.2
6.2
9.4
10.0
14.7
22.0
39.8
Colon & Rectum
Breast
Lung & Bronchus
0 50 100 150
31.6
36.7
50.2
0 50 100 150
Death rates were notranked when the populationsize was less than 50,000or case counts were fewerthan 16 in each of the sitecategories.
0 50 100 150
Death rates were notranked when the populationsize was less than 50,000or case counts were fewerthan 16 in each of the sitecategories.
0 50 100 150
Death rates were notranked when the populationsize was less than 50,000or case counts were fewerthan 16 in each of the sitecategories.
Rate† per 100,000Rate† per 100,000
Rate† per 100,000Rate† per 100,000
Rate† per 100,000Rate† per 100,000
All Races White
Black Asian/Pacific Islander‡
American Indian/Alaska Native‡ Hispanic‡§
∗ Data are from the National Vital Statistics System (NVSS).† Rates are age-adjusted to the 2000 U.S. standard population (19 age groups - Census P25-1130). See Table 2.1.1.2F-2.27.1.2F
and Appendix F.1-F.2 for 95% confidence intervals for rates. Rates are suppressed and not ranked if the population of a specific
category (race, ethnicity) is less than 50,000 or if deaths are fewer than 16.‡ Data for specified racial or ethnic populations other than white and black should be interpreted with caution. See Technical
Notes.§ Hispanic origin is not mutually exclusive from race categories (white, black, Asian/Pacific Islander, American Indian/Alaska
Native).
Note: ONS — Other Nervous System; NOS — Not Otherwise Specified; IBD — Intrahepatic Bile Duct.

United States Cancer Statistics: 2004 Incidence and Mortality
330
Figure 3.23.M1: Age-Adjusted Invasive Cancer Incidence Rates for the 10 Primary Siteswith the Highest Rates within Race- and Ethnic-Specific Categories
Kentucky,∗† Males, 2004
Pancreas
Leukemias
Oral Cavity & Pharynx
Kidney & Renal Pelvis
Non-Hodgkin Lymphoma
Melanomas of the Skin
Urinary Bladder
Colon & Rectum
Prostate
Lung & Bronchus
0 50 100 150 200 250 300
12.0
16.5
17.7
19.1
23.9
24.9
38.1
68.6
129.7
133.2
Pancreas
Leukemias
Oral Cavity & Pharynx
Kidney & Renal Pelvis
Non-Hodgkin Lymphoma
Melanomas of the Skin
Urinary Bladder
Colon & Rectum
Prostate
Lung & Bronchus
0 50 100 150 200 250 300
12.2
15.7
17.1
18.7
23.7
23.9
38.4
68.3
116.8
132.9
Oral Cavity & Pharynx
Larynx
Urinary Bladder
Non-Hodgkin Lymphoma
Kidney & Renal Pelvis
Colon & Rectum
Lung & Bronchus
Prostate
0 50 100 150 200 250 300
18.0
20.1
24.4
24.5
26.6
73.2
144.0
188.5
0 50 100 150 200 250 300
Incidence rates were notranked when the populationsize was less than 50,000or case counts were fewerthan 16 in each of the sitecategories.
0 50 100 150 200 250 300
Incidence rates were notranked when the populationsize was less than 50,000or case counts were fewerthan 16 in each of the sitecategories.
0 50 100 150 200 250 300
Incidence rates aresuppressed and notranked at state’s request.
Rate‡ per 100,000Rate‡ per 100,000
Rate‡ per 100,000Rate‡ per 100,000
Rate‡ per 100,000Rate‡ per 100,000
All Races White
Black Asian/Pacific Islander§
American Indian/Alaska Native§ Hispanic§�
∗ Data are from selected state and metropolitan area cancer registries that meet the data quality criteria for all invasive
cancer sites combined. See Appendix B for data quality criteria and registry-specific data quality information.† Excludes basal and squamous cell carcinomas of the skin except when these occur on the skin of the genital organs, and in
situ cancers except urinary bladder.‡ Rates are age-adjusted to the 2000 U.S. standard population (19 age groups - Census P25-1130). See Table 2.1.1.1M-2.27.1.1M
and Appendix F.1-F.2 for 95% confidence intervals for rates. Rates are suppressed and not ranked if the population of a specific
category (race, ethnicity) is less than 50,000 or if cases are fewer than 16.§ Data for specified racial or ethnic populations other than white and black should be interpreted with caution. See Technical
Notes.� Hispanic origin is not mutually exclusive from race categories (white, black, Asian/Pacific Islander, American Indian/Alaska
Native).
Note: ONS — Other Nervous System; NOS — Not Otherwise Specified; IBD — Intrahepatic Bile Duct.
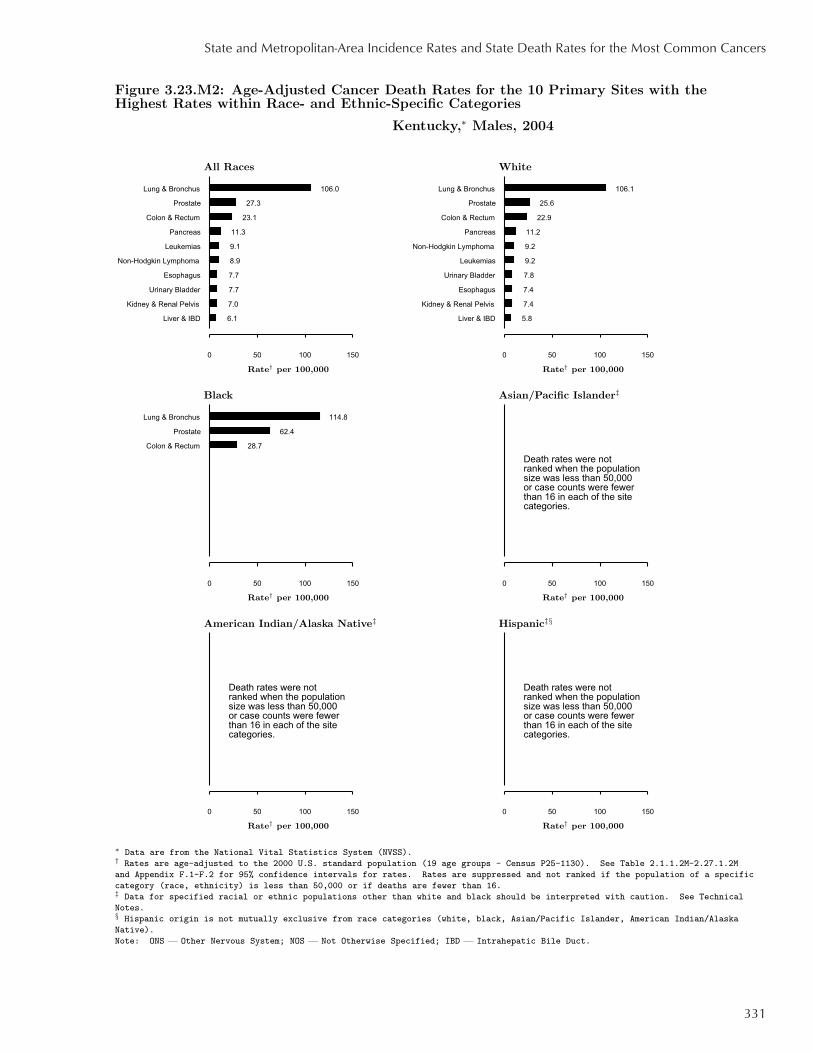
State and Metropolitan-Area Incidence Rates and State Death Rates for the Most Common Cancers
33�
Figure 3.23.M2: Age-Adjusted Cancer Death Rates for the 10 Primary Sites with theHighest Rates within Race- and Ethnic-Specific Categories
Kentucky,∗ Males, 2004
Liver & IBD
Kidney & Renal Pelvis
Urinary Bladder
Esophagus
Non-Hodgkin Lymphoma
Leukemias
Pancreas
Colon & Rectum
Prostate
Lung & Bronchus
0 50 100 150
6.1
7.0
7.7
7.7
8.9
9.1
11.3
23.1
27.3
106.0
Liver & IBD
Kidney & Renal Pelvis
Esophagus
Urinary Bladder
Leukemias
Non-Hodgkin Lymphoma
Pancreas
Colon & Rectum
Prostate
Lung & Bronchus
0 50 100 150
5.8
7.4
7.4
7.8
9.2
9.2
11.2
22.9
25.6
106.1
Colon & Rectum
Prostate
Lung & Bronchus
0 50 100 150
28.7
62.4
114.8
0 50 100 150
Death rates were notranked when the populationsize was less than 50,000or case counts were fewerthan 16 in each of the sitecategories.
0 50 100 150
Death rates were notranked when the populationsize was less than 50,000or case counts were fewerthan 16 in each of the sitecategories.
0 50 100 150
Death rates were notranked when the populationsize was less than 50,000or case counts were fewerthan 16 in each of the sitecategories.
Rate† per 100,000Rate† per 100,000
Rate† per 100,000Rate† per 100,000
Rate† per 100,000Rate† per 100,000
All Races White
Black Asian/Pacific Islander‡
American Indian/Alaska Native‡ Hispanic‡§
∗ Data are from the National Vital Statistics System (NVSS).† Rates are age-adjusted to the 2000 U.S. standard population (19 age groups - Census P25-1130). See Table 2.1.1.2M-2.27.1.2M
and Appendix F.1-F.2 for 95% confidence intervals for rates. Rates are suppressed and not ranked if the population of a specific
category (race, ethnicity) is less than 50,000 or if deaths are fewer than 16.‡ Data for specified racial or ethnic populations other than white and black should be interpreted with caution. See Technical
Notes.§ Hispanic origin is not mutually exclusive from race categories (white, black, Asian/Pacific Islander, American Indian/Alaska
Native).
Note: ONS — Other Nervous System; NOS — Not Otherwise Specified; IBD — Intrahepatic Bile Duct.
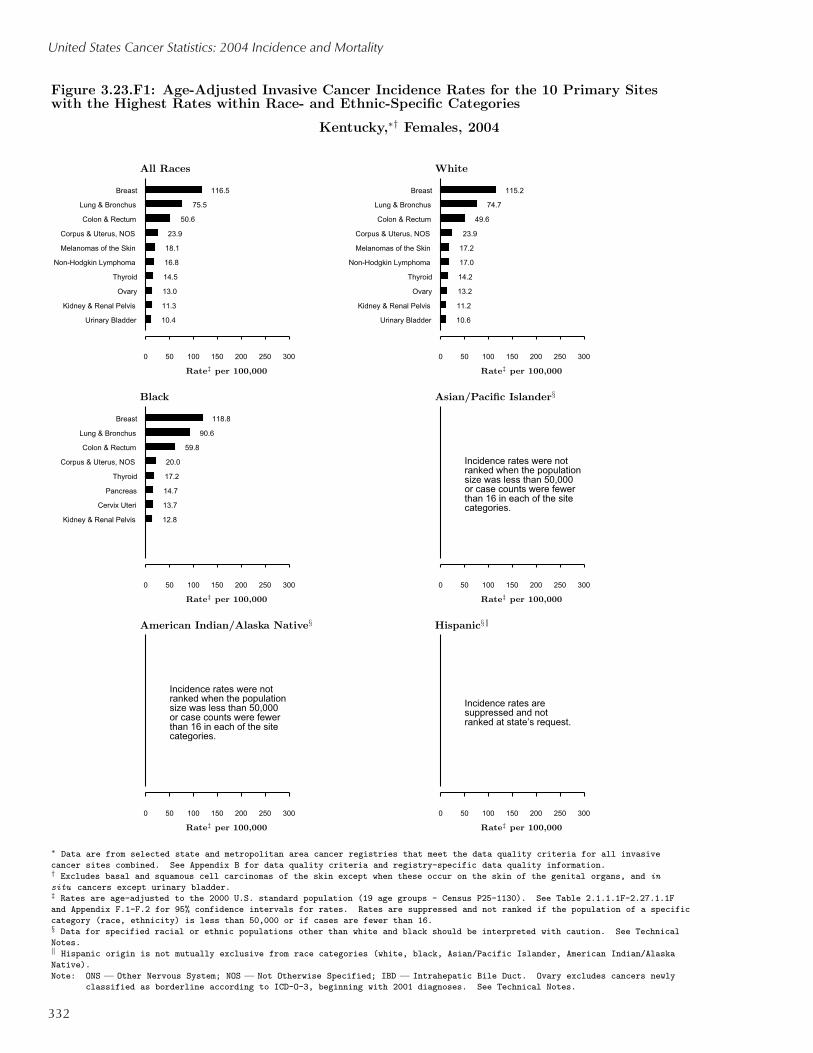
United States Cancer Statistics: 2004 Incidence and Mortality
33�
Figure 3.23.F1: Age-Adjusted Invasive Cancer Incidence Rates for the 10 Primary Siteswith the Highest Rates within Race- and Ethnic-Specific Categories
Kentucky,∗† Females, 2004
Urinary Bladder
Kidney & Renal Pelvis
Ovary
Thyroid
Non-Hodgkin Lymphoma
Melanomas of the Skin
Corpus & Uterus, NOS
Colon & Rectum
Lung & Bronchus
Breast
0 50 100 150 200 250 300
10.4
11.3
13.0
14.5
16.8
18.1
23.9
50.6
75.5
116.5
Urinary Bladder
Kidney & Renal Pelvis
Ovary
Thyroid
Non-Hodgkin Lymphoma
Melanomas of the Skin
Corpus & Uterus, NOS
Colon & Rectum
Lung & Bronchus
Breast
0 50 100 150 200 250 300
10.6
11.2
13.2
14.2
17.0
17.2
23.9
49.6
74.7
115.2
Kidney & Renal Pelvis
Cervix Uteri
Pancreas
Thyroid
Corpus & Uterus, NOS
Colon & Rectum
Lung & Bronchus
Breast
0 50 100 150 200 250 300
12.8
13.7
14.7
17.2
20.0
59.8
90.6
118.8
0 50 100 150 200 250 300
Incidence rates were notranked when the populationsize was less than 50,000or case counts were fewerthan 16 in each of the sitecategories.
0 50 100 150 200 250 300
Incidence rates were notranked when the populationsize was less than 50,000or case counts were fewerthan 16 in each of the sitecategories.
0 50 100 150 200 250 300
Incidence rates aresuppressed and notranked at state’s request.
Rate‡ per 100,000Rate‡ per 100,000
Rate‡ per 100,000Rate‡ per 100,000
Rate‡ per 100,000Rate‡ per 100,000
All Races White
Black Asian/Pacific Islander§
American Indian/Alaska Native§ Hispanic§�
∗ Data are from selected state and metropolitan area cancer registries that meet the data quality criteria for all invasive
cancer sites combined. See Appendix B for data quality criteria and registry-specific data quality information.† Excludes basal and squamous cell carcinomas of the skin except when these occur on the skin of the genital organs, and in
situ cancers except urinary bladder.‡ Rates are age-adjusted to the 2000 U.S. standard population (19 age groups - Census P25-1130). See Table 2.1.1.1F-2.27.1.1F
and Appendix F.1-F.2 for 95% confidence intervals for rates. Rates are suppressed and not ranked if the population of a specific
category (race, ethnicity) is less than 50,000 or if cases are fewer than 16.§ Data for specified racial or ethnic populations other than white and black should be interpreted with caution. See Technical
Notes.� Hispanic origin is not mutually exclusive from race categories (white, black, Asian/Pacific Islander, American Indian/Alaska
Native).
Note: ONS — Other Nervous System; NOS — Not Otherwise Specified; IBD — Intrahepatic Bile Duct. Ovary excludes cancers newly
classified as borderline according to ICD-O-3, beginning with 2001 diagnoses. See Technical Notes.

State and Metropolitan-Area Incidence Rates and State Death Rates for the Most Common Cancers
333
Figure 3.23.F2: Age-Adjusted Cancer Death Rates for the 10 Primary Sites with theHighest Rates within Race- and Ethnic-Specific Categories
Kentucky,∗ Females, 2004
Brain & ONS
Corpus & Uterus, NOS
Liver & IBD
Non-Hodgkin Lymphoma
Leukemias
Ovary
Pancreas
Colon & Rectum
Breast
Lung & Bronchus
0 50 100 150
3.4
3.5
3.9
6.1
6.2
8.5
9.4
18.3
24.3
57.0
Kidney & Renal Pelvis
Corpus & Uterus, NOS
Liver & IBD
Leukemias
Non-Hodgkin Lymphoma
Ovary
Pancreas
Colon & Rectum
Breast
Lung & Bronchus
0 50 100 150
3.2
3.6
3.7
6.2
6.3
8.7
9.0
18.1
23.7
57.1
Pancreas
Colon & Rectum
Breast
Lung & Bronchus
0 50 100 150
14.8
24.6
36.0
62.9
0 50 100 150
Death rates were notranked when the populationsize was less than 50,000or case counts were fewerthan 16 in each of the sitecategories.
0 50 100 150
Death rates were notranked when the populationsize was less than 50,000or case counts were fewerthan 16 in each of the sitecategories.
0 50 100 150
Death rates were notranked when the populationsize was less than 50,000or case counts were fewerthan 16 in each of the sitecategories.
Rate† per 100,000Rate† per 100,000
Rate† per 100,000Rate† per 100,000
Rate† per 100,000Rate† per 100,000
All Races White
Black Asian/Pacific Islander‡
American Indian/Alaska Native‡ Hispanic‡§
∗ Data are from the National Vital Statistics System (NVSS).† Rates are age-adjusted to the 2000 U.S. standard population (19 age groups - Census P25-1130). See Table 2.1.1.2F-2.27.1.2F
and Appendix F.1-F.2 for 95% confidence intervals for rates. Rates are suppressed and not ranked if the population of a specific
category (race, ethnicity) is less than 50,000 or if deaths are fewer than 16.‡ Data for specified racial or ethnic populations other than white and black should be interpreted with caution. See Technical
Notes.§ Hispanic origin is not mutually exclusive from race categories (white, black, Asian/Pacific Islander, American Indian/Alaska
Native).
Note: ONS — Other Nervous System; NOS — Not Otherwise Specified; IBD — Intrahepatic Bile Duct.
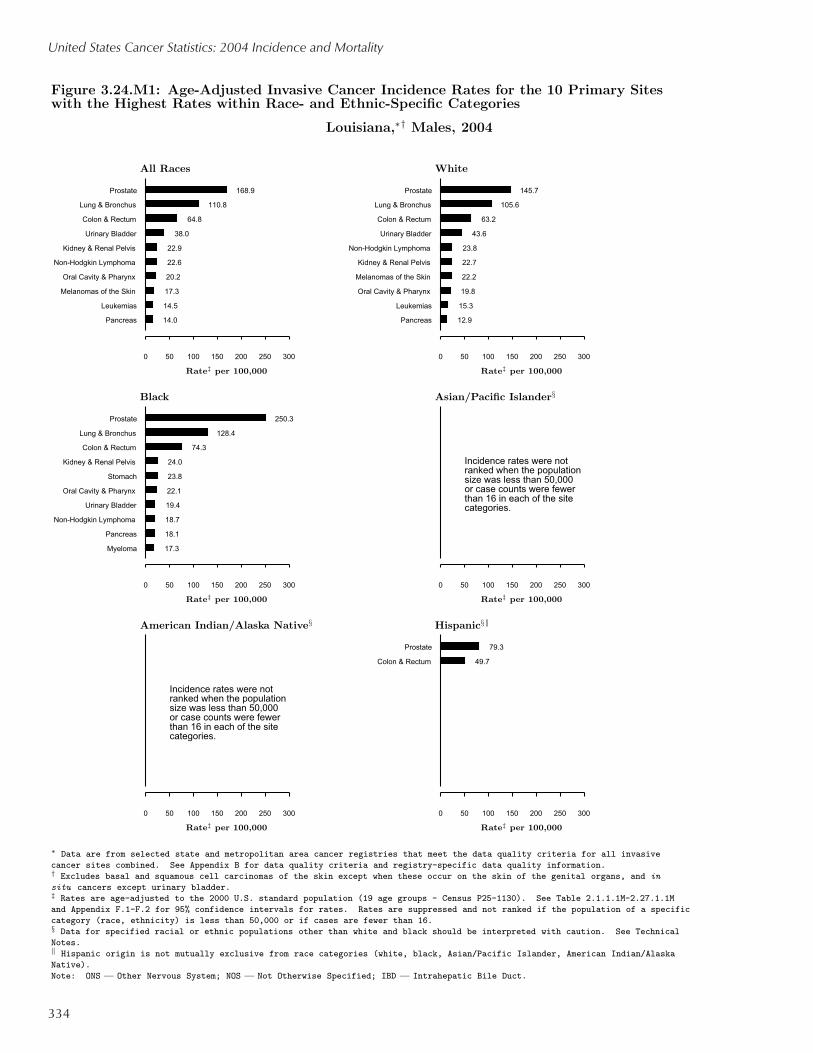
United States Cancer Statistics: 2004 Incidence and Mortality
33�
Figure 3.24.M1: Age-Adjusted Invasive Cancer Incidence Rates for the 10 Primary Siteswith the Highest Rates within Race- and Ethnic-Specific Categories
Louisiana,∗† Males, 2004
Pancreas
Leukemias
Melanomas of the Skin
Oral Cavity & Pharynx
Non-Hodgkin Lymphoma
Kidney & Renal Pelvis
Urinary Bladder
Colon & Rectum
Lung & Bronchus
Prostate
0 50 100 150 200 250 300
14.0
14.5
17.3
20.2
22.6
22.9
38.0
64.8
110.8
168.9
Pancreas
Leukemias
Oral Cavity & Pharynx
Melanomas of the Skin
Kidney & Renal Pelvis
Non-Hodgkin Lymphoma
Urinary Bladder
Colon & Rectum
Lung & Bronchus
Prostate
0 50 100 150 200 250 300
12.9
15.3
19.8
22.2
22.7
23.8
43.6
63.2
105.6
145.7
Myeloma
Pancreas
Non-Hodgkin Lymphoma
Urinary Bladder
Oral Cavity & Pharynx
Stomach
Kidney & Renal Pelvis
Colon & Rectum
Lung & Bronchus
Prostate
0 50 100 150 200 250 300
17.3
18.1
18.7
19.4
22.1
23.8
24.0
74.3
128.4
250.3
0 50 100 150 200 250 300
Incidence rates were notranked when the populationsize was less than 50,000or case counts were fewerthan 16 in each of the sitecategories.
0 50 100 150 200 250 300
Incidence rates were notranked when the populationsize was less than 50,000or case counts were fewerthan 16 in each of the sitecategories.
Colon & Rectum
Prostate
0 50 100 150 200 250 300
49.7
79.3
Rate‡ per 100,000Rate‡ per 100,000
Rate‡ per 100,000Rate‡ per 100,000
Rate‡ per 100,000Rate‡ per 100,000
All Races White
Black Asian/Pacific Islander§
American Indian/Alaska Native§ Hispanic§�
∗ Data are from selected state and metropolitan area cancer registries that meet the data quality criteria for all invasive
cancer sites combined. See Appendix B for data quality criteria and registry-specific data quality information.† Excludes basal and squamous cell carcinomas of the skin except when these occur on the skin of the genital organs, and in
situ cancers except urinary bladder.‡ Rates are age-adjusted to the 2000 U.S. standard population (19 age groups - Census P25-1130). See Table 2.1.1.1M-2.27.1.1M
and Appendix F.1-F.2 for 95% confidence intervals for rates. Rates are suppressed and not ranked if the population of a specific
category (race, ethnicity) is less than 50,000 or if cases are fewer than 16.§ Data for specified racial or ethnic populations other than white and black should be interpreted with caution. See Technical
Notes.� Hispanic origin is not mutually exclusive from race categories (white, black, Asian/Pacific Islander, American Indian/Alaska
Native).
Note: ONS — Other Nervous System; NOS — Not Otherwise Specified; IBD — Intrahepatic Bile Duct.
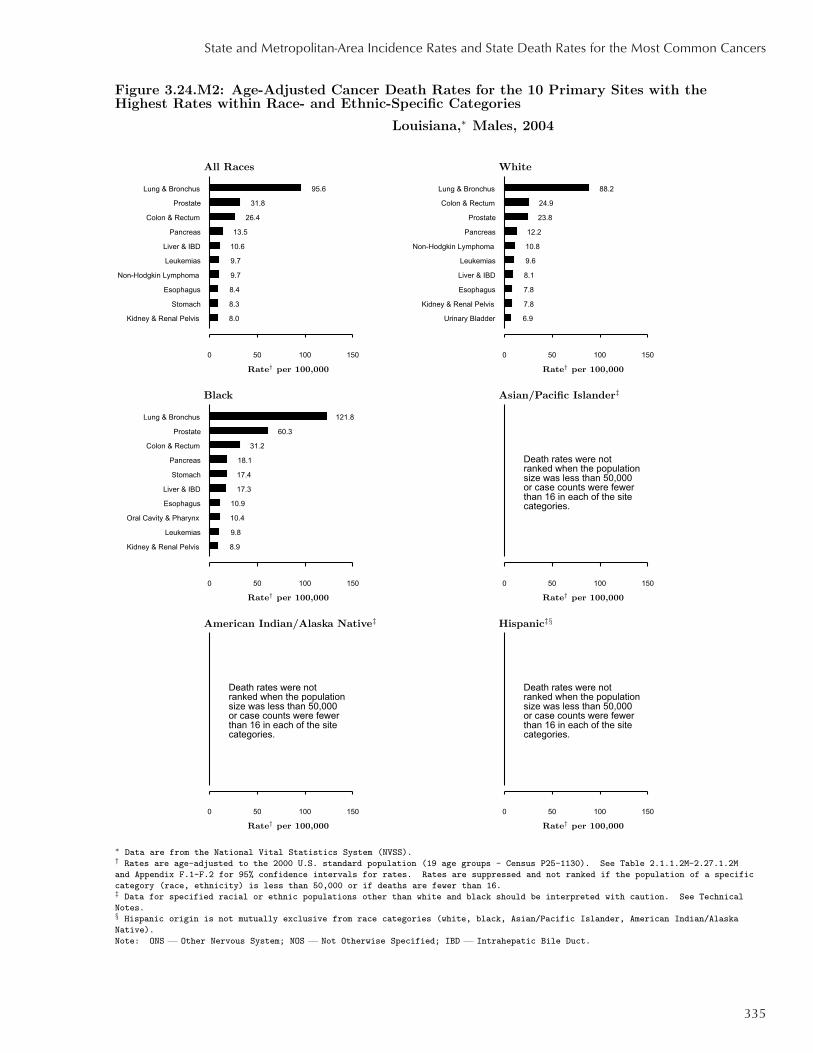
State and Metropolitan-Area Incidence Rates and State Death Rates for the Most Common Cancers
33�
Figure 3.24.M2: Age-Adjusted Cancer Death Rates for the 10 Primary Sites with theHighest Rates within Race- and Ethnic-Specific Categories
Louisiana,∗ Males, 2004
Kidney & Renal Pelvis
Stomach
Esophagus
Non-Hodgkin Lymphoma
Leukemias
Liver & IBD
Pancreas
Colon & Rectum
Prostate
Lung & Bronchus
0 50 100 150
8.0
8.3
8.4
9.7
9.7
10.6
13.5
26.4
31.8
95.6
Urinary Bladder
Kidney & Renal Pelvis
Esophagus
Liver & IBD
Leukemias
Non-Hodgkin Lymphoma
Pancreas
Prostate
Colon & Rectum
Lung & Bronchus
0 50 100 150
6.9
7.8
7.8
8.1
9.6
10.8
12.2
23.8
24.9
88.2
Kidney & Renal Pelvis
Leukemias
Oral Cavity & Pharynx
Esophagus
Liver & IBD
Stomach
Pancreas
Colon & Rectum
Prostate
Lung & Bronchus
0 50 100 150
8.9
9.8
10.4
10.9
17.3
17.4
18.1
31.2
60.3
121.8
0 50 100 150
Death rates were notranked when the populationsize was less than 50,000or case counts were fewerthan 16 in each of the sitecategories.
0 50 100 150
Death rates were notranked when the populationsize was less than 50,000or case counts were fewerthan 16 in each of the sitecategories.
0 50 100 150
Death rates were notranked when the populationsize was less than 50,000or case counts were fewerthan 16 in each of the sitecategories.
Rate† per 100,000Rate† per 100,000
Rate† per 100,000Rate† per 100,000
Rate† per 100,000Rate† per 100,000
All Races White
Black Asian/Pacific Islander‡
American Indian/Alaska Native‡ Hispanic‡§
∗ Data are from the National Vital Statistics System (NVSS).† Rates are age-adjusted to the 2000 U.S. standard population (19 age groups - Census P25-1130). See Table 2.1.1.2M-2.27.1.2M
and Appendix F.1-F.2 for 95% confidence intervals for rates. Rates are suppressed and not ranked if the population of a specific
category (race, ethnicity) is less than 50,000 or if deaths are fewer than 16.‡ Data for specified racial or ethnic populations other than white and black should be interpreted with caution. See Technical
Notes.§ Hispanic origin is not mutually exclusive from race categories (white, black, Asian/Pacific Islander, American Indian/Alaska
Native).
Note: ONS — Other Nervous System; NOS — Not Otherwise Specified; IBD — Intrahepatic Bile Duct.

United States Cancer Statistics: 2004 Incidence and Mortality
33�
Figure 3.24.F1: Age-Adjusted Invasive Cancer Incidence Rates for the 10 Primary Siteswith the Highest Rates within Race- and Ethnic-Specific Categories
Louisiana,∗† Females, 2004
Cervix Uteri
Thyroid
Ovary
Kidney & Renal Pelvis
Pancreas
Corpus & Uterus, NOS
Non-Hodgkin Lymphoma
Colon & Rectum
Lung & Bronchus
Breast
0 50 100 150 200 250 300
9.2
10.5
10.6
11.9
12.3
16.8
17.7
45.4
57.5
120.0
Pancreas
Ovary
Melanomas of the Skin
Kidney & Renal Pelvis
Thyroid
Corpus & Uterus, NOS
Non-Hodgkin Lymphoma
Colon & Rectum
Lung & Bronchus
Breast
0 50 100 150 200 250 300
11.4
11.5
12.0
12.6
13.0
16.9
19.3
44.6
60.7
117.9
Stomach
Myeloma
Kidney & Renal Pelvis
Cervix Uteri
Non-Hodgkin Lymphoma
Pancreas
Corpus & Uterus, NOS
Colon & Rectum
Lung & Bronchus
Breast
0 50 100 150 200 250 300
9.4
9.9
10.1
13.1
13.3
14.6
17.7
49.1
49.3
126.1
0 50 100 150 200 250 300
Incidence rates were notranked when the populationsize was less than 50,000or case counts were fewerthan 16 in each of the sitecategories.
0 50 100 150 200 250 300
Incidence rates were notranked when the populationsize was less than 50,000or case counts were fewerthan 16 in each of the sitecategories.
Breast
0 50 100 150 200 250 300
69.5
Rate‡ per 100,000Rate‡ per 100,000
Rate‡ per 100,000Rate‡ per 100,000
Rate‡ per 100,000Rate‡ per 100,000
All Races White
Black Asian/Pacific Islander§
American Indian/Alaska Native§ Hispanic§�
∗ Data are from selected state and metropolitan area cancer registries that meet the data quality criteria for all invasive
cancer sites combined. See Appendix B for data quality criteria and registry-specific data quality information.† Excludes basal and squamous cell carcinomas of the skin except when these occur on the skin of the genital organs, and in
situ cancers except urinary bladder.‡ Rates are age-adjusted to the 2000 U.S. standard population (19 age groups - Census P25-1130). See Table 2.1.1.1F-2.27.1.1F
and Appendix F.1-F.2 for 95% confidence intervals for rates. Rates are suppressed and not ranked if the population of a specific
category (race, ethnicity) is less than 50,000 or if cases are fewer than 16.§ Data for specified racial or ethnic populations other than white and black should be interpreted with caution. See Technical
Notes.� Hispanic origin is not mutually exclusive from race categories (white, black, Asian/Pacific Islander, American Indian/Alaska
Native).
Note: ONS — Other Nervous System; NOS — Not Otherwise Specified; IBD — Intrahepatic Bile Duct. Ovary excludes cancers newly
classified as borderline according to ICD-O-3, beginning with 2001 diagnoses. See Technical Notes.

State and Metropolitan-Area Incidence Rates and State Death Rates for the Most Common Cancers
33�
Figure 3.24.F2: Age-Adjusted Cancer Death Rates for the 10 Primary Sites with theHighest Rates within Race- and Ethnic-Specific Categories
Louisiana,∗ Females, 2004
Kidney & Renal Pelvis
Corpus & Uterus, NOS
Liver & IBD
Leukemias
Non-Hodgkin Lymphoma
Ovary
Pancreas
Colon & Rectum
Breast
Lung & Bronchus
0 50 100 150
3.6
3.8
4.3
5.4
6.4
8.3
10.9
18.0
27.6
46.3
Kidney & Renal Pelvis
Brain & ONS
Liver & IBD
Leukemias
Non-Hodgkin Lymphoma
Ovary
Pancreas
Colon & Rectum
Breast
Lung & Bronchus
0 50 100 150
3.4
3.7
3.7
5.4
7.0
8.3
9.9
16.4
22.7
48.4
Leukemias
Cervix Uteri
Liver & IBD
Stomach
Corpus & Uterus, NOS
Ovary
Pancreas
Colon & Rectum
Breast
Lung & Bronchus
0 50 100 150
5.7
5.9
6.0
6.6
7.4
8.1
14.0
23.4
39.3
41.2
0 50 100 150
Death rates were notranked when the populationsize was less than 50,000or case counts were fewerthan 16 in each of the sitecategories.
0 50 100 150
Death rates were notranked when the populationsize was less than 50,000or case counts were fewerthan 16 in each of the sitecategories.
0 50 100 150
Death rates were notranked when the populationsize was less than 50,000or case counts were fewerthan 16 in each of the sitecategories.
Rate† per 100,000Rate† per 100,000
Rate† per 100,000Rate† per 100,000
Rate† per 100,000Rate† per 100,000
All Races White
Black Asian/Pacific Islander‡
American Indian/Alaska Native‡ Hispanic‡§
∗ Data are from the National Vital Statistics System (NVSS).† Rates are age-adjusted to the 2000 U.S. standard population (19 age groups - Census P25-1130). See Table 2.1.1.2F-2.27.1.2F
and Appendix F.1-F.2 for 95% confidence intervals for rates. Rates are suppressed and not ranked if the population of a specific
category (race, ethnicity) is less than 50,000 or if deaths are fewer than 16.‡ Data for specified racial or ethnic populations other than white and black should be interpreted with caution. See Technical
Notes.§ Hispanic origin is not mutually exclusive from race categories (white, black, Asian/Pacific Islander, American Indian/Alaska
Native).
Note: ONS — Other Nervous System; NOS — Not Otherwise Specified; IBD — Intrahepatic Bile Duct.

United States Cancer Statistics: 2004 Incidence and Mortality
33�
Figure 3.25.M1: Age-Adjusted Invasive Cancer Incidence Rates for the 10 Primary Siteswith the Highest Rates within Race- and Ethnic-Specific Categories
Maine,∗† Males, 2004
Pancreas
Kidney & Renal Pelvis
Leukemias
Oral Cavity & Pharynx
Melanomas of the Skin
Non-Hodgkin Lymphoma
Urinary Bladder
Colon & Rectum
Lung & Bronchus
Prostate
0 50 100 150 200 250 300
14.8
18.2
19.2
19.7
27.0
27.0
46.8
62.6
99.0
167.4
Pancreas
Kidney & Renal Pelvis
Leukemias
Oral Cavity & Pharynx
Non-Hodgkin Lymphoma
Melanomas of the Skin
Urinary Bladder
Colon & Rectum
Lung & Bronchus
Prostate
0 50 100 150 200 250 300
14.8
18.1
18.9
19.7
26.2
26.7
46.5
62.0
98.4
164.7
0 50 100 150 200 250 300
Incidence rates were notranked when the populationsize was less than 50,000or case counts were fewerthan 16 in each of the sitecategories.
0 50 100 150 200 250 300
Incidence rates were notranked when the populationsize was less than 50,000or case counts were fewerthan 16 in each of the sitecategories.
0 50 100 150 200 250 300
Incidence rates were notranked when the populationsize was less than 50,000or case counts were fewerthan 16 in each of the sitecategories.
0 50 100 150 200 250 300
Incidence rates were notranked when the populationsize was less than 50,000or case counts were fewerthan 16 in each of the sitecategories.
Rate‡ per 100,000Rate‡ per 100,000
Rate‡ per 100,000Rate‡ per 100,000
Rate‡ per 100,000Rate‡ per 100,000
All Races White
Black Asian/Pacific Islander§
American Indian/Alaska Native§ Hispanic§�
∗ Data are from selected state and metropolitan area cancer registries that meet the data quality criteria for all invasive
cancer sites combined. See Appendix B for data quality criteria and registry-specific data quality information.† Excludes basal and squamous cell carcinomas of the skin except when these occur on the skin of the genital organs, and in
situ cancers except urinary bladder.‡ Rates are age-adjusted to the 2000 U.S. standard population (19 age groups - Census P25-1130). See Table 2.1.1.1M-2.27.1.1M
and Appendix F.1-F.2 for 95% confidence intervals for rates. Rates are suppressed and not ranked if the population of a specific
category (race, ethnicity) is less than 50,000 or if cases are fewer than 16.§ Data for specified racial or ethnic populations other than white and black should be interpreted with caution. See Technical
Notes.� Hispanic origin is not mutually exclusive from race categories (white, black, Asian/Pacific Islander, American Indian/Alaska
Native).
Note: ONS — Other Nervous System; NOS — Not Otherwise Specified; IBD — Intrahepatic Bile Duct.

State and Metropolitan-Area Incidence Rates and State Death Rates for the Most Common Cancers
33�
Figure 3.25.M2: Age-Adjusted Cancer Death Rates for the 10 Primary Sites with theHighest Rates within Race- and Ethnic-Specific Categories
Maine,∗ Males, 2004
Liver & IBD
Brain & ONS
Leukemias
Non-Hodgkin Lymphoma
Esophagus
Urinary Bladder
Pancreas
Colon & Rectum
Prostate
Lung & Bronchus
0 50 100 150
6.0
6.9
9.2
9.8
10.6
11.7
13.1
17.7
26.6
78.0
Liver & IBD
Brain & ONS
Leukemias
Non-Hodgkin Lymphoma
Esophagus
Urinary Bladder
Pancreas
Colon & Rectum
Prostate
Lung & Bronchus
0 50 100 150
5.9
6.8
9.2
9.5
10.4
11.8
13.2
17.6
26.5
78.2
0 50 100 150
Death rates were notranked when the populationsize was less than 50,000or case counts were fewerthan 16 in each of the sitecategories.
0 50 100 150
Death rates were notranked when the populationsize was less than 50,000or case counts were fewerthan 16 in each of the sitecategories.
0 50 100 150
Death rates were notranked when the populationsize was less than 50,000or case counts were fewerthan 16 in each of the sitecategories.
0 50 100 150
Death rates were notranked when the populationsize was less than 50,000or case counts were fewerthan 16 in each of the sitecategories.
Rate† per 100,000Rate† per 100,000
Rate† per 100,000Rate† per 100,000
Rate† per 100,000Rate† per 100,000
All Races White
Black Asian/Pacific Islander‡
American Indian/Alaska Native‡ Hispanic‡§
∗ Data are from the National Vital Statistics System (NVSS).† Rates are age-adjusted to the 2000 U.S. standard population (19 age groups - Census P25-1130). See Table 2.1.1.2M-2.27.1.2M
and Appendix F.1-F.2 for 95% confidence intervals for rates. Rates are suppressed and not ranked if the population of a specific
category (race, ethnicity) is less than 50,000 or if deaths are fewer than 16.‡ Data for specified racial or ethnic populations other than white and black should be interpreted with caution. See Technical
Notes.§ Hispanic origin is not mutually exclusive from race categories (white, black, Asian/Pacific Islander, American Indian/Alaska
Native).
Note: ONS — Other Nervous System; NOS — Not Otherwise Specified; IBD — Intrahepatic Bile Duct.

United States Cancer Statistics: 2004 Incidence and Mortality
3�0
Figure 3.25.F1: Age-Adjusted Invasive Cancer Incidence Rates for the 10 Primary Siteswith the Highest Rates within Race- and Ethnic-Specific Categories
Maine,∗† Females, 2004
Kidney & Renal Pelvis
Ovary
Urinary Bladder
Thyroid
Melanomas of the Skin
Non-Hodgkin Lymphoma
Corpus & Uterus, NOS
Colon & Rectum
Lung & Bronchus
Breast
0 50 100 150 200 250 300
12.3
12.7
13.0
13.4
18.4
18.8
26.9
50.0
64.7
123.0
Kidney & Renal Pelvis
Ovary
Urinary Bladder
Thyroid
Melanomas of the Skin
Non-Hodgkin Lymphoma
Corpus & Uterus, NOS
Colon & Rectum
Lung & Bronchus
Breast
0 50 100 150 200 250 300
12.4
12.7
13.1
13.7
17.9
18.8
27.3
49.4
64.7
121.0
0 50 100 150 200 250 300
Incidence rates were notranked when the populationsize was less than 50,000or case counts were fewerthan 16 in each of the sitecategories.
0 50 100 150 200 250 300
Incidence rates were notranked when the populationsize was less than 50,000or case counts were fewerthan 16 in each of the sitecategories.
0 50 100 150 200 250 300
Incidence rates were notranked when the populationsize was less than 50,000or case counts were fewerthan 16 in each of the sitecategories.
0 50 100 150 200 250 300
Incidence rates were notranked when the populationsize was less than 50,000or case counts were fewerthan 16 in each of the sitecategories.
Rate‡ per 100,000Rate‡ per 100,000
Rate‡ per 100,000Rate‡ per 100,000
Rate‡ per 100,000Rate‡ per 100,000
All Races White
Black Asian/Pacific Islander§
American Indian/Alaska Native§ Hispanic§�
∗ Data are from selected state and metropolitan area cancer registries that meet the data quality criteria for all invasive
cancer sites combined. See Appendix B for data quality criteria and registry-specific data quality information.† Excludes basal and squamous cell carcinomas of the skin except when these occur on the skin of the genital organs, and in
situ cancers except urinary bladder.‡ Rates are age-adjusted to the 2000 U.S. standard population (19 age groups - Census P25-1130). See Table 2.1.1.1F-2.27.1.1F
and Appendix F.1-F.2 for 95% confidence intervals for rates. Rates are suppressed and not ranked if the population of a specific
category (race, ethnicity) is less than 50,000 or if cases are fewer than 16.§ Data for specified racial or ethnic populations other than white and black should be interpreted with caution. See Technical
Notes.� Hispanic origin is not mutually exclusive from race categories (white, black, Asian/Pacific Islander, American Indian/Alaska
Native).
Note: ONS — Other Nervous System; NOS — Not Otherwise Specified; IBD — Intrahepatic Bile Duct. Ovary excludes cancers newly
classified as borderline according to ICD-O-3, beginning with 2001 diagnoses. See Technical Notes.

State and Metropolitan-Area Incidence Rates and State Death Rates for the Most Common Cancers
3��
Figure 3.25.F2: Age-Adjusted Cancer Death Rates for the 10 Primary Sites with theHighest Rates within Race- and Ethnic-Specific Categories
Maine,∗ Females, 2004
Myeloma
Brain & ONS
Leukemias
Corpus & Uterus, NOS
Ovary
Non-Hodgkin Lymphoma
Pancreas
Colon & Rectum
Breast
Lung & Bronchus
0 50 100 150
3.3
3.5
4.8
5.0
6.8
7.2
9.9
17.8
21.2
49.0
Myeloma
Brain & ONS
Leukemias
Corpus & Uterus, NOS
Ovary
Non-Hodgkin Lymphoma
Pancreas
Colon & Rectum
Breast
Lung & Bronchus
0 50 100 150
3.4
3.6
4.7
5.1
6.9
7.2
10.0
17.4
21.3
49.1
0 50 100 150
Death rates were notranked when the populationsize was less than 50,000or case counts were fewerthan 16 in each of the sitecategories.
0 50 100 150
Death rates were notranked when the populationsize was less than 50,000or case counts were fewerthan 16 in each of the sitecategories.
0 50 100 150
Death rates were notranked when the populationsize was less than 50,000or case counts were fewerthan 16 in each of the sitecategories.
0 50 100 150
Death rates were notranked when the populationsize was less than 50,000or case counts were fewerthan 16 in each of the sitecategories.
Rate† per 100,000Rate† per 100,000
Rate† per 100,000Rate† per 100,000
Rate† per 100,000Rate† per 100,000
All Races White
Black Asian/Pacific Islander‡
American Indian/Alaska Native‡ Hispanic‡§
∗ Data are from the National Vital Statistics System (NVSS).† Rates are age-adjusted to the 2000 U.S. standard population (19 age groups - Census P25-1130). See Table 2.1.1.2F-2.27.1.2F
and Appendix F.1-F.2 for 95% confidence intervals for rates. Rates are suppressed and not ranked if the population of a specific
category (race, ethnicity) is less than 50,000 or if deaths are fewer than 16.‡ Data for specified racial or ethnic populations other than white and black should be interpreted with caution. See Technical
Notes.§ Hispanic origin is not mutually exclusive from race categories (white, black, Asian/Pacific Islander, American Indian/Alaska
Native).
Note: ONS — Other Nervous System; NOS — Not Otherwise Specified; IBD — Intrahepatic Bile Duct.

United States Cancer Statistics: 2004 Incidence and Mortality
3��
Incidence data are not presented for states that did not meet theUSCS data quality criteria.
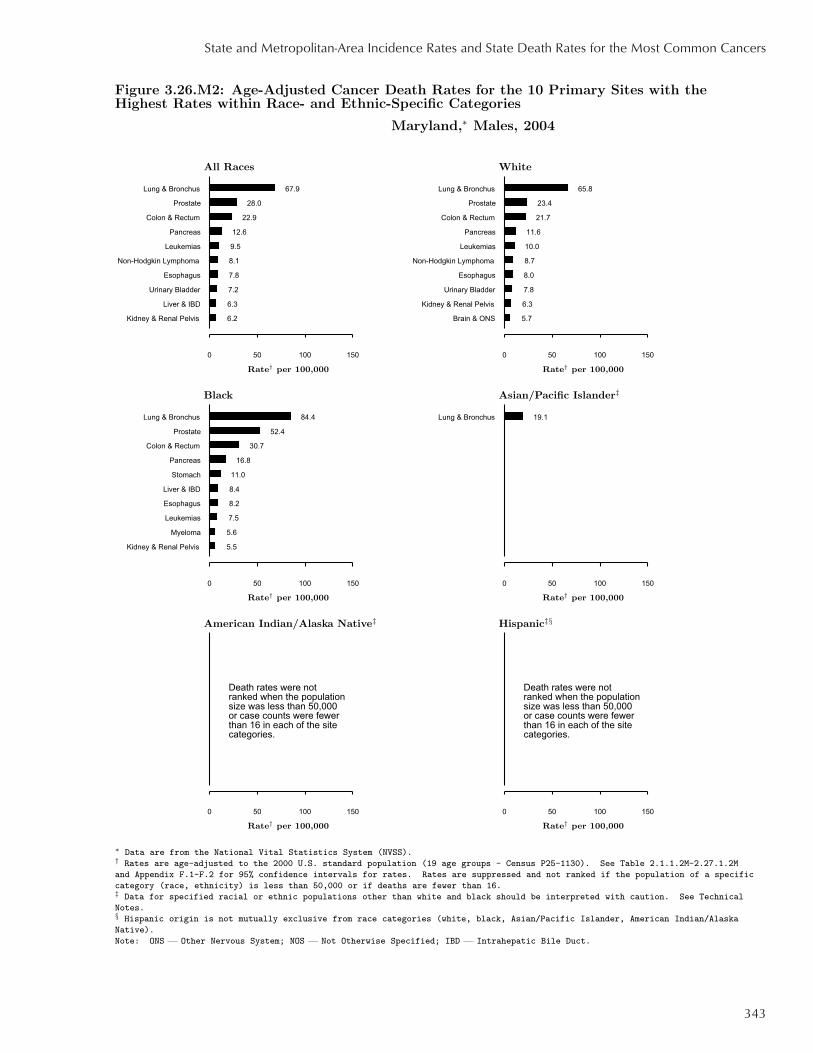
State and Metropolitan-Area Incidence Rates and State Death Rates for the Most Common Cancers
3�3
Figure 3.26.M2: Age-Adjusted Cancer Death Rates for the 10 Primary Sites with theHighest Rates within Race- and Ethnic-Specific Categories
Maryland,∗ Males, 2004
Kidney & Renal Pelvis
Liver & IBD
Urinary Bladder
Esophagus
Non-Hodgkin Lymphoma
Leukemias
Pancreas
Colon & Rectum
Prostate
Lung & Bronchus
0 50 100 150
6.2
6.3
7.2
7.8
8.1
9.5
12.6
22.9
28.0
67.9
Brain & ONS
Kidney & Renal Pelvis
Urinary Bladder
Esophagus
Non-Hodgkin Lymphoma
Leukemias
Pancreas
Colon & Rectum
Prostate
Lung & Bronchus
0 50 100 150
5.7
6.3
7.8
8.0
8.7
10.0
11.6
21.7
23.4
65.8
Kidney & Renal Pelvis
Myeloma
Leukemias
Esophagus
Liver & IBD
Stomach
Pancreas
Colon & Rectum
Prostate
Lung & Bronchus
0 50 100 150
5.5
5.6
7.5
8.2
8.4
11.0
16.8
30.7
52.4
84.4 Lung & Bronchus
0 50 100 150
19.1
0 50 100 150
Death rates were notranked when the populationsize was less than 50,000or case counts were fewerthan 16 in each of the sitecategories.
0 50 100 150
Death rates were notranked when the populationsize was less than 50,000or case counts were fewerthan 16 in each of the sitecategories.
Rate† per 100,000Rate† per 100,000
Rate† per 100,000Rate† per 100,000
Rate† per 100,000Rate† per 100,000
All Races White
Black Asian/Pacific Islander‡
American Indian/Alaska Native‡ Hispanic‡§
∗ Data are from the National Vital Statistics System (NVSS).† Rates are age-adjusted to the 2000 U.S. standard population (19 age groups - Census P25-1130). See Table 2.1.1.2M-2.27.1.2M
and Appendix F.1-F.2 for 95% confidence intervals for rates. Rates are suppressed and not ranked if the population of a specific
category (race, ethnicity) is less than 50,000 or if deaths are fewer than 16.‡ Data for specified racial or ethnic populations other than white and black should be interpreted with caution. See Technical
Notes.§ Hispanic origin is not mutually exclusive from race categories (white, black, Asian/Pacific Islander, American Indian/Alaska
Native).
Note: ONS — Other Nervous System; NOS — Not Otherwise Specified; IBD — Intrahepatic Bile Duct.

United States Cancer Statistics: 2004 Incidence and Mortality
3��
Incidence data are not presented for states that did not meet theUSCS data quality criteria.

State and Metropolitan-Area Incidence Rates and State Death Rates for the Most Common Cancers
3��
Figure 3.26.F2: Age-Adjusted Cancer Death Rates for the 10 Primary Sites with theHighest Rates within Race- and Ethnic-Specific Categories
Maryland,∗ Females, 2004
Myeloma
Brain & ONS
Corpus & Uterus, NOS
Non-Hodgkin Lymphoma
Leukemias
Ovary
Pancreas
Colon & Rectum
Breast
Lung & Bronchus
0 50 100 150
3.5
3.7
4.8
5.3
5.4
8.5
10.1
15.9
26.9
42.6
Myeloma
Corpus & Uterus, NOS
Brain & ONS
Leukemias
Non-Hodgkin Lymphoma
Pancreas
Ovary
Colon & Rectum
Breast
Lung & Bronchus
0 50 100 150
3.0
4.0
4.4
5.5
5.9
9.1
9.3
14.4
25.3
44.4
Cervix Uteri
Stomach
Leukemias
Myeloma
Ovary
Corpus & Uterus, NOS
Pancreas
Colon & Rectum
Breast
Lung & Bronchus
0 50 100 150
3.9
5.3
5.5
5.6
6.8
7.9
13.3
21.6
32.9
40.8
0 50 100 150
Death rates were notranked when the populationsize was less than 50,000or case counts were fewerthan 16 in each of the sitecategories.
0 50 100 150
Death rates were notranked when the populationsize was less than 50,000or case counts were fewerthan 16 in each of the sitecategories.
0 50 100 150
Death rates were notranked when the populationsize was less than 50,000or case counts were fewerthan 16 in each of the sitecategories.
Rate† per 100,000Rate† per 100,000
Rate† per 100,000Rate† per 100,000
Rate† per 100,000Rate† per 100,000
All Races White
Black Asian/Pacific Islander‡
American Indian/Alaska Native‡ Hispanic‡§
∗ Data are from the National Vital Statistics System (NVSS).† Rates are age-adjusted to the 2000 U.S. standard population (19 age groups - Census P25-1130). See Table 2.1.1.2F-2.27.1.2F
and Appendix F.1-F.2 for 95% confidence intervals for rates. Rates are suppressed and not ranked if the population of a specific
category (race, ethnicity) is less than 50,000 or if deaths are fewer than 16.‡ Data for specified racial or ethnic populations other than white and black should be interpreted with caution. See Technical
Notes.§ Hispanic origin is not mutually exclusive from race categories (white, black, Asian/Pacific Islander, American Indian/Alaska
Native).
Note: ONS — Other Nervous System; NOS — Not Otherwise Specified; IBD — Intrahepatic Bile Duct.

United States Cancer Statistics: 2004 Incidence and Mortality
3��
Figure 3.27.M1: Age-Adjusted Invasive Cancer Incidence Rates for the 10 Primary Siteswith the Highest Rates within Race- and Ethnic-Specific Categories
Massachusetts,∗† Males, 2004
Pancreas
Leukemias
Oral Cavity & Pharynx
Kidney & Renal Pelvis
Non-Hodgkin Lymphoma
Melanomas of the Skin
Urinary Bladder
Colon & Rectum
Lung & Bronchus
Prostate
0 50 100 150 200 250 300
12.2
15.5
15.5
19.5
23.2
25.4
43.7
63.6
79.6
154.5
Esophagus
Oral Cavity & Pharynx
Leukemias
Kidney & Renal Pelvis
Non-Hodgkin Lymphoma
Melanomas of the Skin
Urinary Bladder
Colon & Rectum
Lung & Bronchus
Prostate
0 50 100 150 200 250 300
12.4
15.7
15.8
19.7
23.2
25.5
45.2
64.2
80.0
148.3
Myeloma
Pancreas
Liver & IBD
Non-Hodgkin Lymphoma
Stomach
Kidney & Renal Pelvis
Urinary Bladder
Colon & Rectum
Lung & Bronchus
Prostate
0 50 100 150 200 250 300
12.7
13.5
15.1
17.1
20.8
22.7
23.5
47.6
84.3
241.1
Liver & IBD
Lung & Bronchus
Colon & Rectum
Prostate
0 50 100 150 200 250 300
24.8
43.1
43.9
69.5
0 50 100 150 200 250 300
Incidence rates were notranked when the populationsize was less than 50,000or case counts were fewerthan 16 in each of the sitecategories.
Non-Hodgkin Lymphoma
Oral Cavity & Pharynx
Liver & IBD
Stomach
Urinary Bladder
Colon & Rectum
Lung & Bronchus
Prostate
0 50 100 150 200 250 300
14.0
14.9
15.5
20.3
25.2
41.7
52.6
190.8
Rate‡ per 100,000Rate‡ per 100,000
Rate‡ per 100,000Rate‡ per 100,000
Rate‡ per 100,000Rate‡ per 100,000
All Races White
Black Asian/Pacific Islander§
American Indian/Alaska Native§ Hispanic§�
∗ Data are from selected state and metropolitan area cancer registries that meet the data quality criteria for all invasive
cancer sites combined. See Appendix B for data quality criteria and registry-specific data quality information.† Excludes basal and squamous cell carcinomas of the skin except when these occur on the skin of the genital organs, and in
situ cancers except urinary bladder.‡ Rates are age-adjusted to the 2000 U.S. standard population (19 age groups - Census P25-1130). See Table 2.1.1.1M-2.27.1.1M
and Appendix F.1-F.2 for 95% confidence intervals for rates. Rates are suppressed and not ranked if the population of a specific
category (race, ethnicity) is less than 50,000 or if cases are fewer than 16.§ Data for specified racial or ethnic populations other than white and black should be interpreted with caution. See Technical
Notes.� Hispanic origin is not mutually exclusive from race categories (white, black, Asian/Pacific Islander, American Indian/Alaska
Native).
Note: ONS — Other Nervous System; NOS — Not Otherwise Specified; IBD — Intrahepatic Bile Duct.
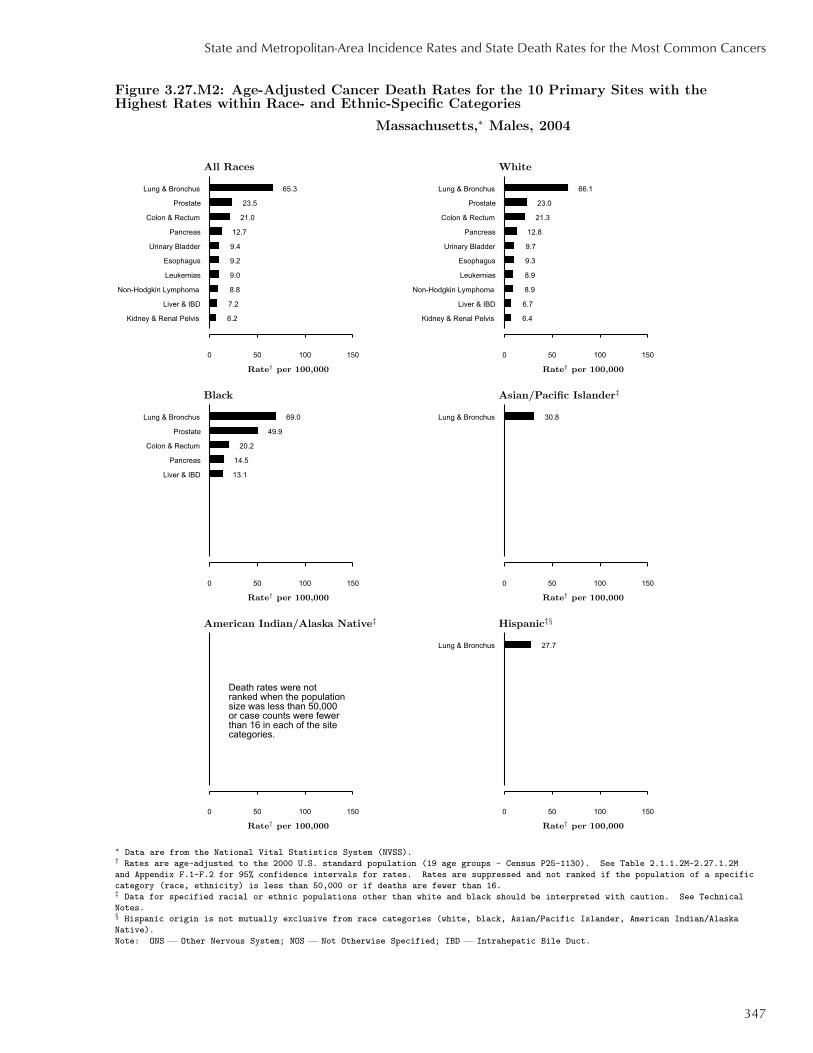
State and Metropolitan-Area Incidence Rates and State Death Rates for the Most Common Cancers
3��
Figure 3.27.M2: Age-Adjusted Cancer Death Rates for the 10 Primary Sites with theHighest Rates within Race- and Ethnic-Specific Categories
Massachusetts,∗ Males, 2004
Kidney & Renal Pelvis
Liver & IBD
Non-Hodgkin Lymphoma
Leukemias
Esophagus
Urinary Bladder
Pancreas
Colon & Rectum
Prostate
Lung & Bronchus
0 50 100 150
6.2
7.2
8.8
9.0
9.2
9.4
12.7
21.0
23.5
65.3
Kidney & Renal Pelvis
Liver & IBD
Non-Hodgkin Lymphoma
Leukemias
Esophagus
Urinary Bladder
Pancreas
Colon & Rectum
Prostate
Lung & Bronchus
0 50 100 150
6.4
6.7
8.9
8.9
9.3
9.7
12.8
21.3
23.0
66.1
Liver & IBD
Pancreas
Colon & Rectum
Prostate
Lung & Bronchus
0 50 100 150
13.1
14.5
20.2
49.9
69.0 Lung & Bronchus
0 50 100 150
30.8
0 50 100 150
Death rates were notranked when the populationsize was less than 50,000or case counts were fewerthan 16 in each of the sitecategories.
Lung & Bronchus
0 50 100 150
27.7
Rate† per 100,000Rate† per 100,000
Rate† per 100,000Rate† per 100,000
Rate† per 100,000Rate† per 100,000
All Races White
Black Asian/Pacific Islander‡
American Indian/Alaska Native‡ Hispanic‡§
∗ Data are from the National Vital Statistics System (NVSS).† Rates are age-adjusted to the 2000 U.S. standard population (19 age groups - Census P25-1130). See Table 2.1.1.2M-2.27.1.2M
and Appendix F.1-F.2 for 95% confidence intervals for rates. Rates are suppressed and not ranked if the population of a specific
category (race, ethnicity) is less than 50,000 or if deaths are fewer than 16.‡ Data for specified racial or ethnic populations other than white and black should be interpreted with caution. See Technical
Notes.§ Hispanic origin is not mutually exclusive from race categories (white, black, Asian/Pacific Islander, American Indian/Alaska
Native).
Note: ONS — Other Nervous System; NOS — Not Otherwise Specified; IBD — Intrahepatic Bile Duct.

United States Cancer Statistics: 2004 Incidence and Mortality
3��
Figure 3.27.F1: Age-Adjusted Invasive Cancer Incidence Rates for the 10 Primary Siteswith the Highest Rates within Race- and Ethnic-Specific Categories
Massachusetts,∗† Females, 2004
Pancreas
Urinary Bladder
Ovary
Non-Hodgkin Lymphoma
Thyroid
Melanomas of the Skin
Corpus & Uterus, NOS
Colon & Rectum
Lung & Bronchus
Breast
0 50 100 150 200 250 300
9.9
13.7
13.8
17.2
18.6
18.7
29.3
46.5
63.1
134.0
Kidney & Renal Pelvis
Urinary Bladder
Ovary
Non-Hodgkin Lymphoma
Thyroid
Melanomas of the Skin
Corpus & Uterus, NOS
Colon & Rectum
Lung & Bronchus
Breast
0 50 100 150 200 250 300
10.1
14.1
14.3
17.4
18.5
18.9
29.8
46.5
64.7
136.1
Cervix Uteri
Non-Hodgkin Lymphoma
Thyroid
Corpus & Uterus, NOS
Colon & Rectum
Lung & Bronchus
Breast
0 50 100 150 200 250 300
10.8
12.5
13.3
20.3
36.8
46.5
104.9
Corpus & Uterus, NOS
Thyroid
Lung & Bronchus
Colon & Rectum
Breast
0 50 100 150 200 250 300
21.7
24.2
27.0
31.7
85.0
0 50 100 150 200 250 300
Incidence rates were notranked when the populationsize was less than 50,000or case counts were fewerthan 16 in each of the sitecategories.
Cervix Uteri
Leukemias
Non-Hodgkin Lymphoma
Thyroid
Corpus & Uterus, NOS
Lung & Bronchus
Colon & Rectum
Breast
0 50 100 150 200 250 300
10.1
12.0
15.8
19.4
24.7
25.4
37.8
103.0
Rate‡ per 100,000Rate‡ per 100,000
Rate‡ per 100,000Rate‡ per 100,000
Rate‡ per 100,000Rate‡ per 100,000
All Races White
Black Asian/Pacific Islander§
American Indian/Alaska Native§ Hispanic§�
∗ Data are from selected state and metropolitan area cancer registries that meet the data quality criteria for all invasive
cancer sites combined. See Appendix B for data quality criteria and registry-specific data quality information.† Excludes basal and squamous cell carcinomas of the skin except when these occur on the skin of the genital organs, and in
situ cancers except urinary bladder.‡ Rates are age-adjusted to the 2000 U.S. standard population (19 age groups - Census P25-1130). See Table 2.1.1.1F-2.27.1.1F
and Appendix F.1-F.2 for 95% confidence intervals for rates. Rates are suppressed and not ranked if the population of a specific
category (race, ethnicity) is less than 50,000 or if cases are fewer than 16.§ Data for specified racial or ethnic populations other than white and black should be interpreted with caution. See Technical
Notes.� Hispanic origin is not mutually exclusive from race categories (white, black, Asian/Pacific Islander, American Indian/Alaska
Native).
Note: ONS — Other Nervous System; NOS — Not Otherwise Specified; IBD — Intrahepatic Bile Duct. Ovary excludes cancers newly
classified as borderline according to ICD-O-3, beginning with 2001 diagnoses. See Technical Notes.

State and Metropolitan-Area Incidence Rates and State Death Rates for the Most Common Cancers
3��
Figure 3.27.F2: Age-Adjusted Cancer Death Rates for the 10 Primary Sites with theHighest Rates within Race- and Ethnic-Specific Categories
Massachusetts,∗ Females, 2004
Stomach
Brain & ONS
Corpus & Uterus, NOS
Leukemias
Non-Hodgkin Lymphoma
Ovary
Pancreas
Colon & Rectum
Breast
Lung & Bronchus
0 50 100 150
3.0
3.3
4.3
5.8
6.1
9.3
10.1
15.4
24.1
43.5
Liver & IBD
Brain & ONS
Corpus & Uterus, NOS
Non-Hodgkin Lymphoma
Leukemias
Ovary
Pancreas
Colon & Rectum
Breast
Lung & Bronchus
0 50 100 150
2.9
3.6
4.4
5.9
6.0
9.5
10.3
15.7
24.9
44.6
Colon & Rectum
Breast
Lung & Bronchus
0 50 100 150
11.2
17.0
34.8
0 50 100 150
Death rates were notranked when the populationsize was less than 50,000or case counts were fewerthan 16 in each of the sitecategories.
0 50 100 150
Death rates were notranked when the populationsize was less than 50,000or case counts were fewerthan 16 in each of the sitecategories.
0 50 100 150
Death rates were notranked when the populationsize was less than 50,000or case counts were fewerthan 16 in each of the sitecategories.
Rate† per 100,000Rate† per 100,000
Rate† per 100,000Rate† per 100,000
Rate† per 100,000Rate† per 100,000
All Races White
Black Asian/Pacific Islander‡
American Indian/Alaska Native‡ Hispanic‡§
∗ Data are from the National Vital Statistics System (NVSS).† Rates are age-adjusted to the 2000 U.S. standard population (19 age groups - Census P25-1130). See Table 2.1.1.2F-2.27.1.2F
and Appendix F.1-F.2 for 95% confidence intervals for rates. Rates are suppressed and not ranked if the population of a specific
category (race, ethnicity) is less than 50,000 or if deaths are fewer than 16.‡ Data for specified racial or ethnic populations other than white and black should be interpreted with caution. See Technical
Notes.§ Hispanic origin is not mutually exclusive from race categories (white, black, Asian/Pacific Islander, American Indian/Alaska
Native).
Note: ONS — Other Nervous System; NOS — Not Otherwise Specified; IBD — Intrahepatic Bile Duct.

United States Cancer Statistics: 2004 Incidence and Mortality
3�0
Figure 3.28.M1: Age-Adjusted Invasive Cancer Incidence Rates for the 10 Primary Siteswith the Highest Rates within Race- and Ethnic-Specific Categories
Michigan,∗† Males, 2004
Pancreas
Oral Cavity & Pharynx
Leukemias
Kidney & Renal Pelvis
Melanomas of the Skin
Non-Hodgkin Lymphoma
Urinary Bladder
Colon & Rectum
Lung & Bronchus
Prostate
0 50 100 150 200 250 300
13.6
15.3
16.5
18.2
19.7
24.4
38.1
56.3
88.2
170.7
Pancreas
Oral Cavity & Pharynx
Leukemias
Kidney & Renal Pelvis
Melanomas of the Skin
Non-Hodgkin Lymphoma
Urinary Bladder
Colon & Rectum
Lung & Bronchus
Prostate
0 50 100 150 200 250 300
12.9
14.5
16.2
17.5
20.9
23.8
39.6
53.8
85.9
147.3
Leukemias
Myeloma
Oral Cavity & Pharynx
Pancreas
Urinary Bladder
Kidney & Renal Pelvis
Non-Hodgkin Lymphoma
Colon & Rectum
Lung & Bronchus
Prostate
0 50 100 150 200 250 300
16.8
17.1
17.9
19.5
20.7
22.7
24.1
75.5
111.5
248.9
Colon & Rectum
Prostate
0 50 100 150 200 250 300
54.5
69.0
0 50 100 150 200 250 300
Incidence rates were notranked when the populationsize was less than 50,000or case counts were fewerthan 16 in each of the sitecategories.
Colon & Rectum
Lung & Bronchus
Prostate
0 50 100 150 200 250 300
26.1
44.1
98.8
Rate‡ per 100,000Rate‡ per 100,000
Rate‡ per 100,000Rate‡ per 100,000
Rate‡ per 100,000Rate‡ per 100,000
All Races White
Black Asian/Pacific Islander§
American Indian/Alaska Native§ Hispanic§�
∗ Data are from selected state and metropolitan area cancer registries that meet the data quality criteria for all invasive
cancer sites combined. See Appendix B for data quality criteria and registry-specific data quality information.† Excludes basal and squamous cell carcinomas of the skin except when these occur on the skin of the genital organs, and in
situ cancers except urinary bladder.‡ Rates are age-adjusted to the 2000 U.S. standard population (19 age groups - Census P25-1130). See Table 2.1.1.1M-2.27.1.1M
and Appendix F.1-F.2 for 95% confidence intervals for rates. Rates are suppressed and not ranked if the population of a specific
category (race, ethnicity) is less than 50,000 or if cases are fewer than 16.§ Data for specified racial or ethnic populations other than white and black should be interpreted with caution. See Technical
Notes.� Hispanic origin is not mutually exclusive from race categories (white, black, Asian/Pacific Islander, American Indian/Alaska
Native).
Note: ONS — Other Nervous System; NOS — Not Otherwise Specified; IBD — Intrahepatic Bile Duct.

State and Metropolitan-Area Incidence Rates and State Death Rates for the Most Common Cancers
3��
Figure 3.28.M2: Age-Adjusted Cancer Death Rates for the 10 Primary Sites with theHighest Rates within Race- and Ethnic-Specific Categories
Michigan,∗ Males, 2004
Kidney & Renal Pelvis
Liver & IBD
Urinary Bladder
Esophagus
Non-Hodgkin Lymphoma
Leukemias
Pancreas
Colon & Rectum
Prostate
Lung & Bronchus
0 50 100 150
5.8
6.7
8.2
8.8
9.6
9.7
12.7
21.6
24.3
74.9
Kidney & Renal Pelvis
Brain & ONS
Urinary Bladder
Esophagus
Leukemias
Non-Hodgkin Lymphoma
Pancreas
Colon & Rectum
Prostate
Lung & Bronchus
0 50 100 150
6.0
6.2
8.6
8.9
9.8
9.9
12.2
20.7
22.1
72.4
Non-Hodgkin Lymphoma
Esophagus
Stomach
Leukemias
Myeloma
Liver & IBD
Pancreas
Colon & Rectum
Prostate
Lung & Bronchus
0 50 100 150
6.6
7.2
9.5
9.8
11.2
11.9
17.6
31.1
46.6
99.9
0 50 100 150
Death rates were notranked when the populationsize was less than 50,000or case counts were fewerthan 16 in each of the sitecategories.
0 50 100 150
Death rates were notranked when the populationsize was less than 50,000or case counts were fewerthan 16 in each of the sitecategories.
Lung & Bronchus
0 50 100 150
55.1
Rate† per 100,000Rate† per 100,000
Rate† per 100,000Rate† per 100,000
Rate† per 100,000Rate† per 100,000
All Races White
Black Asian/Pacific Islander‡
American Indian/Alaska Native‡ Hispanic‡§
∗ Data are from the National Vital Statistics System (NVSS).† Rates are age-adjusted to the 2000 U.S. standard population (19 age groups - Census P25-1130). See Table 2.1.1.2M-2.27.1.2M
and Appendix F.1-F.2 for 95% confidence intervals for rates. Rates are suppressed and not ranked if the population of a specific
category (race, ethnicity) is less than 50,000 or if deaths are fewer than 16.‡ Data for specified racial or ethnic populations other than white and black should be interpreted with caution. See Technical
Notes.§ Hispanic origin is not mutually exclusive from race categories (white, black, Asian/Pacific Islander, American Indian/Alaska
Native).
Note: ONS — Other Nervous System; NOS — Not Otherwise Specified; IBD — Intrahepatic Bile Duct.

United States Cancer Statistics: 2004 Incidence and Mortality
3��
Figure 3.28.F1: Age-Adjusted Invasive Cancer Incidence Rates for the 10 Primary Siteswith the Highest Rates within Race- and Ethnic-Specific Categories
Michigan,∗† Females, 2004
Pancreas
Leukemias
Thyroid
Ovary
Melanomas of the Skin
Non-Hodgkin Lymphoma
Corpus & Uterus, NOS
Colon & Rectum
Lung & Bronchus
Breast
0 50 100 150 200 250 300
9.8
9.9
12.1
12.7
14.0
18.8
25.7
40.6
59.2
119.0
Kidney & Renal Pelvis
Leukemias
Thyroid
Ovary
Melanomas of the Skin
Non-Hodgkin Lymphoma
Corpus & Uterus, NOS
Colon & Rectum
Lung & Bronchus
Breast
0 50 100 150 200 250 300
9.8
9.9
12.7
12.9
15.1
18.7
26.3
39.1
58.1
118.5
Kidney & Renal Pelvis
Myeloma
Cervix Uteri
Ovary
Pancreas
Non-Hodgkin Lymphoma
Corpus & Uterus, NOS
Colon & Rectum
Lung & Bronchus
Breast
0 50 100 150 200 250 300
9.5
9.5
10.9
11.8
12.8
15.9
20.7
50.3
66.7
118.1
Lung & Bronchus
Colon & Rectum
Breast
0 50 100 150 200 250 300
26.4
28.5
74.2
0 50 100 150 200 250 300
Incidence rates were notranked when the populationsize was less than 50,000or case counts were fewerthan 16 in each of the sitecategories.
Thyroid
Corpus & Uterus, NOS
Lung & Bronchus
Colon & Rectum
Breast
0 50 100 150 200 250 300
9.0
24.7
29.0
34.3
82.1
Rate‡ per 100,000Rate‡ per 100,000
Rate‡ per 100,000Rate‡ per 100,000
Rate‡ per 100,000Rate‡ per 100,000
All Races White
Black Asian/Pacific Islander§
American Indian/Alaska Native§ Hispanic§�
∗ Data are from selected state and metropolitan area cancer registries that meet the data quality criteria for all invasive
cancer sites combined. See Appendix B for data quality criteria and registry-specific data quality information.† Excludes basal and squamous cell carcinomas of the skin except when these occur on the skin of the genital organs, and in
situ cancers except urinary bladder.‡ Rates are age-adjusted to the 2000 U.S. standard population (19 age groups - Census P25-1130). See Table 2.1.1.1F-2.27.1.1F
and Appendix F.1-F.2 for 95% confidence intervals for rates. Rates are suppressed and not ranked if the population of a specific
category (race, ethnicity) is less than 50,000 or if cases are fewer than 16.§ Data for specified racial or ethnic populations other than white and black should be interpreted with caution. See Technical
Notes.� Hispanic origin is not mutually exclusive from race categories (white, black, Asian/Pacific Islander, American Indian/Alaska
Native).
Note: ONS — Other Nervous System; NOS — Not Otherwise Specified; IBD — Intrahepatic Bile Duct. Ovary excludes cancers newly
classified as borderline according to ICD-O-3, beginning with 2001 diagnoses. See Technical Notes.

State and Metropolitan-Area Incidence Rates and State Death Rates for the Most Common Cancers
3�3
Figure 3.28.F2: Age-Adjusted Cancer Death Rates for the 10 Primary Sites with theHighest Rates within Race- and Ethnic-Specific Categories
Michigan,∗ Females, 2004
Liver & IBD
Brain & ONS
Corpus & Uterus, NOS
Leukemias
Non-Hodgkin Lymphoma
Ovary
Pancreas
Colon & Rectum
Breast
Lung & Bronchus
0 50 100 150
3.5
3.5
4.6
5.9
6.1
8.8
9.1
15.1
24.3
44.0
Liver & IBD
Brain & ONS
Corpus & Uterus, NOS
Leukemias
Non-Hodgkin Lymphoma
Pancreas
Ovary
Colon & Rectum
Breast
Lung & Bronchus
0 50 100 150
3.3
3.7
4.3
5.9
6.4
8.8
9.1
14.6
23.0
44.0
Non-Hodgkin Lymphoma
Stomach
Leukemias
Corpus & Uterus, NOS
Myeloma
Ovary
Pancreas
Colon & Rectum
Breast
Lung & Bronchus
0 50 100 150
4.2
4.7
5.5
6.3
6.4
7.9
11.8
19.6
33.5
46.5
0 50 100 150
Death rates were notranked when the populationsize was less than 50,000or case counts were fewerthan 16 in each of the sitecategories.
0 50 100 150
Death rates were notranked when the populationsize was less than 50,000or case counts were fewerthan 16 in each of the sitecategories.
Breast
Lung & Bronchus
0 50 100 150
18.3
20.1
Rate† per 100,000Rate† per 100,000
Rate† per 100,000Rate† per 100,000
Rate† per 100,000Rate† per 100,000
All Races White
Black Asian/Pacific Islander‡
American Indian/Alaska Native‡ Hispanic‡§
∗ Data are from the National Vital Statistics System (NVSS).† Rates are age-adjusted to the 2000 U.S. standard population (19 age groups - Census P25-1130). See Table 2.1.1.2F-2.27.1.2F
and Appendix F.1-F.2 for 95% confidence intervals for rates. Rates are suppressed and not ranked if the population of a specific
category (race, ethnicity) is less than 50,000 or if deaths are fewer than 16.‡ Data for specified racial or ethnic populations other than white and black should be interpreted with caution. See Technical
Notes.§ Hispanic origin is not mutually exclusive from race categories (white, black, Asian/Pacific Islander, American Indian/Alaska
Native).
Note: ONS — Other Nervous System; NOS — Not Otherwise Specified; IBD — Intrahepatic Bile Duct.
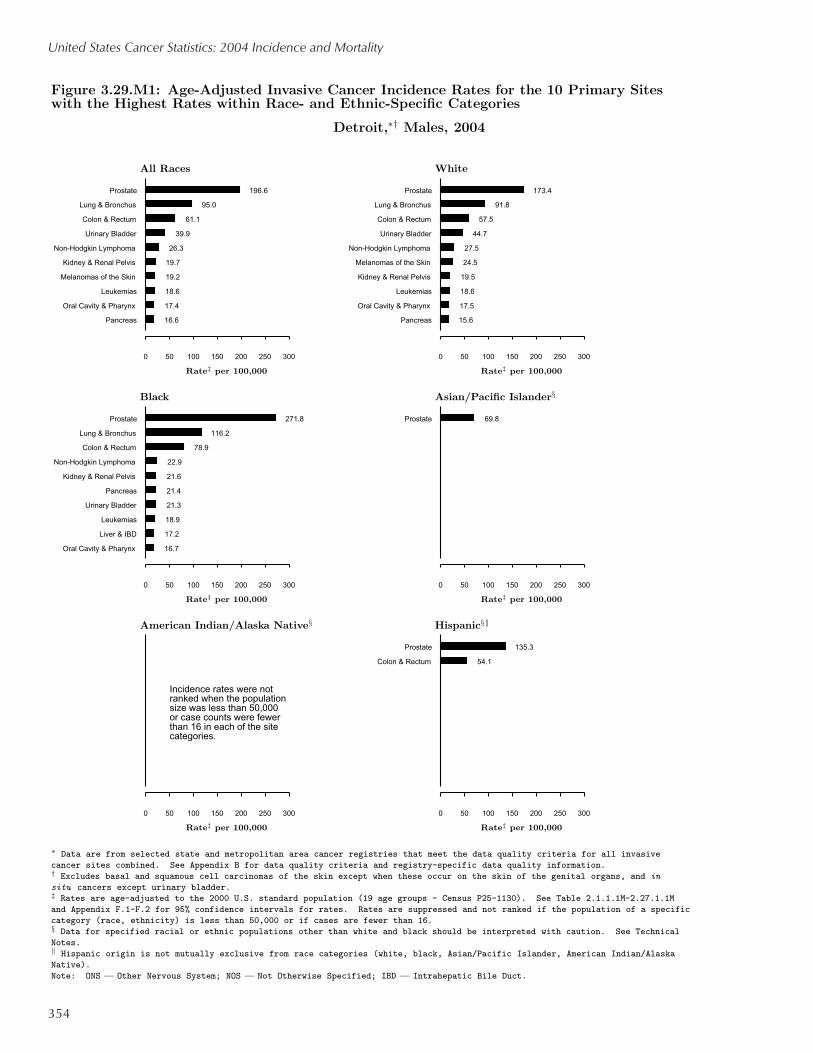
United States Cancer Statistics: 2004 Incidence and Mortality
3��
Figure 3.29.M1: Age-Adjusted Invasive Cancer Incidence Rates for the 10 Primary Siteswith the Highest Rates within Race- and Ethnic-Specific Categories
Detroit,∗† Males, 2004
Pancreas
Oral Cavity & Pharynx
Leukemias
Melanomas of the Skin
Kidney & Renal Pelvis
Non-Hodgkin Lymphoma
Urinary Bladder
Colon & Rectum
Lung & Bronchus
Prostate
0 50 100 150 200 250 300
16.6
17.4
18.6
19.2
19.7
26.3
39.9
61.1
95.0
196.6
Pancreas
Oral Cavity & Pharynx
Leukemias
Kidney & Renal Pelvis
Melanomas of the Skin
Non-Hodgkin Lymphoma
Urinary Bladder
Colon & Rectum
Lung & Bronchus
Prostate
0 50 100 150 200 250 300
15.6
17.5
18.6
19.5
24.5
27.5
44.7
57.5
91.8
173.4
Oral Cavity & Pharynx
Liver & IBD
Leukemias
Urinary Bladder
Pancreas
Kidney & Renal Pelvis
Non-Hodgkin Lymphoma
Colon & Rectum
Lung & Bronchus
Prostate
0 50 100 150 200 250 300
16.7
17.2
18.9
21.3
21.4
21.6
22.9
78.9
116.2
271.8 Prostate
0 50 100 150 200 250 300
69.8
0 50 100 150 200 250 300
Incidence rates were notranked when the populationsize was less than 50,000or case counts were fewerthan 16 in each of the sitecategories.
Colon & Rectum
Prostate
0 50 100 150 200 250 300
54.1
135.3
Rate‡ per 100,000Rate‡ per 100,000
Rate‡ per 100,000Rate‡ per 100,000
Rate‡ per 100,000Rate‡ per 100,000
All Races White
Black Asian/Pacific Islander§
American Indian/Alaska Native§ Hispanic§�
∗ Data are from selected state and metropolitan area cancer registries that meet the data quality criteria for all invasive
cancer sites combined. See Appendix B for data quality criteria and registry-specific data quality information.† Excludes basal and squamous cell carcinomas of the skin except when these occur on the skin of the genital organs, and in
situ cancers except urinary bladder.‡ Rates are age-adjusted to the 2000 U.S. standard population (19 age groups - Census P25-1130). See Table 2.1.1.1M-2.27.1.1M
and Appendix F.1-F.2 for 95% confidence intervals for rates. Rates are suppressed and not ranked if the population of a specific
category (race, ethnicity) is less than 50,000 or if cases are fewer than 16.§ Data for specified racial or ethnic populations other than white and black should be interpreted with caution. See Technical
Notes.� Hispanic origin is not mutually exclusive from race categories (white, black, Asian/Pacific Islander, American Indian/Alaska
Native).
Note: ONS — Other Nervous System; NOS — Not Otherwise Specified; IBD — Intrahepatic Bile Duct.

State and Metropolitan-Area Incidence Rates and State Death Rates for the Most Common Cancers
3��
Mortality data are not presented for metropolitan areas.

United States Cancer Statistics: 2004 Incidence and Mortality
3��
Figure 3.29.F1: Age-Adjusted Invasive Cancer Incidence Rates for the 10 Primary Siteswith the Highest Rates within Race- and Ethnic-Specific Categories
Detroit,∗† Females, 2004
Pancreas
Kidney & Renal Pelvis
Melanomas of the Skin
Ovary
Thyroid
Non-Hodgkin Lymphoma
Corpus & Uterus, NOS
Colon & Rectum
Lung & Bronchus
Breast
0 50 100 150 200 250 300
10.9
11.3
12.6
12.7
12.8
19.6
26.8
43.2
66.6
126.0
Urinary Bladder
Kidney & Renal Pelvis
Ovary
Thyroid
Melanomas of the Skin
Non-Hodgkin Lymphoma
Corpus & Uterus, NOS
Colon & Rectum
Lung & Bronchus
Breast
0 50 100 150 200 250 300
10.9
11.4
13.6
14.6
16.9
20.6
28.7
40.5
68.0
128.9
Myeloma
Ovary
Kidney & Renal Pelvis
Cervix Uteri
Pancreas
Non-Hodgkin Lymphoma
Corpus & Uterus, NOS
Colon & Rectum
Lung & Bronchus
Breast
0 50 100 150 200 250 300
10.6
11.2
11.5
12.4
12.6
15.1
21.8
53.8
65.0
120.2 Breast
0 50 100 150 200 250 300
61.4
0 50 100 150 200 250 300
Incidence rates were notranked when the populationsize was less than 50,000or case counts were fewerthan 16 in each of the sitecategories.
Corpus & Uterus, NOS
Breast
0 50 100 150 200 250 300
50.8
124.5
Rate‡ per 100,000Rate‡ per 100,000
Rate‡ per 100,000Rate‡ per 100,000
Rate‡ per 100,000Rate‡ per 100,000
All Races White
Black Asian/Pacific Islander§
American Indian/Alaska Native§ Hispanic§�
∗ Data are from selected state and metropolitan area cancer registries that meet the data quality criteria for all invasive
cancer sites combined. See Appendix B for data quality criteria and registry-specific data quality information.† Excludes basal and squamous cell carcinomas of the skin except when these occur on the skin of the genital organs, and in
situ cancers except urinary bladder.‡ Rates are age-adjusted to the 2000 U.S. standard population (19 age groups - Census P25-1130). See Table 2.1.1.1F-2.27.1.1F
and Appendix F.1-F.2 for 95% confidence intervals for rates. Rates are suppressed and not ranked if the population of a specific
category (race, ethnicity) is less than 50,000 or if cases are fewer than 16.§ Data for specified racial or ethnic populations other than white and black should be interpreted with caution. See Technical
Notes.� Hispanic origin is not mutually exclusive from race categories (white, black, Asian/Pacific Islander, American Indian/Alaska
Native).
Note: ONS — Other Nervous System; NOS — Not Otherwise Specified; IBD — Intrahepatic Bile Duct. Ovary excludes cancers newly
classified as borderline according to ICD-O-3, beginning with 2001 diagnoses. See Technical Notes.

State and Metropolitan-Area Incidence Rates and State Death Rates for the Most Common Cancers
3��
Mortality data are not presented for metropolitan areas.

United States Cancer Statistics: 2004 Incidence and Mortality
3��
Figure 3.30.M1: Age-Adjusted Invasive Cancer Incidence Rates for the 10 Primary Siteswith the Highest Rates within Race- and Ethnic-Specific Categories
Minnesota,∗† Males, 2004
Pancreas
Oral Cavity & Pharynx
Kidney & Renal Pelvis
Melanomas of the Skin
Leukemias
Non-Hodgkin Lymphoma
Urinary Bladder
Colon & Rectum
Lung & Bronchus
Prostate
0 50 100 150 200 250 300
11.4
15.7
20.3
22.6
22.7
27.7
42.8
58.8
70.4
184.6
Pancreas
Oral Cavity & Pharynx
Kidney & Renal Pelvis
Leukemias
Melanomas of the Skin
Non-Hodgkin Lymphoma
Urinary Bladder
Colon & Rectum
Lung & Bronchus
Prostate
0 50 100 150 200 250 300
11.1
14.6
19.6
21.1
21.5
26.7
41.9
56.6
69.2
169.5
Oral Cavity & Pharynx
Colon & Rectum
Lung & Bronchus
Prostate
0 50 100 150 200 250 300
33.9
45.3
74.8
211.4 Colon & Rectum
0 50 100 150 200 250 300
61.8
0 50 100 150 200 250 300
Incidence rates were notranked when the populationsize was less than 50,000or case counts were fewerthan 16 in each of the sitecategories.
Prostate
0 50 100 150 200 250 300
107.0
Rate‡ per 100,000Rate‡ per 100,000
Rate‡ per 100,000Rate‡ per 100,000
Rate‡ per 100,000Rate‡ per 100,000
All Races White
Black Asian/Pacific Islander§
American Indian/Alaska Native§ Hispanic§�
∗ Data are from selected state and metropolitan area cancer registries that meet the data quality criteria for all invasive
cancer sites combined. See Appendix B for data quality criteria and registry-specific data quality information.† Excludes basal and squamous cell carcinomas of the skin except when these occur on the skin of the genital organs, and in
situ cancers except urinary bladder.‡ Rates are age-adjusted to the 2000 U.S. standard population (19 age groups - Census P25-1130). See Table 2.1.1.1M-2.27.1.1M
and Appendix F.1-F.2 for 95% confidence intervals for rates. Rates are suppressed and not ranked if the population of a specific
category (race, ethnicity) is less than 50,000 or if cases are fewer than 16.§ Data for specified racial or ethnic populations other than white and black should be interpreted with caution. See Technical
Notes.� Hispanic origin is not mutually exclusive from race categories (white, black, Asian/Pacific Islander, American Indian/Alaska
Native).
Note: ONS — Other Nervous System; NOS — Not Otherwise Specified; IBD — Intrahepatic Bile Duct.

State and Metropolitan-Area Incidence Rates and State Death Rates for the Most Common Cancers
3��
Figure 3.30.M2: Age-Adjusted Cancer Death Rates for the 10 Primary Sites with theHighest Rates within Race- and Ethnic-Specific Categories
Minnesota,∗ Males, 2004
Brain & ONS
Kidney & Renal Pelvis
Urinary Bladder
Esophagus
Non-Hodgkin Lymphoma
Leukemias
Pancreas
Colon & Rectum
Prostate
Lung & Bronchus
0 50 100 150
5.6
5.8
7.4
8.4
10.1
10.7
12.5
17.1
27.6
59.5
Kidney & Renal Pelvis
Brain & ONS
Urinary Bladder
Esophagus
Non-Hodgkin Lymphoma
Leukemias
Pancreas
Colon & Rectum
Prostate
Lung & Bronchus
0 50 100 150
5.7
5.8
7.6
8.5
10.0
10.7
12.3
17.0
27.4
59.3
Lung & Bronchus
0 50 100 150
56.6
0 50 100 150
Death rates were notranked when the populationsize was less than 50,000or case counts were fewerthan 16 in each of the sitecategories.
0 50 100 150
Death rates were notranked when the populationsize was less than 50,000or case counts were fewerthan 16 in each of the sitecategories.
0 50 100 150
Death rates were notranked when the populationsize was less than 50,000or case counts were fewerthan 16 in each of the sitecategories.
Rate† per 100,000Rate† per 100,000
Rate† per 100,000Rate† per 100,000
Rate† per 100,000Rate† per 100,000
All Races White
Black Asian/Pacific Islander‡
American Indian/Alaska Native‡ Hispanic‡§
∗ Data are from the National Vital Statistics System (NVSS).† Rates are age-adjusted to the 2000 U.S. standard population (19 age groups - Census P25-1130). See Table 2.1.1.2M-2.27.1.2M
and Appendix F.1-F.2 for 95% confidence intervals for rates. Rates are suppressed and not ranked if the population of a specific
category (race, ethnicity) is less than 50,000 or if deaths are fewer than 16.‡ Data for specified racial or ethnic populations other than white and black should be interpreted with caution. See Technical
Notes.§ Hispanic origin is not mutually exclusive from race categories (white, black, Asian/Pacific Islander, American Indian/Alaska
Native).
Note: ONS — Other Nervous System; NOS — Not Otherwise Specified; IBD — Intrahepatic Bile Duct.
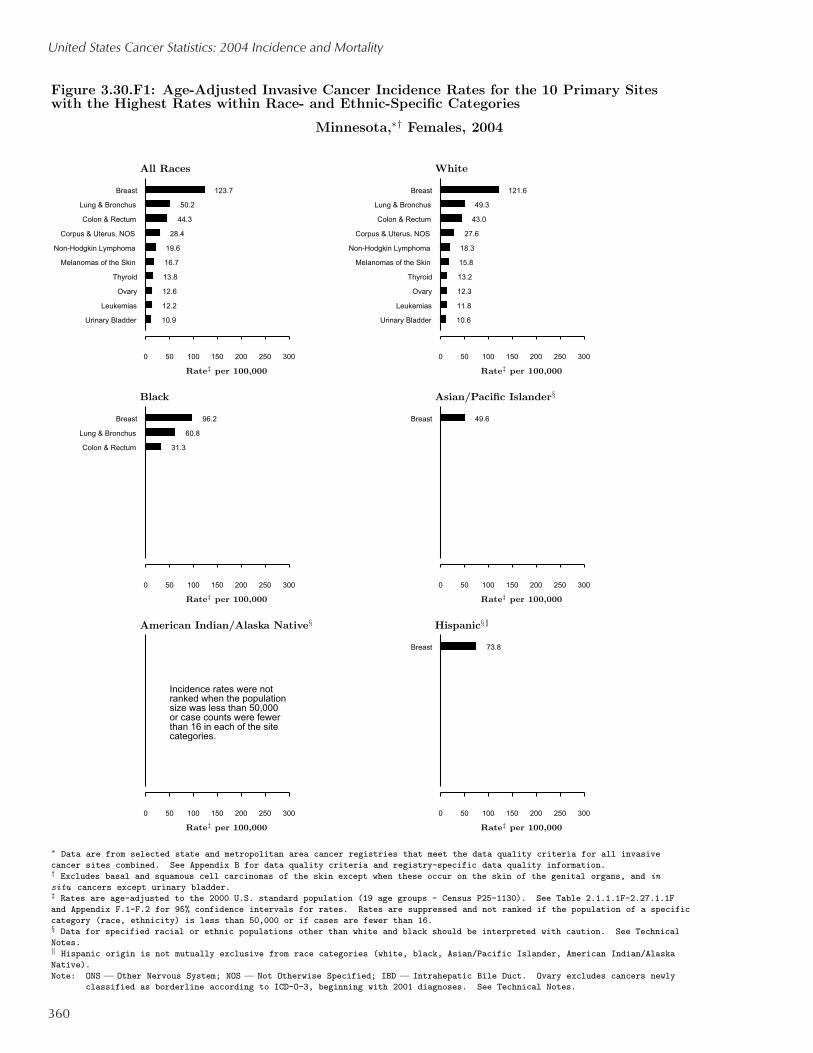
United States Cancer Statistics: 2004 Incidence and Mortality
3�0
Figure 3.30.F1: Age-Adjusted Invasive Cancer Incidence Rates for the 10 Primary Siteswith the Highest Rates within Race- and Ethnic-Specific Categories
Minnesota,∗† Females, 2004
Urinary Bladder
Leukemias
Ovary
Thyroid
Melanomas of the Skin
Non-Hodgkin Lymphoma
Corpus & Uterus, NOS
Colon & Rectum
Lung & Bronchus
Breast
0 50 100 150 200 250 300
10.9
12.2
12.6
13.8
16.7
19.6
28.4
44.3
50.2
123.7
Urinary Bladder
Leukemias
Ovary
Thyroid
Melanomas of the Skin
Non-Hodgkin Lymphoma
Corpus & Uterus, NOS
Colon & Rectum
Lung & Bronchus
Breast
0 50 100 150 200 250 300
10.6
11.8
12.3
13.2
15.8
18.3
27.6
43.0
49.3
121.6
Colon & Rectum
Lung & Bronchus
Breast
0 50 100 150 200 250 300
31.3
60.8
96.2 Breast
0 50 100 150 200 250 300
49.6
0 50 100 150 200 250 300
Incidence rates were notranked when the populationsize was less than 50,000or case counts were fewerthan 16 in each of the sitecategories.
Breast
0 50 100 150 200 250 300
73.8
Rate‡ per 100,000Rate‡ per 100,000
Rate‡ per 100,000Rate‡ per 100,000
Rate‡ per 100,000Rate‡ per 100,000
All Races White
Black Asian/Pacific Islander§
American Indian/Alaska Native§ Hispanic§�
∗ Data are from selected state and metropolitan area cancer registries that meet the data quality criteria for all invasive
cancer sites combined. See Appendix B for data quality criteria and registry-specific data quality information.† Excludes basal and squamous cell carcinomas of the skin except when these occur on the skin of the genital organs, and in
situ cancers except urinary bladder.‡ Rates are age-adjusted to the 2000 U.S. standard population (19 age groups - Census P25-1130). See Table 2.1.1.1F-2.27.1.1F
and Appendix F.1-F.2 for 95% confidence intervals for rates. Rates are suppressed and not ranked if the population of a specific
category (race, ethnicity) is less than 50,000 or if cases are fewer than 16.§ Data for specified racial or ethnic populations other than white and black should be interpreted with caution. See Technical
Notes.� Hispanic origin is not mutually exclusive from race categories (white, black, Asian/Pacific Islander, American Indian/Alaska
Native).
Note: ONS — Other Nervous System; NOS — Not Otherwise Specified; IBD — Intrahepatic Bile Duct. Ovary excludes cancers newly
classified as borderline according to ICD-O-3, beginning with 2001 diagnoses. See Technical Notes.

State and Metropolitan-Area Incidence Rates and State Death Rates for the Most Common Cancers
3��
Figure 3.30.F2: Age-Adjusted Cancer Death Rates for the 10 Primary Sites with theHighest Rates within Race- and Ethnic-Specific Categories
Minnesota,∗ Females, 2004
Liver & IBD
Brain & ONS
Corpus & Uterus, NOS
Leukemias
Non-Hodgkin Lymphoma
Pancreas
Ovary
Colon & Rectum
Breast
Lung & Bronchus
0 50 100 150
3.2
3.6
4.7
5.8
6.2
7.9
8.8
13.7
22.4
38.0
Kidney & Renal Pelvis
Brain & ONS
Corpus & Uterus, NOS
Leukemias
Non-Hodgkin Lymphoma
Pancreas
Ovary
Colon & Rectum
Breast
Lung & Bronchus
0 50 100 150
3.0
3.6
4.6
5.8
6.2
7.7
9.0
13.6
22.3
38.0
Breast
Lung & Bronchus
0 50 100 150
39.1
49.8
0 50 100 150
Death rates were notranked when the populationsize was less than 50,000or case counts were fewerthan 16 in each of the sitecategories.
0 50 100 150
Death rates were notranked when the populationsize was less than 50,000or case counts were fewerthan 16 in each of the sitecategories.
0 50 100 150
Death rates were notranked when the populationsize was less than 50,000or case counts were fewerthan 16 in each of the sitecategories.
Rate† per 100,000Rate† per 100,000
Rate† per 100,000Rate† per 100,000
Rate† per 100,000Rate† per 100,000
All Races White
Black Asian/Pacific Islander‡
American Indian/Alaska Native‡ Hispanic‡§
∗ Data are from the National Vital Statistics System (NVSS).† Rates are age-adjusted to the 2000 U.S. standard population (19 age groups - Census P25-1130). See Table 2.1.1.2F-2.27.1.2F
and Appendix F.1-F.2 for 95% confidence intervals for rates. Rates are suppressed and not ranked if the population of a specific
category (race, ethnicity) is less than 50,000 or if deaths are fewer than 16.‡ Data for specified racial or ethnic populations other than white and black should be interpreted with caution. See Technical
Notes.§ Hispanic origin is not mutually exclusive from race categories (white, black, Asian/Pacific Islander, American Indian/Alaska
Native).
Note: ONS — Other Nervous System; NOS — Not Otherwise Specified; IBD — Intrahepatic Bile Duct.

United States Cancer Statistics: 2004 Incidence and Mortality
3��
Figure 3.31.M1: Age-Adjusted Invasive Cancer Incidence Rates for the 10 Primary Siteswith the Highest Rates within Race- and Ethnic-Specific Categories
Mississippi,∗† Males, 2004
Leukemias
Pancreas
Melanomas of the Skin
Oral Cavity & Pharynx
Kidney & Renal Pelvis
Non-Hodgkin Lymphoma
Urinary Bladder
Colon & Rectum
Lung & Bronchus
Prostate
0 50 100 150 200 250 300
12.0
13.0
16.1
18.2
19.7
21.5
29.5
64.5
110.2
152.7
Leukemias
Pancreas
Oral Cavity & Pharynx
Kidney & Renal Pelvis
Melanomas of the Skin
Non-Hodgkin Lymphoma
Urinary Bladder
Colon & Rectum
Lung & Bronchus
Prostate
0 50 100 150 200 250 300
11.2
12.2
17.3
19.7
22.0
22.5
33.9
61.5
104.7
127.0
Esophagus
Urinary Bladder
Pancreas
Non-Hodgkin Lymphoma
Stomach
Kidney & Renal Pelvis
Oral Cavity & Pharynx
Colon & Rectum
Lung & Bronchus
Prostate
0 50 100 150 200 250 300
15.2
15.6
15.9
18.2
18.3
18.9
20.5
71.2
124.4
218.6
0 50 100 150 200 250 300
Incidence rates were notranked when the populationsize was less than 50,000or case counts were fewerthan 16 in each of the sitecategories.
0 50 100 150 200 250 300
Incidence rates were notranked when the populationsize was less than 50,000or case counts were fewerthan 16 in each of the sitecategories.
0 50 100 150 200 250 300
Incidence rates were notranked when the populationsize was less than 50,000or case counts were fewerthan 16 in each of the sitecategories.
Rate‡ per 100,000Rate‡ per 100,000
Rate‡ per 100,000Rate‡ per 100,000
Rate‡ per 100,000Rate‡ per 100,000
All Races White
Black Asian/Pacific Islander§
American Indian/Alaska Native§ Hispanic§�
∗ Data are from selected state and metropolitan area cancer registries that meet the data quality criteria for all invasive
cancer sites combined. See Appendix B for data quality criteria and registry-specific data quality information.† Excludes basal and squamous cell carcinomas of the skin except when these occur on the skin of the genital organs, and in
situ cancers except urinary bladder.‡ Rates are age-adjusted to the 2000 U.S. standard population (19 age groups - Census P25-1130). See Table 2.1.1.1M-2.27.1.1M
and Appendix F.1-F.2 for 95% confidence intervals for rates. Rates are suppressed and not ranked if the population of a specific
category (race, ethnicity) is less than 50,000 or if cases are fewer than 16.§ Data for specified racial or ethnic populations other than white and black should be interpreted with caution. See Technical
Notes.� Hispanic origin is not mutually exclusive from race categories (white, black, Asian/Pacific Islander, American Indian/Alaska
Native).
Note: ONS — Other Nervous System; NOS — Not Otherwise Specified; IBD — Intrahepatic Bile Duct.

State and Metropolitan-Area Incidence Rates and State Death Rates for the Most Common Cancers
3�3
Figure 3.31.M2: Age-Adjusted Cancer Death Rates for the 10 Primary Sites with theHighest Rates within Race- and Ethnic-Specific Categories
Mississippi,∗ Males, 2004
Urinary Bladder
Kidney & Renal Pelvis
Esophagus
Liver & IBD
Non-Hodgkin Lymphoma
Leukemias
Pancreas
Colon & Rectum
Prostate
Lung & Bronchus
0 50 100 150
6.8
6.8
7.5
8.3
8.9
9.0
14.1
25.7
31.8
100.4
Kidney & Renal Pelvis
Brain & ONS
Liver & IBD
Urinary Bladder
Leukemias
Non-Hodgkin Lymphoma
Pancreas
Prostate
Colon & Rectum
Lung & Bronchus
0 50 100 150
6.7
7.3
7.5
8.4
8.9
9.8
13.0
20.7
24.0
95.4
Kidney & Renal Pelvis
Oral Cavity & Pharynx
Liver & IBD
Leukemias
Esophagus
Stomach
Pancreas
Colon & Rectum
Prostate
Lung & Bronchus
0 50 100 150
6.9
8.0
9.1
9.3
10.3
12.7
18.0
31.5
65.1
115.8
0 50 100 150
Death rates were notranked when the populationsize was less than 50,000or case counts were fewerthan 16 in each of the sitecategories.
0 50 100 150
Death rates were notranked when the populationsize was less than 50,000or case counts were fewerthan 16 in each of the sitecategories.
0 50 100 150
Death rates were notranked when the populationsize was less than 50,000or case counts were fewerthan 16 in each of the sitecategories.
Rate† per 100,000Rate† per 100,000
Rate† per 100,000Rate† per 100,000
Rate† per 100,000Rate† per 100,000
All Races White
Black Asian/Pacific Islander‡
American Indian/Alaska Native‡ Hispanic‡§
∗ Data are from the National Vital Statistics System (NVSS).† Rates are age-adjusted to the 2000 U.S. standard population (19 age groups - Census P25-1130). See Table 2.1.1.2M-2.27.1.2M
and Appendix F.1-F.2 for 95% confidence intervals for rates. Rates are suppressed and not ranked if the population of a specific
category (race, ethnicity) is less than 50,000 or if deaths are fewer than 16.‡ Data for specified racial or ethnic populations other than white and black should be interpreted with caution. See Technical
Notes.§ Hispanic origin is not mutually exclusive from race categories (white, black, Asian/Pacific Islander, American Indian/Alaska
Native).
Note: ONS — Other Nervous System; NOS — Not Otherwise Specified; IBD — Intrahepatic Bile Duct.

United States Cancer Statistics: 2004 Incidence and Mortality
3��
Figure 3.31.F1: Age-Adjusted Invasive Cancer Incidence Rates for the 10 Primary Siteswith the Highest Rates within Race- and Ethnic-Specific Categories
Mississippi,∗† Females, 2004
Cervix Uteri
Ovary
Melanomas of the Skin
Thyroid
Kidney & Renal Pelvis
Non-Hodgkin Lymphoma
Corpus & Uterus, NOS
Colon & Rectum
Lung & Bronchus
Breast
0 50 100 150 200 250 300
9.2
9.3
10.9
11.7
11.8
13.6
18.2
47.4
54.2
108.5
Leukemias
Ovary
Kidney & Renal Pelvis
Thyroid
Non-Hodgkin Lymphoma
Melanomas of the Skin
Corpus & Uterus, NOS
Colon & Rectum
Lung & Bronchus
Breast
0 50 100 150 200 250 300
8.6
9.9
12.7
12.9
14.9
16.1
16.9
43.1
58.2
107.4
Thyroid
Pancreas
Non-Hodgkin Lymphoma
Myeloma
Kidney & Renal Pelvis
Cervix Uteri
Corpus & Uterus, NOS
Lung & Bronchus
Colon & Rectum
Breast
0 50 100 150 200 250 300
9.3
9.3
9.6
9.8
10.0
13.8
21.8
44.2
56.6
109.7
0 50 100 150 200 250 300
Incidence rates were notranked when the populationsize was less than 50,000or case counts were fewerthan 16 in each of the sitecategories.
0 50 100 150 200 250 300
Incidence rates were notranked when the populationsize was less than 50,000or case counts were fewerthan 16 in each of the sitecategories.
0 50 100 150 200 250 300
Incidence rates were notranked when the populationsize was less than 50,000or case counts were fewerthan 16 in each of the sitecategories.
Rate‡ per 100,000Rate‡ per 100,000
Rate‡ per 100,000Rate‡ per 100,000
Rate‡ per 100,000Rate‡ per 100,000
All Races White
Black Asian/Pacific Islander§
American Indian/Alaska Native§ Hispanic§�
∗ Data are from selected state and metropolitan area cancer registries that meet the data quality criteria for all invasive
cancer sites combined. See Appendix B for data quality criteria and registry-specific data quality information.† Excludes basal and squamous cell carcinomas of the skin except when these occur on the skin of the genital organs, and in
situ cancers except urinary bladder.‡ Rates are age-adjusted to the 2000 U.S. standard population (19 age groups - Census P25-1130). See Table 2.1.1.1F-2.27.1.1F
and Appendix F.1-F.2 for 95% confidence intervals for rates. Rates are suppressed and not ranked if the population of a specific
category (race, ethnicity) is less than 50,000 or if cases are fewer than 16.§ Data for specified racial or ethnic populations other than white and black should be interpreted with caution. See Technical
Notes.� Hispanic origin is not mutually exclusive from race categories (white, black, Asian/Pacific Islander, American Indian/Alaska
Native).
Note: ONS — Other Nervous System; NOS — Not Otherwise Specified; IBD — Intrahepatic Bile Duct. Ovary excludes cancers newly
classified as borderline according to ICD-O-3, beginning with 2001 diagnoses. See Technical Notes.

State and Metropolitan-Area Incidence Rates and State Death Rates for the Most Common Cancers
3��
Figure 3.31.F2: Age-Adjusted Cancer Death Rates for the 10 Primary Sites with theHighest Rates within Race- and Ethnic-Specific Categories
Mississippi,∗ Females, 2004
Liver & IBD
Corpus & Uterus, NOS
Brain & ONS
Non-Hodgkin Lymphoma
Leukemias
Ovary
Pancreas
Colon & Rectum
Breast
Lung & Bronchus
0 50 100 150
3.9
3.9
4.1
4.6
6.5
7.9
8.5
17.6
27.3
45.3
Kidney & Renal Pelvis
Liver & IBD
Brain & ONS
Non-Hodgkin Lymphoma
Leukemias
Pancreas
Ovary
Colon & Rectum
Breast
Lung & Bronchus
0 50 100 150
3.5
3.7
4.8
5.2
6.2
7.6
8.0
14.3
23.9
47.0
Stomach
Myeloma
Corpus & Uterus, NOS
Leukemias
Ovary
Cervix Uteri
Pancreas
Colon & Rectum
Breast
Lung & Bronchus
0 50 100 150
4.8
5.3
7.2
7.3
7.4
7.5
11.0
24.9
35.4
40.7
0 50 100 150
Death rates were notranked when the populationsize was less than 50,000or case counts were fewerthan 16 in each of the sitecategories.
0 50 100 150
Death rates were notranked when the populationsize was less than 50,000or case counts were fewerthan 16 in each of the sitecategories.
0 50 100 150
Death rates were notranked when the populationsize was less than 50,000or case counts were fewerthan 16 in each of the sitecategories.
Rate† per 100,000Rate† per 100,000
Rate† per 100,000Rate† per 100,000
Rate† per 100,000Rate† per 100,000
All Races White
Black Asian/Pacific Islander‡
American Indian/Alaska Native‡ Hispanic‡§
∗ Data are from the National Vital Statistics System (NVSS).† Rates are age-adjusted to the 2000 U.S. standard population (19 age groups - Census P25-1130). See Table 2.1.1.2F-2.27.1.2F
and Appendix F.1-F.2 for 95% confidence intervals for rates. Rates are suppressed and not ranked if the population of a specific
category (race, ethnicity) is less than 50,000 or if deaths are fewer than 16.‡ Data for specified racial or ethnic populations other than white and black should be interpreted with caution. See Technical
Notes.§ Hispanic origin is not mutually exclusive from race categories (white, black, Asian/Pacific Islander, American Indian/Alaska
Native).
Note: ONS — Other Nervous System; NOS — Not Otherwise Specified; IBD — Intrahepatic Bile Duct.

United States Cancer Statistics: 2004 Incidence and Mortality
3��
Figure 3.32.M1: Age-Adjusted Invasive Cancer Incidence Rates for the 10 Primary Siteswith the Highest Rates within Race- and Ethnic-Specific Categories
Missouri,∗† Males, 2004
Pancreas
Oral Cavity & Pharynx
Leukemias
Kidney & Renal Pelvis
Melanomas of the Skin
Non-Hodgkin Lymphoma
Urinary Bladder
Colon & Rectum
Lung & Bronchus
Prostate
0 50 100 150 200 250 300
12.4
15.2
16.4
19.9
20.2
21.8
34.0
58.7
101.6
117.2
Pancreas
Oral Cavity & Pharynx
Leukemias
Kidney & Renal Pelvis
Melanomas of the Skin
Non-Hodgkin Lymphoma
Urinary Bladder
Colon & Rectum
Lung & Bronchus
Prostate
0 50 100 150 200 250 300
11.8
15.1
16.6
19.8
21.5
22.5
35.0
58.3
99.8
111.5
Leukemias
Oral Cavity & Pharynx
Stomach
Kidney & Renal Pelvis
Pancreas
Urinary Bladder
Liver & IBD
Colon & Rectum
Lung & Bronchus
Prostate
0 50 100 150 200 250 300
14.2
15.7
15.7
17.5
19.5
20.5
27.3
64.1
128.1
185.4
0 50 100 150 200 250 300
Incidence rates were notranked when the populationsize was less than 50,000or case counts were fewerthan 16 in each of the sitecategories.
0 50 100 150 200 250 300
Incidence rates were notranked when the populationsize was less than 50,000or case counts were fewerthan 16 in each of the sitecategories.
Lung & Bronchus
Prostate
0 50 100 150 200 250 300
59.3
75.6
Rate‡ per 100,000Rate‡ per 100,000
Rate‡ per 100,000Rate‡ per 100,000
Rate‡ per 100,000Rate‡ per 100,000
All Races White
Black Asian/Pacific Islander§
American Indian/Alaska Native§ Hispanic§�
∗ Data are from selected state and metropolitan area cancer registries that meet the data quality criteria for all invasive
cancer sites combined. See Appendix B for data quality criteria and registry-specific data quality information.† Excludes basal and squamous cell carcinomas of the skin except when these occur on the skin of the genital organs, and in
situ cancers except urinary bladder.‡ Rates are age-adjusted to the 2000 U.S. standard population (19 age groups - Census P25-1130). See Table 2.1.1.1M-2.27.1.1M
and Appendix F.1-F.2 for 95% confidence intervals for rates. Rates are suppressed and not ranked if the population of a specific
category (race, ethnicity) is less than 50,000 or if cases are fewer than 16.§ Data for specified racial or ethnic populations other than white and black should be interpreted with caution. See Technical
Notes.� Hispanic origin is not mutually exclusive from race categories (white, black, Asian/Pacific Islander, American Indian/Alaska
Native).
Note: ONS — Other Nervous System; NOS — Not Otherwise Specified; IBD — Intrahepatic Bile Duct.
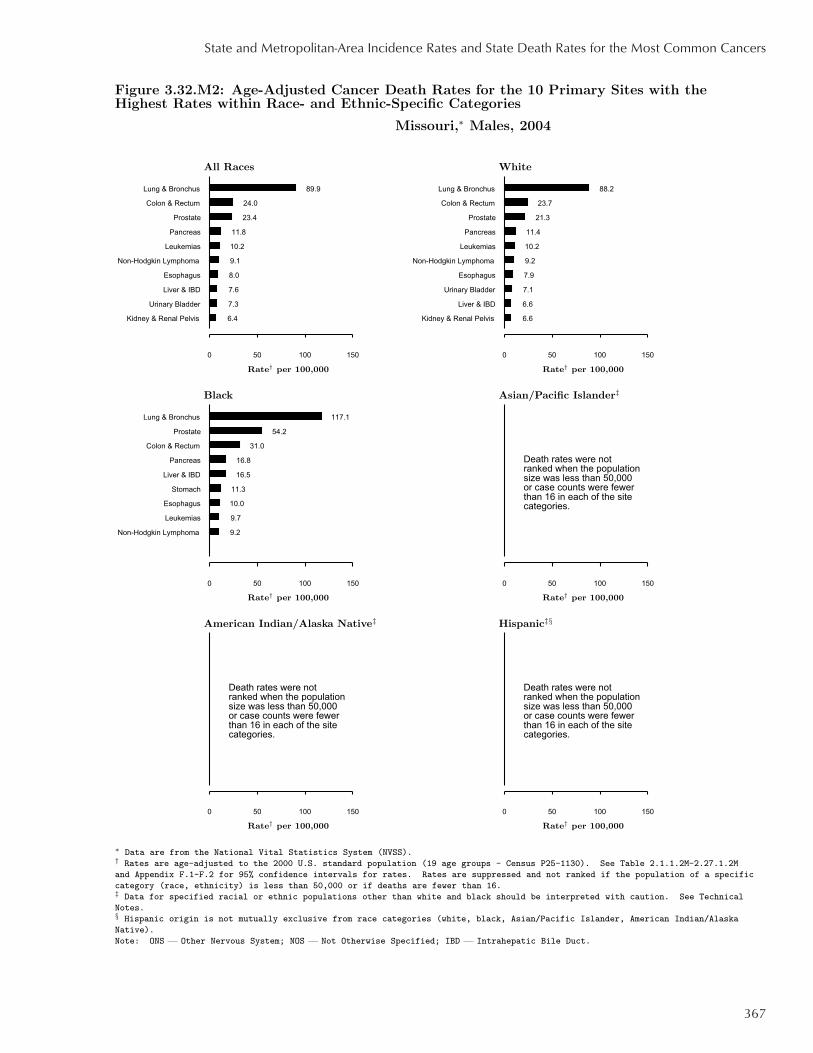
State and Metropolitan-Area Incidence Rates and State Death Rates for the Most Common Cancers
3��
Figure 3.32.M2: Age-Adjusted Cancer Death Rates for the 10 Primary Sites with theHighest Rates within Race- and Ethnic-Specific Categories
Missouri,∗ Males, 2004
Kidney & Renal Pelvis
Urinary Bladder
Liver & IBD
Esophagus
Non-Hodgkin Lymphoma
Leukemias
Pancreas
Prostate
Colon & Rectum
Lung & Bronchus
0 50 100 150
6.4
7.3
7.6
8.0
9.1
10.2
11.8
23.4
24.0
89.9
Kidney & Renal Pelvis
Liver & IBD
Urinary Bladder
Esophagus
Non-Hodgkin Lymphoma
Leukemias
Pancreas
Prostate
Colon & Rectum
Lung & Bronchus
0 50 100 150
6.6
6.6
7.1
7.9
9.2
10.2
11.4
21.3
23.7
88.2
Non-Hodgkin Lymphoma
Leukemias
Esophagus
Stomach
Liver & IBD
Pancreas
Colon & Rectum
Prostate
Lung & Bronchus
0 50 100 150
9.2
9.7
10.0
11.3
16.5
16.8
31.0
54.2
117.1
0 50 100 150
Death rates were notranked when the populationsize was less than 50,000or case counts were fewerthan 16 in each of the sitecategories.
0 50 100 150
Death rates were notranked when the populationsize was less than 50,000or case counts were fewerthan 16 in each of the sitecategories.
0 50 100 150
Death rates were notranked when the populationsize was less than 50,000or case counts were fewerthan 16 in each of the sitecategories.
Rate† per 100,000Rate† per 100,000
Rate† per 100,000Rate† per 100,000
Rate† per 100,000Rate† per 100,000
All Races White
Black Asian/Pacific Islander‡
American Indian/Alaska Native‡ Hispanic‡§
∗ Data are from the National Vital Statistics System (NVSS).† Rates are age-adjusted to the 2000 U.S. standard population (19 age groups - Census P25-1130). See Table 2.1.1.2M-2.27.1.2M
and Appendix F.1-F.2 for 95% confidence intervals for rates. Rates are suppressed and not ranked if the population of a specific
category (race, ethnicity) is less than 50,000 or if deaths are fewer than 16.‡ Data for specified racial or ethnic populations other than white and black should be interpreted with caution. See Technical
Notes.§ Hispanic origin is not mutually exclusive from race categories (white, black, Asian/Pacific Islander, American Indian/Alaska
Native).
Note: ONS — Other Nervous System; NOS — Not Otherwise Specified; IBD — Intrahepatic Bile Duct.

United States Cancer Statistics: 2004 Incidence and Mortality
3��
Figure 3.32.F1: Age-Adjusted Invasive Cancer Incidence Rates for the 10 Primary Siteswith the Highest Rates within Race- and Ethnic-Specific Categories
Missouri,∗† Females, 2004
Pancreas
Kidney & Renal Pelvis
Ovary
Melanomas of the Skin
Thyroid
Non-Hodgkin Lymphoma
Corpus & Uterus, NOS
Colon & Rectum
Lung & Bronchus
Breast
0 50 100 150 200 250 300
9.4
10.7
11.3
12.2
13.9
16.0
24.1
42.7
59.7
117.5
Pancreas
Kidney & Renal Pelvis
Ovary
Melanomas of the Skin
Thyroid
Non-Hodgkin Lymphoma
Corpus & Uterus, NOS
Colon & Rectum
Lung & Bronchus
Breast
0 50 100 150 200 250 300
9.2
10.6
11.5
13.6
14.8
16.5
24.8
41.7
58.9
117.5
Thyroid
Ovary
Pancreas
Non-Hodgkin Lymphoma
Kidney & Renal Pelvis
Cervix Uteri
Corpus & Uterus, NOS
Colon & Rectum
Lung & Bronchus
Breast
0 50 100 150 200 250 300
8.7
8.9
11.5
12.0
13.2
13.6
18.3
56.2
72.3
117.7
0 50 100 150 200 250 300
Incidence rates were notranked when the populationsize was less than 50,000or case counts were fewerthan 16 in each of the sitecategories.
0 50 100 150 200 250 300
Incidence rates were notranked when the populationsize was less than 50,000or case counts were fewerthan 16 in each of the sitecategories.
Colon & Rectum
Breast
0 50 100 150 200 250 300
50.6
131.9
Rate‡ per 100,000Rate‡ per 100,000
Rate‡ per 100,000Rate‡ per 100,000
Rate‡ per 100,000Rate‡ per 100,000
All Races White
Black Asian/Pacific Islander§
American Indian/Alaska Native§ Hispanic§�
∗ Data are from selected state and metropolitan area cancer registries that meet the data quality criteria for all invasive
cancer sites combined. See Appendix B for data quality criteria and registry-specific data quality information.† Excludes basal and squamous cell carcinomas of the skin except when these occur on the skin of the genital organs, and in
situ cancers except urinary bladder.‡ Rates are age-adjusted to the 2000 U.S. standard population (19 age groups - Census P25-1130). See Table 2.1.1.1F-2.27.1.1F
and Appendix F.1-F.2 for 95% confidence intervals for rates. Rates are suppressed and not ranked if the population of a specific
category (race, ethnicity) is less than 50,000 or if cases are fewer than 16.§ Data for specified racial or ethnic populations other than white and black should be interpreted with caution. See Technical
Notes.� Hispanic origin is not mutually exclusive from race categories (white, black, Asian/Pacific Islander, American Indian/Alaska
Native).
Note: ONS — Other Nervous System; NOS — Not Otherwise Specified; IBD — Intrahepatic Bile Duct. Ovary excludes cancers newly
classified as borderline according to ICD-O-3, beginning with 2001 diagnoses. See Technical Notes.

State and Metropolitan-Area Incidence Rates and State Death Rates for the Most Common Cancers
3��
Figure 3.32.F2: Age-Adjusted Cancer Death Rates for the 10 Primary Sites with theHighest Rates within Race- and Ethnic-Specific Categories
Missouri,∗ Females, 2004
Myeloma
Brain & ONS
Corpus & Uterus, NOS
Leukemias
Non-Hodgkin Lymphoma
Ovary
Pancreas
Colon & Rectum
Breast
Lung & Bronchus
0 50 100 150
3.5
3.7
4.4
5.6
5.9
8.4
9.1
16.0
25.5
47.5
Myeloma
Brain & ONS
Corpus & Uterus, NOS
Leukemias
Non-Hodgkin Lymphoma
Ovary
Pancreas
Colon & Rectum
Breast
Lung & Bronchus
0 50 100 150
3.3
3.8
4.0
5.5
6.2
8.6
8.9
15.4
24.9
47.0
Stomach
Myeloma
Leukemias
Ovary
Corpus & Uterus, NOS
Pancreas
Colon & Rectum
Breast
Lung & Bronchus
0 50 100 150
5.4
5.6
6.2
6.9
8.6
11.7
24.9
31.0
58.2
0 50 100 150
Death rates were notranked when the populationsize was less than 50,000or case counts were fewerthan 16 in each of the sitecategories.
0 50 100 150
Death rates were notranked when the populationsize was less than 50,000or case counts were fewerthan 16 in each of the sitecategories.
0 50 100 150
Death rates were notranked when the populationsize was less than 50,000or case counts were fewerthan 16 in each of the sitecategories.
Rate† per 100,000Rate† per 100,000
Rate† per 100,000Rate† per 100,000
Rate† per 100,000Rate† per 100,000
All Races White
Black Asian/Pacific Islander‡
American Indian/Alaska Native‡ Hispanic‡§
∗ Data are from the National Vital Statistics System (NVSS).† Rates are age-adjusted to the 2000 U.S. standard population (19 age groups - Census P25-1130). See Table 2.1.1.2F-2.27.1.2F
and Appendix F.1-F.2 for 95% confidence intervals for rates. Rates are suppressed and not ranked if the population of a specific
category (race, ethnicity) is less than 50,000 or if deaths are fewer than 16.‡ Data for specified racial or ethnic populations other than white and black should be interpreted with caution. See Technical
Notes.§ Hispanic origin is not mutually exclusive from race categories (white, black, Asian/Pacific Islander, American Indian/Alaska
Native).
Note: ONS — Other Nervous System; NOS — Not Otherwise Specified; IBD — Intrahepatic Bile Duct.

United States Cancer Statistics: 2004 Incidence and Mortality
3�0
Figure 3.33.M1: Age-Adjusted Invasive Cancer Incidence Rates for the 10 Primary Siteswith the Highest Rates within Race- and Ethnic-Specific Categories
Montana,∗† Males, 2004
Pancreas
Leukemias
Oral Cavity & Pharynx
Kidney & Renal Pelvis
Melanomas of the Skin
Non-Hodgkin Lymphoma
Urinary Bladder
Colon & Rectum
Lung & Bronchus
Prostate
0 50 100 150 200 250 300
13.6
16.2
16.3
17.1
18.3
22.3
41.8
50.8
71.4
173.5
Pancreas
Oral Cavity & Pharynx
Leukemias
Kidney & Renal Pelvis
Melanomas of the Skin
Non-Hodgkin Lymphoma
Urinary Bladder
Colon & Rectum
Lung & Bronchus
Prostate
0 50 100 150 200 250 300
13.1
16.0
16.1
17.1
17.6
22.3
41.5
50.8
69.5
171.4
0 50 100 150 200 250 300
Incidence rates were notranked when the populationsize was less than 50,000or case counts were fewerthan 16 in each of the sitecategories.
0 50 100 150 200 250 300
Incidence rates were notranked when the populationsize was less than 50,000or case counts were fewerthan 16 in each of the sitecategories.
0 50 100 150 200 250 300
Incidence rates were notranked when the populationsize was less than 50,000or case counts were fewerthan 16 in each of the sitecategories.
0 50 100 150 200 250 300
Incidence rates were notranked when the populationsize was less than 50,000or case counts were fewerthan 16 in each of the sitecategories.
Rate‡ per 100,000Rate‡ per 100,000
Rate‡ per 100,000Rate‡ per 100,000
Rate‡ per 100,000Rate‡ per 100,000
All Races White
Black Asian/Pacific Islander§
American Indian/Alaska Native§ Hispanic§�
∗ Data are from selected state and metropolitan area cancer registries that meet the data quality criteria for all invasive
cancer sites combined. See Appendix B for data quality criteria and registry-specific data quality information.† Excludes basal and squamous cell carcinomas of the skin except when these occur on the skin of the genital organs, and in
situ cancers except urinary bladder.‡ Rates are age-adjusted to the 2000 U.S. standard population (19 age groups - Census P25-1130). See Table 2.1.1.1M-2.27.1.1M
and Appendix F.1-F.2 for 95% confidence intervals for rates. Rates are suppressed and not ranked if the population of a specific
category (race, ethnicity) is less than 50,000 or if cases are fewer than 16.§ Data for specified racial or ethnic populations other than white and black should be interpreted with caution. See Technical
Notes.� Hispanic origin is not mutually exclusive from race categories (white, black, Asian/Pacific Islander, American Indian/Alaska
Native).
Note: ONS — Other Nervous System; NOS — Not Otherwise Specified; IBD — Intrahepatic Bile Duct.

State and Metropolitan-Area Incidence Rates and State Death Rates for the Most Common Cancers
3��
Figure 3.33.M2: Age-Adjusted Cancer Death Rates for the 10 Primary Sites with theHighest Rates within Race- and Ethnic-Specific Categories
Montana,∗ Males, 2004
Kidney & Renal Pelvis
Esophagus
Myeloma
Leukemias
Urinary Bladder
Non-Hodgkin Lymphoma
Pancreas
Colon & Rectum
Prostate
Lung & Bronchus
0 50 100 150
6.0
7.5
7.6
8.8
8.9
10.0
12.3
17.4
31.1
56.6
Kidney & Renal Pelvis
Esophagus
Myeloma
Leukemias
Urinary Bladder
Non-Hodgkin Lymphoma
Pancreas
Colon & Rectum
Prostate
Lung & Bronchus
0 50 100 150
6.2
7.4
7.4
8.7
9.0
9.8
12.2
17.3
30.9
56.6
0 50 100 150
Death rates were notranked when the populationsize was less than 50,000or case counts were fewerthan 16 in each of the sitecategories.
0 50 100 150
Death rates were notranked when the populationsize was less than 50,000or case counts were fewerthan 16 in each of the sitecategories.
0 50 100 150
Death rates were notranked when the populationsize was less than 50,000or case counts were fewerthan 16 in each of the sitecategories.
0 50 100 150
Death rates were notranked when the populationsize was less than 50,000or case counts were fewerthan 16 in each of the sitecategories.
Rate† per 100,000Rate† per 100,000
Rate† per 100,000Rate† per 100,000
Rate† per 100,000Rate† per 100,000
All Races White
Black Asian/Pacific Islander‡
American Indian/Alaska Native‡ Hispanic‡§
∗ Data are from the National Vital Statistics System (NVSS).† Rates are age-adjusted to the 2000 U.S. standard population (19 age groups - Census P25-1130). See Table 2.1.1.2M-2.27.1.2M
and Appendix F.1-F.2 for 95% confidence intervals for rates. Rates are suppressed and not ranked if the population of a specific
category (race, ethnicity) is less than 50,000 or if deaths are fewer than 16.‡ Data for specified racial or ethnic populations other than white and black should be interpreted with caution. See Technical
Notes.§ Hispanic origin is not mutually exclusive from race categories (white, black, Asian/Pacific Islander, American Indian/Alaska
Native).
Note: ONS — Other Nervous System; NOS — Not Otherwise Specified; IBD — Intrahepatic Bile Duct.

United States Cancer Statistics: 2004 Incidence and Mortality
3��
Figure 3.33.F1: Age-Adjusted Invasive Cancer Incidence Rates for the 10 Primary Siteswith the Highest Rates within Race- and Ethnic-Specific Categories
Montana,∗† Females, 2004
Kidney & Renal Pelvis
Urinary Bladder
Melanomas of the Skin
Ovary
Non-Hodgkin Lymphoma
Thyroid
Corpus & Uterus, NOS
Colon & Rectum
Lung & Bronchus
Breast
0 50 100 150 200 250 300
9.5
10.1
12.8
13.1
13.8
14.6
23.7
37.8
54.3
111.5
Pancreas
Urinary Bladder
Melanomas of the Skin
Ovary
Non-Hodgkin Lymphoma
Thyroid
Corpus & Uterus, NOS
Colon & Rectum
Lung & Bronchus
Breast
0 50 100 150 200 250 300
9.4
10.1
12.8
13.0
13.7
14.5
23.4
37.6
53.4
111.6
0 50 100 150 200 250 300
Incidence rates were notranked when the populationsize was less than 50,000or case counts were fewerthan 16 in each of the sitecategories.
0 50 100 150 200 250 300
Incidence rates were notranked when the populationsize was less than 50,000or case counts were fewerthan 16 in each of the sitecategories.
0 50 100 150 200 250 300
Incidence rates were notranked when the populationsize was less than 50,000or case counts were fewerthan 16 in each of the sitecategories.
0 50 100 150 200 250 300
Incidence rates were notranked when the populationsize was less than 50,000or case counts were fewerthan 16 in each of the sitecategories.
Rate‡ per 100,000Rate‡ per 100,000
Rate‡ per 100,000Rate‡ per 100,000
Rate‡ per 100,000Rate‡ per 100,000
All Races White
Black Asian/Pacific Islander§
American Indian/Alaska Native§ Hispanic§�
∗ Data are from selected state and metropolitan area cancer registries that meet the data quality criteria for all invasive
cancer sites combined. See Appendix B for data quality criteria and registry-specific data quality information.† Excludes basal and squamous cell carcinomas of the skin except when these occur on the skin of the genital organs, and in
situ cancers except urinary bladder.‡ Rates are age-adjusted to the 2000 U.S. standard population (19 age groups - Census P25-1130). See Table 2.1.1.1F-2.27.1.1F
and Appendix F.1-F.2 for 95% confidence intervals for rates. Rates are suppressed and not ranked if the population of a specific
category (race, ethnicity) is less than 50,000 or if cases are fewer than 16.§ Data for specified racial or ethnic populations other than white and black should be interpreted with caution. See Technical
Notes.� Hispanic origin is not mutually exclusive from race categories (white, black, Asian/Pacific Islander, American Indian/Alaska
Native).
Note: ONS — Other Nervous System; NOS — Not Otherwise Specified; IBD — Intrahepatic Bile Duct. Ovary excludes cancers newly
classified as borderline according to ICD-O-3, beginning with 2001 diagnoses. See Technical Notes.

State and Metropolitan-Area Incidence Rates and State Death Rates for the Most Common Cancers
3�3
Figure 3.33.F2: Age-Adjusted Cancer Death Rates for the 10 Primary Sites with theHighest Rates within Race- and Ethnic-Specific Categories
Montana,∗ Females, 2004
Liver & IBD
Brain & ONS
Corpus & Uterus, NOS
Leukemias
Non-Hodgkin Lymphoma
Ovary
Pancreas
Colon & Rectum
Breast
Lung & Bronchus
0 50 100 150
3.4
3.6
5.3
5.3
6.4
9.0
9.3
11.4
24.3
43.3
Liver & IBD
Brain & ONS
Leukemias
Corpus & Uterus, NOS
Non-Hodgkin Lymphoma
Ovary
Pancreas
Colon & Rectum
Breast
Lung & Bronchus
0 50 100 150
3.2
3.8
5.2
5.3
6.5
9.1
9.4
11.7
24.2
43.4
0 50 100 150
Death rates were notranked when the populationsize was less than 50,000or case counts were fewerthan 16 in each of the sitecategories.
0 50 100 150
Death rates were notranked when the populationsize was less than 50,000or case counts were fewerthan 16 in each of the sitecategories.
0 50 100 150
Death rates were notranked when the populationsize was less than 50,000or case counts were fewerthan 16 in each of the sitecategories.
0 50 100 150
Death rates were notranked when the populationsize was less than 50,000or case counts were fewerthan 16 in each of the sitecategories.
Rate† per 100,000Rate† per 100,000
Rate† per 100,000Rate† per 100,000
Rate† per 100,000Rate† per 100,000
All Races White
Black Asian/Pacific Islander‡
American Indian/Alaska Native‡ Hispanic‡§
∗ Data are from the National Vital Statistics System (NVSS).† Rates are age-adjusted to the 2000 U.S. standard population (19 age groups - Census P25-1130). See Table 2.1.1.2F-2.27.1.2F
and Appendix F.1-F.2 for 95% confidence intervals for rates. Rates are suppressed and not ranked if the population of a specific
category (race, ethnicity) is less than 50,000 or if deaths are fewer than 16.‡ Data for specified racial or ethnic populations other than white and black should be interpreted with caution. See Technical
Notes.§ Hispanic origin is not mutually exclusive from race categories (white, black, Asian/Pacific Islander, American Indian/Alaska
Native).
Note: ONS — Other Nervous System; NOS — Not Otherwise Specified; IBD — Intrahepatic Bile Duct.

United States Cancer Statistics: 2004 Incidence and Mortality
3��
Figure 3.34.M1: Age-Adjusted Invasive Cancer Incidence Rates for the 10 Primary Siteswith the Highest Rates within Race- and Ethnic-Specific Categories
Nebraska,∗† Males, 2004
Pancreas
Oral Cavity & Pharynx
Leukemias
Kidney & Renal Pelvis
Melanomas of the Skin
Non-Hodgkin Lymphoma
Urinary Bladder
Colon & Rectum
Lung & Bronchus
Prostate
0 50 100 150 200 250 300
12.5
14.4
17.6
17.8
20.5
24.8
37.4
64.0
89.0
150.0
Pancreas
Oral Cavity & Pharynx
Leukemias
Kidney & Renal Pelvis
Melanomas of the Skin
Non-Hodgkin Lymphoma
Urinary Bladder
Colon & Rectum
Lung & Bronchus
Prostate
0 50 100 150 200 250 300
11.9
14.4
17.0
17.4
18.0
24.6
37.3
63.9
88.9
141.5
0 50 100 150 200 250 300
Incidence rates were notranked when the populationsize was less than 50,000or case counts were fewerthan 16 in each of the sitecategories.
0 50 100 150 200 250 300
Incidence rates were notranked when the populationsize was less than 50,000or case counts were fewerthan 16 in each of the sitecategories.
0 50 100 150 200 250 300
Incidence rates were notranked when the populationsize was less than 50,000or case counts were fewerthan 16 in each of the sitecategories.
Prostate
0 50 100 150 200 250 300
130.5
Rate‡ per 100,000Rate‡ per 100,000
Rate‡ per 100,000Rate‡ per 100,000
Rate‡ per 100,000Rate‡ per 100,000
All Races White
Black Asian/Pacific Islander§
American Indian/Alaska Native§ Hispanic§�
∗ Data are from selected state and metropolitan area cancer registries that meet the data quality criteria for all invasive
cancer sites combined. See Appendix B for data quality criteria and registry-specific data quality information.† Excludes basal and squamous cell carcinomas of the skin except when these occur on the skin of the genital organs, and in
situ cancers except urinary bladder.‡ Rates are age-adjusted to the 2000 U.S. standard population (19 age groups - Census P25-1130). See Table 2.1.1.1M-2.27.1.1M
and Appendix F.1-F.2 for 95% confidence intervals for rates. Rates are suppressed and not ranked if the population of a specific
category (race, ethnicity) is less than 50,000 or if cases are fewer than 16.§ Data for specified racial or ethnic populations other than white and black should be interpreted with caution. See Technical
Notes.� Hispanic origin is not mutually exclusive from race categories (white, black, Asian/Pacific Islander, American Indian/Alaska
Native).
Note: ONS — Other Nervous System; NOS — Not Otherwise Specified; IBD — Intrahepatic Bile Duct.

State and Metropolitan-Area Incidence Rates and State Death Rates for the Most Common Cancers
3��
Figure 3.34.M2: Age-Adjusted Cancer Death Rates for the 10 Primary Sites with theHighest Rates within Race- and Ethnic-Specific Categories
Nebraska,∗ Males, 2004
Liver & IBD
Kidney & Renal Pelvis
Urinary Bladder
Non-Hodgkin Lymphoma
Esophagus
Leukemias
Pancreas
Colon & Rectum
Prostate
Lung & Bronchus
0 50 100 150
6.2
6.4
7.0
7.9
8.5
9.6
11.9
21.8
24.2
66.2
Liver & IBD
Kidney & Renal Pelvis
Urinary Bladder
Non-Hodgkin Lymphoma
Esophagus
Leukemias
Pancreas
Colon & Rectum
Prostate
Lung & Bronchus
0 50 100 150
5.9
6.3
7.2
7.9
8.5
9.8
11.5
21.2
24.1
65.2
0 50 100 150
Death rates were notranked when the populationsize was less than 50,000or case counts were fewerthan 16 in each of the sitecategories.
0 50 100 150
Death rates were notranked when the populationsize was less than 50,000or case counts were fewerthan 16 in each of the sitecategories.
0 50 100 150
Death rates were notranked when the populationsize was less than 50,000or case counts were fewerthan 16 in each of the sitecategories.
0 50 100 150
Death rates were notranked when the populationsize was less than 50,000or case counts were fewerthan 16 in each of the sitecategories.
Rate† per 100,000Rate† per 100,000
Rate† per 100,000Rate† per 100,000
Rate† per 100,000Rate† per 100,000
All Races White
Black Asian/Pacific Islander‡
American Indian/Alaska Native‡ Hispanic‡§
∗ Data are from the National Vital Statistics System (NVSS).† Rates are age-adjusted to the 2000 U.S. standard population (19 age groups - Census P25-1130). See Table 2.1.1.2M-2.27.1.2M
and Appendix F.1-F.2 for 95% confidence intervals for rates. Rates are suppressed and not ranked if the population of a specific
category (race, ethnicity) is less than 50,000 or if deaths are fewer than 16.‡ Data for specified racial or ethnic populations other than white and black should be interpreted with caution. See Technical
Notes.§ Hispanic origin is not mutually exclusive from race categories (white, black, Asian/Pacific Islander, American Indian/Alaska
Native).
Note: ONS — Other Nervous System; NOS — Not Otherwise Specified; IBD — Intrahepatic Bile Duct.

United States Cancer Statistics: 2004 Incidence and Mortality
3��
Figure 3.34.F1: Age-Adjusted Invasive Cancer Incidence Rates for the 10 Primary Siteswith the Highest Rates within Race- and Ethnic-Specific Categories
Nebraska,∗† Females, 2004
Kidney & Renal Pelvis
Urinary Bladder
Ovary
Melanomas of the Skin
Thyroid
Non-Hodgkin Lymphoma
Corpus & Uterus, NOS
Colon & Rectum
Lung & Bronchus
Breast
0 50 100 150 200 250 300
10.2
10.4
11.2
14.7
15.5
15.9
29.0
44.6
47.3
123.7
Urinary Bladder
Kidney & Renal Pelvis
Ovary
Melanomas of the Skin
Thyroid
Non-Hodgkin Lymphoma
Corpus & Uterus, NOS
Colon & Rectum
Lung & Bronchus
Breast
0 50 100 150 200 250 300
10.2
10.5
11.2
13.1
15.8
15.8
29.3
43.6
46.5
123.9
0 50 100 150 200 250 300
Incidence rates were notranked when the populationsize was less than 50,000or case counts were fewerthan 16 in each of the sitecategories.
0 50 100 150 200 250 300
Incidence rates were notranked when the populationsize was less than 50,000or case counts were fewerthan 16 in each of the sitecategories.
0 50 100 150 200 250 300
Incidence rates were notranked when the populationsize was less than 50,000or case counts were fewerthan 16 in each of the sitecategories.
Breast
0 50 100 150 200 250 300
77.3
Rate‡ per 100,000Rate‡ per 100,000
Rate‡ per 100,000Rate‡ per 100,000
Rate‡ per 100,000Rate‡ per 100,000
All Races White
Black Asian/Pacific Islander§
American Indian/Alaska Native§ Hispanic§�
∗ Data are from selected state and metropolitan area cancer registries that meet the data quality criteria for all invasive
cancer sites combined. See Appendix B for data quality criteria and registry-specific data quality information.† Excludes basal and squamous cell carcinomas of the skin except when these occur on the skin of the genital organs, and in
situ cancers except urinary bladder.‡ Rates are age-adjusted to the 2000 U.S. standard population (19 age groups - Census P25-1130). See Table 2.1.1.1F-2.27.1.1F
and Appendix F.1-F.2 for 95% confidence intervals for rates. Rates are suppressed and not ranked if the population of a specific
category (race, ethnicity) is less than 50,000 or if cases are fewer than 16.§ Data for specified racial or ethnic populations other than white and black should be interpreted with caution. See Technical
Notes.� Hispanic origin is not mutually exclusive from race categories (white, black, Asian/Pacific Islander, American Indian/Alaska
Native).
Note: ONS — Other Nervous System; NOS — Not Otherwise Specified; IBD — Intrahepatic Bile Duct. Ovary excludes cancers newly
classified as borderline according to ICD-O-3, beginning with 2001 diagnoses. See Technical Notes.

State and Metropolitan-Area Incidence Rates and State Death Rates for the Most Common Cancers
3��
Figure 3.34.F2: Age-Adjusted Cancer Death Rates for the 10 Primary Sites with theHighest Rates within Race- and Ethnic-Specific Categories
Nebraska,∗ Females, 2004
Kidney & Renal Pelvis
Brain & ONS
Leukemias
Corpus & Uterus, NOS
Non-Hodgkin Lymphoma
Ovary
Pancreas
Colon & Rectum
Breast
Lung & Bronchus
0 50 100 150
4.1
4.5
5.1
5.4
5.9
7.4
7.5
16.4
23.4
33.4
Kidney & Renal Pelvis
Brain & ONS
Leukemias
Corpus & Uterus, NOS
Non-Hodgkin Lymphoma
Ovary
Pancreas
Colon & Rectum
Breast
Lung & Bronchus
0 50 100 150
4.1
4.6
5.2
5.5
6.1
7.1
7.2
16.4
22.7
32.9
0 50 100 150
Death rates were notranked when the populationsize was less than 50,000or case counts were fewerthan 16 in each of the sitecategories.
0 50 100 150
Death rates were notranked when the populationsize was less than 50,000or case counts were fewerthan 16 in each of the sitecategories.
0 50 100 150
Death rates were notranked when the populationsize was less than 50,000or case counts were fewerthan 16 in each of the sitecategories.
0 50 100 150
Death rates were notranked when the populationsize was less than 50,000or case counts were fewerthan 16 in each of the sitecategories.
Rate† per 100,000Rate† per 100,000
Rate† per 100,000Rate† per 100,000
Rate† per 100,000Rate† per 100,000
All Races White
Black Asian/Pacific Islander‡
American Indian/Alaska Native‡ Hispanic‡§
∗ Data are from the National Vital Statistics System (NVSS).† Rates are age-adjusted to the 2000 U.S. standard population (19 age groups - Census P25-1130). See Table 2.1.1.2F-2.27.1.2F
and Appendix F.1-F.2 for 95% confidence intervals for rates. Rates are suppressed and not ranked if the population of a specific
category (race, ethnicity) is less than 50,000 or if deaths are fewer than 16.‡ Data for specified racial or ethnic populations other than white and black should be interpreted with caution. See Technical
Notes.§ Hispanic origin is not mutually exclusive from race categories (white, black, Asian/Pacific Islander, American Indian/Alaska
Native).
Note: ONS — Other Nervous System; NOS — Not Otherwise Specified; IBD — Intrahepatic Bile Duct.
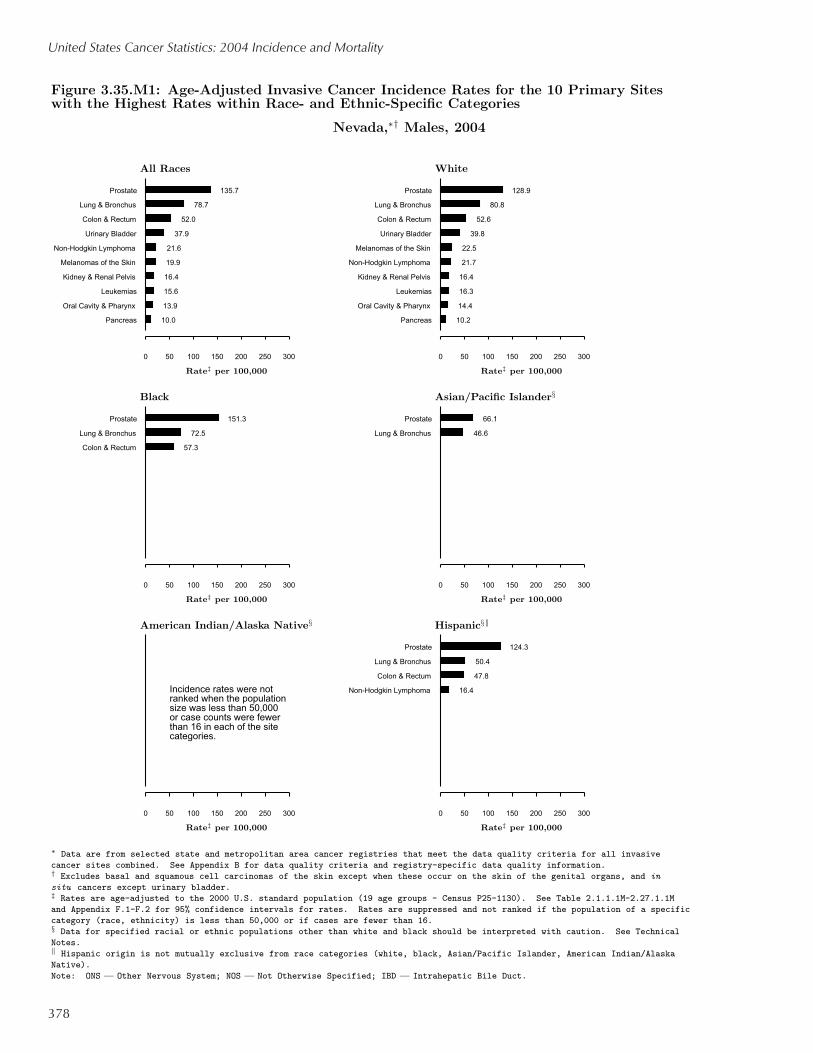
United States Cancer Statistics: 2004 Incidence and Mortality
3��
Figure 3.35.M1: Age-Adjusted Invasive Cancer Incidence Rates for the 10 Primary Siteswith the Highest Rates within Race- and Ethnic-Specific Categories
Nevada,∗† Males, 2004
Pancreas
Oral Cavity & Pharynx
Leukemias
Kidney & Renal Pelvis
Melanomas of the Skin
Non-Hodgkin Lymphoma
Urinary Bladder
Colon & Rectum
Lung & Bronchus
Prostate
0 50 100 150 200 250 300
10.0
13.9
15.6
16.4
19.9
21.6
37.9
52.0
78.7
135.7
Pancreas
Oral Cavity & Pharynx
Leukemias
Kidney & Renal Pelvis
Non-Hodgkin Lymphoma
Melanomas of the Skin
Urinary Bladder
Colon & Rectum
Lung & Bronchus
Prostate
0 50 100 150 200 250 300
10.2
14.4
16.3
16.4
21.7
22.5
39.8
52.6
80.8
128.9
Colon & Rectum
Lung & Bronchus
Prostate
0 50 100 150 200 250 300
57.3
72.5
151.3
Lung & Bronchus
Prostate
0 50 100 150 200 250 300
46.6
66.1
0 50 100 150 200 250 300
Incidence rates were notranked when the populationsize was less than 50,000or case counts were fewerthan 16 in each of the sitecategories.
Non-Hodgkin Lymphoma
Colon & Rectum
Lung & Bronchus
Prostate
0 50 100 150 200 250 300
16.4
47.8
50.4
124.3
Rate‡ per 100,000Rate‡ per 100,000
Rate‡ per 100,000Rate‡ per 100,000
Rate‡ per 100,000Rate‡ per 100,000
All Races White
Black Asian/Pacific Islander§
American Indian/Alaska Native§ Hispanic§�
∗ Data are from selected state and metropolitan area cancer registries that meet the data quality criteria for all invasive
cancer sites combined. See Appendix B for data quality criteria and registry-specific data quality information.† Excludes basal and squamous cell carcinomas of the skin except when these occur on the skin of the genital organs, and in
situ cancers except urinary bladder.‡ Rates are age-adjusted to the 2000 U.S. standard population (19 age groups - Census P25-1130). See Table 2.1.1.1M-2.27.1.1M
and Appendix F.1-F.2 for 95% confidence intervals for rates. Rates are suppressed and not ranked if the population of a specific
category (race, ethnicity) is less than 50,000 or if cases are fewer than 16.§ Data for specified racial or ethnic populations other than white and black should be interpreted with caution. See Technical
Notes.� Hispanic origin is not mutually exclusive from race categories (white, black, Asian/Pacific Islander, American Indian/Alaska
Native).
Note: ONS — Other Nervous System; NOS — Not Otherwise Specified; IBD — Intrahepatic Bile Duct.

State and Metropolitan-Area Incidence Rates and State Death Rates for the Most Common Cancers
3��
Figure 3.35.M2: Age-Adjusted Cancer Death Rates for the 10 Primary Sites with theHighest Rates within Race- and Ethnic-Specific Categories
Nevada,∗ Males, 2004
Kidney & Renal Pelvis
Urinary Bladder
Esophagus
Non-Hodgkin Lymphoma
Liver & IBD
Leukemias
Pancreas
Colon & Rectum
Prostate
Lung & Bronchus
0 50 100 150
5.9
6.7
6.7
7.5
9.1
9.2
10.5
25.2
25.9
61.3
Kidney & Renal Pelvis
Esophagus
Urinary Bladder
Non-Hodgkin Lymphoma
Liver & IBD
Leukemias
Pancreas
Colon & Rectum
Prostate
Lung & Bronchus
0 50 100 150
5.7
6.3
7.3
8.1
8.6
9.3
10.6
24.9
26.3
62.9
Colon & Rectum
Lung & Bronchus
0 50 100 150
48.6
57.0 Lung & Bronchus
0 50 100 150
35.6
0 50 100 150
Death rates were notranked when the populationsize was less than 50,000or case counts were fewerthan 16 in each of the sitecategories.
Lung & Bronchus
0 50 100 150
35.7
Rate† per 100,000Rate† per 100,000
Rate† per 100,000Rate† per 100,000
Rate† per 100,000Rate† per 100,000
All Races White
Black Asian/Pacific Islander‡
American Indian/Alaska Native‡ Hispanic‡§
∗ Data are from the National Vital Statistics System (NVSS).† Rates are age-adjusted to the 2000 U.S. standard population (19 age groups - Census P25-1130). See Table 2.1.1.2M-2.27.1.2M
and Appendix F.1-F.2 for 95% confidence intervals for rates. Rates are suppressed and not ranked if the population of a specific
category (race, ethnicity) is less than 50,000 or if deaths are fewer than 16.‡ Data for specified racial or ethnic populations other than white and black should be interpreted with caution. See Technical
Notes.§ Hispanic origin is not mutually exclusive from race categories (white, black, Asian/Pacific Islander, American Indian/Alaska
Native).
Note: ONS — Other Nervous System; NOS — Not Otherwise Specified; IBD — Intrahepatic Bile Duct.

United States Cancer Statistics: 2004 Incidence and Mortality
3�0
Figure 3.35.F1: Age-Adjusted Invasive Cancer Incidence Rates for the 10 Primary Siteswith the Highest Rates within Race- and Ethnic-Specific Categories
Nevada,∗† Females, 2004
Leukemias
Urinary Bladder
Ovary
Melanomas of the Skin
Non-Hodgkin Lymphoma
Corpus & Uterus, NOS
Thyroid
Colon & Rectum
Lung & Bronchus
Breast
0 50 100 150 200 250 300
10.9
11.1
11.6
12.3
16.0
18.2
18.9
44.5
67.9
106.4
Leukemias
Urinary Bladder
Ovary
Melanomas of the Skin
Non-Hodgkin Lymphoma
Thyroid
Corpus & Uterus, NOS
Colon & Rectum
Lung & Bronchus
Breast
0 50 100 150 200 250 300
10.8
11.3
12.3
14.4
16.1
18.1
19.3
44.7
72.1
108.4
Lung & Bronchus
Colon & Rectum
Breast
0 50 100 150 200 250 300
44.2
48.8
97.2
Thyroid
Colon & Rectum
Lung & Bronchus
Breast
0 50 100 150 200 250 300
28.3
31.5
33.9
65.1
0 50 100 150 200 250 300
Incidence rates were notranked when the populationsize was less than 50,000or case counts were fewerthan 16 in each of the sitecategories. Leukemias
Cervix Uteri
Corpus & Uterus, NOS
Thyroid
Lung & Bronchus
Colon & Rectum
Breast
0 50 100 150 200 250 300
8.5
12.7
12.8
18.9
28.4
38.2
68.7
Rate‡ per 100,000Rate‡ per 100,000
Rate‡ per 100,000Rate‡ per 100,000
Rate‡ per 100,000Rate‡ per 100,000
All Races White
Black Asian/Pacific Islander§
American Indian/Alaska Native§ Hispanic§�
∗ Data are from selected state and metropolitan area cancer registries that meet the data quality criteria for all invasive
cancer sites combined. See Appendix B for data quality criteria and registry-specific data quality information.† Excludes basal and squamous cell carcinomas of the skin except when these occur on the skin of the genital organs, and in
situ cancers except urinary bladder.‡ Rates are age-adjusted to the 2000 U.S. standard population (19 age groups - Census P25-1130). See Table 2.1.1.1F-2.27.1.1F
and Appendix F.1-F.2 for 95% confidence intervals for rates. Rates are suppressed and not ranked if the population of a specific
category (race, ethnicity) is less than 50,000 or if cases are fewer than 16.§ Data for specified racial or ethnic populations other than white and black should be interpreted with caution. See Technical
Notes.� Hispanic origin is not mutually exclusive from race categories (white, black, Asian/Pacific Islander, American Indian/Alaska
Native).
Note: ONS — Other Nervous System; NOS — Not Otherwise Specified; IBD — Intrahepatic Bile Duct. Ovary excludes cancers newly
classified as borderline according to ICD-O-3, beginning with 2001 diagnoses. See Technical Notes.
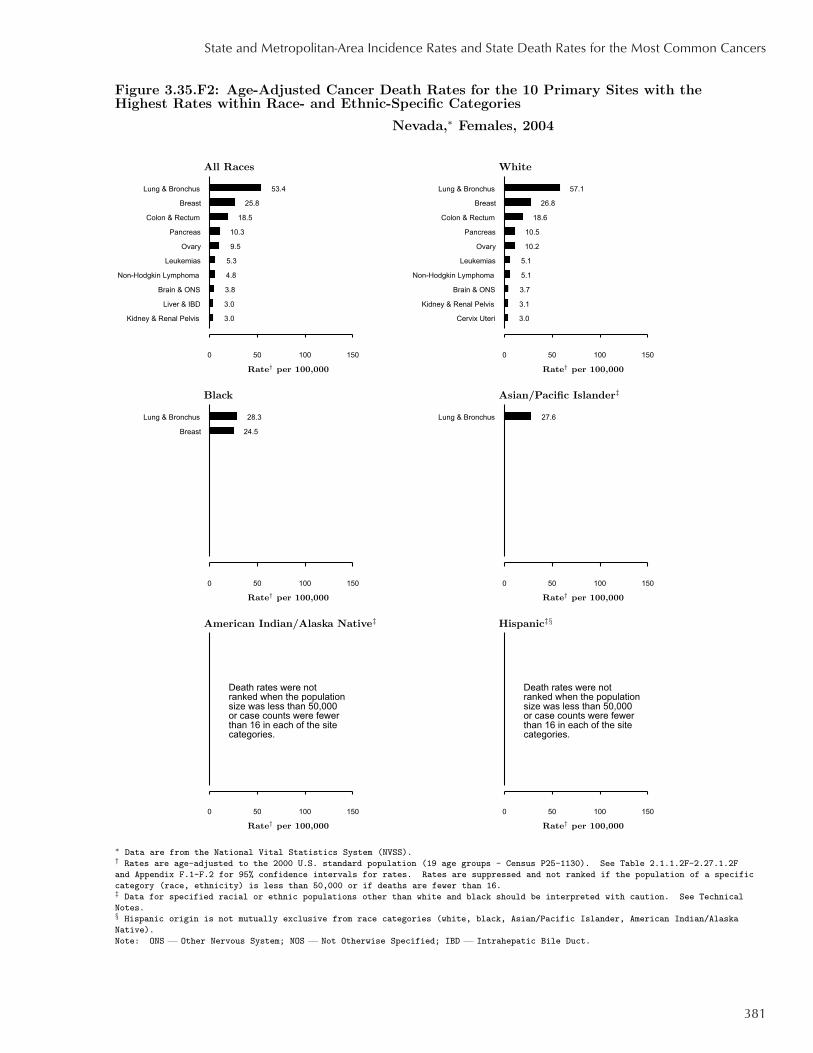
State and Metropolitan-Area Incidence Rates and State Death Rates for the Most Common Cancers
3��
Figure 3.35.F2: Age-Adjusted Cancer Death Rates for the 10 Primary Sites with theHighest Rates within Race- and Ethnic-Specific Categories
Nevada,∗ Females, 2004
Kidney & Renal Pelvis
Liver & IBD
Brain & ONS
Non-Hodgkin Lymphoma
Leukemias
Ovary
Pancreas
Colon & Rectum
Breast
Lung & Bronchus
0 50 100 150
3.0
3.0
3.8
4.8
5.3
9.5
10.3
18.5
25.8
53.4
Cervix Uteri
Kidney & Renal Pelvis
Brain & ONS
Non-Hodgkin Lymphoma
Leukemias
Ovary
Pancreas
Colon & Rectum
Breast
Lung & Bronchus
0 50 100 150
3.0
3.1
3.7
5.1
5.1
10.2
10.5
18.6
26.8
57.1
Breast
Lung & Bronchus
0 50 100 150
24.5
28.3 Lung & Bronchus
0 50 100 150
27.6
0 50 100 150
Death rates were notranked when the populationsize was less than 50,000or case counts were fewerthan 16 in each of the sitecategories.
0 50 100 150
Death rates were notranked when the populationsize was less than 50,000or case counts were fewerthan 16 in each of the sitecategories.
Rate† per 100,000Rate† per 100,000
Rate† per 100,000Rate† per 100,000
Rate† per 100,000Rate† per 100,000
All Races White
Black Asian/Pacific Islander‡
American Indian/Alaska Native‡ Hispanic‡§
∗ Data are from the National Vital Statistics System (NVSS).† Rates are age-adjusted to the 2000 U.S. standard population (19 age groups - Census P25-1130). See Table 2.1.1.2F-2.27.1.2F
and Appendix F.1-F.2 for 95% confidence intervals for rates. Rates are suppressed and not ranked if the population of a specific
category (race, ethnicity) is less than 50,000 or if deaths are fewer than 16.‡ Data for specified racial or ethnic populations other than white and black should be interpreted with caution. See Technical
Notes.§ Hispanic origin is not mutually exclusive from race categories (white, black, Asian/Pacific Islander, American Indian/Alaska
Native).
Note: ONS — Other Nervous System; NOS — Not Otherwise Specified; IBD — Intrahepatic Bile Duct.

United States Cancer Statistics: 2004 Incidence and Mortality
3��
Figure 3.36.M1: Age-Adjusted Invasive Cancer Incidence Rates for the 10 Primary Siteswith the Highest Rates within Race- and Ethnic-Specific Categories
New Hampshire,∗† Males, 2004
Pancreas
Oral Cavity & Pharynx
Leukemias
Kidney & Renal Pelvis
Non-Hodgkin Lymphoma
Melanomas of the Skin
Urinary Bladder
Colon & Rectum
Lung & Bronchus
Prostate
0 50 100 150 200 250 300
11.0
14.0
16.0
18.5
24.9
30.8
45.7
59.7
83.9
158.0
Esophagus
Oral Cavity & Pharynx
Leukemias
Kidney & Renal Pelvis
Non-Hodgkin Lymphoma
Melanomas of the Skin
Urinary Bladder
Colon & Rectum
Lung & Bronchus
Prostate
0 50 100 150 200 250 300
10.2
13.8
15.7
18.2
24.8
30.8
46.0
59.7
80.9
152.9
0 50 100 150 200 250 300
Incidence rates were notranked when the populationsize was less than 50,000or case counts were fewerthan 16 in each of the sitecategories.
0 50 100 150 200 250 300
Incidence rates were notranked when the populationsize was less than 50,000or case counts were fewerthan 16 in each of the sitecategories.
0 50 100 150 200 250 300
Incidence rates were notranked when the populationsize was less than 50,000or case counts were fewerthan 16 in each of the sitecategories.
0 50 100 150 200 250 300
Incidence rates were notranked when the populationsize was less than 50,000or case counts were fewerthan 16 in each of the sitecategories.
Rate‡ per 100,000Rate‡ per 100,000
Rate‡ per 100,000Rate‡ per 100,000
Rate‡ per 100,000Rate‡ per 100,000
All Races White
Black Asian/Pacific Islander§
American Indian/Alaska Native§ Hispanic§�
∗ Data are from selected state and metropolitan area cancer registries that meet the data quality criteria for all invasive
cancer sites combined. See Appendix B for data quality criteria and registry-specific data quality information.† Excludes basal and squamous cell carcinomas of the skin except when these occur on the skin of the genital organs, and in
situ cancers except urinary bladder.‡ Rates are age-adjusted to the 2000 U.S. standard population (19 age groups - Census P25-1130). See Table 2.1.1.1M-2.27.1.1M
and Appendix F.1-F.2 for 95% confidence intervals for rates. Rates are suppressed and not ranked if the population of a specific
category (race, ethnicity) is less than 50,000 or if cases are fewer than 16.§ Data for specified racial or ethnic populations other than white and black should be interpreted with caution. See Technical
Notes.� Hispanic origin is not mutually exclusive from race categories (white, black, Asian/Pacific Islander, American Indian/Alaska
Native).
Note: ONS — Other Nervous System; NOS — Not Otherwise Specified; IBD — Intrahepatic Bile Duct.

State and Metropolitan-Area Incidence Rates and State Death Rates for the Most Common Cancers
3�3
Figure 3.36.M2: Age-Adjusted Cancer Death Rates for the 10 Primary Sites with theHighest Rates within Race- and Ethnic-Specific Categories
New Hampshire,∗ Males, 2004
Kidney & Renal Pelvis
Brain & ONS
Esophagus
Non-Hodgkin Lymphoma
Urinary Bladder
Leukemias
Pancreas
Colon & Rectum
Prostate
Lung & Bronchus
0 50 100 150
6.2
6.5
8.5
9.1
9.2
9.9
11.7
22.3
28.5
68.3
Kidney & Renal Pelvis
Brain & ONS
Esophagus
Non-Hodgkin Lymphoma
Urinary Bladder
Leukemias
Pancreas
Colon & Rectum
Prostate
Lung & Bronchus
0 50 100 150
6.3
6.7
8.6
9.0
9.3
9.9
11.3
22.6
28.8
68.9
0 50 100 150
Death rates were notranked when the populationsize was less than 50,000or case counts were fewerthan 16 in each of the sitecategories.
0 50 100 150
Death rates were notranked when the populationsize was less than 50,000or case counts were fewerthan 16 in each of the sitecategories.
0 50 100 150
Death rates were notranked when the populationsize was less than 50,000or case counts were fewerthan 16 in each of the sitecategories.
0 50 100 150
Death rates were notranked when the populationsize was less than 50,000or case counts were fewerthan 16 in each of the sitecategories.
Rate† per 100,000Rate† per 100,000
Rate† per 100,000Rate† per 100,000
Rate† per 100,000Rate† per 100,000
All Races White
Black Asian/Pacific Islander‡
American Indian/Alaska Native‡ Hispanic‡§
∗ Data are from the National Vital Statistics System (NVSS).† Rates are age-adjusted to the 2000 U.S. standard population (19 age groups - Census P25-1130). See Table 2.1.1.2M-2.27.1.2M
and Appendix F.1-F.2 for 95% confidence intervals for rates. Rates are suppressed and not ranked if the population of a specific
category (race, ethnicity) is less than 50,000 or if deaths are fewer than 16.‡ Data for specified racial or ethnic populations other than white and black should be interpreted with caution. See Technical
Notes.§ Hispanic origin is not mutually exclusive from race categories (white, black, Asian/Pacific Islander, American Indian/Alaska
Native).
Note: ONS — Other Nervous System; NOS — Not Otherwise Specified; IBD — Intrahepatic Bile Duct.

United States Cancer Statistics: 2004 Incidence and Mortality
3��
Figure 3.36.F1: Age-Adjusted Invasive Cancer Incidence Rates for the 10 Primary Siteswith the Highest Rates within Race- and Ethnic-Specific Categories
New Hampshire,∗† Females, 2004
Pancreas
Ovary
Urinary Bladder
Non-Hodgkin Lymphoma
Thyroid
Melanomas of the Skin
Corpus & Uterus, NOS
Colon & Rectum
Lung & Bronchus
Breast
0 50 100 150 200 250 300
11.3
12.9
13.9
16.8
17.0
26.5
28.4
42.7
61.5
127.9
Pancreas
Ovary
Urinary Bladder
Non-Hodgkin Lymphoma
Thyroid
Melanomas of the Skin
Corpus & Uterus, NOS
Colon & Rectum
Lung & Bronchus
Breast
0 50 100 150 200 250 300
10.5
12.0
13.6
17.1
17.3
26.3
28.5
42.4
59.3
128.2
0 50 100 150 200 250 300
Incidence rates were notranked when the populationsize was less than 50,000or case counts were fewerthan 16 in each of the sitecategories.
0 50 100 150 200 250 300
Incidence rates were notranked when the populationsize was less than 50,000or case counts were fewerthan 16 in each of the sitecategories.
0 50 100 150 200 250 300
Incidence rates were notranked when the populationsize was less than 50,000or case counts were fewerthan 16 in each of the sitecategories.
0 50 100 150 200 250 300
Incidence rates were notranked when the populationsize was less than 50,000or case counts were fewerthan 16 in each of the sitecategories.
Rate‡ per 100,000Rate‡ per 100,000
Rate‡ per 100,000Rate‡ per 100,000
Rate‡ per 100,000Rate‡ per 100,000
All Races White
Black Asian/Pacific Islander§
American Indian/Alaska Native§ Hispanic§�
∗ Data are from selected state and metropolitan area cancer registries that meet the data quality criteria for all invasive
cancer sites combined. See Appendix B for data quality criteria and registry-specific data quality information.† Excludes basal and squamous cell carcinomas of the skin except when these occur on the skin of the genital organs, and in
situ cancers except urinary bladder.‡ Rates are age-adjusted to the 2000 U.S. standard population (19 age groups - Census P25-1130). See Table 2.1.1.1F-2.27.1.1F
and Appendix F.1-F.2 for 95% confidence intervals for rates. Rates are suppressed and not ranked if the population of a specific
category (race, ethnicity) is less than 50,000 or if cases are fewer than 16.§ Data for specified racial or ethnic populations other than white and black should be interpreted with caution. See Technical
Notes.� Hispanic origin is not mutually exclusive from race categories (white, black, Asian/Pacific Islander, American Indian/Alaska
Native).
Note: ONS — Other Nervous System; NOS — Not Otherwise Specified; IBD — Intrahepatic Bile Duct. Ovary excludes cancers newly
classified as borderline according to ICD-O-3, beginning with 2001 diagnoses. See Technical Notes.
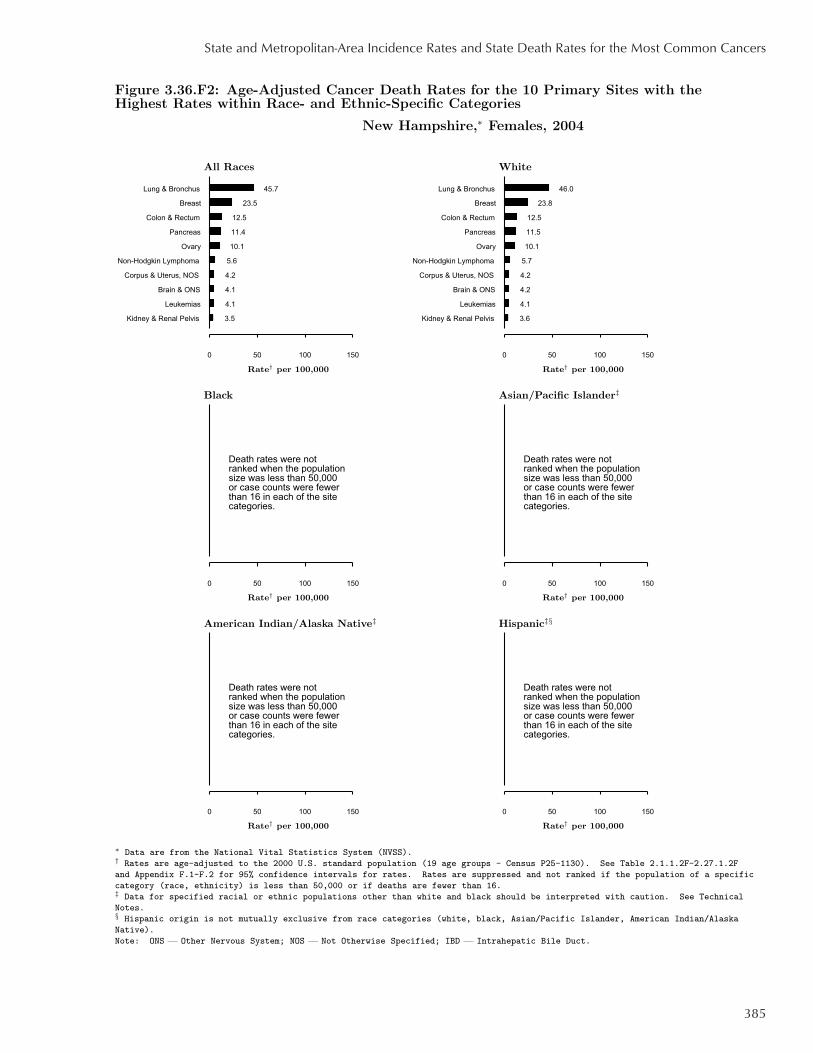
State and Metropolitan-Area Incidence Rates and State Death Rates for the Most Common Cancers
3��
Figure 3.36.F2: Age-Adjusted Cancer Death Rates for the 10 Primary Sites with theHighest Rates within Race- and Ethnic-Specific Categories
New Hampshire,∗ Females, 2004
Kidney & Renal Pelvis
Leukemias
Brain & ONS
Corpus & Uterus, NOS
Non-Hodgkin Lymphoma
Ovary
Pancreas
Colon & Rectum
Breast
Lung & Bronchus
0 50 100 150
3.5
4.1
4.1
4.2
5.6
10.1
11.4
12.5
23.5
45.7
Kidney & Renal Pelvis
Leukemias
Brain & ONS
Corpus & Uterus, NOS
Non-Hodgkin Lymphoma
Ovary
Pancreas
Colon & Rectum
Breast
Lung & Bronchus
0 50 100 150
3.6
4.1
4.2
4.2
5.7
10.1
11.5
12.5
23.8
46.0
0 50 100 150
Death rates were notranked when the populationsize was less than 50,000or case counts were fewerthan 16 in each of the sitecategories.
0 50 100 150
Death rates were notranked when the populationsize was less than 50,000or case counts were fewerthan 16 in each of the sitecategories.
0 50 100 150
Death rates were notranked when the populationsize was less than 50,000or case counts were fewerthan 16 in each of the sitecategories.
0 50 100 150
Death rates were notranked when the populationsize was less than 50,000or case counts were fewerthan 16 in each of the sitecategories.
Rate† per 100,000Rate† per 100,000
Rate† per 100,000Rate† per 100,000
Rate† per 100,000Rate† per 100,000
All Races White
Black Asian/Pacific Islander‡
American Indian/Alaska Native‡ Hispanic‡§
∗ Data are from the National Vital Statistics System (NVSS).† Rates are age-adjusted to the 2000 U.S. standard population (19 age groups - Census P25-1130). See Table 2.1.1.2F-2.27.1.2F
and Appendix F.1-F.2 for 95% confidence intervals for rates. Rates are suppressed and not ranked if the population of a specific
category (race, ethnicity) is less than 50,000 or if deaths are fewer than 16.‡ Data for specified racial or ethnic populations other than white and black should be interpreted with caution. See Technical
Notes.§ Hispanic origin is not mutually exclusive from race categories (white, black, Asian/Pacific Islander, American Indian/Alaska
Native).
Note: ONS — Other Nervous System; NOS — Not Otherwise Specified; IBD — Intrahepatic Bile Duct.

United States Cancer Statistics: 2004 Incidence and Mortality
3��
Figure 3.37.M1: Age-Adjusted Invasive Cancer Incidence Rates for the 10 Primary Siteswith the Highest Rates within Race- and Ethnic-Specific Categories
New Jersey,∗† Males, 2004
Pancreas
Oral Cavity & Pharynx
Leukemias
Kidney & Renal Pelvis
Non-Hodgkin Lymphoma
Melanomas of the Skin
Urinary Bladder
Colon & Rectum
Lung & Bronchus
Prostate
0 50 100 150 200 250 300
13.9
14.1
16.8
20.5
25.0
27.2
48.1
63.2
74.1
157.8
Oral Cavity & Pharynx
Pancreas
Leukemias
Kidney & Renal Pelvis
Non-Hodgkin Lymphoma
Melanomas of the Skin
Urinary Bladder
Colon & Rectum
Lung & Bronchus
Prostate
0 50 100 150 200 250 300
13.6
14.0
16.8
21.4
25.8
30.7
50.9
63.5
74.5
143.6
Liver & IBD
Myeloma
Kidney & Renal Pelvis
Stomach
Non-Hodgkin Lymphoma
Oral Cavity & Pharynx
Urinary Bladder
Colon & Rectum
Lung & Bronchus
Prostate
0 50 100 150 200 250 300
14.1
15.3
16.7
17.1
19.2
22.4
23.8
66.2
85.5
242.6
Kidney & Renal Pelvis
Oral Cavity & Pharynx
Non-Hodgkin Lymphoma
Pancreas
Liver & IBD
Urinary Bladder
Stomach
Lung & Bronchus
Colon & Rectum
Prostate
0 50 100 150 200 250 300
9.1
9.3
10.3
12.8
13.9
18.3
20.4
29.2
30.8
76.3
0 50 100 150 200 250 300
Incidence rates were notranked when the populationsize was less than 50,000or case counts were fewerthan 16 in each of the sitecategories.
Liver & IBD
Pancreas
Oral Cavity & Pharynx
Kidney & Renal Pelvis
Stomach
Non-Hodgkin Lymphoma
Urinary Bladder
Lung & Bronchus
Colon & Rectum
Prostate
0 50 100 150 200 250 300
13.6
13.7
14.3
16.4
20.9
22.9
33.0
62.2
66.1
157.7
Rate‡ per 100,000Rate‡ per 100,000
Rate‡ per 100,000Rate‡ per 100,000
Rate‡ per 100,000Rate‡ per 100,000
All Races White
Black Asian/Pacific Islander§
American Indian/Alaska Native§ Hispanic§�
∗ Data are from selected state and metropolitan area cancer registries that meet the data quality criteria for all invasive
cancer sites combined. See Appendix B for data quality criteria and registry-specific data quality information.† Excludes basal and squamous cell carcinomas of the skin except when these occur on the skin of the genital organs, and in
situ cancers except urinary bladder.‡ Rates are age-adjusted to the 2000 U.S. standard population (19 age groups - Census P25-1130). See Table 2.1.1.1M-2.27.1.1M
and Appendix F.1-F.2 for 95% confidence intervals for rates. Rates are suppressed and not ranked if the population of a specific
category (race, ethnicity) is less than 50,000 or if cases are fewer than 16.§ Data for specified racial or ethnic populations other than white and black should be interpreted with caution. See Technical
Notes.� Hispanic origin is not mutually exclusive from race categories (white, black, Asian/Pacific Islander, American Indian/Alaska
Native).
Note: ONS — Other Nervous System; NOS — Not Otherwise Specified; IBD — Intrahepatic Bile Duct.

State and Metropolitan-Area Incidence Rates and State Death Rates for the Most Common Cancers
3��
Figure 3.37.M2: Age-Adjusted Cancer Death Rates for the 10 Primary Sites with theHighest Rates within Race- and Ethnic-Specific Categories
New Jersey,∗ Males, 2004
Stomach
Esophagus
Liver & IBD
Urinary Bladder
Non-Hodgkin Lymphoma
Leukemias
Pancreas
Colon & Rectum
Prostate
Lung & Bronchus
0 50 100 150
6.8
7.0
7.2
8.3
9.3
9.5
12.7
22.7
23.6
61.1
Stomach
Liver & IBD
Esophagus
Urinary Bladder
Non-Hodgkin Lymphoma
Leukemias
Pancreas
Prostate
Colon & Rectum
Lung & Bronchus
0 50 100 150
6.2
6.5
7.1
8.7
9.7
9.9
12.7
21.1
22.5
60.8
Non-Hodgkin Lymphoma
Myeloma
Leukemias
Esophagus
Stomach
Liver & IBD
Pancreas
Colon & Rectum
Prostate
Lung & Bronchus
0 50 100 150
7.4
7.5
7.6
8.1
11.0
11.6
15.8
28.3
53.7
78.3
Liver & IBD
Stomach
Colon & Rectum
Prostate
Lung & Bronchus
0 50 100 150
9.1
11.2
15.6
16.9
31.9
0 50 100 150
Death rates were notranked when the populationsize was less than 50,000or case counts were fewerthan 16 in each of the sitecategories. Liver & IBD
Pancreas
Non-Hodgkin Lymphoma
Stomach
Colon & Rectum
Prostate
Lung & Bronchus
0 50 100 150
5.9
6.4
6.8
10.7
13.7
14.3
24.4
Rate† per 100,000Rate† per 100,000
Rate† per 100,000Rate† per 100,000
Rate† per 100,000Rate† per 100,000
All Races White
Black Asian/Pacific Islander‡
American Indian/Alaska Native‡ Hispanic‡§
∗ Data are from the National Vital Statistics System (NVSS).† Rates are age-adjusted to the 2000 U.S. standard population (19 age groups - Census P25-1130). See Table 2.1.1.2M-2.27.1.2M
and Appendix F.1-F.2 for 95% confidence intervals for rates. Rates are suppressed and not ranked if the population of a specific
category (race, ethnicity) is less than 50,000 or if deaths are fewer than 16.‡ Data for specified racial or ethnic populations other than white and black should be interpreted with caution. See Technical
Notes.§ Hispanic origin is not mutually exclusive from race categories (white, black, Asian/Pacific Islander, American Indian/Alaska
Native).
Note: ONS — Other Nervous System; NOS — Not Otherwise Specified; IBD — Intrahepatic Bile Duct.

United States Cancer Statistics: 2004 Incidence and Mortality
3��
Figure 3.37.F1: Age-Adjusted Invasive Cancer Incidence Rates for the 10 Primary Siteswith the Highest Rates within Race- and Ethnic-Specific Categories
New Jersey,∗† Females, 2004
Pancreas
Ovary
Urinary Bladder
Melanomas of the Skin
Non-Hodgkin Lymphoma
Thyroid
Corpus & Uterus, NOS
Colon & Rectum
Lung & Bronchus
Breast
0 50 100 150 200 250 300
11.1
13.3
13.4
15.9
17.5
18.8
27.5
45.5
53.8
129.5
Kidney & Renal Pelvis
Ovary
Urinary Bladder
Non-Hodgkin Lymphoma
Melanomas of the Skin
Thyroid
Corpus & Uterus, NOS
Colon & Rectum
Lung & Bronchus
Breast
0 50 100 150 200 250 300
11.2
13.9
14.2
18.0
18.8
20.6
29.1
45.3
54.8
135.8
Urinary Bladder
Myeloma
Ovary
Pancreas
Cervix Uteri
Non-Hodgkin Lymphoma
Corpus & Uterus, NOS
Colon & Rectum
Lung & Bronchus
Breast
0 50 100 150 200 250 300
9.5
9.8
10.1
13.5
14.1
14.7
19.4
48.3
56.2
102.7
Brain & ONS
Leukemias
Non-Hodgkin Lymphoma
Stomach
Ovary
Thyroid
Corpus & Uterus, NOS
Lung & Bronchus
Colon & Rectum
Breast
0 50 100 150 200 250 300
6.6
7.2
7.2
8.4
9.2
15.6
16.8
20.1
21.1
76.9
0 50 100 150 200 250 300
Incidence rates were notranked when the populationsize was less than 50,000or case counts were fewerthan 16 in each of the sitecategories.
Ovary
Pancreas
Stomach
Cervix Uteri
Non-Hodgkin Lymphoma
Thyroid
Corpus & Uterus, NOS
Lung & Bronchus
Colon & Rectum
Breast
0 50 100 150 200 250 300
11.5
13.4
14.2
16.3
18.4
20.2
20.8
37.5
41.0
97.7
Rate‡ per 100,000Rate‡ per 100,000
Rate‡ per 100,000Rate‡ per 100,000
Rate‡ per 100,000Rate‡ per 100,000
All Races White
Black Asian/Pacific Islander§
American Indian/Alaska Native§ Hispanic§�
∗ Data are from selected state and metropolitan area cancer registries that meet the data quality criteria for all invasive
cancer sites combined. See Appendix B for data quality criteria and registry-specific data quality information.† Excludes basal and squamous cell carcinomas of the skin except when these occur on the skin of the genital organs, and in
situ cancers except urinary bladder.‡ Rates are age-adjusted to the 2000 U.S. standard population (19 age groups - Census P25-1130). See Table 2.1.1.1F-2.27.1.1F
and Appendix F.1-F.2 for 95% confidence intervals for rates. Rates are suppressed and not ranked if the population of a specific
category (race, ethnicity) is less than 50,000 or if cases are fewer than 16.§ Data for specified racial or ethnic populations other than white and black should be interpreted with caution. See Technical
Notes.� Hispanic origin is not mutually exclusive from race categories (white, black, Asian/Pacific Islander, American Indian/Alaska
Native).
Note: ONS — Other Nervous System; NOS — Not Otherwise Specified; IBD — Intrahepatic Bile Duct. Ovary excludes cancers newly
classified as borderline according to ICD-O-3, beginning with 2001 diagnoses. See Technical Notes.

State and Metropolitan-Area Incidence Rates and State Death Rates for the Most Common Cancers
3��
Figure 3.37.F2: Age-Adjusted Cancer Death Rates for the 10 Primary Sites with theHighest Rates within Race- and Ethnic-Specific Categories
New Jersey,∗ Females, 2004
Brain & ONS
Liver & IBD
Corpus & Uterus, NOS
Leukemias
Non-Hodgkin Lymphoma
Ovary
Pancreas
Colon & Rectum
Breast
Lung & Bronchus
0 50 100 150
3.3
3.4
4.9
5.7
5.8
8.6
10.1
16.2
25.9
40.1
Liver & IBD
Brain & ONS
Corpus & Uterus, NOS
Leukemias
Non-Hodgkin Lymphoma
Ovary
Pancreas
Colon & Rectum
Breast
Lung & Bronchus
0 50 100 150
3.3
3.6
4.9
5.9
6.2
9.1
10.0
16.2
25.6
41.1
Leukemias
Stomach
Cervix Uteri
Myeloma
Corpus & Uterus, NOS
Ovary
Pancreas
Colon & Rectum
Breast
Lung & Bronchus
0 50 100 150
4.9
5.2
5.2
5.9
6.5
7.1
12.7
18.6
33.1
43.2
Breast
Lung & Bronchus
0 50 100 150
8.9
9.7
0 50 100 150
Death rates were notranked when the populationsize was less than 50,000or case counts were fewerthan 16 in each of the sitecategories.
Liver & IBD
Stomach
Pancreas
Colon & Rectum
Lung & Bronchus
Breast
0 50 100 150
4.9
5.4
8.1
8.8
9.6
12.2
Rate† per 100,000Rate† per 100,000
Rate† per 100,000Rate† per 100,000
Rate† per 100,000Rate† per 100,000
All Races White
Black Asian/Pacific Islander‡
American Indian/Alaska Native‡ Hispanic‡§
∗ Data are from the National Vital Statistics System (NVSS).† Rates are age-adjusted to the 2000 U.S. standard population (19 age groups - Census P25-1130). See Table 2.1.1.2F-2.27.1.2F
and Appendix F.1-F.2 for 95% confidence intervals for rates. Rates are suppressed and not ranked if the population of a specific
category (race, ethnicity) is less than 50,000 or if deaths are fewer than 16.‡ Data for specified racial or ethnic populations other than white and black should be interpreted with caution. See Technical
Notes.§ Hispanic origin is not mutually exclusive from race categories (white, black, Asian/Pacific Islander, American Indian/Alaska
Native).
Note: ONS — Other Nervous System; NOS — Not Otherwise Specified; IBD — Intrahepatic Bile Duct.

United States Cancer Statistics: 2004 Incidence and Mortality
3�0
Figure 3.38.M1: Age-Adjusted Invasive Cancer Incidence Rates for the 10 Primary Siteswith the Highest Rates within Race- and Ethnic-Specific Categories
New Mexico,∗† Males, 2004
Stomach
Leukemias
Oral Cavity & Pharynx
Kidney & Renal Pelvis
Non-Hodgkin Lymphoma
Melanomas of the Skin
Urinary Bladder
Colon & Rectum
Lung & Bronchus
Prostate
0 50 100 150 200 250 300
11.0
14.4
14.7
15.8
16.5
20.0
26.9
51.0
54.3
143.0
Pancreas
Oral Cavity & Pharynx
Leukemias
Kidney & Renal Pelvis
Non-Hodgkin Lymphoma
Melanomas of the Skin
Urinary Bladder
Colon & Rectum
Lung & Bronchus
Prostate
0 50 100 150 200 250 300
11.2
15.3
15.4
15.7
17.7
21.7
29.0
52.2
56.8
148.6
0 50 100 150 200 250 300
Incidence rates were notranked when the populationsize was less than 50,000or case counts were fewerthan 16 in each of the sitecategories.
0 50 100 150 200 250 300
Incidence rates were notranked when the populationsize was less than 50,000or case counts were fewerthan 16 in each of the sitecategories.
Colon & Rectum
Prostate
0 50 100 150 200 250 300
38.4
65.3
Pancreas
Oral Cavity & Pharynx
Non-Hodgkin Lymphoma
Stomach
Kidney & Renal Pelvis
Liver & IBD
Urinary Bladder
Lung & Bronchus
Colon & Rectum
Prostate
0 50 100 150 200 250 300
12.0
12.0
13.4
15.6
16.5
17.3
17.8
39.5
49.3
127.5
Rate‡ per 100,000Rate‡ per 100,000
Rate‡ per 100,000Rate‡ per 100,000
Rate‡ per 100,000Rate‡ per 100,000
All Races White
Black Asian/Pacific Islander§
American Indian/Alaska Native§ Hispanic§�
∗ Data are from selected state and metropolitan area cancer registries that meet the data quality criteria for all invasive
cancer sites combined. See Appendix B for data quality criteria and registry-specific data quality information.† Excludes basal and squamous cell carcinomas of the skin except when these occur on the skin of the genital organs, and in
situ cancers except urinary bladder.‡ Rates are age-adjusted to the 2000 U.S. standard population (19 age groups - Census P25-1130). See Table 2.1.1.1M-2.27.1.1M
and Appendix F.1-F.2 for 95% confidence intervals for rates. Rates are suppressed and not ranked if the population of a specific
category (race, ethnicity) is less than 50,000 or if cases are fewer than 16.§ Data for specified racial or ethnic populations other than white and black should be interpreted with caution. See Technical
Notes.� Hispanic origin is not mutually exclusive from race categories (white, black, Asian/Pacific Islander, American Indian/Alaska
Native).
Note: ONS — Other Nervous System; NOS — Not Otherwise Specified; IBD — Intrahepatic Bile Duct.

State and Metropolitan-Area Incidence Rates and State Death Rates for the Most Common Cancers
3��
Figure 3.38.M2: Age-Adjusted Cancer Death Rates for the 10 Primary Sites with theHighest Rates within Race- and Ethnic-Specific Categories
New Mexico,∗ Males, 2004
Urinary Bladder
Non-Hodgkin Lymphoma
Stomach
Esophagus
Leukemias
Liver & IBD
Pancreas
Colon & Rectum
Prostate
Lung & Bronchus
0 50 100 150
5.4
5.9
7.4
7.4
8.4
9.2
11.3
22.4
24.2
44.7
Urinary Bladder
Non-Hodgkin Lymphoma
Stomach
Esophagus
Leukemias
Liver & IBD
Pancreas
Colon & Rectum
Prostate
Lung & Bronchus
0 50 100 150
5.9
6.1
6.8
7.9
8.5
9.5
11.7
22.3
24.2
46.1
0 50 100 150
Death rates were notranked when the populationsize was less than 50,000or case counts were fewerthan 16 in each of the sitecategories.
0 50 100 150
Death rates were notranked when the populationsize was less than 50,000or case counts were fewerthan 16 in each of the sitecategories.
0 50 100 150
Death rates were notranked when the populationsize was less than 50,000or case counts were fewerthan 16 in each of the sitecategories.
Kidney & Renal Pelvis
Leukemias
Esophagus
Stomach
Pancreas
Liver & IBD
Prostate
Colon & Rectum
Lung & Bronchus
0 50 100 150
6.0
6.0
6.7
9.2
13.0
18.9
21.9
26.8
34.6
Rate† per 100,000Rate† per 100,000
Rate† per 100,000Rate† per 100,000
Rate† per 100,000Rate† per 100,000
All Races White
Black Asian/Pacific Islander‡
American Indian/Alaska Native‡ Hispanic‡§
∗ Data are from the National Vital Statistics System (NVSS).† Rates are age-adjusted to the 2000 U.S. standard population (19 age groups - Census P25-1130). See Table 2.1.1.2M-2.27.1.2M
and Appendix F.1-F.2 for 95% confidence intervals for rates. Rates are suppressed and not ranked if the population of a specific
category (race, ethnicity) is less than 50,000 or if deaths are fewer than 16.‡ Data for specified racial or ethnic populations other than white and black should be interpreted with caution. See Technical
Notes.§ Hispanic origin is not mutually exclusive from race categories (white, black, Asian/Pacific Islander, American Indian/Alaska
Native).
Note: ONS — Other Nervous System; NOS — Not Otherwise Specified; IBD — Intrahepatic Bile Duct.

United States Cancer Statistics: 2004 Incidence and Mortality
3��
Figure 3.38.F1: Age-Adjusted Invasive Cancer Incidence Rates for the 10 Primary Siteswith the Highest Rates within Race- and Ethnic-Specific Categories
New Mexico,∗† Females, 2004
Cervix Uteri
Leukemias
Ovary
Melanomas of the Skin
Non-Hodgkin Lymphoma
Thyroid
Corpus & Uterus, NOS
Colon & Rectum
Lung & Bronchus
Breast
0 50 100 150 200 250 300
9.3
10.5
10.7
12.8
14.5
17.8
19.2
34.4
38.4
108.2
Cervix Uteri
Ovary
Leukemias
Melanomas of the Skin
Non-Hodgkin Lymphoma
Thyroid
Corpus & Uterus, NOS
Colon & Rectum
Lung & Bronchus
Breast
0 50 100 150 200 250 300
9.9
10.6
10.6
14.3
14.5
19.1
19.9
34.4
40.1
114.1
0 50 100 150 200 250 300
Incidence rates were notranked when the populationsize was less than 50,000or case counts were fewerthan 16 in each of the sitecategories.
0 50 100 150 200 250 300
Incidence rates were notranked when the populationsize was less than 50,000or case counts were fewerthan 16 in each of the sitecategories.
Colon & Rectum
Breast
0 50 100 150 200 250 300
35.5
58.3
Pancreas
Kidney & Renal Pelvis
Ovary
Non-Hodgkin Lymphoma
Cervix Uteri
Thyroid
Corpus & Uterus, NOS
Lung & Bronchus
Colon & Rectum
Breast
0 50 100 150 200 250 300
8.8
8.8
9.7
10.4
12.5
16.4
19.3
24.5
31.5
92.7
Rate‡ per 100,000Rate‡ per 100,000
Rate‡ per 100,000Rate‡ per 100,000
Rate‡ per 100,000Rate‡ per 100,000
All Races White
Black Asian/Pacific Islander§
American Indian/Alaska Native§ Hispanic§�
∗ Data are from selected state and metropolitan area cancer registries that meet the data quality criteria for all invasive
cancer sites combined. See Appendix B for data quality criteria and registry-specific data quality information.† Excludes basal and squamous cell carcinomas of the skin except when these occur on the skin of the genital organs, and in
situ cancers except urinary bladder.‡ Rates are age-adjusted to the 2000 U.S. standard population (19 age groups - Census P25-1130). See Table 2.1.1.1F-2.27.1.1F
and Appendix F.1-F.2 for 95% confidence intervals for rates. Rates are suppressed and not ranked if the population of a specific
category (race, ethnicity) is less than 50,000 or if cases are fewer than 16.§ Data for specified racial or ethnic populations other than white and black should be interpreted with caution. See Technical
Notes.� Hispanic origin is not mutually exclusive from race categories (white, black, Asian/Pacific Islander, American Indian/Alaska
Native).
Note: ONS — Other Nervous System; NOS — Not Otherwise Specified; IBD — Intrahepatic Bile Duct. Ovary excludes cancers newly
classified as borderline according to ICD-O-3, beginning with 2001 diagnoses. See Technical Notes.

State and Metropolitan-Area Incidence Rates and State Death Rates for the Most Common Cancers
3�3
Figure 3.38.F2: Age-Adjusted Cancer Death Rates for the 10 Primary Sites with theHighest Rates within Race- and Ethnic-Specific Categories
New Mexico,∗ Females, 2004
Stomach
Corpus & Uterus, NOS
Liver & IBD
Leukemias
Non-Hodgkin Lymphoma
Ovary
Pancreas
Colon & Rectum
Breast
Lung & Bronchus
0 50 100 150
3.5
3.5
4.3
4.4
5.4
6.9
9.0
11.8
23.5
28.9
Urinary Bladder
Corpus & Uterus, NOS
Liver & IBD
Leukemias
Non-Hodgkin Lymphoma
Ovary
Pancreas
Colon & Rectum
Breast
Lung & Bronchus
0 50 100 150
3.6
3.7
3.9
4.6
5.1
6.8
9.6
12.1
24.8
30.5
0 50 100 150
Death rates were notranked when the populationsize was less than 50,000or case counts were fewerthan 16 in each of the sitecategories.
0 50 100 150
Death rates were notranked when the populationsize was less than 50,000or case counts were fewerthan 16 in each of the sitecategories.
0 50 100 150
Death rates were notranked when the populationsize was less than 50,000or case counts were fewerthan 16 in each of the sitecategories.
Leukemias
Liver & IBD
Kidney & Renal Pelvis
Ovary
Stomach
Pancreas
Colon & Rectum
Lung & Bronchus
Breast
0 50 100 150
4.7
4.9
4.9
6.0
6.2
10.7
11.9
17.7
21.2
Rate† per 100,000Rate† per 100,000
Rate† per 100,000Rate† per 100,000
Rate† per 100,000Rate† per 100,000
All Races White
Black Asian/Pacific Islander‡
American Indian/Alaska Native‡ Hispanic‡§
∗ Data are from the National Vital Statistics System (NVSS).† Rates are age-adjusted to the 2000 U.S. standard population (19 age groups - Census P25-1130). See Table 2.1.1.2F-2.27.1.2F
and Appendix F.1-F.2 for 95% confidence intervals for rates. Rates are suppressed and not ranked if the population of a specific
category (race, ethnicity) is less than 50,000 or if deaths are fewer than 16.‡ Data for specified racial or ethnic populations other than white and black should be interpreted with caution. See Technical
Notes.§ Hispanic origin is not mutually exclusive from race categories (white, black, Asian/Pacific Islander, American Indian/Alaska
Native).
Note: ONS — Other Nervous System; NOS — Not Otherwise Specified; IBD — Intrahepatic Bile Duct.

United States Cancer Statistics: 2004 Incidence and Mortality
3��
Figure 3.39.M1: Age-Adjusted Invasive Cancer Incidence Rates for the 10 Primary Siteswith the Highest Rates within Race- and Ethnic-Specific Categories
New York,∗† Males, 2004
Pancreas
Oral Cavity & Pharynx
Leukemias
Melanomas of the Skin
Kidney & Renal Pelvis
Non-Hodgkin Lymphoma
Urinary Bladder
Colon & Rectum
Lung & Bronchus
Prostate
0 50 100 150 200 250 300
13.8
15.0
16.0
17.0
20.3
24.2
42.7
59.5
78.2
153.9
Pancreas
Oral Cavity & Pharynx
Leukemias
Melanomas of the Skin
Kidney & Renal Pelvis
Non-Hodgkin Lymphoma
Urinary Bladder
Colon & Rectum
Lung & Bronchus
Prostate
0 50 100 150 200 250 300
14.2
14.6
17.0
18.7
21.5
25.3
47.2
59.2
79.0
141.8
Pancreas
Kidney & Renal Pelvis
Liver & IBD
Oral Cavity & Pharynx
Stomach
Urinary Bladder
Non-Hodgkin Lymphoma
Colon & Rectum
Lung & Bronchus
Prostate
0 50 100 150 200 250 300
13.2
14.9
15.1
15.8
15.8
16.4
16.5
58.1
77.0
232.4
Leukemias
Kidney & Renal Pelvis
Oral Cavity & Pharynx
Non-Hodgkin Lymphoma
Urinary Bladder
Liver & IBD
Stomach
Colon & Rectum
Prostate
Lung & Bronchus
0 50 100 150 200 250 300
8.9
10.0
11.0
11.7
11.9
23.7
24.0
42.2
53.9
56.2
Prostate
0 50 100 150 200 250 300
46.2
Pancreas
Kidney & Renal Pelvis
Oral Cavity & Pharynx
Stomach
Liver & IBD
Urinary Bladder
Non-Hodgkin Lymphoma
Lung & Bronchus
Colon & Rectum
Prostate
0 50 100 150 200 250 300
13.1
13.5
14.7
16.9
20.0
21.6
24.6
49.4
57.9
151.8
Rate‡ per 100,000Rate‡ per 100,000
Rate‡ per 100,000Rate‡ per 100,000
Rate‡ per 100,000Rate‡ per 100,000
All Races White
Black Asian/Pacific Islander§
American Indian/Alaska Native§ Hispanic§�
∗ Data are from selected state and metropolitan area cancer registries that meet the data quality criteria for all invasive
cancer sites combined. See Appendix B for data quality criteria and registry-specific data quality information.† Excludes basal and squamous cell carcinomas of the skin except when these occur on the skin of the genital organs, and in
situ cancers except urinary bladder.‡ Rates are age-adjusted to the 2000 U.S. standard population (19 age groups - Census P25-1130). See Table 2.1.1.1M-2.27.1.1M
and Appendix F.1-F.2 for 95% confidence intervals for rates. Rates are suppressed and not ranked if the population of a specific
category (race, ethnicity) is less than 50,000 or if cases are fewer than 16.§ Data for specified racial or ethnic populations other than white and black should be interpreted with caution. See Technical
Notes.� Hispanic origin is not mutually exclusive from race categories (white, black, Asian/Pacific Islander, American Indian/Alaska
Native).
Note: ONS — Other Nervous System; NOS — Not Otherwise Specified; IBD — Intrahepatic Bile Duct.
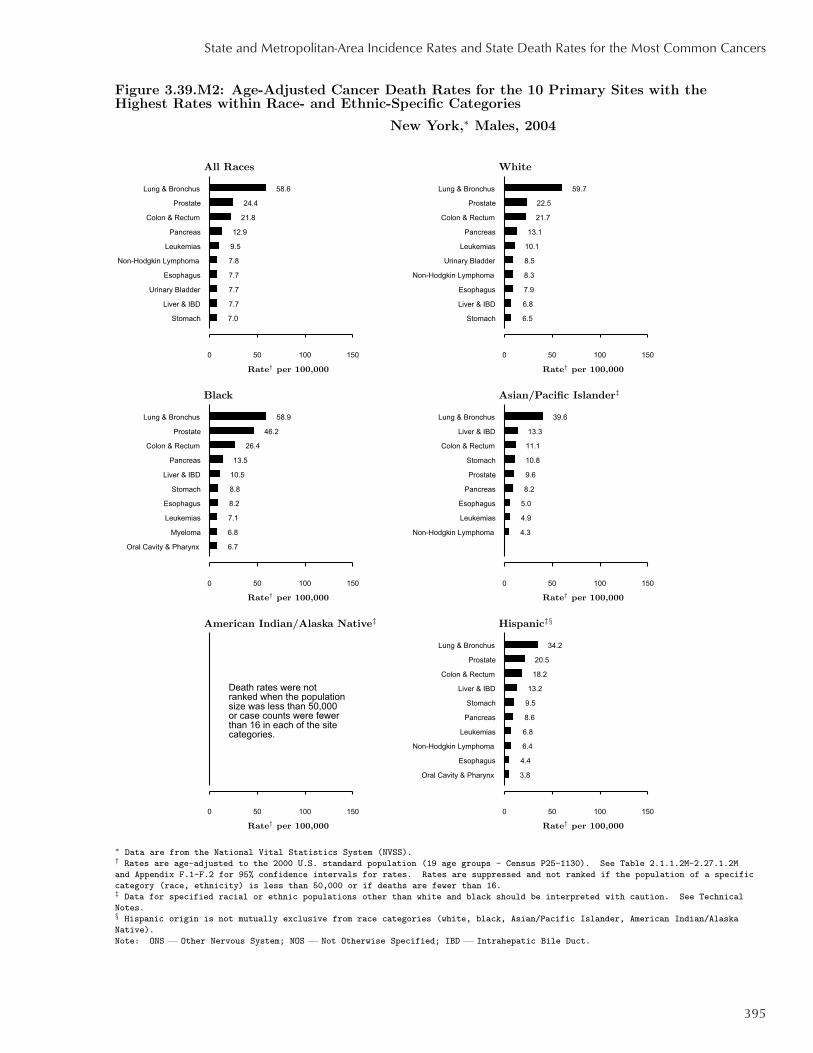
State and Metropolitan-Area Incidence Rates and State Death Rates for the Most Common Cancers
3��
Figure 3.39.M2: Age-Adjusted Cancer Death Rates for the 10 Primary Sites with theHighest Rates within Race- and Ethnic-Specific Categories
New York,∗ Males, 2004
Stomach
Liver & IBD
Urinary Bladder
Esophagus
Non-Hodgkin Lymphoma
Leukemias
Pancreas
Colon & Rectum
Prostate
Lung & Bronchus
0 50 100 150
7.0
7.7
7.7
7.7
7.8
9.5
12.9
21.8
24.4
58.6
Stomach
Liver & IBD
Esophagus
Non-Hodgkin Lymphoma
Urinary Bladder
Leukemias
Pancreas
Colon & Rectum
Prostate
Lung & Bronchus
0 50 100 150
6.5
6.8
7.9
8.3
8.5
10.1
13.1
21.7
22.5
59.7
Oral Cavity & Pharynx
Myeloma
Leukemias
Esophagus
Stomach
Liver & IBD
Pancreas
Colon & Rectum
Prostate
Lung & Bronchus
0 50 100 150
6.7
6.8
7.1
8.2
8.8
10.5
13.5
26.4
46.2
58.9
Non-Hodgkin Lymphoma
Leukemias
Esophagus
Pancreas
Prostate
Stomach
Colon & Rectum
Liver & IBD
Lung & Bronchus
0 50 100 150
4.3
4.9
5.0
8.2
9.6
10.8
11.1
13.3
39.6
0 50 100 150
Death rates were notranked when the populationsize was less than 50,000or case counts were fewerthan 16 in each of the sitecategories.
Oral Cavity & Pharynx
Esophagus
Non-Hodgkin Lymphoma
Leukemias
Pancreas
Stomach
Liver & IBD
Colon & Rectum
Prostate
Lung & Bronchus
0 50 100 150
3.8
4.4
6.4
6.8
8.6
9.5
13.2
18.2
20.5
34.2
Rate† per 100,000Rate† per 100,000
Rate† per 100,000Rate† per 100,000
Rate† per 100,000Rate† per 100,000
All Races White
Black Asian/Pacific Islander‡
American Indian/Alaska Native‡ Hispanic‡§
∗ Data are from the National Vital Statistics System (NVSS).† Rates are age-adjusted to the 2000 U.S. standard population (19 age groups - Census P25-1130). See Table 2.1.1.2M-2.27.1.2M
and Appendix F.1-F.2 for 95% confidence intervals for rates. Rates are suppressed and not ranked if the population of a specific
category (race, ethnicity) is less than 50,000 or if deaths are fewer than 16.‡ Data for specified racial or ethnic populations other than white and black should be interpreted with caution. See Technical
Notes.§ Hispanic origin is not mutually exclusive from race categories (white, black, Asian/Pacific Islander, American Indian/Alaska
Native).
Note: ONS — Other Nervous System; NOS — Not Otherwise Specified; IBD — Intrahepatic Bile Duct.

United States Cancer Statistics: 2004 Incidence and Mortality
3��
Figure 3.39.F1: Age-Adjusted Invasive Cancer Incidence Rates for the 10 Primary Siteswith the Highest Rates within Race- and Ethnic-Specific Categories
New York,∗† Females, 2004
Melanomas of the Skin
Urinary Bladder
Pancreas
Ovary
Thyroid
Non-Hodgkin Lymphoma
Corpus & Uterus, NOS
Colon & Rectum
Lung & Bronchus
Breast
0 50 100 150 200 250 300
11.2
11.2
11.2
14.0
15.6
16.4
28.6
46.0
53.2
122.8
Pancreas
Melanomas of the Skin
Urinary Bladder
Ovary
Thyroid
Non-Hodgkin Lymphoma
Corpus & Uterus, NOS
Colon & Rectum
Lung & Bronchus
Breast
0 50 100 150 200 250 300
11.3
12.1
12.4
14.7
16.7
17.6
29.5
45.5
57.0
125.6
Myeloma
Stomach
Ovary
Non-Hodgkin Lymphoma
Pancreas
Cervix Uteri
Corpus & Uterus, NOS
Lung & Bronchus
Colon & Rectum
Breast
0 50 100 150 200 250 300
9.0
9.4
10.0
10.5
11.8
11.8
24.7
40.1
46.3
99.4
Liver & IBD
Non-Hodgkin Lymphoma
Stomach
Cervix Uteri
Ovary
Corpus & Uterus, NOS
Thyroid
Lung & Bronchus
Colon & Rectum
Breast
0 50 100 150 200 250 300
7.2
7.8
8.4
9.7
10.5
16.1
16.7
24.3
34.5
72.9
0 50 100 150 200 250 300
Incidence rates were notranked when the populationsize was less than 50,000or case counts were fewerthan 16 in each of the sitecategories.
Stomach
Kidney & Renal Pelvis
Cervix Uteri
Ovary
Thyroid
Non-Hodgkin Lymphoma
Corpus & Uterus, NOS
Lung & Bronchus
Colon & Rectum
Breast
0 50 100 150 200 250 300
9.0
9.4
10.9
11.8
14.0
14.4
22.2
27.3
41.6
89.8
Rate‡ per 100,000Rate‡ per 100,000
Rate‡ per 100,000Rate‡ per 100,000
Rate‡ per 100,000Rate‡ per 100,000
All Races White
Black Asian/Pacific Islander§
American Indian/Alaska Native§ Hispanic§�
∗ Data are from selected state and metropolitan area cancer registries that meet the data quality criteria for all invasive
cancer sites combined. See Appendix B for data quality criteria and registry-specific data quality information.† Excludes basal and squamous cell carcinomas of the skin except when these occur on the skin of the genital organs, and in
situ cancers except urinary bladder.‡ Rates are age-adjusted to the 2000 U.S. standard population (19 age groups - Census P25-1130). See Table 2.1.1.1F-2.27.1.1F
and Appendix F.1-F.2 for 95% confidence intervals for rates. Rates are suppressed and not ranked if the population of a specific
category (race, ethnicity) is less than 50,000 or if cases are fewer than 16.§ Data for specified racial or ethnic populations other than white and black should be interpreted with caution. See Technical
Notes.� Hispanic origin is not mutually exclusive from race categories (white, black, Asian/Pacific Islander, American Indian/Alaska
Native).
Note: ONS — Other Nervous System; NOS — Not Otherwise Specified; IBD — Intrahepatic Bile Duct. Ovary excludes cancers newly
classified as borderline according to ICD-O-3, beginning with 2001 diagnoses. See Technical Notes.

State and Metropolitan-Area Incidence Rates and State Death Rates for the Most Common Cancers
3��
Figure 3.39.F2: Age-Adjusted Cancer Death Rates for the 10 Primary Sites with theHighest Rates within Race- and Ethnic-Specific Categories
New York,∗ Females, 2004
Liver & IBD
Stomach
Corpus & Uterus, NOS
Non-Hodgkin Lymphoma
Leukemias
Ovary
Pancreas
Colon & Rectum
Breast
Lung & Bronchus
0 50 100 150
3.4
3.9
4.7
5.4
5.4
8.5
9.6
15.7
24.3
37.2
Brain & ONS
Stomach
Corpus & Uterus, NOS
Leukemias
Non-Hodgkin Lymphoma
Ovary
Pancreas
Colon & Rectum
Breast
Lung & Bronchus
0 50 100 150
3.4
3.5
4.4
5.9
5.9
9.2
9.8
15.5
24.3
40.0
Leukemias
Myeloma
Liver & IBD
Stomach
Ovary
Corpus & Uterus, NOS
Pancreas
Colon & Rectum
Breast
Lung & Bronchus
0 50 100 150
4.1
4.6
4.9
5.5
6.4
7.6
9.8
18.0
27.7
28.4
Liver & IBD
Ovary
Pancreas
Stomach
Colon & Rectum
Breast
Lung & Bronchus
0 50 100 150
3.4
4.3
5.7
7.4
10.0
12.0
15.2
0 50 100 150
Death rates were notranked when the populationsize was less than 50,000or case counts were fewerthan 16 in each of the sitecategories.
Leukemias
Corpus & Uterus, NOS
Non-Hodgkin Lymphoma
Liver & IBD
Stomach
Ovary
Pancreas
Colon & Rectum
Lung & Bronchus
Breast
0 50 100 150
3.1
3.2
3.8
4.0
5.6
5.6
5.8
12.8
14.1
16.9
Rate† per 100,000Rate† per 100,000
Rate† per 100,000Rate† per 100,000
Rate† per 100,000Rate† per 100,000
All Races White
Black Asian/Pacific Islander‡
American Indian/Alaska Native‡ Hispanic‡§
∗ Data are from the National Vital Statistics System (NVSS).† Rates are age-adjusted to the 2000 U.S. standard population (19 age groups - Census P25-1130). See Table 2.1.1.2F-2.27.1.2F
and Appendix F.1-F.2 for 95% confidence intervals for rates. Rates are suppressed and not ranked if the population of a specific
category (race, ethnicity) is less than 50,000 or if deaths are fewer than 16.‡ Data for specified racial or ethnic populations other than white and black should be interpreted with caution. See Technical
Notes.§ Hispanic origin is not mutually exclusive from race categories (white, black, Asian/Pacific Islander, American Indian/Alaska
Native).
Note: ONS — Other Nervous System; NOS — Not Otherwise Specified; IBD — Intrahepatic Bile Duct.

United States Cancer Statistics: 2004 Incidence and Mortality
3��
Figure 3.40.M1: Age-Adjusted Invasive Cancer Incidence Rates for the 10 Primary Siteswith the Highest Rates within Race- and Ethnic-Specific Categories
North Carolina,∗† Males, 2004
Pancreas
Leukemias
Oral Cavity & Pharynx
Non-Hodgkin Lymphoma
Melanomas of the Skin
Kidney & Renal Pelvis
Urinary Bladder
Colon & Rectum
Lung & Bronchus
Prostate
0 50 100 150 200 250 300
13.0
13.3
17.5
20.5
22.1
22.8
36.4
54.1
99.7
148.8
Pancreas
Leukemias
Oral Cavity & Pharynx
Non-Hodgkin Lymphoma
Kidney & Renal Pelvis
Melanomas of the Skin
Urinary Bladder
Colon & Rectum
Lung & Bronchus
Prostate
0 50 100 150 200 250 300
12.4
14.0
16.3
21.3
22.4
26.4
39.3
52.3
98.3
131.2
Myeloma
Stomach
Non-Hodgkin Lymphoma
Pancreas
Urinary Bladder
Oral Cavity & Pharynx
Kidney & Renal Pelvis
Colon & Rectum
Lung & Bronchus
Prostate
0 50 100 150 200 250 300
13.8
14.9
15.3
15.7
21.3
22.8
23.8
64.6
107.0
239.0
Lung & Bronchus
Prostate
0 50 100 150 200 250 300
54.2
62.5
Colon & Rectum
Lung & Bronchus
Prostate
0 50 100 150 200 250 300
47.9
94.8
144.9
Testis
Colon & Rectum
Lung & Bronchus
Prostate
0 50 100 150 200 250 300
3.9
36.1
36.5
63.0
Rate‡ per 100,000Rate‡ per 100,000
Rate‡ per 100,000Rate‡ per 100,000
Rate‡ per 100,000Rate‡ per 100,000
All Races White
Black Asian/Pacific Islander§
American Indian/Alaska Native§ Hispanic§�
∗ Data are from selected state and metropolitan area cancer registries that meet the data quality criteria for all invasive
cancer sites combined. See Appendix B for data quality criteria and registry-specific data quality information.† Excludes basal and squamous cell carcinomas of the skin except when these occur on the skin of the genital organs, and in
situ cancers except urinary bladder.‡ Rates are age-adjusted to the 2000 U.S. standard population (19 age groups - Census P25-1130). See Table 2.1.1.1M-2.27.1.1M
and Appendix F.1-F.2 for 95% confidence intervals for rates. Rates are suppressed and not ranked if the population of a specific
category (race, ethnicity) is less than 50,000 or if cases are fewer than 16.§ Data for specified racial or ethnic populations other than white and black should be interpreted with caution. See Technical
Notes.� Hispanic origin is not mutually exclusive from race categories (white, black, Asian/Pacific Islander, American Indian/Alaska
Native).
Note: ONS — Other Nervous System; NOS — Not Otherwise Specified; IBD — Intrahepatic Bile Duct.

State and Metropolitan-Area Incidence Rates and State Death Rates for the Most Common Cancers
3��
Figure 3.40.M2: Age-Adjusted Cancer Death Rates for the 10 Primary Sites with theHighest Rates within Race- and Ethnic-Specific Categories
North Carolina,∗ Males, 2004
Liver & IBD
Kidney & Renal Pelvis
Urinary Bladder
Esophagus
Non-Hodgkin Lymphoma
Leukemias
Pancreas
Colon & Rectum
Prostate
Lung & Bronchus
0 50 100 150
6.3
6.3
7.0
7.4
8.7
9.2
13.4
21.4
29.1
84.3
Kidney & Renal Pelvis
Liver & IBD
Esophagus
Urinary Bladder
Non-Hodgkin Lymphoma
Leukemias
Pancreas
Colon & Rectum
Prostate
Lung & Bronchus
0 50 100 150
6.2
6.3
6.9
7.5
9.2
9.4
12.8
20.5
23.2
82.4
Oral Cavity & Pharynx
Kidney & Renal Pelvis
Leukemias
Stomach
Esophagus
Myeloma
Pancreas
Colon & Rectum
Prostate
Lung & Bronchus
0 50 100 150
6.5
6.6
8.1
10.2
10.3
10.4
17.1
26.7
64.8
93.9
0 50 100 150
Death rates were notranked when the populationsize was less than 50,000or case counts were fewerthan 16 in each of the sitecategories.
Lung & Bronchus
0 50 100 150
107.4
0 50 100 150
Death rates were notranked when the populationsize was less than 50,000or case counts were fewerthan 16 in each of the sitecategories.
Rate† per 100,000Rate† per 100,000
Rate† per 100,000Rate† per 100,000
Rate† per 100,000Rate† per 100,000
All Races White
Black Asian/Pacific Islander‡
American Indian/Alaska Native‡ Hispanic‡§
∗ Data are from the National Vital Statistics System (NVSS).† Rates are age-adjusted to the 2000 U.S. standard population (19 age groups - Census P25-1130). See Table 2.1.1.2M-2.27.1.2M
and Appendix F.1-F.2 for 95% confidence intervals for rates. Rates are suppressed and not ranked if the population of a specific
category (race, ethnicity) is less than 50,000 or if deaths are fewer than 16.‡ Data for specified racial or ethnic populations other than white and black should be interpreted with caution. See Technical
Notes.§ Hispanic origin is not mutually exclusive from race categories (white, black, Asian/Pacific Islander, American Indian/Alaska
Native).
Note: ONS — Other Nervous System; NOS — Not Otherwise Specified; IBD — Intrahepatic Bile Duct.

United States Cancer Statistics: 2004 Incidence and Mortality
�00
Figure 3.40.F1: Age-Adjusted Invasive Cancer Incidence Rates for the 10 Primary Siteswith the Highest Rates within Race- and Ethnic-Specific Categories
North Carolina,∗† Females, 2004
Pancreas
Kidney & Renal Pelvis
Ovary
Thyroid
Melanomas of the Skin
Non-Hodgkin Lymphoma
Corpus & Uterus, NOS
Colon & Rectum
Lung & Bronchus
Breast
0 50 100 150 200 250 300
9.5
10.2
11.0
11.6
13.2
16.0
20.9
41.2
53.6
115.8
Kidney & Renal Pelvis
Urinary Bladder
Ovary
Thyroid
Non-Hodgkin Lymphoma
Melanomas of the Skin
Corpus & Uterus, NOS
Colon & Rectum
Lung & Bronchus
Breast
0 50 100 150 200 250 300
10.0
10.1
12.0
12.2
16.5
16.7
21.0
38.7
57.1
116.4
Leukemias
Thyroid
Cervix Uteri
Kidney & Renal Pelvis
Pancreas
Non-Hodgkin Lymphoma
Corpus & Uterus, NOS
Lung & Bronchus
Colon & Rectum
Breast
0 50 100 150 200 250 300
8.8
8.8
10.7
11.1
12.8
13.0
21.2
39.0
51.4
114.8 Breast
0 50 100 150 200 250 300
47.9
Lung & Bronchus
Breast
0 50 100 150 200 250 300
48.0
77.9
Thyroid
Cervix Uteri
Colon & Rectum
Breast
0 50 100 150 200 250 300
13.8
25.9
27.7
85.8
Rate‡ per 100,000Rate‡ per 100,000
Rate‡ per 100,000Rate‡ per 100,000
Rate‡ per 100,000Rate‡ per 100,000
All Races White
Black Asian/Pacific Islander§
American Indian/Alaska Native§ Hispanic§�
∗ Data are from selected state and metropolitan area cancer registries that meet the data quality criteria for all invasive
cancer sites combined. See Appendix B for data quality criteria and registry-specific data quality information.† Excludes basal and squamous cell carcinomas of the skin except when these occur on the skin of the genital organs, and in
situ cancers except urinary bladder.‡ Rates are age-adjusted to the 2000 U.S. standard population (19 age groups - Census P25-1130). See Table 2.1.1.1F-2.27.1.1F
and Appendix F.1-F.2 for 95% confidence intervals for rates. Rates are suppressed and not ranked if the population of a specific
category (race, ethnicity) is less than 50,000 or if cases are fewer than 16.§ Data for specified racial or ethnic populations other than white and black should be interpreted with caution. See Technical
Notes.� Hispanic origin is not mutually exclusive from race categories (white, black, Asian/Pacific Islander, American Indian/Alaska
Native).
Note: ONS — Other Nervous System; NOS — Not Otherwise Specified; IBD — Intrahepatic Bile Duct. Ovary excludes cancers newly
classified as borderline according to ICD-O-3, beginning with 2001 diagnoses. See Technical Notes.
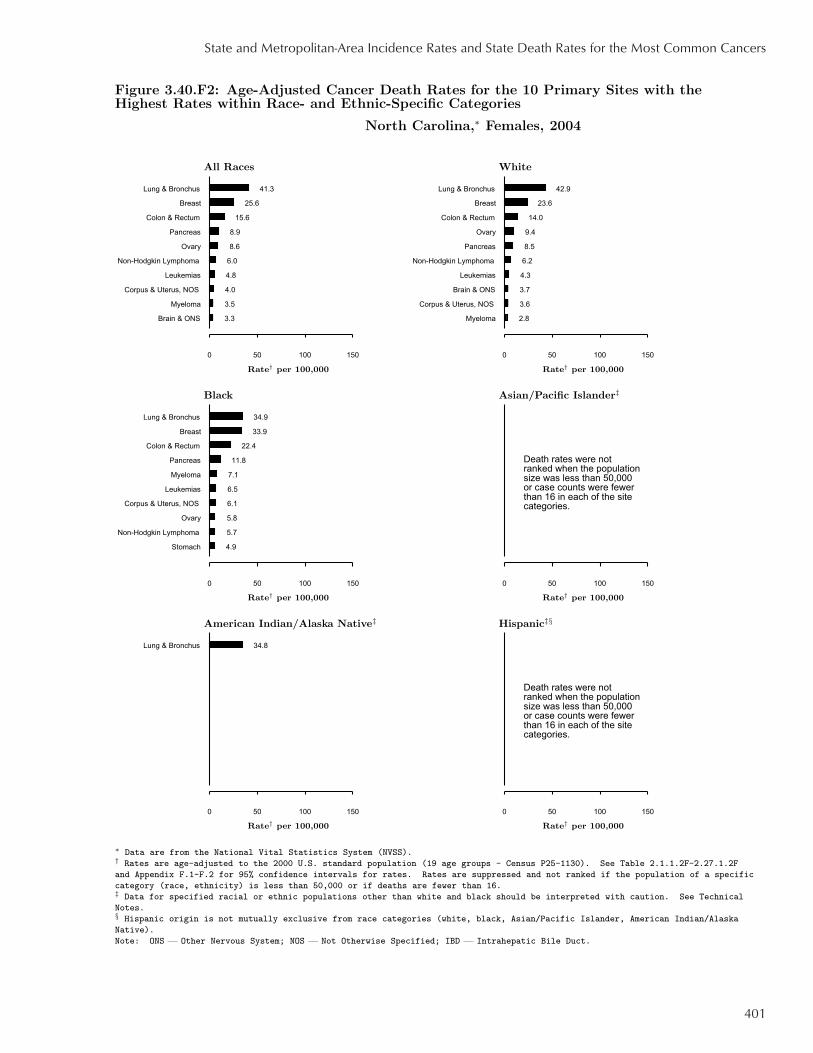
State and Metropolitan-Area Incidence Rates and State Death Rates for the Most Common Cancers
�0�
Figure 3.40.F2: Age-Adjusted Cancer Death Rates for the 10 Primary Sites with theHighest Rates within Race- and Ethnic-Specific Categories
North Carolina,∗ Females, 2004
Brain & ONS
Myeloma
Corpus & Uterus, NOS
Leukemias
Non-Hodgkin Lymphoma
Ovary
Pancreas
Colon & Rectum
Breast
Lung & Bronchus
0 50 100 150
3.3
3.5
4.0
4.8
6.0
8.6
8.9
15.6
25.6
41.3
Myeloma
Corpus & Uterus, NOS
Brain & ONS
Leukemias
Non-Hodgkin Lymphoma
Pancreas
Ovary
Colon & Rectum
Breast
Lung & Bronchus
0 50 100 150
2.8
3.6
3.7
4.3
6.2
8.5
9.4
14.0
23.6
42.9
Stomach
Non-Hodgkin Lymphoma
Ovary
Corpus & Uterus, NOS
Leukemias
Myeloma
Pancreas
Colon & Rectum
Breast
Lung & Bronchus
0 50 100 150
4.9
5.7
5.8
6.1
6.5
7.1
11.8
22.4
33.9
34.9
0 50 100 150
Death rates were notranked when the populationsize was less than 50,000or case counts were fewerthan 16 in each of the sitecategories.
Lung & Bronchus
0 50 100 150
34.8
0 50 100 150
Death rates were notranked when the populationsize was less than 50,000or case counts were fewerthan 16 in each of the sitecategories.
Rate† per 100,000Rate† per 100,000
Rate† per 100,000Rate† per 100,000
Rate† per 100,000Rate† per 100,000
All Races White
Black Asian/Pacific Islander‡
American Indian/Alaska Native‡ Hispanic‡§
∗ Data are from the National Vital Statistics System (NVSS).† Rates are age-adjusted to the 2000 U.S. standard population (19 age groups - Census P25-1130). See Table 2.1.1.2F-2.27.1.2F
and Appendix F.1-F.2 for 95% confidence intervals for rates. Rates are suppressed and not ranked if the population of a specific
category (race, ethnicity) is less than 50,000 or if deaths are fewer than 16.‡ Data for specified racial or ethnic populations other than white and black should be interpreted with caution. See Technical
Notes.§ Hispanic origin is not mutually exclusive from race categories (white, black, Asian/Pacific Islander, American Indian/Alaska
Native).
Note: ONS — Other Nervous System; NOS — Not Otherwise Specified; IBD — Intrahepatic Bile Duct.

United States Cancer Statistics: 2004 Incidence and Mortality
�0�
Figure 3.41.M1: Age-Adjusted Invasive Cancer Incidence Rates for the 10 Primary Siteswith the Highest Rates within Race- and Ethnic-Specific Categories
North Dakota,∗† Males, 2004
Pancreas
Melanomas of the Skin
Oral Cavity & Pharynx
Leukemias
Kidney & Renal Pelvis
Non-Hodgkin Lymphoma
Urinary Bladder
Colon & Rectum
Lung & Bronchus
Prostate
0 50 100 150 200 250 300
10.7
14.6
15.1
15.5
19.5
25.7
37.0
68.0
69.2
152.1
Pancreas
Leukemias
Melanomas of the Skin
Oral Cavity & Pharynx
Kidney & Renal Pelvis
Non-Hodgkin Lymphoma
Urinary Bladder
Lung & Bronchus
Colon & Rectum
Prostate
0 50 100 150 200 250 300
10.4
14.8
15.1
15.3
18.5
25.8
37.2
67.1
67.5
151.7
0 50 100 150 200 250 300
Incidence rates were notranked when the populationsize was less than 50,000or case counts were fewerthan 16 in each of the sitecategories.
0 50 100 150 200 250 300
Incidence rates were notranked when the populationsize was less than 50,000or case counts were fewerthan 16 in each of the sitecategories.
0 50 100 150 200 250 300
Incidence rates were notranked when the populationsize was less than 50,000or case counts were fewerthan 16 in each of the sitecategories.
0 50 100 150 200 250 300
Incidence rates were notranked when the populationsize was less than 50,000or case counts were fewerthan 16 in each of the sitecategories.
Rate‡ per 100,000Rate‡ per 100,000
Rate‡ per 100,000Rate‡ per 100,000
Rate‡ per 100,000Rate‡ per 100,000
All Races White
Black Asian/Pacific Islander§
American Indian/Alaska Native§ Hispanic§�
∗ Data are from selected state and metropolitan area cancer registries that meet the data quality criteria for all invasive
cancer sites combined. See Appendix B for data quality criteria and registry-specific data quality information.† Excludes basal and squamous cell carcinomas of the skin except when these occur on the skin of the genital organs, and in
situ cancers except urinary bladder.‡ Rates are age-adjusted to the 2000 U.S. standard population (19 age groups - Census P25-1130). See Table 2.1.1.1M-2.27.1.1M
and Appendix F.1-F.2 for 95% confidence intervals for rates. Rates are suppressed and not ranked if the population of a specific
category (race, ethnicity) is less than 50,000 or if cases are fewer than 16.§ Data for specified racial or ethnic populations other than white and black should be interpreted with caution. See Technical
Notes.� Hispanic origin is not mutually exclusive from race categories (white, black, Asian/Pacific Islander, American Indian/Alaska
Native).
Note: ONS — Other Nervous System; NOS — Not Otherwise Specified; IBD — Intrahepatic Bile Duct.

State and Metropolitan-Area Incidence Rates and State Death Rates for the Most Common Cancers
�03
Figure 3.41.M2: Age-Adjusted Cancer Death Rates for the 10 Primary Sites with theHighest Rates within Race- and Ethnic-Specific Categories
North Dakota,∗ Males, 2004
Myeloma
Leukemias
Non-Hodgkin Lymphoma
Kidney & Renal Pelvis
Esophagus
Urinary Bladder
Pancreas
Colon & Rectum
Prostate
Lung & Bronchus
0 50 100 150
6.0
6.0
7.4
7.5
7.7
8.1
9.2
19.7
27.8
66.7
Brain & ONS
Leukemias
Non-Hodgkin Lymphoma
Esophagus
Kidney & Renal Pelvis
Urinary Bladder
Pancreas
Colon & Rectum
Prostate
Lung & Bronchus
0 50 100 150
6.1
6.2
6.9
7.2
7.6
8.2
8.7
19.7
28.2
66.1
0 50 100 150
Death rates were notranked when the populationsize was less than 50,000or case counts were fewerthan 16 in each of the sitecategories.
0 50 100 150
Death rates were notranked when the populationsize was less than 50,000or case counts were fewerthan 16 in each of the sitecategories.
0 50 100 150
Death rates were notranked when the populationsize was less than 50,000or case counts were fewerthan 16 in each of the sitecategories.
0 50 100 150
Death rates were notranked when the populationsize was less than 50,000or case counts were fewerthan 16 in each of the sitecategories.
Rate† per 100,000Rate† per 100,000
Rate† per 100,000Rate† per 100,000
Rate† per 100,000Rate† per 100,000
All Races White
Black Asian/Pacific Islander‡
American Indian/Alaska Native‡ Hispanic‡§
∗ Data are from the National Vital Statistics System (NVSS).† Rates are age-adjusted to the 2000 U.S. standard population (19 age groups - Census P25-1130). See Table 2.1.1.2M-2.27.1.2M
and Appendix F.1-F.2 for 95% confidence intervals for rates. Rates are suppressed and not ranked if the population of a specific
category (race, ethnicity) is less than 50,000 or if deaths are fewer than 16.‡ Data for specified racial or ethnic populations other than white and black should be interpreted with caution. See Technical
Notes.§ Hispanic origin is not mutually exclusive from race categories (white, black, Asian/Pacific Islander, American Indian/Alaska
Native).
Note: ONS — Other Nervous System; NOS — Not Otherwise Specified; IBD — Intrahepatic Bile Duct.

United States Cancer Statistics: 2004 Incidence and Mortality
�0�
Figure 3.41.F1: Age-Adjusted Invasive Cancer Incidence Rates for the 10 Primary Siteswith the Highest Rates within Race- and Ethnic-Specific Categories
North Dakota,∗† Females, 2004
Kidney & Renal Pelvis
Pancreas
Ovary
Melanomas of the Skin
Non-Hodgkin Lymphoma
Thyroid
Corpus & Uterus, NOS
Colon & Rectum
Lung & Bronchus
Breast
0 50 100 150 200 250 300
9.7
11.6
12.0
12.6
16.1
16.1
27.1
40.0
47.4
121.2
Kidney & Renal Pelvis
Pancreas
Ovary
Melanomas of the Skin
Thyroid
Non-Hodgkin Lymphoma
Corpus & Uterus, NOS
Colon & Rectum
Lung & Bronchus
Breast
0 50 100 150 200 250 300
10.0
11.3
12.1
13.4
15.4
15.8
27.1
39.4
45.2
120.1
0 50 100 150 200 250 300
Incidence rates were notranked when the populationsize was less than 50,000or case counts were fewerthan 16 in each of the sitecategories.
0 50 100 150 200 250 300
Incidence rates were notranked when the populationsize was less than 50,000or case counts were fewerthan 16 in each of the sitecategories.
0 50 100 150 200 250 300
Incidence rates were notranked when the populationsize was less than 50,000or case counts were fewerthan 16 in each of the sitecategories.
0 50 100 150 200 250 300
Incidence rates were notranked when the populationsize was less than 50,000or case counts were fewerthan 16 in each of the sitecategories.
Rate‡ per 100,000Rate‡ per 100,000
Rate‡ per 100,000Rate‡ per 100,000
Rate‡ per 100,000Rate‡ per 100,000
All Races White
Black Asian/Pacific Islander§
American Indian/Alaska Native§ Hispanic§�
∗ Data are from selected state and metropolitan area cancer registries that meet the data quality criteria for all invasive
cancer sites combined. See Appendix B for data quality criteria and registry-specific data quality information.† Excludes basal and squamous cell carcinomas of the skin except when these occur on the skin of the genital organs, and in
situ cancers except urinary bladder.‡ Rates are age-adjusted to the 2000 U.S. standard population (19 age groups - Census P25-1130). See Table 2.1.1.1F-2.27.1.1F
and Appendix F.1-F.2 for 95% confidence intervals for rates. Rates are suppressed and not ranked if the population of a specific
category (race, ethnicity) is less than 50,000 or if cases are fewer than 16.§ Data for specified racial or ethnic populations other than white and black should be interpreted with caution. See Technical
Notes.� Hispanic origin is not mutually exclusive from race categories (white, black, Asian/Pacific Islander, American Indian/Alaska
Native).
Note: ONS — Other Nervous System; NOS — Not Otherwise Specified; IBD — Intrahepatic Bile Duct. Ovary excludes cancers newly
classified as borderline according to ICD-O-3, beginning with 2001 diagnoses. See Technical Notes.

State and Metropolitan-Area Incidence Rates and State Death Rates for the Most Common Cancers
�0�
Figure 3.41.F2: Age-Adjusted Cancer Death Rates for the 10 Primary Sites with theHighest Rates within Race- and Ethnic-Specific Categories
North Dakota,∗ Females, 2004
Liver & IBD
Kidney & Renal Pelvis
Corpus & Uterus, NOS
Non-Hodgkin Lymphoma
Ovary
Pancreas
Colon & Rectum
Breast
Lung & Bronchus
0 50 100 150
4.0
4.1
4.3
4.4
6.6
10.5
12.9
21.7
35.5
Kidney & Renal Pelvis
Corpus & Uterus, NOS
Non-Hodgkin Lymphoma
Ovary
Pancreas
Colon & Rectum
Breast
Lung & Bronchus
0 50 100 150
3.9
4.3
4.5
6.8
10.6
13.2
22.4
32.5
0 50 100 150
Death rates were notranked when the populationsize was less than 50,000or case counts were fewerthan 16 in each of the sitecategories.
0 50 100 150
Death rates were notranked when the populationsize was less than 50,000or case counts were fewerthan 16 in each of the sitecategories.
0 50 100 150
Death rates were notranked when the populationsize was less than 50,000or case counts were fewerthan 16 in each of the sitecategories.
0 50 100 150
Death rates were notranked when the populationsize was less than 50,000or case counts were fewerthan 16 in each of the sitecategories.
Rate† per 100,000Rate† per 100,000
Rate† per 100,000Rate† per 100,000
Rate† per 100,000Rate† per 100,000
All Races White
Black Asian/Pacific Islander‡
American Indian/Alaska Native‡ Hispanic‡§
∗ Data are from the National Vital Statistics System (NVSS).† Rates are age-adjusted to the 2000 U.S. standard population (19 age groups - Census P25-1130). See Table 2.1.1.2F-2.27.1.2F
and Appendix F.1-F.2 for 95% confidence intervals for rates. Rates are suppressed and not ranked if the population of a specific
category (race, ethnicity) is less than 50,000 or if deaths are fewer than 16.‡ Data for specified racial or ethnic populations other than white and black should be interpreted with caution. See Technical
Notes.§ Hispanic origin is not mutually exclusive from race categories (white, black, Asian/Pacific Islander, American Indian/Alaska
Native).
Note: ONS — Other Nervous System; NOS — Not Otherwise Specified; IBD — Intrahepatic Bile Duct.
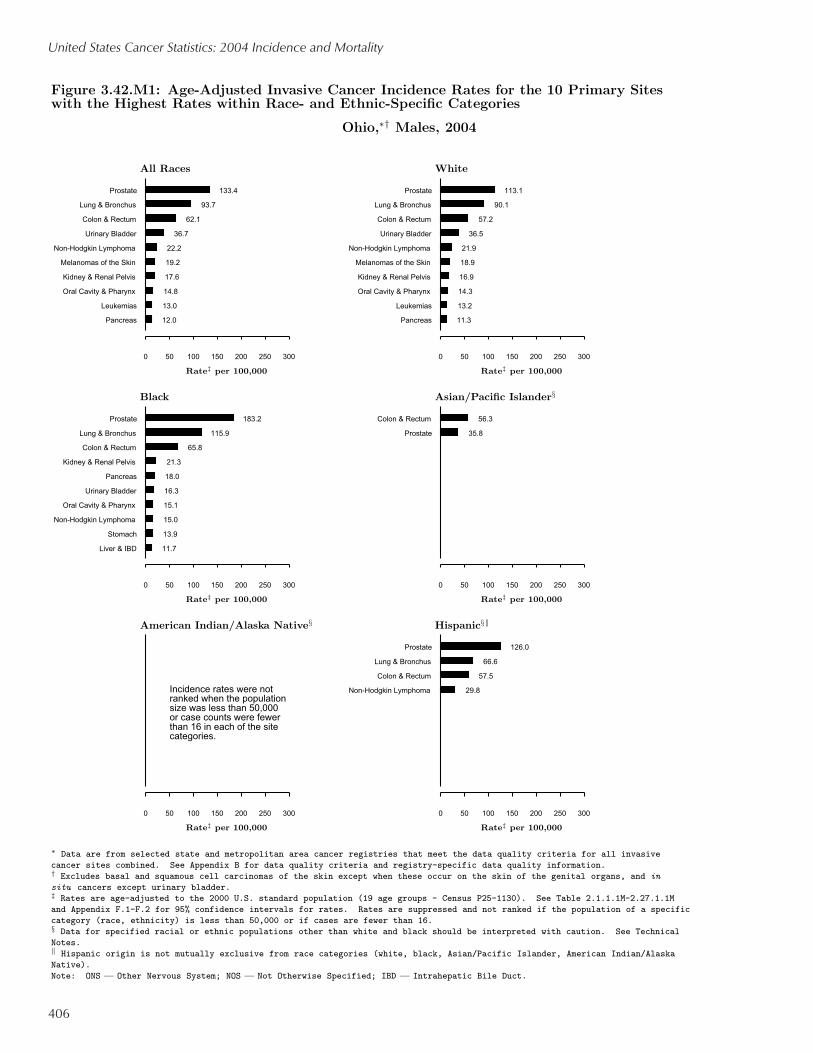
United States Cancer Statistics: 2004 Incidence and Mortality
�0�
Figure 3.42.M1: Age-Adjusted Invasive Cancer Incidence Rates for the 10 Primary Siteswith the Highest Rates within Race- and Ethnic-Specific Categories
Ohio,∗† Males, 2004
Pancreas
Leukemias
Oral Cavity & Pharynx
Kidney & Renal Pelvis
Melanomas of the Skin
Non-Hodgkin Lymphoma
Urinary Bladder
Colon & Rectum
Lung & Bronchus
Prostate
0 50 100 150 200 250 300
12.0
13.0
14.8
17.6
19.2
22.2
36.7
62.1
93.7
133.4
Pancreas
Leukemias
Oral Cavity & Pharynx
Kidney & Renal Pelvis
Melanomas of the Skin
Non-Hodgkin Lymphoma
Urinary Bladder
Colon & Rectum
Lung & Bronchus
Prostate
0 50 100 150 200 250 300
11.3
13.2
14.3
16.9
18.9
21.9
36.5
57.2
90.1
113.1
Liver & IBD
Stomach
Non-Hodgkin Lymphoma
Oral Cavity & Pharynx
Urinary Bladder
Pancreas
Kidney & Renal Pelvis
Colon & Rectum
Lung & Bronchus
Prostate
0 50 100 150 200 250 300
11.7
13.9
15.0
15.1
16.3
18.0
21.3
65.8
115.9
183.2
Prostate
Colon & Rectum
0 50 100 150 200 250 300
35.8
56.3
0 50 100 150 200 250 300
Incidence rates were notranked when the populationsize was less than 50,000or case counts were fewerthan 16 in each of the sitecategories.
Non-Hodgkin Lymphoma
Colon & Rectum
Lung & Bronchus
Prostate
0 50 100 150 200 250 300
29.8
57.5
66.6
126.0
Rate‡ per 100,000Rate‡ per 100,000
Rate‡ per 100,000Rate‡ per 100,000
Rate‡ per 100,000Rate‡ per 100,000
All Races White
Black Asian/Pacific Islander§
American Indian/Alaska Native§ Hispanic§�
∗ Data are from selected state and metropolitan area cancer registries that meet the data quality criteria for all invasive
cancer sites combined. See Appendix B for data quality criteria and registry-specific data quality information.† Excludes basal and squamous cell carcinomas of the skin except when these occur on the skin of the genital organs, and in
situ cancers except urinary bladder.‡ Rates are age-adjusted to the 2000 U.S. standard population (19 age groups - Census P25-1130). See Table 2.1.1.1M-2.27.1.1M
and Appendix F.1-F.2 for 95% confidence intervals for rates. Rates are suppressed and not ranked if the population of a specific
category (race, ethnicity) is less than 50,000 or if cases are fewer than 16.§ Data for specified racial or ethnic populations other than white and black should be interpreted with caution. See Technical
Notes.� Hispanic origin is not mutually exclusive from race categories (white, black, Asian/Pacific Islander, American Indian/Alaska
Native).
Note: ONS — Other Nervous System; NOS — Not Otherwise Specified; IBD — Intrahepatic Bile Duct.

State and Metropolitan-Area Incidence Rates and State Death Rates for the Most Common Cancers
�0�
Figure 3.42.M2: Age-Adjusted Cancer Death Rates for the 10 Primary Sites with theHighest Rates within Race- and Ethnic-Specific Categories
Ohio,∗ Males, 2004
Liver & IBD
Kidney & Renal Pelvis
Esophagus
Urinary Bladder
Non-Hodgkin Lymphoma
Leukemias
Pancreas
Colon & Rectum
Prostate
Lung & Bronchus
0 50 100 150
6.0
6.6
9.0
9.3
9.5
10.3
13.1
24.7
27.0
80.1
Brain & ONS
Kidney & Renal Pelvis
Esophagus
Urinary Bladder
Non-Hodgkin Lymphoma
Leukemias
Pancreas
Colon & Rectum
Prostate
Lung & Bronchus
0 50 100 150
5.5
6.7
9.1
9.4
9.6
10.4
12.6
23.8
24.9
78.6
Non-Hodgkin Lymphoma
Esophagus
Myeloma
Stomach
Leukemias
Liver & IBD
Pancreas
Colon & Rectum
Prostate
Lung & Bronchus
0 50 100 150
8.2
8.4
10.2
10.2
10.6
11.5
19.5
36.6
52.7
101.8
0 50 100 150
Death rates were notranked when the populationsize was less than 50,000or case counts were fewerthan 16 in each of the sitecategories.
0 50 100 150
Death rates were notranked when the populationsize was less than 50,000or case counts were fewerthan 16 in each of the sitecategories.
Lung & Bronchus
0 50 100 150
32.3
Rate† per 100,000Rate† per 100,000
Rate† per 100,000Rate† per 100,000
Rate† per 100,000Rate† per 100,000
All Races White
Black Asian/Pacific Islander‡
American Indian/Alaska Native‡ Hispanic‡§
∗ Data are from the National Vital Statistics System (NVSS).† Rates are age-adjusted to the 2000 U.S. standard population (19 age groups - Census P25-1130). See Table 2.1.1.2M-2.27.1.2M
and Appendix F.1-F.2 for 95% confidence intervals for rates. Rates are suppressed and not ranked if the population of a specific
category (race, ethnicity) is less than 50,000 or if deaths are fewer than 16.‡ Data for specified racial or ethnic populations other than white and black should be interpreted with caution. See Technical
Notes.§ Hispanic origin is not mutually exclusive from race categories (white, black, Asian/Pacific Islander, American Indian/Alaska
Native).
Note: ONS — Other Nervous System; NOS — Not Otherwise Specified; IBD — Intrahepatic Bile Duct.

United States Cancer Statistics: 2004 Incidence and Mortality
�0�
Figure 3.42.F1: Age-Adjusted Invasive Cancer Incidence Rates for the 10 Primary Siteswith the Highest Rates within Race- and Ethnic-Specific Categories
Ohio,∗† Females, 2004
Urinary Bladder
Kidney & Renal Pelvis
Ovary
Thyroid
Melanomas of the Skin
Non-Hodgkin Lymphoma
Corpus & Uterus, NOS
Colon & Rectum
Lung & Bronchus
Breast
0 50 100 150 200 250 300
9.3
10.7
11.2
11.7
15.3
16.4
25.8
44.1
58.0
118.9
Urinary Bladder
Kidney & Renal Pelvis
Thyroid
Ovary
Melanomas of the Skin
Non-Hodgkin Lymphoma
Corpus & Uterus, NOS
Colon & Rectum
Lung & Bronchus
Breast
0 50 100 150 200 250 300
8.9
10.5
11.8
11.8
15.4
16.4
25.4
41.2
56.5
114.7
Stomach
Leukemias
Myeloma
Kidney & Renal Pelvis
Non-Hodgkin Lymphoma
Pancreas
Corpus & Uterus, NOS
Colon & Rectum
Lung & Bronchus
Breast
0 50 100 150 200 250 300
7.4
8.0
8.3
10.1
10.2
13.7
18.0
46.3
63.4
115.7 Breast
0 50 100 150 200 250 300
52.7
0 50 100 150 200 250 300
Incidence rates were notranked when the populationsize was less than 50,000or case counts were fewerthan 16 in each of the sitecategories.
Colon & Rectum
Lung & Bronchus
Breast
0 50 100 150 200 250 300
33.1
45.3
98.3
Rate‡ per 100,000Rate‡ per 100,000
Rate‡ per 100,000Rate‡ per 100,000
Rate‡ per 100,000Rate‡ per 100,000
All Races White
Black Asian/Pacific Islander§
American Indian/Alaska Native§ Hispanic§�
∗ Data are from selected state and metropolitan area cancer registries that meet the data quality criteria for all invasive
cancer sites combined. See Appendix B for data quality criteria and registry-specific data quality information.† Excludes basal and squamous cell carcinomas of the skin except when these occur on the skin of the genital organs, and in
situ cancers except urinary bladder.‡ Rates are age-adjusted to the 2000 U.S. standard population (19 age groups - Census P25-1130). See Table 2.1.1.1F-2.27.1.1F
and Appendix F.1-F.2 for 95% confidence intervals for rates. Rates are suppressed and not ranked if the population of a specific
category (race, ethnicity) is less than 50,000 or if cases are fewer than 16.§ Data for specified racial or ethnic populations other than white and black should be interpreted with caution. See Technical
Notes.� Hispanic origin is not mutually exclusive from race categories (white, black, Asian/Pacific Islander, American Indian/Alaska
Native).
Note: ONS — Other Nervous System; NOS — Not Otherwise Specified; IBD — Intrahepatic Bile Duct. Ovary excludes cancers newly
classified as borderline according to ICD-O-3, beginning with 2001 diagnoses. See Technical Notes.

State and Metropolitan-Area Incidence Rates and State Death Rates for the Most Common Cancers
�0�
Figure 3.42.F2: Age-Adjusted Cancer Death Rates for the 10 Primary Sites with theHighest Rates within Race- and Ethnic-Specific Categories
Ohio,∗ Females, 2004
Myeloma
Brain & ONS
Corpus & Uterus, NOS
Leukemias
Non-Hodgkin Lymphoma
Pancreas
Ovary
Colon & Rectum
Breast
Lung & Bronchus
0 50 100 150
3.4
3.8
4.6
5.6
5.6
8.9
9.4
16.4
27.0
46.4
Myeloma
Brain & ONS
Corpus & Uterus, NOS
Leukemias
Non-Hodgkin Lymphoma
Pancreas
Ovary
Colon & Rectum
Breast
Lung & Bronchus
0 50 100 150
3.1
4.2
4.4
5.6
5.8
8.5
9.5
16.1
25.9
45.7
Non-Hodgkin Lymphoma
Stomach
Leukemias
Corpus & Uterus, NOS
Myeloma
Ovary
Pancreas
Colon & Rectum
Breast
Lung & Bronchus
0 50 100 150
3.4
6.0
6.2
6.5
6.6
9.1
13.5
20.6
37.4
57.0
0 50 100 150
Death rates were notranked when the populationsize was less than 50,000or case counts were fewerthan 16 in each of the sitecategories.
0 50 100 150
Death rates were notranked when the populationsize was less than 50,000or case counts were fewerthan 16 in each of the sitecategories.
0 50 100 150
Death rates were notranked when the populationsize was less than 50,000or case counts were fewerthan 16 in each of the sitecategories.
Rate† per 100,000Rate† per 100,000
Rate† per 100,000Rate† per 100,000
Rate† per 100,000Rate† per 100,000
All Races White
Black Asian/Pacific Islander‡
American Indian/Alaska Native‡ Hispanic‡§
∗ Data are from the National Vital Statistics System (NVSS).† Rates are age-adjusted to the 2000 U.S. standard population (19 age groups - Census P25-1130). See Table 2.1.1.2F-2.27.1.2F
and Appendix F.1-F.2 for 95% confidence intervals for rates. Rates are suppressed and not ranked if the population of a specific
category (race, ethnicity) is less than 50,000 or if deaths are fewer than 16.‡ Data for specified racial or ethnic populations other than white and black should be interpreted with caution. See Technical
Notes.§ Hispanic origin is not mutually exclusive from race categories (white, black, Asian/Pacific Islander, American Indian/Alaska
Native).
Note: ONS — Other Nervous System; NOS — Not Otherwise Specified; IBD — Intrahepatic Bile Duct.

United States Cancer Statistics: 2004 Incidence and Mortality
��0
Figure 3.43.M1: Age-Adjusted Invasive Cancer Incidence Rates for the 10 Primary Siteswith the Highest Rates within Race- and Ethnic-Specific Categories
Oklahoma,∗† Males, 2004
Pancreas
Leukemias
Oral Cavity & Pharynx
Kidney & Renal Pelvis
Melanomas of the Skin
Non-Hodgkin Lymphoma
Urinary Bladder
Colon & Rectum
Lung & Bronchus
Prostate
0 50 100 150 200 250 300
12.5
16.5
17.0
19.3
20.6
21.8
35.4
57.7
99.6
137.5
Pancreas
Leukemias
Oral Cavity & Pharynx
Kidney & Renal Pelvis
Melanomas of the Skin
Non-Hodgkin Lymphoma
Urinary Bladder
Colon & Rectum
Lung & Bronchus
Prostate
0 50 100 150 200 250 300
11.7
15.9
16.6
18.7
22.3
22.9
36.8
56.7
97.1
132.1
Pancreas
Colon & Rectum
Lung & Bronchus
Prostate
0 50 100 150 200 250 300
23.0
64.0
121.3
201.5
0 50 100 150 200 250 300
Incidence rates were notranked when the populationsize was less than 50,000or case counts were fewerthan 16 in each of the sitecategories.
Leukemias
Oral Cavity & Pharynx
Urinary Bladder
Kidney & Renal Pelvis
Colon & Rectum
Lung & Bronchus
Prostate
0 50 100 150 200 250 300
20.6
24.3
24.4
30.1
66.6
121.0
157.9
Lung & Bronchus
Prostate
0 50 100 150 200 250 300
55.0
91.8
Rate‡ per 100,000Rate‡ per 100,000
Rate‡ per 100,000Rate‡ per 100,000
Rate‡ per 100,000Rate‡ per 100,000
All Races White
Black Asian/Pacific Islander§
American Indian/Alaska Native§ Hispanic§�
∗ Data are from selected state and metropolitan area cancer registries that meet the data quality criteria for all invasive
cancer sites combined. See Appendix B for data quality criteria and registry-specific data quality information.† Excludes basal and squamous cell carcinomas of the skin except when these occur on the skin of the genital organs, and in
situ cancers except urinary bladder.‡ Rates are age-adjusted to the 2000 U.S. standard population (19 age groups - Census P25-1130). See Table 2.1.1.1M-2.27.1.1M
and Appendix F.1-F.2 for 95% confidence intervals for rates. Rates are suppressed and not ranked if the population of a specific
category (race, ethnicity) is less than 50,000 or if cases are fewer than 16.§ Data for specified racial or ethnic populations other than white and black should be interpreted with caution. See Technical
Notes.� Hispanic origin is not mutually exclusive from race categories (white, black, Asian/Pacific Islander, American Indian/Alaska
Native).
Note: ONS — Other Nervous System; NOS — Not Otherwise Specified; IBD — Intrahepatic Bile Duct.

State and Metropolitan-Area Incidence Rates and State Death Rates for the Most Common Cancers
���
Figure 3.43.M2: Age-Adjusted Cancer Death Rates for the 10 Primary Sites with theHighest Rates within Race- and Ethnic-Specific Categories
Oklahoma,∗ Males, 2004
Liver & IBD
Urinary Bladder
Esophagus
Kidney & Renal Pelvis
Non-Hodgkin Lymphoma
Leukemias
Pancreas
Colon & Rectum
Prostate
Lung & Bronchus
0 50 100 150
6.1
6.7
7.1
7.8
10.3
10.8
11.6
24.0
24.2
84.9
Brain & ONS
Urinary Bladder
Esophagus
Kidney & Renal Pelvis
Non-Hodgkin Lymphoma
Leukemias
Pancreas
Prostate
Colon & Rectum
Lung & Bronchus
0 50 100 150
6.2
6.9
7.1
7.8
10.6
10.8
11.1
23.0
23.2
85.2
Pancreas
Colon & Rectum
Prostate
Lung & Bronchus
0 50 100 150
24.9
45.4
55.1
105.9
0 50 100 150
Death rates were notranked when the populationsize was less than 50,000or case counts were fewerthan 16 in each of the sitecategories.
Colon & Rectum
Lung & Bronchus
0 50 100 150
20.5
73.2
0 50 100 150
Death rates were notranked when the populationsize was less than 50,000or case counts were fewerthan 16 in each of the sitecategories.
Rate† per 100,000Rate† per 100,000
Rate† per 100,000Rate† per 100,000
Rate† per 100,000Rate† per 100,000
All Races White
Black Asian/Pacific Islander‡
American Indian/Alaska Native‡ Hispanic‡§
∗ Data are from the National Vital Statistics System (NVSS).† Rates are age-adjusted to the 2000 U.S. standard population (19 age groups - Census P25-1130). See Table 2.1.1.2M-2.27.1.2M
and Appendix F.1-F.2 for 95% confidence intervals for rates. Rates are suppressed and not ranked if the population of a specific
category (race, ethnicity) is less than 50,000 or if deaths are fewer than 16.‡ Data for specified racial or ethnic populations other than white and black should be interpreted with caution. See Technical
Notes.§ Hispanic origin is not mutually exclusive from race categories (white, black, Asian/Pacific Islander, American Indian/Alaska
Native).
Note: ONS — Other Nervous System; NOS — Not Otherwise Specified; IBD — Intrahepatic Bile Duct.
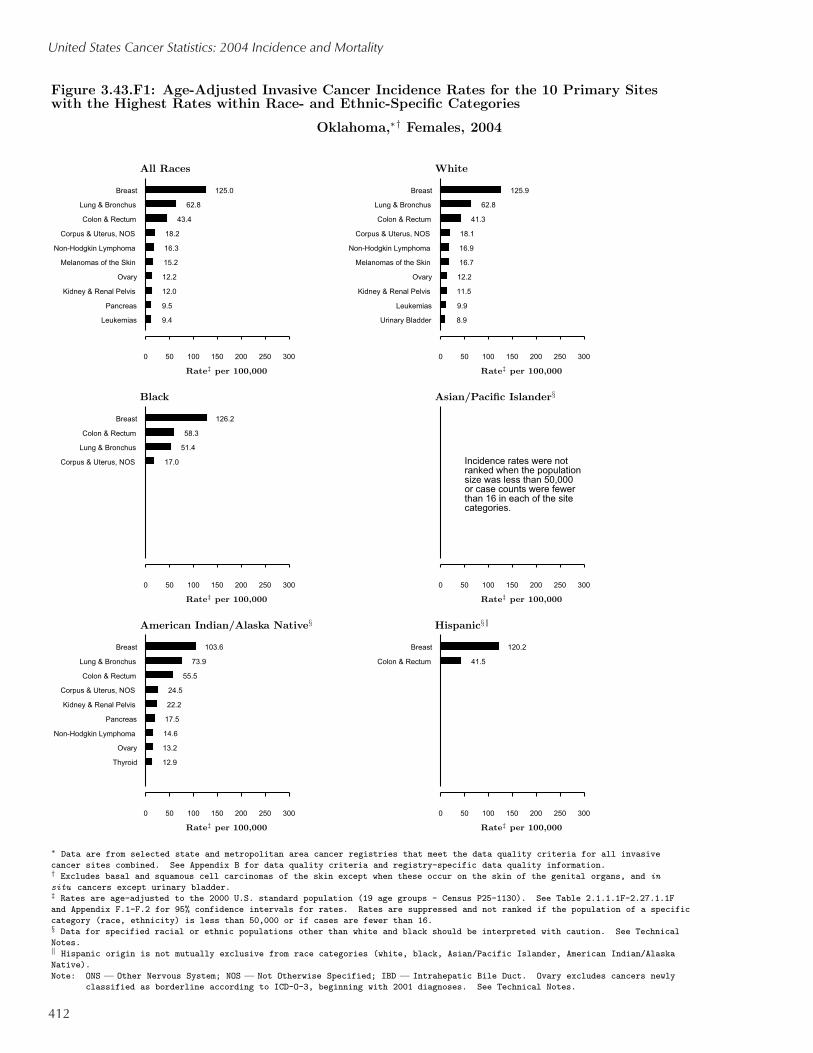
United States Cancer Statistics: 2004 Incidence and Mortality
���
Figure 3.43.F1: Age-Adjusted Invasive Cancer Incidence Rates for the 10 Primary Siteswith the Highest Rates within Race- and Ethnic-Specific Categories
Oklahoma,∗† Females, 2004
Leukemias
Pancreas
Kidney & Renal Pelvis
Ovary
Melanomas of the Skin
Non-Hodgkin Lymphoma
Corpus & Uterus, NOS
Colon & Rectum
Lung & Bronchus
Breast
0 50 100 150 200 250 300
9.4
9.5
12.0
12.2
15.2
16.3
18.2
43.4
62.8
125.0
Urinary Bladder
Leukemias
Kidney & Renal Pelvis
Ovary
Melanomas of the Skin
Non-Hodgkin Lymphoma
Corpus & Uterus, NOS
Colon & Rectum
Lung & Bronchus
Breast
0 50 100 150 200 250 300
8.9
9.9
11.5
12.2
16.7
16.9
18.1
41.3
62.8
125.9
Corpus & Uterus, NOS
Lung & Bronchus
Colon & Rectum
Breast
0 50 100 150 200 250 300
17.0
51.4
58.3
126.2
0 50 100 150 200 250 300
Incidence rates were notranked when the populationsize was less than 50,000or case counts were fewerthan 16 in each of the sitecategories.
Thyroid
Ovary
Non-Hodgkin Lymphoma
Pancreas
Kidney & Renal Pelvis
Corpus & Uterus, NOS
Colon & Rectum
Lung & Bronchus
Breast
0 50 100 150 200 250 300
12.9
13.2
14.6
17.5
22.2
24.5
55.5
73.9
103.6
Colon & Rectum
Breast
0 50 100 150 200 250 300
41.5
120.2
Rate‡ per 100,000Rate‡ per 100,000
Rate‡ per 100,000Rate‡ per 100,000
Rate‡ per 100,000Rate‡ per 100,000
All Races White
Black Asian/Pacific Islander§
American Indian/Alaska Native§ Hispanic§�
∗ Data are from selected state and metropolitan area cancer registries that meet the data quality criteria for all invasive
cancer sites combined. See Appendix B for data quality criteria and registry-specific data quality information.† Excludes basal and squamous cell carcinomas of the skin except when these occur on the skin of the genital organs, and in
situ cancers except urinary bladder.‡ Rates are age-adjusted to the 2000 U.S. standard population (19 age groups - Census P25-1130). See Table 2.1.1.1F-2.27.1.1F
and Appendix F.1-F.2 for 95% confidence intervals for rates. Rates are suppressed and not ranked if the population of a specific
category (race, ethnicity) is less than 50,000 or if cases are fewer than 16.§ Data for specified racial or ethnic populations other than white and black should be interpreted with caution. See Technical
Notes.� Hispanic origin is not mutually exclusive from race categories (white, black, Asian/Pacific Islander, American Indian/Alaska
Native).
Note: ONS — Other Nervous System; NOS — Not Otherwise Specified; IBD — Intrahepatic Bile Duct. Ovary excludes cancers newly
classified as borderline according to ICD-O-3, beginning with 2001 diagnoses. See Technical Notes.

State and Metropolitan-Area Incidence Rates and State Death Rates for the Most Common Cancers
��3
Figure 3.43.F2: Age-Adjusted Cancer Death Rates for the 10 Primary Sites with theHighest Rates within Race- and Ethnic-Specific Categories
Oklahoma,∗ Females, 2004
Kidney & Renal Pelvis
Brain & ONS
Corpus & Uterus, NOS
Non-Hodgkin Lymphoma
Leukemias
Ovary
Pancreas
Colon & Rectum
Breast
Lung & Bronchus
0 50 100 150
3.2
3.3
4.0
4.8
5.7
8.4
8.6
15.9
22.5
46.5
Kidney & Renal Pelvis
Brain & ONS
Corpus & Uterus, NOS
Non-Hodgkin Lymphoma
Leukemias
Pancreas
Ovary
Colon & Rectum
Breast
Lung & Bronchus
0 50 100 150
3.0
3.5
4.1
5.1
6.0
8.2
8.7
15.8
21.8
47.8
Pancreas
Colon & Rectum
Breast
Lung & Bronchus
0 50 100 150
17.0
20.7
36.2
39.6
0 50 100 150
Death rates were notranked when the populationsize was less than 50,000or case counts were fewerthan 16 in each of the sitecategories.
Colon & Rectum
Breast
Lung & Bronchus
0 50 100 150
13.7
23.3
37.4
0 50 100 150
Death rates were notranked when the populationsize was less than 50,000or case counts were fewerthan 16 in each of the sitecategories.
Rate† per 100,000Rate† per 100,000
Rate† per 100,000Rate† per 100,000
Rate† per 100,000Rate† per 100,000
All Races White
Black Asian/Pacific Islander‡
American Indian/Alaska Native‡ Hispanic‡§
∗ Data are from the National Vital Statistics System (NVSS).† Rates are age-adjusted to the 2000 U.S. standard population (19 age groups - Census P25-1130). See Table 2.1.1.2F-2.27.1.2F
and Appendix F.1-F.2 for 95% confidence intervals for rates. Rates are suppressed and not ranked if the population of a specific
category (race, ethnicity) is less than 50,000 or if deaths are fewer than 16.‡ Data for specified racial or ethnic populations other than white and black should be interpreted with caution. See Technical
Notes.§ Hispanic origin is not mutually exclusive from race categories (white, black, Asian/Pacific Islander, American Indian/Alaska
Native).
Note: ONS — Other Nervous System; NOS — Not Otherwise Specified; IBD — Intrahepatic Bile Duct.

United States Cancer Statistics: 2004 Incidence and Mortality
���
Figure 3.44.M1: Age-Adjusted Invasive Cancer Incidence Rates for the 10 Primary Siteswith the Highest Rates within Race- and Ethnic-Specific Categories
Oregon,∗† Males, 2004
Pancreas
Leukemias
Oral Cavity & Pharynx
Kidney & Renal Pelvis
Non-Hodgkin Lymphoma
Melanomas of the Skin
Urinary Bladder
Colon & Rectum
Lung & Bronchus
Prostate
0 50 100 150 200 250 300
11.8
12.7
15.8
17.6
26.4
28.5
40.3
56.0
79.7
147.8
Pancreas
Leukemias
Oral Cavity & Pharynx
Kidney & Renal Pelvis
Non-Hodgkin Lymphoma
Melanomas of the Skin
Urinary Bladder
Colon & Rectum
Lung & Bronchus
Prostate
0 50 100 150 200 250 300
11.5
12.8
15.9
17.4
26.7
29.5
39.8
55.2
80.0
143.7
0 50 100 150 200 250 300
Incidence rates were notranked when the populationsize was less than 50,000or case counts were fewerthan 16 in each of the sitecategories.
Lung & Bronchus
Prostate
0 50 100 150 200 250 300
56.0
70.7
0 50 100 150 200 250 300
Incidence rates were notranked when the populationsize was less than 50,000or case counts were fewerthan 16 in each of the sitecategories.
Non-Hodgkin Lymphoma
Colon & Rectum
Lung & Bronchus
Prostate
0 50 100 150 200 250 300
28.1
41.1
46.6
108.9
Rate‡ per 100,000Rate‡ per 100,000
Rate‡ per 100,000Rate‡ per 100,000
Rate‡ per 100,000Rate‡ per 100,000
All Races White
Black Asian/Pacific Islander§
American Indian/Alaska Native§ Hispanic§�
∗ Data are from selected state and metropolitan area cancer registries that meet the data quality criteria for all invasive
cancer sites combined. See Appendix B for data quality criteria and registry-specific data quality information.† Excludes basal and squamous cell carcinomas of the skin except when these occur on the skin of the genital organs, and in
situ cancers except urinary bladder.‡ Rates are age-adjusted to the 2000 U.S. standard population (19 age groups - Census P25-1130). See Table 2.1.1.1M-2.27.1.1M
and Appendix F.1-F.2 for 95% confidence intervals for rates. Rates are suppressed and not ranked if the population of a specific
category (race, ethnicity) is less than 50,000 or if cases are fewer than 16.§ Data for specified racial or ethnic populations other than white and black should be interpreted with caution. See Technical
Notes.� Hispanic origin is not mutually exclusive from race categories (white, black, Asian/Pacific Islander, American Indian/Alaska
Native).
Note: ONS — Other Nervous System; NOS — Not Otherwise Specified; IBD — Intrahepatic Bile Duct.

State and Metropolitan-Area Incidence Rates and State Death Rates for the Most Common Cancers
���
Figure 3.44.M2: Age-Adjusted Cancer Death Rates for the 10 Primary Sites with theHighest Rates within Race- and Ethnic-Specific Categories
Oregon,∗ Males, 2004
Brain & ONS
Liver & IBD
Urinary Bladder
Leukemias
Esophagus
Non-Hodgkin Lymphoma
Pancreas
Colon & Rectum
Prostate
Lung & Bronchus
0 50 100 150
6.4
6.6
8.5
9.5
9.7
11.1
11.6
20.2
25.8
65.8
Kidney & Renal Pelvis
Brain & ONS
Urinary Bladder
Leukemias
Esophagus
Non-Hodgkin Lymphoma
Pancreas
Colon & Rectum
Prostate
Lung & Bronchus
0 50 100 150
6.1
6.5
8.8
9.4
9.8
11.2
11.6
19.9
26.0
66.0
0 50 100 150
Death rates were notranked when the populationsize was less than 50,000or case counts were fewerthan 16 in each of the sitecategories.
Lung & Bronchus
0 50 100 150
47.6
0 50 100 150
Death rates were notranked when the populationsize was less than 50,000or case counts were fewerthan 16 in each of the sitecategories.
0 50 100 150
Death rates were notranked when the populationsize was less than 50,000or case counts were fewerthan 16 in each of the sitecategories.
Rate† per 100,000Rate† per 100,000
Rate† per 100,000Rate† per 100,000
Rate† per 100,000Rate† per 100,000
All Races White
Black Asian/Pacific Islander‡
American Indian/Alaska Native‡ Hispanic‡§
∗ Data are from the National Vital Statistics System (NVSS).† Rates are age-adjusted to the 2000 U.S. standard population (19 age groups - Census P25-1130). See Table 2.1.1.2M-2.27.1.2M
and Appendix F.1-F.2 for 95% confidence intervals for rates. Rates are suppressed and not ranked if the population of a specific
category (race, ethnicity) is less than 50,000 or if deaths are fewer than 16.‡ Data for specified racial or ethnic populations other than white and black should be interpreted with caution. See Technical
Notes.§ Hispanic origin is not mutually exclusive from race categories (white, black, Asian/Pacific Islander, American Indian/Alaska
Native).
Note: ONS — Other Nervous System; NOS — Not Otherwise Specified; IBD — Intrahepatic Bile Duct.
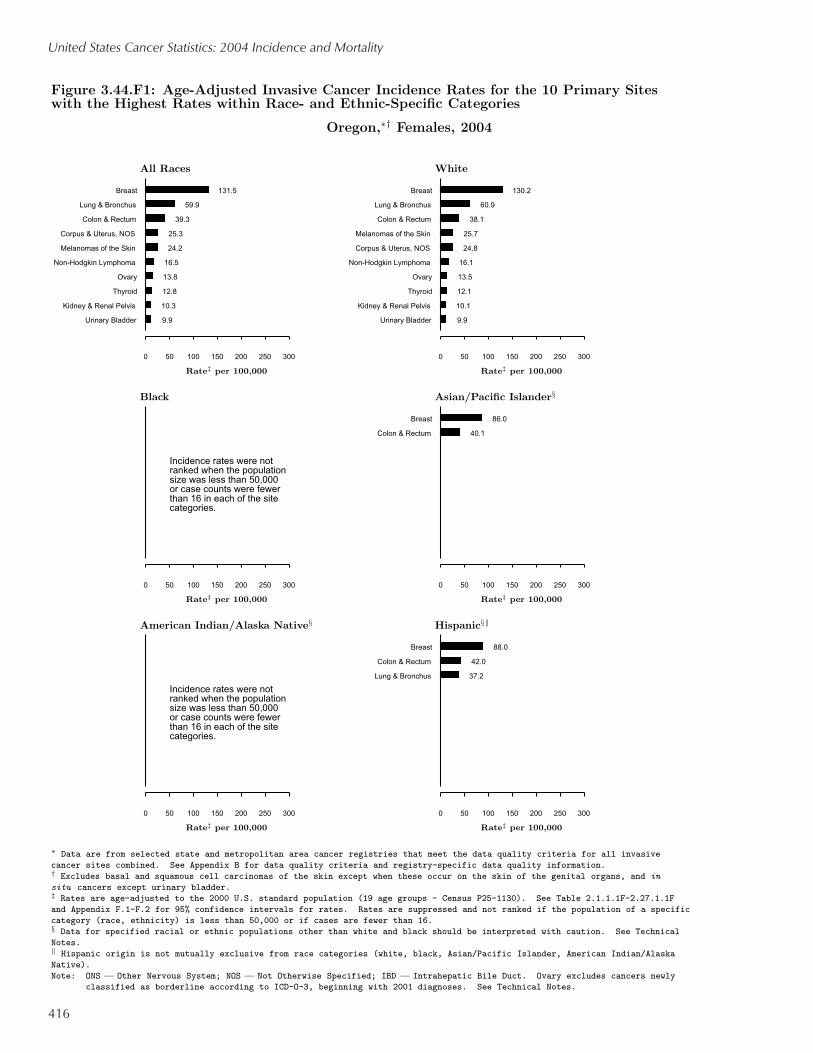
United States Cancer Statistics: 2004 Incidence and Mortality
���
Figure 3.44.F1: Age-Adjusted Invasive Cancer Incidence Rates for the 10 Primary Siteswith the Highest Rates within Race- and Ethnic-Specific Categories
Oregon,∗† Females, 2004
Urinary Bladder
Kidney & Renal Pelvis
Thyroid
Ovary
Non-Hodgkin Lymphoma
Melanomas of the Skin
Corpus & Uterus, NOS
Colon & Rectum
Lung & Bronchus
Breast
0 50 100 150 200 250 300
9.9
10.3
12.8
13.8
16.5
24.2
25.3
39.3
59.9
131.5
Urinary Bladder
Kidney & Renal Pelvis
Thyroid
Ovary
Non-Hodgkin Lymphoma
Corpus & Uterus, NOS
Melanomas of the Skin
Colon & Rectum
Lung & Bronchus
Breast
0 50 100 150 200 250 300
9.9
10.1
12.1
13.5
16.1
24.8
25.7
38.1
60.9
130.2
0 50 100 150 200 250 300
Incidence rates were notranked when the populationsize was less than 50,000or case counts were fewerthan 16 in each of the sitecategories.
Colon & Rectum
Breast
0 50 100 150 200 250 300
40.1
86.0
0 50 100 150 200 250 300
Incidence rates were notranked when the populationsize was less than 50,000or case counts were fewerthan 16 in each of the sitecategories.
Lung & Bronchus
Colon & Rectum
Breast
0 50 100 150 200 250 300
37.2
42.0
88.0
Rate‡ per 100,000Rate‡ per 100,000
Rate‡ per 100,000Rate‡ per 100,000
Rate‡ per 100,000Rate‡ per 100,000
All Races White
Black Asian/Pacific Islander§
American Indian/Alaska Native§ Hispanic§�
∗ Data are from selected state and metropolitan area cancer registries that meet the data quality criteria for all invasive
cancer sites combined. See Appendix B for data quality criteria and registry-specific data quality information.† Excludes basal and squamous cell carcinomas of the skin except when these occur on the skin of the genital organs, and in
situ cancers except urinary bladder.‡ Rates are age-adjusted to the 2000 U.S. standard population (19 age groups - Census P25-1130). See Table 2.1.1.1F-2.27.1.1F
and Appendix F.1-F.2 for 95% confidence intervals for rates. Rates are suppressed and not ranked if the population of a specific
category (race, ethnicity) is less than 50,000 or if cases are fewer than 16.§ Data for specified racial or ethnic populations other than white and black should be interpreted with caution. See Technical
Notes.� Hispanic origin is not mutually exclusive from race categories (white, black, Asian/Pacific Islander, American Indian/Alaska
Native).
Note: ONS — Other Nervous System; NOS — Not Otherwise Specified; IBD — Intrahepatic Bile Duct. Ovary excludes cancers newly
classified as borderline according to ICD-O-3, beginning with 2001 diagnoses. See Technical Notes.

State and Metropolitan-Area Incidence Rates and State Death Rates for the Most Common Cancers
���
Figure 3.44.F2: Age-Adjusted Cancer Death Rates for the 10 Primary Sites with theHighest Rates within Race- and Ethnic-Specific Categories
Oregon,∗ Females, 2004
Myeloma
Corpus & Uterus, NOS
Brain & ONS
Leukemias
Non-Hodgkin Lymphoma
Pancreas
Ovary
Colon & Rectum
Breast
Lung & Bronchus
0 50 100 150
3.2
3.6
4.3
5.2
6.1
10.7
11.4
13.7
24.1
46.9
Myeloma
Corpus & Uterus, NOS
Brain & ONS
Leukemias
Non-Hodgkin Lymphoma
Pancreas
Ovary
Colon & Rectum
Breast
Lung & Bronchus
0 50 100 150
3.2
3.7
4.4
5.4
6.1
10.6
11.5
14.0
24.7
47.8
0 50 100 150
Death rates were notranked when the populationsize was less than 50,000or case counts were fewerthan 16 in each of the sitecategories.
0 50 100 150
Death rates were notranked when the populationsize was less than 50,000or case counts were fewerthan 16 in each of the sitecategories.
0 50 100 150
Death rates were notranked when the populationsize was less than 50,000or case counts were fewerthan 16 in each of the sitecategories.
0 50 100 150
Death rates were notranked when the populationsize was less than 50,000or case counts were fewerthan 16 in each of the sitecategories.
Rate† per 100,000Rate† per 100,000
Rate† per 100,000Rate† per 100,000
Rate† per 100,000Rate† per 100,000
All Races White
Black Asian/Pacific Islander‡
American Indian/Alaska Native‡ Hispanic‡§
∗ Data are from the National Vital Statistics System (NVSS).† Rates are age-adjusted to the 2000 U.S. standard population (19 age groups - Census P25-1130). See Table 2.1.1.2F-2.27.1.2F
and Appendix F.1-F.2 for 95% confidence intervals for rates. Rates are suppressed and not ranked if the population of a specific
category (race, ethnicity) is less than 50,000 or if deaths are fewer than 16.‡ Data for specified racial or ethnic populations other than white and black should be interpreted with caution. See Technical
Notes.§ Hispanic origin is not mutually exclusive from race categories (white, black, Asian/Pacific Islander, American Indian/Alaska
Native).
Note: ONS — Other Nervous System; NOS — Not Otherwise Specified; IBD — Intrahepatic Bile Duct.

United States Cancer Statistics: 2004 Incidence and Mortality
���
Figure 3.45.M1: Age-Adjusted Invasive Cancer Incidence Rates for the 10 Primary Siteswith the Highest Rates within Race- and Ethnic-Specific Categories
Pennsylvania,∗† Males, 2004
Pancreas
Oral Cavity & Pharynx
Leukemias
Melanomas of the Skin
Kidney & Renal Pelvis
Non-Hodgkin Lymphoma
Urinary Bladder
Colon & Rectum
Lung & Bronchus
Prostate
0 50 100 150 200 250 300
14.5
15.0
16.1
21.1
21.5
24.0
45.1
63.6
87.4
144.5
Pancreas
Oral Cavity & Pharynx
Leukemias
Kidney & Renal Pelvis
Melanomas of the Skin
Non-Hodgkin Lymphoma
Urinary Bladder
Colon & Rectum
Lung & Bronchus
Prostate
0 50 100 150 200 250 300
14.2
14.8
15.9
21.1
21.7
24.0
46.7
63.0
85.5
135.0
Oral Cavity & Pharynx
Stomach
Non-Hodgkin Lymphoma
Liver & IBD
Pancreas
Urinary Bladder
Kidney & Renal Pelvis
Colon & Rectum
Lung & Bronchus
Prostate
0 50 100 150 200 250 300
15.5
16.7
17.1
17.7
18.3
21.2
24.3
67.4
114.4
239.3
Colon & Rectum
Lung & Bronchus
Prostate
0 50 100 150 200 250 300
25.1
41.1
59.0
0 50 100 150 200 250 300
Incidence rates were notranked when the populationsize was less than 50,000or case counts were fewerthan 16 in each of the sitecategories.
0 50 100 150 200 250 300
Incidence rates aresuppressed and notranked at state’s request.
Rate‡ per 100,000Rate‡ per 100,000
Rate‡ per 100,000Rate‡ per 100,000
Rate‡ per 100,000Rate‡ per 100,000
All Races White
Black Asian/Pacific Islander§
American Indian/Alaska Native§ Hispanic§�
∗ Data are from selected state and metropolitan area cancer registries that meet the data quality criteria for all invasive
cancer sites combined. See Appendix B for data quality criteria and registry-specific data quality information.† Excludes basal and squamous cell carcinomas of the skin except when these occur on the skin of the genital organs, and in
situ cancers except urinary bladder.‡ Rates are age-adjusted to the 2000 U.S. standard population (19 age groups - Census P25-1130). See Table 2.1.1.1M-2.27.1.1M
and Appendix F.1-F.2 for 95% confidence intervals for rates. Rates are suppressed and not ranked if the population of a specific
category (race, ethnicity) is less than 50,000 or if cases are fewer than 16.§ Data for specified racial or ethnic populations other than white and black should be interpreted with caution. See Technical
Notes.� Hispanic origin is not mutually exclusive from race categories (white, black, Asian/Pacific Islander, American Indian/Alaska
Native).
Note: ONS — Other Nervous System; NOS — Not Otherwise Specified; IBD — Intrahepatic Bile Duct.

State and Metropolitan-Area Incidence Rates and State Death Rates for the Most Common Cancers
���
Figure 3.45.M2: Age-Adjusted Cancer Death Rates for the 10 Primary Sites with theHighest Rates within Race- and Ethnic-Specific Categories
Pennsylvania,∗ Males, 2004
Kidney & Renal Pelvis
Liver & IBD
Urinary Bladder
Esophagus
Non-Hodgkin Lymphoma
Leukemias
Pancreas
Colon & Rectum
Prostate
Lung & Bronchus
0 50 100 150
5.5
7.0
8.0
9.2
9.5
10.2
13.6
23.2
24.2
70.6
Brain & ONS
Liver & IBD
Urinary Bladder
Esophagus
Non-Hodgkin Lymphoma
Leukemias
Pancreas
Prostate
Colon & Rectum
Lung & Bronchus
0 50 100 150
5.7
6.4
8.2
9.2
9.9
10.3
13.6
22.6
23.0
69.1
Myeloma
Kidney & Renal Pelvis
Esophagus
Leukemias
Stomach
Liver & IBD
Pancreas
Colon & Rectum
Prostate
Lung & Bronchus
0 50 100 150
5.7
6.6
9.3
11.6
11.6
12.7
15.2
28.0
50.9
97.9 Lung & Bronchus
0 50 100 150
37.6
0 50 100 150
Death rates were notranked when the populationsize was less than 50,000or case counts were fewerthan 16 in each of the sitecategories.
Lung & Bronchus
0 50 100 150
35.5
Rate† per 100,000Rate† per 100,000
Rate† per 100,000Rate† per 100,000
Rate† per 100,000Rate† per 100,000
All Races White
Black Asian/Pacific Islander‡
American Indian/Alaska Native‡ Hispanic‡§
∗ Data are from the National Vital Statistics System (NVSS).† Rates are age-adjusted to the 2000 U.S. standard population (19 age groups - Census P25-1130). See Table 2.1.1.2M-2.27.1.2M
and Appendix F.1-F.2 for 95% confidence intervals for rates. Rates are suppressed and not ranked if the population of a specific
category (race, ethnicity) is less than 50,000 or if deaths are fewer than 16.‡ Data for specified racial or ethnic populations other than white and black should be interpreted with caution. See Technical
Notes.§ Hispanic origin is not mutually exclusive from race categories (white, black, Asian/Pacific Islander, American Indian/Alaska
Native).
Note: ONS — Other Nervous System; NOS — Not Otherwise Specified; IBD — Intrahepatic Bile Duct.

United States Cancer Statistics: 2004 Incidence and Mortality
��0
Figure 3.45.F1: Age-Adjusted Invasive Cancer Incidence Rates for the 10 Primary Siteswith the Highest Rates within Race- and Ethnic-Specific Categories
Pennsylvania,∗† Females, 2004
Pancreas
Urinary Bladder
Ovary
Melanomas of the Skin
Non-Hodgkin Lymphoma
Thyroid
Corpus & Uterus, NOS
Colon & Rectum
Lung & Bronchus
Breast
0 50 100 150 200 250 300
10.8
10.8
13.2
14.3
17.3
20.3
29.7
47.1
54.5
123.1
Kidney & Renal Pelvis
Urinary Bladder
Ovary
Melanomas of the Skin
Non-Hodgkin Lymphoma
Thyroid
Corpus & Uterus, NOS
Colon & Rectum
Lung & Bronchus
Breast
0 50 100 150 200 250 300
10.4
11.0
13.5
14.9
17.6
20.8
30.2
46.3
53.3
123.1
Ovary
Non-Hodgkin Lymphoma
Cervix Uteri
Kidney & Renal Pelvis
Thyroid
Pancreas
Corpus & Uterus, NOS
Colon & Rectum
Lung & Bronchus
Breast
0 50 100 150 200 250 300
10.1
10.9
11.2
12.5
14.1
15.8
22.7
50.4
67.9
118.1
Corpus & Uterus, NOS
Thyroid
Non-Hodgkin Lymphoma
Lung & Bronchus
Colon & Rectum
Breast
0 50 100 150 200 250 300
13.9
14.6
18.4
22.5
35.5
67.9
0 50 100 150 200 250 300
Incidence rates were notranked when the populationsize was less than 50,000or case counts were fewerthan 16 in each of the sitecategories.
0 50 100 150 200 250 300
Incidence rates aresuppressed and notranked at state’s request.
Rate‡ per 100,000Rate‡ per 100,000
Rate‡ per 100,000Rate‡ per 100,000
Rate‡ per 100,000Rate‡ per 100,000
All Races White
Black Asian/Pacific Islander§
American Indian/Alaska Native§ Hispanic§�
∗ Data are from selected state and metropolitan area cancer registries that meet the data quality criteria for all invasive
cancer sites combined. See Appendix B for data quality criteria and registry-specific data quality information.† Excludes basal and squamous cell carcinomas of the skin except when these occur on the skin of the genital organs, and in
situ cancers except urinary bladder.‡ Rates are age-adjusted to the 2000 U.S. standard population (19 age groups - Census P25-1130). See Table 2.1.1.1F-2.27.1.1F
and Appendix F.1-F.2 for 95% confidence intervals for rates. Rates are suppressed and not ranked if the population of a specific
category (race, ethnicity) is less than 50,000 or if cases are fewer than 16.§ Data for specified racial or ethnic populations other than white and black should be interpreted with caution. See Technical
Notes.� Hispanic origin is not mutually exclusive from race categories (white, black, Asian/Pacific Islander, American Indian/Alaska
Native).
Note: ONS — Other Nervous System; NOS — Not Otherwise Specified; IBD — Intrahepatic Bile Duct. Ovary excludes cancers newly
classified as borderline according to ICD-O-3, beginning with 2001 diagnoses. See Technical Notes.
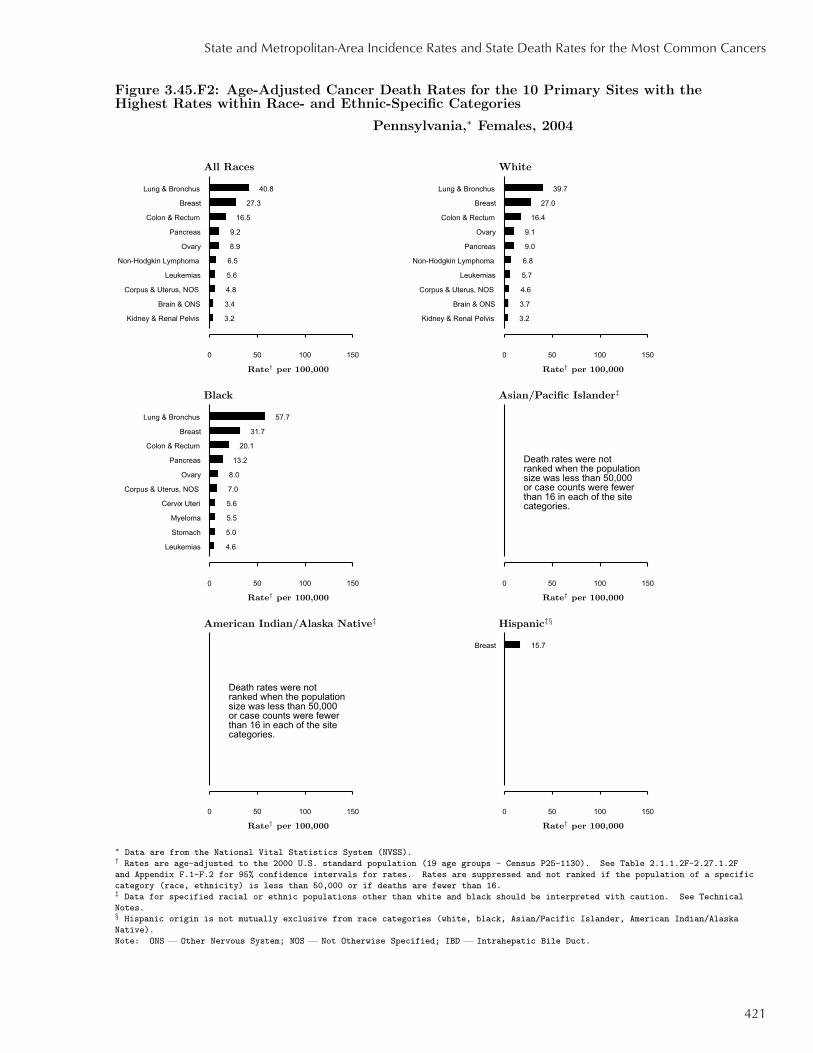
State and Metropolitan-Area Incidence Rates and State Death Rates for the Most Common Cancers
���
Figure 3.45.F2: Age-Adjusted Cancer Death Rates for the 10 Primary Sites with theHighest Rates within Race- and Ethnic-Specific Categories
Pennsylvania,∗ Females, 2004
Kidney & Renal Pelvis
Brain & ONS
Corpus & Uterus, NOS
Leukemias
Non-Hodgkin Lymphoma
Ovary
Pancreas
Colon & Rectum
Breast
Lung & Bronchus
0 50 100 150
3.2
3.4
4.8
5.6
6.5
8.9
9.2
16.5
27.3
40.8
Kidney & Renal Pelvis
Brain & ONS
Corpus & Uterus, NOS
Leukemias
Non-Hodgkin Lymphoma
Pancreas
Ovary
Colon & Rectum
Breast
Lung & Bronchus
0 50 100 150
3.2
3.7
4.6
5.7
6.8
9.0
9.1
16.4
27.0
39.7
Leukemias
Stomach
Myeloma
Cervix Uteri
Corpus & Uterus, NOS
Ovary
Pancreas
Colon & Rectum
Breast
Lung & Bronchus
0 50 100 150
4.6
5.0
5.5
5.6
7.0
8.0
13.2
20.1
31.7
57.7
0 50 100 150
Death rates were notranked when the populationsize was less than 50,000or case counts were fewerthan 16 in each of the sitecategories.
0 50 100 150
Death rates were notranked when the populationsize was less than 50,000or case counts were fewerthan 16 in each of the sitecategories.
Breast
0 50 100 150
15.7
Rate† per 100,000Rate† per 100,000
Rate† per 100,000Rate† per 100,000
Rate† per 100,000Rate† per 100,000
All Races White
Black Asian/Pacific Islander‡
American Indian/Alaska Native‡ Hispanic‡§
∗ Data are from the National Vital Statistics System (NVSS).† Rates are age-adjusted to the 2000 U.S. standard population (19 age groups - Census P25-1130). See Table 2.1.1.2F-2.27.1.2F
and Appendix F.1-F.2 for 95% confidence intervals for rates. Rates are suppressed and not ranked if the population of a specific
category (race, ethnicity) is less than 50,000 or if deaths are fewer than 16.‡ Data for specified racial or ethnic populations other than white and black should be interpreted with caution. See Technical
Notes.§ Hispanic origin is not mutually exclusive from race categories (white, black, Asian/Pacific Islander, American Indian/Alaska
Native).
Note: ONS — Other Nervous System; NOS — Not Otherwise Specified; IBD — Intrahepatic Bile Duct.

United States Cancer Statistics: 2004 Incidence and Mortality
���
Figure 3.46.M1: Age-Adjusted Invasive Cancer Incidence Rates for the 10 Primary Siteswith the Highest Rates within Race- and Ethnic-Specific Categories
Rhode Island,∗† Males, 2004
Stomach
Oral Cavity & Pharynx
Leukemias
Non-Hodgkin Lymphoma
Kidney & Renal Pelvis
Melanomas of the Skin
Urinary Bladder
Colon & Rectum
Lung & Bronchus
Prostate
0 50 100 150 200 250 300
15.0
15.3
15.8
21.1
23.5
23.9
54.6
66.0
95.7
143.6
Stomach
Oral Cavity & Pharynx
Leukemias
Non-Hodgkin Lymphoma
Kidney & Renal Pelvis
Melanomas of the Skin
Urinary Bladder
Colon & Rectum
Lung & Bronchus
Prostate
0 50 100 150 200 250 300
14.5
14.6
15.8
21.6
23.1
24.6
55.9
67.6
96.5
137.6
0 50 100 150 200 250 300
Incidence rates were notranked when the populationsize was less than 50,000or case counts were fewerthan 16 in each of the sitecategories.
0 50 100 150 200 250 300
Incidence rates were notranked when the populationsize was less than 50,000or case counts were fewerthan 16 in each of the sitecategories.
0 50 100 150 200 250 300
Incidence rates were notranked when the populationsize was less than 50,000or case counts were fewerthan 16 in each of the sitecategories.
Lung & Bronchus
Prostate
0 50 100 150 200 250 300
110.2
226.8
Rate‡ per 100,000Rate‡ per 100,000
Rate‡ per 100,000Rate‡ per 100,000
Rate‡ per 100,000Rate‡ per 100,000
All Races White
Black Asian/Pacific Islander§
American Indian/Alaska Native§ Hispanic§�
∗ Data are from selected state and metropolitan area cancer registries that meet the data quality criteria for all invasive
cancer sites combined. See Appendix B for data quality criteria and registry-specific data quality information.† Excludes basal and squamous cell carcinomas of the skin except when these occur on the skin of the genital organs, and in
situ cancers except urinary bladder.‡ Rates are age-adjusted to the 2000 U.S. standard population (19 age groups - Census P25-1130). See Table 2.1.1.1M-2.27.1.1M
and Appendix F.1-F.2 for 95% confidence intervals for rates. Rates are suppressed and not ranked if the population of a specific
category (race, ethnicity) is less than 50,000 or if cases are fewer than 16.§ Data for specified racial or ethnic populations other than white and black should be interpreted with caution. See Technical
Notes.� Hispanic origin is not mutually exclusive from race categories (white, black, Asian/Pacific Islander, American Indian/Alaska
Native).
Note: ONS — Other Nervous System; NOS — Not Otherwise Specified; IBD — Intrahepatic Bile Duct.

State and Metropolitan-Area Incidence Rates and State Death Rates for the Most Common Cancers
��3
Figure 3.46.M2: Age-Adjusted Cancer Death Rates for the 10 Primary Sites with theHighest Rates within Race- and Ethnic-Specific Categories
Rhode Island,∗ Males, 2004
Non-Hodgkin Lymphoma
Leukemias
Stomach
Esophagus
Urinary Bladder
Liver & IBD
Pancreas
Colon & Rectum
Prostate
Lung & Bronchus
0 50 100 150
7.7
8.3
8.7
9.1
9.3
9.9
12.4
21.2
26.9
74.4
Non-Hodgkin Lymphoma
Leukemias
Stomach
Liver & IBD
Esophagus
Urinary Bladder
Pancreas
Colon & Rectum
Prostate
Lung & Bronchus
0 50 100 150
8.2
8.2
8.7
8.8
9.4
9.7
12.9
21.7
26.1
75.9
0 50 100 150
Death rates were notranked when the populationsize was less than 50,000or case counts were fewerthan 16 in each of the sitecategories.
0 50 100 150
Death rates were notranked when the populationsize was less than 50,000or case counts were fewerthan 16 in each of the sitecategories.
0 50 100 150
Death rates were notranked when the populationsize was less than 50,000or case counts were fewerthan 16 in each of the sitecategories.
0 50 100 150
Death rates were notranked when the populationsize was less than 50,000or case counts were fewerthan 16 in each of the sitecategories.
Rate† per 100,000Rate† per 100,000
Rate† per 100,000Rate† per 100,000
Rate† per 100,000Rate† per 100,000
All Races White
Black Asian/Pacific Islander‡
American Indian/Alaska Native‡ Hispanic‡§
∗ Data are from the National Vital Statistics System (NVSS).† Rates are age-adjusted to the 2000 U.S. standard population (19 age groups - Census P25-1130). See Table 2.1.1.2M-2.27.1.2M
and Appendix F.1-F.2 for 95% confidence intervals for rates. Rates are suppressed and not ranked if the population of a specific
category (race, ethnicity) is less than 50,000 or if deaths are fewer than 16.‡ Data for specified racial or ethnic populations other than white and black should be interpreted with caution. See Technical
Notes.§ Hispanic origin is not mutually exclusive from race categories (white, black, Asian/Pacific Islander, American Indian/Alaska
Native).
Note: ONS — Other Nervous System; NOS — Not Otherwise Specified; IBD — Intrahepatic Bile Duct.

United States Cancer Statistics: 2004 Incidence and Mortality
���
Figure 3.46.F1: Age-Adjusted Invasive Cancer Incidence Rates for the 10 Primary Siteswith the Highest Rates within Race- and Ethnic-Specific Categories
Rhode Island,∗† Females, 2004
Leukemias
Urinary Bladder
Non-Hodgkin Lymphoma
Kidney & Renal Pelvis
Thyroid
Melanomas of the Skin
Corpus & Uterus, NOS
Colon & Rectum
Lung & Bronchus
Breast
0 50 100 150 200 250 300
12.1
13.2
13.7
14.0
16.5
19.6
27.4
44.8
57.7
130.1
Leukemias
Urinary Bladder
Non-Hodgkin Lymphoma
Kidney & Renal Pelvis
Thyroid
Melanomas of the Skin
Corpus & Uterus, NOS
Colon & Rectum
Lung & Bronchus
Breast
0 50 100 150 200 250 300
12.6
13.7
14.0
14.3
16.7
20.5
21.8
44.2
58.3
128.4
0 50 100 150 200 250 300
Incidence rates were notranked when the populationsize was less than 50,000or case counts were fewerthan 16 in each of the sitecategories.
0 50 100 150 200 250 300
Incidence rates were notranked when the populationsize was less than 50,000or case counts were fewerthan 16 in each of the sitecategories.
0 50 100 150 200 250 300
Incidence rates were notranked when the populationsize was less than 50,000or case counts were fewerthan 16 in each of the sitecategories.
Breast
0 50 100 150 200 250 300
96.6
Rate‡ per 100,000Rate‡ per 100,000
Rate‡ per 100,000Rate‡ per 100,000
Rate‡ per 100,000Rate‡ per 100,000
All Races White
Black Asian/Pacific Islander§
American Indian/Alaska Native§ Hispanic§�
∗ Data are from selected state and metropolitan area cancer registries that meet the data quality criteria for all invasive
cancer sites combined. See Appendix B for data quality criteria and registry-specific data quality information.† Excludes basal and squamous cell carcinomas of the skin except when these occur on the skin of the genital organs, and in
situ cancers except urinary bladder.‡ Rates are age-adjusted to the 2000 U.S. standard population (19 age groups - Census P25-1130). See Table 2.1.1.1F-2.27.1.1F
and Appendix F.1-F.2 for 95% confidence intervals for rates. Rates are suppressed and not ranked if the population of a specific
category (race, ethnicity) is less than 50,000 or if cases are fewer than 16.§ Data for specified racial or ethnic populations other than white and black should be interpreted with caution. See Technical
Notes.� Hispanic origin is not mutually exclusive from race categories (white, black, Asian/Pacific Islander, American Indian/Alaska
Native).
Note: ONS — Other Nervous System; NOS — Not Otherwise Specified; IBD — Intrahepatic Bile Duct. Ovary excludes cancers newly
classified as borderline according to ICD-O-3, beginning with 2001 diagnoses. See Technical Notes.

State and Metropolitan-Area Incidence Rates and State Death Rates for the Most Common Cancers
���
Figure 3.46.F2: Age-Adjusted Cancer Death Rates for the 10 Primary Sites with theHighest Rates within Race- and Ethnic-Specific Categories
Rhode Island,∗ Females, 2004
Brain & ONS
Stomach
Corpus & Uterus, NOS
Non-Hodgkin Lymphoma
Leukemias
Pancreas
Ovary
Colon & Rectum
Breast
Lung & Bronchus
0 50 100 150
3.2
4.0
4.6
5.2
7.4
9.3
10.6
15.2
21.6
42.0
Kidney & Renal Pelvis
Stomach
Corpus & Uterus, NOS
Non-Hodgkin Lymphoma
Leukemias
Pancreas
Ovary
Colon & Rectum
Breast
Lung & Bronchus
0 50 100 150
3.3
3.7
4.2
5.4
7.5
9.3
10.3
15.5
21.5
42.6
0 50 100 150
Death rates were notranked when the populationsize was less than 50,000or case counts were fewerthan 16 in each of the sitecategories.
0 50 100 150
Death rates were notranked when the populationsize was less than 50,000or case counts were fewerthan 16 in each of the sitecategories.
0 50 100 150
Death rates were notranked when the populationsize was less than 50,000or case counts were fewerthan 16 in each of the sitecategories.
0 50 100 150
Death rates were notranked when the populationsize was less than 50,000or case counts were fewerthan 16 in each of the sitecategories.
Rate† per 100,000Rate† per 100,000
Rate† per 100,000Rate† per 100,000
Rate† per 100,000Rate† per 100,000
All Races White
Black Asian/Pacific Islander‡
American Indian/Alaska Native‡ Hispanic‡§
∗ Data are from the National Vital Statistics System (NVSS).† Rates are age-adjusted to the 2000 U.S. standard population (19 age groups - Census P25-1130). See Table 2.1.1.2F-2.27.1.2F
and Appendix F.1-F.2 for 95% confidence intervals for rates. Rates are suppressed and not ranked if the population of a specific
category (race, ethnicity) is less than 50,000 or if deaths are fewer than 16.‡ Data for specified racial or ethnic populations other than white and black should be interpreted with caution. See Technical
Notes.§ Hispanic origin is not mutually exclusive from race categories (white, black, Asian/Pacific Islander, American Indian/Alaska
Native).
Note: ONS — Other Nervous System; NOS — Not Otherwise Specified; IBD — Intrahepatic Bile Duct.

United States Cancer Statistics: 2004 Incidence and Mortality
���
Figure 3.47.M1: Age-Adjusted Invasive Cancer Incidence Rates for the 10 Primary Siteswith the Highest Rates within Race- and Ethnic-Specific Categories
South Carolina,∗† Males, 2004
Pancreas
Leukemias
Kidney & Renal Pelvis
Oral Cavity & Pharynx
Non-Hodgkin Lymphoma
Melanomas of the Skin
Urinary Bladder
Colon & Rectum
Lung & Bronchus
Prostate
0 50 100 150 200 250 300
12.6
14.9
17.2
19.1
20.3
24.1
30.8
62.7
96.8
163.5
Pancreas
Leukemias
Kidney & Renal Pelvis
Oral Cavity & Pharynx
Non-Hodgkin Lymphoma
Melanomas of the Skin
Urinary Bladder
Colon & Rectum
Lung & Bronchus
Prostate
0 50 100 150 200 250 300
12.2
16.0
17.5
17.5
21.2
30.3
34.3
59.6
96.1
138.2
Non-Hodgkin Lymphoma
Larynx
Kidney & Renal Pelvis
Esophagus
Urinary Bladder
Stomach
Oral Cavity & Pharynx
Colon & Rectum
Lung & Bronchus
Prostate
0 50 100 150 200 250 300
15.4
15.8
16.3
16.6
17.2
21.7
24.4
71.8
98.2
243.2
0 50 100 150 200 250 300
Incidence rates were notranked when the populationsize was less than 50,000or case counts were fewerthan 16 in each of the sitecategories.
0 50 100 150 200 250 300
Incidence rates were notranked when the populationsize was less than 50,000or case counts were fewerthan 16 in each of the sitecategories.
0 50 100 150 200 250 300
Incidence rates aresuppressed and notranked at state’s request.
Rate‡ per 100,000Rate‡ per 100,000
Rate‡ per 100,000Rate‡ per 100,000
Rate‡ per 100,000Rate‡ per 100,000
All Races White
Black Asian/Pacific Islander§
American Indian/Alaska Native§ Hispanic§�
∗ Data are from selected state and metropolitan area cancer registries that meet the data quality criteria for all invasive
cancer sites combined. See Appendix B for data quality criteria and registry-specific data quality information.† Excludes basal and squamous cell carcinomas of the skin except when these occur on the skin of the genital organs, and in
situ cancers except urinary bladder.‡ Rates are age-adjusted to the 2000 U.S. standard population (19 age groups - Census P25-1130). See Table 2.1.1.1M-2.27.1.1M
and Appendix F.1-F.2 for 95% confidence intervals for rates. Rates are suppressed and not ranked if the population of a specific
category (race, ethnicity) is less than 50,000 or if cases are fewer than 16.§ Data for specified racial or ethnic populations other than white and black should be interpreted with caution. See Technical
Notes.� Hispanic origin is not mutually exclusive from race categories (white, black, Asian/Pacific Islander, American Indian/Alaska
Native).
Note: ONS — Other Nervous System; NOS — Not Otherwise Specified; IBD — Intrahepatic Bile Duct.

State and Metropolitan-Area Incidence Rates and State Death Rates for the Most Common Cancers
���
Figure 3.47.M2: Age-Adjusted Cancer Death Rates for the 10 Primary Sites with theHighest Rates within Race- and Ethnic-Specific Categories
South Carolina,∗ Males, 2004
Oral Cavity & Pharynx
Stomach
Liver & IBD
Non-Hodgkin Lymphoma
Esophagus
Leukemias
Pancreas
Colon & Rectum
Prostate
Lung & Bronchus
0 50 100 150
6.2
6.9
6.9
7.4
8.4
9.9
12.9
21.1
32.6
84.6
Liver & IBD
Kidney & Renal Pelvis
Urinary Bladder
Esophagus
Non-Hodgkin Lymphoma
Leukemias
Pancreas
Colon & Rectum
Prostate
Lung & Bronchus
0 50 100 150
6.1
6.4
7.0
7.5
7.6
10.5
12.1
18.9
24.1
84.4
Leukemias
Myeloma
Liver & IBD
Esophagus
Oral Cavity & Pharynx
Pancreas
Stomach
Colon & Rectum
Prostate
Lung & Bronchus
0 50 100 150
8.4
9.8
10.0
12.4
12.6
15.5
16.3
30.7
67.7
86.6
0 50 100 150
Death rates were notranked when the populationsize was less than 50,000or case counts were fewerthan 16 in each of the sitecategories.
0 50 100 150
Death rates were notranked when the populationsize was less than 50,000or case counts were fewerthan 16 in each of the sitecategories.
0 50 100 150
Death rates were notranked when the populationsize was less than 50,000or case counts were fewerthan 16 in each of the sitecategories.
Rate† per 100,000Rate† per 100,000
Rate† per 100,000Rate† per 100,000
Rate† per 100,000Rate† per 100,000
All Races White
Black Asian/Pacific Islander‡
American Indian/Alaska Native‡ Hispanic‡§
∗ Data are from the National Vital Statistics System (NVSS).† Rates are age-adjusted to the 2000 U.S. standard population (19 age groups - Census P25-1130). See Table 2.1.1.2M-2.27.1.2M
and Appendix F.1-F.2 for 95% confidence intervals for rates. Rates are suppressed and not ranked if the population of a specific
category (race, ethnicity) is less than 50,000 or if deaths are fewer than 16.‡ Data for specified racial or ethnic populations other than white and black should be interpreted with caution. See Technical
Notes.§ Hispanic origin is not mutually exclusive from race categories (white, black, Asian/Pacific Islander, American Indian/Alaska
Native).
Note: ONS — Other Nervous System; NOS — Not Otherwise Specified; IBD — Intrahepatic Bile Duct.

United States Cancer Statistics: 2004 Incidence and Mortality
���
Figure 3.47.F1: Age-Adjusted Invasive Cancer Incidence Rates for the 10 Primary Siteswith the Highest Rates within Race- and Ethnic-Specific Categories
South Carolina,∗† Females, 2004
Pancreas
Kidney & Renal Pelvis
Thyroid
Ovary
Non-Hodgkin Lymphoma
Melanomas of the Skin
Corpus & Uterus, NOS
Colon & Rectum
Lung & Bronchus
Breast
0 50 100 150 200 250 300
9.1
9.8
10.3
11.8
14.9
17.1
18.4
44.3
49.5
112.5
Kidney & Renal Pelvis
Leukemias
Thyroid
Ovary
Non-Hodgkin Lymphoma
Corpus & Uterus, NOS
Melanomas of the Skin
Colon & Rectum
Lung & Bronchus
Breast
0 50 100 150 200 250 300
9.1
9.6
10.5
13.1
16.0
16.4
23.2
42.4
53.3
113.6
Thyroid
Myeloma
Pancreas
Non-Hodgkin Lymphoma
Cervix Uteri
Kidney & Renal Pelvis
Corpus & Uterus, NOS
Lung & Bronchus
Colon & Rectum
Breast
0 50 100 150 200 250 300
9.5
10.6
10.6
11.2
11.5
11.6
24.9
37.0
48.7
105.2
0 50 100 150 200 250 300
Incidence rates were notranked when the populationsize was less than 50,000or case counts were fewerthan 16 in each of the sitecategories.
0 50 100 150 200 250 300
Incidence rates were notranked when the populationsize was less than 50,000or case counts were fewerthan 16 in each of the sitecategories.
0 50 100 150 200 250 300
Incidence rates aresuppressed and notranked at state’s request.
Rate‡ per 100,000Rate‡ per 100,000
Rate‡ per 100,000Rate‡ per 100,000
Rate‡ per 100,000Rate‡ per 100,000
All Races White
Black Asian/Pacific Islander§
American Indian/Alaska Native§ Hispanic§�
∗ Data are from selected state and metropolitan area cancer registries that meet the data quality criteria for all invasive
cancer sites combined. See Appendix B for data quality criteria and registry-specific data quality information.† Excludes basal and squamous cell carcinomas of the skin except when these occur on the skin of the genital organs, and in
situ cancers except urinary bladder.‡ Rates are age-adjusted to the 2000 U.S. standard population (19 age groups - Census P25-1130). See Table 2.1.1.1F-2.27.1.1F
and Appendix F.1-F.2 for 95% confidence intervals for rates. Rates are suppressed and not ranked if the population of a specific
category (race, ethnicity) is less than 50,000 or if cases are fewer than 16.§ Data for specified racial or ethnic populations other than white and black should be interpreted with caution. See Technical
Notes.� Hispanic origin is not mutually exclusive from race categories (white, black, Asian/Pacific Islander, American Indian/Alaska
Native).
Note: ONS — Other Nervous System; NOS — Not Otherwise Specified; IBD — Intrahepatic Bile Duct. Ovary excludes cancers newly
classified as borderline according to ICD-O-3, beginning with 2001 diagnoses. See Technical Notes.

State and Metropolitan-Area Incidence Rates and State Death Rates for the Most Common Cancers
���
Figure 3.47.F2: Age-Adjusted Cancer Death Rates for the 10 Primary Sites with theHighest Rates within Race- and Ethnic-Specific Categories
South Carolina,∗ Females, 2004
Myeloma
Brain & ONS
Corpus & Uterus, NOS
Leukemias
Non-Hodgkin Lymphoma
Ovary
Pancreas
Colon & Rectum
Breast
Lung & Bronchus
0 50 100 150
3.9
4.3
4.7
5.2
5.3
8.7
9.3
14.7
23.1
38.6
Myeloma
Corpus & Uterus, NOS
Brain & ONS
Non-Hodgkin Lymphoma
Leukemias
Pancreas
Ovary
Colon & Rectum
Breast
Lung & Bronchus
0 50 100 150
2.8
3.2
4.3
5.3
5.3
8.5
8.6
13.9
20.4
42.2
Leukemias
Non-Hodgkin Lymphoma
Stomach
Myeloma
Ovary
Corpus & Uterus, NOS
Pancreas
Colon & Rectum
Lung & Bronchus
Breast
0 50 100 150
4.8
5.1
5.6
7.3
9.0
9.5
11.3
17.6
27.5
30.4
0 50 100 150
Death rates were notranked when the populationsize was less than 50,000or case counts were fewerthan 16 in each of the sitecategories.
0 50 100 150
Death rates were notranked when the populationsize was less than 50,000or case counts were fewerthan 16 in each of the sitecategories.
0 50 100 150
Death rates were notranked when the populationsize was less than 50,000or case counts were fewerthan 16 in each of the sitecategories.
Rate† per 100,000Rate† per 100,000
Rate† per 100,000Rate† per 100,000
Rate† per 100,000Rate† per 100,000
All Races White
Black Asian/Pacific Islander‡
American Indian/Alaska Native‡ Hispanic‡§
∗ Data are from the National Vital Statistics System (NVSS).† Rates are age-adjusted to the 2000 U.S. standard population (19 age groups - Census P25-1130). See Table 2.1.1.2F-2.27.1.2F
and Appendix F.1-F.2 for 95% confidence intervals for rates. Rates are suppressed and not ranked if the population of a specific
category (race, ethnicity) is less than 50,000 or if deaths are fewer than 16.‡ Data for specified racial or ethnic populations other than white and black should be interpreted with caution. See Technical
Notes.§ Hispanic origin is not mutually exclusive from race categories (white, black, Asian/Pacific Islander, American Indian/Alaska
Native).
Note: ONS — Other Nervous System; NOS — Not Otherwise Specified; IBD — Intrahepatic Bile Duct.

United States Cancer Statistics: 2004 Incidence and Mortality
�30
Figure 3.48.M1: Age-Adjusted Invasive Cancer Incidence Rates for the 10 Primary Siteswith the Highest Rates within Race- and Ethnic-Specific Categories
South Dakota,∗† Males, 2004
Pancreas
Melanomas of the Skin
Oral Cavity & Pharynx
Kidney & Renal Pelvis
Non-Hodgkin Lymphoma
Leukemias
Urinary Bladder
Colon & Rectum
Lung & Bronchus
Prostate
0 50 100 150 200 250 300
12.5
17.3
18.2
18.6
19.0
19.5
33.3
61.7
81.1
180.1
Pancreas
Oral Cavity & Pharynx
Kidney & Renal Pelvis
Non-Hodgkin Lymphoma
Melanomas of the Skin
Leukemias
Urinary Bladder
Colon & Rectum
Lung & Bronchus
Prostate
0 50 100 150 200 250 300
12.7
17.6
18.2
18.2
18.3
18.7
34.0
62.1
79.9
181.0
0 50 100 150 200 250 300
Incidence rates were notranked when the populationsize was less than 50,000or case counts were fewerthan 16 in each of the sitecategories.
0 50 100 150 200 250 300
Incidence rates were notranked when the populationsize was less than 50,000or case counts were fewerthan 16 in each of the sitecategories.
0 50 100 150 200 250 300
Incidence rates were notranked when the populationsize was less than 50,000or case counts were fewerthan 16 in each of the sitecategories.
0 50 100 150 200 250 300
Incidence rates were notranked when the populationsize was less than 50,000or case counts were fewerthan 16 in each of the sitecategories.
Rate‡ per 100,000Rate‡ per 100,000
Rate‡ per 100,000Rate‡ per 100,000
Rate‡ per 100,000Rate‡ per 100,000
All Races White
Black Asian/Pacific Islander§
American Indian/Alaska Native§ Hispanic§�
∗ Data are from selected state and metropolitan area cancer registries that meet the data quality criteria for all invasive
cancer sites combined. See Appendix B for data quality criteria and registry-specific data quality information.† Excludes basal and squamous cell carcinomas of the skin except when these occur on the skin of the genital organs, and in
situ cancers except urinary bladder.‡ Rates are age-adjusted to the 2000 U.S. standard population (19 age groups - Census P25-1130). See Table 2.1.1.1M-2.27.1.1M
and Appendix F.1-F.2 for 95% confidence intervals for rates. Rates are suppressed and not ranked if the population of a specific
category (race, ethnicity) is less than 50,000 or if cases are fewer than 16.§ Data for specified racial or ethnic populations other than white and black should be interpreted with caution. See Technical
Notes.� Hispanic origin is not mutually exclusive from race categories (white, black, Asian/Pacific Islander, American Indian/Alaska
Native).
Note: ONS — Other Nervous System; NOS — Not Otherwise Specified; IBD — Intrahepatic Bile Duct.
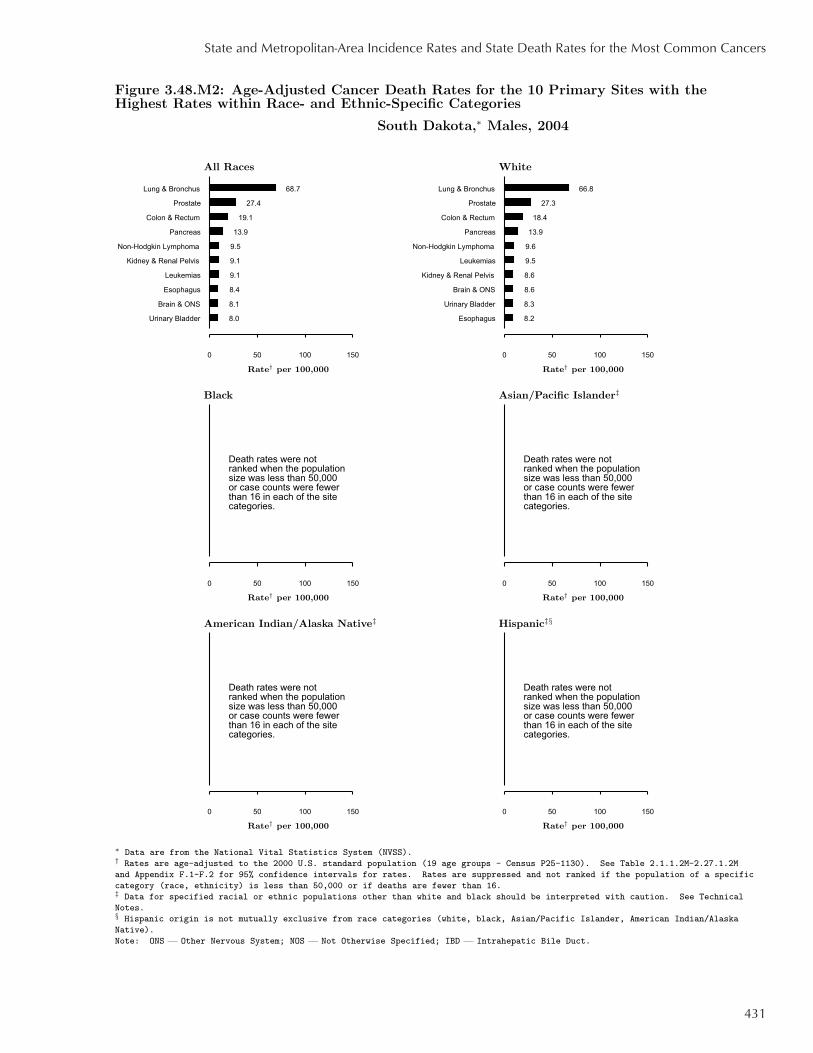
State and Metropolitan-Area Incidence Rates and State Death Rates for the Most Common Cancers
�3�
Figure 3.48.M2: Age-Adjusted Cancer Death Rates for the 10 Primary Sites with theHighest Rates within Race- and Ethnic-Specific Categories
South Dakota,∗ Males, 2004
Urinary Bladder
Brain & ONS
Esophagus
Leukemias
Kidney & Renal Pelvis
Non-Hodgkin Lymphoma
Pancreas
Colon & Rectum
Prostate
Lung & Bronchus
0 50 100 150
8.0
8.1
8.4
9.1
9.1
9.5
13.9
19.1
27.4
68.7
Esophagus
Urinary Bladder
Brain & ONS
Kidney & Renal Pelvis
Leukemias
Non-Hodgkin Lymphoma
Pancreas
Colon & Rectum
Prostate
Lung & Bronchus
0 50 100 150
8.2
8.3
8.6
8.6
9.5
9.6
13.9
18.4
27.3
66.8
0 50 100 150
Death rates were notranked when the populationsize was less than 50,000or case counts were fewerthan 16 in each of the sitecategories.
0 50 100 150
Death rates were notranked when the populationsize was less than 50,000or case counts were fewerthan 16 in each of the sitecategories.
0 50 100 150
Death rates were notranked when the populationsize was less than 50,000or case counts were fewerthan 16 in each of the sitecategories.
0 50 100 150
Death rates were notranked when the populationsize was less than 50,000or case counts were fewerthan 16 in each of the sitecategories.
Rate† per 100,000Rate† per 100,000
Rate† per 100,000Rate† per 100,000
Rate† per 100,000Rate† per 100,000
All Races White
Black Asian/Pacific Islander‡
American Indian/Alaska Native‡ Hispanic‡§
∗ Data are from the National Vital Statistics System (NVSS).† Rates are age-adjusted to the 2000 U.S. standard population (19 age groups - Census P25-1130). See Table 2.1.1.2M-2.27.1.2M
and Appendix F.1-F.2 for 95% confidence intervals for rates. Rates are suppressed and not ranked if the population of a specific
category (race, ethnicity) is less than 50,000 or if deaths are fewer than 16.‡ Data for specified racial or ethnic populations other than white and black should be interpreted with caution. See Technical
Notes.§ Hispanic origin is not mutually exclusive from race categories (white, black, Asian/Pacific Islander, American Indian/Alaska
Native).
Note: ONS — Other Nervous System; NOS — Not Otherwise Specified; IBD — Intrahepatic Bile Duct.

United States Cancer Statistics: 2004 Incidence and Mortality
�3�
Figure 3.48.F1: Age-Adjusted Invasive Cancer Incidence Rates for the 10 Primary Siteswith the Highest Rates within Race- and Ethnic-Specific Categories
South Dakota,∗† Females, 2004
Pancreas
Kidney & Renal Pelvis
Thyroid
Leukemias
Melanomas of the Skin
Non-Hodgkin Lymphoma
Corpus & Uterus, NOS
Colon & Rectum
Lung & Bronchus
Breast
0 50 100 150 200 250 300
10.0
10.3
10.4
11.7
13.4
18.4
22.2
38.3
41.5
109.4
Urinary Bladder
Kidney & Renal Pelvis
Thyroid
Leukemias
Melanomas of the Skin
Non-Hodgkin Lymphoma
Corpus & Uterus, NOS
Colon & Rectum
Lung & Bronchus
Breast
0 50 100 150 200 250 300
9.8
10.1
10.7
12.1
14.0
18.2
22.7
38.2
39.6
111.2
0 50 100 150 200 250 300
Incidence rates were notranked when the populationsize was less than 50,000or case counts were fewerthan 16 in each of the sitecategories.
0 50 100 150 200 250 300
Incidence rates were notranked when the populationsize was less than 50,000or case counts were fewerthan 16 in each of the sitecategories.
0 50 100 150 200 250 300
Incidence rates were notranked when the populationsize was less than 50,000or case counts were fewerthan 16 in each of the sitecategories.
0 50 100 150 200 250 300
Incidence rates were notranked when the populationsize was less than 50,000or case counts were fewerthan 16 in each of the sitecategories.
Rate‡ per 100,000Rate‡ per 100,000
Rate‡ per 100,000Rate‡ per 100,000
Rate‡ per 100,000Rate‡ per 100,000
All Races White
Black Asian/Pacific Islander§
American Indian/Alaska Native§ Hispanic§�
∗ Data are from selected state and metropolitan area cancer registries that meet the data quality criteria for all invasive
cancer sites combined. See Appendix B for data quality criteria and registry-specific data quality information.† Excludes basal and squamous cell carcinomas of the skin except when these occur on the skin of the genital organs, and in
situ cancers except urinary bladder.‡ Rates are age-adjusted to the 2000 U.S. standard population (19 age groups - Census P25-1130). See Table 2.1.1.1F-2.27.1.1F
and Appendix F.1-F.2 for 95% confidence intervals for rates. Rates are suppressed and not ranked if the population of a specific
category (race, ethnicity) is less than 50,000 or if cases are fewer than 16.§ Data for specified racial or ethnic populations other than white and black should be interpreted with caution. See Technical
Notes.� Hispanic origin is not mutually exclusive from race categories (white, black, Asian/Pacific Islander, American Indian/Alaska
Native).
Note: ONS — Other Nervous System; NOS — Not Otherwise Specified; IBD — Intrahepatic Bile Duct. Ovary excludes cancers newly
classified as borderline according to ICD-O-3, beginning with 2001 diagnoses. See Technical Notes.

State and Metropolitan-Area Incidence Rates and State Death Rates for the Most Common Cancers
�33
Figure 3.48.F2: Age-Adjusted Cancer Death Rates for the 10 Primary Sites with theHighest Rates within Race- and Ethnic-Specific Categories
South Dakota,∗ Females, 2004
Brain & ONS
Corpus & Uterus, NOS
Myeloma
Non-Hodgkin Lymphoma
Leukemias
Ovary
Pancreas
Colon & Rectum
Breast
Lung & Bronchus
0 50 100 150
3.9
3.9
4.1
5.5
6.7
7.0
10.0
14.6
22.0
34.8
Corpus & Uterus, NOS
Myeloma
Brain & ONS
Non-Hodgkin Lymphoma
Ovary
Leukemias
Pancreas
Colon & Rectum
Breast
Lung & Bronchus
0 50 100 150
3.9
4.0
4.1
5.6
6.5
6.7
9.4
15.1
21.8
32.8
0 50 100 150
Death rates were notranked when the populationsize was less than 50,000or case counts were fewerthan 16 in each of the sitecategories.
0 50 100 150
Death rates were notranked when the populationsize was less than 50,000or case counts were fewerthan 16 in each of the sitecategories.
0 50 100 150
Death rates were notranked when the populationsize was less than 50,000or case counts were fewerthan 16 in each of the sitecategories.
0 50 100 150
Death rates were notranked when the populationsize was less than 50,000or case counts were fewerthan 16 in each of the sitecategories.
Rate† per 100,000Rate† per 100,000
Rate† per 100,000Rate† per 100,000
Rate† per 100,000Rate† per 100,000
All Races White
Black Asian/Pacific Islander‡
American Indian/Alaska Native‡ Hispanic‡§
∗ Data are from the National Vital Statistics System (NVSS).† Rates are age-adjusted to the 2000 U.S. standard population (19 age groups - Census P25-1130). See Table 2.1.1.2F-2.27.1.2F
and Appendix F.1-F.2 for 95% confidence intervals for rates. Rates are suppressed and not ranked if the population of a specific
category (race, ethnicity) is less than 50,000 or if deaths are fewer than 16.‡ Data for specified racial or ethnic populations other than white and black should be interpreted with caution. See Technical
Notes.§ Hispanic origin is not mutually exclusive from race categories (white, black, Asian/Pacific Islander, American Indian/Alaska
Native).
Note: ONS — Other Nervous System; NOS — Not Otherwise Specified; IBD — Intrahepatic Bile Duct.
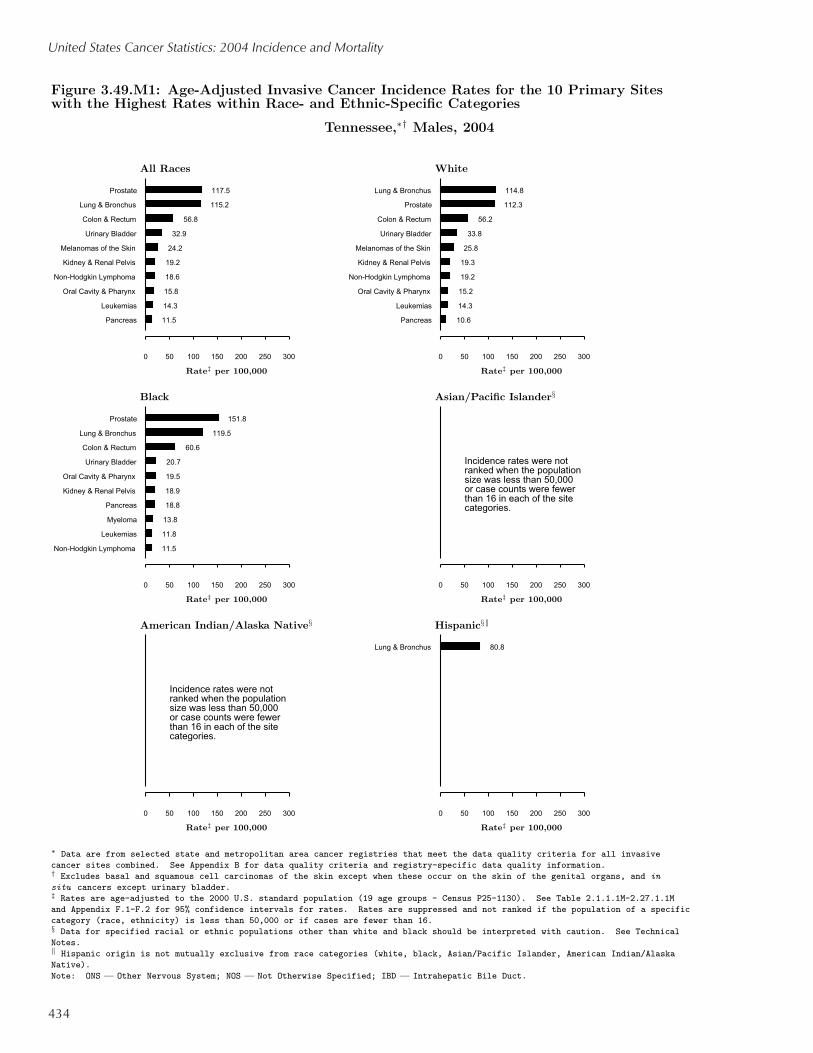
United States Cancer Statistics: 2004 Incidence and Mortality
�3�
Figure 3.49.M1: Age-Adjusted Invasive Cancer Incidence Rates for the 10 Primary Siteswith the Highest Rates within Race- and Ethnic-Specific Categories
Tennessee,∗† Males, 2004
Pancreas
Leukemias
Oral Cavity & Pharynx
Non-Hodgkin Lymphoma
Kidney & Renal Pelvis
Melanomas of the Skin
Urinary Bladder
Colon & Rectum
Lung & Bronchus
Prostate
0 50 100 150 200 250 300
11.5
14.3
15.8
18.6
19.2
24.2
32.9
56.8
115.2
117.5
Pancreas
Leukemias
Oral Cavity & Pharynx
Non-Hodgkin Lymphoma
Kidney & Renal Pelvis
Melanomas of the Skin
Urinary Bladder
Colon & Rectum
Prostate
Lung & Bronchus
0 50 100 150 200 250 300
10.6
14.3
15.2
19.2
19.3
25.8
33.8
56.2
112.3
114.8
Non-Hodgkin Lymphoma
Leukemias
Myeloma
Pancreas
Kidney & Renal Pelvis
Oral Cavity & Pharynx
Urinary Bladder
Colon & Rectum
Lung & Bronchus
Prostate
0 50 100 150 200 250 300
11.5
11.8
13.8
18.8
18.9
19.5
20.7
60.6
119.5
151.8
0 50 100 150 200 250 300
Incidence rates were notranked when the populationsize was less than 50,000or case counts were fewerthan 16 in each of the sitecategories.
0 50 100 150 200 250 300
Incidence rates were notranked when the populationsize was less than 50,000or case counts were fewerthan 16 in each of the sitecategories.
Lung & Bronchus
0 50 100 150 200 250 300
80.8
Rate‡ per 100,000Rate‡ per 100,000
Rate‡ per 100,000Rate‡ per 100,000
Rate‡ per 100,000Rate‡ per 100,000
All Races White
Black Asian/Pacific Islander§
American Indian/Alaska Native§ Hispanic§�
∗ Data are from selected state and metropolitan area cancer registries that meet the data quality criteria for all invasive
cancer sites combined. See Appendix B for data quality criteria and registry-specific data quality information.† Excludes basal and squamous cell carcinomas of the skin except when these occur on the skin of the genital organs, and in
situ cancers except urinary bladder.‡ Rates are age-adjusted to the 2000 U.S. standard population (19 age groups - Census P25-1130). See Table 2.1.1.1M-2.27.1.1M
and Appendix F.1-F.2 for 95% confidence intervals for rates. Rates are suppressed and not ranked if the population of a specific
category (race, ethnicity) is less than 50,000 or if cases are fewer than 16.§ Data for specified racial or ethnic populations other than white and black should be interpreted with caution. See Technical
Notes.� Hispanic origin is not mutually exclusive from race categories (white, black, Asian/Pacific Islander, American Indian/Alaska
Native).
Note: ONS — Other Nervous System; NOS — Not Otherwise Specified; IBD — Intrahepatic Bile Duct.

State and Metropolitan-Area Incidence Rates and State Death Rates for the Most Common Cancers
�3�
Figure 3.49.M2: Age-Adjusted Cancer Death Rates for the 10 Primary Sites with theHighest Rates within Race- and Ethnic-Specific Categories
Tennessee,∗ Males, 2004
Urinary Bladder
Brain & ONS
Liver & IBD
Esophagus
Non-Hodgkin Lymphoma
Leukemias
Pancreas
Colon & Rectum
Prostate
Lung & Bronchus
0 50 100 150
6.6
6.7
7.2
7.6
9.8
11.3
12.4
23.3
27.9
98.0
Urinary Bladder
Liver & IBD
Brain & ONS
Esophagus
Non-Hodgkin Lymphoma
Leukemias
Pancreas
Colon & Rectum
Prostate
Lung & Bronchus
0 50 100 150
6.7
6.8
7.1
7.5
10.1
11.6
12.1
22.3
24.6
96.1
Esophagus
Liver & IBD
Oral Cavity & Pharynx
Leukemias
Stomach
Myeloma
Pancreas
Colon & Rectum
Prostate
Lung & Bronchus
0 50 100 150
8.7
9.1
9.3
9.8
10.7
10.8
14.5
32.7
59.0
117.1
0 50 100 150
Death rates were notranked when the populationsize was less than 50,000or case counts were fewerthan 16 in each of the sitecategories.
0 50 100 150
Death rates were notranked when the populationsize was less than 50,000or case counts were fewerthan 16 in each of the sitecategories.
0 50 100 150
Death rates were notranked when the populationsize was less than 50,000or case counts were fewerthan 16 in each of the sitecategories.
Rate† per 100,000Rate† per 100,000
Rate† per 100,000Rate† per 100,000
Rate† per 100,000Rate† per 100,000
All Races White
Black Asian/Pacific Islander‡
American Indian/Alaska Native‡ Hispanic‡§
∗ Data are from the National Vital Statistics System (NVSS).† Rates are age-adjusted to the 2000 U.S. standard population (19 age groups - Census P25-1130). See Table 2.1.1.2M-2.27.1.2M
and Appendix F.1-F.2 for 95% confidence intervals for rates. Rates are suppressed and not ranked if the population of a specific
category (race, ethnicity) is less than 50,000 or if deaths are fewer than 16.‡ Data for specified racial or ethnic populations other than white and black should be interpreted with caution. See Technical
Notes.§ Hispanic origin is not mutually exclusive from race categories (white, black, Asian/Pacific Islander, American Indian/Alaska
Native).
Note: ONS — Other Nervous System; NOS — Not Otherwise Specified; IBD — Intrahepatic Bile Duct.
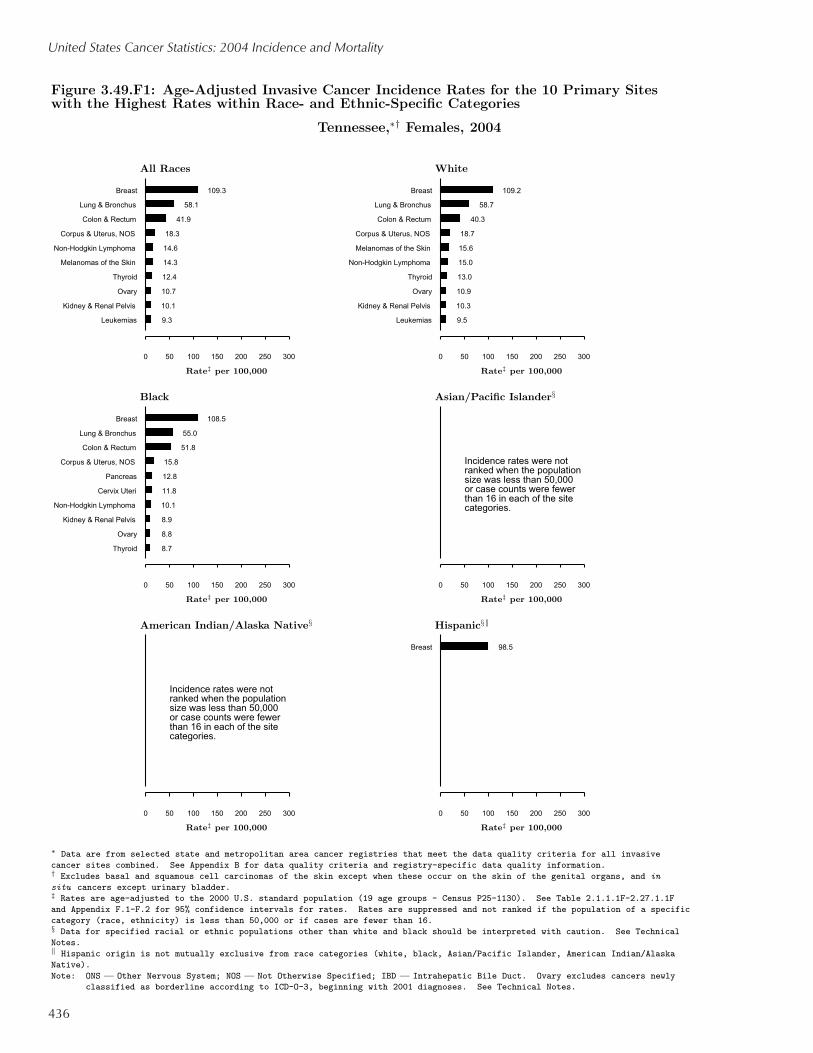
United States Cancer Statistics: 2004 Incidence and Mortality
�3�
Figure 3.49.F1: Age-Adjusted Invasive Cancer Incidence Rates for the 10 Primary Siteswith the Highest Rates within Race- and Ethnic-Specific Categories
Tennessee,∗† Females, 2004
Leukemias
Kidney & Renal Pelvis
Ovary
Thyroid
Melanomas of the Skin
Non-Hodgkin Lymphoma
Corpus & Uterus, NOS
Colon & Rectum
Lung & Bronchus
Breast
0 50 100 150 200 250 300
9.3
10.1
10.7
12.4
14.3
14.6
18.3
41.9
58.1
109.3
Leukemias
Kidney & Renal Pelvis
Ovary
Thyroid
Non-Hodgkin Lymphoma
Melanomas of the Skin
Corpus & Uterus, NOS
Colon & Rectum
Lung & Bronchus
Breast
0 50 100 150 200 250 300
9.5
10.3
10.9
13.0
15.0
15.6
18.7
40.3
58.7
109.2
Thyroid
Ovary
Kidney & Renal Pelvis
Non-Hodgkin Lymphoma
Cervix Uteri
Pancreas
Corpus & Uterus, NOS
Colon & Rectum
Lung & Bronchus
Breast
0 50 100 150 200 250 300
8.7
8.8
8.9
10.1
11.8
12.8
15.8
51.8
55.0
108.5
0 50 100 150 200 250 300
Incidence rates were notranked when the populationsize was less than 50,000or case counts were fewerthan 16 in each of the sitecategories.
0 50 100 150 200 250 300
Incidence rates were notranked when the populationsize was less than 50,000or case counts were fewerthan 16 in each of the sitecategories.
Breast
0 50 100 150 200 250 300
98.5
Rate‡ per 100,000Rate‡ per 100,000
Rate‡ per 100,000Rate‡ per 100,000
Rate‡ per 100,000Rate‡ per 100,000
All Races White
Black Asian/Pacific Islander§
American Indian/Alaska Native§ Hispanic§�
∗ Data are from selected state and metropolitan area cancer registries that meet the data quality criteria for all invasive
cancer sites combined. See Appendix B for data quality criteria and registry-specific data quality information.† Excludes basal and squamous cell carcinomas of the skin except when these occur on the skin of the genital organs, and in
situ cancers except urinary bladder.‡ Rates are age-adjusted to the 2000 U.S. standard population (19 age groups - Census P25-1130). See Table 2.1.1.1F-2.27.1.1F
and Appendix F.1-F.2 for 95% confidence intervals for rates. Rates are suppressed and not ranked if the population of a specific
category (race, ethnicity) is less than 50,000 or if cases are fewer than 16.§ Data for specified racial or ethnic populations other than white and black should be interpreted with caution. See Technical
Notes.� Hispanic origin is not mutually exclusive from race categories (white, black, Asian/Pacific Islander, American Indian/Alaska
Native).
Note: ONS — Other Nervous System; NOS — Not Otherwise Specified; IBD — Intrahepatic Bile Duct. Ovary excludes cancers newly
classified as borderline according to ICD-O-3, beginning with 2001 diagnoses. See Technical Notes.

State and Metropolitan-Area Incidence Rates and State Death Rates for the Most Common Cancers
�3�
Figure 3.49.F2: Age-Adjusted Cancer Death Rates for the 10 Primary Sites with theHighest Rates within Race- and Ethnic-Specific Categories
Tennessee,∗ Females, 2004
Corpus & Uterus, NOS
Myeloma
Brain & ONS
Non-Hodgkin Lymphoma
Leukemias
Ovary
Pancreas
Colon & Rectum
Breast
Lung & Bronchus
0 50 100 150
3.4
3.8
5.1
5.5
6.2
8.9
10.2
16.7
25.7
47.0
Corpus & Uterus, NOS
Myeloma
Brain & ONS
Non-Hodgkin Lymphoma
Leukemias
Ovary
Pancreas
Colon & Rectum
Breast
Lung & Bronchus
0 50 100 150
2.9
3.5
5.6
5.6
6.2
8.8
10.0
15.6
24.0
47.5
Cervix Uteri
Leukemias
Stomach
Myeloma
Corpus & Uterus, NOS
Ovary
Pancreas
Colon & Rectum
Breast
Lung & Bronchus
0 50 100 150
5.5
5.6
5.8
6.3
6.9
9.1
11.5
25.7
37.1
44.7
0 50 100 150
Death rates were notranked when the populationsize was less than 50,000or case counts were fewerthan 16 in each of the sitecategories.
0 50 100 150
Death rates were notranked when the populationsize was less than 50,000or case counts were fewerthan 16 in each of the sitecategories.
0 50 100 150
Death rates were notranked when the populationsize was less than 50,000or case counts were fewerthan 16 in each of the sitecategories.
Rate† per 100,000Rate† per 100,000
Rate† per 100,000Rate† per 100,000
Rate† per 100,000Rate† per 100,000
All Races White
Black Asian/Pacific Islander‡
American Indian/Alaska Native‡ Hispanic‡§
∗ Data are from the National Vital Statistics System (NVSS).† Rates are age-adjusted to the 2000 U.S. standard population (19 age groups - Census P25-1130). See Table 2.1.1.2F-2.27.1.2F
and Appendix F.1-F.2 for 95% confidence intervals for rates. Rates are suppressed and not ranked if the population of a specific
category (race, ethnicity) is less than 50,000 or if deaths are fewer than 16.‡ Data for specified racial or ethnic populations other than white and black should be interpreted with caution. See Technical
Notes.§ Hispanic origin is not mutually exclusive from race categories (white, black, Asian/Pacific Islander, American Indian/Alaska
Native).
Note: ONS — Other Nervous System; NOS — Not Otherwise Specified; IBD — Intrahepatic Bile Duct.

United States Cancer Statistics: 2004 Incidence and Mortality
�3�
Figure 3.50.M1: Age-Adjusted Invasive Cancer Incidence Rates for the 10 Primary Siteswith the Highest Rates within Race- and Ethnic-Specific Categories
Texas,∗† Males, 2004
Pancreas
Oral Cavity & Pharynx
Leukemias
Melanomas of the Skin
Kidney & Renal Pelvis
Non-Hodgkin Lymphoma
Urinary Bladder
Colon & Rectum
Lung & Bronchus
Prostate
0 50 100 150 200 250 300
13.1
15.8
16.2
18.8
21.9
22.1
30.0
58.0
86.6
136.8
Pancreas
Leukemias
Oral Cavity & Pharynx
Melanomas of the Skin
Kidney & Renal Pelvis
Non-Hodgkin Lymphoma
Urinary Bladder
Colon & Rectum
Lung & Bronchus
Prostate
0 50 100 150 200 250 300
12.6
16.1
16.2
20.2
21.9
22.2
31.3
56.0
84.1
123.5
Urinary Bladder
Larynx
Liver & IBD
Stomach
Non-Hodgkin Lymphoma
Pancreas
Kidney & Renal Pelvis
Colon & Rectum
Lung & Bronchus
Prostate
0 50 100 150 200 250 300
14.2
14.8
14.8
16.3
18.5
19.1
25.4
75.5
120.0
201.2
Oral Cavity & Pharynx
Leukemias
Kidney & Renal Pelvis
Non-Hodgkin Lymphoma
Stomach
Liver & IBD
Lung & Bronchus
Colon & Rectum
Prostate
0 50 100 150 200 250 300
4.7
6.6
8.7
10.3
14.0
25.8
41.8
50.1
54.6
Prostate
0 50 100 150 200 250 300
41.9
Leukemias
Pancreas
Stomach
Urinary Bladder
Non-Hodgkin Lymphoma
Liver & IBD
Kidney & Renal Pelvis
Lung & Bronchus
Colon & Rectum
Prostate
0 50 100 150 200 250 300
10.7
10.9
14.8
16.4
18.0
20.8
22.3
49.0
53.6
101.3
Rate‡ per 100,000Rate‡ per 100,000
Rate‡ per 100,000Rate‡ per 100,000
Rate‡ per 100,000Rate‡ per 100,000
All Races White
Black Asian/Pacific Islander§
American Indian/Alaska Native§ Hispanic§�
∗ Data are from selected state and metropolitan area cancer registries that meet the data quality criteria for all invasive
cancer sites combined. See Appendix B for data quality criteria and registry-specific data quality information.† Excludes basal and squamous cell carcinomas of the skin except when these occur on the skin of the genital organs, and in
situ cancers except urinary bladder.‡ Rates are age-adjusted to the 2000 U.S. standard population (19 age groups - Census P25-1130). See Table 2.1.1.1M-2.27.1.1M
and Appendix F.1-F.2 for 95% confidence intervals for rates. Rates are suppressed and not ranked if the population of a specific
category (race, ethnicity) is less than 50,000 or if cases are fewer than 16.§ Data for specified racial or ethnic populations other than white and black should be interpreted with caution. See Technical
Notes.� Hispanic origin is not mutually exclusive from race categories (white, black, Asian/Pacific Islander, American Indian/Alaska
Native).
Note: ONS — Other Nervous System; NOS — Not Otherwise Specified; IBD — Intrahepatic Bile Duct.

State and Metropolitan-Area Incidence Rates and State Death Rates for the Most Common Cancers
�3�
Figure 3.50.M2: Age-Adjusted Cancer Death Rates for the 10 Primary Sites with theHighest Rates within Race- and Ethnic-Specific Categories
Texas,∗ Males, 2004
Urinary Bladder
Esophagus
Kidney & Renal Pelvis
Non-Hodgkin Lymphoma
Leukemias
Liver & IBD
Pancreas
Colon & Rectum
Prostate
Lung & Bronchus
0 50 100 150
6.5
6.7
6.8
8.6
9.8
10.5
11.7
21.3
25.1
70.1
Esophagus
Urinary Bladder
Kidney & Renal Pelvis
Non-Hodgkin Lymphoma
Liver & IBD
Leukemias
Pancreas
Colon & Rectum
Prostate
Lung & Bronchus
0 50 100 150
6.5
6.7
6.9
8.6
9.9
10.0
11.4
20.9
22.9
68.0
Oral Cavity & Pharynx
Non-Hodgkin Lymphoma
Esophagus
Leukemias
Stomach
Liver & IBD
Pancreas
Colon & Rectum
Prostate
Lung & Bronchus
0 50 100 150
8.3
8.7
9.2
9.5
10.9
14.9
17.4
28.8
57.0
105.7
Non-Hodgkin Lymphoma
Stomach
Colon & Rectum
Liver & IBD
Lung & Bronchus
0 50 100 150
8.4
10.0
12.3
16.1
30.4
0 50 100 150
Death rates were notranked when the populationsize was less than 50,000or case counts were fewerthan 16 in each of the sitecategories.
Esophagus
Leukemias
Non-Hodgkin Lymphoma
Kidney & Renal Pelvis
Pancreas
Stomach
Liver & IBD
Colon & Rectum
Prostate
Lung & Bronchus
0 50 100 150
4.5
5.7
6.8
8.7
9.8
10.0
15.9
18.6
20.3
36.1
Rate† per 100,000Rate† per 100,000
Rate† per 100,000Rate† per 100,000
Rate† per 100,000Rate† per 100,000
All Races White
Black Asian/Pacific Islander‡
American Indian/Alaska Native‡ Hispanic‡§
∗ Data are from the National Vital Statistics System (NVSS).† Rates are age-adjusted to the 2000 U.S. standard population (19 age groups - Census P25-1130). See Table 2.1.1.2M-2.27.1.2M
and Appendix F.1-F.2 for 95% confidence intervals for rates. Rates are suppressed and not ranked if the population of a specific
category (race, ethnicity) is less than 50,000 or if deaths are fewer than 16.‡ Data for specified racial or ethnic populations other than white and black should be interpreted with caution. See Technical
Notes.§ Hispanic origin is not mutually exclusive from race categories (white, black, Asian/Pacific Islander, American Indian/Alaska
Native).
Note: ONS — Other Nervous System; NOS — Not Otherwise Specified; IBD — Intrahepatic Bile Duct.

United States Cancer Statistics: 2004 Incidence and Mortality
��0
Figure 3.50.F1: Age-Adjusted Invasive Cancer Incidence Rates for the 10 Primary Siteswith the Highest Rates within Race- and Ethnic-Specific Categories
Texas,∗† Females, 2004
Leukemias
Melanomas of the Skin
Kidney & Renal Pelvis
Ovary
Thyroid
Non-Hodgkin Lymphoma
Corpus & Uterus, NOS
Colon & Rectum
Lung & Bronchus
Breast
0 50 100 150 200 250 300
9.8
9.9
11.5
12.2
12.9
15.9
18.0
39.1
50.7
109.5
Leukemias
Melanomas of the Skin
Kidney & Renal Pelvis
Ovary
Thyroid
Non-Hodgkin Lymphoma
Corpus & Uterus, NOS
Colon & Rectum
Lung & Bronchus
Breast
0 50 100 150 200 250 300
10.0
10.7
11.6
12.6
13.3
16.2
18.0
37.7
51.2
109.1
Myeloma
Ovary
Non-Hodgkin Lymphoma
Cervix Uteri
Kidney & Renal Pelvis
Pancreas
Corpus & Uterus, NOS
Lung & Bronchus
Colon & Rectum
Breast
0 50 100 150 200 250 300
9.6
10.6
11.0
11.0
12.0
14.4
17.9
50.7
52.6
113.5
Cervix Uteri
Ovary
Corpus & Uterus, NOS
Thyroid
Non-Hodgkin Lymphoma
Liver & IBD
Lung & Bronchus
Colon & Rectum
Breast
0 50 100 150 200 250 300
5.6
7.0
9.3
9.6
10.4
10.4
19.9
24.2
54.1
Breast
0 50 100 150 200 250 300
21.4
Liver & IBD
Ovary
Kidney & Renal Pelvis
Thyroid
Cervix Uteri
Non-Hodgkin Lymphoma
Corpus & Uterus, NOS
Lung & Bronchus
Colon & Rectum
Breast
0 50 100 150 200 250 300
9.2
11.7
12.8
13.0
13.9
14.8
16.1
23.0
30.0
79.4
Rate‡ per 100,000Rate‡ per 100,000
Rate‡ per 100,000Rate‡ per 100,000
Rate‡ per 100,000Rate‡ per 100,000
All Races White
Black Asian/Pacific Islander§
American Indian/Alaska Native§ Hispanic§�
∗ Data are from selected state and metropolitan area cancer registries that meet the data quality criteria for all invasive
cancer sites combined. See Appendix B for data quality criteria and registry-specific data quality information.† Excludes basal and squamous cell carcinomas of the skin except when these occur on the skin of the genital organs, and in
situ cancers except urinary bladder.‡ Rates are age-adjusted to the 2000 U.S. standard population (19 age groups - Census P25-1130). See Table 2.1.1.1F-2.27.1.1F
and Appendix F.1-F.2 for 95% confidence intervals for rates. Rates are suppressed and not ranked if the population of a specific
category (race, ethnicity) is less than 50,000 or if cases are fewer than 16.§ Data for specified racial or ethnic populations other than white and black should be interpreted with caution. See Technical
Notes.� Hispanic origin is not mutually exclusive from race categories (white, black, Asian/Pacific Islander, American Indian/Alaska
Native).
Note: ONS — Other Nervous System; NOS — Not Otherwise Specified; IBD — Intrahepatic Bile Duct. Ovary excludes cancers newly
classified as borderline according to ICD-O-3, beginning with 2001 diagnoses. See Technical Notes.

State and Metropolitan-Area Incidence Rates and State Death Rates for the Most Common Cancers
���
Figure 3.50.F2: Age-Adjusted Cancer Death Rates for the 10 Primary Sites with theHighest Rates within Race- and Ethnic-Specific Categories
Texas,∗ Females, 2004
Cervix Uteri
Corpus & Uterus, NOS
Liver & IBD
Leukemias
Non-Hodgkin Lymphoma
Ovary
Pancreas
Colon & Rectum
Breast
Lung & Bronchus
0 50 100 150
3.4
3.5
4.1
5.5
5.7
7.6
8.8
14.2
23.2
38.8
Corpus & Uterus, NOS
Brain & ONS
Liver & IBD
Leukemias
Non-Hodgkin Lymphoma
Ovary
Pancreas
Colon & Rectum
Breast
Lung & Bronchus
0 50 100 150
3.3
3.5
3.9
5.7
5.8
7.5
8.5
13.7
22.2
38.5
Liver & IBD
Non-Hodgkin Lymphoma
Cervix Uteri
Corpus & Uterus, NOS
Myeloma
Ovary
Pancreas
Colon & Rectum
Breast
Lung & Bronchus
0 50 100 150
5.3
5.4
5.7
5.9
6.9
9.6
12.7
20.1
35.3
45.5
Pancreas
Breast
Colon & Rectum
Lung & Bronchus
0 50 100 150
6.4
8.5
11.8
20.4
0 50 100 150
Death rates were notranked when the populationsize was less than 50,000or case counts were fewerthan 16 in each of the sitecategories.
Cervix Uteri
Non-Hodgkin Lymphoma
Leukemias
Ovary
Stomach
Liver & IBD
Pancreas
Colon & Rectum
Lung & Bronchus
Breast
0 50 100 150
4.2
4.4
4.6
5.7
5.7
6.6
7.8
11.5
14.8
17.2
Rate† per 100,000Rate† per 100,000
Rate† per 100,000Rate† per 100,000
Rate† per 100,000Rate† per 100,000
All Races White
Black Asian/Pacific Islander‡
American Indian/Alaska Native‡ Hispanic‡§
∗ Data are from the National Vital Statistics System (NVSS).† Rates are age-adjusted to the 2000 U.S. standard population (19 age groups - Census P25-1130). See Table 2.1.1.2F-2.27.1.2F
and Appendix F.1-F.2 for 95% confidence intervals for rates. Rates are suppressed and not ranked if the population of a specific
category (race, ethnicity) is less than 50,000 or if deaths are fewer than 16.‡ Data for specified racial or ethnic populations other than white and black should be interpreted with caution. See Technical
Notes.§ Hispanic origin is not mutually exclusive from race categories (white, black, Asian/Pacific Islander, American Indian/Alaska
Native).
Note: ONS — Other Nervous System; NOS — Not Otherwise Specified; IBD — Intrahepatic Bile Duct.

United States Cancer Statistics: 2004 Incidence and Mortality
���
Figure 3.51.M1: Age-Adjusted Invasive Cancer Incidence Rates for the 10 Primary Siteswith the Highest Rates within Race- and Ethnic-Specific Categories
Utah,∗† Males, 2004
Oral Cavity & Pharynx
Pancreas
Kidney & Renal Pelvis
Leukemias
Non-Hodgkin Lymphoma
Urinary Bladder
Melanomas of the Skin
Lung & Bronchus
Colon & Rectum
Prostate
0 50 100 150 200 250 300
11.7
12.2
13.5
14.8
24.1
27.1
31.0
37.5
47.5
186.3
Oral Cavity & Pharynx
Pancreas
Kidney & Renal Pelvis
Leukemias
Non-Hodgkin Lymphoma
Urinary Bladder
Melanomas of the Skin
Lung & Bronchus
Colon & Rectum
Prostate
0 50 100 150 200 250 300
11.7
12.2
13.9
14.8
24.5
27.4
32.0
37.1
48.5
186.0
0 50 100 150 200 250 300
Incidence rates were notranked when the populationsize was less than 50,000or case counts were fewerthan 16 in each of the sitecategories.
0 50 100 150 200 250 300
Incidence rates were notranked when the populationsize was less than 50,000or case counts were fewerthan 16 in each of the sitecategories.
0 50 100 150 200 250 300
Incidence rates were notranked when the populationsize was less than 50,000or case counts were fewerthan 16 in each of the sitecategories.
Colon & Rectum
Prostate
0 50 100 150 200 250 300
53.7
127.2
Rate‡ per 100,000Rate‡ per 100,000
Rate‡ per 100,000Rate‡ per 100,000
Rate‡ per 100,000Rate‡ per 100,000
All Races White
Black Asian/Pacific Islander§
American Indian/Alaska Native§ Hispanic§�
∗ Data are from selected state and metropolitan area cancer registries that meet the data quality criteria for all invasive
cancer sites combined. See Appendix B for data quality criteria and registry-specific data quality information.† Excludes basal and squamous cell carcinomas of the skin except when these occur on the skin of the genital organs, and in
situ cancers except urinary bladder.‡ Rates are age-adjusted to the 2000 U.S. standard population (19 age groups - Census P25-1130). See Table 2.1.1.1M-2.27.1.1M
and Appendix F.1-F.2 for 95% confidence intervals for rates. Rates are suppressed and not ranked if the population of a specific
category (race, ethnicity) is less than 50,000 or if cases are fewer than 16.§ Data for specified racial or ethnic populations other than white and black should be interpreted with caution. See Technical
Notes.� Hispanic origin is not mutually exclusive from race categories (white, black, Asian/Pacific Islander, American Indian/Alaska
Native).
Note: ONS — Other Nervous System; NOS — Not Otherwise Specified; IBD — Intrahepatic Bile Duct.

State and Metropolitan-Area Incidence Rates and State Death Rates for the Most Common Cancers
��3
Figure 3.51.M2: Age-Adjusted Cancer Death Rates for the 10 Primary Sites with theHighest Rates within Race- and Ethnic-Specific Categories
Utah,∗ Males, 2004
Melanomas of the Skin
Brain & ONS
Esophagus
Urinary Bladder
Leukemias
Non-Hodgkin Lymphoma
Pancreas
Colon & Rectum
Prostate
Lung & Bronchus
0 50 100 150
4.3
5.0
6.7
7.3
8.6
9.3
11.0
15.0
24.2
35.6
Melanomas of the Skin
Brain & ONS
Esophagus
Urinary Bladder
Leukemias
Non-Hodgkin Lymphoma
Pancreas
Colon & Rectum
Prostate
Lung & Bronchus
0 50 100 150
4.5
5.1
6.8
7.4
8.8
9.4
10.9
15.5
24.4
35.4
0 50 100 150
Death rates were notranked when the populationsize was less than 50,000or case counts were fewerthan 16 in each of the sitecategories.
0 50 100 150
Death rates were notranked when the populationsize was less than 50,000or case counts were fewerthan 16 in each of the sitecategories.
0 50 100 150
Death rates were notranked when the populationsize was less than 50,000or case counts were fewerthan 16 in each of the sitecategories.
0 50 100 150
Death rates were notranked when the populationsize was less than 50,000or case counts were fewerthan 16 in each of the sitecategories.
Rate† per 100,000Rate† per 100,000
Rate† per 100,000Rate† per 100,000
Rate† per 100,000Rate† per 100,000
All Races White
Black Asian/Pacific Islander‡
American Indian/Alaska Native‡ Hispanic‡§
∗ Data are from the National Vital Statistics System (NVSS).† Rates are age-adjusted to the 2000 U.S. standard population (19 age groups - Census P25-1130). See Table 2.1.1.2M-2.27.1.2M
and Appendix F.1-F.2 for 95% confidence intervals for rates. Rates are suppressed and not ranked if the population of a specific
category (race, ethnicity) is less than 50,000 or if deaths are fewer than 16.‡ Data for specified racial or ethnic populations other than white and black should be interpreted with caution. See Technical
Notes.§ Hispanic origin is not mutually exclusive from race categories (white, black, Asian/Pacific Islander, American Indian/Alaska
Native).
Note: ONS — Other Nervous System; NOS — Not Otherwise Specified; IBD — Intrahepatic Bile Duct.
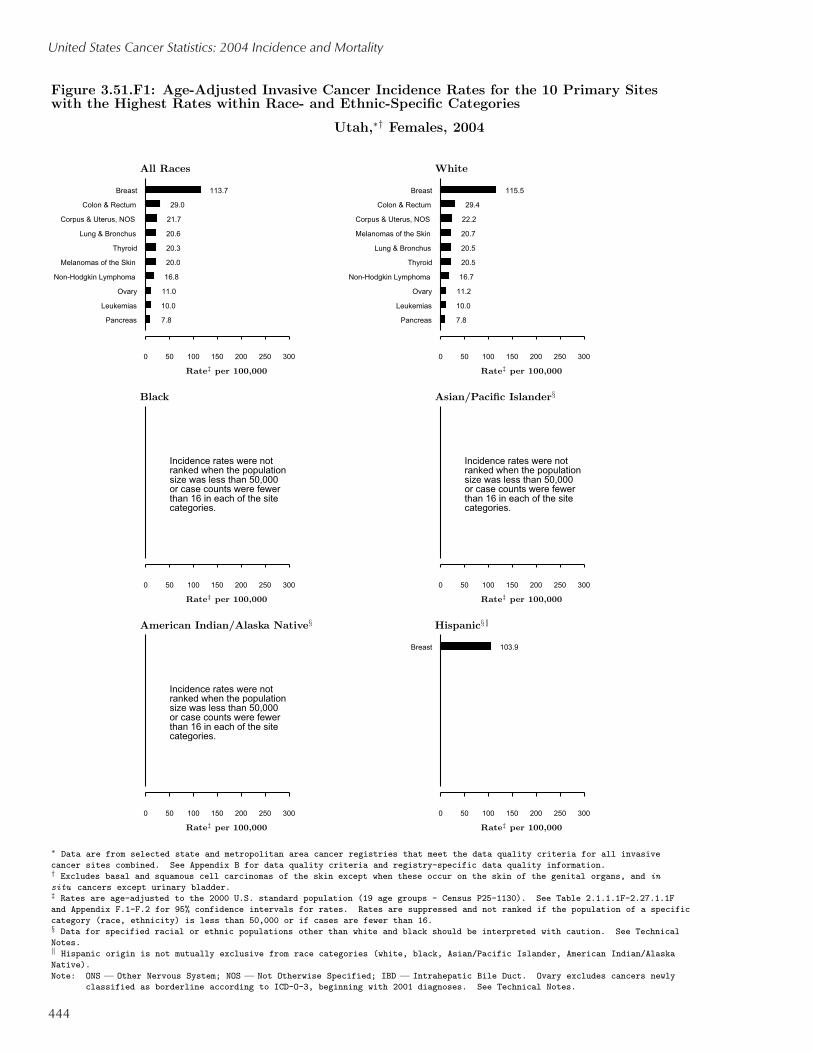
United States Cancer Statistics: 2004 Incidence and Mortality
���
Figure 3.51.F1: Age-Adjusted Invasive Cancer Incidence Rates for the 10 Primary Siteswith the Highest Rates within Race- and Ethnic-Specific Categories
Utah,∗† Females, 2004
Pancreas
Leukemias
Ovary
Non-Hodgkin Lymphoma
Melanomas of the Skin
Thyroid
Lung & Bronchus
Corpus & Uterus, NOS
Colon & Rectum
Breast
0 50 100 150 200 250 300
7.8
10.0
11.0
16.8
20.0
20.3
20.6
21.7
29.0
113.7
Pancreas
Leukemias
Ovary
Non-Hodgkin Lymphoma
Thyroid
Lung & Bronchus
Melanomas of the Skin
Corpus & Uterus, NOS
Colon & Rectum
Breast
0 50 100 150 200 250 300
7.8
10.0
11.2
16.7
20.5
20.5
20.7
22.2
29.4
115.5
0 50 100 150 200 250 300
Incidence rates were notranked when the populationsize was less than 50,000or case counts were fewerthan 16 in each of the sitecategories.
0 50 100 150 200 250 300
Incidence rates were notranked when the populationsize was less than 50,000or case counts were fewerthan 16 in each of the sitecategories.
0 50 100 150 200 250 300
Incidence rates were notranked when the populationsize was less than 50,000or case counts were fewerthan 16 in each of the sitecategories.
Breast
0 50 100 150 200 250 300
103.9
Rate‡ per 100,000Rate‡ per 100,000
Rate‡ per 100,000Rate‡ per 100,000
Rate‡ per 100,000Rate‡ per 100,000
All Races White
Black Asian/Pacific Islander§
American Indian/Alaska Native§ Hispanic§�
∗ Data are from selected state and metropolitan area cancer registries that meet the data quality criteria for all invasive
cancer sites combined. See Appendix B for data quality criteria and registry-specific data quality information.† Excludes basal and squamous cell carcinomas of the skin except when these occur on the skin of the genital organs, and in
situ cancers except urinary bladder.‡ Rates are age-adjusted to the 2000 U.S. standard population (19 age groups - Census P25-1130). See Table 2.1.1.1F-2.27.1.1F
and Appendix F.1-F.2 for 95% confidence intervals for rates. Rates are suppressed and not ranked if the population of a specific
category (race, ethnicity) is less than 50,000 or if cases are fewer than 16.§ Data for specified racial or ethnic populations other than white and black should be interpreted with caution. See Technical
Notes.� Hispanic origin is not mutually exclusive from race categories (white, black, Asian/Pacific Islander, American Indian/Alaska
Native).
Note: ONS — Other Nervous System; NOS — Not Otherwise Specified; IBD — Intrahepatic Bile Duct. Ovary excludes cancers newly
classified as borderline according to ICD-O-3, beginning with 2001 diagnoses. See Technical Notes.
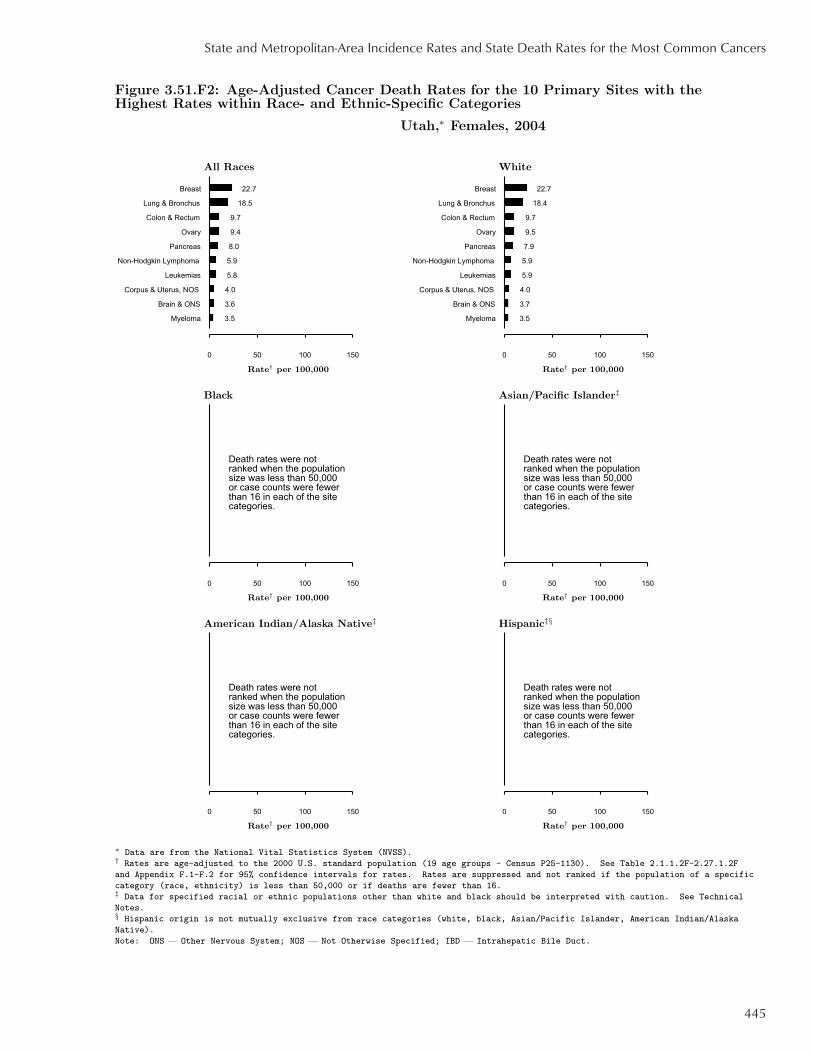
State and Metropolitan-Area Incidence Rates and State Death Rates for the Most Common Cancers
���
Figure 3.51.F2: Age-Adjusted Cancer Death Rates for the 10 Primary Sites with theHighest Rates within Race- and Ethnic-Specific Categories
Utah,∗ Females, 2004
Myeloma
Brain & ONS
Corpus & Uterus, NOS
Leukemias
Non-Hodgkin Lymphoma
Pancreas
Ovary
Colon & Rectum
Lung & Bronchus
Breast
0 50 100 150
3.5
3.6
4.0
5.8
5.9
8.0
9.4
9.7
18.5
22.7
Myeloma
Brain & ONS
Corpus & Uterus, NOS
Leukemias
Non-Hodgkin Lymphoma
Pancreas
Ovary
Colon & Rectum
Lung & Bronchus
Breast
0 50 100 150
3.5
3.7
4.0
5.9
5.9
7.9
9.5
9.7
18.4
22.7
0 50 100 150
Death rates were notranked when the populationsize was less than 50,000or case counts were fewerthan 16 in each of the sitecategories.
0 50 100 150
Death rates were notranked when the populationsize was less than 50,000or case counts were fewerthan 16 in each of the sitecategories.
0 50 100 150
Death rates were notranked when the populationsize was less than 50,000or case counts were fewerthan 16 in each of the sitecategories.
0 50 100 150
Death rates were notranked when the populationsize was less than 50,000or case counts were fewerthan 16 in each of the sitecategories.
Rate† per 100,000Rate† per 100,000
Rate† per 100,000Rate† per 100,000
Rate† per 100,000Rate† per 100,000
All Races White
Black Asian/Pacific Islander‡
American Indian/Alaska Native‡ Hispanic‡§
∗ Data are from the National Vital Statistics System (NVSS).† Rates are age-adjusted to the 2000 U.S. standard population (19 age groups - Census P25-1130). See Table 2.1.1.2F-2.27.1.2F
and Appendix F.1-F.2 for 95% confidence intervals for rates. Rates are suppressed and not ranked if the population of a specific
category (race, ethnicity) is less than 50,000 or if deaths are fewer than 16.‡ Data for specified racial or ethnic populations other than white and black should be interpreted with caution. See Technical
Notes.§ Hispanic origin is not mutually exclusive from race categories (white, black, Asian/Pacific Islander, American Indian/Alaska
Native).
Note: ONS — Other Nervous System; NOS — Not Otherwise Specified; IBD — Intrahepatic Bile Duct.

United States Cancer Statistics: 2004 Incidence and Mortality
���
Figure 3.52.M1: Age-Adjusted Invasive Cancer Incidence Rates for the 10 Primary Siteswith the Highest Rates within Race- and Ethnic-Specific Categories
Vermont,∗† Males, 2004
Pancreas
Oral Cavity & Pharynx
Kidney & Renal Pelvis
Leukemias
Non-Hodgkin Lymphoma
Melanomas of the Skin
Urinary Bladder
Colon & Rectum
Lung & Bronchus
Prostate
0 50 100 150 200 250 300
13.6
16.3
19.7
22.2
22.5
31.6
47.4
50.2
77.1
148.6
Pancreas
Oral Cavity & Pharynx
Kidney & Renal Pelvis
Non-Hodgkin Lymphoma
Leukemias
Melanomas of the Skin
Urinary Bladder
Colon & Rectum
Lung & Bronchus
Prostate
0 50 100 150 200 250 300
13.7
16.5
19.9
22.4
22.5
31.7
46.1
50.3
76.8
148.9
0 50 100 150 200 250 300
Incidence rates were notranked when the populationsize was less than 50,000or case counts were fewerthan 16 in each of the sitecategories.
0 50 100 150 200 250 300
Incidence rates were notranked when the populationsize was less than 50,000or case counts were fewerthan 16 in each of the sitecategories.
0 50 100 150 200 250 300
Incidence rates were notranked when the populationsize was less than 50,000or case counts were fewerthan 16 in each of the sitecategories.
0 50 100 150 200 250 300
Incidence rates were notranked when the populationsize was less than 50,000or case counts were fewerthan 16 in each of the sitecategories.
Rate‡ per 100,000Rate‡ per 100,000
Rate‡ per 100,000Rate‡ per 100,000
Rate‡ per 100,000Rate‡ per 100,000
All Races White
Black Asian/Pacific Islander§
American Indian/Alaska Native§ Hispanic§�
∗ Data are from selected state and metropolitan area cancer registries that meet the data quality criteria for all invasive
cancer sites combined. See Appendix B for data quality criteria and registry-specific data quality information.† Excludes basal and squamous cell carcinomas of the skin except when these occur on the skin of the genital organs, and in
situ cancers except urinary bladder.‡ Rates are age-adjusted to the 2000 U.S. standard population (19 age groups - Census P25-1130). See Table 2.1.1.1M-2.27.1.1M
and Appendix F.1-F.2 for 95% confidence intervals for rates. Rates are suppressed and not ranked if the population of a specific
category (race, ethnicity) is less than 50,000 or if cases are fewer than 16.§ Data for specified racial or ethnic populations other than white and black should be interpreted with caution. See Technical
Notes.� Hispanic origin is not mutually exclusive from race categories (white, black, Asian/Pacific Islander, American Indian/Alaska
Native).
Note: ONS — Other Nervous System; NOS — Not Otherwise Specified; IBD — Intrahepatic Bile Duct.

State and Metropolitan-Area Incidence Rates and State Death Rates for the Most Common Cancers
���
Figure 3.52.M2: Age-Adjusted Cancer Death Rates for the 10 Primary Sites with theHighest Rates within Race- and Ethnic-Specific Categories
Vermont,∗ Males, 2004
Kidney & Renal Pelvis
Esophagus
Liver & IBD
Urinary Bladder
Leukemias
Non-Hodgkin Lymphoma
Pancreas
Colon & Rectum
Prostate
Lung & Bronchus
0 50 100 150
5.3
5.6
6.0
7.4
7.5
8.4
11.4
21.6
29.2
64.1
Kidney & Renal Pelvis
Esophagus
Liver & IBD
Urinary Bladder
Leukemias
Non-Hodgkin Lymphoma
Pancreas
Colon & Rectum
Prostate
Lung & Bronchus
0 50 100 150
5.3
5.6
5.8
7.2
7.6
8.1
11.5
21.8
29.4
64.8
0 50 100 150
Death rates were notranked when the populationsize was less than 50,000or case counts were fewerthan 16 in each of the sitecategories.
0 50 100 150
Death rates were notranked when the populationsize was less than 50,000or case counts were fewerthan 16 in each of the sitecategories.
0 50 100 150
Death rates were notranked when the populationsize was less than 50,000or case counts were fewerthan 16 in each of the sitecategories.
0 50 100 150
Death rates were notranked when the populationsize was less than 50,000or case counts were fewerthan 16 in each of the sitecategories.
Rate† per 100,000Rate† per 100,000
Rate† per 100,000Rate† per 100,000
Rate† per 100,000Rate† per 100,000
All Races White
Black Asian/Pacific Islander‡
American Indian/Alaska Native‡ Hispanic‡§
∗ Data are from the National Vital Statistics System (NVSS).† Rates are age-adjusted to the 2000 U.S. standard population (19 age groups - Census P25-1130). See Table 2.1.1.2M-2.27.1.2M
and Appendix F.1-F.2 for 95% confidence intervals for rates. Rates are suppressed and not ranked if the population of a specific
category (race, ethnicity) is less than 50,000 or if deaths are fewer than 16.‡ Data for specified racial or ethnic populations other than white and black should be interpreted with caution. See Technical
Notes.§ Hispanic origin is not mutually exclusive from race categories (white, black, Asian/Pacific Islander, American Indian/Alaska
Native).
Note: ONS — Other Nervous System; NOS — Not Otherwise Specified; IBD — Intrahepatic Bile Duct.

United States Cancer Statistics: 2004 Incidence and Mortality
���
Figure 3.52.F1: Age-Adjusted Invasive Cancer Incidence Rates for the 10 Primary Siteswith the Highest Rates within Race- and Ethnic-Specific Categories
Vermont,∗† Females, 2004
Pancreas
Urinary Bladder
Ovary
Non-Hodgkin Lymphoma
Thyroid
Melanomas of the Skin
Corpus & Uterus, NOS
Colon & Rectum
Lung & Bronchus
Breast
0 50 100 150 200 250 300
11.5
11.6
11.7
14.3
16.8
28.5
30.2
40.0
52.3
127.6
Pancreas
Urinary Bladder
Ovary
Non-Hodgkin Lymphoma
Thyroid
Melanomas of the Skin
Corpus & Uterus, NOS
Colon & Rectum
Lung & Bronchus
Breast
0 50 100 150 200 250 300
11.6
11.7
11.9
14.5
16.9
29.0
30.5
40.0
52.8
128.0
0 50 100 150 200 250 300
Incidence rates were notranked when the populationsize was less than 50,000or case counts were fewerthan 16 in each of the sitecategories.
0 50 100 150 200 250 300
Incidence rates were notranked when the populationsize was less than 50,000or case counts were fewerthan 16 in each of the sitecategories.
0 50 100 150 200 250 300
Incidence rates were notranked when the populationsize was less than 50,000or case counts were fewerthan 16 in each of the sitecategories.
0 50 100 150 200 250 300
Incidence rates were notranked when the populationsize was less than 50,000or case counts were fewerthan 16 in each of the sitecategories.
Rate‡ per 100,000Rate‡ per 100,000
Rate‡ per 100,000Rate‡ per 100,000
Rate‡ per 100,000Rate‡ per 100,000
All Races White
Black Asian/Pacific Islander§
American Indian/Alaska Native§ Hispanic§�
∗ Data are from selected state and metropolitan area cancer registries that meet the data quality criteria for all invasive
cancer sites combined. See Appendix B for data quality criteria and registry-specific data quality information.† Excludes basal and squamous cell carcinomas of the skin except when these occur on the skin of the genital organs, and in
situ cancers except urinary bladder.‡ Rates are age-adjusted to the 2000 U.S. standard population (19 age groups - Census P25-1130). See Table 2.1.1.1F-2.27.1.1F
and Appendix F.1-F.2 for 95% confidence intervals for rates. Rates are suppressed and not ranked if the population of a specific
category (race, ethnicity) is less than 50,000 or if cases are fewer than 16.§ Data for specified racial or ethnic populations other than white and black should be interpreted with caution. See Technical
Notes.� Hispanic origin is not mutually exclusive from race categories (white, black, Asian/Pacific Islander, American Indian/Alaska
Native).
Note: ONS — Other Nervous System; NOS — Not Otherwise Specified; IBD — Intrahepatic Bile Duct. Ovary excludes cancers newly
classified as borderline according to ICD-O-3, beginning with 2001 diagnoses. See Technical Notes.
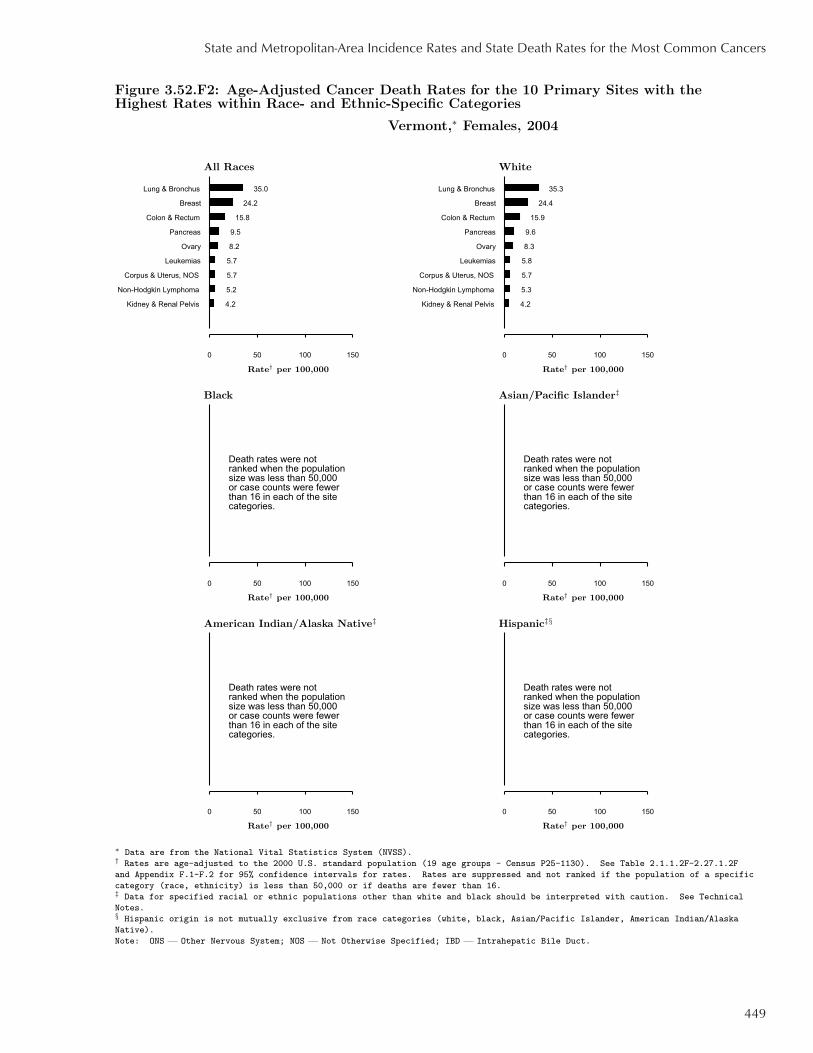
State and Metropolitan-Area Incidence Rates and State Death Rates for the Most Common Cancers
���
Figure 3.52.F2: Age-Adjusted Cancer Death Rates for the 10 Primary Sites with theHighest Rates within Race- and Ethnic-Specific Categories
Vermont,∗ Females, 2004
Kidney & Renal Pelvis
Non-Hodgkin Lymphoma
Corpus & Uterus, NOS
Leukemias
Ovary
Pancreas
Colon & Rectum
Breast
Lung & Bronchus
0 50 100 150
4.2
5.2
5.7
5.7
8.2
9.5
15.8
24.2
35.0
Kidney & Renal Pelvis
Non-Hodgkin Lymphoma
Corpus & Uterus, NOS
Leukemias
Ovary
Pancreas
Colon & Rectum
Breast
Lung & Bronchus
0 50 100 150
4.2
5.3
5.7
5.8
8.3
9.6
15.9
24.4
35.3
0 50 100 150
Death rates were notranked when the populationsize was less than 50,000or case counts were fewerthan 16 in each of the sitecategories.
0 50 100 150
Death rates were notranked when the populationsize was less than 50,000or case counts were fewerthan 16 in each of the sitecategories.
0 50 100 150
Death rates were notranked when the populationsize was less than 50,000or case counts were fewerthan 16 in each of the sitecategories.
0 50 100 150
Death rates were notranked when the populationsize was less than 50,000or case counts were fewerthan 16 in each of the sitecategories.
Rate† per 100,000Rate† per 100,000
Rate† per 100,000Rate† per 100,000
Rate† per 100,000Rate† per 100,000
All Races White
Black Asian/Pacific Islander‡
American Indian/Alaska Native‡ Hispanic‡§
∗ Data are from the National Vital Statistics System (NVSS).† Rates are age-adjusted to the 2000 U.S. standard population (19 age groups - Census P25-1130). See Table 2.1.1.2F-2.27.1.2F
and Appendix F.1-F.2 for 95% confidence intervals for rates. Rates are suppressed and not ranked if the population of a specific
category (race, ethnicity) is less than 50,000 or if deaths are fewer than 16.‡ Data for specified racial or ethnic populations other than white and black should be interpreted with caution. See Technical
Notes.§ Hispanic origin is not mutually exclusive from race categories (white, black, Asian/Pacific Islander, American Indian/Alaska
Native).
Note: ONS — Other Nervous System; NOS — Not Otherwise Specified; IBD — Intrahepatic Bile Duct.

United States Cancer Statistics: 2004 Incidence and Mortality
��0
Figure 3.53.M1: Age-Adjusted Invasive Cancer Incidence Rates for the 10 Primary Siteswith the Highest Rates within Race- and Ethnic-Specific Categories
Virginia,∗† Males, 2004
Pancreas
Leukemias
Oral Cavity & Pharynx
Kidney & Renal Pelvis
Non-Hodgkin Lymphoma
Melanomas of the Skin
Urinary Bladder
Colon & Rectum
Lung & Bronchus
Prostate
0 50 100 150 200 250 300
12.0
12.3
14.1
17.8
19.5
21.2
33.5
55.8
88.6
139.3
Pancreas
Leukemias
Oral Cavity & Pharynx
Kidney & Renal Pelvis
Non-Hodgkin Lymphoma
Melanomas of the Skin
Urinary Bladder
Colon & Rectum
Lung & Bronchus
Prostate
0 50 100 150 200 250 300
11.4
12.0
13.6
17.7
20.6
25.2
35.9
53.0
87.0
123.5
Leukemias
Non-Hodgkin Lymphoma
Pancreas
Oral Cavity & Pharynx
Stomach
Kidney & Renal Pelvis
Urinary Bladder
Colon & Rectum
Lung & Bronchus
Prostate
0 50 100 150 200 250 300
11.9
12.9
16.1
16.8
19.0
19.9
20.6
72.3
105.3
211.2
Urinary Bladder
Stomach
Liver & IBD
Colon & Rectum
Lung & Bronchus
Prostate
0 50 100 150 200 250 300
18.5
18.8
23.1
32.7
43.6
69.1
0 50 100 150 200 250 300
Incidence rates were notranked when the populationsize was less than 50,000or case counts were fewerthan 16 in each of the sitecategories.
Non-Hodgkin Lymphoma
Colon & Rectum
Lung & Bronchus
Prostate
0 50 100 150 200 250 300
20.6
29.7
34.0
125.1
Rate‡ per 100,000Rate‡ per 100,000
Rate‡ per 100,000Rate‡ per 100,000
Rate‡ per 100,000Rate‡ per 100,000
All Races White
Black Asian/Pacific Islander§
American Indian/Alaska Native§ Hispanic§�
∗ Data are from selected state and metropolitan area cancer registries that meet the data quality criteria for all invasive
cancer sites combined. See Appendix B for data quality criteria and registry-specific data quality information.† Excludes basal and squamous cell carcinomas of the skin except when these occur on the skin of the genital organs, and in
situ cancers except urinary bladder.‡ Rates are age-adjusted to the 2000 U.S. standard population (19 age groups - Census P25-1130). See Table 2.1.1.1M-2.27.1.1M
and Appendix F.1-F.2 for 95% confidence intervals for rates. Rates are suppressed and not ranked if the population of a specific
category (race, ethnicity) is less than 50,000 or if cases are fewer than 16.§ Data for specified racial or ethnic populations other than white and black should be interpreted with caution. See Technical
Notes.� Hispanic origin is not mutually exclusive from race categories (white, black, Asian/Pacific Islander, American Indian/Alaska
Native).
Note: ONS — Other Nervous System; NOS — Not Otherwise Specified; IBD — Intrahepatic Bile Duct.

State and Metropolitan-Area Incidence Rates and State Death Rates for the Most Common Cancers
���
Figure 3.53.M2: Age-Adjusted Cancer Death Rates for the 10 Primary Sites with theHighest Rates within Race- and Ethnic-Specific Categories
Virginia,∗ Males, 2004
Kidney & Renal Pelvis
Liver & IBD
Urinary Bladder
Esophagus
Non-Hodgkin Lymphoma
Leukemias
Pancreas
Colon & Rectum
Prostate
Lung & Bronchus
0 50 100 150
5.8
6.7
7.3
7.4
8.3
9.7
12.5
22.9
25.7
75.0
Liver & IBD
Kidney & Renal Pelvis
Esophagus
Urinary Bladder
Non-Hodgkin Lymphoma
Leukemias
Pancreas
Colon & Rectum
Prostate
Lung & Bronchus
0 50 100 150
5.7
5.9
7.4
7.8
8.9
9.9
12.1
21.6
21.7
72.0
Kidney & Renal Pelvis
Esophagus
Leukemias
Myeloma
Liver & IBD
Stomach
Pancreas
Colon & Rectum
Prostate
Lung & Bronchus
0 50 100 150
6.2
7.5
9.2
9.4
10.5
12.5
15.6
32.4
52.2
101.9 Lung & Bronchus
0 50 100 150
26.7
0 50 100 150
Death rates were notranked when the populationsize was less than 50,000or case counts were fewerthan 16 in each of the sitecategories.
0 50 100 150
Death rates were notranked when the populationsize was less than 50,000or case counts were fewerthan 16 in each of the sitecategories.
Rate† per 100,000Rate† per 100,000
Rate† per 100,000Rate† per 100,000
Rate† per 100,000Rate† per 100,000
All Races White
Black Asian/Pacific Islander‡
American Indian/Alaska Native‡ Hispanic‡§
∗ Data are from the National Vital Statistics System (NVSS).† Rates are age-adjusted to the 2000 U.S. standard population (19 age groups - Census P25-1130). See Table 2.1.1.2M-2.27.1.2M
and Appendix F.1-F.2 for 95% confidence intervals for rates. Rates are suppressed and not ranked if the population of a specific
category (race, ethnicity) is less than 50,000 or if deaths are fewer than 16.‡ Data for specified racial or ethnic populations other than white and black should be interpreted with caution. See Technical
Notes.§ Hispanic origin is not mutually exclusive from race categories (white, black, Asian/Pacific Islander, American Indian/Alaska
Native).
Note: ONS — Other Nervous System; NOS — Not Otherwise Specified; IBD — Intrahepatic Bile Duct.

United States Cancer Statistics: 2004 Incidence and Mortality
���
Figure 3.53.F1: Age-Adjusted Invasive Cancer Incidence Rates for the 10 Primary Siteswith the Highest Rates within Race- and Ethnic-Specific Categories
Virginia,∗† Females, 2004
Kidney & Renal Pelvis
Pancreas
Thyroid
Ovary
Non-Hodgkin Lymphoma
Melanomas of the Skin
Corpus & Uterus, NOS
Colon & Rectum
Lung & Bronchus
Breast
0 50 100 150 200 250 300
9.3
9.6
10.1
13.0
13.3
14.3
21.7
42.8
51.9
121.1
Kidney & Renal Pelvis
Urinary Bladder
Thyroid
Ovary
Non-Hodgkin Lymphoma
Melanomas of the Skin
Corpus & Uterus, NOS
Colon & Rectum
Lung & Bronchus
Breast
0 50 100 150 200 250 300
9.3
10.0
10.3
13.8
13.9
17.7
22.9
41.2
53.3
120.6
Leukemias
Kidney & Renal Pelvis
Myeloma
Non-Hodgkin Lymphoma
Ovary
Pancreas
Corpus & Uterus, NOS
Lung & Bronchus
Colon & Rectum
Breast
0 50 100 150 200 250 300
8.1
8.8
8.8
9.6
9.9
12.1
16.9
49.5
50.8
123.4
Corpus & Uterus, NOS
Thyroid
Lung & Bronchus
Colon & Rectum
Breast
0 50 100 150 200 250 300
15.3
15.3
22.7
31.7
75.8
0 50 100 150 200 250 300
Incidence rates were notranked when the populationsize was less than 50,000or case counts were fewerthan 16 in each of the sitecategories.
Thyroid
Cervix Uteri
Corpus & Uterus, NOS
Lung & Bronchus
Colon & Rectum
Breast
0 50 100 150 200 250 300
10.1
14.4
16.7
20.4
26.0
90.5
Rate‡ per 100,000Rate‡ per 100,000
Rate‡ per 100,000Rate‡ per 100,000
Rate‡ per 100,000Rate‡ per 100,000
All Races White
Black Asian/Pacific Islander§
American Indian/Alaska Native§ Hispanic§�
∗ Data are from selected state and metropolitan area cancer registries that meet the data quality criteria for all invasive
cancer sites combined. See Appendix B for data quality criteria and registry-specific data quality information.† Excludes basal and squamous cell carcinomas of the skin except when these occur on the skin of the genital organs, and in
situ cancers except urinary bladder.‡ Rates are age-adjusted to the 2000 U.S. standard population (19 age groups - Census P25-1130). See Table 2.1.1.1F-2.27.1.1F
and Appendix F.1-F.2 for 95% confidence intervals for rates. Rates are suppressed and not ranked if the population of a specific
category (race, ethnicity) is less than 50,000 or if cases are fewer than 16.§ Data for specified racial or ethnic populations other than white and black should be interpreted with caution. See Technical
Notes.� Hispanic origin is not mutually exclusive from race categories (white, black, Asian/Pacific Islander, American Indian/Alaska
Native).
Note: ONS — Other Nervous System; NOS — Not Otherwise Specified; IBD — Intrahepatic Bile Duct. Ovary excludes cancers newly
classified as borderline according to ICD-O-3, beginning with 2001 diagnoses. See Technical Notes.

State and Metropolitan-Area Incidence Rates and State Death Rates for the Most Common Cancers
��3
Figure 3.53.F2: Age-Adjusted Cancer Death Rates for the 10 Primary Sites with theHighest Rates within Race- and Ethnic-Specific Categories
Virginia,∗ Females, 2004
Brain & ONS
Myeloma
Corpus & Uterus, NOS
Leukemias
Non-Hodgkin Lymphoma
Pancreas
Ovary
Colon & Rectum
Breast
Lung & Bronchus
0 50 100 150
3.0
3.2
4.3
5.2
5.4
8.9
9.2
14.4
25.4
42.3
Myeloma
Brain & ONS
Corpus & Uterus, NOS
Leukemias
Non-Hodgkin Lymphoma
Pancreas
Ovary
Colon & Rectum
Breast
Lung & Bronchus
0 50 100 150
2.9
3.2
3.9
4.8
5.9
8.7
9.2
13.2
23.9
43.4
Cervix Uteri
Stomach
Myeloma
Corpus & Uterus, NOS
Leukemias
Ovary
Pancreas
Colon & Rectum
Breast
Lung & Bronchus
0 50 100 150
3.5
4.3
5.6
6.3
6.6
9.7
11.2
21.4
33.9
40.9
Breast
Lung & Bronchus
0 50 100 150
12.1
22.8
0 50 100 150
Death rates were notranked when the populationsize was less than 50,000or case counts were fewerthan 16 in each of the sitecategories.
Breast
Lung & Bronchus
0 50 100 150
20.1
27.9
Rate† per 100,000Rate† per 100,000
Rate† per 100,000Rate† per 100,000
Rate† per 100,000Rate† per 100,000
All Races White
Black Asian/Pacific Islander‡
American Indian/Alaska Native‡ Hispanic‡§
∗ Data are from the National Vital Statistics System (NVSS).† Rates are age-adjusted to the 2000 U.S. standard population (19 age groups - Census P25-1130). See Table 2.1.1.2F-2.27.1.2F
and Appendix F.1-F.2 for 95% confidence intervals for rates. Rates are suppressed and not ranked if the population of a specific
category (race, ethnicity) is less than 50,000 or if deaths are fewer than 16.‡ Data for specified racial or ethnic populations other than white and black should be interpreted with caution. See Technical
Notes.§ Hispanic origin is not mutually exclusive from race categories (white, black, Asian/Pacific Islander, American Indian/Alaska
Native).
Note: ONS — Other Nervous System; NOS — Not Otherwise Specified; IBD — Intrahepatic Bile Duct.

United States Cancer Statistics: 2004 Incidence and Mortality
���
Figure 3.54.M1: Age-Adjusted Invasive Cancer Incidence Rates for the 10 Primary Siteswith the Highest Rates within Race- and Ethnic-Specific Categories
Washington,∗† Males, 2004
Pancreas
Oral Cavity & Pharynx
Leukemias
Kidney & Renal Pelvis
Non-Hodgkin Lymphoma
Melanomas of the Skin
Urinary Bladder
Colon & Rectum
Lung & Bronchus
Prostate
0 50 100 150 200 250 300
12.2
17.1
18.1
19.6
27.3
29.5
41.6
52.8
77.4
163.8
Pancreas
Oral Cavity & Pharynx
Leukemias
Kidney & Renal Pelvis
Non-Hodgkin Lymphoma
Melanomas of the Skin
Urinary Bladder
Colon & Rectum
Lung & Bronchus
Prostate
0 50 100 150 200 250 300
12.3
16.8
18.1
18.7
27.4
31.9
41.9
52.1
77.6
157.9
Kidney & Renal Pelvis
Urinary Bladder
Colon & Rectum
Lung & Bronchus
Prostate
0 50 100 150 200 250 300
33.2
35.2
55.8
100.4
218.6
Kidney & Renal Pelvis
Leukemias
Stomach
Non-Hodgkin Lymphoma
Liver & IBD
Colon & Rectum
Lung & Bronchus
Prostate
0 50 100 150 200 250 300
11.5
13.6
14.4
18.3
31.6
33.5
53.6
84.1
Lung & Bronchus
Prostate
0 50 100 150 200 250 300
72.6
97.2
Leukemias
Kidney & Renal Pelvis
Colon & Rectum
Non-Hodgkin Lymphoma
Lung & Bronchus
Prostate
0 50 100 150 200 250 300
12.6
25.3
30.6
31.8
47.8
127.7
Rate‡ per 100,000Rate‡ per 100,000
Rate‡ per 100,000Rate‡ per 100,000
Rate‡ per 100,000Rate‡ per 100,000
All Races White
Black Asian/Pacific Islander§
American Indian/Alaska Native§ Hispanic§�
∗ Data are from selected state and metropolitan area cancer registries that meet the data quality criteria for all invasive
cancer sites combined. See Appendix B for data quality criteria and registry-specific data quality information.† Excludes basal and squamous cell carcinomas of the skin except when these occur on the skin of the genital organs, and in
situ cancers except urinary bladder.‡ Rates are age-adjusted to the 2000 U.S. standard population (19 age groups - Census P25-1130). See Table 2.1.1.1M-2.27.1.1M
and Appendix F.1-F.2 for 95% confidence intervals for rates. Rates are suppressed and not ranked if the population of a specific
category (race, ethnicity) is less than 50,000 or if cases are fewer than 16.§ Data for specified racial or ethnic populations other than white and black should be interpreted with caution. See Technical
Notes.� Hispanic origin is not mutually exclusive from race categories (white, black, Asian/Pacific Islander, American Indian/Alaska
Native).
Note: ONS — Other Nervous System; NOS — Not Otherwise Specified; IBD — Intrahepatic Bile Duct.

State and Metropolitan-Area Incidence Rates and State Death Rates for the Most Common Cancers
���
Figure 3.54.M2: Age-Adjusted Cancer Death Rates for the 10 Primary Sites with theHighest Rates within Race- and Ethnic-Specific Categories
Washington,∗ Males, 2004
Kidney & Renal Pelvis
Esophagus
Urinary Bladder
Liver & IBD
Non-Hodgkin Lymphoma
Leukemias
Pancreas
Colon & Rectum
Prostate
Lung & Bronchus
0 50 100 150
6.6
7.9
8.1
8.2
9.8
11.3
12.4
18.7
25.0
63.5
Kidney & Renal Pelvis
Liver & IBD
Esophagus
Urinary Bladder
Non-Hodgkin Lymphoma
Leukemias
Pancreas
Colon & Rectum
Prostate
Lung & Bronchus
0 50 100 150
6.8
7.3
8.2
8.3
10.3
11.2
12.5
19.0
25.6
64.5
Lung & Bronchus
0 50 100 150
71.4
Colon & Rectum
Liver & IBD
Lung & Bronchus
0 50 100 150
14.4
24.9
40.0
Lung & Bronchus
0 50 100 150
51.3
0 50 100 150
Death rates were notranked when the populationsize was less than 50,000or case counts were fewerthan 16 in each of the sitecategories.
Rate† per 100,000Rate† per 100,000
Rate† per 100,000Rate† per 100,000
Rate† per 100,000Rate† per 100,000
All Races White
Black Asian/Pacific Islander‡
American Indian/Alaska Native‡ Hispanic‡§
∗ Data are from the National Vital Statistics System (NVSS).† Rates are age-adjusted to the 2000 U.S. standard population (19 age groups - Census P25-1130). See Table 2.1.1.2M-2.27.1.2M
and Appendix F.1-F.2 for 95% confidence intervals for rates. Rates are suppressed and not ranked if the population of a specific
category (race, ethnicity) is less than 50,000 or if deaths are fewer than 16.‡ Data for specified racial or ethnic populations other than white and black should be interpreted with caution. See Technical
Notes.§ Hispanic origin is not mutually exclusive from race categories (white, black, Asian/Pacific Islander, American Indian/Alaska
Native).
Note: ONS — Other Nervous System; NOS — Not Otherwise Specified; IBD — Intrahepatic Bile Duct.

United States Cancer Statistics: 2004 Incidence and Mortality
���
Figure 3.54.F1: Age-Adjusted Invasive Cancer Incidence Rates for the 10 Primary Siteswith the Highest Rates within Race- and Ethnic-Specific Categories
Washington,∗† Females, 2004
Leukemias
Pancreas
Thyroid
Ovary
Non-Hodgkin Lymphoma
Melanomas of the Skin
Corpus & Uterus, NOS
Colon & Rectum
Lung & Bronchus
Breast
0 50 100 150 200 250 300
10.2
10.8
14.1
14.1
18.5
23.0
25.6
39.7
59.6
130.7
Leukemias
Pancreas
Thyroid
Ovary
Non-Hodgkin Lymphoma
Melanomas of the Skin
Corpus & Uterus, NOS
Colon & Rectum
Lung & Bronchus
Breast
0 50 100 150 200 250 300
10.4
10.8
13.3
14.1
18.2
25.4
25.4
38.8
60.7
129.5
Non-Hodgkin Lymphoma
Colon & Rectum
Lung & Bronchus
Breast
0 50 100 150 200 250 300
19.6
55.3
61.0
128.3
Cervix Uteri
Ovary
Non-Hodgkin Lymphoma
Thyroid
Stomach
Corpus & Uterus, NOS
Colon & Rectum
Lung & Bronchus
Breast
0 50 100 150 200 250 300
8.7
9.8
11.8
13.0
13.7
14.5
25.0
37.7
96.7
Colon & Rectum
Lung & Bronchus
Breast
0 50 100 150 200 250 300
42.1
61.2
102.2
Thyroid
Corpus & Uterus, NOS
Ovary
Lung & Bronchus
Colon & Rectum
Breast
0 50 100 150 200 250 300
9.0
17.6
20.5
26.2
29.0
88.3
Rate‡ per 100,000Rate‡ per 100,000
Rate‡ per 100,000Rate‡ per 100,000
Rate‡ per 100,000Rate‡ per 100,000
All Races White
Black Asian/Pacific Islander§
American Indian/Alaska Native§ Hispanic§�
∗ Data are from selected state and metropolitan area cancer registries that meet the data quality criteria for all invasive
cancer sites combined. See Appendix B for data quality criteria and registry-specific data quality information.† Excludes basal and squamous cell carcinomas of the skin except when these occur on the skin of the genital organs, and in
situ cancers except urinary bladder.‡ Rates are age-adjusted to the 2000 U.S. standard population (19 age groups - Census P25-1130). See Table 2.1.1.1F-2.27.1.1F
and Appendix F.1-F.2 for 95% confidence intervals for rates. Rates are suppressed and not ranked if the population of a specific
category (race, ethnicity) is less than 50,000 or if cases are fewer than 16.§ Data for specified racial or ethnic populations other than white and black should be interpreted with caution. See Technical
Notes.� Hispanic origin is not mutually exclusive from race categories (white, black, Asian/Pacific Islander, American Indian/Alaska
Native).
Note: ONS — Other Nervous System; NOS — Not Otherwise Specified; IBD — Intrahepatic Bile Duct. Ovary excludes cancers newly
classified as borderline according to ICD-O-3, beginning with 2001 diagnoses. See Technical Notes.

State and Metropolitan-Area Incidence Rates and State Death Rates for the Most Common Cancers
���
Figure 3.54.F2: Age-Adjusted Cancer Death Rates for the 10 Primary Sites with theHighest Rates within Race- and Ethnic-Specific Categories
Washington,∗ Females, 2004
Liver & IBD
Corpus & Uterus, NOS
Brain & ONS
Leukemias
Non-Hodgkin Lymphoma
Pancreas
Ovary
Colon & Rectum
Breast
Lung & Bronchus
0 50 100 150
3.4
4.3
5.0
5.8
5.9
10.5
10.6
14.3
23.3
43.8
Liver & IBD
Corpus & Uterus, NOS
Brain & ONS
Non-Hodgkin Lymphoma
Leukemias
Ovary
Pancreas
Colon & Rectum
Breast
Lung & Bronchus
0 50 100 150
2.9
4.3
5.3
5.9
6.0
10.7
10.7
13.9
24.2
45.6
Breast
0 50 100 150
21.0
Stomach
Breast
Liver & IBD
Colon & Rectum
Lung & Bronchus
0 50 100 150
8.4
9.1
10.9
13.1
19.9
0 50 100 150
Death rates were notranked when the populationsize was less than 50,000or case counts were fewerthan 16 in each of the sitecategories.
0 50 100 150
Death rates were notranked when the populationsize was less than 50,000or case counts were fewerthan 16 in each of the sitecategories.
Rate† per 100,000Rate† per 100,000
Rate† per 100,000Rate† per 100,000
Rate† per 100,000Rate† per 100,000
All Races White
Black Asian/Pacific Islander‡
American Indian/Alaska Native‡ Hispanic‡§
∗ Data are from the National Vital Statistics System (NVSS).† Rates are age-adjusted to the 2000 U.S. standard population (19 age groups - Census P25-1130). See Table 2.1.1.2F-2.27.1.2F
and Appendix F.1-F.2 for 95% confidence intervals for rates. Rates are suppressed and not ranked if the population of a specific
category (race, ethnicity) is less than 50,000 or if deaths are fewer than 16.‡ Data for specified racial or ethnic populations other than white and black should be interpreted with caution. See Technical
Notes.§ Hispanic origin is not mutually exclusive from race categories (white, black, Asian/Pacific Islander, American Indian/Alaska
Native).
Note: ONS — Other Nervous System; NOS — Not Otherwise Specified; IBD — Intrahepatic Bile Duct.

United States Cancer Statistics: 2004 Incidence and Mortality
���
Figure 3.55.M1: Age-Adjusted Invasive Cancer Incidence Rates for the 10 Primary Siteswith the Highest Rates within Race- and Ethnic-Specific Categories
Seattle-Puget Sound,∗† Males, 2004
Pancreas
Oral Cavity & Pharynx
Leukemias
Kidney & Renal Pelvis
Non-Hodgkin Lymphoma
Melanomas of the Skin
Urinary Bladder
Colon & Rectum
Lung & Bronchus
Prostate
0 50 100 150 200 250 300
12.6
16.8
18.5
19.9
27.5
31.3
42.9
53.3
76.8
168.0
Pancreas
Oral Cavity & Pharynx
Leukemias
Kidney & Renal Pelvis
Non-Hodgkin Lymphoma
Melanomas of the Skin
Urinary Bladder
Colon & Rectum
Lung & Bronchus
Prostate
0 50 100 150 200 250 300
12.6
17.5
19.0
19.8
28.4
35.4
45.4
54.1
77.0
172.2
Urinary Bladder
Kidney & Renal Pelvis
Colon & Rectum
Lung & Bronchus
Prostate
0 50 100 150 200 250 300
30.5
33.5
63.7
102.7
236.7
Leukemias
Stomach
Non-Hodgkin Lymphoma
Liver & IBD
Colon & Rectum
Lung & Bronchus
Prostate
0 50 100 150 200 250 300
11.9
17.7
18.0
30.1
34.1
58.6
88.1
0 50 100 150 200 250 300
Incidence rates were notranked when the populationsize was less than 50,000or case counts were fewerthan 16 in each of the sitecategories.
Non-Hodgkin Lymphoma
Lung & Bronchus
Prostate
0 50 100 150 200 250 300
39.3
49.3
138.1
Rate‡ per 100,000Rate‡ per 100,000
Rate‡ per 100,000Rate‡ per 100,000
Rate‡ per 100,000Rate‡ per 100,000
All Races White
Black Asian/Pacific Islander§
American Indian/Alaska Native§ Hispanic§�
∗ Data are from selected state and metropolitan area cancer registries that meet the data quality criteria for all invasive
cancer sites combined. See Appendix B for data quality criteria and registry-specific data quality information.† Excludes basal and squamous cell carcinomas of the skin except when these occur on the skin of the genital organs, and in
situ cancers except urinary bladder.‡ Rates are age-adjusted to the 2000 U.S. standard population (19 age groups - Census P25-1130). See Table 2.1.1.1M-2.27.1.1M
and Appendix F.1-F.2 for 95% confidence intervals for rates. Rates are suppressed and not ranked if the population of a specific
category (race, ethnicity) is less than 50,000 or if cases are fewer than 16.§ Data for specified racial or ethnic populations other than white and black should be interpreted with caution. See Technical
Notes.� Hispanic origin is not mutually exclusive from race categories (white, black, Asian/Pacific Islander, American Indian/Alaska
Native).
Note: ONS — Other Nervous System; NOS — Not Otherwise Specified; IBD — Intrahepatic Bile Duct.

State and Metropolitan-Area Incidence Rates and State Death Rates for the Most Common Cancers
���
Mortality data are not presented for metropolitan areas.

United States Cancer Statistics: 2004 Incidence and Mortality
��0
Figure 3.55.F1: Age-Adjusted Invasive Cancer Incidence Rates for the 10 Primary Siteswith the Highest Rates within Race- and Ethnic-Specific Categories
Seattle-Puget Sound,∗† Females, 2004
Urinary Bladder
Leukemias
Thyroid
Ovary
Non-Hodgkin Lymphoma
Melanomas of the Skin
Corpus & Uterus, NOS
Colon & Rectum
Lung & Bronchus
Breast
0 50 100 150 200 250 300
10.1
10.4
14.1
14.4
18.2
24.5
25.2
41.1
61.0
135.8
Urinary Bladder
Leukemias
Thyroid
Ovary
Non-Hodgkin Lymphoma
Corpus & Uterus, NOS
Melanomas of the Skin
Colon & Rectum
Lung & Bronchus
Breast
0 50 100 150 200 250 300
10.9
11.1
14.4
15.1
18.6
26.3
28.4
40.7
62.6
139.3
Lung & Bronchus
Colon & Rectum
Breast
0 50 100 150 200 250 300
60.4
61.0
132.7
Cervix Uteri
Ovary
Non-Hodgkin Lymphoma
Thyroid
Stomach
Corpus & Uterus, NOS
Colon & Rectum
Lung & Bronchus
Breast
0 50 100 150 200 250 300
9.2
9.6
11.4
14.0
14.5
16.0
28.3
39.3
95.9
0 50 100 150 200 250 300
Incidence rates were notranked when the populationsize was less than 50,000or case counts were fewerthan 16 in each of the sitecategories.
Colon & Rectum
Lung & Bronchus
Breast
0 50 100 150 200 250 300
39.6
41.1
107.9
Rate‡ per 100,000Rate‡ per 100,000
Rate‡ per 100,000Rate‡ per 100,000
Rate‡ per 100,000Rate‡ per 100,000
All Races White
Black Asian/Pacific Islander§
American Indian/Alaska Native§ Hispanic§�
∗ Data are from selected state and metropolitan area cancer registries that meet the data quality criteria for all invasive
cancer sites combined. See Appendix B for data quality criteria and registry-specific data quality information.† Excludes basal and squamous cell carcinomas of the skin except when these occur on the skin of the genital organs, and in
situ cancers except urinary bladder.‡ Rates are age-adjusted to the 2000 U.S. standard population (19 age groups - Census P25-1130). See Table 2.1.1.1F-2.27.1.1F
and Appendix F.1-F.2 for 95% confidence intervals for rates. Rates are suppressed and not ranked if the population of a specific
category (race, ethnicity) is less than 50,000 or if cases are fewer than 16.§ Data for specified racial or ethnic populations other than white and black should be interpreted with caution. See Technical
Notes.� Hispanic origin is not mutually exclusive from race categories (white, black, Asian/Pacific Islander, American Indian/Alaska
Native).
Note: ONS — Other Nervous System; NOS — Not Otherwise Specified; IBD — Intrahepatic Bile Duct. Ovary excludes cancers newly
classified as borderline according to ICD-O-3, beginning with 2001 diagnoses. See Technical Notes.

State and Metropolitan-Area Incidence Rates and State Death Rates for the Most Common Cancers
���
Mortality data are not presented for metropolitan areas.
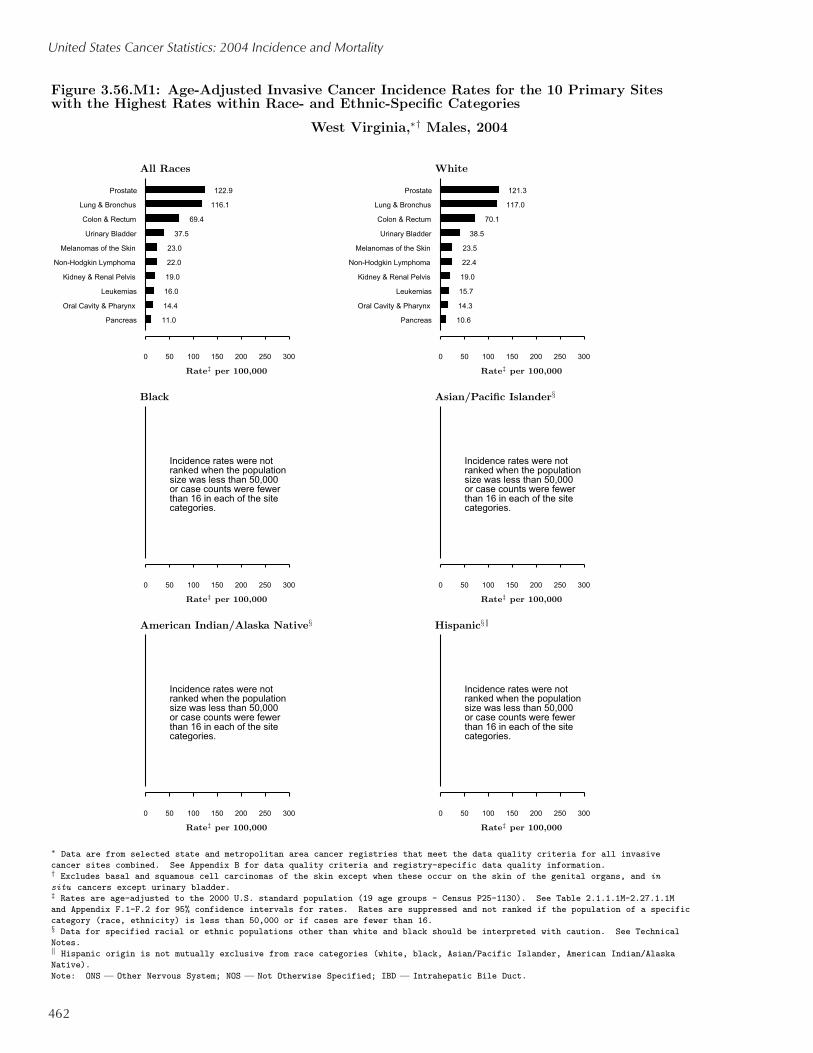
United States Cancer Statistics: 2004 Incidence and Mortality
���
Figure 3.56.M1: Age-Adjusted Invasive Cancer Incidence Rates for the 10 Primary Siteswith the Highest Rates within Race- and Ethnic-Specific Categories
West Virginia,∗† Males, 2004
Pancreas
Oral Cavity & Pharynx
Leukemias
Kidney & Renal Pelvis
Non-Hodgkin Lymphoma
Melanomas of the Skin
Urinary Bladder
Colon & Rectum
Lung & Bronchus
Prostate
0 50 100 150 200 250 300
11.0
14.4
16.0
19.0
22.0
23.0
37.5
69.4
116.1
122.9
Pancreas
Oral Cavity & Pharynx
Leukemias
Kidney & Renal Pelvis
Non-Hodgkin Lymphoma
Melanomas of the Skin
Urinary Bladder
Colon & Rectum
Lung & Bronchus
Prostate
0 50 100 150 200 250 300
10.6
14.3
15.7
19.0
22.4
23.5
38.5
70.1
117.0
121.3
0 50 100 150 200 250 300
Incidence rates were notranked when the populationsize was less than 50,000or case counts were fewerthan 16 in each of the sitecategories.
0 50 100 150 200 250 300
Incidence rates were notranked when the populationsize was less than 50,000or case counts were fewerthan 16 in each of the sitecategories.
0 50 100 150 200 250 300
Incidence rates were notranked when the populationsize was less than 50,000or case counts were fewerthan 16 in each of the sitecategories.
0 50 100 150 200 250 300
Incidence rates were notranked when the populationsize was less than 50,000or case counts were fewerthan 16 in each of the sitecategories.
Rate‡ per 100,000Rate‡ per 100,000
Rate‡ per 100,000Rate‡ per 100,000
Rate‡ per 100,000Rate‡ per 100,000
All Races White
Black Asian/Pacific Islander§
American Indian/Alaska Native§ Hispanic§�
∗ Data are from selected state and metropolitan area cancer registries that meet the data quality criteria for all invasive
cancer sites combined. See Appendix B for data quality criteria and registry-specific data quality information.† Excludes basal and squamous cell carcinomas of the skin except when these occur on the skin of the genital organs, and in
situ cancers except urinary bladder.‡ Rates are age-adjusted to the 2000 U.S. standard population (19 age groups - Census P25-1130). See Table 2.1.1.1M-2.27.1.1M
and Appendix F.1-F.2 for 95% confidence intervals for rates. Rates are suppressed and not ranked if the population of a specific
category (race, ethnicity) is less than 50,000 or if cases are fewer than 16.§ Data for specified racial or ethnic populations other than white and black should be interpreted with caution. See Technical
Notes.� Hispanic origin is not mutually exclusive from race categories (white, black, Asian/Pacific Islander, American Indian/Alaska
Native).
Note: ONS — Other Nervous System; NOS — Not Otherwise Specified; IBD — Intrahepatic Bile Duct.
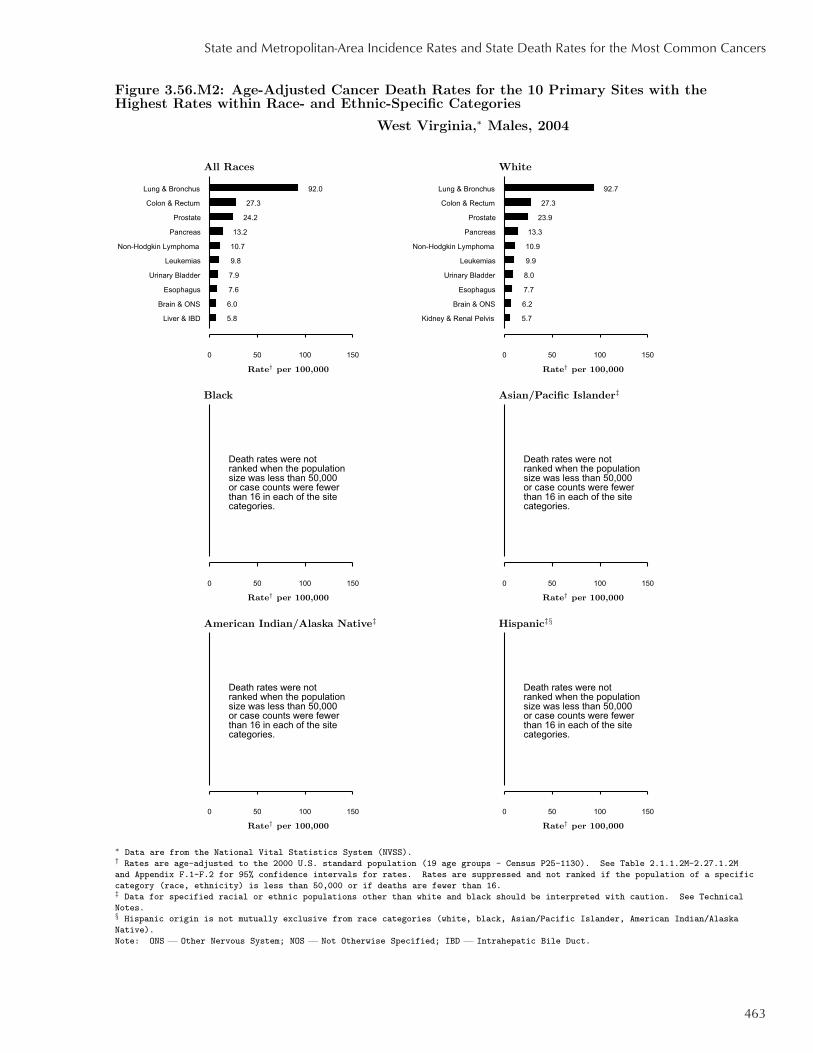
State and Metropolitan-Area Incidence Rates and State Death Rates for the Most Common Cancers
��3
Figure 3.56.M2: Age-Adjusted Cancer Death Rates for the 10 Primary Sites with theHighest Rates within Race- and Ethnic-Specific Categories
West Virginia,∗ Males, 2004
Liver & IBD
Brain & ONS
Esophagus
Urinary Bladder
Leukemias
Non-Hodgkin Lymphoma
Pancreas
Prostate
Colon & Rectum
Lung & Bronchus
0 50 100 150
5.8
6.0
7.6
7.9
9.8
10.7
13.2
24.2
27.3
92.0
Kidney & Renal Pelvis
Brain & ONS
Esophagus
Urinary Bladder
Leukemias
Non-Hodgkin Lymphoma
Pancreas
Prostate
Colon & Rectum
Lung & Bronchus
0 50 100 150
5.7
6.2
7.7
8.0
9.9
10.9
13.3
23.9
27.3
92.7
0 50 100 150
Death rates were notranked when the populationsize was less than 50,000or case counts were fewerthan 16 in each of the sitecategories.
0 50 100 150
Death rates were notranked when the populationsize was less than 50,000or case counts were fewerthan 16 in each of the sitecategories.
0 50 100 150
Death rates were notranked when the populationsize was less than 50,000or case counts were fewerthan 16 in each of the sitecategories.
0 50 100 150
Death rates were notranked when the populationsize was less than 50,000or case counts were fewerthan 16 in each of the sitecategories.
Rate† per 100,000Rate† per 100,000
Rate† per 100,000Rate† per 100,000
Rate† per 100,000Rate† per 100,000
All Races White
Black Asian/Pacific Islander‡
American Indian/Alaska Native‡ Hispanic‡§
∗ Data are from the National Vital Statistics System (NVSS).† Rates are age-adjusted to the 2000 U.S. standard population (19 age groups - Census P25-1130). See Table 2.1.1.2M-2.27.1.2M
and Appendix F.1-F.2 for 95% confidence intervals for rates. Rates are suppressed and not ranked if the population of a specific
category (race, ethnicity) is less than 50,000 or if deaths are fewer than 16.‡ Data for specified racial or ethnic populations other than white and black should be interpreted with caution. See Technical
Notes.§ Hispanic origin is not mutually exclusive from race categories (white, black, Asian/Pacific Islander, American Indian/Alaska
Native).
Note: ONS — Other Nervous System; NOS — Not Otherwise Specified; IBD — Intrahepatic Bile Duct.

United States Cancer Statistics: 2004 Incidence and Mortality
���
Figure 3.56.F1: Age-Adjusted Invasive Cancer Incidence Rates for the 10 Primary Siteswith the Highest Rates within Race- and Ethnic-Specific Categories
West Virginia,∗† Females, 2004
Pancreas
Kidney & Renal Pelvis
Thyroid
Ovary
Melanomas of the Skin
Non-Hodgkin Lymphoma
Corpus & Uterus, NOS
Colon & Rectum
Lung & Bronchus
Breast
0 50 100 150 200 250 300
9.9
10.7
11.8
12.1
15.9
16.1
28.4
49.2
63.8
114.2
Pancreas
Kidney & Renal Pelvis
Thyroid
Ovary
Melanomas of the Skin
Non-Hodgkin Lymphoma
Corpus & Uterus, NOS
Colon & Rectum
Lung & Bronchus
Breast
0 50 100 150 200 250 300
9.8
10.4
11.5
12.0
16.1
16.3
28.2
48.8
64.7
114.7
0 50 100 150 200 250 300
Incidence rates were notranked when the populationsize was less than 50,000or case counts were fewerthan 16 in each of the sitecategories.
0 50 100 150 200 250 300
Incidence rates were notranked when the populationsize was less than 50,000or case counts were fewerthan 16 in each of the sitecategories.
0 50 100 150 200 250 300
Incidence rates were notranked when the populationsize was less than 50,000or case counts were fewerthan 16 in each of the sitecategories.
0 50 100 150 200 250 300
Incidence rates were notranked when the populationsize was less than 50,000or case counts were fewerthan 16 in each of the sitecategories.
Rate‡ per 100,000Rate‡ per 100,000
Rate‡ per 100,000Rate‡ per 100,000
Rate‡ per 100,000Rate‡ per 100,000
All Races White
Black Asian/Pacific Islander§
American Indian/Alaska Native§ Hispanic§�
∗ Data are from selected state and metropolitan area cancer registries that meet the data quality criteria for all invasive
cancer sites combined. See Appendix B for data quality criteria and registry-specific data quality information.† Excludes basal and squamous cell carcinomas of the skin except when these occur on the skin of the genital organs, and in
situ cancers except urinary bladder.‡ Rates are age-adjusted to the 2000 U.S. standard population (19 age groups - Census P25-1130). See Table 2.1.1.1F-2.27.1.1F
and Appendix F.1-F.2 for 95% confidence intervals for rates. Rates are suppressed and not ranked if the population of a specific
category (race, ethnicity) is less than 50,000 or if cases are fewer than 16.§ Data for specified racial or ethnic populations other than white and black should be interpreted with caution. See Technical
Notes.� Hispanic origin is not mutually exclusive from race categories (white, black, Asian/Pacific Islander, American Indian/Alaska
Native).
Note: ONS — Other Nervous System; NOS — Not Otherwise Specified; IBD — Intrahepatic Bile Duct. Ovary excludes cancers newly
classified as borderline according to ICD-O-3, beginning with 2001 diagnoses. See Technical Notes.

State and Metropolitan-Area Incidence Rates and State Death Rates for the Most Common Cancers
���
Figure 3.56.F2: Age-Adjusted Cancer Death Rates for the 10 Primary Sites with theHighest Rates within Race- and Ethnic-Specific Categories
West Virginia,∗ Females, 2004
Kidney & Renal Pelvis
Brain & ONS
Corpus & Uterus, NOS
Leukemias
Non-Hodgkin Lymphoma
Pancreas
Ovary
Colon & Rectum
Breast
Lung & Bronchus
0 50 100 150
3.5
3.6
4.9
5.3
5.6
9.1
10.8
18.4
24.7
48.4
Kidney & Renal Pelvis
Brain & ONS
Corpus & Uterus, NOS
Leukemias
Non-Hodgkin Lymphoma
Pancreas
Ovary
Colon & Rectum
Breast
Lung & Bronchus
0 50 100 150
3.6
3.7
5.1
5.3
5.6
9.2
10.9
18.0
24.6
49.1
0 50 100 150
Death rates were notranked when the populationsize was less than 50,000or case counts were fewerthan 16 in each of the sitecategories.
0 50 100 150
Death rates were notranked when the populationsize was less than 50,000or case counts were fewerthan 16 in each of the sitecategories.
0 50 100 150
Death rates were notranked when the populationsize was less than 50,000or case counts were fewerthan 16 in each of the sitecategories.
0 50 100 150
Death rates were notranked when the populationsize was less than 50,000or case counts were fewerthan 16 in each of the sitecategories.
Rate† per 100,000Rate† per 100,000
Rate† per 100,000Rate† per 100,000
Rate† per 100,000Rate† per 100,000
All Races White
Black Asian/Pacific Islander‡
American Indian/Alaska Native‡ Hispanic‡§
∗ Data are from the National Vital Statistics System (NVSS).† Rates are age-adjusted to the 2000 U.S. standard population (19 age groups - Census P25-1130). See Table 2.1.1.2F-2.27.1.2F
and Appendix F.1-F.2 for 95% confidence intervals for rates. Rates are suppressed and not ranked if the population of a specific
category (race, ethnicity) is less than 50,000 or if deaths are fewer than 16.‡ Data for specified racial or ethnic populations other than white and black should be interpreted with caution. See Technical
Notes.§ Hispanic origin is not mutually exclusive from race categories (white, black, Asian/Pacific Islander, American Indian/Alaska
Native).
Note: ONS — Other Nervous System; NOS — Not Otherwise Specified; IBD — Intrahepatic Bile Duct.
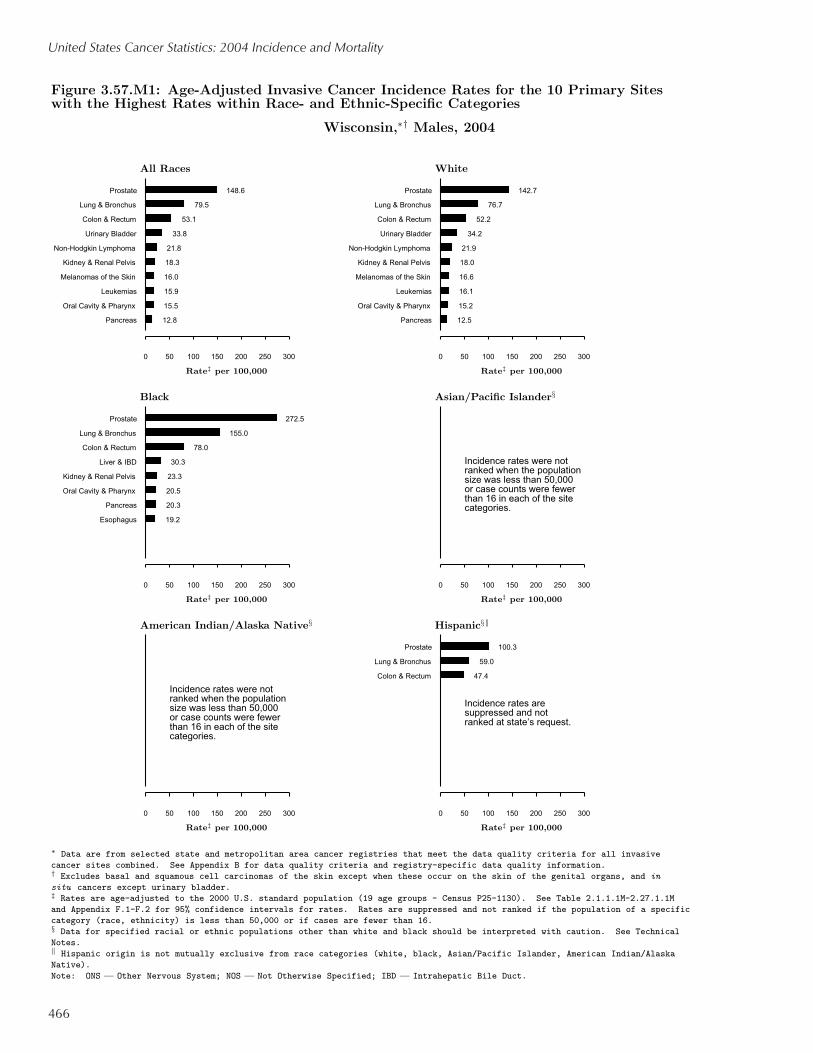
United States Cancer Statistics: 2004 Incidence and Mortality
���
Figure 3.57.M1: Age-Adjusted Invasive Cancer Incidence Rates for the 10 Primary Siteswith the Highest Rates within Race- and Ethnic-Specific Categories
Wisconsin,∗† Males, 2004
Pancreas
Oral Cavity & Pharynx
Leukemias
Melanomas of the Skin
Kidney & Renal Pelvis
Non-Hodgkin Lymphoma
Urinary Bladder
Colon & Rectum
Lung & Bronchus
Prostate
0 50 100 150 200 250 300
12.8
15.5
15.9
16.0
18.3
21.8
33.8
53.1
79.5
148.6
Pancreas
Oral Cavity & Pharynx
Leukemias
Melanomas of the Skin
Kidney & Renal Pelvis
Non-Hodgkin Lymphoma
Urinary Bladder
Colon & Rectum
Lung & Bronchus
Prostate
0 50 100 150 200 250 300
12.5
15.2
16.1
16.6
18.0
21.9
34.2
52.2
76.7
142.7
Esophagus
Pancreas
Oral Cavity & Pharynx
Kidney & Renal Pelvis
Liver & IBD
Colon & Rectum
Lung & Bronchus
Prostate
0 50 100 150 200 250 300
19.2
20.3
20.5
23.3
30.3
78.0
155.0
272.5
0 50 100 150 200 250 300
Incidence rates were notranked when the populationsize was less than 50,000or case counts were fewerthan 16 in each of the sitecategories.
0 50 100 150 200 250 300
Incidence rates were notranked when the populationsize was less than 50,000or case counts were fewerthan 16 in each of the sitecategories.
Colon & Rectum
Lung & Bronchus
Prostate
0 50 100 150 200 250 300
47.4
59.0
100.3
Incidence rates aresuppressed and notranked at state’s request.
Rate‡ per 100,000Rate‡ per 100,000
Rate‡ per 100,000Rate‡ per 100,000
Rate‡ per 100,000Rate‡ per 100,000
All Races White
Black Asian/Pacific Islander§
American Indian/Alaska Native§ Hispanic§�
∗ Data are from selected state and metropolitan area cancer registries that meet the data quality criteria for all invasive
cancer sites combined. See Appendix B for data quality criteria and registry-specific data quality information.† Excludes basal and squamous cell carcinomas of the skin except when these occur on the skin of the genital organs, and in
situ cancers except urinary bladder.‡ Rates are age-adjusted to the 2000 U.S. standard population (19 age groups - Census P25-1130). See Table 2.1.1.1M-2.27.1.1M
and Appendix F.1-F.2 for 95% confidence intervals for rates. Rates are suppressed and not ranked if the population of a specific
category (race, ethnicity) is less than 50,000 or if cases are fewer than 16.§ Data for specified racial or ethnic populations other than white and black should be interpreted with caution. See Technical
Notes.� Hispanic origin is not mutually exclusive from race categories (white, black, Asian/Pacific Islander, American Indian/Alaska
Native).
Note: ONS — Other Nervous System; NOS — Not Otherwise Specified; IBD — Intrahepatic Bile Duct.

State and Metropolitan-Area Incidence Rates and State Death Rates for the Most Common Cancers
���
Figure 3.57.M2: Age-Adjusted Cancer Death Rates for the 10 Primary Sites with theHighest Rates within Race- and Ethnic-Specific Categories
Wisconsin,∗ Males, 2004
Kidney & Renal Pelvis
Liver & IBD
Urinary Bladder
Non-Hodgkin Lymphoma
Esophagus
Leukemias
Pancreas
Colon & Rectum
Prostate
Lung & Bronchus
0 50 100 150
6.8
7.4
9.3
9.4
9.6
11.5
12.4
20.2
28.5
66.5
Kidney & Renal Pelvis
Liver & IBD
Esophagus
Urinary Bladder
Non-Hodgkin Lymphoma
Leukemias
Pancreas
Colon & Rectum
Prostate
Lung & Bronchus
0 50 100 150
6.8
6.9
9.3
9.4
9.7
11.5
12.3
19.9
28.3
64.6
Esophagus
Colon & Rectum
Prostate
Lung & Bronchus
0 50 100 150
22.0
38.3
45.3
137.4
0 50 100 150
Death rates were notranked when the populationsize was less than 50,000or case counts were fewerthan 16 in each of the sitecategories.
0 50 100 150
Death rates were notranked when the populationsize was less than 50,000or case counts were fewerthan 16 in each of the sitecategories.
0 50 100 150
Death rates were notranked when the populationsize was less than 50,000or case counts were fewerthan 16 in each of the sitecategories.
Rate† per 100,000Rate† per 100,000
Rate† per 100,000Rate† per 100,000
Rate† per 100,000Rate† per 100,000
All Races White
Black Asian/Pacific Islander‡
American Indian/Alaska Native‡ Hispanic‡§
∗ Data are from the National Vital Statistics System (NVSS).† Rates are age-adjusted to the 2000 U.S. standard population (19 age groups - Census P25-1130). See Table 2.1.1.2M-2.27.1.2M
and Appendix F.1-F.2 for 95% confidence intervals for rates. Rates are suppressed and not ranked if the population of a specific
category (race, ethnicity) is less than 50,000 or if deaths are fewer than 16.‡ Data for specified racial or ethnic populations other than white and black should be interpreted with caution. See Technical
Notes.§ Hispanic origin is not mutually exclusive from race categories (white, black, Asian/Pacific Islander, American Indian/Alaska
Native).
Note: ONS — Other Nervous System; NOS — Not Otherwise Specified; IBD — Intrahepatic Bile Duct.

United States Cancer Statistics: 2004 Incidence and Mortality
���
Figure 3.57.F1: Age-Adjusted Invasive Cancer Incidence Rates for the 10 Primary Siteswith the Highest Rates within Race- and Ethnic-Specific Categories
Wisconsin,∗† Females, 2004
Leukemias
Kidney & Renal Pelvis
Melanomas of the Skin
Ovary
Thyroid
Non-Hodgkin Lymphoma
Corpus & Uterus, NOS
Colon & Rectum
Lung & Bronchus
Breast
0 50 100 150 200 250 300
9.8
10.1
11.4
13.2
13.3
15.5
25.4
41.8
50.3
114.9
Leukemias
Kidney & Renal Pelvis
Melanomas of the Skin
Ovary
Thyroid
Non-Hodgkin Lymphoma
Corpus & Uterus, NOS
Colon & Rectum
Lung & Bronchus
Breast
0 50 100 150 200 250 300
9.9
10.0
11.9
13.1
13.6
15.3
25.2
40.7
49.6
115.0
Non-Hodgkin Lymphoma
Ovary
Pancreas
Cervix Uteri
Corpus & Uterus, NOS
Colon & Rectum
Lung & Bronchus
Breast
0 50 100 150 200 250 300
13.3
14.3
17.2
20.7
32.5
60.7
67.8
103.4 Breast
0 50 100 150 200 250 300
68.0
0 50 100 150 200 250 300
Incidence rates were notranked when the populationsize was less than 50,000or case counts were fewerthan 16 in each of the sitecategories.
Colon & Rectum
Breast
0 50 100 150 200 250 300
40.9
103.1
Rate‡ per 100,000Rate‡ per 100,000
Rate‡ per 100,000Rate‡ per 100,000
Rate‡ per 100,000Rate‡ per 100,000
All Races White
Black Asian/Pacific Islander§
American Indian/Alaska Native§ Hispanic§�
∗ Data are from selected state and metropolitan area cancer registries that meet the data quality criteria for all invasive
cancer sites combined. See Appendix B for data quality criteria and registry-specific data quality information.† Excludes basal and squamous cell carcinomas of the skin except when these occur on the skin of the genital organs, and in
situ cancers except urinary bladder.‡ Rates are age-adjusted to the 2000 U.S. standard population (19 age groups - Census P25-1130). See Table 2.1.1.1F-2.27.1.1F
and Appendix F.1-F.2 for 95% confidence intervals for rates. Rates are suppressed and not ranked if the population of a specific
category (race, ethnicity) is less than 50,000 or if cases are fewer than 16.§ Data for specified racial or ethnic populations other than white and black should be interpreted with caution. See Technical
Notes.� Hispanic origin is not mutually exclusive from race categories (white, black, Asian/Pacific Islander, American Indian/Alaska
Native).
Note: ONS — Other Nervous System; NOS — Not Otherwise Specified; IBD — Intrahepatic Bile Duct. Ovary excludes cancers newly
classified as borderline according to ICD-O-3, beginning with 2001 diagnoses. See Technical Notes.

State and Metropolitan-Area Incidence Rates and State Death Rates for the Most Common Cancers
���
Figure 3.57.F2: Age-Adjusted Cancer Death Rates for the 10 Primary Sites with theHighest Rates within Race- and Ethnic-Specific Categories
Wisconsin,∗ Females, 2004
Kidney & Renal Pelvis
Brain & ONS
Corpus & Uterus, NOS
Non-Hodgkin Lymphoma
Leukemias
Ovary
Pancreas
Colon & Rectum
Breast
Lung & Bronchus
0 50 100 150
3.2
3.2
3.8
6.1
6.3
9.0
9.4
14.1
23.4
38.3
Kidney & Renal Pelvis
Brain & ONS
Corpus & Uterus, NOS
Non-Hodgkin Lymphoma
Leukemias
Ovary
Pancreas
Colon & Rectum
Breast
Lung & Bronchus
0 50 100 150
3.1
3.3
3.5
6.2
6.3
9.2
9.4
14.2
23.5
37.4
Breast
Lung & Bronchus
0 50 100 150
22.8
54.9
0 50 100 150
Death rates were notranked when the populationsize was less than 50,000or case counts were fewerthan 16 in each of the sitecategories.
0 50 100 150
Death rates were notranked when the populationsize was less than 50,000or case counts were fewerthan 16 in each of the sitecategories.
0 50 100 150
Death rates were notranked when the populationsize was less than 50,000or case counts were fewerthan 16 in each of the sitecategories.
Rate† per 100,000Rate† per 100,000
Rate† per 100,000Rate† per 100,000
Rate† per 100,000Rate† per 100,000
All Races White
Black Asian/Pacific Islander‡
American Indian/Alaska Native‡ Hispanic‡§
∗ Data are from the National Vital Statistics System (NVSS).† Rates are age-adjusted to the 2000 U.S. standard population (19 age groups - Census P25-1130). See Table 2.1.1.2F-2.27.1.2F
and Appendix F.1-F.2 for 95% confidence intervals for rates. Rates are suppressed and not ranked if the population of a specific
category (race, ethnicity) is less than 50,000 or if deaths are fewer than 16.‡ Data for specified racial or ethnic populations other than white and black should be interpreted with caution. See Technical
Notes.§ Hispanic origin is not mutually exclusive from race categories (white, black, Asian/Pacific Islander, American Indian/Alaska
Native).
Note: ONS — Other Nervous System; NOS — Not Otherwise Specified; IBD — Intrahepatic Bile Duct.

United States Cancer Statistics: 2004 Incidence and Mortality
��0
Figure 3.58.M1: Age-Adjusted Invasive Cancer Incidence Rates for the 10 Primary Siteswith the Highest Rates within Race- and Ethnic-Specific Categories
Wyoming,∗† Males, 2004
Pancreas
Leukemias
Kidney & Renal Pelvis
Oral Cavity & Pharynx
Non-Hodgkin Lymphoma
Melanomas of the Skin
Urinary Bladder
Colon & Rectum
Lung & Bronchus
Prostate
0 50 100 150 200 250 300
11.0
12.8
13.7
16.9
22.5
25.4
37.6
53.0
64.4
163.4
Pancreas
Leukemias
Kidney & Renal Pelvis
Oral Cavity & Pharynx
Non-Hodgkin Lymphoma
Melanomas of the Skin
Urinary Bladder
Colon & Rectum
Lung & Bronchus
Prostate
0 50 100 150 200 250 300
11.2
11.4
13.5
17.2
21.9
24.9
36.8
49.7
65.3
157.5
0 50 100 150 200 250 300
Incidence rates were notranked when the populationsize was less than 50,000or case counts were fewerthan 16 in each of the sitecategories.
0 50 100 150 200 250 300
Incidence rates were notranked when the populationsize was less than 50,000or case counts were fewerthan 16 in each of the sitecategories.
0 50 100 150 200 250 300
Incidence rates were notranked when the populationsize was less than 50,000or case counts were fewerthan 16 in each of the sitecategories.
0 50 100 150 200 250 300
Incidence rates were notranked when the populationsize was less than 50,000or case counts were fewerthan 16 in each of the sitecategories.
Rate‡ per 100,000Rate‡ per 100,000
Rate‡ per 100,000Rate‡ per 100,000
Rate‡ per 100,000Rate‡ per 100,000
All Races White
Black Asian/Pacific Islander§
American Indian/Alaska Native§ Hispanic§�
∗ Data are from selected state and metropolitan area cancer registries that meet the data quality criteria for all invasive
cancer sites combined. See Appendix B for data quality criteria and registry-specific data quality information.† Excludes basal and squamous cell carcinomas of the skin except when these occur on the skin of the genital organs, and in
situ cancers except urinary bladder.‡ Rates are age-adjusted to the 2000 U.S. standard population (19 age groups - Census P25-1130). See Table 2.1.1.1M-2.27.1.1M
and Appendix F.1-F.2 for 95% confidence intervals for rates. Rates are suppressed and not ranked if the population of a specific
category (race, ethnicity) is less than 50,000 or if cases are fewer than 16.§ Data for specified racial or ethnic populations other than white and black should be interpreted with caution. See Technical
Notes.� Hispanic origin is not mutually exclusive from race categories (white, black, Asian/Pacific Islander, American Indian/Alaska
Native).
Note: ONS — Other Nervous System; NOS — Not Otherwise Specified; IBD — Intrahepatic Bile Duct.

State and Metropolitan-Area Incidence Rates and State Death Rates for the Most Common Cancers
���
Figure 3.58.M2: Age-Adjusted Cancer Death Rates for the 10 Primary Sites with theHighest Rates within Race- and Ethnic-Specific Categories
Wyoming,∗ Males, 2004
Brain & ONS
Urinary Bladder
Non-Hodgkin Lymphoma
Esophagus
Leukemias
Pancreas
Colon & Rectum
Prostate
Lung & Bronchus
0 50 100 150
6.6
7.2
7.6
9.9
9.9
10.5
21.7
26.6
50.6
Brain & ONS
Urinary Bladder
Non-Hodgkin Lymphoma
Esophagus
Leukemias
Pancreas
Colon & Rectum
Prostate
Lung & Bronchus
0 50 100 150
6.8
7.3
7.7
10.1
10.1
10.6
21.6
26.5
51.1
0 50 100 150
Death rates were notranked when the populationsize was less than 50,000or case counts were fewerthan 16 in each of the sitecategories.
0 50 100 150
Death rates were notranked when the populationsize was less than 50,000or case counts were fewerthan 16 in each of the sitecategories.
0 50 100 150
Death rates were notranked when the populationsize was less than 50,000or case counts were fewerthan 16 in each of the sitecategories.
0 50 100 150
Death rates were notranked when the populationsize was less than 50,000or case counts were fewerthan 16 in each of the sitecategories.
Rate† per 100,000Rate† per 100,000
Rate† per 100,000Rate† per 100,000
Rate† per 100,000Rate† per 100,000
All Races White
Black Asian/Pacific Islander‡
American Indian/Alaska Native‡ Hispanic‡§
∗ Data are from the National Vital Statistics System (NVSS).† Rates are age-adjusted to the 2000 U.S. standard population (19 age groups - Census P25-1130). See Table 2.1.1.2M-2.27.1.2M
and Appendix F.1-F.2 for 95% confidence intervals for rates. Rates are suppressed and not ranked if the population of a specific
category (race, ethnicity) is less than 50,000 or if deaths are fewer than 16.‡ Data for specified racial or ethnic populations other than white and black should be interpreted with caution. See Technical
Notes.§ Hispanic origin is not mutually exclusive from race categories (white, black, Asian/Pacific Islander, American Indian/Alaska
Native).
Note: ONS — Other Nervous System; NOS — Not Otherwise Specified; IBD — Intrahepatic Bile Duct.

United States Cancer Statistics: 2004 Incidence and Mortality
���
Figure 3.58.F1: Age-Adjusted Invasive Cancer Incidence Rates for the 10 Primary Siteswith the Highest Rates within Race- and Ethnic-Specific Categories
Wyoming,∗† Females, 2004
Cervix Uteri
Urinary Bladder
Ovary
Corpus & Uterus, NOS
Non-Hodgkin Lymphoma
Melanomas of the Skin
Thyroid
Colon & Rectum
Lung & Bronchus
Breast
0 50 100 150 200 250 300
9.6
10.8
14.9
15.9
17.0
18.0
24.6
40.2
44.4
113.3
Oral Cavity & Pharynx
Urinary Bladder
Ovary
Non-Hodgkin Lymphoma
Corpus & Uterus, NOS
Melanomas of the Skin
Thyroid
Colon & Rectum
Lung & Bronchus
Breast
0 50 100 150 200 250 300
9.4
11.1
14.8
15.3
15.5
18.7
22.3
37.7
43.5
108.2
0 50 100 150 200 250 300
Incidence rates were notranked when the populationsize was less than 50,000or case counts were fewerthan 16 in each of the sitecategories.
0 50 100 150 200 250 300
Incidence rates were notranked when the populationsize was less than 50,000or case counts were fewerthan 16 in each of the sitecategories.
0 50 100 150 200 250 300
Incidence rates were notranked when the populationsize was less than 50,000or case counts were fewerthan 16 in each of the sitecategories.
0 50 100 150 200 250 300
Incidence rates were notranked when the populationsize was less than 50,000or case counts were fewerthan 16 in each of the sitecategories.
Rate‡ per 100,000Rate‡ per 100,000
Rate‡ per 100,000Rate‡ per 100,000
Rate‡ per 100,000Rate‡ per 100,000
All Races White
Black Asian/Pacific Islander§
American Indian/Alaska Native§ Hispanic§�
∗ Data are from selected state and metropolitan area cancer registries that meet the data quality criteria for all invasive
cancer sites combined. See Appendix B for data quality criteria and registry-specific data quality information.† Excludes basal and squamous cell carcinomas of the skin except when these occur on the skin of the genital organs, and in
situ cancers except urinary bladder.‡ Rates are age-adjusted to the 2000 U.S. standard population (19 age groups - Census P25-1130). See Table 2.1.1.1F-2.27.1.1F
and Appendix F.1-F.2 for 95% confidence intervals for rates. Rates are suppressed and not ranked if the population of a specific
category (race, ethnicity) is less than 50,000 or if cases are fewer than 16.§ Data for specified racial or ethnic populations other than white and black should be interpreted with caution. See Technical
Notes.� Hispanic origin is not mutually exclusive from race categories (white, black, Asian/Pacific Islander, American Indian/Alaska
Native).
Note: ONS — Other Nervous System; NOS — Not Otherwise Specified; IBD — Intrahepatic Bile Duct. Ovary excludes cancers newly
classified as borderline according to ICD-O-3, beginning with 2001 diagnoses. See Technical Notes.

State and Metropolitan-Area Incidence Rates and State Death Rates for the Most Common Cancers
��3
Figure 3.58.F2: Age-Adjusted Cancer Death Rates for the 10 Primary Sites with theHighest Rates within Race- and Ethnic-Specific Categories
Wyoming,∗ Females, 2004
Non-Hodgkin Lymphoma
Pancreas
Ovary
Colon & Rectum
Breast
Lung & Bronchus
0 50 100 150
8.6
10.8
12.3
13.2
24.5
31.8
Non-Hodgkin Lymphoma
Pancreas
Ovary
Colon & Rectum
Breast
Lung & Bronchus
0 50 100 150
7.0
10.0
12.2
13.4
24.7
31.4
0 50 100 150
Death rates were notranked when the populationsize was less than 50,000or case counts were fewerthan 16 in each of the sitecategories.
0 50 100 150
Death rates were notranked when the populationsize was less than 50,000or case counts were fewerthan 16 in each of the sitecategories.
0 50 100 150
Death rates were notranked when the populationsize was less than 50,000or case counts were fewerthan 16 in each of the sitecategories.
0 50 100 150
Death rates were notranked when the populationsize was less than 50,000or case counts were fewerthan 16 in each of the sitecategories.
Rate† per 100,000Rate† per 100,000
Rate† per 100,000Rate† per 100,000
Rate† per 100,000Rate† per 100,000
All Races White
Black Asian/Pacific Islander‡
American Indian/Alaska Native‡ Hispanic‡§
∗ Data are from the National Vital Statistics System (NVSS).† Rates are age-adjusted to the 2000 U.S. standard population (19 age groups - Census P25-1130). See Table 2.1.1.2F-2.27.1.2F
and Appendix F.1-F.2 for 95% confidence intervals for rates. Rates are suppressed and not ranked if the population of a specific
category (race, ethnicity) is less than 50,000 or if deaths are fewer than 16.‡ Data for specified racial or ethnic populations other than white and black should be interpreted with caution. See Technical
Notes.§ Hispanic origin is not mutually exclusive from race categories (white, black, Asian/Pacific Islander, American Indian/Alaska
Native).
Note: ONS — Other Nervous System; NOS — Not Otherwise Specified; IBD — Intrahepatic Bile Duct.


Appendices


Appendix A


Appendix A
A-�
National Program of Cancer Registries
Scientific Working Group Members
Mark E. Allen, MS, California Cancer RegistryJanet Bates, MD, MPH, California Central Cancer RegistrySally A. Bushhouse, DVM, PhD, Minnesota Cancer Surveillance SystemVivien W. Chen, PhD, Louisiana Tumor Registry Susan T. Gershman, MS, MPH, PhD, CTR, Massachusetts Cancer RegistryGeorgette G. Haydu, MS, Ohio Cancer Incidence Surveillance SystemJeanette Jackson-Thompson, PhD, MSPH, Missouri Cancer RegistryAlison T. Johnson, CTR, Vermont Cancer Registry Amy Kahn, MS, CTR, New York State Cancer RegistryKaren L. Knight, MS, North Carolina Central Cancer RegistryBetsy A. Kohler, MPH, CTR, New Jersey State Cancer RegistrySue Min Lai, PhD, MS, MBA, Kansas Cancer RegistryMelinda Lehnherr, RN, Illinois State Cancer RegistryJill A. MacKinnon, PhD, CTR, Florida Cancer Data SystemHoward J. Martin, PhD, Virginia Cancer RegistryXiaoling Niu, MS, New Jersey State Cancer RegistryEmily Reed, CTR, Kentucky Cancer RegistryMaria J. Schymura, PhD, New York State Cancer RegistryTiefu Shen, MD, PhD, Illinois State Cancer RegistryLaura Stephenson, BA, Wisconsin Cancer Reporting System Thomas C. Tucker, PhD, MPH, Kentucky Cancer RegistryNancy S. Weiss, PhD, Texas Cancer RegistryMelanie Williams, PhD, Texas Cancer RegistryBrian D. Wright, BS, Pennsylvania Cancer Registry Xiao Cheng Wu, MD, MPH, CTR, Louisiana Tumor Registry
CTR = certified tumor registrar.


Appendix B


Tables B.1–B.2

United States Cancer Statistics: 2004 Incidence and Mortality
B-2
Table B.1: Achievement of Selected Data Quality Criteria* by State and SEER Metropolitan Area Cancer Registries, 2004Data from the shaded states and metropolitan areas are NOT included in United StatesCancer Statistics: 2004 Incidence and Mortality.
% Case % Passing % % Missing % Missing % Missing
Cancer Registry Ascertainment† Edits‡ DCOs§ Sex Race Age
Alabama >95 100.00 1.68 0.00 0.48 0.00
Alaska >95 100.00 1.42 0.00 1.10 0.00
Arizona 90-94 100.00 3.08 0.01 2.24 0.05
Arkansas 90-94 100.00 0.49 0.06 0.68 0.03
California >95 100.00 0.86 0.02 1.87 0.04
Greater Bay║ ≥ 95 100.00 1.00 0.00 1.77 0.03
Los Angeles ≥ 95 100.00 1.20 0.01 1.87 0.02
Colorado >95 99.97 2.46 0.00 2.61 0.01
Connecticut 90-94 100.00 1.40 0.03 0.39 0.00
Delaware >95 100.00 2.43 0.00 1.62 0.00
District of Columbia 90-94 100.00 2.77 0.00 2.18 0.00
Florida >95 100.00 2.80 0.03 0.58 0.00
Georgia >95 100.00 2.08 0.00 0.33 0.00
Atlanta ≥ 95 100.00 1.10 0.00 0.43 0.00
Hawaii ≥ 95 100.00 1.40 0.00 1.95 0.00
Idaho >95 100.00 1.93 0.00 0.08 0.00
Illinois >95 100.00 1.94 0.00 2.31 0.00
Indiana >95 100.00 2.14 0.00 0.83 0.00
Iowa ≥ 95 100.00 1.40 0.01 1.87 0.00
Kansas >95 100.00 2.82 0.00 2.60 0.00
Kentucky >95 100.00 1.02 0.00 2.37 0.00
Louisiana >95 100.00 1.16 0.00 0.15 0.00
Maine >95 100.00 1.67 0.02 1.13 0.00
Maryland ¶
Massachusetts >95 100.00 1.80 0.00 1.44 0.00
Michigan >95 99.75 1.70 0.04 2.56 0.00
Detroit 90-94 100.00 1.00 0.00 2.24 0.00
Minnesota >95 99.94 2.46 0.00 4.34 0.03
Mississippi >95 100.00 3.69 0.00 0.48 0.00
Missouri >95 100.00 2.14 0.01 0.27 0.00
Montana >95 100.00 2.84 0.00 1.24 0.00
Nebraska >95 100.00 2.03 0.00 2.19 0.00
Nevada >95 100.00 2.52 0.00 2.14 0.02
New Hampshire >95 100.00 0.80 0.12 2.35 0.00
New Jersey >95 100.00 1.21 0.00 1.58 0.02
New Mexico ≥ 95 99.98 2.60 0.00 0.04 0.00
New York >95 100.00 0.86 0.00 1.80 0.06
North Carolina >95 100.00 0.97 0.02 0.29 0.00
continued
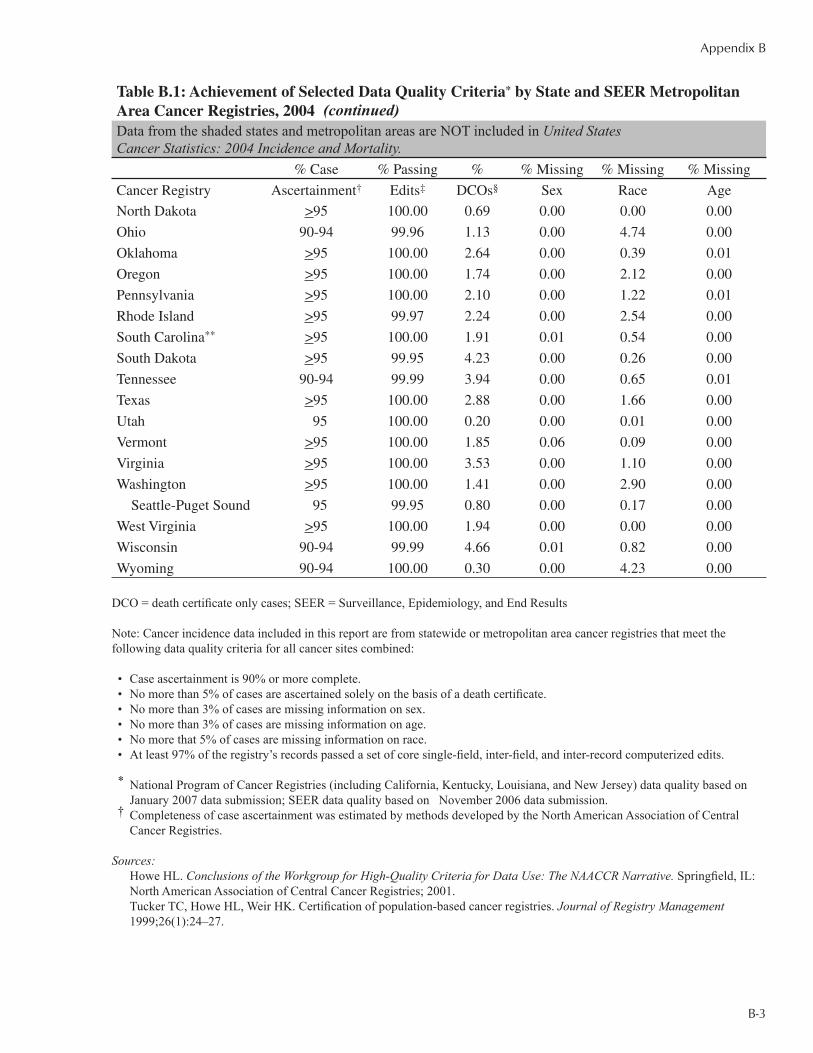
Appendix B
B-3
Table B.1: Achievement of Selected Data Quality Criteria* by State and SEER Metropolitan Area Cancer Registries, 2004Data from the shaded states and metropolitan areas are NOT included in United StatesCancer Statistics: 2004 Incidence and Mortality.
% Case % Passing % % Missing % Missing % Missing
Cancer Registry Ascertainment† Edits‡ DCOs§ Sex Race Age
North Dakota >95 100.00 0.69 0.00 0.00 0.00
Ohio 90-94 99.96 1.13 0.00 4.74 0.00
Oklahoma >95 100.00 2.64 0.00 0.39 0.01
Oregon >95 100.00 1.74 0.00 2.12 0.00
Pennsylvania >95 100.00 2.10 0.00 1.22 0.01
Rhode Island >95 99.97 2.24 0.00 2.54 0.00
South Carolina** >95 100.00 1.91 0.01 0.54 0.00
South Dakota >95 99.95 4.23 0.00 0.26 0.00
Tennessee 90-94 99.99 3.94 0.00 0.65 0.01
Texas >95 100.00 2.88 0.00 1.66 0.00
Utah ≥ 95 100.00 0.20 0.00 0.01 0.00
Vermont >95 100.00 1.85 0.06 0.09 0.00
Virginia >95 100.00 3.53 0.00 1.10 0.00
Washington >95 100.00 1.41 0.00 2.90 0.00
Seattle-Puget Sound ≥ 95 99.95 0.80 0.00 0.17 0.00
West Virginia >95 100.00 1.94 0.00 0.00 0.00
Wisconsin 90-94 99.99 4.66 0.01 0.82 0.00
Wyoming 90-94 100.00 0.30 0.00 4.23 0.00
DCO = death certificate only cases; SEER = Surveillance, Epidemiology, and End Results
Note: Cancer incidence data included in this report are from statewide or metropolitan area cancer registries that meet the following data quality criteria for all cancer sites combined:
• Case ascertainment is 90% or more complete.• No more than 5% of cases are ascertained solely on the basis of a death certificate.• No more than 3% of cases are missing information on sex.• No more than 3% of cases are missing information on age.• No more that 5% of cases are missing information on race.• At least 97% of the registry’s records passed a set of core single-field, inter-field, and inter-record computerized edits.
* National Program of Cancer Registries (including California, Kentucky, Louisiana, and New Jersey) data quality based on January 2007 data submission; SEER data quality based on November 2006 data submission.
† Completeness of case ascertainment was estimated by methods developed by the North American Association of Central Cancer Registries.
Sources:Howe HL. Conclusions of the Workgroup for High-Quality Criteria for Data Use: The NAACCR Narrative. Springfield, IL: North American Association of Central Cancer Registries; 2001.Tucker TC, Howe HL, Weir HK. Certification of population-based cancer registries. Journal of Registry Management 1999;26(1):24–27.
(continued)

United States Cancer Statistics: 2004 Incidence and Mortality
B-4
‡ Computerized edits test the validity and logic of data components reported for selected items.§ Death certificate only cases (DCOs) are cancer cases ascertained solely on the basis of a death certificate after the registry has
completed a routine procedure known as death clearance and followback. ║ Greater Bay includes San Francisco-Oakland and San Jose-Monterey Registries.¶ No data available**While the South Carolina Central Cancer Registry met USCS publication criteria, data for nonmalignant brain and other
nervous system tumors were not available for inclusion in tables 1.3.1.1M and 1.3.1.1F.

Appendix B
B-5
Table B.2: Confirmation* and detection† rates for cancer mortality‡ by anatomic site and International Classification of Diseases (ICD) version—United States
Confirmation Rate* (%) Detection Rate† (%) Cancer Site ICD–9 ICD–8A ICD–9 ICD–8AAll malignant sites 84.8 82.7 83.3 82.7Oral cavity and pharynx NA NA NA NA Esophagus 77.0 86.1 93.7 93.2Stomach 93.9 90.9 88.1 89.2Colon and rectum 95.6 95.0 92.7 92.9Liver and intrahepatic bile duct§ NA 76.7 NA 49.6 Liver§ 70.2 NA 78.3 NAPancreas 90.3 89.0 91.5 90.2Larynx 69.3 73.2 72.2 80.3Lung and bronchus§ 94.3 NA 95.4 NA Trachea, lung and bronchus§ NA 93.9 NA 95.0Melanomas of the skin 88.6 90.5 89.7 87.6Breast║ 98.7 98.1 95.7 95.0 Cervix uteri 93.2 90.4 81.1 79.0Corpus and uterus, NOS§ NA 71.5 NA 81.5 Corpus§ 93.3 NA 43.9 NAOvary§ 91.9 NA 90.7 NA Ovary, fallopian tube, etc.§ NA 88.2 NA 88.3Prostate 98.1 96.3 93.5 94.7Testis 75.9 90.4 90.6 83.1Urinary bladder 95.7 93.6 88.9 91.1Kidney and renal pelvis§ 93.5 NA 89.6 NA Kidney§ NA 93.0 NA 87.9 Brain and other nervous system 93.1 89.2 97.1 97.2Thyroid 96.6 91.5 88.6 87.2Hodgkin lymphoma 95.6 92.5 83.5 86.7Non-Hodgkin lymphoma 92.8 88.4 87.5 83.2Multiple myeloma 97.2 98.1 97.3 96.6Leukemias NA NA NA NA
NA = not available; NOS = not otherwise specified.
* Percentage of cancer listed as underlying cause of death (UCD) on the death certificate that agrees with the original cancer diagnosis as coded in the medical record.
† Percentage of original cancer diagnoses as coded in the medical record that agrees with cancer as UCD on the death certificate.
‡ Adapted from (1) Percy C, Stanek E, III, Gloeckler L. Accuracy of cancer death certificates and its effect on cancer mortality statistics. American Journal of Public Health 1981;71(3):242– 250 and (2) Percy CL, Miller BA, Gloeckler Ries LA. Effect of changes in cancer classification and the accuracy of cancer death certificates on trends in cancer mortality. Annals of the New York Academy of Sciences 1990;609:87–97.
§ Because of inconsistencies in site categories, caution should be used when comparing ICD–9 and ICD–8A confirmation and detection rates.
║ Includes both male and female breast cancer.


Appendix C


Tables C.1–C.4

United States Cancer Statistics: 2004 Incidence and Mortality
C-2
Table C.1: SEER Site Groups for Primary Cancer Sites Based on the International Classification of Diseases for Oncology, Third Edition (ICD–O–3)
Site Group Primary Site Histologic TypeOral Cavity and Pharynx Lip C000-C009
excluding 9590-9989, and sometimes 9050-9055, 9140*
Tongue C019-C029 Salivary gland C079-C089 Floor of mouth C040-C049
Gum and other mouth C030-C039, C050-C059, C060-C069
Nasopharynx C110-C119 Tonsil C090-C099 Oropharynx C100-C109 Hypopharynx C129, C130-C139 Other oral cavity and pharynx C140, C142-C148 Digestive System Esophagus C150-C159
excluding 9590-9989, and sometimes 9050-9055, 9140* Stomach C160-C169
Small intestine C170-C179 Colon and rectum Colon excluding rectum Cecum C180
excluding 9590-9989, and sometimes 9050-9055, 9140*
Appendix C181 Ascending colon C182 Hepaticflexure C183 Transverse colon C184 Splenicflexure C185 Descending colon C186 Sigmoid colon C187 Large intestine, NOS C188-C189, C260 Rectum and rectosigmoid junction Rectosigmoid junction C199
excluding 9590-9989, and sometimes 9050-9055, 9140*
Rectum C209 Anus, anal canal, and anorectum C210-C212, C218
Liver and intrahepatic bile duct Liver C220
excluding 9590-9989, and sometimes 9050-9055, 9140*
Intrahepatic bile duct C221 Gallbladder C239 Other biliary C240-C249 Pancreas C250-C259 Retroperitoneum C480 Peritoneum, omentum, and mesentery C481-C482
Other digestive organs C268-C269, C488
continued
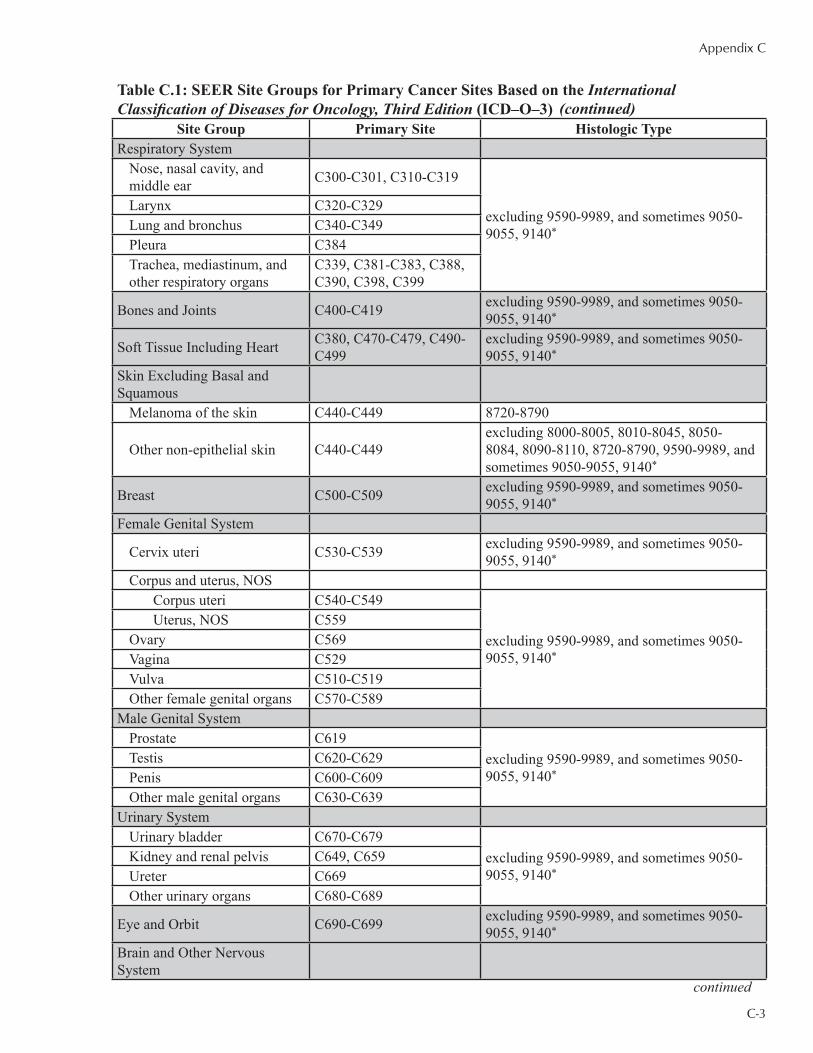
Appendix C
C-3
Table C.1: SEER Site Groups for Primary Cancer Sites Based on the International Classification of Diseases for Oncology, Third Edition (ICD–O–3)
Site Group Primary Site Histologic TypeRespiratory System Nose, nasal cavity, and middle ear C300-C301, C310-C319
excluding 9590-9989, and sometimes 9050-9055, 9140*
Larynx C320-C329 Lung and bronchus C340-C349 Pleura C384 Trachea, mediastinum, and other respiratory organs
C339, C381-C383, C388, C390, C398, C399
Bones and Joints C400-C419 excluding 9590-9989, and sometimes 9050-9055, 9140*
Soft Tissue Including Heart C380, C470-C479, C490-C499
excluding 9590-9989, and sometimes 9050-9055, 9140*
Skin Excluding Basal and Squamous
Melanoma of the skin C440-C449 8720-8790
Other non-epithelial skin C440-C449 excluding 8000-8005, 8010-8045, 8050-8084, 8090-8110, 8720-8790, 9590-9989, and sometimes 9050-9055, 9140*
Breast C500-C509 excluding 9590-9989, and sometimes 9050-9055, 9140*
Female Genital System
Cervix uteri C530-C539 excluding 9590-9989, and sometimes 9050-9055, 9140*
Corpus and uterus, NOS Corpus uteri C540-C549
excluding 9590-9989, and sometimes 9050-9055, 9140*
Uterus, NOS C559 Ovary C569 Vagina C529 Vulva C510-C519 Other female genital organs C570-C589 Male Genital System Prostate C619
excluding 9590-9989, and sometimes 9050-9055, 9140*
Testis C620-C629 Penis C600-C609 Other male genital organs C630-C639 Urinary System Urinary bladder C670-C679
excluding 9590-9989, and sometimes 9050-9055, 9140*
Kidney and renal pelvis C649, C659 Ureter C669 Other urinary organs C680-C689
Eye and Orbit C690-C699 excluding 9590-9989, and sometimes 9050-9055, 9140*
Brain and Other Nervous System
continued
(continued)

United States Cancer Statistics: 2004 Incidence and Mortality
C-4
Table C.1: SEER Site Groups for Primary Cancer Sites Based on the International Classification of Diseases for Oncology, Third Edition (ICD–O–3)
Site Group Primary Site Histologic Type
Brain C710-C719 excluding 9530-9539, 9590-9989, and sometimes 9050-9055, 9140*
Cranial nerves; other nervous system
C710-C719 9530-9539
C700-C709, C720-C729 excluding 9590-9989, and sometimes 9050-9055, 9140*
Endocrine System Thyroid C739
excluding 9590-9989, and sometimes 9050-9055, 9140* Other endocrine
including thymusC379, C740-C749, C750-C759
Lymphoma Hodgkin lymphoma
Hodgkin - nodal C024, C098-C099, C111, C142, C379, C422, C770-C779 9650-9667
Hodgkin - extranodal All other sites Non-hodgkin lymphoma (NHL)
NHL - nodalC024, C098,C099, C111,C142, C379,C422, C770-C779
9590-9596, 9670-9671, 9673, 9675, 9678-9680, 9684, 9687, 9689-9691, 9695, 9698-9702, 9705, 9708-9709, 9714-9719, 9727-9729, 9823, 9827
NHL - extranodal
All sites except C024, C098-C099, C111, C142, C379, C422, C770-C779
9590-9596, 9670-9671, 9673, 9675, 9678-9680, 9684, 9687, 9689-9691, 9695, 9698-9702, 9705, 9708-9709, 9714-9719, 9727-9729
All sites except C024, C098-C099, C111, C142, C379, C420-C422, C424, C770-C779
9823, 9827
Myeloma 9731-9732, 9734 Leukemia Lymphocytic leukemia Acute lymphocytic leukemia 9826,9835-9837
Chronic lymphocytic Leukemia C420, C421, C424 9823
Other lymphocytic leukemia 9820, 9832-9834, 9940
Myeloid and monocytic leukemia
Acute myeloid leukemia 9840, 9861, 9866, 9867, 9871-9874, 9895-9897, 9910, 9920
Acute monocytic leukemia 9891
Chronic myeloid leukemia 9863, 9875, 9876, 9945, 9946
continued
(continued)

Appendix C
C-5
Table C.1: SEER Site Groups for Primary Cancer Sites Based on the International Classification of Diseases for Oncology, Third Edition (ICD–O–3)
Site Group Primary Site Histologic Type Other myeloid/monocytic leukemia 9860, 9930
Other leukemia Other acute leukemia 9801, 9805, 9931
Aleukemic, subleukemic, and NOS
9733, 9742, 9800, 9831, 9870, 9948, 9963, 9964
C420, C421, C424 9827 Mesothelioma* 9050-9055 Kaposi Sarcoma* 9140
Miscellaneous
9740-9741, 9750-9758, 9760-9769, 9950, 9960-9962, 9970, 9975, 9980, 9982-9987, 9989
C760-C768, C809 excluding 9590-9989, and sometimes 9050-9055, 9140* C420-C424
C770-C779
Invalid Site or histology code not within valid range or site code not found in this table.
NOS=nototherwisespecified;SEER=Surveillance,Epidemiology,andEndResults.
*The Site Recode variable can be created with or without Mesothelioma (9050-9055) and Kaposi Sarcoma (9140) as separate groupings. The table above documents both possibilities.
Source: http://seer.cancer.gov/siterecode/icdo3_d01272003/. [Accessed October 2007].
(continued)

United States Cancer Statistics: 2004 Incidence and Mortality
C-6
Table C.2: SEER Site Groups based on the International Classification of Childhood Cancer, Third Edition (ICCC-3) based on ICD–O–31
Site Group Histologic Type Primary SiteI. Leukemias, Myeloproliferative Diseases, and Myelodysplastic Diseases
(a) Lymphoid leukemias 9820, 9823, 9826, 9827, 9831-9837, 9940, 9948 C000-C809
(b) Acute myeloid leukemias 9840, 9861, 9866, 9867, 9870-9874, 9891, 9895-9897, 9910, 9920, 9931 C000-C809
(c) Chronic myeloproliferative diseases 9863, 9875, 9876, 9950, 9960-9964 C000-C809
(d) Myelodysplastic syndrome and other myeloproliferative diseases
9945, 9946, 9975, 9980, 9982-9987, 9989 C000-C809
(e)Unspecifiedandother specifiedleukemias 9800, 9801, 9805, 9860, 9930 C000-C809
II. Lymphomas and Reticuloendothelial Neoplasms
(a) Hodgkin lymphomas 9650-9655, 9659, 9661-9665, 9667 C000-C809
(b) Non-Hodgkin lymphomas (except Burkitt lymphoma)
9591, 9670, 9671, 9673, 9675, 9678-9680, 9684, 9689-9691, 9695, 9698-9702, 9705, 9708, 9709, 9714, 9716-9719, 9727-9729, 9731-9734, 9760-9762, 9764-9769, 9970
C000-C809
(c) Burkitt lymphoma 9687 C000-C809 (d) Miscellaneous lymphoreticular neoplasms 9740-9742, 9750, 9754-9758 C000-C809
(e)Unspecifiedlymphomas 9590, 9596 C000-C809III. CNS and Miscellaneous Intracranial and Intraspinal Neoplasms
(a) Ependymomas and choroid plexus tumor 9383, 9390-9394 C000-C809
(b) Astrocytomas9380 C7239384, 9400-9411, 9420, 9421-9424, 9440-9442 C000-C809
(c) Intracranial and intraspinal embryonal tumors
9470-9474, 9480, 9508 C000-C8099501-9504 C700-C729
(d) Other gliomas9380 C700-C722, C724-C729,
C751, C7539381, 9382, 9430, 9444, 9450, 9451, 9460 C000-C809
(e)Otherspecifiedintracranial and intraspinal neoplasms
8270-8281, 8300, 9350-9352, 9360-9362, 9412, 9413, 9492, 9493, 9505-9507, 9530-9539, 9582
C000-C809
(f)Unspecifiedintracranialand intraspinal neoplasms 8000-8005 C700-C729, C751-C753
continued
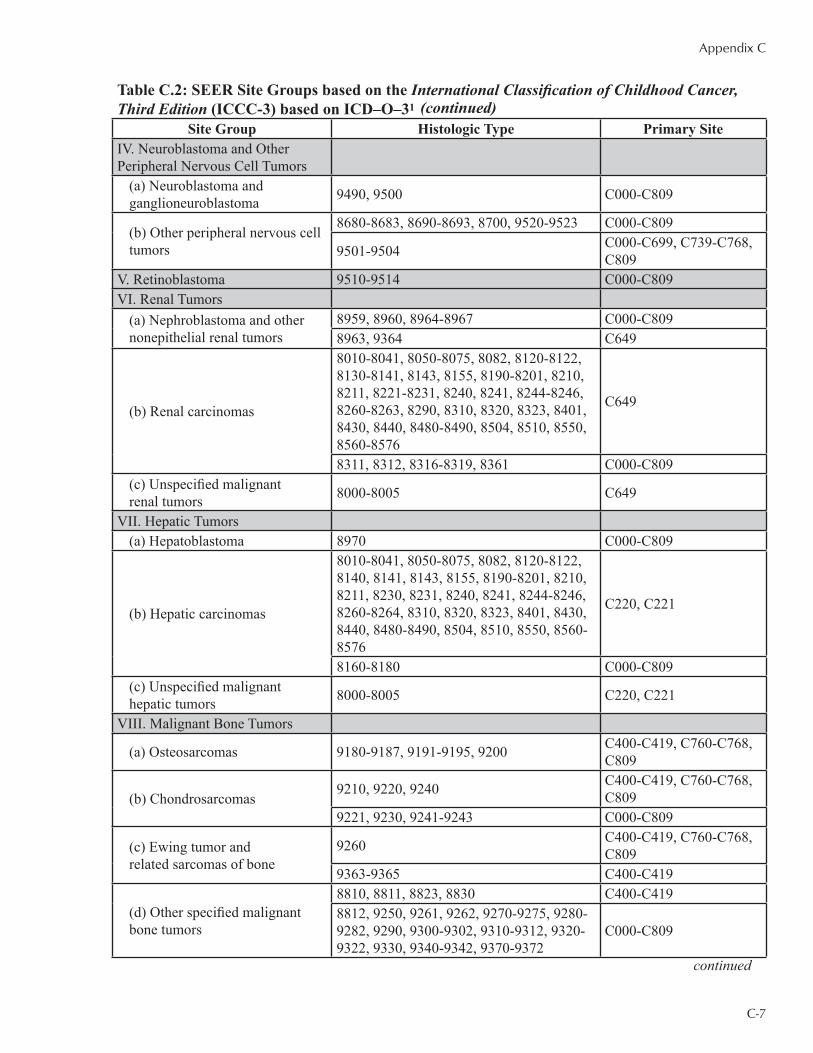
Appendix C
C-7
Table C.2: SEER Site Groups based on the International Classification of Childhood Cancer, Third Edition (ICCC-3) based on ICD–O–31
Site Group Histologic Type Primary SiteIV. Neuroblastoma and Other Peripheral Nervous Cell Tumors
(a) Neuroblastoma and ganglioneuroblastoma 9490, 9500 C000-C809
(b) Other peripheral nervous cell tumors
8680-8683, 8690-8693, 8700, 9520-9523 C000-C809
9501-9504 C000-C699, C739-C768, C809
V. Retinoblastoma 9510-9514 C000-C809VI. Renal Tumors (a) Nephroblastoma and other nonepithelial renal tumors
8959, 8960, 8964-8967 C000-C8098963, 9364 C649
(b) Renal carcinomas
8010-8041, 8050-8075, 8082, 8120-8122, 8130-8141, 8143, 8155, 8190-8201, 8210, 8211, 8221-8231, 8240, 8241, 8244-8246, 8260-8263, 8290, 8310, 8320, 8323, 8401, 8430, 8440, 8480-8490, 8504, 8510, 8550, 8560-8576
C649
8311, 8312, 8316-8319, 8361 C000-C809 (c)Unspecifiedmalignant renal tumors 8000-8005 C649
VII. Hepatic Tumors (a) Hepatoblastoma 8970 C000-C809
(b) Hepatic carcinomas
8010-8041, 8050-8075, 8082, 8120-8122, 8140, 8141, 8143, 8155, 8190-8201, 8210, 8211, 8230, 8231, 8240, 8241, 8244-8246, 8260-8264, 8310, 8320, 8323, 8401, 8430, 8440, 8480-8490, 8504, 8510, 8550, 8560-8576
C220, C221
8160-8180 C000-C809 (c)Unspecifiedmalignant hepatic tumors 8000-8005 C220, C221
VIII. Malignant Bone Tumors
(a) Osteosarcomas 9180-9187, 9191-9195, 9200 C400-C419, C760-C768, C809
(b) Chondrosarcomas9210, 9220, 9240 C400-C419, C760-C768,
C8099221, 9230, 9241-9243 C000-C809
(c) Ewing tumor and related sarcomas of bone
9260 C400-C419, C760-C768, C809
9363-9365 C400-C419
(d)Otherspecifiedmalignant bone tumors
8810, 8811, 8823, 8830 C400-C4198812, 9250, 9261, 9262, 9270-9275, 9280-9282, 9290, 9300-9302, 9310-9312, 9320-9322, 9330, 9340-9342, 9370-9372
C000-C809
continued
(continued)

United States Cancer Statistics: 2004 Incidence and Mortality
C-8
Table C.2: SEER Site Groups based on the International Classification of Childhood Cancer, Third Edition (ICCC-3) based on ICD–O–31
Site Group Histologic Type Primary Site (e)Unspecifiedmalignant bone tumors 8000-8005, 8800, 8801, 8803-8805 C400-C419
IX. Soft Tissue and Other Extraosseous Sarcomas
(a)Rhabdomyosarcomas 8900-8905, 8910, 8912, 8920, 8991 C000-C809
(b) Fibrosarcomas, peripheral nerve sheath tumors, and other fibrousneoplasms
8810, 8811, 8813-8815, 8821, 8823, 8834-8835
C000-C399, C440-C768, C809
8820, 8822, 8824-8827, 9150, 9160, 9491, 9540-9571, 9580 C000-C809
(c) Kaposi sarcoma 9140 C000-C809
(d)Otherspecifiedsoft tissue sarcomas
8587, 8710-8713, 8806, 8831-8833, 8836, 8840-8842, 8850-8858, 8860-8862, 8870, 8880, 8881, 8890-8898, 8921, 8982, 8990, 9040-9044, 9120-9125, 9130-9133, 9135, 9136, 9141, 9142, 9161, 9170-9175, 9231, 9251, 9252, 9373, 9581
C000-C809
8830 C000-C399, C440-C768, C809
8963 C000-C639, C659-C699, C739-C768, C809
9180, 9210, 9220, 9240 C490-C4999260 C000-C399, C470-C759
9364C000-C399, C470-C639, C659-C699, C739-C768, C809
9365 C000-C399, C470-C639, C659-C768, C809
(e)Unspecifiedsoft tissue sarcomas 8800-8805 C000-C399, C440-C768,
C809X. Germ Cell Tumors, Trophoblastic Tumors, and Neoplasms of Gonads
(a) Intracranial and intraspinal germ cell tumors
9060-9065, 9070-9072, 9080-9085, 9100, 9101 C700-C729, C751-C753
(b) Malignant extracranial and extragonadal germ cell tumors
9060-9065, 9070-9072, 9080-9085, 9100-9105
C000-C559, C570-C619, C630-C699, C739-C750, C754-C768, C809
(c) Malignant gonadal germ cell tumors
9060-9065, 9070-9073, 9080-9085, 9090, 9091, 9100, 9101 C569, C620-C629
(d) Gonadal carcinomas
8010-8041, 8050-8075, 8082, 8120-8122, 8130-8141, 8143, 8190-8201, 8210, 8211, 8221-8241, 8244-8246, 8260-8263, 8290, 8310, 8313, 8320, 8323, 8380-8384, 8430, 8440, 8480-8490, 8504, 8510, 8550, 8560-8573, 9000, 9014, 9015
C569, C620-C629
8441-8444, 8450, 8451, 8460-8473 C000-C809continued
(continued)

Appendix C
C-9
Table C.2: SEER Site Groups based on the International Classification of Childhood Cancer, Third Edition (ICCC-3) based on ICD–O–31
Site Group Histologic Type Primary Site (e)Otherandunspecified malignant gonadal tumors
8590-8671 C000-C8098000-8005 C569, C620-C629
XI. Other Malignant Epithelial Neoplasms and Malignant Melanomas
(a) Adrenocortical carcinomas 8370-8375 C000-C809
(b) Thyroid carcinomas
8010-8041, 8050-8075, 8082, 8120-8122, 8130-8141, 8190, 8200, 8201, 8211, 8230, 8231, 8244-8246, 8260-8263, 8290, 8310, 8320, 8323, 8430, 8440, 8480, 8481, 8510, 8560-8573
C739
8330-8337, 8340-8347, 8350 C000-C809
(c) Nasopharyngeal carcinomas
8010-8041, 8050-8075, 8082, 8083, 8120-8122, 8130-8141, 8190, 8200, 8201, 8211, 8230, 8231, 8244-8246, 8260-8263, 8290, 8310, 8320, 8323, 8430, 8440, 8480, 8481, 8500-8576
C110-C119
(d) Malignant melanomas 8720-8780, 8790 C000-C809
(e) Skin carcinomas
8010-8041, 8050-8075, 8078, 8082, 8090-8110, 8140, 8143, 8147, 8190, 8200, 8240, 8246, 8247, 8260, 8310, 8320, 8323, 8390-8420, 8430, 8480, 8542, 8560, 8570-8573, 8940, 8941
C440-C449
(f)Otherandunspecified carcinomas
8010-8084, 8120-8157, 8190-8264, 8290, 8310, 8313-8315, 8320-8325, 8360, 8380-8384, 8430-8440, 8452-8454, 8480-8586, 8588-8589, 8940, 8941, 8983, 9000, 9010-9016, 9020, 9030
C000-C109, C129-C218, C239-C399, C480-C488, C500-C559, C570-C619, C630-C639, C659-C729, C750-C768, C809
XII.OtherandUnspecifiedMalignant Neoplasms
(a)Otherspecifiedmalignant tumors
8930-8936, 8950, 8951, 8971-8981, 9050-9055, 9110 C000-C809
9363 C000-C399, C470-C759
(b)Otherunspecifiedmalignant tumors 8000-8005
C000-C218, C239-C399, C420-C559, C570-C619, C630-C639, C659-C699, C739-C750, C754-C809
NotClassifiedbyICCCorinsitu CNS = central nervous system; ICCC = International Classification of Childhood Cancer; ICD–O–3 = International Classification of Diseases for Oncology, Third Edition.
1Steliarova-FoucherE,StillerC,LacourB,KaatschP.InternationalClassificationofChildhoodCancer,ThirdEdition.Cancer 2005;103:1457–1467.
Source: http://seer.cancer.gov/iccc/iccc3.html. [Accessed October 2007].
(continued)

United States Cancer Statistics: 2004 Incidence and Mortality
C-10
Table C.3: Brain and Other Nervous System Histology Groupings*
Histology ICD–O–3 CodeTumors of Neuroepithelial Tissue Pilocytic astrocytoma 9421Diffuseastrocytoma(protoplasma,fibrillary) 9410, 9420 Anaplastic astrocytoma 9401, 9411 Unique astrocytoma variants 9383, 9384, 9424 Astrocytoma, NOS 9400 Glioblastoma 9440, 9441, 9442/3 Oligodendroglioma 9450 Anaplastic oligodendroglioma 9451, 9460 Ependymoma/anaplastic ependymoma 9391-9393 Ependymoma variants 9394 Mixed glioma 9382 Glioma malignant, NOS 9380 Choroid plexus 9390 Neuroepithelial 9381, 9423, 9430, 9444 Benign and malignant neuronal/glial, neuronal and mixed
8680-8682, 8690, 8693, 9412, 9413, 9442/1, 9490-9493, 9500, 9505, 9506, 9522, 9523
Pineal parenchymal 9360-9362 Embryonal/primitive/medulloblastoma 8963, 9363, 9364, 9470-9474, 9501-9503, 9508Tumors of Cranial and Spinal Nerves Nerve sheath, benign and malignant 9540, 9541, 9550, 9560, 9561, 9570, 9571 Other tumors of cranial and spinal nerves 9562Tumors of Meninges Meningioma 9530-9534, 9537-9539 Other mesenchymal, benign and malignant 8324, 8728, 8800-8806, 8810, 8815, 8824, 8830,
8831, 8850, 8851, 8857, 8861, 8890, 8897, 8900, 8910, 8920, 8990, 9040, 9150, 9180, 9210, 9241, 9260, 9480
Hemangioblastoma 9161, 9535Lymphomas and Hemopoietic Neoplasms Lymphoma 9590, 9591, 9596, 9650-9655, 9659, 9661-9665,
9667, 9670, 9671, 9673, 9675, 9680, 9684, 9687, 9690, 9691, 9695, 9698, 9699, 9701, 9702, 9705, 9714, 9719, 9727, 9729, 9731, 9734, 9740, 9741, 9750, 9755-9758, 9827, 9861, 9930
Germ Cell Tumors and Cysts Germ cell tumors, cysts, and heterotopias 8020, 9060, 9061, 9064, 9065, 9070-9072, 9080-
9085, 9100Tumors of the Sellar Region Pituitary 8022, 8040, 8140, 8146, 8246, 8260, 8270-8272,
8280, 8281, 8290, 8300, 8310, 8323, 8333, 8334, 9582
Craniopharyngioma 9350-9352 Local Extensions from Regional Tumors Chordoma/chondrosarcoma 9220, 9231, 9240, 9370-9373
continued

Appendix C
C-11
Table C.3: Brain and Other Nervous System Histology Groupings*
Histology ICD–O–3 CodeUnclassifiedTumors Hemangioma 9120-9123, 9125, 9130, 9131, 9133, 9140Neoplasm,unspecified 8000-8005, 8010, 8013, 8021 All other All remaining histologies not listed above
ICD–O–3 = International Classification of Diseases for Oncology, Third Edition; NOS = not otherwise specified.*ModifiedfromCBTRUS(2005).Statistical Report: Primary Brain Tumors in the United States,1998–2002. Published by the Central Brain Tumor Registry of the United States.
(continued)

United States Cancer Statistics: 2004 Incidence and Mortality
C-12
Table C.4: SEER Cause of Death Recodes for Cancer Causes of Death, International Classification of Diseases, Tenth Revision (ICD–10)Cancer Causes of Death ICD–10 CodesAll Malignant Cancers C00-C97Oral Cavity and Pharynx Lip C00 Tongue C01-C02 Salivary gland C07-C08 Floor of mouth C04 Gum and other mouth C03, C05-C06 Nasopharynx C11 Tonsil C09 Oropharynx C10 Hypopharynx C12-C13 Other oral cavity and pharynx C14Digestive System Esophagus C15 Stomach C16 Small intestine C17 Colon and rectum Colon excluding rectum C18, C26.0 Rectum and rectosigmoid junction C19-C20 Anus, anal canal, and anorectum C21 Liver and intrahepatic bile duct Liver C22.0, C22.2-C22.4, C22.7, C22.9 Intrahepatic bile duct C22.1 Gallbladder C23 Other biliary C24 Pancreas C25 Retroperitoneum C48.0 Peritoneum, omentum, and mesentery C45.1*, C48.1-C48.2 Other digestive organs C26.8-C26.9, C48.8Respiratory System Nose, nasal cavity, and middle ear C30-C31 Larynx C32 Lung and bronchus C34 Pleura C38.4, C45.0*
Trachea, mediastinum, and other respiratory organs C33, C38.1-C38.3, C38.8, C39Bones and Joints C40-C41Soft Tissue Including Heart C47, C49, C38.0, C45.2*
Skin Excluding Basal and Squamous Melanoma of the skin C43 Other non-epithelial skin C44, C46*
Breast C50Female Genital System Cervix uteri C53
continued

Appendix C
C-13
Table C.4: SEER Cause of Death Recodes for Cancer Causes of Death, International Classification of Diseases, Tenth Revision (ICD–10)Cancer Causes of Death ICD–10 Codes Corpus and uterus, NOS Corpus uteri C54 Uterus, NOS C55 Ovary C56 Vagina C52 Vulva C51 Other female genital organs C57-C58Male Genital System Prostate C61 Testis C62 Penis C60 Other male genital organs C63Urinary System Urinary bladder C67 Kidney and renal pelvis C64-C65 Ureter C66 Other urinary organs C68Eye and Orbit C69Brain and Other Nervous System C70, C71, C72Endocrine System Thyroid C73 Other endocrine including thymus C37, C74-C75Lymphoma Hodgkin lymphoma C81 Non-Hodgkin lymphoma C82-C85, C96.3Myeloma C90.0, C90.2Leukemia Lymphocytic leukemia Acute lymphocytic leukemia C91.0 Chronic lymphocytic leukemia C91.1 Other lymphocytic leukemia C91.2-C91.4, C91.7, C91.9 Myeloid and monocytic leukemia Acute myeloid leukemia C92.0, C92.4-C92.5, C94.0, C94.2 Acute monocytic leukemia C93.0 Chronic myeloid leukemia C92.1
Other myeloid/monocytic leukemiaC92.2-C92.3, C92.7, C92.9, C93.1-C93.2, C93.7, C93.9
Other leukemia Other acute leukemia C94.4, C94.5, C95.0
Aleukemic, subleukemic, and NOSC90.1, C91.5, C94.1, C94.3, C94.7, C95.1, C95.2, C95.7, C95.9
Mesothelioma C45*
continued
(continued)

United States Cancer Statistics: 2004 Incidence and Mortality
C-14
Table C.4: SEER Cause of Death Recodes for Cancer Causes of Death, International Classification of Diseases, Tenth Revision (ICD–10)Cancer Causes of Death ICD–10 CodesKaposi sarcoma C46*
Miscellaneous Malignant Cancer C26.1, C45.7*, C45.9*, C76-C80, C88, C96.0-C96.2, C96.7, C96.9, C97
NOS=nototherwisespecified;SEER=Surveillance,Epidemiology,andEndResults.
*Mesothelioma (C45) and Kaposi sarcoma (C46) can be listed as separate recodes or within site-groupings. The table contains both possibilities.
Source: http://seer.cancer.gov/codrecode/1969+_d09172004/index.html. [Accessed October 2007].
(continued)


Tables D.�.�M–D.�.�F
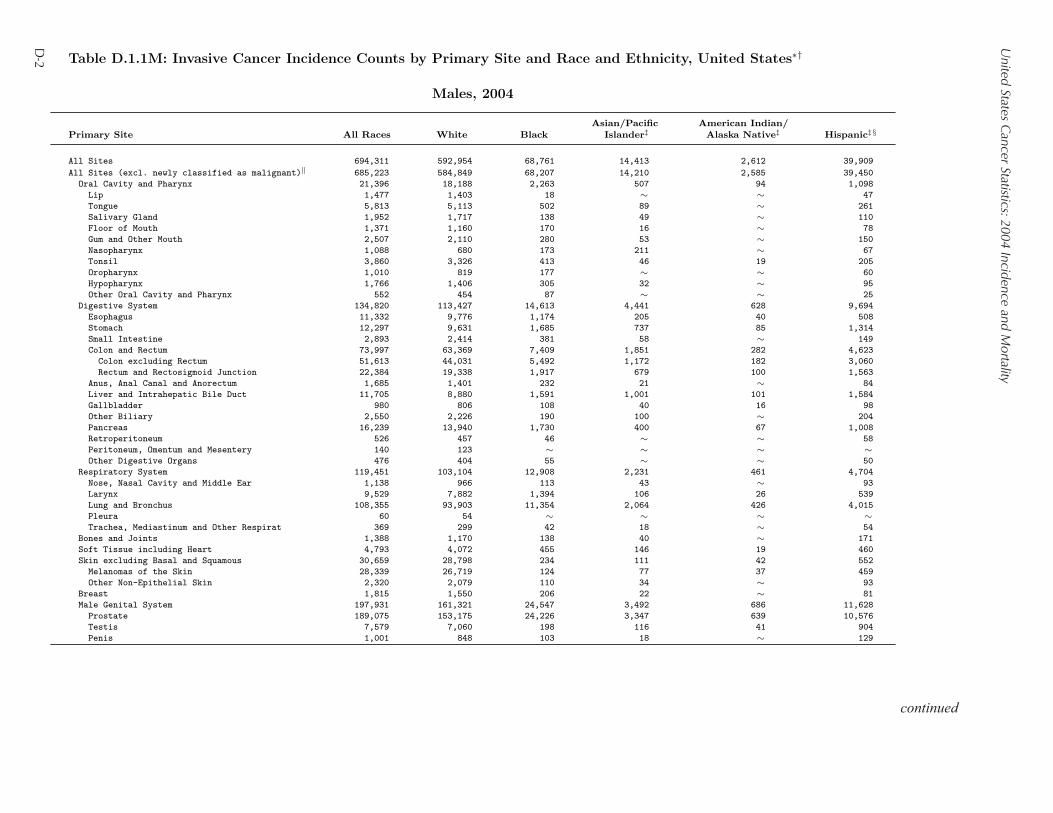
United
States Cancer Statistics: 2004 Incid
ence and M
ortality
D-�
continued
Table D.1.1M: Invasive Cancer Incidence Counts by Primary Site and Race and Ethnicity, United States∗†
Males, 2004
Asian/Pacific American Indian/Primary Site All Races White Black Islander‡ Alaska Native‡ Hispanic‡§
All Sites 694,311 592,954 68,761 14,413 2,612 39,909
All Sites (excl. newly classified as malignant)� 685,223 584,849 68,207 14,210 2,585 39,450
Oral Cavity and Pharynx 21,396 18,188 2,263 507 94 1,098
Lip 1,477 1,403 18 ∼ ∼ 47
Tongue 5,813 5,113 502 89 ∼ 261
Salivary Gland 1,952 1,717 138 49 ∼ 110
Floor of Mouth 1,371 1,160 170 16 ∼ 78
Gum and Other Mouth 2,507 2,110 280 53 ∼ 150
Nasopharynx 1,088 680 173 211 ∼ 67
Tonsil 3,860 3,326 413 46 19 205
Oropharynx 1,010 819 177 ∼ ∼ 60
Hypopharynx 1,766 1,406 305 32 ∼ 95
Other Oral Cavity and Pharynx 552 454 87 ∼ ∼ 25
Digestive System 134,820 113,427 14,613 4,441 628 9,694
Esophagus 11,332 9,776 1,174 205 40 508
Stomach 12,297 9,631 1,685 737 85 1,314
Small Intestine 2,893 2,414 381 58 ∼ 149
Colon and Rectum 73,997 63,369 7,409 1,851 282 4,623
Colon excluding Rectum 51,613 44,031 5,492 1,172 182 3,060
Rectum and Rectosigmoid Junction 22,384 19,338 1,917 679 100 1,563
Anus, Anal Canal and Anorectum 1,685 1,401 232 21 ∼ 84
Liver and Intrahepatic Bile Duct 11,705 8,880 1,591 1,001 101 1,584
Gallbladder 980 806 108 40 16 98
Other Biliary 2,550 2,226 190 100 ∼ 204
Pancreas 16,239 13,940 1,730 400 67 1,008
Retroperitoneum 526 457 46 ∼ ∼ 58
Peritoneum, Omentum and Mesentery 140 123 ∼ ∼ ∼ ∼Other Digestive Organs 476 404 55 ∼ ∼ 50
Respiratory System 119,451 103,104 12,908 2,231 461 4,704
Nose, Nasal Cavity and Middle Ear 1,138 966 113 43 ∼ 93
Larynx 9,529 7,882 1,394 106 26 539
Lung and Bronchus 108,355 93,903 11,354 2,064 426 4,015
Pleura 60 54 ∼ ∼ ∼ ∼Trachea, Mediastinum and Other Respirat 369 299 42 18 ∼ 54
Bones and Joints 1,388 1,170 138 40 ∼ 171
Soft Tissue including Heart 4,793 4,072 455 146 19 460
Skin excluding Basal and Squamous 30,659 28,798 234 111 42 552
Melanomas of the Skin 28,339 26,719 124 77 37 459
Other Non-Epithelial Skin 2,320 2,079 110 34 ∼ 93
Breast 1,815 1,550 206 22 ∼ 81
Male Genital System 197,931 161,321 24,547 3,492 686 11,628
Prostate 189,075 153,175 24,226 3,347 639 10,576
Testis 7,579 7,060 198 116 41 904
Penis 1,001 848 103 18 ∼ 129

Appendix D
D-3
Table D.1.1M: Invasive Cancer Incidence Counts by Primary Site and Race and Ethnicity, United States∗†(continued)
Males, 2004
Asian/Pacific American Indian/Primary Site All Races White Black Islander‡ Alaska Native‡ Hispanic‡§
Other Male Genital Organs 276 238 20 ∼ ∼ 19
Urinary System 73,073 66,270 4,362 1,028 251 3,554
Urinary Bladder¶ 46,146 42,781 1,849 583 83 1,642
Kidney and Renal Pelvis 25,450 22,144 2,445 405 166 1,855
Ureter 1,014 949 29 28 ∼ 32
Other Urinary Organs 463 396 39 ∼ ∼ 25
Eye and Orbit 1,261 1,153 42 18 ∼ 95
Brain and Other Nervous System 10,542 9,522 652 204 39 870
Brain 9,930 9,013 585 186 36 807
Cranial Nerves and Other Nervous System 612 509 67 18 ∼ 63
Endocrine System 7,479 6,595 444 289 22 589
Thyroid 6,401 5,708 316 243 22 475
Other Endocrine including Thymus 1,078 887 128 46 ∼ 114
Lymphomas 33,603 29,496 2,613 748 106 2,607
Hodgkin Lymphoma 4,276 3,630 471 85 18 442
Non-Hodgkin Lymphoma 29,327 25,866 2,142 663 88 2,165
Myeloma 8,628 6,868 1,422 159 40 593
Leukemias 19,496 17,014 1,411 438 97 1,478
Acute Lymphocytic 2,411 2,053 196 87 24 541
Chronic Lymphocytic 6,398 5,641 386 52 16 168
Acute Myeloid 5,595 4,925 415 171 29 417
Chronic Myeloid 2,328 1,982 196 68 ∼ 183
Other Leukemias 2,764 2,413 218 60 20 169
Mesothelioma 2,389 2,240 107 25 ∼ 118
Kaposi Sarcoma 1,103 757 260 19 ∼ 248
Miscellaneous 24,484 21,409 2,084 495 101 1,369
∗ Data are from all state and metropolitan area cancer registries, except Maryland. Included data cover approximately 98% of the population and met data quality
criteria for all invasive cancer sites combined. See Appendix B for registry-specific data quality information.† Excludes basal and squamous cell carcinomas of the skin except when these occur on the skin of the genital organs, and in situ cancers except urinary bladder.‡ Data for specified racial or ethnic populations other than white and black should be interpreted with caution. See Technical Notes.
§ Hispanic origin is not mutually exclusive from race categories (white, black, Asian/Pacific Islander, American Indian/Alaska Native).
� Excludes some endometrial cancers; papillary ependymomas and papillary meningiomas; chronic myeloproliferative diseases; and myelodysplastic syndromes. These
cancers are newly classified and reported as malignant cancers according to ICD-O-3, beginning with 2001 diagnoses. See Technical Notes.
¶ Includes invasive and in situ.
∼ Counts are suppressed if fewer than 16 cases were reported in a specific category (site, race, ethnicity).
Notes: Incidence counts cover approximately 98% of the U.S. population; death counts cover 100% of the U.S. population. Use caution when comparing incidence
and death counts.

United
States Cancer Statistics: 2004 Incid
ence and M
ortality
D-�
continued
Table D.1.1F: Invasive Cancer Incidence Counts by Primary Site and Race and Ethnicity, United States∗†
Females, 2004
Asian/Pacific American Indian/Primary Site All Races White Black Islander‡ Alaska Native‡ Hispanic‡§
All Sites 647,815 557,239 61,779 16,112 2,761 40,269
All Sites (excl. newly classified as malignant)� 639,976 550,389 61,214 15,919 2,732 39,801
Oral Cavity and Pharynx 9,424 8,016 886 303 42 461
Lip 489 459 ∼ ∼ ∼ 16
Tongue 2,482 2,165 174 81 ∼ 135
Salivary Gland 1,493 1,258 154 45 ∼ 111
Floor of Mouth 608 528 57 ∼ ∼ 22
Gum and Other Mouth 1,958 1,666 188 47 ∼ 74
Nasopharynx 490 321 66 91 ∼ 31
Tonsil 935 804 104 ∼ ∼ 49
Oropharynx 315 264 42 ∼ ∼ ∼Hypopharynx 465 393 64 ∼ ∼ ∼Other Oral Cavity and Pharynx 189 158 28 ∼ ∼ ∼
Digestive System 116,002 96,957 13,644 3,504 560 7,696
Esophagus 3,343 2,730 492 66 ∼ 154
Stomach 7,854 5,957 1,222 513 48 986
Small Intestine 2,586 2,115 382 44 ∼ 160
Colon and Rectum 71,086 60,090 7,992 1,794 311 3,883
Colon excluding Rectum 54,081 45,685 6,288 1,266 220 2,819
Rectum and Rectosigmoid Junction 17,005 14,405 1,704 528 91 1,064
Anus, Anal Canal and Anorectum 2,760 2,439 258 21 ∼ 187
Liver and Intrahepatic Bile Duct 4,875 3,749 609 414 55 662
Gallbladder 2,241 1,835 295 74 19 286
Other Biliary 2,179 1,864 179 107 ∼ 179
Pancreas 16,331 13,758 1,988 405 77 1,014
Retroperitoneum 538 437 70 21 ∼ 69
Peritoneum, Omentum and Mesentery 1,669 1,536 90 26 ∼ 77
Other Digestive Organs 540 447 67 19 ∼ 39
Respiratory System 91,400 80,653 8,341 1,520 384 3,079
Nose, Nasal Cavity and Middle Ear 805 698 69 21 ∼ 54
Larynx 2,466 2,079 332 24 ∼ 103
Lung and Bronchus 87,897 77,680 7,913 1,470 369 2,903
Pleura 39 33 ∼ ∼ ∼ ∼Trachea, Mediastinum and Other Respirat 193 163 21 ∼ ∼ 19
Bones and Joints 1,216 1,011 143 32 ∼ 190
Soft Tissue including Heart 4,124 3,341 568 125 19 387
Skin excluding Basal and Squamous 23,527 21,689 314 123 43 699
Melanomas of the Skin 21,700 20,159 159 86 36 592
Other Non-Epithelial Skin 1,827 1,530 155 37 ∼ 107
Breast 186,772 159,840 18,441 5,104 717 11,296
Female Genital System 74,788 63,830 7,197 2,149 339 6,080
Cervix 11,892 9,207 1,866 479 88 1,839
Corpus 35,790 30,981 3,039 987 142 2,323
Uterus, NOS 1,191 918 225 20 ∼ 82

Appendix D
D-�
Table D.1.1F: Invasive Cancer Incidence Counts by Primary Site and Race and Ethnicity, United States∗†(continued)
Females, 2004
Asian/Pacific American Indian/Primary Site All Races White Black Islander‡ Alaska Native‡ Hispanic‡§
Ovary¶ 20,095 17,719 1,517 553 81 1,488
Vagina 1,130 897 173 28 ∼ 90
Vulva 3,631 3,210 270 46 ∼ 180
Other Female Genital Organs 1,059 898 107 36 ∼ 78
Urinary System 32,911 29,171 2,714 436 156 1,895
Urinary Bladder∗∗ 15,946 14,428 1,032 176 34 614
Kidney and Renal Pelvis 16,074 13,974 1,597 237 119 1,250
Ureter 637 590 25 ∼ ∼ 22
Other Urinary Organs 254 179 60 ∼ ∼ ∼Eye and Orbit 1,073 993 41 ∼ ∼ 82
Brain and Other Nervous System 8,720 7,743 647 216 28 722
Brain 8,000 7,143 569 188 25 667
Cranial Nerves and Other Nervous System 720 600 78 28 ∼ 55
Endocrine System 21,540 18,393 1,596 971 118 2,325
Thyroid 20,574 17,630 1,445 937 116 2,226
Other Endocrine including Thymus 966 763 151 34 ∼ 99
Lymphomas 29,784 26,122 2,301 658 107 2,087
Hodgkin Lymphoma 3,669 3,116 404 74 ∼ 355
Non-Hodgkin Lymphoma 26,115 23,006 1,897 584 93 1,732
Myeloma 7,131 5,436 1,396 132 47 551
Leukemias 14,668 12,678 1,236 303 61 1,183
Acute Lymphocytic 1,805 1,527 147 77 20 397
Chronic Lymphocytic 4,517 3,983 265 25 ∼ 168
Acute Myeloid 4,699 4,036 477 123 ∼ 368
Chronic Myeloid 1,695 1,433 170 39 ∼ 143
Other Leukemias 1,952 1,699 177 39 ∼ 107
Mesothelioma 646 592 35 ∼ ∼ 45
Kaposi Sarcoma 142 97 34 ∼ ∼ 24
Miscellaneous 23,947 20,677 2,245 508 123 1,467
Breast, in situ †† 44,905 38,005 4,303 1,472 154 2,484
∗ Data are from all state and metropolitan area cancer registries, except Maryland. Included data cover approximately 98% of the population and met data quality
criteria for all invasive cancer sites combined. See Appendix B for registry-specific data quality information.† Excludes basal and squamous cell carcinomas of the skin except when these occur on the skin of the genital organs, and in situ cancers except urinary bladder.‡ Data for specified racial or ethnic populations other than white and black should be interpreted with caution. See Technical Notes.
§ Hispanic origin is not mutually exclusive from race categories (white, black, Asian/Pacific Islander, American Indian/Alaska Native).
� Excludes some endometrial cancers; papillary ependymomas and papillary meningiomas; chronic myeloproliferative diseases; and myelodysplastic syndromes. These
cancers are newly classified and reported as malignant cancers according to ICD-O-3, beginning with 2001 diagnoses. See Technical Notes.
¶ Ovary excludes cancers newly classified as borderline according to ICD-O-3, beginning with 2001 diagnoses. See Technical Notes.∗∗ Includes invasive and in situ.†† Case counts for in situ female breast cancer are listed separately and are not included in the "all sites" category.
∼ Counts are suppressed if fewer than 16 cases were reported in a specific category (site, race, ethnicity).
Notes: Incidence counts cover approximately 98% of the U.S. population; death counts cover 100% of the U.S. population. Use caution when comparing incidence
and death counts.

United
States Cancer Statistics: 2004 Incid
ence and M
ortality
D-�
continued
Table D.1.2M: Cancer Death Counts by Primary Site and Race and Ethnicity, United States∗
Males, 2004
Asian/Pacific American Indian/Primary Site All Races White Black Islander† Alaska Native† Hispanic†‡
All Sites 286,824 247,446 32,441 5,696 1,241 12,999
Oral Cavity and Pharynx 5,312 4,270 874 137 31 241
Lip 49 46 ∼ ∼ ∼ ∼Tongue 1,228 1,049 152 21 ∼ 58
Salivary Gland 463 414 36 ∼ ∼ 18
Floor of Mouth 93 75 16 ∼ ∼ ∼Gum and Other Mouth 621 511 98 ∼ ∼ 26
Nasopharynx 432 288 80 61 ∼ 28
Tonsil 458 371 77 ∼ ∼ 22
Oropharynx 464 376 81 ∼ ∼ 18
Hypopharynx 298 229 62 ∼ ∼ ∼Other Oral Cavity and Pharynx 1,206 911 270 ∼ ∼ 55
Digestive System 72,127 60,695 8,795 2,249 388 4,446
Esophagus 10,081 8,831 1,060 145 45 346
Stomach 6,958 5,332 1,191 389 46 771
Small Intestine 592 487 85 16 ∼ 17
Colon and Rectum 26,881 23,004 3,194 553 130 1,333
Colon excluding Rectum 22,074 18,825 2,698 445 106 1,101
Rectum and Rectosigmoid Junction 4,807 4,179 496 108 24 232
Anus, Anal Canal and Anorectum 240 202 32 ∼ ∼ ∼Liver and Intrahepatic Bile Duct 9,832 7,694 1,349 712 77 1,046
Gallbladder 595 490 64 32 ∼ 52
Other Biliary 690 627 32 27 ∼ 49
Pancreas 15,776 13,610 1,737 358 71 789
Retroperitoneum 112 99 ∼ ∼ ∼ ∼Peritoneum, Omentum and Mesentery 68 60 ∼ ∼ ∼ ∼Other Digestive Organs 302 259 33 ∼ ∼ 20
Respiratory System 92,942 80,421 10,568 1,567 386 2,903
Nose, Nasal Cavity and Middle Ear 260 219 31 ∼ ∼ ∼Larynx 2,935 2,370 530 25 ∼ 178
Lung and Bronchus 89,575 77,685 9,987 1,531 372 2,700
Pleura 54 51 ∼ ∼ ∼ ∼Trachea, Mediastinum and Other Respirat 118 96 17 ∼ ∼ ∼
Bones and Joints 715 602 93 ∼ ∼ 60
Soft Tissue including Heart 1,884 1,649 184 45 ∼ 109
Skin excluding Basal and Squamous 6,770 6,578 160 19 ∼ 117
Melanomas of the Skin 5,125 5,053 57 ∼ ∼ 79
Other Non-Epithelial Skin 1,645 1,525 103 ∼ ∼ 38
Breast 362 301 56 ∼ ∼ 17
Male Genital System 29,627 24,283 4,867 375 102 1,319
Prostate 29,002 23,726 4,815 362 99 1,238
Testis 357 321 25 ∼ ∼ 44
Penis 231 207 21 ∼ ∼ 37
Other Male Genital Organs 37 29 ∼ ∼ ∼ ∼

Appendix D
D-�
Table D.1.2M: Cancer Death Counts by Primary Site and Race and Ethnicity, United States∗(continued)
Males, 2004
Asian/Pacific American Indian/Primary Site All Races White Black Islander† Alaska Native† Hispanic†‡
Urinary System 16,955 15,546 1,150 185 74 767
Urinary Bladder 8,995 8,407 478 95 ∼ 253
Kidney and Renal Pelvis 7,640 6,839 655 87 59 507
Ureter 177 170 ∼ ∼ ∼ ∼Other Urinary Organs 143 130 ∼ ∼ ∼ ∼
Eye and Orbit 112 109 ∼ ∼ ∼ ∼Brain and Other Nervous System 7,074 6,508 409 132 25 365
Endocrine System 1,027 896 84 41 ∼ 74
Thyroid 593 529 41 21 ∼ 45
Other Endocrine including Thymus 434 367 43 20 ∼ 29
Lymphoma 11,786 10,692 810 242 42 662
Hodgkin Lymphoma 730 647 71 ∼ ∼ 57
Non-Hodgkin Lymphoma 11,056 10,045 739 233 39 605
Myeloma 5,472 4,521 843 80 28 277
Leukemias 12,051 10,788 989 232 42 672
Acute Lymphocytic 765 663 69 26 ∼ 151
Chronic Lymphocytic 2,549 2,298 230 16 ∼ 46
Acute Myeloid 4,513 4,062 331 107 ∼ 230
Chronic Myeloid 643 552 69 18 ∼ 48
Other Leukemias 3,581 3,213 290 65 ∼ 197
Mesothelioma 2,010 1,921 73 ∼ ∼ 62
Miscellaneous 20,561 17,638 2,475 359 89 891
∗ Data are from the National Vital Statistics System (NVSS).† Data for specified racial or ethnic populations other than white and black should be interpreted with caution. See Technical Notes.‡ Hispanic origin is not mutually exclusive from race categories (white, black, Asian/Pacific Islander, American Indian/Alaska Native).
∼ Counts are suppressed if fewer than 16 cases were reported in a specific category (site, race, ethnicity).
Notes: Incidence counts cover approximately 98% of the U.S. population; death counts cover 100% of the U.S. population. Use caution when comparing
incidence and death counts.

United
States Cancer Statistics: 2004 Incid
ence and M
ortality
D-�
continued
Table D.1.2F: Cancer Death Counts by Primary Site and Race and Ethnicity, United States∗
Females, 2004
Asian/Pacific American Indian/Primary Site All Races White Black Islander† Alaska Native† Hispanic†‡
All Sites 267,056 230,682 30,056 5,167 1,151 11,520
Oral Cavity and Pharynx 2,514 2,173 275 58 ∼ 91
Lip 25 23 ∼ ∼ ∼ ∼Tongue 653 584 52 ∼ ∼ 25
Salivary Gland 234 214 18 ∼ ∼ ∼Floor of Mouth 29 25 ∼ ∼ ∼ ∼Gum and Other Mouth 547 498 39 ∼ ∼ ∼Nasopharynx 205 149 34 21 ∼ ∼Tonsil 134 116 ∼ ∼ ∼ ∼Oropharynx 194 153 38 ∼ ∼ ∼Hypopharynx 70 61 ∼ ∼ ∼ ∼Other Oral Cavity and Pharynx 423 350 70 ∼ ∼ ∼
Digestive System 60,088 50,343 7,765 1,678 302 3,324
Esophagus 2,942 2,420 467 42 ∼ 94
Stomach 4,901 3,735 843 291 32 584
Small Intestine 523 421 90 ∼ ∼ 23
Colon and Rectum 26,699 22,658 3,426 518 97 1,108
Colon excluding Rectum 22,914 19,391 3,011 429 83 956
Rectum and Rectosigmoid Junction 3,785 3,267 415 89 ∼ 152
Anus, Anal Canal and Anorectum 349 310 29 ∼ ∼ ∼Liver and Intrahepatic Bile Duct 5,489 4,417 665 341 66 519
Gallbladder 1,341 1,109 162 57 ∼ 121
Other Biliary 771 691 56 18 ∼ 47
Pancreas 15,995 13,618 1,937 372 68 781
Retroperitoneum 107 88 18 ∼ ∼ ∼Peritoneum, Omentum and Mesentery 618 575 31 ∼ ∼ ∼Other Digestive Organs 353 301 41 ∼ ∼ ∼
Respiratory System 69,458 61,541 6,609 999 309 1,542
Nose, Nasal Cavity and Middle Ear 198 175 ∼ ∼ ∼ ∼Larynx 733 615 108 ∼ ∼ ∼Lung and Bronchus 68,431 60,667 6,475 985 304 1,510
Pleura 24 21 ∼ ∼ ∼ ∼Trachea, Mediastinum and Other Respirat 72 63 ∼ ∼ ∼ ∼
Bones and Joints 586 496 77 ∼ ∼ 57
Soft Tissue including Heart 1,838 1,535 252 42 ∼ 111
Skin excluding Basal and Squamous 3,531 3,411 95 20 ∼ 83
Melanomas of the Skin 2,827 2,748 62 ∼ ∼ 59
Other Non-Epithelial Skin 704 663 33 ∼ ∼ 24
Breast 40,954 34,458 5,541 786 169 1,909
Female Genital System 27,049 23,065 3,301 567 116 1,511
Cervix 3,850 2,899 789 131 31 430
Corpus 3,272 2,733 461 69 ∼ 135
Uterus, NOS 3,718 2,980 653 73 ∼ 190
Ovary 14,716 13,127 1,256 276 57 689

Appendix D
D-�
Table D.1.2F: Cancer Death Counts by Primary Site and Race and Ethnicity, United States∗(continued)
Females, 2004
Asian/Pacific American Indian/Primary Site All Races White Black Islander† Alaska Native† Hispanic†‡
Vagina 416 358 51 ∼ ∼ 20
Vulva 806 732 61 ∼ ∼ 34
Other Female Genital Organs 271 236 30 ∼ ∼ ∼Urinary System 8,973 7,924 902 110 37 411
Urinary Bladder 4,035 3,550 435 45 ∼ 144
Kidney and Renal Pelvis 4,673 4,149 436 56 32 256
Ureter 157 143 ∼ ∼ ∼ ∼Other Urinary Organs 108 82 22 ∼ ∼ ∼
Eye and Orbit 96 95 ∼ ∼ ∼ ∼Brain and Other Nervous System 5,755 5,285 356 105 ∼ 306
Endocrine System 1,245 1,059 140 39 ∼ 96
Thyroid 816 701 77 33 ∼ 67
Other Endocrine including Thymus 429 358 63 ∼ ∼ 29
Lymphoma 10,428 9,462 739 198 29 495
Hodgkin Lymphoma 546 471 64 ∼ ∼ 38
Non-Hodgkin Lymphoma 9,882 8,991 675 188 28 457
Myeloma 5,106 4,062 952 68 24 268
Leukemias 9,421 8,352 885 150 34 481
Acute Lymphocytic 606 530 47 26 ∼ 111
Chronic Lymphocytic 1,793 1,632 146 ∼ ∼ 34
Acute Myeloid 3,701 3,289 330 69 ∼ 175
Chronic Myeloid 521 454 59 ∼ ∼ 40
Other Leukemias 2,800 2,447 303 43 ∼ 121
Mesothelioma 494 471 16 ∼ ∼ 16
Miscellaneous 19,509 16,940 2,149 333 87 817
∗ Data are from the National Vital Statistics System (NVSS).† Data for specified racial or ethnic populations other than white and black should be interpreted with caution. See Technical Notes.‡ Hispanic origin is not mutually exclusive from race categories (white, black, Asian/Pacific Islander, American Indian/Alaska Native).
∼ Counts are suppressed if fewer than 16 cases were reported in a specific category (site, race, ethnicity).
Notes: Incidence counts cover approximately 98% of the U.S. population; death counts cover 100% of the U.S. population. Use caution when comparing
incidence and death counts.

United
States Cancer Statistics: 2004 Incid
ence and M
ortality
D-�0
continued
Table D.2.1M: Invasive Cancer Incidence Counts for Ages 0-19 by International Classification of Childhood Cancer(ICCC∗) Group and Subgroup, Race and Ethnicity, United States†
Males, 2004
Asian/Pacific American Indian/ICCC Group and Subgroup All Races White Black Islander‡ Alaska Native‡ Hispanic‡§
All ICCC Groups Combined 7,254 5,908 833 247 56 1,394
I Leukemias, myeloproliferative & myelodysplastic diseases 2,058 1,701 202 86 21 505
I(a) Lymphoid leukemias 1,492 1,263 123 51 18 379
I(b) Acute myeloid leukemias 370 291 51 21 ∼ 84
I(c) Chronic myeloproliferative diseases 83 61 ∼ ∼ ∼ ∼I(d) Myelodysplastic syndrome and other myeloproliferative
diseases 58 46 ∼ ∼ ∼ ∼I(e) Unspecified and other specified leukemias 55 40 ∼ ∼ ∼ ∼
II Lymphomas and reticuloendothelial neoplasms 1,120 885 167 33 ∼ 197
II(a) Hodgkin lymphomas 488 394 63 16 ∼ 71
II(b) Non-Hodgkin lymphomas (except Burkitt lymphoma) 427 319 82 ∼ ∼ 82
II(c) Burkitt lymphoma 142 122 ∼ ∼ ∼ 27
II(d) Miscellaneous lymphoreticular neoplasms 42 34 ∼ ∼ ∼ ∼II(e) Unspecified lymphomas 21 16 ∼ ∼ ∼ ∼
III CNS and misc intracranial and intraspinal neoplasms 1,249 1,014 156 31 ∼ 196
III(a) Ependymomas and choroid plexus tumor 115 92 17 ∼ ∼ 25
III(b) Astrocytomas 598 489 68 ∼ ∼ 78
III(c) Intracranial and intraspinal embryonal tumors 294 247 30 ∼ ∼ 58
III(d) Other gliomas 191 149 28 ∼ ∼ 29
III(e) Other specified intracranial & intraspinal
neoplasms 35 26 ∼ ∼ ∼ ∼III(f) Unspecified intracranial and intraspinal
neoplasms 16 ∼ ∼ ∼ ∼ ∼IV Neuroblastoma and other peripheral nervous cell tumors 350 288 41 ∼ ∼ 61
IV(a) Neuroblastoma and ganglioneuroblastoma 341 282 40 ∼ ∼ 59
IV(b) Other peripheral nervous cell tumors ∼ ∼ ∼ ∼ ∼ ∼V Retinoblastoma 124 93 17 ∼ ∼ 33
VI Renal tumors 249 187 49 ∼ ∼ 36
VI(a) Nephroblastoma and other nonepithelial renal
tumors 226 176 37 ∼ ∼ 35
VI(b) Renal carcinomas 22 ∼ ∼ ∼ ∼ ∼VI(c) Unspecified malignant renal tumors ∼ ∼ ∼ ∼ ∼ ∼
VII Hepatic tumors 109 86 ∼ ∼ ∼ 31
VII(a) Hepatoblastoma 79 62 ∼ ∼ ∼ 19
VII(b) Hepatic carcinomas 26 20 ∼ ∼ ∼ ∼VII(c) Unspecified malignant hepatic tumors ∼ ∼ ∼ ∼ ∼ ∼
VIII Malignant bone tumors 372 287 57 ∼ ∼ 65
VIII(a) Osteosarcomas 207 145 44 ∼ ∼ 38
VIII(b) Chondrosarcomas 27 22 ∼ ∼ ∼ ∼VIII(c) Ewing tumor and related sarcomas of bone 113 104 ∼ ∼ ∼ 21

Appendix D
D-��
Table D.2.1M: Invasive Cancer Incidence Counts for Ages 0-19 by International Classification of Childhood Cancer(ICCC∗) Group and Subgroup, Race and Ethnicity, United States† (continued)
Males, 2004
Asian/Pacific American Indian/ICCC Group and Subgroup All Races White Black Islander‡ Alaska Native‡ Hispanic‡§
VIII(d) Other specified malignant bone tumors 16 ∼ ∼ ∼ ∼ ∼VIII(e) Unspecified malignant bone tumors ∼ ∼ ∼ ∼ ∼ ∼
IX Soft tissue and other extraosseous sarcomas 497 402 61 17 ∼ 103
IX(a) Rhabdomyosarcomas 197 164 19 ∼ ∼ 39
IX(b) Fibrosarcomas, peripheral nerve sheath tumors &
other fibrous neoplams 44 29 ∼ ∼ ∼ ∼IX(c) Kaposi sarcoma ∼ ∼ ∼ ∼ ∼ ∼IX(d) Other specified soft tissue sarcomas 208 170 24 ∼ ∼ 48
IX(e) Unspecified soft tissue sarcomas 45 37 ∼ ∼ ∼ ∼X Germ cell, trophoblastic tumors & neoplasms of gonads 566 499 19 27 ∼ 108
X(a) Intracranial & intraspinal germ cell tumors 101 86 ∼ ∼ ∼ 25
X(b) Malignant extracranial & extragonadal germ cell
tumors 46 36 ∼ ∼ ∼ ∼X(c) Malignant gonadal germ cell tumors 413 371 ∼ ∼ ∼ 70
X(d) Gonadal carcinomas ∼ ∼ ∼ ∼ ∼ ∼X(e) Other and unspecified malignant gonadal tumors ∼ ∼ ∼ ∼ ∼ ∼
XI Other malignant epithelial neoplasms and malignant
melanomas 519 434 47 ∼ ∼ 53
XI(a) Adrenocortical carcinomas ∼ ∼ ∼ ∼ ∼ ∼XI(b) Thyroid carcinomas 97 88 ∼ ∼ ∼ ∼XI(c) Nasopharyngeal carcinomas 31 ∼ 16 ∼ ∼ ∼XI(d) Malignant melanomas 237 212 ∼ ∼ ∼ ∼XI(e) Skin carcinomas ∼ ∼ ∼ ∼ ∼ ∼XI(f) Other and unspecified carcinomas 147 113 23 ∼ ∼ 24
XII Other and unspecified malignant neoplasms 27 22 ∼ ∼ ∼ ∼XII(a) Other specified malignant tumors ∼ ∼ ∼ ∼ ∼ ∼XII(b) Other unspecified malignant tumors ∼ ∼ ∼ ∼ ∼ ∼
Not classified by ICCC ∼ ∼ ∼ ∼ ∼ ∼∗ 2005 International Classification of Childhood Cancer based on ICD-O-3. See Technical Notes and Appendix C.† Data are from all state and metropolitan area cancer registries, except Maryland. Included data cover approximately 98% of the population and met data quality
criteria for all invasive cancer sites combined. See Appendix B for registry-specific data quality information.‡ Data for specified racial or ethnic populations other than white and black should be interpreted with caution. See Technical Notes.
§ Hispanic origin is not mutually exclusive from race categories (white, black, Asian/Pacific Islander, American Indian/Alaska Native).
∼ Counts are suppressed if fewer than 16 cases were reported in a specific category (site, race, ethnicity).

United
States Cancer Statistics: 2004 Incid
ence and M
ortality
D-��
continued
Table D.2.1F: Invasive Cancer Incidence Counts for Ages 0-19 by International Classification of Childhood Cancer(ICCC∗) Group and Subgroup, Race and Ethnicity, United States†
Females, 2004
Asian/Pacific American Indian/ICCC Group and Subgroup All Races White Black Islander‡ Alaska Native‡ Hispanic‡§
All ICCC Groups Combined 6,167 4,962 764 213 48 1,195
I Leukemias, myeloproliferative & myelodysplastic diseases 1,482 1,211 154 69 ∼ 360
I(a) Lymphoid leukemias 1,065 891 86 48 ∼ 266
I(b) Acute myeloid leukemias 276 216 41 ∼ ∼ 63
I(c) Chronic myeloproliferative diseases 58 42 ∼ ∼ ∼ ∼I(d) Myelodysplastic syndrome and other myeloproliferative
diseases 42 27 ∼ ∼ ∼ ∼I(e) Unspecified and other specified leukemias 41 35 ∼ ∼ ∼ ∼
II Lymphomas and reticuloendothelial neoplasms 771 615 108 20 ∼ 120
II(a) Hodgkin lymphomas 446 371 53 ∼ ∼ 63
II(b) Non-Hodgkin lymphomas (except Burkitt lymphoma) 242 180 43 ∼ ∼ 40
II(c) Burkitt lymphoma 42 35 ∼ ∼ ∼ ∼II(d) Miscellaneous lymphoreticular neoplasms 29 23 ∼ ∼ ∼ ∼II(e) Unspecified lymphomas ∼ ∼ ∼ ∼ ∼ ∼
III CNS and misc intracranial and intraspinal neoplasms 1,112 894 142 41 ∼ 208
III(a) Ependymomas and choroid plexus tumor 100 71 19 ∼ ∼ 23
III(b) Astrocytomas 565 466 60 19 ∼ 94
III(c) Intracranial and intraspinal embryonal tumors 222 187 22 ∼ ∼ 41
III(d) Other gliomas 178 137 29 ∼ ∼ 44
III(e) Other specified intracranial & intraspinal
neoplasms 25 16 ∼ ∼ ∼ ∼III(f) Unspecified intracranial and intraspinal
neoplasms 22 17 ∼ ∼ ∼ ∼IV Neuroblastoma and other peripheral nervous cell tumors 313 251 39 ∼ ∼ 56
IV(a) Neuroblastoma and ganglioneuroblastoma 301 241 39 ∼ ∼ 55
IV(b) Other peripheral nervous cell tumors ∼ ∼ ∼ ∼ ∼ ∼V Retinoblastoma 125 92 24 ∼ ∼ 42
VI Renal tumors 246 191 41 ∼ ∼ 50
VI(a) Nephroblastoma and other nonepithelial renal
tumors 226 174 38 ∼ ∼ 50
VI(b) Renal carcinomas 20 17 ∼ ∼ ∼ ∼VI(c) Unspecified malignant renal tumors ∼ ∼ ∼ ∼ ∼ ∼
VII Hepatic tumors 86 68 ∼ ∼ ∼ 20
VII(a) Hepatoblastoma 65 54 ∼ ∼ ∼ ∼VII(b) Hepatic carcinomas 18 ∼ ∼ ∼ ∼ ∼VII(c) Unspecified malignant hepatic tumors ∼ ∼ ∼ ∼ ∼ ∼
VIII Malignant bone tumors 327 256 52 ∼ ∼ 67
VIII(a) Osteosarcomas 198 143 43 ∼ ∼ 48
VIII(b) Chondrosarcomas ∼ ∼ ∼ ∼ ∼ ∼VIII(c) Ewing tumor and related sarcomas of bone 93 82 ∼ ∼ ∼ ∼

Appendix D
D-�3
Table D.2.1F: Invasive Cancer Incidence Counts for Ages 0-19 by International Classification of Childhood Cancer(ICCC∗) Group and Subgroup, Race and Ethnicity, United States† (continued)
Females, 2004
Asian/Pacific American Indian/ICCC Group and Subgroup All Races White Black Islander‡ Alaska Native‡ Hispanic‡§
VIII(d) Other specified malignant bone tumors 22 20 ∼ ∼ ∼ ∼VIII(e) Unspecified malignant bone tumors ∼ ∼ ∼ ∼ ∼ ∼
IX Soft tissue and other extraosseous sarcomas 442 341 86 ∼ ∼ 73
IX(a) Rhabdomyosarcomas 141 110 27 ∼ ∼ 20
IX(b) Fibrosarcomas, peripheral nerve sheath tumors &
other fibrous neoplams 59 44 ∼ ∼ ∼ ∼IX(c) Kaposi sarcoma ∼ ∼ ∼ ∼ ∼ ∼IX(d) Other specified soft tissue sarcomas 190 146 36 ∼ ∼ 27
IX(e) Unspecified soft tissue sarcomas 51 40 ∼ ∼ ∼ ∼X Germ cell, trophoblastic tumors & neoplasms of gonads 323 243 51 20 ∼ 77
X(a) Intracranial & intraspinal germ cell tumors 41 32 ∼ ∼ ∼ ∼X(b) Malignant extracranial & extragonadal germ cell
tumors 56 40 ∼ ∼ ∼ ∼X(c) Malignant gonadal germ cell tumors 179 133 33 ∼ ∼ 53
X(d) Gonadal carcinomas 26 21 ∼ ∼ ∼ ∼X(e) Other and unspecified malignant gonadal tumors 21 17 ∼ ∼ ∼ ∼
XI Other malignant epithelial neoplasms and malignant
melanomas 893 762 54 19 ∼ 111
XI(a) Adrenocortical carcinomas ∼ ∼ ∼ ∼ ∼ ∼XI(b) Thyroid carcinomas 431 381 ∼ ∼ ∼ 72
XI(c) Nasopharyngeal carcinomas ∼ ∼ ∼ ∼ ∼ ∼XI(d) Malignant melanomas 269 243 ∼ ∼ ∼ ∼XI(e) Skin carcinomas ∼ ∼ ∼ ∼ ∼ ∼XI(f) Other and unspecified carcinomas 161 116 30 ∼ ∼ 18
XII Other and unspecified malignant neoplasms 29 21 ∼ ∼ ∼ ∼XII(a) Other specified malignant tumors ∼ ∼ ∼ ∼ ∼ ∼XII(b) Other unspecified malignant tumors ∼ ∼ ∼ ∼ ∼ ∼
Not classified by ICCC 18 17 ∼ ∼ ∼ ∼∗ 2005 International Classification of Childhood Cancer based on ICD-O-3. See Technical Notes and Appendix C.† Data are from all state and metropolitan area cancer registries, except Maryland. Included data cover approximately 98% of the population and met data quality
criteria for all invasive cancer sites combined. See Appendix B for registry-specific data quality information.‡ Data for specified racial or ethnic populations other than white and black should be interpreted with caution. See Technical Notes.
§ Hispanic origin is not mutually exclusive from race categories (white, black, Asian/Pacific Islander, American Indian/Alaska Native).
∼ Counts are suppressed if fewer than 16 cases were reported in a specific category (site, race, ethnicity).
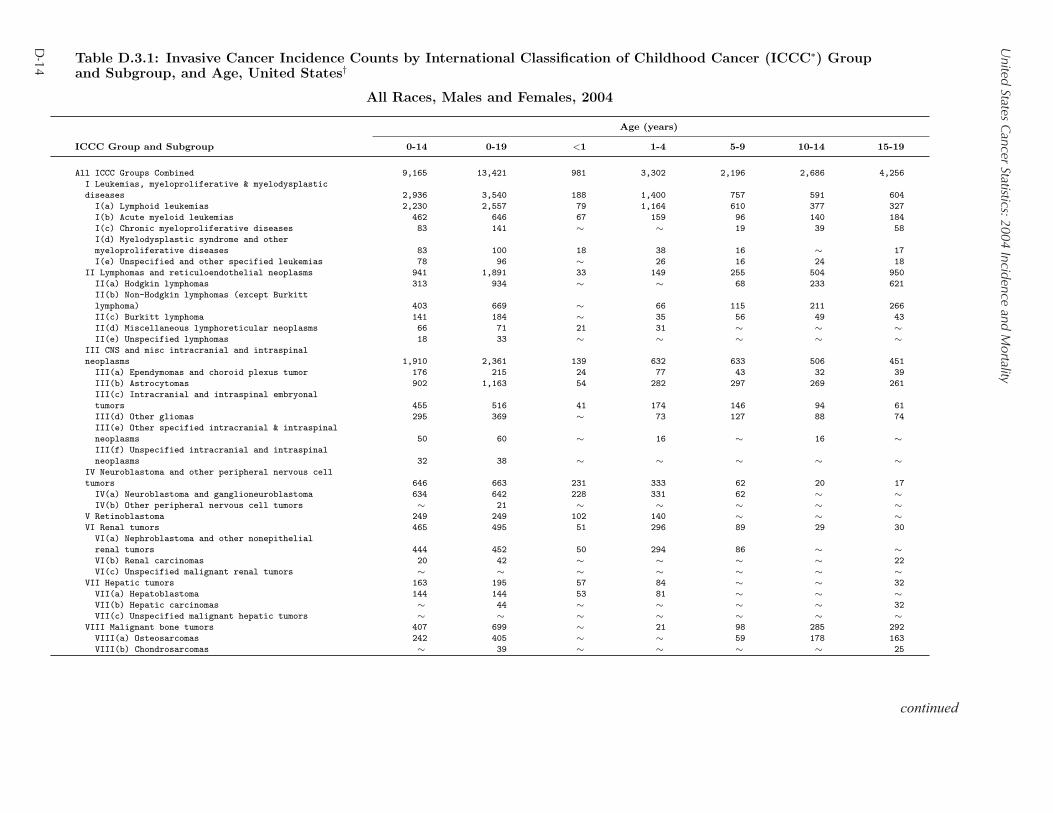
United
States Cancer Statistics: 2004 Incid
ence and M
ortality
D-��
continued
Table D.3.1: Invasive Cancer Incidence Counts by International Classification of Childhood Cancer (ICCC∗) Groupand Subgroup, and Age, United States†
All Races, Males and Females, 2004
Age (years)
ICCC Group and Subgroup 0-14 0-19 <1 1-4 5-9 10-14 15-19
All ICCC Groups Combined 9,165 13,421 981 3,302 2,196 2,686 4,256
I Leukemias, myeloproliferative & myelodysplastic
diseases 2,936 3,540 188 1,400 757 591 604
I(a) Lymphoid leukemias 2,230 2,557 79 1,164 610 377 327
I(b) Acute myeloid leukemias 462 646 67 159 96 140 184
I(c) Chronic myeloproliferative diseases 83 141 ∼ ∼ 19 39 58
I(d) Myelodysplastic syndrome and other
myeloproliferative diseases 83 100 18 38 16 ∼ 17
I(e) Unspecified and other specified leukemias 78 96 ∼ 26 16 24 18
II Lymphomas and reticuloendothelial neoplasms 941 1,891 33 149 255 504 950
II(a) Hodgkin lymphomas 313 934 ∼ ∼ 68 233 621
II(b) Non-Hodgkin lymphomas (except Burkitt
lymphoma) 403 669 ∼ 66 115 211 266
II(c) Burkitt lymphoma 141 184 ∼ 35 56 49 43
II(d) Miscellaneous lymphoreticular neoplasms 66 71 21 31 ∼ ∼ ∼II(e) Unspecified lymphomas 18 33 ∼ ∼ ∼ ∼ ∼
III CNS and misc intracranial and intraspinal
neoplasms 1,910 2,361 139 632 633 506 451
III(a) Ependymomas and choroid plexus tumor 176 215 24 77 43 32 39
III(b) Astrocytomas 902 1,163 54 282 297 269 261
III(c) Intracranial and intraspinal embryonal
tumors 455 516 41 174 146 94 61
III(d) Other gliomas 295 369 ∼ 73 127 88 74
III(e) Other specified intracranial & intraspinal
neoplasms 50 60 ∼ 16 ∼ 16 ∼III(f) Unspecified intracranial and intraspinal
neoplasms 32 38 ∼ ∼ ∼ ∼ ∼IV Neuroblastoma and other peripheral nervous cell
tumors 646 663 231 333 62 20 17
IV(a) Neuroblastoma and ganglioneuroblastoma 634 642 228 331 62 ∼ ∼IV(b) Other peripheral nervous cell tumors ∼ 21 ∼ ∼ ∼ ∼ ∼
V Retinoblastoma 249 249 102 140 ∼ ∼ ∼VI Renal tumors 465 495 51 296 89 29 30
VI(a) Nephroblastoma and other nonepithelial
renal tumors 444 452 50 294 86 ∼ ∼VI(b) Renal carcinomas 20 42 ∼ ∼ ∼ ∼ 22
VI(c) Unspecified malignant renal tumors ∼ ∼ ∼ ∼ ∼ ∼ ∼VII Hepatic tumors 163 195 57 84 ∼ ∼ 32
VII(a) Hepatoblastoma 144 144 53 81 ∼ ∼ ∼VII(b) Hepatic carcinomas ∼ 44 ∼ ∼ ∼ ∼ 32
VII(c) Unspecified malignant hepatic tumors ∼ ∼ ∼ ∼ ∼ ∼ ∼VIII Malignant bone tumors 407 699 ∼ 21 98 285 292
VIII(a) Osteosarcomas 242 405 ∼ ∼ 59 178 163
VIII(b) Chondrosarcomas ∼ 39 ∼ ∼ ∼ ∼ 25

Appendix D
D-��
Table D.3.1: Invasive Cancer Incidence Counts by International Classification of Childhood Cancer (ICCC∗) Groupand Subgroup, and Age, United States† (continued)
All Races, Males and Females, 2004
Age (years)
ICCC Group and Subgroup 0-14 0-19 <1 1-4 5-9 10-14 15-19
VIII(c) Ewing tumor and related sarcomas of bone 130 206 ∼ ∼ 32 82 76
VIII(d) Other specified malignant bone tumors 17 38 ∼ ∼ ∼ ∼ 21
VIII(e) Unspecified malignant bone tumors ∼ ∼ ∼ ∼ ∼ ∼ ∼IX Soft tissue and other extraosseous sarcomas 615 939 71 146 139 259 324
IX(a) Rhabdomyosarcomas 271 338 16 110 73 72 67
IX(b) Fibrosarcomas, peripheral nerve sheath
tumors & other fibrous neoplams 73 103 25 ∼ ∼ 37 30
IX(c) Kaposi sarcoma ∼ ∼ ∼ ∼ ∼ ∼ ∼IX(d) Other specified soft tissue sarcomas 209 398 21 28 44 116 189
IX(e) Unspecified soft tissue sarcomas 61 96 ∼ ∼ ∼ 33 35
X Germ cell, trophoblastic tumors & neoplasms of
gonads 336 889 72 48 41 175 553
X(a) Intracranial & intraspinal germ cell tumors 94 142 ∼ ∼ 18 60 48
X(b) Malignant extracranial & extragonadal germ
cell tumors 77 102 44 25 ∼ ∼ 25
X(c) Malignant gonadal germ cell tumors 149 592 17 18 19 95 443
X(d) Gonadal carcinomas ∼ 31 ∼ ∼ ∼ ∼ 23
X(e) Other and unspecified malignant gonadal
tumors ∼ 22 ∼ ∼ ∼ ∼ ∼XI Other malignant epithelial neoplasms and
malignant melanomas 438 1,412 23 37 93 285 974
XI(a) Adrenocortical carcinomas ∼ 17 ∼ ∼ ∼ ∼ ∼XI(b) Thyroid carcinomas 150 528 ∼ ∼ 33 111 378
XI(c) Nasopharyngeal carcinomas 22 44 ∼ ∼ ∼ 21 22
XI(d) Malignant melanomas 147 506 ∼ 20 35 82 359
XI(e) Skin carcinomas ∼ ∼ ∼ ∼ ∼ ∼ ∼XI(f) Other and unspecified carcinomas 97 308 ∼ ∼ 21 63 211
XII Other and unspecified malignant neoplasms 37 56 ∼ ∼ ∼ ∼ 19
XII(a) Other specified malignant tumors 19 29 ∼ ∼ ∼ ∼ ∼XII(b) Other unspecified malignant tumors 18 27 ∼ ∼ ∼ ∼ ∼
Not classified by ICCC 22 32 ∼ ∼ ∼ ∼ ∼∗ 2005 International Classification of Childhood Cancer based on ICD-O-3. See Technical Notes and Appendix C.† Data are from all state and metropolitan area cancer registries, except Maryland. Included data cover approximately 98% of the population and met data quality
criteria for all invasive cancer sites combined. See Appendix B for registry-specific data quality information.
∼ Counts are suppressed if fewer than 16 cases were reported in a specific category (site, age).
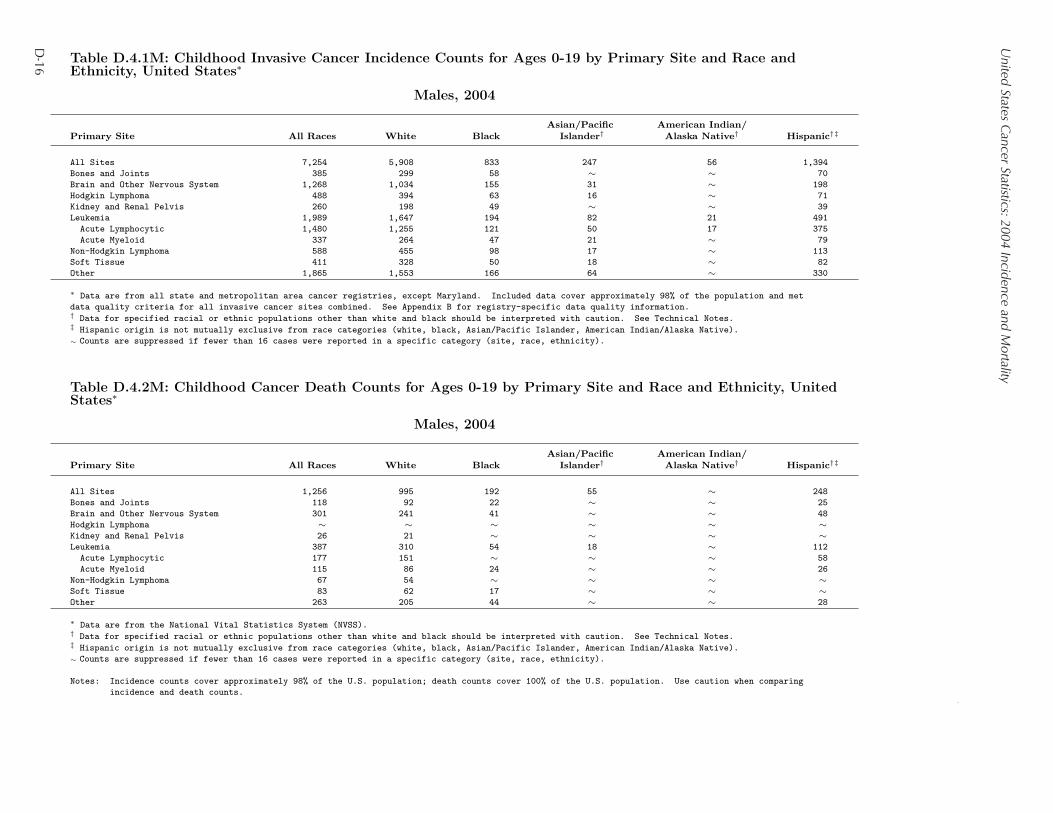
United
States Cancer Statistics: 2004 Incid
ence and M
ortality
D-��
continued
Table D.4.1M: Childhood Invasive Cancer Incidence Counts for Ages 0-19 by Primary Site and Race andEthnicity, United States∗
Males, 2004
Asian/Pacific American Indian/Primary Site All Races White Black Islander† Alaska Native† Hispanic†‡
All Sites 7,254 5,908 833 247 56 1,394
Bones and Joints 385 299 58 ∼ ∼ 70
Brain and Other Nervous System 1,268 1,034 155 31 ∼ 198
Hodgkin Lymphoma 488 394 63 16 ∼ 71
Kidney and Renal Pelvis 260 198 49 ∼ ∼ 39
Leukemia 1,989 1,647 194 82 21 491
Acute Lymphocytic 1,480 1,255 121 50 17 375
Acute Myeloid 337 264 47 21 ∼ 79
Non-Hodgkin Lymphoma 588 455 98 17 ∼ 113
Soft Tissue 411 328 50 18 ∼ 82
Other 1,865 1,553 166 64 ∼ 330
∗ Data are from all state and metropolitan area cancer registries, except Maryland. Included data cover approximately 98% of the population and met
data quality criteria for all invasive cancer sites combined. See Appendix B for registry-specific data quality information.† Data for specified racial or ethnic populations other than white and black should be interpreted with caution. See Technical Notes.‡ Hispanic origin is not mutually exclusive from race categories (white, black, Asian/Pacific Islander, American Indian/Alaska Native).
∼ Counts are suppressed if fewer than 16 cases were reported in a specific category (site, race, ethnicity).
Table D.4.2M: Childhood Cancer Death Counts for Ages 0-19 by Primary Site and Race and Ethnicity, UnitedStates∗
Males, 2004
Asian/Pacific American Indian/Primary Site All Races White Black Islander† Alaska Native† Hispanic†‡
All Sites 1,256 995 192 55 ∼ 248
Bones and Joints 118 92 22 ∼ ∼ 25
Brain and Other Nervous System 301 241 41 ∼ ∼ 48
Hodgkin Lymphoma ∼ ∼ ∼ ∼ ∼ ∼Kidney and Renal Pelvis 26 21 ∼ ∼ ∼ ∼Leukemia 387 310 54 18 ∼ 112
Acute Lymphocytic 177 151 ∼ ∼ ∼ 58
Acute Myeloid 115 86 24 ∼ ∼ 26
Non-Hodgkin Lymphoma 67 54 ∼ ∼ ∼ ∼Soft Tissue 83 62 17 ∼ ∼ ∼Other 263 205 44 ∼ ∼ 28
∗ Data are from the National Vital Statistics System (NVSS).† Data for specified racial or ethnic populations other than white and black should be interpreted with caution. See Technical Notes.‡ Hispanic origin is not mutually exclusive from race categories (white, black, Asian/Pacific Islander, American Indian/Alaska Native).
∼ Counts are suppressed if fewer than 16 cases were reported in a specific category (site, race, ethnicity).
Notes: Incidence counts cover approximately 98% of the U.S. population; death counts cover 100% of the U.S. population. Use caution when comparing
incidence and death counts.

Appendix D
D-��
Table D.4.1F: Childhood Invasive Cancer Incidence Counts for Ages 0-19 by Primary Site and Race andEthnicity, United States∗
Females, 2004
Asian/Pacific American Indian/Primary Site All Races White Black Islander† Alaska Native† Hispanic†‡
All Sites 6,167 4,962 764 213 48 1,195
Bones and Joints 334 259 56 ∼ ∼ 69
Brain and Other Nervous System 1,143 924 140 44 ∼ 216
Hodgkin Lymphoma 446 371 53 ∼ ∼ 63
Kidney and Renal Pelvis 255 199 42 ∼ ∼ 50
Leukemia 1,423 1,169 142 66 ∼ 349
Acute Lymphocytic 1,057 885 84 48 ∼ 266
Acute Myeloid 236 186 33 ∼ ∼ 59
Non-Hodgkin Lymphoma 295 220 54 ∼ ∼ 46
Soft Tissue 406 309 74 ∼ ∼ 70
Other 1,865 1,511 203 60 ∼ 332
∗ Data are from all state and metropolitan area cancer registries, except Maryland. Included data cover approximately 98% of the population and met
data quality criteria for all invasive cancer sites combined. See Appendix B for registry-specific data quality information.† Data for specified racial or ethnic populations other than white and black should be interpreted with caution. See Technical Notes.‡ Hispanic origin is not mutually exclusive from race categories (white, black, Asian/Pacific Islander, American Indian/Alaska Native).
∼ Counts are suppressed if fewer than 16 cases were reported in a specific category (site, race, ethnicity).
Table D.4.2F: Childhood Cancer Death Counts for Ages 0-19 by Primary Site and Race and Ethnicity, UnitedStates∗
Females, 2004
Asian/Pacific American Indian/Primary Site All Races White Black Islander† Alaska Native† Hispanic†‡
All Sites 967 753 176 34 ∼ 189
Bones and Joints 71 55 ∼ ∼ ∼ ∼Brain and Other Nervous System 254 199 44 ∼ ∼ 54
Hodgkin Lymphoma ∼ ∼ ∼ ∼ ∼ ∼Kidney and Renal Pelvis 33 27 ∼ ∼ ∼ ∼Leukemia 278 222 43 ∼ ∼ 71
Acute Lymphocytic 118 103 ∼ ∼ ∼ 41
Acute Myeloid 96 69 24 ∼ ∼ ∼Non-Hodgkin Lymphoma 33 25 ∼ ∼ ∼ ∼Soft Tissue 81 58 20 ∼ ∼ ∼Other 205 157 41 ∼ ∼ 30
∗ Data are from the National Vital Statistics System (NVSS).† Data for specified racial or ethnic populations other than white and black should be interpreted with caution. See Technical Notes.‡ Hispanic origin is not mutually exclusive from race categories (white, black, Asian/Pacific Islander, American Indian/Alaska Native).
∼ Counts are suppressed if fewer than 16 cases were reported in a specific category (site, race, ethnicity).
Notes: Incidence counts cover approximately 98% of the U.S. population; death counts cover 100% of the U.S. population. Use caution when comparing
incidence and death counts.

United
States Cancer Statistics: 2004 Incid
ence and M
ortality
D-��
continued
Table D.5.1: Childhood Invasive Cancer Incidence Counts by Primary Site and Age, United States∗
All Races, Males and Females, 2004
Age (years)
Primary Site 0-14 0-19 <1 1-4 5-9 10-14 15-19
All Sites 9,165 13,421 981 3,302 2,196 2,686 4,256
Bones and Joints 421 719 ∼ 28 100 288 298
Brain and Other Nervous System 1,959 2,411 159 640 635 525 452
Hodgkin Lymphoma 313 934 ∼ ∼ 68 233 621
Kidney and Renal Pelvis 479 515 50 306 90 33 36
Leukemia 2,848 3,412 169 1,371 735 573 564
Acute Lymphocytic 2,217 2,537 78 1,158 606 375 320
Acute Myeloid 403 573 54 137 83 129 170
Non-Hodgkin Lymphoma 559 883 ∼ 105 177 265 324
Soft Tissue 580 817 123 167 96 194 237
Other 2,006 3,730 463 673 295 575 1,724
∗ Data are from all state and metropolitan area cancer registries, except Maryland. Included data cover approximately 98% of the population and met data
quality criteria for all invasive cancer sites combined. See Appendix B for registry-specific data quality information.
∼ Counts are suppressed if fewer than 16 cases were reported in a specific category (site, age).
Table D.5.2: Childhood Cancer Death Counts by Primary Site and Age, United States∗
All Races, Males and Females, 2004
Age (years)
Primary Site 0-14 0-19 <1 1-4 5-9 10-14 15-19
All Sites 1,492 2,223 74 399 526 493 731
Bones and Joints 75 189 ∼ ∼ ∼ 57 114
Brain and Other Nervous System 446 555 19 102 186 139 109
Hodgkin Lymphoma ∼ 23 ∼ ∼ ∼ ∼ 17
Kidney and Renal Pelvis 51 59 ∼ 18 23 ∼ ∼Leukemia 455 665 23 120 156 156 210
Acute Lymphocytic 202 295 ∼ 42 83 72 93
Acute Myeloid 147 211 ∼ 55 35 50 64
Non-Hodgkin Lymphoma 44 100 ∼ ∼ 22 19 56
Soft Tissue 98 164 ∼ 24 28 42 66
Other 317 468 20 130 98 69 151
∗ Data are from the National Vital Statistics System (NVSS).
∼ Counts are suppressed if fewer than 16 cases were reported in a specific category (site, age).
Notes: Incidence counts cover approximately 98% of the U.S. population; death counts cover 100% of the U.S. population. Use caution when comparing
incidence and death counts.

Appendix D
D-��
Table D.6.1M: Incidence Counts for Brain and Other Nervous System Tumors by Histologic Grouping,∗ Age,and Behavior, United States†
All Races, Males, 2004
0-19 years 20+ years
Histology Group and Subgroup Benign/Borderline Malignant Benign/Borderline Malignant
Total 543 1,346 10,273 9,911
Tumors of Neuroepthelial Tissue 186 1,210 427 8,369
Pilocytic astrocytoma ∼ 331 ∼ 137
Diffuse astrocytoma ∼ 22 ∼ 135
Anaplastic astrocytoma ∼ 20 ∼ 630
Unique astrocytoma variants 23 ∼ 93 16
Astrocytoma, NOS ∼ 87 ∼ 574
Glioblastoma ∼ 65 ∼ 5,184
Oligodendroglioma ∼ 32 ∼ 426
Anaplastic oligodendroglioma ∼ ∼ ∼ 185
Ependymoma/anaplastic ependymoma ∼ 100 ∼ 275
Ependymoma variants ∼ ∼ 135 ∼Mixed glioma ∼ ∼ ∼ 261
Glioma malignant, NOS ∼ 188 ∼ 390
Choroid plexus 25 ∼ 21 ∼Neuroepithelial ∼ ∼ ∼ 27
Neuronal/glial, neuronal 121 27 149 19
Pineal parenchymal ∼ 19 ∼ ∼Embryonal/primitive/medulloblastoma ∼ 275 ∼ 91
Tumors of Cranial and Spinal Nerves 88 ∼ 2,022 24
Nerve sheath, benign and malignant 88 ∼ 2,022 24
Tumors of the Meninges 64 ∼ 4,437 188
Meningioma 39 ∼ 4,138 165
Other mesenchymal ∼ ∼ 74 21
Hemangioblastoma ∼ ∼ 225 ∼Lymphomas and Hematopoietic Neoplasms ∼ ∼ ∼ 685
Germ Cell Tumors ∼ 101 22 37
Tumors of Sellar Region 136 ∼ 2,759 20
Pituitary 67 ∼ 2,591 20
Craniopharyngioma 69 ∼ 168 ∼Local Extensions from Regional Tumors ∼ ∼ ∼ 22
Unclassified Tumors 55 16 604 566
Hemangioma 21 ∼ 117 ∼Neoplasm, unspecified 34 16 484 561
All other ∼ ∼ ∼ ∼∗ Modified from the Central Brain Tumor Registry of the United States statistics report, see Technical Notes and Appendix C.† Data are from all state and metropolitan area cancer registries, except Maryland and South Carolina. Included data cover approximately 97% of the
population and met data quality criteria for all invasive cancer sites combined. See Appendix B for registry-specific data quality information.
∼ Counts are suppressed if fewer than 16 cases were reported in a specific category (histology, age, behavior).
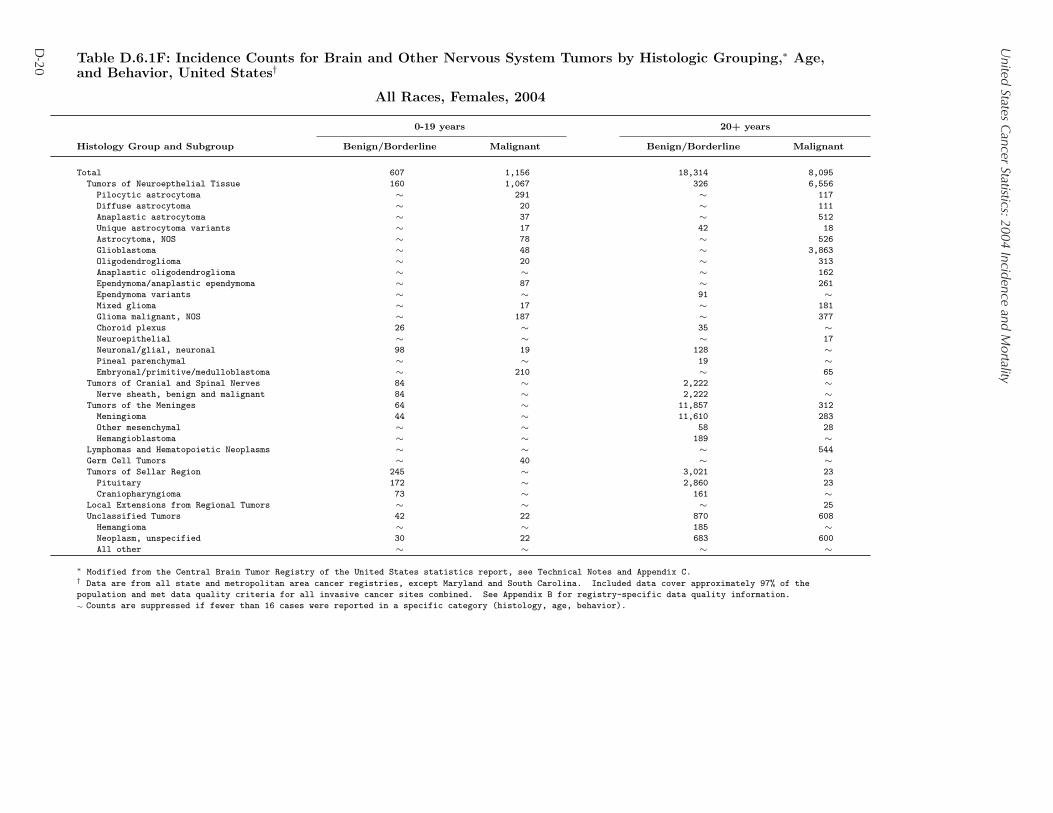
United
States Cancer Statistics: 2004 Incid
ence and M
ortality
D-�0
continued
Table D.6.1F: Incidence Counts for Brain and Other Nervous System Tumors by Histologic Grouping,∗ Age,and Behavior, United States†
All Races, Females, 2004
0-19 years 20+ years
Histology Group and Subgroup Benign/Borderline Malignant Benign/Borderline Malignant
Total 607 1,156 18,314 8,095
Tumors of Neuroepthelial Tissue 160 1,067 326 6,556
Pilocytic astrocytoma ∼ 291 ∼ 117
Diffuse astrocytoma ∼ 20 ∼ 111
Anaplastic astrocytoma ∼ 37 ∼ 512
Unique astrocytoma variants ∼ 17 42 18
Astrocytoma, NOS ∼ 78 ∼ 526
Glioblastoma ∼ 48 ∼ 3,863
Oligodendroglioma ∼ 20 ∼ 313
Anaplastic oligodendroglioma ∼ ∼ ∼ 162
Ependymoma/anaplastic ependymoma ∼ 87 ∼ 261
Ependymoma variants ∼ ∼ 91 ∼Mixed glioma ∼ 17 ∼ 181
Glioma malignant, NOS ∼ 187 ∼ 377
Choroid plexus 26 ∼ 35 ∼Neuroepithelial ∼ ∼ ∼ 17
Neuronal/glial, neuronal 98 19 128 ∼Pineal parenchymal ∼ ∼ 19 ∼Embryonal/primitive/medulloblastoma ∼ 210 ∼ 65
Tumors of Cranial and Spinal Nerves 84 ∼ 2,222 ∼Nerve sheath, benign and malignant 84 ∼ 2,222 ∼
Tumors of the Meninges 64 ∼ 11,857 312
Meningioma 44 ∼ 11,610 283
Other mesenchymal ∼ ∼ 58 28
Hemangioblastoma ∼ ∼ 189 ∼Lymphomas and Hematopoietic Neoplasms ∼ ∼ ∼ 544
Germ Cell Tumors ∼ 40 ∼ ∼Tumors of Sellar Region 245 ∼ 3,021 23
Pituitary 172 ∼ 2,860 23
Craniopharyngioma 73 ∼ 161 ∼Local Extensions from Regional Tumors ∼ ∼ ∼ 25
Unclassified Tumors 42 22 870 608
Hemangioma ∼ ∼ 185 ∼Neoplasm, unspecified 30 22 683 600
All other ∼ ∼ ∼ ∼∗ Modified from the Central Brain Tumor Registry of the United States statistics report, see Technical Notes and Appendix C.† Data are from all state and metropolitan area cancer registries, except Maryland and South Carolina. Included data cover approximately 97% of the
population and met data quality criteria for all invasive cancer sites combined. See Appendix B for registry-specific data quality information.
∼ Counts are suppressed if fewer than 16 cases were reported in a specific category (histology, age, behavior).

Appendix E


Tables E.�.�–E.��.�
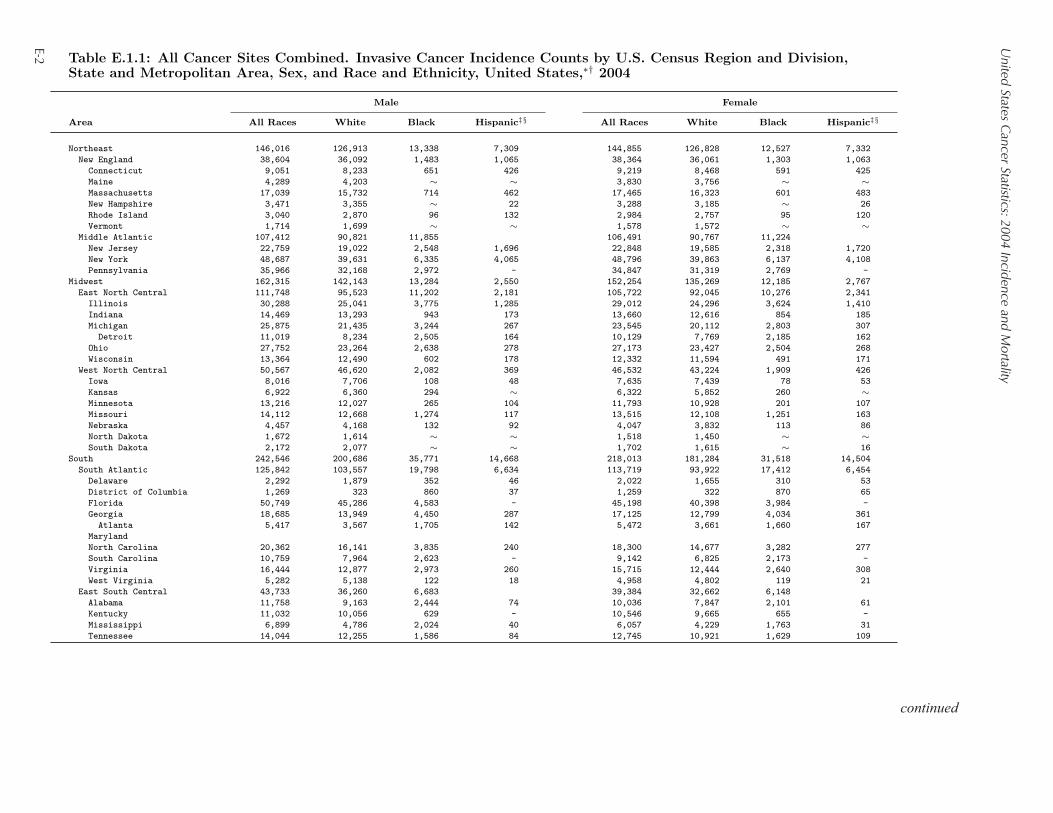
United
States Cancer Statistics: 2004 Incid
ence and M
ortality
E-�
continued
Table E.1.1: All Cancer Sites Combined. Invasive Cancer Incidence Counts by U.S. Census Region and Division,State and Metropolitan Area, Sex, and Race and Ethnicity, United States,∗† 2004
Male Female
Area All Races White Black Hispanic‡§ All Races White Black Hispanic‡§
Northeast 146,016 126,913 13,338 7,309 144,855 126,828 12,527 7,332
New England 38,604 36,092 1,483 1,065 38,364 36,061 1,303 1,063
Connecticut 9,051 8,233 651 426 9,219 8,468 591 425
Maine 4,289 4,203 ∼ ∼ 3,830 3,756 ∼ ∼Massachusetts 17,039 15,732 714 462 17,465 16,323 601 483
New Hampshire 3,471 3,355 ∼ 22 3,288 3,185 ∼ 26
Rhode Island 3,040 2,870 96 132 2,984 2,757 95 120
Vermont 1,714 1,699 ∼ ∼ 1,578 1,572 ∼ ∼Middle Atlantic 107,412 90,821 11,855 106,491 90,767 11,224
New Jersey 22,759 19,022 2,548 1,696 22,848 19,585 2,318 1,720
New York 48,687 39,631 6,335 4,065 48,796 39,863 6,137 4,108
Pennsylvania 35,966 32,168 2,972 - 34,847 31,319 2,769 -
Midwest 162,315 142,143 13,284 2,550 152,254 135,269 12,185 2,767
East North Central 111,748 95,523 11,202 2,181 105,722 92,045 10,276 2,341
Illinois 30,288 25,041 3,775 1,285 29,012 24,296 3,624 1,410
Indiana 14,469 13,293 943 173 13,660 12,616 854 185
Michigan 25,875 21,435 3,244 267 23,545 20,112 2,803 307
Detroit 11,019 8,234 2,505 164 10,129 7,769 2,185 162
Ohio 27,752 23,264 2,638 278 27,173 23,427 2,504 268
Wisconsin 13,364 12,490 602 178 12,332 11,594 491 171
West North Central 50,567 46,620 2,082 369 46,532 43,224 1,909 426
Iowa 8,016 7,706 108 48 7,635 7,439 78 53
Kansas 6,922 6,360 294 ∼ 6,322 5,852 260 ∼Minnesota 13,216 12,027 265 104 11,793 10,928 201 107
Missouri 14,112 12,668 1,274 117 13,515 12,108 1,251 163
Nebraska 4,457 4,168 132 92 4,047 3,832 113 86
North Dakota 1,672 1,614 ∼ ∼ 1,518 1,450 ∼ ∼South Dakota 2,172 2,077 ∼ ∼ 1,702 1,615 ∼ 16
South 242,546 200,686 35,771 14,668 218,013 181,284 31,518 14,504
South Atlantic 125,842 103,557 19,798 6,634 113,719 93,922 17,412 6,454
Delaware 2,292 1,879 352 46 2,022 1,655 310 53
District of Columbia 1,269 323 860 37 1,259 322 870 65
Florida 50,749 45,286 4,583 - 45,198 40,398 3,984 -
Georgia 18,685 13,949 4,450 287 17,125 12,799 4,034 361
Atlanta 5,417 3,567 1,705 142 5,472 3,661 1,660 167
Maryland
North Carolina 20,362 16,141 3,835 240 18,300 14,677 3,282 277
South Carolina 10,759 7,964 2,623 - 9,142 6,825 2,173 -
Virginia 16,444 12,877 2,973 260 15,715 12,444 2,640 308
West Virginia 5,282 5,138 122 18 4,958 4,802 119 21
East South Central 43,733 36,260 6,683 39,384 32,662 6,148
Alabama 11,758 9,163 2,444 74 10,036 7,847 2,101 61
Kentucky 11,032 10,056 629 - 10,546 9,665 655 -
Mississippi 6,899 4,786 2,024 40 6,057 4,229 1,763 31
Tennessee 14,044 12,255 1,586 84 12,745 10,921 1,629 109

Appendix E
E-3
Table E.1.1: All Cancer Sites Combined. Invasive Cancer Incidence Counts by U.S. Census Region and Division,State and Metropolitan Area, Sex, and Race and Ethnicity, United States,∗† 2004 (continued)
Male Female
Area All Races White Black Hispanic‡§ All Races White Black Hispanic‡§
West South Central 72,971 60,869 9,290 7,781 64,910 54,700 7,958 7,815
Arkansas 7,273 6,402 778 42 6,153 5,342 694 47
Louisiana 11,663 8,333 3,229 152 9,922 7,198 2,640 133
Oklahoma 8,753 7,549 489 134 8,263 7,111 438 164
Texas 45,282 38,585 4,794 7,453 40,572 35,049 4,186 7,471
West 143,434 123,212 6,368 15,382 132,693 113,858 5,549
Mountain 41,075 38,274 912 3,797 37,152 34,709 743
Arizona 11,567 10,701 266 1,144 10,594 9,835 219 1,187
Colorado 8,900 8,157 264 814 8,753 8,202 223 914
Idaho 3,275 3,228 ∼ 86 2,750 2,708 ∼ 90
Montana 2,536 2,405 ∼ 20 2,077 1,955 ∼ ∼Nevada 5,301 4,686 285 371 4,724 4,189 233 360
New Mexico 4,097 3,890 53 1,161 3,761 3,489 48 1,076
Utah 4,140 4,013 28 156 3,412 3,321 ∼ 189
Wyoming 1,259 1,194 ∼ 45 1,081 1,010 ∼ 36
Pacific 102,359 84,938 5,456 11,585 95,541 79,149 4,806 11,800
Alaska 1,173 921 37 18 1,014 719 27 25
California 73,391 60,232 4,871 10,939 68,547 56,404 4,380 11,104
San Francisco-Oakland 9,438 6,792 932 726 9,033 6,477 889 756
San Jose-Monterey 4,779 3,942 129 611 4,329 3,533 75 577
Los Angeles 18,583 13,714 2,210 3,994 17,881 13,388 2,070 4,211
Hawaii 3,047 1,076 27 91 2,831 825 18 94
Oregon 9,217 8,705 112 195 8,700 8,196 83 229
Washington 15,531 14,004 409 342 14,449 13,005 298 348
Seattle-Puget Sound 10,739 9,794 379 194 10,116 9,130 281 198
∗ Data are from all state and metropolitan area cancer registries, except Maryland. Included data cover approximately 98% of the population and met data quality
criteria for all invasive cancer sites combined. See Appendix B for registry-specific data quality information.† Excludes basal and squamous cell carcinomas of the skin except when these occur on the skin of the genital organs, and in situ cancers except urinary bladder.‡ Data for specified racial or ethnic populations other than white and black should be interpreted with caution. See Technical Notes.
§ Hispanic origin is not mutually exclusive from race categories (white, black).
∼ Counts are suppressed if fewer than 16 cases were reported in a specific category (area, sex, race, ethnicity).
- Counts are suppressed at the state’s or metropolitan area’s request. See Technical Notes.
Notes: Cases from suppressed counts are included in region/division counts. Region/division counts are presented for regions/divisions with 100% of the
population covered by registries that meet the data quality criteria specified above unless the count for exactly one state in the region or division
is suppressed due to a count of less than 16. Michigan, Georgia, California, and Washington state counts each include cases from the SEER metropolitan
areas.

United
States Cancer Statistics: 2004 Incid
ence and M
ortality
E-�
continued
Table E.1.2: All Cancer Sites Combined. Cancer Death Counts by U.S. Census Region and Division, State, Sex,and Race and Ethnicity, United States,∗ 2004
Male Female
Area All Races White Black Hispanic†‡ All Races White Black Hispanic†‡
United States 286,824 247,446 32,441 12,999 267,056 230,682 30,056 11,520
Northeast 55,880 49,696 5,216 1,886 56,667 50,514 5,382 1,771
New England 14,983 14,264 578 235 14,836 14,210 498 199
Connecticut 3,581 3,305 248 99 3,593 3,351 216 81
Maine 1,618 1,596 ∼ ∼ 1,506 1,496 ∼ ∼Massachusetts 6,611 6,252 274 107 6,726 6,413 238 90
New Hampshire 1,317 1,310 ∼ ∼ 1,237 1,230 ∼ ∼Rhode Island 1,229 1,177 45 22 1,189 1,138 39 23
Vermont 627 624 ∼ ∼ 585 582 ∼ ∼Middle Atlantic 40,897 35,432 4,638 1,651 41,831 36,304 4,884 1,572
New Jersey 8,363 7,154 1,012 343 8,843 7,652 1,033 345
New York 17,749 14,835 2,376 1,172 18,351 15,418 2,525 1,116
Pennsylvania 14,785 13,443 1,250 136 14,637 13,234 1,326 111
Midwest 67,986 61,029 6,336 788 63,593 57,012 5,970 662
East North Central 47,596 41,865 5,360 644 44,699 39,266 5,053 525
Illinois 12,344 10,349 1,837 357 11,945 9,950 1,835 303
Indiana 6,489 5,983 491 45 6,063 5,585 456 39
Michigan 10,202 8,750 1,339 134 9,451 8,134 1,230 105
Ohio 12,846 11,364 1,448 66 12,094 10,710 1,340 53
Wisconsin 5,715 5,419 245 42 5,146 4,887 192 25
West North Central 20,390 19,164 976 144 18,894 17,746 917 137
Iowa 3,266 3,207 43 18 3,074 3,017 46 ∼Kansas 2,764 2,596 140 37 2,548 2,391 130 53
Minnesota 4,646 4,469 82 31 4,447 4,291 80 20
Missouri 6,514 5,825 650 34 5,935 5,293 606 34
Nebraska 1,692 1,615 58 22 1,578 1,510 53 16
North Dakota 666 651 ∼ ∼ 599 575 ∼ ∼South Dakota 842 801 ∼ ∼ 713 669 ∼ ∼
South 108,757 89,505 18,168 5,074 95,874 78,607 16,171 4,360
South Atlantic 58,283 47,574 10,211 2,106 51,920 42,086 9,285 1,780
Delaware 968 824 137 ∼ 859 728 123 ∼District of Columbia 587 142 439 ∼ 565 126 432 ∼Florida 21,388 19,279 2,000 1,883 18,452 16,537 1,773 1,529
Georgia 7,567 5,601 1,907 53 6,746 4,946 1,747 65
Maryland 5,088 3,715 1,271 38 5,080 3,714 1,274 41
North Carolina 8,694 6,855 1,734 45 7,783 6,101 1,594 32
South Carolina 4,530 3,287 1,231 ∼ 3,818 2,755 1,037 ∼Virginia 6,986 5,459 1,429 58 6,398 5,026 1,239 90
West Virginia 2,475 2,412 63 ∼ 2,219 2,153 66 ∼East South Central 19,963 16,515 3,386 52 17,521 14,399 3,059 63
Alabama 5,258 4,057 1,187 ∼ 4,498 3,464 1,016 ∼Kentucky 4,775 4,483 282 17 4,384 4,075 300 26
Mississippi 3,235 2,215 1,008 ∼ 2,748 1,856 880 ∼Tennessee 6,695 5,760 909 17 5,891 5,004 863 17

Appendix E
E-�
Table E.1.2: All Cancer Sites Combined. Cancer Death Counts by U.S. Census Region and Division, State, Sex,and Race and Ethnicity, United States,∗ 2004 (continued)
Male Female
Area All Races White Black Hispanic†‡ All Races White Black Hispanic†‡
West South Central 30,511 25,416 4,571 26,433 22,122 3,827 2,517
Arkansas 3,347 2,901 438 ∼ 2,957 2,582 362 17
Louisiana 5,106 3,427 1,641 32 4,328 3,000 1,307 20
Oklahoma 3,938 3,460 238 44 3,331 2,925 197 39
Texas 18,120 15,628 2,254 2,830 15,817 13,615 1,961 2,441
West 54,201 47,216 2,721 5,251 50,922 44,549 2,533 4,727
Mountain 15,885 15,054 418 1,543 14,497 13,685 341
Arizona 5,166 4,919 119 508 4,452 4,177 114 414
Colorado 3,122 2,959 109 306 3,074 2,930 81 275
Idaho 1,173 1,159 ∼ 33 1,054 1,042 ∼ 24
Montana 966 925 ∼ ∼ 901 862 ∼ ∼Nevada 2,113 1,894 142 119 2,006 1,800 114 73
New Mexico 1,593 1,484 36 505 1,442 1,352 21 408
Utah 1,303 1,270 ∼ 49 1,142 1,109 ∼ 41
Wyoming 449 444 ∼ ∼ 426 413 ∼ 16
Pacific 38,316 32,162 2,303 36,425 30,864 2,192
Alaska 411 310 ∼ ∼ 317 226 ∼ ∼California 27,378 22,699 2,108 3,510 26,322 21,983 2,041 3,300
Hawaii 1,173 327 ∼ 60 915 250 ∼ 45
Oregon 3,714 3,563 52 49 3,522 3,411 44 53
Washington 5,640 5,263 121 84 5,349 4,994 100 71
∗ Data are from the National Vital Statistics System (NVSS).† Data for specified racial or ethnic populations other than white and black should be interpreted with caution. See Technical Notes.‡ Hispanic origin is not mutually exclusive from race categories (white, black).
∼ Counts are suppressed if fewer than 16 cases were reported in a specific category (area, sex, race, ethnicity).
Notes: Region/division counts are suppressed if the count for exactly one state in the region or division is suppressed due to a count of less than 16.

United
States Cancer Statistics: 2004 Incid
ence and M
ortality
E-�
continued
Table E.2.1: Brain and Other Nervous System. Invasive Cancer Incidence Counts by U.S. Census Region andDivision, State and Metropolitan Area, Sex, and Race and Ethnicity, United States,∗† 2004
Male Female
Area All Races White Black Hispanic‡§ All Races White Black Hispanic‡§
Northeast 2,208 2,013 122 152 113 117
New England 632 603 ∼ 24 ∼ 23
Connecticut 144 130 ∼ ∼ 114 109 ∼ ∼Maine 74 74 ∼ ∼ 58 57 ∼ ∼Massachusetts 276 263 ∼ ∼ 191 183 ∼ ∼New Hampshire 56 55 ∼ ∼ 47 44 ∼ ∼Rhode Island 58 57 ∼ ∼ 35 35 ∼ ∼Vermont 24 24 ∼ ∼ ∼ ∼ ∼ ∼
Middle Atlantic 1,576 1,410 107 1,349 1,179 105
New Jersey 321 298 16 36 326 280 24 25
New York 742 642 65 86 587 493 63 63
Pennsylvania 513 470 26 - 436 406 18 -
Midwest 2,418 2,230 129 68 2,035 1,860 124 58
East North Central 1,643 1,496 105 55 1,425 1,282 105 47
Illinois 423 384 26 32 392 342 36 31
Indiana 232 215 ∼ ∼ 191 183 ∼ ∼Michigan 389 352 29 ∼ 321 277 38 ∼
Detroit 138 112 20 ∼ 118 90 26 ∼Ohio 391 345 34 ∼ 349 322 20 ∼Wisconsin 208 200 ∼ ∼ 172 158 ∼ ∼
West North Central 775 734 24 ∼ 610 578 19 ∼Iowa 122 119 ∼ ∼ 100 98 ∼ ∼Kansas 109 101 ∼ ∼ 83 74 ∼ ∼Minnesota 201 193 ∼ ∼ 143 139 ∼ ∼Missouri 213 198 ∼ ∼ 193 179 ∼ ∼Nebraska 66 61 ∼ ∼ 49 47 ∼ ∼North Dakota 24 22 ∼ ∼ 21 20 ∼ ∼South Dakota 40 40 ∼ ∼ 21 21 ∼ ∼
South 3,545 3,125 343 285 3,060 2,629 361 277
South Atlantic 1,805 1,578 186 136 1,571 1,327 206 115
Delaware 38 35 ∼ ∼ 27 25 ∼ ∼District of Columbia ∼ ∼ ∼ ∼ ∼ ∼ ∼ ∼Florida 732 651 59 - 585 521 57 -
Georgia 260 220 37 ∼ 270 207 58 ∼Atlanta 75 56 18 ∼ 82 59 18 ∼
Maryland
North Carolina 287 250 31 ∼ 269 224 35 ∼South Carolina 149 124 24 - 120 98 21 -
Virginia 245 212 26 ∼ 218 180 24 ∼West Virginia 79 76 ∼ ∼ 71 69 ∼ ∼
East South Central 624 554 ∼ 556 480 ∼Alabama 167 149 18 ∼ 142 121 19 ∼Kentucky 151 144 ∼ - 133 126 ∼ -
Mississippi 91 70 20 ∼ 81 57 23 ∼Tennessee 215 191 21 ∼ 200 176 20 ∼

Appendix E
E-�
Table E.2.1: Brain and Other Nervous System. Invasive Cancer Incidence Counts by U.S. Census Region andDivision, State and Metropolitan Area, Sex, and Race and Ethnicity, United States,∗† 2004 (continued)
Male Female
Area All Races White Black Hispanic‡§ All Races White Black Hispanic‡§
West South Central 1,116 993 92 141 933 822 87 152
Arkansas 107 94 ∼ ∼ 65 59 ∼ ∼Louisiana 143 119 24 ∼ 109 83 25 ∼Oklahoma 143 124 ∼ ∼ 119 96 ∼ ∼Texas 723 656 50 137 640 584 45 144
West 2,371 58 365 1,816 1,632 49 270
Mountain 696 667 ∼ 73 ∼ 69
Arizona 204 196 ∼ 24 186 176 ∼ 31
Colorado 152 147 ∼ 23 126 120 ∼ ∼Idaho 52 52 ∼ ∼ 46 45 ∼ ∼Montana 43 42 ∼ ∼ 27 26 ∼ ∼Nevada 83 77 ∼ ∼ 66 59 ∼ ∼New Mexico 63 58 ∼ ∼ 46 45 ∼ ∼Utah 77 76 ∼ ∼ 73 73 ∼ ∼Wyoming 22 19 ∼ ∼ ∼ ∼ ∼ ∼
Pacific 1,675 50 292 1,075 40 201
Alaska 23 18 ∼ ∼ ∼ ∼ ∼ ∼California 1,207 1,065 46 274 880 767 39 194
San Francisco-Oakland 154 123 ∼ 21 109 86 ∼ ∼San Jose-Monterey 66 56 ∼ 19 63 49 ∼ ∼Los Angeles 297 248 24 107 206 175 18 78
Hawaii 27 ∼ ∼ ∼ 26 ∼ ∼ ∼Oregon 160 153 ∼ ∼ 117 111 ∼ ∼Washington 258 237 ∼ ∼ 196 183 ∼ ∼
Seattle-Puget Sound 182 170 ∼ ∼ 139 132 ∼ ∼∗ Data are from all state and metropolitan area cancer registries, except Maryland. Included data cover approximately 98% of the population and met data quality
criteria for all invasive cancer sites combined. See Appendix B for registry-specific data quality information.† Invasive cancers only.‡ Data for specified racial or ethnic populations other than white and black should be interpreted with caution. See Technical Notes.
§ Hispanic origin is not mutually exclusive from race categories (white, black).
∼ Counts are suppressed if fewer than 16 cases were reported in a specific category (area, sex, race, ethnicity).
- Counts are suppressed at the state’s or metropolitan area’s request. See Technical Notes.
Notes: Cases from suppressed counts are included in region/division counts. Region/division counts are presented for regions/divisions with 100% of the
population covered by registries that meet the data quality criteria specified above unless the count for exactly one state in the region or division
is suppressed due to a count of less than 16. Michigan, Georgia, California, and Washington state counts each include cases from the SEER metropolitan
areas.

United
States Cancer Statistics: 2004 Incid
ence and M
ortality
E-�
continued
Table E.2.2: Brain and Other Nervous System. Cancer Death Counts by U.S. Census Region and Division,State, Sex, and Race and Ethnicity, United States,∗ 2004
Male Female
Area All Races White Black Hispanic†‡ All Races White Black Hispanic†‡
United States 7,074 6,508 409 365 5,755 5,285 356 306
Northeast 1,299 1,224 49 42 52 35
New England 366 356 ∼ ∼ ∼ ∼Connecticut 77 73 ∼ ∼ 78 74 ∼ ∼Maine 49 47 ∼ ∼ 30 30 ∼ ∼Massachusetts 145 141 ∼ ∼ 129 128 ∼ ∼New Hampshire 42 42 ∼ ∼ 30 30 ∼ ∼Rhode Island 36 36 ∼ ∼ 22 21 ∼ ∼Vermont 17 17 ∼ ∼ ∼ ∼ ∼ ∼
Middle Atlantic 933 868 43 36 778 715 48 31
New Jersey 189 177 ∼ ∼ 167 152 ∼ ∼New York 406 360 31 26 343 304 30 18
Pennsylvania 338 331 ∼ ∼ 268 259 ∼ ∼Midwest 1,703 1,617 70 31 63 22
East North Central 1,139 1,068 59 24 930 876 49 ∼Illinois 277 253 17 ∼ 234 214 17 ∼Indiana 153 148 ∼ ∼ 135 132 ∼ ∼Michigan 272 255 ∼ ∼ 201 181 20 ∼Ohio 294 271 23 ∼ 257 249 ∼ ∼Wisconsin 143 141 ∼ ∼ 103 100 ∼ ∼
West North Central 564 549 ∼ ∼ ∼ ∼Iowa 89 88 ∼ ∼ 71 71 ∼ ∼Kansas 84 81 ∼ ∼ 68 65 ∼ ∼Minnesota 130 130 ∼ ∼ 98 94 ∼ ∼Missouri 163 155 ∼ ∼ 123 112 ∼ ∼Nebraska 50 47 ∼ ∼ 46 45 ∼ ∼North Dakota 17 17 ∼ ∼ ∼ ∼ ∼ ∼South Dakota 31 31 ∼ ∼ 18 18 ∼ ∼
South 2,535 2,267 245 133 2,065 1,832 202 103
South Atlantic 1,296 1,157 126 59 1,077 941 121 49
Delaware 19 17 ∼ ∼ ∼ ∼ ∼ ∼District of Columbia ∼ ∼ ∼ ∼ ∼ ∼ ∼ ∼Florida 446 411 32 47 394 366 27 42
Georgia 157 136 19 ∼ 128 109 18 ∼Maryland 125 103 19 ∼ 111 93 ∼ ∼North Carolina 213 192 18 ∼ 157 137 16 ∼South Carolina 97 85 ∼ ∼ 101 75 26 ∼Virginia 169 150 17 ∼ 123 103 ∼ ∼West Virginia 58 58 ∼ ∼ 43 43 ∼ ∼
East South Central 470 426 44 ∼ 413 376 35 ∼Alabama 120 104 16 ∼ 95 88 ∼ ∼Kentucky 90 86 ∼ ∼ 79 70 ∼ ∼Mississippi 78 67 ∼ ∼ 65 53 ∼ ∼Tennessee 182 169 ∼ ∼ 174 165 ∼ ∼
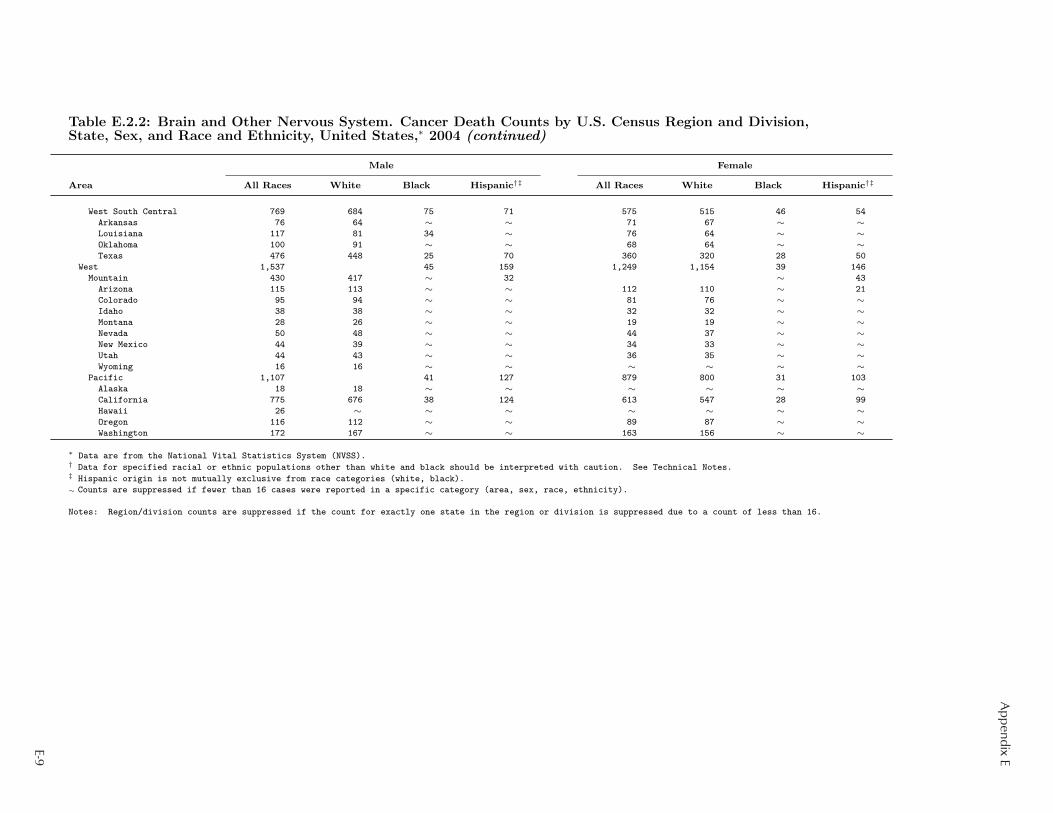
Appendix E
E-�
Table E.2.2: Brain and Other Nervous System. Cancer Death Counts by U.S. Census Region and Division,State, Sex, and Race and Ethnicity, United States,∗ 2004 (continued)
Male Female
Area All Races White Black Hispanic†‡ All Races White Black Hispanic†‡
West South Central 769 684 75 71 575 515 46 54
Arkansas 76 64 ∼ ∼ 71 67 ∼ ∼Louisiana 117 81 34 ∼ 76 64 ∼ ∼Oklahoma 100 91 ∼ ∼ 68 64 ∼ ∼Texas 476 448 25 70 360 320 28 50
West 1,537 45 159 1,249 1,154 39 146
Mountain 430 417 ∼ 32 ∼ 43
Arizona 115 113 ∼ ∼ 112 110 ∼ 21
Colorado 95 94 ∼ ∼ 81 76 ∼ ∼Idaho 38 38 ∼ ∼ 32 32 ∼ ∼Montana 28 26 ∼ ∼ 19 19 ∼ ∼Nevada 50 48 ∼ ∼ 44 37 ∼ ∼New Mexico 44 39 ∼ ∼ 34 33 ∼ ∼Utah 44 43 ∼ ∼ 36 35 ∼ ∼Wyoming 16 16 ∼ ∼ ∼ ∼ ∼ ∼
Pacific 1,107 41 127 879 800 31 103
Alaska 18 18 ∼ ∼ ∼ ∼ ∼ ∼California 775 676 38 124 613 547 28 99
Hawaii 26 ∼ ∼ ∼ ∼ ∼ ∼ ∼Oregon 116 112 ∼ ∼ 89 87 ∼ ∼Washington 172 167 ∼ ∼ 163 156 ∼ ∼
∗ Data are from the National Vital Statistics System (NVSS).† Data for specified racial or ethnic populations other than white and black should be interpreted with caution. See Technical Notes.‡ Hispanic origin is not mutually exclusive from race categories (white, black).
∼ Counts are suppressed if fewer than 16 cases were reported in a specific category (area, sex, race, ethnicity).
Notes: Region/division counts are suppressed if the count for exactly one state in the region or division is suppressed due to a count of less than 16.

United
States Cancer Statistics: 2004 Incid
ence and M
ortality
E-�0
continued
Table E.3.1: Breast. Invasive Cancer Incidence Counts by U.S. Census Region and Division, State andMetropolitan Area, and Race and Ethnicity, United States,∗† 2004
Male Female
Area All Races White Black Hispanic‡§ All Races White Black Hispanic‡§
Northeast 40,848 35,641 3,546 2,039
New England 11,001 10,336 405 320
Connecticut 2,706 2,484 180 129
Maine 1,025 998 ∼ ∼Massachusetts 5,011 4,675 195 148
New Hampshire 948 932 ∼ ∼Rhode Island 833 773 22 31
Vermont 478 474 ∼ ∼Middle Atlantic 29,847 25,305 3,141
New Jersey 6,531 5,620 630 473
New York 13,749 11,059 1,744 1,133
Pennsylvania 9,567 8,626 767 -
Midwest 43,367 38,583 3,488 769
East North Central 30,003 26,130 2,922 650
Illinois 8,120 6,806 1,005 370
Indiana 3,711 3,437 224 61
Michigan 6,696 5,725 803 86
Detroit 2,873 2,198 623 51
Ohio 7,902 6,782 769 76
Wisconsin 3,574 3,380 121 57
West North Central 13,364 12,453 566 119
Iowa 2,118 2,078 21 ∼Kansas 1,793 1,646 83 ∼Minnesota 3,417 3,205 58 24
Missouri 3,901 3,481 366 53
Nebraska 1,203 1,148 34 25
North Dakota 453 436 ∼ ∼South Dakota 479 459 ∼ ∼
South 62,461 51,273 9,694 4,000
South Atlantic 32,620 26,509 5,389 1,801
Delaware 552 439 100 ∼District of Columbia 394 118 250 16
Florida 11,962 10,620 1,107 -
Georgia 5,322 3,900 1,325 112
Atlanta 1,830 1,195 583 47
Maryland
North Carolina 5,435 4,304 1,034 80
South Carolina 2,685 1,994 648 -
Virginia 4,955 3,856 896 99
West Virginia 1,315 1,278 29 ∼East South Central 10,993 9,059 1,806 69
Alabama 2,868 2,224 617 19
Kentucky 2,741 2,523 170 -
Mississippi 1,717 1,179 523 ∼Tennessee 3,667 3,133 496 37

Appendix E
E-��
Table E.3.1: Breast. Invasive Cancer Incidence Counts by U.S. Census Region and Division, State andMetropolitan Area, and Race and Ethnicity, United States,∗† 2004 (continued)
Male Female
Area All Races White Black Hispanic‡§ All Races White Black Hispanic‡§
West South Central 18,848 15,705 2,499
Arkansas 1,685 1,434 208 ∼Louisiana 2,927 2,045 855 37
Oklahoma 2,494 2,166 149 52
Texas 11,742 10,060 1,287 2,027
West 40,096 34,343 1,713 4,488
Mountain 10,889 10,209 210 1,125
Arizona 3,102 2,888 62 352
Colorado 2,659 2,499 58 255
Idaho 744 733 ∼ 17
Montana 608 581 ∼ ∼Nevada 1,242 1,085 74 101
New Mexico 1,119 1,057 ∼ 325
Utah 1,097 1,070 ∼ 60
Wyoming 318 296 ∼ ∼Pacific 29,207 24,134 1,503
Alaska 311 226 ∼ ∼California 21,032 17,294 1,361 3,165
San Francisco-Oakland 2,868 2,061 279 213
San Jose-Monterey 1,332 1,097 19 163
Los Angeles 5,425 4,030 624 1,180
Hawaii 869 257 ∼ 33
Oregon 2,669 2,503 23 63
Washington 4,326 3,854 102 97
Seattle-Puget Sound 3,085 2,760 97 54
∗ Data are from all state and metropolitan area cancer registries, except Maryland. Included data cover approximately 98% of the population and met data quality
criteria for all invasive cancer sites combined. See Appendix B for registry-specific data quality information.† Invasive cancers only.‡ Data for specified racial or ethnic populations other than white and black should be interpreted with caution. See Technical Notes.
§ Hispanic origin is not mutually exclusive from race categories (white, black).
∼ Counts are suppressed if fewer than 16 cases were reported in a specific category (area, sex, race, ethnicity).
- Counts are suppressed at the state’s or metropolitan area’s request. See Technical Notes.
Notes: Cases from suppressed counts are included in region/division counts. Region/division counts are presented for regions/divisions with 100% of the
population covered by registries that meet the data quality criteria specified above unless the count for exactly one state in the region or division
is suppressed due to a count of less than 16. Michigan, Georgia, California, and Washington state counts each include cases from the SEER metropolitan
areas.

United
States Cancer Statistics: 2004 Incid
ence and M
ortality
E-��
continued
Table E.3.2: Breast. Cancer Death Counts by U.S. Census Region and Division, State, and Race and Ethnicity,United States,∗ 2004
Male Female
Area All Races White Black Hispanic†‡ All Races White Black Hispanic†‡
United States 40,954 34,458 5,541 1,909
Northeast 8,716 7,629 956 310
New England 2,140 2,051 71 33
Connecticut 553 511 32 ∼Maine 185 184 ∼ ∼Massachusetts 972 935 32 ∼New Hampshire 179 178 ∼ ∼Rhode Island 155 147 ∼ ∼Vermont 96 96 ∼ ∼
Middle Atlantic 6,576 5,578 885 277
New Jersey 1,376 1,150 198 55
New York 2,888 2,338 479 201
Pennsylvania 2,312 2,090 208 21
Midwest 9,566 8,385 1,082 88
East North Central 6,768 5,773 921 76
Illinois 1,830 1,438 356 43
Indiana 864 794 67 ∼Michigan 1,413 1,171 226 16
Ohio 1,888 1,631 247 ∼Wisconsin 773 739 25 ∼
West North Central 2,798 2,612 161 ∼Iowa 436 427 ∼ ∼Kansas 366 339 24 ∼Minnesota 656 630 21 ∼Missouri 898 796 96 ∼Nebraska 248 233 ∼ ∼North Dakota 88 87 ∼ ∼South Dakota 106 100 ∼ ∼
South 14,702 11,501 3,036 742
South Atlantic 8,094 6,275 1,737 321
Delaware 131 109 21 ∼District of Columbia 90 27 63 ∼Florida 2,754 2,401 334 273
Georgia 1,131 799 324 ∼Maryland 847 583 251 ∼North Carolina 1,226 908 303 ∼South Carolina 559 371 186 ∼Virginia 1,052 785 243 20
West Virginia 304 292 ∼ ∼East South Central 2,568 2,014 543 ∼Alabama 651 487 160 ∼Kentucky 587 534 52 ∼Mississippi 445 276 169 ∼Tennessee 885 717 162 ∼

Appendix E
E-�3
Table E.3.2: Breast. Cancer Death Counts by U.S. Census Region and Division, State, and Race and Ethnicity,United States,∗ 2004 (continued)
Male Female
Area All Races White Black Hispanic†‡ All Races White Black Hispanic†‡
West South Central 4,040 3,212 756 414
Arkansas 418 350 64 ∼Louisiana 685 411 267 ∼Oklahoma 464 391 39 ∼Texas 2,473 2,060 386 401
West 7,970 6,943 467 769
Mountain 2,315 2,187 52 203
Arizona 676 630 20 66
Colorado 509 486 ∼ 37
Idaho 160 156 ∼ ∼Montana 138 131 ∼ ∼Nevada 294 265 17 ∼New Mexico 247 236 ∼ 71
Utah 221 214 ∼ ∼Wyoming 70 69 ∼ ∼
Pacific 5,655 4,756 415 566
Alaska 45 28 ∼ ∼California 4,202 3,454 390 541
Hawaii 118 39 ∼ ∼Oregon 512 501 ∼ ∼Washington 778 734 17 ∼
∗ Data are from the National Vital Statistics System (NVSS).† Data for specified racial or ethnic populations other than white and black should be interpreted with caution. See Technical Notes.‡ Hispanic origin is not mutually exclusive from race categories (white, black).
∼ Counts are suppressed if fewer than 16 cases were reported in a specific category (area, sex, race, ethnicity).
Notes: Region/division counts are suppressed if the count for exactly one state in the region or division is suppressed due to a count of less than 16.

United
States Cancer Statistics: 2004 Incid
ence and M
ortality
E-��
continued
Table E.4.1: Breast, In Situ . Cancer Incidence Counts by U.S. Census Region and Division, State andMetropolitan Area, and Race and Ethnicity, United States,∗† 2004
Male Female
Area All Races White Black Hispanic‡§ All Races White Black Hispanic‡§
Northeast 11,221 9,634 946 558
New England 3,320 3,114 113 105
Connecticut 833 754 53 43
Maine 254 251 ∼ ∼Massachusetts 1,629 1,527 55 52
New Hampshire 263 260 ∼ ∼Rhode Island 233 214 ∼ ∼Vermont 108 108 ∼ ∼
Middle Atlantic 7,901 6,520 833
New Jersey 1,774 1,517 164 114
New York 3,788 2,921 460 314
Pennsylvania 2,339 2,082 209 -
Midwest 10,307 9,058 880 190
East North Central 7,369 6,340 763
Illinois 2,058 1,698 266 93
Indiana 855 767 70 ∼Michigan 1,691 1,449 195 22
Detroit 752 589 148 ∼Ohio 1,856 1,587 180 20
Wisconsin 909 839 52 16
West North Central 2,938 2,718 117 32
Iowa 475 461 ∼ ∼Kansas 421 387 ∼ ∼Minnesota 784 720 18 ∼Missouri 815 726 78 ∼Nebraska 259 251 ∼ ∼North Dakota 86 82 ∼ ∼South Dakota 98 91 ∼ ∼
South 14,110 11,538 2,107 807
South Atlantic 7,818 6,370 1,221 426
Delaware 171 143 20 ∼District of Columbia 110 38 63 ∼Florida 2,920 2,596 259 -
Georgia 1,276 937 307 21
Atlanta 499 321 156 ∼Maryland
North Carolina 1,213 972 210 ∼South Carolina 597 454 134 -
Virginia 1,240 947 223 25
West Virginia 291 283 ∼ ∼East South Central 2,304 1,888 388 ∼Alabama 672 511 159 ∼Kentucky 548 499 38 -
Mississippi 338 224 108 ∼Tennessee 746 654 83 ∼

Appendix E
E-��
Table E.4.1: Breast, In Situ . Cancer Incidence Counts by U.S. Census Region and Division, State andMetropolitan Area, and Race and Ethnicity, United States,∗† 2004 (continued)
Male Female
Area All Races White Black Hispanic‡§ All Races White Black Hispanic‡§
West South Central 3,988 3,280 498 375
Arkansas 337 287 40 ∼Louisiana 579 426 148 ∼Oklahoma 536 465 26 ∼Texas 2,536 2,102 284 360
West 9,267 7,775 370 929
Mountain 2,501 2,328 41 226
Arizona 631 593 ∼ 69
Colorado 728 656 ∼ 59
Idaho 188 186 ∼ ∼Montana 168 157 ∼ ∼Nevada 237 209 ∼ 19
New Mexico 249 238 ∼ 70
Utah 227 221 ∼ ∼Wyoming 73 68 ∼ ∼
Pacific 6,766 5,447 329 703
Alaska 100 81 ∼ ∼California 4,754 3,810 302 661
San Francisco-Oakland 710 493 60 47
San Jose-Monterey 355 259 ∼ 35
Los Angeles 1,130 824 146 222
Hawaii 245 59 ∼ ∼Oregon 554 516 ∼ ∼Washington 1,113 981 17 19
Seattle-Puget Sound 848 753 17 17
∗ Data are from all state and metropolitan area cancer registries, except Maryland. Included data cover approximately 98% of the population and met data quality
criteria for all invasive cancer sites combined. See Appendix B for registry-specific data quality information.† In situ cancers only.‡ Data for specified racial or ethnic populations other than white and black should be interpreted with caution. See Technical Notes.
§ Hispanic origin is not mutually exclusive from race categories (white, black).
∼ Counts are suppressed if fewer than 16 cases were reported in a specific category (area, sex, race, ethnicity).
- Counts are suppressed at the state’s or metropolitan area’s request. See Technical Notes.
Notes: Cases from suppressed counts are included in region/division counts. Region/division counts are presented for regions/divisions with 100% of the
population covered by registries that meet the data quality criteria specified above unless the count for exactly one state in the region or division
is suppressed due to a count of less than 16. Michigan, Georgia, California, and Washington state counts each include cases from the SEER metropolitan
areas.

United
States Cancer Statistics: 2004 Incid
ence and M
ortality
E-��
continued
Table E.5.1: Cervix Uteri. Invasive Cancer Incidence Counts by U.S. Census Region and Division, State andMetropolitan Area, and Race and Ethnicity, United States,∗† 2004
Male Female
Area All Races White Black Hispanic‡§ All Races White Black Hispanic‡§
Northeast 2,399 1,812 422 300
New England 576 499 48 44
Connecticut 138 112 21 19
Maine 66 63 ∼ ∼Massachusetts 250 216 21 17
New Hampshire 35 35 ∼ ∼Rhode Island 63 49 ∼ ∼Vermont 24 24 ∼ ∼
Middle Atlantic 1,823 1,313 374
New Jersey 446 335 90 85
New York 852 547 211 146
Pennsylvania 525 431 73 -
Midwest 2,541 2,048 361 132
East North Central 1,809 1,425 296 102
Illinois 555 405 117 72
Indiana 251 224 21 ∼Michigan 355 260 79 ∼
Detroit 170 98 68 ∼Ohio 452 377 50 ∼Wisconsin 196 159 29 ∼
West North Central 732 623 65 30
Iowa 96 90 ∼ ∼Kansas 102 94 ∼ ∼Minnesota 167 137 ∼ ∼Missouri 260 209 45 ∼Nebraska 62 55 ∼ ∼North Dakota 19 17 ∼ ∼South Dakota 26 21 ∼ ∼
South 4,491 3,333 982 685
South Atlantic 2,164 1,567 508 266
Delaware 37 29 ∼ ∼District of Columbia 40 ∼ 25 ∼Florida 827 678 130 -
Georgia 363 228 125 23
Atlanta 128 67 55 ∼Maryland
North Carolina 375 260 98 26
South Carolina 176 96 71 -
Virginia 253 183 47 22
West Virginia 93 85 ∼ ∼East South Central 811 570 216 ∼Alabama 194 112 73 ∼Kentucky 214 191 21 -
Mississippi 137 66 66 ∼Tennessee 266 201 56 ∼

Appendix E
E-��
Table E.5.1: Cervix Uteri. Invasive Cancer Incidence Counts by U.S. Census Region and Division, State andMetropolitan Area, and Race and Ethnicity, United States,∗† 2004 (continued)
Male Female
Area All Races White Black Hispanic‡§ All Races White Black Hispanic‡§
West South Central 1,516 1,196 410
Arkansas 138 113 24 ∼Louisiana 215 121 93 ∼Oklahoma 143 118 ∼ ∼Texas 1,020 844 134 395
West 2,461 2,014 101 722
Mountain 657 593 ∼ 160
Arizona 183 161 ∼ 52
Colorado 137 122 ∼ 30
Idaho 39 39 ∼ ∼Montana 31 26 ∼ ∼Nevada 92 83 ∼ 19
New Mexico 90 83 ∼ 45
Utah 63 60 ∼ ∼Wyoming 22 19 ∼ ∼
Pacific 1,804 1,421 92 562
Alaska 20 ∼ ∼ ∼California 1,423 1,124 85 531
San Francisco-Oakland 131 89 ∼ 25
San Jose-Monterey 94 70 ∼ 29
Los Angeles 469 363 35 237
Hawaii 43 ∼ ∼ ∼Oregon 102 90 ∼ ∼Washington 216 181 ∼ ∼
Seattle-Puget Sound 154 129 ∼ ∼∗ Data are from all state and metropolitan area cancer registries, except Maryland. Included data cover approximately 98% of the population and met data quality
criteria for all invasive cancer sites combined. See Appendix B for registry-specific data quality information.† Invasive cancers only.‡ Data for specified racial or ethnic populations other than white and black should be interpreted with caution. See Technical Notes.
§ Hispanic origin is not mutually exclusive from race categories (white, black).
∼ Counts are suppressed if fewer than 16 cases were reported in a specific category (area, sex, race, ethnicity).
- Counts are suppressed at the state’s or metropolitan area’s request. See Technical Notes.
Notes: Cases from suppressed counts are included in region/division counts. Region/division counts are presented for regions/divisions with 100% of the
population covered by registries that meet the data quality criteria specified above unless the count for exactly one state in the region or division
is suppressed due to a count of less than 16. Michigan, Georgia, California, and Washington state counts each include cases from the SEER metropolitan
areas.

United
States Cancer Statistics: 2004 Incid
ence and M
ortality
E-��
continued
Table E.5.2: Cervix Uteri. Cancer Death Counts by U.S. Census Region and Division, State, and Race andEthnicity, United States,∗ 2004
Male Female
Area All Races White Black Hispanic†‡ All Races White Black Hispanic†‡
United States 3,850 2,899 789 430
Northeast 729 575 143 68
New England 159 151 ∼ ∼Connecticut 37 35 ∼ ∼Maine 17 17 ∼ ∼Massachusetts 64 58 ∼ ∼New Hampshire 17 17 ∼ ∼Rhode Island ∼ ∼ ∼ ∼Vermont ∼ ∼ ∼ ∼
Middle Atlantic 570 424 135 56
New Jersey 131 96 32 ∼New York 270 199 66 39
Pennsylvania 169 129 37 ∼Midwest 845 693 132 27
East North Central 611 488 116 23
Illinois 196 139 56 ∼Indiana 86 77 ∼ ∼Michigan 118 90 28 ∼Ohio 148 132 ∼ ∼Wisconsin 63 50 ∼ ∼
West North Central 234 205 16 ∼Iowa 36 35 ∼ ∼Kansas 27 24 ∼ ∼Minnesota 52 49 ∼ ∼Missouri 85 68 ∼ ∼Nebraska 23 21 ∼ ∼North Dakota ∼ ∼ ∼ ∼South Dakota ∼ ∼ ∼ ∼
South 1,557 1,057 468 142
South Atlantic 745 489 241 29
Delaware ∼ ∼ ∼ ∼District of Columbia ∼ ∼ ∼ ∼Florida 251 195 52 21
Georgia 125 66 58 ∼Maryland 77 46 30 ∼North Carolina 111 70 38 ∼South Carolina 54 23 28 ∼Virginia 76 50 24 ∼West Virginia 33 32 ∼ ∼
East South Central 274 170 ∼Alabama 76 43 33 ∼Kentucky 45 37 ∼ ∼Mississippi 56 21 35 ∼Tennessee 97 69 27 ∼

Appendix E
E-��
Table E.5.2: Cervix Uteri. Cancer Death Counts by U.S. Census Region and Division, State, and Race andEthnicity, United States,∗ 2004 (continued)
Male Female
Area All Races White Black Hispanic†‡ All Races White Black Hispanic†‡
West South Central 538 398 124 110
Arkansas 56 43 ∼ ∼Louisiana 69 27 41 ∼Oklahoma 46 36 ∼ ∼Texas 367 292 66 109
West 719 574 46 193
Mountain 198 179 ∼ 52
Arizona 65 58 ∼ 24
Colorado 36 32 ∼ ∼Idaho ∼ ∼ ∼ ∼Montana ∼ ∼ ∼ ∼Nevada 33 30 ∼ ∼New Mexico 27 25 ∼ ∼Utah ∼ ∼ ∼ ∼Wyoming ∼ ∼ ∼ ∼
Pacific 521 395 39 141
Alaska ∼ ∼ ∼ ∼California 415 312 38 139
Hawaii ∼ ∼ ∼ ∼Oregon 29 25 ∼ ∼Washington 57 49 ∼ ∼
∗ Data are from the National Vital Statistics System (NVSS).† Data for specified racial or ethnic populations other than white and black should be interpreted with caution. See Technical Notes.‡ Hispanic origin is not mutually exclusive from race categories (white, black).
∼ Counts are suppressed if fewer than 16 cases were reported in a specific category (area, sex, race, ethnicity).
Notes: Region/division counts are suppressed if the count for exactly one state in the region or division is suppressed due to a count of less than 16.

United
States Cancer Statistics: 2004 Incid
ence and M
ortality
E-�0
continued
Table E.6.1: Colon and Rectum. Invasive Cancer Incidence Counts by U.S. Census Region and Division, Stateand Metropolitan Area, Sex, and Race and Ethnicity, United States,∗† 2004
Male Female
Area All Races White Black Hispanic‡§ All Races White Black Hispanic‡§
Northeast 15,773 13,905 1,305 838 16,318 14,252 1,532 784
New England 4,165 3,935 140 109 4,206 3,959 145 110
Connecticut 1,011 917 74 55 1,054 960 66 52
Maine 432 424 ∼ ∼ 443 434 ∼ ∼Massachusetts 1,885 1,773 54 36 1,908 1,791 63 45
New Hampshire 349 344 ∼ ∼ 322 315 ∼ ∼Rhode Island 335 325 ∼ ∼ 327 308 ∼ ∼Vermont 153 152 ∼ ∼ 152 151 ∼ ∼
Middle Atlantic 11,608 9,970 1,165 12,112 10,293 1,387
New Jersey 2,480 2,120 257 211 2,465 2,102 277 162
New York 5,113 4,190 621 464 5,512 4,455 782 470
Pennsylvania 4,015 3,660 287 - 4,135 3,736 328 -
Midwest 17,856 15,752 1,463 289 17,304 15,235 1,554 233
East North Central 12,278 10,531 1,257 255 12,006 10,302 1,321
Illinois 3,538 2,947 459 156 3,523 2,914 511 118
Indiana 1,626 1,486 110 26 1,552 1,418 119 ∼Michigan 2,509 2,116 333 25 2,395 2,019 328 27
Detroit 1,051 773 261 19 1,021 739 267 ∼Ohio 3,260 2,712 300 30 3,137 2,640 302 22
Wisconsin 1,345 1,270 55 18 1,399 1,311 61 18
West North Central 5,578 5,221 206 34 5,298 4,933 233 38
Iowa 957 939 ∼ ∼ 958 945 ∼ ∼Kansas 780 717 41 ∼ 696 640 30 ∼Minnesota 1,325 1,224 19 ∼ 1,277 1,197 16 ∼Missouri 1,550 1,409 124 ∼ 1,513 1,336 166 16
Nebraska 512 493 ∼ ∼ 483 457 ∼ ∼North Dakota 219 212 ∼ ∼ 174 168 ∼ ∼South Dakota 235 227 ∼ ∼ 197 190 ∼ ∼
South 26,193 21,684 3,967 1,842 24,222 19,486 4,228 1,470
South Atlantic 13,544 11,140 2,155 811 12,731 10,135 2,345 743
Delaware 232 188 35 ∼ 198 157 33 ∼District of Columbia 129 28 94 ∼ 152 32 117 ∼Florida 5,602 5,010 506 - 5,084 4,466 517 -
Georgia 1,949 1,431 476 36 1,877 1,274 573 26
Atlanta 516 343 149 16 521 299 207 ∼Maryland
North Carolina 2,004 1,589 385 24 1,985 1,499 448 22
South Carolina 1,176 863 297 - 1,074 774 287 -
Virginia 1,787 1,378 350 19 1,752 1,348 349 26
West Virginia 665 653 ∼ ∼ 609 585 21 ∼East South Central 4,842 4,025 771 21 4,589 3,672 870 24
Alabama 1,291 986 290 ∼ 1,151 844 301 ∼Kentucky 1,249 1,173 68 - 1,222 1,122 82 -
Mississippi 795 553 232 ∼ 774 500 264 ∼Tennessee 1,507 1,313 181 ∼ 1,442 1,206 223 ∼

Appendix E
E-��
Table E.6.1: Colon and Rectum. Invasive Cancer Incidence Counts by U.S. Census Region and Division, Stateand Metropolitan Area, Sex, and Race and Ethnicity, United States,∗† 2004 (continued)
Male Female
Area All Races White Black Hispanic‡§ All Races White Black Hispanic‡§
West South Central 7,807 6,519 1,041 1,010 6,902 5,679 1,013 703
Arkansas 787 688 92 ∼ 719 621 87 ∼Louisiana 1,217 890 320 17 1,132 807 319 ∼Oklahoma 935 809 52 ∼ 906 760 62 16
Texas 4,868 4,132 577 977 4,145 3,491 545 670
West 14,175 12,028 674 1,654 13,242 11,117 678 1,396
Mountain 4,147 3,905 95 468 3,759 3,502 109 359
Arizona 1,206 1,136 22 144 1,069 992 34 92
Colorado 921 865 28 108 934 876 36 101
Idaho 299 294 ∼ ∼ 283 281 ∼ ∼Montana 236 228 ∼ ∼ 216 207 ∼ ∼Nevada 532 475 35 43 503 442 33 37
New Mexico 437 408 ∼ 136 360 326 ∼ 104
Utah 386 381 ∼ 21 283 277 ∼ ∼Wyoming 130 118 ∼ ∼ 111 101 ∼ ∼
Pacific 10,028 8,123 579 1,186 9,483 7,615 569 1,037
Alaska 127 91 ∼ ∼ 107 56 ∼ ∼California 7,154 5,762 520 1,128 6,868 5,505 519 977
San Francisco-Oakland 960 664 100 85 967 647 106 71
San Jose-Monterey 427 316 ∼ 69 408 333 ∼ 54
Los Angeles 1,841 1,321 242 381 1,852 1,319 266 357
Hawaii 373 92 ∼ ∼ 346 94 ∼ ∼Oregon 949 894 ∼ 20 831 769 ∼ 23
Washington 1,425 1,284 40 27 1,331 1,191 38 27
Seattle-Puget Sound 973 882 38 ∼ 932 821 38 18
∗ Data are from all state and metropolitan area cancer registries, except Maryland. Included data cover approximately 98% of the population and met data quality
criteria for all invasive cancer sites combined. See Appendix B for registry-specific data quality information.† Invasive cancers only.‡ Data for specified racial or ethnic populations other than white and black should be interpreted with caution. See Technical Notes.
§ Hispanic origin is not mutually exclusive from race categories (white, black).
∼ Counts are suppressed if fewer than 16 cases were reported in a specific category (area, sex, race, ethnicity).
- Counts are suppressed at the state’s or metropolitan area’s request. See Technical Notes.
Notes: Cases from suppressed counts are included in region/division counts. Region/division counts are presented for regions/divisions with 100% of the
population covered by registries that meet the data quality criteria specified above unless the count for exactly one state in the region or division
is suppressed due to a count of less than 16. Michigan, Georgia, California, and Washington state counts each include cases from the SEER metropolitan
areas.

United
States Cancer Statistics: 2004 Incid
ence and M
ortality
E-��
continued
Table E.6.2: Colon and Rectum. Cancer Death Counts by U.S. Census Region and Division, State, Sex, andRace and Ethnicity, United States,∗ 2004
Male Female
Area All Races White Black Hispanic†‡ All Races White Black Hispanic†‡
United States 26,881 23,004 3,194 1,333 26,699 22,658 3,426 1,108
Northeast 5,473 4,852 532 210 5,936 5,273 585 199
New England 1,343 1,280 53 26 1,475 1,413 51 ∼Connecticut 326 296 27 ∼ 348 315 30 ∼Maine 116 114 ∼ ∼ 163 160 ∼ ∼Massachusetts 609 581 21 ∼ 680 657 19 ∼New Hampshire 121 121 ∼ ∼ 102 101 ∼ ∼Rhode Island 108 105 ∼ ∼ 120 118 ∼ ∼Vermont 63 63 ∼ ∼ 62 62 ∼ ∼
Middle Atlantic 4,130 3,572 479 4,461 3,860 534
New Jersey 862 737 102 39 924 809 105 33
New York 1,824 1,512 261 134 1,972 1,624 296 140
Pennsylvania 1,444 1,323 116 ∼ 1,565 1,427 133 ∼Midwest 6,443 5,751 639 66 6,537 5,854 644 59
East North Central 4,550 3,964 556 53 4,559 3,990 43
Illinois 1,235 1,021 203 28 1,277 1,053 216 19
Indiana 628 579 47 ∼ 630 570 56 ∼Michigan 930 790 131 ∼ 924 792 124 ∼Ohio 1,259 1,101 154 ∼ 1,220 1,083 133 ∼Wisconsin 498 473 21 ∼ 508 492 ∼ ∼
West North Central 1,893 1,787 83 ∼ 1,978 1,864 104 16
Iowa 335 330 ∼ ∼ 336 334 ∼ ∼Kansas 263 250 ∼ ∼ 271 250 20 ∼Minnesota 373 359 ∼ ∼ 425 413 ∼ ∼Missouri 614 556 56 ∼ 606 532 72 ∼Nebraska 172 162 ∼ ∼ 193 188 ∼ ∼North Dakota 64 63 ∼ ∼ 65 65 ∼ ∼South Dakota 72 67 ∼ ∼ 82 82 ∼ ∼
South 9,856 8,009 1,743 543 9,433 7,434 1,905 438
South Atlantic 5,252 4,205 1,000 219 5,073 3,935 1,097 188
Delaware 82 66 ∼ ∼ 77 64 ∼ ∼District of Columbia 47 ∼ 38 ∼ 63 ∼ 53 ∼Florida 1,907 1,686 213 200 1,801 1,585 205 175
Georgia 651 462 182 ∼ 654 431 222 ∼Maryland 509 369 131 ∼ 504 349 145 ∼North Carolina 747 585 152 ∼ 770 565 195 ∼South Carolina 375 260 115 ∼ 365 260 105 ∼Virginia 682 524 147 ∼ 603 448 146 ∼West Virginia 252 245 ∼ ∼ 236 223 ∼ ∼
East South Central 1,751 1,404 341 ∼ 1,764 1,369 387 ∼Alabama 480 344 135 ∼ 428 296 131 ∼Kentucky 399 372 26 ∼ 455 420 34 ∼Mississippi 299 203 94 ∼ 293 173 115 ∼Tennessee 573 485 86 ∼ 588 480 107 ∼

Appendix E
E-�3
Table E.6.2: Colon and Rectum. Cancer Death Counts by U.S. Census Region and Division, State, Sex, andRace and Ethnicity, United States,∗ 2004 (continued)
Male Female
Area All Races White Black Hispanic†‡ All Races White Black Hispanic†‡
West South Central 2,853 2,400 402 319 2,596 2,130 421 243
Arkansas 324 288 36 ∼ 293 245 48 ∼Louisiana 468 330 130 ∼ 454 305 149 ∼Oklahoma 373 319 32 ∼ 338 297 22 ∼Texas 1,688 1,463 204 310 1,511 1,283 202 238
West 5,109 4,392 280 514 4,793 292 412
Mountain 1,567 1,472 55 181 1,345 1,274 32 126
Arizona 471 440 19 37 404 386 ∼ 36
Colorado 339 324 ∼ 53 311 296 ∼ 30
Idaho 99 98 ∼ ∼ 96 95 ∼ ∼Montana 79 76 ∼ ∼ 69 68 ∼ ∼Nevada 230 202 24 ∼ 207 182 ∼ ∼New Mexico 184 168 ∼ 70 125 117 ∼ 38
Utah 117 117 ∼ ∼ 96 93 ∼ ∼Wyoming 48 47 ∼ ∼ 37 37 ∼ ∼
Pacific 3,542 2,920 225 333 3,448 260 286
Alaska 35 28 ∼ ∼ 24 ∼ ∼ ∼California 2,577 2,101 206 313 2,543 2,042 243 273
Hawaii 116 26 ∼ ∼ 79 20 ∼ ∼Oregon 330 312 ∼ ∼ 306 301 ∼ ∼Washington 484 453 ∼ ∼ 496 447 ∼ ∼
∗ Data are from the National Vital Statistics System (NVSS).† Data for specified racial or ethnic populations other than white and black should be interpreted with caution. See Technical Notes.‡ Hispanic origin is not mutually exclusive from race categories (white, black).
∼ Counts are suppressed if fewer than 16 cases were reported in a specific category (area, sex, race, ethnicity).
Notes: Region/division counts are suppressed if the count for exactly one state in the region or division is suppressed due to a count of less than 16.
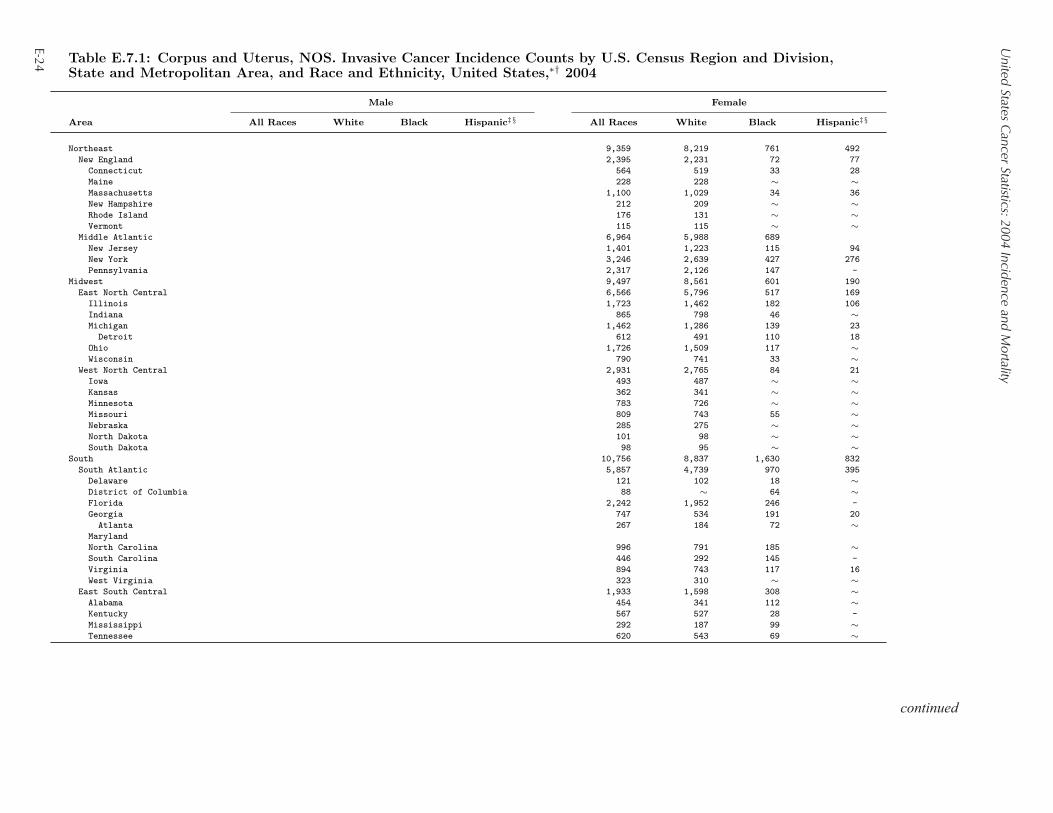
United
States Cancer Statistics: 2004 Incid
ence and M
ortality
E-��
continued
Table E.7.1: Corpus and Uterus, NOS. Invasive Cancer Incidence Counts by U.S. Census Region and Division,State and Metropolitan Area, and Race and Ethnicity, United States,∗† 2004
Male Female
Area All Races White Black Hispanic‡§ All Races White Black Hispanic‡§
Northeast 9,359 8,219 761 492
New England 2,395 2,231 72 77
Connecticut 564 519 33 28
Maine 228 228 ∼ ∼Massachusetts 1,100 1,029 34 36
New Hampshire 212 209 ∼ ∼Rhode Island 176 131 ∼ ∼Vermont 115 115 ∼ ∼
Middle Atlantic 6,964 5,988 689
New Jersey 1,401 1,223 115 94
New York 3,246 2,639 427 276
Pennsylvania 2,317 2,126 147 -
Midwest 9,497 8,561 601 190
East North Central 6,566 5,796 517 169
Illinois 1,723 1,462 182 106
Indiana 865 798 46 ∼Michigan 1,462 1,286 139 23
Detroit 612 491 110 18
Ohio 1,726 1,509 117 ∼Wisconsin 790 741 33 ∼
West North Central 2,931 2,765 84 21
Iowa 493 487 ∼ ∼Kansas 362 341 ∼ ∼Minnesota 783 726 ∼ ∼Missouri 809 743 55 ∼Nebraska 285 275 ∼ ∼North Dakota 101 98 ∼ ∼South Dakota 98 95 ∼ ∼
South 10,756 8,837 1,630 832
South Atlantic 5,857 4,739 970 395
Delaware 121 102 18 ∼District of Columbia 88 ∼ 64 ∼Florida 2,242 1,952 246 -
Georgia 747 534 191 20
Atlanta 267 184 72 ∼Maryland
North Carolina 996 791 185 ∼South Carolina 446 292 145 -
Virginia 894 743 117 16
West Virginia 323 310 ∼ ∼East South Central 1,933 1,598 308 ∼Alabama 454 341 112 ∼Kentucky 567 527 28 -
Mississippi 292 187 99 ∼Tennessee 620 543 69 ∼

Appendix E
E-��
Table E.7.1: Corpus and Uterus, NOS. Invasive Cancer Incidence Counts by U.S. Census Region and Division,State and Metropolitan Area, and Race and Ethnicity, United States,∗† 2004 (continued)
Male Female
Area All Races White Black Hispanic‡§ All Races White Black Hispanic‡§
West South Central 2,966 2,500 352 428
Arkansas 261 226 28 ∼Louisiana 414 294 117 ∼Oklahoma 368 314 18 ∼Texas 1,923 1,666 189 413
West 7,369 6,282 272 891
Mountain 1,989 1,860 32 199
Arizona 567 517 ∼ 56
Colorado 461 431 ∼ 38
Idaho 156 153 ∼ ∼Montana 132 125 ∼ ∼Nevada 216 197 ∼ 16
New Mexico 201 187 ∼ 68
Utah 210 206 ∼ ∼Wyoming 46 44 ∼ ∼
Pacific 5,380 4,422 240 692
Alaska 62 54 ∼ ∼California 3,767 3,096 222 655
San Francisco-Oakland 547 395 39 44
San Jose-Monterey 233 195 ∼ 30
Los Angeles 1,026 781 105 276
Hawaii 194 39 ∼ ∼Oregon 515 480 ∼ ∼Washington 842 753 ∼ 18
Seattle-Puget Sound 572 522 ∼ ∼∗ Data are from all state and metropolitan area cancer registries, except Maryland. Included data cover approximately 98% of the population and met data quality
criteria for all invasive cancer sites combined. See Appendix B for registry-specific data quality information.† Invasive cancers only.‡ Data for specified racial or ethnic populations other than white and black should be interpreted with caution. See Technical Notes.
§ Hispanic origin is not mutually exclusive from race categories (white, black).
∼ Counts are suppressed if fewer than 16 cases were reported in a specific category (area, sex, race, ethnicity).
- Counts are suppressed at the state’s or metropolitan area’s request. See Technical Notes.
Notes: Cases from suppressed counts are included in region/division counts. Region/division counts are presented for regions/divisions with 100% of the
population covered by registries that meet the data quality criteria specified above unless the count for exactly one state in the region or division
is suppressed due to a count of less than 16. Michigan, Georgia, California, and Washington state counts each include cases from the SEER metropolitan
areas.

United
States Cancer Statistics: 2004 Incid
ence and M
ortality
E-��
continued
Table E.7.2: Corpus and Uterus, NOS. Cancer Death Counts by U.S. Census Region and Division, State, andRace and Ethnicity, United States,∗ 2004
Male Female
Area All Races White Black Hispanic†‡ All Races White Black Hispanic†‡
United States 6,990 5,713 1,114 325
Northeast 1,658 1,415 227 59
New England 412 391 19 ∼Connecticut 108 98 ∼ ∼Maine 43 43 ∼ ∼Massachusetts 173 166 ∼ ∼New Hampshire 31 31 ∼ ∼Rhode Island 34 30 ∼ ∼Vermont 23 23 ∼ ∼
Middle Atlantic 1,246 1,024 208 53
New Jersey 263 222 36 ∼New York 560 426 127 35
Pennsylvania 423 376 45 ∼Midwest 1,767 1,536 214 24
East North Central 1,221 1,024 186 19
Illinois 317 237 75 ∼Indiana 183 168 ∼ ∼Michigan 266 221 41 ∼Ohio 329 286 42 ∼Wisconsin 126 112 ∼ ∼
West North Central 546 512 28 ∼Iowa 89 88 ∼ ∼Kansas 67 66 ∼ ∼Minnesota 135 130 ∼ ∼Missouri 156 130 24 ∼Nebraska 59 59 ∼ ∼North Dakota 21 21 ∼ ∼South Dakota 19 18 ∼ ∼
South 2,299 1,694 578 122
South Atlantic 1,322 943 365 50
Delaware 28 20 ∼ ∼District of Columbia 19 ∼ 16 ∼Florida 424 340 82 41
Georgia 161 102 57 ∼Maryland 148 90 55 ∼North Carolina 194 142 51 ∼South Carolina 113 58 53 ∼Virginia 173 127 43 ∼West Virginia 62 62 ∼ ∼
East South Central 369 275 ∼Alabama 102 72 30 ∼Kentucky 84 81 ∼ ∼Mississippi 65 33 32 ∼Tennessee 118 89 27 ∼

Appendix E
E-��
Table E.7.2: Corpus and Uterus, NOS. Cancer Death Counts by U.S. Census Region and Division, State, andRace and Ethnicity, United States,∗ 2004 (continued)
Male Female
Area All Races White Black Hispanic†‡ All Races White Black Hispanic†‡
West South Central 608 476 121 71
Arkansas 61 49 ∼ ∼Louisiana 94 48 46 ∼Oklahoma 86 78 ∼ ∼Texas 367 301 58 69
West 1,266 1,068 95 120
Mountain ∼ 25
Arizona 100 87 ∼ ∼Colorado 67 61 ∼ ∼Idaho 19 18 ∼ ∼Montana 29 28 ∼ ∼Nevada 26 24 ∼ ∼New Mexico 37 35 ∼ ∼Utah 38 37 ∼ ∼Wyoming ∼ ∼ ∼ ∼
Pacific 771 82 95
Alaska ∼ ∼ ∼ ∼California 684 549 75 89
Hawaii 27 ∼ ∼ ∼Oregon 78 76 ∼ ∼Washington 147 136 ∼ ∼
∗ Data are from the National Vital Statistics System (NVSS).† Data for specified racial or ethnic populations other than white and black should be interpreted with caution. See Technical Notes.‡ Hispanic origin is not mutually exclusive from race categories (white, black).
∼ Counts are suppressed if fewer than 16 cases were reported in a specific category (area, sex, race, ethnicity).
Notes: Region/division counts are suppressed if the count for exactly one state in the region or division is suppressed due to a count of less than 16.

United
States Cancer Statistics: 2004 Incid
ence and M
ortality
E-��
continued
Table E.8.1: Esophagus. Invasive Cancer Incidence Counts by U.S. Census Region and Division, State andMetropolitan Area, Sex, and Race and Ethnicity, United States,∗† 2004
Male Female
Area All Races White Black Hispanic‡§ All Races White Black Hispanic‡§
Northeast 2,539 2,261 216 115 647 109 41
New England 777 736 30 ∼ 202 ∼ ∼Connecticut 178 158 18 ∼ 54 50 ∼ ∼Maine 95 94 ∼ ∼ 16 ∼ ∼ ∼Massachusetts 367 349 ∼ ∼ 91 88 ∼ ∼New Hampshire 61 60 ∼ ∼ 31 30 ∼ ∼Rhode Island 53 52 ∼ ∼ 17 ∼ ∼ ∼Vermont 23 23 ∼ ∼ ∼ ∼ ∼ ∼
Middle Atlantic 1,762 1,525 186 563 445 100 36
New Jersey 368 310 45 28 108 85 17 ∼New York 749 614 104 68 277 208 61 20
Pennsylvania 645 601 37 - 178 152 22 -
Midwest 2,861 2,553 222 34 844 703 115 ∼East North Central 2,041 1,787 29 616 499 94 ∼Illinois 514 438 67 ∼ 173 129 40 ∼Indiana 250 235 ∼ ∼ 63 56 ∼ ∼Michigan 460 400 52 ∼ 150 126 22 ∼
Detroit 166 127 37 ∼ 69 48 21 ∼Ohio 549 468 43 ∼ 152 115 23 ∼Wisconsin 268 246 16 ∼ 78 73 ∼ ∼
West North Central 820 766 33 ∼ 228 204 21 ∼Iowa 142 138 ∼ ∼ 38 38 ∼ ∼Kansas 74 70 ∼ ∼ 22 19 ∼ ∼Minnesota 204 192 ∼ ∼ 67 64 ∼ ∼Missouri 261 235 24 ∼ 70 56 ∼ ∼Nebraska 79 76 ∼ ∼ ∼ ∼ ∼ ∼North Dakota 20 18 ∼ ∼ ∼ ∼ ∼ ∼South Dakota 40 37 ∼ ∼ ∼ ∼ ∼ ∼
South 3,747 3,015 667 159 1,101 849 234 51
South Atlantic 2,044 1,625 390 53 614 457 146 ∼Delaware 41 37 ∼ ∼ 17 ∼ ∼ ∼District of Columbia 33 ∼ 28 ∼ ∼ ∼ ∼ ∼Florida 831 743 78 - 236 198 33 -
Georgia 293 197 93 ∼ 92 54 37 ∼Atlanta 72 50 20 ∼ 38 21 16 ∼
Maryland
North Carolina 314 243 65 ∼ 95 72 21 ∼South Carolina 185 114 70 - 43 23 20 -
Virginia 267 212 49 ∼ 90 67 21 ∼West Virginia 80 76 ∼ ∼ 28 27 ∼ ∼
East South Central 699 542 ∼ 184 140 42 ∼Alabama 187 132 49 ∼ 41 31 ∼ ∼Kentucky 171 161 ∼ - 57 52 ∼ -
Mississippi 132 75 53 ∼ 31 17 ∼ ∼Tennessee 209 174 32 ∼ 55 40 ∼ ∼

Appendix E
E-��
Table E.8.1: Esophagus. Invasive Cancer Incidence Counts by U.S. Census Region and Division, State andMetropolitan Area, Sex, and Race and Ethnicity, United States,∗† 2004 (continued)
Male Female
Area All Races White Black Hispanic‡§ All Races White Black Hispanic‡§
West South Central 1,004 848 135 102 303 252 46 36
Arkansas 91 75 ∼ ∼ 32 29 ∼ ∼Louisiana 167 114 52 ∼ 50 34 16 ∼Oklahoma 127 114 ∼ ∼ 41 34 ∼ ∼Texas 619 545 59 99 180 155 22 34
West 2,185 69 200 622 531 34 49
Mountain 689 653 ∼ 50 158 144 ∼ ∼Arizona 205 194 ∼ 16 48 45 ∼ ∼Colorado 149 140 ∼ ∼ 35 30 ∼ ∼Idaho 51 51 ∼ ∼ ∼ ∼ ∼ ∼Montana 37 36 ∼ ∼ ∼ ∼ ∼ ∼Nevada 88 78 ∼ ∼ 19 16 ∼ ∼New Mexico 83 80 ∼ 19 24 23 ∼ ∼Utah 50 49 ∼ ∼ ∼ ∼ ∼ ∼Wyoming 26 25 ∼ ∼ ∼ ∼ ∼ ∼
Pacific 1,496 56 150 464 387 29 37
Alaska 19 ∼ ∼ ∼ ∼ ∼ ∼ ∼California 1,005 869 51 138 320 268 25 37
San Francisco-Oakland 132 103 ∼ ∼ 48 38 ∼ ∼San Jose-Monterey 52 46 ∼ ∼ 23 16 ∼ ∼Los Angeles 241 188 25 49 93 70 ∼ 16
Hawaii 51 17 ∼ ∼ ∼ ∼ ∼ ∼Oregon 160 151 ∼ ∼ 44 42 ∼ ∼Washington 261 242 ∼ ∼ 78 74 ∼ ∼
Seattle-Puget Sound 177 165 ∼ ∼ 63 59 ∼ ∼∗ Data are from all state and metropolitan area cancer registries, except Maryland. Included data cover approximately 98% of the population and met data quality
criteria for all invasive cancer sites combined. See Appendix B for registry-specific data quality information.† Invasive cancers only.‡ Data for specified racial or ethnic populations other than white and black should be interpreted with caution. See Technical Notes.
§ Hispanic origin is not mutually exclusive from race categories (white, black).
∼ Counts are suppressed if fewer than 16 cases were reported in a specific category (area, sex, race, ethnicity).
- Counts are suppressed at the state’s or metropolitan area’s request. See Technical Notes.
Notes: Cases from suppressed counts are included in region/division counts. Region/division counts are presented for regions/divisions with 100% of the
population covered by registries that meet the data quality criteria specified above unless the count for exactly one state in the region or division
is suppressed due to a count of less than 16. Michigan, Georgia, California, and Washington state counts each include cases from the SEER metropolitan
areas.

United
States Cancer Statistics: 2004 Incid
ence and M
ortality
E-30
continued
Table E.8.2: Esophagus. Cancer Death Counts by U.S. Census Region and Division, State, Sex, and Race andEthnicity, United States,∗ 2004
Male Female
Area All Races White Black Hispanic†‡ All Races White Black Hispanic†‡
United States 10,081 8,831 1,060 346 2,942 2,420 467 94
Northeast 2,113 1,901 184 62 96 22
New England 583 555 23 ∼ ∼ ∼Connecticut 124 114 ∼ ∼ 38 36 ∼ ∼Maine 75 73 ∼ ∼ 17 17 ∼ ∼Massachusetts 270 255 ∼ ∼ 84 76 ∼ ∼New Hampshire 49 49 ∼ ∼ 21 20 ∼ ∼Rhode Island 47 46 ∼ ∼ 18 17 ∼ ∼Vermont 18 18 ∼ ∼ ∼ ∼ ∼ ∼
Middle Atlantic 1,530 1,346 161 54 512 423 21
New Jersey 277 240 34 ∼ 102 90 ∼ ∼New York 674 568 88 38 235 180 54 ∼Pennsylvania 579 538 39 ∼ 175 153 22 ∼
Midwest 2,518 2,312 188 20 694 593 91 ∼East North Central 1,773 1,605 18 520 441 74 ∼
Illinois 425 368 57 ∼ 136 102 32 ∼Indiana 227 215 ∼ ∼ 71 65 ∼ ∼Michigan 396 355 34 ∼ 100 86 ∼ ∼Ohio 477 439 38 ∼ 152 131 20 ∼Wisconsin 248 228 16 ∼ 61 57 ∼ ∼
West North Central 745 707 31 ∼ 174 152 17 ∼Iowa 122 120 ∼ ∼ 25 25 ∼ ∼Kansas 88 84 ∼ ∼ 26 22 ∼ ∼Minnesota 190 185 ∼ ∼ 37 36 ∼ ∼Missouri 220 199 21 ∼ 62 49 ∼ ∼Nebraska 68 66 ∼ ∼ ∼ ∼ ∼ ∼North Dakota 25 23 ∼ ∼ ∼ ∼ ∼ ∼South Dakota 32 30 ∼ ∼ ∼ ∼ ∼ ∼
South 3,536 2,889 614 124 990 739 241 37
South Atlantic 2,005 1,629 364 45 584 430 147 ∼Delaware 45 38 ∼ ∼ 16 ∼ ∼ ∼District of Columbia 24 ∼ 22 ∼ ∼ ∼ ∼ ∼Florida 722 664 58 42 197 167 27 ∼Georgia 272 189 83 ∼ 76 44 32 ∼Maryland 184 142 38 ∼ 44 27 17 ∼North Carolina 282 217 63 ∼ 101 74 26 ∼South Carolina 164 111 53 ∼ 50 31 18 ∼Virginia 238 193 39 ∼ 69 49 19 ∼West Virginia 74 73 ∼ ∼ 23 21 ∼ ∼
East South Central 618 499 ∼ 150 46 ∼Alabama 169 128 40 ∼ 42 24 18 ∼Kentucky 150 137 ∼ ∼ 41 38 ∼ ∼Mississippi 97 58 38 ∼ 24 ∼ ∼ ∼Tennessee 202 176 25 ∼ 43 30 ∼ ∼
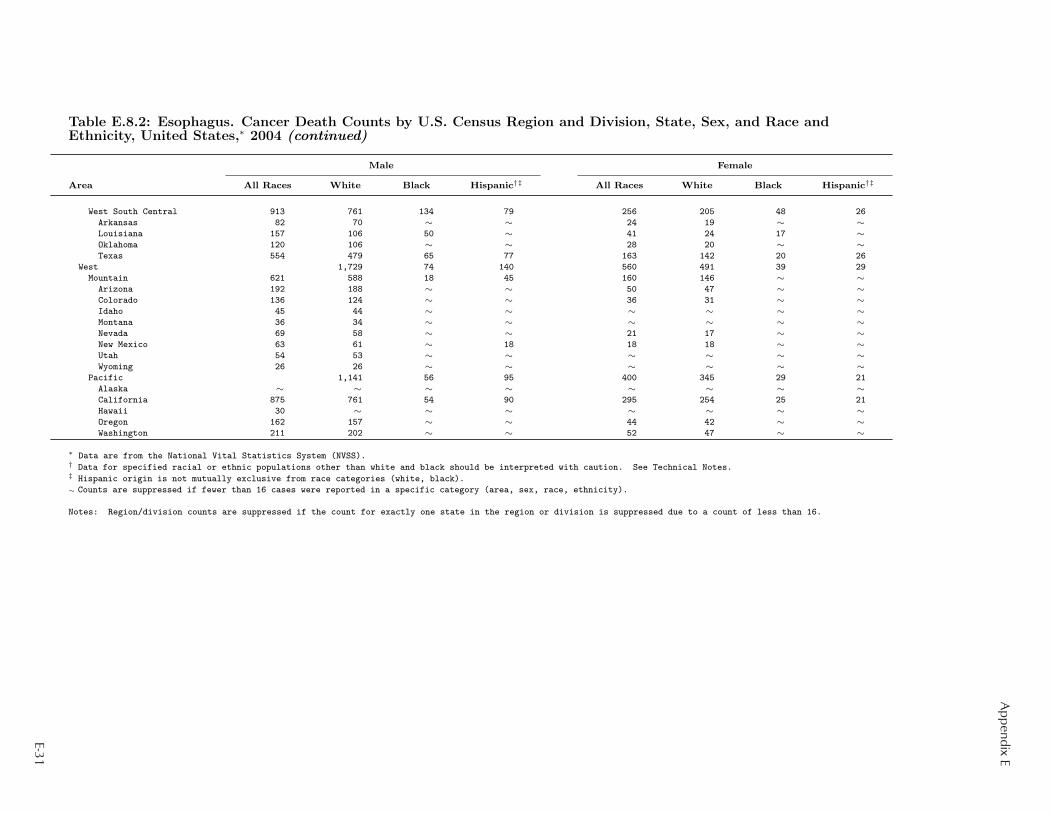
Appendix E
E-3�
Table E.8.2: Esophagus. Cancer Death Counts by U.S. Census Region and Division, State, Sex, and Race andEthnicity, United States,∗ 2004 (continued)
Male Female
Area All Races White Black Hispanic†‡ All Races White Black Hispanic†‡
West South Central 913 761 134 79 256 205 48 26
Arkansas 82 70 ∼ ∼ 24 19 ∼ ∼Louisiana 157 106 50 ∼ 41 24 17 ∼Oklahoma 120 106 ∼ ∼ 28 20 ∼ ∼Texas 554 479 65 77 163 142 20 26
West 1,729 74 140 560 491 39 29
Mountain 621 588 18 45 160 146 ∼ ∼Arizona 192 188 ∼ ∼ 50 47 ∼ ∼Colorado 136 124 ∼ ∼ 36 31 ∼ ∼Idaho 45 44 ∼ ∼ ∼ ∼ ∼ ∼Montana 36 34 ∼ ∼ ∼ ∼ ∼ ∼Nevada 69 58 ∼ ∼ 21 17 ∼ ∼New Mexico 63 61 ∼ 18 18 18 ∼ ∼Utah 54 53 ∼ ∼ ∼ ∼ ∼ ∼Wyoming 26 26 ∼ ∼ ∼ ∼ ∼ ∼
Pacific 1,141 56 95 400 345 29 21
Alaska ∼ ∼ ∼ ∼ ∼ ∼ ∼ ∼California 875 761 54 90 295 254 25 21
Hawaii 30 ∼ ∼ ∼ ∼ ∼ ∼ ∼Oregon 162 157 ∼ ∼ 44 42 ∼ ∼Washington 211 202 ∼ ∼ 52 47 ∼ ∼
∗ Data are from the National Vital Statistics System (NVSS).† Data for specified racial or ethnic populations other than white and black should be interpreted with caution. See Technical Notes.‡ Hispanic origin is not mutually exclusive from race categories (white, black).
∼ Counts are suppressed if fewer than 16 cases were reported in a specific category (area, sex, race, ethnicity).
Notes: Region/division counts are suppressed if the count for exactly one state in the region or division is suppressed due to a count of less than 16.

United
States Cancer Statistics: 2004 Incid
ence and M
ortality
E-3�
continued
Table E.9.1: Hodgkin Lymphoma. Cancer Incidence Counts by U.S. Census Region and Division, State andMetropolitan Area, and Race and Ethnicity, United States,∗† 2004
Male Female
Area All Races White Black Hispanic‡§ All Races White Black Hispanic‡§
Northeast 99 85 837 731 81 73
New England ∼ 17 208 196 ∼ ∼Connecticut 57 52 ∼ ∼ 59 54 ∼ ∼Maine 27 27 ∼ ∼ 18 18 ∼ ∼Massachusetts 117 111 ∼ ∼ 93 87 ∼ ∼New Hampshire 26 26 ∼ ∼ ∼ ∼ ∼ ∼Rhode Island 21 20 ∼ ∼ ∼ ∼ ∼ ∼Vermont ∼ ∼ ∼ ∼ ∼ ∼ ∼ ∼
Middle Atlantic 727 601 93 629 535 62
New Jersey 142 111 27 16 130 107 17 ∼New York 337 272 44 46 311 255 44 45
Pennsylvania 248 218 22 - 188 173 ∼ -
Midwest 1,003 873 100 43 883 781 72 32
East North Central 710 608 83 38 614 534 60 29
Illinois 210 172 35 20 146 121 16 ∼Indiana 100 92 ∼ ∼ 74 66 ∼ ∼Michigan 146 124 19 ∼ 155 131 19 ∼
Detroit 56 44 ∼ ∼ 75 59 ∼ ∼Ohio 168 141 17 ∼ 160 140 16 ∼Wisconsin 86 79 ∼ ∼ 79 76 ∼ ∼
West North Central 293 265 17 ∼ 269 247 ∼ ∼Iowa 44 42 ∼ ∼ 42 40 ∼ ∼Kansas 35 33 ∼ ∼ 36 32 ∼ ∼Minnesota 85 79 ∼ ∼ 73 66 ∼ ∼Missouri 83 70 ∼ ∼ 66 57 ∼ ∼Nebraska 29 25 ∼ ∼ 32 32 ∼ ∼North Dakota ∼ ∼ ∼ ∼ ∼ ∼ ∼ ∼South Dakota ∼ ∼ ∼ ∼ ∼ ∼ ∼ ∼
South 1,396 1,142 219 143 1,160 919 203 113
South Atlantic 682 552 116 65 595 451 126 43
Delaware ∼ ∼ ∼ ∼ ∼ ∼ ∼ ∼District of Columbia ∼ ∼ ∼ ∼ ∼ ∼ ∼ ∼Florida 255 222 28 - 200 169 26 -
Georgia 107 73 32 ∼ 109 76 31 ∼Atlanta 39 21 17 ∼ 46 28 18 ∼
Maryland
North Carolina 135 111 22 ∼ 98 79 16 ∼South Carolina 49 36 ∼ - 54 37 ∼ -
Virginia 102 83 17 ∼ 93 60 27 ∼West Virginia ∼ ∼ ∼ ∼ 20 20 ∼ ∼
East South Central 225 184 37 ∼ 180 136 39 ∼Alabama 59 45 ∼ ∼ 42 31 ∼ ∼Kentucky 60 55 ∼ - 47 41 ∼ -
Mississippi 39 25 ∼ ∼ 28 16 ∼ ∼Tennessee 67 59 ∼ ∼ 63 48 ∼ ∼

Appendix E
E-33
Table E.9.1: Hodgkin Lymphoma. Cancer Incidence Counts by U.S. Census Region and Division, State andMetropolitan Area, and Race and Ethnicity, United States,∗† 2004 (continued)
Male Female
Area All Races White Black Hispanic‡§ All Races White Black Hispanic‡§
West South Central 489 406 66 76 385 332 38 69
Arkansas 54 44 ∼ ∼ 26 20 ∼ ∼Louisiana 79 60 17 ∼ 54 44 ∼ ∼Oklahoma 57 49 ∼ ∼ 37 34 ∼ ∼Texas 299 253 35 73 268 234 23 65
West 892 768 53 171 789 685 48 137
Mountain 256 231 ∼ 36 206 193 ∼ 27
Arizona 53 49 ∼ ∼ 40 35 ∼ ∼Colorado 77 70 ∼ ∼ 54 52 ∼ ∼Idaho ∼ ∼ ∼ ∼ 18 18 ∼ ∼Montana ∼ ∼ ∼ ∼ ∼ ∼ ∼ ∼Nevada 40 31 ∼ ∼ 28 24 ∼ ∼New Mexico 26 24 ∼ ∼ 18 17 ∼ ∼Utah 28 27 ∼ ∼ 36 36 ∼ ∼Wyoming ∼ ∼ ∼ ∼ ∼ ∼ ∼ ∼
Pacific 537 43 135 492 39 110
Alaska ∼ ∼ ∼ ∼ ∼ ∼ ∼ ∼California 457 387 33 127 428 365 33 102
San Francisco-Oakland 58 43 ∼ ∼ 50 37 ∼ ∼San Jose-Monterey 34 30 ∼ ∼ 28 20 ∼ ∼Los Angeles 118 98 ∼ 41 114 95 ∼ 40
Hawaii 16 ∼ ∼ ∼ 16 ∼ ∼ ∼Oregon 60 56 ∼ ∼ 49 46 ∼ ∼Washington 93 78 ∼ ∼ 85 74 ∼ ∼
Seattle-Puget Sound 70 60 ∼ ∼ 59 52 ∼ ∼∗ Data are from all state and metropolitan area cancer registries, except Maryland. Included data cover approximately 98% of the population and met data quality
criteria for all invasive cancer sites combined. See Appendix B for registry-specific data quality information.† Invasive cancers only.‡ Data for specified racial or ethnic populations other than white and black should be interpreted with caution. See Technical Notes.
§ Hispanic origin is not mutually exclusive from race categories (white, black).
∼ Counts are suppressed if fewer than 16 cases were reported in a specific category (area, sex, race, ethnicity).
- Counts are suppressed at the state’s or metropolitan area’s request. See Technical Notes.
Notes: Cases from suppressed counts are included in region/division counts. Region/division counts are presented for regions/divisions with 100% of the
population covered by registries that meet the data quality criteria specified above unless the count for exactly one state in the region or division
is suppressed due to a count of less than 16. Michigan, Georgia, California, and Washington state counts each include cases from the SEER metropolitan
areas.

United
States Cancer Statistics: 2004 Incid
ence and M
ortality
E-3�
continued
Table E.9.2: Hodgkin Lymphoma. Cancer Death Counts by U.S. Census Region and Division, State, and Raceand Ethnicity, United States,∗ 2004
Male Female
Area All Races White Black Hispanic†‡ All Races White Black Hispanic†‡
United States 730 647 71 57 546 471 64 38
Northeast 158 139 16 ∼ 110 101 ∼ ∼New England 34 33 ∼ ∼ 28 28 ∼ ∼
Connecticut ∼ ∼ ∼ ∼ ∼ ∼ ∼ ∼Maine ∼ ∼ ∼ ∼ ∼ ∼ ∼ ∼Massachusetts ∼ ∼ ∼ ∼ ∼ ∼ ∼ ∼New Hampshire ∼ ∼ ∼ ∼ ∼ ∼ ∼ ∼Rhode Island ∼ ∼ ∼ ∼ ∼ ∼ ∼ ∼Vermont ∼ ∼ ∼ ∼ ∼ ∼ ∼ ∼
Middle Atlantic 124 106 ∼ ∼ 82 73 ∼ ∼New Jersey 29 21 ∼ ∼ 21 19 ∼ ∼New York 53 46 ∼ ∼ 34 30 ∼ ∼Pennsylvania 42 39 ∼ ∼ 27 24 ∼ ∼
Midwest 166 154 ∼ ∼ 120 106 ∼ ∼East North Central 117 108 ∼ ∼ 81 69 ∼ ∼
Illinois 37 35 ∼ ∼ 19 ∼ ∼ ∼Indiana ∼ ∼ ∼ ∼ ∼ ∼ ∼ ∼Michigan 27 24 ∼ ∼ 19 16 ∼ ∼Ohio 33 29 ∼ ∼ 27 25 ∼ ∼Wisconsin ∼ ∼ ∼ ∼ ∼ ∼ ∼ ∼
West North Central 49 46 ∼ ∼ 39 37 ∼ ∼Iowa ∼ ∼ ∼ ∼ ∼ ∼ ∼ ∼Kansas ∼ ∼ ∼ ∼ ∼ ∼ ∼ ∼Minnesota ∼ ∼ ∼ ∼ ∼ ∼ ∼ ∼Missouri ∼ ∼ ∼ ∼ ∼ ∼ ∼ ∼Nebraska ∼ ∼ ∼ ∼ ∼ ∼ ∼ ∼North Dakota ∼ ∼ ∼ ∼ ∼ ∼ ∼ ∼South Dakota ∼ ∼ ∼ ∼ ∼ ∼ ∼ ∼
South 253 214 35 19 212 170 40 ∼South Atlantic 121 96 23 ∼ 109 84 25 ∼
Delaware ∼ ∼ ∼ ∼ ∼ ∼ ∼ ∼District of Columbia ∼ ∼ ∼ ∼ ∼ ∼ ∼ ∼Florida 46 40 ∼ ∼ 37 33 ∼ ∼Georgia 18 ∼ ∼ ∼ 17 ∼ ∼ ∼Maryland ∼ ∼ ∼ ∼ ∼ ∼ ∼ ∼North Carolina ∼ ∼ ∼ ∼ ∼ ∼ ∼ ∼South Carolina ∼ ∼ ∼ ∼ ∼ ∼ ∼ ∼Virginia 18 ∼ ∼ ∼ ∼ ∼ ∼ ∼West Virginia ∼ ∼ ∼ ∼ ∼ ∼ ∼ ∼
East South Central 44 37 ∼ ∼ 38 29 ∼ ∼Alabama ∼ ∼ ∼ ∼ ∼ ∼ ∼ ∼Kentucky ∼ ∼ ∼ ∼ ∼ ∼ ∼ ∼Mississippi ∼ ∼ ∼ ∼ ∼ ∼ ∼ ∼Tennessee ∼ ∼ ∼ ∼ ∼ ∼ ∼ ∼

Appendix E
E-3�
Table E.9.2: Hodgkin Lymphoma. Cancer Death Counts by U.S. Census Region and Division, State, and Raceand Ethnicity, United States,∗ 2004 (continued)
Male Female
Area All Races White Black Hispanic†‡ All Races White Black Hispanic†‡
West South Central 88 81 ∼ ∼ 65 57 ∼ ∼Arkansas ∼ ∼ ∼ ∼ ∼ ∼ ∼ ∼Louisiana ∼ ∼ ∼ ∼ ∼ ∼ ∼ ∼Oklahoma ∼ ∼ ∼ ∼ ∼ ∼ ∼ ∼Texas 55 51 ∼ ∼ 35 31 ∼ ∼
West 153 140 ∼ 27 104 94 ∼ 16
Mountain 44 43 ∼ ∼ 23 22 ∼ ∼Arizona ∼ ∼ ∼ ∼ ∼ ∼ ∼ ∼Colorado ∼ ∼ ∼ ∼ ∼ ∼ ∼ ∼Idaho ∼ ∼ ∼ ∼ ∼ ∼ ∼ ∼Montana ∼ ∼ ∼ ∼ ∼ ∼ ∼ ∼Nevada ∼ ∼ ∼ ∼ ∼ ∼ ∼ ∼New Mexico ∼ ∼ ∼ ∼ ∼ ∼ ∼ ∼Utah ∼ ∼ ∼ ∼ ∼ ∼ ∼ ∼Wyoming ∼ ∼ ∼ ∼ ∼ ∼ ∼ ∼
Pacific 109 97 ∼ 22 81 72 ∼ ∼Alaska ∼ ∼ ∼ ∼ ∼ ∼ ∼ ∼California 86 77 ∼ 21 61 56 ∼ ∼Hawaii ∼ ∼ ∼ ∼ ∼ ∼ ∼ ∼Oregon ∼ ∼ ∼ ∼ ∼ ∼ ∼ ∼Washington ∼ ∼ ∼ ∼ ∼ ∼ ∼ ∼
∗ Data are from the National Vital Statistics System (NVSS).† Data for specified racial or ethnic populations other than white and black should be interpreted with caution. See Technical Notes.‡ Hispanic origin is not mutually exclusive from race categories (white, black).
∼ Counts are suppressed if fewer than 16 cases were reported in a specific category (area, sex, race, ethnicity).
Notes: Region/division counts are suppressed if the count for exactly one state in the region or division is suppressed due to a count of less than 16.

United
States Cancer Statistics: 2004 Incid
ence and M
ortality
E-3�
continued
Table E.10.1: Kaposi Sarcoma. Invasive Cancer Incidence Counts by U.S. Census Region and Division, Stateand Metropolitan Area, Sex, and Race and Ethnicity, United States,∗† 2004
Male Female
Area All Races White Black Hispanic‡§ All Races White Black Hispanic‡§
Northeast 269 166 82 59 46 26 ∼ ∼New England 57 43 ∼ ∼ ∼ ∼ ∼ ∼Connecticut ∼ ∼ ∼ ∼ ∼ ∼ ∼ ∼Maine ∼ ∼ ∼ ∼ ∼ ∼ ∼ ∼Massachusetts 29 21 ∼ ∼ ∼ ∼ ∼ ∼New Hampshire ∼ ∼ ∼ ∼ ∼ ∼ ∼ ∼Rhode Island ∼ ∼ ∼ ∼ ∼ ∼ ∼ ∼Vermont ∼ ∼ ∼ ∼ ∼ ∼ ∼ ∼
Middle Atlantic 212 123 74 55 37 18 ∼ ∼New Jersey 42 27 ∼ ∼ ∼ ∼ ∼ ∼New York 138 75 51 38 24 ∼ ∼ ∼Pennsylvania 32 21 ∼ - ∼ ∼ ∼ -
Midwest 131 73 44 ∼ 16 ∼ ∼ ∼East North Central 91 44 36 ∼ ∼ ∼ ∼ ∼Illinois 44 21 17 ∼ ∼ ∼ ∼ ∼Indiana ∼ ∼ ∼ ∼ ∼ ∼ ∼ ∼Michigan 20 ∼ ∼ ∼ ∼ ∼ ∼ ∼
Detroit ∼ ∼ ∼ ∼ ∼ ∼ ∼ ∼Ohio 18 ∼ ∼ ∼ ∼ ∼ ∼ ∼Wisconsin ∼ ∼ ∼ ∼ ∼ ∼ ∼ ∼
West North Central 40 29 ∼ ∼ ∼ ∼ ∼ ∼Iowa ∼ ∼ ∼ ∼ ∼ ∼ ∼ ∼Kansas ∼ ∼ ∼ ∼ ∼ ∼ ∼ ∼Minnesota ∼ ∼ ∼ ∼ ∼ ∼ ∼ ∼Missouri ∼ ∼ ∼ ∼ ∼ ∼ ∼ ∼Nebraska ∼ ∼ ∼ ∼ ∼ ∼ ∼ ∼North Dakota ∼ ∼ ∼ ∼ ∼ ∼ ∼ ∼South Dakota ∼ ∼ ∼ ∼ ∼ ∼ ∼ ∼
South 347 228 103 72 51 38 ∼ ∼South Atlantic 206 130 68 38 17 ∼ ∼ ∼Delaware ∼ ∼ ∼ ∼ ∼ ∼ ∼ ∼District of Columbia ∼ ∼ ∼ ∼ ∼ ∼ ∼ ∼Florida 107 88 18 - ∼ ∼ ∼ -
Georgia 53 22 29 ∼ ∼ ∼ ∼ ∼Atlanta 45 17 27 ∼ ∼ ∼ ∼ ∼
Maryland
North Carolina 20 ∼ ∼ ∼ ∼ ∼ ∼ ∼South Carolina ∼ ∼ ∼ - ∼ ∼ ∼ -
Virginia ∼ ∼ ∼ ∼ ∼ ∼ ∼ ∼West Virginia ∼ ∼ ∼ ∼ ∼ ∼ ∼ ∼
East South Central 32 22 ∼ ∼ ∼ ∼ ∼ ∼Alabama ∼ ∼ ∼ ∼ ∼ ∼ ∼ ∼Kentucky ∼ ∼ ∼ - ∼ ∼ ∼ -
Mississippi ∼ ∼ ∼ ∼ ∼ ∼ ∼ ∼Tennessee ∼ ∼ ∼ ∼ ∼ ∼ ∼ ∼

Appendix E
E-3�
Table E.10.1: Kaposi Sarcoma. Invasive Cancer Incidence Counts by U.S. Census Region and Division, Stateand Metropolitan Area, Sex, and Race and Ethnicity, United States,∗† 2004 (continued)
Male Female
Area All Races White Black Hispanic‡§ All Races White Black Hispanic‡§
West South Central 109 76 26 33 24 18 ∼ ∼Arkansas ∼ ∼ ∼ ∼ ∼ ∼ ∼ ∼Louisiana 16 ∼ ∼ ∼ ∼ ∼ ∼ ∼Oklahoma ∼ ∼ ∼ ∼ ∼ ∼ ∼ ∼Texas 81 57 19 32 18 ∼ ∼ ∼
West 356 290 31 105 29 22 ∼ ∼Mountain 46 38 ∼ 16 ∼ ∼ ∼ ∼Arizona ∼ ∼ ∼ ∼ ∼ ∼ ∼ ∼Colorado ∼ ∼ ∼ ∼ ∼ ∼ ∼ ∼Idaho ∼ ∼ ∼ ∼ ∼ ∼ ∼ ∼Montana ∼ ∼ ∼ ∼ ∼ ∼ ∼ ∼Nevada ∼ ∼ ∼ ∼ ∼ ∼ ∼ ∼New Mexico ∼ ∼ ∼ ∼ ∼ ∼ ∼ ∼Utah ∼ ∼ ∼ ∼ ∼ ∼ ∼ ∼Wyoming ∼ ∼ ∼ ∼ ∼ ∼ ∼ ∼
Pacific 310 252 28 89 24 18 ∼ ∼Alaska ∼ ∼ ∼ ∼ ∼ ∼ ∼ ∼California 266 213 27 83 19 ∼ ∼ ∼
San Francisco-Oakland 51 41 ∼ ∼ ∼ ∼ ∼ ∼San Jose-Monterey ∼ ∼ ∼ ∼ ∼ ∼ ∼ ∼Los Angeles 113 87 ∼ 38 ∼ ∼ ∼ ∼
Hawaii ∼ ∼ ∼ ∼ ∼ ∼ ∼ ∼Oregon ∼ ∼ ∼ ∼ ∼ ∼ ∼ ∼Washington 26 23 ∼ ∼ ∼ ∼ ∼ ∼Seattle-Puget Sound 23 20 ∼ ∼ ∼ ∼ ∼ ∼
∗ Data are from all state and metropolitan area cancer registries, except Maryland. Included data cover approximately 98% of the population and met data quality
criteria for all invasive cancer sites combined. See Appendix B for registry-specific data quality information.† Invasive cancers only.‡ Data for specified racial or ethnic populations other than white and black should be interpreted with caution. See Technical Notes.
§ Hispanic origin is not mutually exclusive from race categories (white, black).
∼ Counts are suppressed if fewer than 16 cases were reported in a specific category (area, sex, race, ethnicity).
- Counts are suppressed at the state’s or metropolitan area’s request. See Technical Notes.
Notes: Cases from suppressed counts are included in region/division counts. Region/division counts are presented for regions/divisions with 100% of the
population covered by registries that meet the data quality criteria specified above unless the count for exactly one state in the region or division
is suppressed due to a count of less than 16. Michigan, Georgia, California, and Washington state counts each include cases from the SEER metropolitan
areas.
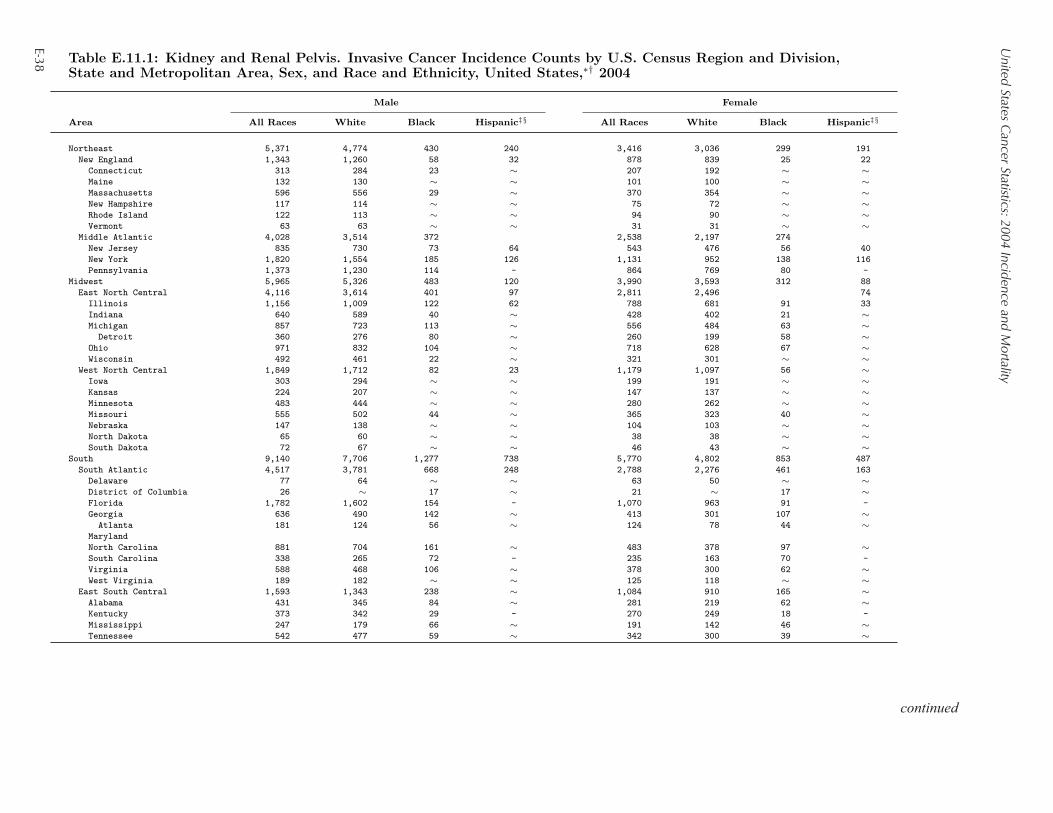
United
States Cancer Statistics: 2004 Incid
ence and M
ortality
E-3�
continued
Table E.11.1: Kidney and Renal Pelvis. Invasive Cancer Incidence Counts by U.S. Census Region and Division,State and Metropolitan Area, Sex, and Race and Ethnicity, United States,∗† 2004
Male Female
Area All Races White Black Hispanic‡§ All Races White Black Hispanic‡§
Northeast 5,371 4,774 430 240 3,416 3,036 299 191
New England 1,343 1,260 58 32 878 839 25 22
Connecticut 313 284 23 ∼ 207 192 ∼ ∼Maine 132 130 ∼ ∼ 101 100 ∼ ∼Massachusetts 596 556 29 ∼ 370 354 ∼ ∼New Hampshire 117 114 ∼ ∼ 75 72 ∼ ∼Rhode Island 122 113 ∼ ∼ 94 90 ∼ ∼Vermont 63 63 ∼ ∼ 31 31 ∼ ∼
Middle Atlantic 4,028 3,514 372 2,538 2,197 274
New Jersey 835 730 73 64 543 476 56 40
New York 1,820 1,554 185 126 1,131 952 138 116
Pennsylvania 1,373 1,230 114 - 864 769 80 -
Midwest 5,965 5,326 483 120 3,990 3,593 312 88
East North Central 4,116 3,614 401 97 2,811 2,496 74
Illinois 1,156 1,009 122 62 788 681 91 33
Indiana 640 589 40 ∼ 428 402 21 ∼Michigan 857 723 113 ∼ 556 484 63 ∼
Detroit 360 276 80 ∼ 260 199 58 ∼Ohio 971 832 104 ∼ 718 628 67 ∼Wisconsin 492 461 22 ∼ 321 301 ∼ ∼
West North Central 1,849 1,712 82 23 1,179 1,097 56 ∼Iowa 303 294 ∼ ∼ 199 191 ∼ ∼Kansas 224 207 ∼ ∼ 147 137 ∼ ∼Minnesota 483 444 ∼ ∼ 280 262 ∼ ∼Missouri 555 502 44 ∼ 365 323 40 ∼Nebraska 147 138 ∼ ∼ 104 103 ∼ ∼North Dakota 65 60 ∼ ∼ 38 38 ∼ ∼South Dakota 72 67 ∼ ∼ 46 43 ∼ ∼
South 9,140 7,706 1,277 738 5,770 4,802 853 487
South Atlantic 4,517 3,781 668 248 2,788 2,276 461 163
Delaware 77 64 ∼ ∼ 63 50 ∼ ∼District of Columbia 26 ∼ 17 ∼ 21 ∼ 17 ∼Florida 1,782 1,602 154 - 1,070 963 91 -
Georgia 636 490 142 ∼ 413 301 107 ∼Atlanta 181 124 56 ∼ 124 78 44 ∼
Maryland
North Carolina 881 704 161 ∼ 483 378 97 ∼South Carolina 338 265 72 - 235 163 70 -
Virginia 588 468 106 ∼ 378 300 62 ∼West Virginia 189 182 ∼ ∼ 125 118 ∼ ∼
East South Central 1,593 1,343 238 ∼ 1,084 910 165 ∼Alabama 431 345 84 ∼ 281 219 62 ∼Kentucky 373 342 29 - 270 249 18 -
Mississippi 247 179 66 ∼ 191 142 46 ∼Tennessee 542 477 59 ∼ 342 300 39 ∼
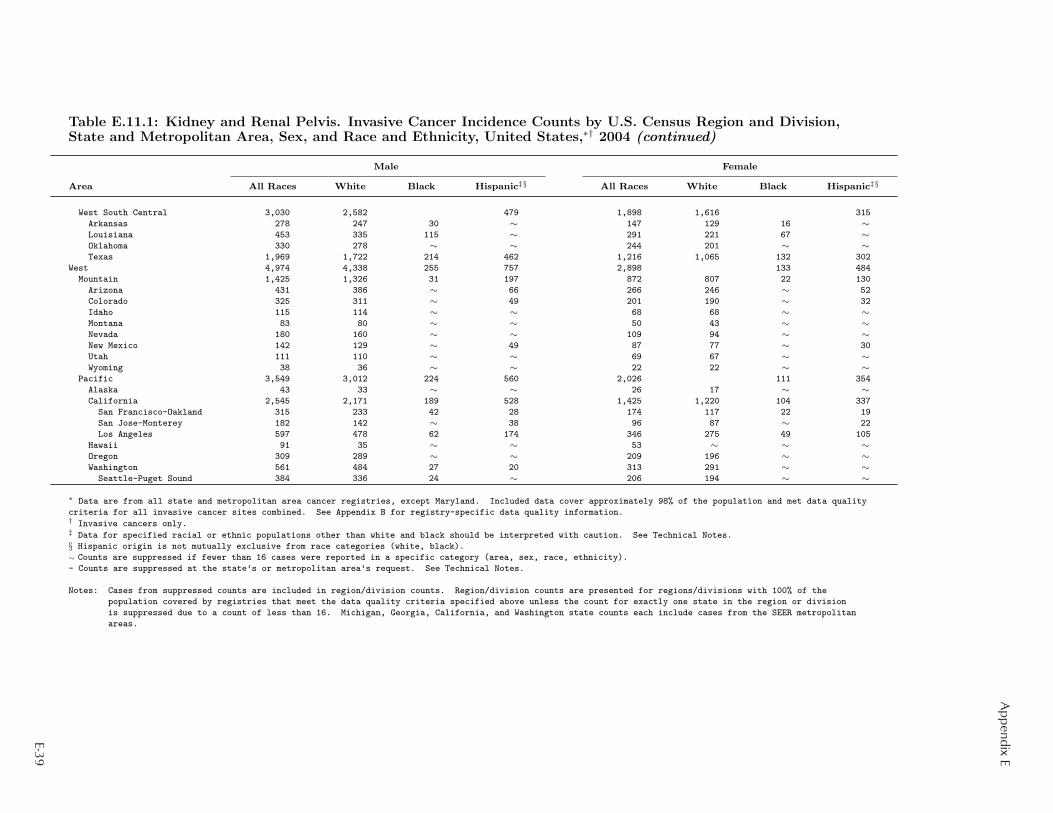
Appendix E
E-3�
Table E.11.1: Kidney and Renal Pelvis. Invasive Cancer Incidence Counts by U.S. Census Region and Division,State and Metropolitan Area, Sex, and Race and Ethnicity, United States,∗† 2004 (continued)
Male Female
Area All Races White Black Hispanic‡§ All Races White Black Hispanic‡§
West South Central 3,030 2,582 479 1,898 1,616 315
Arkansas 278 247 30 ∼ 147 129 16 ∼Louisiana 453 335 115 ∼ 291 221 67 ∼Oklahoma 330 278 ∼ ∼ 244 201 ∼ ∼Texas 1,969 1,722 214 462 1,216 1,065 132 302
West 4,974 4,338 255 757 2,898 133 484
Mountain 1,425 1,326 31 197 872 807 22 130
Arizona 431 386 ∼ 66 266 246 ∼ 52
Colorado 325 311 ∼ 49 201 190 ∼ 32
Idaho 115 114 ∼ ∼ 68 68 ∼ ∼Montana 83 80 ∼ ∼ 50 43 ∼ ∼Nevada 180 160 ∼ ∼ 109 94 ∼ ∼New Mexico 142 129 ∼ 49 87 77 ∼ 30
Utah 111 110 ∼ ∼ 69 67 ∼ ∼Wyoming 38 36 ∼ ∼ 22 22 ∼ ∼
Pacific 3,549 3,012 224 560 2,026 111 354
Alaska 43 33 ∼ ∼ 26 17 ∼ ∼California 2,545 2,171 189 528 1,425 1,220 104 337
San Francisco-Oakland 315 233 42 28 174 117 22 19
San Jose-Monterey 182 142 ∼ 38 96 87 ∼ 22
Los Angeles 597 478 62 174 346 275 49 105
Hawaii 91 35 ∼ ∼ 53 ∼ ∼ ∼Oregon 309 289 ∼ ∼ 209 196 ∼ ∼Washington 561 484 27 20 313 291 ∼ ∼
Seattle-Puget Sound 384 336 24 ∼ 206 194 ∼ ∼∗ Data are from all state and metropolitan area cancer registries, except Maryland. Included data cover approximately 98% of the population and met data quality
criteria for all invasive cancer sites combined. See Appendix B for registry-specific data quality information.† Invasive cancers only.‡ Data for specified racial or ethnic populations other than white and black should be interpreted with caution. See Technical Notes.
§ Hispanic origin is not mutually exclusive from race categories (white, black).
∼ Counts are suppressed if fewer than 16 cases were reported in a specific category (area, sex, race, ethnicity).
- Counts are suppressed at the state’s or metropolitan area’s request. See Technical Notes.
Notes: Cases from suppressed counts are included in region/division counts. Region/division counts are presented for regions/divisions with 100% of the
population covered by registries that meet the data quality criteria specified above unless the count for exactly one state in the region or division
is suppressed due to a count of less than 16. Michigan, Georgia, California, and Washington state counts each include cases from the SEER metropolitan
areas.

United
States Cancer Statistics: 2004 Incid
ence and M
ortality
E-�0
continued
Table E.11.2: Kidney and Renal Pelvis. Cancer Death Counts by U.S. Census Region and Division, State, Sex,and Race and Ethnicity, United States,∗ 2004
Male Female
Area All Races White Black Hispanic†‡ All Races White Black Hispanic†‡
United States 7,640 6,839 655 507 4,673 4,149 436 256
Northeast 1,383 1,279 91 38 947 870 69 21
New England 401 387 ∼ ∼ 249 237 ∼ ∼Connecticut 99 92 ∼ ∼ 61 56 ∼ ∼Maine 35 34 ∼ ∼ 20 20 ∼ ∼Massachusetts 182 177 ∼ ∼ 102 95 ∼ ∼New Hampshire 35 35 ∼ ∼ 27 27 ∼ ∼Rhode Island 33 32 ∼ ∼ 23 23 ∼ ∼Vermont 17 17 ∼ ∼ 16 16 ∼ ∼
Middle Atlantic 982 892 33 698 633 19
New Jersey 197 183 ∼ ∼ 125 113 ∼ ∼New York 436 389 40 25 289 255 30 16
Pennsylvania 349 320 29 ∼ 284 265 19 ∼Midwest 1,869 1,732 117 30 92 25
East North Central 1,295 1,184 102 24 845 763 79 18
Illinois 326 284 39 ∼ 211 182 28 ∼Indiana 186 178 ∼ ∼ 137 125 ∼ ∼Michigan 262 237 21 ∼ 175 159 16 ∼Ohio 350 320 30 ∼ 215 198 17 ∼Wisconsin 171 165 ∼ ∼ 107 99 ∼ ∼
West North Central 574 548 ∼ ∼ ∼ ∼Iowa 91 91 ∼ ∼ 58 58 ∼ ∼Kansas 72 68 ∼ ∼ 44 41 ∼ ∼Minnesota 129 123 ∼ ∼ 91 88 ∼ ∼Missouri 170 160 ∼ ∼ 113 104 ∼ ∼Nebraska 53 50 ∼ ∼ 48 46 ∼ ∼North Dakota 25 25 ∼ ∼ 18 17 ∼ ∼South Dakota 34 31 ∼ ∼ ∼ ∼ ∼ ∼
South 2,900 2,476 386 226 1,638 1,389 233 90
South Atlantic 1,453 1,220 219 62 811 676 130 30
Delaware 27 24 ∼ ∼ ∼ ∼ ∼ ∼District of Columbia ∼ ∼ ∼ ∼ ∼ ∼ ∼ ∼Florida 510 464 43 56 273 250 22 28
Georgia 184 138 45 ∼ 129 107 22 ∼Maryland 139 108 27 ∼ 65 48 ∼ ∼North Carolina 228 182 43 ∼ 129 98 30 ∼South Carolina 116 94 22 ∼ 69 50 19 ∼Virginia 184 153 28 ∼ 83 68 ∼ ∼West Virginia 56 54 ∼ ∼ 45 44 ∼ ∼
East South Central 497 435 ∼ 302 256 45 ∼Alabama 116 97 19 ∼ 70 52 18 ∼Kentucky 130 129 ∼ ∼ 77 75 ∼ ∼Mississippi 79 59 20 ∼ 55 41 ∼ ∼Tennessee 172 150 22 ∼ 100 88 ∼ ∼

Appendix E
E-��
Table E.11.2: Kidney and Renal Pelvis. Cancer Death Counts by U.S. Census Region and Division, State, Sex,and Race and Ethnicity, United States,∗ 2004 (continued)
Male Female
Area All Races White Black Hispanic†‡ All Races White Black Hispanic†‡
West South Central 950 821 105 162 525 457 58 59
Arkansas 92 80 ∼ ∼ 63 54 ∼ ∼Louisiana 154 112 42 ∼ 92 64 27 ∼Oklahoma 131 115 ∼ ∼ 68 56 ∼ ∼Texas 573 514 48 157 302 283 17 58
West 1,488 1,352 61 213 859 761 42 120
Mountain ∼ 64 234 ∼ 36
Arizona 149 142 ∼ 27 78 72 ∼ ∼Colorado 92 89 ∼ ∼ 41 41 ∼ ∼Idaho 33 33 ∼ ∼ 24 24 ∼ ∼Montana 28 28 ∼ ∼ 16 ∼ ∼ ∼Nevada 59 51 ∼ ∼ 34 31 ∼ ∼New Mexico 44 39 ∼ 18 31 28 ∼ 16
Utah 28 28 ∼ ∼ 20 20 ∼ ∼Wyoming ∼ ∼ ∼ ∼ ∼ ∼ ∼ ∼
Pacific 1,040 927 54 149 611 527 38 84
Alaska ∼ ∼ ∼ ∼ ∼ ∼ ∼ ∼California 739 650 52 143 445 381 36 83
Hawaii ∼ ∼ ∼ ∼ ∼ ∼ ∼ ∼Oregon 101 99 ∼ ∼ 57 55 ∼ ∼Washington 174 166 ∼ ∼ 90 85 ∼ ∼
∗ Data are from the National Vital Statistics System (NVSS).† Data for specified racial or ethnic populations other than white and black should be interpreted with caution. See Technical Notes.‡ Hispanic origin is not mutually exclusive from race categories (white, black).
∼ Counts are suppressed if fewer than 16 cases were reported in a specific category (area, sex, race, ethnicity).
Notes: Region/division counts are suppressed if the count for exactly one state in the region or division is suppressed due to a count of less than 16.

United
States Cancer Statistics: 2004 Incid
ence and M
ortality
E-��
continued
Table E.12.1: Larynx. Invasive Cancer Incidence Counts by U.S. Census Region and Division, State andMetropolitan Area, Sex, and Race and Ethnicity, United States,∗† 2004
Male Female
Area All Races White Black Hispanic‡§ All Races White Black Hispanic‡§
Northeast 1,957 1,674 243 122 523 456 59 23
New England 491 466 19 ∼ 133 125 ∼ ∼Connecticut 110 93 ∼ ∼ 29 26 ∼ ∼Maine 52 52 ∼ ∼ 17 17 ∼ ∼Massachusetts 209 201 ∼ ∼ 59 55 ∼ ∼New Hampshire 48 48 ∼ ∼ ∼ ∼ ∼ ∼Rhode Island 44 44 ∼ ∼ ∼ ∼ ∼ ∼Vermont 28 28 ∼ ∼ ∼ ∼ ∼ ∼
Middle Atlantic 1,466 1,208 224 390 331 20
New Jersey 268 217 47 22 74 63 ∼ ∼New York 662 531 110 79 156 127 25 ∼Pennsylvania 536 460 67 - 160 141 17 -
Midwest 2,259 265 29 623 521 88 ∼East North Central 1,614 1,340 22 446 367 67 ∼Illinois 426 336 76 ∼ 100 70 26 ∼Indiana 230 207 21 ∼ 62 57 ∼ ∼Michigan 353 292 55 ∼ 105 86 18 ∼
Detroit 164 112 48 ∼ 51 33 17 ∼Ohio 420 339 53 ∼ 140 116 19 ∼Wisconsin 185 166 ∼ ∼ 39 38 ∼ ∼
West North Central 645 45 ∼ 177 154 21 ∼Iowa 110 107 ∼ ∼ 26 24 ∼ ∼Kansas 75 69 ∼ ∼ 29 24 ∼ ∼Minnesota 138 125 ∼ ∼ 36 30 ∼ ∼Missouri 225 195 27 ∼ 59 49 ∼ ∼Nebraska 57 50 ∼ ∼ ∼ ∼ ∼ ∼North Dakota 16 ∼ ∼ ∼ ∼ ∼ ∼ ∼South Dakota 24 24 ∼ ∼ ∼ ∼ ∼ ∼
South 3,951 3,085 806 237 945 769 167 36
South Atlantic 2,027 1,570 430 125 464 380 83 20
Delaware 39 25 ∼ ∼ ∼ ∼ ∼ ∼District of Columbia 23 ∼ 19 ∼ ∼ ∼ ∼ ∼Florida 817 705 100 - 183 171 ∼ -
Georgia 293 202 86 ∼ 66 55 ∼ ∼Atlanta 55 29 23 ∼ 16 ∼ ∼ ∼
Maryland
North Carolina 330 246 81 ∼ 93 70 23 ∼South Carolina 191 116 74 - 40 18 22 -
Virginia 254 194 56 ∼ 48 36 ∼ ∼West Virginia 80 78 ∼ ∼ 25 25 ∼ ∼
East South Central 797 628 162 ∼ 214 174 39 ∼Alabama 211 150 59 ∼ 63 50 ∼ ∼Kentucky 196 174 21 - 61 56 ∼ -
Mississippi 119 69 48 ∼ 26 19 ∼ ∼Tennessee 271 235 34 ∼ 64 49 ∼ ∼

Appendix E
E-�3
Table E.12.1: Larynx. Invasive Cancer Incidence Counts by U.S. Census Region and Division, State andMetropolitan Area, Sex, and Race and Ethnicity, United States,∗† 2004 (continued)
Male Female
Area All Races White Black Hispanic‡§ All Races White Black Hispanic‡§
West South Central 1,127 887 214 109 267 215 45 16
Arkansas 136 119 ∼ ∼ 36 29 ∼ ∼Louisiana 221 145 75 ∼ 56 41 ∼ ∼Oklahoma 107 89 ∼ ∼ 41 32 ∼ ∼Texas 663 534 115 102 134 113 20 ∼
West 80 151 375 333 18 35
Mountain 389 369 ∼ 40 120 115 ∼ ∼Arizona 118 112 ∼ ∼ 30 27 ∼ ∼Colorado 74 67 ∼ ∼ 29 28 ∼ ∼Idaho 27 27 ∼ ∼ ∼ ∼ ∼ ∼Montana 31 31 ∼ ∼ ∼ ∼ ∼ ∼Nevada 59 55 ∼ ∼ 26 25 ∼ ∼New Mexico 38 35 ∼ ∼ ∼ ∼ ∼ ∼Utah 26 26 ∼ ∼ ∼ ∼ ∼ ∼Wyoming 16 16 ∼ ∼ ∼ ∼ ∼ ∼
Pacific 68 111 255 218 17 22
Alaska ∼ ∼ ∼ ∼ ∼ ∼ ∼ ∼California 692 581 62 104 173 148 17 19
San Francisco-Oakland 85 61 ∼ ∼ 23 17 ∼ ∼San Jose-Monterey 47 40 ∼ ∼ ∼ ∼ ∼ ∼Los Angeles 173 133 25 36 43 33 ∼ ∼
Hawaii 32 17 ∼ ∼ ∼ ∼ ∼ ∼Oregon 87 84 ∼ ∼ 29 27 ∼ ∼Washington 149 138 ∼ ∼ 45 39 ∼ ∼
Seattle-Puget Sound 110 101 ∼ ∼ 31 28 ∼ ∼∗ Data are from all state and metropolitan area cancer registries, except Maryland. Included data cover approximately 98% of the population and met data quality
criteria for all invasive cancer sites combined. See Appendix B for registry-specific data quality information.† Invasive cancers only.‡ Data for specified racial or ethnic populations other than white and black should be interpreted with caution. See Technical Notes.
§ Hispanic origin is not mutually exclusive from race categories (white, black).
∼ Counts are suppressed if fewer than 16 cases were reported in a specific category (area, sex, race, ethnicity).
- Counts are suppressed at the state’s or metropolitan area’s request. See Technical Notes.
Notes: Cases from suppressed counts are included in region/division counts. Region/division counts are presented for regions/divisions with 100% of the
population covered by registries that meet the data quality criteria specified above unless the count for exactly one state in the region or division
is suppressed due to a count of less than 16. Michigan, Georgia, California, and Washington state counts each include cases from the SEER metropolitan
areas.

United
States Cancer Statistics: 2004 Incid
ence and M
ortality
E-��
continued
Table E.12.2: Larynx. Cancer Death Counts by U.S. Census Region and Division, State, Sex, and Race andEthnicity, United States,∗ 2004
Male Female
Area All Races White Black Hispanic†‡ All Races White Black Hispanic†‡
United States 2,935 2,370 530 178 733 615 108 ∼Northeast 612 515 93 39 161 135 24 ∼
New England 147 142 ∼ ∼ 39 37 ∼ ∼Connecticut 30 27 ∼ ∼ ∼ ∼ ∼ ∼Maine ∼ ∼ ∼ ∼ ∼ ∼ ∼ ∼Massachusetts 76 74 ∼ ∼ 20 19 ∼ ∼New Hampshire ∼ ∼ ∼ ∼ ∼ ∼ ∼ ∼Rhode Island ∼ ∼ ∼ ∼ ∼ ∼ ∼ ∼Vermont ∼ ∼ ∼ ∼ ∼ ∼ ∼ ∼
Middle Atlantic 465 373 88 36 122 98 22 ∼New Jersey 99 81 17 ∼ 22 17 ∼ ∼New York 213 159 51 31 53 40 ∼ ∼Pennsylvania 153 133 20 ∼ 47 41 ∼ ∼
Midwest 626 530 92 ∼ 173 149 22 ∼East North Central 460 377 82 ∼ 19 ∼
Illinois 112 79 33 ∼ 33 27 ∼ ∼Indiana 59 51 ∼ ∼ ∼ ∼ ∼ ∼Michigan 105 86 18 ∼ 27 20 ∼ ∼Ohio 135 117 18 ∼ 38 35 ∼ ∼Wisconsin 49 44 ∼ ∼ 20 17 ∼ ∼
West North Central 166 153 ∼ ∼ 43 39 ∼ ∼Iowa 31 31 ∼ ∼ ∼ ∼ ∼ ∼Kansas 26 21 ∼ ∼ ∼ ∼ ∼ ∼Minnesota 37 37 ∼ ∼ ∼ ∼ ∼ ∼Missouri 54 48 ∼ ∼ ∼ ∼ ∼ ∼Nebraska ∼ ∼ ∼ ∼ ∼ ∼ ∼ ∼North Dakota ∼ ∼ ∼ ∼ ∼ ∼ ∼ ∼South Dakota ∼ ∼ ∼ ∼ ∼ ∼ ∼ ∼
South 1,245 932 308 67 282 223 55 ∼South Atlantic 669 486 183 34 163 132 31 ∼
Delaware 19 ∼ ∼ ∼ ∼ ∼ ∼ ∼District of Columbia ∼ ∼ ∼ ∼ ∼ ∼ ∼ ∼Florida 237 207 30 33 64 61 ∼ ∼Georgia 87 51 36 ∼ 19 ∼ ∼ ∼Maryland 66 43 23 ∼ ∼ ∼ ∼ ∼North Carolina 101 72 29 ∼ 22 ∼ ∼ ∼South Carolina 48 22 26 ∼ ∼ ∼ ∼ ∼Virginia 72 48 24 ∼ 16 ∼ ∼ ∼West Virginia 28 28 ∼ ∼ ∼ ∼ ∼ ∼
East South Central 215 40 ∼ 39 33 ∼ ∼Alabama 50 34 16 ∼ ∼ ∼ ∼ ∼Kentucky 57 52 ∼ ∼ ∼ ∼ ∼ ∼Mississippi 22 ∼ ∼ ∼ ∼ ∼ ∼ ∼Tennessee 86 74 ∼ ∼ ∼ ∼ ∼ ∼

Appendix E
E-��
Table E.12.2: Larynx. Cancer Death Counts by U.S. Census Region and Division, State, Sex, and Race andEthnicity, United States,∗ 2004 (continued)
Male Female
Area All Races White Black Hispanic†‡ All Races White Black Hispanic†‡
West South Central 361 273 85 32 80 58 18 ∼Arkansas 31 23 ∼ ∼ ∼ ∼ ∼ ∼Louisiana 76 42 34 ∼ ∼ ∼ ∼ ∼Oklahoma 34 29 ∼ ∼ ∼ ∼ ∼ ∼Texas 220 179 40 32 44 33 ∼ ∼
West 452 393 37 63 117 108 ∼ ∼Mountain 128 121 ∼ 20 33 32 ∼ ∼
Arizona 48 45 ∼ ∼ ∼ ∼ ∼ ∼Colorado 24 21 ∼ ∼ ∼ ∼ ∼ ∼Idaho ∼ ∼ ∼ ∼ ∼ ∼ ∼ ∼Montana ∼ ∼ ∼ ∼ ∼ ∼ ∼ ∼Nevada ∼ ∼ ∼ ∼ ∼ ∼ ∼ ∼New Mexico 20 20 ∼ ∼ ∼ ∼ ∼ ∼Utah ∼ ∼ ∼ ∼ ∼ ∼ ∼ ∼Wyoming ∼ ∼ ∼ ∼ ∼ ∼ ∼ ∼
Pacific 324 272 32 43 84 76 ∼ ∼Alaska ∼ ∼ ∼ ∼ ∼ ∼ ∼ ∼California 246 201 31 40 54 47 ∼ ∼Hawaii ∼ ∼ ∼ ∼ ∼ ∼ ∼ ∼Oregon 25 24 ∼ ∼ 17 16 ∼ ∼Washington 45 42 ∼ ∼ ∼ ∼ ∼ ∼
∗ Data are from the National Vital Statistics System (NVSS).† Data for specified racial or ethnic populations other than white and black should be interpreted with caution. See Technical Notes.‡ Hispanic origin is not mutually exclusive from race categories (white, black).
∼ Counts are suppressed if fewer than 16 cases were reported in a specific category (area, sex, race, ethnicity).
Notes: Region/division counts are suppressed if the count for exactly one state in the region or division is suppressed due to a count of less than 16.

United
States Cancer Statistics: 2004 Incid
ence and M
ortality
E-��
continued
Table E.13.1: Leukemias. Cancer Incidence Counts by U.S. Census Region and Division, State and MetropolitanArea, and Race and Ethnicity, United States,∗† 2004
Male Female
Area All Races White Black Hispanic‡§ All Races White Black Hispanic‡§
Northeast 4,082 3,616 285 216 3,146 2,787 230 169
New England 1,028 967 31 34 804 757 24 33
Connecticut 203 185 ∼ ∼ 166 154 ∼ ∼Maine 123 120 ∼ ∼ 97 95 ∼ ∼Massachusetts 460 430 ∼ ∼ 356 331 ∼ 17
New Hampshire 96 92 ∼ ∼ 76 71 ∼ ∼Rhode Island 81 75 ∼ ∼ 81 78 ∼ ∼Vermont 65 65 ∼ ∼ 28 28 ∼ ∼
Middle Atlantic 3,054 2,649 254 2,342 2,030 206
New Jersey 667 558 54 53 503 421 46 40
New York 1,382 1,190 136 117 1,109 953 110 87
Pennsylvania 1,005 901 64 - 730 656 50 -
Midwest 4,807 4,307 267 108 3,615 3,217 244 93
East North Central 3,131 2,778 88 2,430 2,113 76
Illinois 893 756 65 48 737 605 80 57
Indiana 403 380 17 ∼ 280 258 18 ∼Michigan 746 634 81 ∼ 572 494 49 ∼
Detroit 324 248 66 ∼ 236 184 44 ∼Ohio 684 620 46 ∼ 529 458 53 ∼Wisconsin 405 388 ∼ ∼ 312 298 ∼ ∼
West North Central 1,676 1,529 52 20 1,185 1,104 34 17
Iowa 243 234 ∼ ∼ 204 195 ∼ ∼Kansas 226 205 ∼ ∼ 167 153 ∼ ∼Minnesota 512 452 ∼ ∼ 342 313 ∼ ∼Missouri 428 392 29 ∼ 288 266 17 ∼Nebraska 143 132 ∼ ∼ 97 92 ∼ ∼North Dakota 50 47 ∼ ∼ 33 32 ∼ ∼South Dakota 74 67 ∼ ∼ 54 53 ∼ ∼
South 6,502 5,542 717 537 4,892 4,080 662 420
South Atlantic 3,265 2,780 394 221 2,406 1,976 384 160
Delaware 43 38 ∼ ∼ 38 31 ∼ ∼District of Columbia 17 ∼ ∼ ∼ 26 ∼ 18 ∼Florida 1,385 1,246 106 - 964 864 89 -
Georgia 515 401 101 21 412 313 90 20
Atlanta 159 114 42 ∼ 119 77 41 ∼Maryland
North Carolina 489 417 57 ∼ 380 296 79 ∼South Carolina 274 224 47 - 207 163 42 -
Virginia 391 304 62 ∼ 280 205 59 ∼West Virginia 151 144 ∼ ∼ 99 97 ∼ ∼
East South Central 1,103 927 16 887 728 ∼Alabama 291 244 43 ∼ 220 171 48 ∼Kentucky 299 267 ∼ - 222 191 ∼ -
Mississippi 147 98 49 ∼ 139 100 38 ∼Tennessee 366 318 38 ∼ 306 266 33 ∼

Appendix E
E-��
Table E.13.1: Leukemias. Cancer Incidence Counts by U.S. Census Region and Division, State and MetropolitanArea, and Race and Ethnicity, United States,∗† 2004 (continued)
Male Female
Area All Races White Black Hispanic‡§ All Races White Black Hispanic‡§
West South Central 2,134 1,835 179 300 1,599 1,376 248
Arkansas 185 166 ∼ ∼ 135 114 19 ∼Louisiana 279 217 62 ∼ 212 156 55 ∼Oklahoma 264 220 ∼ ∼ 191 173 ∼ ∼Texas 1,406 1,232 91 281 1,061 933 70 241
West 4,105 3,549 142 617 2,594 100 501
Mountain 1,199 1,108 20 147 917 841 18 115
Arizona 268 245 ∼ 51 213 202 ∼ 31
Colorado 322 290 ∼ 27 227 203 ∼ 30
Idaho 100 96 ∼ ∼ 71 70 ∼ ∼Montana 73 69 ∼ ∼ 51 46 ∼ ∼Nevada 151 138 ∼ ∼ 126 107 ∼ 17
New Mexico 123 118 ∼ 38 107 96 ∼ 26
Utah 131 125 ∼ ∼ 101 97 ∼ ∼Wyoming 31 27 ∼ ∼ 21 20 ∼ ∼
Pacific 2,906 2,441 122 470 1,753 82 386
Alaska 33 26 ∼ ∼ ∼ ∼ ∼ ∼California 2,099 1,747 109 444 1,535 1,276 76 359
San Francisco-Oakland 242 178 ∼ 22 201 151 ∼ 23
San Jose-Monterey 150 122 ∼ 30 99 77 ∼ 17
Los Angeles 546 432 58 169 431 340 41 134
Hawaii 76 22 ∼ ∼ 60 ∼ ∼ ∼Oregon 215 206 ∼ ∼ 156 148 ∼ ∼Washington 483 440 ∼ 16 332 306 ∼ ∼Seattle-Puget Sound 333 303 ∼ ∼ 230 215 ∼ ∼
∗ Data are from all state and metropolitan area cancer registries, except Maryland. Included data cover approximately 98% of the population and met data quality
criteria for all invasive cancer sites combined. See Appendix B for registry-specific data quality information.† Invasive cancers only.‡ Data for specified racial or ethnic populations other than white and black should be interpreted with caution. See Technical Notes.
§ Hispanic origin is not mutually exclusive from race categories (white, black).
∼ Counts are suppressed if fewer than 16 cases were reported in a specific category (area, sex, race, ethnicity).
- Counts are suppressed at the state’s or metropolitan area’s request. See Technical Notes.
Notes: Cases from suppressed counts are included in region/division counts. Region/division counts are presented for regions/divisions with 100% of the
population covered by registries that meet the data quality criteria specified above unless the count for exactly one state in the region or division
is suppressed due to a count of less than 16. Michigan, Georgia, California, and Washington state counts each include cases from the SEER metropolitan
areas.

United
States Cancer Statistics: 2004 Incid
ence and M
ortality
E-��
continued
Table E.13.2: Leukemias. Cancer Death Counts by U.S. Census Region and Division, State, and Race andEthnicity, United States,∗ 2004
Male Female
Area All Races White Black Hispanic†‡ All Races White Black Hispanic†‡
United States 12,051 10,788 989 672 9,421 8,352 885 481
Northeast 2,346 2,138 168 94 1,983 1,812 146 60
New England 563 535 18 ∼ 508 483 20 ∼Connecticut 124 118 ∼ ∼ 115 104 ∼ ∼Maine 58 58 ∼ ∼ 42 41 ∼ ∼Massachusetts 261 243 ∼ ∼ 242 231 ∼ ∼New Hampshire 56 55 ∼ ∼ 33 33 ∼ ∼Rhode Island 43 40 ∼ ∼ 55 53 ∼ ∼Vermont 21 21 ∼ ∼ 21 21 ∼ ∼
Middle Atlantic 1,783 1,603 150 84 1,475 1,329 126 53
New Jersey 358 320 29 ∼ 317 279 28 ∼New York 790 697 74 60 654 578 67 37
Pennsylvania 635 586 47 ∼ 504 472 31 ∼Midwest 2,934 2,723 187 56 162 30
East North Central 2,032 1,861 157 44 1,597 1,451 137 18
Illinois 534 483 44 29 411 366 41 ∼Indiana 276 263 ∼ ∼ 211 197 ∼ ∼Michigan 417 369 44 ∼ 357 319 36 ∼Ohio 526 478 48 ∼ 401 359 41 ∼Wisconsin 279 268 ∼ ∼ 217 210 ∼ ∼
West North Central 902 862 30 ∼ 25 ∼Iowa 156 154 ∼ ∼ 145 143 ∼ ∼Kansas 126 122 ∼ ∼ 100 99 ∼ ∼Minnesota 232 222 ∼ ∼ 169 164 ∼ ∼Missouri 259 236 21 ∼ 200 180 18 ∼Nebraska 76 75 ∼ ∼ 59 58 ∼ ∼North Dakota 19 19 ∼ ∼ ∼ ∼ ∼ ∼South Dakota 34 34 ∼ ∼ 37 36 ∼ ∼
South 4,285 3,712 534 234 3,363 2,811 516 196
South Atlantic 2,304 1,977 311 94 1,781 1,441 317 78
Delaware 34 31 ∼ ∼ 32 29 ∼ ∼District of Columbia 23 ∼ ∼ ∼ 20 ∼ ∼ ∼Florida 882 803 73 79 645 573 65 63
Georgia 292 235 56 ∼ 275 209 64 ∼Maryland 209 165 41 ∼ 169 130 38 ∼North Carolina 318 268 47 ∼ 234 173 56 ∼South Carolina 171 140 31 ∼ 127 98 29 ∼Virginia 285 236 46 ∼ 214 160 46 ∼West Virginia 90 89 ∼ ∼ 65 63 ∼ ∼
East South Central 737 651 ∼ 627 526 ∼Alabama 209 183 26 ∼ 156 122 34 ∼Kentucky 152 145 ∼ ∼ 151 143 ∼ ∼Mississippi 107 78 29 ∼ 108 75 33 ∼Tennessee 269 245 24 ∼ 212 186 26 ∼
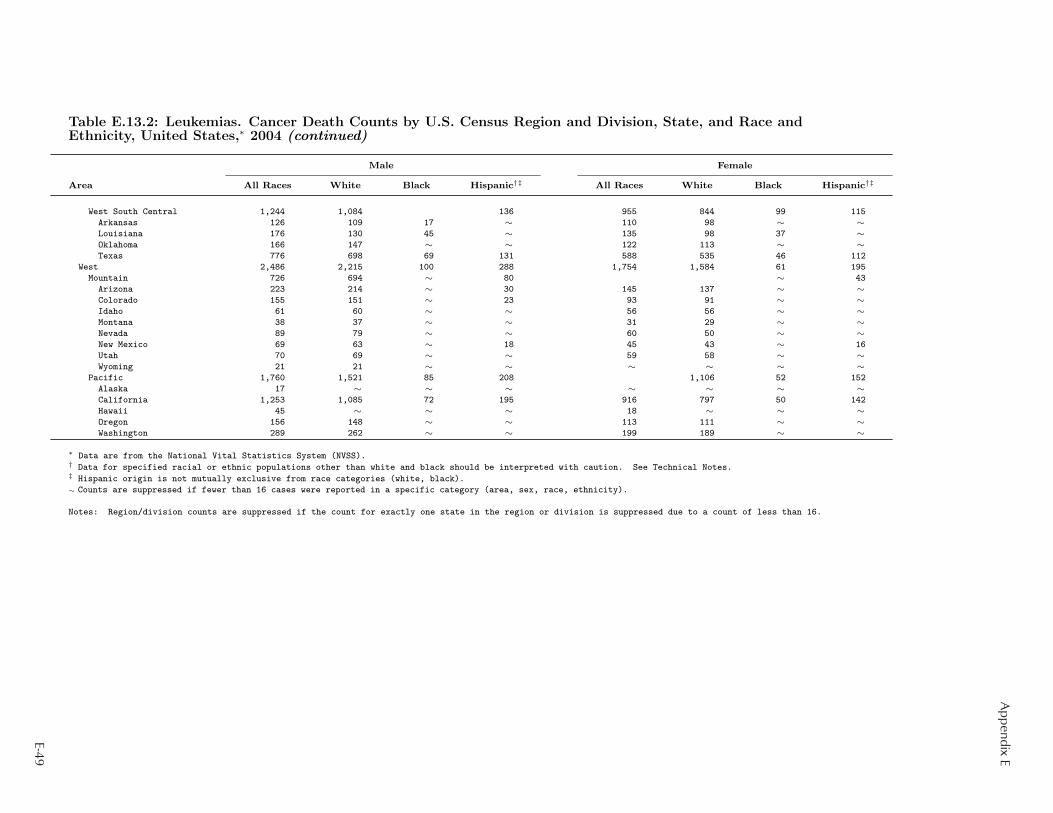
Appendix E
E-��
Table E.13.2: Leukemias. Cancer Death Counts by U.S. Census Region and Division, State, and Race andEthnicity, United States,∗ 2004 (continued)
Male Female
Area All Races White Black Hispanic†‡ All Races White Black Hispanic†‡
West South Central 1,244 1,084 136 955 844 99 115
Arkansas 126 109 17 ∼ 110 98 ∼ ∼Louisiana 176 130 45 ∼ 135 98 37 ∼Oklahoma 166 147 ∼ ∼ 122 113 ∼ ∼Texas 776 698 69 131 588 535 46 112
West 2,486 2,215 100 288 1,754 1,584 61 195
Mountain 726 694 ∼ 80 ∼ 43
Arizona 223 214 ∼ 30 145 137 ∼ ∼Colorado 155 151 ∼ 23 93 91 ∼ ∼Idaho 61 60 ∼ ∼ 56 56 ∼ ∼Montana 38 37 ∼ ∼ 31 29 ∼ ∼Nevada 89 79 ∼ ∼ 60 50 ∼ ∼New Mexico 69 63 ∼ 18 45 43 ∼ 16
Utah 70 69 ∼ ∼ 59 58 ∼ ∼Wyoming 21 21 ∼ ∼ ∼ ∼ ∼ ∼
Pacific 1,760 1,521 85 208 1,106 52 152
Alaska 17 ∼ ∼ ∼ ∼ ∼ ∼ ∼California 1,253 1,085 72 195 916 797 50 142
Hawaii 45 ∼ ∼ ∼ 18 ∼ ∼ ∼Oregon 156 148 ∼ ∼ 113 111 ∼ ∼Washington 289 262 ∼ ∼ 199 189 ∼ ∼
∗ Data are from the National Vital Statistics System (NVSS).† Data for specified racial or ethnic populations other than white and black should be interpreted with caution. See Technical Notes.‡ Hispanic origin is not mutually exclusive from race categories (white, black).
∼ Counts are suppressed if fewer than 16 cases were reported in a specific category (area, sex, race, ethnicity).
Notes: Region/division counts are suppressed if the count for exactly one state in the region or division is suppressed due to a count of less than 16.
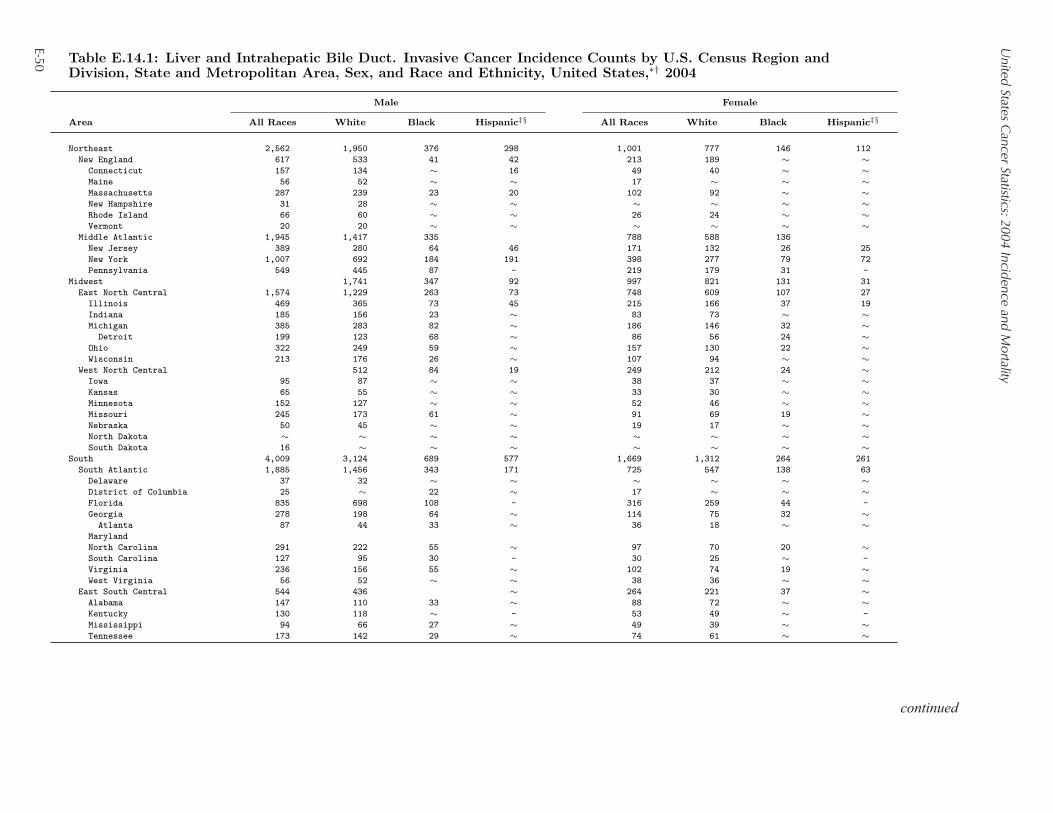
United
States Cancer Statistics: 2004 Incid
ence and M
ortality
E-�0
continued
Table E.14.1: Liver and Intrahepatic Bile Duct. Invasive Cancer Incidence Counts by U.S. Census Region andDivision, State and Metropolitan Area, Sex, and Race and Ethnicity, United States,∗† 2004
Male Female
Area All Races White Black Hispanic‡§ All Races White Black Hispanic‡§
Northeast 2,562 1,950 376 298 1,001 777 146 112
New England 617 533 41 42 213 189 ∼ ∼Connecticut 157 134 ∼ 16 49 40 ∼ ∼Maine 56 52 ∼ ∼ 17 ∼ ∼ ∼Massachusetts 287 239 23 20 102 92 ∼ ∼New Hampshire 31 28 ∼ ∼ ∼ ∼ ∼ ∼Rhode Island 66 60 ∼ ∼ 26 24 ∼ ∼Vermont 20 20 ∼ ∼ ∼ ∼ ∼ ∼
Middle Atlantic 1,945 1,417 335 788 588 136
New Jersey 389 280 64 46 171 132 26 25
New York 1,007 692 184 191 398 277 79 72
Pennsylvania 549 445 87 - 219 179 31 -
Midwest 1,741 347 92 997 821 131 31
East North Central 1,574 1,229 263 73 748 609 107 27
Illinois 469 365 73 45 215 166 37 19
Indiana 185 156 23 ∼ 83 73 ∼ ∼Michigan 385 283 82 ∼ 186 146 32 ∼
Detroit 199 123 68 ∼ 86 56 24 ∼Ohio 322 249 59 ∼ 157 130 22 ∼Wisconsin 213 176 26 ∼ 107 94 ∼ ∼
West North Central 512 84 19 249 212 24 ∼Iowa 95 87 ∼ ∼ 38 37 ∼ ∼Kansas 65 55 ∼ ∼ 33 30 ∼ ∼Minnesota 152 127 ∼ ∼ 52 46 ∼ ∼Missouri 245 173 61 ∼ 91 69 19 ∼Nebraska 50 45 ∼ ∼ 19 17 ∼ ∼North Dakota ∼ ∼ ∼ ∼ ∼ ∼ ∼ ∼South Dakota 16 ∼ ∼ ∼ ∼ ∼ ∼ ∼
South 4,009 3,124 689 577 1,669 1,312 264 261
South Atlantic 1,885 1,456 343 171 725 547 138 63
Delaware 37 32 ∼ ∼ ∼ ∼ ∼ ∼District of Columbia 25 ∼ 22 ∼ 17 ∼ ∼ ∼Florida 835 698 108 - 316 259 44 -
Georgia 278 198 64 ∼ 114 75 32 ∼Atlanta 87 44 33 ∼ 36 18 ∼ ∼
Maryland
North Carolina 291 222 55 ∼ 97 70 20 ∼South Carolina 127 95 30 - 30 25 ∼ -
Virginia 236 156 55 ∼ 102 74 19 ∼West Virginia 56 52 ∼ ∼ 38 36 ∼ ∼
East South Central 544 436 ∼ 264 221 37 ∼Alabama 147 110 33 ∼ 88 72 ∼ ∼Kentucky 130 118 ∼ - 53 49 ∼ -
Mississippi 94 66 27 ∼ 49 39 ∼ ∼Tennessee 173 142 29 ∼ 74 61 ∼ ∼

Appendix E
E-��
Table E.14.1: Liver and Intrahepatic Bile Duct. Invasive Cancer Incidence Counts by U.S. Census Region andDivision, State and Metropolitan Area, Sex, and Race and Ethnicity, United States,∗† 2004 (continued)
Male Female
Area All Races White Black Hispanic‡§ All Races White Black Hispanic‡§
West South Central 1,580 1,232 398 680 544 89 196
Arkansas 104 82 19 ∼ 37 30 ∼ ∼Louisiana 228 139 80 ∼ 76 47 28 ∼Oklahoma 131 102 ∼ ∼ 76 58 ∼ ∼Texas 1,117 909 135 384 491 409 49 190
West 2,065 179 617 1,208 839 68 258
Mountain 587 17 166 287 238 ∼ 58
Arizona 237 208 ∼ 56 94 77 ∼ 16
Colorado 145 133 ∼ 38 63 53 ∼ ∼Idaho 40 40 ∼ ∼ 17 16 ∼ ∼Montana 19 ∼ ∼ ∼ ∼ ∼ ∼ ∼Nevada 91 77 ∼ ∼ 35 27 ∼ ∼New Mexico 87 75 ∼ 53 48 40 ∼ 19
Utah 38 30 ∼ ∼ ∼ ∼ ∼ ∼Wyoming ∼ ∼ ∼ ∼ ∼ ∼ ∼ ∼
Pacific 2,260 1,478 162 451 921 601 64 200
Alaska 29 16 ∼ ∼ 16 ∼ ∼ ∼California 1,731 1,111 141 429 701 457 60 189
San Francisco-Oakland 270 125 38 26 88 42 ∼ ∼San Jose-Monterey 128 70 ∼ 30 41 22 ∼ ∼Los Angeles 478 285 52 153 232 139 24 77
Hawaii 78 20 ∼ ∼ 38 ∼ ∼ ∼Oregon 148 128 ∼ ∼ 52 43 ∼ ∼Washington 274 203 ∼ ∼ 114 92 ∼ ∼
Seattle-Puget Sound 197 136 ∼ ∼ 80 63 ∼ ∼∗ Data are from all state and metropolitan area cancer registries, except Maryland. Included data cover approximately 98% of the population and met data quality
criteria for all invasive cancer sites combined. See Appendix B for registry-specific data quality information.† Invasive cancers only.‡ Data for specified racial or ethnic populations other than white and black should be interpreted with caution. See Technical Notes.
§ Hispanic origin is not mutually exclusive from race categories (white, black).
∼ Counts are suppressed if fewer than 16 cases were reported in a specific category (area, sex, race, ethnicity).
- Counts are suppressed at the state’s or metropolitan area’s request. See Technical Notes.
Notes: Cases from suppressed counts are included in region/division counts. Region/division counts are presented for regions/divisions with 100% of the
population covered by registries that meet the data quality criteria specified above unless the count for exactly one state in the region or division
is suppressed due to a count of less than 16. Michigan, Georgia, California, and Washington state counts each include cases from the SEER metropolitan
areas.

United
States Cancer Statistics: 2004 Incid
ence and M
ortality
E-��
continued
Table E.14.2: Liver and Intrahepatic Bile Duct. Cancer Death Counts by U.S. Census Region and Division,State, Sex, and Race and Ethnicity, United States,∗ 2004
Male Female
Area All Races White Black Hispanic†‡ All Races White Black Hispanic†‡
United States 9,832 7,694 1,349 1,046 5,489 4,417 665 519
Northeast 1,904 1,525 267 168 135 71
New England 487 436 34 25 ∼ ∼Connecticut 125 113 ∼ ∼ 59 57 ∼ ∼Maine 41 40 ∼ ∼ 22 22 ∼ ∼Massachusetts 216 187 18 ∼ 125 115 ∼ ∼New Hampshire 35 35 ∼ ∼ 19 19 ∼ ∼Rhode Island 51 43 ∼ ∼ 21 19 ∼ ∼Vermont 19 18 ∼ ∼ ∼ ∼ ∼ ∼
Middle Atlantic 1,417 1,089 233 866 705 128
New Jersey 286 219 50 19 188 159 18 18
New York 682 493 123 116 405 304 80 42
Pennsylvania 449 377 60 ∼ 273 242 30 ∼Midwest 280 51 1,043 128 35
East North Central 1,391 1,113 42 878 747 107 30
Illinois 379 288 69 21 260 200 50 17
Indiana 181 155 24 ∼ 101 96 ∼ ∼Michigan 318 240 64 ∼ 207 175 25 ∼Ohio 324 262 56 ∼ 217 193 22 ∼Wisconsin 189 168 ∼ ∼ 93 83 ∼ ∼
West North Central 52 ∼ 296 21 ∼Iowa 85 78 ∼ ∼ 55 54 ∼ ∼Kansas 58 52 ∼ ∼ 35 34 ∼ ∼Minnesota 120 104 ∼ ∼ 91 80 ∼ ∼Missouri 206 162 38 ∼ 99 85 ∼ ∼Nebraska 52 48 ∼ ∼ 23 21 ∼ ∼North Dakota ∼ ∼ ∼ ∼ 16 ∼ ∼ ∼South Dakota 24 24 ∼ ∼ ∼ ∼ ∼ ∼
South 3,656 2,856 682 400 1,942 1,523 351 203
South Atlantic 1,763 1,371 338 110 898 693 172 62
Delaware 30 25 ∼ ∼ ∼ ∼ ∼ ∼District of Columbia 21 ∼ 19 ∼ ∼ ∼ ∼ ∼Florida 717 630 72 89 322 274 37 51
Georgia 205 138 56 ∼ 114 82 28 ∼Maryland 151 98 43 ∼ 92 70 19 ∼North Carolina 236 188 44 ∼ 131 99 27 ∼South Carolina 131 87 43 ∼ 64 42 20 ∼Virginia 216 150 54 ∼ 111 80 23 ∼West Virginia 56 53 ∼ ∼ 44 42 ∼ ∼
East South Central 566 445 ∼ 377 303 ∼Alabama 160 120 37 ∼ 108 85 20 ∼Kentucky 109 96 ∼ ∼ 95 86 ∼ ∼Mississippi 104 70 31 ∼ 65 44 21 ∼Tennessee 193 159 31 ∼ 109 88 20 ∼

Appendix E
E-�3
Table E.14.2: Liver and Intrahepatic Bile Duct. Cancer Death Counts by U.S. Census Region and Division,State, Sex, and Race and Ethnicity, United States,∗ 2004 (continued)
Male Female
Area All Races White Black Hispanic†‡ All Races White Black Hispanic†‡
West South Central 1,327 1,040 234 289 667 527 110 140
Arkansas 121 106 ∼ ∼ 69 55 ∼ ∼Louisiana 202 112 83 ∼ 108 68 38 ∼Oklahoma 103 81 ∼ ∼ 61 45 ∼ ∼Texas 901 741 129 281 429 359 54 133
West 2,327 1,723 120 427 1,219 905 51 210
Mountain 573 518 ∼ 139 325 275 ∼ 51
Arizona 203 186 ∼ 42 104 87 ∼ ∼Colorado 100 89 ∼ 23 79 68 ∼ 18
Idaho 34 34 ∼ ∼ ∼ ∼ ∼ ∼Montana ∼ ∼ ∼ ∼ 18 16 ∼ ∼Nevada 94 77 ∼ ∼ 34 23 ∼ ∼New Mexico 83 77 ∼ 56 46 38 ∼ 16
Utah 35 33 ∼ ∼ 22 21 ∼ ∼Wyoming ∼ ∼ ∼ ∼ ∼ ∼ ∼ ∼
Pacific 1,754 106 288 630 45 159
Alaska 21 ∼ ∼ ∼ ∼ ∼ ∼ ∼California 1,310 887 95 277 675 479 43 152
Hawaii 72 16 ∼ ∼ 40 ∼ ∼ ∼Oregon 115 99 ∼ ∼ 56 51 ∼ ∼Washington 236 190 ∼ ∼ 110 88 ∼ ∼
∗ Data are from the National Vital Statistics System (NVSS).† Data for specified racial or ethnic populations other than white and black should be interpreted with caution. See Technical Notes.‡ Hispanic origin is not mutually exclusive from race categories (white, black).
∼ Counts are suppressed if fewer than 16 cases were reported in a specific category (area, sex, race, ethnicity).
Notes: Region/division counts are suppressed if the count for exactly one state in the region or division is suppressed due to a count of less than 16.
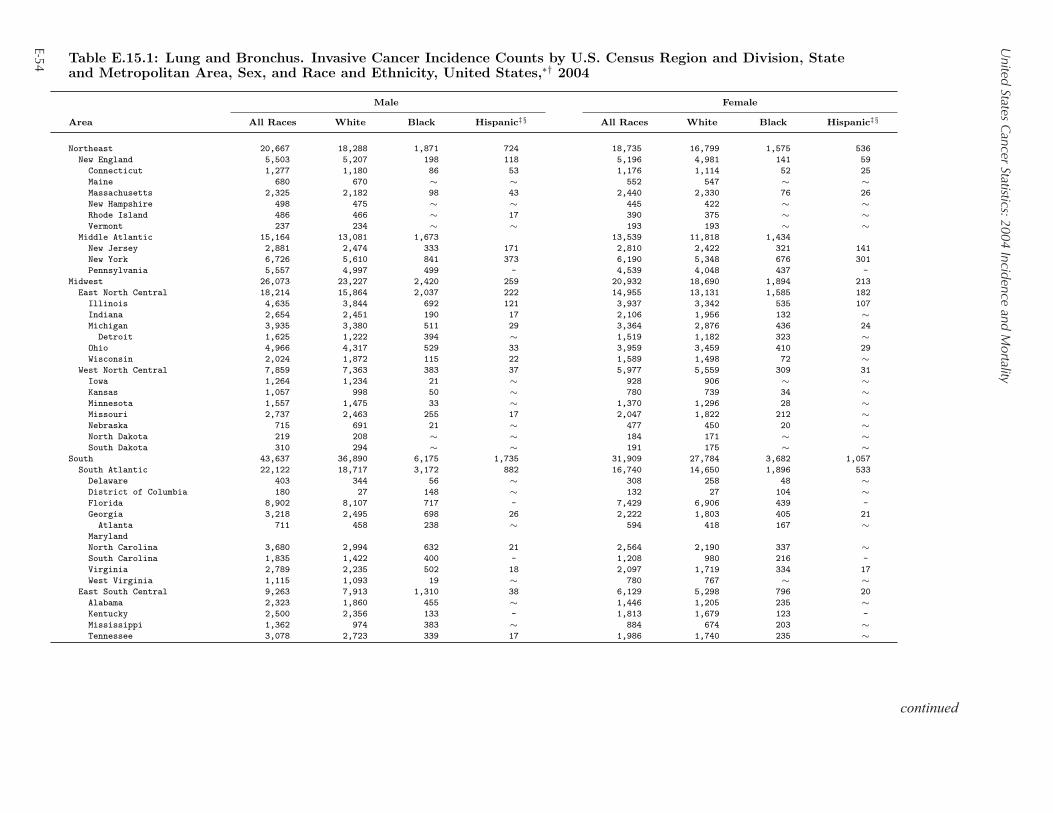
United
States Cancer Statistics: 2004 Incid
ence and M
ortality
E-��
continued
Table E.15.1: Lung and Bronchus. Invasive Cancer Incidence Counts by U.S. Census Region and Division, Stateand Metropolitan Area, Sex, and Race and Ethnicity, United States,∗† 2004
Male Female
Area All Races White Black Hispanic‡§ All Races White Black Hispanic‡§
Northeast 20,667 18,288 1,871 724 18,735 16,799 1,575 536
New England 5,503 5,207 198 118 5,196 4,981 141 59
Connecticut 1,277 1,180 86 53 1,176 1,114 52 25
Maine 680 670 ∼ ∼ 552 547 ∼ ∼Massachusetts 2,325 2,182 98 43 2,440 2,330 76 26
New Hampshire 498 475 ∼ ∼ 445 422 ∼ ∼Rhode Island 486 466 ∼ 17 390 375 ∼ ∼Vermont 237 234 ∼ ∼ 193 193 ∼ ∼
Middle Atlantic 15,164 13,081 1,673 13,539 11,818 1,434
New Jersey 2,881 2,474 333 171 2,810 2,422 321 141
New York 6,726 5,610 841 373 6,190 5,348 676 301
Pennsylvania 5,557 4,997 499 - 4,539 4,048 437 -
Midwest 26,073 23,227 2,420 259 20,932 18,690 1,894 213
East North Central 18,214 15,864 2,037 222 14,955 13,131 1,585 182
Illinois 4,635 3,844 692 121 3,937 3,342 535 107
Indiana 2,654 2,451 190 17 2,106 1,956 132 ∼Michigan 3,935 3,380 511 29 3,364 2,876 436 24
Detroit 1,625 1,222 394 ∼ 1,519 1,182 323 ∼Ohio 4,966 4,317 529 33 3,959 3,459 410 29
Wisconsin 2,024 1,872 115 22 1,589 1,498 72 ∼West North Central 7,859 7,363 383 37 5,977 5,559 309 31
Iowa 1,264 1,234 21 ∼ 928 906 ∼ ∼Kansas 1,057 998 50 ∼ 780 739 34 ∼Minnesota 1,557 1,475 33 ∼ 1,370 1,296 28 ∼Missouri 2,737 2,463 255 17 2,047 1,822 212 ∼Nebraska 715 691 21 ∼ 477 450 20 ∼North Dakota 219 208 ∼ ∼ 184 171 ∼ ∼South Dakota 310 294 ∼ ∼ 191 175 ∼ ∼
South 43,637 36,890 6,175 1,735 31,909 27,784 3,682 1,057
South Atlantic 22,122 18,717 3,172 882 16,740 14,650 1,896 533
Delaware 403 344 56 ∼ 308 258 48 ∼District of Columbia 180 27 148 ∼ 132 27 104 ∼Florida 8,902 8,107 717 - 7,429 6,906 439 -
Georgia 3,218 2,495 698 26 2,222 1,803 405 21
Atlanta 711 458 238 ∼ 594 418 167 ∼Maryland
North Carolina 3,680 2,994 632 21 2,564 2,190 337 ∼South Carolina 1,835 1,422 400 - 1,208 980 216 -
Virginia 2,789 2,235 502 18 2,097 1,719 334 17
West Virginia 1,115 1,093 19 ∼ 780 767 ∼ ∼East South Central 9,263 7,913 1,310 38 6,129 5,298 796 20
Alabama 2,323 1,860 455 ∼ 1,446 1,205 235 ∼Kentucky 2,500 2,356 133 - 1,813 1,679 123 -
Mississippi 1,362 974 383 ∼ 884 674 203 ∼Tennessee 3,078 2,723 339 17 1,986 1,740 235 ∼
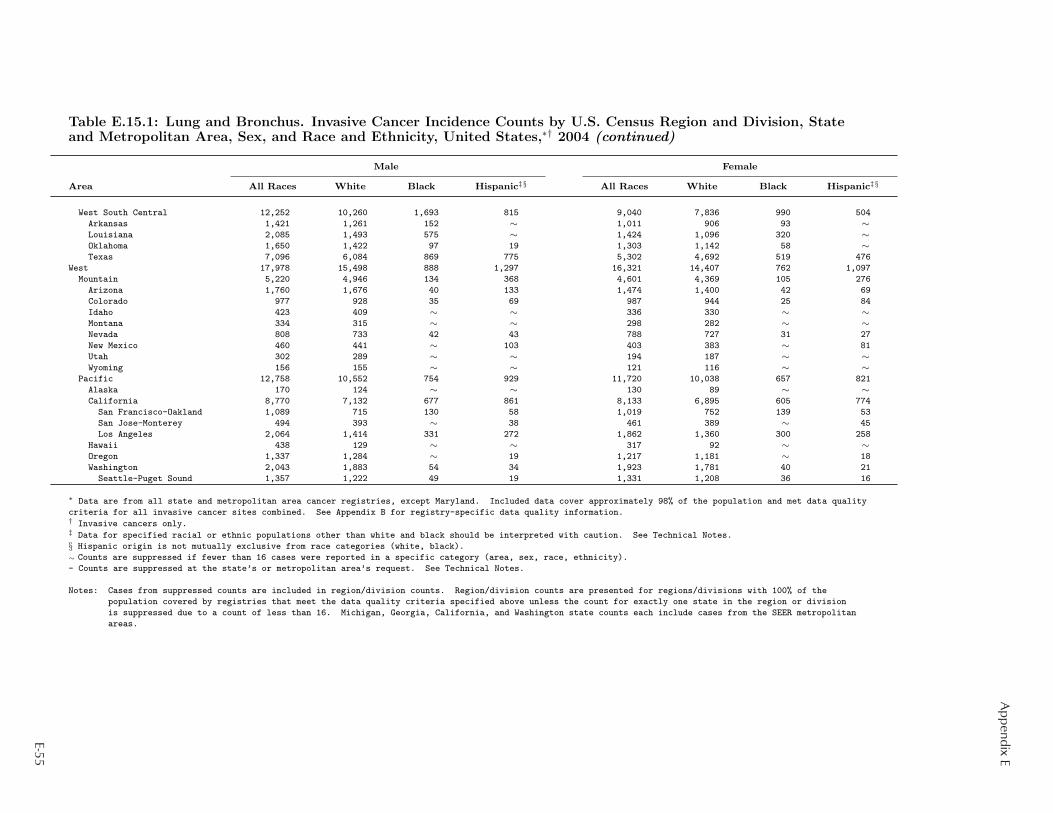
Appendix E
E-��
Table E.15.1: Lung and Bronchus. Invasive Cancer Incidence Counts by U.S. Census Region and Division, Stateand Metropolitan Area, Sex, and Race and Ethnicity, United States,∗† 2004 (continued)
Male Female
Area All Races White Black Hispanic‡§ All Races White Black Hispanic‡§
West South Central 12,252 10,260 1,693 815 9,040 7,836 990 504
Arkansas 1,421 1,261 152 ∼ 1,011 906 93 ∼Louisiana 2,085 1,493 575 ∼ 1,424 1,096 320 ∼Oklahoma 1,650 1,422 97 19 1,303 1,142 58 ∼Texas 7,096 6,084 869 775 5,302 4,692 519 476
West 17,978 15,498 888 1,297 16,321 14,407 762 1,097
Mountain 5,220 4,946 134 368 4,601 4,369 105 276
Arizona 1,760 1,676 40 133 1,474 1,400 42 69
Colorado 977 928 35 69 987 944 25 84
Idaho 423 409 ∼ ∼ 336 330 ∼ ∼Montana 334 315 ∼ ∼ 298 282 ∼ ∼Nevada 808 733 42 43 788 727 31 27
New Mexico 460 441 ∼ 103 403 383 ∼ 81
Utah 302 289 ∼ ∼ 194 187 ∼ ∼Wyoming 156 155 ∼ ∼ 121 116 ∼ ∼
Pacific 12,758 10,552 754 929 11,720 10,038 657 821
Alaska 170 124 ∼ ∼ 130 89 ∼ ∼California 8,770 7,132 677 861 8,133 6,895 605 774
San Francisco-Oakland 1,089 715 130 58 1,019 752 139 53
San Jose-Monterey 494 393 ∼ 38 461 389 ∼ 45
Los Angeles 2,064 1,414 331 272 1,862 1,360 300 258
Hawaii 438 129 ∼ ∼ 317 92 ∼ ∼Oregon 1,337 1,284 ∼ 19 1,217 1,181 ∼ 18
Washington 2,043 1,883 54 34 1,923 1,781 40 21
Seattle-Puget Sound 1,357 1,222 49 19 1,331 1,208 36 16
∗ Data are from all state and metropolitan area cancer registries, except Maryland. Included data cover approximately 98% of the population and met data quality
criteria for all invasive cancer sites combined. See Appendix B for registry-specific data quality information.† Invasive cancers only.‡ Data for specified racial or ethnic populations other than white and black should be interpreted with caution. See Technical Notes.
§ Hispanic origin is not mutually exclusive from race categories (white, black).
∼ Counts are suppressed if fewer than 16 cases were reported in a specific category (area, sex, race, ethnicity).
- Counts are suppressed at the state’s or metropolitan area’s request. See Technical Notes.
Notes: Cases from suppressed counts are included in region/division counts. Region/division counts are presented for regions/divisions with 100% of the
population covered by registries that meet the data quality criteria specified above unless the count for exactly one state in the region or division
is suppressed due to a count of less than 16. Michigan, Georgia, California, and Washington state counts each include cases from the SEER metropolitan
areas.

United
States Cancer Statistics: 2004 Incid
ence and M
ortality
E-��
continued
Table E.15.2: Lung and Bronchus. Cancer Death Counts by U.S. Census Region and Division, State, Sex, andRace and Ethnicity, United States,∗ 2004
Male Female
Area All Races White Black Hispanic†‡ All Races White Black Hispanic†‡
United States 89,575 77,685 9,987 2,700 68,431 60,667 6,475 1,510
Northeast 16,215 14,488 1,456 399 13,846 12,500 1,208 231
New England 4,429 4,243 148 52 3,788 3,659 110 23
Connecticut 1,055 978 69 22 872 828 42 ∼Maine 524 521 ∼ ∼ 427 425 ∼ ∼Massachusetts 1,885 1,792 70 24 1,727 1,656 57 ∼New Hampshire 396 394 ∼ ∼ 335 333 ∼ ∼Rhode Island 376 365 ∼ ∼ 293 283 ∼ ∼Vermont 193 193 ∼ ∼ 134 134 ∼ ∼
Middle Atlantic 11,786 10,245 1,308 347 10,058 8,841 1,098
New Jersey 2,346 2,010 286 69 2,141 1,876 244 37
New York 4,980 4,209 615 250 4,404 3,840 479 156
Pennsylvania 4,460 4,026 407 28 3,513 3,125 375 ∼Midwest 21,850 19,597 2,063 179 16,349 14,698 1,503 86
East North Central 15,198 13,350 1,739 154 11,587 10,259 1,251 69
Illinois 3,840 3,217 575 80 2,964 2,512 424 38
Indiana 2,209 2,044 164 ∼ 1,616 1,508 104 ∼Michigan 3,290 2,804 454 36 2,534 2,215 298 16
Ohio 4,188 3,727 451 17 3,239 2,867 367 ∼Wisconsin 1,671 1,558 95 ∼ 1,234 1,157 58 ∼
West North Central 6,652 6,247 324 25 4,762 4,439 252 17
Iowa 1,072 1,053 ∼ ∼ 751 730 16 ∼Kansas 900 846 44 ∼ 644 599 32 ∼Minnesota 1,296 1,249 20 ∼ 1,059 1,022 20 ∼Missouri 2,383 2,145 225 ∼ 1,650 1,476 169 ∼Nebraska 531 506 19 ∼ 346 329 ∼ ∼North Dakota 212 206 ∼ ∼ 146 132 ∼ ∼South Dakota 258 242 ∼ ∼ 166 151 ∼ ∼
South 36,932 30,918 5,703 1,118 25,730 22,225 3,247 597
South Atlantic 19,263 16,059 3,060 513 13,823 11,911 1,786 276
Delaware 329 281 46 ∼ 254 219 31 ∼District of Columbia 166 40 125 ∼ 117 24 91 ∼Florida 6,804 6,193 576 462 5,261 4,902 322 235
Georgia 2,672 2,095 566 16 1,641 1,312 315 ∼Maryland 1,547 1,132 394 ∼ 1,298 1,002 282 ∼North Carolina 3,037 2,461 528 ∼ 1,996 1,673 301 ∼South Carolina 1,560 1,216 342 ∼ 943 778 160 ∼Virginia 2,278 1,789 465 ∼ 1,714 1,413 273 20
West Virginia 870 852 18 ∼ 599 588 ∼ ∼East South Central 7,601 6,450 1,130 ∼ 4,903 4,247 641 ∼Alabama 1,884 1,525 353 ∼ 1,167 978 186 ∼Kentucky 1,942 1,836 102 ∼ 1,372 1,286 85 ∼Mississippi 1,226 870 354 ∼ 743 554 185 ∼Tennessee 2,549 2,219 321 ∼ 1,621 1,429 185 ∼

Appendix E
E-��
Table E.15.2: Lung and Bronchus. Cancer Death Counts by U.S. Census Region and Division, State, Sex, andRace and Ethnicity, United States,∗ 2004 (continued)
Male Female
Area All Races White Black Hispanic†‡ All Races White Black Hispanic†‡
West South Central 10,068 8,409 1,513 591 7,004 6,067 820 308
Arkansas 1,263 1,116 146 ∼ 837 770 63 ∼Louisiana 1,765 1,219 539 ∼ 1,151 886 261 ∼Oklahoma 1,387 1,235 77 ∼ 972 876 42 ∼Texas 5,653 4,839 751 571 4,044 3,535 454 295
West 14,578 12,682 765 1,004 12,506 11,244 517 596
Mountain 4,254 4,055 112 298 3,546 3,405 68 173
Arizona 1,505 1,448 32 110 1,182 1,136 27 44
Colorado 789 750 32 57 712 686 17 50
Idaho 302 298 ∼ ∼ 233 232 ∼ ∼Montana 263 254 ∼ ∼ 240 232 ∼ ∼Nevada 627 568 36 27 612 572 19 ∼New Mexico 372 352 ∼ 88 304 293 ∼ 56
Utah 278 268 ∼ ∼ 176 170 ∼ ∼Wyoming 118 117 ∼ ∼ 87 84 ∼ ∼
Pacific 10,324 8,627 653 706 8,960 7,839 449 423
Alaska 123 89 ∼ ∼ 106 84 ∼ ∼California 7,150 5,870 586 665 6,249 5,388 421 394
Hawaii 311 78 ∼ ∼ 212 66 ∼ ∼Oregon 1,096 1,052 20 ∼ 971 946 ∼ ∼Washington 1,644 1,538 39 ∼ 1,422 1,355 ∼ ∼
∗ Data are from the National Vital Statistics System (NVSS).† Data for specified racial or ethnic populations other than white and black should be interpreted with caution. See Technical Notes.‡ Hispanic origin is not mutually exclusive from race categories (white, black).
∼ Counts are suppressed if fewer than 16 cases were reported in a specific category (area, sex, race, ethnicity).
Notes: Region/division counts are suppressed if the count for exactly one state in the region or division is suppressed due to a count of less than 16.
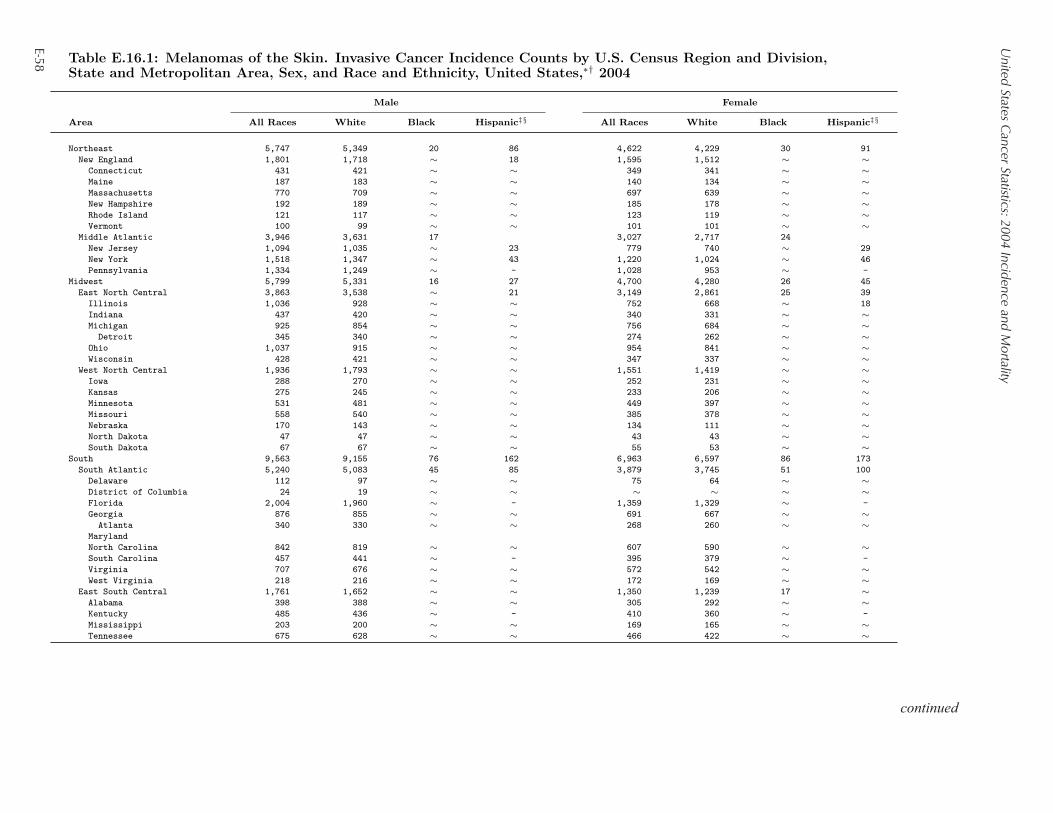
United
States Cancer Statistics: 2004 Incid
ence and M
ortality
E-��
continued
Table E.16.1: Melanomas of the Skin. Invasive Cancer Incidence Counts by U.S. Census Region and Division,State and Metropolitan Area, Sex, and Race and Ethnicity, United States,∗† 2004
Male Female
Area All Races White Black Hispanic‡§ All Races White Black Hispanic‡§
Northeast 5,747 5,349 20 86 4,622 4,229 30 91
New England 1,801 1,718 ∼ 18 1,595 1,512 ∼ ∼Connecticut 431 421 ∼ ∼ 349 341 ∼ ∼Maine 187 183 ∼ ∼ 140 134 ∼ ∼Massachusetts 770 709 ∼ ∼ 697 639 ∼ ∼New Hampshire 192 189 ∼ ∼ 185 178 ∼ ∼Rhode Island 121 117 ∼ ∼ 123 119 ∼ ∼Vermont 100 99 ∼ ∼ 101 101 ∼ ∼
Middle Atlantic 3,946 3,631 17 3,027 2,717 24
New Jersey 1,094 1,035 ∼ 23 779 740 ∼ 29
New York 1,518 1,347 ∼ 43 1,220 1,024 ∼ 46
Pennsylvania 1,334 1,249 ∼ - 1,028 953 ∼ -
Midwest 5,799 5,331 16 27 4,700 4,280 26 45
East North Central 3,863 3,538 ∼ 21 3,149 2,861 25 39
Illinois 1,036 928 ∼ ∼ 752 668 ∼ 18
Indiana 437 420 ∼ ∼ 340 331 ∼ ∼Michigan 925 854 ∼ ∼ 756 684 ∼ ∼
Detroit 345 340 ∼ ∼ 274 262 ∼ ∼Ohio 1,037 915 ∼ ∼ 954 841 ∼ ∼Wisconsin 428 421 ∼ ∼ 347 337 ∼ ∼
West North Central 1,936 1,793 ∼ ∼ 1,551 1,419 ∼ ∼Iowa 288 270 ∼ ∼ 252 231 ∼ ∼Kansas 275 245 ∼ ∼ 233 206 ∼ ∼Minnesota 531 481 ∼ ∼ 449 397 ∼ ∼Missouri 558 540 ∼ ∼ 385 378 ∼ ∼Nebraska 170 143 ∼ ∼ 134 111 ∼ ∼North Dakota 47 47 ∼ ∼ 43 43 ∼ ∼South Dakota 67 67 ∼ ∼ 55 53 ∼ ∼
South 9,563 9,155 76 162 6,963 6,597 86 173
South Atlantic 5,240 5,083 45 85 3,879 3,745 51 100
Delaware 112 97 ∼ ∼ 75 64 ∼ ∼District of Columbia 24 19 ∼ ∼ ∼ ∼ ∼ ∼Florida 2,004 1,960 ∼ - 1,359 1,329 ∼ -
Georgia 876 855 ∼ ∼ 691 667 ∼ ∼Atlanta 340 330 ∼ ∼ 268 260 ∼ ∼
Maryland
North Carolina 842 819 ∼ ∼ 607 590 ∼ ∼South Carolina 457 441 ∼ - 395 379 ∼ -
Virginia 707 676 ∼ ∼ 572 542 ∼ ∼West Virginia 218 216 ∼ ∼ 172 169 ∼ ∼
East South Central 1,761 1,652 ∼ ∼ 1,350 1,239 17 ∼Alabama 398 388 ∼ ∼ 305 292 ∼ ∼Kentucky 485 436 ∼ - 410 360 ∼ -
Mississippi 203 200 ∼ ∼ 169 165 ∼ ∼Tennessee 675 628 ∼ ∼ 466 422 ∼ ∼

Appendix E
E-��
Table E.16.1: Melanomas of the Skin. Invasive Cancer Incidence Counts by U.S. Census Region and Division,State and Metropolitan Area, Sex, and Race and Ethnicity, United States,∗† 2004 (continued)
Male Female
Area All Races White Black Hispanic‡§ All Races White Black Hispanic‡§
West South Central 2,562 2,420 21 70 1,734 1,613 18 68
Arkansas 221 216 ∼ ∼ 159 156 ∼ ∼Louisiana 329 315 ∼ ∼ 213 201 ∼ ∼Oklahoma 344 322 ∼ ∼ 290 268 ∼ ∼Texas 1,668 1,567 ∼ 66 1,072 988 ∼ 62
West 7,230 6,884 ∼ 184 5,415 5,053 17 283
Mountain 1,968 1,896 ∼ 32 1,415 1,355 ∼ 52
Arizona 516 468 ∼ ∼ 297 256 ∼ ∼Colorado 442 436 ∼ ∼ 375 368 ∼ 17
Idaho 196 196 ∼ ∼ 152 151 ∼ ∼Montana 87 80 ∼ ∼ 67 62 ∼ ∼Nevada 212 210 ∼ ∼ 143 142 ∼ ∼New Mexico 175 172 ∼ ∼ 128 126 ∼ ∼Utah 276 273 ∼ ∼ 206 203 ∼ ∼Wyoming 64 61 ∼ ∼ 47 47 ∼ ∼
Pacific 5,262 4,988 ∼ 152 4,000 3,698 ∼ 231
Alaska 24 23 ∼ ∼ 27 25 ∼ ∼California 3,715 3,482 ∼ 140 2,653 2,399 ∼ 210
San Francisco-Oakland 365 342 ∼ ∼ 283 240 ∼ ∼San Jose-Monterey 206 194 ∼ ∼ 165 161 ∼ ∼Los Angeles 737 715 ∼ 44 486 464 ∼ 62
Hawaii 170 156 ∼ ∼ 115 98 ∼ ∼Oregon 506 497 ∼ ∼ 460 455 ∼ ∼Washington 847 830 ∼ ∼ 745 721 ∼ ∼
Seattle-Puget Sound 612 610 ∼ ∼ 545 537 ∼ ∼∗ Data are from all state and metropolitan area cancer registries, except Maryland. Included data cover approximately 98% of the population and met data quality
criteria for all invasive cancer sites combined. See Appendix B for registry-specific data quality information.† Invasive cancers only.‡ Data for specified racial or ethnic populations other than white and black should be interpreted with caution. See Technical Notes.
§ Hispanic origin is not mutually exclusive from race categories (white, black).
∼ Counts are suppressed if fewer than 16 cases were reported in a specific category (area, sex, race, ethnicity).
- Counts are suppressed at the state’s or metropolitan area’s request. See Technical Notes.
Notes: Cases from suppressed counts are included in region/division counts. Region/division counts are presented for regions/divisions with 100% of the
population covered by registries that meet the data quality criteria specified above unless the count for exactly one state in the region or division
is suppressed due to a count of less than 16. Michigan, Georgia, California, and Washington state counts each include cases from the SEER metropolitan
areas.

United
States Cancer Statistics: 2004 Incid
ence and M
ortality
E-�0
continued
Table E.16.2: Melanomas of the Skin. Cancer Death Counts by U.S. Census Region and Division, State, Sex,and Race and Ethnicity, United States,∗ 2004
Male Female
Area All Races White Black Hispanic†‡ All Races White Black Hispanic†‡
United States 5,125 5,053 57 79 2,827 2,748 62 59
Northeast ∼ ∼ 591 581 ∼ ∼New England ∼ ∼ 160 160 ∼ ∼
Connecticut 81 78 ∼ ∼ 46 46 ∼ ∼Maine 28 27 ∼ ∼ 16 16 ∼ ∼Massachusetts 125 125 ∼ ∼ 66 66 ∼ ∼New Hampshire 31 31 ∼ ∼ 17 17 ∼ ∼Rhode Island 33 33 ∼ ∼ ∼ ∼ ∼ ∼Vermont ∼ ∼ ∼ ∼ ∼ ∼ ∼ ∼
Middle Atlantic 673 669 ∼ ∼ 431 421 ∼ ∼New Jersey 149 148 ∼ ∼ 95 92 ∼ ∼New York 254 252 ∼ ∼ 185 179 ∼ ∼Pennsylvania 270 269 ∼ ∼ 151 150 ∼ ∼
Midwest 1,128 1,114 ∼ ∼ 667 653 ∼ ∼East North Central 773 764 ∼ ∼ 440 429 ∼ ∼
Illinois 205 202 ∼ ∼ 129 125 ∼ ∼Indiana 116 115 ∼ ∼ 73 71 ∼ ∼Michigan 166 163 ∼ ∼ 78 74 ∼ ∼Ohio 194 192 ∼ ∼ 115 114 ∼ ∼Wisconsin 92 92 ∼ ∼ 45 45 ∼ ∼
West North Central 355 350 ∼ ∼ 227 224 ∼ ∼Iowa 53 53 ∼ ∼ 33 33 ∼ ∼Kansas 55 55 ∼ ∼ 33 31 ∼ ∼Minnesota 72 71 ∼ ∼ 60 60 ∼ ∼Missouri 128 125 ∼ ∼ 66 65 ∼ ∼Nebraska 29 28 ∼ ∼ 23 23 ∼ ∼North Dakota ∼ ∼ ∼ ∼ ∼ ∼ ∼ ∼South Dakota ∼ ∼ ∼ ∼ ∼ ∼ ∼ ∼
South 1,898 1,862 33 33 977 931 43 25
South Atlantic 1,053 1,036 16 ∼ 555 531 23 ∼Delaware 19 19 ∼ ∼ ∼ ∼ ∼ ∼District of Columbia ∼ ∼ ∼ ∼ ∼ ∼ ∼ ∼Florida 418 413 ∼ ∼ 212 207 ∼ ∼Georgia 131 128 ∼ ∼ 72 69 ∼ ∼Maryland 89 88 ∼ ∼ 56 55 ∼ ∼North Carolina 150 146 ∼ ∼ 80 74 ∼ ∼South Carolina 63 62 ∼ ∼ 41 38 ∼ ∼Virginia 132 130 ∼ ∼ 65 62 ∼ ∼West Virginia 44 44 ∼ ∼ 17 17 ∼ ∼
East South Central 310 305 ∼ ∼ 165 156 ∼ ∼Alabama 66 64 ∼ ∼ 40 35 ∼ ∼Kentucky 85 85 ∼ ∼ 45 45 ∼ ∼Mississippi 37 35 ∼ ∼ 20 19 ∼ ∼Tennessee 122 121 ∼ ∼ 60 57 ∼ ∼

Appendix E
E-��
Table E.16.2: Melanomas of the Skin. Cancer Death Counts by U.S. Census Region and Division, State, Sex,and Race and Ethnicity, United States,∗ 2004 (continued)
Male Female
Area All Races White Black Hispanic†‡ All Races White Black Hispanic†‡
West South Central 535 521 ∼ 18 257 244 ∼ ∼Arkansas 59 56 ∼ ∼ 18 18 ∼ ∼Louisiana 56 53 ∼ ∼ 27 26 ∼ ∼Oklahoma 67 66 ∼ ∼ 40 38 ∼ ∼Texas 353 346 ∼ 18 172 162 ∼ ∼
West 1,115 1,101 ∼ 29 592 583 ∼ 16
Mountain 328 326 ∼ ∼ 203 203 ∼ ∼Arizona 105 104 ∼ ∼ 51 51 ∼ ∼Colorado 72 71 ∼ ∼ 51 51 ∼ ∼Idaho 29 29 ∼ ∼ 17 17 ∼ ∼Montana ∼ ∼ ∼ ∼ ∼ ∼ ∼ ∼Nevada 44 44 ∼ ∼ 22 22 ∼ ∼New Mexico 22 22 ∼ ∼ 21 21 ∼ ∼Utah 35 35 ∼ ∼ 18 18 ∼ ∼Wyoming ∼ ∼ ∼ ∼ ∼ ∼ ∼ ∼
Pacific 787 775 ∼ 24 389 380 ∼ ∼Alaska ∼ ∼ ∼ ∼ ∼ ∼ ∼ ∼California 558 549 ∼ 21 271 266 ∼ ∼Hawaii ∼ ∼ ∼ ∼ ∼ ∼ ∼ ∼Oregon 73 73 ∼ ∼ 46 45 ∼ ∼Washington 133 133 ∼ ∼ 63 61 ∼ ∼
∗ Data are from the National Vital Statistics System (NVSS).† Data for specified racial or ethnic populations other than white and black should be interpreted with caution. See Technical Notes.‡ Hispanic origin is not mutually exclusive from race categories (white, black).
∼ Counts are suppressed if fewer than 16 cases were reported in a specific category (area, sex, race, ethnicity).
Notes: Region/division counts are suppressed if the count for exactly one state in the region or division is suppressed due to a count of less than 16.

United
States Cancer Statistics: 2004 Incid
ence and M
ortality
E-��
continued
Table E.17.1: Mesothelioma. Invasive Cancer Incidence Counts by U.S. Census Region and Division, State andMetropolitan Area, Sex, and Race and Ethnicity, United States,∗† 2004
Male Female
Area All Races White Black Hispanic‡§ All Races White Black Hispanic‡§
Northeast 628 604 16 ∼ 157 146 ∼ ∼New England 166 162 ∼ ∼ 35 34 ∼ ∼Connecticut 41 40 ∼ ∼ ∼ ∼ ∼ ∼Maine 18 18 ∼ ∼ ∼ ∼ ∼ ∼Massachusetts 75 73 ∼ ∼ ∼ ∼ ∼ ∼New Hampshire 16 16 ∼ ∼ ∼ ∼ ∼ ∼Rhode Island ∼ ∼ ∼ ∼ ∼ ∼ ∼ ∼Vermont ∼ ∼ ∼ ∼ ∼ ∼ ∼ ∼
Middle Atlantic 462 442 ∼ ∼ 122 112 ∼ ∼New Jersey 113 105 ∼ ∼ 25 22 ∼ ∼New York 159 151 ∼ ∼ 49 45 ∼ ∼Pennsylvania 190 186 ∼ - 48 45 ∼ -
Midwest 527 507 17 ∼ 177 163 ∼ ∼East North Central 376 359 ∼ ∼ 121 111 ∼ ∼Illinois 100 96 ∼ ∼ 38 32 ∼ ∼Indiana 46 45 ∼ ∼ 18 18 ∼ ∼Michigan 75 68 ∼ ∼ 27 24 ∼ ∼
Detroit 40 36 ∼ ∼ ∼ ∼ ∼ ∼Ohio 89 85 ∼ ∼ 19 18 ∼ ∼Wisconsin 66 65 ∼ ∼ 19 19 ∼ ∼
West North Central 151 148 ∼ ∼ 56 52 ∼ ∼Iowa 18 18 ∼ ∼ ∼ ∼ ∼ ∼Kansas 17 17 ∼ ∼ ∼ ∼ ∼ ∼Minnesota 49 47 ∼ ∼ 17 17 ∼ ∼Missouri 33 32 ∼ ∼ ∼ ∼ ∼ ∼Nebraska 17 17 ∼ ∼ ∼ ∼ ∼ ∼North Dakota ∼ ∼ ∼ ∼ ∼ ∼ ∼ ∼South Dakota ∼ ∼ ∼ ∼ ∼ ∼ ∼ ∼
South 746 674 62 40 192 174 17 ∼South Atlantic 401 367 29 ∼ 101 90 ∼ ∼Delaware ∼ ∼ ∼ ∼ ∼ ∼ ∼ ∼District of Columbia ∼ ∼ ∼ ∼ ∼ ∼ ∼ ∼Florida 170 163 ∼ - 42 39 ∼ -
Georgia 35 33 ∼ ∼ ∼ ∼ ∼ ∼Atlanta ∼ ∼ ∼ ∼ ∼ ∼ ∼ ∼
Maryland
North Carolina 54 47 ∼ ∼ 16 ∼ ∼ ∼South Carolina 21 19 ∼ - ∼ ∼ ∼ -
Virginia 81 66 ∼ ∼ ∼ ∼ ∼ ∼West Virginia 28 28 ∼ ∼ ∼ ∼ ∼ ∼
East South Central ∼ ∼ 32 30 ∼ ∼Alabama 23 17 ∼ ∼ ∼ ∼ ∼ ∼Kentucky 19 17 ∼ - ∼ ∼ ∼ -
Mississippi ∼ ∼ ∼ ∼ ∼ ∼ ∼ ∼Tennessee 46 43 ∼ ∼ ∼ ∼ ∼ ∼
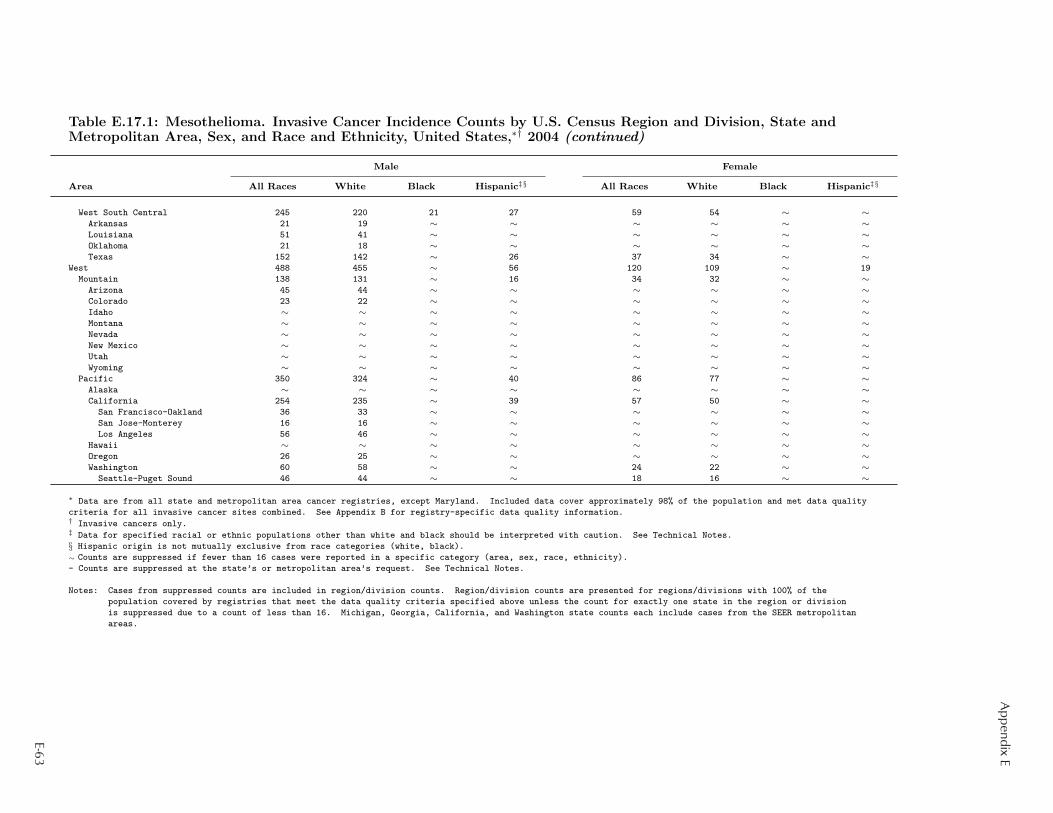
Appendix E
E-�3
Table E.17.1: Mesothelioma. Invasive Cancer Incidence Counts by U.S. Census Region and Division, State andMetropolitan Area, Sex, and Race and Ethnicity, United States,∗† 2004 (continued)
Male Female
Area All Races White Black Hispanic‡§ All Races White Black Hispanic‡§
West South Central 245 220 21 27 59 54 ∼ ∼Arkansas 21 19 ∼ ∼ ∼ ∼ ∼ ∼Louisiana 51 41 ∼ ∼ ∼ ∼ ∼ ∼Oklahoma 21 18 ∼ ∼ ∼ ∼ ∼ ∼Texas 152 142 ∼ 26 37 34 ∼ ∼
West 488 455 ∼ 56 120 109 ∼ 19
Mountain 138 131 ∼ 16 34 32 ∼ ∼Arizona 45 44 ∼ ∼ ∼ ∼ ∼ ∼Colorado 23 22 ∼ ∼ ∼ ∼ ∼ ∼Idaho ∼ ∼ ∼ ∼ ∼ ∼ ∼ ∼Montana ∼ ∼ ∼ ∼ ∼ ∼ ∼ ∼Nevada ∼ ∼ ∼ ∼ ∼ ∼ ∼ ∼New Mexico ∼ ∼ ∼ ∼ ∼ ∼ ∼ ∼Utah ∼ ∼ ∼ ∼ ∼ ∼ ∼ ∼Wyoming ∼ ∼ ∼ ∼ ∼ ∼ ∼ ∼
Pacific 350 324 ∼ 40 86 77 ∼ ∼Alaska ∼ ∼ ∼ ∼ ∼ ∼ ∼ ∼California 254 235 ∼ 39 57 50 ∼ ∼San Francisco-Oakland 36 33 ∼ ∼ ∼ ∼ ∼ ∼San Jose-Monterey 16 16 ∼ ∼ ∼ ∼ ∼ ∼Los Angeles 56 46 ∼ ∼ ∼ ∼ ∼ ∼
Hawaii ∼ ∼ ∼ ∼ ∼ ∼ ∼ ∼Oregon 26 25 ∼ ∼ ∼ ∼ ∼ ∼Washington 60 58 ∼ ∼ 24 22 ∼ ∼
Seattle-Puget Sound 46 44 ∼ ∼ 18 16 ∼ ∼∗ Data are from all state and metropolitan area cancer registries, except Maryland. Included data cover approximately 98% of the population and met data quality
criteria for all invasive cancer sites combined. See Appendix B for registry-specific data quality information.† Invasive cancers only.‡ Data for specified racial or ethnic populations other than white and black should be interpreted with caution. See Technical Notes.
§ Hispanic origin is not mutually exclusive from race categories (white, black).
∼ Counts are suppressed if fewer than 16 cases were reported in a specific category (area, sex, race, ethnicity).
- Counts are suppressed at the state’s or metropolitan area’s request. See Technical Notes.
Notes: Cases from suppressed counts are included in region/division counts. Region/division counts are presented for regions/divisions with 100% of the
population covered by registries that meet the data quality criteria specified above unless the count for exactly one state in the region or division
is suppressed due to a count of less than 16. Michigan, Georgia, California, and Washington state counts each include cases from the SEER metropolitan
areas.
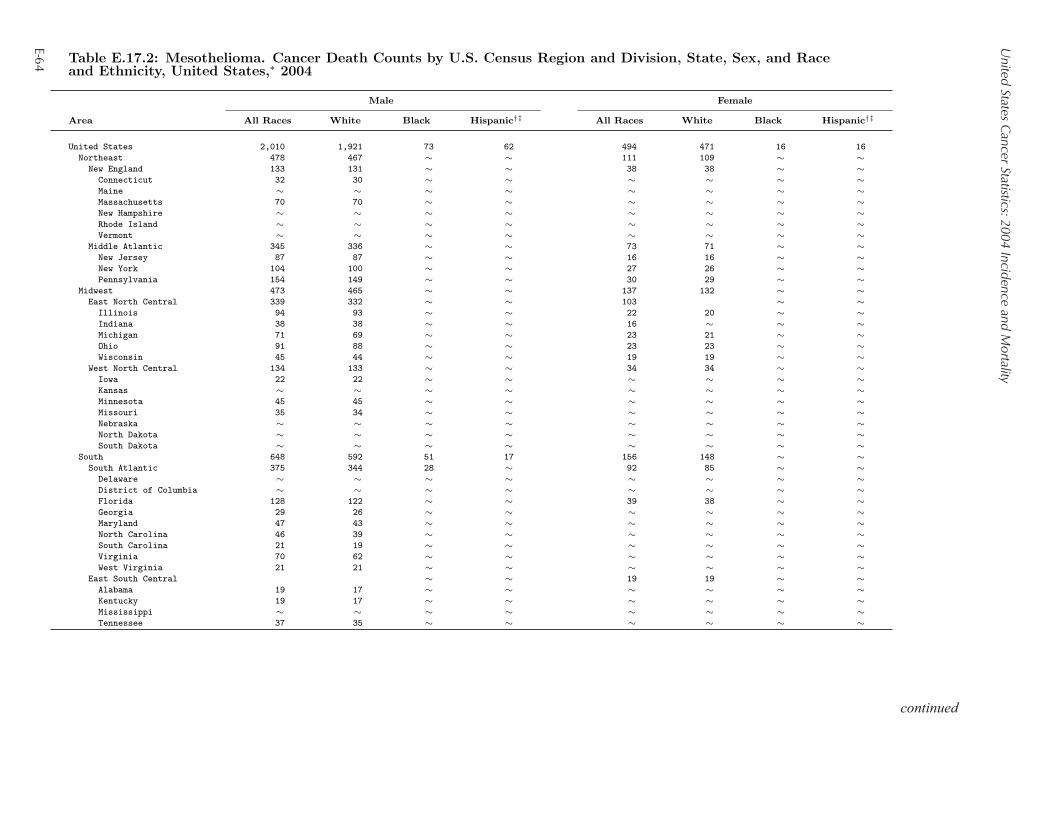
United
States Cancer Statistics: 2004 Incid
ence and M
ortality
E-��
continued
Table E.17.2: Mesothelioma. Cancer Death Counts by U.S. Census Region and Division, State, Sex, and Raceand Ethnicity, United States,∗ 2004
Male Female
Area All Races White Black Hispanic†‡ All Races White Black Hispanic†‡
United States 2,010 1,921 73 62 494 471 16 16
Northeast 478 467 ∼ ∼ 111 109 ∼ ∼New England 133 131 ∼ ∼ 38 38 ∼ ∼
Connecticut 32 30 ∼ ∼ ∼ ∼ ∼ ∼Maine ∼ ∼ ∼ ∼ ∼ ∼ ∼ ∼Massachusetts 70 70 ∼ ∼ ∼ ∼ ∼ ∼New Hampshire ∼ ∼ ∼ ∼ ∼ ∼ ∼ ∼Rhode Island ∼ ∼ ∼ ∼ ∼ ∼ ∼ ∼Vermont ∼ ∼ ∼ ∼ ∼ ∼ ∼ ∼
Middle Atlantic 345 336 ∼ ∼ 73 71 ∼ ∼New Jersey 87 87 ∼ ∼ 16 16 ∼ ∼New York 104 100 ∼ ∼ 27 26 ∼ ∼Pennsylvania 154 149 ∼ ∼ 30 29 ∼ ∼
Midwest 473 465 ∼ ∼ 137 132 ∼ ∼East North Central 339 332 ∼ ∼ 103 ∼ ∼
Illinois 94 93 ∼ ∼ 22 20 ∼ ∼Indiana 38 38 ∼ ∼ 16 ∼ ∼ ∼Michigan 71 69 ∼ ∼ 23 21 ∼ ∼Ohio 91 88 ∼ ∼ 23 23 ∼ ∼Wisconsin 45 44 ∼ ∼ 19 19 ∼ ∼
West North Central 134 133 ∼ ∼ 34 34 ∼ ∼Iowa 22 22 ∼ ∼ ∼ ∼ ∼ ∼Kansas ∼ ∼ ∼ ∼ ∼ ∼ ∼ ∼Minnesota 45 45 ∼ ∼ ∼ ∼ ∼ ∼Missouri 35 34 ∼ ∼ ∼ ∼ ∼ ∼Nebraska ∼ ∼ ∼ ∼ ∼ ∼ ∼ ∼North Dakota ∼ ∼ ∼ ∼ ∼ ∼ ∼ ∼South Dakota ∼ ∼ ∼ ∼ ∼ ∼ ∼ ∼
South 648 592 51 17 156 148 ∼ ∼South Atlantic 375 344 28 ∼ 92 85 ∼ ∼
Delaware ∼ ∼ ∼ ∼ ∼ ∼ ∼ ∼District of Columbia ∼ ∼ ∼ ∼ ∼ ∼ ∼ ∼Florida 128 122 ∼ ∼ 39 38 ∼ ∼Georgia 29 26 ∼ ∼ ∼ ∼ ∼ ∼Maryland 47 43 ∼ ∼ ∼ ∼ ∼ ∼North Carolina 46 39 ∼ ∼ ∼ ∼ ∼ ∼South Carolina 21 19 ∼ ∼ ∼ ∼ ∼ ∼Virginia 70 62 ∼ ∼ ∼ ∼ ∼ ∼West Virginia 21 21 ∼ ∼ ∼ ∼ ∼ ∼
East South Central ∼ ∼ 19 19 ∼ ∼Alabama 19 17 ∼ ∼ ∼ ∼ ∼ ∼Kentucky 19 17 ∼ ∼ ∼ ∼ ∼ ∼Mississippi ∼ ∼ ∼ ∼ ∼ ∼ ∼ ∼Tennessee 37 35 ∼ ∼ ∼ ∼ ∼ ∼

Appendix E
E-��
Table E.17.2: Mesothelioma. Cancer Death Counts by U.S. Census Region and Division, State, Sex, and Raceand Ethnicity, United States,∗ 2004 (continued)
Male Female
Area All Races White Black Hispanic†‡ All Races White Black Hispanic†‡
West South Central 16 ∼ 45 44 ∼ ∼Arkansas ∼ ∼ ∼ ∼ ∼ ∼ ∼ ∼Louisiana 40 34 ∼ ∼ ∼ ∼ ∼ ∼Oklahoma 18 17 ∼ ∼ ∼ ∼ ∼ ∼Texas 113 104 ∼ ∼ 29 28 ∼ ∼
West 411 397 ∼ 36 90 82 ∼ ∼Mountain 116 114 ∼ ∼ 23 20 ∼ ∼
Arizona 29 29 ∼ ∼ ∼ ∼ ∼ ∼Colorado 23 23 ∼ ∼ ∼ ∼ ∼ ∼Idaho ∼ ∼ ∼ ∼ ∼ ∼ ∼ ∼Montana ∼ ∼ ∼ ∼ ∼ ∼ ∼ ∼Nevada ∼ ∼ ∼ ∼ ∼ ∼ ∼ ∼New Mexico ∼ ∼ ∼ ∼ ∼ ∼ ∼ ∼Utah ∼ ∼ ∼ ∼ ∼ ∼ ∼ ∼Wyoming ∼ ∼ ∼ ∼ ∼ ∼ ∼ ∼
Pacific 295 283 ∼ 27 67 62 ∼ ∼Alaska ∼ ∼ ∼ ∼ ∼ ∼ ∼ ∼California 187 182 ∼ 25 45 42 ∼ ∼Hawaii ∼ ∼ ∼ ∼ ∼ ∼ ∼ ∼Oregon 34 34 ∼ ∼ ∼ ∼ ∼ ∼Washington 64 62 ∼ ∼ 16 ∼ ∼ ∼
∗ Data are from the National Vital Statistics System (NVSS).† Data for specified racial or ethnic populations other than white and black should be interpreted with caution. See Technical Notes.‡ Hispanic origin is not mutually exclusive from race categories (white, black).
∼ Counts are suppressed if fewer than 16 cases were reported in a specific category (area, sex, race, ethnicity).
Notes: Region/division counts are suppressed if the count for exactly one state in the region or division is suppressed due to a count of less than 16.

United
States Cancer Statistics: 2004 Incid
ence and M
ortality
E-��
continued
Table E.18.1: Myeloma. Cancer Incidence Counts by U.S. Census Region and Division, State and MetropolitanArea, and Race and Ethnicity, United States,∗† 2004
Male Female
Area All Races White Black Hispanic‡§ All Races White Black Hispanic‡§
Northeast 1,752 1,440 257 131 276 109
New England 413 372 33 19 23 ∼Connecticut 88 72 ∼ ∼ 84 69 ∼ ∼Maine 33 32 ∼ ∼ 39 37 ∼ ∼Massachusetts 204 182 17 ∼ 144 134 ∼ ∼New Hampshire 37 37 ∼ ∼ 29 29 ∼ ∼Rhode Island 30 28 ∼ ∼ 31 28 ∼ ∼Vermont 21 21 ∼ ∼ ∼ ∼ ∼ ∼
Middle Atlantic 1,339 1,068 224 1,170 874 253
New Jersey 292 227 54 34 234 171 56 26
New York 636 489 120 68 599 421 151 70
Pennsylvania 411 352 50 - 337 282 46 -
Midwest 2,021 1,698 276 25 1,683 1,375 263 38
East North Central 1,369 1,098 23 1,142 886 226 31
Illinois 364 271 82 ∼ 333 240 84 20
Indiana 172 153 17 ∼ 137 120 ∼ ∼Michigan 336 252 76 ∼ 253 185 61 ∼
Detroit 153 99 52 ∼ 118 64 51 ∼Ohio 317 260 51 ∼ 275 212 54 ∼Wisconsin 180 162 ∼ ∼ 144 129 ∼ ∼
West North Central 652 600 37 ∼ 541 489 37 ∼Iowa 89 86 ∼ ∼ 74 72 ∼ ∼Kansas 94 86 ∼ ∼ 81 74 ∼ ∼Minnesota 155 147 ∼ ∼ 122 113 ∼ ∼Missouri 207 181 24 ∼ 154 129 21 ∼Nebraska 56 52 ∼ ∼ 59 52 ∼ ∼North Dakota 17 17 ∼ ∼ 21 21 ∼ ∼South Dakota 34 31 ∼ ∼ 30 28 ∼ ∼
South 3,078 2,240 748 201 2,602 1,817 722 201
South Atlantic 1,531 1,099 395 80 1,344 917 398 89
Delaware 35 29 ∼ ∼ ∼ ∼ ∼ ∼District of Columbia 33 ∼ 27 ∼ 23 ∼ ∼ ∼Florida 608 486 104 - 516 408 98 -
Georgia 232 136 94 ∼ 212 129 81 ∼Atlanta 61 26 35 ∼ 75 39 35 ∼
Maryland
North Carolina 259 175 79 ∼ 219 144 75 ∼South Carolina 122 87 35 - 141 74 63 -
Virginia 181 124 48 ∼ 175 106 60 ∼West Virginia 61 58 ∼ ∼ 46 43 ∼ ∼
East South Central 573 421 ∼ 464 309 ∼Alabama 179 118 58 ∼ 136 80 55 ∼Kentucky 126 115 ∼ - 117 97 ∼ -
Mississippi 99 61 38 ∼ 98 52 45 ∼Tennessee 169 127 40 ∼ 113 80 33 ∼

Appendix E
E-��
Table E.18.1: Myeloma. Cancer Incidence Counts by U.S. Census Region and Division, State and MetropolitanArea, and Race and Ethnicity, United States,∗† 2004 (continued)
Male Female
Area All Races White Black Hispanic‡§ All Races White Black Hispanic‡§
West South Central 974 720 120 794 591 112
Arkansas 90 68 19 ∼ 73 55 16 ∼Louisiana 146 71 75 ∼ 136 74 62 ∼Oklahoma 115 92 ∼ ∼ 73 61 ∼ ∼Texas 623 489 103 113 512 401 95 104
West 1,777 141 236 1,339 1,063 135 203
Mountain 484 443 21 47 ∼ 49
Arizona 123 110 ∼ 19 107 94 ∼ ∼Colorado 109 96 ∼ ∼ 67 60 ∼ ∼Idaho 51 51 ∼ ∼ 25 25 ∼ ∼Montana 30 29 ∼ ∼ 19 17 ∼ ∼Nevada 65 55 ∼ ∼ 47 37 ∼ ∼New Mexico 49 47 ∼ 18 42 39 ∼ 21
Utah 40 39 ∼ ∼ 40 39 ∼ ∼Wyoming 17 16 ∼ ∼ ∼ ∼ ∼ ∼
Pacific 1,293 120 189 739 125 154
Alaska 17 ∼ ∼ ∼ ∼ ∼ ∼ ∼California 939 741 107 178 747 549 115 151
San Francisco-Oakland 132 88 23 ∼ 100 64 18 ∼San Jose-Monterey 72 56 ∼ ∼ 53 48 ∼ ∼Los Angeles 236 156 52 56 229 137 66 53
Hawaii 36 17 ∼ ∼ 20 ∼ ∼ ∼Oregon 104 100 ∼ ∼ 73 72 ∼ ∼Washington 197 175 ∼ ∼ 126 106 ∼ ∼
Seattle-Puget Sound 142 121 ∼ ∼ 97 81 ∼ ∼∗ Data are from all state and metropolitan area cancer registries, except Maryland. Included data cover approximately 98% of the population and met data quality
criteria for all invasive cancer sites combined. See Appendix B for registry-specific data quality information.† Invasive cancers only.‡ Data for specified racial or ethnic populations other than white and black should be interpreted with caution. See Technical Notes.
§ Hispanic origin is not mutually exclusive from race categories (white, black).
∼ Counts are suppressed if fewer than 16 cases were reported in a specific category (area, sex, race, ethnicity).
- Counts are suppressed at the state’s or metropolitan area’s request. See Technical Notes.
Notes: Cases from suppressed counts are included in region/division counts. Region/division counts are presented for regions/divisions with 100% of the
population covered by registries that meet the data quality criteria specified above unless the count for exactly one state in the region or division
is suppressed due to a count of less than 16. Michigan, Georgia, California, and Washington state counts each include cases from the SEER metropolitan
areas.

United
States Cancer Statistics: 2004 Incid
ence and M
ortality
E-��
continued
Table E.18.2: Myeloma. Cancer Death Counts by U.S. Census Region and Division, State, and Race and Ethnicity,United States,∗ 2004
Male Female
Area All Races White Black Hispanic†‡ All Races White Black Hispanic†‡
United States 5,472 4,521 843 277 5,106 4,062 952 268
Northeast 134 31 158 45
New England 19 ∼ 16 ∼Connecticut 68 64 ∼ ∼ 71 63 ∼ ∼Maine 32 32 ∼ ∼ 30 30 ∼ ∼Massachusetts 125 110 ∼ ∼ 106 100 ∼ ∼New Hampshire 26 26 ∼ ∼ 20 20 ∼ ∼Rhode Island 17 16 ∼ ∼ 23 22 ∼ ∼Vermont ∼ ∼ ∼ ∼ ∼ ∼ ∼ ∼
Middle Atlantic 713 589 115 27 758 608 142 39
New Jersey 140 114 26 ∼ 156 119 33 ∼New York 332 260 66 19 311 235 73 26
Pennsylvania 241 215 23 ∼ 291 254 36 ∼Midwest 1,347 1,150 186 22 177 17
East North Central 916 755 155 18 839 682 ∼Illinois 222 174 44 ∼ 220 171 47 ∼Indiana 110 96 ∼ ∼ 114 97 17 ∼Michigan 222 172 48 ∼ 161 120 41 ∼Ohio 244 200 44 ∼ 245 202 42 ∼Wisconsin 118 113 ∼ ∼ 99 92 ∼ ∼
West North Central 431 395 31 ∼ 23 ∼Iowa 68 63 ∼ ∼ 56 54 ∼ ∼Kansas 61 54 ∼ ∼ 68 65 ∼ ∼Minnesota 102 96 ∼ ∼ 85 83 ∼ ∼Missouri 124 110 ∼ ∼ 126 110 16 ∼Nebraska 35 32 ∼ ∼ 31 30 ∼ ∼North Dakota 19 18 ∼ ∼ ∼ ∼ ∼ ∼South Dakota 22 22 ∼ ∼ 22 21 ∼ ∼
South 2,020 1,552 447 93 1,947 1,404 531 105
South Atlantic 1,121 863 247 40 1,038 717 315 44
Delaware 18 16 ∼ ∼ ∼ ∼ ∼ ∼District of Columbia ∼ ∼ ∼ ∼ ∼ ∼ ∼ ∼Florida 419 374 43 38 324 258 63 39
Georgia 135 92 42 ∼ 149 90 59 ∼Maryland 98 69 26 ∼ 105 67 37 ∼North Carolina 182 128 53 ∼ 172 112 59 ∼South Carolina 89 55 34 ∼ 96 53 42 ∼Virginia 127 87 37 ∼ 134 97 37 ∼West Virginia 44 41 ∼ ∼ 35 32 ∼ ∼
East South Central 345 260 ∼ 398 297 ∼Alabama 100 67 33 ∼ 123 77 45 ∼Kentucky 75 68 ∼ ∼ 79 73 ∼ ∼Mississippi 42 26 16 ∼ 63 39 24 ∼Tennessee 128 99 29 ∼ 133 108 25 ∼

Appendix E
E-��
Table E.18.2: Myeloma. Cancer Death Counts by U.S. Census Region and Division, State, and Race and Ethnicity,United States,∗ 2004 (continued)
Male Female
Area All Races White Black Hispanic†‡ All Races White Black Hispanic†‡
West South Central 554 429 52 511 390 116 60
Arkansas 60 43 17 ∼ 58 47 ∼ ∼Louisiana 88 50 38 ∼ 83 52 31 ∼Oklahoma 76 62 ∼ ∼ 43 33 ∼ ∼Texas 330 274 53 50 327 258 67 60
West 1,113 971 76 131 899 746 86 101
Mountain ∼ 34 271 246 ∼ 25
Arizona 114 106 ∼ ∼ 79 71 ∼ ∼Colorado 50 48 ∼ ∼ 52 48 ∼ ∼Idaho 43 43 ∼ ∼ 24 24 ∼ ∼Montana 33 31 ∼ ∼ ∼ ∼ ∼ ∼Nevada 43 39 ∼ ∼ 28 21 ∼ ∼New Mexico 29 27 ∼ ∼ 30 26 ∼ ∼Utah 30 30 ∼ ∼ 33 32 ∼ ∼Wyoming ∼ ∼ ∼ ∼ ∼ ∼ ∼ ∼
Pacific 642 68 97 628 500 73 76
Alaska ∼ ∼ ∼ ∼ ∼ ∼ ∼ ∼California 554 457 63 93 454 346 69 73
Hawaii 20 ∼ ∼ ∼ ∼ ∼ ∼ ∼Oregon 70 65 ∼ ∼ 70 67 ∼ ∼Washington 116 108 ∼ ∼ 83 77 ∼ ∼
∗ Data are from the National Vital Statistics System (NVSS).† Data for specified racial or ethnic populations other than white and black should be interpreted with caution. See Technical Notes.‡ Hispanic origin is not mutually exclusive from race categories (white, black).
∼ Counts are suppressed if fewer than 16 cases were reported in a specific category (area, sex, race, ethnicity).
Notes: Region/division counts are suppressed if the count for exactly one state in the region or division is suppressed due to a count of less than 16.

United
States Cancer Statistics: 2004 Incid
ence and M
ortality
E-�0
continued
Table E.19.1: Non-Hodgkin Lymphoma. Cancer Incidence Counts by U.S. Census Region and Division, Stateand Metropolitan Area, and Race and Ethnicity, United States,∗† 2004
Male Female
Area All Races White Black Hispanic‡§ All Races White Black Hispanic‡§
Northeast 6,307 5,621 434 412 5,711 5,145 391 314
New England 1,652 1,551 55 50 1,495 1,422 43 41
Connecticut 430 399 23 24 379 352 20 20
Maine 181 173 ∼ ∼ 159 157 ∼ ∼Massachusetts 699 646 28 20 683 642 22 18
New Hampshire 160 156 ∼ ∼ 123 123 ∼ ∼Rhode Island 110 106 ∼ ∼ 99 96 ∼ ∼Vermont 72 71 ∼ ∼ 52 52 ∼ ∼
Middle Atlantic 4,655 4,070 379 4,216 3,723 348
New Jersey 1,004 868 89 89 906 785 91 79
New York 2,132 1,809 204 237 1,871 1,607 185 174
Pennsylvania 1,519 1,393 86 - 1,439 1,331 72 -
Midwest 7,090 6,429 409 169 6,458 5,824 392 101
East North Central 4,838 4,313 346 152 4,438 3,933 337 92
Illinois 1,355 1,174 117 90 1,163 997 108 61
Indiana 613 594 ∼ ∼ 567 523 34 ∼Michigan 1,119 953 126 ∼ 1,074 929 110 ∼Detroit 472 379 86 ∼ 453 365 77 ∼
Ohio 1,187 1,053 75 21 1,132 1,009 68 ∼Wisconsin 564 539 ∼ ∼ 502 475 17 ∼
West North Central 2,252 2,116 63 17 2,020 1,891 55 ∼Iowa 355 340 ∼ ∼ 341 334 ∼ ∼Kansas 318 301 ∼ ∼ 276 264 ∼ ∼Minnesota 633 583 ∼ ∼ 542 487 ∼ ∼Missouri 590 554 31 ∼ 547 507 38 ∼Nebraska 201 191 ∼ ∼ 166 159 ∼ ∼North Dakota 83 81 ∼ ∼ 62 59 ∼ ∼South Dakota 72 66 ∼ ∼ 86 81 ∼ ∼
South 9,551 8,235 1,099 751 8,605 7,442 952 643
South Atlantic 4,897 4,173 625 351 4,358 3,709 567 271
Delaware 95 79 ∼ ∼ 75 65 ∼ ∼District of Columbia 61 19 35 ∼ 39 ∼ 27 ∼Florida 2,001 1,811 157 - 1,749 1,560 162 -
Georgia 744 565 166 20 643 521 112 ∼Atlanta 272 170 95 ∼ 191 144 44 ∼
Maryland
North Carolina 772 650 106 ∼ 762 629 118 ∼South Carolina 379 301 72 - 356 284 66 -
Virginia 632 538 73 16 539 449 69 ∼West Virginia 213 210 ∼ ∼ 195 190 ∼ ∼
East South Central 1,662 1,454 187 ∼ 1,520 1,344 ∼Alabama 449 386 58 ∼ 399 345 50 ∼Kentucky 446 414 25 - 405 383 ∼ -
Mississippi 267 203 61 ∼ 220 173 45 ∼Tennessee 500 451 43 ∼ 496 443 45 ∼

Appendix E
E-��
Table E.19.1: Non-Hodgkin Lymphoma. Cancer Incidence Counts by U.S. Census Region and Division, Stateand Metropolitan Area, and Race and Ethnicity, United States,∗† 2004 (continued)
Male Female
Area All Races White Black Hispanic‡§ All Races White Black Hispanic‡§
West South Central 2,992 2,608 287 385 2,727 2,389 230 361
Arkansas 271 251 ∼ ∼ 268 248 ∼ ∼Louisiana 437 339 95 ∼ 435 341 88 ∼Oklahoma 358 330 ∼ ∼ 338 306 ∼ ∼Texas 1,926 1,688 168 367 1,686 1,494 121 345
West 6,379 5,581 200 833 5,341 4,595 162 674
Mountain 1,722 1,615 32 173 1,490 1,375 22 141
Arizona 485 448 ∼ 51 375 357 ∼ 43
Colorado 377 351 ∼ 38 362 324 ∼ 28
Idaho 129 128 ∼ ∼ 130 126 ∼ ∼Montana 105 100 ∼ ∼ 76 72 ∼ ∼Nevada 230 202 ∼ 24 182 159 ∼ ∼New Mexico 137 134 ∼ 38 151 136 ∼ 36
Utah 205 201 ∼ ∼ 166 159 ∼ ∼Wyoming 54 51 ∼ ∼ 48 42 ∼ ∼
Pacific 4,657 3,966 168 660 3,851 3,220 140 533
Alaska 49 39 ∼ ∼ 28 23 ∼ ∼California 3,301 2,766 150 607 2,765 2,306 121 506
San Francisco-Oakland 505 373 30 50 381 288 32 47
San Jose-Monterey 240 203 ∼ 37 200 159 ∼ 25
Los Angeles 839 666 68 225 732 568 55 190
Hawaii 101 37 ∼ ∼ 103 28 ∼ ∼Oregon 453 436 ∼ 19 344 318 ∼ ∼Washington 753 688 ∼ 27 611 545 17 ∼Seattle-Puget Sound 515 472 ∼ 16 410 368 ∼ ∼
∗ Data are from all state and metropolitan area cancer registries, except Maryland. Included data cover approximately 98% of the population and met data quality
criteria for all invasive cancer sites combined. See Appendix B for registry-specific data quality information.† Invasive cancers only.‡ Data for specified racial or ethnic populations other than white and black should be interpreted with caution. See Technical Notes.
§ Hispanic origin is not mutually exclusive from race categories (white, black).
∼ Counts are suppressed if fewer than 16 cases were reported in a specific category (area, sex, race, ethnicity).
- Counts are suppressed at the state’s or metropolitan area’s request. See Technical Notes.
Notes: Cases from suppressed counts are included in region/division counts. Region/division counts are presented for regions/divisions with 100% of the
population covered by registries that meet the data quality criteria specified above unless the count for exactly one state in the region or division
is suppressed due to a count of less than 16. Michigan, Georgia, California, and Washington state counts each include cases from the SEER metropolitan
areas.
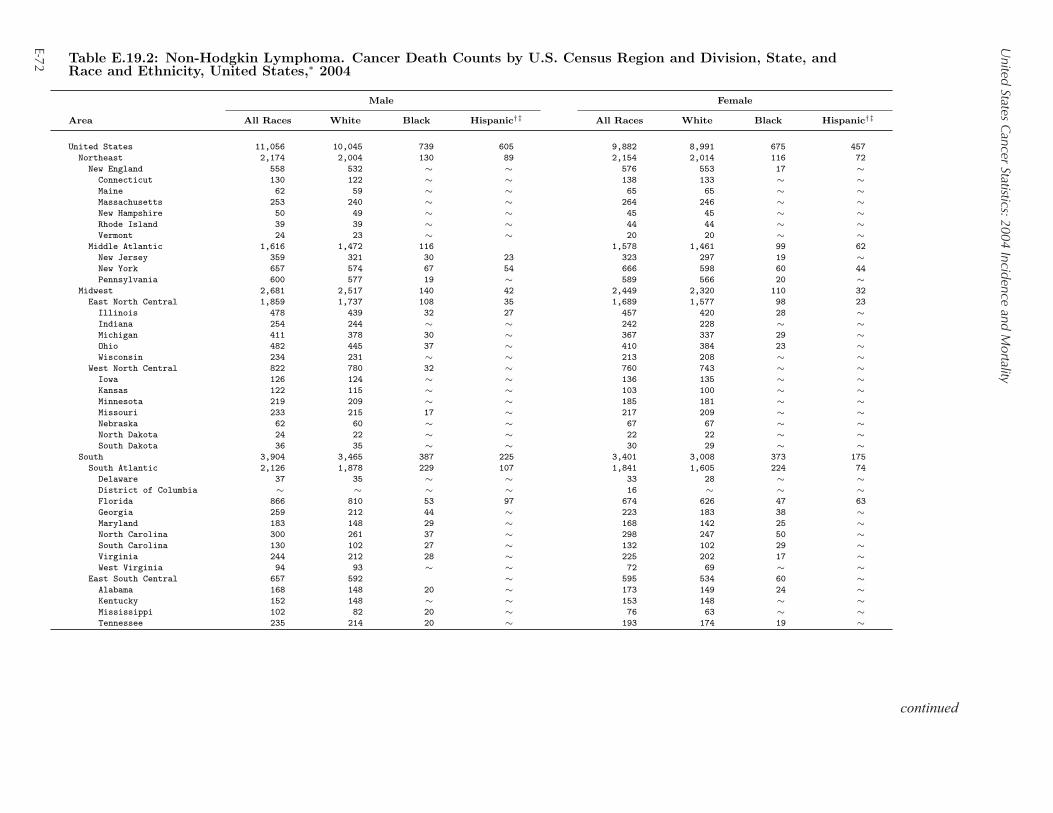
United
States Cancer Statistics: 2004 Incid
ence and M
ortality
E-��
continued
Table E.19.2: Non-Hodgkin Lymphoma. Cancer Death Counts by U.S. Census Region and Division, State, andRace and Ethnicity, United States,∗ 2004
Male Female
Area All Races White Black Hispanic†‡ All Races White Black Hispanic†‡
United States 11,056 10,045 739 605 9,882 8,991 675 457
Northeast 2,174 2,004 130 89 2,154 2,014 116 72
New England 558 532 ∼ ∼ 576 553 17 ∼Connecticut 130 122 ∼ ∼ 138 133 ∼ ∼Maine 62 59 ∼ ∼ 65 65 ∼ ∼Massachusetts 253 240 ∼ ∼ 264 246 ∼ ∼New Hampshire 50 49 ∼ ∼ 45 45 ∼ ∼Rhode Island 39 39 ∼ ∼ 44 44 ∼ ∼Vermont 24 23 ∼ ∼ 20 20 ∼ ∼
Middle Atlantic 1,616 1,472 116 1,578 1,461 99 62
New Jersey 359 321 30 23 323 297 19 ∼New York 657 574 67 54 666 598 60 44
Pennsylvania 600 577 19 ∼ 589 566 20 ∼Midwest 2,681 2,517 140 42 2,449 2,320 110 32
East North Central 1,859 1,737 108 35 1,689 1,577 98 23
Illinois 478 439 32 27 457 420 28 ∼Indiana 254 244 ∼ ∼ 242 228 ∼ ∼Michigan 411 378 30 ∼ 367 337 29 ∼Ohio 482 445 37 ∼ 410 384 23 ∼Wisconsin 234 231 ∼ ∼ 213 208 ∼ ∼
West North Central 822 780 32 ∼ 760 743 ∼ ∼Iowa 126 124 ∼ ∼ 136 135 ∼ ∼Kansas 122 115 ∼ ∼ 103 100 ∼ ∼Minnesota 219 209 ∼ ∼ 185 181 ∼ ∼Missouri 233 215 17 ∼ 217 209 ∼ ∼Nebraska 62 60 ∼ ∼ 67 67 ∼ ∼North Dakota 24 22 ∼ ∼ 22 22 ∼ ∼South Dakota 36 35 ∼ ∼ 30 29 ∼ ∼
South 3,904 3,465 387 225 3,401 3,008 373 175
South Atlantic 2,126 1,878 229 107 1,841 1,605 224 74
Delaware 37 35 ∼ ∼ 33 28 ∼ ∼District of Columbia ∼ ∼ ∼ ∼ 16 ∼ ∼ ∼Florida 866 810 53 97 674 626 47 63
Georgia 259 212 44 ∼ 223 183 38 ∼Maryland 183 148 29 ∼ 168 142 25 ∼North Carolina 300 261 37 ∼ 298 247 50 ∼South Carolina 130 102 27 ∼ 132 102 29 ∼Virginia 244 212 28 ∼ 225 202 17 ∼West Virginia 94 93 ∼ ∼ 72 69 ∼ ∼
East South Central 657 592 ∼ 595 534 60 ∼Alabama 168 148 20 ∼ 173 149 24 ∼Kentucky 152 148 ∼ ∼ 153 148 ∼ ∼Mississippi 102 82 20 ∼ 76 63 ∼ ∼Tennessee 235 214 20 ∼ 193 174 19 ∼

Appendix E
E-�3
Table E.19.2: Non-Hodgkin Lymphoma. Cancer Death Counts by U.S. Census Region and Division, State, andRace and Ethnicity, United States,∗ 2004 (continued)
Male Female
Area All Races White Black Hispanic†‡ All Races White Black Hispanic†‡
West South Central 1,121 995 95 115 965 869 89 99
Arkansas 113 108 ∼ ∼ 104 101 ∼ ∼Louisiana 175 144 30 ∼ 161 130 31 ∼Oklahoma 162 146 ∼ ∼ 103 99 ∼ ∼Texas 671 597 58 115 597 539 54 93
West 2,059 82 249 1,649 76 178
Mountain 658 633 ∼ 62 553 529 ∼ 41
Arizona 214 207 ∼ 28 163 159 ∼ 17
Colorado 135 129 ∼ ∼ 111 110 ∼ ∼Idaho 52 50 ∼ ∼ 52 51 ∼ ∼Montana 45 42 ∼ ∼ 37 36 ∼ ∼Nevada 74 71 ∼ ∼ 54 50 ∼ ∼New Mexico 48 46 ∼ ∼ 57 49 ∼ ∼Utah 74 72 ∼ ∼ 56 55 ∼ ∼Wyoming 16 16 ∼ ∼ 23 19 ∼ ∼
Pacific 1,426 68 187 1,120 67 137
Alaska ∼ ∼ ∼ ∼ ∼ ∼ ∼ ∼California 1,157 986 62 175 947 791 61 123
Hawaii 40 ∼ ∼ ∼ 36 ∼ ∼ ∼Oregon 180 175 ∼ ∼ 138 133 ∼ ∼Washington 252 242 ∼ ∼ 198 184 ∼ ∼
∗ Data are from the National Vital Statistics System (NVSS).† Data for specified racial or ethnic populations other than white and black should be interpreted with caution. See Technical Notes.‡ Hispanic origin is not mutually exclusive from race categories (white, black).
∼ Counts are suppressed if fewer than 16 cases were reported in a specific category (area, sex, race, ethnicity).
Notes: Region/division counts are suppressed if the count for exactly one state in the region or division is suppressed due to a count of less than 16.

United
States Cancer Statistics: 2004 Incid
ence and M
ortality
E-��
continued
Table E.20.1: Oral Cavity and Pharynx. Invasive Cancer Incidence Counts by U.S. Census Region and Division,State and Metropolitan Area, Sex, and Race and Ethnicity, United States,∗† 2004
Male Female
Area All Races White Black Hispanic‡§ All Races White Black Hispanic‡§
Northeast 4,026 3,442 415 226 1,928 1,637 192 99
New England 1,101 1,024 48 35 508 451 33 ∼Connecticut 245 213 26 ∼ 125 106 16 ∼Maine 141 139 ∼ ∼ 46 43 ∼ ∼Massachusetts 485 453 ∼ 18 245 218 ∼ ∼New Hampshire 95 92 ∼ ∼ 42 41 ∼ ∼Rhode Island 81 73 ∼ ∼ 29 22 ∼ ∼Vermont 54 54 ∼ ∼ 21 21 ∼ ∼
Middle Atlantic 2,925 2,418 367 1,420 1,186 159
New Jersey 588 472 96 48 320 278 26 18
New York 1,365 1,071 195 130 676 535 98 66
Pennsylvania 972 875 76 - 424 373 35 -
Midwest 4,914 4,259 457 77 2,145 1,887 171 25
East North Central 3,402 2,875 387 65 1,435 1,232 142 18
Illinois 972 748 164 34 417 341 51 ∼Indiana 434 397 33 ∼ 185 171 ∼ ∼Michigan 739 613 96 ∼ 315 260 38 ∼
Detroit 326 252 66 ∼ 138 106 30 ∼Ohio 835 723 76 ∼ 334 287 33 ∼Wisconsin 422 394 18 ∼ 184 173 ∼ ∼
West North Central 1,512 1,384 70 ∼ 710 655 29 ∼Iowa 257 243 ∼ ∼ 109 101 ∼ ∼Kansas 211 194 ∼ ∼ 91 86 ∼ ∼Minnesota 375 332 18 ∼ 216 200 ∼ ∼Missouri 429 386 36 ∼ 183 164 19 ∼Nebraska 120 115 ∼ ∼ 65 61 ∼ ∼North Dakota 50 49 ∼ ∼ 23 20 ∼ ∼South Dakota 70 65 ∼ ∼ 23 23 ∼ ∼
South 8,047 6,652 1,213 414 3,346 2,809 444 177
South Atlantic 4,197 3,402 716 219 1,793 1,487 260 93
Delaware 74 61 ∼ ∼ 24 19 ∼ ∼District of Columbia 47 ∼ 35 ∼ 16 ∼ ∼ ∼Florida 1,718 1,520 168 - 757 666 76 -
Georgia 622 488 123 ∼ 261 199 60 ∼Atlanta 179 120 52 ∼ 77 50 25 ∼
Maryland
North Carolina 697 520 161 ∼ 299 243 49 ∼South Carolina 398 277 119 - 147 111 32 -
Virginia 494 384 93 ∼ 224 180 27 ∼West Virginia 147 142 ∼ ∼ 65 64 ∼ ∼
East South Central 1,454 1,198 230 ∼ 593 505 ∼Alabama 398 329 65 ∼ 174 148 26 ∼Kentucky 354 320 22 - 146 134 ∼ -
Mississippi 242 164 76 ∼ 84 60 23 ∼Tennessee 460 385 67 ∼ 189 163 19 ∼

Appendix E
E-��
Table E.20.1: Oral Cavity and Pharynx. Invasive Cancer Incidence Counts by U.S. Census Region and Division,State and Metropolitan Area, Sex, and Race and Ethnicity, United States,∗† 2004 (continued)
Male Female
Area All Races White Black Hispanic‡§ All Races White Black Hispanic‡§
West South Central 2,396 2,052 186 960 817 110 82
Arkansas 227 202 19 ∼ 100 89 ∼ ∼Louisiana 412 294 116 ∼ 157 122 33 ∼Oklahoma 292 247 ∼ ∼ 120 101 ∼ ∼Texas 1,465 1,309 118 176 583 505 60 77
West 4,409 3,835 178 381 2,005 1,683 79 160
Mountain 1,228 1,157 22 105 525 491 ∼ 31
Arizona 343 312 ∼ 31 154 142 ∼ ∼Colorado 262 252 ∼ 22 109 102 ∼ ∼Idaho 112 111 ∼ ∼ 35 35 ∼ ∼Montana 83 79 ∼ ∼ 30 29 ∼ ∼Nevada 153 138 ∼ ∼ 63 57 ∼ ∼New Mexico 135 128 ∼ 37 54 50 ∼ ∼Utah 100 97 ∼ ∼ 53 50 ∼ ∼Wyoming 40 40 ∼ ∼ 27 26 ∼ ∼
Pacific 3,181 2,678 156 276 1,480 1,192 69 129
Alaska 35 31 ∼ ∼ 17 ∼ ∼ ∼California 2,261 1,884 137 257 1,067 844 68 114
San Francisco-Oakland 307 218 23 19 165 118 ∼ ∼San Jose-Monterey 136 109 ∼ ∼ 78 58 ∼ ∼Los Angeles 505 378 59 94 259 185 32 48
Hawaii 98 45 ∼ ∼ 44 ∼ ∼ ∼Oregon 287 274 ∼ ∼ 134 129 ∼ ∼Washington 500 444 ∼ ∼ 218 193 ∼ ∼
Seattle-Puget Sound 337 310 ∼ ∼ 146 133 ∼ ∼∗ Data are from all state and metropolitan area cancer registries, except Maryland. Included data cover approximately 98% of the population and met data quality
criteria for all invasive cancer sites combined. See Appendix B for registry-specific data quality information.† Invasive cancers only.‡ Data for specified racial or ethnic populations other than white and black should be interpreted with caution. See Technical Notes.
§ Hispanic origin is not mutually exclusive from race categories (white, black).
∼ Counts are suppressed if fewer than 16 cases were reported in a specific category (area, sex, race, ethnicity).
- Counts are suppressed at the state’s or metropolitan area’s request. See Technical Notes.
Notes: Cases from suppressed counts are included in region/division counts. Region/division counts are presented for regions/divisions with 100% of the
population covered by registries that meet the data quality criteria specified above unless the count for exactly one state in the region or division
is suppressed due to a count of less than 16. Michigan, Georgia, California, and Washington state counts each include cases from the SEER metropolitan
areas.

United
States Cancer Statistics: 2004 Incid
ence and M
ortality
E-��
continued
Table E.20.2: Oral Cavity and Pharynx. Cancer Death Counts by U.S. Census Region and Division, State, Sex,and Race and Ethnicity, United States,∗ 2004
Male Female
Area All Races White Black Hispanic†‡ All Races White Black Hispanic†‡
United States 5,312 4,270 874 241 2,514 2,173 275 91
Northeast 840 137 56 499 438 52 23
New England 255 ∼ ∼ 138 132 ∼ ∼Connecticut 61 52 ∼ ∼ 20 17 ∼ ∼Maine 35 33 ∼ ∼ 17 17 ∼ ∼Massachusetts 130 123 ∼ ∼ 63 61 ∼ ∼New Hampshire 22 22 ∼ ∼ 22 22 ∼ ∼Rhode Island 16 ∼ ∼ ∼ ∼ ∼ ∼ ∼Vermont ∼ ∼ ∼ ∼ ∼ ∼ ∼ ∼
Middle Atlantic 727 585 123 49 361 306 48 22
New Jersey 142 115 23 ∼ 75 59 ∼ ∼New York 357 267 79 32 179 150 23 ∼Pennsylvania 228 203 21 ∼ 107 97 ∼ ∼
Midwest 1,167 1,015 138 ∼ 566 514 49 ∼East North Central 854 719 126 ∼ 401 354 44 ∼
Illinois 239 184 51 ∼ 97 83 ∼ ∼Indiana 78 72 ∼ ∼ 49 41 ∼ ∼Michigan 200 168 31 ∼ 83 68 ∼ ∼Ohio 233 196 34 ∼ 123 115 ∼ ∼Wisconsin 104 99 ∼ ∼ 49 47 ∼ ∼
West North Central 313 296 ∼ ∼ 165 160 ∼ ∼Iowa 49 46 ∼ ∼ 35 35 ∼ ∼Kansas 48 45 ∼ ∼ 24 24 ∼ ∼Minnesota 68 65 ∼ ∼ 42 41 ∼ ∼Missouri 107 100 ∼ ∼ 47 43 ∼ ∼Nebraska 24 24 ∼ ∼ ∼ ∼ ∼ ∼North Dakota ∼ ∼ ∼ ∼ ∼ ∼ ∼ ∼South Dakota ∼ ∼ ∼ ∼ ∼ ∼ ∼ ∼
South 2,128 1,561 542 82 935 780 149 35
South Atlantic 1,123 813 302 28 511 414 92 18
Delaware 18 ∼ ∼ ∼ ∼ ∼ ∼ ∼District of Columbia 18 ∼ 16 ∼ ∼ ∼ ∼ ∼Florida 411 348 59 27 203 179 24 16
Georgia 147 93 54 ∼ 72 45 26 ∼Maryland 98 64 32 ∼ 40 28 ∼ ∼North Carolina 156 112 42 ∼ 87 73 ∼ ∼South Carolina 123 65 58 ∼ 33 25 ∼ ∼Virginia 109 79 30 ∼ 45 40 ∼ ∼West Virginia 43 38 ∼ ∼ 18 16 ∼ ∼
East South Central 372 268 ∼ 185 155 30 ∼Alabama 106 70 35 ∼ 55 40 ∼ ∼Kentucky 76 68 ∼ ∼ 48 47 ∼ ∼Mississippi 67 38 29 ∼ 22 17 ∼ ∼Tennessee 123 92 30 ∼ 60 51 ∼ ∼

Appendix E
E-��
Table E.20.2: Oral Cavity and Pharynx. Cancer Death Counts by U.S. Census Region and Division, State, Sex,and Race and Ethnicity, United States,∗ 2004 (continued)
Male Female
Area All Races White Black Hispanic†‡ All Races White Black Hispanic†‡
West South Central 633 480 138 52 239 211 27 17
Arkansas 78 63 ∼ ∼ 30 27 ∼ ∼Louisiana 109 60 49 ∼ 42 28 ∼ ∼Oklahoma 70 58 ∼ ∼ 24 22 ∼ ∼Texas 376 299 70 51 143 134 ∼ 17
West 1,014 854 57 89 514 441 25 32
Mountain 257 ∼ 30 136 123 ∼ ∼Arizona 87 84 ∼ ∼ 41 38 ∼ ∼Colorado 47 43 ∼ ∼ 35 32 ∼ ∼Idaho 19 19 ∼ ∼ ∼ ∼ ∼ ∼Montana 17 ∼ ∼ ∼ ∼ ∼ ∼ ∼Nevada 50 44 ∼ ∼ 21 ∼ ∼ ∼New Mexico 27 26 ∼ ∼ ∼ ∼ ∼ ∼Utah 23 20 ∼ ∼ ∼ ∼ ∼ ∼Wyoming ∼ ∼ ∼ ∼ ∼ ∼ ∼ ∼
Pacific 597 48 59 378 318 20 27
Alaska ∼ ∼ ∼ ∼ ∼ ∼ ∼ ∼California 542 433 47 58 259 210 20 26
Hawaii 23 ∼ ∼ ∼ ∼ ∼ ∼ ∼Oregon 58 55 ∼ ∼ 36 36 ∼ ∼Washington 108 99 ∼ ∼ 63 62 ∼ ∼
∗ Data are from the National Vital Statistics System (NVSS).† Data for specified racial or ethnic populations other than white and black should be interpreted with caution. See Technical Notes.‡ Hispanic origin is not mutually exclusive from race categories (white, black).
∼ Counts are suppressed if fewer than 16 cases were reported in a specific category (area, sex, race, ethnicity).
Notes: Region/division counts are suppressed if the count for exactly one state in the region or division is suppressed due to a count of less than 16.

United
States Cancer Statistics: 2004 Incid
ence and M
ortality
E-��
continued
Table E.21.1: Ovary. Invasive Cancer Incidence Counts by U.S. Census Region and Division, State andMetropolitan Area, and Race and Ethnicity, United States,∗† 2004
Male Female
Area All Races White Black Hispanic‡§ All Races White Black Hispanic‡§
Northeast 4,419 3,904 321 246
New England 1,118 1,050 24 30
Connecticut 279 256 ∼ ∼Maine 105 104 ∼ ∼Massachusetts 521 495 ∼ ∼New Hampshire 96 87 ∼ ∼Rhode Island 73 64 ∼ ∼Vermont 44 44 ∼ ∼
Middle Atlantic 3,301 2,854 297
New Jersey 677 583 59 53
New York 1,582 1,312 173 152
Pennsylvania 1,042 959 65 -
Midwest 4,556 4,179 275 105
East North Central 3,172 2,877 235 89
Illinois 885 778 85 51
Indiana 398 374 20 ∼Michigan 721 632 79 ∼
Detroit 295 236 57 ∼Ohio 754 706 35 ∼Wisconsin 414 387 16 ∼
West North Central 1,384 1,302 40 16
Iowa 247 240 ∼ ∼Kansas 209 200 ∼ ∼Minnesota 353 330 ∼ ∼Missouri 381 346 28 ∼Nebraska 111 106 ∼ ∼North Dakota 45 44 ∼ ∼South Dakota 38 36 ∼ ∼
South 6,791 5,866 778 553
South Atlantic 3,619 3,118 435 238
Delaware 77 70 ∼ ∼District of Columbia 49 16 31 ∼Florida 1,487 1,354 107 -
Georgia 524 406 109 ∼Atlanta 173 121 46 ∼
Maryland
North Carolina 522 452 63 ∼South Carolina 285 235 46 -
Virginia 531 447 69 ∼West Virginia 144 138 ∼ ∼
East South Central 1,160 997 ∼Alabama 341 278 60 ∼Kentucky 307 289 ∼ -
Mississippi 150 113 36 ∼Tennessee 362 317 38 ∼

Appendix E
E-��
Table E.21.1: Ovary. Invasive Cancer Incidence Counts by U.S. Census Region and Division, State andMetropolitan Area, and Race and Ethnicity, United States,∗† 2004 (continued)
Male Female
Area All Races White Black Hispanic‡§ All Races White Black Hispanic‡§
West South Central 2,012 1,751 312
Arkansas 190 169 16 ∼Louisiana 260 198 59 ∼Oklahoma 250 218 ∼ ∼Texas 1,312 1,166 111 298
West 4,329 3,770 143 584
Mountain 1,213 1,146 17 140
Arizona 371 349 ∼ 51
Colorado 296 286 ∼ 29
Idaho 74 72 ∼ ∼Montana 73 69 ∼ ∼Nevada 135 122 ∼ ∼New Mexico 113 101 ∼ 33
Utah 109 106 ∼ ∼Wyoming 42 41 ∼ ∼
Pacific 3,116 2,624 126 444
Alaska 27 21 ∼ ∼California 2,265 1,895 115 413
San Francisco-Oakland 287 206 16 25
San Jose-Monterey 130 99 ∼ 20
Los Angeles 611 476 60 160
Hawaii 77 24 ∼ ∼Oregon 281 261 ∼ ∼Washington 466 423 ∼ 21
Seattle-Puget Sound 325 300 ∼ ∼∗ Data are from all state and metropolitan area cancer registries, except Maryland. Included data cover approximately 98% of the population and met data quality
criteria for all invasive cancer sites combined. See Appendix B for registry-specific data quality information.† Invasive cancers only.‡ Data for specified racial or ethnic populations other than white and black should be interpreted with caution. See Technical Notes.
§ Hispanic origin is not mutually exclusive from race categories (white, black).
∼ Counts are suppressed if fewer than 16 cases were reported in a specific category (area, sex, race, ethnicity).
- Counts are suppressed at the state’s or metropolitan area’s request. See Technical Notes.
Notes: Cases from suppressed counts are included in region/division counts. Region/division counts are presented for regions/divisions with 100% of the
population covered by registries that meet the data quality criteria specified above unless the count for exactly one state in the region or division
is suppressed due to a count of less than 16. Michigan, Georgia, California, and Washington state counts each include cases from the SEER metropolitan
areas.

United
States Cancer Statistics: 2004 Incid
ence and M
ortality
E-�0
continued
Table E.21.2: Ovary. Cancer Death Counts by U.S. Census Region and Division, State, and Race and Ethnicity,United States,∗ 2004
Male Female
Area All Races White Black Hispanic†‡ All Races White Black Hispanic†‡
United States 14,716 13,127 1,256 689
Northeast 2,999 2,732 225 91
New England 778 745 25 ∼Connecticut 169 158 ∼ ∼Maine 60 60 ∼ ∼Massachusetts 371 355 ∼ ∼New Hampshire 75 74 ∼ ∼Rhode Island 71 66 ∼ ∼Vermont 32 32 ∼ ∼
Middle Atlantic 2,221 1,987 200 81
New Jersey 456 409 42 ∼New York 1,012 881 107 64
Pennsylvania 753 697 51 ∼Midwest 3,440 3,179 229 39
East North Central 2,404 2,185 197 31
Illinois 624 545 70 17
Indiana 316 300 ∼ ∼Michigan 516 461 49 ∼Ohio 659 597 59 ∼Wisconsin 289 282 ∼ ∼
West North Central 1,036 994 32 ∼Iowa 187 185 ∼ ∼Kansas 161 155 ∼ ∼Minnesota 253 249 ∼ ∼Missouri 295 274 20 ∼Nebraska 80 74 ∼ ∼North Dakota 26 26 ∼ ∼South Dakota 34 31 ∼ ∼
South 5,070 4,323 696 243
South Atlantic 2,822 2,398 402 106
Delaware 50 42 ∼ ∼District of Columbia 27 ∼ 16 ∼Florida 957 874 77 87
Georgia 389 306 80 ∼Maryland 264 210 52 ∼North Carolina 417 365 50 ∼South Carolina 212 158 53 ∼Virginia 372 300 65 ∼West Virginia 134 132 ∼ ∼
East South Central 912 783 ∼Alabama 274 230 43 ∼Kentucky 204 195 ∼ ∼Mississippi 127 92 34 ∼Tennessee 307 266 39 ∼
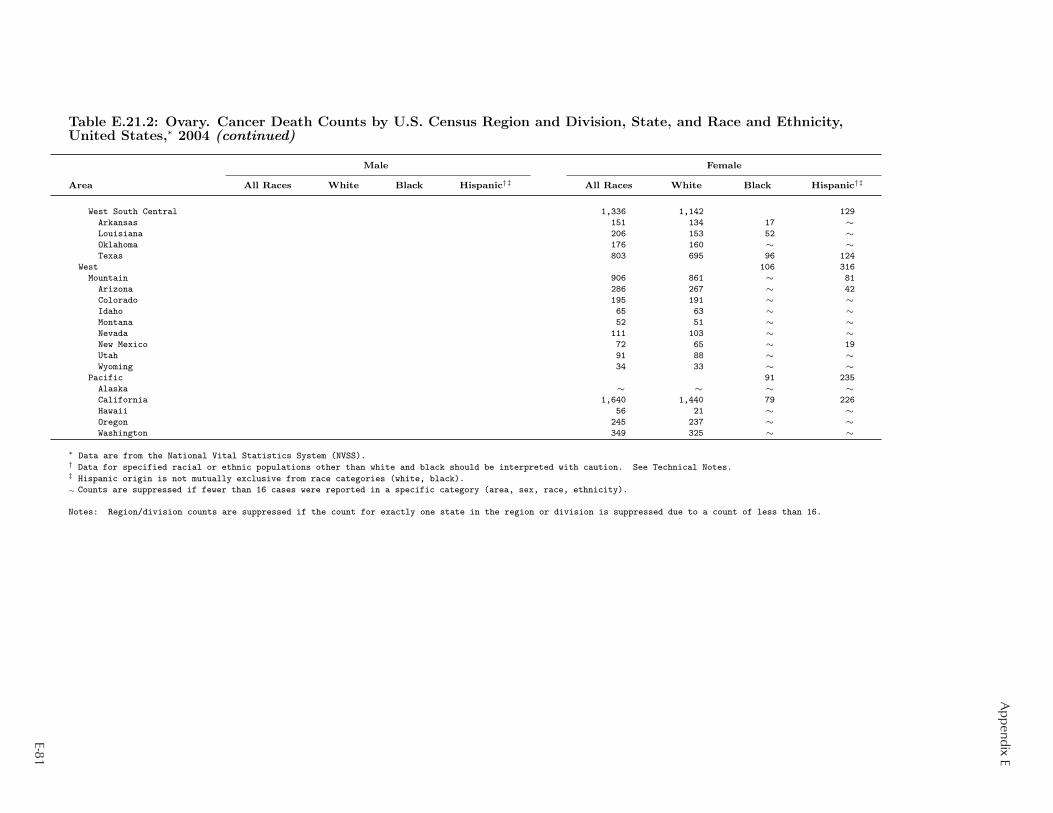
Appendix E
E-��
Table E.21.2: Ovary. Cancer Death Counts by U.S. Census Region and Division, State, and Race and Ethnicity,United States,∗ 2004 (continued)
Male Female
Area All Races White Black Hispanic†‡ All Races White Black Hispanic†‡
West South Central 1,336 1,142 129
Arkansas 151 134 17 ∼Louisiana 206 153 52 ∼Oklahoma 176 160 ∼ ∼Texas 803 695 96 124
West 106 316
Mountain 906 861 ∼ 81
Arizona 286 267 ∼ 42
Colorado 195 191 ∼ ∼Idaho 65 63 ∼ ∼Montana 52 51 ∼ ∼Nevada 111 103 ∼ ∼New Mexico 72 65 ∼ 19
Utah 91 88 ∼ ∼Wyoming 34 33 ∼ ∼
Pacific 91 235
Alaska ∼ ∼ ∼ ∼California 1,640 1,440 79 226
Hawaii 56 21 ∼ ∼Oregon 245 237 ∼ ∼Washington 349 325 ∼ ∼
∗ Data are from the National Vital Statistics System (NVSS).† Data for specified racial or ethnic populations other than white and black should be interpreted with caution. See Technical Notes.‡ Hispanic origin is not mutually exclusive from race categories (white, black).
∼ Counts are suppressed if fewer than 16 cases were reported in a specific category (area, sex, race, ethnicity).
Notes: Region/division counts are suppressed if the count for exactly one state in the region or division is suppressed due to a count of less than 16.

United
States Cancer Statistics: 2004 Incid
ence and M
ortality
E-��
continued
Table E.22.1: Pancreas. Invasive Cancer Incidence Counts by U.S. Census Region and Division, State andMetropolitan Area, Sex, and Race and Ethnicity, United States,∗† 2004
Male Female
Area All Races White Black Hispanic‡§ All Races White Black Hispanic‡§
Northeast 3,544 3,130 316 169 3,880 3,376 406 184
New England 885 823 41 23 959 908 33 26
Connecticut 239 215 23 ∼ 254 234 19 ∼Maine 102 101 ∼ ∼ 99 99 ∼ ∼Massachusetts 364 340 16 ∼ 401 379 ∼ ∼New Hampshire 65 56 ∼ ∼ 86 79 ∼ ∼Rhode Island 74 70 ∼ ∼ 75 73 ∼ ∼Vermont 41 41 ∼ ∼ 44 44 ∼ ∼
Middle Atlantic 2,659 2,307 275 2,921 2,468 373
New Jersey 550 471 54 36 612 520 74 50
New York 1,187 1,004 142 101 1,354 1,116 195 95
Pennsylvania 922 832 79 - 955 832 104 -
Midwest 3,833 3,385 377 65 3,669 3,229 382 58
East North Central 2,718 2,354 316 60 2,601 2,236 330 47
Illinois 786 668 100 34 748 625 111 37
Indiana 339 310 26 ∼ 351 313 33 ∼Michigan 618 518 91 ∼ 583 495 81 ∼
Detroit 292 215 72 ∼ 261 196 61 ∼Ohio 647 550 83 ∼ 607 509 89 ∼Wisconsin 328 308 16 ∼ 312 294 16 ∼
West North Central 1,115 1,031 61 ∼ 1,068 993 52 ∼Iowa 189 184 ∼ ∼ 191 185 ∼ ∼Kansas 156 145 ∼ ∼ 151 139 ∼ ∼Minnesota 255 240 ∼ ∼ 217 209 ∼ ∼Missouri 332 290 40 ∼ 333 297 34 ∼Nebraska 101 93 ∼ ∼ 79 75 ∼ ∼North Dakota 35 33 ∼ ∼ 48 45 ∼ ∼South Dakota 47 46 ∼ ∼ 49 43 ∼ ∼
South 5,606 4,622 884 387 5,445 4,346 998 352
South Atlantic 2,963 2,438 476 185 2,852 2,260 543 164
Delaware 48 38 ∼ ∼ 61 50 ∼ ∼District of Columbia 34 ∼ 20 ∼ 38 ∼ 27 ∼Florida 1,273 1,141 114 - 1,156 1,012 125 -
Georgia 411 299 105 ∼ 397 270 122 ∼Atlanta 123 77 41 ∼ 108 79 28 ∼
Maryland
North Carolina 471 369 95 ∼ 461 347 111 ∼South Carolina 240 184 52 - 223 156 63 -
Virginia 381 295 75 ∼ 392 296 82 ∼West Virginia 105 99 ∼ ∼ 124 119 ∼ ∼
East South Central 939 774 ∼ 929 744 182 ∼Alabama 255 206 48 ∼ 269 203 66 ∼Kentucky 222 212 ∼ - 221 198 21 -
Mississippi 151 105 46 ∼ 142 100 42 ∼Tennessee 311 251 55 ∼ 297 243 53 ∼

Appendix E
E-�3
Table E.22.1: Pancreas. Invasive Cancer Incidence Counts by U.S. Census Region and Division, State andMetropolitan Area, Sex, and Race and Ethnicity, United States,∗† 2004 (continued)
Male Female
Area All Races White Black Hispanic‡§ All Races White Black Hispanic‡§
West South Central 1,704 1,410 249 197 1,664 1,342 186
Arkansas 142 125 16 ∼ 153 130 22 ∼Louisiana 261 180 81 ∼ 311 212 94 ∼Oklahoma 204 170 17 ∼ 201 164 ∼ ∼Texas 1,097 935 135 190 999 836 144 181
West 3,256 153 387 3,337 202 420
Mountain 938 886 16 109 898 845 24 104
Arizona 272 257 ∼ 27 244 231 ∼ 26
Colorado 202 190 ∼ 28 218 202 ∼ 37
Idaho 84 83 ∼ ∼ 82 80 ∼ ∼Montana 65 60 ∼ ∼ 55 54 ∼ ∼Nevada 103 92 ∼ ∼ 120 106 ∼ ∼New Mexico 92 87 ∼ 35 82 78 ∼ 29
Utah 96 93 ∼ ∼ 75 73 ∼ ∼Wyoming 24 24 ∼ ∼ 22 21 ∼ ∼
Pacific 2,318 137 278 2,439 178 316
Alaska 28 21 ∼ ∼ 16 ∼ ∼ ∼California 1,686 1,390 121 259 1,766 1,407 160 296
San Francisco-Oakland 242 165 27 19 241 168 35 27
San Jose-Monterey 111 87 ∼ 21 130 103 ∼ ∼Los Angeles 424 311 51 83 464 326 79 96
Hawaii 74 ∼ ∼ ∼ 87 16 ∼ ∼Oregon 201 187 ∼ ∼ 210 197 ∼ ∼Washington 329 305 ∼ ∼ 360 329 ∼ ∼
Seattle-Puget Sound 227 205 ∼ ∼ 223 198 ∼ ∼∗ Data are from all state and metropolitan area cancer registries, except Maryland. Included data cover approximately 98% of the population and met data quality
criteria for all invasive cancer sites combined. See Appendix B for registry-specific data quality information.† Invasive cancers only.‡ Data for specified racial or ethnic populations other than white and black should be interpreted with caution. See Technical Notes.
§ Hispanic origin is not mutually exclusive from race categories (white, black).
∼ Counts are suppressed if fewer than 16 cases were reported in a specific category (area, sex, race, ethnicity).
- Counts are suppressed at the state’s or metropolitan area’s request. See Technical Notes.
Notes: Cases from suppressed counts are included in region/division counts. Region/division counts are presented for regions/divisions with 100% of the
population covered by registries that meet the data quality criteria specified above unless the count for exactly one state in the region or division
is suppressed due to a count of less than 16. Michigan, Georgia, California, and Washington state counts each include cases from the SEER metropolitan
areas.
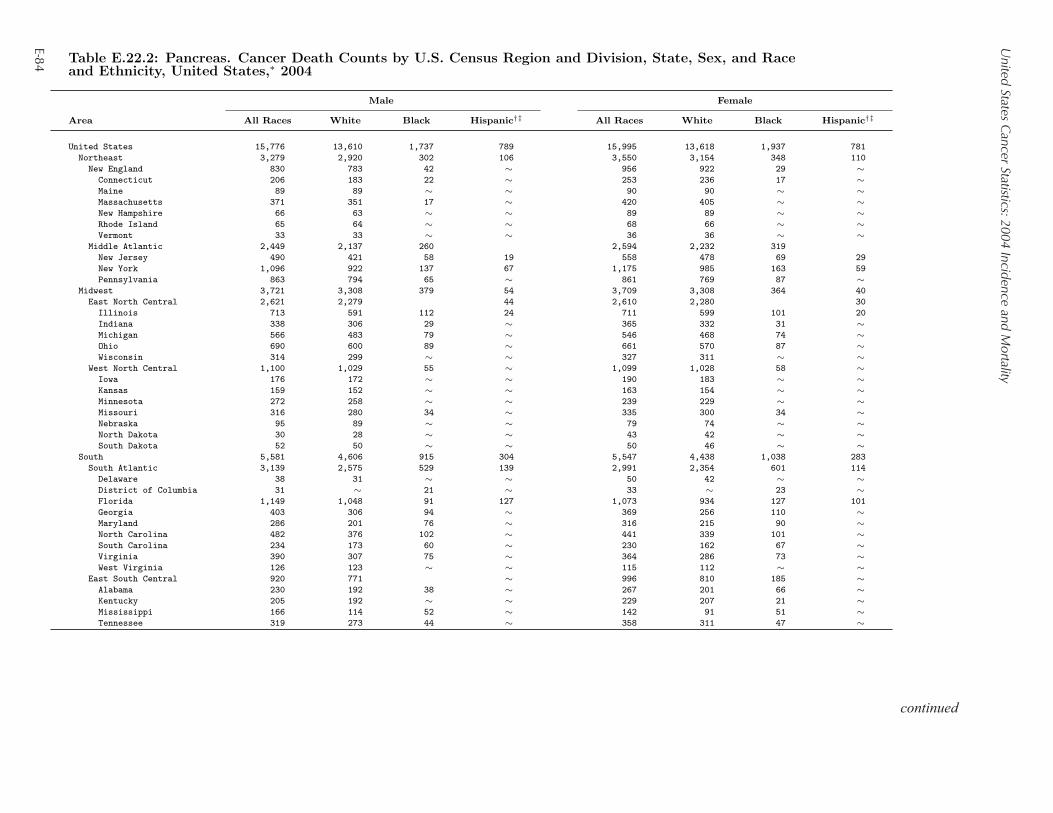
United
States Cancer Statistics: 2004 Incid
ence and M
ortality
E-��
continued
Table E.22.2: Pancreas. Cancer Death Counts by U.S. Census Region and Division, State, Sex, and Raceand Ethnicity, United States,∗ 2004
Male Female
Area All Races White Black Hispanic†‡ All Races White Black Hispanic†‡
United States 15,776 13,610 1,737 789 15,995 13,618 1,937 781
Northeast 3,279 2,920 302 106 3,550 3,154 348 110
New England 830 783 42 ∼ 956 922 29 ∼Connecticut 206 183 22 ∼ 253 236 17 ∼Maine 89 89 ∼ ∼ 90 90 ∼ ∼Massachusetts 371 351 17 ∼ 420 405 ∼ ∼New Hampshire 66 63 ∼ ∼ 89 89 ∼ ∼Rhode Island 65 64 ∼ ∼ 68 66 ∼ ∼Vermont 33 33 ∼ ∼ 36 36 ∼ ∼
Middle Atlantic 2,449 2,137 260 2,594 2,232 319
New Jersey 490 421 58 19 558 478 69 29
New York 1,096 922 137 67 1,175 985 163 59
Pennsylvania 863 794 65 ∼ 861 769 87 ∼Midwest 3,721 3,308 379 54 3,709 3,308 364 40
East North Central 2,621 2,279 44 2,610 2,280 30
Illinois 713 591 112 24 711 599 101 20
Indiana 338 306 29 ∼ 365 332 31 ∼Michigan 566 483 79 ∼ 546 468 74 ∼Ohio 690 600 89 ∼ 661 570 87 ∼Wisconsin 314 299 ∼ ∼ 327 311 ∼ ∼
West North Central 1,100 1,029 55 ∼ 1,099 1,028 58 ∼Iowa 176 172 ∼ ∼ 190 183 ∼ ∼Kansas 159 152 ∼ ∼ 163 154 ∼ ∼Minnesota 272 258 ∼ ∼ 239 229 ∼ ∼Missouri 316 280 34 ∼ 335 300 34 ∼Nebraska 95 89 ∼ ∼ 79 74 ∼ ∼North Dakota 30 28 ∼ ∼ 43 42 ∼ ∼South Dakota 52 50 ∼ ∼ 50 46 ∼ ∼
South 5,581 4,606 915 304 5,547 4,438 1,038 283
South Atlantic 3,139 2,575 529 139 2,991 2,354 601 114
Delaware 38 31 ∼ ∼ 50 42 ∼ ∼District of Columbia 31 ∼ 21 ∼ 33 ∼ 23 ∼Florida 1,149 1,048 91 127 1,073 934 127 101
Georgia 403 306 94 ∼ 369 256 110 ∼Maryland 286 201 76 ∼ 316 215 90 ∼North Carolina 482 376 102 ∼ 441 339 101 ∼South Carolina 234 173 60 ∼ 230 162 67 ∼Virginia 390 307 75 ∼ 364 286 73 ∼West Virginia 126 123 ∼ ∼ 115 112 ∼ ∼
East South Central 920 771 ∼ 996 810 185 ∼Alabama 230 192 38 ∼ 267 201 66 ∼Kentucky 205 192 ∼ ∼ 229 207 21 ∼Mississippi 166 114 52 ∼ 142 91 51 ∼Tennessee 319 273 44 ∼ 358 311 47 ∼

Appendix E
E-��
Table E.22.2: Pancreas. Cancer Death Counts by U.S. Census Region and Division, State, Sex, and Raceand Ethnicity, United States,∗ 2004 (continued)
Male Female
Area All Races White Black Hispanic†‡ All Races White Black Hispanic†‡
West South Central 1,522 1,260 239 165 1,560 1,274 252 166
Arkansas 137 119 18 ∼ 172 149 21 ∼Louisiana 250 170 80 ∼ 276 186 88 ∼Oklahoma 185 156 18 ∼ 184 154 18 ∼Texas 950 815 123 162 928 785 125 163
West 3,195 141 325 3,189 2,718 187 348
Mountain 938 889 19 98 891 838 23 92
Arizona 311 295 ∼ 25 249 230 ∼ 18
Colorado 186 177 ∼ 19 188 177 ∼ 29
Idaho 72 71 ∼ ∼ 81 80 ∼ ∼Montana 59 56 ∼ ∼ 56 55 ∼ ∼Nevada 105 94 ∼ ∼ 115 103 ∼ ∼New Mexico 93 88 ∼ 35 95 92 ∼ 34
Utah 88 84 ∼ ∼ 76 73 ∼ ∼Wyoming 24 24 ∼ ∼ 31 28 ∼ ∼
Pacific 2,257 122 227 2,298 1,880 164 256
Alaska 26 19 ∼ ∼ 16 ∼ ∼ ∼California 1,622 1,361 113 216 1,613 1,305 149 244
Hawaii 84 ∼ ∼ ∼ 84 ∼ ∼ ∼Oregon 196 187 ∼ ∼ 235 223 ∼ ∼Washington 329 306 ∼ ∼ 350 327 ∼ ∼
∗ Data are from the National Vital Statistics System (NVSS).† Data for specified racial or ethnic populations other than white and black should be interpreted with caution. See Technical Notes.‡ Hispanic origin is not mutually exclusive from race categories (white, black).
∼ Counts are suppressed if fewer than 16 cases were reported in a specific category (area, sex, race, ethnicity).
Notes: Region/division counts are suppressed if the count for exactly one state in the region or division is suppressed due to a count of less than 16.
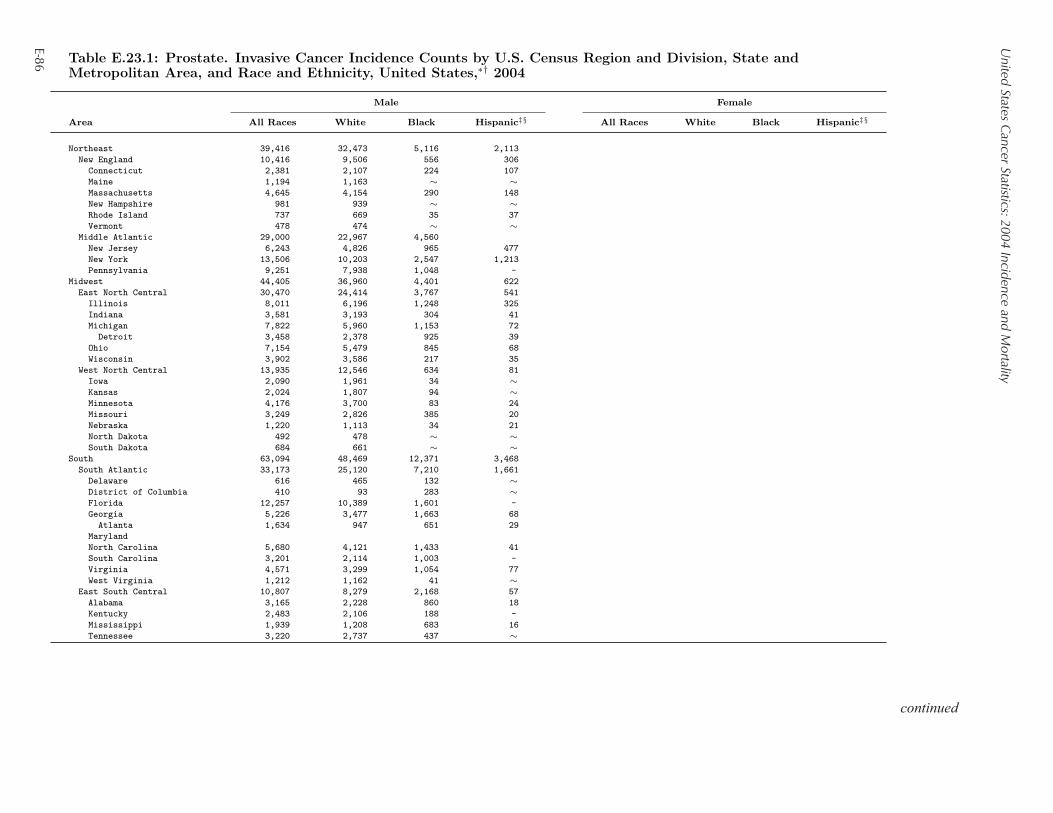
United
States Cancer Statistics: 2004 Incid
ence and M
ortality
E-��
continued
Table E.23.1: Prostate. Invasive Cancer Incidence Counts by U.S. Census Region and Division, State andMetropolitan Area, and Race and Ethnicity, United States,∗† 2004
Male Female
Area All Races White Black Hispanic‡§ All Races White Black Hispanic‡§
Northeast 39,416 32,473 5,116 2,113
New England 10,416 9,506 556 306
Connecticut 2,381 2,107 224 107
Maine 1,194 1,163 ∼ ∼Massachusetts 4,645 4,154 290 148
New Hampshire 981 939 ∼ ∼Rhode Island 737 669 35 37
Vermont 478 474 ∼ ∼Middle Atlantic 29,000 22,967 4,560
New Jersey 6,243 4,826 965 477
New York 13,506 10,203 2,547 1,213
Pennsylvania 9,251 7,938 1,048 -
Midwest 44,405 36,960 4,401 622
East North Central 30,470 24,414 3,767 541
Illinois 8,011 6,196 1,248 325
Indiana 3,581 3,193 304 41
Michigan 7,822 5,960 1,153 72
Detroit 3,458 2,378 925 39
Ohio 7,154 5,479 845 68
Wisconsin 3,902 3,586 217 35
West North Central 13,935 12,546 634 81
Iowa 2,090 1,961 34 ∼Kansas 2,024 1,807 94 ∼Minnesota 4,176 3,700 83 24
Missouri 3,249 2,826 385 20
Nebraska 1,220 1,113 34 21
North Dakota 492 478 ∼ ∼South Dakota 684 661 ∼ ∼
South 63,094 48,469 12,371 3,468
South Atlantic 33,173 25,120 7,210 1,661
Delaware 616 465 132 ∼District of Columbia 410 93 283 ∼Florida 12,257 10,389 1,601 -
Georgia 5,226 3,477 1,663 68
Atlanta 1,634 947 651 29
Maryland
North Carolina 5,680 4,121 1,433 41
South Carolina 3,201 2,114 1,003 -
Virginia 4,571 3,299 1,054 77
West Virginia 1,212 1,162 41 ∼East South Central 10,807 8,279 2,168 57
Alabama 3,165 2,228 860 18
Kentucky 2,483 2,106 188 -
Mississippi 1,939 1,208 683 16
Tennessee 3,220 2,737 437 ∼

Appendix E
E-��
Table E.23.1: Prostate. Invasive Cancer Incidence Counts by U.S. Census Region and Division, State andMetropolitan Area, and Race and Ethnicity, United States,∗† 2004 (continued)
Male Female
Area All Races White Black Hispanic‡§ All Races White Black Hispanic‡§
West South Central 19,114 15,070 2,993
Arkansas 2,024 1,751 244 ∼Louisiana 3,228 2,098 1,104 28
Oklahoma 2,284 1,945 158 32
Texas 11,578 9,276 1,487 1,686
West 42,160 35,273 2,338 4,373
Mountain 12,207 11,075 339
Arizona 2,989 2,676 105 239
Colorado 2,703 2,303 105 198
Idaho 998 985 ∼ 22
Montana 863 823 ∼ ∼Nevada 1,446 1,214 98 108
New Mexico 1,276 1,215 20 353
Utah 1,524 1,473 ∼ 43
Wyoming 408 386 ∼ 21
Pacific 29,953 24,198 1,999
Alaska 321 276 ∼ ∼California 21,725 17,268 1,802 3,219
San Francisco-Oakland 2,835 2,045 322 195
San Jose-Monterey 1,548 1,326 48 178
Los Angeles 5,781 4,039 818 1,303
Hawaii 833 276 ∼ 22
Oregon 2,573 2,393 42 48
Washington 4,501 3,985 133 92
Seattle-Puget Sound 3,124 2,867 128 52
∗ Data are from all state and metropolitan area cancer registries, except Maryland. Included data cover approximately 98% of the population and met data quality
criteria for all invasive cancer sites combined. See Appendix B for registry-specific data quality information.† Invasive cancers only.‡ Data for specified racial or ethnic populations other than white and black should be interpreted with caution. See Technical Notes.
§ Hispanic origin is not mutually exclusive from race categories (white, black).
∼ Counts are suppressed if fewer than 16 cases were reported in a specific category (area, sex, race, ethnicity).
- Counts are suppressed at the state’s or metropolitan area’s request. See Technical Notes.
Notes: Cases from suppressed counts are included in region/division counts. Region/division counts are presented for regions/divisions with 100% of the
population covered by registries that meet the data quality criteria specified above unless the count for exactly one state in the region or division
is suppressed due to a count of less than 16. Michigan, Georgia, California, and Washington state counts each include cases from the SEER metropolitan
areas.

United
States Cancer Statistics: 2004 Incid
ence and M
ortality
E-��
continued
Table E.23.2: Prostate. Cancer Death Counts by U.S. Census Region and Division, State, and Race andEthnicity, United States,∗ 2004
Male Female
Area All Races White Black Hispanic†‡ All Races White Black Hispanic†‡
United States 29,002 23,726 4,815 1,238
Northeast 5,776 4,914 801 175
New England 1,567 1,478 79 18
Connecticut 403 370 30 ∼Maine 158 156 ∼ ∼Massachusetts 651 605 40 ∼New Hampshire 143 143 ∼ ∼Rhode Island 135 127 ∼ ∼Vermont 77 77 ∼ ∼
Middle Atlantic 4,209 3,436 722
New Jersey 838 664 158 32
New York 1,896 1,489 378 112
Pennsylvania 1,475 1,283 186 ∼Midwest 6,887 5,957 896 60
East North Central 4,784 4,002 760 43
Illinois 1,228 940 278 26
Indiana 661 575 86 ∼Michigan 967 784 176 ∼Ohio 1,274 1,072 199 ∼Wisconsin 654 631 21 ∼
West North Central 2,103 1,955 136 17
Iowa 352 346 ∼ ∼Kansas 272 240 29 ∼Minnesota 558 542 ∼ ∼Missouri 546 461 82 ∼Nebraska 184 178 ∼ ∼North Dakota 89 89 ∼ ∼South Dakota 102 99 ∼ ∼
South 10,430 7,655 2,716 489
South Atlantic 5,787 4,191 1,569 232
Delaware 106 87 18 ∼District of Columbia 92 22 70 ∼Florida 2,134 1,819 315 209
Georgia 698 402 291 ∼Maryland 560 368 186 ∼North Carolina 858 569 282 ∼South Carolina 491 282 206 ∼Virginia 648 450 193 ∼West Virginia 200 192 ∼ ∼
East South Central 1,826 1,286 536 ∼Alabama 545 329 215 ∼Kentucky 393 349 44 ∼Mississippi 305 149 156 ∼Tennessee 583 459 121 ∼

Appendix E
E-��
Table E.23.2: Prostate. Cancer Death Counts by U.S. Census Region and Division, State, and Race andEthnicity, United States,∗ 2004 (continued)
Male Female
Area All Races White Black Hispanic†‡ All Races White Black Hispanic†‡
West South Central 2,817 2,178 611 254
Arkansas 316 247 69 ∼Louisiana 491 277 211 ∼Oklahoma 339 289 33 ∼Texas 1,671 1,365 298 248
West 5,909 5,200 402 514
Mountain 1,791 1,686 62 147
Arizona 550 514 19 55
Colorado 355 329 20 26
Idaho 153 151 ∼ ∼Montana 130 126 ∼ ∼Nevada 210 191 ∼ ∼New Mexico 175 162 ∼ 46
Utah 167 163 ∼ ∼Wyoming 51 50 ∼ ∼
Pacific 4,118 3,514 340 367
Alaska 32 26 ∼ ∼California 2,979 2,486 317 348
Hawaii 113 42 ∼ ∼Oregon 403 394 ∼ ∼Washington 591 566 ∼ ∼
∗ Data are from the National Vital Statistics System (NVSS).† Data for specified racial or ethnic populations other than white and black should be interpreted with caution. See Technical Notes.‡ Hispanic origin is not mutually exclusive from race categories (white, black).
∼ Counts are suppressed if fewer than 16 cases were reported in a specific category (area, sex, race, ethnicity).
Notes: Region/division counts are suppressed if the count for exactly one state in the region or division is suppressed due to a count of less than 16.
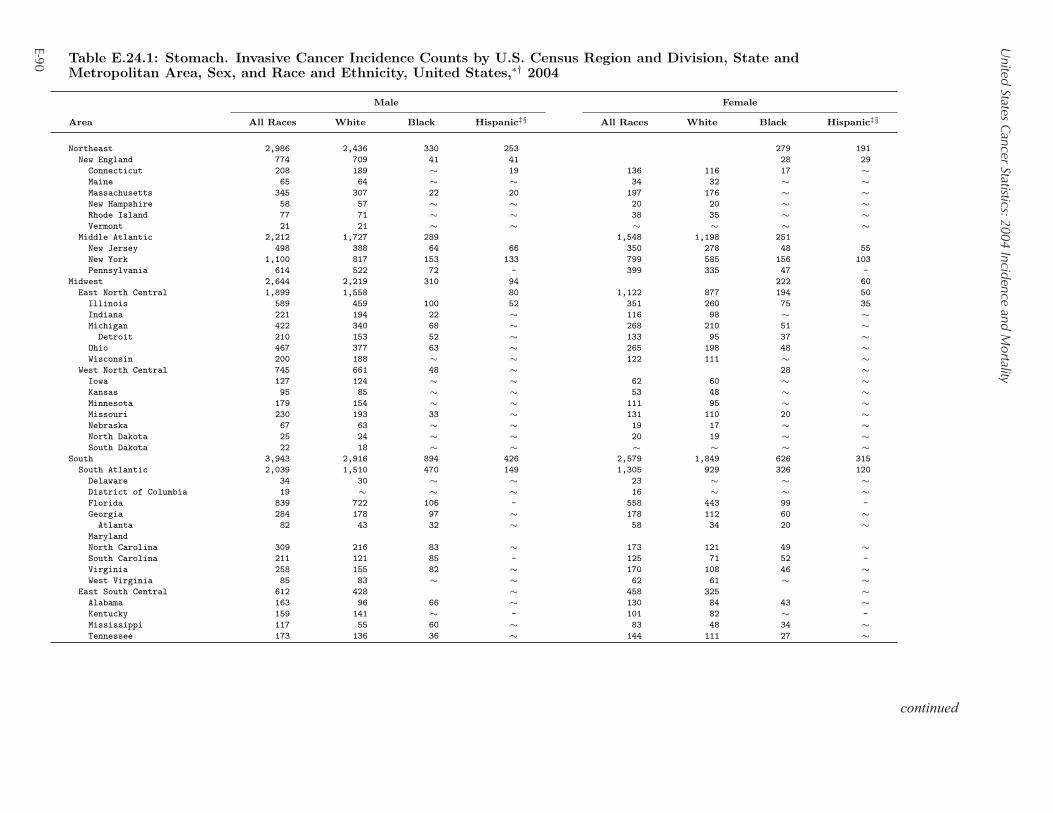
United
States Cancer Statistics: 2004 Incid
ence and M
ortality
E-�0
continued
Table E.24.1: Stomach. Invasive Cancer Incidence Counts by U.S. Census Region and Division, State andMetropolitan Area, Sex, and Race and Ethnicity, United States,∗† 2004
Male Female
Area All Races White Black Hispanic‡§ All Races White Black Hispanic‡§
Northeast 2,986 2,436 330 253 279 191
New England 774 709 41 41 28 29
Connecticut 208 189 ∼ 19 136 116 17 ∼Maine 65 64 ∼ ∼ 34 32 ∼ ∼Massachusetts 345 307 22 20 197 176 ∼ ∼New Hampshire 58 57 ∼ ∼ 20 20 ∼ ∼Rhode Island 77 71 ∼ ∼ 38 35 ∼ ∼Vermont 21 21 ∼ ∼ ∼ ∼ ∼ ∼
Middle Atlantic 2,212 1,727 289 1,548 1,198 251
New Jersey 498 388 64 66 350 278 48 55
New York 1,100 817 153 133 799 585 156 103
Pennsylvania 614 522 72 - 399 335 47 -
Midwest 2,644 2,219 310 94 222 60
East North Central 1,899 1,558 80 1,122 877 194 50
Illinois 589 459 100 52 351 260 75 35
Indiana 221 194 22 ∼ 116 98 ∼ ∼Michigan 422 340 68 ∼ 268 210 51 ∼
Detroit 210 153 52 ∼ 133 95 37 ∼Ohio 467 377 63 ∼ 265 198 48 ∼Wisconsin 200 188 ∼ ∼ 122 111 ∼ ∼
West North Central 745 661 48 ∼ 28 ∼Iowa 127 124 ∼ ∼ 62 60 ∼ ∼Kansas 95 85 ∼ ∼ 53 48 ∼ ∼Minnesota 179 154 ∼ ∼ 111 95 ∼ ∼Missouri 230 193 33 ∼ 131 110 20 ∼Nebraska 67 63 ∼ ∼ 19 17 ∼ ∼North Dakota 25 24 ∼ ∼ 20 19 ∼ ∼South Dakota 22 18 ∼ ∼ ∼ ∼ ∼ ∼
South 3,943 2,916 894 426 2,579 1,849 626 315
South Atlantic 2,039 1,510 470 149 1,305 929 326 120
Delaware 34 30 ∼ ∼ 23 ∼ ∼ ∼District of Columbia 19 ∼ ∼ ∼ 16 ∼ ∼ ∼Florida 839 722 106 - 558 443 99 -
Georgia 284 178 97 ∼ 178 112 60 ∼Atlanta 82 43 32 ∼ 58 34 20 ∼
Maryland
North Carolina 309 216 83 ∼ 173 121 49 ∼South Carolina 211 121 85 - 125 71 52 -
Virginia 258 155 82 ∼ 170 108 46 ∼West Virginia 85 83 ∼ ∼ 62 61 ∼ ∼
East South Central 612 428 ∼ 458 325 ∼Alabama 163 96 66 ∼ 130 84 43 ∼Kentucky 159 141 ∼ - 101 82 ∼ -
Mississippi 117 55 60 ∼ 83 48 34 ∼Tennessee 173 136 36 ∼ 144 111 27 ∼

Appendix E
E-��
Table E.24.1: Stomach. Invasive Cancer Incidence Counts by U.S. Census Region and Division, State andMetropolitan Area, Sex, and Race and Ethnicity, United States,∗† 2004 (continued)
Male Female
Area All Races White Black Hispanic‡§ All Races White Black Hispanic‡§
West South Central 1,292 978 270 816 595 191
Arkansas 107 78 27 ∼ 74 49 24 ∼Louisiana 245 139 104 ∼ 135 74 60 ∼Oklahoma 122 94 ∼ ∼ 91 72 ∼ ∼Texas 818 667 108 259 516 400 90 182
West 2,724 151 541 1,756 1,279 95 420
Mountain 666 593 28 129 331 ∼ 90
Arizona 190 168 ∼ 37 106 95 ∼ 34
Colorado 132 124 ∼ 28 80 69 ∼ 21
Idaho 42 41 ∼ ∼ 21 19 ∼ ∼Montana 34 29 ∼ ∼ 16 ∼ ∼ ∼Nevada 94 72 ∼ ∼ 48 44 ∼ ∼New Mexico 93 83 ∼ 44 59 49 ∼ 24
Utah 62 59 ∼ ∼ 34 32 ∼ ∼Wyoming 19 17 ∼ ∼ ∼ ∼ ∼ ∼
Pacific 2,058 123 412 948 84 330
Alaska 23 ∼ ∼ ∼ ∼ ∼ ∼ ∼California 1,541 1,108 108 392 1,075 744 77 313
San Francisco-Oakland 212 119 29 31 147 91 ∼ 28
San Jose-Monterey 80 58 ∼ ∼ 75 50 ∼ 24
Los Angeles 498 309 49 150 372 221 41 131
Hawaii 111 18 ∼ ∼ 53 ∼ ∼ ∼Oregon 138 127 ∼ ∼ 96 81 ∼ ∼Washington 245 205 ∼ ∼ 149 116 ∼ ∼
Seattle-Puget Sound 170 141 ∼ ∼ 111 79 ∼ ∼∗ Data are from all state and metropolitan area cancer registries, except Maryland. Included data cover approximately 98% of the population and met data quality
criteria for all invasive cancer sites combined. See Appendix B for registry-specific data quality information.† Invasive cancers only.‡ Data for specified racial or ethnic populations other than white and black should be interpreted with caution. See Technical Notes.
§ Hispanic origin is not mutually exclusive from race categories (white, black).
∼ Counts are suppressed if fewer than 16 cases were reported in a specific category (area, sex, race, ethnicity).
- Counts are suppressed at the state’s or metropolitan area’s request. See Technical Notes.
Notes: Cases from suppressed counts are included in region/division counts. Region/division counts are presented for regions/divisions with 100% of the
population covered by registries that meet the data quality criteria specified above unless the count for exactly one state in the region or division
is suppressed due to a count of less than 16. Michigan, Georgia, California, and Washington state counts each include cases from the SEER metropolitan
areas.

United
States Cancer Statistics: 2004 Incid
ence and M
ortality
E-��
continued
Table E.24.2: Stomach. Cancer Death Counts by U.S. Census Region and Division, State, Sex, and Race andEthnicity, United States,∗ 2004
Male Female
Area All Races White Black Hispanic†‡ All Races White Black Hispanic†‡
United States 6,958 5,332 1,191 771 4,901 3,735 843 584
Northeast 196 123 1,180 950 168 105
New England 26 ∼ 271 247 ∼ ∼Connecticut 102 92 ∼ ∼ 66 58 ∼ ∼Maine 31 30 ∼ ∼ 25 24 ∼ ∼Massachusetts 167 150 ∼ ∼ 128 116 ∼ ∼New Hampshire 20 20 ∼ ∼ ∼ ∼ ∼ ∼Rhode Island 44 42 ∼ ∼ 32 29 ∼ ∼Vermont ∼ ∼ ∼ ∼ ∼ ∼ ∼ ∼
Middle Atlantic 1,167 923 170 909 703 153
New Jersey 259 203 37 31 184 147 29 21
New York 581 448 84 67 479 351 91 67
Pennsylvania 327 272 49 ∼ 246 205 33 ∼Midwest 1,175 216 50 1,025 837 162 38
East North Central 1,018 811 182 44 746 595 136 33
Illinois 348 257 81 28 230 174 51 22
Indiana 102 89 ∼ ∼ 91 76 ∼ ∼Michigan 210 162 40 ∼ 154 122 30 ∼Ohio 239 192 43 ∼ 182 139 39 ∼Wisconsin 119 111 ∼ ∼ 89 84 ∼ ∼
West North Central 364 34 ∼ 279 242 26 ∼Iowa 58 57 ∼ ∼ 40 36 ∼ ∼Kansas 50 48 ∼ ∼ 33 28 ∼ ∼Minnesota 114 108 ∼ ∼ 81 76 ∼ ∼Missouri 128 104 23 ∼ 86 66 16 ∼Nebraska 29 24 ∼ ∼ 18 17 ∼ ∼North Dakota 16 ∼ ∼ ∼ ∼ ∼ ∼ ∼South Dakota ∼ ∼ ∼ ∼ ∼ ∼ ∼ ∼
South 2,517 1,782 672 277 1,644 1,150 441 181
South Atlantic 1,363 928 400 91 861 577 255 56
Delaware 21 18 ∼ ∼ ∼ ∼ ∼ ∼District of Columbia 21 ∼ ∼ ∼ ∼ ∼ ∼ ∼Florida 506 428 73 76 313 246 58 44
Georgia 178 89 84 ∼ 103 60 42 ∼Maryland 118 58 49 ∼ 100 58 35 ∼North Carolina 185 124 57 ∼ 128 83 43 ∼South Carolina 127 63 63 ∼ 70 36 33 ∼Virginia 163 100 55 ∼ 85 48 29 ∼West Virginia 44 43 ∼ ∼ 41 40 ∼ ∼
East South Central 376 260 ∼ 276 197 ∼Alabama 115 69 45 ∼ 73 48 22 ∼Kentucky 84 80 ∼ ∼ 52 46 ∼ ∼Mississippi 71 31 40 ∼ 58 35 23 ∼Tennessee 106 80 26 ∼ 93 68 25 ∼

Appendix E
E-�3
Table E.24.2: Stomach. Cancer Death Counts by U.S. Census Region and Division, State, Sex, and Race andEthnicity, United States,∗ 2004 (continued)
Male Female
Area All Races White Black Hispanic†‡ All Races White Black Hispanic†‡
West South Central 778 594 157 183 507 376 124
Arkansas 50 40 ∼ ∼ 54 38 16 ∼Louisiana 150 78 70 ∼ 82 40 42 ∼Oklahoma 64 53 ∼ ∼ 48 39 ∼ ∼Texas 514 423 71 173 323 259 50 123
West 1,482 1,112 107 321 1,052 798 72 260
Mountain 21 76 245 213 ∼ 63
Arizona 111 94 ∼ 25 79 66 ∼ 28
Colorado 74 67 ∼ 18 60 51 ∼ ∼Idaho 29 29 ∼ ∼ 17 17 ∼ ∼Montana 20 19 ∼ ∼ ∼ ∼ ∼ ∼Nevada 38 25 ∼ ∼ 21 17 ∼ ∼New Mexico 60 52 ∼ 23 37 33 ∼ 20
Utah 27 25 ∼ ∼ ∼ ∼ ∼ ∼Wyoming ∼ ∼ ∼ ∼ ∼ ∼ ∼ ∼
Pacific 794 86 245 585 62 197
Alaska ∼ ∼ ∼ ∼ ∼ ∼ ∼ ∼California 861 622 79 233 621 453 58 186
Hawaii 63 ∼ ∼ ∼ 28 ∼ ∼ ∼Oregon 65 57 ∼ ∼ 57 49 ∼ ∼Washington 114 99 ∼ ∼ 97 78 ∼ ∼
∗ Data are from the National Vital Statistics System (NVSS).† Data for specified racial or ethnic populations other than white and black should be interpreted with caution. See Technical Notes.‡ Hispanic origin is not mutually exclusive from race categories (white, black).
∼ Counts are suppressed if fewer than 16 cases were reported in a specific category (area, sex, race, ethnicity).
Notes: Region/division counts are suppressed if the count for exactly one state in the region or division is suppressed due to a count of less than 16.

United
States Cancer Statistics: 2004 Incid
ence and M
ortality
E-��
continued
Table E.25.1: Testis. Invasive Cancer Incidence Counts by U.S. Census Region and Division, State andMetropolitan Area, and Race and Ethnicity, United States,∗† 2004
Male Female
Area All Races White Black Hispanic‡§ All Races White Black Hispanic‡§
Northeast 1,598 1,487 44 114
New England 429 411 ∼ 21
Connecticut 102 95 ∼ ∼Maine 36 36 ∼ ∼Massachusetts 181 172 ∼ ∼New Hampshire 48 47 ∼ ∼Rhode Island 35 34 ∼ ∼Vermont 27 27 ∼ ∼
Middle Atlantic 1,169 1,076 39
New Jersey 266 242 ∼ 35
New York 497 456 ∼ 52
Pennsylvania 406 378 16 -
Midwest 1,844 1,731 34 64
East North Central 1,275 1,192 31 52
Illinois 339 314 ∼ 27
Indiana 155 151 ∼ ∼Michigan 285 269 ∼ ∼Detroit 109 102 ∼ ∼
Ohio 307 274 ∼ ∼Wisconsin 189 184 ∼ ∼
West North Central 569 539 ∼ ∼Iowa 93 90 ∼ ∼Kansas 69 66 ∼ ∼Minnesota 170 153 ∼ ∼Missouri 143 140 ∼ ∼Nebraska 55 53 ∼ ∼North Dakota 21 20 ∼ ∼South Dakota 18 17 ∼ ∼
South 2,233 2,077 96 323
South Atlantic 1,069 988 49 120
Delaware ∼ ∼ ∼ ∼District of Columbia 20 ∼ ∼ ∼Florida 363 344 ∼ -
Georgia 183 164 ∼ ∼Atlanta 71 61 ∼ ∼
Maryland
North Carolina 209 185 ∼ 20
South Carolina 65 63 ∼ -
Virginia 177 165 ∼ ∼West Virginia 40 40 ∼ ∼
East South Central 376 353 16 ∼Alabama 101 95 ∼ ∼Kentucky 94 92 ∼ -
Mississippi 53 47 ∼ ∼Tennessee 128 119 ∼ ∼

Appendix E
E-��
Table E.25.1: Testis. Invasive Cancer Incidence Counts by U.S. Census Region and Division, State andMetropolitan Area, and Race and Ethnicity, United States,∗† 2004 (continued)
Male Female
Area All Races White Black Hispanic‡§ All Races White Black Hispanic‡§
West South Central 788 736 31 194
Arkansas 51 49 ∼ ∼Louisiana 107 99 ∼ ∼Oklahoma 84 73 ∼ ∼Texas 546 515 18 184
West 1,765 24 403
Mountain ∼ 88
Arizona 137 129 ∼ 29
Colorado 146 135 ∼ 25
Idaho 55 54 ∼ ∼Montana 21 21 ∼ ∼Nevada 56 50 ∼ ∼New Mexico 47 44 ∼ 18
Utah 101 99 ∼ ∼Wyoming ∼ ∼ ∼ ∼
Pacific 1,326 1,218 17 315
Alaska 16 ∼ ∼ ∼California 967 893 16 304
San Francisco-Oakland 110 98 ∼ 20
San Jose-Monterey 67 61 ∼ 20
Los Angeles 234 209 ∼ 94
Hawaii 27 ∼ ∼ ∼Oregon 117 113 ∼ ∼Washington 199 185 ∼ ∼Seattle-Puget Sound 147 142 ∼ ∼
∗ Data are from all state and metropolitan area cancer registries, except Maryland. Included data cover approximately 98% of the population and met data quality
criteria for all invasive cancer sites combined. See Appendix B for registry-specific data quality information.† Invasive cancers only.‡ Data for specified racial or ethnic populations other than white and black should be interpreted with caution. See Technical Notes.
§ Hispanic origin is not mutually exclusive from race categories (white, black).
∼ Counts are suppressed if fewer than 16 cases were reported in a specific category (area, sex, race, ethnicity).
- Counts are suppressed at the state’s or metropolitan area’s request. See Technical Notes.
Notes: Cases from suppressed counts are included in region/division counts. Region/division counts are presented for regions/divisions with 100% of the
population covered by registries that meet the data quality criteria specified above unless the count for exactly one state in the region or division
is suppressed due to a count of less than 16. Michigan, Georgia, California, and Washington state counts each include cases from the SEER metropolitan
areas.

United
States Cancer Statistics: 2004 Incid
ence and M
ortality
E-��
continued
Table E.25.2: Testis. Cancer Death Counts by U.S. Census Region and Division, State, and Race and Ethnicity,United States,∗ 2004
Male Female
Area All Races White Black Hispanic†‡ All Races White Black Hispanic†‡
United States 357 321 25 44
Northeast 75 71 ∼ ∼New England 27 25 ∼ ∼
Connecticut ∼ ∼ ∼ ∼Maine ∼ ∼ ∼ ∼Massachusetts ∼ ∼ ∼ ∼New Hampshire ∼ ∼ ∼ ∼Rhode Island ∼ ∼ ∼ ∼Vermont ∼ ∼ ∼ ∼
Middle Atlantic ∼ ∼New Jersey ∼ ∼ ∼ ∼New York 19 18 ∼ ∼Pennsylvania 20 19 ∼ ∼
Midwest 71 66 ∼ ∼East North Central 54 52 ∼ ∼
Illinois 17 16 ∼ ∼Indiana ∼ ∼ ∼ ∼Michigan ∼ ∼ ∼ ∼Ohio ∼ ∼ ∼ ∼Wisconsin ∼ ∼ ∼ ∼
West North Central 17 ∼ ∼ ∼Iowa ∼ ∼ ∼ ∼Kansas ∼ ∼ ∼ ∼Minnesota ∼ ∼ ∼ ∼Missouri ∼ ∼ ∼ ∼Nebraska ∼ ∼ ∼ ∼North Dakota ∼ ∼ ∼ ∼South Dakota ∼ ∼ ∼ ∼
South 118 101 16 16
South Atlantic 53 45 ∼ ∼Delaware ∼ ∼ ∼ ∼District of Columbia ∼ ∼ ∼ ∼Florida 18 ∼ ∼ ∼Georgia ∼ ∼ ∼ ∼Maryland ∼ ∼ ∼ ∼North Carolina ∼ ∼ ∼ ∼South Carolina ∼ ∼ ∼ ∼Virginia ∼ ∼ ∼ ∼West Virginia ∼ ∼ ∼ ∼
East South Central 17 ∼ ∼ ∼Alabama ∼ ∼ ∼ ∼Kentucky ∼ ∼ ∼ ∼Mississippi ∼ ∼ ∼ ∼Tennessee ∼ ∼ ∼ ∼

Appendix E
E-��
Table E.25.2: Testis. Cancer Death Counts by U.S. Census Region and Division, State, and Race and Ethnicity,United States,∗ 2004 (continued)
Male Female
Area All Races White Black Hispanic†‡ All Races White Black Hispanic†‡
West South Central 48 43 ∼ ∼Arkansas ∼ ∼ ∼ ∼Louisiana ∼ ∼ ∼ ∼Oklahoma ∼ ∼ ∼ ∼Texas 33 30 ∼ ∼
West 93 83 ∼ 22
Mountain 22 21 ∼ ∼Arizona ∼ ∼ ∼ ∼Colorado ∼ ∼ ∼ ∼Idaho ∼ ∼ ∼ ∼Montana ∼ ∼ ∼ ∼Nevada ∼ ∼ ∼ ∼New Mexico ∼ ∼ ∼ ∼Utah ∼ ∼ ∼ ∼Wyoming ∼ ∼ ∼ ∼
Pacific 71 62 ∼ 19
Alaska ∼ ∼ ∼ ∼California 55 48 ∼ 19
Hawaii ∼ ∼ ∼ ∼Oregon ∼ ∼ ∼ ∼Washington ∼ ∼ ∼ ∼
∗ Data are from the National Vital Statistics System (NVSS).† Data for specified racial or ethnic populations other than white and black should be interpreted with caution. See Technical Notes.‡ Hispanic origin is not mutually exclusive from race categories (white, black).
∼ Counts are suppressed if fewer than 16 cases were reported in a specific category (area, sex, race, ethnicity).
Notes: Region/division counts are suppressed if the count for exactly one state in the region or division is suppressed due to a count of less than 16.
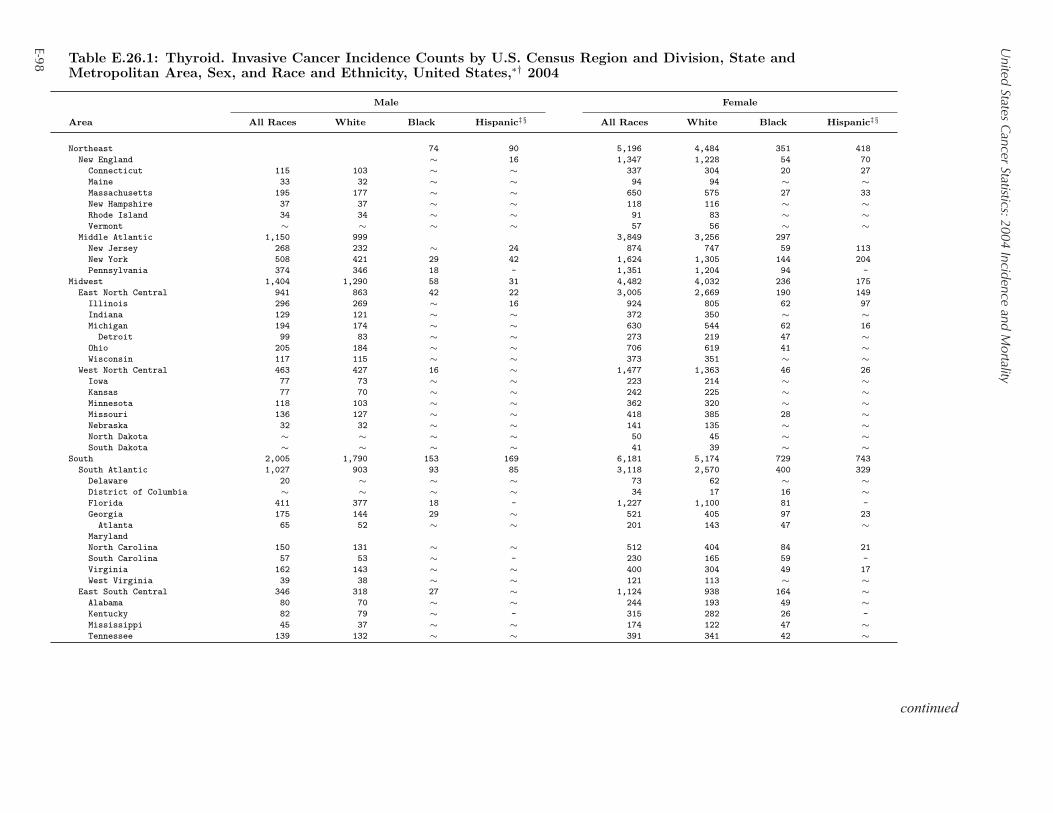
United
States Cancer Statistics: 2004 Incid
ence and M
ortality
E-��
continued
Table E.26.1: Thyroid. Invasive Cancer Incidence Counts by U.S. Census Region and Division, State andMetropolitan Area, Sex, and Race and Ethnicity, United States,∗† 2004
Male Female
Area All Races White Black Hispanic‡§ All Races White Black Hispanic‡§
Northeast 74 90 5,196 4,484 351 418
New England ∼ 16 1,347 1,228 54 70
Connecticut 115 103 ∼ ∼ 337 304 20 27
Maine 33 32 ∼ ∼ 94 94 ∼ ∼Massachusetts 195 177 ∼ ∼ 650 575 27 33
New Hampshire 37 37 ∼ ∼ 118 116 ∼ ∼Rhode Island 34 34 ∼ ∼ 91 83 ∼ ∼Vermont ∼ ∼ ∼ ∼ 57 56 ∼ ∼
Middle Atlantic 1,150 999 3,849 3,256 297
New Jersey 268 232 ∼ 24 874 747 59 113
New York 508 421 29 42 1,624 1,305 144 204
Pennsylvania 374 346 18 - 1,351 1,204 94 -
Midwest 1,404 1,290 58 31 4,482 4,032 236 175
East North Central 941 863 42 22 3,005 2,669 190 149
Illinois 296 269 ∼ 16 924 805 62 97
Indiana 129 121 ∼ ∼ 372 350 ∼ ∼Michigan 194 174 ∼ ∼ 630 544 62 16
Detroit 99 83 ∼ ∼ 273 219 47 ∼Ohio 205 184 ∼ ∼ 706 619 41 ∼Wisconsin 117 115 ∼ ∼ 373 351 ∼ ∼
West North Central 463 427 16 ∼ 1,477 1,363 46 26
Iowa 77 73 ∼ ∼ 223 214 ∼ ∼Kansas 77 70 ∼ ∼ 242 225 ∼ ∼Minnesota 118 103 ∼ ∼ 362 320 ∼ ∼Missouri 136 127 ∼ ∼ 418 385 28 ∼Nebraska 32 32 ∼ ∼ 141 135 ∼ ∼North Dakota ∼ ∼ ∼ ∼ 50 45 ∼ ∼South Dakota ∼ ∼ ∼ ∼ 41 39 ∼ ∼
South 2,005 1,790 153 169 6,181 5,174 729 743
South Atlantic 1,027 903 93 85 3,118 2,570 400 329
Delaware 20 ∼ ∼ ∼ 73 62 ∼ ∼District of Columbia ∼ ∼ ∼ ∼ 34 17 16 ∼Florida 411 377 18 - 1,227 1,100 81 -
Georgia 175 144 29 ∼ 521 405 97 23
Atlanta 65 52 ∼ ∼ 201 143 47 ∼Maryland
North Carolina 150 131 ∼ ∼ 512 404 84 21
South Carolina 57 53 ∼ - 230 165 59 -
Virginia 162 143 ∼ ∼ 400 304 49 17
West Virginia 39 38 ∼ ∼ 121 113 ∼ ∼East South Central 346 318 27 ∼ 1,124 938 164 ∼Alabama 80 70 ∼ ∼ 244 193 49 ∼Kentucky 82 79 ∼ - 315 282 26 -
Mississippi 45 37 ∼ ∼ 174 122 47 ∼Tennessee 139 132 ∼ ∼ 391 341 42 ∼

Appendix E
E-��
Table E.26.1: Thyroid. Invasive Cancer Incidence Counts by U.S. Census Region and Division, State andMetropolitan Area, Sex, and Race and Ethnicity, United States,∗† 2004 (continued)
Male Female
Area All Races White Black Hispanic‡§ All Races White Black Hispanic‡§
West South Central 632 569 33 82 1,939 1,666 165 400
Arkansas 41 40 ∼ ∼ 124 111 ∼ ∼Louisiana 86 70 ∼ ∼ 248 203 43 ∼Oklahoma 41 35 ∼ ∼ 155 127 ∼ ∼Texas 464 424 19 81 1,412 1,225 108 391
West 1,234 31 185 4,715 3,940 129 890
Mountain ∼ 60 1,676 1,527 33 264
Arizona 145 133 ∼ 24 458 412 ∼ 87
Colorado 106 103 ∼ 17 370 345 ∼ 55
Idaho 31 30 ∼ ∼ 105 105 ∼ ∼Montana 24 24 ∼ ∼ 70 64 ∼ ∼Nevada 58 57 ∼ ∼ 219 175 ∼ 35
New Mexico 57 55 ∼ ∼ 174 163 ∼ 61
Utah 58 54 ∼ ∼ 216 207 ∼ ∼Wyoming ∼ ∼ ∼ ∼ 64 56 ∼ ∼
Pacific 924 767 24 125 3,039 2,413 96 626
Alaska 16 ∼ ∼ ∼ 62 51 ∼ ∼California 657 552 19 114 2,197 1,762 76 587
San Francisco-Oakland 61 43 ∼ ∼ 240 157 ∼ 37
San Jose-Monterey 42 31 ∼ ∼ 155 117 ∼ 31
Los Angeles 177 141 ∼ 49 632 487 36 232
Hawaii 36 ∼ ∼ ∼ 91 19 ∼ ∼Oregon 74 67 ∼ ∼ 236 206 ∼ ∼Washington 141 127 ∼ ∼ 453 375 ∼ 17
Seattle-Puget Sound 106 93 ∼ ∼ 316 271 ∼ ∼∗ Data are from all state and metropolitan area cancer registries, except Maryland. Included data cover approximately 98% of the population and met data quality
criteria for all invasive cancer sites combined. See Appendix B for registry-specific data quality information.† Invasive cancers only.‡ Data for specified racial or ethnic populations other than white and black should be interpreted with caution. See Technical Notes.
§ Hispanic origin is not mutually exclusive from race categories (white, black).
∼ Counts are suppressed if fewer than 16 cases were reported in a specific category (area, sex, race, ethnicity).
- Counts are suppressed at the state’s or metropolitan area’s request. See Technical Notes.
Notes: Cases from suppressed counts are included in region/division counts. Region/division counts are presented for regions/divisions with 100% of the
population covered by registries that meet the data quality criteria specified above unless the count for exactly one state in the region or division
is suppressed due to a count of less than 16. Michigan, Georgia, California, and Washington state counts each include cases from the SEER metropolitan
areas.

United
States Cancer Statistics: 2004 Incid
ence and M
ortality
E-�00
continued
Table E.26.2: Thyroid. Cancer Death Counts by U.S. Census Region and Division, State, Sex, and Race andEthnicity, United States,∗ 2004
Male Female
Area All Races White Black Hispanic†‡ All Races White Black Hispanic†‡
United States 593 529 41 45 816 701 77 67
Northeast 127 110 ∼ ∼ 173 153 ∼ ∼New England 34 32 ∼ ∼ 44 41 ∼ ∼
Connecticut ∼ ∼ ∼ ∼ ∼ ∼ ∼ ∼Maine ∼ ∼ ∼ ∼ ∼ ∼ ∼ ∼Massachusetts 18 16 ∼ ∼ 17 ∼ ∼ ∼New Hampshire ∼ ∼ ∼ ∼ ∼ ∼ ∼ ∼Rhode Island ∼ ∼ ∼ ∼ ∼ ∼ ∼ ∼Vermont ∼ ∼ ∼ ∼ ∼ ∼ ∼ ∼
Middle Atlantic 93 78 ∼ ∼ 129 112 ∼ ∼New Jersey 27 24 ∼ ∼ 38 34 ∼ ∼New York 39 30 ∼ ∼ 52 41 ∼ ∼Pennsylvania 27 24 ∼ ∼ 39 37 ∼ ∼
Midwest 123 118 ∼ ∼ 205 185 ∼ ∼East North Central 85 81 ∼ ∼ 143 ∼ ∼
Illinois ∼ ∼ ∼ ∼ 50 41 ∼ ∼Indiana ∼ ∼ ∼ ∼ 17 17 ∼ ∼Michigan 17 16 ∼ ∼ 26 25 ∼ ∼Ohio 28 26 ∼ ∼ 34 30 ∼ ∼Wisconsin ∼ ∼ ∼ ∼ 16 ∼ ∼ ∼
West North Central 38 37 ∼ ∼ 62 58 ∼ ∼Iowa ∼ ∼ ∼ ∼ ∼ ∼ ∼ ∼Kansas ∼ ∼ ∼ ∼ ∼ ∼ ∼ ∼Minnesota ∼ ∼ ∼ ∼ 16 ∼ ∼ ∼Missouri ∼ ∼ ∼ ∼ 20 18 ∼ ∼Nebraska ∼ ∼ ∼ ∼ ∼ ∼ ∼ ∼North Dakota ∼ ∼ ∼ ∼ ∼ ∼ ∼ ∼South Dakota ∼ ∼ ∼ ∼ ∼ ∼ ∼ ∼
South 207 187 19 19 280 232 41 30
South Atlantic 112 98 ∼ ∼ 136 112 22 ∼Delaware ∼ ∼ ∼ ∼ ∼ ∼ ∼ ∼District of Columbia ∼ ∼ ∼ ∼ ∼ ∼ ∼ ∼Florida 49 47 ∼ ∼ 54 50 ∼ ∼Georgia ∼ ∼ ∼ ∼ ∼ ∼ ∼ ∼Maryland ∼ ∼ ∼ ∼ 19 16 ∼ ∼North Carolina 17 ∼ ∼ ∼ ∼ ∼ ∼ ∼South Carolina ∼ ∼ ∼ ∼ ∼ ∼ ∼ ∼Virginia ∼ ∼ ∼ ∼ ∼ ∼ ∼ ∼West Virginia ∼ ∼ ∼ ∼ ∼ ∼ ∼ ∼
East South Central 33 29 ∼ ∼ 53 46 ∼ ∼Alabama ∼ ∼ ∼ ∼ ∼ ∼ ∼ ∼Kentucky ∼ ∼ ∼ ∼ ∼ ∼ ∼ ∼Mississippi ∼ ∼ ∼ ∼ ∼ ∼ ∼ ∼Tennessee ∼ ∼ ∼ ∼ 21 18 ∼ ∼

Appendix E
E-�0�
Table E.26.2: Thyroid. Cancer Death Counts by U.S. Census Region and Division, State, Sex, and Race andEthnicity, United States,∗ 2004 (continued)
Male Female
Area All Races White Black Hispanic†‡ All Races White Black Hispanic†‡
West South Central 62 60 ∼ ∼ 91 74 ∼ 16
Arkansas ∼ ∼ ∼ ∼ ∼ ∼ ∼ ∼Louisiana ∼ ∼ ∼ ∼ 16 ∼ ∼ ∼Oklahoma ∼ ∼ ∼ ∼ ∼ ∼ ∼ ∼Texas 41 40 ∼ ∼ 56 46 ∼ ∼
West 136 114 ∼ 20 158 131 ∼ 32
Mountain 45 44 ∼ ∼ 38 36 ∼ ∼Arizona ∼ ∼ ∼ ∼ ∼ ∼ ∼ ∼Colorado ∼ ∼ ∼ ∼ ∼ ∼ ∼ ∼Idaho ∼ ∼ ∼ ∼ ∼ ∼ ∼ ∼Montana ∼ ∼ ∼ ∼ ∼ ∼ ∼ ∼Nevada ∼ ∼ ∼ ∼ ∼ ∼ ∼ ∼New Mexico ∼ ∼ ∼ ∼ ∼ ∼ ∼ ∼Utah ∼ ∼ ∼ ∼ ∼ ∼ ∼ ∼Wyoming ∼ ∼ ∼ ∼ ∼ ∼ ∼ ∼
Pacific 91 70 ∼ ∼ 120 95 ∼ 26
Alaska ∼ ∼ ∼ ∼ ∼ ∼ ∼ ∼California 69 55 ∼ ∼ 87 66 ∼ 26
Hawaii ∼ ∼ ∼ ∼ ∼ ∼ ∼ ∼Oregon ∼ ∼ ∼ ∼ ∼ ∼ ∼ ∼Washington ∼ ∼ ∼ ∼ 24 22 ∼ ∼
∗ Data are from the National Vital Statistics System (NVSS).† Data for specified racial or ethnic populations other than white and black should be interpreted with caution. See Technical Notes.‡ Hispanic origin is not mutually exclusive from race categories (white, black).
∼ Counts are suppressed if fewer than 16 cases were reported in a specific category (area, sex, race, ethnicity).
Notes: Region/division counts are suppressed if the count for exactly one state in the region or division is suppressed due to a count of less than 16.

United
States Cancer Statistics: 2004 Incid
ence and M
ortality
E-�0�
continued
Table E.27.1: Urinary Bladder. Invasive Cancer Incidence Counts by U.S. Census Region and Division, Stateand Metropolitan Area, Sex, and Race and Ethnicity, United States,∗† 2004
Male Female
Area All Races White Black Hispanic‡§ All Races White Black Hispanic‡§
Northeast 11,232 10,560 386 314 4,160 3,841 226 140
New England 2,959 2,870 48 55 1,154 1,116 20 22
Connecticut 685 657 18 26 250 235 ∼ ∼Maine 318 313 ∼ ∼ 114 114 ∼ ∼Massachusetts 1,274 1,232 26 18 548 531 ∼ ∼New Hampshire 264 262 ∼ ∼ 102 98 ∼ ∼Rhode Island 275 268 ∼ ∼ 93 91 ∼ ∼Vermont 143 138 ∼ ∼ 47 47 ∼ ∼
Middle Atlantic 8,273 7,690 338 3,006 2,725 206
New Jersey 1,842 1,681 88 86 721 652 52 29
New York 3,601 3,306 162 151 1,345 1,201 94 78
Pennsylvania 2,830 2,703 88 - 940 872 60 -
Midwest 10,842 10,136 345 89 3,668 3,364 180 35
East North Central 7,446 6,886 81 2,557 2,303 31
Illinois 2,084 1,897 97 51 704 622 52 16
Indiana 955 920 21 ∼ 336 317 16 ∼Michigan 1,655 1,527 87 ∼ 553 493 44 ∼
Detroit 665 588 68 ∼ 240 197 38 ∼Ohio 1,904 1,717 68 ∼ 662 575 45 ∼Wisconsin 848 825 ∼ ∼ 302 296 ∼ ∼
West North Central 3,396 3,250 63 ∼ 1,111 1,061 21 ∼Iowa 597 583 ∼ ∼ 186 180 ∼ ∼Kansas 438 418 ∼ ∼ 143 134 ∼ ∼Minnesota 930 880 ∼ ∼ 311 293 ∼ ∼Missouri 888 840 39 ∼ 276 267 ∼ ∼Nebraska 299 289 ∼ ∼ 112 106 ∼ ∼North Dakota 119 117 ∼ ∼ 35 35 ∼ ∼South Dakota 125 123 ∼ ∼ 48 46 ∼ ∼
South 14,617 13,430 910 660 5,061 4,468 517 235
South Atlantic 8,162 7,489 542 379 2,841 2,530 277 121
Delaware 169 150 16 ∼ 65 61 ∼ ∼District of Columbia 45 19 24 ∼ 25 ∼ 18 ∼Florida 3,708 3,528 113 - 1,285 1,191 72 -
Georgia 1,028 903 116 ∼ 353 301 49 ∼Atlanta 267 226 37 ∼ 108 83 23 ∼
Maryland
North Carolina 1,282 1,149 118 ∼ 449 393 53 ∼South Carolina 553 486 63 - 166 132 32 -
Virginia 1,016 894 92 ∼ 381 330 48 ∼West Virginia 361 360 ∼ ∼ 117 115 ∼ ∼
East South Central 2,442 2,245 162 ∼ 862 742 ∼Alabama 588 536 49 ∼ 228 190 36 ∼Kentucky 680 647 21 - 252 240 ∼ -
Mississippi 348 305 41 ∼ 114 81 33 ∼Tennessee 826 757 51 ∼ 268 231 34 ∼

Appendix E
E-�03
Table E.27.1: Urinary Bladder. Invasive Cancer Incidence Counts by U.S. Census Region and Division, Stateand Metropolitan Area, Sex, and Race and Ethnicity, United States,∗† 2004 (continued)
Male Female
Area All Races White Black Hispanic‡§ All Races White Black Hispanic‡§
West South Central 4,013 3,696 206 277 1,358 1,196 127 110
Arkansas 419 407 ∼ ∼ 158 147 ∼ ∼Louisiana 678 587 84 ∼ 228 179 46 ∼Oklahoma 563 519 ∼ ∼ 182 167 ∼ ∼Texas 2,353 2,183 99 259 790 703 65 105
West 9,455 8,655 208 579 109 204
Mountain 2,730 2,647 23 143 898 860 ∼ 56
Arizona 883 860 ∼ 45 283 274 ∼ 17
Colorado 559 543 ∼ 27 175 168 ∼ ∼Idaho 203 202 ∼ ∼ 78 78 ∼ ∼Montana 191 184 ∼ ∼ 56 54 ∼ ∼Nevada 376 351 ∼ ∼ 126 112 ∼ ∼New Mexico 223 221 ∼ 47 89 84 ∼ 22
Utah 209 204 ∼ ∼ 60 59 ∼ ∼Wyoming 86 82 ∼ ∼ 31 31 ∼ ∼
Pacific 6,725 6,008 185 436 96 148
Alaska 86 75 ∼ ∼ ∼ ∼ ∼ ∼California 4,721 4,230 160 415 1,567 1,368 90 141
San Francisco-Oakland 550 465 27 25 190 156 ∼ ∼San Jose-Monterey 313 284 ∼ 27 98 90 ∼ ∼Los Angeles 1,141 952 78 135 402 323 43 57
Hawaii 165 64 ∼ ∼ 54 24 ∼ ∼Oregon 667 632 ∼ ∼ 207 198 ∼ ∼Washington 1,086 1,007 19 ∼ 317 294 ∼ ∼
Seattle-Puget Sound 749 714 16 ∼ 222 212 ∼ ∼∗ Data are from all state and metropolitan area cancer registries, except Maryland. Included data cover approximately 98% of the population and met data quality
criteria for all invasive cancer sites combined. See Appendix B for registry-specific data quality information.† Includes invasive and in situ.‡ Data for specified racial or ethnic populations other than white and black should be interpreted with caution. See Technical Notes.
§ Hispanic origin is not mutually exclusive from race categories (white, black).
∼ Counts are suppressed if fewer than 16 cases were reported in a specific category (area, sex, race, ethnicity).
- Counts are suppressed at the state’s or metropolitan area’s request. See Technical Notes.
Notes: Cases from suppressed counts are included in region/division counts. Region/division counts are presented for regions/divisions with 100% of the
population covered by registries that meet the data quality criteria specified above unless the count for exactly one state in the region or division
is suppressed due to a count of less than 16. Michigan, Georgia, California, and Washington state counts each include cases from the SEER metropolitan
areas.

United
States Cancer Statistics: 2004 Incid
ence and M
ortality
E-�0�
continued
Table E.27.2: Urinary Bladder. Cancer Death Counts by U.S. Census Region and Division, State, Sex, andRace and Ethnicity, United States,∗ 2004
Male Female
Area All Races White Black Hispanic†‡ All Races White Black Hispanic†‡
United States 8,995 8,407 478 253 4,035 3,550 435 144
Northeast 1,995 1,892 93 38 82 29
New England 576 565 ∼ ∼ ∼ ∼Connecticut 120 116 ∼ ∼ 55 55 ∼ ∼Maine 73 73 ∼ ∼ 27 27 ∼ ∼Massachusetts 267 261 ∼ ∼ 109 105 ∼ ∼New Hampshire 49 49 ∼ ∼ 17 17 ∼ ∼Rhode Island 46 46 ∼ ∼ 25 25 ∼ ∼Vermont 21 20 ∼ ∼ ∼ ∼ ∼ ∼
Middle Atlantic 1,419 1,327 83 34 687 605 79 27
New Jersey 303 280 20 ∼ 154 137 16 ∼New York 626 580 41 21 300 261 37 20
Pennsylvania 490 467 22 ∼ 233 207 26 ∼Midwest 2,226 2,115 103 ∼ 941 855 79 ∼
East North Central 1,594 1,502 85 ∼ 672 597 70 ∼Illinois 382 359 21 ∼ 192 162 27 ∼Indiana 205 195 ∼ ∼ 93 85 ∼ ∼Michigan 334 313 19 ∼ 120 105 ∼ ∼Ohio 453 420 32 ∼ 178 157 21 ∼Wisconsin 220 215 ∼ ∼ 89 88 ∼ ∼
West North Central 632 613 18 ∼ 269 258 ∼ ∼Iowa 106 106 ∼ ∼ 51 51 ∼ ∼Kansas 85 84 ∼ ∼ 35 35 ∼ ∼Minnesota 154 152 ∼ ∼ 61 61 ∼ ∼Missouri 178 162 ∼ ∼ 86 76 ∼ ∼Nebraska 53 53 ∼ ∼ 19 19 ∼ ∼North Dakota 26 26 ∼ ∼ ∼ ∼ ∼ ∼South Dakota 30 30 ∼ ∼ ∼ ∼ ∼ ∼
South 2,959 2,706 241 111 1,385 1,152 226 65
South Atlantic 1,724 1,574 145 69 778 641 133 30
Delaware 38 33 ∼ ∼ 18 17 ∼ ∼District of Columbia ∼ ∼ ∼ ∼ ∼ ∼ ∼ ∼Florida 770 731 37 67 291 265 26 27
Georgia 169 145 24 ∼ 76 57 19 ∼Maryland 148 127 20 ∼ 71 53 16 ∼North Carolina 219 196 22 ∼ 125 94 30 ∼South Carolina 99 91 ∼ ∼ 48 36 ∼ ∼Virginia 197 175 22 ∼ 94 76 17 ∼West Virginia 74 73 ∼ ∼ 41 40 ∼ ∼
East South Central 471 437 34 ∼ 235 194 40 ∼Alabama 119 110 ∼ ∼ 61 45 16 ∼Kentucky 125 121 ∼ ∼ 77 71 ∼ ∼Mississippi 73 67 ∼ ∼ 30 23 ∼ ∼Tennessee 154 139 ∼ ∼ 67 55 ∼ ∼

Appendix E
E-�0�
Table E.27.2: Urinary Bladder. Cancer Death Counts by U.S. Census Region and Division, State, Sex, andRace and Ethnicity, United States,∗ 2004 (continued)
Male Female
Area All Races White Black Hispanic†‡ All Races White Black Hispanic†‡
West South Central 764 695 62 42 372 317 53 35
Arkansas 86 85 ∼ ∼ 40 36 ∼ ∼Louisiana 110 84 26 ∼ 61 43 18 ∼Oklahoma 100 92 ∼ ∼ 51 49 ∼ ∼Texas 468 434 33 41 220 189 29 33
West 1,694 41 89 779 699 48 47
Mountain 515 507 ∼ 27 244 233 ∼ 17
Arizona 160 157 ∼ ∼ 82 80 ∼ ∼Colorado 105 104 ∼ ∼ 49 47 ∼ ∼Idaho 37 37 ∼ ∼ ∼ ∼ ∼ ∼Montana 39 38 ∼ ∼ 16 16 ∼ ∼Nevada 62 61 ∼ ∼ 33 27 ∼ ∼New Mexico 42 42 ∼ ∼ 35 35 ∼ ∼Utah 54 52 ∼ ∼ ∼ ∼ ∼ ∼Wyoming 16 16 ∼ ∼ ∼ ∼ ∼ ∼
Pacific 1,187 38 62 535 466 39 30
Alaska ∼ ∼ ∼ ∼ ∼ ∼ ∼ ∼California 922 841 36 61 392 337 38 28
Hawaii 29 ∼ ∼ ∼ ∼ ∼ ∼ ∼Oregon 137 137 ∼ ∼ 53 53 ∼ ∼Washington 198 190 ∼ ∼ 76 71 ∼ ∼
∗ Data are from the National Vital Statistics System (NVSS).† Data for specified racial or ethnic populations other than white and black should be interpreted with caution. See Technical Notes.‡ Hispanic origin is not mutually exclusive from race categories (white, black).
∼ Counts are suppressed if fewer than 16 cases were reported in a specific category (area, sex, race, ethnicity).
Notes: Region/division counts are suppressed if the count for exactly one state in the region or division is suppressed due to a count of less than 16.


Appendix F

Tables F.�–F.�

Tables F.�–F.�
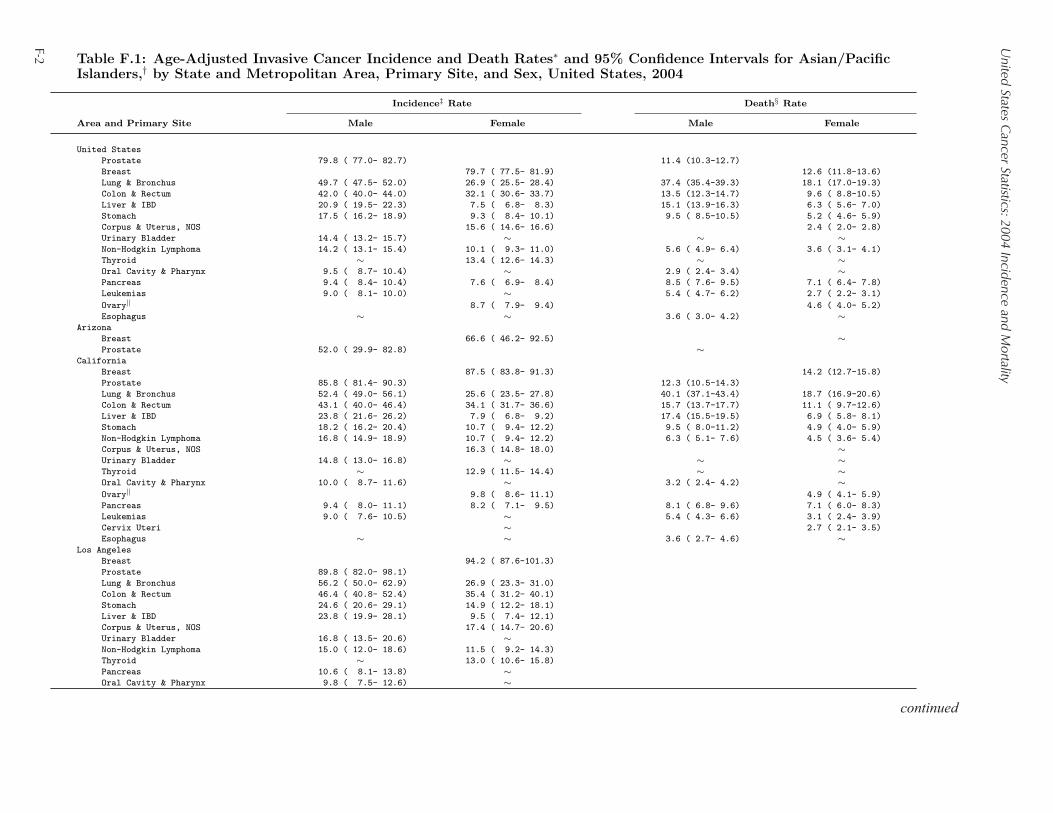
United
States Cancer Statistics: 2004 Incid
ence and M
ortality
F-�
continued
Table F.1: Age-Adjusted Invasive Cancer Incidence and Death Rates∗ and 95% Confidence Intervals for Asian/PacificIslanders,† by State and Metropolitan Area, Primary Site, and Sex, United States, 2004
Incidence‡ Rate Death§ Rate
Area and Primary Site Male Female Male Female
United States
Prostate 79.8 ( 77.0- 82.7) 11.4 (10.3-12.7)
Breast 79.7 ( 77.5- 81.9) 12.6 (11.8-13.6)
Lung & Bronchus 49.7 ( 47.5- 52.0) 26.9 ( 25.5- 28.4) 37.4 (35.4-39.3) 18.1 (17.0-19.3)
Colon & Rectum 42.0 ( 40.0- 44.0) 32.1 ( 30.6- 33.7) 13.5 (12.3-14.7) 9.6 ( 8.8-10.5)
Liver & IBD 20.9 ( 19.5- 22.3) 7.5 ( 6.8- 8.3) 15.1 (13.9-16.3) 6.3 ( 5.6- 7.0)
Stomach 17.5 ( 16.2- 18.9) 9.3 ( 8.4- 10.1) 9.5 ( 8.5-10.5) 5.2 ( 4.6- 5.9)
Corpus & Uterus, NOS 15.6 ( 14.6- 16.6) 2.4 ( 2.0- 2.8)
Urinary Bladder 14.4 ( 13.2- 15.7) ∼ ∼ ∼Non-Hodgkin Lymphoma 14.2 ( 13.1- 15.4) 10.1 ( 9.3- 11.0) 5.6 ( 4.9- 6.4) 3.6 ( 3.1- 4.1)
Thyroid ∼ 13.4 ( 12.6- 14.3) ∼ ∼Oral Cavity & Pharynx 9.5 ( 8.7- 10.4) ∼ 2.9 ( 2.4- 3.4) ∼Pancreas 9.4 ( 8.4- 10.4) 7.6 ( 6.9- 8.4) 8.5 ( 7.6- 9.5) 7.1 ( 6.4- 7.8)
Leukemias 9.0 ( 8.1- 10.0) ∼ 5.4 ( 4.7- 6.2) 2.7 ( 2.2- 3.1)
Ovary� 8.7 ( 7.9- 9.4) 4.6 ( 4.0- 5.2)
Esophagus ∼ ∼ 3.6 ( 3.0- 4.2) ∼Arizona
Breast 66.6 ( 46.2- 92.5) ∼Prostate 52.0 ( 29.9- 82.8) ∼
California
Breast 87.5 ( 83.8- 91.3) 14.2 (12.7-15.8)
Prostate 85.8 ( 81.4- 90.3) 12.3 (10.5-14.3)
Lung & Bronchus 52.4 ( 49.0- 56.1) 25.6 ( 23.5- 27.8) 40.1 (37.1-43.4) 18.7 (16.9-20.6)
Colon & Rectum 43.1 ( 40.0- 46.4) 34.1 ( 31.7- 36.6) 15.7 (13.7-17.7) 11.1 ( 9.7-12.6)
Liver & IBD 23.8 ( 21.6- 26.2) 7.9 ( 6.8- 9.2) 17.4 (15.5-19.5) 6.9 ( 5.8- 8.1)
Stomach 18.2 ( 16.2- 20.4) 10.7 ( 9.4- 12.2) 9.5 ( 8.0-11.2) 4.9 ( 4.0- 5.9)
Non-Hodgkin Lymphoma 16.8 ( 14.9- 18.9) 10.7 ( 9.4- 12.2) 6.3 ( 5.1- 7.6) 4.5 ( 3.6- 5.4)
Corpus & Uterus, NOS 16.3 ( 14.8- 18.0) ∼Urinary Bladder 14.8 ( 13.0- 16.8) ∼ ∼ ∼Thyroid ∼ 12.9 ( 11.5- 14.4) ∼ ∼Oral Cavity & Pharynx 10.0 ( 8.7- 11.6) ∼ 3.2 ( 2.4- 4.2) ∼Ovary� 9.8 ( 8.6- 11.1) 4.9 ( 4.1- 5.9)
Pancreas 9.4 ( 8.0- 11.1) 8.2 ( 7.1- 9.5) 8.1 ( 6.8- 9.6) 7.1 ( 6.0- 8.3)
Leukemias 9.0 ( 7.6- 10.5) ∼ 5.4 ( 4.3- 6.6) 3.1 ( 2.4- 3.9)
Cervix Uteri ∼ 2.7 ( 2.1- 3.5)
Esophagus ∼ ∼ 3.6 ( 2.7- 4.6) ∼Los Angeles
Breast 94.2 ( 87.6-101.3)
Prostate 89.8 ( 82.0- 98.1)
Lung & Bronchus 56.2 ( 50.0- 62.9) 26.9 ( 23.3- 31.0)
Colon & Rectum 46.4 ( 40.8- 52.4) 35.4 ( 31.2- 40.1)
Stomach 24.6 ( 20.6- 29.1) 14.9 ( 12.2- 18.1)
Liver & IBD 23.8 ( 19.9- 28.1) 9.5 ( 7.4- 12.1)
Corpus & Uterus, NOS 17.4 ( 14.7- 20.6)
Urinary Bladder 16.8 ( 13.5- 20.6) ∼Non-Hodgkin Lymphoma 15.0 ( 12.0- 18.6) 11.5 ( 9.2- 14.3)
Thyroid ∼ 13.0 ( 10.6- 15.8)
Pancreas 10.6 ( 8.1- 13.8) ∼Oral Cavity & Pharynx 9.8 ( 7.5- 12.6) ∼

Appendix F
F-3
Table F.1: Age-Adjusted Invasive Cancer Incidence and Death Rates∗ and 95% Confidence Intervals for Asian/PacificIslanders,† by State and Metropolitan Area, Primary Site, and Sex, United States, 2004 (continued)
Incidence‡ Rate Death§ Rate
Area and Primary Site Male Female Male Female
Ovary� 9.6 ( 7.5- 12.1)
Cervix Uteri 8.5 ( 6.6- 10.9)
Kidney & Renal Pelvis 7.9 ( 5.8- 10.5) ∼San Francisco-Oakland
Breast 90.9 ( 83.0- 99.3)
Prostate 83.7 ( 74.9- 93.3)
Lung & Bronchus 59.5 ( 51.9- 67.8) 23.8 ( 19.8- 28.4)
Colon & Rectum 42.2 ( 35.9- 49.2) 37.4 ( 32.3- 43.0)
Liver & IBD 24.6 ( 20.0- 30.0) ∼Non-Hodgkin Lymphoma 20.4 ( 16.2- 25.3) 9.2 ( 6.8- 12.2)
Corpus & Uterus, NOS 18.7 ( 15.3- 22.8)
Stomach 15.5 ( 11.8- 20.0) 7.7 ( 5.5- 10.5)
Urinary Bladder 14.1 ( 10.5- 18.6) ∼Thyroid ∼ 13.8 ( 10.8- 17.4)
Oral Cavity & Pharynx 12.8 ( 9.7- 16.7) 6.3 ( 4.3- 8.8)
Ovary� 11.4 ( 8.7- 14.7)
Pancreas 11.4 ( 8.3- 15.3) 7.0 ( 4.9- 9.7)
Leukemias 10.9 ( 7.7- 14.8) ∼San Jose-Monterey
Prostate 79.1 ( 66.4- 93.3)
Breast 72.9 ( 63.0- 84.0)
Colon & Rectum 47.9 ( 38.2- 59.2) 26.1 ( 19.9- 33.5)
Lung & Bronchus 45.5 ( 35.9- 56.7) 27.5 ( 20.9- 35.4)
Liver & IBD 24.3 ( 17.7- 32.4) ∼Non-Hodgkin Lymphoma 13.0 ( 8.3- 19.2) 14.4 ( 10.0- 20.2)
Urinary Bladder 14.2 ( 9.0- 21.0) ∼Kidney & Renal Pelvis 14.0 ( 9.0- 20.5) ∼Thyroid ∼ 13.2 ( 9.2- 18.3)
Pancreas ∼ 11.9 ( 7.6- 17.5)
Stomach 11.1 ( 6.6- 17.3) 10.9 ( 6.9- 16.4)
Ovary� 10.9 ( 7.2- 15.8)
Leukemias 10.7 ( 6.4- 16.7) 7.7 ( 4.6- 12.0)
Oral Cavity & Pharynx 10.2 ( 6.4- 15.4) ∼Corpus & Uterus, NOS 10.1 ( 6.7- 14.6)
Colorado
Prostate 63.4 ( 38.2- 97.8) ∼Breast 57.3 ( 38.5- 81.9) ∼
Connecticut
Breast 51.5 ( 30.1- 81.5) ∼Florida
Breast 57.2 ( 47.0- 69.0) ∼Prostate 55.4 ( 41.6- 71.9) ∼Lung & Bronchus 28.0 ( 18.1- 40.7) 26.4 ( 18.7- 36.2) 25.6 (16.5-37.5) 20.6 (13.9-29.4)
Colon & Rectum 26.7 ( 18.7- 37.0) 25.6 ( 18.0- 35.0) ∼ ∼Liver & IBD 15.8 ( 8.7- 25.9) ∼ ∼ ∼Corpus & Uterus, NOS 13.1 ( 8.5- 19.3) ∼Thyroid ∼ 11.2 ( 7.1- 17.1) ∼ ∼
Georgia
Prostate 81.1 ( 53.9-115.5) ∼
continued

United
States Cancer Statistics: 2004 Incid
ence and M
ortality
F-�
continued
Table F.1: Age-Adjusted Invasive Cancer Incidence and Death Rates∗ and 95% Confidence Intervals for Asian/PacificIslanders,† by State and Metropolitan Area, Primary Site, and Sex, United States, 2004 (continued)
Incidence‡ Rate Death§ Rate
Area and Primary Site Male Female Male Female
Breast 72.4 ( 55.6- 92.8) ∼Colon & Rectum 47.6 ( 30.5- 70.3) 33.5 ( 19.5- 52.6) ∼ ∼Lung & Bronchus 34.5 ( 18.9- 56.6) ∼ ∼ ∼
Atlanta
Prostate 97.0 ( 60.4-144.8)
Breast 70.7 ( 50.8- 96.1)
Colon & Rectum 48.3 ( 26.9- 78.7) ∼Hawaii
Prostate 121.0 (110.9-131.7) 15.6 (12.1-19.7)
Breast 111.2 (102.3-120.7) 14.0 (11.1-17.6)
Lung & Bronchus 69.0 ( 61.4- 77.2) 37.3 ( 32.5- 42.7) 52.0 (45.4-59.3) 24.3 (20.4-28.7)
Colon & Rectum 60.8 ( 53.7- 68.6) 41.3 ( 36.1- 46.9) 19.8 (15.9-24.5) 9.4 ( 7.1-12.2)
Corpus & Uterus, NOS 27.6 ( 23.2- 32.6) 3.7 ( 2.3- 5.7)
Urinary Bladder 22.7 ( 18.4- 27.7) ∼ 5.0 ( 3.2- 7.6) ∼Stomach 21.0 ( 16.9- 25.8) 8.3 ( 6.1- 11.0) 12.3 ( 9.2-16.1) 4.0 ( 2.6- 6.1)
Non-Hodgkin Lymphoma 14.4 ( 11.1- 18.5) 12.1 ( 9.4- 15.4) 5.6 ( 3.6- 8.3) 4.5 ( 3.0- 6.6)
Thyroid ∼ 13.0 ( 9.9- 16.7) ∼ ∼Liver & IBD 12.7 ( 9.6- 16.5) ∼ 12.6 ( 9.4-16.4) 5.6 ( 3.9- 7.9)
Pancreas 12.6 ( 9.6- 16.4) 11.5 ( 8.9- 14.6) 15.4 (12.0-19.5) 11.0 ( 8.6-14.1)
Oral Cavity & Pharynx 12.0 ( 8.9- 15.7) ∼ ∼ ∼Kidney & Renal Pelvis 11.6 ( 8.6- 15.2) ∼ ∼ ∼Ovary� 10.1 ( 7.5- 13.3) 6.2 ( 4.3- 8.8)
Leukemias ∼ 7.4 ( 5.3- 10.2) 6.9 ( 4.7- 9.8) ∼Esophagus ∼ ∼ 3.9 ( 2.3- 6.3) ∼
Illinois
Breast 71.0 ( 60.5- 82.8) 14.6 ( 9.8-20.8)
Prostate 55.8 ( 43.9- 69.7) ∼Lung & Bronchus 45.0 ( 34.0- 58.2) 18.8 ( 12.8- 26.5) 33.9 (24.3-45.8) 15.6 (10.2-22.6)
Colon & Rectum 41.3 ( 30.8- 53.9) 23.8 ( 17.4- 31.6) ∼ ∼Oral Cavity & Pharynx 14.9 ( 9.5- 22.1) ∼ ∼ ∼Urinary Bladder 14.8 ( 8.4- 23.4) ∼ ∼ ∼Corpus & Uterus, NOS 14.5 ( 9.9- 20.4) ∼Liver & IBD 13.3 ( 8.3- 20.1) ∼ 11.2 ( 6.7-17.5) ∼Thyroid ∼ 12.9 ( 8.8- 18.2) ∼ ∼Stomach 12.6 ( 7.4- 19.8) ∼ ∼ ∼Non-Hodgkin Lymphoma 11.7 ( 7.1- 18.1) 8.2 ( 4.6- 13.3) ∼ ∼Leukemias 8.6 ( 4.5- 14.5) 7.4 ( 4.2- 12.1) ∼ ∼
Maryland
Lung & Bronchus 19.1 (11.3-30.2) ∼Massachusetts
Breast 85.0 ( 68.0-104.9) ∼Prostate 69.5 ( 51.4- 91.5) ∼Colon & Rectum 43.9 ( 29.6- 62.1) 31.7 ( 21.5- 44.9) ∼ ∼Lung & Bronchus 43.1 ( 28.7- 61.4) 27.0 ( 17.0- 40.3) 30.8 (18.4-47.6) ∼Liver & IBD 24.8 ( 15.3- 37.7) ∼ ∼ ∼Thyroid ∼ 24.2 ( 16.2- 34.7) ∼ ∼Corpus & Uterus, NOS 21.7 ( 13.4- 32.9) ∼
Michigan
Breast 74.2 ( 55.1- 97.5) ∼

Appendix F
F-�
Table F.1: Age-Adjusted Invasive Cancer Incidence and Death Rates∗ and 95% Confidence Intervals for Asian/PacificIslanders,† by State and Metropolitan Area, Primary Site, and Sex, United States, 2004 (continued)
Incidence‡ Rate Death§ Rate
Area and Primary Site Male Female Male Female
Prostate 69.0 ( 47.4- 96.3) ∼Colon & Rectum 54.5 ( 33.8- 81.7) 28.5 ( 15.8- 46.3) ∼ ∼Lung & Bronchus ∼ 26.4 ( 14.9- 42.6) ∼ ∼
Detroit
Prostate 69.8 ( 44.6-103.2)
Breast 61.4 ( 41.3- 87.7)
Minnesota
Colon & Rectum 61.8 ( 33.6-101.1) ∼ ∼ ∼Breast 49.6 ( 32.9- 71.8) ∼
Nevada
Prostate 66.1 ( 43.3- 95.7) ∼Breast 65.1 ( 46.1- 88.9) ∼Lung & Bronchus 46.6 ( 29.9- 69.2) 33.9 ( 21.4- 51.0) 35.6 (21.2-56.0) 27.6 (15.8-44.3)
Colon & Rectum ∼ 31.5 ( 17.1- 51.8) ∼ ∼Thyroid ∼ 28.3 ( 18.5- 42.1) ∼ ∼
New Jersey
Breast 76.9 ( 66.6- 88.2) 8.9 ( 5.6-13.5)
Prostate 76.3 ( 62.8- 91.6) 16.9 ( 9.3-27.2)
Colon & Rectum 30.8 ( 23.1- 40.1) 21.1 ( 15.3- 28.2) 15.6 ( 9.1-24.4) ∼Lung & Bronchus 29.2 ( 20.8- 39.4) 20.1 ( 14.0- 27.7) 31.9 (22.6-43.2) 9.7 ( 5.4-15.5)
Stomach 20.4 ( 13.7- 29.0) 8.4 ( 5.0- 13.1) 11.2 ( 6.2-18.2) ∼Urinary Bladder 18.3 ( 11.5- 27.2) ∼ ∼ ∼Corpus & Uterus, NOS 16.8 ( 11.8- 23.1) ∼Thyroid ∼ 15.6 ( 11.6- 20.7) ∼ ∼Liver & IBD 13.9 ( 9.5- 19.8) ∼ 9.1 ( 4.9-15.1) ∼Pancreas 12.8 ( 7.2- 20.6) ∼ ∼ ∼Non-Hodgkin Lymphoma 10.3 ( 6.2- 16.0) 7.2 ( 4.0- 11.7) ∼ ∼Oral Cavity & Pharynx 9.3 ( 5.1- 15.3) ∼ ∼ ∼Ovary� 9.2 ( 5.9- 13.8) ∼Kidney & Renal Pelvis 9.1 ( 5.6- 14.2) ∼ ∼ ∼Leukemias ∼ 7.2 ( 4.1- 11.6) ∼ ∼Brain & ONS ∼ 6.6 ( 3.8- 10.5) ∼ ∼
New York
Breast 72.9 ( 66.2- 80.1) 12.0 ( 9.3-15.3)
Lung & Bronchus 56.2 ( 48.6- 64.5) 24.3 ( 20.1- 29.2) 39.6 (33.1-46.8) 15.2 (11.8-19.2)
Prostate 53.9 ( 46.7- 61.7) 9.6 ( 6.2-13.9)
Colon & Rectum 42.2 ( 36.0- 49.1) 34.5 ( 29.4- 40.2) 11.1 ( 7.9-15.0) 10.0 ( 7.3-13.4)
Stomach 24.0 ( 19.3- 29.3) 8.4 ( 6.0- 11.3) 10.8 ( 7.8-14.6) 7.4 ( 5.1-10.2)
Liver & IBD 23.7 ( 19.2- 28.8) 7.2 ( 5.0- 9.9) 13.3 (10.0-17.2) 3.4 ( 2.0- 5.4)
Thyroid ∼ 16.7 ( 13.7- 20.2) ∼ ∼Corpus & Uterus, NOS 16.1 ( 13.0- 19.7) ∼Urinary Bladder 11.9 ( 8.6- 16.0) ∼ ∼ ∼Non-Hodgkin Lymphoma 11.7 ( 8.8- 15.2) 7.8 ( 5.5- 10.6) 4.3 ( 2.4- 7.0) ∼Oral Cavity & Pharynx 11.0 ( 8.4- 14.2) ∼ ∼ ∼Ovary� 10.5 ( 8.1- 13.5) 4.3 ( 2.7- 6.6)
Kidney & Renal Pelvis 10.0 ( 7.3- 13.4) ∼ ∼ ∼Cervix Uteri 9.7 ( 7.3- 12.6) ∼Leukemias 8.9 ( 6.1- 12.4) ∼ 4.9 ( 2.7- 8.0) ∼Esophagus ∼ ∼ 5.0 ( 2.8- 8.0) ∼
continued

United
States Cancer Statistics: 2004 Incid
ence and M
ortality
F-�
continued
Table F.1: Age-Adjusted Invasive Cancer Incidence and Death Rates∗ and 95% Confidence Intervals for Asian/PacificIslanders,† by State and Metropolitan Area, Primary Site, and Sex, United States, 2004 (continued)
Incidence‡ Rate Death§ Rate
Area and Primary Site Male Female Male Female
Pancreas ∼ ∼ 8.2 ( 5.5-11.6) 5.7 ( 3.7- 8.4)
North Carolina
Prostate 62.5 ( 35.0-100.8) ∼Lung & Bronchus 54.2 ( 29.0- 90.2) ∼ ∼ ∼Breast 47.9 ( 32.4- 68.7) ∼
Ohio
Colon & Rectum 56.3 ( 31.5- 90.3) ∼ ∼ ∼Breast 52.7 ( 34.8- 76.0) ∼Prostate 35.8 ( 20.3- 58.1) ∼
Oregon
Breast 86.0 ( 64.5-112.3) ∼Prostate 70.7 ( 45.8-103.1) ∼Lung & Bronchus 56.0 ( 33.5- 86.5) ∼ 47.6 (26.9-76.4) ∼Colon & Rectum ∼ 40.1 ( 23.7- 62.6) ∼ ∼
Pennsylvania
Breast 67.9 ( 53.2- 85.4) ∼Prostate 59.0 ( 41.1- 81.3) ∼Lung & Bronchus 41.1 ( 26.4- 60.1) 22.5 ( 14.0- 34.0) 37.6 (22.7-57.4) ∼Colon & Rectum 25.1 ( 14.9- 39.3) 35.5 ( 23.6- 51.0) ∼ ∼Non-Hodgkin Lymphoma ∼ 18.4 ( 10.1- 30.4) ∼ ∼Thyroid ∼ 14.6 ( 8.2- 23.9) ∼ ∼Corpus & Uterus, NOS 13.9 ( 8.2- 22.4) ∼
Texas
Prostate 54.6 ( 43.7- 67.1) ∼Breast 54.1 ( 46.0- 63.1) 8.5 ( 5.2-13.1)
Colon & Rectum 50.1 ( 38.6- 63.6) 24.2 ( 18.1- 31.6) 12.3 ( 6.6-20.2) 11.8 ( 7.2-17.9)
Lung & Bronchus 41.8 ( 32.3- 53.0) 19.9 ( 14.5- 26.6) 30.4 (22.1-40.6) 20.4 (14.8-27.2)
Liver & IBD 25.8 ( 17.6- 36.0) 10.4 ( 6.7- 15.4) 16.1 ( 9.9-24.3) ∼Stomach 14.0 ( 8.4- 21.6) ∼ 10.0 ( 5.3-16.6) ∼Non-Hodgkin Lymphoma 10.3 ( 5.9- 16.4) 10.4 ( 6.4- 15.8) 8.4 ( 4.5-14.1) ∼Thyroid ∼ 9.6 ( 6.6- 13.6) ∼ ∼Corpus & Uterus, NOS 9.3 ( 6.2- 13.5) ∼Kidney & Renal Pelvis 8.7 ( 4.6- 14.5) ∼ ∼ ∼Ovary� 7.0 ( 4.2- 10.9) ∼Leukemias 6.6 ( 3.3- 11.6) ∼ ∼ ∼Cervix Uteri 5.6 ( 3.2- 9.3) ∼Oral Cavity & Pharynx 4.7 ( 2.6- 8.0) ∼ ∼ ∼Pancreas ∼ ∼ ∼ 6.4 ( 3.5-10.6)
Virginia
Breast 75.8 ( 62.1- 91.6) 12.1 ( 7.3-19.1)
Prostate 69.1 ( 51.6- 90.1) ∼Lung & Bronchus 43.6 ( 30.0- 60.8) 22.7 ( 14.9- 33.0) 26.7 (15.7-41.5) 22.8 (14.4-34.1)
Colon & Rectum 32.7 ( 22.0- 46.4) 31.7 ( 22.2- 43.7) ∼ ∼Liver & IBD 23.1 ( 12.9- 37.3) ∼ ∼ ∼Stomach 18.8 ( 10.3- 30.9) ∼ ∼ ∼Urinary Bladder 18.5 ( 10.3- 30.3) ∼ ∼ ∼Thyroid ∼ 15.3 ( 10.0- 22.7) ∼ ∼Corpus & Uterus, NOS 15.3 ( 9.2- 23.8) ∼
Washington

Appendix F
F-�
Table F.1: Age-Adjusted Invasive Cancer Incidence and Death Rates∗ and 95% Confidence Intervals for Asian/PacificIslanders,† by State and Metropolitan Area, Primary Site, and Sex, United States, 2004 (continued)
Incidence‡ Rate Death§ Rate
Area and Primary Site Male Female Male Female
Breast 96.7 ( 83.8-111.0) 9.1 ( 5.5-14.1)
Prostate 84.1 ( 68.5-101.8) ∼Lung & Bronchus 53.6 ( 41.2- 68.1) 37.7 ( 29.2- 47.8) 40.0 (29.3-53.1) 19.9 (13.9-27.5)
Colon & Rectum 33.5 ( 24.0- 45.2) 25.0 ( 18.5- 32.9) 14.4 ( 8.2-23.2) 13.1 ( 8.2-19.7)
Liver & IBD 31.6 ( 22.7- 42.6) ∼ 24.9 (16.8-35.2) 10.9 ( 6.6-16.9)
Non-Hodgkin Lymphoma 18.3 ( 11.6- 27.3) 11.8 ( 7.4- 17.8) ∼ ∼Corpus & Uterus, NOS 14.5 ( 9.8- 20.5) ∼Stomach 14.4 ( 8.2- 23.0) 13.7 ( 8.9- 20.0) ∼ 8.4 ( 4.7-13.7)
Leukemias 13.6 ( 7.8- 21.8) ∼ ∼ ∼Thyroid ∼ 13.0 ( 8.9- 18.5) ∼ ∼Kidney & Renal Pelvis 11.5 ( 6.3- 19.0) ∼ ∼ ∼Ovary� 9.8 ( 5.9- 15.3) ∼Cervix Uteri 8.7 ( 5.3- 13.5) ∼
Seattle-Puget Sound
Breast 95.9 ( 82.5-110.8)
Prostate 88.1 ( 71.4-107.3)
Lung & Bronchus 58.6 ( 45.0- 74.6) 39.3 ( 30.2- 50.2)
Colon & Rectum 34.1 ( 24.2- 46.4) 28.3 ( 20.9- 37.4)
Liver & IBD 30.1 ( 21.1- 41.4) ∼Non-Hodgkin Lymphoma 18.0 ( 11.1- 27.3) 11.4 ( 7.0- 17.4)
Stomach 17.7 ( 10.3- 27.8) 14.5 ( 9.3- 21.3)
Corpus & Uterus, NOS 16.0 ( 10.9- 22.7)
Thyroid ∼ 14.0 ( 9.5- 20.1)
Leukemias 11.9 ( 6.3- 20.1) ∼Ovary� 9.6 ( 5.6- 15.3)
Cervix Uteri 9.2 ( 5.5- 14.5)
Wisconsin
Breast 68.0 ( 40.5-105.9) ∼∗ Rates are per 100,000 persons and are age-adjusted to the 2000 U.S. standard population (19 age groups - Census P25-1130).† Data for specified racial or ethnic populations other than white and black should be interpreted with caution. See Technical Notes.‡ Data are from selected state and metropolitan area cancer registries that meet the data quality criteria for all invasive cancer sites combined that have an
Asian/Pacific Islander population of at least 50,000. See Appendix B for data quality criteria and registry-specific data quality information.
§ Data are from the National Vital Statistics System (NVSS).
� Ovary excludes cancers newly classified as borderline according to ICD-O-3, beginning with 2001 diagnoses. See Technical Notes.
∼ Rates are suppressed if the Asian/Pacific Islander population of a specific category (area, sex) is less than 50,000 or if cases are fewer than 16.
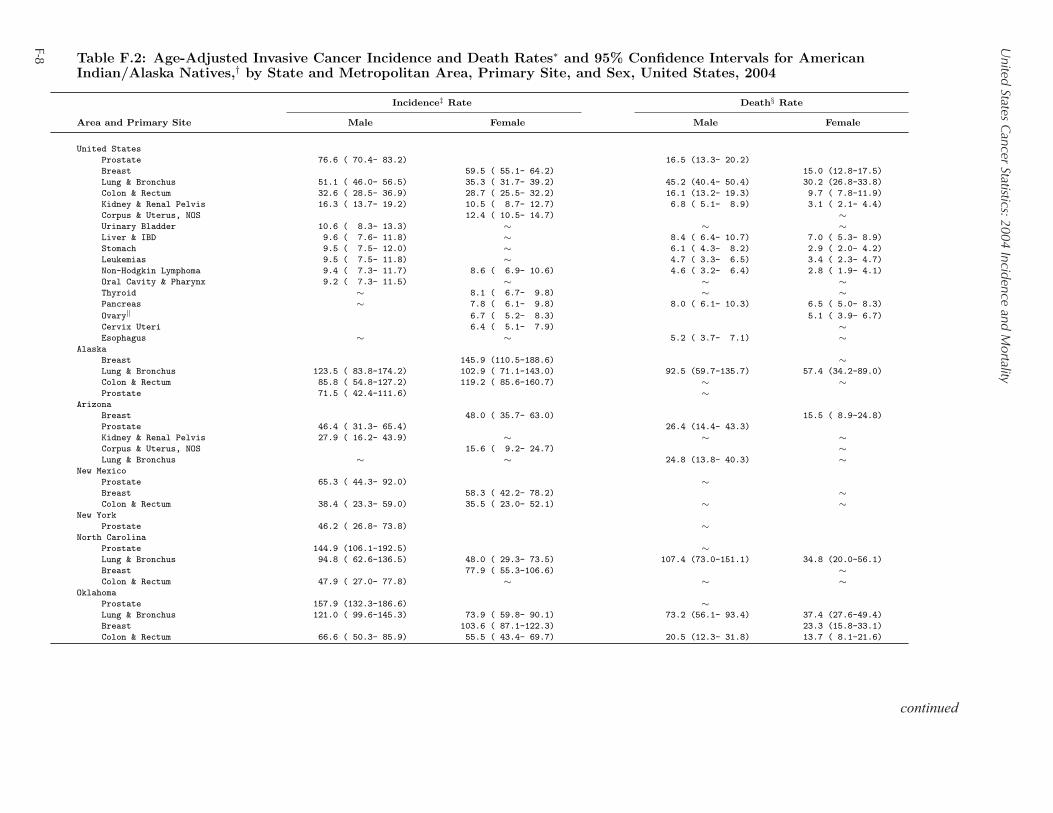
United
States Cancer Statistics: 2004 Incid
ence and M
ortality
F-�
continued
Table F.2: Age-Adjusted Invasive Cancer Incidence and Death Rates∗ and 95% Confidence Intervals for AmericanIndian/Alaska Natives,† by State and Metropolitan Area, Primary Site, and Sex, United States, 2004
Incidence‡ Rate Death§ Rate
Area and Primary Site Male Female Male Female
United States
Prostate 76.6 ( 70.4- 83.2) 16.5 (13.3- 20.2)
Breast 59.5 ( 55.1- 64.2) 15.0 (12.8-17.5)
Lung & Bronchus 51.1 ( 46.0- 56.5) 35.3 ( 31.7- 39.2) 45.2 (40.4- 50.4) 30.2 (26.8-33.8)
Colon & Rectum 32.6 ( 28.5- 36.9) 28.7 ( 25.5- 32.2) 16.1 (13.2- 19.3) 9.7 ( 7.8-11.9)
Kidney & Renal Pelvis 16.3 ( 13.7- 19.2) 10.5 ( 8.7- 12.7) 6.8 ( 5.1- 8.9) 3.1 ( 2.1- 4.4)
Corpus & Uterus, NOS 12.4 ( 10.5- 14.7) ∼Urinary Bladder 10.6 ( 8.3- 13.3) ∼ ∼ ∼Liver & IBD 9.6 ( 7.6- 11.8) ∼ 8.4 ( 6.4- 10.7) 7.0 ( 5.3- 8.9)
Stomach 9.5 ( 7.5- 12.0) ∼ 6.1 ( 4.3- 8.2) 2.9 ( 2.0- 4.2)
Leukemias 9.5 ( 7.5- 11.8) ∼ 4.7 ( 3.3- 6.5) 3.4 ( 2.3- 4.7)
Non-Hodgkin Lymphoma 9.4 ( 7.3- 11.7) 8.6 ( 6.9- 10.6) 4.6 ( 3.2- 6.4) 2.8 ( 1.9- 4.1)
Oral Cavity & Pharynx 9.2 ( 7.3- 11.5) ∼ ∼ ∼Thyroid ∼ 8.1 ( 6.7- 9.8) ∼ ∼Pancreas ∼ 7.8 ( 6.1- 9.8) 8.0 ( 6.1- 10.3) 6.5 ( 5.0- 8.3)
Ovary� 6.7 ( 5.2- 8.3) 5.1 ( 3.9- 6.7)
Cervix Uteri 6.4 ( 5.1- 7.9) ∼Esophagus ∼ ∼ 5.2 ( 3.7- 7.1) ∼
Alaska
Breast 145.9 (110.5-188.6) ∼Lung & Bronchus 123.5 ( 83.8-174.2) 102.9 ( 71.1-143.0) 92.5 (59.7-135.7) 57.4 (34.2-89.0)
Colon & Rectum 85.8 ( 54.8-127.2) 119.2 ( 85.6-160.7) ∼ ∼Prostate 71.5 ( 42.4-111.6) ∼
Arizona
Breast 48.0 ( 35.7- 63.0) 15.5 ( 8.9-24.8)
Prostate 46.4 ( 31.3- 65.4) 26.4 (14.4- 43.3)
Kidney & Renal Pelvis 27.9 ( 16.2- 43.9) ∼ ∼ ∼Corpus & Uterus, NOS 15.6 ( 9.2- 24.7) ∼Lung & Bronchus ∼ ∼ 24.8 (13.8- 40.3) ∼
New Mexico
Prostate 65.3 ( 44.3- 92.0) ∼Breast 58.3 ( 42.2- 78.2) ∼Colon & Rectum 38.4 ( 23.3- 59.0) 35.5 ( 23.0- 52.1) ∼ ∼
New York
Prostate 46.2 ( 26.8- 73.8) ∼North Carolina
Prostate 144.9 (106.1-192.5) ∼Lung & Bronchus 94.8 ( 62.6-136.5) 48.0 ( 29.3- 73.5) 107.4 (73.0-151.1) 34.8 (20.0-56.1)
Breast 77.9 ( 55.3-106.6) ∼Colon & Rectum 47.9 ( 27.0- 77.8) ∼ ∼ ∼
Oklahoma
Prostate 157.9 (132.3-186.6) ∼Lung & Bronchus 121.0 ( 99.6-145.3) 73.9 ( 59.8- 90.1) 73.2 (56.1- 93.4) 37.4 (27.6-49.4)
Breast 103.6 ( 87.1-122.3) 23.3 (15.8-33.1)
Colon & Rectum 66.6 ( 50.3- 85.9) 55.5 ( 43.4- 69.7) 20.5 (12.3- 31.8) 13.7 ( 8.1-21.6)

Appendix F
F-�
Table F.2: Age-Adjusted Invasive Cancer Incidence and Death Rates∗ and 95% Confidence Intervals for AmericanIndian/Alaska Natives,† by State and Metropolitan Area, Primary Site, and Sex, United States, 2004 (continued)
Incidence‡ Rate Death§ Rate
Area and Primary Site Male Female Male Female
Kidney & Renal Pelvis 30.1 ( 20.9- 42.0) 22.2 ( 14.9- 31.6) ∼ ∼Corpus & Uterus, NOS 24.5 ( 16.9- 34.3) ∼Urinary Bladder 24.4 ( 15.1- 36.8) ∼ ∼ ∼Oral Cavity & Pharynx 24.3 ( 15.6- 35.9) ∼ ∼ ∼Leukemias 20.6 ( 12.9- 31.0) ∼ ∼ ∼Pancreas ∼ 17.5 ( 10.9- 26.4) ∼ ∼Non-Hodgkin Lymphoma ∼ 14.6 ( 8.9- 22.5) ∼ ∼Ovary� 13.2 ( 7.8- 20.8) ∼Thyroid ∼ 12.9 ( 7.6- 20.3) ∼ ∼
Texas
Prostate 41.9 ( 25.2- 64.9) ∼Breast 21.4 ( 12.1- 35.5) ∼
Washington
Breast 102.2 ( 73.8-137.7) ∼Prostate 97.2 ( 62.4-142.8) ∼Lung & Bronchus 72.6 ( 40.6-116.8) 61.2 ( 36.3- 95.1) 51.3 (26.1- 88.0) ∼Colon & Rectum ∼ 42.1 ( 23.6- 68.7) ∼ ∼
∗ Rates are per 100,000 persons and are age-adjusted to the 2000 U.S. standard population (19 age groups - Census P25-1130).† Data for specified racial or ethnic populations other than white and black should be interpreted with caution. See Technical Notes.‡ Data are from selected state and metropolitan area cancer registries that meet the data quality criteria for all invasive cancer sites combined that have an
American Indian/Alaska Native population of at least 50,000. See Appendix B for data quality criteria and registry-specific data quality information.
§ Data are from the National Vital Statistics System (NVSS).
� Ovary excludes cancers newly classified as borderline according to ICD-O-3, beginning with 2001 diagnoses. See Technical Notes.
∼ Rates are suppressed if the American Indian/Alaska Native population of a specific category (area, sex) is less than 50,000 or if cases are fewer than 16.


Appendix G

Tables G.�M–G.�

Tables G.�M–G.�

United
States Cancer Statistics: 2004 Incid
ence and M
ortality
G-�
continued
Table G.1M: Population Counts by U.S. Census Region and Division, State and Metropolitan Area, Race andEthnicity
Males, 2004
Asian/Pacific American Indian/Area All Races White Black Islander Alaska Native Hispanic∗
United States 144,535,403 117,881,383 18,421,010 6,673,835 1,559,175 21,351,372
USCS Areas for Incidence† 141,843,403 116,104,577 17,648,835 6,541,037 1,548,954 21,193,952
Northeast 26,474,236 21,700,911 3,307,449 1,348,028 117,848 2,945,492
New England 6,908,705 6,186,295 449,755 244,385 28,270 513,032
Connecticut 1,698,356 1,459,590 174,977 56,727 7,062 187,097
Maine 641,876 626,066 6,610 5,297 3,903 6,371
Massachusetts 3,101,651 2,716,789 221,775 152,389 10,698 246,234
New Hampshire 640,112 618,717 7,898 11,592 1,905 14,254
Rhode Island 521,054 466,585 35,782 15,269 3,418 55,755
Vermont 305,656 298,548 2,713 3,111 1,284 3,321
Middle Atlantic 19,565,531 15,514,616 2,857,694 1,103,643 89,578 2,432,460
New Jersey 4,229,089 3,288,078 611,938 312,826 16,247 658,504
New York 9,328,903 7,009,772 1,606,420 651,550 61,161 1,526,933
Pennsylvania 6,007,539 5,216,766 639,336 139,267 12,170 247,023
Midwest 32,289,571 27,927,176 3,358,710 765,659 238,026 1,976,373
East North Central 22,571,703 19,156,717 2,742,263 561,645 111,078 1,547,122
Illinois 6,241,801 5,035,979 920,643 262,341 22,838 940,756
Indiana 3,063,751 2,740,269 273,787 39,812 9,883 147,291
Michigan 4,965,333 4,102,075 709,373 118,369 35,516 198,784
Detroit‡ 1,967,516 1,403,782 484,705 70,003 9,026 73,282
Ohio 5,576,256 4,804,292 671,104 85,124 15,736 132,030
Wisconsin 2,724,562 2,474,102 167,356 55,999 27,105 128,261
West North Central 9,717,868 8,770,459 616,447 204,014 126,948 429,251
Iowa 1,453,069 1,385,961 39,588 22,331 5,189 56,447
Kansas 1,357,412 1,224,190 87,618 30,622 14,982 118,255
Minnesota 2,529,202 2,285,917 120,621 90,459 32,205 97,273
Missouri 2,813,581 2,436,519 320,508 41,157 15,397 78,788
Nebraska 863,793 800,917 40,041 14,391 8,444 65,206
North Dakota 317,726 295,405 3,354 2,303 16,664 5,280
South Dakota 383,085 341,550 4,717 2,751 34,067 8,002
South 52,081,991 40,439,351 9,896,737 1,296,773 449,130 7,299,027
South Atlantic 27,097,327 20,355,037 5,845,310 746,424 150,556 2,842,232
Delaware 404,483 308,943 82,560 11,158 1,822 25,833
District of Columbia 262,200 104,460 148,460 8,176 1,104 25,568
Florida 8,518,976 6,950,905 1,336,818 189,291 41,962 1,666,479
Georgia 4,408,243 3,003,988 1,264,752 123,822 15,681 351,848
Atlanta‡ 1,586,226 923,807 570,058 86,128 6,233 188,635
Maryland 2,692,000 1,776,806 772,175 132,798 10,221 157,420
North Carolina 4,199,029 3,171,378 891,740 79,491 56,420 301,496
South Carolina 2,045,599 1,427,211 586,335 23,839 8,214 75,901
Virginia 3,680,806 2,763,908 731,198 172,324 13,376 230,040
West Virginia 885,991 847,438 31,272 5,525 1,756 7,647
East South Central 8,516,556 6,696,173 1,699,441 88,585 32,357 225,596
Alabama 2,193,967 1,601,120 560,917 19,720 12,210 55,512
Kentucky 2,032,023 1,850,181 157,359 19,922 4,561 44,956

Appendix G
G-3
Table G.1M: Population Counts by U.S. Census Region and Division, State and Metropolitan Area, Race andEthnicity (continued)
Males, 2004
Asian/Pacific American Indian/Area All Races White Black Islander Alaska Native Hispanic∗
Mississippi 1,407,739 883,401 506,764 11,079 6,495 28,026
Tennessee 2,882,827 2,361,471 474,401 37,864 9,091 97,102
West South Central 16,468,108 13,388,141 2,351,986 461,764 266,217 4,231,199
Arkansas 1,347,557 1,114,656 208,548 14,296 10,057 66,804
Louisiana 2,189,659 1,434,358 707,546 33,448 14,307 64,478
Oklahoma 1,740,252 1,408,274 144,312 30,165 157,501 120,765
Texas 11,190,640 9,430,853 1,291,580 383,855 84,352 3,979,152
West 33,689,605 27,813,945 1,858,114 3,263,375 754,171 9,130,480
Mountain 9,949,581 8,953,483 372,757 263,431 359,910 2,219,493
Arizona 2,871,792 2,538,203 115,273 69,147 149,169 833,657
Colorado 2,321,346 2,118,493 108,217 64,302 30,334 461,577
Idaho 699,787 675,177 5,745 8,235 10,630 66,415
Montana 462,482 425,869 2,952 2,536 31,125 11,064
Nevada 1,187,872 1,002,608 95,622 71,111 18,531 282,732
New Mexico 936,128 799,875 26,354 13,238 96,661 409,069
Utah 1,215,249 1,149,357 15,515 33,170 17,207 137,193
Wyoming 254,925 243,901 3,079 1,692 6,253 17,786
Pacific 23,740,024 18,860,462 1,485,357 2,999,944 394,261 6,910,987
Alaska 340,147 250,579 15,482 17,503 56,583 17,004
California 17,888,546 14,110,552 1,271,125 2,258,880 247,989 6,374,552
San Francisco-Oakland‡ 2,052,063 1,380,964 194,706 459,831 16,562 413,211
San Jose-Monterey‡ 1,224,516 887,776 39,959 283,234 13,547 378,509
Los Angeles‡ 4,902,819 3,724,349 468,198 648,968 61,304 2,327,195
Hawaii 630,082 164,591 21,241 441,651 2,599 48,601
Oregon 1,785,407 1,646,449 41,175 68,689 29,094 188,169
Washington 3,095,842 2,688,291 136,334 213,221 57,996 282,661
Seattle-Puget Sound‡ 2,115,852 1,772,428 117,522 189,756 36,146 141,654
∗ Hispanic origin is not mutually exclusive from race categories (white, black, Asian/Pacific Islander, American Indian/Alaska Native).† Population estimates for all geographic areas combined that meet the data quality criteria for all invasive cancer sites combined. See Appendix B for data
quality criteria and registry-specific data quality information. Populations covered represent approximately 98% of the U.S. population.‡ The populations of the metropolitan areas of Detroit, Atlanta, San Francisco-Oakland, San Jose-Monterey, Los Angeles, and Seattle-Puget Sound are shown
separately because these populations have separate metropolitan area Surveillance, Epidemiology, and End Results (SEER) cancer registries. State population
totals include the populations of the SEER metropolitan areas.
Source: Census Bureau population figures, as modified by the SEER program. Available from: http://www.seer.cancer.gov/popdata [accessed 4/20/07].
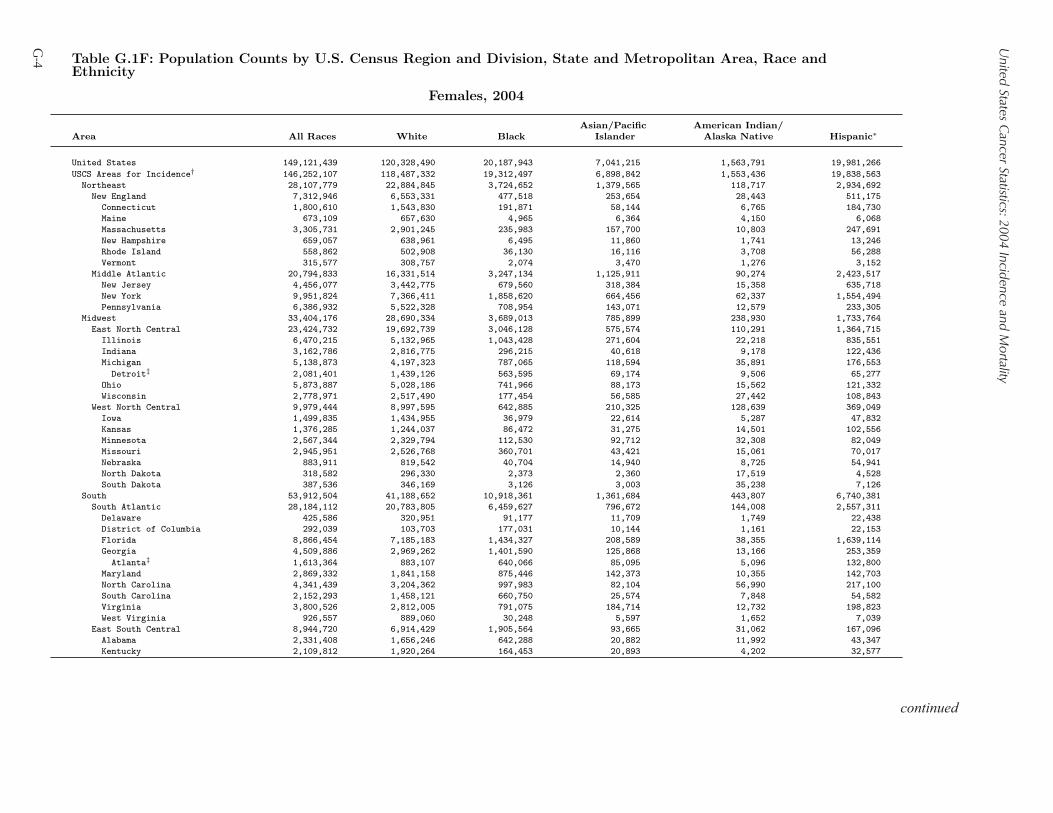
United
States Cancer Statistics: 2004 Incid
ence and M
ortality
G-�
continued
Table G.1F: Population Counts by U.S. Census Region and Division, State and Metropolitan Area, Race andEthnicity
Females, 2004
Asian/Pacific American Indian/Area All Races White Black Islander Alaska Native Hispanic∗
United States 149,121,439 120,328,490 20,187,943 7,041,215 1,563,791 19,981,266
USCS Areas for Incidence† 146,252,107 118,487,332 19,312,497 6,898,842 1,553,436 19,838,563
Northeast 28,107,779 22,884,845 3,724,652 1,379,565 118,717 2,934,692
New England 7,312,946 6,553,331 477,518 253,654 28,443 511,175
Connecticut 1,800,610 1,543,830 191,871 58,144 6,765 184,730
Maine 673,109 657,630 4,965 6,364 4,150 6,068
Massachusetts 3,305,731 2,901,245 235,983 157,700 10,803 247,691
New Hampshire 659,057 638,961 6,495 11,860 1,741 13,246
Rhode Island 558,862 502,908 36,130 16,116 3,708 56,288
Vermont 315,577 308,757 2,074 3,470 1,276 3,152
Middle Atlantic 20,794,833 16,331,514 3,247,134 1,125,911 90,274 2,423,517
New Jersey 4,456,077 3,442,775 679,560 318,384 15,358 635,718
New York 9,951,824 7,366,411 1,858,620 664,456 62,337 1,554,494
Pennsylvania 6,386,932 5,522,328 708,954 143,071 12,579 233,305
Midwest 33,404,176 28,690,334 3,689,013 785,899 238,930 1,733,764
East North Central 23,424,732 19,692,739 3,046,128 575,574 110,291 1,364,715
Illinois 6,470,215 5,132,965 1,043,428 271,604 22,218 835,551
Indiana 3,162,786 2,816,775 296,215 40,618 9,178 122,436
Michigan 5,138,873 4,197,323 787,065 118,594 35,891 176,553
Detroit‡ 2,081,401 1,439,126 563,595 69,174 9,506 65,277
Ohio 5,873,887 5,028,186 741,966 88,173 15,562 121,332
Wisconsin 2,778,971 2,517,490 177,454 56,585 27,442 108,843
West North Central 9,979,444 8,997,595 642,885 210,325 128,639 369,049
Iowa 1,499,835 1,434,955 36,979 22,614 5,287 47,832
Kansas 1,376,285 1,244,037 86,472 31,275 14,501 102,556
Minnesota 2,567,344 2,329,794 112,530 92,712 32,308 82,049
Missouri 2,945,951 2,526,768 360,701 43,421 15,061 70,017
Nebraska 883,911 819,542 40,704 14,940 8,725 54,941
North Dakota 318,582 296,330 2,373 2,360 17,519 4,528
South Dakota 387,536 346,169 3,126 3,003 35,238 7,126
South 53,912,504 41,188,652 10,918,361 1,361,684 443,807 6,740,381
South Atlantic 28,184,112 20,783,805 6,459,627 796,672 144,008 2,557,311
Delaware 425,586 320,951 91,177 11,709 1,749 22,438
District of Columbia 292,039 103,703 177,031 10,144 1,161 22,153
Florida 8,866,454 7,185,183 1,434,327 208,589 38,355 1,639,114
Georgia 4,509,886 2,969,262 1,401,590 125,868 13,166 253,359
Atlanta‡ 1,613,364 883,107 640,066 85,095 5,096 132,800
Maryland 2,869,332 1,841,158 875,446 142,373 10,355 142,703
North Carolina 4,341,439 3,204,362 997,983 82,104 56,990 217,100
South Carolina 2,152,293 1,458,121 660,750 25,574 7,848 54,582
Virginia 3,800,526 2,812,005 791,075 184,714 12,732 198,823
West Virginia 926,557 889,060 30,248 5,597 1,652 7,039
East South Central 8,944,720 6,914,429 1,905,564 93,665 31,062 167,096
Alabama 2,331,408 1,656,246 642,288 20,882 11,992 43,347
Kentucky 2,109,812 1,920,264 164,453 20,893 4,202 32,577

Appendix G
G-�
Table G.1F: Population Counts by U.S. Census Region and Division, State and Metropolitan Area, Race andEthnicity (continued)
Females, 2004
Asian/Pacific American Indian/Area All Races White Black Islander Alaska Native Hispanic∗
Mississippi 1,493,029 905,939 568,327 11,995 6,768 20,764
Tennessee 3,010,471 2,431,980 530,496 39,895 8,100 70,408
West South Central 16,783,672 13,490,418 2,553,170 471,347 268,737 4,015,974
Arkansas 1,402,443 1,144,984 231,927 15,227 10,305 54,294
Louisiana 2,317,026 1,478,118 791,844 32,977 14,087 60,146
Oklahoma 1,783,294 1,440,988 147,505 31,368 163,433 103,052
Texas 11,280,909 9,426,328 1,381,894 391,775 80,912 3,798,482
West 33,696,980 27,564,659 1,855,917 3,514,067 762,337 8,572,429
Mountain 9,876,678 8,864,242 348,200 290,928 373,308 2,058,506
Arizona 2,868,087 2,529,181 107,599 75,220 156,087 773,670
Colorado 2,280,475 2,081,383 100,135 69,937 29,020 417,397
Idaho 695,353 670,916 4,573 9,124 10,740 57,757
Montana 464,438 427,102 2,190 3,431 31,715 10,812
Nevada 1,145,026 951,187 94,483 80,922 18,434 249,564
New Mexico 966,878 824,026 24,077 15,082 103,693 414,251
Utah 1,205,459 1,140,295 12,718 35,121 17,325 118,914
Wyoming 250,962 240,152 2,425 2,091 6,294 16,141
Pacific 23,820,302 18,700,417 1,507,717 3,223,139 389,029 6,513,923
Alaska 317,608 228,640 14,014 19,091 55,863 15,375
California 17,953,492 13,968,827 1,319,853 2,421,222 243,590 6,050,695
San Francisco-Oakland‡ 2,094,917 1,361,998 216,349 500,656 15,914 379,208
San Jose-Monterey‡ 1,178,833 849,560 33,449 283,133 12,691 340,385
Los Angeles‡ 5,014,512 3,706,174 536,372 712,970 58,996 2,283,432
Hawaii 632,042 144,075 15,668 470,032 2,267 45,548
Oregon 1,805,956 1,665,650 36,937 74,490 28,879 155,069
Washington 3,111,204 2,693,225 121,245 238,304 58,430 247,236
Seattle-Puget Sound‡ 2,123,740 1,769,809 105,803 211,863 36,265 121,874
∗ Hispanic origin is not mutually exclusive from race categories (white, black, Asian/Pacific Islander, American Indian/Alaska Native).† Population estimates for all geographic areas combined that meet the data quality criteria for all invasive cancer sites combined. See Appendix B for data
quality criteria and registry-specific data quality information. Populations covered represent approximately 98% of the U.S. population.‡ The populations of the metropolitan areas of Detroit, Atlanta, San Francisco-Oakland, San Jose-Monterey, Los Angeles, and Seattle-Puget Sound are shown
separately because these populations have separate metropolitan area Surveillance, Epidemiology, and End Results (SEER) cancer registries. State population
totals include the populations of the SEER metropolitan areas.
Source: Census Bureau population figures, as modified by the SEER program. Available from: http://www.seer.cancer.gov/popdata [accessed 4/20/07].

United
States Cancer Statistics: 2004 Incid
ence and M
ortality
G-�
continued
Table G.2: Population Counts for Ages 0-19, United States, 2004
A. By Sex and Race
Asian/Pacific American Indian/Sex All Races White Black Islander Alaska Native Hispanic∗
Incidence†
Male 40,956,120 32,074,095 6,467,999 1,866,895 547,131 7,825,390Female 39,025,031 30,438,749 6,268,900 1,786,304 531,078 7,449,873
Mortality‡
Male 41,748,026 32,555,924 6,738,182 1,903,855 550,065 7,878,757Female 39,782,438 30,894,907 6,531,551 1,822,161 533,819 7,500,023
B. By Age (years)
0-14 0-19 <1 1-4 5-9 10-14 15-19
Incidence†
All Races, Male and Female 59,652,836 79,981,151 4,007,094 15,678,516 19,245,543 20,721,683 20,328,315
Mortality‡
All Races, Male and Female 60,806,159 81,530,464 4,083,318 15,977,354 19,614,036 21,131,451 20,724,305
∗ Hispanic origin is not mutually exclusive from race categories (white, black, Asian/Pacific Islander, American Indian/Alaska Native).† Population estimates for all geographic areas combined that meet the data quality criteria for all invasive cancer sites combined. See Appendix B for
data quality criteria and registry-specific data quality information. Populations covered represent approximately 98% of the U.S. population.‡ Population estimates for entire United States.
Source: Census Bureau population figures, as modified by the SEER program. Available from: http://www.seer.cancer.gov/popdata [accessed 4/20/07].

List of Abbreviations
ACME Automated Classification of Medical Entities
ALL acute lymphatic leukemia
CDC Centers for Disease Control and Prevention
CI confidence interval
CMPD chronic myeloproliferative diseases
CNS central nervous system
CTR Certified Tumor Registrar
IARC International Agency for Research on Cancer
IBD intrahepatic bile duct
ICCC International Classification of Childhood Cancer
ICD–9 International Classification of Diseases, Ninth Edition
ICD–O International Classification of Diseases for Oncology
ICD–10 International Classification of Diseases, Tenth Edition
IHS Indian Health Service
KS Kaposi sarcoma
MDS myelodysplastic syndromes
MICAR Mortality Medical Indexing Classification and Retrieval system
NAACCR North American Association of Central Cancer Registries
NCHS National Center for Health Statistics
NCI National Cancer Institute
NHIA NAACCR Hispanic Identification Algorithm
NHL non-Hodgkin lymphoma
NIH National Institutes of Health
NOS not otherwise specified
NPCR National Program of Cancer Registries
NVSS National Vital Statistics System
ONS other nervous system
SEER Surveillance, Epidemiology, and End Results
USCS United States Cancer Statistics
