university of groningen particle transport in fluidized ... · chapter 5:a stochastic model for...
TRANSCRIPT
University of Groningen
Particle transport in fluidized bedsDechsiri, Chutima
IMPORTANT NOTE: You are advised to consult the publisher's version (publisher's PDF) if you wish to cite fromit. Please check the document version below.
Document VersionPublisher's PDF, also known as Version of record
Publication date:2004
Link to publication in University of Groningen/UMCG research database
Citation for published version (APA):Dechsiri, C. (2004). Particle transport in fluidized beds: experiments and stochastic models. Groningen: s.n.
CopyrightOther than for strictly personal use, it is not permitted to download or to forward/distribute the text or part of it without the consent of theauthor(s) and/or copyright holder(s), unless the work is under an open content license (like Creative Commons).
Take-down policyIf you believe that this document breaches copyright please contact us providing details, and we will remove access to the work immediatelyand investigate your claim.
Downloaded from the University of Groningen/UMCG research database (Pure): http://www.rug.nl/research/portal. For technical reasons thenumber of authors shown on this cover page is limited to 10 maximum.
Download date: 28-05-2019
Chapter 5
A Stochastic Model for Fluidized Beds with Baffles 5.1 Introduction There are many different applications of fluidization in industry nowadays where some particulate product is produced, for instance for granulation, coating, drying, catalytic regeneration, classification and recycling. The advantages of a classification process based on fluidization compared to other classification processes are that:
• separation according to density is possible, • the particles are not wetted and • the amount of gas needed is much lower than that of some other
techniques, such as windsifting. The goal of this chapter is to investigate the effect of baffles on the extent of segregation, and therefore the classifying power of a fluidized bed. Hartholt et al. (1996, 1997) found that using internal sieve-like horizontal baffles with apertures large compared to the particle size enhanced particle segregation in fluidized beds, although the bed at low fluidization velocities retained its coherence with little influence of the baffles on the bubble behavior. They proposed that a baffled fluidized bed might be used for dry particle classification, with possible industrial applications, for instance in recycling, granulation and purification of powders. The particle transport mechanisms in a fluidized bed can be concluded as the followings (Rowe and Partridge, 1962):
• transport upwards in the wakes of fluidization bubbles and deposition on the top of the bed
• transport down to compensate the upward transportation • dispersion caused by disturbance of the bulk material in the bed by
fluidization bubbles, and • segregation of individual larger and/or denser particles (jetsam) in the bulk.
Chapter 5:A Stochastic Model for Fluidized Beds with Baffles 108
The key mixing process in bubbling fluidized beds is the upward transport of jetsam (particles naturally tending to sink) in the wakes of rising bubbles. The baffles decrease mixing, and thus enhance segregation, by knocking out part of the bubble wakes (Figure 5.1). This has been confirmed by experiments with baffles in binary mixtures. More information about fluidization with baffles can be found in Chapter 8. Modeling of mixing and segregation of gas fluidized beds was pioneered by Gibilaro and Rowe (1974), resulting in the well-known GR model. Several groups of researchers, e.g. Chiba et al. (1976, 1979), Chen (1980), Tanimoto et al. (1981), Naimer et al. (1982), Hoffmann et al. (1990, 1991), have extended and modified this GR model to different fluidized bed systems. The original GR model had several parameters which were not determined yet. Later works proposed how to obtain the parameters in relation to the physical properties of particles and fluidized bed geometry. Most of the modeling work on mixing and segregation in gas fluidized beds were developed and based on conservation equations. Here we propose a stochastic model for the particle motion in order to explain the segregation profile of binary mixtures in fluidized beds with baffles.
5.2 Description of the Model In bubbling fluidized beds, both jetsam and flotsam (particles tending to float) are carried in bubble wakes (Figure 5.1), and fluidization bubbles also cause a stirring action referred to as dispersion. The shearing of the bed material due to this stirring action also allows individual jetsam particles to segregate towards the bottom of the bed. Gibilaro and Rowe (1974) first introduced these particle transport concepts. Gibilaro and Rowe also operated with a rate of material exchange between the wakes of the fluidization bubbles and the surrounding bulk.
Chapter 5:A Stochastic Model for Fluidized Beds with Baffles 109
123
i-1 i
i+1
N+1
Porous Distributor Plate
Baffle
Fluidization bubble with wake
Position of baffles
Gas in
Bubble size and wake fraction, and therefore flow in the bubble wake, increases with height
Distributor plate
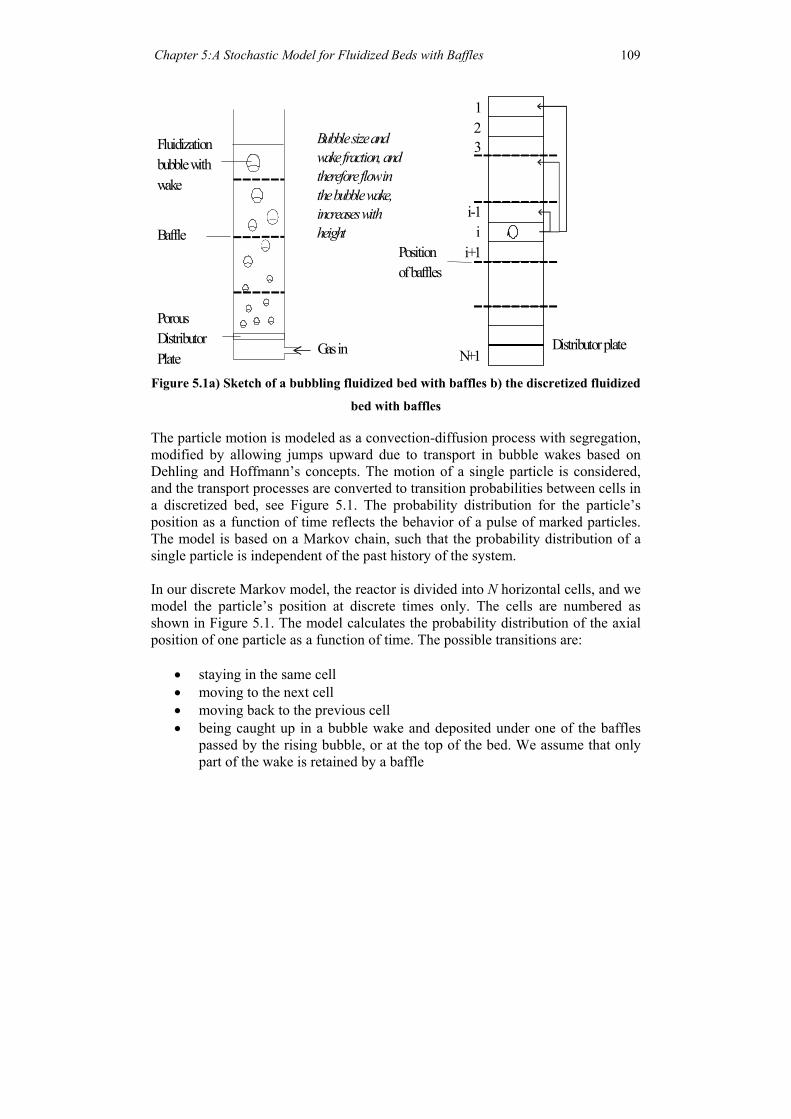
Figure 5.1a) Sketch of a bubbling fluidized bed with baffles b) the discretized fluidized
bed with baffles
The particle motion is modeled as a convection-diffusion process with segregation, modified by allowing jumps upward due to transport in bubble wakes based on Dehling and Hoffmann’s concepts. The motion of a single particle is considered, and the transport processes are converted to transition probabilities between cells in a discretized bed, see Figure 5.1. The probability distribution for the particle’s position as a function of time reflects the behavior of a pulse of marked particles. The model is based on a Markov chain, such that the probability distribution of a single particle is independent of the past history of the system. In our discrete Markov model, the reactor is divided into N horizontal cells, and we model the particle’s position at discrete times only. The cells are numbered as shown in Figure 5.1. The model calculates the probability distribution of the axial position of one particle as a function of time. The possible transitions are:
• staying in the same cell • moving to the next cell • moving back to the previous cell • being caught up in a bubble wake and deposited under one of the baffles
passed by the rising bubble, or at the top of the bed. We assume that only part of the wake is retained by a baffle
Chapter 5:A Stochastic Model for Fluidized Beds with Baffles 110
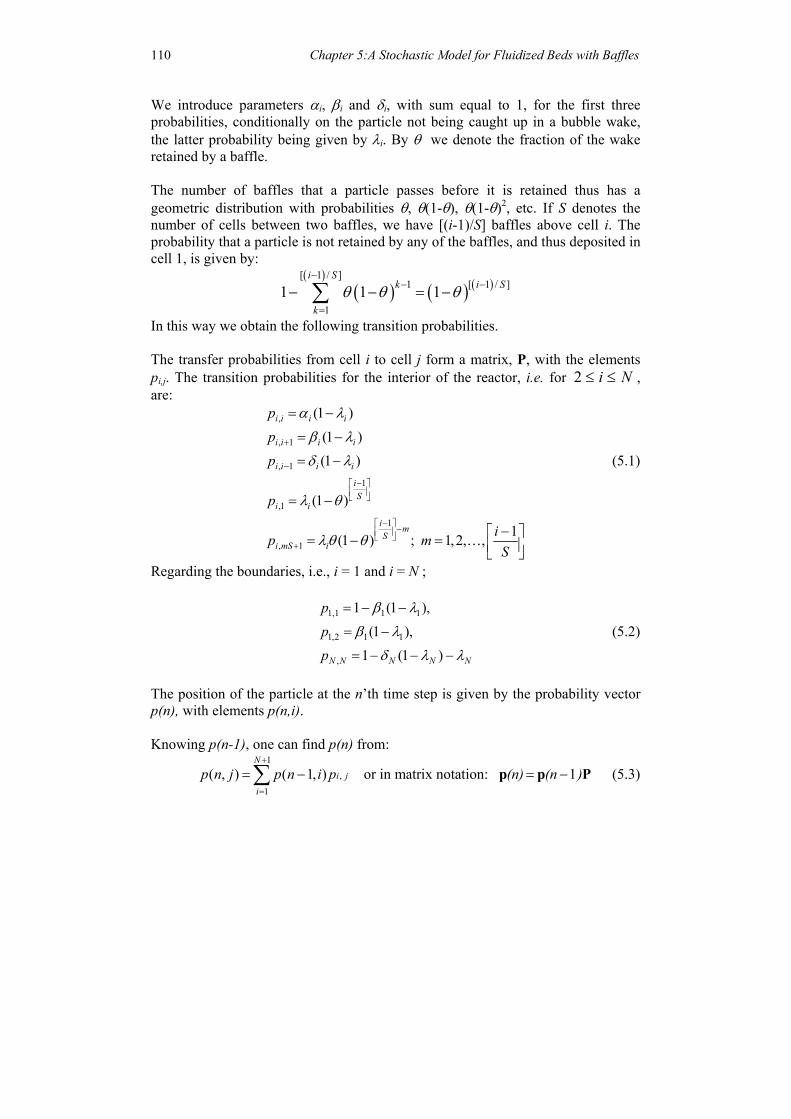
We introduce parameters αi, βi and δi, with sum equal to 1, for the first three probabilities, conditionally on the particle not being caught up in a bubble wake, the latter probability being given by λi. By θ we denote the fraction of the wake retained by a baffle. The number of baffles that a particle passes before it is retained thus has a geometric distribution with probabilities θ, θ(1-θ), θ(1-θ)2, etc. If S denotes the number of cells between two baffles, we have [(i-1)/S] baffles above cell i. The probability that a particle is not retained by any of the baffles, and thus deposited in cell 1, is given by:
( )( )
( ) ( )[ 1 / ]
1 [ 1 / ]
11 1 1
i Sk i S
kθ θ θ
−− −
=
− − = −∑In this way we obtain the following transition probabilities.
i≤2The transfer probabilities from cell i to cell j form a matrix, P, with the elements pi,j. The transition probabilities for the interior of the reactor, i.e. for , are:
N≤
,
, 1
, 1
1
,1
1
, 1
(1 )(1 )(1 )
(1 )
1(1 ) ; 1,2, ,
i i i i
i i i i
i i i i
iS
i i
i mS
i mS i
ppp
p
ip mS
α λ
β λ
δ λ
λ θ
λθ θ
+
−
−
− − +
= −
= −
= −
= −
− = − = …
(5.1)
Regarding the boundaries, i.e., i = 1 and i = N ;
1,1 1 1
1,2 1 1
,
1 (1 ),(1 ),
1 (1 )N N N N N
ppp
β λ
β λ
δ λ λ
= − −
= −
= − − −
(5.2)
The position of the particle at the n’th time step is given by the probability vector p(n), with elements p(n,i). Knowing p(n-1), one can find p(n) from:
1
,
1
( , ) ( 1, ) or in matrix notation: 1N
i j
i
p n j p n i p (n) (n )+
=
= − = −∑ p p P (5.3)
Chapter 5:A Stochastic Model for Fluidized Beds with Baffles 111
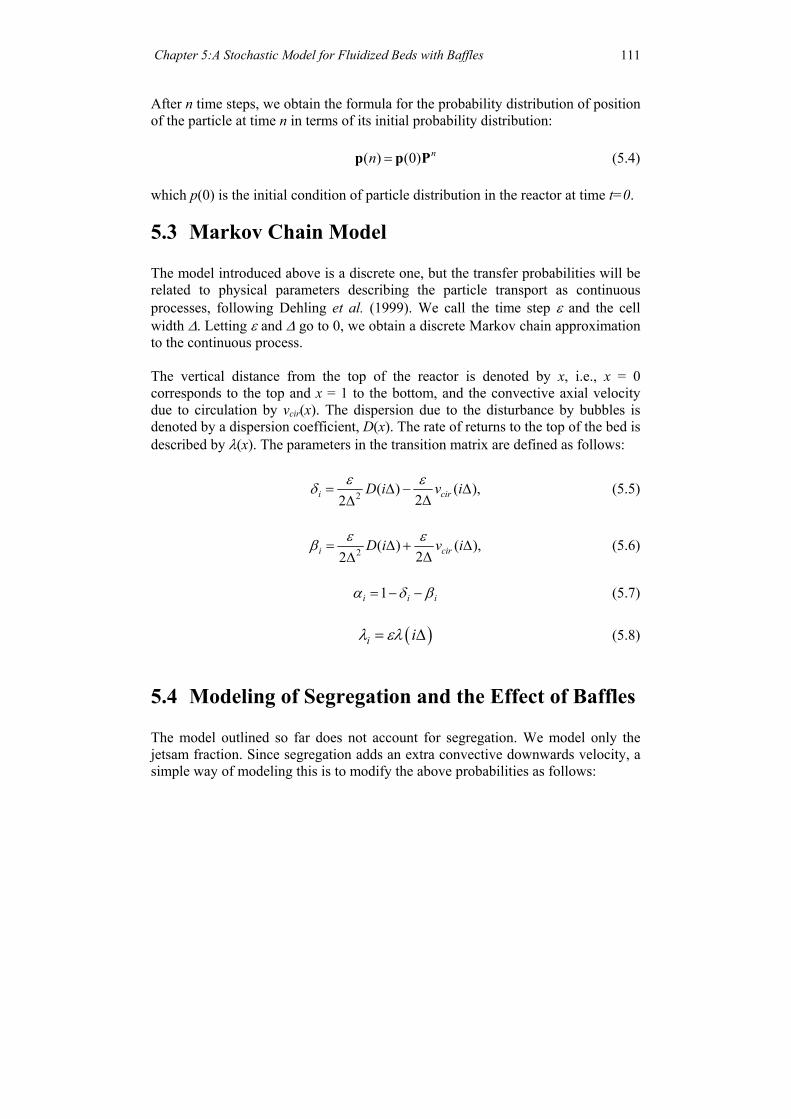
After n time steps, we obtain the formula for the probability distribution of position of the particle at time n in terms of its initial probability distribution: (5.4) ( ) (0) nn =p p P which p(0) is the initial condition of particle distribution in the reactor at time t=0.
5.3 Markov Chain Model The model introduced above is a discrete one, but the transfer probabilities will be related to physical parameters describing the particle transport as continuous processes, following Dehling et al. (1999). We call the time step ε and the cell width ∆. Letting ε and ∆ go to 0, we obtain a discrete Markov chain approximation to the continuous process. The vertical distance from the top of the reactor is denoted by x, i.e., x = 0 corresponds to the top and x = 1 to the bottom, and the convective axial velocity due to circulation by vcir(x). The dispersion due to the disturbance by bubbles is denoted by a dispersion coefficient, D(x). The rate of returns to the top of the bed is described by λ(x). The parameters in the transition matrix are defined as follows:
2 ( ) ( ),22i cirD i v iε εδ = ∆ − ∆∆∆
(5.5)
2 ( ) ( ),22i cirD i v iε εβ = ∆ + ∆∆∆
(5.6)
1i i iα δ β= − − (5.7) ( )i iλ ελ= ∆ (5.8)
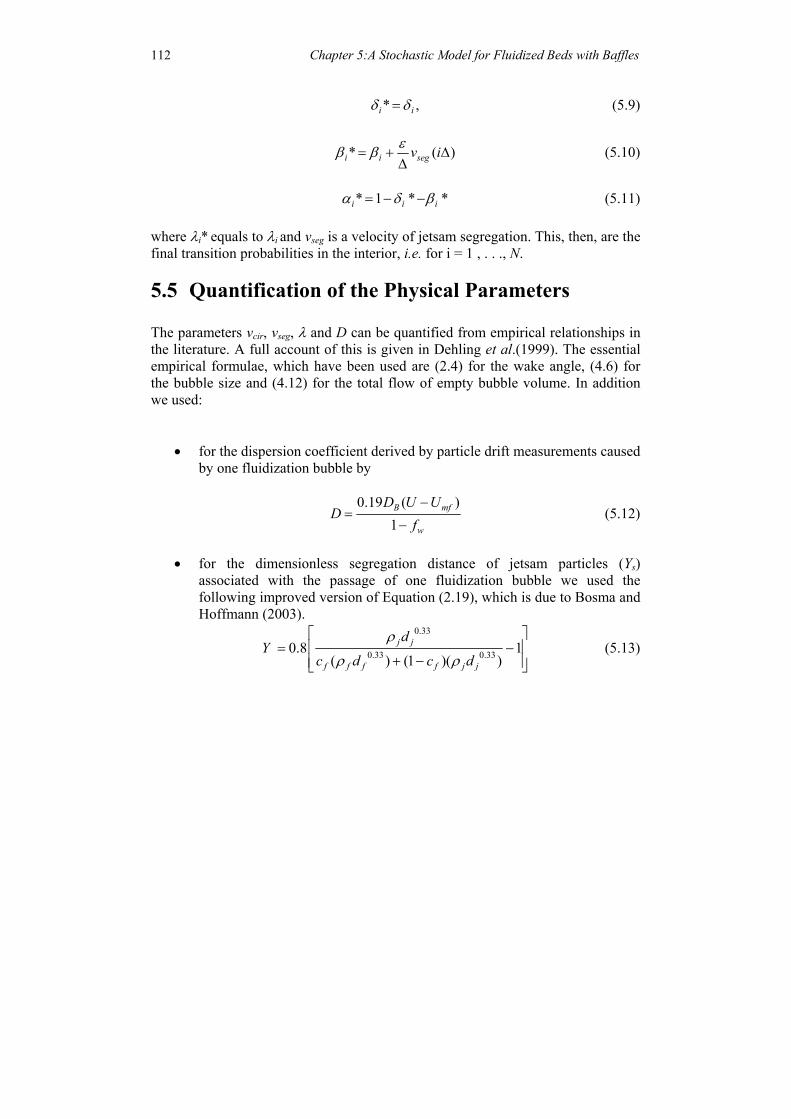
5.4 Modeling of Segregation and the Effect of Baffles The model outlined so far does not account for segregation. We model only the jetsam fraction. Since segregation adds an extra convective downwards velocity, a simple way of modeling this is to modify the above probabilities as follows:
Chapter 5:A Stochastic Model for Fluidized Beds with Baffles 112
* ,i iδ δ= (5.9)
* (i i segv iεβ β )= + ∆∆
(5.10)
* 1 * *i i iα δ β= − − (5.11) where λi* equals to λi and vseg is a velocity of jetsam segregation. This, then, are the final transition probabilities in the interior, i.e. for i = 1 , . . ., N.
5.5 Quantification of the Physical Parameters The parameters vcir, vseg, λ and D can be quantified from empirical relationships in the literature. A full account of this is given in Dehling et al.(1999). The essential empirical formulae, which have been used are (2.4) for the wake angle, (4.6) for the bubble size and (4.12) for the total flow of empty bubble volume. In addition we used:
• for the dispersion coefficient derived by particle drift measurements caused by one fluidization bubble by
0.19 ( )
1B mf
w
D U UD
f−
=−
(5.12)
• for the dimensionless segregation distance of jetsam particles (Ys)
associated with the passage of one fluidization bubble we used the following improved version of Equation (2.19), which is due to Bosma and Hoffmann (2003).
0.33
0.33 0.330.8 1( ) (1 )( )
j j
f f f f j j
dY
c d c d
ρ
ρ ρ
= −
+ − (5.13)
Chapter 5:A Stochastic Model for Fluidized Beds with Baffles 113
5.6 Numerical Simulations and Comparison with Experiments
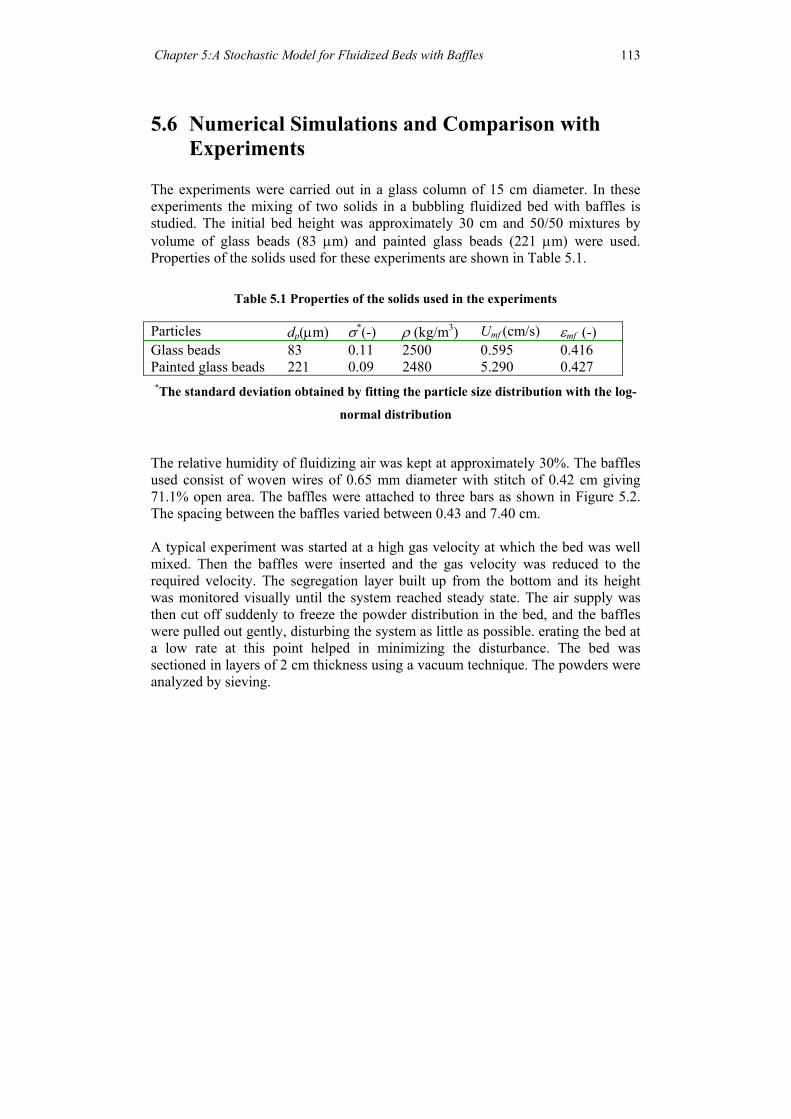
The experiments were carried out in a glass column of 15 cm diameter. In these experiments the mixing of two solids in a bubbling fluidized bed with baffles is studied. The initial bed height was approximately 30 cm and 50/50 mixtures by volume of glass beads (83 µm) and painted glass beads (221 µm) were used. Properties of the solids used for these experiments are shown in Table 5.1.
Table 5.1 Properties of the solids used in the experiments
Particles dp(µm) σ*(-) ρ (kg/m3) Umf (cm/s) εmf (-) Glass beads 83 0.11 2500 0.595 0.416 Painted glass beads 221 0.09 2480 5.290 0.427 *The standard deviation obtained by fitting the particle size distribution with the log-
normal distribution
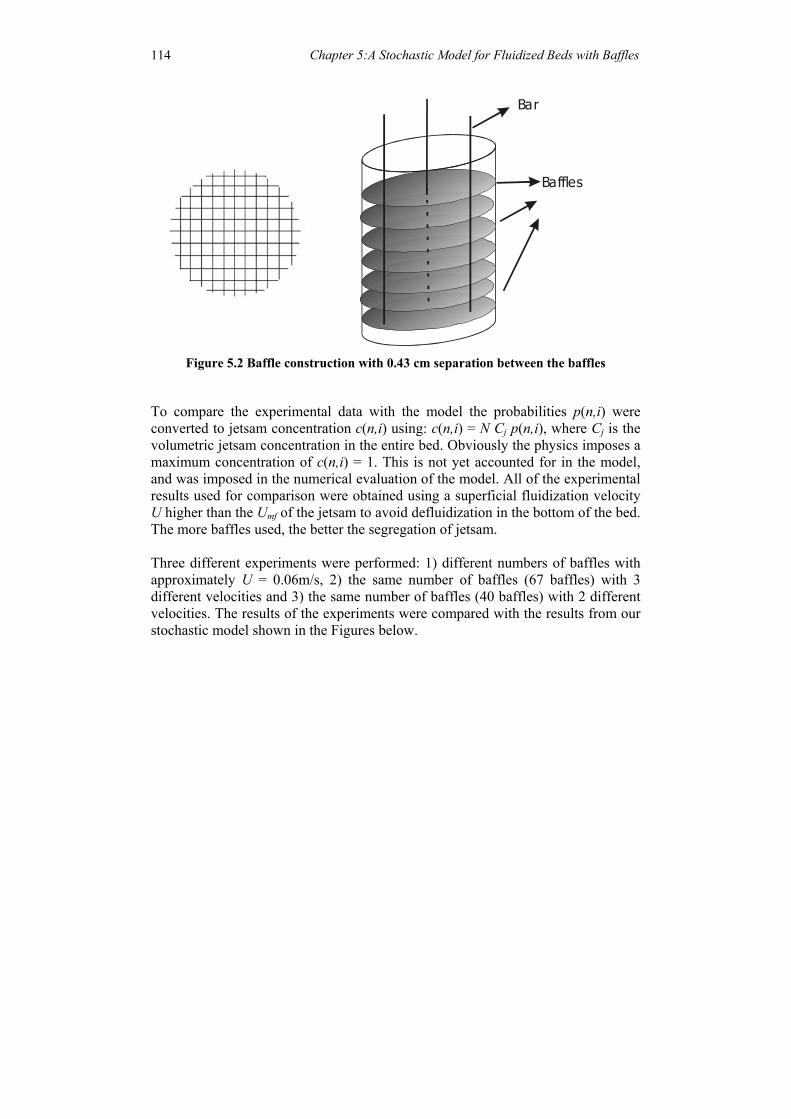
The relative humidity of fluidizing air was kept at approximately 30%. The baffles used consist of woven wires of 0.65 mm diameter with stitch of 0.42 cm giving 71.1% open area. The baffles were attached to three bars as shown in Figure 5.2. The spacing between the baffles varied between 0.43 and 7.40 cm. A typical experiment was started at a high gas velocity at which the bed was well mixed. Then the baffles were inserted and the gas velocity was reduced to the required velocity. The segregation layer built up from the bottom and its height was monitored visually until the system reached steady state. The air supply was then cut off suddenly to freeze the powder distribution in the bed, and the baffles were pulled out gently, disturbing the system as little as possible. erating the bed at a low rate at this point helped in minimizing the disturbance. The bed was sectioned in layers of 2 cm thickness using a vacuum technique. The powders were analyzed by sieving.
Chapter 5:A Stochastic Model for Fluidized Beds with Baffles 114
Bar
Baffles
Figure 5.2 Baffle construction with 0.43 cm separation between the baffles
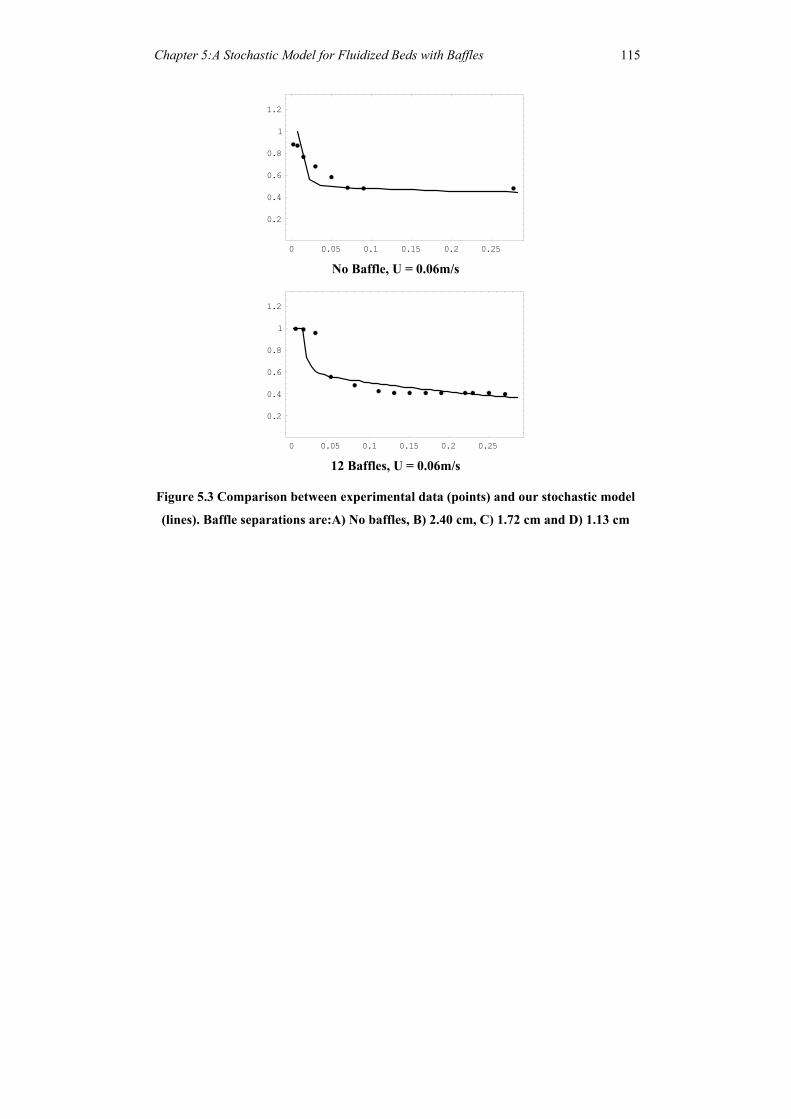
To compare the experimental data with the model the probabilities p(n,i) were converted to jetsam concentration c(n,i) using: c(n,i) = N Cj p(n,i), where Cj is the volumetric jetsam concentration in the entire bed. Obviously the physics imposes a maximum concentration of c(n,i) = 1. This is not yet accounted for in the model, and was imposed in the numerical evaluation of the model. All of the experimental results used for comparison were obtained using a superficial fluidization velocity U higher than the Umf of the jetsam to avoid defluidization in the bottom of the bed. The more baffles used, the better the segregation of jetsam. Three different experiments were performed: 1) different numbers of baffles with approximately U = 0.06m/s, 2) the same number of baffles (67 baffles) with 3 different velocities and 3) the same number of baffles (40 baffles) with 2 different velocities. The results of the experiments were compared with the results from our stochastic model shown in the Figures below.
Chapter 5:A Stochastic Model for Fluidized Beds with Baffles 115
0 0.05 0.1 0.15 0.2 0.25
0.2
0.4
0.6
0.8
1
1.2
No Baffle, U = 0.06m/s
0 0.05 0.1 0.15 0.2 0.25
0.2
0.4
0.6
0.8
1
1.2
12 Baffles, U = 0.06m/s
Figure 5.3 Comparison between experimental data (points) and our stochastic model
(lines). Baffle separations are:A) No baffles, B) 2.40 cm, C) 1.72 cm and D) 1.13 cm
Chapter 5:A Stochastic Model for Fluidized Beds with Baffles 116
0 0.05 0.1 0.15 0.2 0.25
0.2
0.4
0.6
0.8
1
1.2
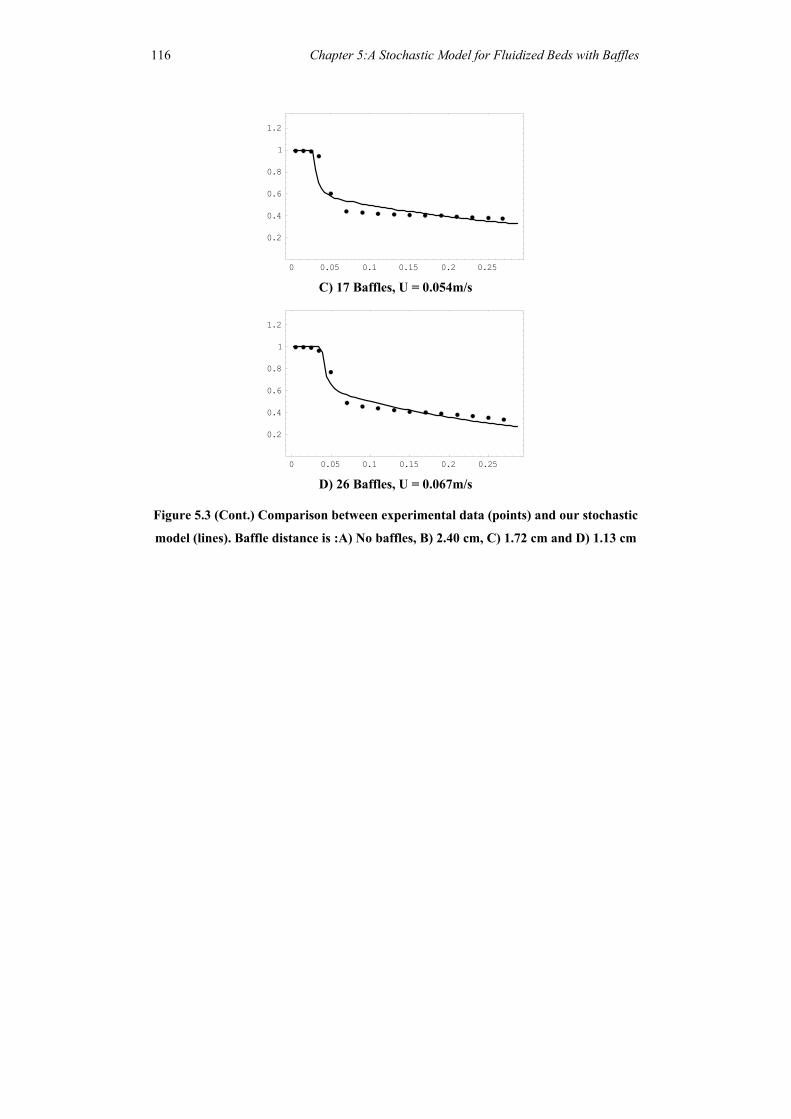
C) 17 Baffles, U = 0.054m/s
0 0.05 0.1 0.15 0.2 0.25
0.2
0.4
0.6
0.8
1
1.2
D) 26 Baffles, U = 0.067m/s
Figure 5.3 (Cont.) Comparison between experimental data (points) and our stochastic
model (lines). Baffle distance is :A) No baffles, B) 2.40 cm, C) 1.72 cm and D) 1.13 cm
Chapter 5:A Stochastic Model for Fluidized Beds with Baffles 117
0 0.05 0.1 0.15 0.2 0.25
0.2
0.4
0.6
0.8
1
1.2
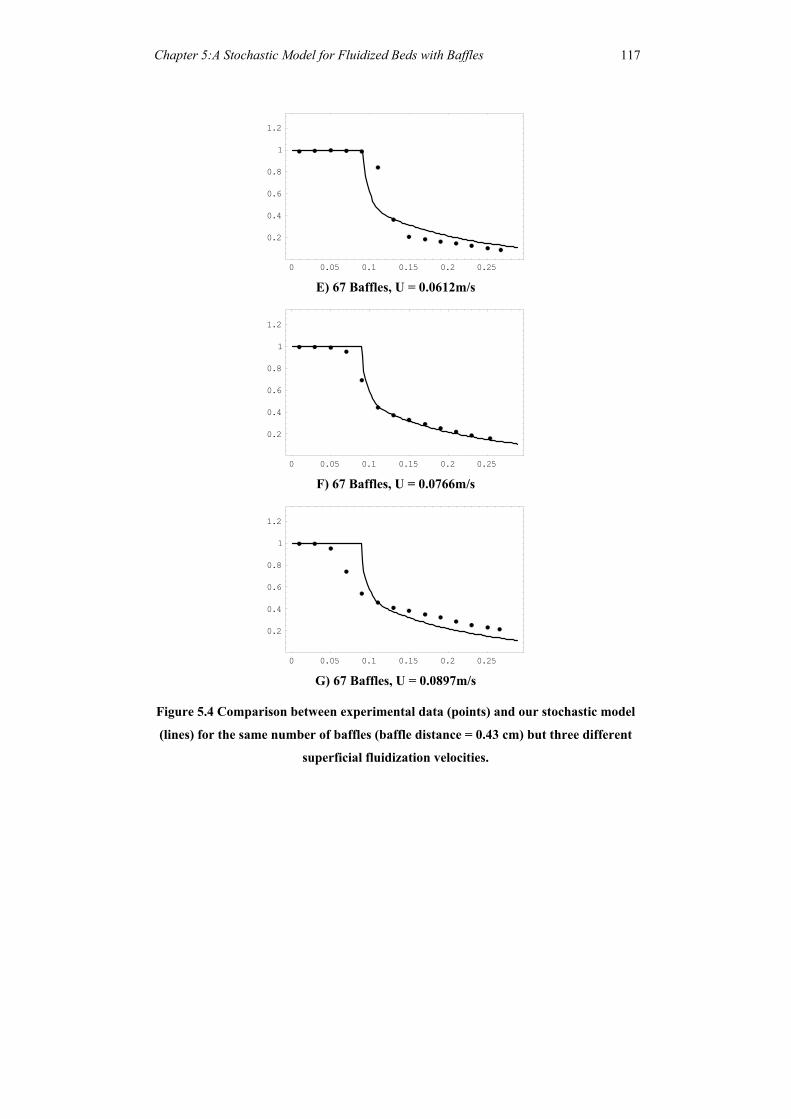
E) 67 Baffles, U = 0.0612m/s
0 0.05 0.1 0.15 0.2 0.25
0.2
0.4
0.6
0.8
1
1.2
F) 67 Baffles, U = 0.0766m/s
0 0.05 0.1 0.15 0.2 0.25
0.2
0.4
0.6
0.8
1
1.2
G) 67 Baffles, U = 0.0897m/s
Figure 5.4 Comparison between experimental data (points) and our stochastic model
(lines) for the same number of baffles (baffle distance = 0.43 cm) but three different
superficial fluidization velocities.
Chapter 5:A Stochastic Model for Fluidized Beds with Baffles 118
0 0.05 0.1 0.15 0.2 0.25
0.2
0.4
0.6
0.8
1
1.2
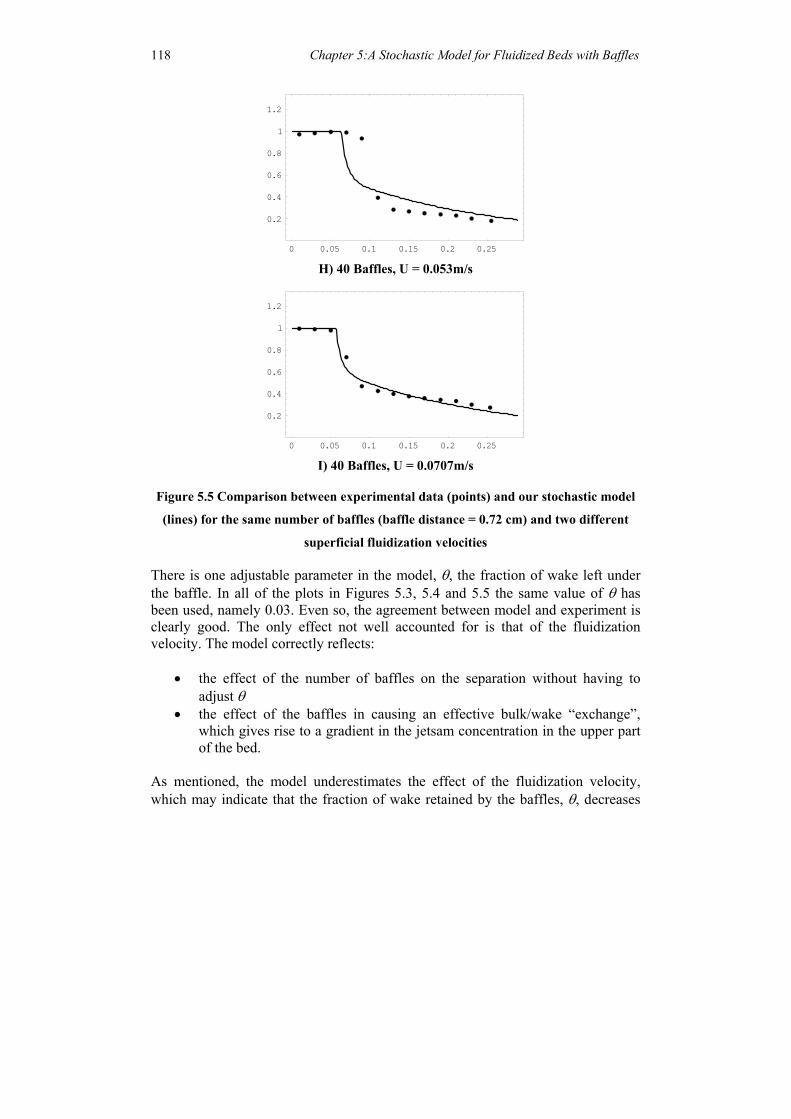
H) 40 Baffles, U = 0.053m/s
0 0.05 0.1 0.15 0.2 0.25
0.2
0.4
0.6
0.8
1
1.2
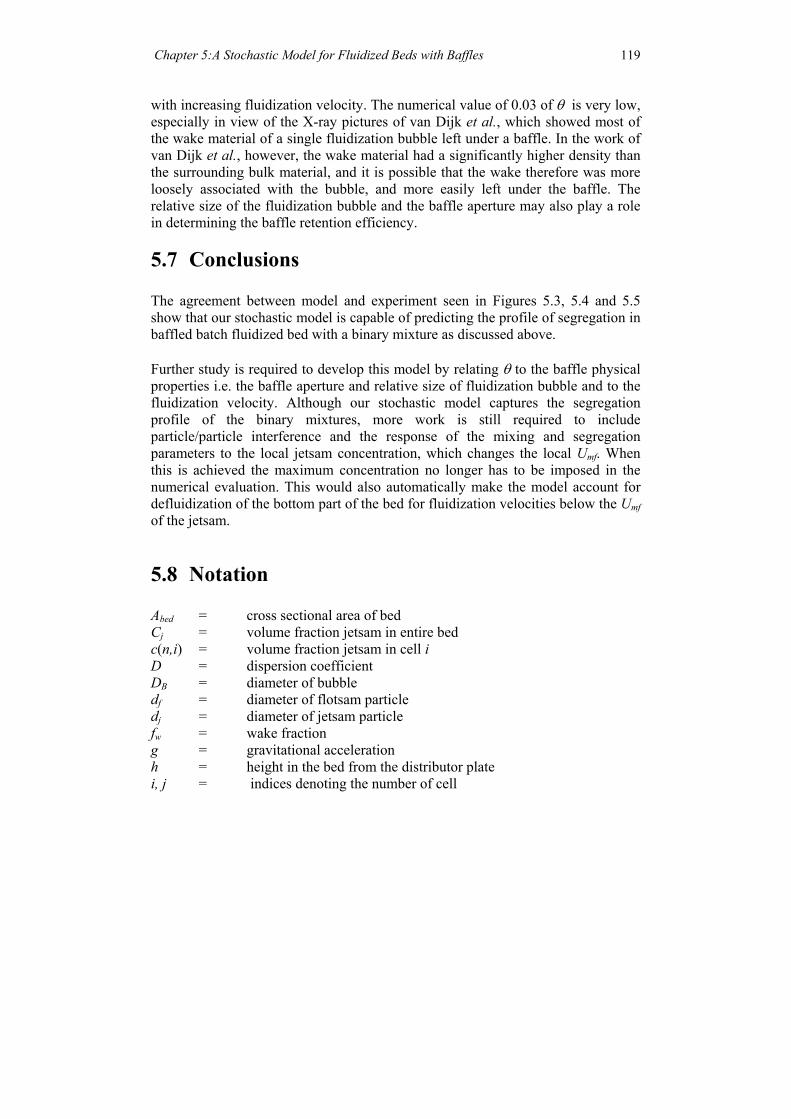
I) 40 Baffles, U = 0.0707m/s
Figure 5.5 Comparison between experimental data (points) and our stochastic model
(lines) for the same number of baffles (baffle distance = 0.72 cm) and two different
superficial fluidization velocities
There is one adjustable parameter in the model, θ, the fraction of wake left under the baffle. In all of the plots in Figures 5.3, 5.4 and 5.5 the same value of θ has been used, namely 0.03. Even so, the agreement between model and experiment is clearly good. The only effect not well accounted for is that of the fluidization velocity. The model correctly reflects:
• the effect of the number of baffles on the separation without having to adjust θ
• the effect of the baffles in causing an effective bulk/wake “exchange”, which gives rise to a gradient in the jetsam concentration in the upper part of the bed.
As mentioned, the model underestimates the effect of the fluidization velocity, which may indicate that the fraction of wake retained by the baffles, θ, decreases
Chapter 5:A Stochastic Model for Fluidized Beds with Baffles 119
with increasing fluidization velocity. The numerical value of 0.03 of θ is very low, especially in view of the X-ray pictures of van Dijk et al., which showed most of the wake material of a single fluidization bubble left under a baffle. In the work of van Dijk et al., however, the wake material had a significantly higher density than the surrounding bulk material, and it is possible that the wake therefore was more loosely associated with the bubble, and more easily left under the baffle. The relative size of the fluidization bubble and the baffle aperture may also play a role in determining the baffle retention efficiency.
5.7 Conclusions The agreement between model and experiment seen in Figures 5.3, 5.4 and 5.5 show that our stochastic model is capable of predicting the profile of segregation in baffled batch fluidized bed with a binary mixture as discussed above. Further study is required to develop this model by relating θ to the baffle physical properties i.e. the baffle aperture and relative size of fluidization bubble and to the fluidization velocity. Although our stochastic model captures the segregation profile of the binary mixtures, more work is still required to include particle/particle interference and the response of the mixing and segregation parameters to the local jetsam concentration, which changes the local Umf. When this is achieved the maximum concentration no longer has to be imposed in the numerical evaluation. This would also automatically make the model account for defluidization of the bottom part of the bed for fluidization velocities below the Umf of the jetsam.
5.8 Notation Abed = cross sectional area of bed Cj = volume fraction jetsam in entire bed c(n,i) = volume fraction jetsam in cell i D = dispersion coefficient DB = diameter of bubble df = diameter of flotsam particle dj = diameter of jetsam particle fw = wake fraction g = gravitational acceleration h = height in the bed from the distributor plate i, j = indices denoting the number of cell
Chapter 5:A Stochastic Model for Fluidized Beds with Baffles 120
m = number of baffles N = number of cells internal to the discretized beds n = index denoting the time step p = probability vector p = elements of p Qb = volumetric flow of gas in the bubble phase P = transition probability matrix pi,j = elements of P S = cells between two baffles U = fluidization velocity (superficial) Umf = minimum fluidization velocity (superficial) vcir = circulation velocity vseg = segregation velocity Y = dimensionless segregation distance Greek symbols: ε = time step ∆ = width of the cells α,β,δ = parameters in the transition probabilities λ = removal rate θ = baffle removal rate θw = wake angle ρf = density of flotsam ρj = density of jetsam
5.9 References Bosma, J.C. and Hoffmann, A.C., “On the capacity of continuous powder classification in a gas-fluidized bed with horizontal sieve-like baffles”, Powder Technol., 134 (2003), 1-15. Chen, J. L.,-P, “A theoretical model for particle segregation in a fluidized bed due to size difference”, Chem. Eng. Commun., 9(1981), 303-320. Dehling, H.G., Hoffmann, A.C. and Stuut, H.W., “Stochastic models for transport in a fluidized bed”, SIAM J. Appl. Math., 60(1999), 337. Dijk, van J. J., Hoffmann, A.C., Cheesman, D. and Yates, J.G, “The influence of horizontal internals on the flowpattern in dense fluidized beds. An X-ray investigation.”, Powder Technol., 98(1998) , 273-278.
Chapter 5:A Stochastic Model for Fluidized Beds with Baffles
121
Geldart, D., “The Effect of Particle Size and Size Distribution on the Behavior of Gas-Fluidized Beds,” Powder Technol., 6(1972), 201. Gibilaro, L.G. and P.N. Rowe, “A model for a segregating gas fluidized bed”, Chem. Eng. Sci., 29(1974), 1403-12. Hartholt, G.P., Particle mixing in gas-solid fluidized beds, PhD thesis, Department of chemical engineering, University of Groningen, The Netherlands, 1996. Hoffmann, A.C. and Dehling, H.G., “A stochastic modeling approach to particle residence time distribution in continuous fluidized beds”, Proceedings of the World Conference on Particle Technology 3, Brighton, UK, July,1998. Hartholt, G.P., la Riviere, R., Hoffmann, A.C. and Janssen, L.P.B.M., “The influence of perforated baffles on the mixing and segregation of a binary group B mixtures a gas-solid fluidized bed,” Powder Technol., 93(1997), 185. Hartholt, G.P., Hoffmann, A.C. and Janssen, L.P.B.M., “Visual observation of individual particle behaviour in gas and liquid fluidised beds”, Powder Technol., 88(1996), 341-345. Hoffmann, A.C. and Paarhuis, H., “A study of particle residence time distribution in continuous fluidized beds”, I.Chem.E.Sym.Ser., (1990), 121. Hoffmann, A.C. and Romp, E.J., “Segregation in a fluidized powder of a continuous size distribution”, Powder Technol., 66(1991), 119. Rowe, P.N. and Partridge, B.A., “Particle movement caused by bubbles in a fluidised bed”, Interaction Between Fluids & Particles Rottenburg, P.A. (Hon. Ed.) Instn Chem. Engrs, London, 1962, 135-142. Tanimoto, H., Chiba, S., Chiba, T. and Kobayashi, H., “Jetsam descent induced by a single bubble passage in three-dimensional gas-fluidized beds”, J. Chem. Eng. of Japan ,14(1981), 273-276. Wen, C.Y. and Yu, Y.H., “Mechanics of fluidization”, Chem Eng. Progress Symp. Ser., 62 (1966), 100-111.