vibrant gujarat - manufacturing sector profile
TRANSCRIPT
Manufacturing Sector Profile
SECTOR PROFILE
1 India - Preferred investment destination
2 Gujarat - Preferred investment destination in India
3 Manufacturing sector in Gujarat - Overview and focus sub sectors
4 Manufacturing focus sub-sectors
4.1 Engineering
- Overview
- Gujarat Scenario – 2017
- Interventions planned
- Investment Opportunities
4.2 Technical Textile
- Overview
- Policy intervention
- Gujarat scenario - 2017
- Interventions planned
- Investment Opportunities
4.3 Auto
- Overview
- Gujarat Scenario – 2020
- Policy Initiatives and Interventions planned
- Investment opportunities
estment destinationerred in1
tunities
Table of Contents
4.4 Chemicals & Petrochemicals
- Overview
- Policy interventions
- Gujarat Scenario – Year 2017
- Investment Opportunities
4.5 Pharmaceuticals & Biotechnology
- Overview
- Policy interventions
- Investment Opportunities
4.6 Gems & Jewellery
- Overview
- Policy interventions
- Investment Opportunities
5 Advantage Gujarat
6 Doing business in Gujarat
7 Key government agencies
INDIA - PREFERRED INVESTMENT DESTINATION
01
1
02
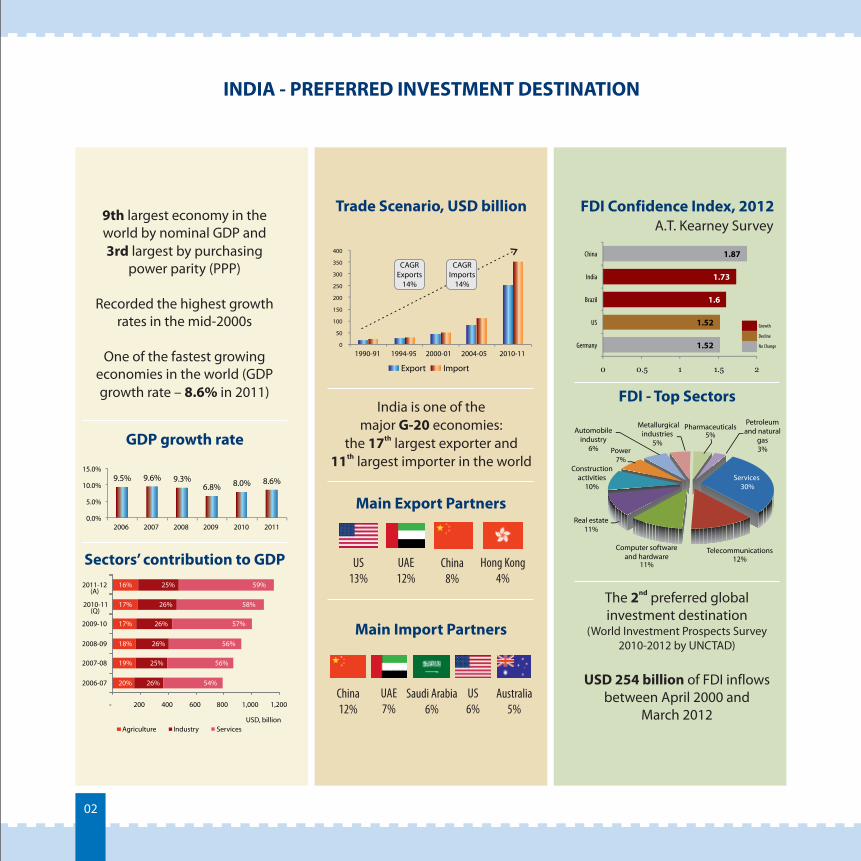
INDIA - PREFERRED INVESTMENT DESTINATION
9th largest economy in the world by nominal GDP and 3rd largest by purchasing
power parity (PPP)
Recorded the highest growth rates in the mid-2000s
One of the fastest growing economies in the world (GDP growth rate – 8.6% in 2011)
GDP growth rate
Sectors’ contribution to GDP
India is one of themajor G-20 economies:
ththe 17 largest exporter andth11 largest importer in the world
Main Export Partners
ndThe 2 preferred global investment destination
(World Investment Prospects Survey 2010-2012 by UNCTAD)
USD 254 billion of FDI inflows between April 2000 and
March 2012
Main Import Partners
US 13%
UAE 12%
China 8%
Hong Kong4%
China12%
UAE 7%
Saudi Arabia6%
US6%
Australia5%
FDI Confidence Index, 2012A.T. Kearney Survey
FDI - Top Sectors
9.5% 9.6% 9.3%6.8% 8.0% 8.6%
0.0%
5.0%
10.0%
15.0%
2006 2007 2008 2009 2010 2011
1.52
1.52
1.6
1.73
1.87
0 0.5 1 1.5 2
Germany
US
Brazil
India
China
Services30%
Telecommunications12%
Computer softwareand hardware
11%
Real estate11%
Constructionactivities
10%
Power7%
Automobile industry
6%
Metallurgical industries
5%
Pharmaceuticals5%
Petroleum and natural
gas3%
No Change
Decline
Growth
- 200 400 600 800 1,000 1,200
Agriculture Industry ServicesUSD, billion
16%
17%
17%
18%
19%
20%
25%
26%
26%
26%
25%
26%
59%
58%
57%
56%
56%
54% 2006-07
2007-08
2008-09
2009-10
2010-11
2011-12(A)
(Q)
Trade Scenario, USD billion
0
50
100
150
200
250
300
350
400
1990-91 1994-95 2000-01 2004-05 2010-11
Export Import
CAGRExports
14%
CAGRImports
14%
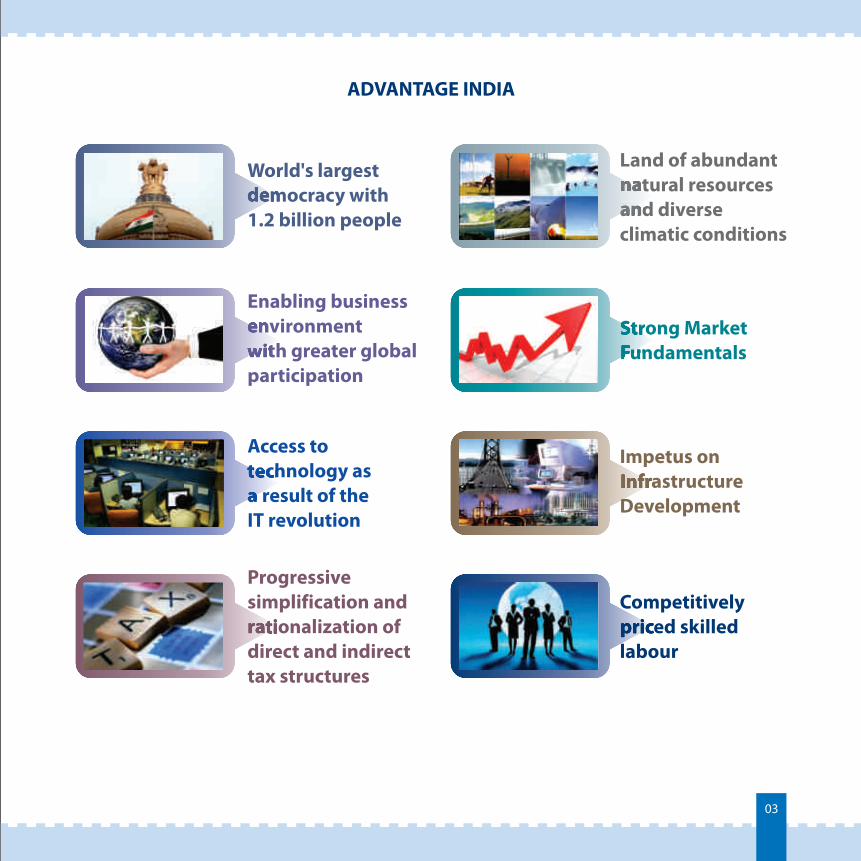
World's largest democracy with1.2 billion people
Land of abundant natural resources and diverse climatic conditions
Enabling business environment with greater global participation
Strong Market Fundamentals
Access to technology as a result of the IT revolution
Impetus on Infrastructure Development
Progressive simplification and rationalization of direct and indirect tax structures
Competitivelypriced skilledlabour
democr naturand div
Strong MarkFundamen
Impetus on InfrastrucDe
pric
enwith gr
technology as a r
simplificrationaliza
ADVANTAGE INDIA
03
04
2GUJARAT - PREFERRED INVESTMENT DESTINATION IN INDIA
05
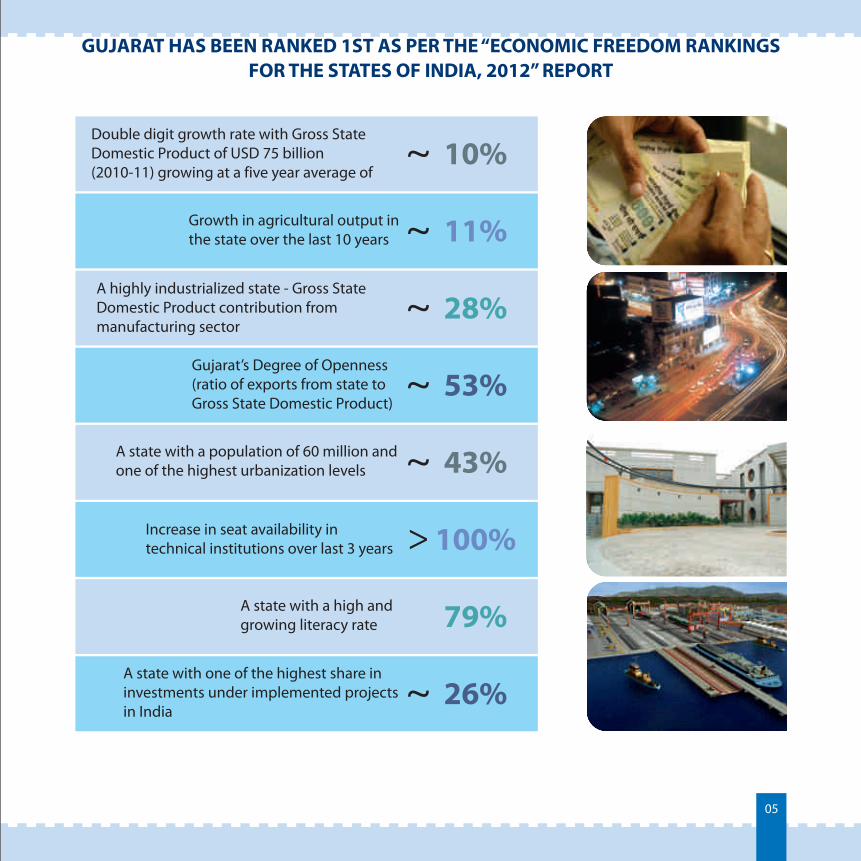
Gujarat’s Degree of Openness (ratio of exports from state to Gross State Domestic Product)
53%
A highly industrialized state - Gross State Domestic Product contribution from manufacturing sector
28%
Growth in agricultural output in the state over the last 10 years 11%
Double digit growth rate with Gross State Domestic Product of USD 75 billion(2010-11) growing at a five year average of
10%
26%A state with one of the highest share in investments under implemented projects in India
A state with a high and growing literacy rate 79%
Increase in seat availability in technical institutions over last 3 years 100%
A state with a population of 60 million and one of the highest urbanization levels 43%
GUJARAT HAS BEEN RANKED 1ST AS PER THE “ECONOMIC FREEDOM RANKINGS FOR THE STATES OF INDIA, 2012” REPORT
06
MANUFACTURING SECTOR IN GUJARAT - OVERVIEW AND FOCUS SUB SECTORS
3
07
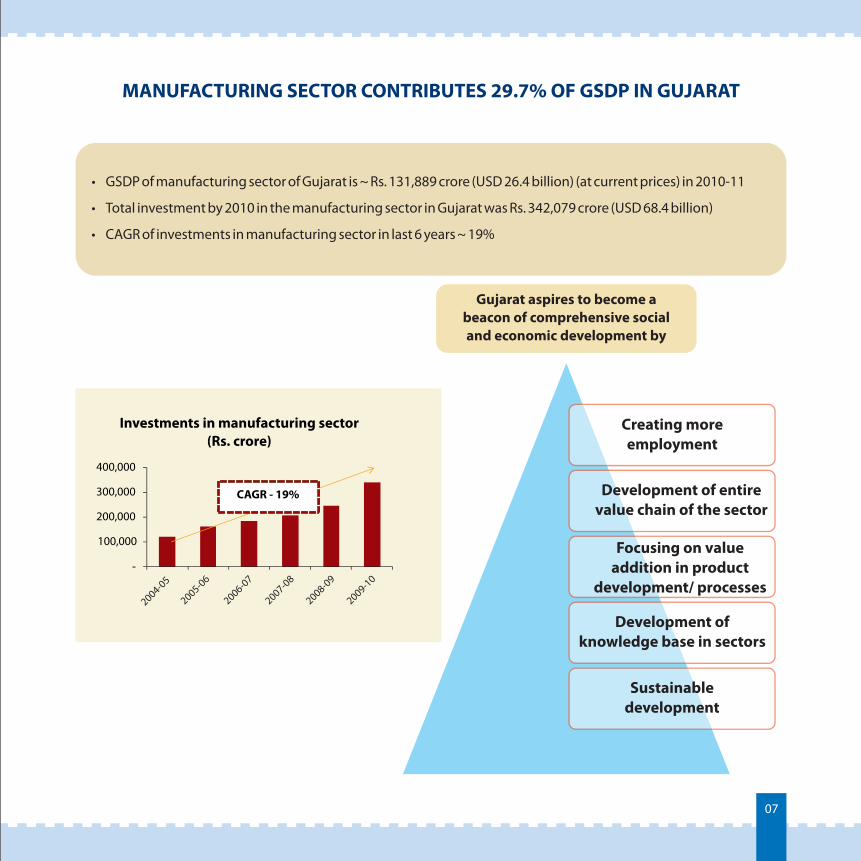
MANUFACTURING SECTOR CONTRIBUTES 29.7% OF GSDP IN GUJARAT
• GSDP of manufacturing sector of Gujarat is ~ Rs. 131,889 crore (USD 26.4 billion) (at current prices) in 2010-11
• Total investment by 2010 in the manufacturing sector in Gujarat was Rs. 342,079 crore (USD 68.4 billion)
• CAGR of investments in manufacturing sector in last 6 years ~ 19%
-
100,000
200,000
300,000
400,000
Investments (Rs. crore)
in manufacturing sector
CAGR - 19%
Gujarat aspires to become a beacon of comprehensive social and economic development by
Creating moreemployment
Development of entirevalue chain of the sector
Focusing on valueaddition in product
development/ processes
Development of knowledge base in sectors
Sustainable development
2004-05
2005-06
2006-07
2007-08
2008-09
2009-10
08
GUJARAT – INVESTMENT REQUIREMENTS
• The size of the Indian economy is likely to be around US $ 3.8 trillion by 2025 – assuming an 8% CAGR
• The GSDP of Gujarat is likely to be around US $ 780 billion by 2025
• Manufacturing sector in Gujarat likely to be around US $ 200 billion by 2025
By 2017
• Incremental investments required in Manufacturing sector by 2017 would be around US $ 80 billion
• Currently, major investments in Gujarat in Manufacturing sector are in Chemical, Textiles and Engineering.
• Defence offsets and agri business parks are upcoming sectors that are likely to attract investments in the State
09
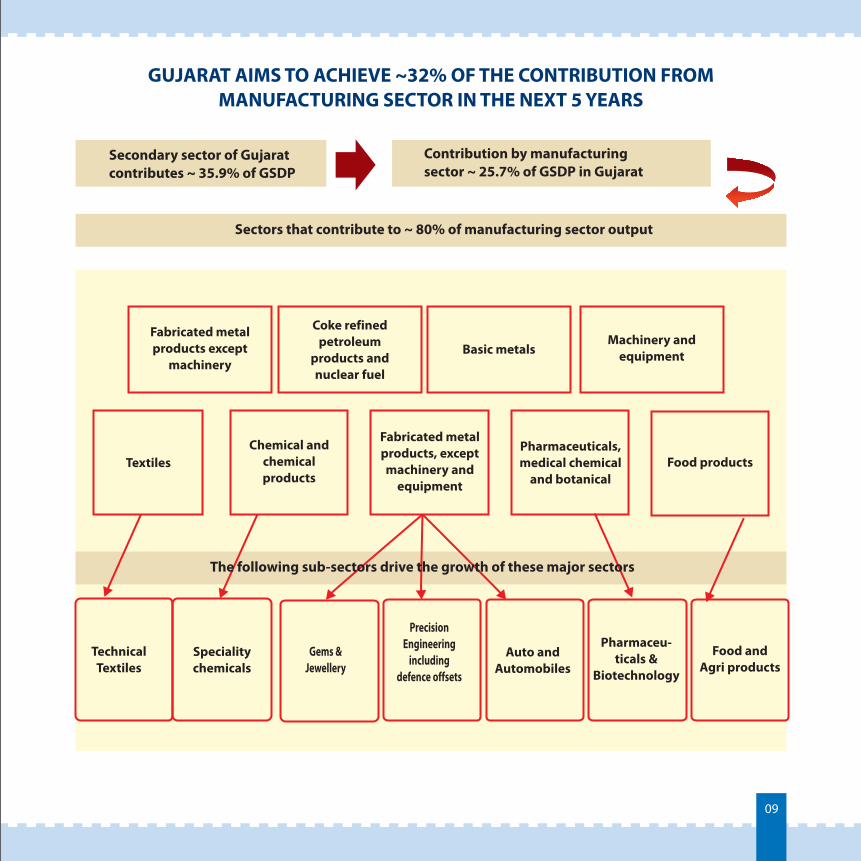
GUJARAT AIMS TO ACHIEVE ~32% OF THE CONTRIBUTION FROM MANUFACTURING SECTOR IN THE NEXT 5 YEARS
Secondary sector of Gujarat contributes ~ 35.9% of GSDP
Contribution by manufacturing sector ~ 25.7% of GSDP in Gujarat
Sectors that contribute to ~ 80% of manufacturing sector output
TechnicalTextiles
Specialitychemicals
Gems &Jewellery
Auto andAutomobiles
Precision Engineering
including defence offsets
Pharmaceu-ticals &
Biotechnology
Food and Agri products
TextilesChemical and
chemicalproducts
Fabricated metalproducts, exceptmachinery and
equipment
Pharmaceuticals,medical chemical
and botanical Food products
Fabricated metal products except
machinery
Coke refined petroleum
products and nuclear fuel
Basic metalsMachinery and
equipment
The following sub-sectors drive the growth of these major sectors
10
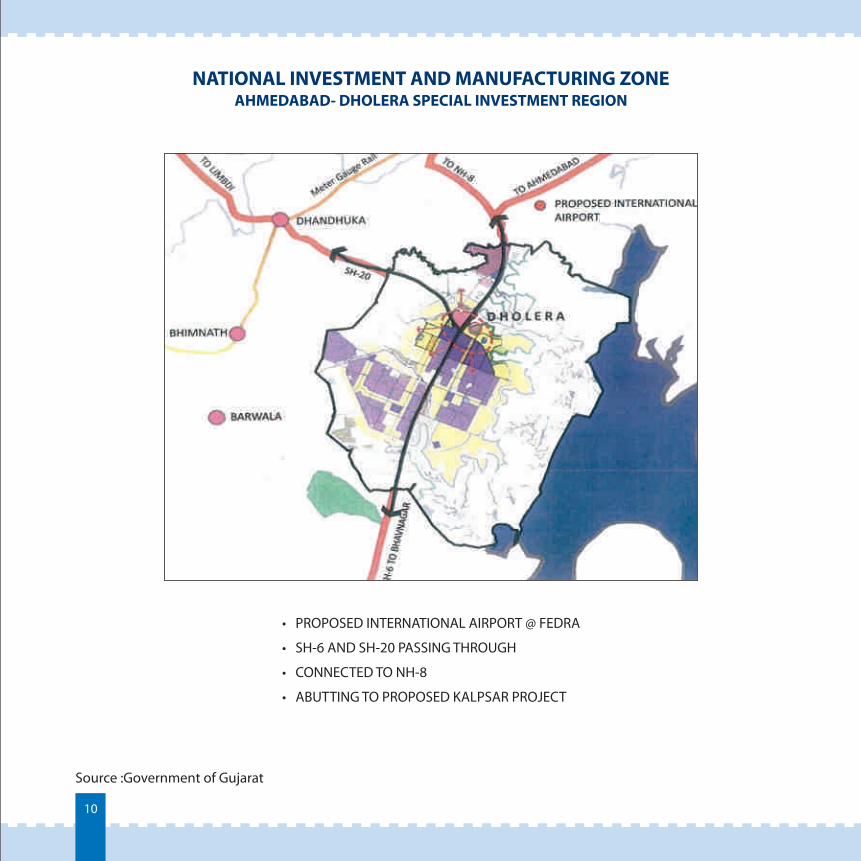
NATIONAL INVESTMENT AND MANUFACTURING ZONE AHMEDABAD- DHOLERA SPECIAL INVESTMENT REGION
Source :Government of Gujarat
• PROPOSED INTERNATIONAL AIRPORT @ FEDRA
• SH-6 AND SH-20 PASSING THROUGH
• CONNECTED TO NH-8
• ABUTTING TO PROPOSED KALPSAR PROJECT
11
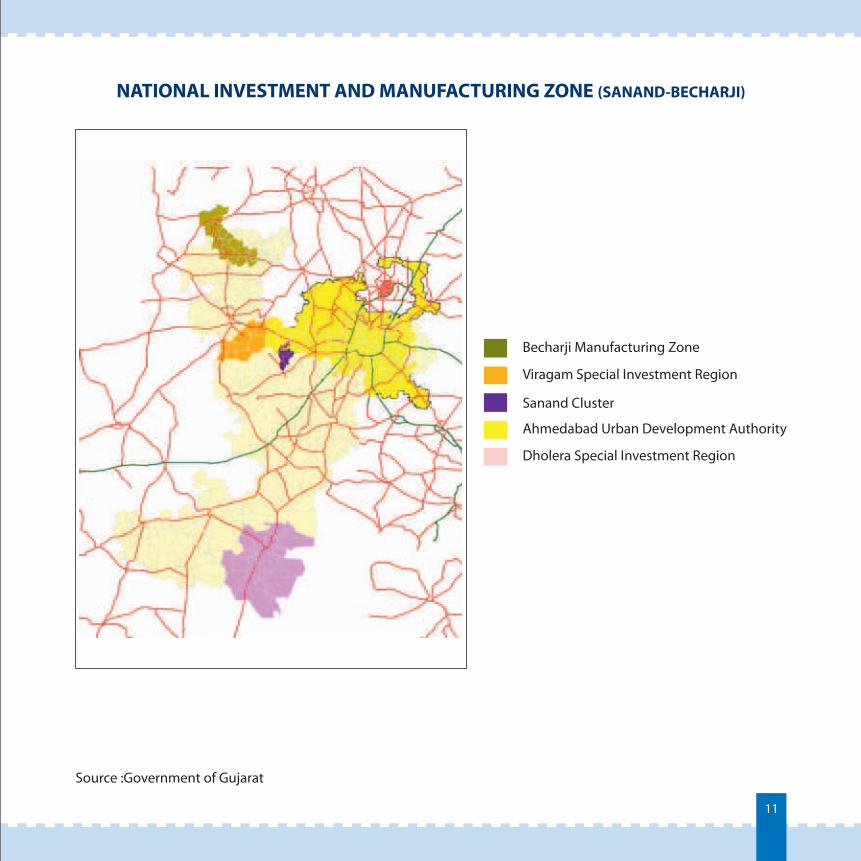
NATIONAL INVESTMENT AND MANUFACTURING ZONE (SANAND-BECHARJI)
Becharji Manufacturing Zone
Viragam Special Investment Region
Sanand Cluster
Ahmedabad Urban Development Authority
Dholera Special Investment Region
Source :Government of Gujarat
12
MANUFACTURING FOCUS SUB-SECTORS
4
13
ENGINEERING
4.1
14
OVERVIEW
4.1.1
15
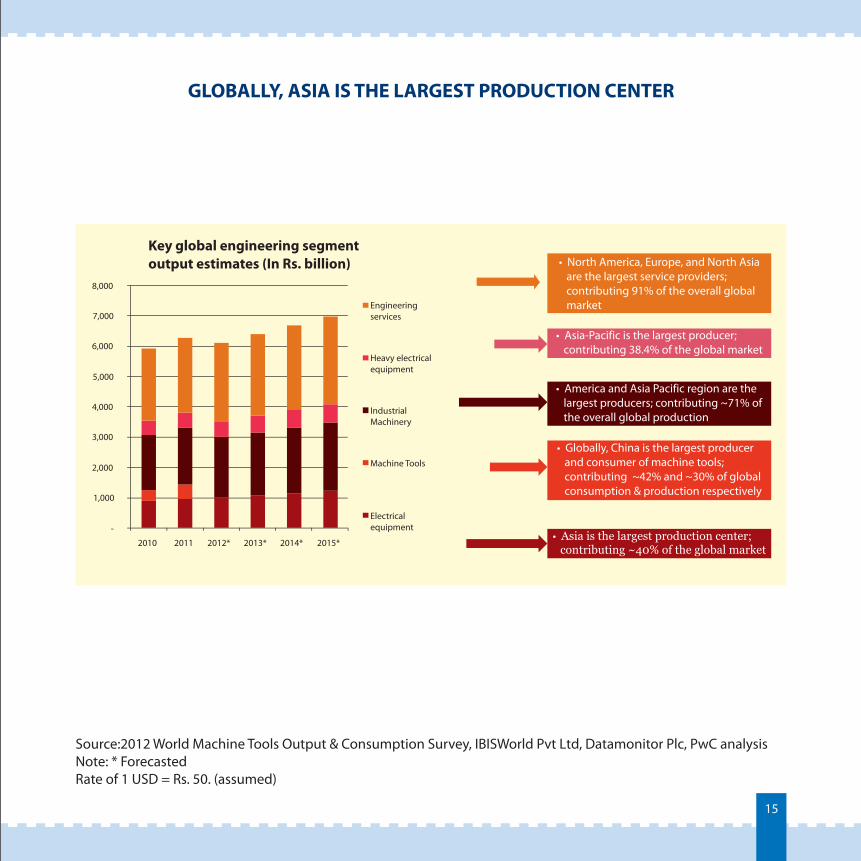
GLOBALLY, ASIA IS THE LARGEST PRODUCTION CENTER
-
1,000
2,000
3,000
4,000
5,000
6,000
7,000
8,000
2010 2011 2012* 2013* 2014* 2015*
Engineeringservices
Heavy electricalequipment
IndustrialMachinery
Machine Tools
Electrical equipment
Source:2012 World Machine Tools Output & Consumption Survey, IBISWorld Pvt Ltd, Datamonitor Plc, PwC analysisNote: * ForecastedRate of 1 USD = Rs. 50. (assumed)
• Asia-Pacific is the largest producer; contributing 38.4% of the global market
• largest producers; contributing ~71% of the overall global production
America and Asia Pacific region are the
•
Asia is the largest production center;contributing ~40% of the global market
• North America, Europe, and North Asia are the largest service providers; contributing 91% of the overall global market
• Globally, China is the largest producer and consumer of machine tools; contributing ~42% and ~30% of global consumption & production respectively
Key global engineering segment output estimates (In Rs. billion)
16
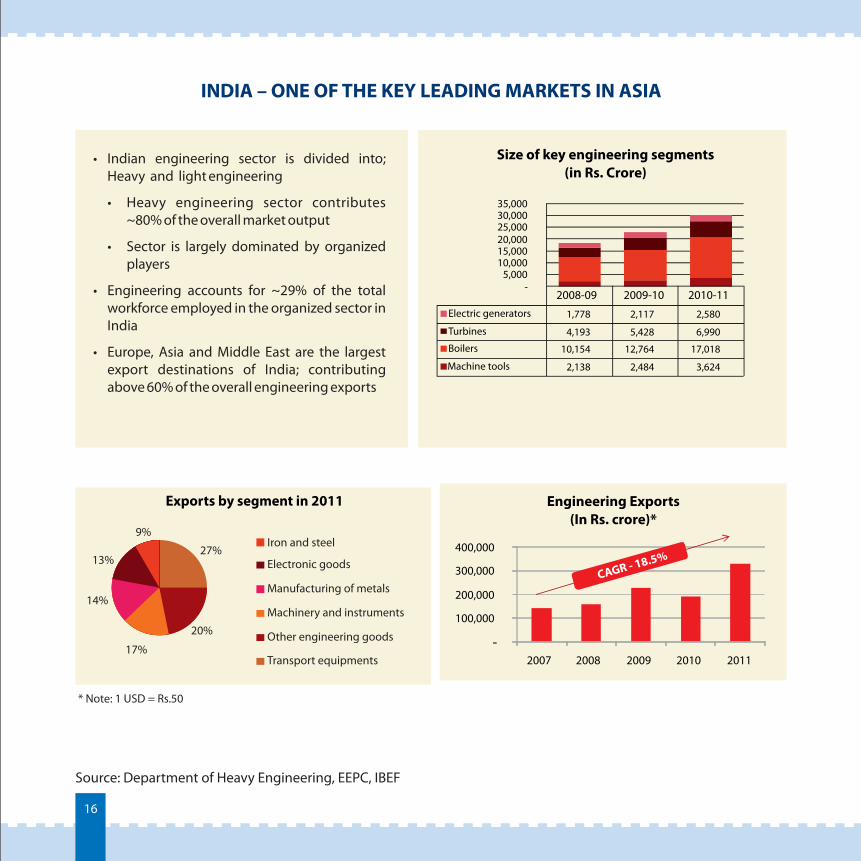
INDIA – ONE OF THE KEY LEADING MARKETS IN ASIA
• Indian engineering sector is divided into; Heavy and light engineering
• Heavy engineering sector contributes ~80% of the overall market output
• Sector is largely dominated by organized players
• Engineering accounts for ~29% of the total workforce employed in the organized sector in India
• Europe, Asia and Middle East are the largest export destinations of India; contributing above 60% of the overall engineering exports
Source: Department of Heavy Engineering, EEPC, IBEF
27%
17%
13%
9%
Exports by segment in 2011
Iron and steel
Electronic goods
Manufacturing of metals
Machinery and instruments
Engineering Exports(In Rs. crore)*
Size of key engineering segments(in Rs. Crore)
14%
20% Other engineering goods
Transport equipments
* Note: 1 USD = Rs.50
-
100,000
200,000
300,000
400,000
2007 2008 2009 2010 2011
CAGR - 18.5%
2008-09 2009-10 2010-11Electric generators 1,778 2,117 2,580
Turbines 4,193 5,428 6,990
Boilers 10,154 12,764 17,018
Machine tools 2,138 2,484 3,624
-5,000
10,000 15,000 20,000 25,000 30,000 35,000
17
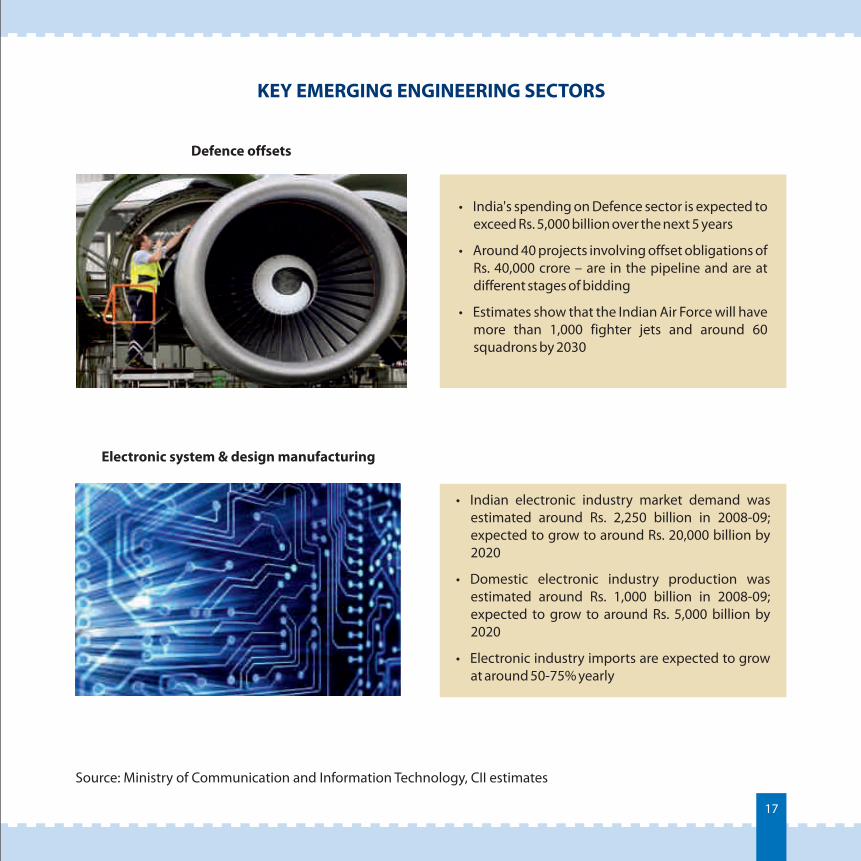
KEY EMERGING ENGINEERING SECTORS
Defence offsets
Electronic system & design manufacturing
• India's spending on Defence sector is expected to exceed Rs. 5,000 billion over the next 5 years
• Around 40 projects involving offset obligations of Rs. 40,000 crore – are in the pipeline and are at different stages of bidding
• Estimates show that the Indian Air Force will have more than 1,000 fighter jets and around 60 squadrons by 2030
• Indian electronic industry market demand was estimated around Rs. 2,250 billion in 2008-09; expected to grow to around Rs. 20,000 billion by 2020
• Domestic electronic industry production was estimated around Rs. 1,000 billion in 2008-09; expected to grow to around Rs. 5,000 billion by 2020
• Electronic industry imports are expected to grow at around 50-75% yearly
Source: Ministry of Communication and Information Technology, CII estimates
18
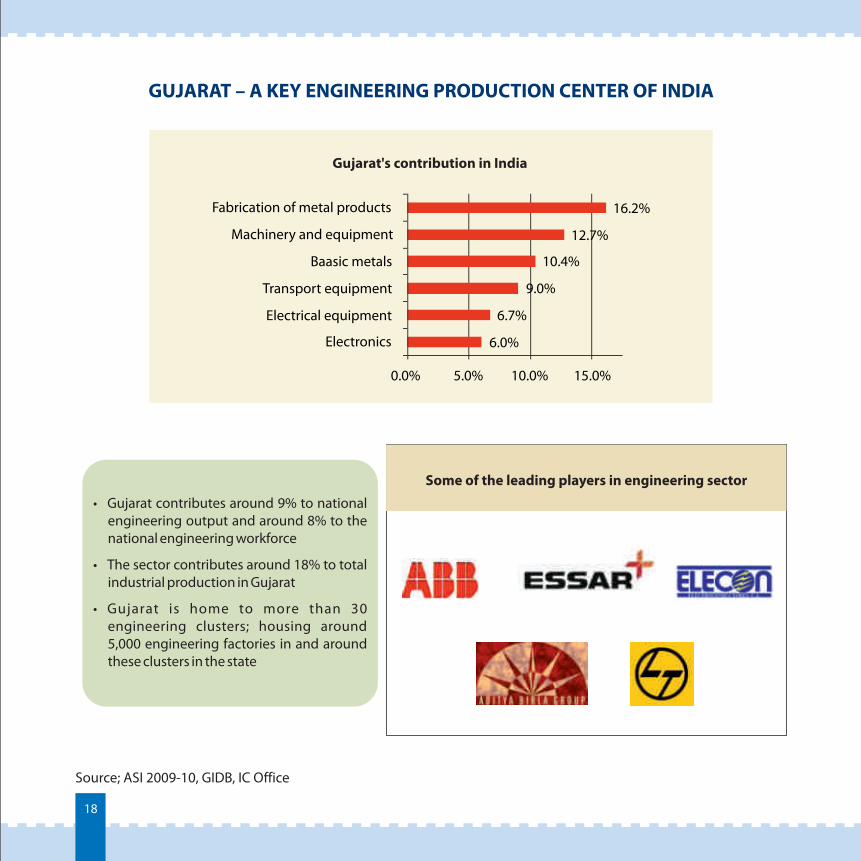
GUJARAT – A KEY ENGINEERING PRODUCTION CENTER OF INDIA
Source; ASI 2009-10, GIDB, IC Office
6.0%
6.7%
9.0%
10.4%
12.7%
16.2%
0.0% 5.0% 10.0% 15.0%
Electronics
Electrical equipment
Transport equipment
Baasic metals
Machinery and equipment
Fabrication of metal products
Gujarat's contribution in India
• Gujarat contributes around 9% to national engineering output and around 8% to the national engineering workforce
• The sector contributes around 18% to total industrial production in Gujarat
• Gujarat is home to more than 30 engineering clusters; housing around 5,000 engineering factories in and around these clusters in the state
Some of the leading players in engineering sector
19
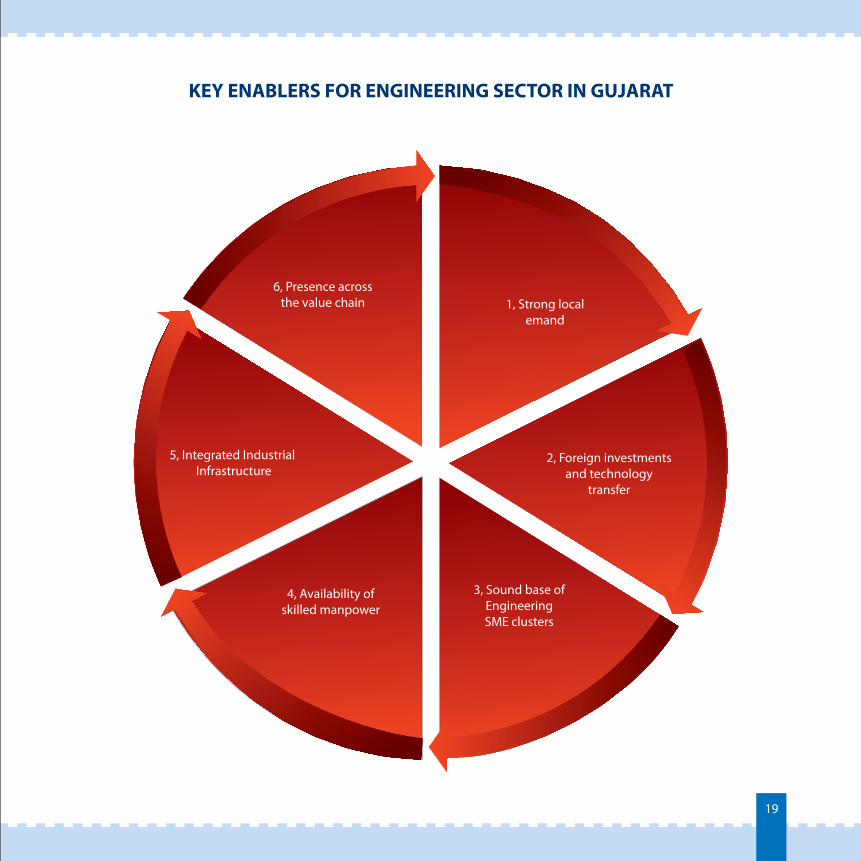
KEY ENABLERS FOR ENGINEERING SECTOR IN GUJARAT
6, Presence across the value chain 1, Strong local
emand
2, Foreign investments and technology
transfer
5, Integrated Industrial Infrastructure
3, Sound base of Engineering SME clusters
4, Availability of skilled manpower
20
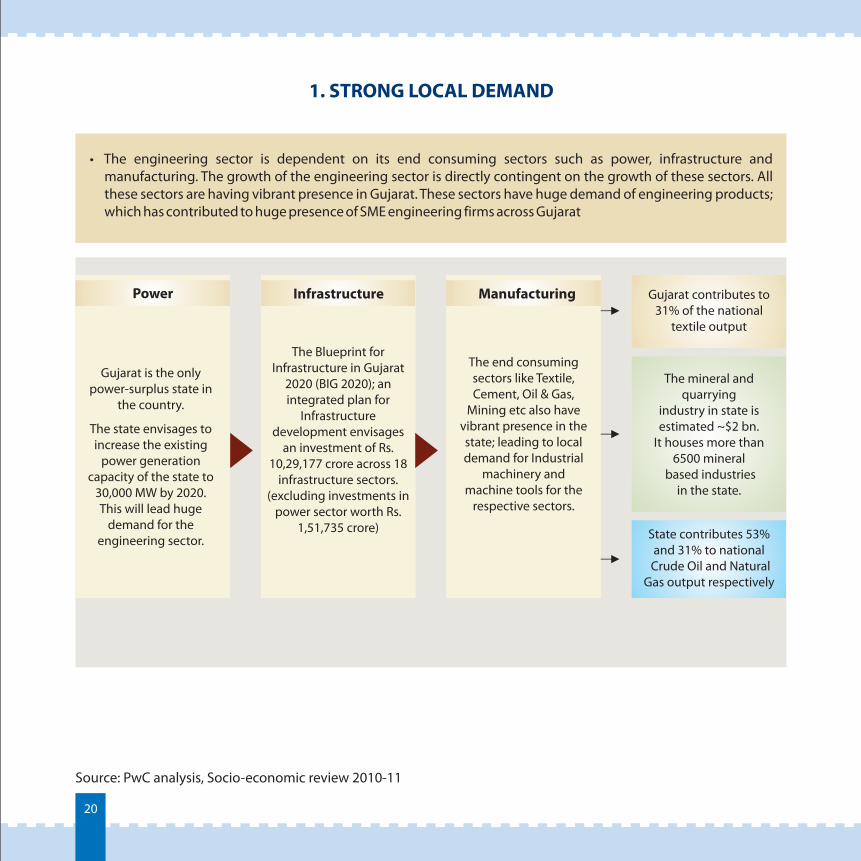
1. STRONG LOCAL DEMAND
Source: PwC analysis, Socio-economic review 2010-11
• The engineering sector is dependent on its end consuming sectors such as power, infrastructure and manufacturing. The growth of the engineering sector is directly contingent on the growth of these sectors. All these sectors are having vibrant presence in Gujarat. These sectors have huge demand of engineering products; which has contributed to huge presence of SME engineering firms across Gujarat
Gujarat is the only power-surplus state in
the country.
The state envisages to increase the existing
power generation capacity of the state to
30,000 MW by 2020. This will lead huge
demand for the engineering sector.
The Blueprint for Infrastructure in Gujarat
2020 (BIG 2020); an integrated plan for
Infrastructure development envisages
an investment of Rs. 10,29,177 crore across 18
infrastructure sectors. (excluding investments in
power sector worth Rs. 1,51,735 crore)
The end consuming sectors like Textile, Cement, Oil & Gas,
Mining etc also have vibrant presence in the state; leading to local demand for Industrial
machinery and machine tools for the
respective sectors.
Gujarat contributes to 31% of the national
textile output
Manufacturing
The mineral and quarrying
industry in state is estimated ~$2 bn.
It houses more than 6500 mineral
based industries in the state.
State contributes 53% and 31% to national
Crude Oil and NaturalGas output respectively
Power Infrastructure
21
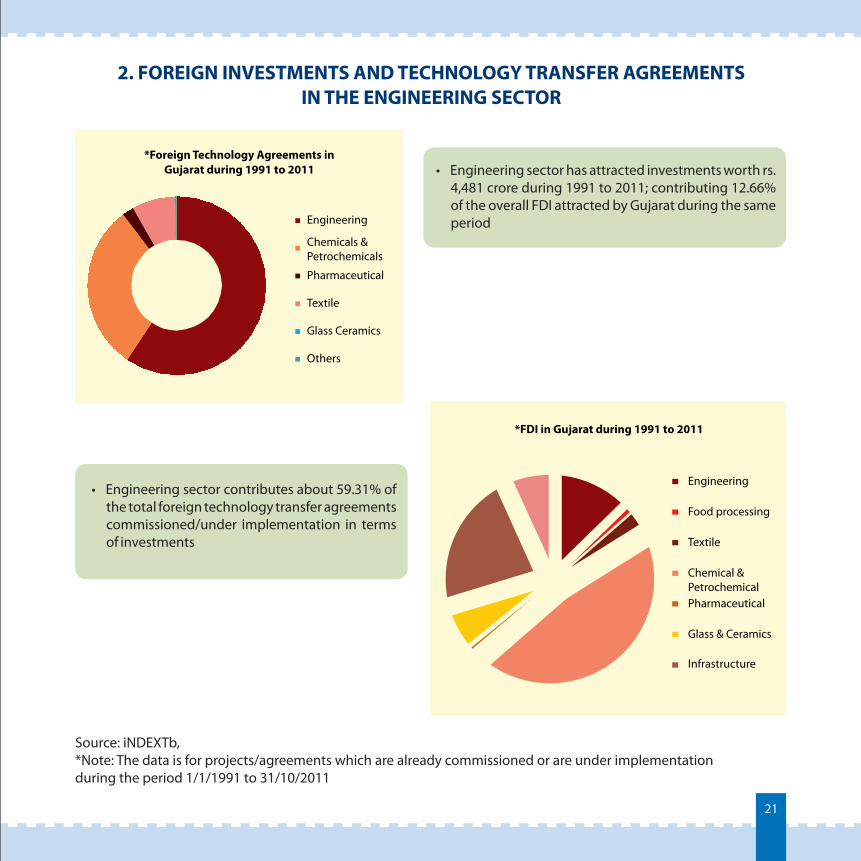
2. FOREIGN INVESTMENTS AND TECHNOLOGY TRANSFER AGREEMENTS IN THE ENGINEERING SECTOR
Source: iNDEXTb, *Note: The data is for projects/agreements which are already commissioned or are under implementation during the period 1/1/1991 to 31/10/2011
• Engineering sector contributes about 59.31% of the total foreign technology transfer agreements commissioned/under implementation in terms of investments
*Foreign Technology Agreements inGujarat during 1991 to 2011
Engineering
Chemicals &Petrochemicals
Pharmaceutical
Textile
Glass Ceramics
Others
• Engineering sector has attracted investments worth rs. 4,481 crore during 1991 to 2011; contributing 12.66% of the overall FDI attracted by Gujarat during the same period
*FDI in Gujarat during 1991 to 2011
Engineering
Food processing
Textile
Chemical &Petrochemical Pharmaceutical
Glass & Ceramics
Infrastructure
22
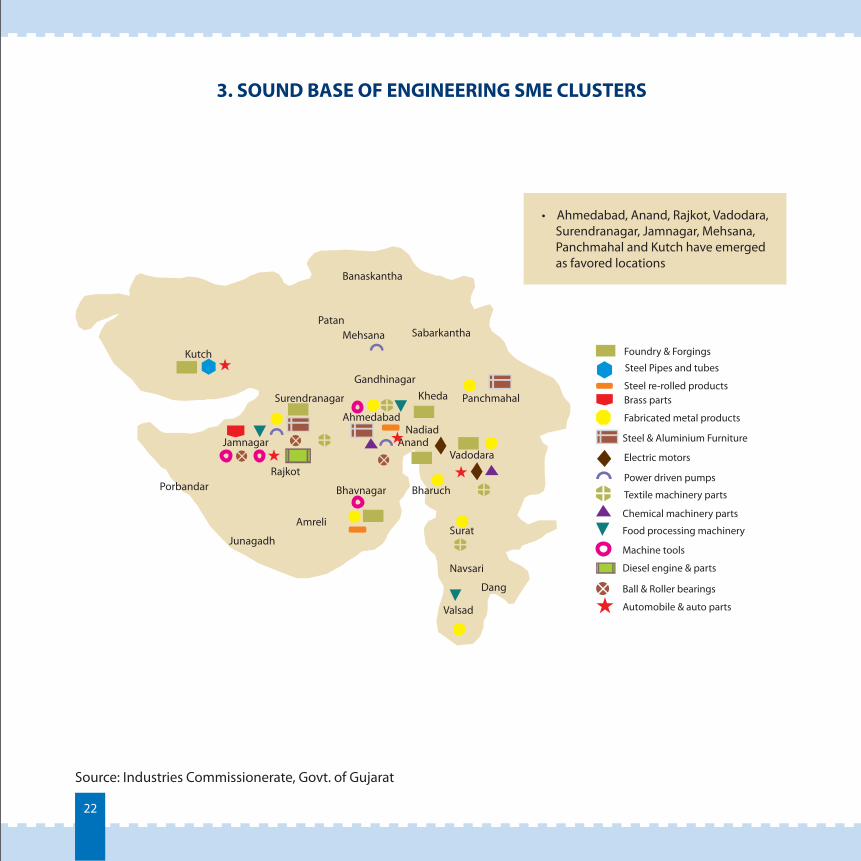
3. SOUND BASE OF ENGINEERING SME CLUSTERS
Source: Industries Commissionerate, Govt. of Gujarat
Kutch
Jamnagar
Porbandar
Junagadh
Amreli
Bhavnagar
Rajkot
Surendranagar
Ahmedabad
Vadodara
Bharuch
Surat
Navsari
Valsad
Gandhinagar
Banaskantha
SabarkanthaPatan
Mehsana
Anand
Dang
Panchmahal
Nadiad
Kheda
Foundry & Forgings
Steel re-rolled productsBrass parts
Fabricated metal products
Steel & Aluminium Furniture
Electric motors
Power driven pumps
Textile machinery parts
Chemical machinery parts
Food processing machinery
Machine tools
Diesel engine & parts
Ball & Roller bearings
Automobile & auto parts
Steel Pipes and tubes
• Ahmedabad, Anand, Rajkot, Vadodara, Surendranagar, Jamnagar, Mehsana, Panchmahal and Kutch have emerged as favored locations
23
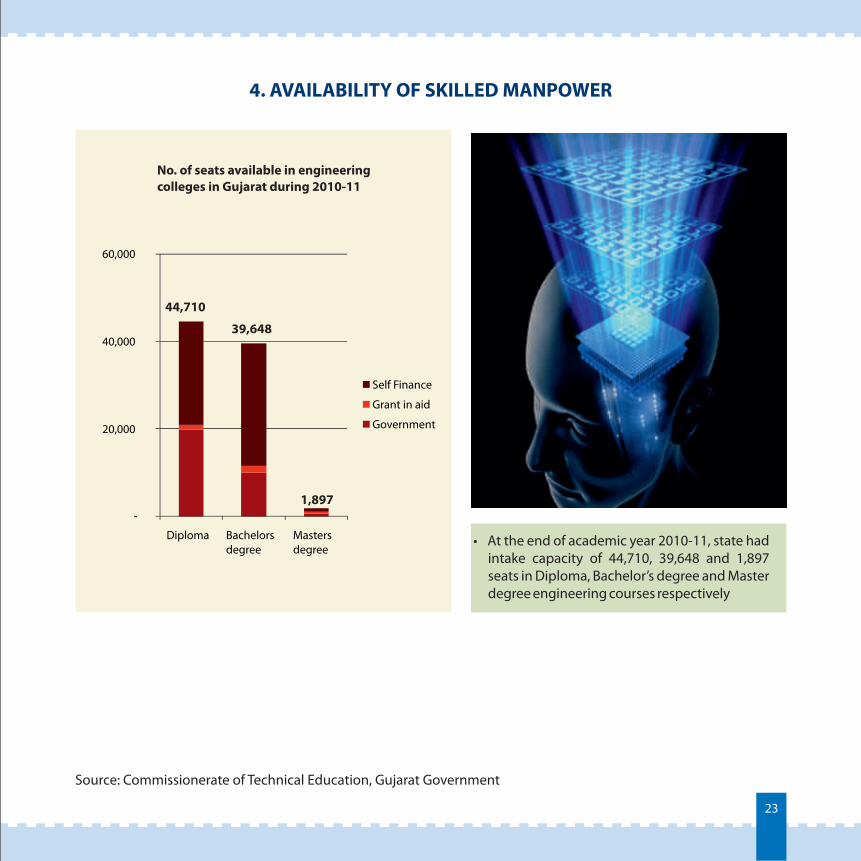
4. AVAILABILITY OF SKILLED MANPOWER
Source: Commissionerate of Technical Education, Gujarat Government
• At the end of academic year 2010-11, state had intake capacity of 44,710, 39,648 and 1,897 seats in Diploma, Bachelor’s degree and Master degree engineering courses respectively
-
20,000
40,000
60,000
Diploma Bachelorsdegree
Mastersdegree
No. of seats available in engineeringcolleges in Gujarat during 2010-11
Self Finance
Grant in aid
Government
44,710
39,648
1,897
24
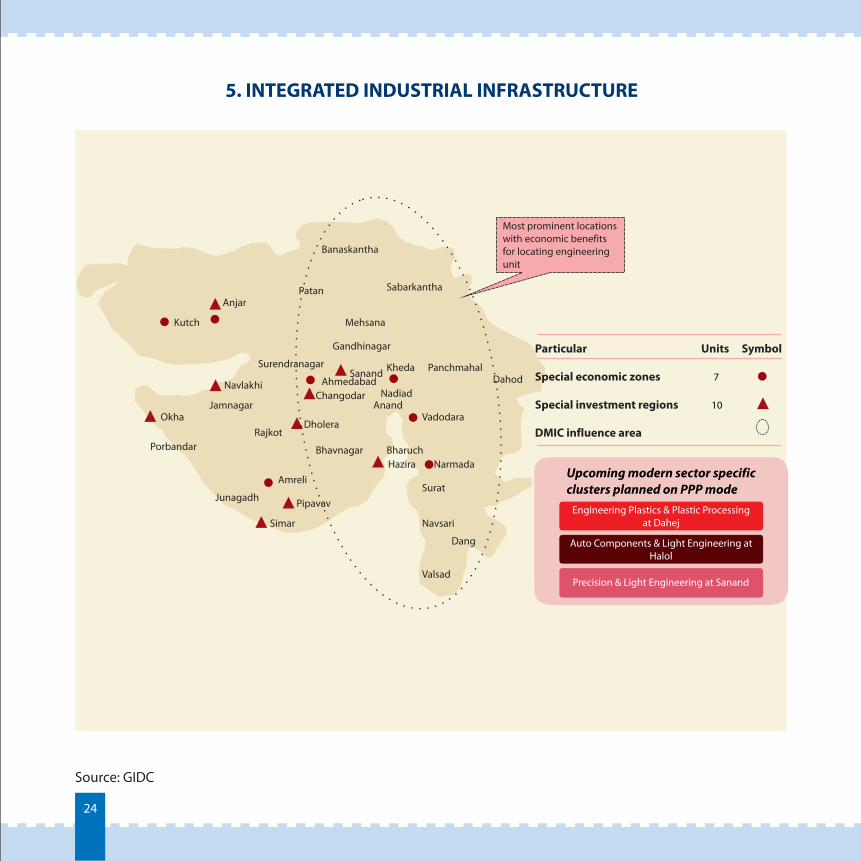
5. INTEGRATED INDUSTRIAL INFRASTRUCTURE
Source: GIDC
Kutch
Jamnagar
Porbandar
Junagadh
Amreli
Bhavnagar
Rajkot
Surendranagar
Ahmedabad
Vadodara
Bharuch
Surat
Navsari
Valsad
Gandhinagar
Banaskantha
SabarkanthaPatan
Mehsana
Anand
Dang
DahodPanchmahal
Nadiad
Narmada
Kheda
Upcoming modern sector specificclusters planned on PPP mode
Engineering Plastics & Plastic Processingat Dahej
Auto Components & Light Engineering atHalol
Precision & Light Engineering at Sanand
Particular Units Symbol
Special economic zones 7
Special investment regions 10
DMIC influence areaDholera
Changodar
Hazira
Okha
NavlakhiSanand
Pipavav
Simar
Anjar
Most prominent locations with economic benefits for locating engineering unit
25
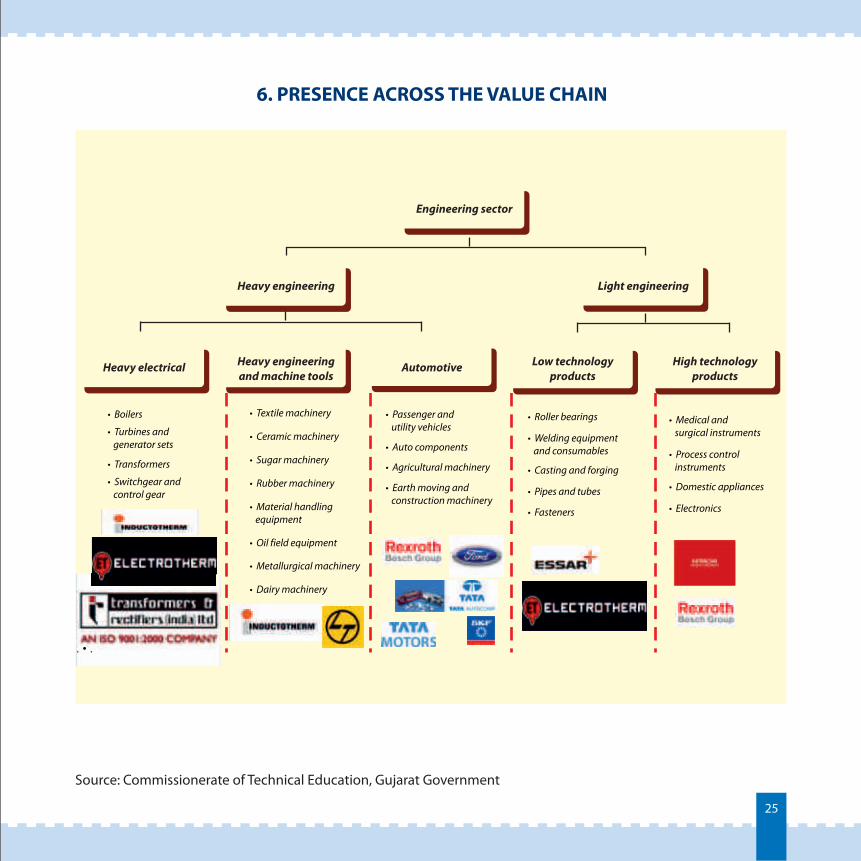
6. PRESENCE ACROSS THE VALUE CHAIN
Source: Commissionerate of Technical Education, Gujarat Government
. • .
Heavy engineering
Heavy electrical
• Boilers
• generator sets
Turbines and
• Transformers
• control gear
Switchgear and
• Textile machinery
• Ceramic machinery
• Sugar machinery
• Rubber machinery
• equipment
Material handling
• Oil field equipment
• Metallurgical machinery
• Dairy machinery
• utility vehicles
Passenger and
• Auto components
• Agricultural machinery
• construction machinery
Earth moving and
• Roller bearings
• and consumables
Welding equipment
• Casting and forging
• Pipes and tubes
• Fasteners
• surgical instruments
Medical and
• instruments
Process control
• Domestic appliances
• Electronics
Light engineering
Engineering sector
Heavy engineeringand machine tools
Automotive Low technologyproducts
High technologyproducts
26
GUJARAT SCENARIO – 2017
4.1.2
27
GOVERNMENT OF GUJARAT’S DEVELOPMENT AGENDA
Based on defence offsets,
stronger engineering sector
with value addition will emerge
Gujarat to target 35% of the possible Defence Offsets to be sourced from India
28
INTERVENTIONS PLANNED
4.1.3
29
GOVERNMENT INTERVENTIONS PLANNED TO BOOST THE SECTOR
• 3 precision engineering clusters with state-of-the-art infrastructure will be developed in the first phase in Halol, Sanand and Mandal –Becharaji;
• These clusters will be developed by GIDC;
• A Centre of Excellence, along with facilities for product testing and validation, will be developed in each of these clusters;
• The benefits of existing industrial park scheme will be extended to these clusters;
• Units coming in these clusters will be provided single window clearances and streamlined & hassle-free procedures for obtaining various approvals;
• The units in these clusters will be networked with the prime educational institutions in the country, so as to enhance technology levels through improved skills and capabilities;
• Development of ancillaries around these estates will be encouraged;
• Government will identify and provide large tracts of land for specialized trials of equipments
30
INVESTMENT OPPORTUNITIES
Source: GIDC
4.1.4
31
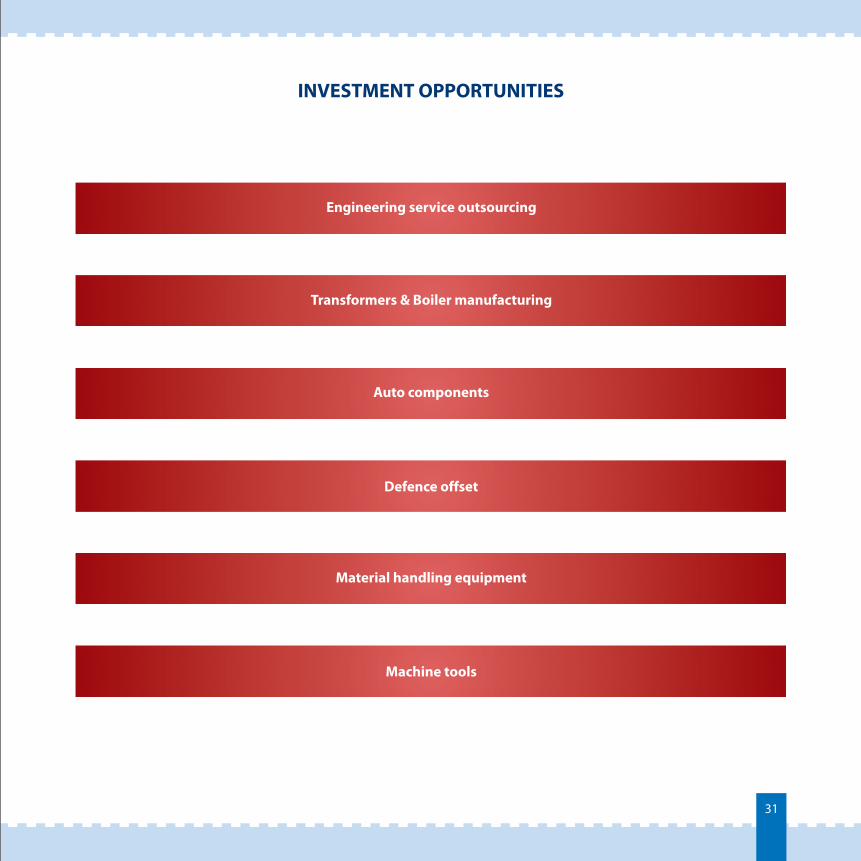
INVESTMENT OPPORTUNITIES
Engineering service outsourcing
Transformers & Boiler manufacturing
Auto components
Defence offset
Material handling equipment
Machine tools
32
TECHNICAL TEXTILE
4.2
33
OVERVIEW
4.2.1
34
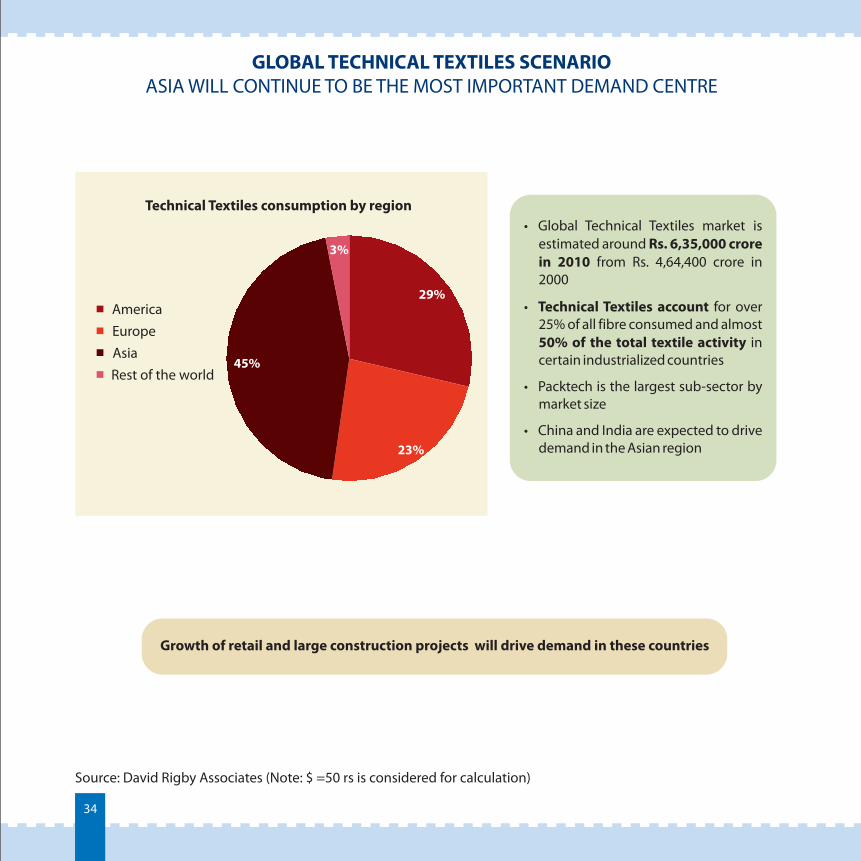
GLOBAL TECHNICAL TEXTILES SCENARIOASIA WILL CONTINUE TO BE THE MOST IMPORTANT DEMAND CENTRE
Source: David Rigby Associates (Note: $ =50 rs is considered for calculation)
• Global Technical Textiles market is estimated around Rs. 6,35,000 crore in 2010 from Rs. 4,64,400 crore in 2000
• Technical Textiles account for over 25% of all fibre consumed and almost 50% of the total textile activity in certain industrialized countries
• Packtech is the largest sub-sector by market size
• China and India are expected to drive demand in the Asian region
Growth of retail and large construction projects will drive demand in these countries
29%
23%
45%
3%
Technical Textiles consumption by region
AmericaEuropeAsiaRest of the world
35
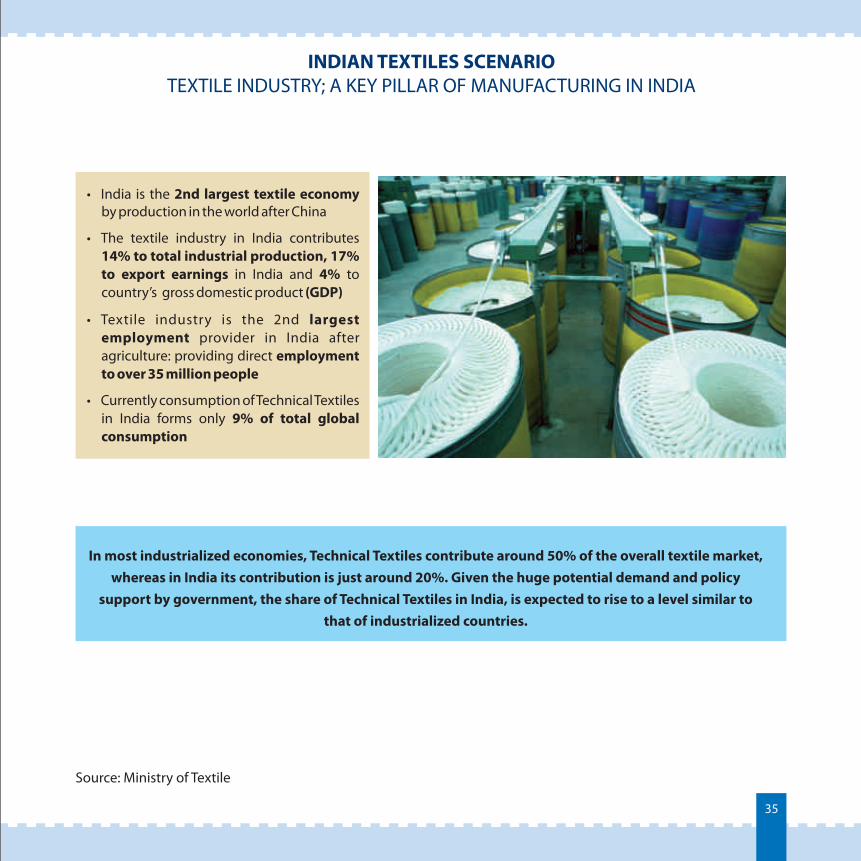
INDIAN TEXTILES SCENARIOTEXTILE INDUSTRY; A KEY PILLAR OF MANUFACTURING IN INDIA
In most industrialized economies, Technical Textiles contribute around 50% of the overall textile market, whereas in India its contribution is just around 20%. Given the huge potential demand and policy
support by government, the share of Technical Textiles in India, is expected to rise to a level similar to that of industrialized countries.
Source: Ministry of Textile
• India is the 2nd largest textile economy by production in the world after China
• The textile industry in India contributes 14% to total industrial production, 17% to export earnings in India and 4% to country’s gross domestic product (GDP)
• Textile industry is the 2nd largest employment provider in India after agriculture: providing direct employment to over 35 million people
• Currently consumption of Technical Textiles in India forms only 9% of total global consumption
36
INDIAN TECHNICAL TEXTILES SCENARIOA HIGHLY POTENT AND RAPIDLY GROWING INDUSTRY
Source: Ministry of Textiles, PwC Analysis (CAGR is calculated for 5 year period – 2011-12(E) to 2016-17 (P))(E) – estimated, (P) - projected
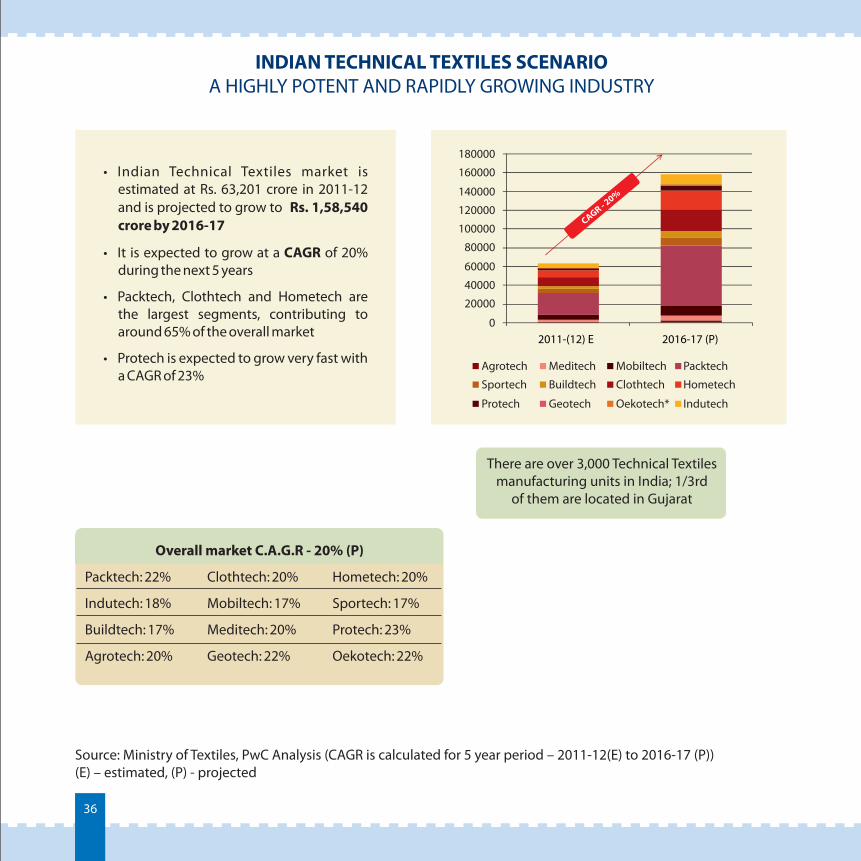
• Indian Technical Textiles market is estimated at Rs. 63,201 crore in 2011-12 and is projected to grow to Rs. 1,58,540 crore by 2016-17
• It is expected to grow at a CAGR of 20% during the next 5 years
• Packtech, Clothtech and Hometech are the largest segments, contributing to around 65% of the overall market
• Protech is expected to grow very fast with a CAGR of 23%
0
20000
40000
60000
80000
100000
120000
140000
160000
180000
2011-(12) E 2016-17 (P)
Agrotech Meditech Mobiltech Packtech
Sportech Buildtech Clothtech Hometech
Protech Geotech Oekotech* Indutech
There are over 3,000 Technical Textiles manufacturing units in India; 1/3rd
of them are located in Gujarat
Overall market C.A.G.R - 20% (P)
Packtech: 22% Clothtech: 20% Hometech: 20%
Indutech: 18% Mobiltech: 17% Sportech: 17%
Buildtech: 17% Meditech: 20% Protech: 23%
Agrotech: 20% Geotech: 22% Oekotech: 22%
CAGR - 20%
37
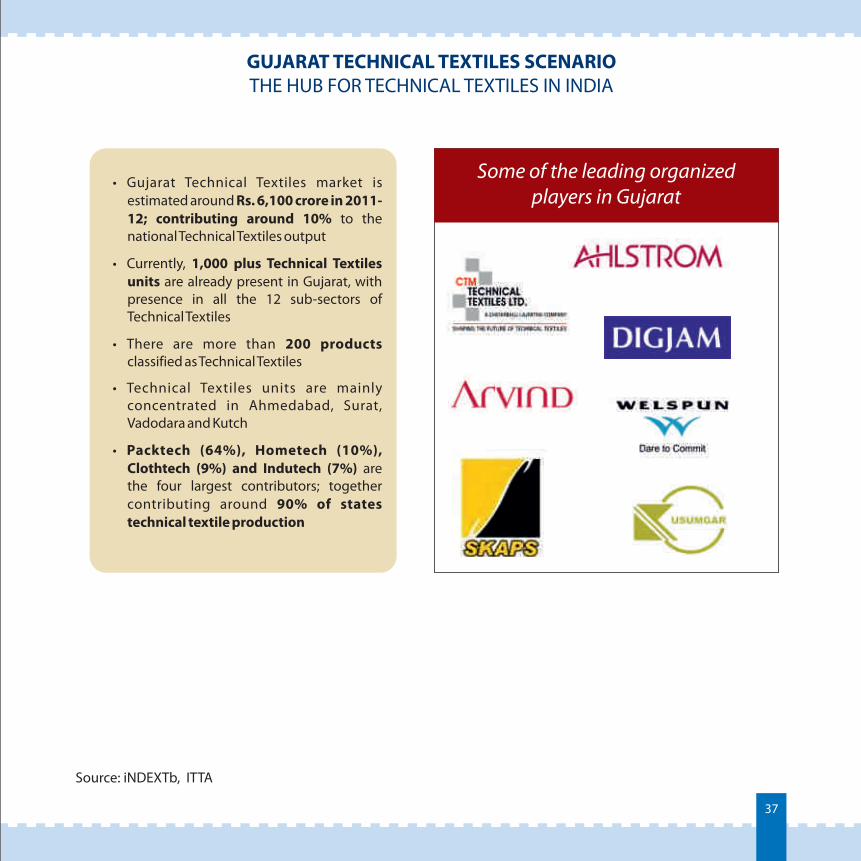
GUJARAT TECHNICAL TEXTILES SCENARIOTHE HUB FOR TECHNICAL TEXTILES IN INDIA
Source: iNDEXTb, ITTA
• Gujarat Technical Textiles market is estimated around Rs. 6,100 crore in 2011-12; contributing around 10% to the national Technical Textiles output
• Currently, 1,000 plus Technical Textiles units are already present in Gujarat, with presence in all the 12 sub-sectors of Technical Textiles
• There are more than 200 products classified as Technical Textiles
• Technical Textiles units are mainly concentrated in Ahmedabad, Surat, Vadodara and Kutch
• Packtech (64%), Hometech (10%), Clothtech (9%) and Indutech (7%) are the four largest contributors; together contributing around 90% of states technical textile production
Some of the leading organizedplayers in Gujarat
38
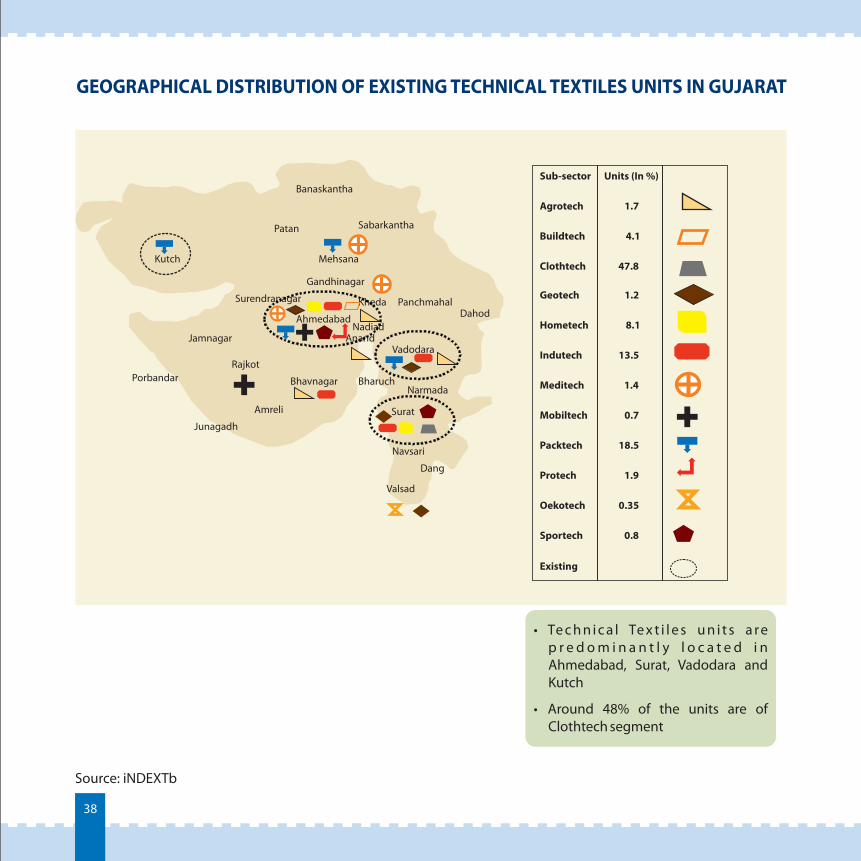
GEOGRAPHICAL DISTRIBUTION OF EXISTING TECHNICAL TEXTILES UNITS IN GUJARAT
Source: iNDEXTb
• Te c h n i c a l Te x t i l e s u n i t s a r e p r e d o m i n a n t l y l o c a t e d i n Ahmedabad, Surat, Vadodara and Kutch
• Around 48% of the units are of Clothtech segment
Sub-sector Units (In %)
Agrotech 1.7
Buildtech 4.1
Clothtech 47.8
Geotech 1.2
Hometech 8.1
Indutech 13.5
Meditech 1.4
Mobiltech 0.7
Packtech 18.5
Protech 1.9
Oekotech 0.35
Sportech 0.8
Kutch
Jamnagar
Porbandar
Junagadh
Amreli
Bhavnagar
Rajkot
Surendranagar
Ahmedabad
Vadodara
Bharuch
Surat
Navsari
Valsad
Gandhinagar
Banaskantha
SabarkanthaPatan
Mehsana
Anand
Dang
DahodPanchmahal
Nadiad
Narmada
Kheda
Existing
39
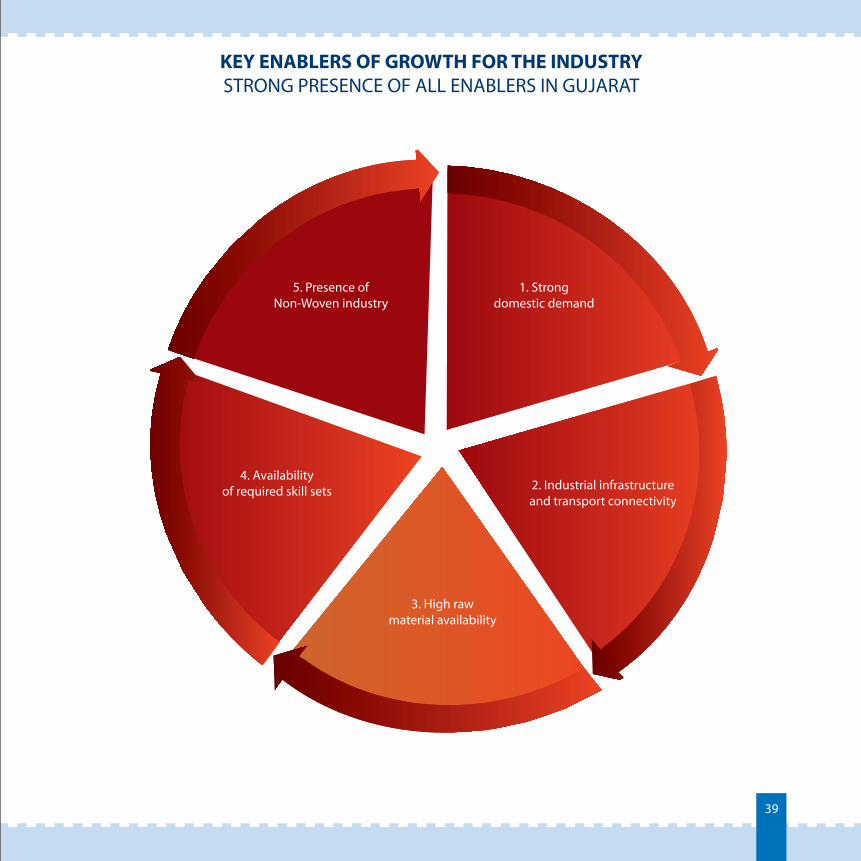
KEY ENABLERS OF GROWTH FOR THE INDUSTRYSTRONG PRESENCE OF ALL ENABLERS IN GUJARAT
4. Availability of required skill sets
1. Strong domestic demand
2. Industrial infrastructure and transport connectivity
3. High raw material availability
5. Presence of Non-Woven industry
40
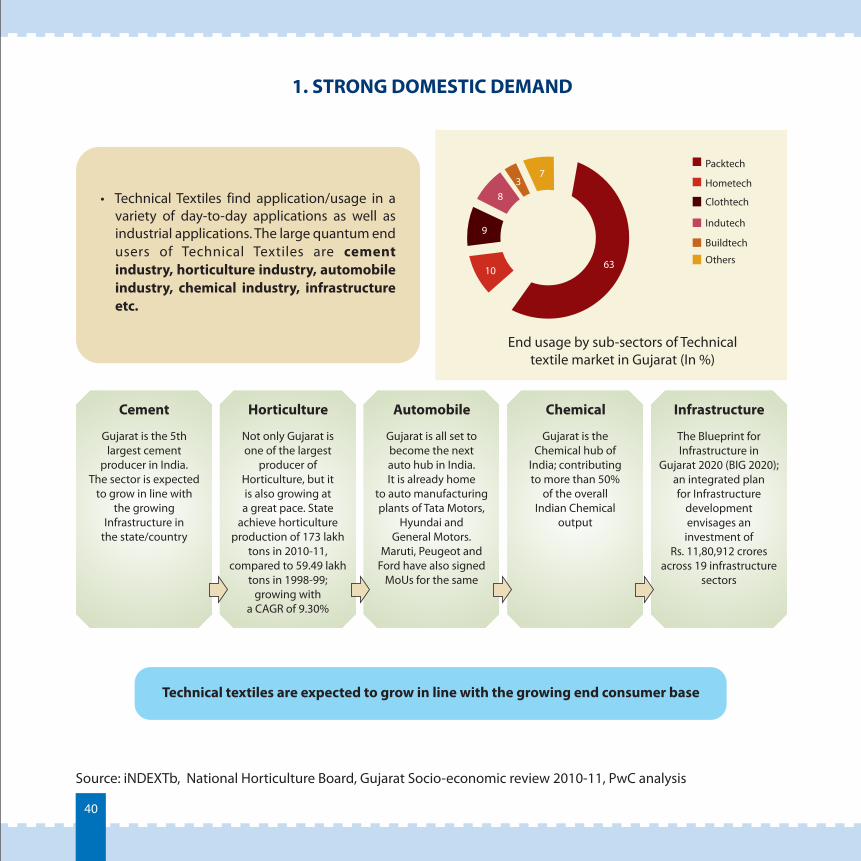
1. STRONG DOMESTIC DEMAND
Source: iNDEXTb, National Horticulture Board, Gujarat Socio-economic review 2010-11, PwC analysis
• Technical Textiles find application/usage in a variety of day-to-day applications as well as industrial applications. The large quantum end users of Technical Textiles are cement industry, horticulture industry, automobile industry, chemical industry, infrastructure etc.
Packtech
Hometech
Clothtech
Indutech
Buildtech
Others6310
9
83
7
End usage by sub-sectors of Technical textile market in Gujarat (In %)
Gujarat is the 5th largest cement
producer in India. The sector is expected
to grow in line with the growing
Infrastructure in the state/country
Not only Gujarat is one of the largest
producer of Horticulture, but it is also growing at a great pace. State
achieve horticulture production of 173 lakh
tons in 2010-11, compared to 59.49 lakh
tons in 1998-99; growing with
a CAGR of 9.30%
Gujarat is all set to become the next auto hub in India. It is already home
to auto manufacturing plants of Tata Motors,
Hyundai and General Motors.
Maruti, Peugeot and Ford have also signed
MoUs for the same
Gujarat is the Chemical hub of
India; contributing to more than 50%
of the overall Indian Chemical
output
The Blueprint for Infrastructure in
Gujarat 2020 (BIG 2020); an integrated planfor Infrastructure
development envisages an investment of
Rs. 11,80,912 crores across 19 infrastructure
sectors
Cement Horticulture Automobile Chemical Infrastructure
Technical textiles are expected to grow in line with the growing end consumer base
41
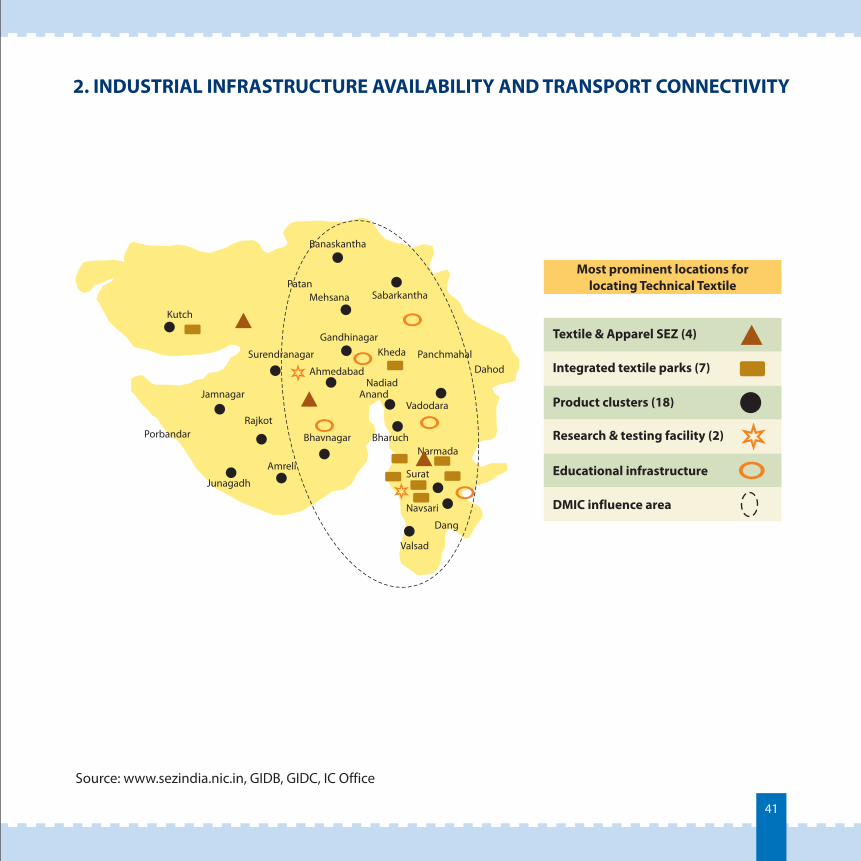
2. INDUSTRIAL INFRASTRUCTURE AVAILABILITY AND TRANSPORT CONNECTIVITY
Kutch
Jamnagar
Porbandar
Junagadh
Amreli
Bhavnagar
Rajkot
Surendranagar
Ahmedabad
Vadodara
Bharuch
Surat
Navsari
Valsad
Gandhinagar
Banaskantha
SabarkanthaPatan
Mehsana
Anand
Dang
DahodPanchmahal
Nadiad
Narmada
Kheda
Source: www.sezindia.nic.in, GIDB, GIDC, IC Office
Most prominent locations for locating Technical Textile
Textile & Apparel SEZ (4)
Integrated textile parks (7)
Product clusters (18)
Research & testing facility (2)
Educational infrastructure
DMIC influence area
42
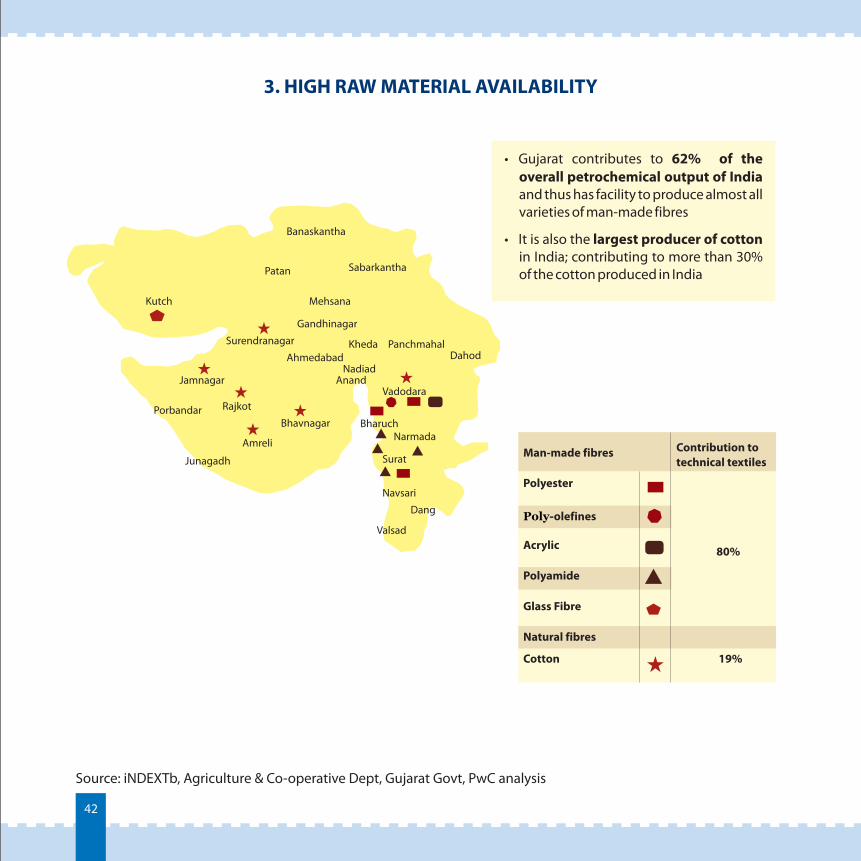
3. HIGH RAW MATERIAL AVAILABILITY
Source: iNDEXTb, Agriculture & Co-operative Dept, Gujarat Govt, PwC analysis
• Gujarat contributes to 62% of the overall petrochemical output of India and thus has facility to produce almost all varieties of man-made fibres
• It is also the largest producer of cotton in India; contributing to more than 30% of the cotton produced in India
Man-made fibres Contribution totechnical textiles
Polyester
Poly-olefines
Acrylic 80%
19%
Polyamide
Glass Fibre
Cotton
Natural fibres
Kutch
Jamnagar
Porbandar
Junagadh
Amreli
Bhavnagar
Rajkot
Surendranagar
Ahmedabad
Vadodara
Bharuch
Surat
Navsari
Valsad
Gandhinagar
Banaskantha
SabarkanthaPatan
Mehsana
Anand
Dang
DahodPanchmahal
Nadiad
Narmada
Kheda
43
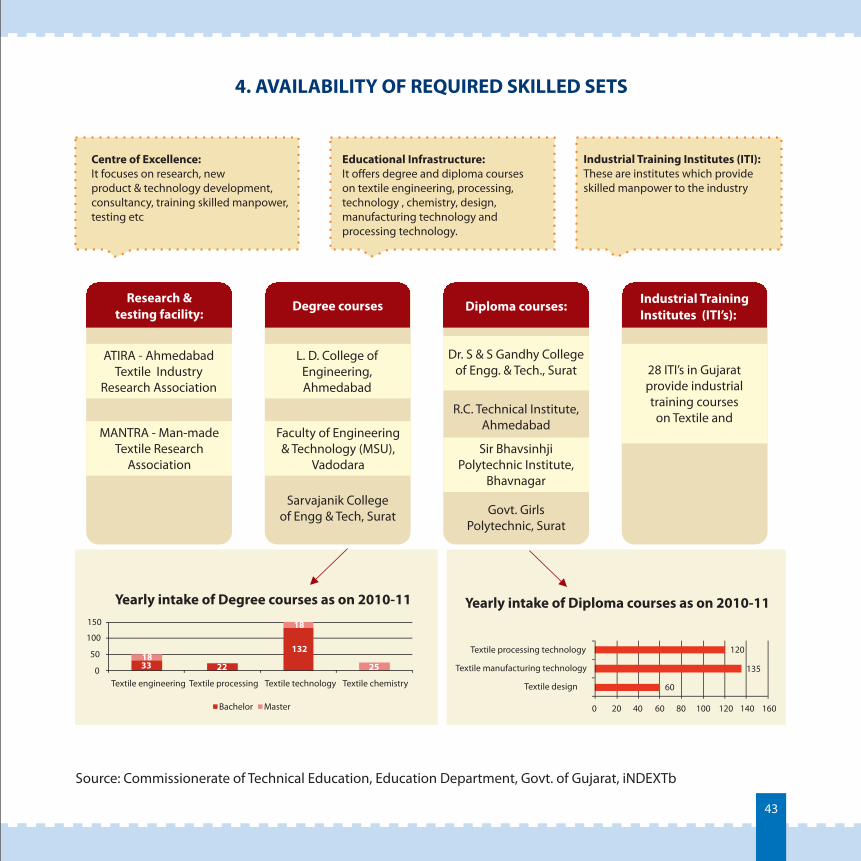
4. AVAILABILITY OF REQUIRED SKILLED SETS
Source: Commissionerate of Technical Education, Education Department, Govt. of Gujarat, iNDEXTb
Centre of Excellence: It focuses on research, newproduct & technology development, consultancy, training skilled manpower,testing etc
Educational Infrastructure:It offers degree and diploma courses on textile engineering, processing,technology , chemistry, design, manufacturing technology and processing technology.
Industrial Training Institutes (ITI):These are institutes which provideskilled manpower to the industry
60
135
120
0 20 40 60 80 100 120 140 160
Textile design
Textile manufacturing technology
Textile processing technology
Yearly intake of Diploma courses as on 2010-11
33 22
13218
18
250
50
100
150
Textile engineering Textile processing Textile technology Textile chemistry
Bachelor Master
Research & testing facility:
Degree courses Diploma courses: Industrial Training Institutes (ITI’s):
ATIRA - AhmedabadTextile Industry
Research Association
L. D. College of Engineering, Ahmedabad
Dr. S & S Gandhy College of Engg. & Tech., Surat 28 ITI’s in Gujarat
provide industrial training courses
on Textile and
Yearly intake of Degree courses as on 2010-11
MANTRA - Man-madeTextile Research
Association
Sarvajanik College of Engg & Tech, Surat Govt. Girls
Polytechnic, Surat
R.C. Technical Institute, AhmedabadFaculty of Engineering
& Technology (MSU),Vadodara
Sir Bhavsinhji Polytechnic Institute,
Bhavnagar
44
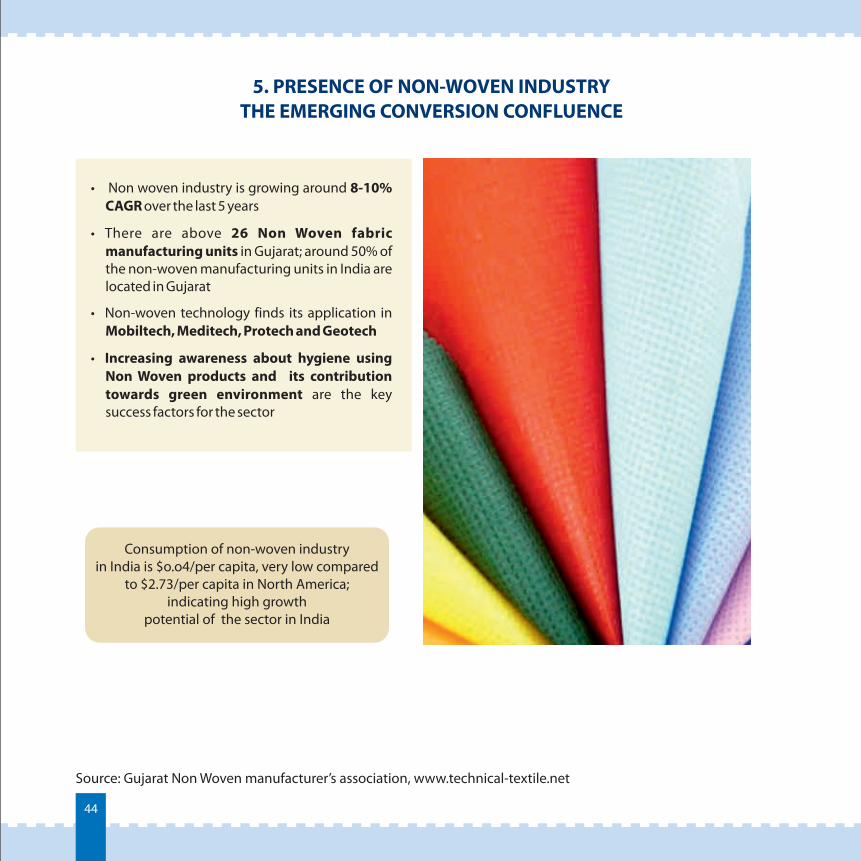
5. PRESENCE OF NON-WOVEN INDUSTRYTHE EMERGING CONVERSION CONFLUENCE
Source: Gujarat Non Woven manufacturer’s association, www.technical-textile.net
• Non woven industry is growing around 8-10% CAGR over the last 5 years
• There are above 26 Non Woven fabric manufacturing units in Gujarat; around 50% of the non-woven manufacturing units in India are located in Gujarat
• Non-woven technology finds its application in Mobiltech, Meditech, Protech and Geotech
• Increasing awareness about hygiene using Non Woven products and its contribution towards green environment are the key success factors for the sector
Consumption of non-woven industry in India is $o.o4/per capita, very low compared
to $2.73/per capita in North America; indicating high growth
potential of the sector in India
45
POLICY INTERVENTIONS
4.2.2
46
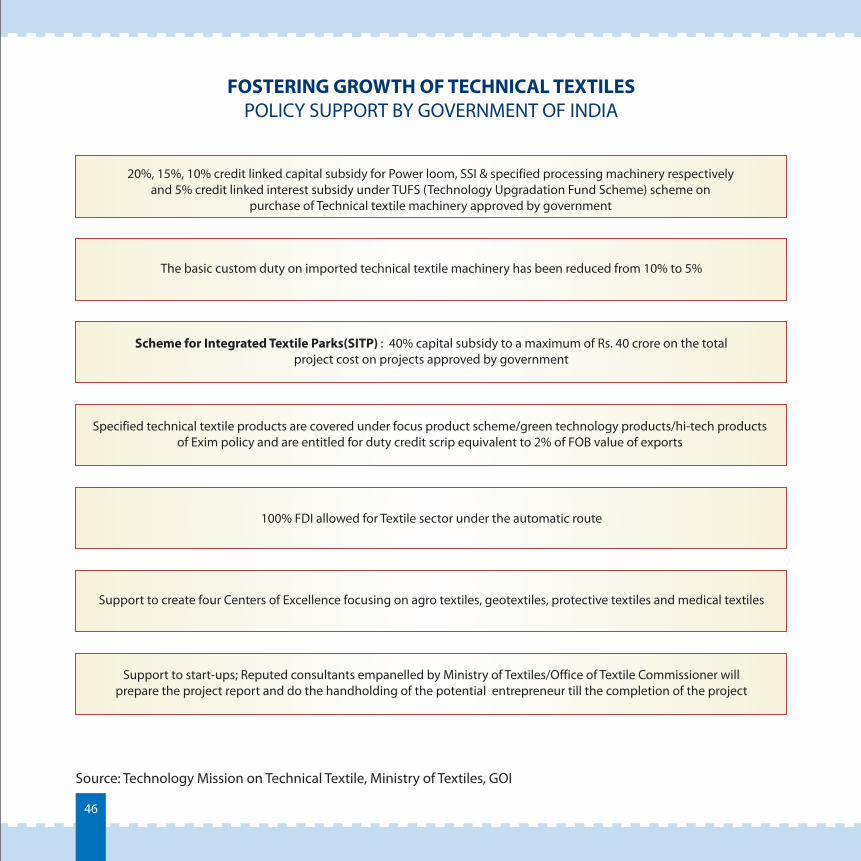
FOSTERING GROWTH OF TECHNICAL TEXTILESPOLICY SUPPORT BY GOVERNMENT OF INDIA
Source: Technology Mission on Technical Textile, Ministry of Textiles, GOI
20%, 15%, 10% credit linked capital subsidy for Power loom, SSI & specified processing machinery respectively and 5% credit linked interest subsidy under TUFS (Technology Upgradation Fund Scheme) scheme on
purchase of Technical textile machinery approved by government
The basic custom duty on imported technical textile machinery has been reduced from 10% to 5%
Scheme for Integrated Textile Parks(SITP) : 40% capital subsidy to a maximum of Rs. 40 crore on the total project cost on projects approved by government
Specified technical textile products are covered under focus product scheme/green technology products/hi-tech products of Exim policy and are entitled for duty credit scrip equivalent to 2% of FOB value of exports
100% FDI allowed for Textile sector under the automatic route
Support to create four Centers of Excellence focusing on agro textiles, geotextiles, protective textiles and medical textiles
Support to start-ups; Reputed consultants empanelled by Ministry of Textiles/Office of Textile Commissioner will prepare the project report and do the handholding of the potential entrepreneur till the completion of the project
47
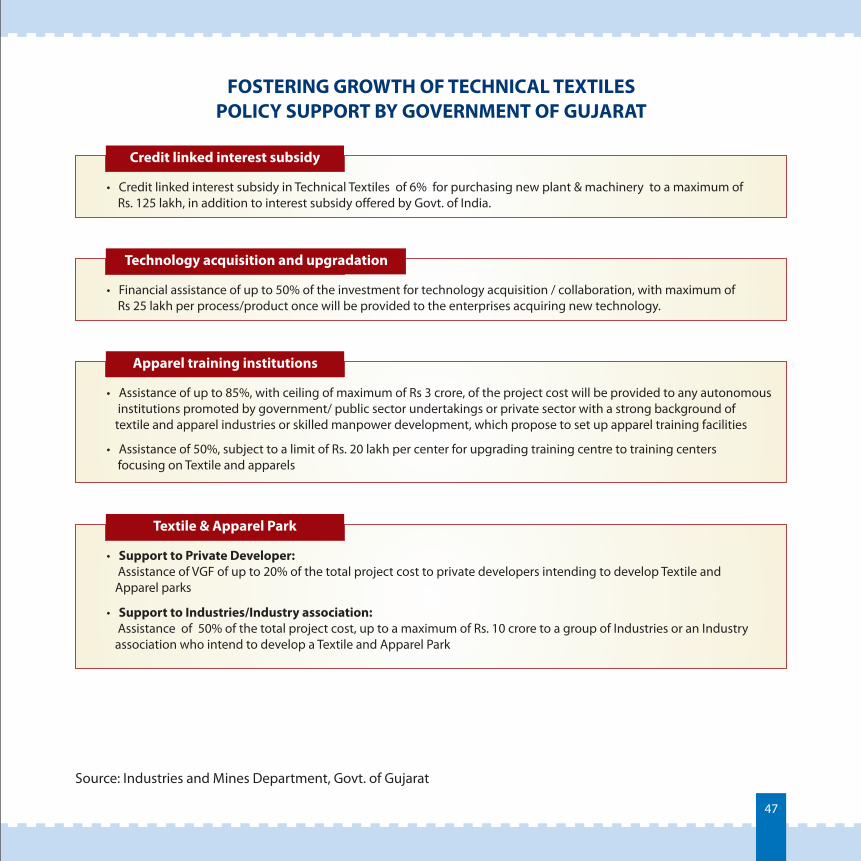
FOSTERING GROWTH OF TECHNICAL TEXTILESPOLICY SUPPORT BY GOVERNMENT OF GUJARAT
• Rs. 125 lakh, in addition to interest subsidy offered by Govt. of India.
Credit linked interest subsidy in Technical Textiles of 6% for purchasing new plant & machinery to a maximum of
Credit linked interest subsidy
• Rs 25 lakh per process/product once will be provided to the enterprises acquiring new technology.
Financial assistance of up to 50% of the investment for technology acquisition / collaboration, with maximum of
Technology acquisition and upgradation
• Assistance of up to 85%, with ceiling of maximum of Rs 3 crore, of the project cost will be provided to any autonomous institutions promoted by government/ public sector undertakings or private sector with a strong background of textile and apparel industries or skilled manpower development, which propose to set up apparel training facilities
Assistance of 50%, subject to a limit of Rs. 20 lakh per center for upgrading training centre to training centers focusing on Textile and apparels•
Apparel training institutions
• Support to Private Developer: Assistance of VGF of up to 20% of the total project cost to private developers intending to develop Textile and Apparel parks
Support to Industries/Industry association: Assistance of 50% of the total project cost, up to a maximum of Rs. 10 crore to a group of Industries or an Industry association who intend to develop a Textile and Apparel Park
•
Textile & Apparel Park
Source: Industries and Mines Department, Govt. of Gujarat
48
GUJARAT SCENARIO - 2017
4.2.3
49
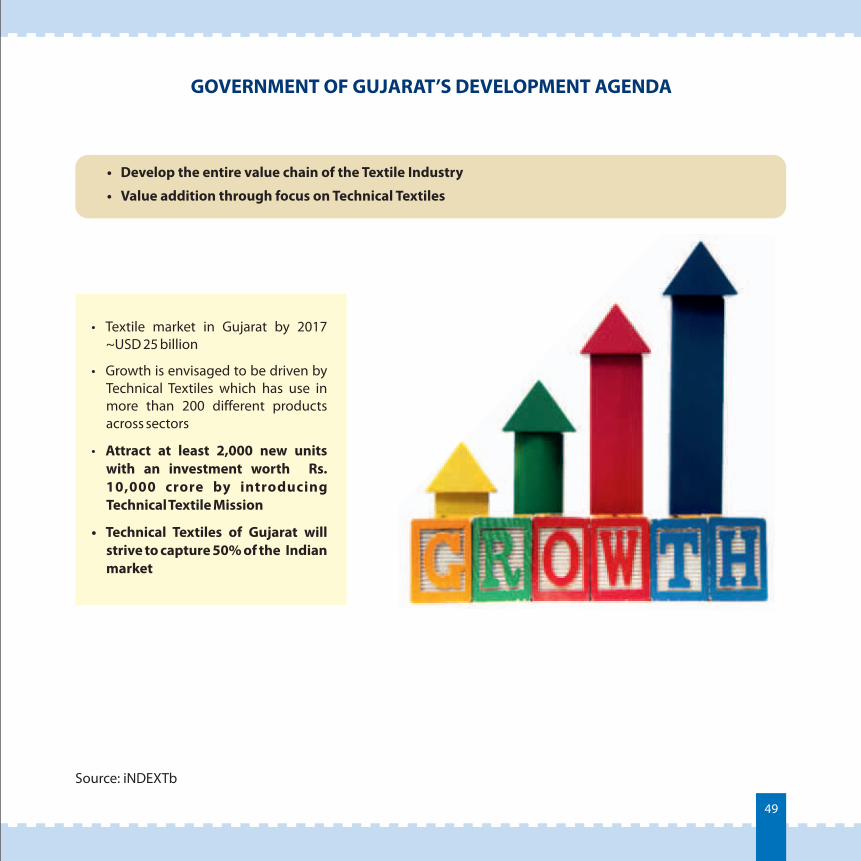
GOVERNMENT OF GUJARAT’S DEVELOPMENT AGENDA
• Develop the entire value chain of the Textile Industry
Value addition through focus on Technical Textiles•
• Textile market in Gujarat by 2017 ~USD 25 billion
• Growth is envisaged to be driven by Technical Textiles which has use in more than 200 different products across sectors
• Attract at least 2,000 new units with an investment worth Rs. 10,000 crore by introducing Technical Textile Mission
• Technical Textiles of Gujarat will strive to capture 50% of the Indian market
Source: iNDEXTb
50
INTERVENTIONS PLANNED
4.2.4
51
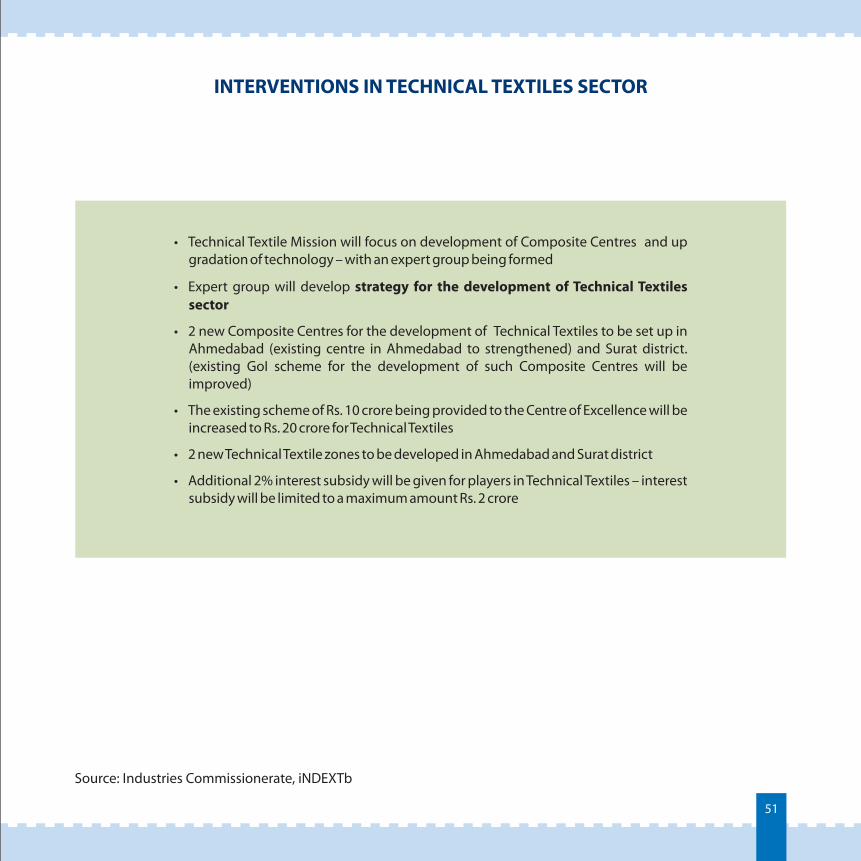
INTERVENTIONS IN TECHNICAL TEXTILES SECTOR
• Technical Textile Mission will focus on development of Composite Centres and up gradation of technology – with an expert group being formed
• Expert group will develop strategy for the development of Technical Textiles sector
• 2 new Composite Centres for the development of Technical Textiles to be set up in Ahmedabad (existing centre in Ahmedabad to strengthened) and Surat district. (existing GoI scheme for the development of such Composite Centres will be improved)
• The existing scheme of Rs. 10 crore being provided to the Centre of Excellence will be increased to Rs. 20 crore for Technical Textiles
• 2 new Technical Textile zones to be developed in Ahmedabad and Surat district
• Additional 2% interest subsidy will be given for players in Technical Textiles – interest subsidy will be limited to a maximum amount Rs. 2 crore
Source: Industries Commissionerate, iNDEXTb
52
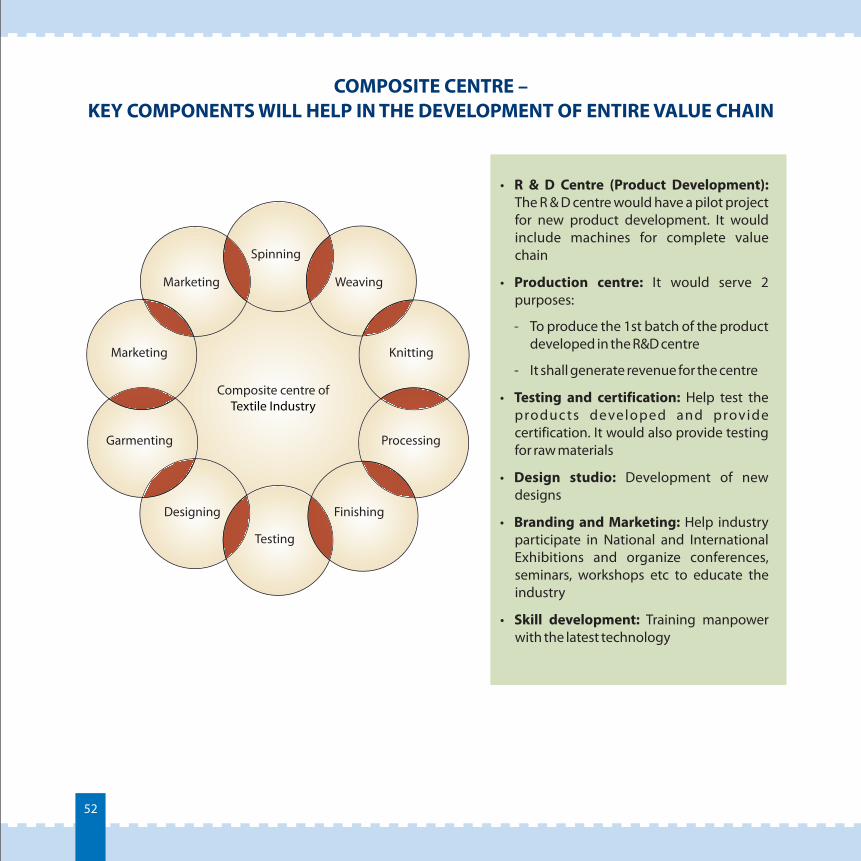
COMPOSITE CENTRE – KEY COMPONENTS WILL HELP IN THE DEVELOPMENT OF ENTIRE VALUE CHAIN
• R & D Centre (Product Development): The R & D centre would have a pilot project for new product development. It would include machines for complete value chain
• Production centre: It would serve 2 purposes:
- To produce the 1st batch of the product developed in the R&D centre
- It shall generate revenue for the centre
• Testing and certification: Help test the produc ts developed and provide certification. It would also provide testing for raw materials
• Design studio: Development of new designs
• Branding and Marketing: Help industry participate in National and International Exhibitions and organize conferences, seminars, workshops etc to educate the industry
• Skill development: Training manpower with the latest technology
Composite centre of Textile Industry
Spinning
Weaving
Knitting
Processing
Finishing
Testing
Designing
Garmenting
Marketing
Marketing
53
INVESTMENT OPPORTUNITIES
4.2.5
54
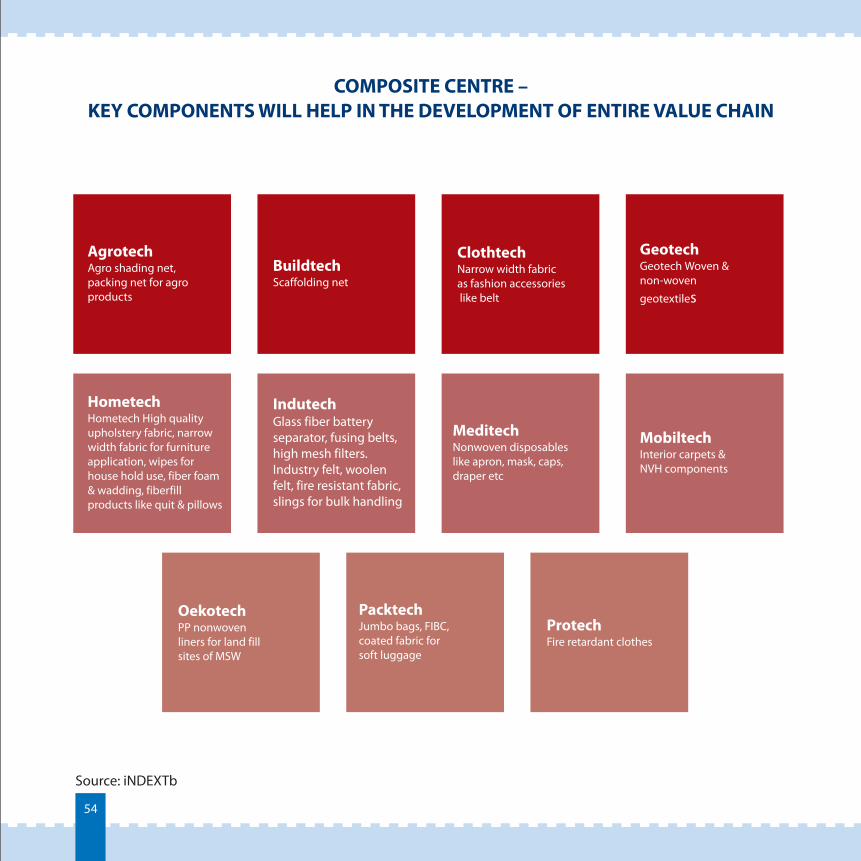
COMPOSITE CENTRE – KEY COMPONENTS WILL HELP IN THE DEVELOPMENT OF ENTIRE VALUE CHAIN
AgrotechAgro shading net, packing net for agro products
BuildtechScaffolding net
ClothtechNarrow width fabric as fashion accessories like belt
GeotechGeotech Woven & non-woven
geotextiles
HometechHometech High quality upholstery fabric, narrowwidth fabric for furniture application, wipes for house hold use, fiber foam& wadding, fiberfill products like quit & pillows
IndutechGlass fiber battery separator, fusing belts, high mesh filters. Industry felt, woolen felt, fire resistant fabric, slings for bulk handling
MeditechNonwoven disposables like apron, mask, caps, draper etc
MobiltechInterior carpets & NVH components
OekotechPP nonwoven liners for land fill sites of MSW
PacktechJumbo bags, FIBC, coated fabric for soft luggage
ProtechFire retardant clothes
Source: iNDEXTb
55
AUTO
4.3
OVERVIEW
4.3.156
AUTOMOTIVE INDUSTRY – GLOBAL SCENARIO
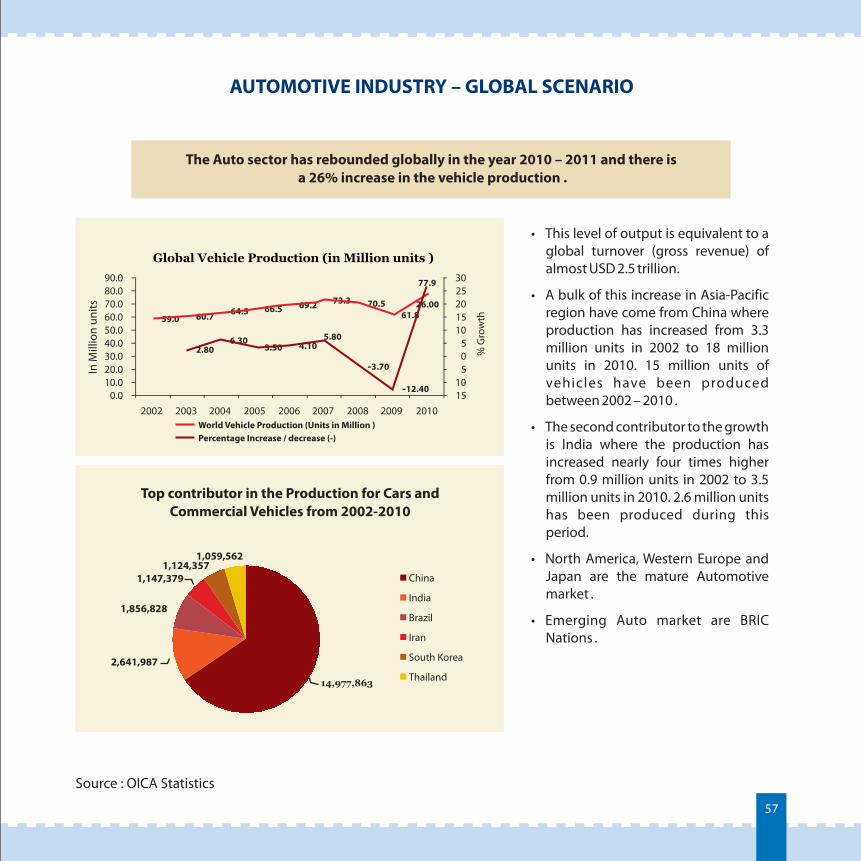
The Auto sector has rebounded globally in the year 2010 – 2011 and there is a 26% increase in the vehicle production .
59.0 60.7 64.5 66.5 69.2 73.3 70.561.8
77.9
2.806.30
3.50 4.105.80
-3.70
-12.40
26.00
-15-10-505
1015202530
0.010.020.030.040.050.060.070.080.090.0
2002 2003 2004 2005 2006 2007 2008 2009 2010
Global Vehicle Production (in Million units )
World Vehicle Production (Units in Million ) Percentage Increase / decrease (-)
• This level of output is equivalent to a global turnover (gross revenue) of almost USD 2.5 trillion.
• A bulk of this increase in Asia-Pacific region have come from China where production has increased from 3.3 million units in 2002 to 18 million units in 2010. 15 million units of vehicles have been produced between 2002 – 2010 .
• The second contributor to the growth is India where the production has increased nearly four times higher from 0.9 million units in 2002 to 3.5 million units in 2010. 2.6 million units has been produced during this period.
• North America, Western Europe and Japan are the mature Automotive market .
• Emerging Auto market are BRIC Nations .
14,977,863
2,641,987
1,856,828
1,147,3791,124,357
1,059,562
Top contributor in the Production for Cars andCommercial Vehicles from 2002-2010
China
India
Brazil
Iran
South Korea
Thailand
In M
illio
n un
its
% G
row
th
Source : OICA Statistics
57
58
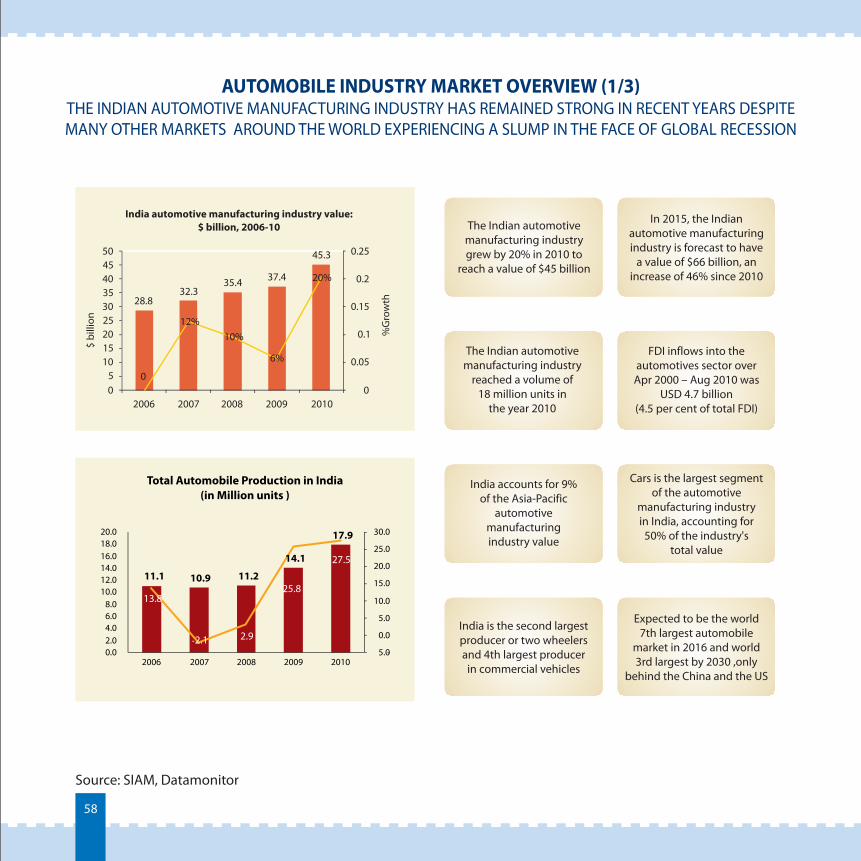
AUTOMOBILE INDUSTRY MARKET OVERVIEW (1/3)THE INDIAN AUTOMOTIVE MANUFACTURING INDUSTRY HAS REMAINED STRONG IN RECENT YEARS DESPITE MANY OTHER MARKETS AROUND THE WORLD EXPERIENCING A SLUMP IN THE FACE OF GLOBAL RECESSION
Source: SIAM, Datamonitor
28.832.3
35.4 37.4
45.3
00
0.05
0.1
0.15
0.2
0.25
05
101520253035404550
2006 2007 2008 2009 2010
India automotive manufacturing industry value:$ billion, 2006-10
11.1 10.9 11.2
17.9
27.5
-5.0
0.0
5.0
10.0
15.0
20.0
25.0
30.0
0.02.04.06.08.0
10.012.014.016.018.020.0
Total Automobile Production in India (in Million units )
The Indian automotive manufacturing industry grew by 20% in 2010 to
reach a value of $45 billion
In 2015, the Indian automotive manufacturing industry is forecast to have
a value of $66 billion, an increase of 46% since 2010
The Indian automotive manufacturing industry
reached a volume of 18 million units in
the year 2010
FDI inflows into the automotives sector over
Apr 2000 – Aug 2010 was USD 4.7 billion
(4.5 per cent of total FDI)
India accounts for 9% of the Asia-Pacific
automotive manufacturing industry value
Cars is the largest segment of the automotive
manufacturing industry in India, accounting for 50% of the industry's
total value
India is the second largest producer or two wheelers and 4th largest producer
in commercial vehicles
Expected to be the world 7th largest automobile
market in 2016 and world 3rd largest by 2030 ,only
behind the China and the US
%G
row
th
$ bi
llion 12%
10%
6%
20%
2010
14.1
25.8
2009
2.1 2.9
2007 2008
13.8
2006
-
59
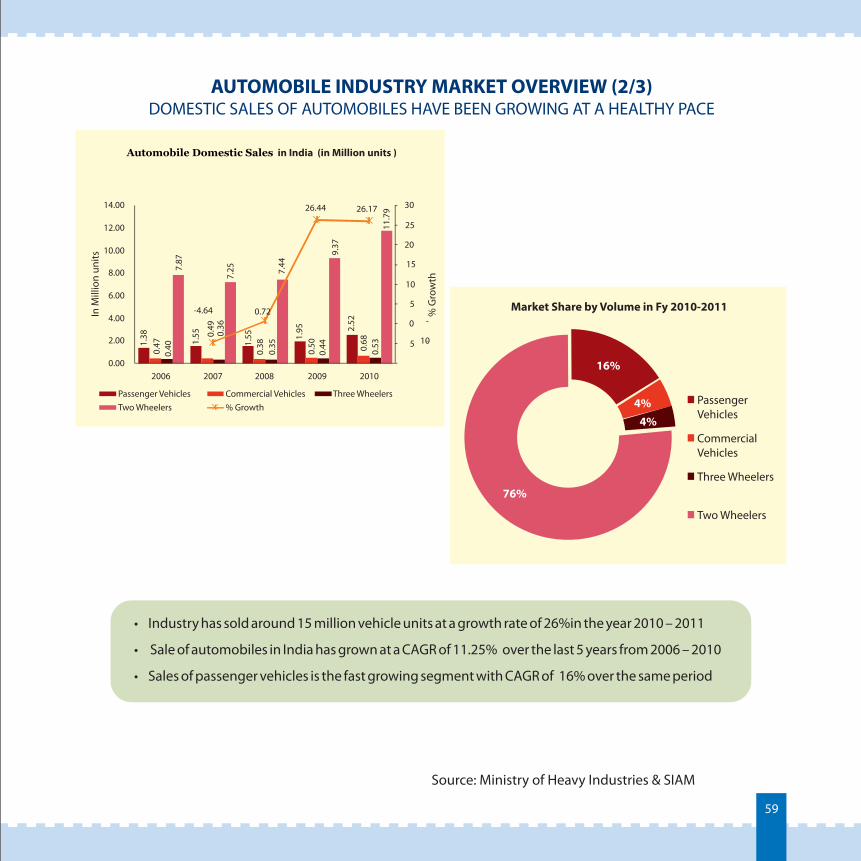
AUTOMOBILE INDUSTRY MARKET OVERVIEW (2/3)DOMESTIC SALES OF AUTOMOBILES HAVE BEEN GROWING AT A HEALTHY PACE
7.87
-10
-
5
0
5
10
15
20
25
30
0.00
2.00
4.00
6.00
8.00
10.00
12.00
14.00
2006 2007 2008 2009 2010
Automobile Domestic Sales in India (in Million units )
Passenger Vehicles Commercial Vehicles Three WheelersTwo Wheelers % Growth
Market Share by Volume in Fy 2010-2011
Passenger Vehicles
Commercial Vehicles
Three Wheelers
Two Wheelers
Source: Ministry of Heavy Industries & SIAM
• Industry has sold around 15 million vehicle units at a growth rate of 26%in the year 2010 – 2011
• Sale of automobiles in India has grown at a CAGR of 11.25% over the last 5 years from 2006 – 2010
• Sales of passenger vehicles is the fast growing segment with CAGR of 16% over the same period
In M
illio
n un
its
1.38
0.47
0.40 1.
55
-4.64
0.49
0.36
7.25
1.55
0.72
0.38
0.35
1.95
0.50
0.44
7.44
9.37
2.52
0.68
0.53
26.1726.44
11.7
9
% G
row
th
16%
4%4%
76%
60
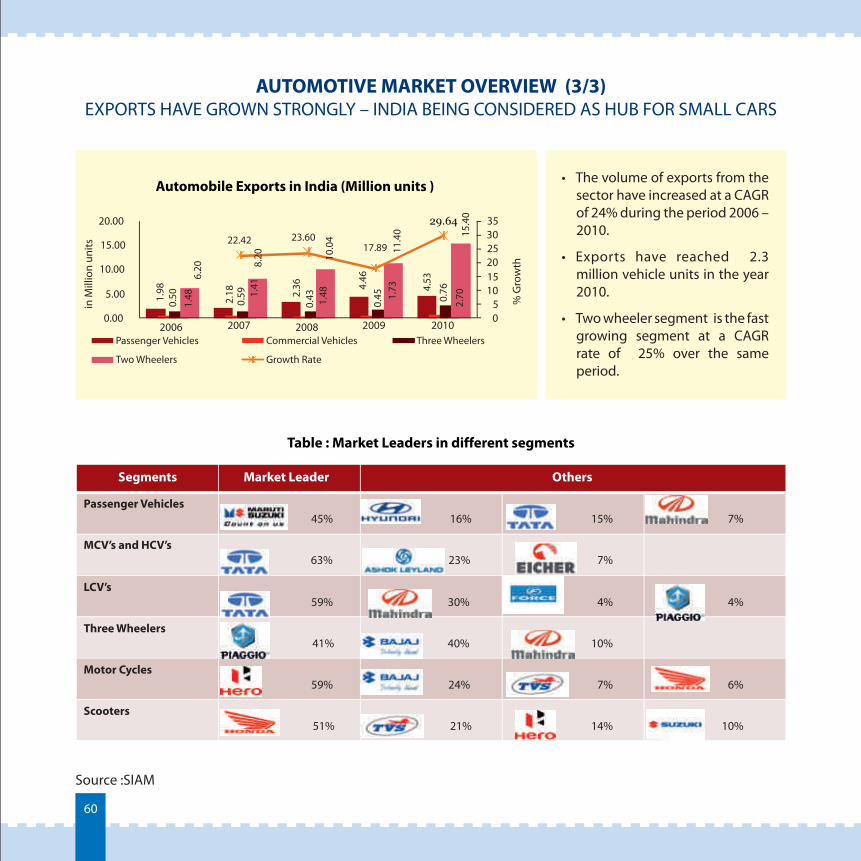
AUTOMOTIVE MARKET OVERVIEW (3/3)EXPORTS HAVE GROWN STRONGLY – INDIA BEING CONSIDERED AS HUB FOR SMALL CARS
29.64
05
101520253035
0.00
5.00
10.00
15.00
20.00
2006 2007 2008 2009 2010
Automobile Exports in India (Million units )
Passenger Vehicles Commercial Vehicles Three Wheelers
Two Wheelers Growth Rate
• The volume of exports from the sector have increased at a CAGR of 24% during the period 2006 – 2010.
• Exports have reached 2.3 million vehicle units in the year 2010.
• Two wheeler segment is the fast growing segment at a CAGR rate of 25% over the same period.
Source :SIAM
Segments Market Leader Others
Passenger Vehicles 45% 16% 15% 7%
MCV’s and HCV’s63% 23% 7%
LCV’s59% 30% 4% 4%
Three Wheelers41% 40% 10%
Motor Cycles59% 24% 7% 6%
Scooters51% 21% 14% 10%
Table : Market Leaders in different segments
in M
illio
n un
its
% G
row
th
1.98
0.50
1.48
6.20
2.18
0.59 1.
4122.42
8.20
2.36
0.43 1.48
23.60
10.0
4
4.46
0.45
17.89
1.73
11.4
0
4.53
0.76
2.70
15.4
0
61
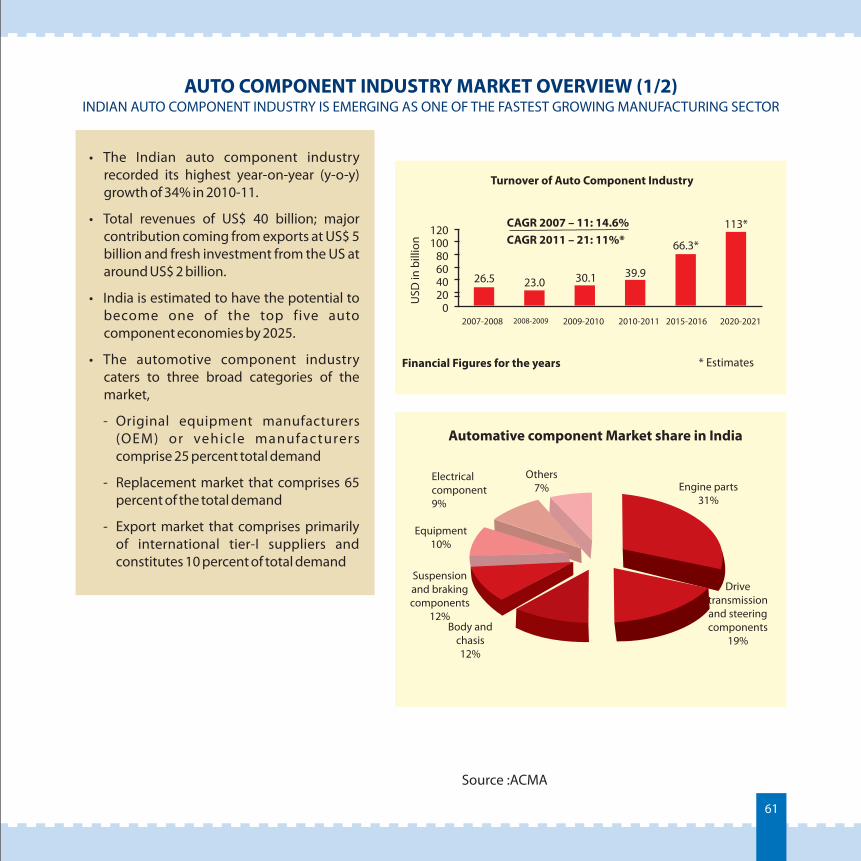
AUTO COMPONENT INDUSTRY MARKET OVERVIEW (1/2)INDIAN AUTO COMPONENT INDUSTRY IS EMERGING AS ONE OF THE FASTEST GROWING MANUFACTURING SECTOR
• The Indian auto component industry recorded its highest year-on-year (y-o-y) growth of 34% in 2010-11.
• Total revenues of US$ 40 billion; major contribution coming from exports at US$ 5 billion and fresh investment from the US at around US$ 2 billion.
• India is estimated to have the potential to become one of the top five auto component economies by 2025.
• The automotive component industry caters to three broad categories of the market,
- Original equipment manufacturers (OEM) or vehicle manufacturers comprise 25 percent total demand
- Replacement market that comprises 65 percent of the total demand
- Export market that comprises primarily of international tier-I suppliers and constitutes 10 percent of total demand
Source :ACMA
120100
80604020
02007-2008 2008-2009 2009-2010 2010-2011 2015-2016 2020-2021
23.0 30.1 39.9
66.3*
113*CAGR 2007 – 11: 14.6% CAGR 2011 – 21: 11%*
USD
in b
illio
n
Turnover of Auto Component Industry
* EstimatesFinancial Figures for the years
Automative component Market share in India
Electricalcomponent9%
Others7%
Equipment10%
Suspensionand brakingcomponents
12%Body and
chasis12%
Drivetransmissionand steeringcomponents
19%
Engine parts31%
26.5
62
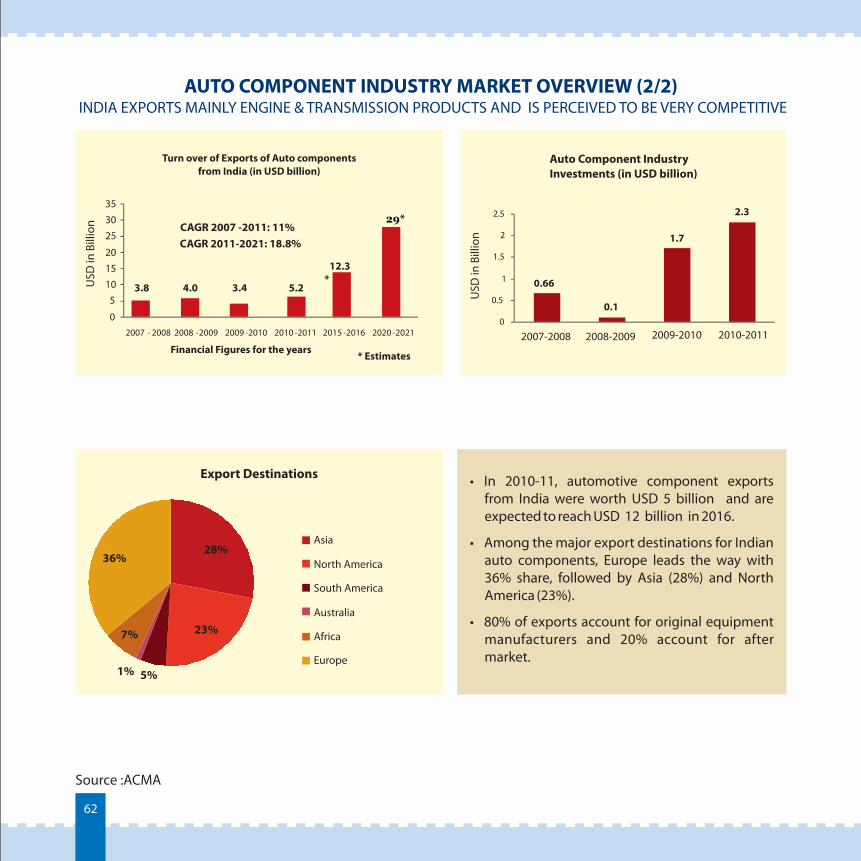
AUTO COMPONENT INDUSTRY MARKET OVERVIEW (2/2) INDIA EXPORTS MAINLY ENGINE & TRANSMISSION PRODUCTS AND IS PERCEIVED TO BE VERY COMPETITIVE
Turn over of Exports of Auto components from India (in USD billion)
0
5101520
253035
2007 - 2008 2008 -2009 2009 -2010 2010 -2011 2015 -2016 2020 -2021
Financial Figures for the years
3.44.03.8 5.2
29*
12.3*
* Estimates
CAGR 2007 -2011: 11%CAGR 2011-2021: 18.8%
Source :ACMA
28%
23%
5%1%
7%
36%
Export Destinations
Asia
North America
South America
Australia
Africa
Europe
• In 2010-11, automotive component exports from India were worth USD 5 billion and are expected to reach USD 12 billion in 2016.
• Among the major export destinations for Indian auto components, Europe leads the way with 36% share, followed by Asia (28%) and North America (23%).
• 80% of exports account for original equipment manufacturers and 20% account for after market.
0.66
0.1
1.7
2.3
0
0.5
1
1.5
2
2.5
2007-2008 2008-2009 2009-2010 2010-2011
Auto Component Industry Investments (in USD billion)
USD
in B
illio
n
USD
in B
illio
n
63
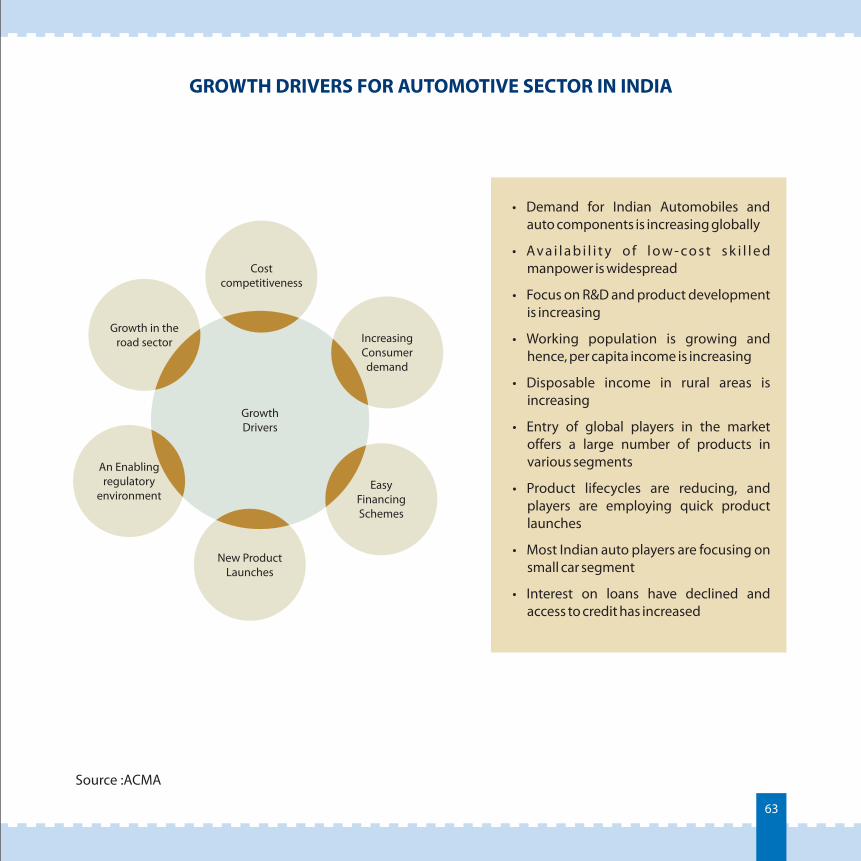
GROWTH DRIVERS FOR AUTOMOTIVE SECTOR IN INDIA
Source :ACMA
• Demand for Indian Automobiles and auto components is increasing globally
• Av a i l a b i l i t y o f l ow - co s t s k i l l e d manpower is widespread
• Focus on R&D and product development is increasing
• Working population is growing and hence, per capita income is increasing
• Disposable income in rural areas is increasing
• Entry of global players in the market offers a large number of products in various segments
• Product lifecycles are reducing, and players are employing quick product launches
• Most Indian auto players are focusing on small car segment
• Interest on loans have declined and access to credit has increased
Cost competitiveness
Increasing Consumer demand
Easy Financing Schemes
Growth in the road sector
An Enabling regulatory
environment
New Product Launches
Growth Drivers
64
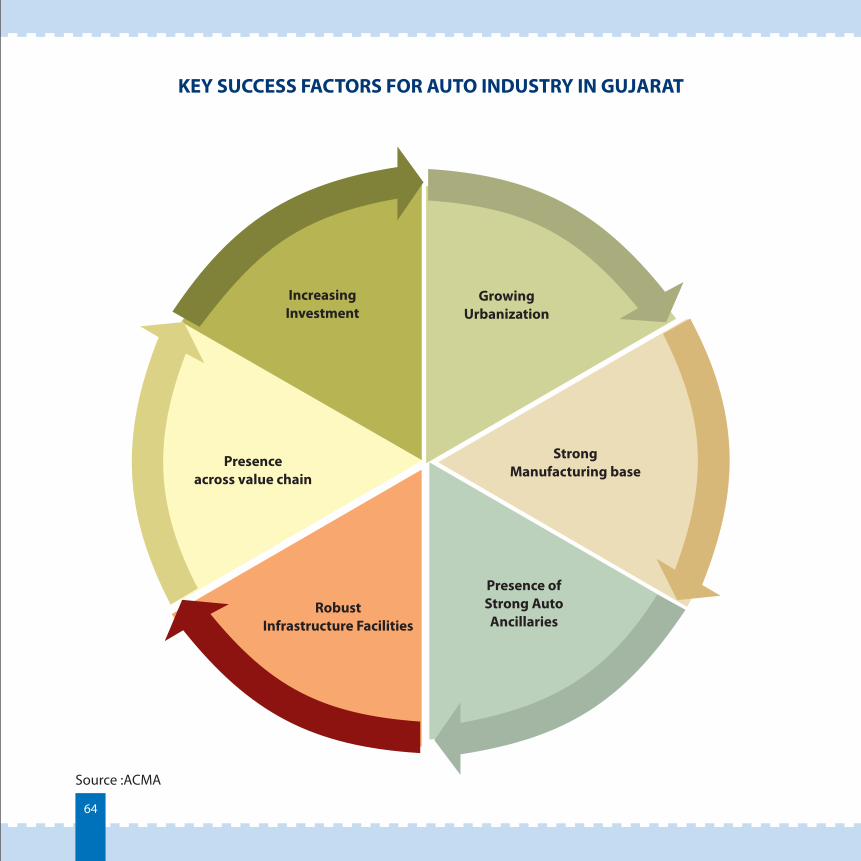
KEY SUCCESS FACTORS FOR AUTO INDUSTRY IN GUJARAT
Source :ACMA
Growing Urbanization
Strong Manufacturing base
Increasing Investment
Presence across value chain
Robust Infrastructure Facilities
Presence of Strong AutoAncillaries
65
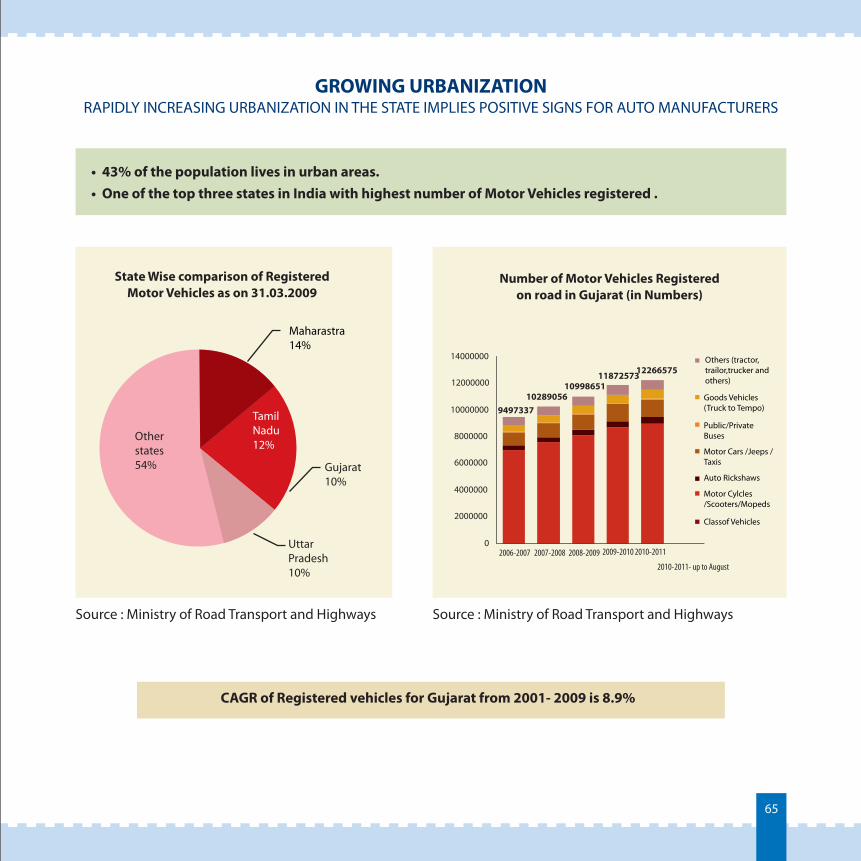
GROWING URBANIZATION RAPIDLY INCREASING URBANIZATION IN THE STATE IMPLIES POSITIVE SIGNS FOR AUTO MANUFACTURERS
Source : Ministry of Road Transport and Highways
• 43% of the population lives in urban areas.• One of the top three states in India with highest number of Motor Vehicles registered .
State Wise comparison of RegisteredMotor Vehicles as on 31.03.2009
0
2000000
4000000
6000000
8000000
10000000
12000000
14000000
2006-2007 2007-2008 2008-2009 2009-2010 2010-2011
Number of Motor Vehicles Registered on road in Gujarat (in Numbers)
Others (tractor,trailor,trucker andothers)
Goods Vehicles(Truck to Tempo)
Public/PrivateBuses
Motor Cars /Jeeps /Taxis
Auto Rickshaws
Motor Cylcles/Scooters/Mopeds
Classof Vehicles
1187257310998651
10289056
12266575
2010-2011- up to August
9497337
CAGR of Registered vehicles for Gujarat from 2001- 2009 is 8.9%
Source : Ministry of Road Transport and Highways
Maharastra14%
Otherstates54%
TamilNadu12%
Gujarat10%
UttarPradesh10%
66
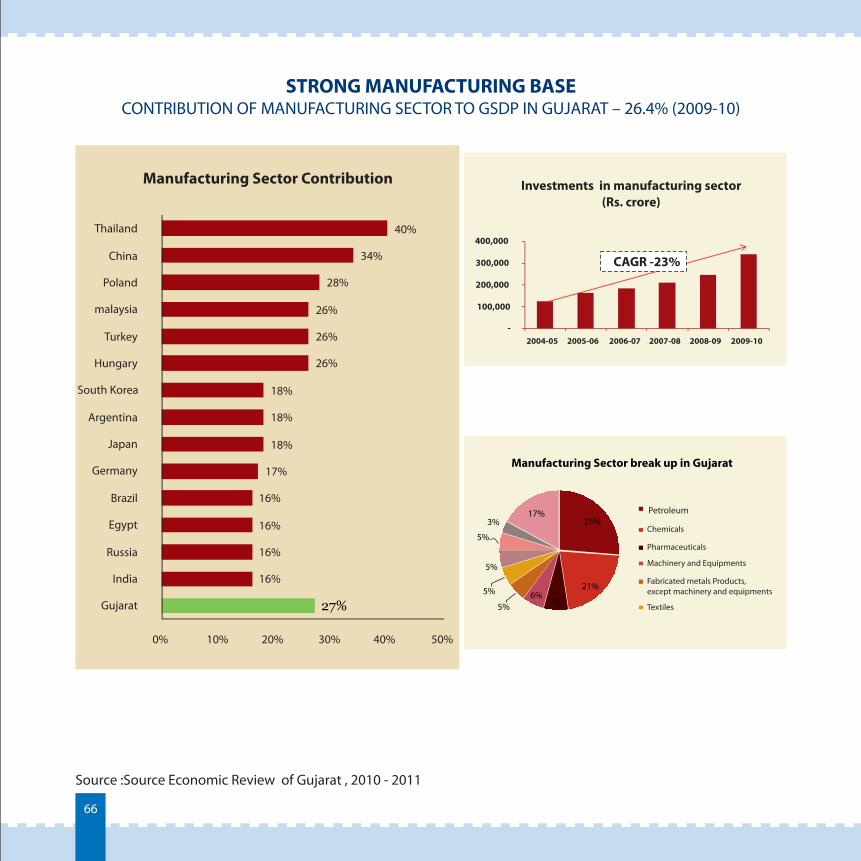
STRONG MANUFACTURING BASECONTRIBUTION OF MANUFACTURING SECTOR TO GSDP IN GUJARAT – 26.4% (2009-10)
Source :Source Economic Review of Gujarat , 2010 - 2011
27%
16%
16%
16%
16%
17%
18%
18%
18%
26%
26%
26%
28%
34%
40%
0% 10% 20% 30% 40% 50%
Gujarat
India
Russia
Egypt
Brazil
Germany
Japan
Argentina
South Korea
Hungary
Turkey
malaysia
Poland
China
Thailand
Manufacturing Sector Contribution
-
100,000
200,000
300,000
400,000
2004-05 2005-06 2006-07 2007-08 2008-09 2009-10
Investments sector(Rs. crore) in manufacturing
26%
21%
7%6%
5%
5%
5%
5%
3%17%
Manufacturing Sector break up in Gujarat
Petroleum
Chemicals
Pharmaceuticals
Machinery and Equipments
Fabricated metals Products,except machinery and equipments
Textiles
CAGR -23%
67
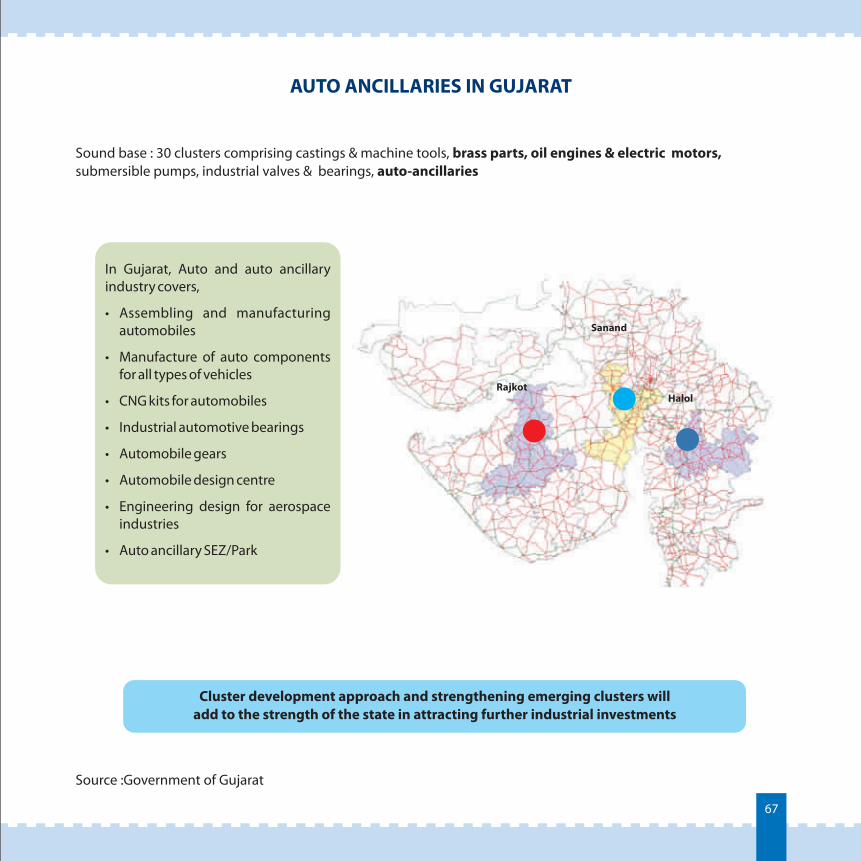
AUTO ANCILLARIES IN GUJARAT
Source :Government of Gujarat
Sound base : 30 clusters comprising castings & machine tools, brass parts, oil engines & electric motors, submersible pumps, industrial valves & bearings, auto-ancillaries
In Gujarat, Auto and auto ancillary industry covers,
• Assembling and manufacturing automobiles
• Manufacture of auto components for all types of vehicles
• CNG kits for automobiles
• Industrial automotive bearings
• Automobile gears
• Automobile design centre
• Engineering design for aerospace industries
• Auto ancillary SEZ/Park
Rajkot
Sanand
Halol
Cluster development approach and strengthening emerging clusters will add to the strength of the state in attracting further industrial investments
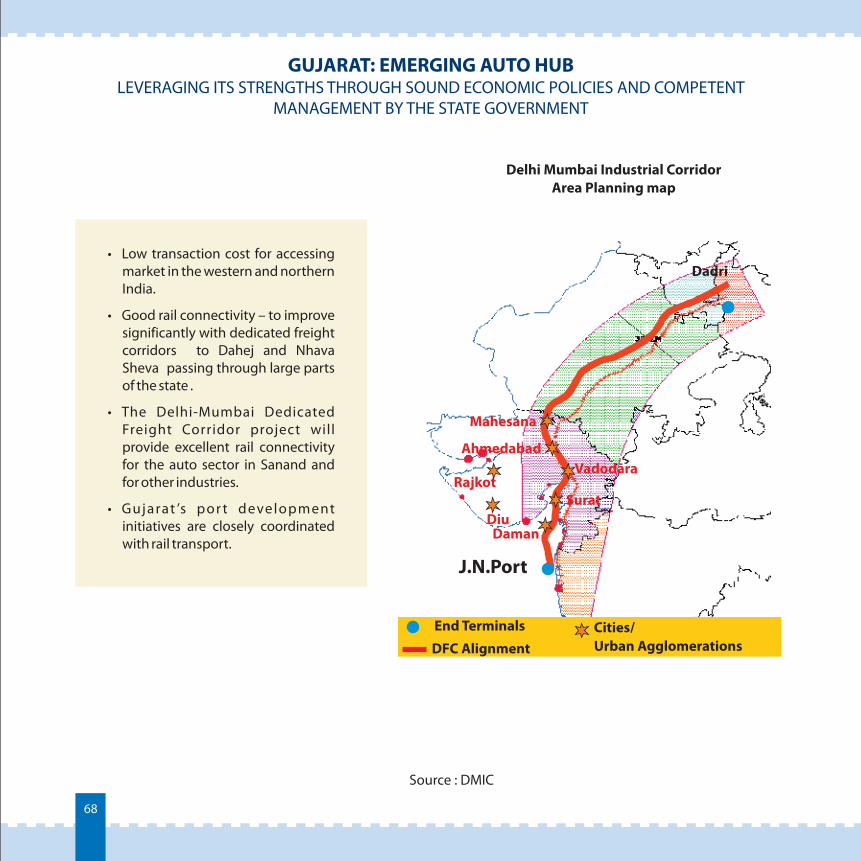
GUJARAT: EMERGING AUTO HUB LEVERAGING ITS STRENGTHS THROUGH SOUND ECONOMIC POLICIES AND COMPETENT
MANAGEMENT BY THE STATE GOVERNMENT
Source : DMIC
• Low transaction cost for accessing market in the western and northern India.
• Good rail connectivity – to improve significantly with dedicated freight corridors to Dahej and Nhava Sheva passing through large parts of the state .
• The Delhi-Mumbai Dedicated Freight Corridor project will provide excellent rail connectivity for the auto sector in Sanand and for other industries.
• Gujarat ’s por t development initiatives are closely coordinated with rail transport.
Delhi Mumbai Industrial Corridor Area Planning map
Dadri
J.N.Port
Daman
SuratRajkot
AhmedabadVadodara
Mahesana `
End Terminals
DFC AlignmentCities/ Urban Agglomerations
Diu
68
69
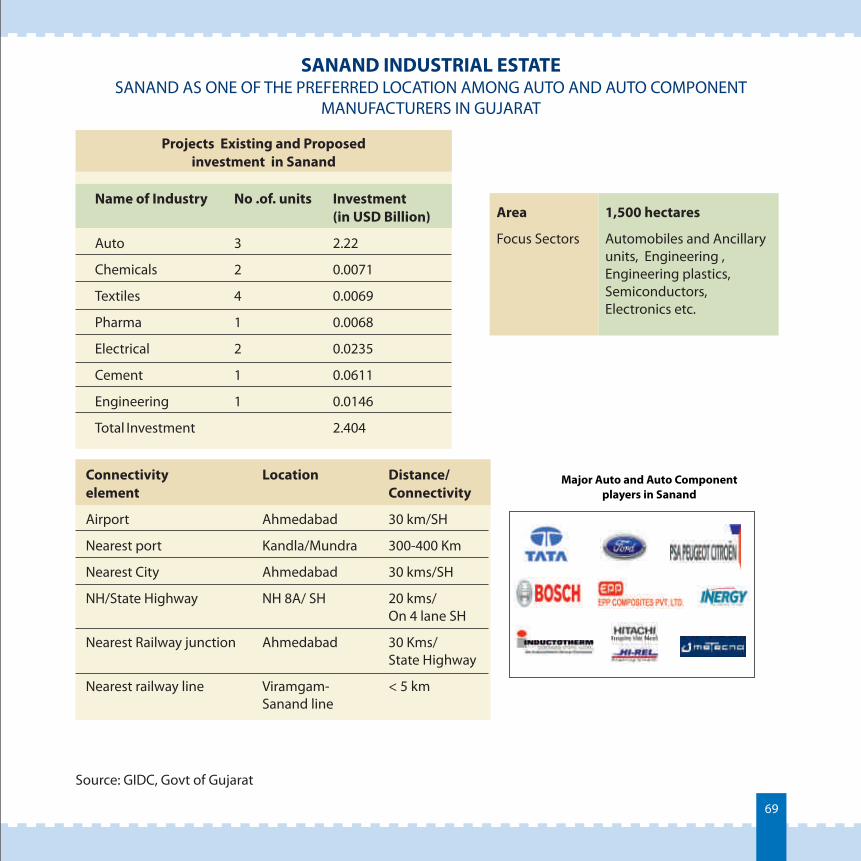
SANAND INDUSTRIAL ESTATE SANAND AS ONE OF THE PREFERRED LOCATION AMONG AUTO AND AUTO COMPONENT
MANUFACTURERS IN GUJARAT
Source: GIDC, Govt of Gujarat
Area 1,500 hectares
Focus Sectors Automobiles and Ancillary units, Engineering , Engineering plastics, Semiconductors, Electronics etc.
Major Auto and Auto Component players in Sanand
Projects Existing and Proposed investment in Sanand
Name of Industry No .of. units Investment (in USD Billion)
Auto 3 2.22
Chemicals 2 0.0071
Textiles 4 0.0069
Pharma 1 0.0068
Electrical 2 0.0235
Cement 1 0.0611
Engineering 1 0.0146
Total Investment 2.404
Connectivity element Connectivity
Airport Ahmedabad 30 km/SH
Nearest port Kandla/Mundra 300-400 Km
Nearest City Ahmedabad 30 kms/SH
NH/State Highway NH 8A/ SH 20 kms/ On 4 lane SH
Nearest Railway junction Ahmedabad 30 Kms/ State Highway
Nearest railway line Viramgam-Sanand line
Location Distance/
< 5 km
70
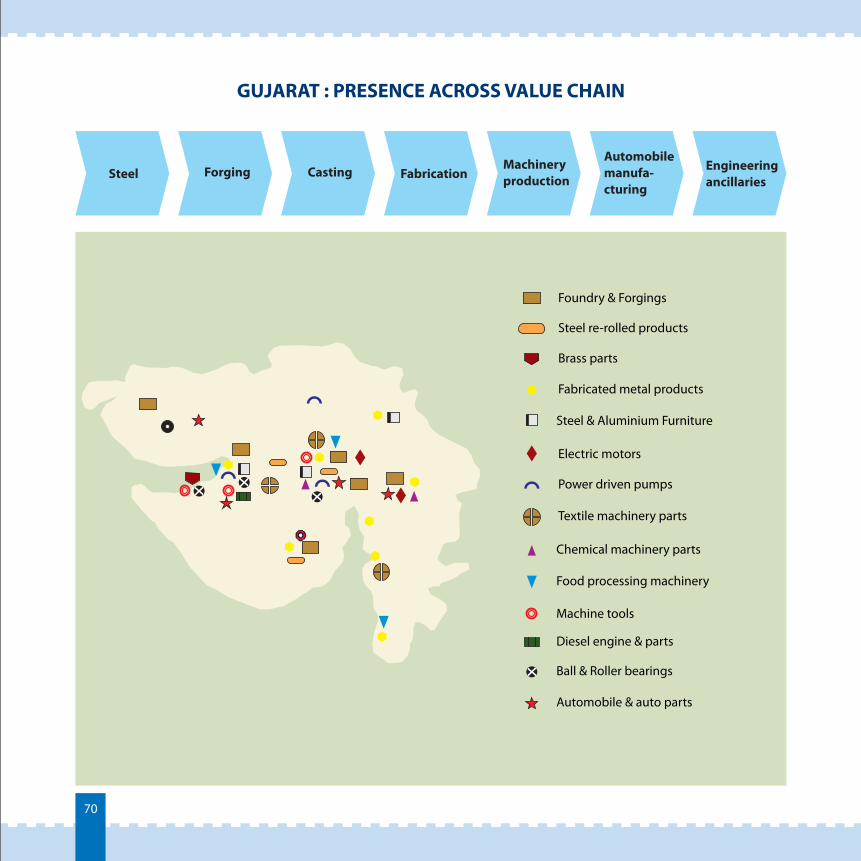
GUJARAT : PRESENCE ACROSS VALUE CHAIN
Foundry & Forgings
Steel re-rolled products
Brass parts
Fabricated metal products
Steel & Aluminium Furniture
Electric motors
Power driven pumps
Textile machinery parts
Chemical machinery parts
Food processing machinery
Machine tools
Diesel engine & parts
Ball & Roller bearings
Automobile & auto parts
Steel Forging Casting FabricationMachinery production
Automobilemanufa-cturing
Engineering ancillaries
71
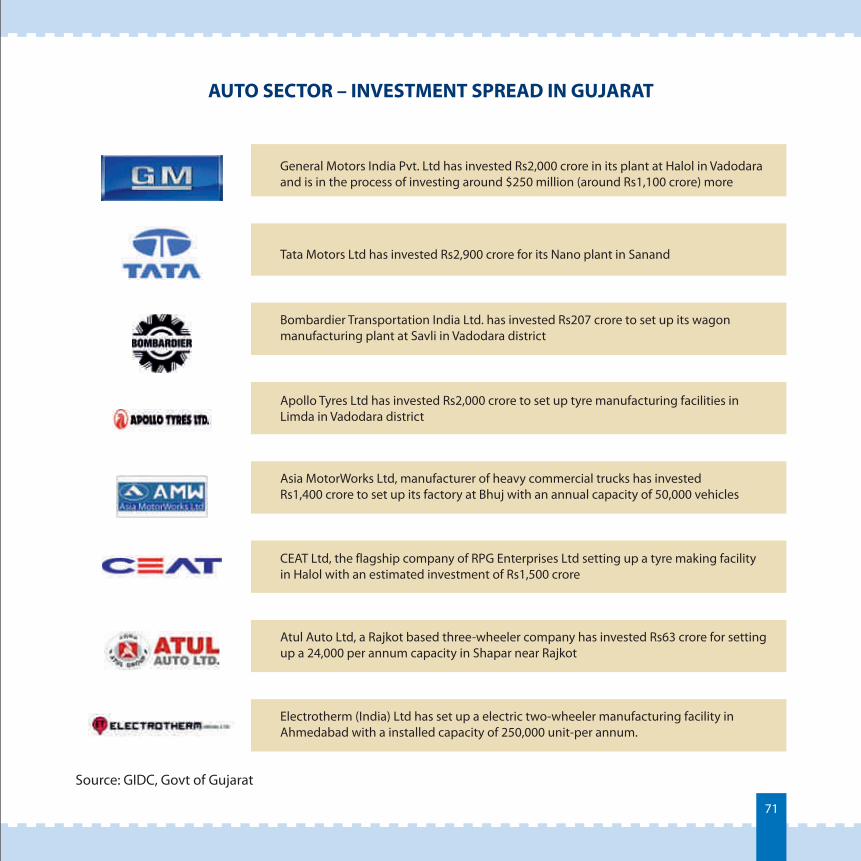
AUTO SECTOR – INVESTMENT SPREAD IN GUJARAT
Source: GIDC, Govt of Gujarat
General Motors India Pvt. Ltd has invested Rs2,000 crore in its plant at Halol in Vadodara and is in the process of investing around $250 million (around Rs1,100 crore) more
Tata Motors Ltd has invested Rs2,900 crore for its Nano plant in Sanand
Bombardier Transportation India Ltd. has invested Rs207 crore to set up its wagon manufacturing plant at Savli in Vadodara district
Apollo Tyres Ltd has invested Rs2,000 crore to set up tyre manufacturing facilities in Limda in Vadodara district
Asia MotorWorks Ltd, manufacturer of heavy commercial trucks has investedRs1,400 crore to set up its factory at Bhuj with an annual capacity of 50,000 vehicles
CEAT Ltd, the flagship company of RPG Enterprises Ltd setting up a tyre making facility in Halol with an estimated investment of Rs1,500 crore
Atul Auto Ltd, a Rajkot based three-wheeler company has invested Rs63 crore for settingup a 24,000 per annum capacity in Shapar near Rajkot
Electrotherm (India) Ltd has set up a electric two-wheeler manufacturing facility in Ahmedabad with a installed capacity of 250,000 unit-per annum.
Hindustan Aeronautics Ltd is in talks with the state for setting up a USD 0.88 billion project for design, development, manufacture, repair and overhaul of aircraft, aero engines and helicopters
72
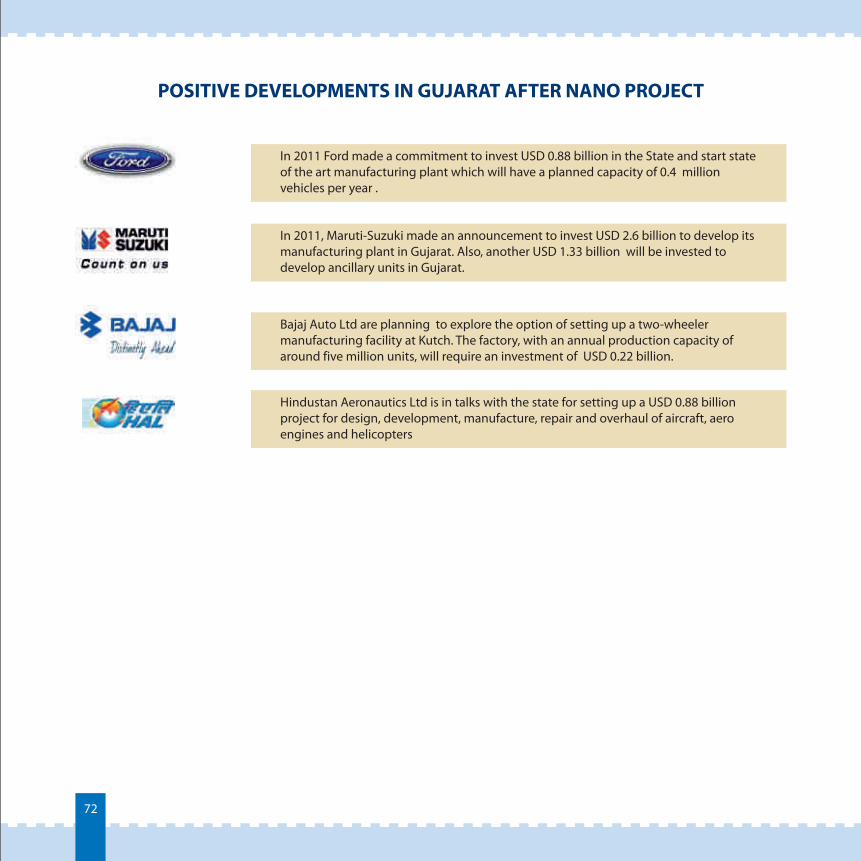
POSITIVE DEVELOPMENTS IN GUJARAT AFTER NANO PROJECT
In 2011 Ford made a commitment to invest USD 0.88 billion in the State and start state of the art manufacturing plant which will have a planned capacity of 0.4 million vehicles per year .
In 2011, Maruti-Suzuki made an announcement to invest USD 2.6 billion to develop its manufacturing plant in Gujarat. Also, another USD 1.33 billion will be invested to develop ancillary units in Gujarat.
Bajaj Auto Ltd are planning to explore the option of setting up a two-wheeler manufacturing facility at Kutch. The factory, with an annual production capacity ofaround five million units, will require an investment of USD 0.22 billion.
73
GUJARAT SCENARIO – 2020
4.3.2
74
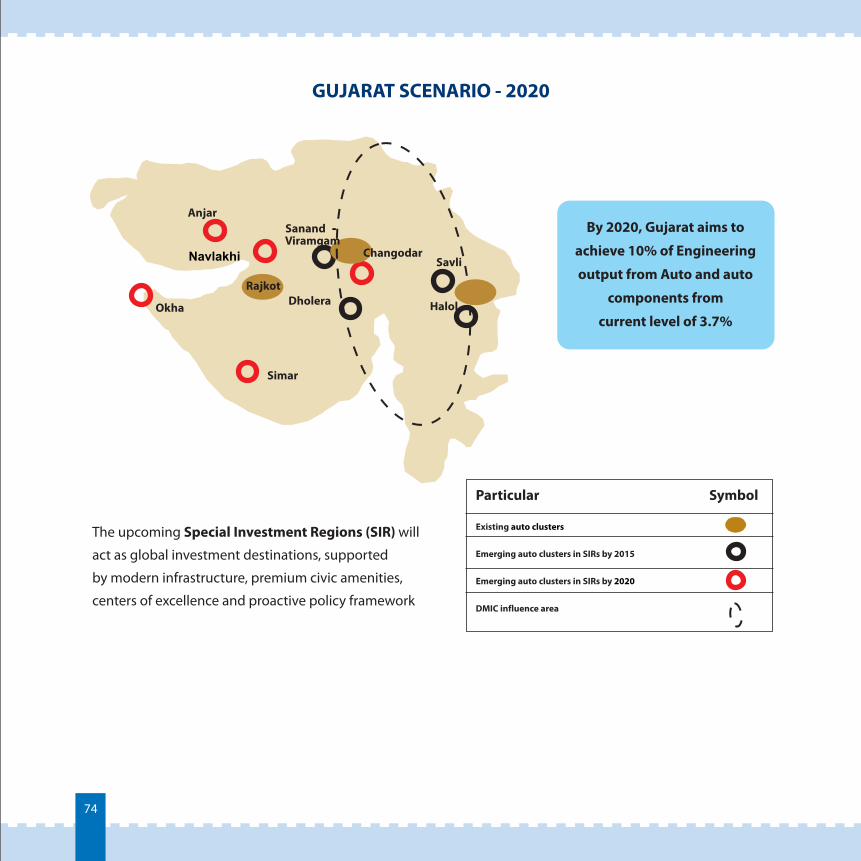
GUJARAT SCENARIO - 2020
By 2020, Gujarat aims to
achieve 10% of Engineering
output from Auto and auto
components from
current level of 3.7%DholeraOkha
Simar
Navlakhi Savli
AnjarSanand -
Halol
The upcoming Special Investment Regions (SIR) will
act as global investment destinations, supported
by modern infrastructure, premium civic amenities,
centers of excellence and proactive policy framework
ChangodarViramgam
Rajkot
Particular Symbol
Existing auto clusters
Emerging auto clusters in SIRs by 2015
Emerging auto clusters in SIRs by 2020
DMIC influence area
75
GUJARAT SCENARIO – 2020
4.3.3
76
POLICY INITIATIVES AND INTERVENTIONS PLANNED
The National Strategy for Manufacturing, drawn by the National Manufacturing Competitiveness Council (NMCC), has identified “automobiles sector” as a priority area. The Government of India has taken a number of initiatives to promote growth in the sector.
Auto Policy 2002
• The policy emphasizes on low emission fuel auto technologies and the availability of appropriate auto fuels.
• The policy’s objective is to establish India as an international hub for manufacturing small, affordable passenger cars and a key global centre for manufacturing tractors and two-wheelers.
• The policy provides for the automatic approval for foreign equity investment of up to 100 per cent for the manufacture of auto components.
Automotive Mission Plan 2016
The AMP targets exports worth US$ 40–45 billion in 2016, including component exports worth US$ 20–25 billion and outsourced engineering services worth US$ 2–2.5 billion. The AMP targets a total turnover of US$ 145 billion by 2016.
Interventions Planned :Auto clusters will be promoted in Rajkot, Halol, Sanand and Mandal
Source: Ministry of Heavy Industries
77
INVESTMENT OPPORTUNITIES
4.3.4
78
INVESTMENT OPPORTUNITIES
• Government policies, including a weighted tax deduction of up to 200% for in-house R&D activities in the country, have given impetus to investment in R&D.
• India’s vast availability of low-cost skilled and educated manpower, proven product-development capabilities, and geographic advantage due to its proximity to emerging markets present significant growth opportunities in the country.
• The number of global players moving to India has been increasing on the back of Government of India permitting 100% foreign equity investments.
• Light vehicle sales in India are estimated to cross the 3 million mark by 2012.
• The Automobile Mission Plan envisages industry to grow 5-fold to US$145 billion by 2016
• The auto component industry in India has potential to grow at a CAGR of 13% to reach US$40 billion by 2015
Source: Ministry of Heavy Industries, SIAM & ACMA
79
CHEMICALS AND PETROCHEMICALS
4.4
80
OVERVIEW
4.4.1
81
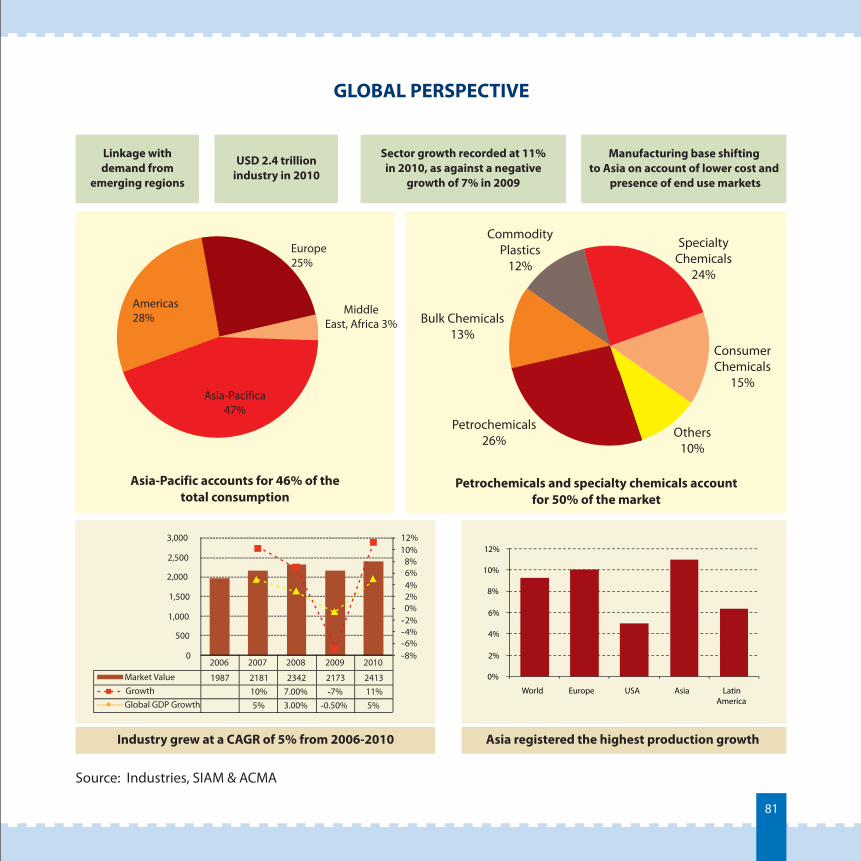
GLOBAL PERSPECTIVE
Source: Industries, SIAM & ACMA
Linkage with demand from
emerging regions
USD 2.4 trillion industry in 2010
Sector growth recorded at 11% in 2010, as against a negative
growth of 7% in 2009
Manufacturing base shifting to Asia on account of lower cost and
presence of end use markets
Europe25%
MiddleEast, Africa 3%
Americas28%
Asia-Pacifica47%
CommodityPlastics
12%
Bulk Chemicals13%
Petrochemicals26%
Others10%
ConsumerChemicals
15%
SpecialtyChemicals
24%
Asia-Pacific accounts for 46% of the total consumption
2006 2007 2008 2009 2010
Market Value 1987 2181 2342 2173 2413Growth 10% 7.00% -7% 11%Global GDP Growth 5% 3.00% -0.50% 5%
-8%-6%-4%-2%0%2%4%6%8%
10%12%
0
500
1,000
1,500
2,000
2,500
3,000
Industry grew at a CAGR of 5% from 2006-2010
0%
2%
4%
6%
8%
10%
12%
World Europe USA Asia Latin America
Petrochemicals and specialty chemicals account for 50% of the market
Asia registered the highest production growth
82
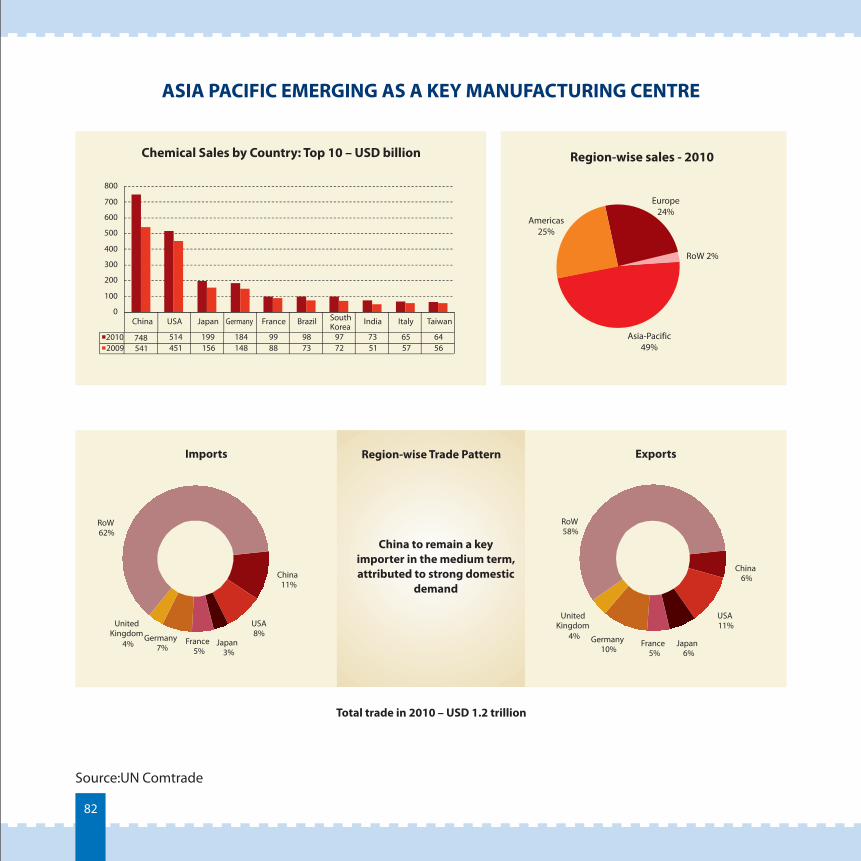
ASIA PACIFIC EMERGING AS A KEY MANUFACTURING CENTRE
Source:UN Comtrade
Chemical Sales by Country: Top 10 – USD billion
China USA Japan Germany France Brazil SouthKorea
India Italy Taiwan
2010 748 514 199 184 99 98 97 73 65 642009 541 451 156 148 88 73 72 51 57 56
0
100
200
300
400
500
600
700
800
Region-wise sales - 2010
Americas25%
Europe24%
RoW 2%
Asia-Pacific49%
China to remain a keyimporter in the medium term, attributed to strong domestic
demand
Region-wise Trade PatternImports Exports
China11%
USA8%
Japan3%
France5%
Germany7%
United Kingdom
4%
RoW62%
China6%
USA11%
Japan6%
France5%
Germany10%
United Kingdom
4%
RoW58%
Total trade in 2010 – USD 1.2 trillion
83
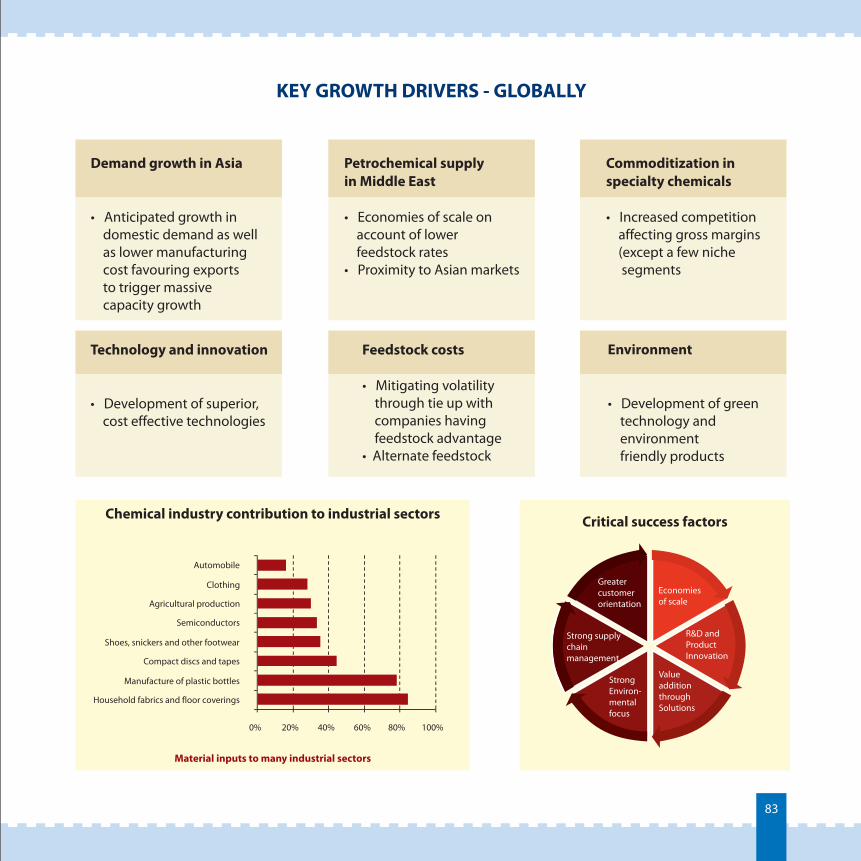
KEY GROWTH DRIVERS - GLOBALLY
0% 20% 40% 60% 80% 100%
Household fabrics and floor coverings
Manufacture of plastic bottles
Compact discs and tapes
Shoes, snickers and other footwear
Semiconductors
Agricultural production
Clothing
Automobile
Material inputs to many industrial sectors
Petrochemical supply in Middle East
Economies of scale on account of lower feedstock rates
Proximity to Asian markets
•
•
Commoditization in specialty chemicals
Increased competition affecting gross margins (except a few niche segments
•
Technology and innovation
Development of superior, cost effective technologies•
Feedstock costs
• Mitigating volatility through tie up with companies having feedstock advantage• Alternate feedstock
Environment
Development of green technology and environment friendly products
•
Demand growth in Asia
Anticipated growth in domestic demand as well
as lower manufacturingcost favouring exports to trigger massive
apacity growth
•
c
Chemical industry contribution to industrial sectors
Economiesof scale
R&D andProductInnovation
ValueadditionthroughSolutions
StrongEnviron-mentalfocus
Strong supplychainmanagement
Greatercustomerorientation
Critical success factors
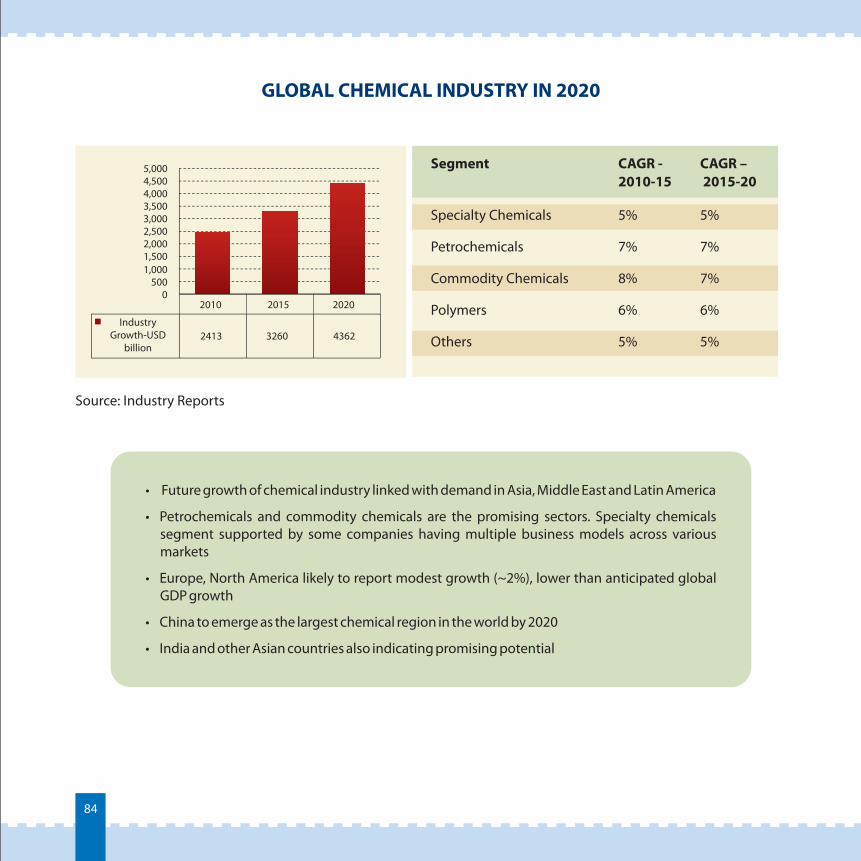
GLOBAL CHEMICAL INDUSTRY IN 2020
2010 2015 2020
IndustryGrowth-USD
billion 2413 3260 4362
0500
1,0001,5002,0002,5003,0003,5004,0004,5005,000
• Future growth of chemical industry linked with demand in Asia, Middle East and Latin America
• Petrochemicals and commodity chemicals are the promising sectors. Specialty chemicals segment supported by some companies having multiple business models across various markets
• Europe, North America likely to report modest growth (~2%), lower than anticipated global GDP growth
• China to emerge as the largest chemical region in the world by 2020
• India and other Asian countries also indicating promising potential
Segment CAGR - 2010-15 2015-20
Specialty Chemicals 5% 5%
Petrochemicals 7% 7%
Commodity Chemicals 8% 7%
Polymers 6% 6%
Others 5% 5%
CAGR –
84
Source: Industry Reports
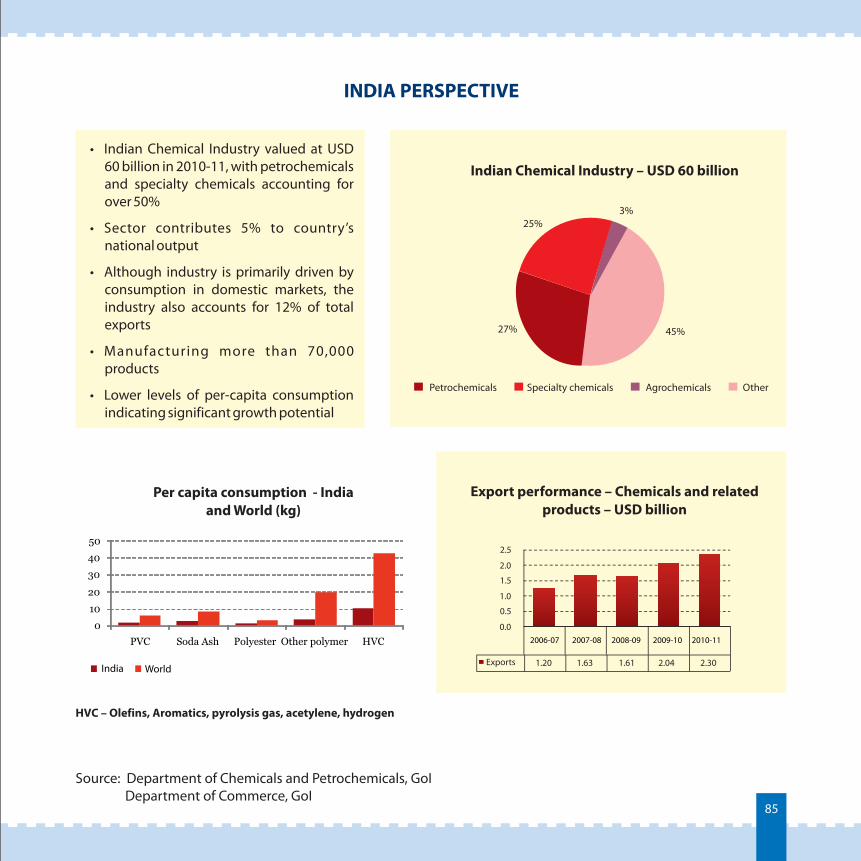
INDIA PERSPECTIVE
• Indian Chemical Industry valued at USD 60 billion in 2010-11, with petrochemicals and specialty chemicals accounting for over 50%
• Sector contributes 5% to country’s national output
• Although industry is primarily driven by consumption in domestic markets, the industry also accounts for 12% of total exports
• Manufacturing more than 70,000 products
• Lower levels of per-capita consumption indicating significant growth potential
Indian Chemical Industry – USD 60 billion
3%
45%27%
25%
Specialty chemicalsPetrochemicals Agrochemicals Other
Export performance – Chemicals and related products – USD billion
0
10
20
30
40
50
PVC Soda Ash Polyester Other polymer HVC
Per capita consumption - India and World (kg)
HVC – Olefins, Aromatics, pyrolysis gas, acetylene, hydrogen
2006-07
Exports 1.20 1.63 1.61 2.04 2.30
0.0
0.5
1.0
1.5
2.0
2.5
2007-08 2008-09 2009-10 2010-11
85
India World
Source: Department of Chemicals and Petrochemicals, GoI Department of Commerce, GoI
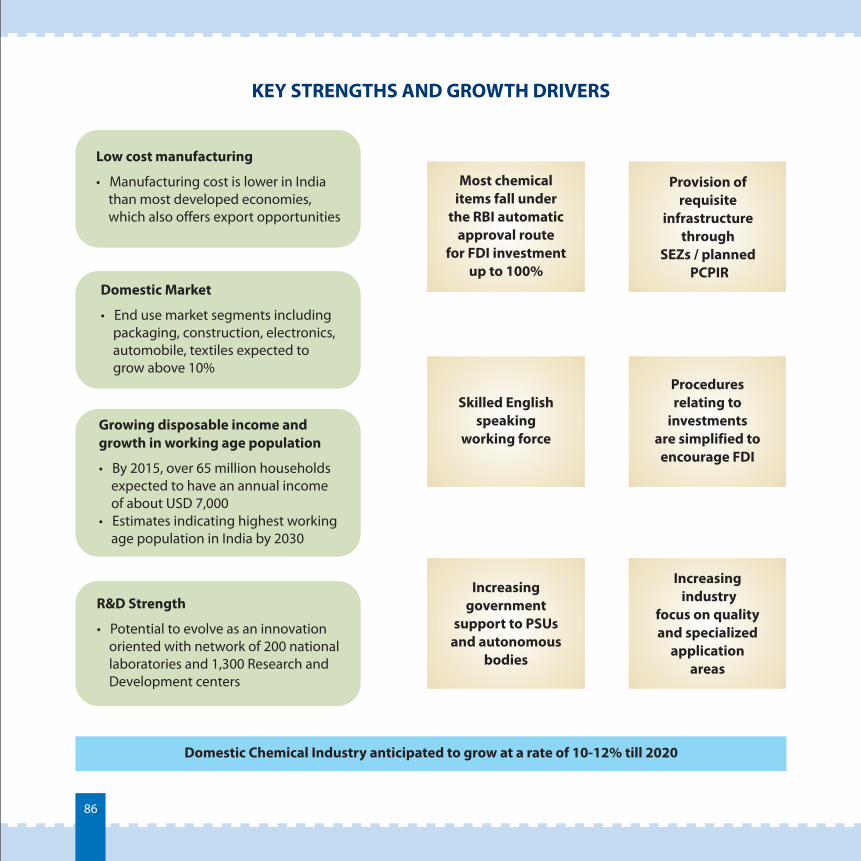
KEY STRENGTHS AND GROWTH DRIVERS
Domestic Market
End use market segments including packaging, construction, electronics, automobile, textiles expected to grow above 10%
•
R&D Strength
• Potential to evolve as an innovation oriented with network of 200 national laboratories and 1,300 Research and Development centers
Domestic Chemical Industry anticipated to grow at a rate of 10-12% till 2020
Most chemical items fall under
the RBI automatic approval route
for FDI investment up to 100%
Skilled English speaking
working force
Increasing government
support to PSUs and autonomous
bodies
Provision of requisite
infrastructure through
SEZs / planned PCPIR
Procedures relating to
investments are simplified to encourage FDI
Increasing industry
focus on quality and specialized
application areas
Low cost manufacturing
Manufacturing cost is lower in India than most developed economies, which also offers export opportunities
•
Growing disposable income and growth in working age population
• By 2015, over 65 million households expected to have an annual income of about USD 7,000
Estimates indicating highest working age population in India by 2030•
86
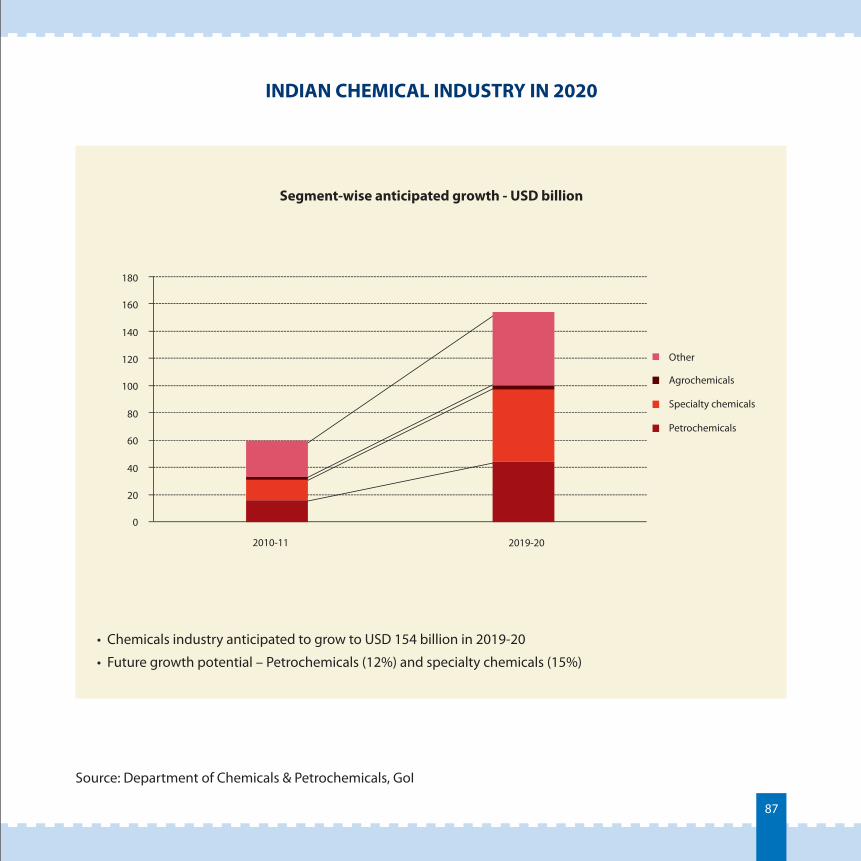
INDIAN CHEMICAL INDUSTRY IN 2020
0
20
40
60
80
100
120
140
160
180
2010-11
Segment-wise anticipated growth - USD billion
Other
Agrochemicals
Specialty chemicals
Petrochemicals
Source: Department of Chemicals & Petrochemicals, GoI
• Chemicals industry anticipated to grow to USD 154 billion in 2019-20
• Future growth potential – Petrochemicals (12%) and specialty chemicals (15%)
2019-20
87
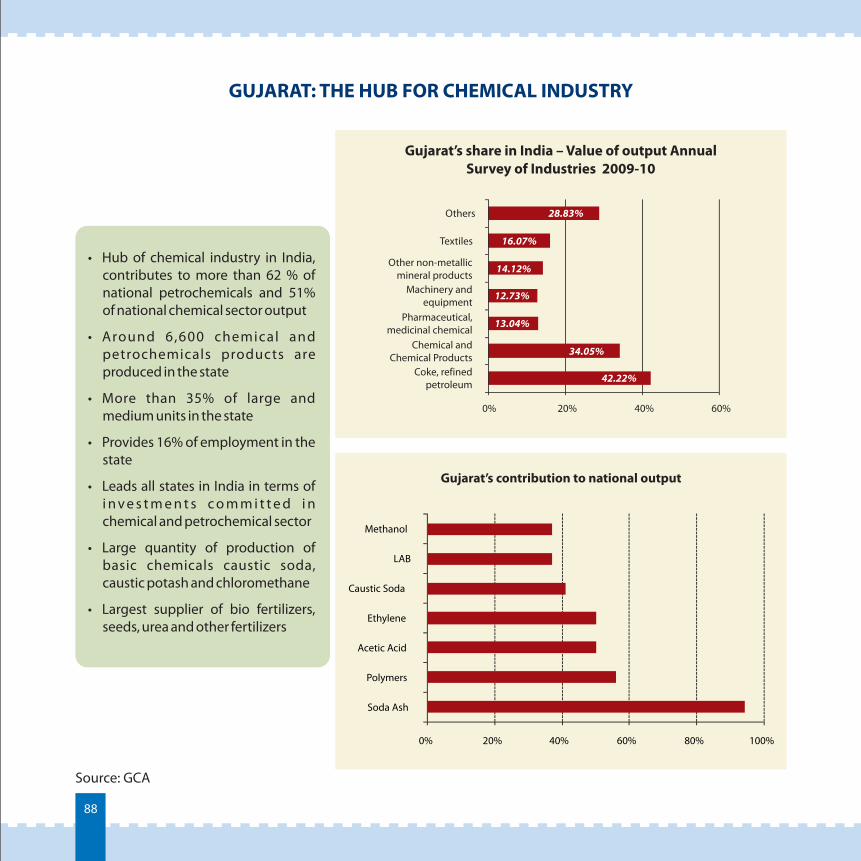
GUJARAT: THE HUB FOR CHEMICAL INDUSTRY
Source: GCA
• Hub of chemical industry in India, contributes to more than 62 % of national petrochemicals and 51% of national chemical sector output
• Around 6,600 chemical and petrochemicals products are produced in the state
• More than 35% of large and medium units in the state
• Provides 16% of employment in the state
• Leads all states in India in terms of i n v e s t m e n t s c o m m i t t e d i n chemical and petrochemical sector
• Large quantity of production of basic chemicals caustic soda, caustic potash and chloromethane
• Largest supplier of bio fertilizers, seeds, urea and other fertilizers
42.22%
34.05%
13.04%
12.73%
14.12%
16.07%
28.83%
Coke, refinedpetroleum
Chemical andChemical Products
Pharmaceutical,medicinal chemical
Machinery andequipment
Other non-mineral products
metallic
Textiles
Others
0% 20% 40% 60%
0% 20% 40% 60% 80% 100%
Soda Ash
Polymers
Acetic Acid
Ethylene
Caustic Soda
LAB
Methanol
Gujarat’s contribution to national output
Gujarat’s share in India – Value of output Annual Survey of Industries 2009-10
88
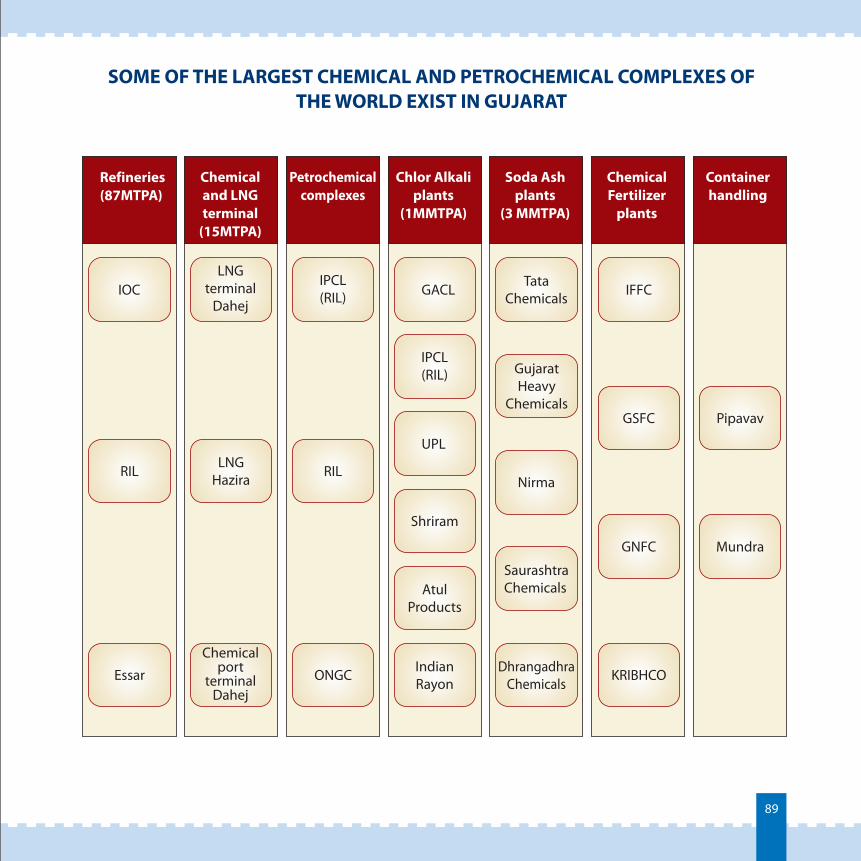
SOME OF THE LARGEST CHEMICAL AND PETROCHEMICAL COMPLEXES OF THE WORLD EXIST IN GUJARAT
IPCL (RIL) GACL
UPL
Atul Products
Tata Chemicals
Gujarat Heavy
Chemicals
Saurashtra Chemicals
IFFC
GSFC Pipavav
IOC
Essar ONGC Indian Rayon
Dhrangadhra Chemicals
KRIBHCO
Chemical port
terminal Dahej
Shriram
GNFC Mundra
RIL LNG
Hazira RIL Nirma
LNG terminal
Dahej
Refineries(87MTPA)
Chemical and LNG terminal
(15MTPA)
Petrochemical complexes
Chlor Alkali plants
(1MMTPA)
Soda Ash plants
(3 MMTPA)
Chemical Fertilizer
plants
Container handling
89
IPCL (RIL)
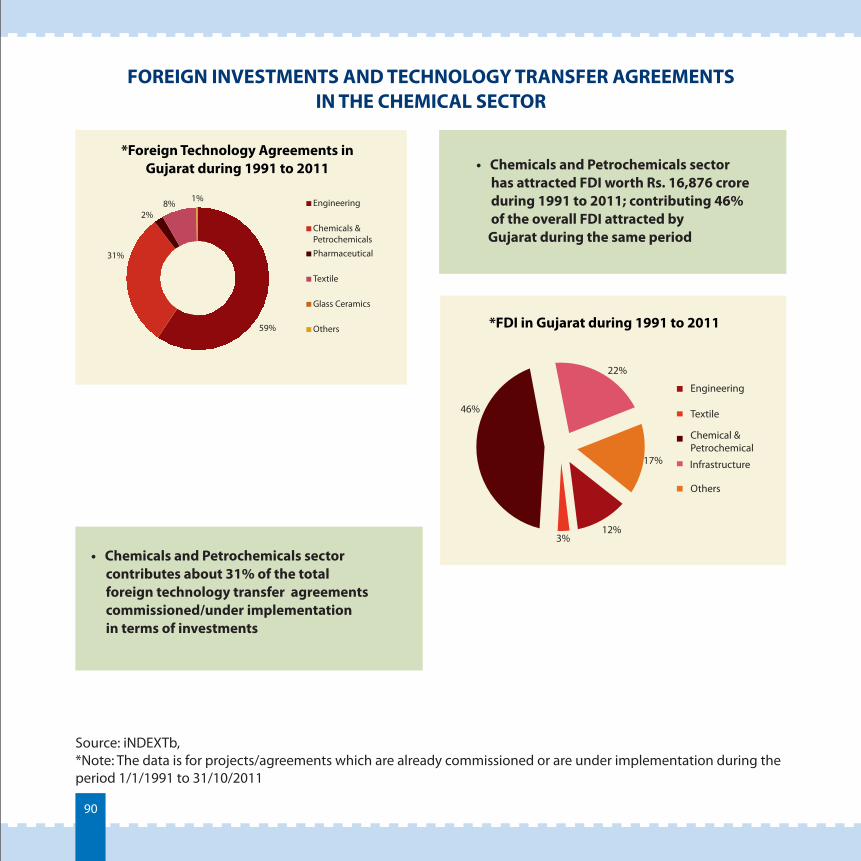
FOREIGN INVESTMENTS AND TECHNOLOGY TRANSFER AGREEMENTS IN THE CHEMICAL SECTOR
Source: iNDEXTb, *Note: The data is for projects/agreements which are already commissioned or are under implementation during the period 1/1/1991 to 31/10/2011
*Foreign Technology Agreements inGujarat during 1991 to 2011
Engineering
Chemicals &Petrochemicals
Pharmaceutical
Textile
Glass Ceramics
Others
• Chemicals and Petrochemicals sector contributes about 31% of the total foreign technology transfer agreements commissioned/under implementation
in terms of investments
• Chemicals and Petrochemicals sector has attracted FDI worth Rs. 16,876 crore during 1991 to 2011; contributing 46% of the overall FDI attracted by Gujarat during the same period
12%3%
46%
22%
17%
*FDI in Gujarat during 1991 to 2011
Engineering
Textile
Chemical &Petrochemical
Infrastructure
Others
59%
31%
2%8% 1%
90
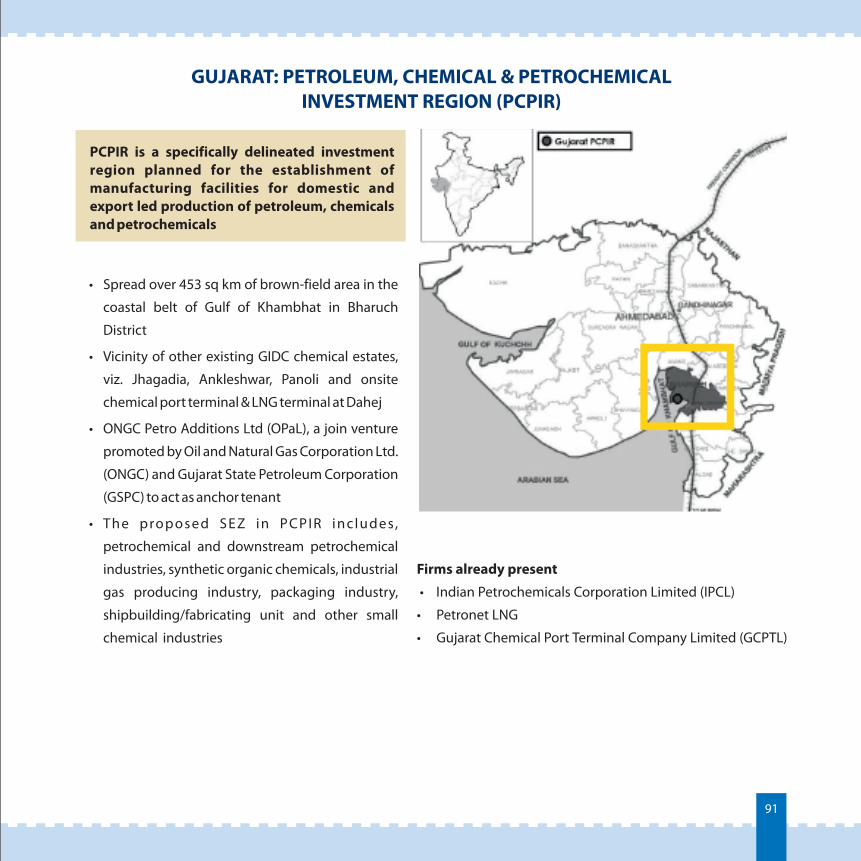
GUJARAT: PETROLEUM, CHEMICAL & PETROCHEMICAL INVESTMENT REGION (PCPIR)
PCPIR is a specifically delineated investment region planned for the establishment of manufacturing facilities for domestic and export led production of petroleum, chemicals and petrochemicals
• Spread over 453 sq km of brown-field area in the
coastal belt of Gulf of Khambhat in Bharuch
District
• Vicinity of other existing GIDC chemical estates,
viz. Jhagadia, Ankleshwar, Panoli and onsite
chemical port terminal & LNG terminal at Dahej
• ONGC Petro Additions Ltd (OPaL), a join venture
promoted by Oil and Natural Gas Corporation Ltd.
(ONGC) and Gujarat State Petroleum Corporation
(GSPC) to act as anchor tenant
• The proposed SEZ in PCPIR inc ludes,
petrochemical and downstream petrochemical
industries, synthetic organic chemicals, industrial
gas producing industry, packaging industry,
shipbuilding/fabricating unit and other small
chemical industries
Firms already present
• Indian Petrochemicals Corporation Limited (IPCL)
Petronet LNG
Gujarat Chemical Port Terminal Company Limited (GCPTL)
•
•
91
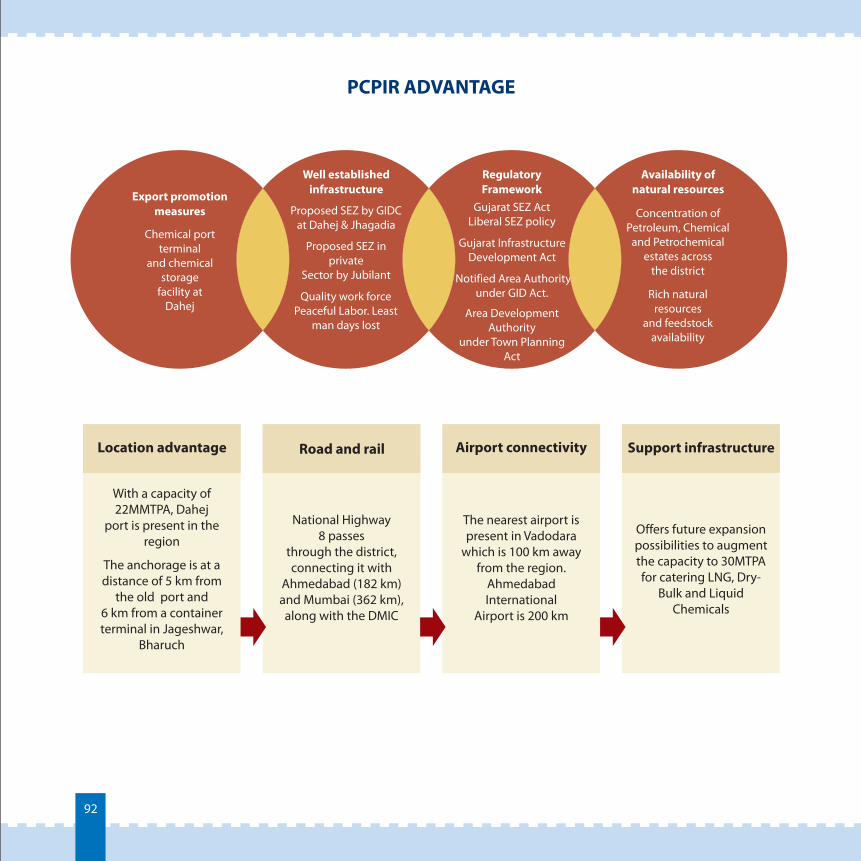
PCPIR ADVANTAGE
Export promotion measures
Well establishedinfrastructure
Proposed SEZ by GIDCat Dahej & Jhagadia
Proposed SEZ in private
Sector by Jubilant
Quality work force Peaceful Labor. Least
man days lost
RegulatoryFramework
Gujarat SEZ ActLiberal SEZ policy
Gujarat InfrastructureDevelopment Act
Notified Area Authorityunder GID Act.
Area Development Authority
under Town Planning Act
Chemical port terminal
and chemical storage
facility at Dahej
Availability of natural resources
Concentration of Petroleum, Chemical
and Petrochemical estates across
the district
Rich natural resources
and feedstock availability
With a capacity of 22MMTPA, Dahej
port is present in the region
The anchorage is at a distance of 5 km from
the old port and 6 km from a container terminal in Jageshwar,
Bharuch
National Highway 8 passes
through the district, connecting it with
Ahmedabad (182 km) and Mumbai (362 km), along with the DMIC
The nearest airport is present in Vadodara
which is 100 km away from the region.
Ahmedabad International
Airport is 200 km
Offers future expansion possibilities to augment the capacity to 30MTPA for catering LNG, Dry-
Bulk and Liquid Chemicals
Location advantage Road and rail Airport connectivity Support infrastructure
92
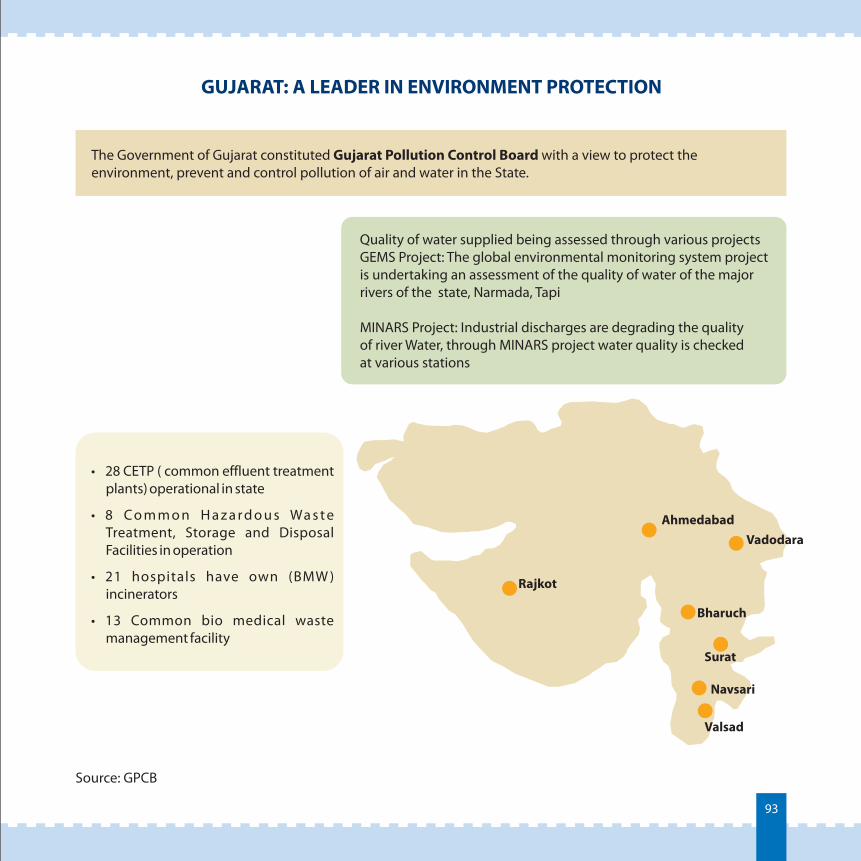
GUJARAT: A LEADER IN ENVIRONMENT PROTECTION
The Government of Gujarat constituted Gujarat Pollution Control Board with a view to protect the environment, prevent and control pollution of air and water in the State.
Quality of water supplied being assessed through various projectsGEMS Project: The global environmental monitoring system projectis undertaking an assessment of the quality of water of the major rivers of the state, Narmada, Tapi
MINARS Project: Industrial discharges are degrading the quality of river Water, through MINARS project water quality is checked at various stations
• 28 CETP ( common effluent treatment plants) operational in state
• 8 C o m m o n H a z a r d o u s Wa s t e Treatment, Storage and Disposal Facilities in operation
• 21 hospitals have own (BMW ) incinerators
• 13 Common bio medical waste management facility
Source: GPCB
Ahmedabad
Surat
Rajkot
Valsad
Bharuch
Navsari
Vadodara
93
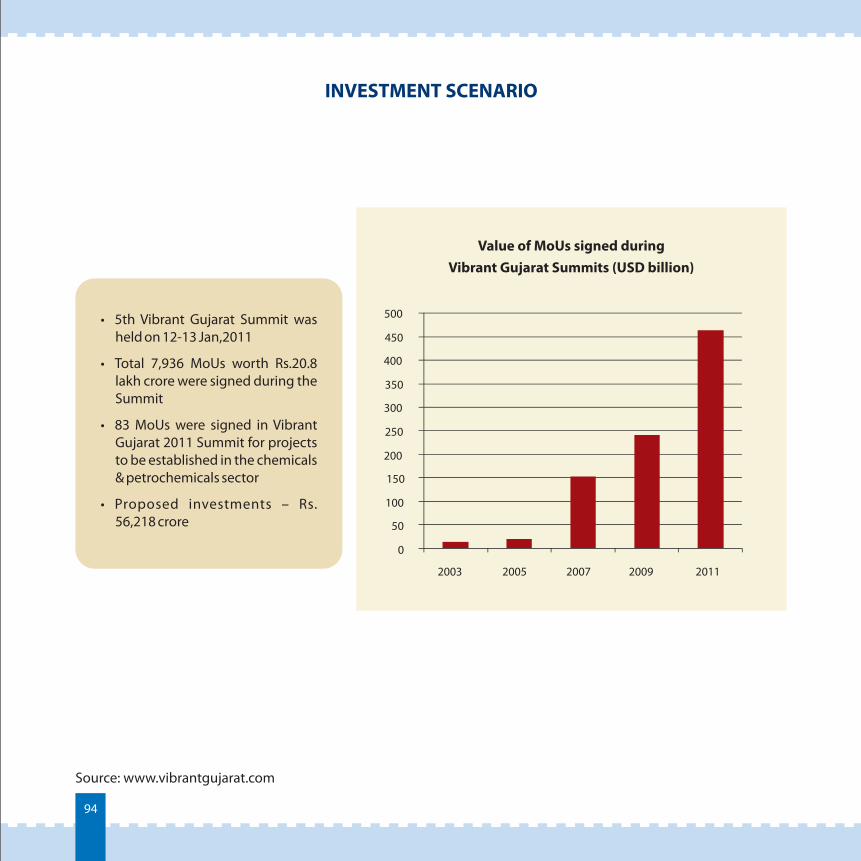
INVESTMENT SCENARIO
• 5th Vibrant Gujarat Summit was held on 12-13 Jan,2011
• Total 7,936 MoUs worth Rs.20.8 lakh crore were signed during the Summit
• 83 MoUs were signed in Vibrant Gujarat 2011 Summit for projects to be established in the chemicals & petrochemicals sector
• Proposed investments – Rs. 56,218 crore
Value of MoUs signed during Vibrant Gujarat Summits (USD billion)
Source: www.vibrantgujarat.com
0
50
100
150
200
250
300
350
400
450
500
2003 2005 2007 2009 2011
94
LEADING COMPANIES IN GUJARAT
95
POLICY INTERVENTIONS
4.4.296
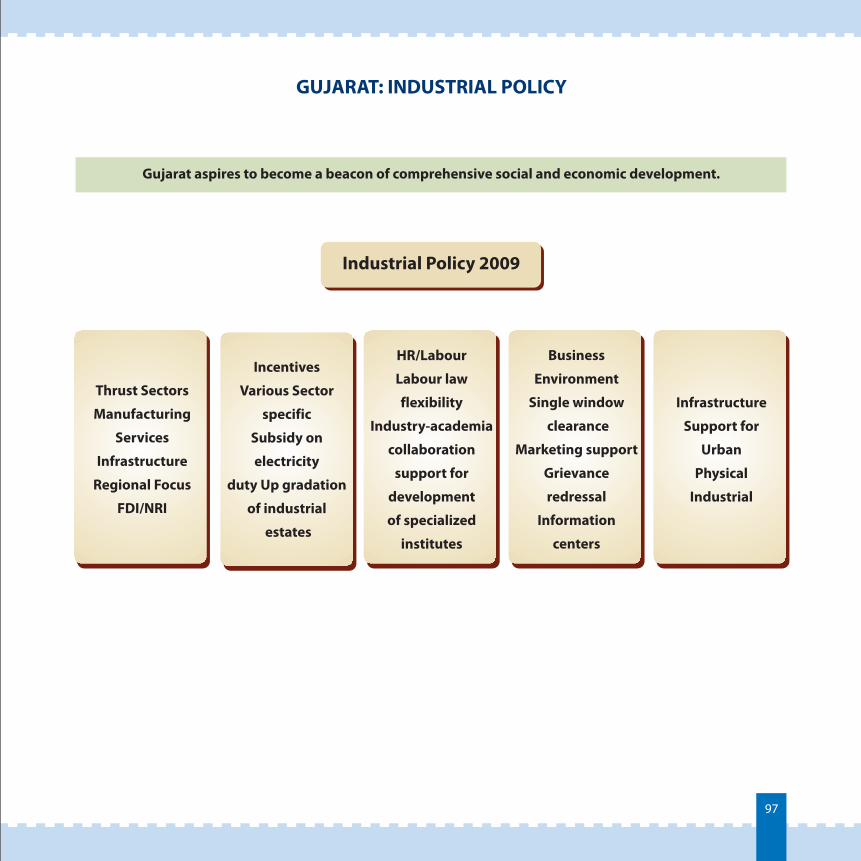
GUJARAT: INDUSTRIAL POLICY
Gujarat aspires to become a beacon of comprehensive social and economic development.
Incentives
Various Sector
specific
Subsidy on
electricity
duty Up gradation
of industrial
estates
HR/Labour
Labour law
flexibility
Industry-academia
collaboration
support for
development
of specialized
institutes
Business
Environment
Single window
clearance
Marketing support
Grievance
redressal
Information
centers
Infrastructure
Support for
Urban
Physical
Industrial
Thrust Sectors
Manufacturing
Services
Infrastructure
Regional Focus
FDI/NRI
Industrial Policy 2009
97
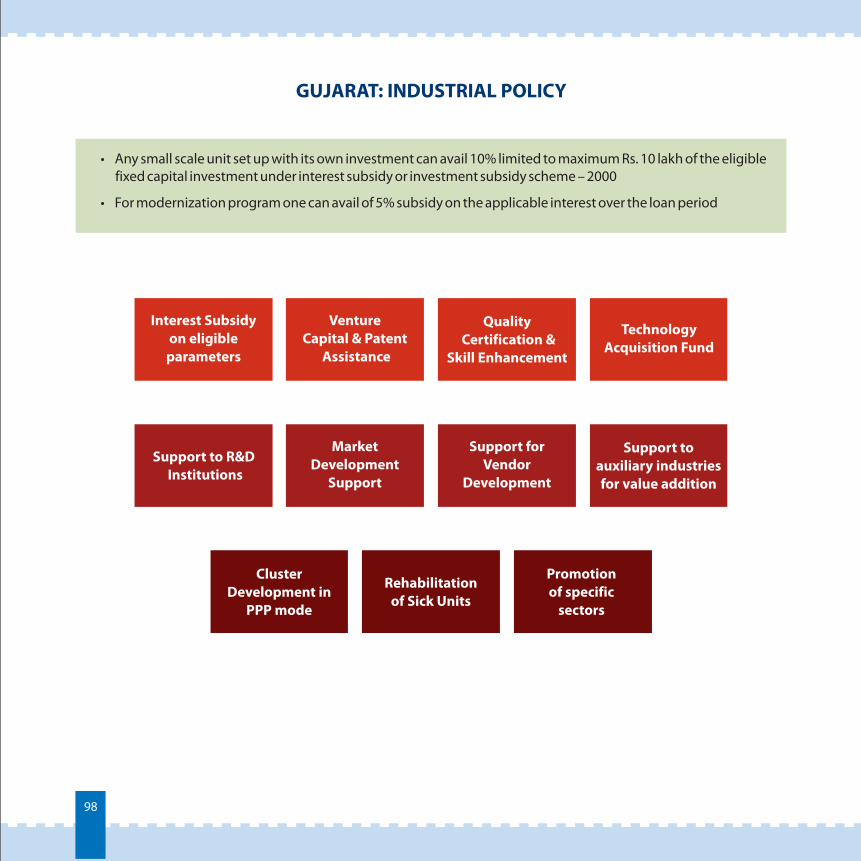
GUJARAT: INDUSTRIAL POLICY
• Any small scale unit set up with its own investment can avail 10% limited to maximum Rs. 10 lakh of the eligible fixed capital investment under interest subsidy or investment subsidy scheme – 2000
• For modernization program one can avail of 5% subsidy on the applicable interest over the loan period
Interest Subsidy on eligible
parameters
Venture Capital & Patent
Assistance
Quality Certification &
Skill Enhancement
Technology Acquisition Fund
Support to R&D Institutions
Market Development
Support
Support for Vendor
Development
Support to auxiliary industries for value addition
Cluster Development in
PPP mode
Rehabilitation of Sick Units
Promotion of specific
sectors
98
GUJARAT: INDUSTRIAL POLICY
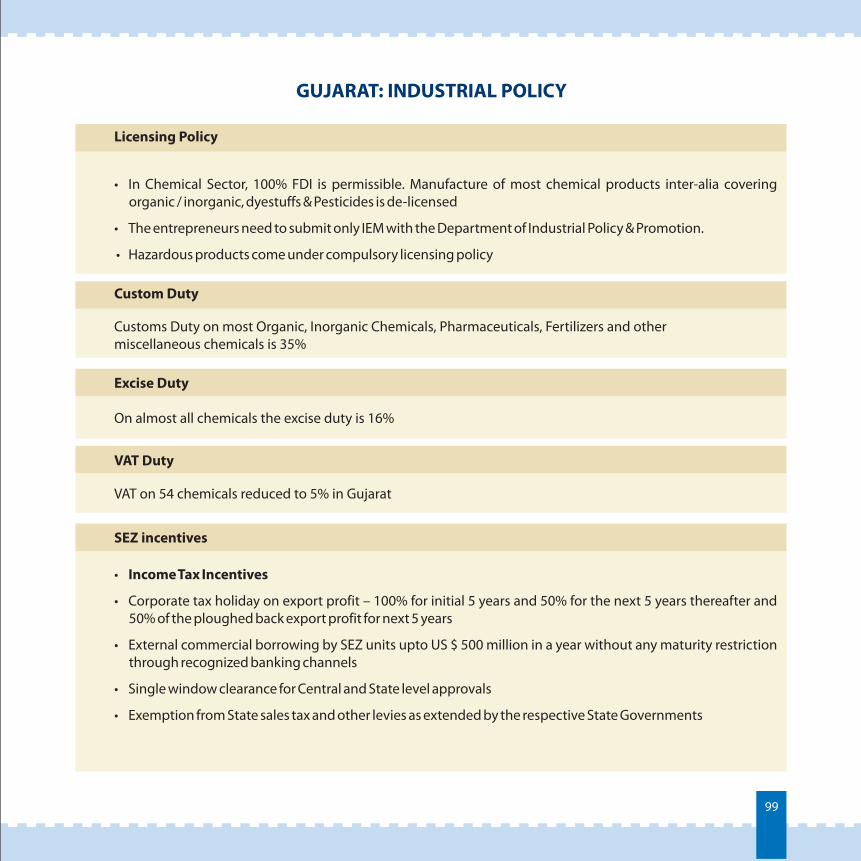
Licensing Policy
•
•
•
In Chemical Sector, 100% FDI is permissible. Manufacture of most chemical products inter-alia covering organic / inorganic, dyestuffs & Pesticides is de-licensed
The entrepreneurs need to submit only IEM with the Department of Industrial Policy & Promotion.
Hazardous products come under compulsory licensing policy
Customs Duty on most Organic, Inorganic Chemicals, Pharmaceuticals, Fertilizers and other miscellaneous chemicals is 35%
Custom Duty
Excise Duty
On almost all chemicals the excise duty is 16%
VAT Duty
VAT on 54 chemicals reduced to 5% in Gujarat
SEZ incentives
•
•
•
•
•
Income Tax Incentives
Corporate tax holiday on export profit – 100% for initial 5 years and 50% for the next 5 years thereafter and 50% of the ploughed back export profit for next 5 years
External commercial borrowing by SEZ units upto US $ 500 million in a year without any maturity restriction through recognized banking channels
Single window clearance for Central and State level approvals
Exemption from State sales tax and other levies as extended by the respective State Governments
99
GUJARAT: INDUSTRIAL POLICY
•
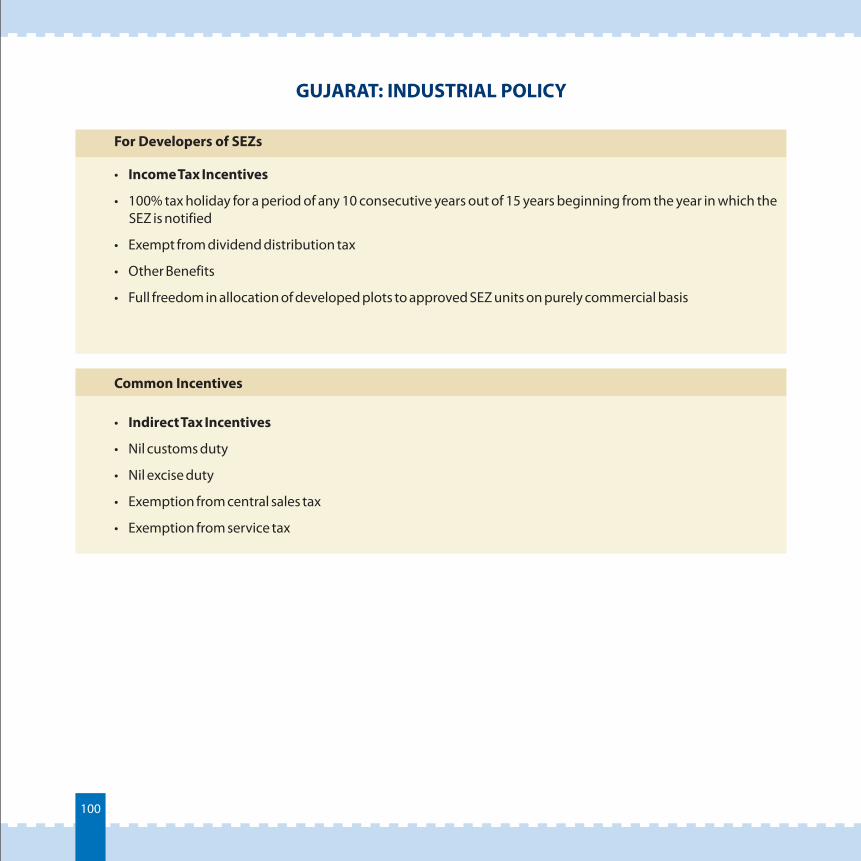
• 100% tax holiday for a period of any 10 consecutive years out of 15 years beginning from the year in which the SEZ is notified
• Exempt from dividend distribution tax
• Other Benefits
• Full freedom in allocation of developed plots to approved SEZ units on purely commercial basis
Income Tax Incentives
For Developers of SEZs
Common Incentives
• Indirect Tax Incentives
• Nil customs duty
• Nil excise duty
• Exemption from central sales tax
• Exemption from service tax
100
GUJARAT SCENARIO – YEAR 2017
4.4.3101
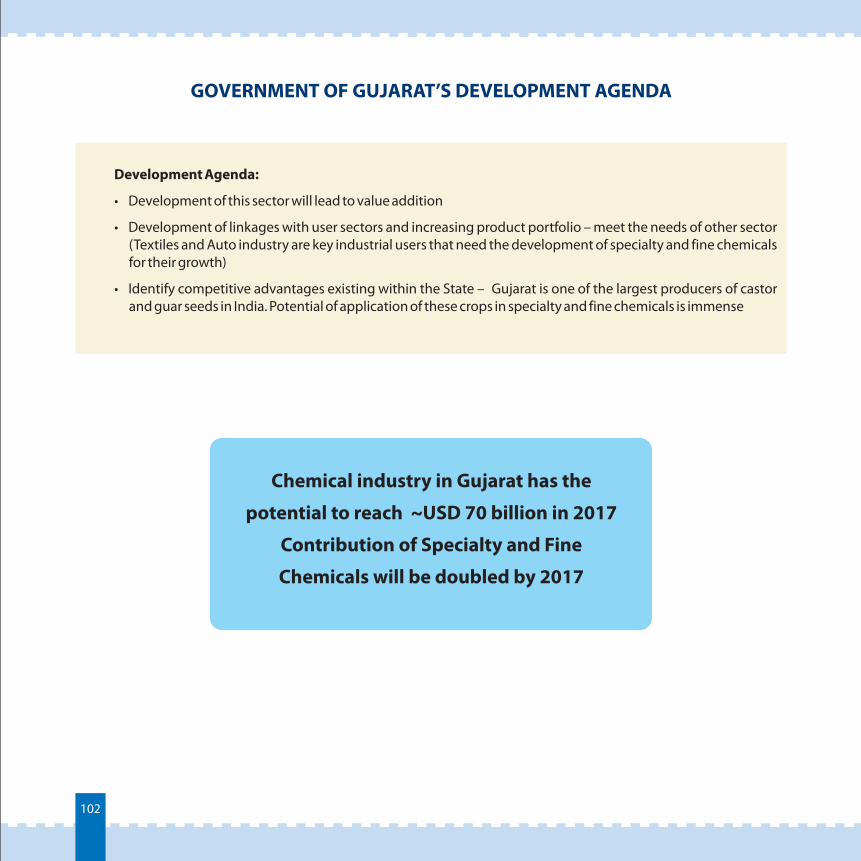
GOVERNMENT OF GUJARAT’S DEVELOPMENT AGENDA
Development Agenda:
• Development of this sector will lead to value addition
• Development of linkages with user sectors and increasing product portfolio – meet the needs of other sector (Textiles and Auto industry are key industrial users that need the development of specialty and fine chemicals for their growth)
• Identify competitive advantages existing within the State – Gujarat is one of the largest producers of castor and guar seeds in India. Potential of application of these crops in specialty and fine chemicals is immense
Chemical industry in Gujarat has the
potential to reach ~USD 70 billion in 2017
Contribution of Specialty and Fine
Chemicals will be doubled by 2017
102
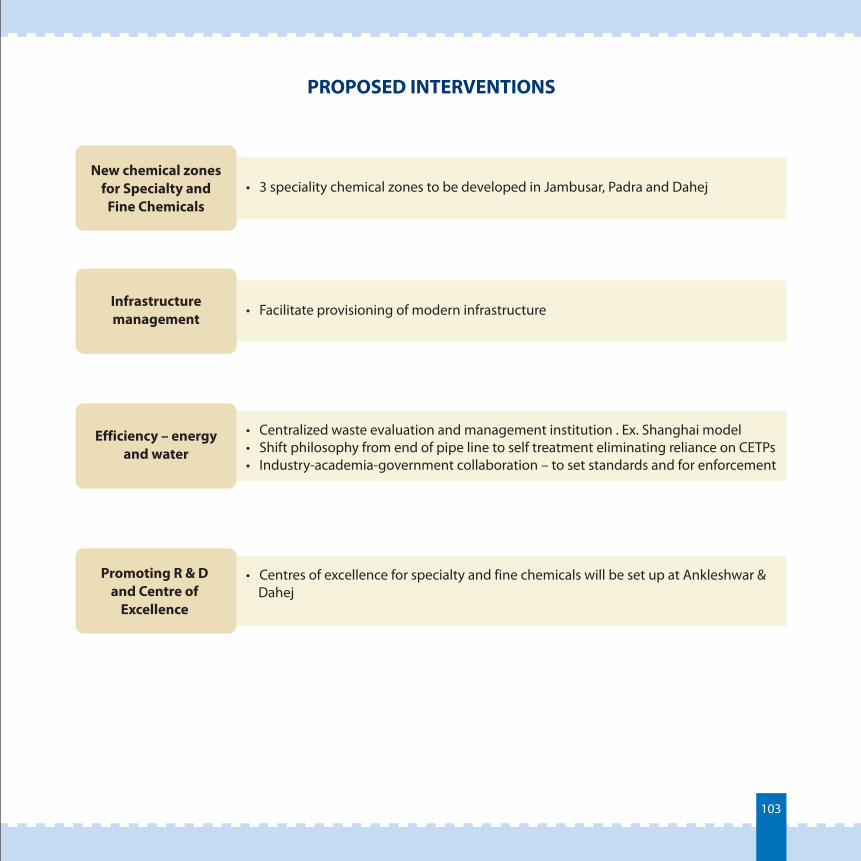
PROPOSED INTERVENTIONS
• 3 speciality chemical zones to be developed in Jambusar, Padra and DahejNew chemical zones
for Specialty and Fine Chemicals
• Facilitate provisioning of modern infrastructureInfrastructure management
Efficiency – energy and water
• Centralized waste evaluation and management institution . Ex. Shanghai model Shift philosophy from end of pipe line to self treatment eliminating reliance on CETPsIndustry-academia-government collaboration – to set standards and for enforcement
• •
Promoting R & D and Centre of
Excellence
• Centres of excellence for specialty and fine chemicals will be set up at Ankleshwar & Dahej
103
PHARMACEUTICALS & BIOTECHNOLOGY
4.5104
OVERVIEW
4.5.1105
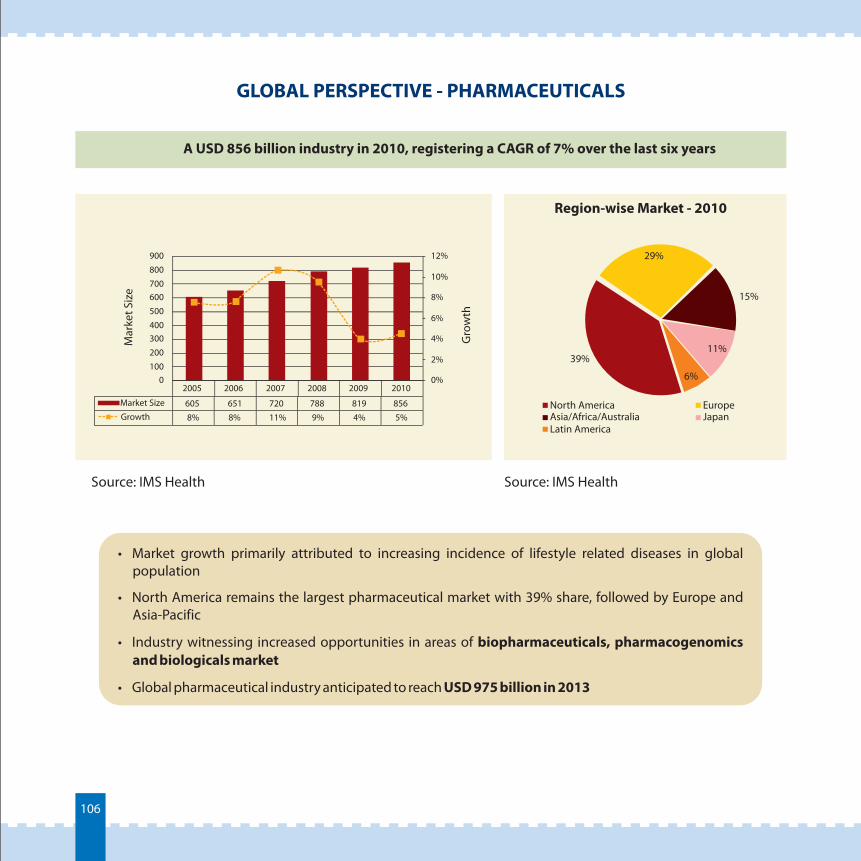
GLOBAL PERSPECTIVE - PHARMACEUTICALS
A USD 856 billion industry in 2010, registering a CAGR of 7% over the last six years
2005 2006 2007 2008 2009 2010
Market Size 605 651 720 788 819 856Growth 8% 8% 11% 9% 4% 5%
0%
2%
4%
6%
8%
10%
12%
0100
200
300400
500
600700
800
900
39%
15%
North America EuropeAsia/Africa/Australia JapanLatin America
Source: IMS Health Source: IMS Health
• Market growth primarily attributed to increasing incidence of lifestyle related diseases in global population
• North America remains the largest pharmaceutical market with 39% share, followed by Europe and Asia-Pacific
• Industry witnessing increased opportunities in areas of biopharmaceuticals, pharmacogenomics and biologicals market
• Global pharmaceutical industry anticipated to reach USD 975 billion in 2013
Mar
ket S
ize
Gro
wth
Region-wise Market - 2010
29%
11%
6%
106
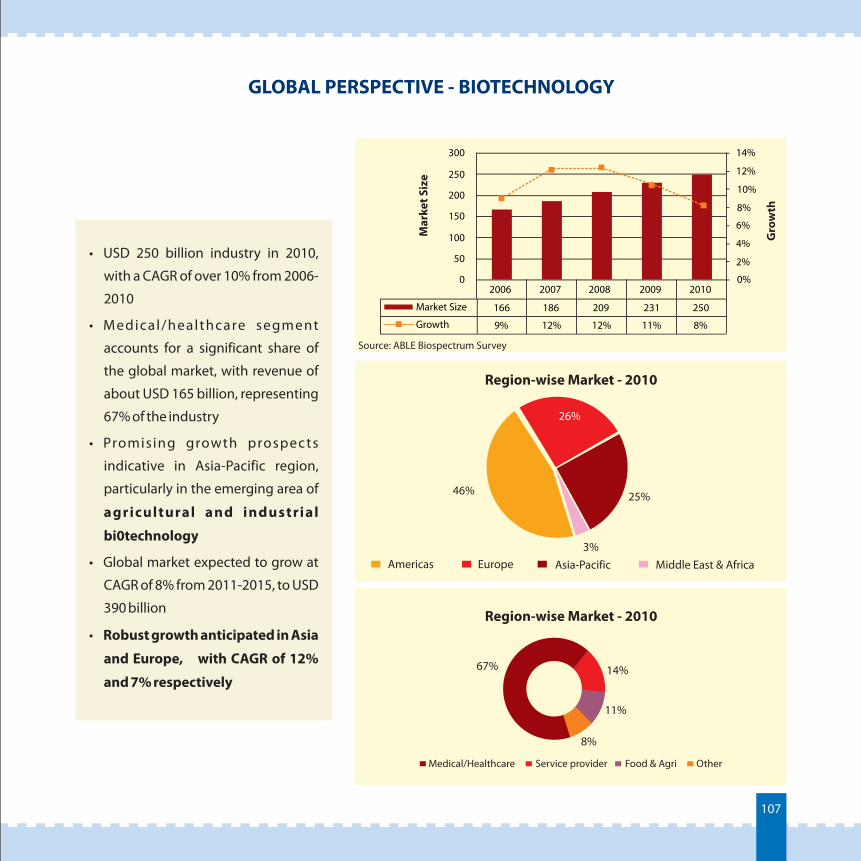
GLOBAL PERSPECTIVE - BIOTECHNOLOGY
• USD 250 billion industry in 2010,
with a CAGR of over 10% from 2006-
2010
• Medical/healthcare segment
accounts for a significant share of
the global market, with revenue of
about USD 165 billion, representing
67% of the industry
• Promising growth prospects
indicative in Asia-Pacific region,
particularly in the emerging area of
agricultural and industrial
bi0technology
• Global market expected to grow at
CAGR of 8% from 2011-2015, to USD
390 billion
• Robust growth anticipated in Asia
and Europe, with CAGR of 12%
and 7% respectively
2006 2007 2008 2009 2010
Market Size 166 186 209 231 250
Growth 9% 12% 12% 11% 8%
0%
2%
4%
6%
8%
10%
12%
14%
0
50
100
150
200
250
300
Gro
wth
Mar
ket S
ize
Region-wise Market - 2010
25%
3%
46%
26%
Americas Europe Asia-Pacific Middle East & Africa
Region-wise Market - 2010
67%
11%
8%
Medical/Healthcare Service provider Food & Agri Other
14%
107
Source: ABLE Biospectrum Survey
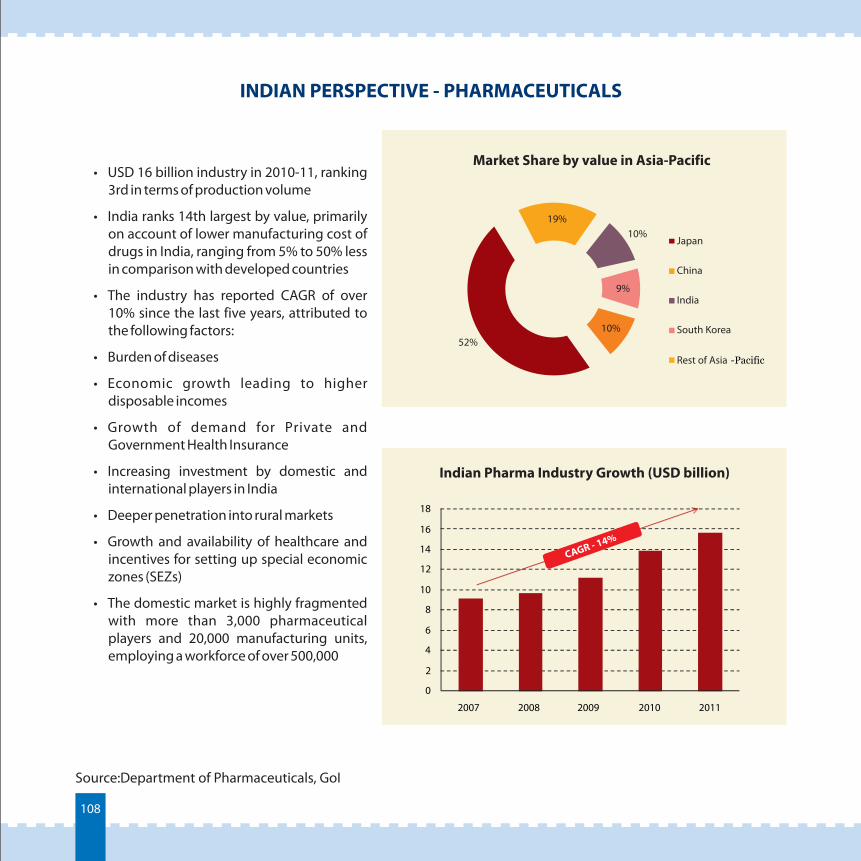
INDIAN PERSPECTIVE - PHARMACEUTICALS
• USD 16 billion industry in 2010-11, ranking 3rd in terms of production volume
• India ranks 14th largest by value, primarily on account of lower manufacturing cost of drugs in India, ranging from 5% to 50% less in comparison with developed countries
• The industry has reported CAGR of over 10% since the last five years, attributed to the following factors:
• Burden of diseases
• Economic growth leading to higher disposable incomes
• Growth of demand for Private and Government Health Insurance
• Increasing investment by domestic and international players in India
• Deeper penetration into rural markets
• Growth and availability of healthcare and incentives for setting up special economic zones (SEZs)
• The domestic market is highly fragmented with more than 3,000 pharmaceutical players and 20,000 manufacturing units, employing a workforce of over 500,000
0
2
4
6
8
10
12
14
16
18
2007 2008 2009 2010 2011
Indian Pharma Industry Growth (USD billion)
Market Share by value in Asia-Pacific
Source:Department of Pharmaceuticals, GoI
52%
10%Japan
China
India
South Korea
Rest of Asia -Pacific
19%
9%
10%
108
CAGR - 14%
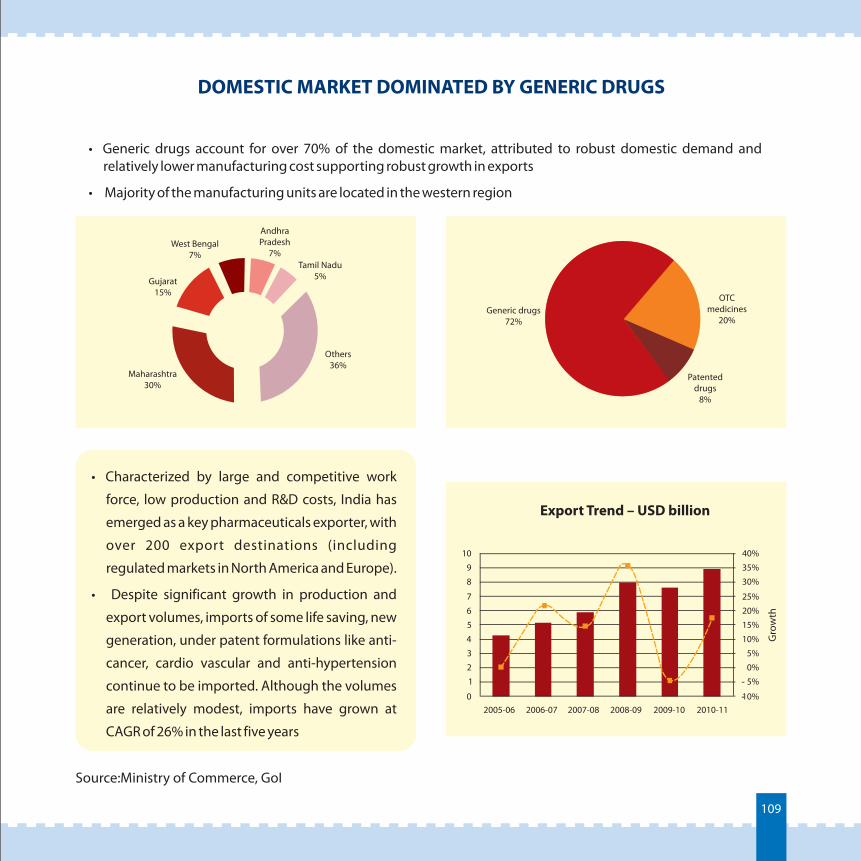
DOMESTIC MARKET DOMINATED BY GENERIC DRUGS
• Generic drugs account for over 70% of the domestic market, attributed to robust domestic demand and relatively lower manufacturing cost supporting robust growth in exports
• Majority of the manufacturing units are located in the western region
Maharashtra30%
Gujarat15%
West Bengal7%
AndhraPradesh
7% Tamil Nadu
5%
Others36%
Generic drugs72%
OTC medicines
20%
Patenteddrugs
8%
• Characterized by large and competitive work
force, low production and R&D costs, India has
emerged as a key pharmaceuticals exporter, with
over 200 export destinations (including
regulated markets in North America and Europe).
• Despite significant growth in production and
export volumes, imports of some life saving, new
generation, under patent formulations like anti-
cancer, cardio vascular and anti-hypertension
continue to be imported. Although the volumes
are relatively modest, imports have grown at
CAGR of 26% in the last five years
-10%
- 5%
0%
5%
10%
15%
20%
25%
30%
35%
40%
0
1
2
3
4
5
6
7
8
9
10
2005-06 2006-07 2007-08 2008-09 2009-10 2010-11
Export Trend – USD billion
Source:Ministry of Commerce, GoIG
row
th
109
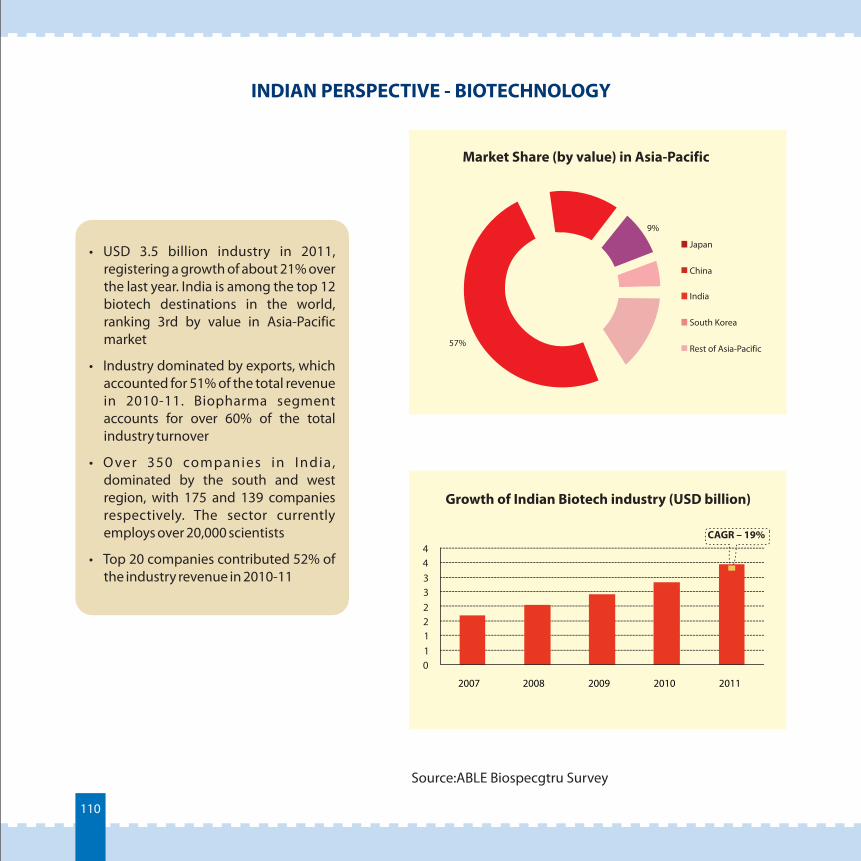
INDIAN PERSPECTIVE - BIOTECHNOLOGY
• USD 3.5 billion industry in 2011, registering a growth of about 21% over the last year. India is among the top 12 biotech destinations in the world, ranking 3rd by value in Asia-Pacific market
• Industry dominated by exports, which accounted for 51% of the total revenue in 2010-11. Biopharma segment accounts for over 60% of the total industry turnover
• O ver 350 companies in India, dominated by the south and west region, with 175 and 139 companies respectively. The sector currently employs over 20,000 scientists
• Top 20 companies contributed 52% of the industry revenue in 2010-11
Market Share (by value) in Asia-Pacific
Growth of Indian Biotech industry (USD billion)
011223344
2007 2008 2009 2010 2011
57%
14%9%
5%
15%
Japan
China
India
South Korea
Rest of Asia-Pacific
CAGR – 19%
Source:ABLE Biospecgtru Survey
110
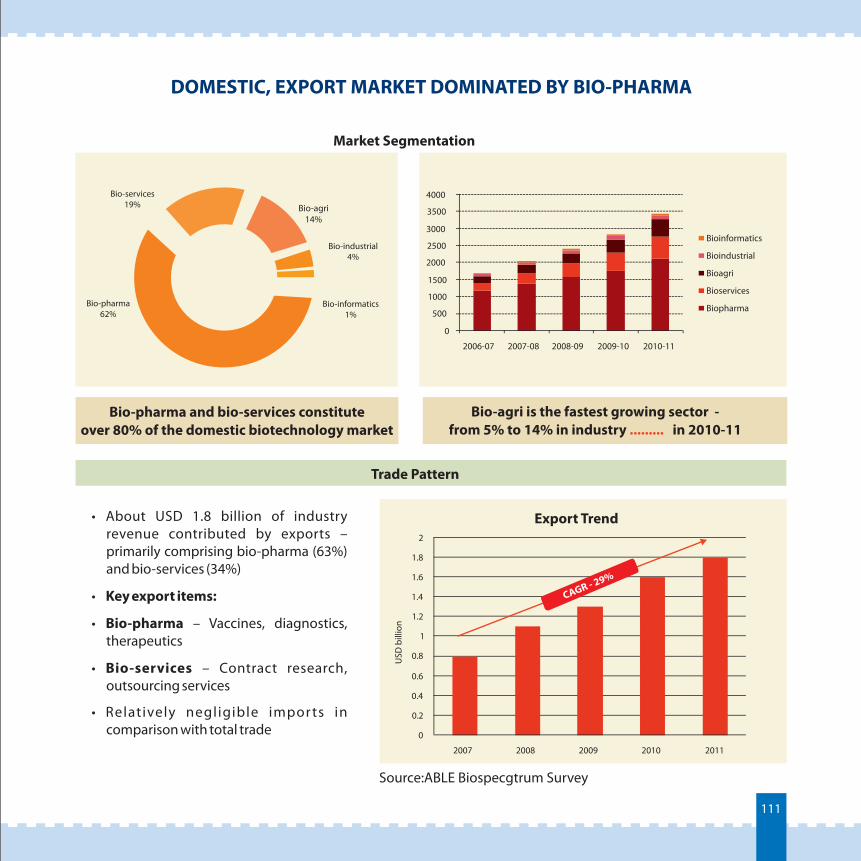
DOMESTIC, EXPORT MARKET DOMINATED BY BIO-PHARMA
Source:ABLE Biospecgtrum Survey
Bio-services19% Bio-agri
14%
Bio-industrial4%
Bio-informatics1%
Bio-pharma62%
0
500
1000
1500
2000
2500
3000
3500
4000
2006-07 2007-08 2008-09 2009-10 2010-11
Bioinformatics
Bioindustrial
Bioagri
Bioservices
Biopharma
Market Segmentation
Bio-pharma and bio-services constitute over 80% of the domestic biotechnology market
• About USD 1.8 billion of industry revenue contributed by exports – primarily comprising bio-pharma (63%) and bio-services (34%)
• Key export items:
• Bio-pharma – Vaccines, diagnostics, therapeutics
• Bio-services – Contract research, outsourcing services
• Relatively negligible impor ts in comparison with total trade
Bio-agri is the fastest growing sector - from 5% to 14% in industry in 2010-11.........
0
0.2
0.4
0.6
0.8
1
1.2
1.4
1.6
1.8
2
2007 2008 2009 2010 2011
Trade Pattern
Export Trend
USD
bill
ion
111
CAGR - 29%
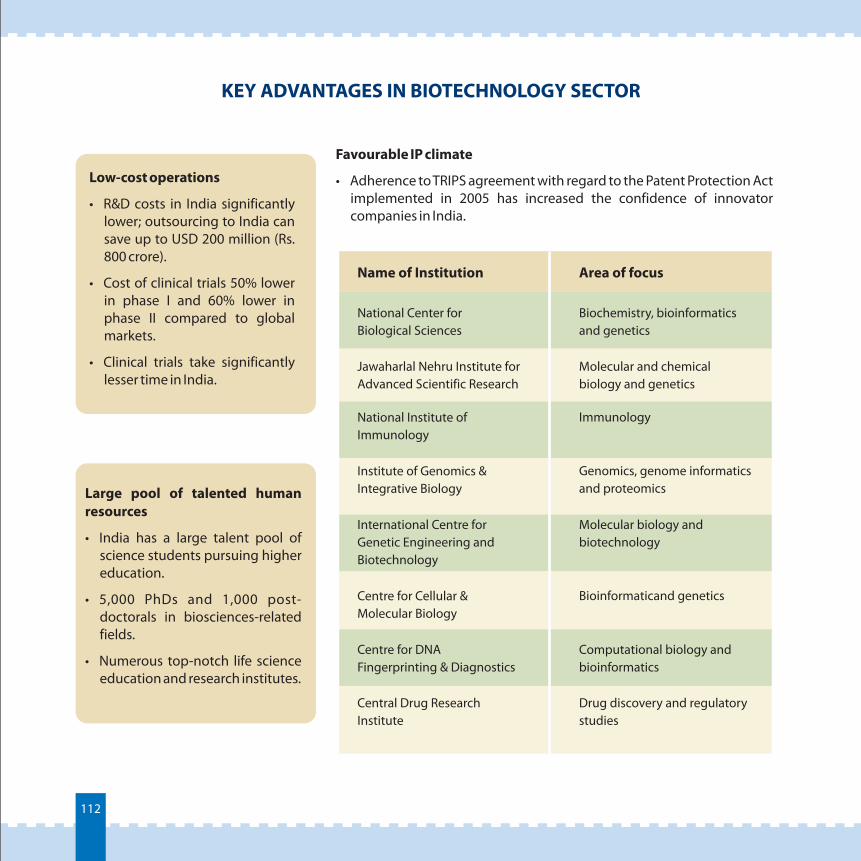
KEY ADVANTAGES IN BIOTECHNOLOGY SECTOR
Low-cost operations
• R&D costs in India significantly lower; outsourcing to India can save up to USD 200 million (Rs. 800 crore).
• Cost of clinical trials 50% lower in phase I and 60% lower in phase II compared to global markets.
• Clinical trials take significantly lesser time in India.
Favourable IP climate
• Adherence to TRIPS agreement with regard to the Patent Protection Act implemented in 2005 has increased the confidence of innovator companies in India.
Large pool of talented human resources
• India has a large talent pool of science students pursuing higher education.
• 5,000 PhDs and 1,000 post-doctorals in biosciences-related fields.
• Numerous top-notch life science education and research institutes.
Name of Institution Area of focus
National Center for Biological Sciences
Jawaharlal Nehru Institute for Advanced Scientific Research
Biochemistry, bioinformatics and genetics
Molecular and chemical biology and genetics
National Institute ofImmunology
Institute of Genomics & Integrative Biology
International Centre for Genetic Engineering and Biotechnology
Centre for Cellular & Molecular Biology
Centre for DNA Fingerprinting & Diagnostics
Central Drug Research Institute
Immunology
Genomics, genome informatics and proteomics
Molecular biology and biotechnology
Bioinformaticand genetics
Computational biology and bioinformatics
Drug discovery and regulatory studies
112
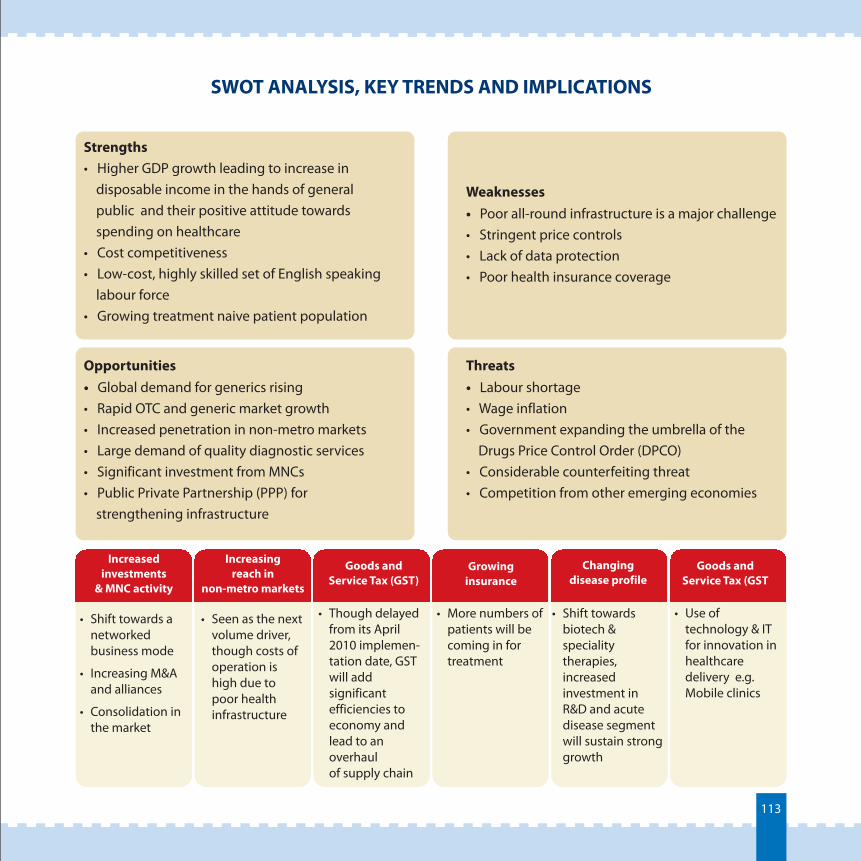
SWOT ANALYSIS, KEY TRENDS AND IMPLICATIONS
Strengths• Higher GDP growth leading to increase in disposable income in the hands of general public and their positive attitude towards spending on healthcare• Cost competitiveness• Low-cost, highly skilled set of English speaking labour force• Growing treatment naive patient population
Weaknesses• Poor all-round infrastructure is a major challenge• Stringent price controls• Lack of data protection• Poor health insurance coverage
Opportunities• Global demand for generics rising• Rapid OTC and generic market growth• Increased penetration in non-metro markets• Large demand of quality diagnostic services• Significant investment from MNCs• Public Private Partnership (PPP) for strengthening infrastructure
Threats• Labour shortage• Wage inflation• Government expanding the umbrella of the Drugs Price Control Order (DPCO)• Considerable counterfeiting threat• Competition from other emerging economies
Increased investments
& MNC activity
• Shift towards a networked business mode
Increasing M&A and alliances
Consolidation in the market
•
•
Increasing reach in
non-metro markets
Goods and Service Tax (GST)
Growing insurance
Changing disease profile
Goods and Service Tax (GST
• Seen as the next volume driver, though costs of operation is high due to poor health infrastructure
• Though delayed from its April 2010 implemen- tation date, GST will add significant efficiencies to economy and lead to an overhaul of supply chain
• More numbers of patients will be coming in for treatment
• Shift towards biotech & speciality therapies, increased investment in R&D and acute disease segment will sustain strong growth
• Use of technology & IT for innovation in healthcare delivery e.g. Mobile clinics
113
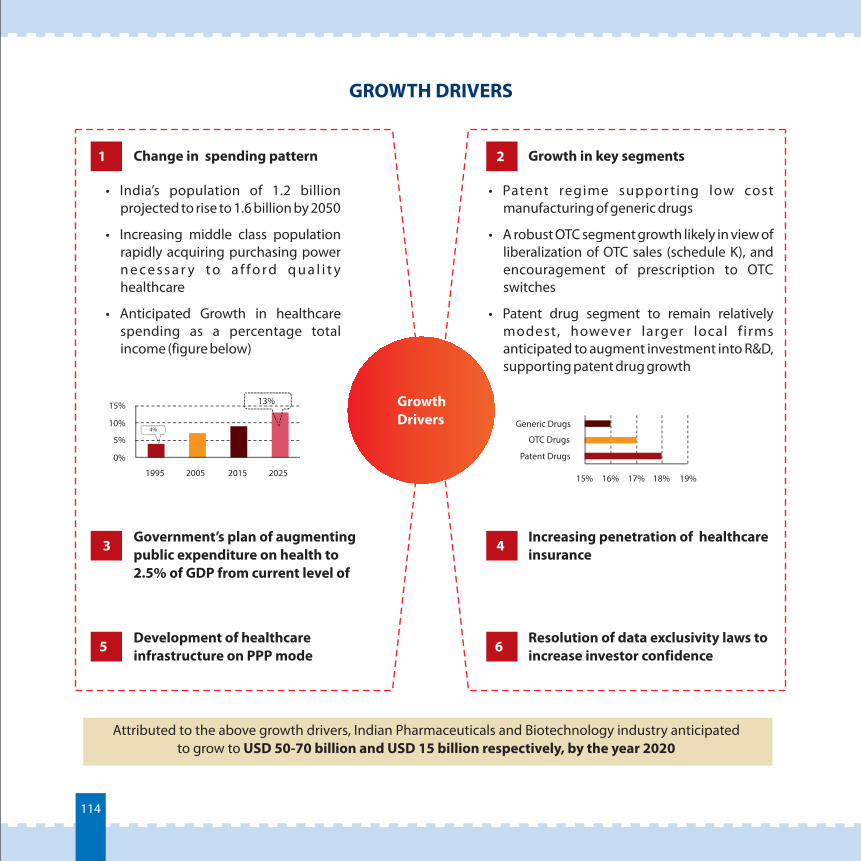
5
GROWTH DRIVERS
Attributed to the above growth drivers, Indian Pharmaceuticals and Biotechnology industry anticipated to grow to USD 50-70 billion and USD 15 billion respectively, by the year 2020
Growth in segmentskey
• India’s population of 1.2 billion projected to rise to 1.6 billion by 2050
Increasing middle class population rapidly acquiring purchasing power n e c e s s a r y t o a f f o r d q u a l i t y healthcare
Anticipated Growth in healthcare spending as a percentage total income (figure below)
•
•
• Patent regime suppor ting low cost manufacturing of generic drugs
A robust OTC segment growth likely in view of liberalization of OTC sales (schedule K), and encouragement of prescription to OTC switches
Patent drug segment to remain relatively modest, however larger local f irms anticipated to augment investment into R&D, supporting patent drug growth
•
•
15% 16% 17% 18% 19%
Patent Drugs
OTC Drugs
Generic Drugs
Government’s plan of augmenting public expenditure on health to 2.5% of GDP from current level of
Increasing penetration of healthcare insurance
Development of healthcare infrastructure on PPP mode
Resolution of data exclusivity laws to investor confidenceincrease
2 1 Change in spending pattern
0%
5%
10%
15%
1995 2005 2015 2025
13%
4%
3
6
4
GrowthDrivers
114
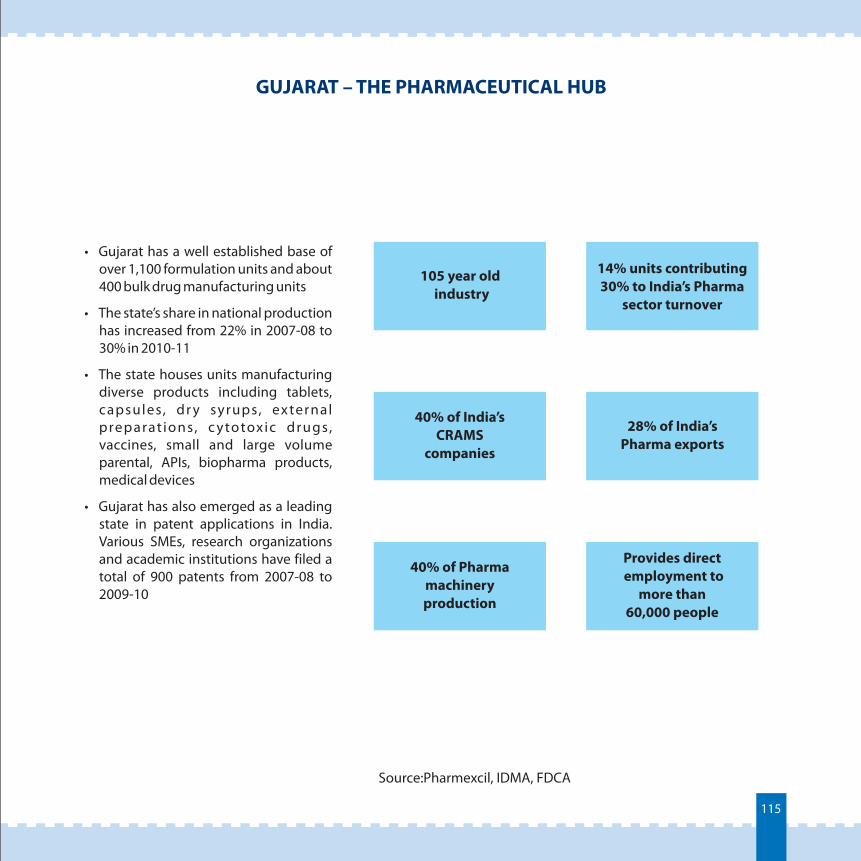
GUJARAT – THE PHARMACEUTICAL HUB
• Gujarat has a well established base of over 1,100 formulation units and about 400 bulk drug manufacturing units
The state’s share in national production has increased from 22% in 2007-08 to 30% in 2010-11
The state houses units manufacturing diverse products including tablets, capsules, dr y syrups, ex ternal preparat ions, c ytotoxic drugs, vaccines, small and large volume parental, APIs, biopharma products, medical devices
Gujarat has also emerged as a leading state in patent applications in India. Various SMEs, research organizations and academic institutions have filed a total of 900 patents from 2007-08 to 2009-10
•
•
•
105 year old industry
40% of India’s CRAMS
companies
28% of India’s Pharma exports
40% of Pharma machinery production
Provides direct employment to
more than 60,000 people
Source:Pharmexcil, IDMA, FDCA
14% units contributing 30% to India’s Pharma
sector turnover
115
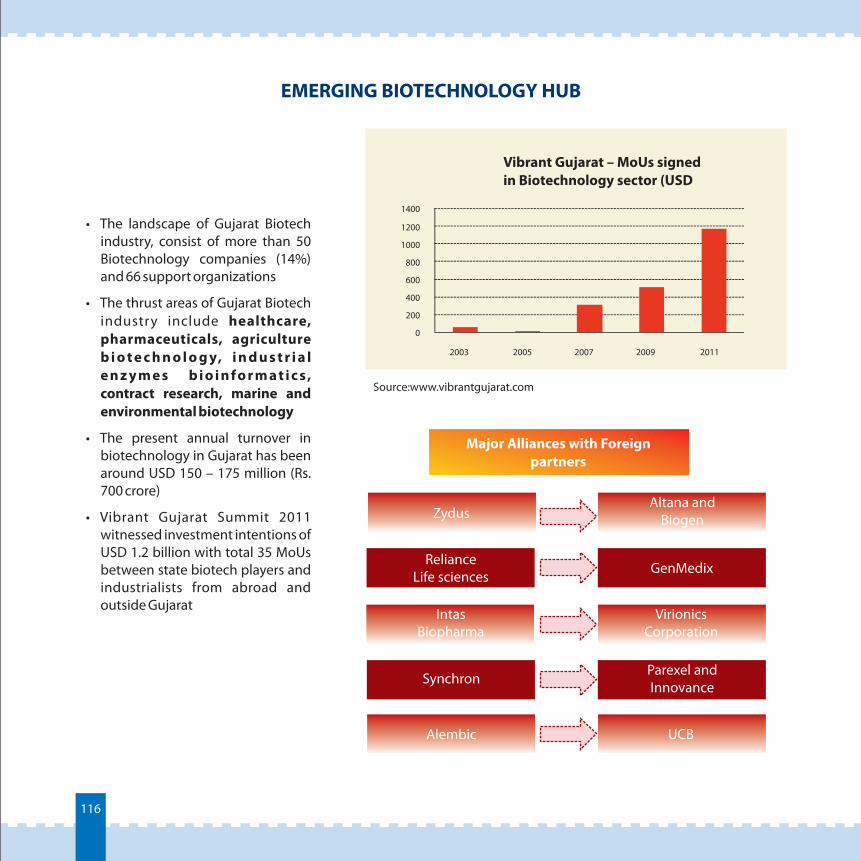
Alembic
Synchron
IntasBiopharma
EMERGING BIOTECHNOLOGY HUB
• The landscape of Gujarat Biotech industry, consist of more than 50 Biotechnology companies (14%) and 66 support organizations
The thrust areas of Gujarat Biotech industry include healthcare, pharmaceuticals, agriculture b i o t e c h n o l o g y, i n d u s t r i a l e n z y m e s b i o i n f o r m a t i c s , contract research, marine and environmental biotechnology
•
•
•
The present annual turnover in biotechnology in Gujarat has been around USD 150 – 175 million (Rs. 700 crore)
Vibrant Gujarat Summit 2011 witnessed investment intentions of USD 1.2 billion with total 35 MoUs between state biotech players and industrialists from abroad and outside Gujarat
0
200
400
600
800
1000
1200
1400
2003 2005 2007 2009 2011
Vibrant Gujarat – MoUs signed in Biotechnology sector (USD
Major Alliances with Foreignpartners
ZydusAltana
Biogen and
RelianceLife sciences GenMedix
VirionicsCorporation
Parexel Innovance
and
UCB
Source:www.vibrantgujarat.com
116
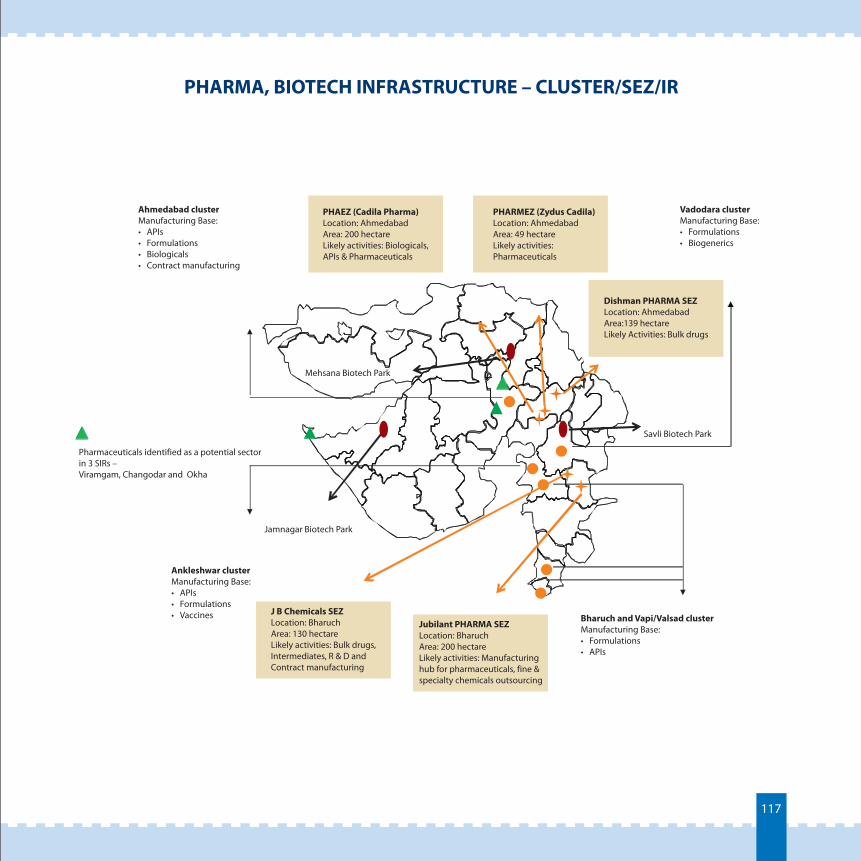
PHARMA, BIOTECH INFRASTRUCTURE – CLUSTER/SEZ/IR
J B Chemicals SEZLocation: BharuchArea: 130 hectareLikely activities: Bulk drugs, Intermediates, R & D andContract manufacturing
Mehsana Biotech Park
Savli Biotech Park
Jamnagar Biotech Park
Pharmaceuticals identified as a potential sector in 3 SIRs – Viramgam, Changodar and Okha
Ankleshwar cluster Manufacturing Base:• APIs • Formulations• Vaccines Bharuch and Vapi/Valsad cluster
Manufacturing Base:• Formulations• APIs
Vadodara cluster Manufacturing Base:• Formulations• Biogenerics
Ahmedabad cluster Manufacturing Base:• APIs • Formulations• Biologicals • Contract manufacturing
PHAEZ (Cadila Pharma)Location: AhmedabadArea: 200 hectareLikely activities: Biologicals, APIs & Pharmaceuticals
PHARMEZ (Zydus Cadila)Location: AhmedabadArea: 49 hectareLikely activities: Pharmaceuticals
Jubilant PHARMA SEZLocation: BharuchArea: 200 hectareLikely activities: Manufacturinghub for pharmaceuticals, fine & specialty chemicals outsourcing
Dishman PHARMA SEZLocation: AhmedabadArea:139 hectareLikely Activities: Bulk drugs
117
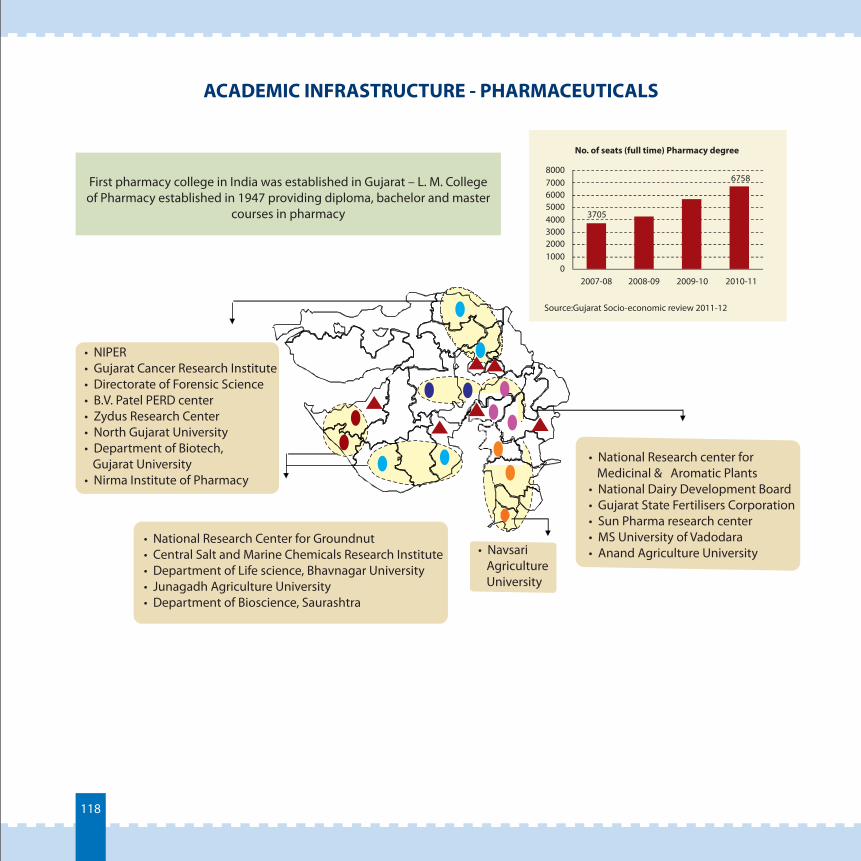
ACADEMIC INFRASTRUCTURE - PHARMACEUTICALS
First pharmacy college in India was established in Gujarat – L. M. College of Pharmacy established in 1947 providing diploma, bachelor and master
courses in pharmacy
• National Research center for Medicinal & Aromatic Plants
National Dairy Development BoardGujarat State Fertilisers CorporationSun Pharma research centerMS University of VadodaraAnand Agriculture University
• • • • • • Navsari
Agriculture University
• National Research Center for GroundnutCentral Salt and Marine Chemicals Research InstituteDepartment of Life science, Bhavnagar UniversityJunagadh Agriculture UniversityDepartment of Bioscience, Saurashtra
• • • •
• NIPERGujarat Cancer Research InstituteDirectorate of Forensic ScienceB.V. Patel PERD centerZydus Research CenterNorth Gujarat UniversityDepartment of Biotech,
Gujarat UniversityNirma Institute of Pharmacy
• • • • • •
•
010002000300040005000600070008000
2007-08 2008-09 2009-10 2010-11
Source:Gujarat Socio-economic review 2011-12
118
No. of seats (full time) Pharmacy degree
3705
6758
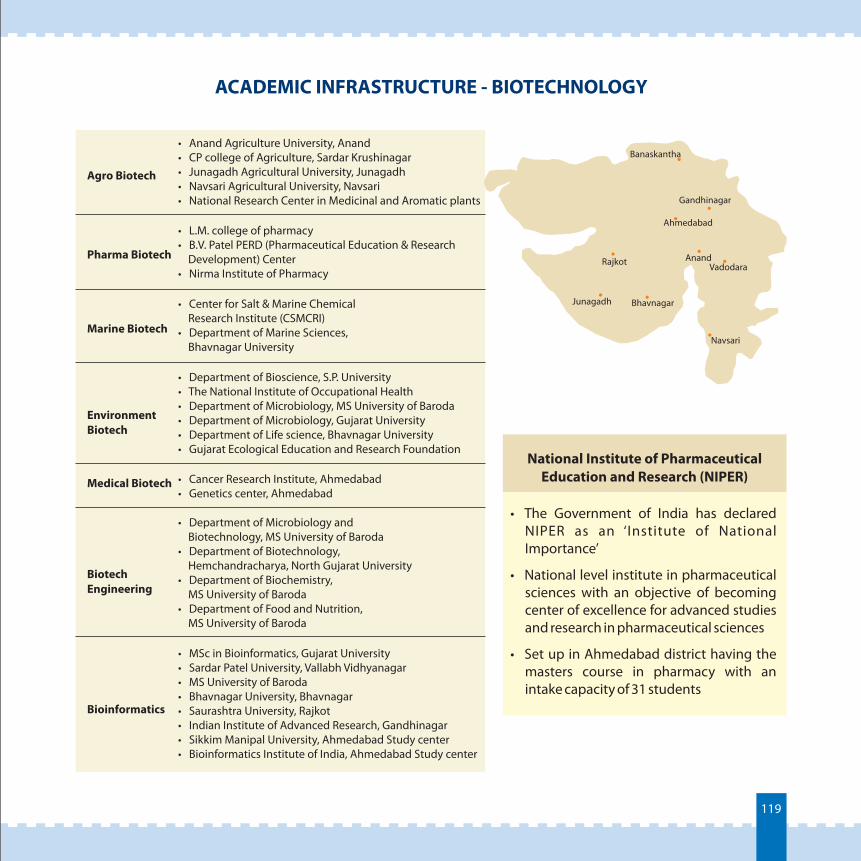
ACADEMIC INFRASTRUCTURE - BIOTECHNOLOGY
Rajkot
Junagadh Bhavnagar
Navsari
Ahmedabad
Anand
Banaskantha
Gandhinagar
Vadodara
• The Government of India has declared NIPER as an ‘Institute of National Importance’
National level institute in pharmaceutical sciences with an objective of becoming center of excellence for advanced studies and research in pharmaceutical sciences
Set up in Ahmedabad district having the masters course in pharmacy with an intake capacity of 31 students
•
•
• Anand Agriculture University, Anand • CP college of Agriculture, Sardar Krushinagar • Junagadh Agricultural University, Junagadh • Navsari Agricultural University, Navsari • National Research Center in Medicinal and Aromatic plants
• L.M. college of pharmacy• B.V. Patel PERD (Pharmaceutical Education & Research Development) Center• Nirma Institute of Pharmacy
• Center for Salt & Marine Chemical Research Institute (CSMCRI)• Department of Marine Sciences, Bhavnagar University
• Department of Bioscience, S.P. University• The National Institute of Occupational Health• Department of Microbiology, MS University of Baroda• Department of Microbiology, Gujarat University• Department of Life science, Bhavnagar University• Gujarat Ecological Education and Research Foundation
• Cancer Research Institute, Ahmedabad• Genetics center, Ahmedabad
• Department of Microbiology and Biotechnology, MS University of Baroda• Department of Biotechnology, Hemchandracharya, North Gujarat University• Department of Biochemistry, MS University of Baroda• Department of Food and Nutrition, MS University of Baroda
• MSc in Bioinformatics, Gujarat University• Sardar Patel University, Vallabh Vidhyanagar• MS University of Baroda• Bhavnagar University, Bhavnagar• Saurashtra University, Rajkot• Indian Institute of Advanced Research, Gandhinagar• Sikkim Manipal University, Ahmedabad Study center• Bioinformatics Institute of India, Ahmedabad Study center
Agro Biotech
Pharma Biotech
Marine Biotech
Environment Biotech
Medical Biotech
Biotech Engineering
Bioinformatics
National Institute of Pharmaceutical Education and Research (NIPER)
119
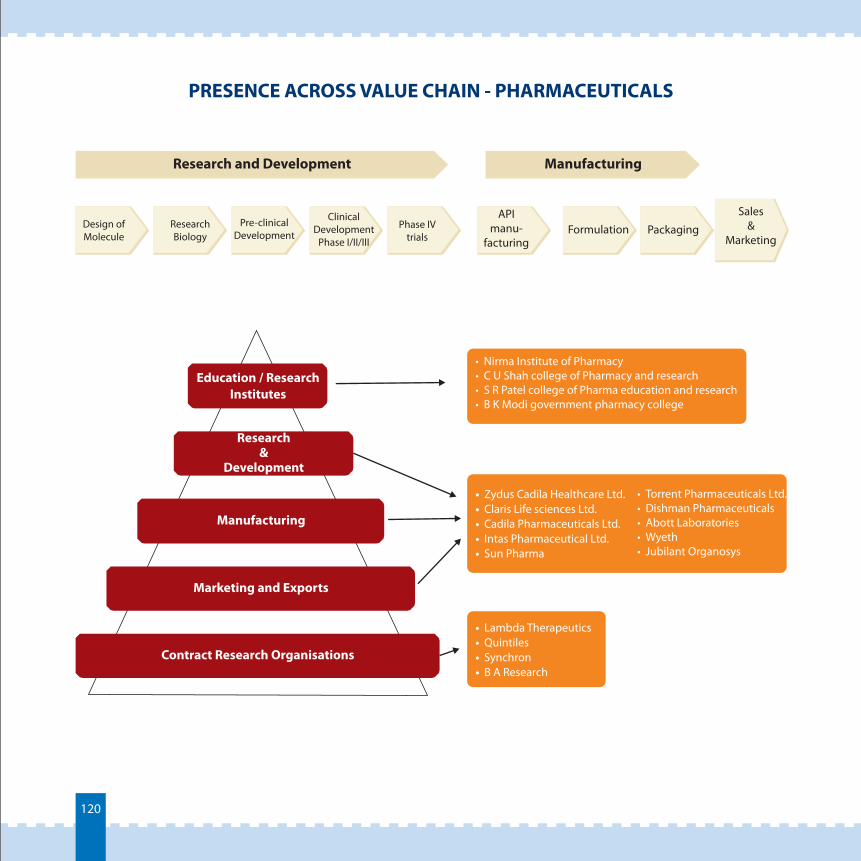
PRESENCE ACROSS VALUE CHAIN - PHARMACEUTICALS
Research and Development Manufacturing
Education / ResearchInstitutes
Research&
Development
Marketing and Exports
Contract Research Organisations
• Nirma Institute of Pharmacy• C U Shah college of Pharmacy and research• S R Patel college of Pharma education and research• B K Modi government pharmacy college
• • Claris Life sciences Ltd.• Cadila Pharmaceuticals Ltd.• Intas Pharmaceutical Ltd.• Sun Pharma
Zydus Cadila Healthcare Ltd. • • Dishman Pharmaceuticals• Abott Laboratories• Wyeth• Jubilant Organosys
Torrent Pharmaceuticals Ltd.
• • Quintiles• Synchron• B A Research
Lambda Therapeutics
Manufacturing
Formulation Packaging
Sales&
Marketing
ClinicalDevelopment
Phase I/II/III
Phase IVtrials
ResearchBiology
Design ofMolecule
Pre-clinicalDevelopment
APImanu-
facturing
120
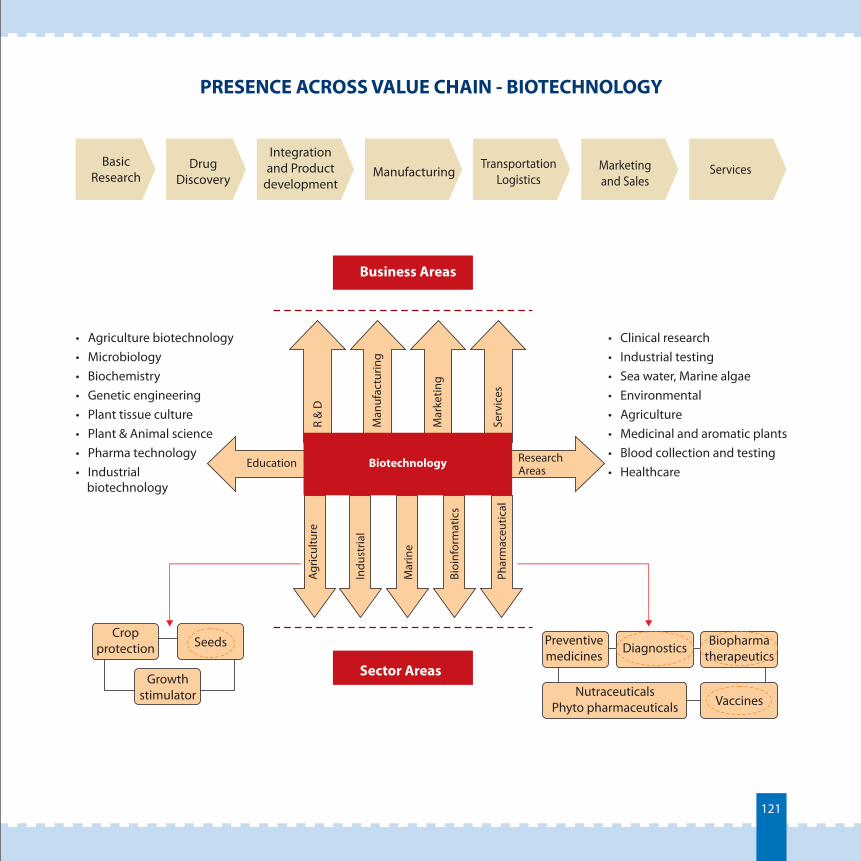
PRESENCE ACROSS VALUE CHAIN - BIOTECHNOLOGY
BasicResearch
Drug Discovery
Integration and Product
developmentManufacturing
TransportationLogistics
Marketing and Sales
Services
Business Areas
• Agriculture biotechnologyMicrobiologyBiochemistryGenetic engineeringPlant tissue culturePlant & Animal sciencePharma technologyIndustrial
biotechnology
• • • • • • •
• Clinical researchIndustrial testingSea water, Marine algaeEnvironmentalAgricultureMedicinal and aromatic plantsBlood collection and testingHealthcare
• • • • • • •
R &
D
Mar
ketin
g
Serv
ices
Education ResearchAreas
Agric
ultu
re
Bioi
nfor
mat
ics
Phar
mac
eutic
al
Mar
ine
Indu
stria
lM
anuf
actu
ring
Biotechnology
Cropprotection Seeds
Growthstimulator
Sector Areas
Preventivemedicines
Diagnostics Biopharma therapeutics
NutraceuticalsPhyto pharmaceuticals Vaccines
121
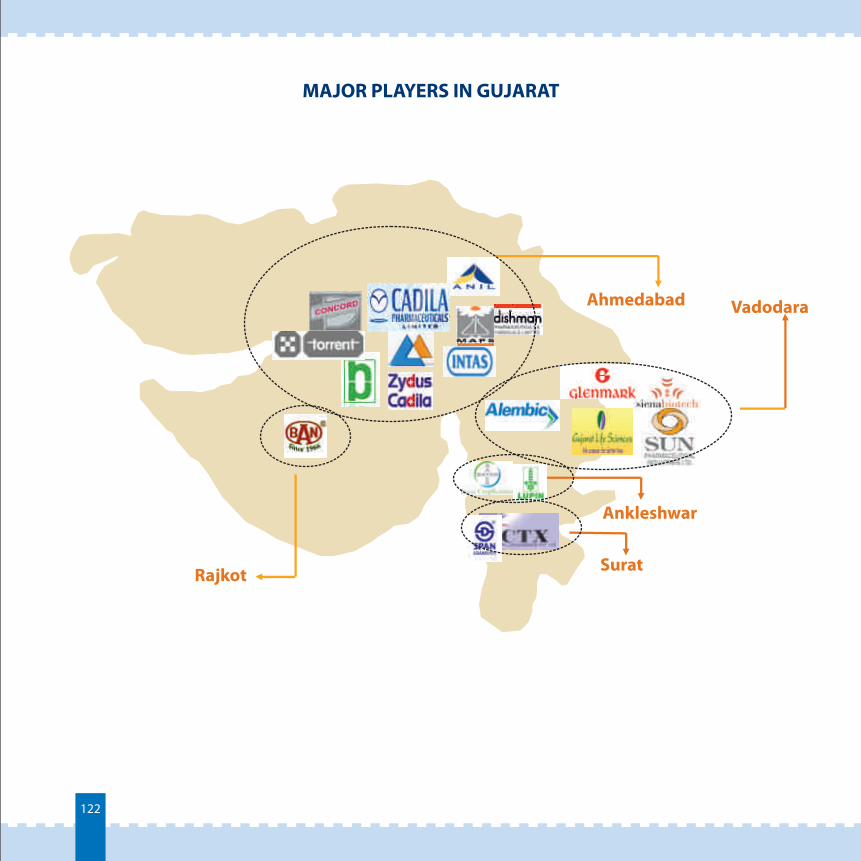
MAJOR PLAYERS IN GUJARAT
Ahmedabad
Ankleshwar
Vadodara
SuratRajkot
122
POLICY INTERVENTIONS
4.5.2123
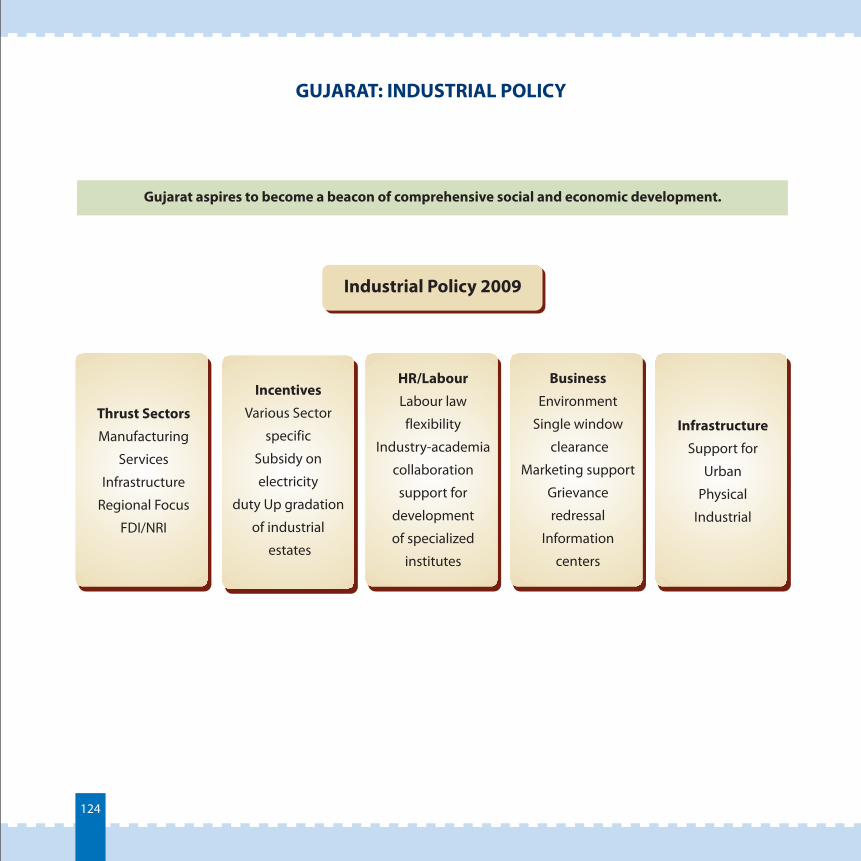
GUJARAT: INDUSTRIAL POLICY
Gujarat aspires to become a beacon of comprehensive social and economic development.
Incentives
Various Sector
specific
Subsidy on
electricity
duty Up gradation
of industrial
estates
HR/Labour
Labour law
flexibility
Industry-academia
collaboration
support for
development
of specialized
institutes
Business
Environment
Single window
clearance
Marketing support
Grievance
redressal
Information
centers
Infrastructure
Support for
Urban
Physical
Industrial
Thrust Sectors
Manufacturing
Services
Infrastructure
Regional Focus
FDI/NRI
Industrial Policy 2009
124
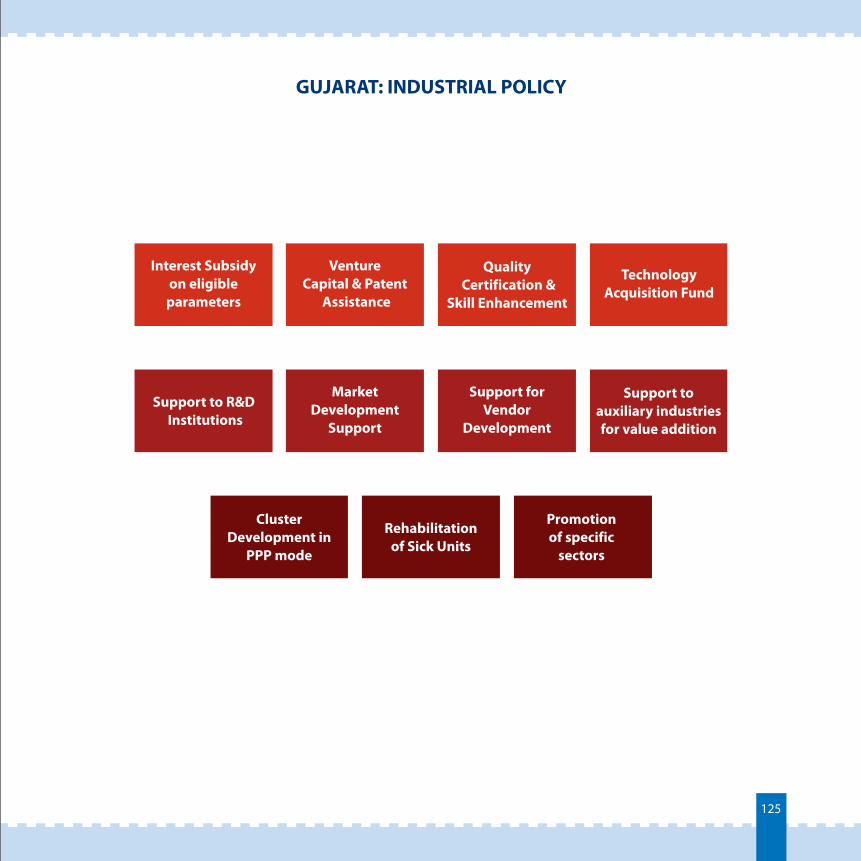
GUJARAT: INDUSTRIAL POLICY
Interest Subsidy on eligible
parameters
Venture Capital & Patent
Assistance
Quality Certification &
Skill Enhancement
Technology Acquisition Fund
Support to R&D Institutions
Market Development
Support
Support for Vendor
Development
Support to auxiliary industries for value addition
Cluster Development in
PPP mode
Rehabilitation of Sick Units
Promotion of specific
sectors
125
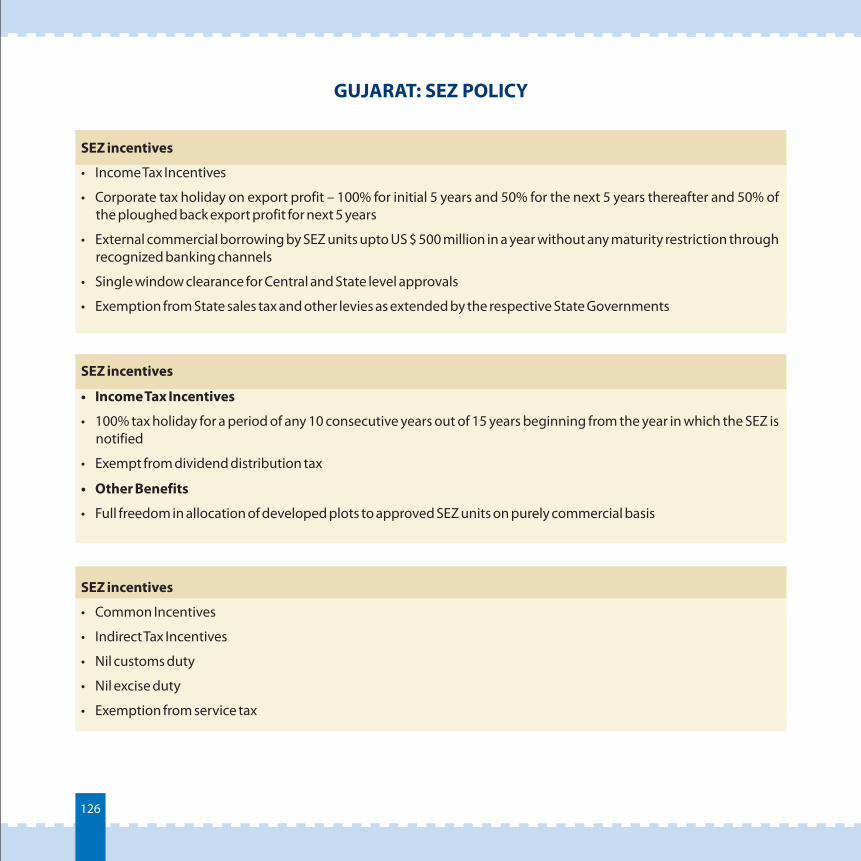
GUJARAT: SEZ POLICY
SEZ incentives
• Income Tax Incentives
• 100% tax holiday for a period of any 10 consecutive years out of 15 years beginning from the year in which the SEZ is notified
• Exempt from dividend distribution tax
• Other Benefits
• Full freedom in allocation of developed plots to approved SEZ units on purely commercial basis
SEZ incentives
Income Tax Incentives
Single window clearance for Central and State level approvals
•
•
•
•
•
Corporate tax holiday on export profit – 100% for initial 5 years and 50% for the next 5 years thereafter and 50% of the ploughed back export profit for next 5 years
External commercial borrowing by SEZ units upto US $ 500 million in a year without any maturity restriction through recognized banking channels
Exemption from State sales tax and other levies as extended by the respective State Governments
SEZ incentives
• Common Incentives
• Indirect Tax Incentives
• Nil customs duty
• Nil excise duty
• Exemption from service tax
126
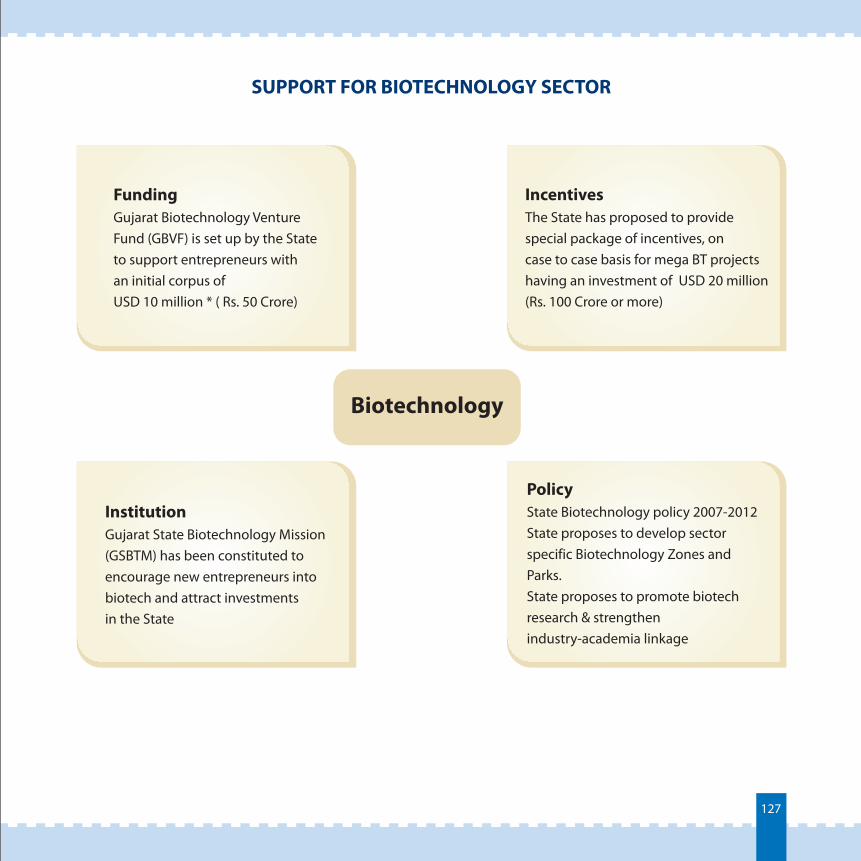
SUPPORT FOR BIOTECHNOLOGY SECTOR
FundingGujarat Biotechnology Venture Fund (GBVF) is set up by the State to support entrepreneurs with an initial corpus of USD 10 million * ( Rs. 50 Crore)
Biotechnology
InstitutionGujarat State Biotechnology Mission (GSBTM) has been constituted to encourage new entrepreneurs into biotech and attract investments in the State
PolicyState Biotechnology policy 2007-2012State proposes to develop sector specific Biotechnology Zones and Parks.State proposes to promote biotech research & strengthen industry-academia linkage
IncentivesThe State has proposed to provide special package of incentives, on case to case basis for mega BT projects having an investment of USD 20 million (Rs. 100 Crore or more)
127
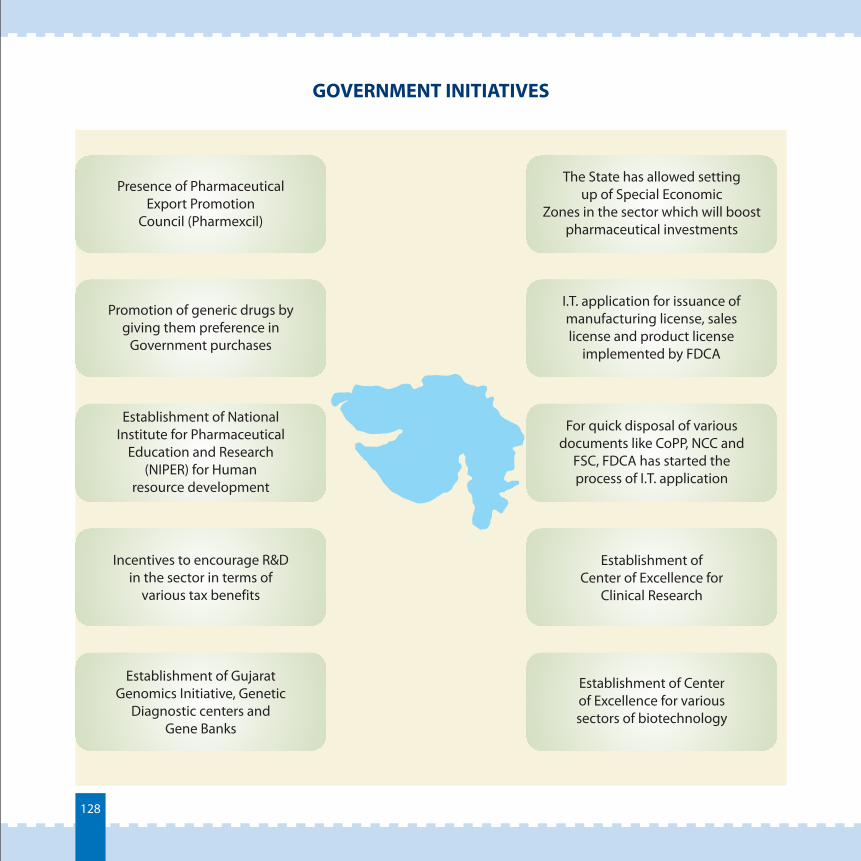
GOVERNMENT INITIATIVES
Presence of Pharmaceutical Export Promotion
Council (Pharmexcil)
The State has allowed setting up of Special Economic
Zones in the sector which will boost pharmaceutical investments
Promotion of generic drugs by giving them preference in
Government purchases
Establishment of National Institute for Pharmaceutical
Education and Research (NIPER) for Human
resource development
Incentives to encourage R&D in the sector in terms of
various tax benefits
Establishment of Gujarat Genomics Initiative, Genetic
Diagnostic centers and Gene Banks
I.T. application for issuance of manufacturing license, sales license and product license
implemented by FDCA
For quick disposal of various documents like CoPP, NCC and
FSC, FDCA has started the process of I.T. application
Establishment of Center of Excellence for
Clinical Research
Establishment of Center of Excellence for various sectors of biotechnology
128
INVESTMENT OPPORTUNITIES
4.5.3129
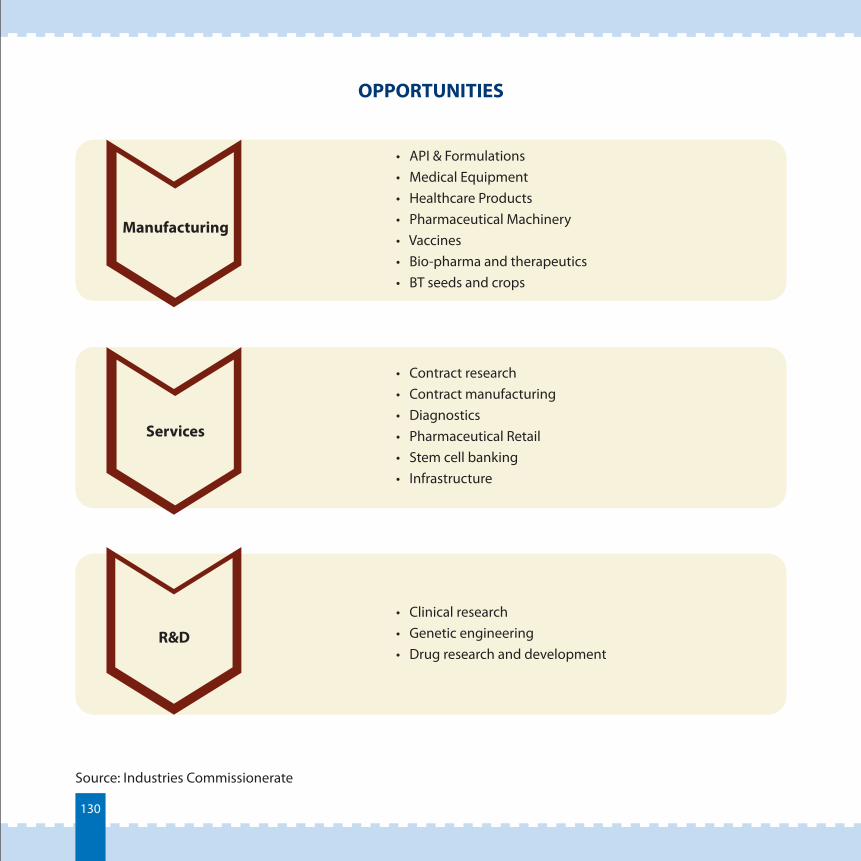
OPPORTUNITIES
• API & FormulationsMedical EquipmentHealthcare ProductsPharmaceutical MachineryVaccinesBio-pharma and therapeuticsBT seeds and crops
• • • • • •
• Contract researchContract manufacturingDiagnosticsPharmaceutical RetailStem cell bankingInfrastructure
• • • • •
• Clinical researchGenetic engineeringDrug research and development
• •
Manufacturing
R&D
Services
Source: Industries Commissionerate
130
GEMS & JEWELLERY
4.6131
OVERVIEW
Source: Industries Commissionerate
4.6.1132
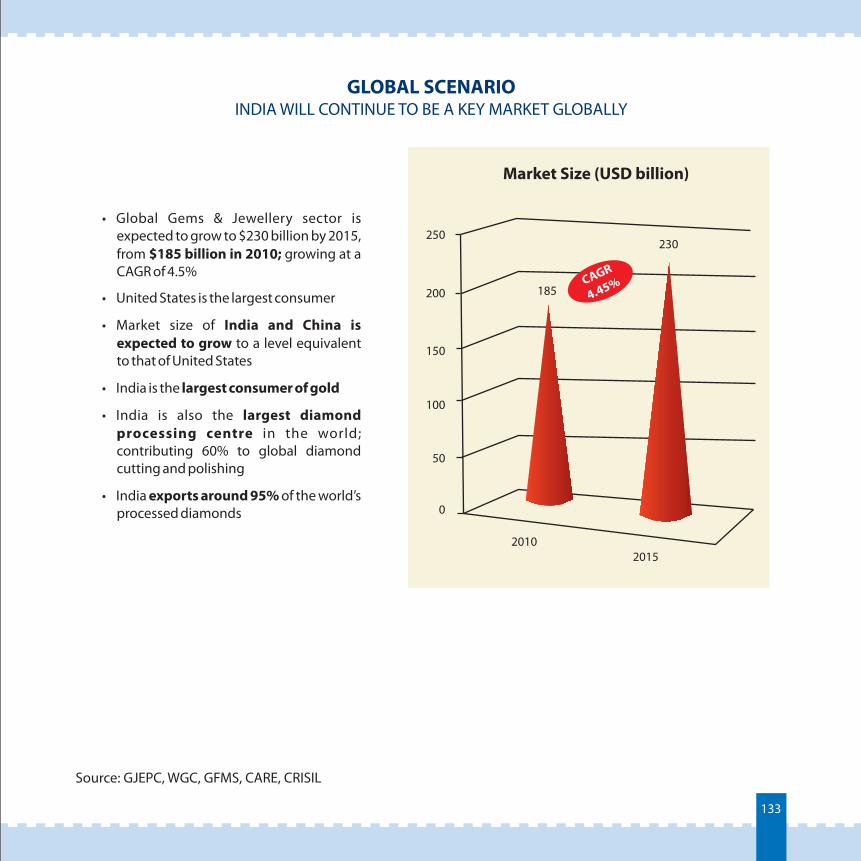
GLOBAL SCENARIOINDIA WILL CONTINUE TO BE A KEY MARKET GLOBALLY
Source: GJEPC, WGC, GFMS, CARE, CRISIL
• Global Gems & Jewellery sector is expected to grow to $230 billion by 2015, from $185 billion in 2010; growing at a CAGR of 4.5%
• United States is the largest consumer
• Market size of India and China is expected to grow to a level equivalent to that of United States
• India is the largest consumer of gold
• India is also the largest diamond processing centre in the world; contributing 60% to global diamond cutting and polishing
• India exports around 95% of the world’s processed diamonds
Market Size (USD billion)
250
200
150
100
50
0
185
230
20102015
CAGR
4.45%
133
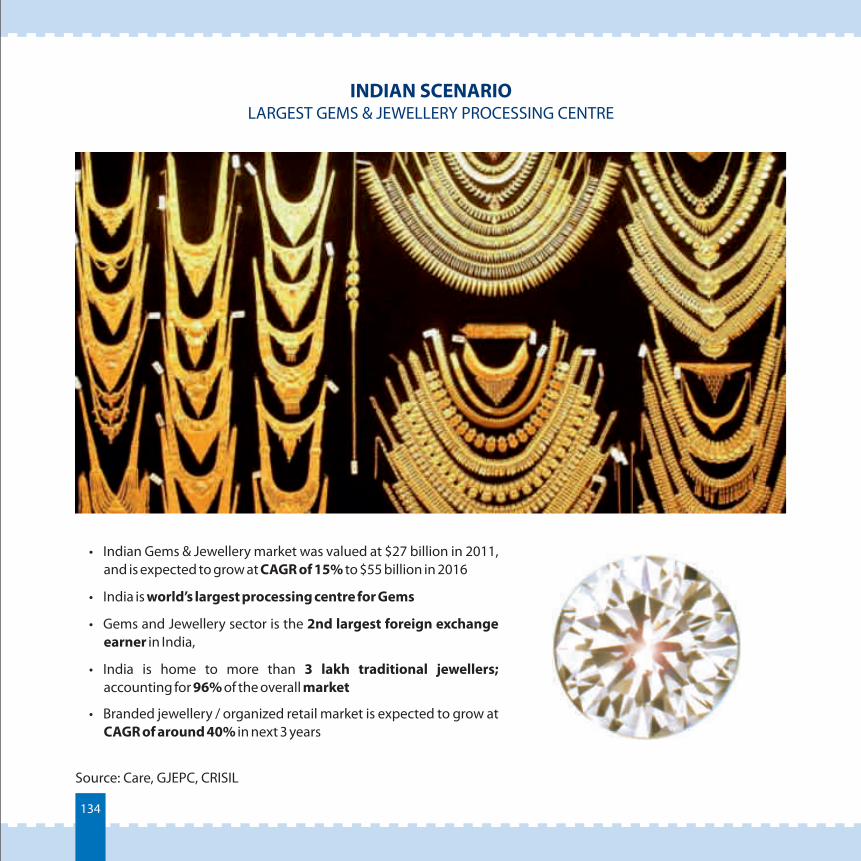
INDIAN SCENARIOLARGEST GEMS & JEWELLERY PROCESSING CENTRE
Source: Care, GJEPC, CRISIL
• Indian Gems & Jewellery market was valued at $27 billion in 2011, and is expected to grow at CAGR of 15% to $55 billion in 2016
• India is world’s largest processing centre for Gems
• Gems and Jewellery sector is the 2nd largest foreign exchange earner in India,
• India is home to more than 3 lakh traditional jewellers; accounting for 96% of the overall market
• Branded jewellery / organized retail market is expected to grow at CAGR of around 40% in next 3 years
134
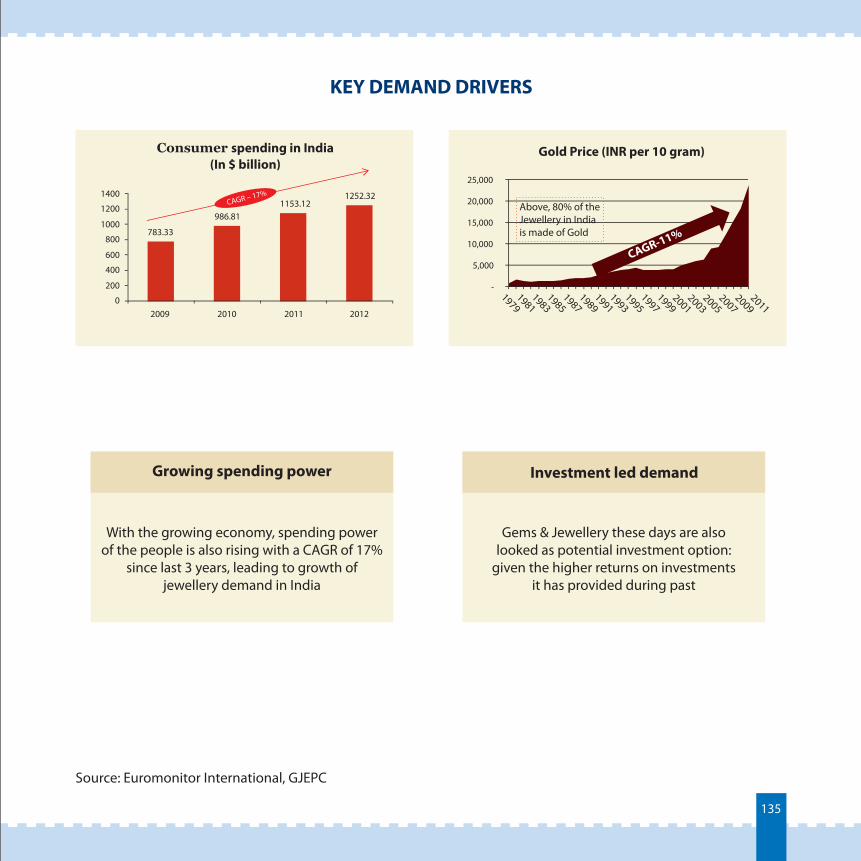
KEY DEMAND DRIVERS
Source: Euromonitor International, GJEPC
783.33
986.811153.12
1252.32
0
200
400
600
800
1000
1200
1400
2009 2010 2011 2012
Consumer
spending in India(In $ billion)
-
5,000
10,000
15,000
20,000
25,000
Gold Price (INR per 10 gram)
With the growing economy, spending power of the people is also rising with a CAGR of 17%
since last 3 years, leading to growth of jewellery demand in India
Gems & Jewellery these days are also looked as potential investment option:
given the higher returns on investments it has provided during past
Growing spending power Investment led demand
CAGR-11%
19791981
19831985
19891987
19911993
19951997
19992001
20032005
20072009
2011
CAGR – 17%
135
Above, 80% of the Jewellery in India is made of Gold
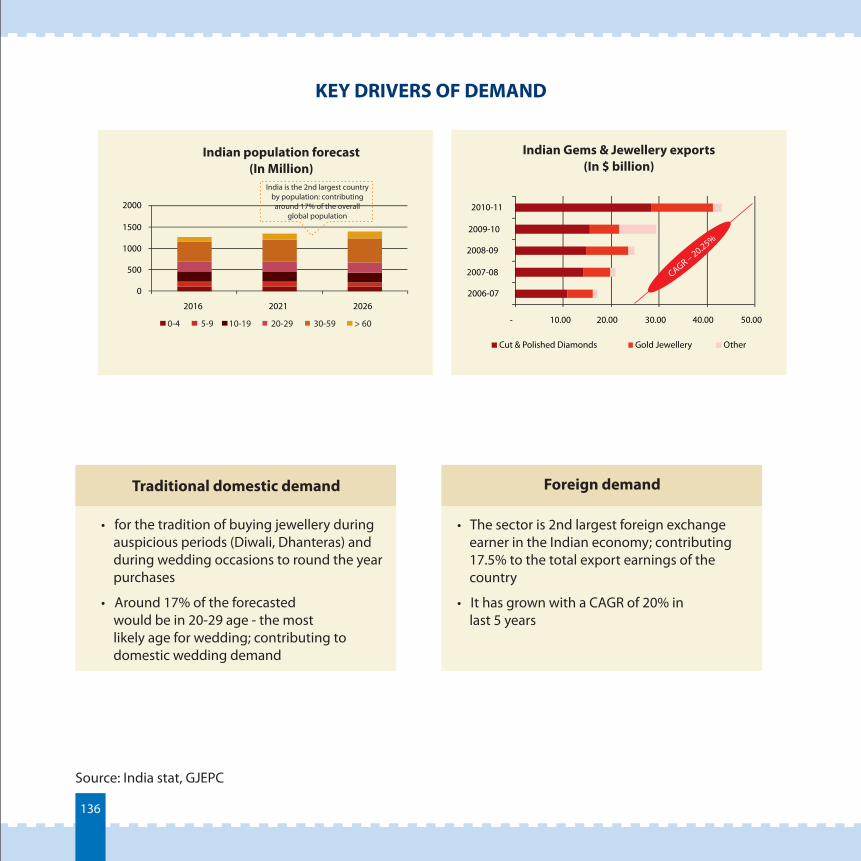
KEY DRIVERS OF DEMAND
Source: India stat, GJEPC
0
500
1000
1500
2000
2016 2021 2026
Indian population forecast(In Million)
- 10.00 20.00 30.00 40.00 50.00
2006-07
2007-08
2008-09
2009-10
2010-11
Indian Gems & Jewellery exports (In $ billion)
Cut & Polished Diamonds Gold Jewellery Other
• for the tradition of buying jewellery during auspicious periods (Diwali, Dhanteras) and
during wedding occasions to round the year purchases
Around 17% of the forecasted would be in 20-29 age - the most likely age for wedding; contributing to domestic wedding demand
•
• The sector is 2nd largest foreign exchange earner in the Indian economy; contributing 17.5% to the total export earnings of the country
It has grown with a CAGR of 20% in last 5 years•
Traditional domestic demand Foreign demand
0-4 5-9 20-2910-19 30-59 > 60
India is the 2nd largest country by population: contributing around 17% of the overall
global population
CAGR – 20.25%
136
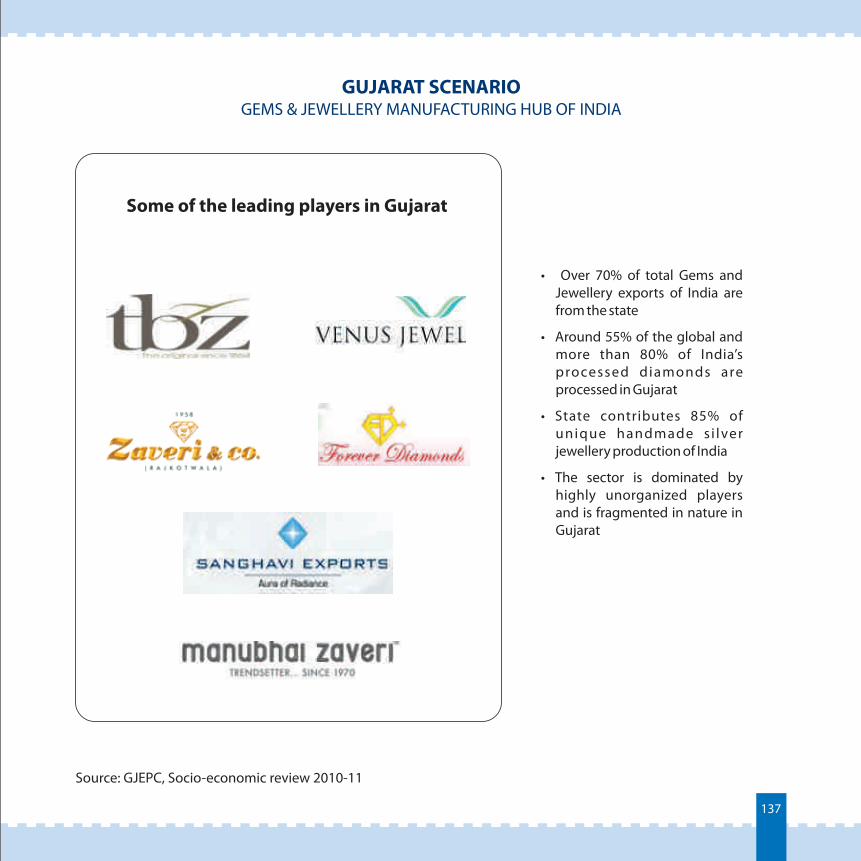
GUJARAT SCENARIOGEMS & JEWELLERY MANUFACTURING HUB OF INDIA
Source: GJEPC, Socio-economic review 2010-11
Some of the leading players in Gujarat
• Over 70% of total Gems and Jewellery exports of India are from the state
• Around 55% of the global and more than 80% of India’s processed diamonds are processed in Gujarat
• State contributes 85% of unique handmade s i lver jewellery production of India
• The sector is dominated by highly unorganized players and is fragmented in nature in Gujarat
137
SURAT: THE GLOBAL DIAMOND PROCESSING HUB
Source: iNDEXTb, GJEPC
• Surat is the largest diamond processing cluster in the world
• 90% of total diamonds in Gujarat are processed by about 10 ,000 diamond units located in and around Surat; employing work force of around 1 mn
• Presence of Indian diamond institute has lead to an increase in labour productivity
• Surat specializes in processing smallest low grade diamonds
Surat is called “A Silky City Sparkling with Diamonds”
138
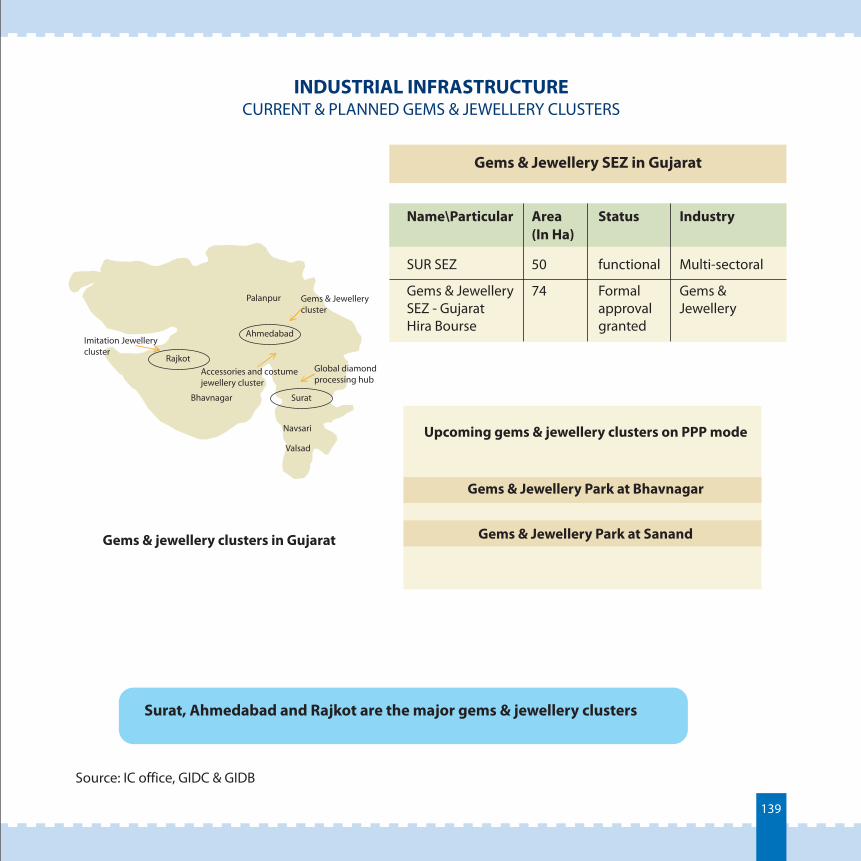
INDUSTRIAL INFRASTRUCTURECURRENT & PLANNED GEMS & JEWELLERY CLUSTERS
Source: IC office, GIDC & GIDB
Ahmedabad
Rajkot
Bhavnagar
Valsad
Palanpur
Navsari
Imitation Jewellerycluster
Global diamondprocessing hub
Gems & Jewellerycluster
Accessories and costumejewellery cluster
Gems & jewellery clusters in Gujarat
Surat, Ahmedabad and Rajkot are the major gems & jewellery clusters
Upcoming gems & jewellery clusters on PPP mode
Gems & Jewellery Park at Bhavnagar
Gems & Jewellery Park at Sanand
Gems & Jewellery SEZ in Gujarat
Name\Particular Area Status Industry
SUR SEZ 50 functional Multi-sectoral
Gems & Jewellery SEZ - Gujarat Hira Bourse
(In Ha)
74 Formal Gems &approval Jewellerygranted
139
Surat
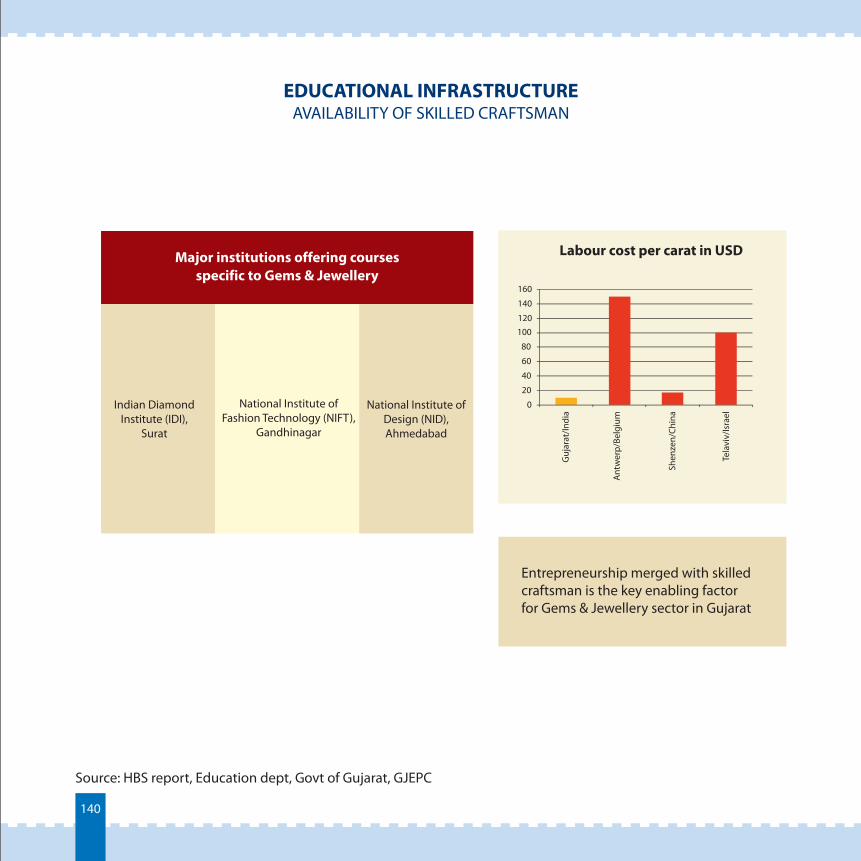
EDUCATIONAL INFRASTRUCTUREAVAILABILITY OF SKILLED CRAFTSMAN
Source: HBS report, Education dept, Govt of Gujarat, GJEPC
Major institutions offering courses specific to Gems & Jewellery
Entrepreneurship merged with skilled craftsman is the key enabling factor for Gems & Jewellery sector in Gujarat
0
20
40
60
80
100120
140
160
Labour cost per carat in USD
Indian Diamond Institute (IDI),
Surat
National Institute of Fashion Technology (NIFT),
Gandhinagar
National Institute of Design (NID), Ahmedabad
Guj
arat
/Indi
a
Ant
wer
p/Be
lgiu
m
Shen
zen/
Chin
a
Tela
viv/
Isra
el
140
POLICY INTERVENTIONS
4.6.2141
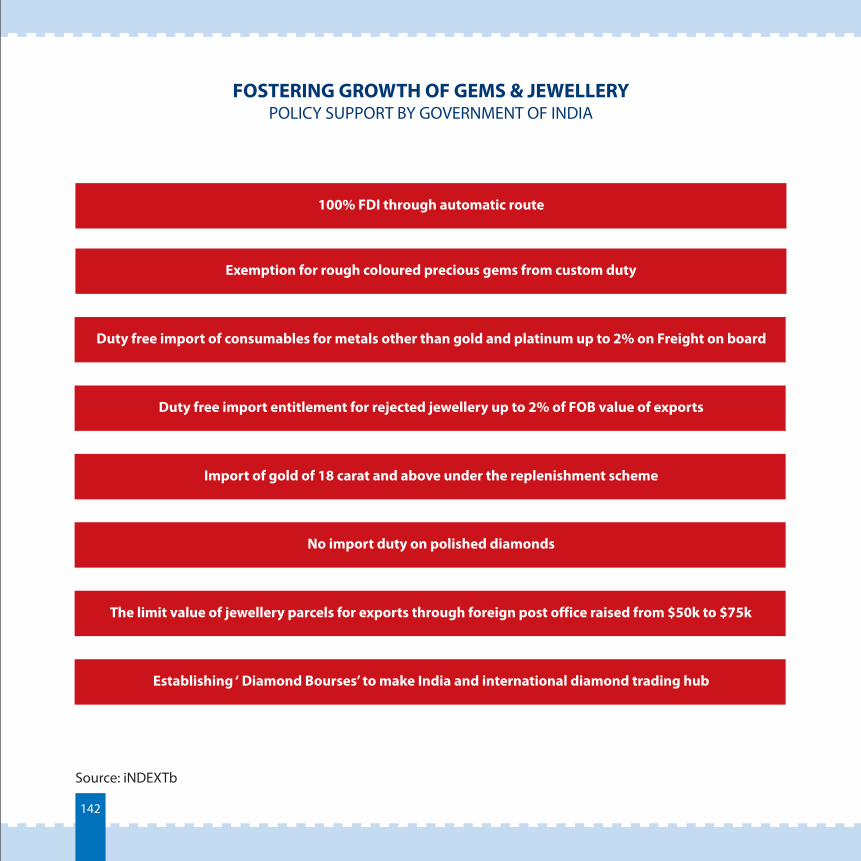
FOSTERING GROWTH OF GEMS & JEWELLERYPOLICY SUPPORT BY GOVERNMENT OF INDIA
Source: iNDEXTb
100% FDI through automatic route
Exemption for rough coloured precious gems from custom duty
Duty free import of consumables for metals other than gold and platinum up to 2% on Freight on board
Duty free import entitlement for rejected jewellery up to 2% of FOB value of exports
Import of gold of 18 carat and above under the replenishment scheme
No import duty on polished diamonds
The limit value of jewellery parcels for exports through foreign post office raised from $50k to $75k
Establishing ‘ Diamond Bourses’ to make India and international diamond trading hub
142
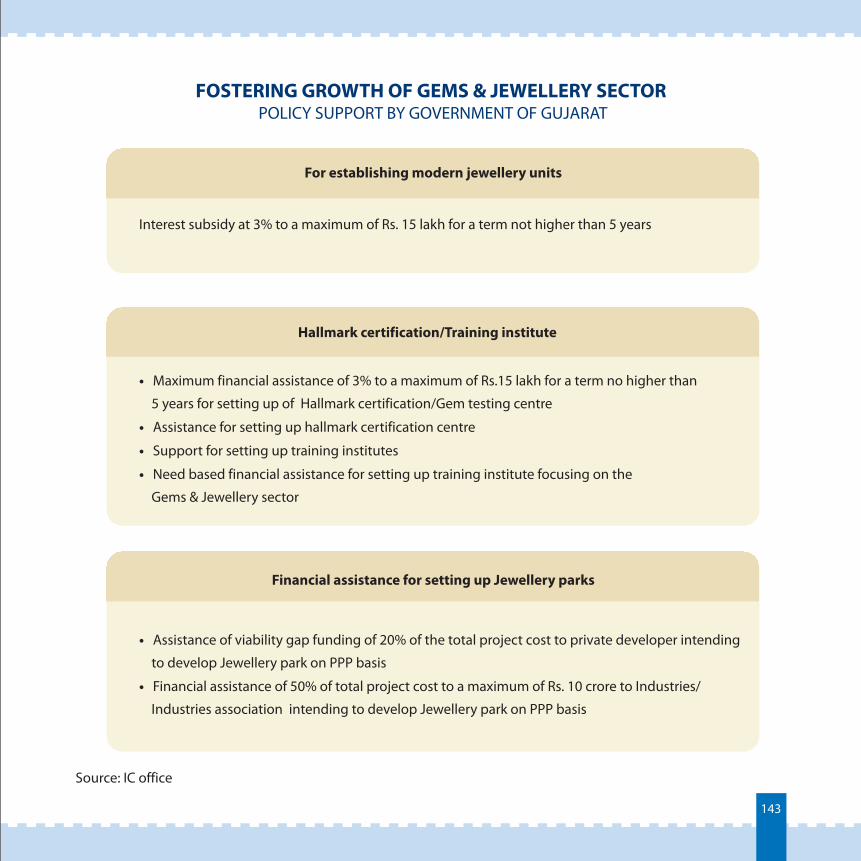
FOSTERING GROWTH OF GEMS & JEWELLERY SECTOR POLICY SUPPORT BY GOVERNMENT OF GUJARAT
Source: IC office
•
•
•
•
Maximum financial assistance of 3% to a maximum of Rs.15 lakh for a term no higher than
5 years for setting up of Hallmark certification/Gem testing centre
Assistance for setting up hallmark certification centre
Support for setting up training institutes
Need based financial assistance for setting up training institute focusing on the
Gems & Jewellery sector
• Assistance of viability gap funding of 20% of the total project cost to private developer intending
to develop Jewellery park on PPP basis
• Financial assistance of 50% of total project cost to a maximum of Rs. 10 crore to Industries/
Industries association intending to develop Jewellery park on PPP basis
Financial assistance for setting up Jewellery parks
Interest subsidy at 3% to a maximum of Rs. 15 lakh for a term not higher than 5 years
Hallmark certification/Training institute
For establishing modern jewellery units
143
INVESTMENT OPPORTUNITIES
4.6.3144
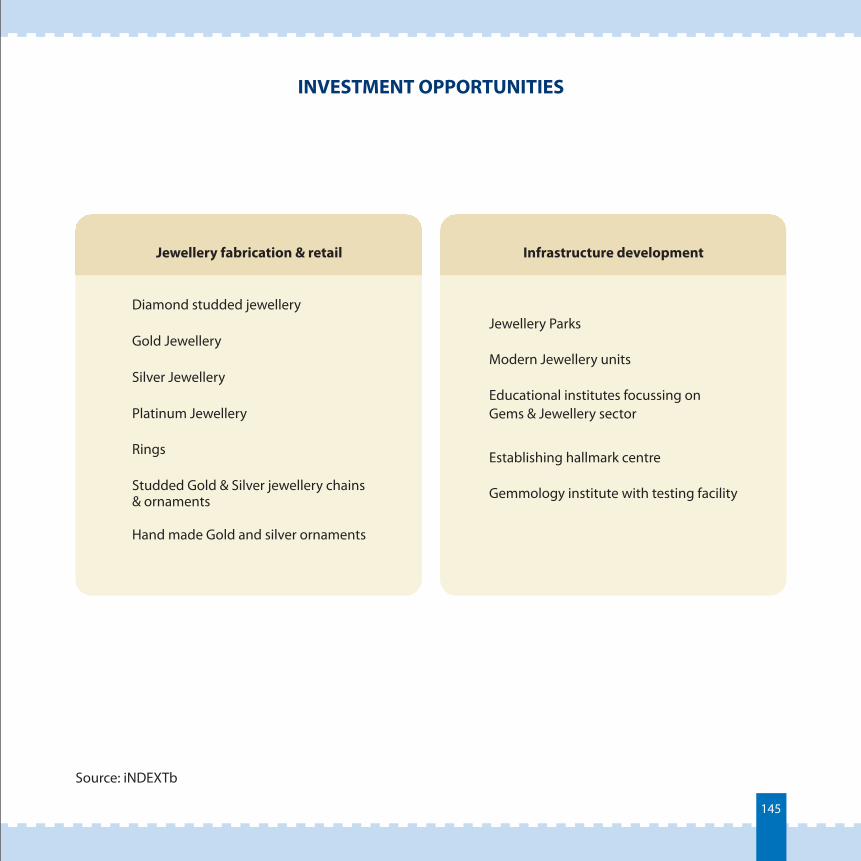
Educational institutes focussing on
Gems & Jewellery sector
INVESTMENT OPPORTUNITIES
Source: iNDEXTb
Jewellery fabrication & retail
Diamond studded jewellery
Gold Jewellery
Silver Jewellery
Platinum Jewellery
Rings
Studded Gold & Silver jewellery chains & ornaments
Hand made Gold and silver ornaments
Infrastructure development
Jewellery Parks
Modern Jewellery units
Establishing hallmark centre
Gemmology institute with testing facility
145
ADVANTAGE GUJARAT
Source: TERI, GEDA5
146
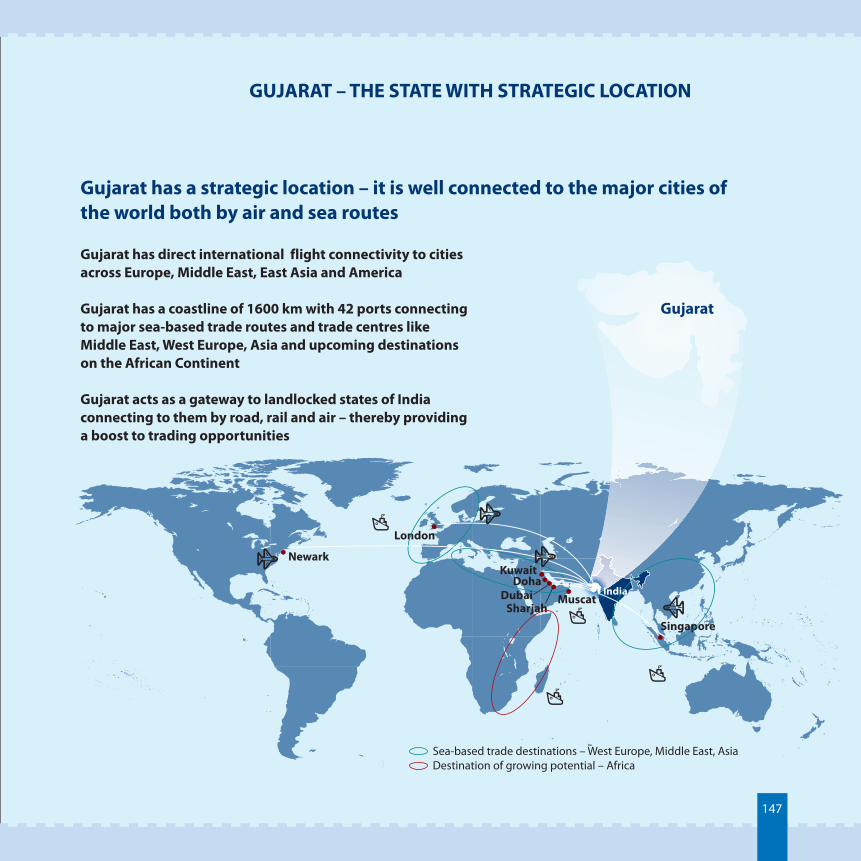
GUJARAT – THE STATE WITH STRATEGIC LOCATION
147
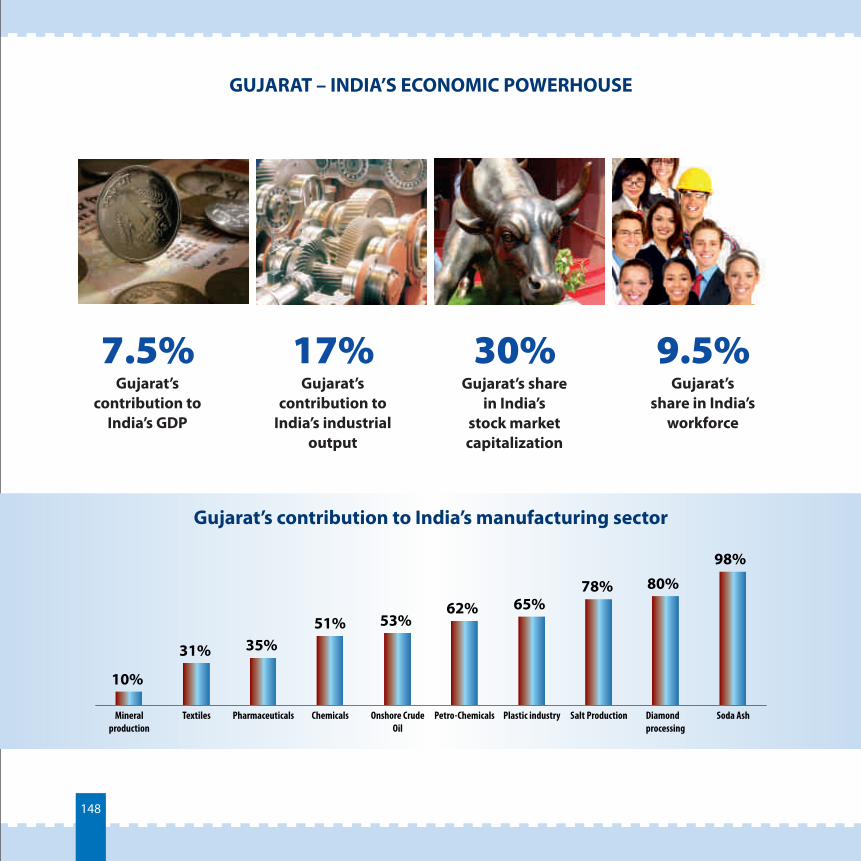
GUJARAT – INDIA’S ECONOMIC POWERHOUSE
148
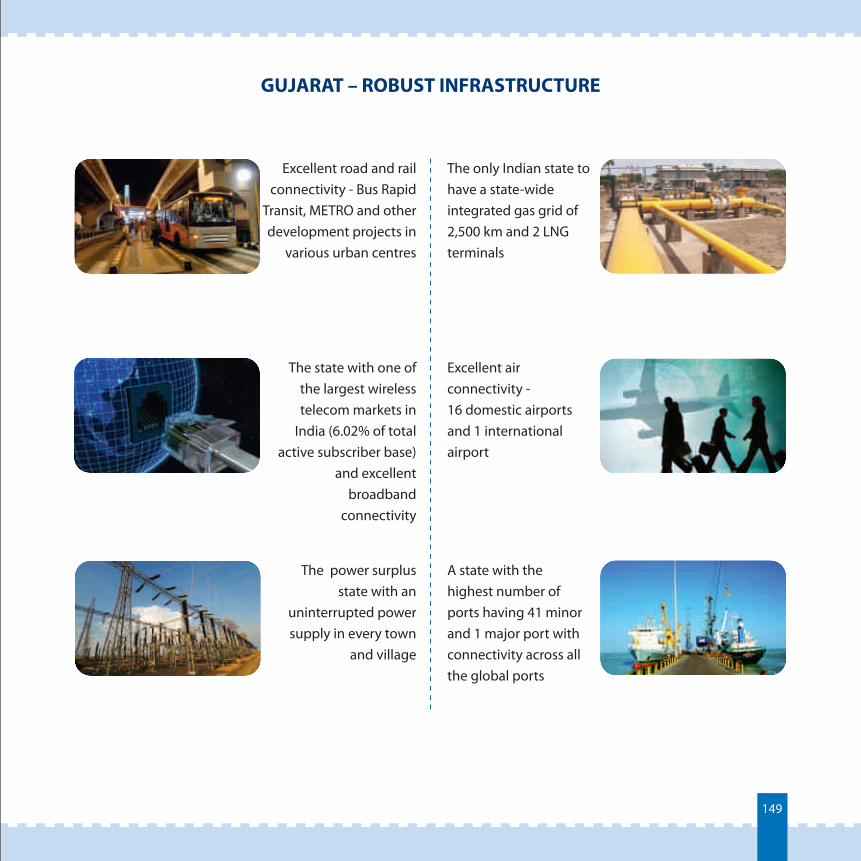
GUJARAT – ROBUST INFRASTRUCTURE
149
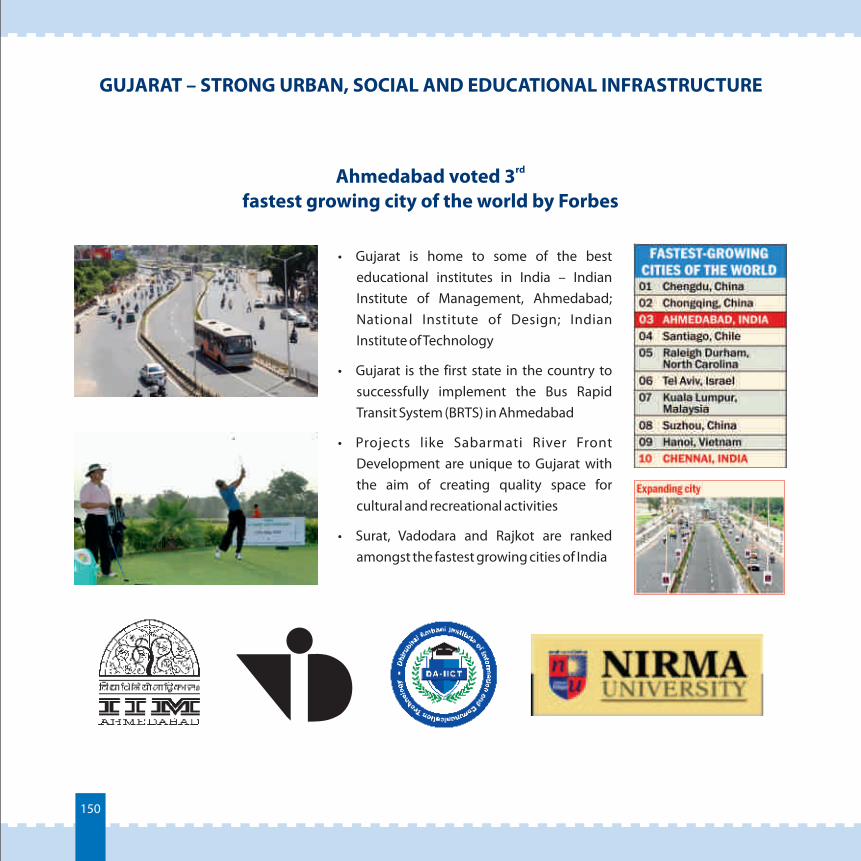
GUJARAT – STRONG URBAN, SOCIAL AND EDUCATIONAL INFRASTRUCTURE
150
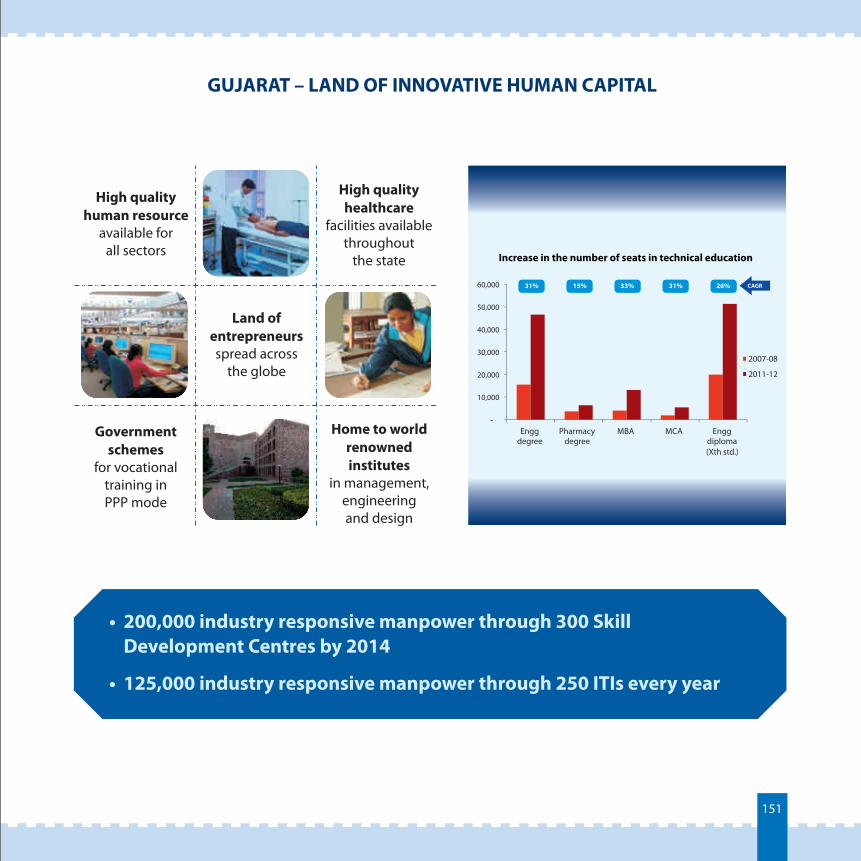
GUJARAT – LAND OF INNOVATIVE HUMAN CAPITAL
151
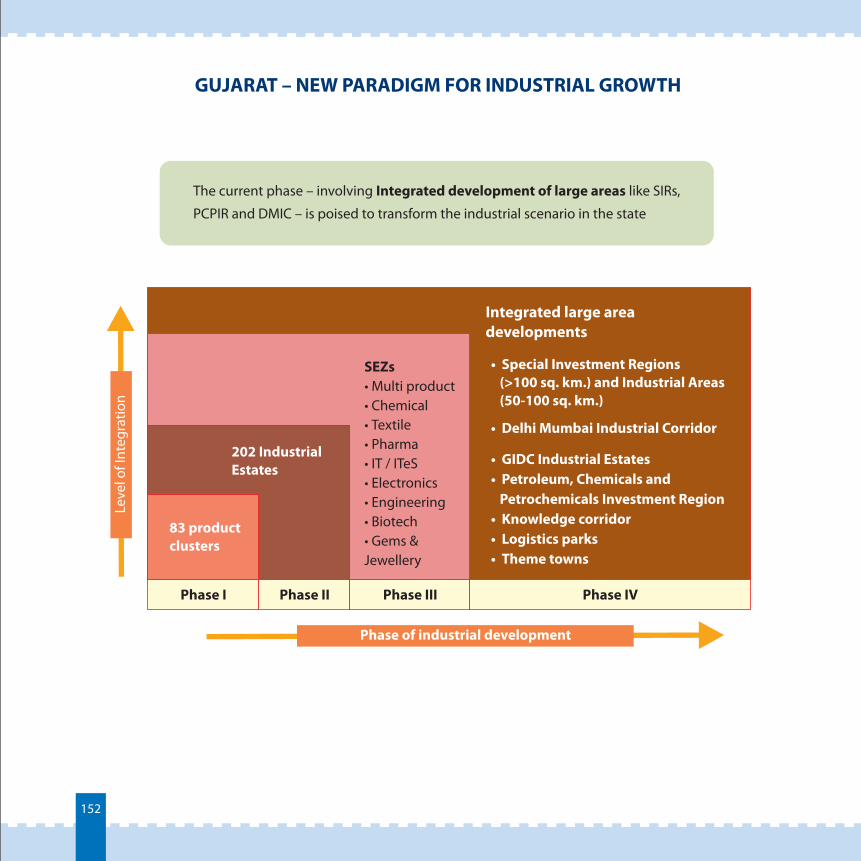
GUJARAT – NEW PARADIGM FOR INDUSTRIAL GROWTH
The current phase – involving Integrated development of large areas like SIRs,
PCPIR and DMIC – is poised to transform the industrial scenario in the state
Phase of industrial development
Leve
l of I
nteg
ratio
n
83 productclusters
202 IndustrialEstates
SEZs• Multi product• Chemical• Textile• Pharma• IT / ITeS• Electronics• Engineering• Biotech• Gems & Jewellery
Integrated large areadevelopments
• Special Investment Regions (>100 sq. km.) and Industrial Areas (50-100 sq. km.)
• CorridorDelhi Mumbai Industrial
• GIDC Industrial Estates• Petroleum, Chemicals and Petrochemicals Investment Region• Knowledge corridor• Logistics parks• Theme towns
Phase I Phase II Phase III Phase IV
152
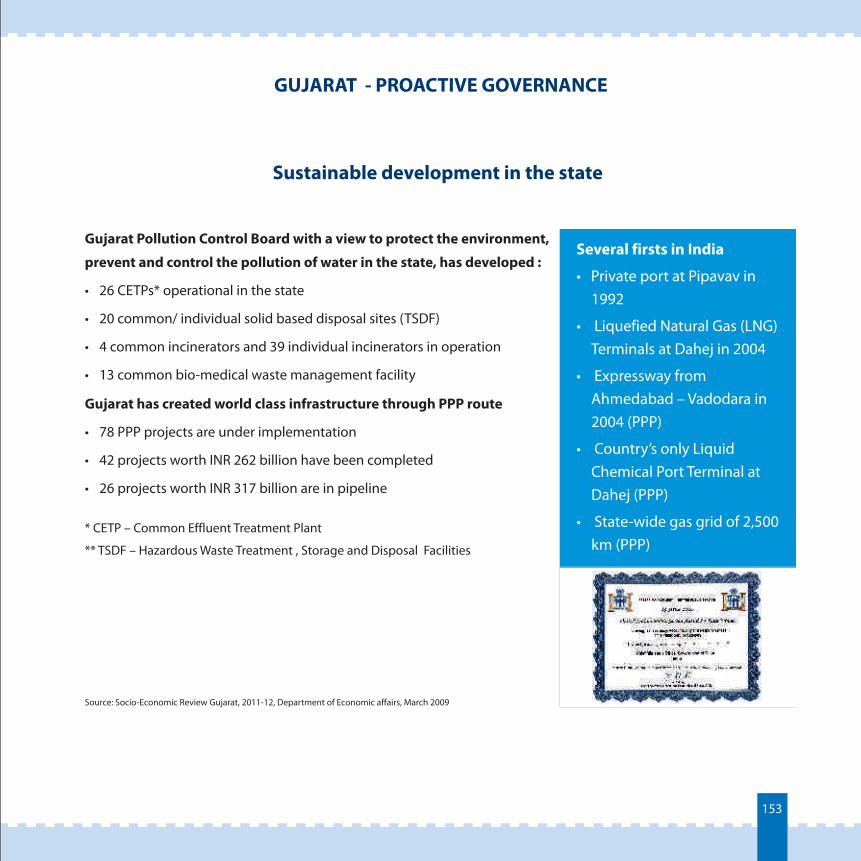
GUJARAT - PROACTIVE GOVERNANCE
153
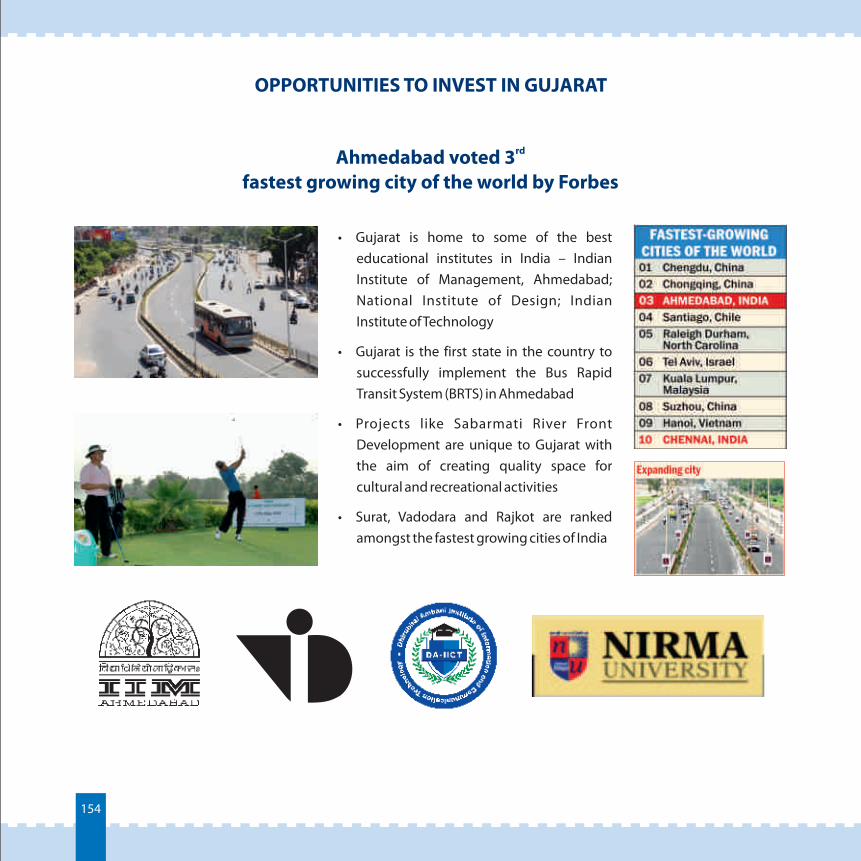
OPPORTUNITIES TO INVEST IN GUJARAT
154
Source: TERI, GEDA6
DOING BUSINESS IN GUJARAT
155
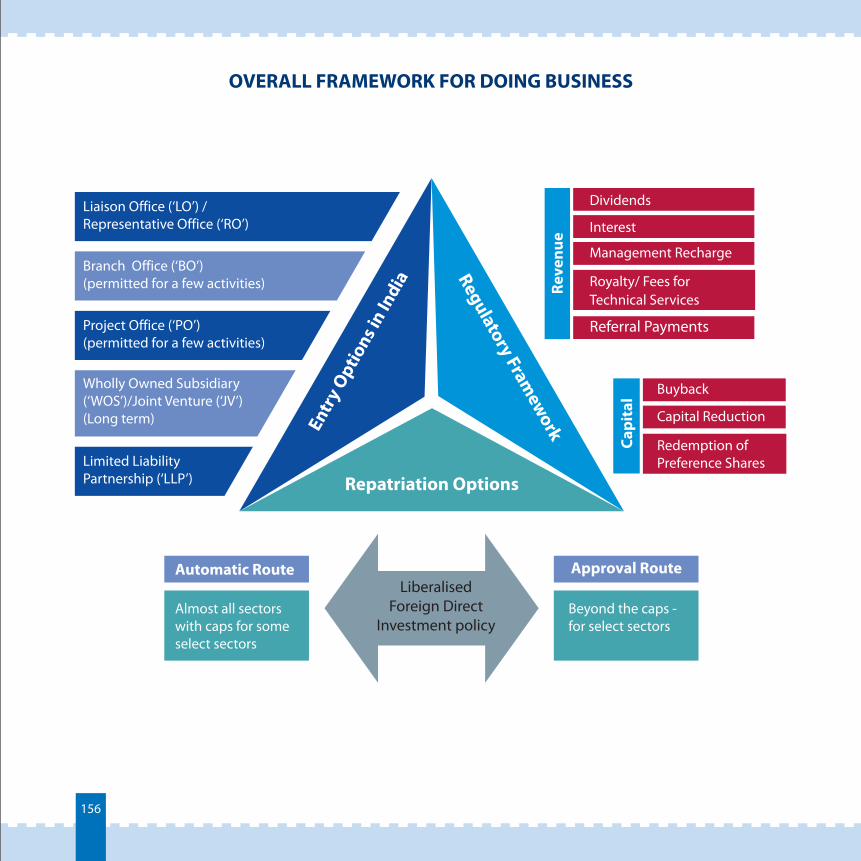
OVERALL FRAMEWORK FOR DOING BUSINESS
156
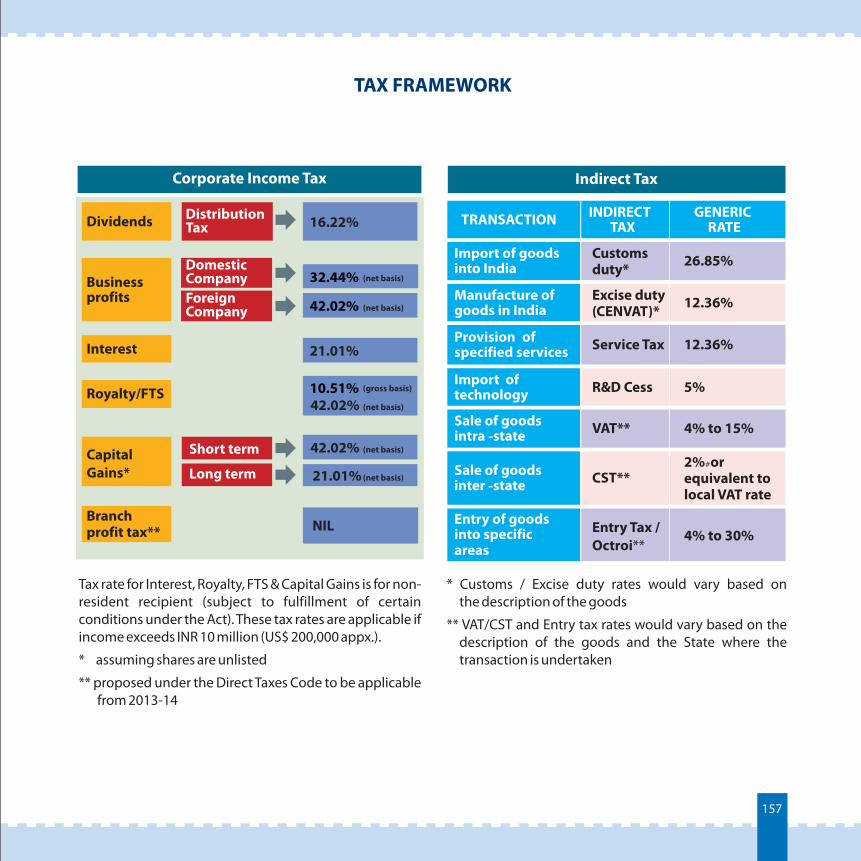
TAX FRAMEWORK
157
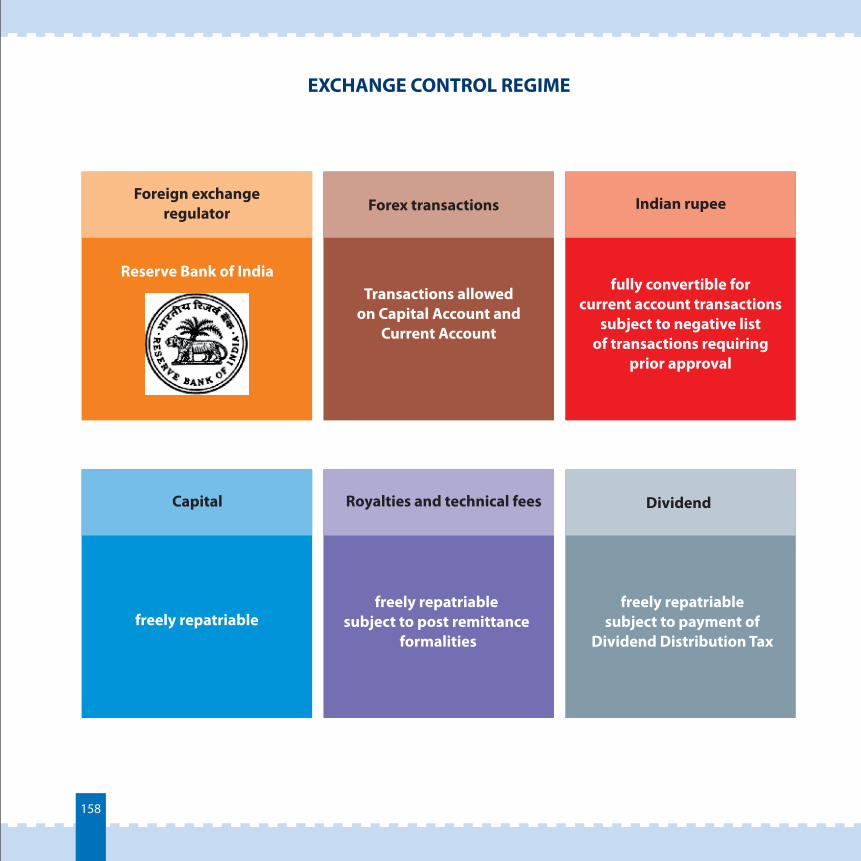
EXCHANGE CONTROL REGIME
158
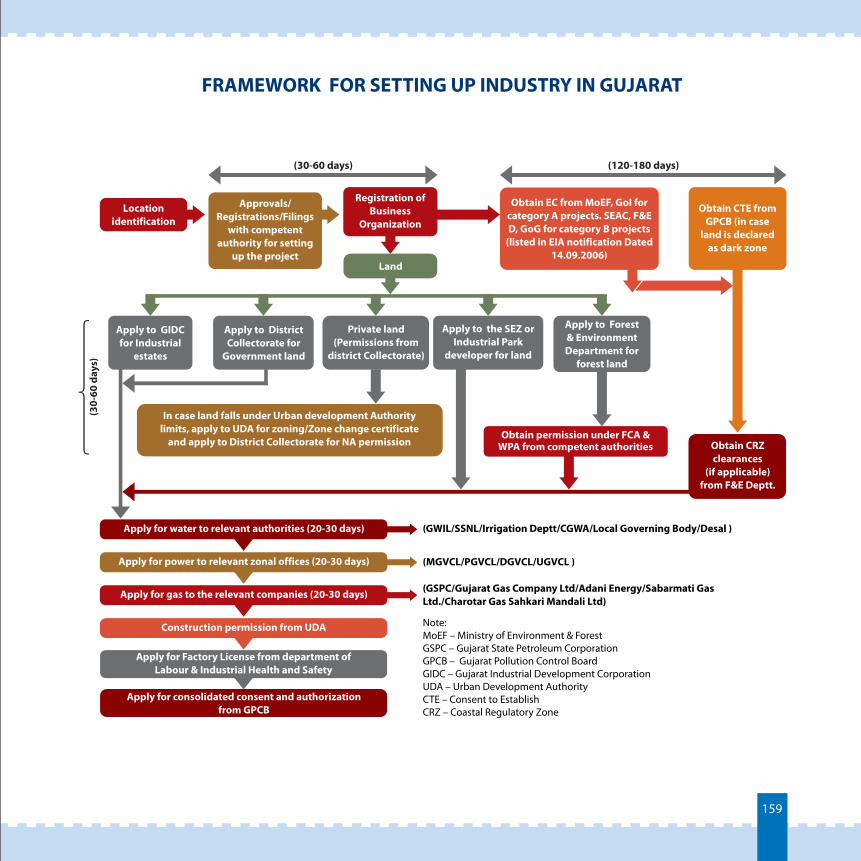
FRAMEWORK FOR SETTING UP INDUSTRY IN GUJARAT
159
Source: TERI, GEDA7
KEY GOVERNMENT AGENCIES
160
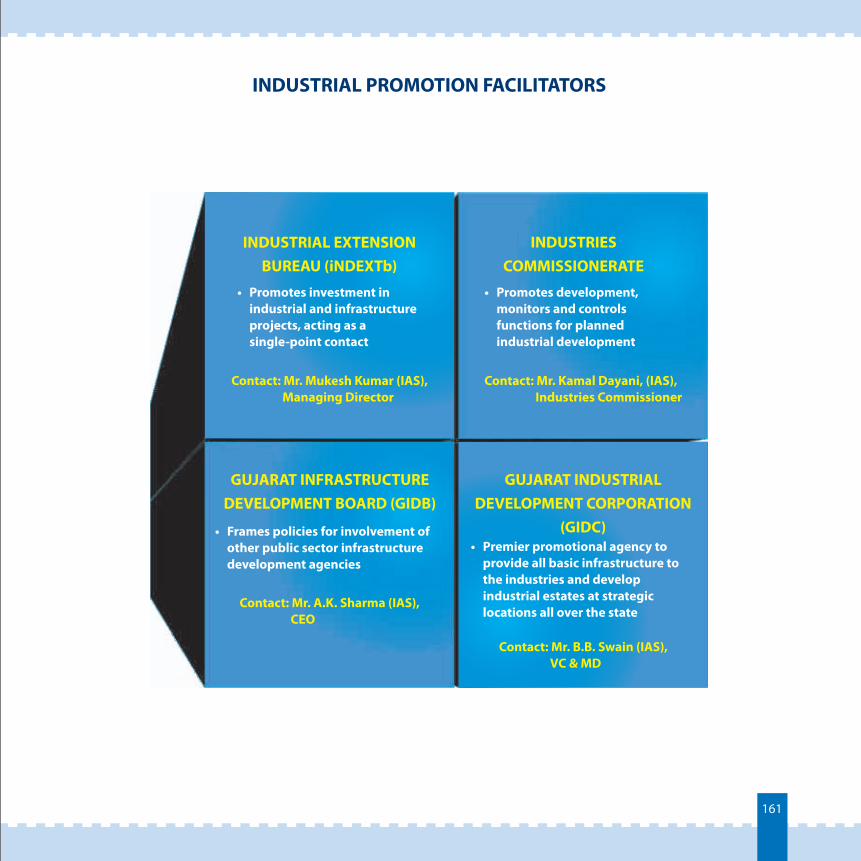
INDUSTRIAL PROMOTION FACILITATORS
161
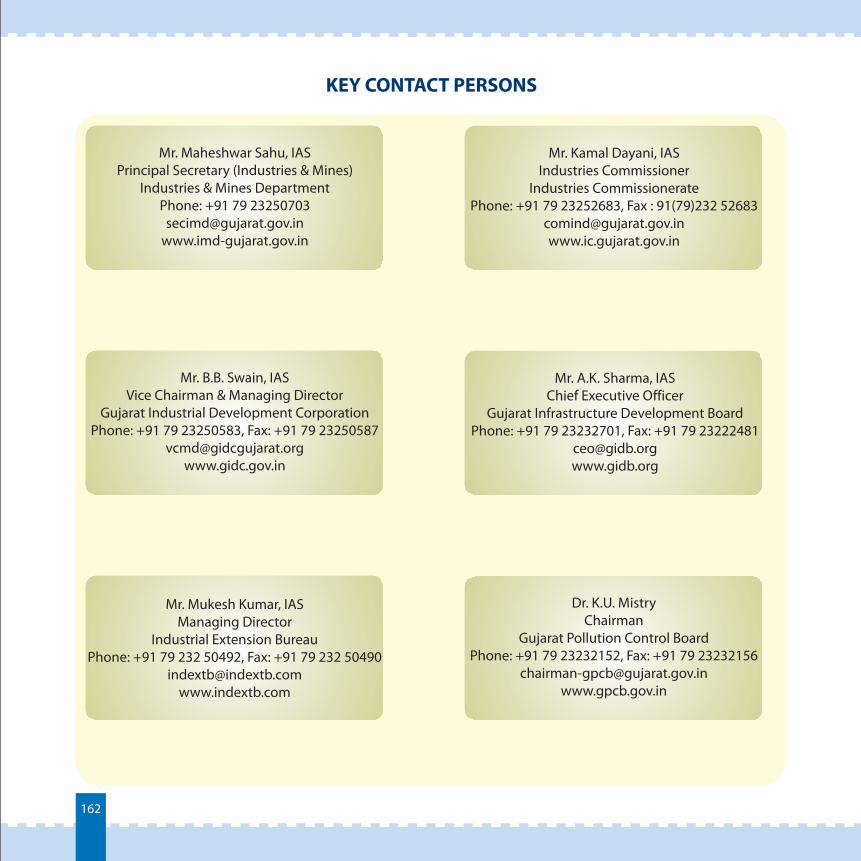
KEY CONTACT PERSONS
Mr. Maheshwar Sahu, IASPrincipal Secretary (Industries & Mines)
Industries & Mines DepartmentPhone: +91 79 23250703
Mr. Kamal Dayani, IASIndustries Commissioner
Industries CommissioneratePhone: +91 79 23252683, Fax : 91(79)232 52683
Mr. B.B. Swain, IASVice Chairman & Managing Director
Gujarat Industrial Development CorporationPhone: +91 79 23250583, Fax: +91 79 23250587
Mr. A.K. Sharma, IASChief Executive Officer
Gujarat Infrastructure Development BoardPhone: +91 79 23232701, Fax: +91 79 23222481
Mr. Mukesh Kumar, IASManaging Director
Industrial Extension BureauPhone: +91 79 232 50492, Fax: +91 79 232 50490
Dr. K.U. MistryChairman
Gujarat Pollution Control BoardPhone: +91 79 23232152, Fax: +91 79 23232156
162
ndHead Office: Block No. 18, 2 Floor, Udyog Bhavan, GH-4, Sector 11, Gandhinagar 382 010 Gujarat, INDIA Phone: +91-79-23250492/93 Fax: +91-79-23250490
www.indextb.com, www.ic.gujarat.gov.in E-mail: [email protected] Regional Office: A-6, State Emporia Building, Baba Kharak Singh Marg, New Delhi 110 001, INDIA
Telefax: 011-23747002, 23360049 E-mail: [email protected]
For more details and online registration, log on to www.vibrantgujarat.com
Exhibition PartnerNational Partner Knowledge Partner
Relationship Partner Airline Partners