vol.14, december.2014 issn 2354-7065 - isomase.orgisomase.org/jomase/vol.14 dec 2014/vol-14.pdf ·...
TRANSCRIPT
ISSN 2354-7065Vol.14, December.2014

Journal of Ocean, Mechanical and Aerospace -Science and Engineering-
Vol.14: December 2014
ISOMAse
International Society of Ocean, Mechanical and Aerospace -Scientists and Engineers-
Contents
About JOMAse
Scope of JOMAse
Editors
Title and Authors PagesThe Susceptibility of FPSO Vessel to Green Water in Extreme Wave Environment
Ezebuchi Akandu, Atilla Incecik, Nigel Barltrop
1 - 6
Review on Dynamic Behaviour of Moored Twin Hulls FPSO Nik Mohd Khairuddin B. Nik Ismail, Jaswar Koto
7 - 12
Computational Analysis of the influence of Two Circumferential Grooves on Performance of Journal Bearing with Palm Oil as Lubricant
Asral, Dodi Sofyan Arief, Jamaluddin Md Sherif, Abd Khair Junaidi
13 - 18
Stratified Oil-Water Two-Phases Flow of Subsea Pipeline Adib Zulhilmi Mohd Alias, Jaswar Koto,
Yasser M.Ahmed, Abd Khair Junaidi
19 - 24

Journal of Ocean, Mechanical and Aerospace -Science and Engineering-
Vol.14: December 2014
ISOMAse
International Society of Ocean, Mechanical and Aerospace -Scientists and Engineers-
About JOMAse
The Journal of Ocean, Mechanical and Aerospace -science and engineering- (JOMAse, ISSN: 2354-7065) is an online professional journal which is published by the International Society of Ocean, Mechanical and Aerospace -scientists and engineers- (ISOMAse), Insya Allah, twelve volumes in a year. The mission of the JOMAse is to foster free and extremely rapid scientific communication across the world wide community. The JOMAse is an original and peer review article that advance the understanding of both science and engineering and its application to the solution of challenges and complex problems in naval architecture, offshore and subsea, machines and control system, aeronautics, satellite and aerospace. The JOMAse is particularly concerned with the demonstration of applied science and innovative engineering solutions to solve specific industrial problems. Original contributions providing insight into the use of computational fluid dynamic, heat transfer, thermodynamics, experimental and analytical, application of finite element, structural and impact mechanics, stress and strain localization and globalization, metal forming, behaviour and application of advanced materials in ocean and aerospace engineering, robotics and control, tribology, materials processing and corrosion generally from the core of the journal contents are encouraged. Articles preferably should focus on the following aspects: new methods or theory or philosophy innovative practices, critical survey or analysis of a subject or topic, new or latest research findings and critical review or evaluation of new discoveries. The authors are required to confirm that their paper has not been submitted to any other journal in English or any other language.

Journal of Ocean, Mechanical and Aerospace -Science and Engineering-
Vol.14: December 2014
ISOMAse
International Society of Ocean, Mechanical and Aerospace -Scientists and Engineers-
Scope of JOMAse
The JOMAse welcomes manuscript submissions from academicians, scholars, and practitioners for possible publication from all over the world that meets the general criteria of significance and educational excellence. The scope of the journal is as follows:
• Environment and Safety • Renewable Energy • Naval Architecture and Offshore Engineering • Computational and Experimental Mechanics • Hydrodynamic and Aerodynamics • Noise and Vibration • Aeronautics and Satellite • Engineering Materials and Corrosion • Fluids Mechanics Engineering • Stress and Structural Modeling • Manufacturing and Industrial Engineering • Robotics and Control • Heat Transfer and Thermal • Power Plant Engineering • Risk and Reliability • Case studies and Critical reviews
The International Society of Ocean, Mechanical and Aerospace –science and engineering is inviting you to submit your manuscript(s) to [email protected] for publication. Our objective is to inform authors of the decision on their manuscript(s) within 2 weeks of submission. Following acceptance, a paper will normally be published in the next online issue.

Journal of Ocean, Mechanical and Aerospace -Science and Engineering-
Vol.14: December 2014
ISOMAse
International Society of Ocean, Mechanical and Aerospace -Scientists and Engineers-
Editors
Chief-in-Editor
Jaswar Koto (Ocean and Aerospace Research Institute, Indonesia Universiti Teknologi Malaysia, Malaysia)
Associate Editors
Abyn Hassan (Persian Gulf University, Iran) Adhy Prayitno (Universitas Riau, Indonesia) Adi Maimun (Universiti Teknologi Malaysia, Malaysia) Agoes Priyanto (Universiti Teknologi Malaysia, Malaysia) Ahmad Fitriadhy (Universiti Malaysia Terengganu, Malaysia) Ahmad Zubaydi (Institut Teknologi Sepuluh Nopember, Indonesia) Ali Selamat (Universiti Teknologi Malaysia, Malaysia) Buana Ma’ruf (Badan Pengkajian dan Penerapan Teknologi, Indonesia) Carlos Guedes Soares (Centre for Marine Technology and Engineering (CENTEC), University of Lisbon, Portugal) Dani Harmanto (University of Derby, UK) Iis Sopyan (International Islamic University Malaysia, Malaysia) Jamasri (Universitas Gadjah Mada, Indonesia) Mazlan Abdul Wahid (Universiti Teknologi Malaysia, Malaysia) Mohamed Kotb (Alexandria University, Egypt) Priyono Sutikno (Institut Teknologi Bandung, Indonesia) Sergey Antonenko (Far Eastern Federal University, Russia) Sunaryo (Universitas Indonesia, Indonesia) Tay Cho Jui (National University of Singapore, Singapore)
Published in Indonesia.
JOMAse
ISOMAse, Jalan Sisingamangaraja No.89 Pekanbaru-Riau Indonesia http://www.isomase.org/
Printed in Indonesia.
Teknik Mesin Fakultas Teknik Universitas Riau, Indonesia http://ft.unri.ac.id/

Journal of Ocean, Mechanical and Aerospace -Science and Engineering-, Vol.14
December 20, 2014
1 Published by International Society of Ocean, Mechanical and Aerospace Scientists and Engineers
The Susceptibility of FPSO Vessel to Green Water in Extreme Wave Environment
Ezebuchi Akandu,a,*Atilla Incecik,a and Nigel Barltrop,a
a)Department of Naval Architecture, Ocean and Marine Engineering, University of Strathclyde, Glasgow, United Kingdom *Corresponding author: [email protected] Paper History Received: 3-December-2014 Received in revised form: 10-December-2014 Accepted: 19-December-2014 ABSTRACT The Floating Production, Storage and Offloading (FPSO) vessels in harsh environment are often vulnerable to green water. Green water is the unbroken waves which overtop the bow, side or stern part of the deck of the floating offshore structure. It occurs when the relative motion between the vessel and the wave exceeds the freeboard. Green-water occurrence could lead to deck flooding and damage to deck-mounted equipment. It is therefore necessary to consider the vulnerability of the floating vessel to green water in the design stage. The objective of this research is to determine the optimal principal dimensions of FPSO vessel necessary to prevent or mitigate the effects of green water even in extreme wave environmental conditions. In order to achieve this, the effects of extreme environmental loads on the vessel have been evaluated in terms of the maximum responses in heave and pitch modes of motion. Furthermore, an interactive programme, the ProGreen has been designed to optimise the principal particulars based on the response and freeboard exceedance analyses for the required storage capacity of the FPSO. This design technique helps to prevent or reduce the green water occurrence, ensures good performance during operation and increases the level of safety and operability of the vessel even in extreme wave conditions. KEY WORDS: FPSO; Principal Dimensions; Green Water; Responses. NOMENCLATURE ProGreen: Programme for Green Water Analysis
Breadth, Wave spectral parameter Water particle vertical acceleration zero up-crossing period Freeboard exceedance of each FPSO vessel
Density of sea water Acceleration due to gravity
Response amplitude operator of the relative motion Mbbls Million barrels of oil
Draught to Depth ratio Gamma function
Other symbols are defined in the sections where they are used. 1.0 INTRODUCTION Green water is the flow of the unbroken waves which overtop the bow, side or even stern part of the deck of a ship or floating offshore structure. It depends on the relative motion between the vessel and the waves, velocity, freeboard, and the harshness or flow intensity of the wave. It occurs when the relative motion exceeds the freeboard. The bow is most susceptible to green water occurrence especially for a turret-moored offshore unit due to its weathervaning characteristics, although it sometimes occurs at the stern [1]. This problem is a very important design issue because of its great potential to cause damage to deck-mounted equipment. It poses a tremendous threat to both crew and deck facilities such as accommodation, watertight doors, walk-way ladders and cable trays [2, 3]. Also, it may lead to deck flooding which is hazardous and constitutes a threat to the workforce and could result in downtime depending on its severity.
The FPSOs in the North Sea are highly vulnerable to green water. Between 1995 and 2000, about seventeen green water incidents on twelve FPSOs in UK waters of the North Sea have been reported [4, 5].
Problems associated with green water and wave slamming at the bottom of the bow which are directly related to the freeboard and flare have remained unresolved by most of the available software, although they have been quite helpful in design and

Journal of Ocean, Mechanical and Aerospace -Science and Engineering-, Vol.14
December 20, 2014
2 Published by International Society of Ocean, Mechanical and Aerospace Scientists and Engineers
analysis of ships and offshore floating structures. Most of the available software cannot account for the influence of freeboard and flare which are essential geometric characteristics responsible for deck wetness and water impact forces on deck equipment. Because of the criticality of these phenomena, this study will analyse and discuss ways of addressing the challenges of the green water susceptibility of a Floating Production Storage and offloading Vessel and predict the required principal dimensions with respect to a given storage capacity for a specified wave environment. In other words, the objective of this research is to determine the optimal principal dimensions of FPSO vessel necessary to prevent or mitigate these undesirable effects of green water.
The influence of geometric changes upon the behaviour of a ship or a moored floating offshore vessel (such as FPSO or Floating Storage Unit, FSU) in sea wave is very imperative. The parameters may be categorized as follows:
(i) Displacement, Principal Dimensions (L, B, T, D), and the Block Coefficient.
(ii) The Coefficients which define the hull form details. These are the Waterplane Area Coefficient, the Longitudinal Centres of Buoyancy and Flotation (LCB and LCF). For simplicity, a rectangular form is considered in this paper.
2.0 THEORETICAL ANALYSIS 2.1 The Principal Dimensions of the FPSO There are three major factors that greatly influence the size and arrangements of these different parts of the Floating Production, Storage and Offloading system and its process plants. These are: (i) Provision of sufficient oil storage capacity, (ii) Provision of enough topside area or space for process plants, accommodation, helideck and other required topside equipment and (iii) Provision of displacement and ballast capacity. These factors are directly related to (or functions of) cubic number, length-breadth ( ) and breath-depth ( ) ratios (as variables in the analyses) respectively. The cubic number is the overall volume of the vessel and it is directly proportional to the required storage capacity. With the knowledge of the oil storage efficiency, the cubic number and the preliminary evaluation of the principal dimensions can be made. The overall volume or the cubic number is given by:
LBD /
D
D⁄ 1
From eqn. (1), it follows that: The Length, L 2
Breadth, B 3 Depth, D ab 4
Draught, T D 5
Where: The cubic number, in ; and the cube root of the
cubic number is given by: //
is the displacement; and the new dimensionless factors are: a / ; ⁄ / ; /
: Required oil storage capacity in barrel (bbl); : Oil storage Efficiency; and Conversion factor,
6.28981077; 6.28981077 1 . 2.2 The Wave Environment In offshore structural design, it is convenient to describe the wave environment in spectral form. The general form of the wave spectrum model is given by:
exp 6 The parameters (A, B) of the Spectrum are solved in terms of the significant wave height and the wave period (which are in common use in wave description) for specified values of p and q (For Pierson-Moskowitz spectrum, p=5 and q=4). The nth moment of the spectrum which is very useful in obtaining the wave characteristics is expressed as:
Γ 1 /
/ 7
The zeroth moment (n=0, mn=m0) or the variance of the wave elevation is defined as the area under the Spectral curve. The mean wave frequency is the ratio of the first moment to the zeroth moment. The zero-crossing frequency is the square root of the ratio of the second moment to the zeroth moment. The spectral peak frequency can be obtained by differentiating with respect to the wave frequency, and equating the result to zero. By substituting the expressions for A and B, the modified version of the wave spectrum is therefore obtained as:
124 exp 496.1 8
The rectangular-shaped floating production, storage and offloading vessel with length L, Beam B and draught T, (which are evaluated based on the required storage capacity as given in eqns. 1-5) is be operated in the North Sea of 100-year Return Period storm; the zero up-crossing period and significant wave height are 17.5s and 16.5m respectively. The equation of motion of this vessel is given by:
9 Where: Mjk are the elements of the generalized mass matrix for the structure; Ajk are the elements of the added mass matrix; djk are the elements of the linear damping matrix; Cjk are the elements of the stiffness matrix; Fjare the amplitudes of the wave exciting forces and moments, j and k indicate the directions of fluid forces and the modes of motions; represents responses;
and are the velocity and acceleration terms; and is the angular frequency of encounter. 2.3 Heave Force and Response Assuming the vessel has a constant mass density, zero forward speed and moored in deep sea, with a sinusoidal wave propagating along the negative x-axis (head sea),the velocity potential is:

Journal of Ocean, Mechanical and Aerospace -Science and Engineering-, Vol.14
December 20, 2014
3 Published by International Society of Ocean, Mechanical and Aerospace Scientists and Engineers
cos 10 The vessel is divided into strips of equal sizes and the force acting on each strip ( ) is the sum of the pressure force and the added mass force. These forces are integrated across the length of the vessel to obtain the heave excitation force.
sin
sin
2 sin 2 sin
Where is the 2-D added mass in heave, while the amplitude of the heave force is given by:
2ζ g e T2
ζBλπ 2 e T sin
k2 11
Therefore, the Heave Response Amplitude Operator, RAO3, defined as the heave amplitude per wave amplitude, is:
ζ
Bλπ 2 e T sin
k2 12
: Dynamic magnification factor in heave; λ: wavelength; : virtual added mass coefficient in heave; ζ : wave amplitude; and wave number, k 2 λ⁄ .
sin
2 sin 2 sin
Where is the 2-D added mass in heave, while the amplitude of the heave force is given by:
2ζ g e T2
ζBλπ 2 e T sin
k2 11
Therefore, the Heave Response Amplitude Operator, RAO3, defined as the heave amplitude per wave amplitude, is:
ζBλπ 2 e T sin
k2
… 12 : Dynamic magnification factor in heave; λ: wavelength; :
virtual added mass coefficient in heave; ζ : wave amplitude; and wave number, k 2 λ⁄ . 2.4Pitching Moment and Response The amplitude of the pitching moment has also been obtained following similar procedure and it is given by:
ζBλπ 2
e T 12
cos2
2
… 13 So, the Pitch Response Amplitude Operator, RAO5, defined as the pitch response amplitude per wave amplitude, is:
ζ
Bλπ 2
12 cos 2 2 14
is the dynamic magnification factor in pitch motion. 2.5 Relative Motion The wave profile and heave motion at any point, are respectively given by expressions:
sin and Therefore, the relative motion between wave and vesselat the bow is:
2sin
2
sin 2 cos sin 2
sin 2 cos
sin cos 2 cos sin 2
2 sin 2 sin 2 cos So, the amplitude of the relative motion between the bow and the wave is:
2 2sin
2
/
2 2 sin 2
/
2 2 sin 2
/
… 15
These responses in regular waves are modified to account for the irregularities. Hence, for more realistic irregular waves, spectral analyses are adopted to obtain the most probable maximum responses. Let the most probable maximum amplitude of the relative motion be R. Consequently, the maximum allowable draftis required to be greater than thismaximum relative motion ( ) in orderprevent the bow from exiting the water (bow slamming). Furthermore, a minimum freeboard, equivalent to is needed to avoid green water on the deck. The most probable maximum amplitude of the relative motion between the wave and the vessel at the bow is:
3.72 16
2.6 Freeboard Exceedance The freeboard exceedance is the difference between the most probable relative motion and the freeboard. For each of the vessels being analysed (where represents each of the vessels), it is given by:
Journal of Ocean, Mechanical and Aerospace -Science and Engineering-, Vol.14
December 20, 2014
4 Published by International Society of Ocean, Mechanical and Aerospace Scientists and Engineers
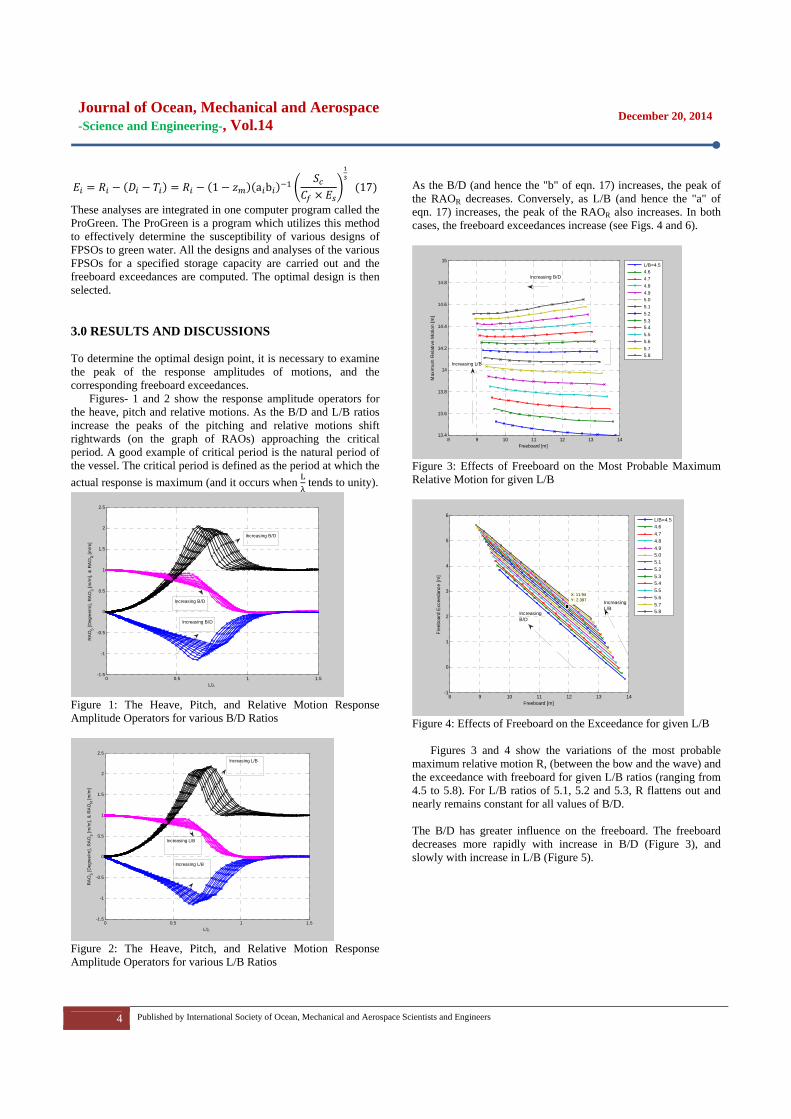
1 a b 17
These analyses are integrated in one computer program called the ProGreen. The ProGreen is a program which utilizes this method to effectively determine the susceptibility of various designs of FPSOs to green water. All the designs and analyses of the various FPSOs for a specified storage capacity are carried out and the freeboard exceedances are computed. The optimal design is then selected. 3.0 RESULTS AND DISCUSSIONS To determine the optimal design point, it is necessary to examine the peak of the response amplitudes of motions, and the corresponding freeboard exceedances.
Figures- 1 and 2 show the response amplitude operators for the heave, pitch and relative motions. As the B/D and L/B ratios increase the peaks of the pitching and relative motions shift rightwards (on the graph of RAOs) approaching the critical period. A good example of critical period is the natural period of the vessel. The critical period is defined as the period at which the actual response is maximum (and it occurs when L tends to unity).
Figure 1: The Heave, Pitch, and Relative Motion Response Amplitude Operators for various B/D Ratios
Figure 2: The Heave, Pitch, and Relative Motion Response Amplitude Operators for various L/B Ratios
As the B/D (and hence the "b" of eqn. 17) increases, the peak of the RAOR decreases. Conversely, as L/B (and hence the "a" of eqn. 17) increases, the peak of the RAOR also increases. In both cases, the freeboard exceedances increase (see Figs. 4 and 6).
Figure 3: Effects of Freeboard on the Most Probable Maximum Relative Motion for given L/B
Figure 4: Effects of Freeboard on the Exceedance for given L/B
Figures 3 and 4 show the variations of the most probable maximum relative motion R, (between the bow and the wave) and the exceedance with freeboard for given L/B ratios (ranging from 4.5 to 5.8). For L/B ratios of 5.1, 5.2 and 5.3, R flattens out and nearly remains constant for all values of B/D. The B/D has greater influence on the freeboard. The freeboard decreases more rapidly with increase in B/D (Figure 3), and slowly with increase in L/B (Figure 5).
0 0.5 1 1.5-1.5
-1
-0.5
0
0.5
1
1.5
2
2.5
L/λ
RA
O5 [D
egre
e/m
], R
AO
3 [m/m
], &
RA
OR [m
/m]
Increasing B/D
Increasing B/D
Increasing B/D
0 0.5 1 1.5-1.5
-1
-0.5
0
0.5
1
1.5
2
2.5
L/λ
RA
O5 [D
egre
e/m
], R
AO
3 [m/m
], &
RA
OR [m
/m]
Increasing L/B
Increasing L/B
Increasing L/B
8 9 10 11 12 13 1413.4
13.6
13.8
14
14.2
14.4
14.6
14.8
15
Freeboard [m]
Max
imum
Rel
ativ
e M
otio
n [m
]
L/B=4.54.64.74.84.95.05.15.25.35.45.55.65.75.8
Increasing B/D
Increasing L/B
8 9 10 11 12 13 14-1
0
1
2
3
4
5
6
X: 11.94Y: 2.397
Freeboard [m]
Free
boar
d E
xcee
danc
e [m
]
L/B=4.54.64.74.84.95.05.15.25.35.45.55.65.75.8Increasing
B/D
IncreasingL/B

Journal of Ocean, Mechanical and Aerospace -Science and Engineering-, Vol.14
December 20, 2014
5 Published by International Society of Ocean, Mechanical and Aerospace Scientists and Engineers
Figure 5: Effects of Freeboard on the Most Probable Maximum Relative Motion for given B/D
Generally, the exceedance is directly proportional to the pitch, heave and relative motions but inversely proportional to the freeboard. So, in order to avoid the vulnerability of the vessel to green water, the exceedance must be less or equal to zero.
, , , , , , 0 18 Where the subscript, 'a' represents "avoidance of green water". The optimal design is obtained when the green water avoidance criterion is met with minimum heave and pitch motions.
, , , , , ,min 19
Where the subscript, 'o' represents "optimal design" of the ProGreen.
In this study, 154 vessels have been analysed as described above (using the ProGreen). The optimal design of FPSO of 2Mbbls of storage capacity for the North Sea has been determined as shown in tables 1 and 2. However, if a different design is preferably selected due to other factors, then the process deck should be raised to account for the estimated freeboard exceedance. In figure 4 for instance, the FPSO with L/B of 5.4, and B/D of 1.6 has a freeboard of 11.5m and exceedance of 2.4m. Therefore, the topside/process deck is required to be raised 2.4m above the main deck.
Figure 6: Effects of Freeboard on the Exceedance for given B/D
Table 1: Green Water Susceptibility of 2Mbbl North Sea FPSOs
Table 2: Optimal Design for North Sea FPSO using ProGreen
Lo [m] Bo [m] Do [m] To [m]
256.8992 54.6594 39.0424 25.3776 4.0 CONCLUSIONS (i) The most probable maximum relative motion is greatly influenced by selected L/B ratio while the freeboard is highly influenced by the B/D ratio. (ii) The freeboard exceedance increases with both L/B and B/D ratios.
10.5 11 11.5 12 12.5 13 13.5 1413.4
13.6
13.8
14
14.2
14.4
14.6
14.8
Freeboard [m]
Max
imum
Rel
ativ
e M
otio
n [m
]
B/D=1.41.51.61.71.81.92
10.5 11 11.5 12 12.5 13 13.5 14-0.5
0
0.5
1
1.5
2
2.5
3
3.5
4
Freeboard [m]
Free
boar
d E
xcee
danc
e [m
]
B/D=1.41.51.61.71.81.92
S/No L/B B/D L B D Freeboard Constraint Exeedance
[m] [m] [m] D-T D-T-R>0 E=R-(D-T)
1 4.5 1.4 249.5586 55.4575 39.6125 13.8644 0.4608 -0.4608
2 4.5 1.5 255.3643 56.7476 37.8318 13.2411 -0.1701 0.1701
3 4.5 1.6 260.9175 57.9817 36.2385 12.6835 -0.7364 0.7364
4 4.5 1.7 266.2438 59.1653 34.8031 12.1811 -1.2485 1.2485
5 4.5 1.8 271.3651 60.3034 33.5019 11.7257 -1.7147 1.7147
6 4.5 1.9 276.3001 61.4 32.3158 11.3105 -2.1417 2.1417
7 4.5 2 281.0648 62.4588 31.2294 10.9303 -2.5348 2.5348
8 4.5 2.1 285.6733 63.4829 30.23 10.5805 -2.8985 2.8985
9 4.5 2.2 290.1376 64.475 29.3068 10.2574 -3.2367 3.2367
10 4.5 2.3 294.4687 65.4375 28.4511 9.9579 -3.5522 3.5522
11 4.5 2.4 298.6759 66.3724 27.6552 9.6793 -3.8479 3.8479
12 4.6 1.4 253.2422 55.0526 39.3233 13.7632 0.2369 -0.2369
13 4.6 1.5 259.1336 56.3334 37.5556 13.1445 -0.3893 0.3893
14 4.6 1.6 264.7687 57.5584 35.974 12.5909 -0.9511 0.9511
15 4.6 1.7 270.1737 58.7334 34.5491 12.0922 -1.4589 1.4589
16 4.6 1.8 275.3706 59.8632 33.2573 11.6401 -1.9209 1.9209
17 4.6 1.9 280.3784 60.9518 32.0799 11.228 -2.3439 2.3439
18 4.6 2 285.2135 62.0029 31.0015 10.8505 -2.7333 2.7333
19 4.6 2.1 289.8899 63.0195 30.0093 10.5033 -3.0936 3.0936
20 4.6 2.2 294.4202 64.0044 29.0929 10.1825 -3.4284 3.4284
21 4.6 2.3 298.8152 64.9598 28.2434 9.8852 -3.7408 3.7408
22 4.6 2.4 303.0845 65.8879 27.4533 9.6087 -4.0335 4.0335
23 4.7 1.4 256.8992 54.6594 39.0424 13.6649 0.0199 -0.0199
24 4.7 1.5 262.8757 55.931 37.2873 13.0506 -0.6012 0.6012
25 4.7 1.6 268.5922 57.1473 35.717 12.501 -1.1582 1.1582
26 4.7 1.7 274.0752 58.3139 34.3023 12.0058 -1.6614 1.6614
27 4.7 1.8 279.3471 59.4356 33.0198 11.5569 -2.119 2.119
28 4.7 1.9 284.4273 60.5164 31.8508 11.1478 -2.5379 2.5379
29 4.7 2 289.3322 61.56 30.78 10.773 -2.9233 2.9233
30 4.7 2.1 294.0762 62.5694 29.7949 10.4282 -3.2799 3.2799
31 4.7 2.2 298.6718 63.5472 28.8851 10.1098 -3.6112 3.6112
32 4.7 2.3 303.1303 64.4958 28.0417 9.8146 -3.9204 3.9204
33 4.7 2.4 307.4613 65.4173 27.2572 9.54 -4.21 4.21
34 4.8 1.4 260.5303 54.2772 38.7694 13.5693 -0.1901 0.1901
35 4.8 1.5 266.5913 55.5399 37.0266 12.9593 -0.8059 0.8059
36 4.8 1.6 272.3886 56.7476 35.4673 12.4135 -1.3577 1.3577
37 4.8 1.7 277.9491 57.9061 34.0624 11.9218 -1.856 1.856
38 4.8 1.8 283.2956 59.0199 32.7888 11.4761 -2.309 2.309
39 4.8 1.9 288.4475 60.0932 31.628 11.0698 -2.7235 2.7235
40 4.8 2 293.4217 61.1295 30.5648 10.6977 -3.1048 3.1048
41 4.8 2.1 298.2328 62.1318 29.5866 10.3553 -3.4575 3.4575
42 4.8 2.2 302.8934 63.1028 28.6831 10.0391 -3.7852 3.7852
43 4.8 2.3 307.4149 64.0448 27.8456 9.7459 -4.091 4.091
44 4.8 2.4 311.8071 64.9598 27.0666 9.4733 -4.3775 4.3775
102 5.4 1.6 294.6393 54.5628 34.1018 11.9356 -2.3965 2.3965
154 5.8 2.4 353.7343 60.9887 25.4119 8.8942 -5.62 5.62

Journal of Ocean, Mechanical and Aerospace -Science and Engineering-, Vol.14
December 20, 2014
6 Published by International Society of Ocean, Mechanical and Aerospace Scientists and Engineers
(iii) The optimal design is favoured by larger depths (or lower L/B and B/D ratios) which ensure that there are both sufficient freeboard and disparity from the critical wavelength. (iv) Theoptimal design of FPSO for oil field development in extreme wave environment such as the North Sea is necessary to avoid green water on deck and its adverse effects. (v) The optimal dimensions for 2Mbbls of oil storage capacity FPSO are: Length is 3.139 of (or 256.9m); Beam of 66.8% of (or 54.7m); and Depth of not less than 47.7% of (or 25.4m). That is, L/B and B/D ratios of 4.7 and 1.4 respectively. ACKNOWLEDGEMENTS The work reported here has been supported by the Federal Government of Nigeria through the Petroleum Technology Development Fund. The authors are grateful for this support. REFERENCE [1] HSE (2001). "Environmental Considerations." Offshore
Technology Report, OTO 2001/010, Health and Safety ExecutiveUK.
[2] HSE (1997). "Green Sea Damage on FPSOs and FSUs." Offshore Technology Report, OTH 1997/487, Health and Safety ExecutiveUK.
[3] HSE (2000). "Review of Green Water and Wave-Slam Design and Specification Requirements for FPSO/FSUs." Offshore Technology Report, OTO 2000/004, Health and Safety ExecutiveUK.
[4] Morris, W. D. M., Buchner, B., and Miller, J. (2000). "Green Water Suscuptibility of North Sea FPSO/FSUs." IBC Conference on Floating Production Systems (FPS)London.
[5] Ersdal, G., and Kvitrud, A. (2000). "Green Water on Norwegian Production Ships." Proceedings of ISOPE Conference, International Society of Offshore and Polar Engineers, Sheattle.

Journal of Ocean, Mechanical and Aerospace -Science and Engineering-, Vol.14
December 20, 2014
7 Published by International Society of Ocean, Mechanical and Aerospace Scientists and Engineers
Review On Dynamic Behaviour of Moored Twin Hulls FPSO
Nik Mohd Khairuddin B. Nik Ismail,a, and Jaswar. Koto,a,b,*
a)Department of Aeronautics, Automotive and Ocean Engineering, Universiti Teknologi Malaysia, Malaysia b)Ocean and Aerospace Research Institute, Pekanbaru, Indonesia *Corresponding author: jaswar,[email protected] and [email protected]
Paper History Received: 7-December-2014 Received in revised form: 15-December-2014 Accepted: 19-December-2014 ABSTRACT
The development of floating offshore structures have been successfully and rapidly in many years. Many researchers has studied the dynamic behavior of of moored floating production storage and offloading structure. This paper investigated the dynamic behavior of catenary anchor leg moored twin hulls floating production storage and offloading which subjected to sea waves, in order to get insight knowledge on its dynamic behaviours due to various turret locations with different loading conditions. The comparison of the dynamics behaviour to the FPSO and it mooring lines are important when choosing potential development and optimal options. The research founded that it currently no information is available for the comparison of the dynamic behaviour of the internal turret moored of twin hulls FPSO at different loading conditions with various turret locations under the action of wave. . KEY WORDS: Moored Twin Hulls; FPSO; Turret Location; Dynamic Response. NOMENCLATURE FPSO Floating Production Storage and Offloading FSO Floating Storage and Offloading CALM Catenary Anchor Leg Mooring TLP Tension Leg Platform FSRU Floating Storage Regasification Unit DWT Deadweight Tonnes
RAO Responded Amplitude Operator 1.0 INTRODUCTION
Offshore structures have been in use successfully for many years and rapidly developing. They serve the same purpose in the oil and gas production as well as the storage system. There are two common the types of offshore structure which are fix structure and floating structure. These floating structures include Tension Leg Platform, Semi-submersible platform, Floating Storage and Offloading, and also Floating Production Storage and Offloading.
Since the offshore drilling are being discovered in deep sea area the fixed structure are not practical because it have significant heave, pitch and yaw motions in large wave. Good stability characteristic as a drilling platform was make the floating structure attempt to replace traditional fixed jacket platforms. These movable structures have the maneuverability ability to be used in several fields, but the cost effectiveness is the main advantages of movable structures.
FPSO is vessel used by the offshore industry for the processing and storage of oil and gas. A FPSO vessel is transportable platform which designed to receive oil or gas produced from nearby platforms or subsea template, process it, and store it until oil or gas can be offloaded onto a tanker or transported through a pipeline. FPSOs are preferred in frontier offshore regions as they are easy to install, and do not require a local pipeline infrastructure to export oil and gas.
The vessels often take the form of traditional tankers. In addition to dedicated vessels that are designed for FPSO, oil and gas tankers can be converted to an FPSO vessel which also makes them an economical and flexible option. The vessels are moored in place either via a single point or by spread mooring which involves the vessel being anchored via multiple points on the sea floor. This allows them to operate in both deepwater and ultra deepwater environments which are designed to take into account local weather situations and can even be detached from moorings which make them ideal in extreme weather conditions.
Turret is a typical single point mooring system for FPSO. Turret also is the major component used for station keeping in

Journal of Ocean, Mechanical and Aerospace -Science and Engineering-, Vol.14
December 20, 2014
8 Published by International Society of Ocean, Mechanical and Aerospace Scientists and Engineers
harsh environments; heavy sea, high winds and strong current which the risers coming from seabed are connected. The most important function of turret is weathervaning which allows vessel to rotate freely around turret.
Floating production vessel have the principal characteristic of remaining at substantially stable position, presenting movements when they experience environmental forces such as the wind, waves and currents. In floating structure design, it is important to determine its motion and behavior when subjected to waves [65].
According to the research from T.R Kannah and R. Natarajan (2006), it has been illustrated that the position of the turret location plays a vital role to determine the behavior of the FPSO and also its mooring lines forces when subjected to environmental impact [86]. Throughout this research, it tries to investigate the influence of turret location to the dynamic behavior and the mooring lines force of the floating production system. This study is made to access the optimum operational capability of the FPSO system due to the dynamic behaviour and mooring lines force condition.
This paper reviewed the development of Floating Production Storage and Offloading structure using Catenary Anchor Leg Mooring.
2.0 REVIEW ON INTERNAL TURRET MOORED OF TWIN HULLS FPSO
It has been forecasted that between 2013 and 2017, 91 billion dollar will be spent on floating production systems, an increase of 100 percent over the preceding five year period [25]. With global economic growth in 2014 projected to increase to 3.5 percent from 2.9 percent in 2013, world oil demand is forecast to rise by one million barrels per day, compared with 900 000 barrels per day in year 2013 [38]. This massive growth in the floating production sector has come as a result of the rapid evolution that gives the impact to the future development of FPSO.
IEA (2012) forecasted that oil and gas demand will rise from 3.3 trillion cubic meters in 2010 to 5.0 trillion cubic meters in 2035, an increase of 50 percent [40]. This situation has driven the market for FPSO to fulfill the demand. As a result of this situation the new concept of twin hull FPSO has emerged. This novelty is achieved by joining together two FPSO which the process facilities along with the storage and crew living quarters are located on deck. This twin hull concept allows adequate space for the process facilities with the necessary space between sections of equipment to satisfy safety requirements, while providing sufficient oil and gas storage capacity.
The environmental loads on moored structures, namely due to wind, current, and waves, are of a main concern when determining vessel motions and evaluating mooring design [99]. Turret-moored FPSO systems are sensitive to the effect of waves, wind and current. In the recent years, considerable research is being carried out on turret moored FPSO system operating at offshore locations. An internal turret moored FPSO system is an attractive concept for both production facilities and offshore storage [86].
In an internal turret moored FPSO system, the turret structure is built inside the tanker’s hull and it is attached to the sea-bed by catenary anchor leg mooring (CALM). The spider part of the
turret located at the vessel keel level includes bearings, allowing the vessel to rotate freely around its mooring legs in response to changes in environmental excitation and system dynamics. In the case of internal turret moored FPSO system, the vessel motions and mooring forces are mainly governed by the location of the turret so as to maintain optimal operating conditions.
Many research have been done up to now about the single point mooring for monohull FPSO. Thiagarajan and Finch (1998, 1999) conducted an experimental investigation of the vertical motions of a turret moored FPSO in wave using different positions of the mooring along the length of the model [89, 90]. The results show that the mooring location affects the vertical motions and accelerations of the FPSO. Bernitsas and Papoulias (1986) conducted the study on the yaw and stability of single point mooring [53]. Yaw of turret moored vessels in regular waves was investigated by Liu et al. (1999) [51]. O' Donoghue and Linfoot (1992) performed the model test in irregular waves and reported the effect of turret position and mooring load characteristics [62]. Jiang et al. (1995) extensively reported the horizontal motions and mooring line loads of single point moored tanker [44]. Cho (2012) and Cho et al. (2013) studied the motion behavior and stability of turret moored floating body and two bodies including sloshing [16, 17]. Recently, Seok et al. (2013) conducted the model test and stability analysis for a turret moored Floating Storage Regasification Unit (FSRU) [74]. Model tests are performed in regular waves. The results of model test show that the possibility of large yaw in irregular wave can be predicted by the regular wave tests.
Based on the review of these existing literatures, it is found that no information is available for the comparison of the dynamic behaviour of the internal turret moored for twin hull FPSO system at different loading conditions with various turret locations under the action of wave. Hence, the present study investigation has been programmed for a typical turret moored FPSO system by catenary anchor leg mooring (CALM) which subjected to sea waves, in order to get insight knowledge on its dynamic behaviour due to various turret locations with different loading conditions. The comparison of the dynamics behaviour to the FPSO and it mooring lines are important when choosing potential development and optimal options. This research will analyses and highlight the optimal turret location to the new potential concepts of twin hull FPSO. It also will highlight areas where effort is best focussed to mitigate the marine risks.
End of the research is targeted to propose a correction method which is applicable to linear diffraction theory in order to evaluate the motion response of selected moored floating structure. The linear diffraction theory estimate the wave force on the floating body based on frequency domain and this method can be considered as an efficient method to study the motion of the large size floating structure with acceptable accuracy. The effectiveness of this diffraction theory apply on large structure is due to the significant diffraction effect exist on the large size structure in wave [48]. In this study, twin hull FPSO will be selected as an offshore structure model since this structure is one of the new concept structure used in deep water oil and gas exploration area.
To achieve this objective, a programming code will develop based on diffraction potential theory. By comparing the numerical result predicted by using diffraction potential theory to experiment result, it is obtained that the motion prediction by diffraction potential theory has an acceptable accuracy mostly,

Journal of Ocean, Mechanical and Aerospace -Science and Engineering-, Vol.14
December 20, 2014
9 Published by International Society of Ocean, Mechanical and Aerospace Scientists and Engineers
except for heave motion when the wave frequency near to the structure natural frequency [76 ~ 82].
As presented in a previous paper, the diffraction potential theory is less accurate to predict the structure heave motion response when the wave frequency closer to structure natural frequency. At this situation, the heave response calculated by the diffraction potential theory will be overshooting compare to experiment result due to low damping executed by the theory and then follow by the large drop which give and underestimating result compare to experiment result before it is returned into normal tendency [82].
In order to correct the over-predicting phenomenon made by the diffraction potential theory, the previous research was trying to increase the damping coefficient by adding viscous damping into the motion equation [80]. From that study, the viscous damping is treated as extra matrix and added into the motion equation separately. This addition viscous damping was estimated based on the equation provided by Nallayarasu and Prasad (2012).
By adding the extra viscous damping into the motion equation, it can be obtained that the significant over-predicting of heave motion when wave frequency near to the floating structure natural frequency was corrected and it is close to the experimental result compared to executed result by diffraction potential theory alone [77]. However, the under-predicting of the heave response by diffraction potential theory in a certain wave frequency region still remaining unsolved by adding the viscous damping to the motion equation as discussed in the previous study [77].
Siow, et al., (2014b) conducted the researches which focus on the effect drag force and viscous damping in estimate the semi-submersible heave response using diffraction potential theory [80]. To able the numerical solution to calculate the extra drag force and viscous damping, they applied the drag term in Morison equation. Accuracy of the modification solution also checked with the previous semisubmersible experiment result which carried out at the towing tank belongs to UniversitiTeknologi Malaysia [3, 80]. The experiment is conducted in head sea condition and slack mooring condition for wavelength around 1 meter to 9 meters. In the comparison, they obtained that the non-agreed heave response tendency near the structure natural frequency predicted by diffraction potential theory can be corrected by involving the drag effect in the calculation.
3.0 CONCLUSION
Dynmaic behavior of morred twin hulls floating production storage and offloading has been reviewed. The research founded that it currently no information is available for the comparison of the dynamic behaviour of the internal turret moored of twin hulls FPSO at different loading conditions with various turret locations under the action of wave.
ACKNOWLEGMENT The authors are very grateful to Universiti Teknologi Malaysia and Ocean and Aerospace Research Institute, Indonesia for supporting this study.
REFERENCES
1. Aanesland, V. and Stansberg, C.T. (1995).Seakeeping Test with Free Running Model in a Wave.Basin.Proceedings of the International Conference on Seakeeping and Weather, London, 28 Feb-1 March.
2. Abyn, H.a , Maimun, A.b, Jaswara, Rafiqul Islam, M.c, Magee, A.d, Bodaghi, B.a, Pauzi, M.b, Siow, C.L.a, Tofa, M.M., 2014, Hydrodynamic Interaction of Floating Structure in Regular Waves, Jurnal Teknologi (Sciences and Engineering), 66.2, 91-96.
3. Abyn, H., Maimun, A., Jaswar, Islam, M. R., Magee, Bodagi, A., B.,Pauzi, M., (2012a). Model Test of Hydrodynamic Interactions of Floating Structures in Regular Waves, Proc. of the 6th Asia-Pacific Workshop on Marine Hydrodynamics, Johor, Malaysia, 3-5 September.
4. Abyn, H.,Maimun, A., Jaswar, Islam, M. R., Magee, A.,Bodagi, B., Pauzi, M., (2012b). Effect of Mesh Number on Accuracy of Semi-Submersible Motion Prediction, Proc. of the 6th Asia-Pacific Workshop on Marine Hydrodynamics, Johor, Malaysia, 3-5 September.
5. Afrizal, E., Mufti, F.M., Siow, C.L., Jaswar, (2013). Study of Fluid Flow Characteristic around Rounded-Shape FPSO Using RANS Method, The 8th International Conference on Numerical Analysis in Engineering. Pekanbaru, Indonesia, 13-14 May.
6. Arribas, P. and Fernandez, C. (2005). Strip Theories Applied to Vertical Motions of High Speed Craft, Journal of Ocean Engineering. 33 (2006), 1214-1229.
7. Ballard, J., Price, W.G., and Temarel P. (2003), Time Domain Simulation ofSymmetric Ship Motion in Waves, International Journal of MaritimeEngineering.Royal institute of Naval Architects. UK.
8. Beck, R.F., (1989), Ship Response to Regular Waves, Principles of Naval Architecture.Volume 3.SNAME. PP 41-83.
9. Bertram, V. (1997).The Influence of Steady Flow in Seakeeping Computations, Proceedings of 5th Symposium Non-linear and Free Surface Flow, Hiroshima. Japan.
10. Bertram, V. (1998).Numerical Investigation of Steady Flow effects in Three Dimensional Seakeeping Computation, Proceedings of 22nd Symposium on Naval Hydrodynamics, National Academy Press. Washington D.C. PP 78-86.
11. Borodai, I.K., and Netsvetayev, Y.A. (1969), Ship Motion in Ocean Waves, Sudostorenie. Leningrad.
12. C. Guedes Soares, N. Fonseca and R. Pascoal. (2005). Experimental and Numerical Study of the Motions of a Turret Moored FPSO in Waves, Journal of Offshore Mechanics and Arctic Engineering. 127 (8), 197-204.
13. Chakrabarti, S. K. (1987), Hydrodynamics of Offshore Structures.(4th edition), Southampton, UK: WIT Press.
14. Chang, M.S. (1977). Computations of Three Dimensional Ship Motions withForward Speed, Proceedings of 2nd International Numerical Ship Hydrodynamics, University of California. Berkley. PP124-135.
15. Chen, X et al. (2000). New Green Function Method to Predict Wave InducedShip Motions and Loads. Proceedings

Journal of Ocean, Mechanical and Aerospace -Science and Engineering-, Vol.14
December 20, 2014
10 Published by International Society of Ocean, Mechanical and Aerospace Scientists and Engineers
of 23rd Symposium on Naval Hydrodynamics, Val-de-Reuil. France.
16. Cho, SK, (2012), A Study on the Motion Behaviour of Side-by-Side Moored Two Floaters Including Sloshing Effects, Ph.D. Thesis.Seoul National University, Korea.
17. Cho, SK, Sung, HG, Hong SY, and Choi, HS (2013).Study of the Behavior of Turret Moored Floating Body, Proceeding International 23rd Offshore and Polar Engineering Conference,ISOPE.30 June-4 July.Anchorage, Alaska, 892–898.
18. Christina Sjöbris, (2012), Decommissioning of SPM buoy, Master of Science Thesis, Chalmers University ofTechnology, Gothenburg, Sweden.
19. Clauss, G. F.,Schmittner, C.,Stutz, K., (2002).Time-Domain Investigation of a Semi-Submersible in Rogue Waves, Proc. of the 21st International Conference on Offshore Mechanics and Arctic Engineering, Oslo, Norway.
20. Clauss, G.F., Hennig, J., Cramer, H., and Brink, K.E. (2005), Validations of Numerical Motion Simulations by Direct Comparison with Time Series from Ship Model Tests in Deterministic Wave Sequences, Proceedings of OMAE.24th International Conference on Offshore Mechanics and Arctic Engineering, Halkidiki. Greece. June 12-17.
21. Cummins, W.E. (1962), The Impulse Response Function and Ship Motions, Schiffstechnik, 1 (9), 101-109.
22. de Kat, J.O., and Paulling, J.R. (1989), The Simulation of Ship Motion andCapsizing in Severe Seas, Trans SNAME.Volume. 97. PP 139 – 168.
23. Denis St. and Pierson, M. (1953), On the Motion of Ship in Confused Seas, Trans SNAME. Volume 63. PP 386-435.
24. Denise,J-P.F. (1982), On the Roll Motion of Barges, Trans RINA, PP 255-268.
25. Douglas Westwood. (2013), Floating Production Promises Possibilities, Petromin, 39/6, 22-32.
26. Faltinsen ,O. M. (1990), Sea Loads on Ships and Offshore Structure, Cambridge, UK: Cambridge University Press.
27. Fein, J.A., Ochi, M.D. and Creight, K. (1980), Seakeeping Characteristics of a Small Waterplane Area Twin Hull (SWATH) Ship, Proceeding of the 13th Symposium of Naval Hydrodynamics.Tokyo, 6-10 October.
28. Fonseca, N., Ralchev, H, and Soares, C.G. (2001), Seakeeping Assessment of a Monohull Operating in the Portuguese Waters, Proceedings of the Third International Conference on Marine Industry. Varna, 4-8 June.
29. Fonseca, N., Ralchev, H, and Soares, C.G. (2001), Seakeeping Assessment of aMonohull Operating in the Portuguese Waters, Proceedings of the Third International Conference on Marine Industry.Volume- 2.04-08 June. Varna.Bulgaria.
30. Frank, W. (1967). Oscillations of Cylinders in or Bellow the Free Surface of Deep Fluids, Technical Report. Report number 2375, David Taylor ResearchCentre. Bethesda. Maryland. USA.
31. Fylling, I. and Larsen, C. (1982). Dynamic behaviour of anchor lines.Norwegian Maritime Research.10(3), 18-32.
32. Gerritsma, J. and Beukelman, W. (1967), Analysis of Modified Strip Theory forthe Calculation of Ship Motion and Wave Bending Moments, International Shipbuilding Progress.Volume 14.No. 156.
33. Grochowalski, S. (1989), Investigation into the Physics of Ship Capsizing byCombined Captive and Free-Running Model Test., Trans SNAME, Volume 97.PP 169 – 212.
34. Hamamoto, M. and Akiyoshi, T. (1988). Study on Ship Motions and Capsizing inFollowing Seas (1st Report) - Equations of Motion for Numerical SimulationJournal of the Society of Naval Architects of Japan. Volume. 163. PP 173 - 180.
35. Hashizume Y. et al. (1989). Wave Estimation from Ship Motion and Nonlinear Ship Response Analysis in Very Rough Seas. Report of Ship Research Institute. 26(3), 140.
36. Hess, J. L., Smith, A. M. O., (1964).Calculation ofNonlifting Potential Flow About Arbitrary 3D Bodies,Journal of Ship Research, 8(20), 22-24.
37. Hua, J., and Palmquist, M. (1995), Wave Estimation through Ship Motion Measurements-A Practical Approach, Proceedings of the International Conference on Seakeeping and Weather, London, 28 Feb- 1 March.
38. Ian Cochran. (2014), World’s GDP Set to Rise – Higher Tanker Demand, Tanker Operator, 13/3, 4-5.
39. Inglis, R., and Price, W.G. (1981), A Three Dimensional Ship Motion Theory-Comparison between Theoretical Prediction and Experimental Data of the Hydrodynamic Coefficients with Forward Speed.
40. International Energy Agency.World Energy Outlook 2012.Paris Cedex: IEA Publications. 2012.
41. J.M.J Journee and W.W. Massie (2001), Offshore Hydromechanics.(1st edition), Delft University of Technology
42. Jaswar , Tiau, K.U., Abyn, H., Siow, C.L, 2014, Stability of Mobile Floating Harbor Container Crane, Jurnal Teknologi (Sciences and Engineering), 66.2, 133-139.
43. Jaswar et al, (2011), An integrated CFD simulation tool in naval architecture and offshore (NAO) engineering, The 4th International Meeting of Advances in Thermofluids, AIP Conf. Proc.Melaka, Malaysia, 3-4 October.
44. Jiang, T, Schellin, T-E and Shrma S-D (1995), Horizontal Motions of an SPM Tanker Under Alternative mooring Configurations, Journal of Offshore Mechanics and Arctic Engineering. 117 (4), 223-231.
45. Kadir Sariöz and Ebru Narli (2004), Effect of Criteria on Seakeeping Performance Assessment, Ocean Engineering Journal, 2005 (32),1161-1173.
46. Khairuddin, N.M.a, Pauzi, M.b, Koto, J., 2014, Experimental analysis on the mooring lines force behaviour of semi-submersible in regular waves, Jurnal Teknologi (Sciences and Engineering), 69.7, 45-51.
47. Korvin-Kroukovsky, B.V. and Jacobs, W.R., (1957), Pitching and HeavingMotion of a Ship in Regular waves, Trans SNAME. Volume 65.
48. Kvittem, M. I.,Bachynski, E.E.,Moan, T., (2012).Effect ofHydrodynamic Modeling in Fully Coupled Simulations of aSemi-Submersible Wind Turbine, Energy Procedia, 24.
49. Lewis, E.V. (1988), Principle of Naval Architecture.(3rdedition), New York: SNME.
50. Lewis, F.M. (1929), The Inertia of Water Surrounding a Vibrating Ship, Trans SNAME. Volume 27. PP 1-20.
51. Liu, F, Brown, D-T and Fang, J. (1999), Yawing of Turret-Moored Monohull Vessels in Response to Regular Waves, Journal of Ship Research. 43 (3),135-142.
Journal of Ocean, Mechanical and Aerospace -Science and Engineering-, Vol.14
December 20, 2014
11 Published by International Society of Ocean, Mechanical and Aerospace Scientists and Engineers
52. Loken, E.,(1981), Hydrodynamic interaction between severalfloating bodies of arbitrary form in Waves, Proc.Of International Symposium on Hydrodynamics in, Ocean Engineering, NIT, Trondheim.
53. M.M. Bernitsas and F.A. Papoulias. (1986), Stability of Single Point Mooring Systems, Journal of Applied Ocean Research.8 (1), 49-58.
54. M.R. Maheri and R.T. Severn.(1992), Experimental AddedMassIn Modal Vibration of Cylindrical Structures, Journal of Structures Engineering.14(3), 163-175.
55. MacCamy,R.C., Fuchs,R.A, (1954), Waveforceonpiles: Adiffractiontheory, Technical Memorandum No.69, US Army Coastal Engineering Research Center.
56. Maimun, A. (1993). Stability of Fishing Vessels in an Astern Sea-Shallow Water Environment.University of Strathclyde. Ph.D. Thesis.
57. Martin Greenhow and Li Yanbao. (1987), Added Masses for Circular Cylinders Near Or Penetrating Fluid Boundaries-Review, Extension And Application To Water-Entry, Exit And Slamming, Journal of Ocean Engineering.14(4), 325-348.
58. Md. Abu Hena Mostofa Kamal (2007), Seakeeping Analysis of Malaysian Fishing Vessel, Master Thesis, Universiti Teknologi Malaysia, Skudai.
59. Mynett, A.E., and Keuning.(1990), Ocean Wave Data Analysis and Ship Dynamics, Proceedings of an International Union of Theoretical and Applied Mechanics, Uxbridge, UK, 24-27 June.
60. Nallayarasu, S. and Siva Prasad, P., (2012), Hydrodynamic Response of Spar and Semi-submersible Interlinked by aRigid Yoke - Part 1: Regular Wave, Ship and Offshore Structures, 7(3).
61. Newman and John Nicholas. (1977). Marine hydrodynamics. (1st edition), Cambridge, Massachusetts: MIT Press.
62. O' Donoghue, T and Linfoot, B-T. (1992), An Experimental Study of Turret-Moored Floating Production Systems, Journal of Applied Ocean Research. 14 (2),127-130.
63. Ogilvie, T.F. (1964), Recent Progress Toward the Understanding and Prediction of Ship Motion, Proceedings of the ONR 5th Symposium on Naval Hydrodynamics, Bergen, 10-12 September.
64. Ogilvie, T.F. and Tuck, E.O. (1969), A Rational Strip Theory of Ship Motions:Part-1. Technical Report.No. 013, Department of Naval Architecture, University of Michigan.
65. R. Sharma, Tae Wan Kim, O.P. Sha and S.C. Misra. (2010), Issues in Offshore Platform Research-Part 1: Semi-submersibles. International Journal Naval Architecture and Ocean Engineering. 2 (3), 155-170.
66. Rameswar Bhattacharya (1972), Dynamis of Marine Vehicles.(1st edition), New York: John Wiley & Sons.
67. Rantanen, A., Holmberg, J., and Karppinen, T. (1995). Measurement of Encountered Waves and Ship Motions During Full Scale Seakeeping Trials, Proceedings of the International Conference on Seakeeping and Weather, London,28 Feb- 1 March.
68. Riaan Van Veer (2008), Application of Linearized Morison Load in Pipe Lay Stinger Design, Proceedings of the ASME 27th International Conference on OffshoreMechanics and Arctic Engineering, Estoril, Portugal, 15-20 Jun.
69. Rixmann B. (2001), Time Domain Seakeeping Simulations of Some Multiple Water plane Vessels, Master Thesis, University of Newfoundland. St Johns, Canada.
70. Rodrigo Pérez Fernández (2012), Seakeeping in the Navigation – Example In Trimaran
71. Salvesen, N., Tuck, E.O., and Faltinsen, O. (1970), Ship Motions and Sea Loads, Trans. SNAME. Volume. 78. PP 250 – 287.
72. Salvesen, N., Tuck, E.O., and Faltinsen, O. (1970), Ship Motions and Sea Loads, Transaction Society of Naval Architecture and Marine Engineering, SNAME. 78 (1970), 250 – 287.
73. Sen, D. (2002). Time Domain Computation of Large Amplitude 3D Ship Motionswith Forward Speed. Journal of Ocean Engineering.Volume 29, PP 973-1002.
74. Seok Kyu, Cho, Hong Gun, Sung, Sa Young Hong, Yun Ho, Kim (2013). Study of the Stability of Turret moored Floating Body, Proceedings of the 13th International Ship Stability Workshop, Brest, 23-26 September, 1-8.
75. Ships.International Journal for Traffic and Transport Engineering. 2(3), 221 – 235.
76. Siow, C. L., Abby Hassan, and Jaswar, (2013). Semi-Submersible’s Response Prediction by Diffraction Potential Method, The International Conference on Marine Safety and Environment. Johor, Malaysia, 12-13 November.
77. Siow, C. L., Abby Hassan, and Jaswar, (2013a). Semi-Submersible’s Response Prediction by Diffraction PotentialMethod, The International Conference on Marine Safety and Environment, pp: 21 - 28, Johor, Malaysia.
78. Siow, C. L., Jaswar, Afrizal, E., Abyn, H., Maimun, A., Pauzi, M., (2013). Comparative of Hydrodynamic Effect between Double Bodies to Single Body in Tank, The 8th International Conference on Numerical Analysis in Engineering. Pekanbaru, Indonesia, 13-14 May.
79. Siow, C. L., Jaswar, Afrizal, E., Abyn, H., Maimun, A., Pauzi, M., (2013b).Comparative of Hydrodynamic Effect betweenDouble Bodies to Single Body in Tank, The 8thInternational Conference on Numerical Analysis in Engineering, pp: 64 –73, Pekanbaru, Indonesia.
80. Siow, C. L., Jaswar, K, Abby Hassan and N.M Khairuddin(2014b), Linearized Morison Drag for Improvement Semi-SubmersibleHeave Response Prediction by Diffraction Potential, Journal of Ocean, Mechanical and Aerospace Science and Engineering, 8, 8-16.
81. Siow, C. L., Jaswar, K, and Abby Hassan, (2014a), Semi-Submersible Heave Response Study Using DiffractionPotential Theory with Viscous Damping Correction, Journal of Ocean, Mechanical and Aerospace Science and Engineering, 5, 24-29.
82. Siow, C.L., Koto, J., Abyn, H., Maimum, A, 2014, Gap distance analysis of floating structures in tandem arrangement, Developments in Maritime Transportation and Exploitation of Sea Resources - Proceedings of IMAM 2013, 15th International Congress of the International Maritime Association of the Mediterranean, 1, 255-263.
83. Smith.W.E. (1967), Computations of Pitch and Heaving Motions for ArbitraryShip Forms, International Shipbuilding Progress.Volume 14.No.155.
84. Söylemez, M.,(1995). Motion tests of a twin-hulled semi-submersible, Journal of Ocean Engineering, 22(6) 643-660.

Journal of Ocean, Mechanical and Aerospace -Science and Engineering-, Vol.14
December 20, 2014
12 Published by International Society of Ocean, Mechanical and Aerospace Scientists and Engineers
85. SubrataChakrabarti, Jeffrey Barnett, Harish Kanchi, Anshu Mehta, JinsukYim (2007), Design Analysis of A Truss Pontoon Semi-Submersible Concept In Deep Water, Journal of Hydrodynamics. 34 (2007), 621-629.
86. T. Rajesh Kannah and R. Natarajan. (2006), Effect of Turret Location on the Dynamic Behaviour of an Internal Turret Moored FPSO System, Journal of Naval Architecture and Marine Engineering. 3 (2006), 23-37.
87. Tasai, F and Takaki, M. (1969), Theory and Calculation of Ship Responses inRegular Waves, Symposium of Seaworthiness of Ships. Japan Society of Naval Architects.
88. Tasai, F. (1967).On the Swaying, Yawing and Rolling Motions of Ships in Oblique Waves, International Shipbuilding Progress.Volume 14 No. 153.
89. Thiagarajan, K. P., and Finch, S. (1998). A Preliminary Investigation into theEffect of Turret Mooring Location on the Vertical Motions of a FPSO Vessel, Proceedings of the 17th International Conference on Offshore Mechanics and Arctic Engineering, ASME.5-9 July.Lisbon, OMAE98-0554.
90. Thiagarajan, K.P., Finch, S. (1999), An Investigation Into the Effect of Turret Mooring Location on the Vertical Motions of an FPSO Vessel, Journal of Offshore Mechanics and Arctic Engineering. 121 (2),71-76.
91. Tiau, K.U., Jaswar, Hassan Abyn and Siow, C.L., (2012). Study On Mobile Floating Harbor Concept, Proc. of the 6th Asia-Pacific Workshop on Marine Hydrodynamics. Johor, Malaysia, 3-5 September.
92. Timman, R. and Newman, J.N. (1962), The Coupled Damping Coefficients of Symetric Ships, Journal of Ship Research.Volume 5 No.4.
93. Tuck, E. O. (1970). ShipMotions in Shallow Water.Journal of Ship Research.14(4), 317–328.
94. Umeda, N., Munif, A., and Hashimoto, H. (2000), Numerical Prediction ofExtreme Motions and Capsizing for intact Ships in Following/Quartering Seas, Fourth Osaka Colloquium on Seakeeping Performance of Ships. Japan.
95. Ursell, F. (1949), On the Heaving Motion of a Circular Cylinder in the Surface of a Fluid Quart, Journal of Mech. Appl.Math.2 PP 218-231.
96. V. J. Kurian, M.A.Yassir, I.S.Harahap (2010), Nonlinear Coupled Dynamic Response of a Semi-submersible Platform, Proceedings of the 12th International Offshore and Polar Engineering Conference. Beijing, 20-25 June.
97. Van Oortmerssen, G., (1979), Hydrodynamic interaction between two structures of floating in waves, Proc. of BOSS ‘79. Second International Conference on Behavior of Offshore Structures, London.
98. Wackers, J. et al., (2011), Free-Surface Viscous FlowSolution Methods for Ship Hydrodynamics, Archive of Computational Methods in Engineering, Vol. 18 1–41.
99. Watanabe, I., and Soares, C.G. (1999), Comparative Study on the Time-DomainAnalysis of Non-linear Ship Motions and Loads on Marine Structures, Journal of Marine Structures.Volume-12. PP 153-170.
100. Webster, W. C. (1995), Mooring-induced damping, Journal Ocean Engineering, 22:571-591.
101. Weinblum, G. and M. St. Denis, (1950), On the Motion of Ships at Sea, TransactionSociety of Naval Architecture and Marine Engineering, SNAME. 58(1950), 184–231.
102. Wu, M.K. and Hermundstad, O.A. (2002), Time-Domain Simulation of Wave-Induced Nonlinear Motions and Loads and its Applications in Ship Design, Journal of Marine Structures.Volume 15. PP 561-597.
103. Wu, S.,Murray, J. J.,Virk, G. S.,(1997). The motions and internal forces of a moored semi-submersible in regular waves, Journal of Ocean Engineering, 24(7), 593-603.
104. Yamakoshi, Y., Takaishi, Y., Kan, M., Yoshino, T. and Tsuchiya, T. (1982), Model Experiments on Capsize of Fishing Boats in Waves. Second International Conference on Stability of Ship and Ocean Vehicles. Tokyo
105. Yilmaz, A. Incecik,(1996), Extreme motion response analysis of moored semi-submersibles, Journal of Ocean Engineering, 23(6), 497-517.

Journal of Ocean, Mechanical and Aerospace -Science and Engineering-, Vol.14
December 20, 2014
13 Published by International Society of Ocean, Mechanical and Aerospace Scientists and Engineers
Computational Analysis of the influence of Two Circumferential Grooves on Performance of Journal Bearing with Palm Oil as
Lubricant
Asral,a,* Dodi Sofyan Arief, a,* Jamaluddin Md Sherif,b,* and Abd Khair Junaidi,b
a)Teknik Mesin - Universitas Riau, Kampus Bina Widya Panam 28293 Pekanbaru, Riau Indonesia b)Faculty of Mechanical Engineering of Universiti Teknologi Malaysia , 81310, Skudai, Johor, Malaysia *Corresponding author: [email protected], [email protected], [email protected] Paper History Received: 25-October-2014 Received in revised form: 10-December-2014 Accepted: 13-November-2014
ABSTRACT This study compares the performance of a bearing with surface waviness liner to a plain bearing. Both bearings are functioned with palm oil as lubricant so that the potential advantages of the journal bearings could be identified. CFD analysis is developed to predict the numerical data for full film lubrication condition. A bearing of 60 mm in diameter with its ratio of length to diameter is 0.5, a clearance 250µm, and 200µm of wave amplitude is simulated. Semi circular wavy surface produces better results in term of load capacity than the plain journal bearing for a small eccentricity. The load carrying capacity is influenced by the increasing in speed of the shaft and the eccentricity ratio. Keyword: Load Carrying Capacity; Eccentricity; Wavy; Grooves; Temperature Drop. 1.0 INTRODUCTION
In designing a bearing system, there are several important aspects that must be considered i.e the method to deliver the lubricant to the bearing, the distribution of the lubricant within the bearing, the quantity of the lubricant which is required and the amount of heat which is generated by the bearing and its effect on the temperature of the lubricant. A good journal bearing is able to
support high load with less friction so that it can reduce the losses of energy. In this case, the properties of the lubricant may also be considered as it influences the contact between journal and bearing by a layer of fluid with a certain thickness. As an effort to improve the efficiency of the machine, some modifications on the bearing geometry are highly recommended. On the other hand, the usage of bio-based lubricant will enhance the operation of the machine to be environmental friendly.
In order to minimize the factor of friction, improvements on the surface contour are highly needed. For full film lubrication, the lubricant thickness in the clearance of two or more solid boundaries depends on the loads and fluid viscosity. This will be the main factor to determine the bearing lifespan. Generally, in good practice, lubrication is attempted to maintain the oil inside the bearing so that direct contact that inflicts damage can be prevented. In this paper, the properties of the lubricant at high performance operation of journal bearing are studied. Numerous studies have been done in various ways that involve numerical analysis and experimental investigation. Hargreaves (1991) had investigated the influence of sinusoidal surface waviness on the stationary surface of rectangular slider bearings. Hargreaves found that the surface waviness could enhance the load carrying capacity. Theoretical study of the effect of non linear bearing liner was carried out by Hassan (1998) who then agreed with Hargreaves’s findings. Hassan reported that wavy surface liner; both axially and circumferentially, would also increase the load carrying capacity. Gertzos (2008) reported that CFD model by using FLUENT package could solve the journal bearing case study which produced results in a very good agreement between theoretical and experimental. Many studies in non linear surface liner have been investigated such as by Dimofte (2002-2008) which concerning axially three sinusoidal wave journal bearing. Moreover, other researchers also investigated the journal bearing with journal groove shape assorted to achieve a good

Journal of Ocean, Mechanical and Aerospace -Science and Engineering-, Vol.14
December 20, 2014
14 Published by International Society of Ocean, Mechanical and Aerospace Scientists and Engineers
performance, as mentioned by Hirayama et al (2009) and Sahu et al (2006).
As the fluid film lubrication for the lubrication between two solids is considered, it is important to understand the influence of the surface topography of these solids on several important parameters in the mechanism of lubrication in order to obtain a journal performance with high performance. Based on the previously-mentioned findings, the aim of this paper is to develop three dimensional CFD models so that the performance characteristic of semi circular wavy groove journal bearings can be studied. The usage of palm oil lubricants are also included and studied.
2.0 NUMERICAL APPROACH
The presented numerical study here was conducted with the commercial Computational Fluid Dynamics (CFD) code FLUENT. The CFD procedures include the approximation of grid generation technique, turbulence model, boundary conditions, solver scheme and the selection of turbulence model. The software was used to compute the full field pressure distribution and the shear stress information for characteristics inside the journal bearing with semi circular wavy surface conditions. Comparisons were made for smooth surface liner in same conditions.
The first step of simulation was pre-processing, which involved the building of the journal bearing model in Gambit. Then finite-volume-based mesh was applied and all the required boundary conditions and flow parameters were imposed. The numerical model was then ready to be calculated and produced results. The final step in analysis was post-processing, which involves organization and interpretation of the data.
.
2.1 Computational Meshes Proper selection of the computational grid is an important aspect in any computational simulation. A suitable grid will provide accurate solution and fast convergence. In this study, geometry and mesh generation are done by using Gambit. For three dimensional (3D) domains, tetrahedral and hexahedral grid types are accepted in Gambit. Tetrahedral and interval size method meshes are chosen to be the type of mesh with 60° of equiangular skewness, which then it will provide smoother meshing that eliminates the highly skewness. In order to obtain a fine grid and reduce the time converging consumption, tetrahedral cells from 223000 up to 320000 of cells are created in the domain. 2.2 Flow Modeling Turbulence flow is one of the most difficult studies of flow in fluid mechanics. Turbulence take place in eddies in the order of millimetre of size, while the whole flow domain may extend over meters or kilometres. In general, the flow on wavy surface is turbulent. Solving turbulence flow in FLUENT can be divided into two categories as follows:
mii
Suxt
=∂∂
+∂∂ )(ρρρ (1)
Equation (1) is the general form of mass conservation equation and it is valid for incompressible as well as compressible flows. The source Sm is the mass added to the continuous phase from the dispersed second phase (e.g., due to vaporization of liquid droplets) and any user-defined sources. Momentum equation is described by:
)()( jij
i uux
ut
ρρ∂∂
+∂∂
iij
ji
i
Fgxx
p++
∂
∂+
∂∂
−= ρτ
(2) where p is the static pressure and igρ and iF are gravitational and external body forces (e.g., forces that arise from interaction with the dispersed phase), respectively.
Two alternative methods can be employed to render the Navier-Stokes equations tractable so that the small-scale turbulent fluctuations do not have to be directly simulated; Reynolds-averaging (or ensemble-averaging) and filtering. Both methods introduce additional terms in the governing equations that need to be modelled in order to achieve a ‘closure’ for the unknowns. The Reynolds-averaged Navier-Stokes (RANS) equations govern the transport of the averaged flow quantities, with the whole range of the scales of turbulence being modelled. The RANS based modelling approach greatly reduces the required of computational effort and resources, and it is widely adopted for practical engineering applications. An entire hierarchy of closure models are available in FLUENT. The RANS equations are often used to compute time-dependent flows, which unsteadiness may be externally imposed or self-sustained. The momentum equation for Reynolds Average Naviers-Stokes has been written as:
0)( =∂∂
+∂∂
ii
uxt
ρρ (3)
ji
jij
i xxuu
xu
t ∂∂
+∂∂
−=∂∂
+∂∂ ρρρ )()( .
+⎥⎥⎦
⎤
⎢⎢⎣
⎡⎟⎟⎠
⎞⎜⎜⎝
⎛
∂∂
−∂
∂+
∂∂
l
lij
i
j
j
i
xu
xu
xu
δμ32
)( ''ji
j
uux
ρ−∂∂ (4)
The turbulent kinetic energy, k transport equation for The RNG ε−k model, is given by:
+⎟⎟⎠
⎞⎜⎜⎝
⎛
∂∂
∂∂
=∂∂
+∂∂
jeffk
ji
i xk
xku
xk
tμαρρ )()(
kMbk SYGG +−−+ ρε (5) and for the dissipation rate,ε is written by:
+⎟⎟⎠
⎞⎜⎜⎝
⎛
∂∂
∂∂
=∂∂
+∂∂
jeff
ji
i xxu
xtεμαρερε ε)()(
εεεεεερε SRk
CGCGk
C bk +−−+2
231 )( (6)
In these equations, Gk represents the generation of turbulence kinetic energy due to the mean velocity gradients. Gb is the generation of turbulence kinetic energy due to buoyancy. YM represents the contribution of the fluctuating dilatation in compressible turbulence to the overall dissipation rate. The quantities kα and εα are the inverse effective Prandtl numbers

Journal of Ocean, Mechanical and Aerospace -Science and Engineering-, Vol.14
December 20, 2014
15 Published by International Society of Ocean, Mechanical and Aerospace Scientists and Engineers
for k and ε , respectively. kS and εS are user-defined source
terms. The model constants ε1C and ε2C have values derived analytically by the RNG theory. These values, used by default in FLUENT, are ε1C =1.42, ε2C = 1.68
μC = 0.0845.
2.3 Boundary Conditions The applied boundary conditions in this simulation are common for an incompressible flow. Figure 1 shows a wavy surface with two grooves semi circular wavy. A bearing of 60mm in diameter with its ratio of length to diameter is 0.5, a clearance 250 µm and 200 µm of wave amplitude was developed. To represent the study, a set of typical boundary conditions was used in the present work in 3D test section of the journal bearing simulations. The shaft (journal) rotated counter-clockwise whereas the bearing was stationary. The lubricant circulated in the journal bearing clearance circumferentially and followed the groove wavy surface. The boundary conditions of pressure inlet, pressure outlet and wall were developed to the left end, right end, shaft and bearing respectively.
Figure.1: A-3D open view drawing of two circumferential grooves journal bearing.
Pressure inlet boundary conditions are used to define the fluid pressure at the flow inlets, along with all other scalar properties of the flow. Pressure on the left side in practice is an integral part with respect to direct ambient pressure (here are conditioned to be zero, Pinlet = 0 gage), so this condition will result in a calculation which is closer to the actual condition.
Pressure outlet of boundary conditions is assigned at the domain outlet. The use of pressure outlet as the boundary conditions instead of an outflow conditions often results in a higher rate of convergence when backflow occurs during iteration. Pressure outlet which is set to zero, Poutlet = 0 gage, is equal to the atmospheric pressure which is typically used as a reference pressure measurement.
Wall boundary conditions are used to bound fluid and solid regions. Journal wavy surface and bearing are treated as wall, moving and stationary wall and no-slip boundary conditions are applied. 2.4 Load Capacity The load capacity is resulted from the pressure generated in the fluid film. The load capacity is a function of load generated pressure distribution around the journal and surface area due to
both the rotation and variation in fluid film thickness along circumference. Therefore, the wave journal bearing load capacity depends on the contact surface shape, amplitude and wave number, which investigated the effect of surface shape as shown in Figure 1 as the scope of this study. Load carrying capacity ratios are plotted in the figure and it is calculated by using the following dimensionless equation load:
DLPFWcc = (7)
where F, P, L, D are the load on the journal, ambient pressure, length of bearing, and the diameter of the journal respectively.
Eccentricity (e) due to the clearance between the shaft and bearing surface is experienced by both external loads and also shaft weight (W), i.e the distance between the axis of the shaft to the bearing as can be seen in Figure 2 while the radial clearance is the difference between the outer radius of journal and the radius of bearing, c = R - r. Consequently the thickness around the circumference of bearing lubrication oil is not the same. The fluid film has a thin film at one end and a thicker film at the other end. As the shaft is rotating at a certain speed, the position of this layer will change. Load and shaft speed are among others that could affect the eccentricity and also the maximum and minimum thickness of lubricant. In this study, eccentricity ratio, ε is set to be 0.107, 0.284, 0.400, 0.568, and 0.632 respectively and also this ensures the minimum thickness of oil lubrication.
Figure.2: Schematic of eccentricity
The lubricant properties used in the calculation is based on
the palm oil, which subsequently is approached by the nature of the Benzene-Liquid included in FLUENT database where density (ρ) = 887.5 kg/m3, thermal conductivity = 0.1721 w/m-k, heat capacity=1861 kj/kg-K, and viscosity (μ) = 0.07719 kg/m-s. 3.0 RESULTS AND DISCUSSIONS
Figure 3 shows the pressure distribution in the bearing due to the effect of changing surface liner with semi-circular wavy surface. It is shown clearly here that the presence of wavy surface can change the pressure distribution as the vicinity of high pressure becomes more concentrated at the top of the wave. Meanwhile for both bearings, maximum pressure areas are formed at the almost half of the bearings in the direction of shaft rotation.

Journal of Ocean, Mechanical and Aerospace -Science and Engineering-, Vol.14
December 20, 2014
16 Published by International Society of Ocean, Mechanical and Aerospace Scientists and Engineers
(a)
(b)
Figure.3: Pressure distribution in the bearing, (a) plain bearing, and (b) semi circular wavy bearing
Then, the effect of the waviness surface shape in dimensionless load carrying capacity in comparison with a linear journal bearing is analyzed. The effects of the shaft speed and eccentricity to the load carrying capacity of the bearing are shown in following Figure 4 to 8. The displayed graphs may provide an explanation that the shaft speed could affect the load capacity, which it is followed by the changes in eccentricity. This provides as an advantage for each changes of the journal bearing inner surface so that the comparison of the characteristics can be obtained. Along with the increasing shaft speed, the characteristics of journal bearings are changed in terms of magnitude load capacity as well as the changes in eccentricity. Plain bearing on a large eccentricity shows a higher performance in load capacity while the wavy bearing seems to be low in performance. This is caused by the fluid pressure that experiences a small clearance around the shaft, as the clearance that serves to support the load on the wavy surface is smaller. Oil can not be forced to be at the peak of the wave so that more are on the valley. The clearance between the surfaces of the shaft with the bearing seems to affect oil pressure. As the semi-circular wavy surface is distinguished by the development of a small groove, it is consequently influenced by the lubrication. By comparing this to the plain bearing, wavy surface seems to have advantage over linear as it increases the load capacity in the small eccentricity. As the shaft speed increases, the characteristics of journal bearings show varied changes in term of magnitude of load capacity and the eccentricity ratio. From these figures, semi circular wavy with the highest value of eccentricity ratio produces the lowest value of load capacity while this event shows contrary in the results of linear journal bearing which it is caused by the
development of groove. The trend of curves between semi circular wavy with the plain journal bearing shows a relatively similar behaviour in term of shape.
Best performance in terms of the increasing in load capacity can be achieved by a circular wavy with the eccentricity ratio, ε = 0.4, which if it is accompanied by an increasing in speed of shaft rotations. From these figures, an obvious event of the increasing in load capacity with a small gradient occurs. This is caused by the changes in fluid pressure around the shaft which it simultaneously acts to support the load. To calculate the amount of pressure, the involved significant parameter is the cross-sectional area where the pressure is experienced, where the surface shape that influences the generated pressure forces is also considered.
0123456789
1011
0 1000 2000 3000 4000 5000 6000Shaft speed, Rpm
Dim
ensi
onle
ss lo
ad c
apac
itySemi circular wavy
Plain bearing
Figure.4: Shaft rotation speed effects to load capacity at eccentricity ratio, ε = 0.632
0
1
2
3
4
5
6
0 1000 2000 3000 4000 5000 6000Shaft speed, Rpm
Dim
ensi
onle
ss lo
ad c
apac
ity
Semi circular wavy
Plain bearing
Figure.5: Shaft rotation speed effects to load capacity at eccentricity ratio, ε = 0.568
0
1
2
3
4
5
6
0 1000 2000 3000 4000 5000 6000Shaft speed, Rpm
Dim
ensi
onle
ss lo
ad
capa
city
Semi circular wavy
Plain bearing
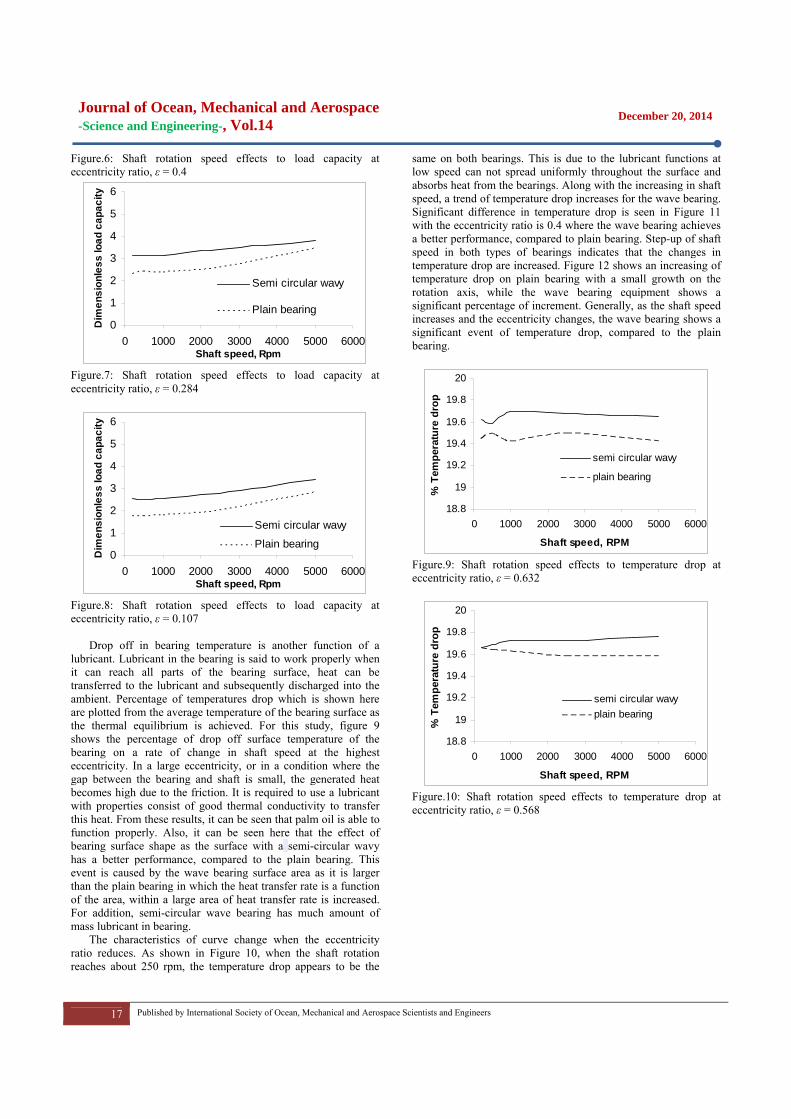
Journal of Ocean, Mechanical and Aerospace -Science and Engineering-, Vol.14
December 20, 2014
17 Published by International Society of Ocean, Mechanical and Aerospace Scientists and Engineers
Figure.6: Shaft rotation speed effects to load capacity at eccentricity ratio, ε = 0.4
0
1
2
3
4
5
6
0 1000 2000 3000 4000 5000 6000Shaft speed, Rpm
Dim
ensi
onle
ss lo
ad c
apac
ity
Semi circular wavy
Plain bearing
Figure.7: Shaft rotation speed effects to load capacity at eccentricity ratio, ε = 0.284
0
1
2
3
4
5
6
0 1000 2000 3000 4000 5000 6000Shaft speed, Rpm
Dim
ensi
onle
ss lo
ad c
apac
ity
Semi circular wavy
Plain bearing
Figure.8: Shaft rotation speed effects to load capacity at eccentricity ratio, ε = 0.107
Drop off in bearing temperature is another function of a lubricant. Lubricant in the bearing is said to work properly when it can reach all parts of the bearing surface, heat can be transferred to the lubricant and subsequently discharged into the ambient. Percentage of temperatures drop which is shown here are plotted from the average temperature of the bearing surface as the thermal equilibrium is achieved. For this study, figure 9 shows the percentage of drop off surface temperature of the bearing on a rate of change in shaft speed at the highest eccentricity. In a large eccentricity, or in a condition where the gap between the bearing and shaft is small, the generated heat becomes high due to the friction. It is required to use a lubricant with properties consist of good thermal conductivity to transfer this heat. From these results, it can be seen that palm oil is able to function properly. Also, it can be seen here that the effect of bearing surface shape as the surface with a semi-circular wavy has a better performance, compared to the plain bearing. This event is caused by the wave bearing surface area as it is larger than the plain bearing in which the heat transfer rate is a function of the area, within a large area of heat transfer rate is increased. For addition, semi-circular wave bearing has much amount of mass lubricant in bearing.
The characteristics of curve change when the eccentricity ratio reduces. As shown in Figure 10, when the shaft rotation reaches about 250 rpm, the temperature drop appears to be the
same on both bearings. This is due to the lubricant functions at low speed can not spread uniformly throughout the surface and absorbs heat from the bearings. Along with the increasing in shaft speed, a trend of temperature drop increases for the wave bearing. Significant difference in temperature drop is seen in Figure 11 with the eccentricity ratio is 0.4 where the wave bearing achieves a better performance, compared to plain bearing. Step-up of shaft speed in both types of bearings indicates that the changes in temperature drop are increased. Figure 12 shows an increasing of temperature drop on plain bearing with a small growth on the rotation axis, while the wave bearing equipment shows a significant percentage of increment. Generally, as the shaft speed increases and the eccentricity changes, the wave bearing shows a significant event of temperature drop, compared to the plain bearing.
18.8
19
19.2
19.4
19.6
19.8
20
0 1000 2000 3000 4000 5000 6000
Shaft speed, RPM
% T
empe
ratu
re d
rop
semi circular wavy
plain bearing
Figure.9: Shaft rotation speed effects to temperature drop at eccentricity ratio, ε = 0.632
18.8
19
19.2
19.4
19.6
19.8
20
0 1000 2000 3000 4000 5000 6000
Shaft speed, RPM
% T
empe
ratu
re d
rop
semi circular wavyplain bearing
Figure.10: Shaft rotation speed effects to temperature drop at eccentricity ratio, ε = 0.568

Journal of Ocean, Mechanical and Aerospace -Science and Engineering-, Vol.14
December 20, 2014
18 Published by International Society of Ocean, Mechanical and Aerospace Scientists and Engineers
18.8
19
19.2
19.4
19.6
19.8
20
0 1000 2000 3000 4000 5000 6000
Shaft speed, RPM
% T
empe
ratu
re d
rop
semi circular wavy
plain bearing
Figure.11: Shaft rotation speed effects to temperature drop at eccentricity ratio, ε = 0.400
18.8
19
19.2
19.4
19.6
19.8
20
0 1000 2000 3000 4000 5000 6000
Shaft speed, RPM
% T
empe
ratu
re d
rop
semi circular wavy
plain bearing
Figure.12: Shaft rotation speed effects to temperature drop at eccentricity ratio, ε = 0.284
18.8
19
19.2
19.4
19.6
19.8
20
0 1000 2000 3000 4000 5000 6000
Shaft speed, RPM
% T
empe
ratu
re d
rop
semi circular wavyplain bearing
Figure.13: Shaft rotation speed effects to temperature drop at eccentricity ratio, ε = 0.107 4. 0 CONCLUSIONS
In this study, it can be concluded that the presence of surface waviness leads to an increment in bearing load carrying capacity with better results are achieved in semi-circular wavy where improvement remains stable even with the increasing in shaft speed in small eccentricity. Also, a conclusion can be made that the performance of liner journal bearings is generally lower than
any other value growth in terms of temperature drop for each changes in shaft speed and eccentricity. Finally, it also can be concluded that palm oil can be used as lubricant.
REFERENCES
1. Habchi,W, Verge, P, Bair,S, Andersson, O, Eyheramendy,D,
and Morales-espeje, G.E, 2010, Influence of Pressure and Temperature Dependence of Thermal Properties of a Lubricant on the Behavior of Cicular TEHD Contacts, Tribology International, article in press.
2. Mishra, P.C, Pandey, R.K, and Athre,K, 2007, Temperature Profile of an Elliptic Bore journal Bearing, Tribology International, 40, 453-458.
3. Chauhan, Amit, Sehgal, Rakesh, and Kumar Sharma, Rajesh, 2010, Thermohydrodynamic Analysis of Elliptical Journal Bearing with Different Grade Oils, Tribology International, article in press.
4. Hirayama, Tomoko, Yamaguchi, Naomi, Sakai, Shingo, Hishida, Noriaki, Matsuoka, Takashi, Yabe, Hiroshi, 2009, Optimization of Groove Dimensions in Herring Bone Grooved Journal Bearings for Improved Repeatable Run Out Characteristics, Tribology International, 42,675-681.
5. Ene, Nicoleta M, Dimofte, Florin, Keith, Theo. G, 2008, A stability Analysis for a Hydrodynamic Three Wave Journal Bearing, Tribology International 41,434-442.
6. Gertzos,K.P,Nikolakopoulos,P.G,Papadopoulos, C.A, 2008, CFD Analysis of Journal Bearing Hydrodynamic Lubrication by Bingham Lubricant, Tribology International, 41,1190-1204.
7. Sahu, M, Sarangi, M, Majumdar, B.C, 2006, Thermo Hydrodynamic Analysis of Herringbone Grooved Journal Bearings, Tribology International, 39,1395-1404.
8. Dimofte, Florin, 2000, Wave Journal Bearings Under Dynamic Loads Nasa/Tm, 212079.
9. E. Rasheed, Hasan, 1998, Effect of Surface Waviness on the Hydrodynamic Lubrication of a Plain Cylindrical Sliding Element Bearing, Wear, 223,1-6.
10. [Hargreaves, D.J, 1991, Surface Waviness Effects on the Load-Carrying Capacity of Rectangular Slider Bearings, Wear, 145,137-151.

Journal of Ocean, Mechanical and Aerospace -Science and Engineering-, Vol.14
December 20, 2014
19 Published by International Society of Ocean, Mechanical and Aerospace Scientists and Engineers
Stratified Oil-Water Two-Phases Flow of Subsea Pipeline
Adib Zulhilmi Mohd Alias,a , Jaswar Koto,a,b,*, Yasser Mohamed Ahmed,a and Abd Khair Junaidi,b
a)Department of Aeronautics, Automotive and Ocean Engineering, Universiti Teknologi Malaysia, Malaysia b)Ocean and Aerospace Research Institute, Pekanbaru, Indonesia *Corresponding author: jaswar,[email protected] and [email protected]
Paper History Received: 7-December-2014 Received in revised form: 15-December-2014 Accepted: 19-December-2014 ABSTRACT Oil-water two-phase flow in 0.0254m horizontal pipe is simulated using FLUENT 6.2. The stratified flow regime is modeled using Volume of Fluid (VOF) with turbulent model RNG k-ε. Grid independent study has been conducted to decide mesh size for solution accuracy and optimum computational cost. The simulation is performed in time-dependent simulation where oil and water are initially separated by patching the region base on difference in density. Observation on the effect of velocity to the pressure gradient was also simulated. Flow velocity at 0.2, 0.5, 0.8 and 1.1 m/s with same volume fraction for each phase with appropriate multiphase model and turbulence model are presented. Keywords: Stratified oil-water flow; Turbulence flow; CFD 1.0 INTRODUCTION Immiscible liquid-liquid flow is a common occurrence encountered in a variety of industrial processes. In oil and gas industry, oil transportation either from reservoir to processing facilities or to onshore refinery are usually transported in multiphase flow condition since water and oil are normally produced together. Fractions of water are usually influenced by its existence within the stratum and also through oil recovery method which used water to enhance the remaining oil in the reservoir.
The presence of water, during the transportation of oil has a significant effect because the flow is no longer can be treated as a single-phase flow. Oil-water has complex interfacial structure which complicates the hydrodynamic prediction of the fluid flow. Changes in water fraction may influence the power required to pump the fluid due to corresponding changes in pipeline pressure drop. Either water-in-oil or oil-in-water dispersions, both can influence the pressure gradient dramatically.
Computational fluid dynamics (CFD) techniques have been used to simulate the stratified pipe flow. One of the early CFD models of turbulent stratified flow in a horizontal pipe was presented by Shoham and Taitel (1984) where a 2D simulation for liquid-gas flow was simulated by adopting zero-equation models for the liquid region flow field while the gas region was treated as a bulk flow. Issa (1988) numerically simulated the stratified gas-liquid pipe flow, using standard k-ε turbulence model with wall function for each phase. Newton and Behnia (1998) obtained more satisfactory solutions for stratified pipe flow by employing a low Reynolds number turbulent model instead of wall functions.
Hui et al 2003 simulated stratified oil-water two-phase turbulent flow in a horizontal tube by applying RNG k-ε model combined with a near-wall low-Re turbulence model to each phase and they adopt continuum surface force approximation for the calculation of surface tension. Their simulation results was compared with Elseth et al 2000 who simulated the turbulent stratified flow, however their numerical results are not acceptable when compared with their measured data.
Stratified oil-water two-phase pipe flow was investigated using different type of multiphase model. Awal et al (2005) achieved CFD simulation tool to investigate inline oil and water separation characteristics under downhole conditions. They chose the Eulerian-Eulerian model, which is computationally most comprehensive but more suitable for multiphase systems with the dispersed phase exceeding 10% v/v/. Carlos F. (2006) developed a 2D model for fully-developed, turbulent-turbulent oil-water stratified flow using finite-volume method in a bipolar coordinate system and applying a simple mixing-length

Journal of Ocean, Mechanical and Aerospace -Science and Engineering-, Vol.14
December 20, 2014
20 Published by International Society of Ocean, Mechanical and Aerospace Scientists and Engineers
turbulence model. Hui et al (2003) and Al-Yaari et al (2011) simulated stratified oil-water two-phase turbulent flow in a horizontal tube numerically using a volume of fluid (VOF) model. They applied RNG k-ε model with enhanced wall function combined with optimum meshes through grid independent study to obtain clearly separated oil layer and optimum computational cost.
In the present paper multiphase model of Volume of Fluid (VOFis used to model the stratified oil-water flow. Optimum number of elements for simulation accuracy has been conducted through grid independent study. Observation on the effect of velocity to the pressure gradient was also simulated at flow velocity 0.2, 0.5, 0.8 and 1.1 m/s with same volume fraction for each phase. 2.0 NUMERICAL SIMULATION
The CFD simulation was started by geometry modeling as shown in Figure.1. In the simulation, the domain and the meshes were created using ANSYS Design Modeler. The computational grid was 46631, 79488, 104584 and 142374 elements as case study.
Geometry modellingDefine geometryDefine boundaries
Grid generationDivide the geometry into small
computational cells
Defining modelsAdd models for turbulence, chemical
reactions etc.
Set propertiesDensity, viscosity etc
Set boundary and inlet conditions
The initial conditions, inlet and outlet conditions and conditions at the wall
are set
SolveChoose solver, iteration
methods, transient or steady state, convergence requirement
Post‐processingAnalyze the results
Figure.1: CFD Simulation Steps. 2.1 Geometry and mesh A sketch of the geometry of the calculation domain is shown in Figure.2. The geometry consists of semicircular inlet for oil and water with 1 meter length of the flow domain. The inlet for both phases is at the same inlet face where oil on top and water at the bottom region. This will initially made the flow in stratified condition. In addition, as both inlets also flew with a same velocity with direction almost parallel to each phase makes fewer disturbances to maintain stratified flow. The diameter of the pipe for the present work is 0.0254 m. In order to keep the volume of oil and water are flowing continuously throughout the domain until the outlet, patch file and adapt region is used to declare the top and bottom regions for oil and water. This will avoid insufficient volume of either phase.
Figure.2: Stratified pipe design using ANSYS Design Modeler
A block-structured meshing approach was used to create
meshes with only tri/tet cells as shown in Figure.3. In order to obtain fine meshing scheme, sizing was set up with curvature normal angle 11 degree, 0.0001 minimum size and 3.0 m maximum size. While to improve the flow near the wall region, two layer inflation with growth rate 1.2 is adapted
Figure.3: Tri/Tet meshes.
2.2 Boundary Conditions There are three faces bounding the calculation domain as follows:
1. Inlet boundary, 2. Wall boundary and 3. Outlet boundary.
Flat velocity profile for oil and water were introduced at the inlet of their sections. The outlet boundary condition at the end was set up as a pressure outlet boundary. It is assumed that no slip was used to model liquid velocity at the wall. The main fluid phases’ physical properties are reported in Table 1.
Table 1: Fluid phases physical properties Property Water Phase Oil Phase
Density (ρ), kg/m3 998.2 780 Dynamic Viscosity (μ), Pa.s 0.001003 0.00157

Journal of Ocean, Mechanical and Aerospace -Science and Engineering-, Vol.14
December 20, 2014
21 Published by International Society of Ocean, Mechanical and Aerospace Scientists and Engineers
Interfacial Tension, N/m 0.17 m @ 200C 2.3 Solution Strategy and Convergence Pressure-based solver is chosen since it was applicable for wide range of flow regimes from low speed incompressible flow to high speed compressible flow. This solver also requires less memory (storage) and allows flexibility in the solution procedure. Green-gauss Node-Based is elected for higher order discretization scheme since it is more accurate for tri/tet meshes. For pressure, PRESTO! discretization scheme was used for pressure, second order upwind discretization scheme was used for the momentum equation, volume fraction, turbulent, kinetic and turbulent dissipation energy. Second-order upwind is chose rather than First-order upwind because it uses larger stencils for 2nd order accuracy and essential with tri/tet mesh even though the solution to converge may be slower but manageable. In addition, the simulation is time dependent (transient) with 1000 time steps, 0.01 time step size and 200 iterations at each time step size. 3.0 RESULTS AND ANALYSIS In this section one presents, use of Volume of Fluid multiphase model along with RNG k-ε for turbulent model, grid independent test and sample of pressure drop prediction using this simulation . 3.1 Grid Independent Study A grid independent study is conducted to obtain sufficient mesh density as it was necessary to resolve accurate flow. A grid independent solution exists when the solution does not change when the mesh is refined. The computational grid of 46631, 79488, 104584 and 142374 elements were tested for the mesh independent study to find out the optimum size of the mesh to be used for simulation. The simulation was carried out at 0.5 input water volume fractions by means that 50 percent of water and 50 percent of oil in 0.5 m/s.
Figure.4 shows an oil volume fraction contours at plane z = 0.5 m which indicates the accuracy of the mesh to display the flow pattern.
As shown in figure, system increased number of elements shows better prediction for stratified flow pattern with smoothness of the clearly oil and mixed layer. 46631 showing bad prediction on the oil and mixed layer since insufficient amount of elements could not give detail prediction especially on the mixed layer. Both meshes for 104584 and 142374 gave almost similar contours of oil fraction with slight differences in the smoothness of the clearly oil and mixed layer. Therefore, based on the oil volume fraction contours results, 142374 cells are the most optimum number of cells required to predict the oil-water stratified flow in the tested domain and such mesh is going to be used for simulation.
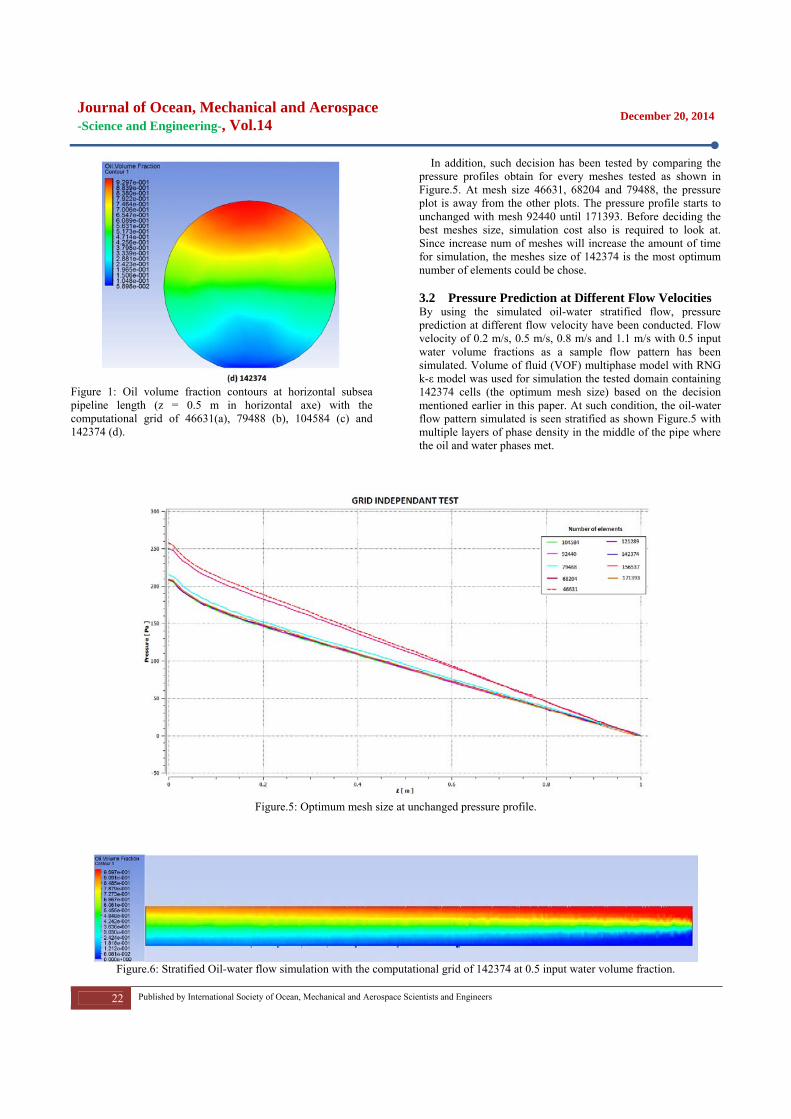
Journal of Ocean, Mechanical and Aerospace -Science and Engineering-, Vol.14
December 20, 2014
22 Published by International Society of Ocean, Mechanical and Aerospace Scientists and Engineers
Figure 1: Oil volume fraction contours at horizontal subsea pipeline length (z = 0.5 m in horizontal axe) with the computational grid of 46631(a), 79488 (b), 104584 (c) and 142374 (d).
In addition, such decision has been tested by comparing the pressure profiles obtain for every meshes tested as shown in Figure.5. At mesh size 46631, 68204 and 79488, the pressure plot is away from the other plots. The pressure profile starts to unchanged with mesh 92440 until 171393. Before deciding the best meshes size, simulation cost also is required to look at. Since increase num of meshes will increase the amount of time for simulation, the meshes size of 142374 is the most optimum number of elements could be chose. 3.2 Pressure Prediction at Different Flow Velocities By using the simulated oil-water stratified flow, pressure prediction at different flow velocity have been conducted. Flow velocity of 0.2 m/s, 0.5 m/s, 0.8 m/s and 1.1 m/s with 0.5 input water volume fractions as a sample flow pattern has been simulated. Volume of fluid (VOF) multiphase model with RNG k-ε model was used for simulation the tested domain containing 142374 cells (the optimum mesh size) based on the decision mentioned earlier in this paper. At such condition, the oil-water flow pattern simulated is seen stratified as shown Figure.5 with multiple layers of phase density in the middle of the pipe where the oil and water phases met.
Figure.5: Optimum mesh size at unchanged pressure profile.
Figure.6: Stratified Oil-water flow simulation with the computational grid of 142374 at 0.5 input water volume fraction.

Journal of Ocean, Mechanical and Aerospace -Science and Engineering-, Vol.14
December 20, 2014
23 Published by International Society of Ocean, Mechanical and Aerospace Scientists and Engineers
Figure.7 shows the view of oil volume fraction contours at pipe length (z = 0.5 m) which located in the middle of the pipe length as shown in Figure.7. Different velocity indicates different inversion point. 0.2 and 0.5 m/s can be considered as slow speed which gives more time for both phases to dispersed within each other. On the view of oil production is not good since avoiding mixing phases will reduce time during separation processes. 0.8 and 1.1 m/s shows better oil and water mixture. From the contours seen the fraction of oil at the upper region shows high fraction of oil. It indicates less water inversion to its phase.
Figure.7: Oil volume fraction contours at pipe length (z = 0.5 m) at 1.1 m/s (a), 0.8 m/s (b), 0.5 m/s (c) and 0.2 m/s (d).
Figure.7: Pressure profile at each flow velocity
4.0 CONCLUSIONS The following conclusive remarks result from our analysis. As far as the fluid dynamic analysis is concerned:
1. CFD calculations using Fluent 6.2 were performed to predict the oil-water stratified flow in 0.0254 m horizontal pipe.
2. Volume of Fluid (VOF) multiphase model with RNG k-ε two equations turbulent model was selected among other different multiphase and turbulent models based on the convergence, prediction off the oil-water stratified flow pattern and the smoothness of the interface.
3. Mesh independent study has been achieved to decide on the optimum mesh size to be used in the simulation process.
4. Pressure prediction base on different flow velocity have been observed. It can be seen that as velocity increases, the pressure gradient also increases.
5. The pressure prediction will be extended to examine the effect from different water volume fraction.

Journal of Ocean, Mechanical and Aerospace -Science and Engineering-, Vol.14
December 20, 2014
24 Published by International Society of Ocean, Mechanical and Aerospace Scientists and Engineers
ACKNOWLEDGEMENTS The authors are very grateful to Universiti Teknologi Malaysia and Ocean and Aerospace Research Institute, Indonesia for supporting this study. Authors are also grateful for useful discussions with my family and all my friends. REFERENCE 1. Shoham, Y.Taitel. (1984). “Stratified turbulent-turbulent
gas-liquid flow in horizontal and inclined pipes”, AIChE J. Vol.30, Issue.2, pp: 377-385.
2. R.I, Issa. (1988). “Prediction of turbulent, stratified, two-phase flow in inclined pipes and channels”, Int. J. Multiphase Flow 14, Vol.1, pp: 141-154.
3. C.H. Newton, M. Behnia. (1998). “Numerical calculation of turbulent stratified gas-liquid pipe flows”, Int. J. Multiphase Flow 24, Vol.5, pp: 141-154.
4. Hui gao, Han-Yang Gu and Lie-Jin Guo. (2003). “Numerical study of stratified oil-water two-phase turbulent flow in a horizontal tube”, Int. J. heat and mass transfer, Vol.46, pp: 749-754
5. G. Elseth, H.K. Kvandal, M.C. Melaaen. (2000). “Measurement of velocity and phase fraction in stratified oil-water flow”, International Symposium on Multiphase Flow and Transport Phenomena, Antalya, Turkey, pp: 206-210.
6. Awal, Mohammad R., Zughbi, Habib D., Razzak, Shaikh A., Al-Majed, Abdulaziz A., and Al-Yousef, hasan Y., (2005). “Liquids phase holdup and separation characteristics as a function of well inclination and flowrate”, SPE SA, pp: 14-16.
7. Carlos F. (2006). “Modelling of oil-water flow in horizontal and near horizontal pipes”, PhD Thesis, Tulsa University.
8. Al-Yaari, M., and Abu-Sharkh. (2011). “CFD Prediction of stratified oil-water flow in a horizontal pipe”, Asian Transactions on Engineering Vol.01, Issue.05, November.
9. Adeeb Alias, Jaswar Koto, Yasser M. Ahmed. (2014). CFD Simulation for Stratified Oil-Water Two-Phase Flow in a Horizontal Pipe, Proceeding of Ocean, Mechanical and Aerospace -Science and Engineering-, Vol.1, pp.20-25.

Publishe
ed & Printed
ISOReJalPekhtt
d OMAse esty Menara Hlan Sisingamakanbaru-Riautp://www.isom
Hotel angaraja No.89u, Indonesia mase.org/
9
Teknik MFakultasUniversIndoneshttp://ft.
Mesin s Teknik itas Riau, ia .unri.ac.id/
IISSN: 2354-70065