west texas sensitivity study · pipeline model vs. electric model ... west texas improvements for...
TRANSCRIPT

WESTTEXASSENSITIVITYSTUDY
JUNE 2016
Prepared for: The Electric Reliability Council of Texas, Inc. (ERCOT) 2705 West Lake Drive Taylor, TX 76574
Prepared by: Energy Ventures Analysis, Inc. 1901 N. Moore Street, Suite 1200 Arlington, VA 22209-1706 703-276-8900

Acknowledgements
During the course of the investigations for the preparation of this report there were several parties that made significant contributions, particularly in response to inquiries and coordinating various presentations and discussions. Of particular note were Toni Gordon at Pioneer Natural Resources and Evan Rowe at ERCOT. Also, the input and response by Ken Donohoo at Oncor and John Holmes at Sharyland were particularly beneficial.

Energy Ventures Analysis, Inc. 1 2016 West Texas Sensitivity Study
TableofContents1. EXECUTIVE SUMMARY ....................................................................................... 1-1
Objective ............................................................................................................................................... 1-1
Report Structure .................................................................................................................................... 1-2
Suggestions and Recommendations ...................................................................................................... 1-2
2. HISTORICAL PERSPECTIVES ............................................................................. 2-1
Overview .............................................................................................................................................. 2-1
Sequence of Events ............................................................................................................................... 2-1
2011 and Earlier .............................................................................................................................. 2-1
2012 to 2014 .................................................................................................................................... 2-2
2015 to 2016 .................................................................................................................................... 2-4
Assessment ........................................................................................................................................... 2-6
Historical ......................................................................................................................................... 2-6
Future ............................................................................................................................................. 2-12
3. PERMIAN BASIN ................................................................................................... 3-1
Background ........................................................................................................................................... 3-1
Geology ........................................................................................................................................... 3-1
Geography ....................................................................................................................................... 3-2
Size and Comparisons ..................................................................................................................... 3-2
Enhanced Oil Recovery ................................................................................................................... 3-4
Recent Activity ..................................................................................................................................... 3-5
Outlook ................................................................................................................................................. 3-7
Future Drilling Activity ................................................................................................................... 3-9
4. OBSERVATIONS .................................................................................................... 4-1
Overview .............................................................................................................................................. 4-1
General Observations ............................................................................................................................ 4-1

Energy Ventures Analysis, Inc. 2 2016 West Texas Sensitivity Study
Overall Assessment ......................................................................................................................... 4-1
Inverse Relationship ........................................................................................................................ 4-1
Limitations ....................................................................................................................................... 4-3
Key Characteristics ............................................................................................................................... 4-4
Key Components ............................................................................................................................. 4-4
Technology ...................................................................................................................................... 4-5
Infrastructure ................................................................................................................................... 4-5
Differences ...................................................................................................................................... 4-5
Evaluation ............................................................................................................................................. 4-8
Coverage .......................................................................................................................................... 4-8
Core Competencies ........................................................................................................................ 4-10
Common Oil Price Forecast .......................................................................................................... 4-10
Environmental Issues ..................................................................................................................... 4-11
Pipeline Model vs. Electric Model ................................................................................................ 4-12
Tragedy of The Commons ............................................................................................................. 4-12
Overall Power Planning Process.................................................................................................... 4-16
5. RECOMMENDATIONS .......................................................................................... 5-1
Overview .............................................................................................................................................. 5-1
Long Time Horizon .............................................................................................................................. 5-1
Limitations ............................................................................................................................................ 5-2
Outreach ................................................................................................................................................ 5-2
Aggregate Assessment ..................................................................................................................... 5-4
5-Year Planning Horizon ................................................................................................................. 5-4
Core Competencies ............................................................................................................................... 5-5
Common Oil Price ................................................................................................................................ 5-9
Infrastructure....................................................................................................................................... 5-10
NGL Plants .................................................................................................................................... 5-10

Energy Ventures Analysis, Inc. 3 2016 West Texas Sensitivity Study
Recent Progress ............................................................................................................................. 5-12
Pipelines ........................................................................................................................................ 5-12
Load Submittals .................................................................................................................................. 5-13
Addendum ..................................................................................................................................... 5-13
Supplemental Model ...................................................................................................................... 5-14
Coordinating Committee .................................................................................................................... 5-15
Summary ............................................................................................................................................. 5-16
6. APPENDIX .............................................................................................................. 6-1

Energy Ventures Analysis, Inc. 1 2016 West Texas Sensitivity Study
ListofExhibits
Exhibit 1-1. Summary of Suggestions and Recommendations ........................................................ 1-3 Exhibit 2-1. Historical West Texas Rig Count .............................................................................. 2-1 Exhibit 2-2. Weather Conditions In Texas For The Summer of 2011 ............................................... 2-2 Exhibit 2-3. West Texas Oil-Directed Rig Count........................................................................... 2-3 Exhibit 2-4. Top 15 Constraints on ERCOT System in 2012 .......................................................... 2-3 Exhibit 2-5. 2012 Five-Year Transmission Plan – Projected 2013 Reliability Constraints ................. 2-4 Exhibit 2-6. Monthly West Texas Well Completions ..................................................................... 2-5 Exhibit 2-7. West Texas Oil Production ....................................................................................... 2-5 Exhibit 2-8. West Texas Improvements For Oncor For 2011 to 2018 .............................................. 2-8 Exhibit 2-9. West Texas Improvements For TNMP For 2012 to 2018 ............................................. 2-9 Exhibit 2-10. Sharyland West Texas Load Growth .......................................................................... 2-9 Exhibit 2-11. West Texas Improvements For Sharyland for 2013 to 2016 ....................................... 2-10 Exhibit 2-12. 2015 Top 15 Constraints On The ERCOT System ..................................................... 2-11 Exhibit 2-13. Far West Texas Project ........................................................................................... 2-12 Exhibit 3-1. Overview of the Permian Basin1 ................................................................................ 3-1 Exhibit 3-2. Permian Basin Oil Rig Counts .................................................................................. 3-2 Exhibit 3-3. Comparison of the Resource Potential for Major U.S. Oil Fields .................................. 3-3 Exhibit 3-4. The Permian Basin Network of CO2 Pipelines ............................................................ 3-5 Exhibit 3-5. Composition of West Texas Rig Count ...................................................................... 3-6 Exhibit 3-6. Permian Basin Rig Count – May 2016 ....................................................................... 3-7 Exhibit 3-7. Oxy’s Permian based Acreage Profile ........................................................................ 3-8 Exhibit 3-8. Average Lead Times Between Final Investment Decision And First
Production For Different Oil Resource Types ............................................................. 3-9 Exhibit 3-9. Global Oil Supply And Demand Balance, Quarterly Data .......................................... 3-10 Exhibit 4-1. Observations Concerning the West Texas Power Planning Process ............................... 4-2 Exhibit 4-2. Inverse Relationships ............................................................................................... 4-3 Exhibit 4-3. Simplified Overview of Power Requirements (Large Producers) .................................. 4-6 Exhibit 4-4. Simplified Overview for Power Requirements (Small Producers) ................................. 4-7 Exhibit 4-5. Current Rig and Well Count For West Texas .............................................................. 4-7 Exhibit 4-6. Metrics for Assessing the Adequacy of Historical Load Submittals for West
Texas Power Requirements ....................................................................................... 4-9 Exhibit 4-7A. Examples of Changes in Load Growth on a Particular Distribution/
Transmission System .............................................................................................. 4-14 Exhibit 4-7B. Examples of Changes in Load Growth on a Particular Distribution/
Transmission System .............................................................................................. 4-15 Exhibit 4-8. Major Steps in the Overall Power Planning Process .................................................. 4-17 Exhibit 5-1. Oxy’s Permian Basin Acreage Profile ........................................................................ 5-2 Exhibit 5-2. Proposed Map for Midland County ............................................................................ 5-6 Exhibit 5-3. Proposed Map for Lynn County ................................................................................ 5-7

Energy Ventures Analysis, Inc. 2 2016 West Texas Sensitivity Study
Exhibit 5-4. Suggested Common Oil Price Forecast ...................................................................... 5-9 Exhibit 5-5. Recent West Texas NGL Plants............................................................................... 5-11 Exhibit 5-6. Example of West Texas Infrastructure Load Forecast ................................................ 5-12 Exhibit 5-7. West Texas Pipeline Projects .................................................................................. 5-13 Exhibit 5-8. Components of a Supplemental West Texas Load Forecasting Model ......................... 5-15 Exhibit 5-9. Summary of Suggestions and Recommendations ...................................................... 5-17 Exhibit A-1. History of Spraberry/Wolfcamp Completions ............................................................. 6-2 Exhibit A-2. Midland Basin: Stacked Play Potential ....................................................................... 6-3 Exhibit A-3. Proposed West Texas Map to Identify Future Small Producer Power Loads................... 6-4 Exhibit A-4. Initial West Texas Map Submission For Company No. 1 – Part A ................................ 6-5 Exhibit A-5. Initial West Texas Map Submission For Company No. 1 – Part B ................................ 6-6 Exhibit A-6. Initial West Texas Map Submission For Company No. 1 – Part C ................................ 6-7 Exhibit A-7. Initial West Texas Map Submission For Company No.2 .............................................. 6-8 Exhibit A-8. Recent West Texas Oil Rig County by Operator ......................................................... 6-9 Exhibit A-9. West Texas Oil/Gas Pipelines ................................................................................. 6-10 Exhibit A-10. MidStream Monitor – April 22, 2016 ...................................................................... 6-11 Exhibit 4-11A. Heat Maps for Load Transmission Examples In Chapter 4 ....................................... 6-14 Exhibit 4-11B. Heat Maps for Load Transmission Examples In Chapter 4 ....................................... 6-15

Energy Ventures Analysis, Inc. 1-1 2016 West Texas Sensitivity Study
1. EXECUTIVESUMMARY
Objective
In the recent past, the West Texas portion of the Permian Basin represented the highest load growth region in ERCOT,1 with annual growth rates reaching 8.5 percent. While West Texas growth over the last two years has declined as a result of the overall decline in the global oil industry, it is likely that by 2018 drilling activity, production and associated power load requirements will rebound significantly and enter a new era of substantial, sustained growth for West Texas power requirements. The likelihood of the occurrence of the latter is greatly enhanced by the fact that the Permian Basin likely is not only the marginal upside barrel for the U.S., but for all of Non-OPEC.
Furthermore, one of the dilemmas with the recent rapid growth in West Texas power requirements was that the TDSPs2 and ERCOT were not – for a variety of reasons – fast enough to accommodate this surge in power requirements. As a result, in 2012 eight of the top 15 constraint points within ERCOT were in West Texas, with projections for 2013 being that the top five constraint points within ERCOT would be in West Texas. This phenomenon created significant tensions among the various stakeholders over adequately meeting West Texas power requirements on a timely basis. Some of these tensions still exist today.
As a result of the above historical problems and tensions, Energy Ventures Analysis, Inc. (EVA) was tasked with the following:
Evaluate the West Texas power planning process;3
Outline the strengths and weaknesses of the power planning process; and,
Identify how and where improvements can be made to the West Texas power planning process.
An additional objective of this effort was for EVA to remain as independent as practical and work with all the stakeholders in the West Texas power planning process, namely, the TDSPs, the producers and ERCOT.
1 Electric Reliability Council of Texas (ERCOT). 2 Transmission/Distribution Service Providers. 3 For the purposes of this report, the West Texas power planning process refers to load forecasting process of transmission planning for West Texas. This shorthand notation, including just ‘planning process’ is used throughout this report.
Energy Ventures Analysis, Inc. 1-2 2016 West Texas Sensitivity Study
This report provides a summary of this overall effort and presents a series of suggestions and recommendations on how the overall power planning process could be improved in the future, so that the tensions and problems of the past can be minimized or alternatively eliminated. These suggestions and recommendations are based upon a series of meetings4 and telephone calls over the last several months with the various stakeholders in the overall West Texas power planning process, plus knowledge and insights gained during an earlier effort in late 2015.5 Lastly, a key aspect of this report is to focus on the future power planning process and not dwell upon the problems and tensions of the past.
ReportStructure
With respect to the remainder of this executive summary it contains a high level synopsis of the various suggestions and recommendations for improving the future West Texas power planning process presented in the body of the report. Concerning the latter, the first two chapters provide background information that is pertinent to development of the various suggestions and recommendations contained in the report. More specifically, Chapter 2 provides a brief historical perspective on West Texas power planning, while Chapter 3 provides an overview of the unique attributes, relevant historical data and overall importance of the Permian Basin, with the primary focus being on West Texas.
Chapter 4 provides a critical assessment of the overall power planning process and makes observations concerning various attributes and characteristics of the West Texas power planning process, which can be grouped into the following three categories: (1) general observations; (2) critical characteristics; and (3) process evaluation.
The concluding Chapter 5 presents in detail the various suggestions and recommendations for improving the overall West Texas planning process, with most of these suggestions and recommendations being based upon the observations noted in Chapter 4. Lastly, this report contains a number of supporting exhibits in the Appendix.
SuggestionsandRecommendations
A summary of the suggestions and recommendations made in this report are presented in Exhibit 1-1. For the most part, these suggestions and recommendations for improving the overall West Texas power planning process are based upon the observations contained in Chapter 4. In addition, Exhibit 1-1 represents a rather high level summary of the suggestions and recommen-
4 Included in these meetings were on-site presentations and discussions with three TDSPs and 12 producers, as well as several discussions with ERCOT. In addition, there were a large number of conference calls both prior to and subsequent to these meetings, as well as a significant number of email exchanges on various identified action items. 5 With respect to the 2015 effort, its focus was a one-off assessment as to the reasonableness of prior producer load submittals. However, results from this effort were limited due to (1) the dramatic change that occurred for the global oil industry over the last two years and (2) the inability to overcome confidentiality concerns by the various stakeholders.

Energy Ventures Analysis, Inc. 1-3 2016 West Texas Sensitivity Study
dations contained in this report. A more complete presentation of each suggestion and recommendation is contained in Chapter 5.
Exhibit 1-1. Summary of Suggestions and Recommendations
Suggestion/Recommendation Description
1. Long Time Horizon Be prepared for increased West Texas drilling activity and its associated power requirements to last over an extended period.
2. Limitations Stakeholders need to be more adaptive and flexible in order to overcome inherent characteristics within their organiza-tion that serve as obstacles to optimize the overall West Texas planning process.
PUCT should consider continuing periodic meetings between the stakeholders in order to help resolve issues that likely will arise in the future.
3. Outreach Outreach programs of all types represent critical vehicles for improving the overall power planning process and should be continued in the future. Key among these outreach programs are the periodic meetings between the TDSPs and individual producers.
4. Aggregate Assessment The focus should be on an aggregate assessment of future power requirements that includes small producers, rather than being focused on a few large producers, as extra-polation techniques are flawed.
5. 5-Year Planning Horizon At a minimum the time horizon for load submittals should be five years. However, for small producers this will require including some qualitative assessments for power requirements for the later years in the planning horizon. A series of West Texas county maps with subsegments has been developed as an aid for soliciting useful qualitative information.
6. Core Competencies Each stakeholder should seek to develop as core competencies within its organization expertise concerning the primary discipline of the other stakeholders (i.e., specifics included in the body of the report).

Energy Ventures Analysis, Inc. 1-4 2016 West Texas Sensitivity Study
7. Common Oil Price The use of a common oil price forecast by all parties providing load submittals should be institutionalized. Suggestions for accomplishing this item are included in the body of the report.
8. Infrastructure Unique and creative approaches should be examined for obtaining load submittals from midstream companies for these large and lumpy loads. A recent example of success in this area, because of prior outreach programs, is contained in the body of the report.
9. Load Submittals ERCOT should consider adding in an addendum to its current load submittal a request that focuses on obtaining additional information on infrastructure capacity requirements from large producers and EOR projects.
TDSPs and ERCOT should consider investing resources to develop a supplemental, high level model for West Texas load requirements that extends out for 10 years.
10. Coordinating Committee In order to advance and monitor the overall West Texas power planning process a small coordinating committee with representatives from each of the stakeholders should be formed and meet on a periodic basis. This coordinating committee could provide periodic assessments to the PUCT.

Energy Ventures Analysis, Inc. 2-1 2016 West Texas Sensitivity Study
2. HISTORICALPERSPECTIVES
Overview
In order to provide the reader with some perspective on the rapid growth that occurred for West Texas power requirements and some of the problems that occurred in not adequately meeting these requirements on a timely basis, this chapter provides a brief overview of a few key historical events.
SequenceofEvents
2011andEarlier
Prior to 2011 drilling activity in the Permian Basin, including West Texas, was at modest levels and production was declining. While not directly comparable to today’s rig count, because of significant improvements over the last several years in rig efficiency, Exhibit 2-1 presents the average annual rig counts prior to 2011. As illustrated, in 2009 the rig count declined by 50 percent and then recovered in 2010.
Exhibit 2-1. Historical West Texas Rig Count
While drilling activity increased in 2011, other events were occurring within the Texas power sector that overwhelmed both ERCOT and the TDSPs. As illustrated in Exhibit 2-2, for Texas 2011 was a very unique year, as the combination of record heat and drought resulted in record power loads throughout the ERCOT system. As a result, the primary focus in 2011 of the power planners for both ERCOT and the TDSPs was avoiding rolling blackouts, as every segment of the power industry was stressed.1
1 Not only did the record power load stress the distribution and transmission systems, but there was significant stress within the generation segment of the power industry. More specifically, while the record loads required the use of all available generating units to meet load requirements, the severe weather conditions limited the maximum output of many of these generating units.
WestTexasOil‐Directed
Year RigCount2008 2182009 1032010 236
Note:Atitspeakin2014WestTexasrigcountwas472rigs.
Source:BakerHughesNorthAmericanRotaryRigCount.

Energy Ventures Analysis, Inc. 2-2 2016 West Texas Sensitivity Study
Exhibit 2-2. Weather Conditions In Texas For The Summer of 2011
Source: John Nielsen-Gammon (Texas State Climatoligist) http://blog.chron.com/climateabyss/2011/08/texas-drought-spot-the-outlier/
As a result of these extreme conditions and the focus on precluding rolling blackouts, the TDSPs and ERCOT did not appreciate fully the sharp increase in drilling activity that occurred in 2011 (i.e., the average annual West Texas rig count increased approximately 40 percent, or from 236 to 330 rigs).
2012to2014
During the 2012 to 2014 period West Texas drilling activity surged, as did the power requirements in the region. With respect to the latter, load growth in West Texas was the highest within all of ERCOT and reached eight percent per annum. With respect to the increased drilling activity, the average annual West Texas rig count in 2014 was about four times the 2009 rig count. The rapid increase in West Texas drilling activity is illustrated in Exhibit 2-3, along with the subsequent decline which is discussed in subsequent sections of this chapter.

Energy Ventures Analysis, Inc. 2-3 2016 West Texas Sensitivity Study
Exhibit 2-3. West Texas Oil-Directed Rig Count
Source: Baker Hughes North American Rotary Rig Count.
As a result of this significant increase in drilling activity and the associated increase in West Texas power requirements, significant excess distribution and transmission capacity was exhausted and congestion began to occur in the West Texas distribution and transmission systems. More specifically, in 2012 eight of the top 15 constraint points within ERCOT were in West Texas, which is illustrated in Exhibit 2-4. The congestion rent associated with these eight West Texas congestion points was approximately $270 MM.
Exhibit 2-4. Top 15 Constraints on ERCOT System in 2012
Note: Stars indicate West Texas constraint points. Source: ERCOT, Report on Existing and Potential Electric System Constraints and Needs, December 2012.
0
100
200
300
400
500
Jan‐08
Apr‐08
Jul‐08
Oct‐08
Jan‐09
Apr‐09
Jul‐09
Oct‐09
Jan‐10
Apr‐10
Jul‐10
Oct‐10
Jan‐11
Apr‐11
Jul‐11
Oct‐11
Jan‐12
Apr‐12
Jul‐12
Oct‐12
Jan‐13
Apr‐13
Jul‐13
Oct‐13
Jan‐14
Apr‐14
Jul‐14
Oct‐14
Jan‐15
Apr‐15
Jul‐15
Oct‐15
Jan‐16
Apr‐16
(No. of Rigs)
Increasing Drilling Activity (+34%/Year)
Decreasing Drilling Activity (‐72%/Year)

Energy Ventures Analysis, Inc. 2-4 2016 West Texas Sensitivity Study
In addition, projections for 2013 at the time were that the top five constraint points within ERCOT would be in West Texas, as illustrated in Exhibit 2-5.
Exhibit 2-5. 2012 Five-Year Transmission Plan – Projected 2013 Reliability Constraints
Note: Stars indicate West Texas constraint points. Source: ERCOT, Report on Existing and Potential Electric System Constraints and Needs, December 2012.
2015to2016
Primarily because of the dramatic changes that occurred within the global oil industry starting in late 2014,2 West Texas drilling activity declined sharply in 2015 and 2016. This was illustrated in Exhibit 2-3 and is further highlighted in Exhibit 2-6, which highlights the change in monthly well completions.
2 The significant changes that have occurred within the global oil industry are addressed in Chapter 3.

Energy Ventures Analysis, Inc. 2-5 2016 West Texas Sensitivity Study
Exhibit 2-6. Monthly West Texas Well Completions
Furthermore, while West Texas production had been increasing at about a 15 percent per annum rate over the prior five years, it has now begun to flatten out and even decline slightly,3 because of the decline in drilling activity (i.e., see Exhibit 2-7).
Exhibit 2-7. West Texas Oil Production
Source: PointLogic.
Exhibit 2-7 illustrates both total West Texas production and production from the tight oil/shale plays within West Texas, which are the primary growth component for West Texas production. As illustrated, over the 2010 to 2015 timeframe these tight oil/shale plays accounted for 92 percent of the overall increase in total West Texas production.
3 Current production levels are about 10 percent below peak 2015 daily production levels or, alternatively, average May 2016 production levels have declined about five percent from November 2015 production levels (i.e., November was the peak month for 2015).
0
200
400
600
800
1,000
1,200
1,400
1,600
Jan‐15
Feb‐15
Mar‐15
Apr‐15
May‐15
Jun‐15
Jul‐15
Aug‐15
Sep‐15
Oct‐15
Nov‐15
Dec‐15
Jan‐16
Source: Texas Railroad Commission.
(Number of Wells)

Energy Ventures Analysis, Inc. 2-6 2016 West Texas Sensitivity Study
Assessment
Historical
While there were some mitigating circumstances, in general the TDSPs and ERCOT were caught off guard by the rapid increase in West Texas drilling activity and the associated significant increase in power requirements. With respect to the increase in West Texas power requirements there were three significant elements that were either underappreciated or missed by ERCOT and the TDSPs in their initial evaluation. These three elements were:
Increased Activity: The TDSPs and ERCOT missed the initial ramp up in drilling activity and did not appreciate fully that this was the beginning of a multi-year trend.
Increased Energy Intensity: Furthermore, the TDSPs and ERCOT did not fully appreciate the significant increase in energy intensity that was associated with the production operations for unconventional drilled wells used for the tight oil/shale plays versus operations associated with for the historical conventional drilling.
Change in Well Mix: During the 2011 to 2014 timeframe there was a significant change in the mix of the types of wells that were being drilled within the West Texas oil industry. More specifically, in 2011 on average 78 percent of the rigs were drilling vertical wells, while the remaining 22 percent were drilling horizontal wells. By 2014 this relationship had shifted to 40 percent vertical and 60 percent horizontal wells, with the production levels for a horizontal well being up to a factor of 10 higher than a vertical well. As an additional point of perspective, year-to-date 2016 the vertical rig count has declined to 13 percent. The TDSPs and ERCOT did not fully appreciate this change in drilling strategies within West Texas and the associated impacts on power requirements.
Furthermore, once the TDSPs and ERCOT were behind the curve it was very difficult to catch up. In addition, during this period communications throughout the planning process were not close to the optimum. Also, tensions between stakeholders, while currently improving, were very high. The latter, in large part, was driven by numerous examples of impairment to operations because of a lack of timely service.
In addition, the TDSPs are continuing to expand their systems, as they are still experiencing load growth, despite the recent decline in drilling activity (i.e., the impact of wells drilled in prior years, as there is a time tag lag behind drilling a well and its need for power, as discussed in Chapter 4).
Specific examples of the TDSPs (1) assessments of load growth for their systems; (2) their current outlook for power within the West Texas region; and (3) data on their system improvements and expansions are noted below.
Oncor: The electric load in West Texas has grown dramatically over the last few years. This growth is continuing due to the oil and natural gas industry and supporting businesses. Recent improvements in oil and natural gas horizontal drilling technologies
Energy Ventures Analysis, Inc. 2-7 2016 West Texas Sensitivity Study
have increased activity in the area, resulting in major load growth at existing substations in these counties and new substations have been constructed to serve the added load. Despite declining oil prices over the last 18-24 months, Oncor has continued to experience increased loads in this area compared to prior historical load levels. This increase in oil and natural gas production, transportation and mid-stream processing has resulted in economic growth in the area that is supporting the oil and natural gas industry.
The business friendly environment of Texas, existing oil and gas infrastructure, and the geological characteristics of the Permian Basin make it a prime candidate to be the first oil and gas play that returns to high growth levels. Additionally, developing improve-ments in horizontal drilling technologies are resulting in improvements in efficiencies, speed, and service cost reductions which will only improve horizontal well margins and economics as time progresses.
Secondary facilities that follow, including midstream processing plants, also create a challenge for area TDSP’s as they are large chunk loads, sometimes 40 MW and above. The inherent nature of the oil and gas industry allows little predictability as to the exact locations for these developments, other than being in nearby production fields. The need for facilities to adequately serve these types of facilities ahead of time is critical since such large loads can have large impacts on capacity and voltage requirements on the transmission system.
Challenges in West Texas with regards to rapid changes in generation interconnections, customer service requests, system protection, engineering, constructability, operability, outage/clearances and maintainability have encouraged West Texas TDSP’s to expand joint coordination efforts for planning future area needs. As the area continues to see generation and load additions, joint coordination will be needed to ensure a strong and reliable transmission system.
Exhibit 2-8 illustrates Oncor’s ongoing commitment in moving forward to serve the customers of West Texas by constructing the needed facilities.

Energy Ventures Analysis, Inc. 2-8 2016 West Texas Sensitivity Study
Exhibit 2-8. West Texas Improvements For Oncor For 2011 to 2018
Texas New Mexico Power: 4 TNMP has seen a sharp increase in transmission/ distribution service requests, primarily for the oil/gas industry, in its West Texas North (WTN) transmission service area over the last two year period compared to previous years. Despite declining oil prices, TNMP has continued to experience increased loads in this area. Developers have assured TNMP that the effect of declining oil prices has slowed their previous aggressive schedule but that additional load will develop in new/existing locations.
The type of load that has increased sharply are loads that can develop fairly quickly on the transmission level, usually within less than a year, and are sizeable in load amount. This creates a time lag when reliable transmission service can be provided if the need arises to construct such facilities.
TNMP has aggressively constructed and proposed transmission and distribution facilities to provide reliable service to meet this growing demand in its WTN service area. Exhibit 2-9 illustrates TNMP’s present and future ongoing efforts to provide reliable service to serve this load. In addition, TNMP has partnered with other TDSPs in the area to better address transmission reliability issues on a regional basis.
4 TNMP has a smaller service territory than Oncor.
2011 2012 2013 2014 20152016
Planned2017
Planned2018
Planned
TransmissionProjects 4 8 11 23 26 16 18 7
TransmissionCircuitMiles 36 15 21 138 111 260 333 110
DistributionUpgradeProjects 23 22 16 15 14 16 20 17
DistributionSubCapacityAdded
60MVA 169MVA 113MVA 375MVA 294MVA 385MVA 238MVA 215MVA
DistributionCustomerRelatedUpgradeProjects
68 111 117 259 20150
thruApr‐ ‐
TransmissionAutoCapacityAdded
0 100MVA 600MVA 0 1850MVA 800MVA 0 0
DistributionCustomerRelatedRequestNoUpgrade
N/A N/A 298 222 256297
thruApr‐ ‐
Source:Oncor.

Energy Ventures Analysis, Inc. 2-9 2016 West Texas Sensitivity Study
Exhibit 2-9. West Texas Improvements For TNMP For 2012 to 2018
Sharyland: Over the past several years, Sharyland has made substantial investments in its T&D system to accommodate growth, preserve system reliability, and to facilitate economic growth. Sharyland’s investment in its West Texas facilities was driven largely by the significant load growth in the recent past within the Permian Basin due to oil and gas activities. As part of this planning process, ERCOT, TDSPs, and the gas industry are coordinating to plan system improvements to meet the planned load growth of the oil and gas industry. Sharyland’s load has increased by 14.5 percent on an annual basis from 2011 to 2015, well in excess of other utilities’ load growth in Texas. Accordingly, additional capital investment in the West Texas facilities is necessary to accommodate such growth and maintain reliability of the system. Exhibit 2-10 details how Sharyland’s peak demand in the West Texas service area has grown over the past five years.
Exhibit 2-10. Sharyland West Texas Load Growth
2011 2012 2013 2014 2015 190 MW 219 MW 254 MW 269 MW 327 MW
To accommodate this growth, Sharyland had made transmission investments totaling approximately $323 MM in the West Texas system. This is comprised of approximately 19 miles of new transmission line, approximately 406 miles of upgraded transmission lines, 23 new substations, and 39 upgraded substations, as illustrated in Exhibit 2-11.
2012 2013 2014 20152016
Planned2017
Planned2018
Planned
TransmissionProjects 1 1 2 2 1 1 1
TransmissionCircuitMiles 32 ‐ 33 6 ‐ 26 40
New/RebuiltSubstations 2 1 2 1 1 2 4
DistributionUpgradeProjects 2 3 3 4 3 ‐ ‐
DistributionSubCapacityAdded
‐ ‐ 10MVA 10MVA 10MVA 30MVA 40MVA
DistributionCustomerRelatedUpgradeProjects
‐ ‐ 4 4 5 4 6
TransmissionAutoCapacityAdded
‐ ‐ ‐ ‐ 150MVA 150MVA 150MVA
DistributionCustomerRelatedRequestNoUpgrade
‐ ‐ 3 5 8 12 4
Source:TexasNewMexicoPower.

Energy Ventures Analysis, Inc. 2-10 2016 West Texas Sensitivity Study
Exhibit 2-11. West Texas Improvements For Sharyland for 2013 to 2016
2013 2014 2015 2016(1) Miles of New Transmission Lines Installed 12 0 7 0
Miles of Existing Transmission Lines Upgraded 6 0 230 170 Number of New Substations Installed 4 3 7 9 Number of Existing Substations Upgraded/Enhanced 12 12 6 9 Estimate of Total Transmission Dollars Invested(2) $112 $49 $67 $95
Miles of New Distribution Lines Installed(3) 537 700 1,625 1,600 Miles of Existing Distribution Lines Installed(3) 6,677 7,377 9,002 10,602 Number of New Transformers Installed 6 7 8 6 Number of New Autotransformers Installed 0 0 0 3 Estimate of Total Distribution Dollars Invested(2) $46 $48 $43 $55
(1) Based on 2016 capital plan. (2) In Millions. (3) In pole miles; includes underground. Source: Sharyland.
On the distribution side, this significant growth, coupled with the location and magnitude of the new loads, required the construction of several new distribution substations to connect the new load and maintain reliability of the system. Some distribution projects required capital investment.5 Beyond new service, distribution capital investment may be required for existing customers with respect to planned system improvements.6 Finally, Sharyland proactively maintains its system and may make a distribution capital investment to address anticipated potential maintenance issues or prevent problems from developing. Sharyland has invested approximately $192 MM in distribution system upgrades in the West Texas area. This is comprised of approximately 4,462 miles of new distribution lines, and 33,658 miles of upgrade distribution lines. Sharyland also installed 27 new transformers and three new autotransformers to help serve the oil and gas loads (i.e., see Exhibit 2-11).
The increased oil and gas loads are comprised primarily of new pump jacks, but have also included natural gas compression facilities. While the large natural gas compression facilities have a longer lead time and require coordinated planning efforts, the pump jacks and increased load behind primary metering points often have occurred with little or no notice or coordination with the utility. This presents challenges when Sharyland does not have the opportunity to plan for the increased load behind the primary metering points. In some instances, the developer requests a certain load amount, but that load does not materialize for years, during which time the system topology has changed in the area such that capacity that was once available is no longer available due to other developers increasing their load in the intervening time period. With the decline in oil prices,
5 For example, new commercial accounts may require the installation of the electric distribution facilities needed to provide delivery service to new premises or oil and gas production facilities. These types of projects could involve onsite and offsite overhead or even potentially underground electric facilities. 6 This could involve the installation of facilities to address added load on existing facilities, an upgrade of existing facilities, or relocation of existing facilities to accommodate public works.
TR
AN
SM
ISS
ION
D
IST
RIB
UT
ION

Energy Ventures Analysis, Inc. 2-11 2016 West Texas Sensitivity Study
Sharyland has seen a decrease in new service requests, however this allows for the fulfillment of the pending requests.
The combination of the TDSPs strengthening and expanding systems and, to a degree, the decline in West Texas drilling activity resulted in only one of the top 15 2015 constraint points within ERCOT being in West Texas, as illustrated in Exhibit 2-12.
Exhibit 2-12. 2015 Top 15 Constraints On The ERCOT System
Note: Stars indicate West Texas constraint points. Source: ERCOT, Report on Existing and Potential Electric System Constraints and Needs, December 2015.
Additive to the above was the announcement in 2016 of the Far West Project, which includes a greenfield 345 kV line and is illustrated in Exhibit 2-13. This particular project will accommodate the combination of confirmed load increases from normal load forecasting and signed customer agreements, which in total will increase loads in this area from 105 MW in 2015 to 426 MW in 2021.

Energy Ventures Analysis, Inc. 2-12 2016 West Texas Sensitivity Study
Exhibit 2-13. Far West Texas Project
Future
While there have been problems and tensions in the past with some still lingering issues, overall the TDSPs and ERCOT currently have a much greater appreciation of the unique attributes of the Permian Basin and its likely role in world oil markets. In addition, both foresee a significant recovery in West Texas drilling activity and production, as well as an associated increase in power requirements. Also, both have expressed a desire to be prepared for the next surge in West Texas activity, as they do not want a repeat of the 2012 to 2014 period. Finally, among the TDSPs and ERCOT there is a focus on developing the capability to forecast in the aggregate the future power requirements for West Texas, rather than respond to just the requests of a few of the producers.
With respect to the producers, they, for the most part, want to (1) improve communications; (2) improve the overall planning process; and (3) to increase the overall coverage of the industry’s power requirements. For each of these items the producers have expressed a willingness to work with the TDSPs and ERCOT.

Energy Ventures Analysis, Inc. 2-13 2016 West Texas Sensitivity Study
As a result, while there are still lingering tensions and there have been a number of problems in the past, in general there currently is a good base upon which to formulate future planning efforts.

Energy Ventures Analysis, Inc. 3-1 2016 West Texas Sensitivity Study
3. PERMIANBASIN
Background
While volumes have been written on the Permian Basin and its unique attributes, this chapter provides a very brief overview of the basin and the attributes of the basin that are of importance in assessing the underlying drivers for West Texas power requirements.
Geology
Exhibit 3-1 provides a simplified and high level overview of the basic geology for the Permian Basin. While Exhibit 3-1 highlights just the Midland and Delaware Basins and excludes the Central Platform, that exclusion is not intended to diminish the importance of the Central Platform, but was done in order to simplify the graphic. Highlighted in Exhibit 3-1 are the key tight oil/shale plays, namely the Spraberry, Wolfcamp and Bone Springs – each of which has its own unique characteristics. This latter group of plays each of which has several sub-formations1
Exhibit 3-1. Overview of the Permian Basin1
Adapted from “North American Shale Revolution: Operators Just Scratching Surface in Assessing Permian’s Tight Oil
Bounty”, Natural Gas Week, April 13, 2015, pp 1-4; and other trade press diagrams.
1 Among the current more attractive segments of these formations are (1) Wolfcamp A, B, C and D formations; (2) First, Second and Third Bone Springs formations; and (3) Upper and Lower Spraberry formations, which can be further subdivided, as well as the Avalon and Delaware formations.

Energy Ventures Analysis, Inc. 3-2 2016 West Texas Sensitivity Study
has been responsible for the significant growth in West Texas production over the last five years (i.e., see Exhibit 2-7).
Geography
In total West Texas encompasses over 50 counties, however not all of these counties have been involved in the recent increase in West Texas drilling activity. More specifically at the height of West Texas oil drilling activity there were 38 counties with active drilling programs, however 14 counties only had a single rig operating within the county. The rig count for the remaining 24 counties ranged from two to 54 rigs. The specific counties involved in the latter group and the intensity of drilling activity in illustrated in Exhibit 3-2.
With the decline in drilling activity at present there are only 14 counties that currently have active drilling programs that consist of more than one rig (i.e., seven counties currently have a single rig in operation). These 14 counties and the intensity of the current drilling programs also are noted in Exhibit 3-2.
SizeandComparisons
The Permian Basin is a world class field and according to the Energy Information Administration (EIA), likely the second largest oil field in the world (i.e., second to Saudi Arabia’s giant Gwahar field). With respect to the U.S., Exhibit 3-3 compares and contrasts the resource potential of the Permian Basin to other major U.S. fields. As illustrated, the Permian Basin clearly stands out.2
This lead position of the Permian Basin among U.S. oil fields is the net result of several factors, including the following:
Footprint: The Permian Basin has a huge geographic footprint, which extends over all or part of 38 counties, or approximately 86,000 square miles.
Thickness: There are a large number of producing formations within the Permian Basin. Among the current tight oil/shale plays that have been developed are between 10 and 15 formations that extend over a vertical distance of about 5,000 feet (i.e., approximately from 6,000 to 11,000 feet below ground). While not all 5,000 feet represents producing zones, the total vertical column for the producing formations is several thousand feet. Furthermore, while not all producing zones exist throughout the Permian Basin, the net result is that the volumetric potential for the Permian Basin is very large (i.e., much larger than other significant regions).3
2 In Exhibit 3-3 the Spraberry/Wolfcamp and the Delaware Basin are both in the Permian Basin. 3 See Appendix.

Energy Ventures Analysis, Inc. 3-3 2016 West Texas Sensitivity Study
Exhibit 3-2. Permian Basin Oil Rig Counts

Energy Ventures Analysis, Inc. 3-4 2016 West Texas Sensitivity Study
Exhibit 3-3. Comparison of the Resource Potential for Major U.S. Oil Fields
This unique feature of the Permian Basin, namely its size, in combination with the superior well economics for so many of the producing formations, makes the Permian Basin stand out when compared to other significant U.S. tight oil/shale plays, such as the Bakken (North Dakota) and the Eagle Ford (South Texas). For example, concerning the latter, the Eagle Ford has a much smaller geographic footprint (i.e., approximately 20,000 square miles) and its producing formations also are much smaller (i.e., several hundred feet). Similarly, while the Bakken also has a large geographic footprint (i.e., approximately 200,000 square miles), the thickness of its producing formations are much less than those for the Permian Basin or the Eagle Ford. Furthermore, a significant portion of the Bakken geographic footprint is not economically attractive.4
This is not to say that (a) there are not economic portions of the Bakken and Eagle Ford plays (e.g., MacKenzie and Williams counties and Karnes Trough, respectively)5 or (b) that these two plays will not make significant contributions to future U.S. production levels, but rather that in any comparison the Permian Basin stands out.
Another attribute of note when comparing the various major U.S. tight oil/shale plays is that initial or primary pressure for most of the Permian Basin formations is relatively low (i.e., a few
4 See Appendix. 5 The Bakken well economics, in particular, are impaired by the high transportation costs for this region. Because of these high costs the realized wellhead oil price for the Bakken is about $10 per barrel less than that realized for the Permian Basin.
,2

Energy Ventures Analysis, Inc. 3-5 2016 West Texas Sensitivity Study
hundred psi at best), whereas the Eagle Ford has a large primary pressure (i.e., about 1,000 psi). This particular attribute has a significant impact on the power requirements for the two plays. In the case of the Eagle Ford, the use of artificial lift, which requires significant power can be delayed a year or more because of high initial pressure, whereas in the Permian Basin the need for artificial lift and its associated power requirement can occur within days.
Lastly, with respect to the expected life of the U.S. tight oil/shale plays, including the Permian Basin, while detailed data does not yet exist for these unconventional plays, because the industry has been only actively pursuing their development for less than 10 years, they, in general, have the same long production lives as conventional wells. While tight oil/shale plays do experience a sharp initial decline in production (i.e., hyperbolic decline rates for the first 6 to 18 months), after that production enters into the more classic exponential decline, which is common for conven-tional plays.
EnhancedOilRecovery
While enhanced oil recovery (EOR) and, in particular, tertiary or CO2 injection exists in other parts of the country, such as Louisiana and Wyoming, the vast majority of the U.S. EOR operations are in the Permian Basin and more specifically in West Texas. The associated power requirements for these EOR operations can be large.
The primary reason for the concentration of EOR operations in West Texas is the existence of a large number of legacy conventional oil fields and the availability of CO2 gas supplies in areas that are in close proximity to West Texas. More specifically, there are approximately 75 EOR projects in West Texas with expansions and additions likely to occur in the future. In addition, there exists an extensive CO2 pipeline network within West Texas, with the Denver City Hub being the focal point (i.e., see Exhibit 3-4).6
RecentActivity
Following the significant success of the use of unconventional drilling and completion techniques for the gas shale plays, the oil industry began to adopt similar techniques for developing the U.S. tight oil/shale plays. The three regions that benefitted most from this effort were the Bakken (North Dakota), Eagle Ford (South Texas) and Permian Basin (West Texas and Southeast New Mexico), and in addition all three areas witnessed a surge in drilling activity and rapid growth in oil production.
With respect to the West Texas segment of the Permian Basin, the announcement in 2011 by Pioneer Natural Resources of the potential for the Spraberry formation when using unconventional drilling and completion techniques further accelerated drilling activity.
6 Kuuskraa, Vello and Wallace, Matt, “CO2–EOR set for growth as new CO2 supplies emerge”, Oil & Gas Journal, April 7, 2014, pp 66-91.

Energy Ventures Analysis, Inc. 3-6 2016 West Texas Sensitivity Study
Exhibit 3-4. The Permian Basin Network of CO2 Pipelines
Source: EPRI, Infrastructure Costs and Feasibility Study – Phase II: CO2 Pipelines (2012 to 2015), March 2013.
More specifically drilling activity, when measured by the average annual rig count, increased about a factor of four and when measured by the change from trough to peak increased by a factor of nine (i.e., see Exhibit 2-3). Furthermore, West Texas production for the key tight oil/shale play increased by a factor of eight (i.e., see Exhibit 2-7).
With respect to the change in rig count during this period, there was a noteworthy change in the mix of the type wells being drilled. As noted in Exhibit 3-5, the number and proportion of vertical rigs declined, while the horizontal rig activity for both metrics increased, with the change over time being dramatic. Significant consequences of this phenomenon are (1) that the production levels of the horizontal wells can be a factor of 10 higher than vertical wells and (2) the associated power requirements for the horizontal wells are much higher (e.g., greater movement of water and higher artificial lift requirements).

Energy Ventures Analysis, Inc. 3-7 2016 West Texas Sensitivity Study
Exhibit 3-5. Composition of West Texas Rig Count
Source: Baker Hughes North American Rotary Rig Count.
While it has been noted earlier, it is instructive to reiterate the tracking of the rig count, such as that noted in Exhibit 3-5, is only a proxy for tracking well completions, which is the entity driving the industry power requirements. In addition, it is useful to reiterate that historical rig counts are not directly comparable to current rig counts, because of significant improvements in rig productivity.
With the sharp decline in oil prices that began in late 2014,7 as a result of Saudi Arabia’s deciding to revise its overall strategy for oil production West Texas drilling activity has declined (i.e., see Exhibit 2-3). With respect to the change in Saudi Arabia’s strategy it involved shifting from the historical OPEC8 production quota system that was designed to maintain oil prices to a strategy of maintaining market share, despite the impact on oil prices. In large part this shift in Saudi Arabia’s strategy was the result of the prolific production increases associated with the U.S. tight oil/shale plays.9
Even with the sharp decline in drilling activity currently the total rig count in the Permian Basin exceeds the cumulative rig count for the next four largest U.S. tight oil/shale plays, which is illustrated in Exhibit 3-6.10 Furthermore, the five tight oil/shale plays noted in Exhibit 3-2
7 Monthly average WTI oil prices declined from about $106 per barrel from June 2014 to about $31 per barrel in February 2016, or 70 percent. Since that time they have recovered to about $45 per barrel. 8 Organization of Petroleum Exporting Countries (OPEC). 9 Between 2009 and 2015 total tight oil/shale play production increased approximately 3.7 MMBD. 10 Drilling activity for all five tight oil/shale plays has declined sharply since late 2014 peak levels (i.e., with the exception of the Woodford, rig counts for these plays have declined between 74 and 89 percent, with the greatest decline occurring for the Eagle Ford and Bakken plays. With respect to the Woodford play, while very economic, it represents a small geographic area.
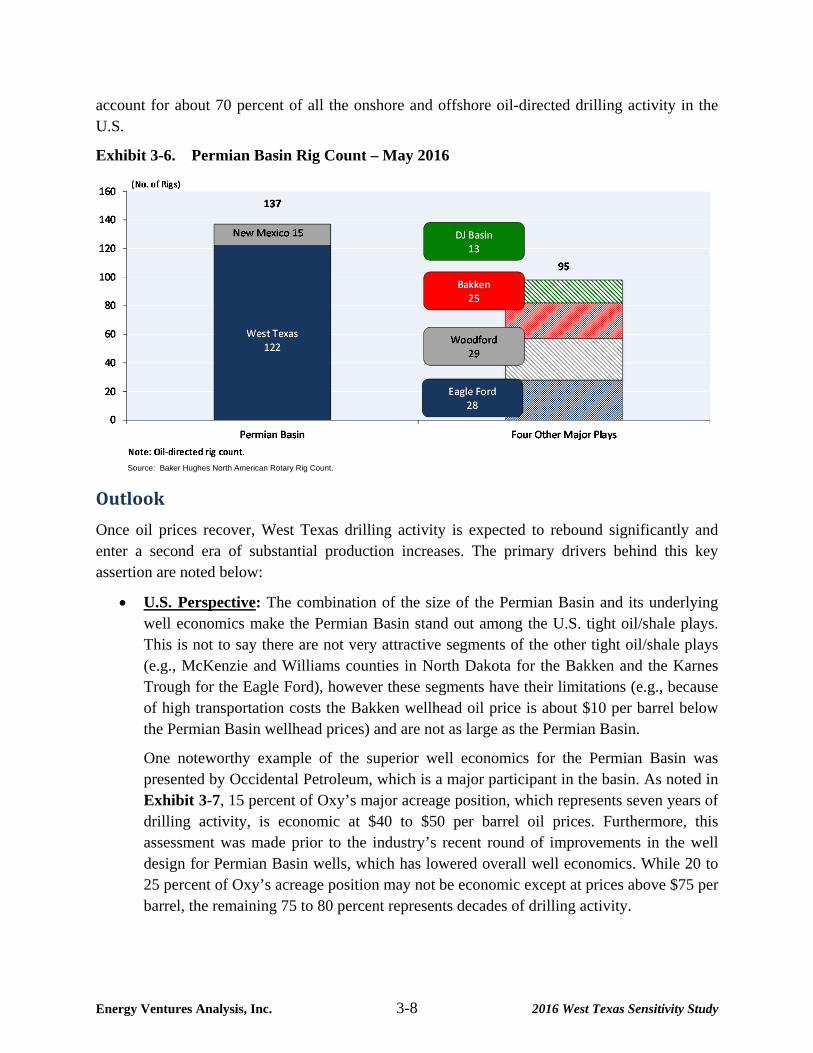
Energy Ventures Analysis, Inc. 3-8 2016 West Texas Sensitivity Study
account for about 70 percent of all the onshore and offshore oil-directed drilling activity in the U.S.
Exhibit 3-6. Permian Basin Rig Count – May 2016
Source: Baker Hughes North American Rotary Rig Count.
Outlook
Once oil prices recover, West Texas drilling activity is expected to rebound significantly and enter a second era of substantial production increases. The primary drivers behind this key assertion are noted below:
U.S. Perspective: The combination of the size of the Permian Basin and its underlying well economics make the Permian Basin stand out among the U.S. tight oil/shale plays. This is not to say there are not very attractive segments of the other tight oil/shale plays (e.g., McKenzie and Williams counties in North Dakota for the Bakken and the Karnes Trough for the Eagle Ford), however these segments have their limitations (e.g., because of high transportation costs the Bakken wellhead oil price is about $10 per barrel below the Permian Basin wellhead prices) and are not as large as the Permian Basin.
One noteworthy example of the superior well economics for the Permian Basin was presented by Occidental Petroleum, which is a major participant in the basin. As noted in Exhibit 3-7, 15 percent of Oxy’s major acreage position, which represents seven years of drilling activity, is economic at $40 to $50 per barrel oil prices. Furthermore, this assessment was made prior to the industry’s recent round of improvements in the well design for Permian Basin wells, which has lowered overall well economics. While 20 to 25 percent of Oxy’s acreage position may not be economic except at prices above $75 per barrel, the remaining 75 to 80 percent represents decades of drilling activity.

Energy Ventures Analysis, Inc. 3-9 2016 West Texas Sensitivity Study
Exhibit 3-7. Oxy’s Permian based Acreage Profile
Source: Occidental Petroleum’s 1Q 2016 Investor Presentation.
The net result is that the Permian Basin; and in particular West Texas, likely represent the largest and overall most economic addition to U.S. production once oil prices recover.
Non-OPEC:11 In addition, the Permian Basin not only represents the marginal upside barrel for the U.S., but likely is the marginal upside barrel for all of Non-OPEC.12 This phenomenon is illustrated in Exhibit 3-8, which was prepared by the International Energy Agency. Exhibit 3-8 depicts both the size of potential undeveloped oil resources by country, type of reserve and how long, on average, it takes to develop a project for these reserves. For example, while many of the deepwater offshore projects individually can represent large additions to Non-OPEC production levels (e.g., up to 0.25 MMBD), they can take three to five years to develop once discovered. With respect to the U.S. tight oil/shale plays, they not only represent the largest potential Non-OPEC resource to be developed, but have the potential to come online in a shorter period of time (i.e., less than a year), than any alternative Non-OPEC resource. Furthermore, the Permian Basin, because of its size and multiple formations represents the majority of the circle representing the U.S. (i.e., the pink circle).
11 Countries that produce oil and are not part of OPEC and defined as Non-OPEC. 12 Long-term the marginal barrel for Non-OPEC on the downside includes the expensive deepwater megaprojects, some Canadian tar sand projects and some production in several counties that have very high cash costs. Fletcher, Laurence and Kantchev, Georgi, “In Oil, A Trader Stands Out by Swing”, Wall Street Journal, April 5, 2016.
0
0.2
0.4
0.6
0.8
1
1.2
$40‐$50 $50‐$60 $60‐$70 $70‐$80 >$80
Avalon
Delaware
Bone Spring
Sprayberry
Wolfcamp D
Wolfcamp C
Wolfcamp B
Wolfcamp A
15%(≈ 7 years)
37%(≈ 16 years)
61%(≈ 27 years)
81%(≈ 36 years)
100%(≈ 44 years)
(% of Acreage)

Energy Ventures Analysis, Inc. 3-10 2016 West Texas Sensitivity Study
Exhibit 3-8. Average Lead Times Between Final Investment Decision And First Production For Different Oil Resource Types
Source: International Energy Agency.
In a nutshell, the Permian Basin, which has the potential according to some studies to further increase its production level by one MMBD, is a world class field and represents both the largest and fastest resource to come online within Non-OPEC. This is particu-larly true in light of the over $190 billion dollars of oil projects delayed or cancelled over the last two years.13
FutureDrillingActivity
Exactly when drilling activity in West Texas will rebound and start a new era for increases in West Texas production is difficult to predict, but it is dependent on attaining higher oil prices. From the perspective of supply and demand fundamentals the two most significant factors suppressing oil prices are (1) the existence of excess global supply and (2) a huge global storage overhang, as global oil inventories are at record levels. The former is highlighted in Exhibit 3-9, which illustrates by quarter the amount of global supply (i.e., blue circles) and the amount of global demand (i.e., grey circles), with the difference since mid-2014 being excess supply, which must be placed into inventories around the world.
13 It is estimated that the global industry has delayed or cancelled about (a) $88 billion of offshore deepwater development projects, (b) $45 billion of onshore projects, (c) $29 billion of oil sands projects, (d) $23 billion of shallow offshore projects; and $8 billion of heavy oil projects. Kent, Sarah and Stewart, Robb M., “At Price Drop Vanquishes Cutting Edge Projects”, Wall Street Journal, May 4, 2016. Furthermore, a year ago 210 deepwater projects were expected to come online between 2016 and 2021. Current estimates are that only 118 of these projects will come online, with the remainder either cancelled or experiencing extended delays. “Can Deepwater Compete With Low-Cost Shale?” Petroleum Intelligence Weekly, April 5, 2016.
0
1
2
3
4
5
6
0 10 20 30 40 50 60 70 80
(Years)
(Reserves Developed ‐ Billion Barrels)
United States
Iraq
Canada
Russia
China
Iran
Saudi ArabiaAlgeria
Brazil
Qatar
Norway
Nigeria
Venezuela
Conventional Onshore
Tight Oil
Offshore Shallow Water
Offshore Deepwater
Extra‐Heavy oil and Bitumen

Energy Ventures Analysis, Inc. 3-11 2016 West Texas Sensitivity Study
Exhibit 3-9. Global Oil Supply And Demand Balance, Quarterly Data
As illustrated, excess global supply has existed on a sustained basis since the second quarter of 2014 and is currently about 1.5 MMBD. While there are a number of uncertainties, the International Energy Agency and others project that this excess supply likely will not be eroded until close to YE2017, and the erosion of the current very large global storage overhang is unlikely to start before 2018. As a result, it is likely that oil prices will remain at relatively low levels until about YE2017, after which some recovery is expected in oil prices. Furthermore, this rebound in oil prices is expected to generate the first signs of a recovery in West Texas drilling activity and a new period of increased power requirements for West Texas.
While there is not one single oil price at which West Texas drilling activity will start to recover, one larger West Texas producer has indicated that they will start to increase their rig count when WTI oil prices reach $45 per barrel on a sustained basis, while others have indicated that $45 to $50 per barrel on a sustained basis would be required.14 While this represents the outlook for a few of the larger producers, which have reduced their well economics significantly over the last year, for the region as a whole it appears that the threshold for a significant increase in West Texas drilling activity maybe in the $60 to $65 per barrel range.
14 “More Price Pain Needed to Break U.S. Shale”, Petroleum Intelligence Weekly, April 25, 2016, p 3-4; Friedman, Nicole and Iosebashvile, Ira, “Oil-Price Rise Could Be Its Own Undoing”, Wall Street Journal, March 31, 2016; and Zborowski, Matt “BHI: US rig count hits all-time low in recorded data”, Oil & Gas Journal, March 21, 2016, pp 19-21.

Energy Ventures Analysis, Inc. 4-1 2016 West Texas Sensitivity Study
4. OBSERVATIONS
Overview
In order to provide a critical assessment of the West Texas power planning process, EVA conducted a series of interviews and engaged in a number of conference calls with various members of each of the stakeholder groups.1 As a result of this assessment, EVA gained several insights into the West Texas power planning process. These insights or observations were divided into three broad categories, as illustrated in Exhibit 4-1.
Each of these observations are reviewed briefly in the material below.
GeneralObservations
OverallAssessment
While historically there have been problems with the overall West Texas power planning process, improvements have been made to this process over the recent past. As a result, the current power planning process represents a good baseline to build upon. However, further improvements are still required in order to be prepared for the next surge.
InverseRelationship
For the typical well, there is an inverse relationship between the production level of a well and power requirements of a well. Stated alternatively, there is a direct correlation between the life of a well and the well’s power requirements. This is illustrated in Exhibit 4-2.
A key consequence of this relationship is that the increased power requirements for West Texas will continue for a very long time. More specifically, once West Texas drilling activity recovers, significant increases in production levels are expected, as the Permian Basin has the potential to add another one MMBD to existing production levels. The net result is that the associated power requirements for West Texas will continue to grow for an extended period of time.
1 Included in these meetings were on-site presentations and discussions with three TDSPs and 12 producers, as well as several discussions with ERCOT. In addition, there were a large number of conference calls both prior to and subsequent to these meetings, as well as a significant number of email exchanges on various identified action items.

Energy Ventures Analysis, Inc. 4-2 2016 West Texas Sensitivity Study
Exhibit 4-1. Observations Concerning the West Texas Power Planning Process
GeneralObservations
Assessment
InverseRelationship
Limitations
Technology
Infrastructure
Differences
CriticalCharacteristics
KeyComponents
ProcessEvaluation
TotalPlanningProcess
Coverage
CoreCompetences
CommonForecasts
EnvironmentalIssues
Pipelinevs.Electric Model
Tragedyof theCommons

Energy Ventures Analysis, Inc. 4-3 2016 West Texas Sensitivity Study
Exhibit 4-2. Inverse Relationships
Limitations
It is unlikely that the West Texas power planning process will ever reach an optimum level, because of some of the inherent characteristics of the stakeholders. More specifically, the following represents the key obstacles to achieving the optimum West Texas power planning process.
Entrenchment: Each of the stakeholders represents a large entity that is fairly entrenched in its business guidelines and policies. Historically these guidelines, procedures and policies have served each stakeholder well and, in most cases, have evolved over an extended period of time. Furthermore each stakeholder, to a degree, expects third parties to adapt to their procedures.
Competition: With the exception of ERCOT, there has been and will continue to be significant competition among the various members of each stakeholder group, which can and has inhibited the exchange of information.
Confidentiality: Obtaining and executing useful confidentiality agreements remains a barrier. The occurrence of this phenomenon exists, in large part, because of the competitive nature of the oil industry.
Heterogeneous: The producer community in particular is not a monolith, as there are considerable differences among the various producers. Included in these are differences in size, business approaches, policies, etc.
The existence of this heterogeneous nature of the producing community requires the TDSPs and ERCOT to have a flexible and adaptive planning process, or stated in simplified terms – ‘one size does not fit all’.
0
0.2
0.4
0.6
0.8
1
0
100
200
300
400
500Load Requirements
(KWh)
Production (B/D)
TYPICAL WELL
LIFE OF WELL

Energy Ventures Analysis, Inc. 4-4 2016 West Texas Sensitivity Study
Focusing on the future it is possible with a genuine effort by all stakeholders that the net impact of these limitations can be reduced even if they cannot be eliminated. As a result, while the overall power planning process cannot be perfected, it can be improved.
KeyCharacteristics
There are four major characteristics of West Texas power requirements that have a significant impact on the West Texas power planning process. These major characteristics are described briefly below.
KeyComponents
At a relatively high level there are three basic components to power requirements for West Texas producers. These three components are as follows:
New Wells (Producers): The drilling of new wells using modern, unconventional drilling and completion techniques involve substantial use of water. The movement of that water, in most cases, requires extensive pumping operations for (1) the initial use of water to fracture the well; (2) recycling the water that is returned to the surface; and (3) the eventual disposal of the used water. The surface facilities used to manage the movement of water (i.e., pumping operations) have significant power requirements.2
In addition, the production from these new wells results in requirements for additional West Texas infrastructure (e.g., NGL processing plants and pipelines). This new infrastructure, as discussed below, has its own power requirements.
Existing Wells (Producers): For existing wells at some point in time the decline in primary reservoir pressure results in the need for artificial lift, which has its own unique power requirements. Furthermore, later in the life of a well, it becomes a potential candidate for secondary (i.e., water flood) or tertiary (i.e., CO2 injection) enhanced oil recovery (EOR) – both of which have significant power requirements.3
Infrastructure (Midstream Companies): As noted above, increases in production levels result in requirements for new infrastructure and these various infrastructure components have their own unique and often large power requirements.
2 A typical 8-well tank battery with compression requires approximately 0.7 MW. A complex water transfer system (i.e., pipelines and several pumps) requires approximately 1.5 MW. 3 One scheduled CO2 flood expansion will require approximately 4 MW.

Energy Ventures Analysis, Inc. 4-5 2016 West Texas Sensitivity Study
Technology
With respect to the specific power requirements for the components noted above, the selection among alternative technologies can have a significant impact on the net power requirements for each component. For example:
Surface Facilities: The requirement to move water can be done either by pumping or merely using trucks to haul water to and from the drill site, with pumping operations requiring more onsite power than trucking operations.
Artificial Lift: The need for artificial lift can be met by either gas lift or electric submersible pumps (ESPs), with the latter requiring more power than the former.4
NGL Plants: Natural gas processing plants can either be gas-driven or electric-driven, with the latter requiring more power than the former.5
For each of these areas there is no single correct or optimum technology and, as a result, the choice of what is the appropriate technology varies by firm.
Infrastructure
Identifying and planning for the power requirements for infrastructure projects and, in particular, NGL plants has and remains a relatively unique challenge. The key dilemma is that the midstream firms do not know the future production plans of the producers and, as a result, in most cases, maintain that they cannot provide long-term plans for power requirements. This is a rather critical factor in the overall power planning process in that the power requirements for these facilities can be very large and are not placed uniformly across the region (i.e., large and lumpy). Furthermore, the specific level of the associated power requirements is impacted by the choice of technology used by the midstream firms developing the plants.
In order to obtain adequate long-term power plans for these facilities, it likely will require both significant outreach to these midstream firms and the use of unique planning processes. Fortunately, there are relatively few midstream firms, which helps facilitate the implementation of unique outreach programs.
Differences
There are significant variations in power requirements among the various producers, with size being a critical factor. To illustrate this phenomenon, Exhibits 4-3 and 4-4 illustrate in simplified fashion the power requirements for a large and small producer.
As noted in Exhibit 4-3, current drilling activity creates new wells, which will have associated power requirements for surface facilities (i.e., the items in red). In addition, the associated
4 A set of eight wells using gas-lift requires approximately 0.03 MW, including some compression. A set of eight wells using ESPs requires approximately 0.7 to 1.6 MW. 5 A large gas-driven NGL plant requires approximately 5 to 8 MW. A large electric-driven NGL plant requires approximately 40 MW.

Energy Ventures Analysis, Inc. 4-6 2016 West Texas Sensitivity Study
production with these new wells results in the need for new infrastructure, which in turn, has its own power requirements (i.e., the items in green).
Exhibit 4-3. Simplified Overview of Power Requirements (Large Producers)
In addition, existing wells, which exist because of prior drilling activity, eventually will require artificial lift, which will require power (i.e., the blue items). Furthermore, at a later point in life these wells will be candidates for either secondary or tertiary recovery, which have their own unique power requirements.
As a result, the large producer power planning process involves a significant number of different types of power requirements.
For the small producer the outlook for power and the overall power planning approach is different. This is illustrated in Exhibit 4-4, which highlights the need for power before surface facilities disappear, because small producers tend to rely on trucks for moving water (i.e., the ‘X’ed out red items). In addition, small producers do not have either the technical expertise or financial wherewithal for secondary and tertiary recovery operations (i.e., the ‘X’ed out blue items). The result is that the small producer power planning process is much more narrow and limited than that for a large producer.
Current Drilling New Infrastructure Power RequirementsActivity (NGL/Pipeline) (Lumpy/Large)
NewNew Wells Production
Water Requirements(Pumps)
Surface FacilitiesPower Requirements
Past DrillingActivity
Recycle/DisposalOld Requirements (Pumps)
Production
ExistingWells Power Requirements
Artificial Lift:(Inverse FunctionWith Life of Well)
Water Flood:Secondary Power Requirements
(Large)
CO2 (Tertiary)(1) Power Requirements(Large)
(1) Only a few West Texas firms are involved actively in either water flood or CO2 injection.

Energy Ventures Analysis, Inc. 4-7 2016 West Texas Sensitivity Study
Exhibit 4-4. Simplified Overview for Power Requirements (Small Producers)
With respect to the possibility of ignoring the small producer in the overall West Texas power planning process under the thesis that their contribution to total power requirements is small and can be ignored, this is likely an unrealistic approach, as the small producer is a significant part of the overall West Texas operations. To illustrate the latter, Exhibit 4-5 uses three different metrics to highlight the importance of the small producer and their importance to an aggregate assessment of future West Texas power requirements.
Exhibit 4-5. Current Rig and Well Count For West Texas
Source: Rig data and TRCC well data.
Current Drilling New Infrastructure Power RequirementsActivity (NGL/Pipeline) (Lumpy/Large)
NewNew Wells Production
Water Requirements(Pumps)
Surface FacilitiesPower Requirements
Past DrillingActivity
Recycle/DisposalOld Requirements (Pumps) Note: Usually uses trucks.
Production
ExistingWells Power Requirements
Artificial Lift:(Inverse FunctionWith Life of Well)
Water Flood:Secondary Power Requirements
(Large)
CO2 (Tertiary) Power Requirements(Large)
XX
X
X
X XX
X
Firms Operate > 10
Rigs6%
Firms Operate 3 to
9 Rigs25%
Firms Operate Only with 2 Rigs
23%
Firms Operate Only With a Single
Rig47%
Firms
Total = 57 Firms
Rig Count for Firms with >
10 Rigs24%
Rig Count for Firms with 3 to 9 Rigs42%
Rig Count for Firms with Only 2 Rigs
17%
Rig Count for Firms with Only a Single
Rig17%
Rig Count
Total = 154 Rigs
Load Submittals
39%
Non Load Submittals
Large7%
Non Load Submittals
Small54%
2016 YTD
2016 YTD Wells = 184

Energy Ventures Analysis, Inc. 4-8 2016 West Texas Sensitivity Study
The left graphic contained in Exhibit 4-5 categorizes the 57 firms that recently were conducting drilling operations within West Texas by the number of rigs under their direction. As illustrated, 70 percent of these firms operated either only one rig or just two rigs, which for the most part, is a small producer. 6 Admittedly, while the small producer represents about 70 percent of firms currently conducting drilling operations, they do not represent 70 percent of the rig count. This is illustrated in the center graphic contained in Exhibit 4-5, which notes that small producers control about one-third of the rigs in operation.
The final metric for assessing the contribution of small producers is contained in the right graphic in Exhibit 4-5. This graphic examines the well completions to date for 2016 and categorizes the wells that were completed by large firms that historically have submitted long-term load submittals for power planning (i.e., 39 percent) and large firms who have completed wells but did not submit load submittals (i.e., seven percent). The final segment of this graphic is the wells completed by the smaller firms (i.e., 54 percent).
No matter which metric is utilized, the primary observation is that the small producer is critical to assessing the aggregate power requirements for West Texas operations.
Evaluation
Based upon the series of interviews and conference calls, EVA was able to assimilate a basic understanding of the West Texas power planning process. Key points in its evaluation of that process are noted below.
Coverage
In order to achieve a more accurate assessment of future West Texas power requirements, the coverage of the producers, both large and small, needs to be increased. This is particularly true since extrapolation techniques from a limited data set can be treacherous. The latter is particularly true when attempting to use power requirement forecasts for large producing firms to extrapolate future power requirements for smaller producing firms and vice-a-versa, because of the significant differences in operations for these entities. In addition, the differences among the producing firms in their choices among alternative technologies can make extrapolating the outlook for power requirements for one firm based upon the projections of another very hazardous. In reality there may be no acceptable extrapolation technique for West Texas power requirements when the overall sample size is relatively small.
With respect to the historical sample size for load submittals, Exhibit 4-6 uses two metrics to illustrate that in the past the sample size, or coverage, for load submittals for long-term power requirements. The left graphic contained in Exhibit 4-6 focuses on the production from the light
6 The Appendix to this report contains a tabulation of the names for each of these 57 firms and highlights small producers.

Energy Ventures Analysis, Inc. 4-9 2016 West Texas Sensitivity Study
oil/shale plays that have accounted for over 90 percent of the production growth in West Texas. As noted in the past, those large firms submitting load submittals represented about 55 percent of this tight oil/shale production. Since historically there have been very few load submittals from smaller producers, this means that the firms accounting for between 40 and 45 percent of growth area for West Texas did not provide load submittals, or alternatively the results for firms representing just 55 to 60 percent of the key production growth area had to be used to be developed an aggregate assessment of the entire regions future power requirements.
Exhibit 4-6. Metrics for Assessing the Adequacy of Historical Load Submittals for West Texas Power Requirements
Source: Permian Basin Producers Association Oil and Gas Seminar, “An Education of Permian Basin O&G Production Operations and Midstream Processing”, November 10, 2015 and Rig Data.
With respect to the right graphic in Exhibit 4-6, it focuses on recent drilling activity. As illustrated, the firms that historically have submitted load submittals (i.e., large and small producers) represent only about 37 percent of current drilling activity. This means that load submittals representing only 35 to 40 percent of current drilling activity must be used to develop an aggregate assessment of the future of West Texas. Not only is this a nearly impossible task because of the significant differences among firms, but it is particularly vexing because drilling activity represents the starting point for the majority of future power requirements.
As a result, an increased level of load submittals is required in order to formulate a more accurate assessment of long-term West Texas power requirements. One of the primary mechanisms for increasing the overall participation of West Texas producers in providing load submittals is to continue and extend existing outreach programs. These would include continuing to work with the PBPA to increase the coverage of its members. The latter would include both the larger and smaller producers that are members of PBPA, as several of the larger members historically have not provided load submittals.
55%
9%
36%
GROWTH SEGMENT FOR WEST TEXAS PRODUCTION: PRODUCTION FOR SPRAYBERRY AND WOLFCAMP FORMATIONS
8 of the Top 10 Producers Providing Load Submittals
2 of the Top 10Producers Not Providing
Load Submittals
June 2015 = 839 MBD(1),(2)
1. Spraberry and Wolfcamp represented 56% of West Texas production (1,491 MBD).2. New Mexico Permian Basin production of 377 MBD excluded.
6%
31%
19%
44%
CURRENT RIG ACTIVITY
5 of Top 10 Rig Operators
Provided Load Submittals
Non‐Top 10Rig Operators
Provided Load Submittals
5 of Top 10 Rig Operators Didn't Provide
Load Submittals
Non‐Top 10Rig Operators Didn't
Provide Load Submittals
Total = 161

Energy Ventures Analysis, Inc. 4-10 2016 West Texas Sensitivity Study
In addition, existing outreach programs to non-PBPA members, which includes a substantial number of smaller producers, need to be extended and expanded. Accomplishing both of these items will take time.
CoreCompetencies
There is a need for each of the stakeholders to establish as a core competency within their organizations expertise concerning the principle discipline of the other stakeholders. More specifically:
Producers need to establish power planning as a core competency within their individual organizations. While many of the larger producers have power planning as a core competency, others do not. The absence of this competency for the latter group reduces the ability to obtain long-term power plans and inhibits communications.
With respect to the small producers, which, in general, are much smaller organizations with limited staff, there are two ways to obtain power planning as a core competency. These include (1) developing this competency internally, which is difficult to do with limited staff, or (2) make use of third-parties that have significant expertise in power planning to aid and assist the firm. To date the latter has been the primary alternative for a significant number of small West Texas producers.
TDSPs and ERCOT: These entities need to make detailed tracking of the West Texas oil and gas industry a core competency. This would include an awareness of global oil markets and oil prices, as well as West Texas’ place within the global oil community. While at present both the TDSPs and ERCOT have improved their tracking of the oil industry, they need to continue to improve their capabilities to both track the oil and gas industry and their expertise about various facets of the industry.
CommonOilPriceForecast
Load submittals that are based upon different long-term oil price forecasts are not additive for almost obvious reasons. For example, a load forecast prepared based upon a $75 per barrel oil forecast will yield very different future power requirement projections than a load submittal based upon a $40 per barrel oil forecast. In addition, attempting to assemble load forecasts from individual producers that are both based upon the high and low pricing points noted above will yield an incorrect aggregate assessment, since these load submittals are location specific and in the future there will be only one oil price.
While there are definite uncertainties associated with forecasting oil prices, a better approach would be for all the producers to use a common oil price forecast for the purpose of power planning. While this common or consensus oil price forecast may not be correct and likely will change from year to year, the load submittals from the various producers will be additive and the overall aggregate assessment will be robust (e.g., if oil prices increase from the common oil price forecast, then the aggregate power outlook would increase and vice-a-versa).

Energy Ventures Analysis, Inc. 4-11 2016 West Texas Sensitivity Study
Lastly, the use of a common oil price forecast for power planning is not intended to replace internal price forecasts by individual producers, but rather be used as a mechanism for producers to adjust their outlook as it pertains to power planning to a common standard.
EnvironmentalIssues
There are several environmental issues on the horizon that could impact future power requirements for West Texas either directly or indirectly. One example of a pending environmental issue that likely would have the net impact of increasing future West Texas power requirements beyond base case scenarios is the potential for future reductions for field level NOx emissions.7 If or when this occurs, it could reduce significantly the use of diesel generator sets in West Texas and elsewhere. This potential reduction in diesel generator sets likely would increase the requirement for on-the-grid power, as well as heighten the tensions among the stakeholders over timely receipt of on-the-grid power. Similar observations could be made for pending methane regulations, although the impact would be different.8
In addition, in the future there likely will be increased scrutiny of infrastructure projects, such as major transmission line projects – even in Texas. One case in point is the Denbury Green Pipeline which is being reviewed by the Texas Supreme Court for a second time.9 Other examples of this increased scrutiny include what is referred to as the ‘thin green line’ in the Pacific Northwest, which has been responsible for the cancellation of approximately 30 energy related projects.10 Still another example of this increased scrutiny is the recent limiting of the Federal Energy Regulatory Commission (FERC) proceeding, which historically have been open to the public in order to promote transparency, to a webcast only, because of planned disruptive protests over new pipeline projects.11
In light of this future increased scrutiny, stakeholders will become increasingly encumbered to work together more closely; in order to ensure that large infrastructure projects, such as major transmission lines, are derived from sound assessments of future aggregate power requirements, and
7 The EPA’s recent revision to the National Ambient Air Quality Standards, which cover ground-level ozone, reduced ozone limits from 75 ppb to 70 ppb. During its review process the EPA considered a 60 ppb standard, which would result in areas containing 94% of the population being in non-attainment. A 60 ppb standard also would make the continued use of diesel-generator sets in the field highly impractical and, as a result, increase the requirement for grid power. The EPA will reevaluate ozone levels in approximately five years. Snow, Nick, “Senate panel divided on bills to modify EPA’s proposed ozone rules”, Oil & Gas Journal, June 29, 2015, p. 20-21 and “EPA air proposals should recognize progress, API officials says”, Oil & Gas Journal, December 8, 2014, p. 26-27. 8 “Broader Than Draft, EPA Methane Irks Gas Oil Lobby Groups”, Natural Gas Week, May 16, 2016, p 1ff. 9 The Denbury Green Pipeline will be reviewed by the Texas Supreme Court for a second time. While this particular case is not applicable directly to transmission lines and at its core focuses on adequate compensation for right-away secured under eminent domain, it represents potentially a key first step that infrastructure projects in the future will be subject to greater scrutiny. Matewitz, Jim, “Texas Supreme Court to rehear “bizarre” pipeline case”, Texas Tribune, April 6, 2016. 10 In the Northwest a series of loosely connected environmental groups consisting primarily of local residents have been able to delay or cause the cancellation of approximately 30 energy related projects, including oil pipelines, port expansions, railroad expansions and energy specific projects. Altman, Alex, “Inside the Fossil Fuel Right in the Pacific Northwest: The thin green line in Oregon’, Time, February 4, 2016. 11 “FERC Blocks Access to Meeting As Fossil Fuels Imbroglio Rages”, Natural Gas Week, May 23, 2016, p 1 ff.

Energy Ventures Analysis, Inc. 4-12 2016 West Texas Sensitivity Study
that all the supporting metrics that form the basis for such power requirements are available and well organized.
PipelineModelvs.ElectricModel
While the producer community is very familiar with the pipeline model for transporting energy, because it is an integral part of the industry and producers have had decades of experience with it, producers, in general, are less familiar with the electric power model for transporting energy and tend to assume the two are similar.12 The latter both inhibits communications and leads to false assessments about the availability of power for producer operations.
With respect to the pipeline model for transporting energy, some of its basic tenants are:
Long-Term Contracts: Firms enter into long-term contracts with a pipeline company for capacity on that specific pipeline and, as a result, are obligated to pay an annual reservation charge.
Firm Capacity: The capacity outlined in the above contract is available whenever it is required.
Long Distance: Major oil and gas trunklines can transport oil and gas over 1,000 miles.
As a point of contrast, the electric power model for transporting energy has the following distinct differences:
Long-Term Contracts: There are not any long-term contracts for capacity.
Reservation Charges: There are not any annual reservation charges.
Short Distances: The movement of electric power over distribution or transmission lines occurs over relatively short distances (i.e., a few hundred miles at best, except for direct current transmission lines).
In reality the electric power model is aligned more clearly with the highway model than the pipeline model, as under the highway model the general guideline is ‘first come first served’ and that can vary over time periods.
In order to reduce any confusion over the two models, future outreach programs need to continually emphasize the difference between the two models, as the confusion appears to linger in the background for some producers.
TragedyofTheCommons
SimplifiedExamples
As noted above, the electric model for transporting energy has distinctly different attributes than the pipeline model for transporting energy. One of these attributes is that electricity will flow along the path of least resistance and under a shared, or common, distribution/transmission system this
12 Producers that have developed power planning as a core competency do not fall into this category.
Energy Ventures Analysis, Inc. 4-13 2016 West Texas Sensitivity Study
attribute can result in the action of one customer, or producer, having a noticeable impact on the service provided to another customer or producer. A series of examples illustrating this basic concept was examined at a recent PBPA meeting with Exhibit 4-7 providing a brief summary of one of the examples highlighted at this PBPA meeting. The key elements of Exhibit 4-7 are as follows:
Prior Load Growth: The initial graphic contained in Exhibit 4-7 illustrates a hypothetical basic distribution/transmission map before the addition of load growth. This particular distribution/transmission is divided into three sections (i.e., west, east and south).
2% Load Growth: The second graphic in Exhibit 4-7 notes what would happen to this particular system if annual load growth increased two percent for a five-year period. The yellow segments, or lines, indicate areas where the power flow on the line is 80 to 100 percent of the line’s power rating. Furthermore, in this graphic it is assumed that forecasted and actual load growth is approximately the same as a result a modicum of system upgrades could be undertaken to minimize the impact of the yellow segments on overall services.
2% Planned/8% Actual Load Growth in One Section: The third graphic in Exhibit 4-7 demonstrates the line loading that would happen to this particular system if the annual forecasted load growth in the east and west sections were two percent for the five-year period while forecasted load growth in the south section was eight percent for the five-year period. As illustrated, there are now both a series of yellow segments (i.e., lines with power flows between 80 to 100 percent line ratings) and a series of red segments (i.e., lines with power flows greater than 100 percent of the line rating). To avoid the problems of this potential overloads, the grid operator would change the generation dispatch on the system to reduce these flow below overload, which would result in congestion costs paid by customers and possibly reliability issues if generation dispatch alone could not resolve the problems.
In addition to the concern over congestion, this sequence of events results in a yellow segment (i.e., power flows between 80 to 100 percent of line rating) occurring in the west section, whereas in the second graphic this had not occurred. This is just one example of where the actions of others affect customers in a completely different section of the system.
8% Actual Overall: The last graphic illustrates the consequences of high estimated load growth in all three sections. Comparing the line load differences between the two cases reveals the planning risk if the load forecasts are not appropriate. Significantly more lines are overloaded or nearing overload in the eight-percent load growth case than the two-percent load growth case.
As illustrated, by the differences between these examples in the case of eight percent annual load growth over the five-year period for all sections, when forecasted load growth is only two percent, significant congestion and possible reliability issues likely would occur in all three sections. In addition, there would be a number of lines that would be operating within 80 to 100 percent of their maximum rating.

Energy Ventures Analysis, Inc. 4-14 2016 West Texas Sensitivity Study
Exhibit 4-7A. Examples of Changes in Load Growth on a Particular Distribution/ Transmission System

Energy Ventures Analysis, Inc. 4-15 2016 West Texas Sensitivity Study
Exhibit 4-7B. Examples of Changes in Load Growth on a Particular Distribution/ Transmission System

Energy Ventures Analysis, Inc. 4-16 2016 West Texas Sensitivity Study
Exhibit 4-7 is just one high level, simplified example highlighting the interdependency of individual customers/producers for electrical service. Furthermore, this example is limited to illustrating just the thermal over load of specific segments and does not address other important aspects of power planning, such as system reliability contingency planning, voltage, and system strength. Lastly, the associated heat maps for this high level example are presented in the Appendix for the interested reader. Other examples examined at the PBPA meeting included the impact of heightened load growth in the west and east sections, as well as other combinations for all three sections.
ImpactonWestTexas
A major takeaway from the examples is that the social nature of the shared use of an electric distribution and transmission system among the oil and gas operators can lead to poor management of a needed resource, namely the delivery capability of the electric grid. This mismanagement can result in a West Texas “tragedy of the commons”.
While the oil and gas operators do not directly manage the electric grid, they can supply key information to the TDSPs and ERCOT, who do. They can individually share with the TDSPs information about the expected quantity and location of their power needs. With that collection of information from their customers, the TDSPs can use the aggregated load and location information to plan improvements and upgrades to the power grid.
If only a few oil and gas operators share that needed information with their TDSPs, it is possible, even probable, that transmission plans will be developed for too little load or the improvements will be scheduled too far into the future. In that case, all the oil and gas operators may experience limited electric deliverability, the tragedy shared by all, even for those operators who shared their expected load with the TDSPs. The result would be that (1) all oil and gas operators would suffer from power delivery issues; (2) all would experience either higher expenses or shortages; and (3) the market for which they all compete would be smaller.
OverallPowerPlanningProcess
Background
The development by the producers of long-term load submittals for their future power requirements and the subsequent assessment of these submittals represent only one of the major steps in the overall power planning process. Concerning the latter, Exhibit 4-8 summarizes the major steps for the overall power planning process.

Energy Ventures Analysis, Inc. 4-17 2016 West Texas Sensitivity Study
Exhibit 4-8. Major Steps in the Overall Power Planning Process
As noted in Exhibit 4-8, the initial step in this process for consumers, such as the producers, is to provide primary metering account (PME) requests and load expectations to the TDSPs, which are used to develop a 5-year forecast. Steps II through IV involve the exchange of information between the TDSPs and ERCOT to develop various facets of a long-term load forecast. The accomplishment of Steps II through IV led to Step V, which is the development of 6-year Regional Plan. The latter, which focuses on an aggregate assessment and includes contingency planning, is required by state law and is for the entire ERCOT region. Subsequently in Step VI, TDSPs propose specific projects to resolve identified needs for transmission.
WestTexas
While a key focus of this report is on the preparation of the load submittals (i.e., by producers and TDSPs) to ERCOT for their required 6-year Regional Plan,13 the load submittals to ERCOT are only one part of the overall West Texas power planning process. Furthermore, within this overall West Texas power planning process the critical interface and primary point of contact occurs between the TDSPs and the producers. It is at this critical interface, which often involves periodic face-to-face meetings, where (1) trust between the parties is developed and (2) the exchange of critical information occurs. While ERCOT may not be involved directly in this critical interface, ERCOT is heavily dependent upon this component of the overall power planning process to be successful. Stated in an alternative fashion, ERCOT cannot operate in a vacuum.
13 Required by the National Electric Reliability Council (NERC). Also Texas state law requires ERCOT to prepare a Long-Term System Assessment (LTSA).
I. Consumers such as producers, provided PME requests and load expectations to TDSPs for a 5-year forecast.
II. ERCOT receives load forecasts from transmission utilities by substation for a 6-year forecast.
III. ERCOT compiles load data, planned generation, and planned transmission upgrades and additions to build transmission planning models for use by ERCOT and TDSPs.
IV. ERCOT and TDSPs use the models to identify transmission needs and develop solutions.
V. ERCOT develops 6-year Regional Plan, which focuses on an aggregate assessment and contingency planning.
Required by state law. VI. TDSPs propose specific projects to resolve identified needs on the transmission
system.

Energy Ventures Analysis, Inc. 4-18 2016 West Texas Sensitivity Study
Primarily because of the above assessment, it is necessary to evaluate the entire West Texas power planning process, rather than merely the 6-year Regional Plan, which is a critical component to the overall process.

Energy Ventures Analysis, Inc. 5-1 2016 West Texas Sensitivity Study
5. RECOMMENDATIONS
Overview
As noted in Chapter 2, it is unlikely that the optimum West Texas power planning process will ever be achieved because of the inherent characteristics of the stakeholders. However, improvements can be made to the overall power planning process to make it better, particularly better than what occurred during the 2012 to 2014 era. The material below makes several suggestions and recommendations on how the overall planning process can be improved. As the reader will note, several of these suggestions/recommendations are interrelated. Furthermore, at present it appears that the stakeholders have about a two-year window – as discussed in Chapter 3 – to improve the overall planning process before the next surge in West Texas drilling activity and the associated power requirements occur.
Finally, for the most part, the suggestions and recommendations made in this chapter are based upon the series of observations noted in Chapter 4.
LongTimeHorizon
The stakeholders should be prepared for the heightened power requirements to exist for an extended period of time. The foundation for this expected long time horizon is (1) the inverse relationships between the power requirements for a well and the production from the well (i.e., see Exhibit 4-2); and (2) the enormous resource potential for the Permian Basin (i.e., see Exhibit 3-3).1
One further indication of the long time horizon for West Texas power requirements is contained in Exhibit 5-1,2 which is an assessment of Occidental Petroleum’s (Oxy) acreage position within the Permian Basin. 3 This assessment identified the percentage of Oxy’s acreage position that is economic to drill at various oil prices. For example, seven percent of Oxy’s acreage position is economically viable at oil prices in the $40 to $50 per barrel range and the cumulative drill sites for that acreage would provide Oxy with drilling opportunities for about seven years.
While there are a number of contingency assessments that do not foresee oil prices returning to above $75 per barrel, the portion of Oxy’s Permian Basin acreage portfolio that is economically viable at $75 per barrel represents decades of drilling activity.
Finally, while neither the exact start point for the next surge in drilling activity nor the rate of growth in power requirements once this surge occurs is known, there are several indications that this second era of substantial West Texas drilling activity could begin in about two years and that
1 Alternatively, there is a third correlation with the life of the well and the size of the power requirements to service that well. 2 Exhibit 5-1 is the same as Exhibit 3-7, but is included here to further aid the reader’s appreciation of this recom-mendation. 3 Occidental Petroleum is one of the larger acreage holders in the Permian Basin.

Energy Ventures Analysis, Inc. 5-2 2016 West Texas Sensitivity Study
the rate of growth of the associated power requirements could be substantial. Furthermore, this rate of growth could be accelerated if certain pending environmental regulations come to fruition (i.e., see Chapter 4).
Exhibit 5-1. Oxy’s Permian Basin Acreage Profile
Limitations
While the overall power planning process likely will not ever be perfected, in order to make significant improvements to this process each of the stakeholders needs to become more adaptive and flexible. Included in this more adaptive and flexible approach would be a conscious effort to overcome, to a greater degree, both the entrenchment and confidentiality issues discussed in Chapter 4.
In addition, the Public Utility Commission of Texas (PUCT) should consider continuing the historical process of having periodic meetings between the stakeholders. The PUCT adopting this ongoing facilitator role would help resolve thorny issues that likely will arise in the future and thus, help reduce tensions between the stakeholders. While this will require the use of some of the PUCT staff’s valuable time, it is likely justified by the importance of future West Texas activity to the entire state and the contribution of West Texas to the entire power load for ERCOT.
Outreach
Critical to achieving many of the suggested improvements to the overall power planning process will be a continuation of all types of outreach programs to and among the various stakeholders. The primary objective of such an extended outreach effort would be to increase both the quantity and quality of participation in the overall West Texas power planning process.
Probably the most significant of these outreach efforts is the periodic meetings – some of which are monthly – between the TDSPs and the individual producers. While historically such meetings have been between the TDSPs and the regional staff of the producers, over time these may have to be
Source: Occidental Petroleum's 1Q 2016 Investor Presentation.
0
0.2
0.4
0.6
0.8
1
1.2
$40‐$50 $50‐$60 $60‐$70 $70‐$80 >$80
Avalon
Delaware
Bone Spring
Sprayberry
Wolfcamp D
Wolfcamp C
Wolfcamp B
Wolfcamp A
15%(≈ 7 years)
37%(≈ 16 years)
61%(≈ 27 years)
81%(≈ 36 years)
100%(≈ 44 years)
(% of Acreage)

Energy Ventures Analysis, Inc. 5-3 2016 West Texas Sensitivity Study
extended to the corporate staff of the specific producers, as this is where the resistance towards power planning exists for some producers. This outreach to corporate staff likely will include significant education about the importance of long-term power planning and the overall West Texas power planning process.4
Other examples of recent outreach programs that would serve as examples for future outreach programs include the following:
Seminars: The November 2015 seminar by the PBPA both provided a sound foundation at a rather granular level of the specific power requirements for producers, as well as provided a forum for the producers to present their points of view on several difficult issues.5
Presentations: In the past there have been several presentations by both ERCOT and the TDSPs to the membership of the PBPA. These presentations represent excellent tools for coordination on both the overall need for greater participation in the West Texas power planning process and to address specific issues about the planning process.
Industry Organizations: Each opportunity to broaden the outreach about the importance and need for long-term power planning by addressing various oil and gas industry groups should be considered. One recent very successful example was a presentation to the Technical Committee of the Gas Producers Association (GPA) concerning the importance of long-term power planning for infrastructure companies (i.e., specifically developers of NGL processing plants) and the problems that can arise from the lack of such planning. This particular presentation was so well received that it was presented subsequently to the board of directors of the GPA.
Trade Press: Every opportunity to address in the trade press various facets of power planning and the limitations of not participating in the process should be considered. A specific example would include the recent article in the Midstream Monitor concerning the potential problems of power overload in the Permian Basin. A copy of this article is contained in the Appendix.6
Small Producers: Unique outreach programs need to be examined and developed for contacting small producers on either an individual basis or through third-party power providers. One suggestion for such a unique outreach effort is to develop a special course on power planning under the auspices of the Society of Petroleum Engineers. Among other things, such a course could introduce and educate small producers on available power planning software, such as Enersight.
Finally, these various outreach programs should continue to emphasize the differences between the pipeline model and the electric model for transporting energy, as there remains for some producers a lingering lack of appreciation of these differences.
4 While these meetings could be considered to be part of an enhanced customer account management effort, they would focus specifically on near to longer term load projections. 5 PBPA Oil and Gas Seminar “An Education of Permian Basin O&G Production Operations and Midstream Processing”, November 10, 2015. 6 Hart, Paul, “Permian Basin’s Growth Threatens Power Overload”, Midstream Monitor, April 22, 2016, p. 2-4.

Energy Ventures Analysis, Inc. 5-4 2016 West Texas Sensitivity Study
AggregateAssessment
As discussed in Chapter 4, the long-term outlook for future West Texas power loads needs to focus on an aggregate assessment of West Texas requirements and not the needs of a few producers. This is particularly true, since there likely are not any adequate extrapolation techniques for projecting West Texas power requirements from a relatively small sample size, because of the significant differences among the producers.
Increasing the overall small size, or coverage of the West Texas producing community, will require a sustained set of outreach programs by the TDSPs and ERCOT to convince more producers to submit load submittals. These outreach programs can be divided into two major categories, namely:
PBPA Members: Continue extensive outreach programs to non-participating members of the PBPA, with a particular focus on the larger producers not currently providing load submittals.
Small Producers: Creative outreach programs, as discussed above, need to be developed to reach small producers – many of which are not PBPA members. One mechanism for achieving such outreach is to work with third-party firms that coordinate power planning for small producers (e.g., Priority Power and Terry Chapman, who is an operations infrastructure specialist).
5‐YearPlanningHorizon
Overview
At a minimum the planning horizon for load submittals needs to be five years in order to provide a basis for long-term planning decisions. While large producers are, in general, capable of meeting the five-year threshold, these become problematic for many of the small producers. In many cases the small producers, at best, can define their drilling programs over the next 18 months, but do not have definite internal plans beyond that time horizon.7
WestTexasCountyMaps
As a result, the overall planning process needs to be more adaptive and creative to accommodate this characteristic of the small producers and still obtain some type of a load submittal. One potential approach is to allow the small producers to submit qualitative assessments for the later years of the planning horizon. One potential mechanism for achieving these qualitative assessments that was suggested and endorsed by both the small producers and the TDSPs involves the use of a West Texas map that divides counties into subsegments. The concept is that small producers would use these maps to indicate on a qualitative basis where their drilling activity would be focused in the latter years of the planning time horizon based upon a common oil price outlook.
7 During interviews with small producers and their representatives, it was noted that it was common for small producers to have internal monthly drilling schedules that identified the location of specific drill sites for the next six to 18 months. However, plans beyond this drilling schedule did not exist within the firm.

Energy Ventures Analysis, Inc. 5-5 2016 West Texas Sensitivity Study
Exhibit 5-2 and Exhibit 5-3 provide illustrations of such county level maps for Midland and Lynn counties. These maps were developed from the standard West Texas land maps8 that, for the most part, divide counties into blocks (i.e., 36 sections or one square mile blocks). In general, the objective when creating the subsegments for each county was to honor the various blocks. However, in several cases, the existence of natural phenomena, such as rivers, and the creation of municipal boundaries resulted in the breakup of standard blocks. In these instances, the smaller areas were combined on a judgmental basis into single county segments that were used for the maps contained in this report.
As a practical matter, while there are 28 counties involving over 400 segments, it is envisioned that any single small producer likely would focus on only three or four county maps, because that is where their acreage is concentrated, which is a very different situation from the larger producers, which tend to have acreage positions throughout the Permian Basin. Furthermore, accompanying each map would be a simplified table that would be used to tabulate qualitative insights by subsegments and by year.9 The use of these tables, which are in an Excel format, should aid and assist the TDSPs in compiling the various small producer insights.
The use of these maps has been tested with a few small producers. Overall this testing, which yielded a few questions and comments, resulted in a sound endorsement of the basic concept (i.e., see Exhibits A-4 through A-7 for specific examples).
CoreCompetencies
As noted in Chapter 4, each of the stakeholders needs to establish and maintain as a core competency expertise on the primary discipline of the other stakeholders. The existence of expertise about the business of the other stakeholders as core competency definitely will facilitate better communications and aid in producing better power plans.
In the case of the producers, each producer should develop power planning as a core competency within their organization. For large producers this likely will result in having staff with significant knowledge about electric power planning. However, for the small producers the most likely alternative will be securing third parties that are experts in power planning, because these producers tend to have limited staff.
In the case of TDSPs and ERCOT, this would involve developing and maintaining the capabilities to track key facets of the oil and gas industry. This would include the following:
8 http://www.glo.texas.gov/land/land-management/gis/ 9 See the Appendix for an example. Also, a data file that includes each of 28 county maps and associated tables is included in the Appendix.

Energy Ventures Analysis, Inc. 5-6 2016 West Texas Sensitivity Study
Exhibit 5-2. Proposed Map for Midland County

Energy Ventures Analysis, Inc. 5-7 2016 West Texas Sensitivity Study
Exhibit 5-3. Proposed Map for Lynn County
LY‐1 LY‐2
LY‐4
LY‐3
LY‐5
LY‐11LY‐9
LY‐6
LY‐7
LY‐12
LY‐10
LY‐8
BLK HBLK 8
BLK 32 BLK 10
BLK 3
BLK 9
BLK 1
BLK 2
BLK 4
BLK 1
BLK 1
BLK 1
BLK 1
BLK 3
BLK 5
BLK 11
BLK 1
BLK J
BLK 1
BLK 18
BLK A‐1
BLK O
BLK 5
BLK 9
BLK C‐42
BLK 12
BLK 21
BLK L
BLK D‐23
BLK 18BLK 7
BLK O
BLK 3
BLK C‐41
BLK 2
BLK 7
BLK Y

Energy Ventures Analysis, Inc. 5-8 2016 West Texas Sensitivity Study
Oil Prices: The routine tracking of oil prices, which is a fairly straightforward process, should exist within each organization. A key aspect of this tracking of oil prices would be awareness of the occurrence of key threshold oil prices which likely would result in an increase in drilling activity. Based upon the various interviews, key threshold prices would include: Sustained oil prices in the $45 to $50 per barrel range, is when some of the larger
producers have indicated they would start increasing the rigs that they operate in the Permian Basin.10
Sustained oil prices in the $60 to $65 per barrel range, as this likely will represent the beginning of the next substantial increase in West Texas drilling activity.11
Rig Count: Tracking the rig count by county with each TDSPs focusing on the counties within its service territory is a relatively straightforward process, as the data is available from the Baker Hughes North American Rotary Rig Count, which is published on a weekly basis at no cost.12 The Baker Hughes service also notes the type of rig (i.e., horizontal or vertical). In addition, there are commercial services, such as Rig Data, which provide not only the rig count by location, but also by operator.
While tracking the rig count by county represents an excellent mechanism for observing trends in drilling activity within West Texas, the rig count is only a proxy for well completions. Furthermore, since there has been significant improvement in rig productivity over the last several years, direct correlations between prior rig count levels and current rig count levels do not exist. However, basic trends such as a significant increase from current drilling activity can be identified (i.e., turning points within the industry).
Well Completions: The tracking of well completions by county can be done using the databases available from the Texas Railroad Commission (TRRC), however there is a time lag in the well counts available in these databases and these databases are not particularly user friendly. As a result, some internal expertise in the use of the TRRC databases will have to be developed by each TDSP and/or ERCOT. An alternative is to use commercially available services, such as Drilling Info which will provide well completions by county and operator.
The recommendation of this report is to initially start tracking the weekly Baker Hughes rig count by county in order to monitor significant changes in industry drilling activity, and then in time to develop expertise for tracking well completions if additional granularity or insight is required.
10 “More Price Pain Needed to Break U.S. Shale”, Petroleum Intelligence Weekly, April 25, 2016, p 3-4; Friedman, Nicole and Iosebashvile, Ira, “Oil-Price Rise Could Be Its Own Undoing”, Wall Street Journal, March 31, 2016; and Zborowski, Matt “BHI: US rig count hits all-time low in recorded data”, Oil & Gas Journal, March 21, 2016, pp 19-21. 11 Both interviews and a literature search have indicated that the combination of cost reductions and improvements in well designs within the Permian Basin have lowered overall well economics to the point that $60 to $65 per barrel for most producers will yield the same economic returns as in the past when oil prices were about $90 per barrel. 12 http://phx.corporate-ir.net/phoenix.zhtml?c=79687&p=irol-reportsother

Energy Ventures Analysis, Inc. 5-9 2016 West Texas Sensitivity Study
CommonOilPrice
As discussed in Chapter 4, producer load submittals should be based upon a common oil price forecast in order to ensure that results are additive, which will increase both the validity and usefulness of the aggregate outlook for load requirements.
With respect to the forthcoming load submittal cycle, at the behest of the producers, EVA provided a suggested common oil price forecast, which is presented in Exhibit 5-4. This recommended common oil price forecast is compared and contrasted to a few other projections for oil prices, including the Energy Information Administration (EIA) projections from its 2016 Annual Energy Outlook and a recent NYMEX strip. As a point of perspective, the forecast provided in Exhibit 5-4 has been revised upward a few dollars per barrel from the forecast provided to the PBPA leadership earlier in the process of reviewing the overall West Texas power planning process. The primary reason for this small upward revision is a series of temporary events over the last two to three months that have curtailed global oil supplies. While the curtailment of supplies is temporary, their cumulative result has had an impact on the market and reduced the buildup of global inventories.13
Exhibit 5-4. Suggested Common Oil Price Forecast
Source: EIA 2016 Annual Energy Outlook; NYMEX; “Price Volatility Leaves Pundits Playing Catch-Up”, Natural Gas Week, February 1, 2016, pp 5-6.
13 These events include: (1) in Canada the curtailment of about 1.5 MMBD of tar sands production capacity, because of the wildfires in Alberta – production already has started to come back online; (2) in Nigeria continued attacks by rebel groups in the Niger Delta resulted in the temporary shutdown of ENI’s Brass River terminal, Chevron’s Okan offshore platforms and Shell’s Forcadoes area, which reduced Nigeria’s April production levels 250 MBD, the ENI and Chevron facilities have come back online, while Shell is still having problems; (3) in Kuwait a three day oil workers strike curtailed about 1.5 MMBD, however production is now back to normal; and (4) in Iraq tensions with the northern Kurds resulted in shutting in about 0.15 MBD, however overall Iraqi production is increasing.

Energy Ventures Analysis, Inc. 5-10 2016 West Texas Sensitivity Study
While EVA has provided a recommendation for a common oil price forecast for the next iteration of load submittals, the long-term goal is to institutionalize this process. With respect to the selection of a common oil price there are several potential alternatives including the following:
Average: There are a number of very reputable firms that provide long-term oil forecasts. One approach would be to take an average of three such forecasts, since opinions on future oil prices do vary.
EIA: Potentially the EIA long-term oil forecast from its Annual Energy Outlook could be used. The chief advantage of this alternative is that the EIA forecast is in the public domain. However, the primary disadvantage to using this EIA alternative is that there is a significant time lag in the publishing of the EIA Annual Energy Outlook, which likely will force the producers to use a somewhat dated projection.
With respect to the NYMEX strip, it is recommended that the NYMEX strip not be used as a common oil price forecast. While the NYMEX strip is a reasonable indicator of oil prices for the next 18 months, beyond that it is not a very good broad market indicator, particularly since the adoption of Dodd-Frank regulations. A key impact of these regulations has been to reduce trading volumes beyond 18 months to almost de minimus levels.
With respect to the appropriate parties to select the common oil price forecast before the start of each annual power planning process, potential alternatives include:
PBPA: A select group from the PBPA could develop and distribute the common oil price forecast, as these individuals are relatively knowledgeable about the industry.
Coordinating Committee: A coordinating committee consisting of a representative from each of the stakeholders (i.e., producers, TDSPs and ERCOT) could work jointly to develop and distribute a common oil price forecast at the beginning of each power planning cycle.14 The primary advantage of this approach is that it would create buy-in from each of the stakeholder groups.
Infrastructure
NGLPlants
As discussed in Chapter 4 in the past obtaining long-term load submittals from midstream com-panies has been problematic, particularly since the power requirements for certain infrastructure (i.e., NGL plants) can be large (e.g., up to 40 MW) and lumpy (i.e., concentrated at difficult to predict locations). Exhibit 5-5 summarizes the recent NGL plant additions for West Texas. These annual additions represent a decline from eight NGL plants added in 2014. Furthermore, expectations are that new NGL plants post mid-2016 to about 2018 will be at a minimum, primarily
14 See last recommendation in this chapter for a further discussion on a coordinating committee.

Energy Ventures Analysis, Inc. 5-11 2016 West Texas Sensitivity Study
because of the decline in drilling activity in West Texas and the associated flat to declining production (i.e., see Exhibit 2-7).15
Exhibit 5-5. Recent West Texas NGL Plants
This anticipated limited additions, if any, of new NGL plants between mid-2016 and 2018 creates an opportunity for the TDSPs and ERCOT to develop unique and more adaptive approaches for obtaining long-term load submittals from the midstream segment of the industry. Among the various approaches that should be considered are the following:
Outreach: The TDSPs and ERCOT might refocus their outreach programs for these midstream firms, as they are distinctly different from the producers.
Meetings: Since there are relatively few midstream firms operating in West Texas, a series of meetings with individual midstream firms over the next two years to explore alternative approaches for obtaining load submittals – even if they only include a combination of quantitative and qualitative information – likely would be productive.
Hotspots: Concerning the possibility of developing some qualitative insights to the power requirements for these midstream firms, particularly during the latter years in the planning horizon, stakeholders could work together to identify potential ‘hotspots’ for new NGL plants once the rebound in West Texas drilling activity begins. As a point of perspective, these ‘hotspots’ likely would include (1) current NGL facilities that can be expanded relatively easily and (2) the intersection of power lines and pipelines in counties where production is projected to grow significantly. Lastly, merely identifying with each midstream firm on a confidential basis potential ‘hotspots’ might help overcome the competitive tensions between the various midstream firms (e.g., it may not be known which midstream firm will build a new NGL plant at a specific ‘hotspot’ location, but the specific
15 To date there have not been any public announcements of new NGL capacity in West Texas for 2016, 2017 and 2018.
Online CapacityName Company County Date (MMCFD)I.2015NGLPlants
MiVida RegencyGas Ward May2015 200BearkatII EnlinkMidstream Glasscock Aug2015 120BigLake LucidEnergyGroup Reagan Mid‐2015 200RamseyIV NuevoMidstream Reeves Aug2015 200
II.2016NGLPlantsPlantI TargaResources Winkler Feb2016 300JamesLakeII CanyonMidstream Andrews Apr2016 200RamseyV NuevoMidstream Reeves Apr2016 200ToyahI ClawMidstream Reeves May2016 60Buffalo AtlasPipeline Martin Jun2016 200
III.2017NGLPlantsUnknown NavitasMidstream Midland Apr2017 155
Source: Company announcements and trade press.

Energy Ventures Analysis, Inc. 5-12 2016 West Texas Sensitivity Study
location represents a high probability point for a future significant increase in power requirements).
Alternative Insights: As discussed in the next recommendation, additional insights concerning the need for new NGL capacity potentially could be obtained from the producers. This information could be used in combination with the above items to develop a better composite picture of the future power requirements for midstream firms.
RecentProgress
While obtaining load submittals from midstream companies has been problematic in the past, prior outreach firms have had some success. This success is illustrated in Exhibit 5-6, which summarizes the load submittals that one midstream firm will be making during the next iteration in the power planning process. While Exhibit 5-6 only presents data for 2016 and 2020, the data for the interim years is available. Furthermore, while Exhibit 5-6 identifies by specific plant (i.e., location) the load requirements, it also identifies the expected ramp up in the power requirements.
Exhibit 5-6. Example of West Texas Infrastructure Load Forecast
Pipelines
In addition to NGL plants, the development of new pipelines in West Texas and/or the expansion of existing systems will increase West Texas load requirements. Exhibit 5-7 summarizes both recent and projected pipeline additions for West Texas. Similarly creative outreach programs to those noted above may be required to obtain load submittals from the appropriate pipeline companies.
Current(MW) Load(MW) Mar‐16 Apr‐16 May‐16 Jun‐16 Jul‐16 Aug‐16 Sep‐16 Oct‐16 Nov‐16 Dec‐16NGLPlantA 46.0 47.0 47.0 47.0 47.0 47.0 47.0 47.0 47.0 47.0 47.0NGLPlantB 46.0 47.0 47.0 47.0 47.0 47.0 47.0 47.0 47.0 47.0 47.0NGLPlantC 21.0 21.0 21.0 21.0 21.0 21.0 21.0 21.0 21.0 21.0 21.0NGLPlantD 4.0 4.0 4.5 4.5 4.5 4.5 4.5 4.5 4.5 4.5 4.5Other 0.6 0.6 0.6 0.6 0.6 0.6 0.6 0.6 0.6 0.6 0.6NGLPlantE 0.0 24.0 24.5 25.5 26.4 27.4 28.4 29.4 30.3 31.3NGLPlantF 0.0 0.0 0.0 0.0 0.0 0.0 0.0 0.0 0.0 0.0NGLPlantG 0.0 0.0 0.0 0.0 0.0 0.0 0.0 0.0 0.0 0.0
Total 119.6 144.1 144.6 145.6 146.5 147.5 148.5 149.5 150.4 151.4
(MW) Jan‐20 Feb‐20 Mar‐20 Apr‐20 May‐20 Jun‐20 Jul‐20 Aug‐20 Sep‐20 Oct‐20 Nov‐20 Dec‐20NGLPlantA 47.0 47.0 47.0 47.0 47.0 47.0 47.0 47.0 47.0 47.0 47.0 47.0NGLPlantB 47.0 47.0 47.0 47.0 47.0 47.0 47.0 47.0 47.0 47.0 47.0 47.0NGLPlantC 21.0 21.0 21.0 21.0 21.0 21.0 21.0 21.0 21.0 21.0 21.0 21.0NGLPlantD 4.5 4.5 4.5 4.5 4.5 4.5 4.5 4.5 4.5 4.5 4.5 4.5Other 1.2 1.2 1.2 1.2 1.2 1.2 1.2 1.2 1.2 1.2 1.2 1.2NGLPlantE 47.0 47.0 47.0 47.0 47.0 47.0 47.0 47.0 47.0 47.0 47.0 47.0NGLPlantF 47.0 47.0 47.0 47.0 47.0 47.0 47.0 47.0 47.0 47.0 47.0 47.0NGLPlantG 27.4 28.7 30.1 31.4 32.7 34.0 35.3 36.5 37.8 39.1 40.4 41.8
Total 242.1 243.4 244.8 246.1 247.4 248.7 250.0 251.2 252.5 253.8 255.1 256.5Note:Similarloadforecastsareavailableforinterimyears.

Energy Ventures Analysis, Inc. 5-13 2016 West Texas Sensitivity Study
Exhibit 5-7. West Texas Pipeline Projects
Source:Companyannouncementsandtradepress.
LoadSubmittals
Addendum
Current ERCOT load submittals request power requirements by location for the specified time horizon. It is suggested that, as a supplement to its standard load submittal requests, ERCOT develop an addendum that would seek selected additional information about future power requirements, particularly future large power additions. Such an addendum would include the following:
NGL Capacity: During the interview process it was noted that several producers develop as part of their own internal long-term strategic plans projections of the additional NGL and pipeline capacity they will need as a result of projected increases in drilling activity. Furthermore, this increased infrastructure capacity tends to be area specific. These projections help the producers identify when they need to start negotiations with the various midstream companies for additional capacity. Furthermore, while one producer may identify the need for 40 MMCFD of new capacity in Midland county – for example – two or three others also may have similar projections, which would then form the basis for a 120 MMCFD plant, such as the Bearkat II plant, even though the specific midstream firm that would develop such a plant would still be an unknown.

Energy Ventures Analysis, Inc. 5-14 2016 West Texas Sensitivity Study
In light of the above it is recommended that ERCOT request as part of its addendum that the producers provide ERCOT a summary of such information, particularly when it is readily available. Admittedly, such a request would be focused on large producers that have relatively sophisticated strategic planning processes. With respect to small producers, such a request should be avoided in order to ensure their cooperation with the relatively simple load submittals previously discussed.
Enhanced Oil Recovery: EOR projects and, in particular, tertiary recovery which involves CO2 injection (i.e., see Chapter 3) have significant power requirements. Furthermore, EOR projects tend to be relatively large projects that do not occur often, but when they do occur they make a noticeable impact on the load requirements for a specific area, depending on the size of the EOR project. Furthermore, implementing an EOR project requires significant sophistication. EOR projects usually are conducted by the large producers because of their upfront cost and the requirement for a relatively sophisticated reservoir engineering staff. More specifically, within West Texas there are only a few large producers that are likely to undertake EOR projects, with Oxy by far the largest EOR firm within the Permian Basin.16 In light of the impact of these EOR projects and the lower frequency of their occurrence, it is recommended that the addendum for the ERCOT load submittals request as a separate item information concerning future EOR projects, even if this information is qualitative. For example, a useful qualitative response could be that no EOR projects are planned over the next five years, however in years six through 10 there are two potential EOR projects likely in the following locations. It is also recommended that this portion of the addendum be directed to only the larger producers currently engaged or likely to be engaged in EOR projects.
SupplementalModel
Load forecasting for electric power often involves the use of very sophisticated econometric algorithms. Furthermore, these econometric algorithms are often very granular in that they may examine specific segments of a given metropolitan area.
Unfortunately, for the largest part of the power requirements for West Texas these rather sophisticated econometric tools for load forecasting are not applicable, because power requirements are fundamentally based on drilling activity, which in turn is driven by global oil prices, rather than population and economic metrics. As a result, it is suggested that TDSPs and ERCOT invest some resources to develop a separate and supplemental long-term model that addresses the unique features of West Texas. This model would supplement the current load submittals and likely extend out over a longer timeframe (e.g., 10 years). Furthermore, it is envisioned that such a model once developed could be improved over time. In addition, the development of such a model would help improve the expertise of the TDSPs and ERCOT concerning the West Texas oil industry.
16 Other firms include Exxon/XTO, Apache and Energen.
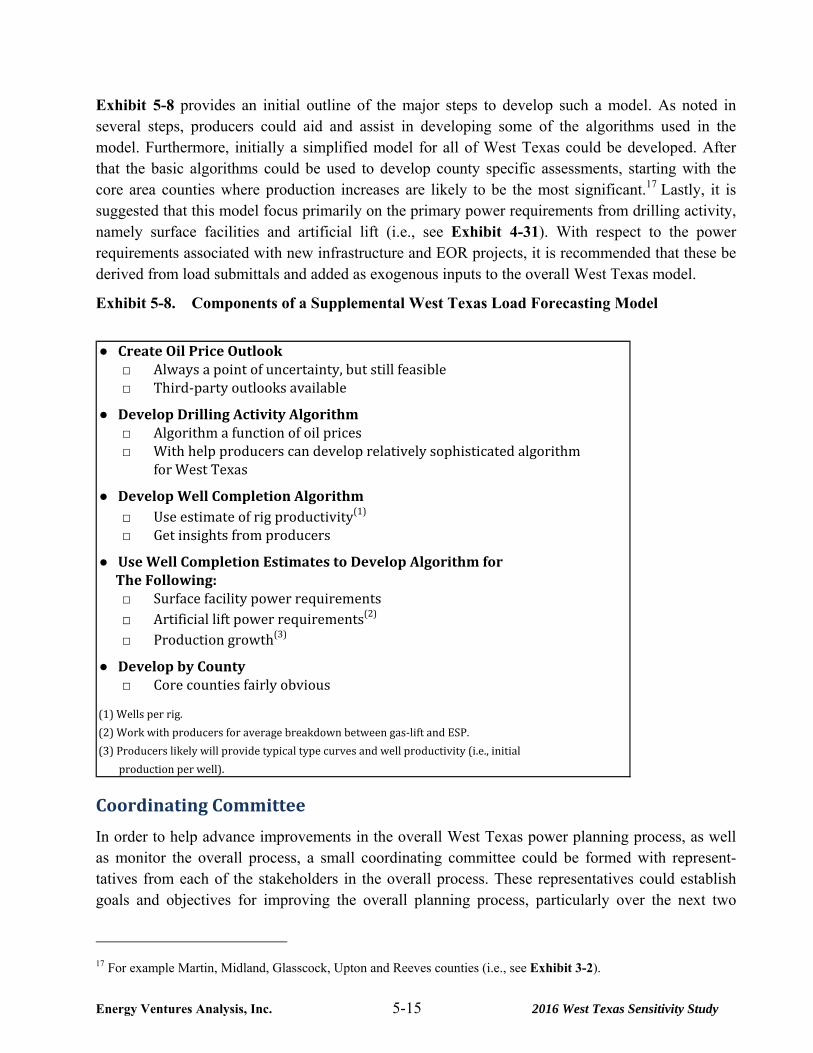
Energy Ventures Analysis, Inc. 5-15 2016 West Texas Sensitivity Study
Exhibit 5-8 provides an initial outline of the major steps to develop such a model. As noted in several steps, producers could aid and assist in developing some of the algorithms used in the model. Furthermore, initially a simplified model for all of West Texas could be developed. After that the basic algorithms could be used to develop county specific assessments, starting with the core area counties where production increases are likely to be the most significant.17 Lastly, it is suggested that this model focus primarily on the primary power requirements from drilling activity, namely surface facilities and artificial lift (i.e., see Exhibit 4-31). With respect to the power requirements associated with new infrastructure and EOR projects, it is recommended that these be derived from load submittals and added as exogenous inputs to the overall West Texas model.
Exhibit 5-8. Components of a Supplemental West Texas Load Forecasting Model
CoordinatingCommittee
In order to help advance improvements in the overall West Texas power planning process, as well as monitor the overall process, a small coordinating committee could be formed with represent-tatives from each of the stakeholders in the overall process. These representatives could establish goals and objectives for improving the overall planning process, particularly over the next two
17 For example Martin, Midland, Glasscock, Upton and Reeves counties (i.e., see Exhibit 3-2).
●CreateOilPriceOutlook□ Alwaysapointofuncertainty,butstillfeasible□ Third‐partyoutlooksavailable
●DevelopDrillingActivityAlgorithm□ Algorithmafunctionofoilprices□ Withhelpproducerscandeveloprelativelysophisticatedalgorithm
forWestTexas
●DevelopWellCompletionAlgorithm□ Useestimateofrigproductivity(1)
□ Getinsightsfromproducers
●UseWellCompletionEstimatestoDevelopAlgorithmforTheFollowing:□ Surfacefacilitypowerrequirements□ Artificialliftpowerrequirements(2)
□ Productiongrowth(3)
●DevelopbyCounty□ Corecountiesfairlyobvious
(1)Wellsperrig.
(2)Workwithproducersforaveragebreakdownbetweengas‐liftandESP.
(3)Producerslikelywillprovidetypicaltypecurvesandwellproductivity(i.e.,initial
productionperwell).

Energy Ventures Analysis, Inc. 5-16 2016 West Texas Sensitivity Study
years, and create their own scorecard for assessing progress. Items that might be included on this scorecard would include, among other things, the following:
Large Producers: Level of participation of large producers.
Small Producers: Level of participation of small producers.
Midstream Producers: Level of participation by midstream firms.
Outreach: Development of outreach programs.
West Texas Maps: Usefulness and improvements to the West Texas county maps presented in this report.
Industry Appraisals: Share insights concerning changes or potential surges in West Texas drilling activity by county.
Furthermore, this coordinating committee could be responsible for the development and distribution of a common oil price forecast for each power planning cycle.
Based upon the series of interviews conducted for this report, the following would be suggested to form the core of this small coordinating committee:
The president of the PBPA.
The Senior Manager of Transmission Planning at ERCOT or his/her representative.
The Director of Power System Planning at Oncor, which is one of the larger TDSPs.
Once established, this core group could consider the merits of adding a few additional members to the coordinating committee, such as (1) a representative from the midstream firms (e.g., the presenter of the April presentation to the Gas Processors Association); (2) a representative of, or for, the small producers (e.g., the president of Priority Power); and (3) another member from the leadership of the PBPA.
Lastly, this coordinating meeting could provide periodic updates to the PUCT staff (e.g., Director of Infrastructure and Reliability Division) on the progress of improving the overall West Texas power planning systems and specifics concerning items included on the above mentioned power planning scorecard.
Summary
Exhibit 5-9 contains a high level summary of the various suggestions and recommendations made in this report. Several of these suggestions and recommendations are interrelated.

Energy Ventures Analysis, Inc. 5-17 2016 West Texas Sensitivity Study
Exhibit 5-9. Summary of Suggestions and Recommendations
Suggestion/Recommendation Description
1. Long Time Horizon Be prepared for increased West Texas drilling activity and its associated power requirements to last over an extended period.
2. Limitations Stakeholders need to be more adaptive and flexible in order to overcome inherent characteristics within their organiza-tion that serve as obstacles to optimize the overall West Texas planning process.
PUCT should consider continuing periodic meetings between the stakeholders in order to help resolve issues that likely will arise in the future.
3. Outreach Outreach programs of all types represent critical vehicles for improving the overall power planning process and should be continued in the future. Key among these outreach programs are the periodic meetings between the TDSPs and individual producers.
4. Aggregate Assessment The focus should be on an aggregate assessment of future power requirements that includes small producers, rather than being focused on a few large producers, as extra-polation techniques are flawed.
5. 5-Year Planning Horizon At a minimum the time horizon for load submittals should be five years. However, for small producers this will require including some qualitative assessments for power requirements for the later years in the planning horizon. A series of West Texas county maps with subsegments has been developed as an aid for soliciting useful qualitative information.
6. Core Competencies Each stakeholder should seek to develop as core competencies within its organization expertise concerning the primary discipline of the other stakeholders (i.e., specifics included in the body of the report).

Energy Ventures Analysis, Inc. 5-18 2016 West Texas Sensitivity Study
7. Common Oil Price The use of a common oil price forecast by all parties providing load submittals should be institutionalized. Suggestions for accomplishing this item are included in the body of the report.
8. Infrastructure Unique and creative approaches should be examined for obtaining load submittals from midstream companies for these large and lumpy loads. A recent example of success in this area, because of prior outreach programs, is contained in the body of the report.
9. Load Submittals ERCOT should consider adding in an addendum to its current load submittal a request that focuses on obtaining additional information on infrastructure capacity requirements from large producers and EOR projects.
TDSPs and ERCOT should consider investing resources to develop a supplemental, high level model for West Texas load requirements that extends out for 10 years.
10. Coordinating Committee In order to advance and monitor the overall West Texas power planning process a small coordinating committee with representatives from each of the stakeholders should be formed and meet on a periodic basis. This coordinating committee could provide periodic assessments to the PUCT.

6-1
6. APPENDIX
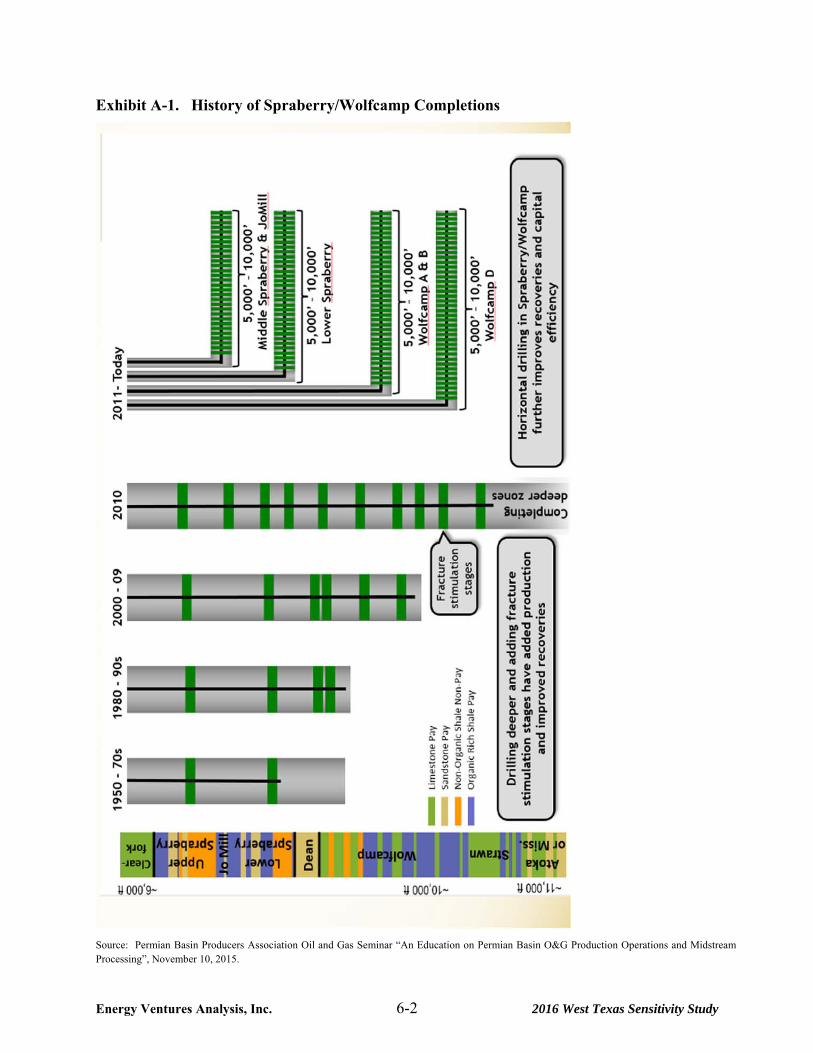
Energy Ventures Analysis, Inc. 6-2 2016 West Texas Sensitivity Study
Exhibit A-1. History of Spraberry/Wolfcamp Completions
Source: Permian Basin Producers Association Oil and Gas Seminar “An Education on Permian Basin O&G Production Operations and Midstream Processing”, November 10, 2015.

Energy Ventures Analysis, Inc. 6-3 2016 West Texas Sensitivity Study
Exhibit A-2. Midland Basin: Stacked Play Potential
Source: Permian Basin Producers Association Oil and Gas Seminar “An Education on Permian Basin O&G Production Operations and Midstream Processing”, November 10, 2015.

Energy Ventures Analysis, Inc. 6-4 2016 West Texas Sensitivity Study
Exhibit A-3. Proposed West Texas Map to Identify Future Small Producer Power Loads

Energy Ventures Analysis, Inc. 6-5 2016 West Texas Sensitivity Study
Exhibit A-4. Initial West Texas Map Submission For Company No. 1 – Part A
MIDLAND COUNTY MAP SUBMISSIONNote that lines do not neccesarially delinate the border of a block. Entire blocks are areas of uniform color and/or pattern.
Year
Section
HP/Load
Estimate
Load
Description
HP/Load
Estimate
Load
Description
HP/Load
Estimate
Load
Description
HP/Load
Estimate
Load
Description
HP/Load
Estimate
Load
Description
MD‐1
MD‐2
MD‐3
MD‐4
MD‐5
MD‐6
MD‐7
MD‐8
MD‐9 360 6 ‐ 60 hp 9005‐60 hp + 3‐
200 hp1560
6‐60 hp + 6‐
200 hp1500
5‐60 hp + 6‐
200 hp1500
5‐60 hp + 6‐
200 hp
MD‐10
MD‐11
MD‐12
MD‐13 400 2‐200 hp 800 4‐200 hp 800 4‐200 hp 800 4‐200 hp
MD‐14
MD‐15 720 12‐60 hp 272010‐200 hp +
12‐60 hp4720
20‐200 hp +
12‐60 hp4720
20‐200 hp +
12‐60 hp4720
20‐200 hp +
12‐60 hp
MD‐16
MD‐17
MD‐18
MD‐19
MD‐20 180 3‐60 hp 120 2‐60 hp 180 3‐60 hp 120 2‐60 hp 120 2‐60 hp
MD‐21 180 3‐60 hp 120 2‐60 hp 180 3‐60 hp 120 2‐60 hp 120 2‐60 hp
MD‐22 180 3‐60 hp 120 2‐60 hp 180 3‐60 hp 120 2‐60 hp 120 2‐60 hp
2016 2017 2018 2019 2020

Energy Ventures Analysis, Inc. 6-6 2016 West Texas Sensitivity Study
Exhibit A-5. Initial West Texas Map Submission For Company No. 1 – Part B
HOWARD COUNTY MAP SUBMISSIONNote that lines do not neccesarially delinate the border of a block. Entire blocks are areas of uniform color and/or pattern.
Year
SectionHP/Load
Estimate
Load
Description
HP/Load
Estimate
Load
Description
HP/Load
Estimate
Load
Description
HP/Load
Estimate
Load
Description
HP/Load
Estimate
Load
Description
HO‐1
HO‐2
HO‐3
HO‐4
HO‐5 14404‐60 hp + 6‐
200 hp1100
5‐60 hp + 4‐
200 hp3300
5‐60 hp + 15‐
200 hp3240
4‐60 hp + 15‐
200 hp1640
4‐60 hp + 7‐
200 hp
HO‐6
HO‐7
HO‐8
HO‐9 200 1‐200 hp 200 1‐200 hp 600 3‐200 hp 600 3‐200 hp 200 1‐200 hp
HO‐10
HO‐11
HO‐12
HO‐13
HO‐14 200 1‐200 hp 200 1‐200 hp 600 3‐200 hp 600 3‐200 hp 200 1‐200 hp
HO‐15
HO‐16 6404‐60 hp + 2‐
200 hp500
5‐60hp + 1‐
200hp1100
5‐60 hp + 4‐
200 hp1040
4‐60 hp + 4‐
200 hp640
4‐60 hp + 2‐
200 hp
HO‐17 6404‐60 hp + 2‐
200 hp500
5‐60hp + 1‐
200hp1100
5‐60 hp + 4‐
200 hp1040
4‐60 hp + 4‐
200 hp640
4‐60 hp + 2‐
200 hp
HO‐18
HO‐19
HO‐20
2016 2017 2018 2019 2020

Energy Ventures Analysis, Inc. 6-7 2016 West Texas Sensitivity Study
Exhibit A-6. Initial West Texas Map Submission For Company No. 1 – Part C
MARTIN COUNTY MAP SUBMISSIONNote that lines do not neccesarially delinate the border of a block. Entire blocks are areas of uniform color and/or pattern.
Year
SectionHP/Load
Estimate
Load
Description
HP/Load
Estimate
Load
Description
HP/Load
Estimate
Load
Description
HP/Load
Estimate
Load
Description
HP/Load
Estimate
Load
Description
MA‐1
MA‐2
MA‐3
MA‐4
MA‐5 180 3‐60 hp 180 3‐60 hp 240 4‐60 hp 180 3‐60 hp 180 3‐60 hp
MA‐6
MA‐7
MA‐8 200 1‐200 hp 200 1‐200 hp
MA‐9
MA‐10
MA‐11
MA‐12
MA‐13 100 1‐200 hp 100 1‐200 hp 400 2‐200 hp 400 2‐200 hp
MA‐14
MA‐15
MA‐16
MA‐17 200 1‐200 hp 200 1‐200 hp 200 1‐200 hp
MA‐18 180 3‐60 hp 180 3‐60 hp 240 4‐60 hp 180 3‐60 hp 180 3‐60 hp
MA‐19
MA‐20
MA‐21
MA‐22
MA‐23 400 2‐200 hp 400 2‐200 hp 1000 5‐200 hp 1000 5‐200 hp
MA‐24 400 2‐200 hp 400 2‐200 hp 1000 5‐200 hp 1000 5‐200 hp
MA‐25
MA‐26
MA‐27
2016 2017 2018 2019 2020

Energy Ventures Analysis, Inc. 6-8 2016 West Texas Sensitivity Study
Exhibit A-7. Initial West Texas Map Submission For Company No.2
CQ Acreage Horizontal Vertical 2016 2017 2018 2019 2020
MD 1 # Vertical Rigs 3 3 4 3 3
MD 2 # Horizontal Rigs 1.5 2 4 5 6
MD 3
MD 4 # Vertical Wells 60 60 80 60 60
MD 5 % Midland 50% 40% 40% 40% 40%
MD 6 % Martin 10% 10% 10% 10% 10%
MD 7 % Howard 20% 25% 20% 20% 20%
MD 8 % Glasscock 20% 25% 30% 30% 30%
MD 9 0.2 0.2
MD 10 # Horizontal 21 28 56 70 84
MD 11 % Midland 0% 50% 50% 40% 33%
MD 12 % Martin 25% 25% 0% 20% 17%
MD 13 0.1 % Howard 50% 25% 50% 40% 17%
MD 14 % Glasscock 25% 0% 0% 0% 33%
MD 15 0.7 0.5
MD 16 #60 HP Motors
MD 17 Midland 30 24 32 24 24
MD 18 Martin 6 6 8 6 6
MD 19 Howard 12 15 16 12 12
MD 20 0.1 Glasscock 12 15 24 18 18
MD 21 0.1
MD 22 0.1 #200 HP Motors
MA 1 Midland 0 14 28 28 28
MA 2 Martin 5 7 0 14 14
MA 3 Howard 11 7 28 28 14
MA 4 Glasscock 5 0 0 0 28
MA 5
MA 6 Total HP
MA 7 Midland 1,800 4,240 7,520 7,040 6,984
MA 8 0.0 0.5 Martin 1,410 1,760 480 3,160 3,216
MA 9 Howard 2,820 2,300 6,560 6,320 3,576
MA 10 Glasscock 1,770 900 1,440 1,080 6,624
MA 11
MA 12
MA 13 0.2
MA 14
MA 15
MA 16
MA 17 0.1
MA 18 0.5
MA 19
MA 20
MA 21
MA 22
MA 23 0.3
MA 24 0.3
MA 25
MA 26
MA 27
HO 1
HO 2
HO 3
HO 4
HO 5 11.0 0.3
HO 6
HO 7
HO 8
HO 9 2.0
HO 10
HO 11
HO 12
HO 13
HO 14 2.0
HO 15
HO 16 3.0 0.3
HO 17 3.0 0.3
HO 18
HO 19
HO 20

Energy Ventures Analysis, Inc. 6-9 2016 West Texas Sensitivity Study
Exhibit A-8. Recent West Texas Oil Rig County by Operator
Name Rig Count Name Rig Count
Parsley Energy 15 US Energy Dev 2
Chevron 11 Ajax Resources 1
XTO 11 Arris Operating 1
Cimarex Energy 7 Centennial Resource 1
Encana 7 Cinnabar Operating 1
Anadarko 6 Discovery 1
COG Operating 6 East Reddin 1
Pioneer 6 Element Petroleum 1
Shell 5 Elevation Resources 1
Apache 4 Fasken Oil 1
Diamondback 4 FDL Operating 1
OXY 4 Great Western 1
Crownquest 3 High Roller 1
EOG Resources 3 High Sky Partners 1
J. Cleo Thompson 3 JPM EOC 1
Ladero Petroleum 3 Kinder Morgan 1
RKI Exp 3 King Operating 1
Am. Energy 2 Manti Tarka 1
BHP Billiton 2 Mercury Operating 1
Callon Petroleum 2 Mewbourne 1
Endeavor 2 Panther Exp 1
EXL Petroleum 2 Prime Operating 1
Jagged Peak 2 Resolute 1
Matador Production 2 Ring Energy 1
QEP Energy 2 Rosetta Resources 1
RSP Permian 2 RP Operating 1
Silver hill 2 Saga Petroleum 1
SM Energy 2 Trinity EOR 1
Summit Petroleum 2

Energy Ventures Analysis, Inc. 6-10 2016 West Texas Sensitivity Study
Exhibit A-9. West Texas Oil/Gas Pipelines

Energy Ventures Analysis, Inc. 6-11 2016 West Texas Sensitivity Study
Exhibit A-10. MidStream Monitor – April 22, 2016

Energy Ventures Analysis, Inc. 6-12 2016 West Texas Sensitivity Study
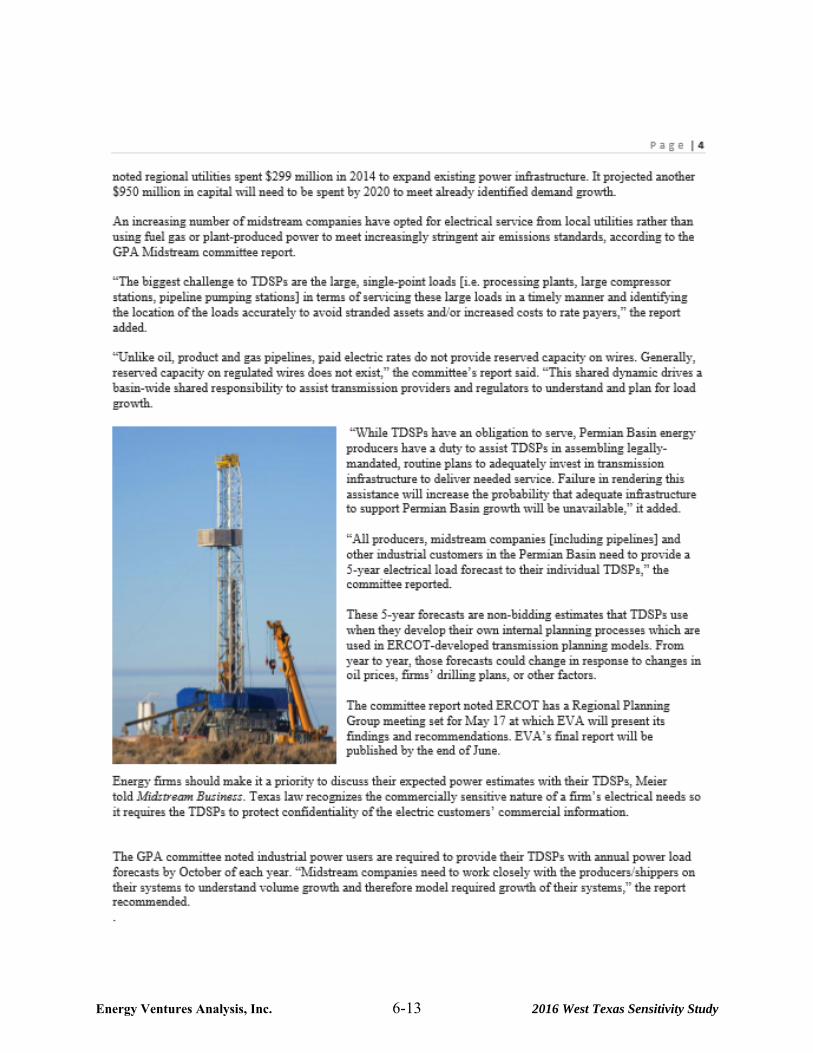
Energy Ventures Analysis, Inc. 6-13 2016 West Texas Sensitivity Study

Energy Ventures Analysis, Inc. 6-14 2016 West Texas Sensitivity Study
Exhibit 4-11A. Heat Maps for Load Transmission Examples In Chapter 4(1)
(1) Units are MVA. Source: May 2016 Meeting of PBPA.

Energy Ventures Analysis, Inc. 6-15 2016 West Texas Sensitivity Study
Exhibit 4-11B. Heat Maps for Load Transmission Examples In Chapter 4(1)
(1) Units are MVA. Source: May 2016 Meeting of PBPA.