winthrop university board of trustees 2000-2001
TRANSCRIPT
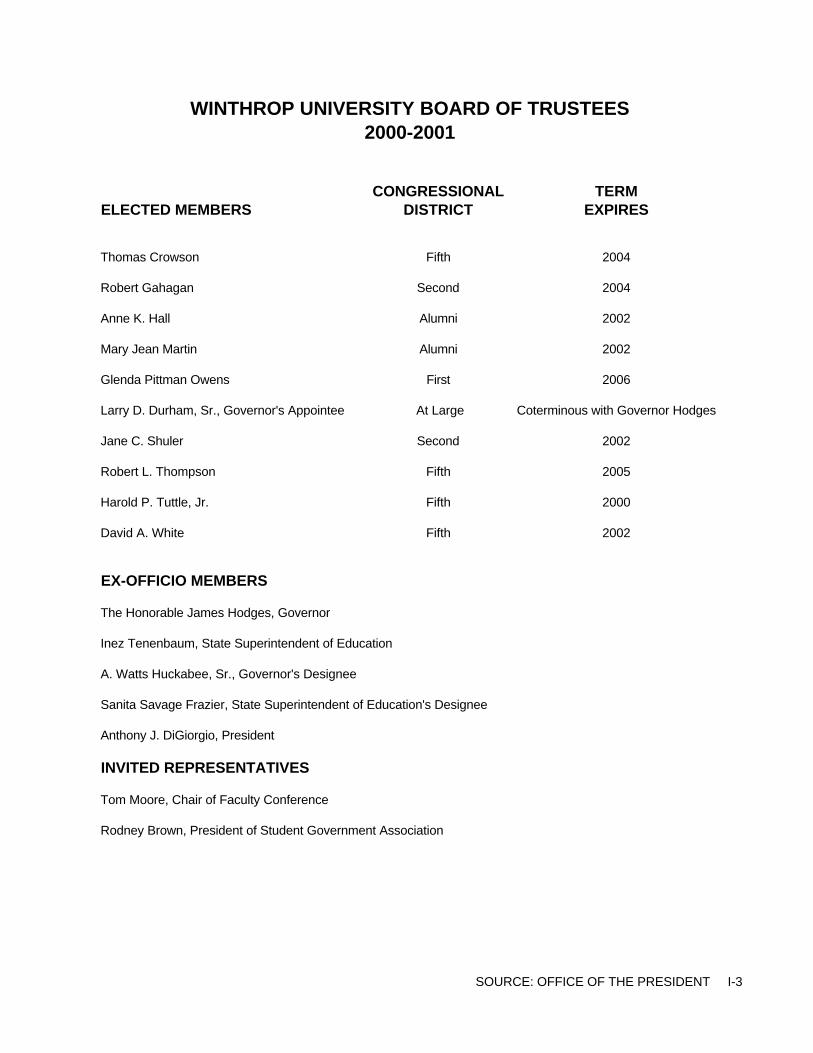
WINTHROP UNIVERSITY BOARD OF TRUSTEES2000-2001
CONGRESSIONAL TERMELECTED MEMBERS DISTRICT EXPIRES
Thomas Crowson Fifth 2004
Robert Gahagan Second 2004
Anne K. Hall Alumni 2002
Mary Jean Martin Alumni 2002
Glenda Pittman Owens First 2006
Larry D. Durham, Sr., Governor's Appointee At Large Coterminous with Governor Hodges
Jane C. Shuler Second 2002
Robert L. Thompson Fifth 2005
Harold P. Tuttle, Jr. Fifth 2000
David A. White Fifth 2002
EX-OFFICIO MEMBERS
The Honorable James Hodges, Governor
Inez Tenenbaum, State Superintendent of Education
A. Watts Huckabee, Sr., Governor's Designee
Sanita Savage Frazier, State Superintendent of Education's Designee
Anthony J. DiGiorgio, President
INVITED REPRESENTATIVES
Tom Moore, Chair of Faculty Conference
Rodney Brown, President of Student Government Association
SOURCE: OFFICE OF THE PRESIDENT I-3

WINTHROP UNIVERSITY
Boardof Trustees
Office of thePresident
Internal Executive
Audit Assistant
Public UniversityAffairs Events
University Finance & Academic Student
Advancement Business Affairs Life
Capital Campus Planning College of College of Residence Dean ofDevelopment Winthrop Projects and Design Arts & Sciences Business Life Students
FoundationFacilities College of Visual Richard W. Riley Dining Student
Alumni Alumni Management Post Office & Performing Arts College of Education Services DevelopmentRelations Association
Human Resources Library Public Student & Affirmative Action Graduate Studies Services Safety Activities
Grants
Procurement & International Institutional Career
University Risk Management Center Research Bookstore Services
Relations
Conference Health and EnrollmentPrinting Center Counseling Services ManagementServices
Rec/Registration
Admissions
FinancialResource Center
Associate Vice
President
ORGANIZATIONAL CHART 2000 - 2001
InformationTechnology
Effective Teaching
Honors
IntercollegiateAthletics
Budgeting
Financial Accounting
Assessment
Office For
November 2000

WINTHROP UNIVERSITY STRATEGIC PLAN MISSION STATEMENT Building on its origins as a women’s college and its history as a teacher preparation institution, Winthrop University has broadened its mission and has achieved national recognition as a competitive and distinctive, public, residential comprehensive teaching institution that aspires to be among the very best institutions of its type in the nation. The University provides personalized and challenging undergraduate, graduate, and continuing professional education programs of national caliber. All eligible bachelor, masters and specialist degrees in the liberal arts and sciences, education, business and the visual and performing arts are nationally accredited. Winthrop enrolls an achievement-oriented, culturally diverse and socially responsible student body of 5,500 students and will remain a medium-sized comprehensive teaching university of between 5,000 and 7,000 students for the foreseeable future. The University recruits South Carolina’s best students as well as highly qualified students from beyond the state whose presence adds diversity and enrichment to the campus and state. Winthrop prides itself on being an institution of choice for groups traditionally under-represented on the college campus. Winthrop’s historic campus, located in a growing city within a major metropolitan area, provides a contemporary and supportive environment that promotes student learning and development. Winthrop has a diverse faculty and professional staff of national caliber and supports their work as effective teachers, scholars, researchers, practitioners, and creative artists. Through this talented group, Winthrop students acquire and develop knowledge, skills, and values which enrich their lives and prepare them to meet the needs and challenges of the contemporary world, including the ability to communicate effectively appreciate diversity, work collaboratively, synthesize knowledge, and adapt to change. Ongoing assessment of programs, and services, ensures both that all academic programs challenge students at their highest level of ability and that the library, instructional technology and other academic service areas support courses of study that are consonant with current methods and knowledge. As a result, Winthrop graduates are eminently well-prepared to assume successful careers in business, industry, government education, the arts, and human services, as well as to enter the most competitive graduate or professional schools. Adopted by the Winthrop University Board of Trustees, June 12, 1998. I-1

STATEMENTS ON ACCREDITATION
Winthrop's academic programs are measured by national standards of quality. WinthropUniversity is accredited by the Commission on Colleges of the Southern Association of Collegesand Schools (1866 Southern Lane, Decatur, Georgia 30033-4097: Telephone number 404-679-4501) to award bachelor's, masters and specialists degrees. Winthrop was last accredited in 1991.
Winthrop offers over 60 academic programs and all of those eligible for national specialized accreditation have received this distinction.
Individual programs are accredited by the following specialized agencies: Accrediting Council on Education in Journalism and Mass Communications (ACEJMC) Association of Graduate Liberal Studies Programs (AGLSP) Commission on Accredited/Approved Dietetics Education (CAADE) Computing Science Accreditation Board (CSAB) Council on Social Work Education (CSWE) Foundation for Interior Design Education Research (FIDER) AACSB - International Association for Management Education (AACSB) National Association of the Education of Young Children (NAEYC) National Association of Schools of Art and Design (NASAD) National Association of Schools of Dance (NASD) National Association of Schools of Music (NASM) National Association of School Psychologists (NASP) National Association of Schools of Theatre (NAST) National Council for the Accreditation of Teacher Education (NCATE)
Documents on accreditation reside in the Office of the President.
I-2

FRESHMEN APPLICATIONS, ACCEPTANCES, ENROLLMENTS FALL 1990 - FALL 2000
YEAR 1990 1991 1992 1993 1994 1995 1996 1997 1998 1999 2000
Applications 2,153 1,334 2,181 2,320 2,261 2,403 2,406 2,662 2,651 3,014 2,969
Acceptances 1,367 1,080 1,576 1,805 1,720 2,064 2,104 2,130 2,019 2,261 2,163Acceptances as % of Applied 63.5% 81.0% 72.3% 77.8% 76.1% 85.9% 87.4% 80.0% 76.2% 75.0% 72.9%
Enrolled 622 662 805 769 744 878 819 912 836 971 907Enrolled as % of Accepted 45.5% 61.3% 51.1% 42.6% 43.3% 42.5% 38.9% 42.8% 41.4% 42.9% 41.9%
0
500
1,000
1,500
2,000
2,500
3,000
3,500
# of
Stu
dent
s
1990 1991 1992 1993 1994 1995 1996 1997 1998 1999 2000Enrolled
Year
FRESHMEN APPLICATIONS, ACCEPTANCES,ENROLLMENTS
FALL 1990 - FALL 2000
EnrolledAcceptedApplied
SOURCE: OFFICE OF ADMISSIONS AND INSTITUTIONAL RESEARCH II-1

FIRST-TIME FRESHMEN CLASS PROFILEFALL 2001
GENDER Winthrop SCHOOL Winthrop
# Percent BACKGROUND # Percent
Male 242 27.2% S.C. High School #DIV/0!Female 649 72.8% Out-of-State H.S./GED #DIV/0!
Foreign H.S./GED #DIV/0!Total 891 100.0% S.C. GED #DIV/0!
Home School #DIV/0!RACE Winthrop Unknown High School #DIV/0!
Male Female Total PercentTotal 0 #DIV/0!
International 1 2 3 0.3%Black (Non-Hispanic) 51 182 233 26.2% ENROLLMENT Winthrop
Native American 0 1 1 0.1% STATUS Male Female Total Percent
Asian / Pacific Islander 3 5 8 0.9%Hispanic 2 7 9 1.0% Full-Time 241 647 888 99.7%White (Non-Hispanic) 183 449 632 70.9% Part-Time 1 2 3 0.3%Unknown 2 3 5 0.6%
Total 242 649 891 100.0%Total 242 649 891 100.0%
RESIDENCY Winthrop
HIGH SCHOOL Winthrop Male Female Total Percent
CLASS RANK # Percent Cum. %
South Carolina Residents 205 571 776 87.1%Top Tenth 161 19.0% 19.0% Non-S.C. Residents 37 78 115 12.9%Second Tenth 180 21.3% 40.3%Top Quarter 0.0% 0.0% Total 242 649 891 100.0%Third Tenth 171 20.2% 60.5%Fourth Tenth 136 16.1% 76.6% UNIVERSITY Winthrop Freshmen
Fifth Tenth 88 10.4% 87.0% HOUSING Male Female Total Percent
Bottom 50% 110 13.0% 100.0%
Subtotal 846 100% University Residences 0 #DIV/0!
Unknown 46 5.2% Off Campus 0 #DIV/0!
Total 892 Total 0 0 0 #DIV/0!
Preliminary
II-2 SOURCE: INSTITUTIONAL RESEARCH

ENROLLMENT 1997 1998 1999 2000STATUS Winthrop SC Winthrop SC Winthrop SC Winthrop SC
# Percent SC Total Percent # Percent SC Total Percent # Percent SC Total Percent # Percent SC Total Percent
Full-Time 909 99.7% 11,775 97.2% 826 98.8% 12,429 98.1% 966 99.5% 12,521 98.5% 902 99.6%Part-Time 3 0.3% 334 2.8% 10 1.2% 236 1.9% 5 0.5% 188 1.5% 4 0.4%
Total 912 100.0% 12,109 100.0% 836 100.0% 12,665 100.0% 971 100.0% 12,709 100.0% 906 100.0%
GENDER 1997 1998 1999 2000Winthrop SC Winthrop SC Winthrop SC Winthrop SC
# Percent SC Total Percent # Percent SC Total Percent # Percent SC Total Percent # Percent SC Total Percent
Male 249 27.3% 5,410 44.8% 238 28.5% 5,600 44.2% 246 25.3% 5,539 43.6% 261 28.8%Female 663 72.7% 6,674 55.2% 598 71.5% 7,065 55.8% 725 74.7% 7,170 56.4% 645 71.2%
Total 912 100.0% 12,084 100.0% 836 100.0% 12,665 100.0% 971 100.0% 12,709 100.0% 906 100.0%
RACE 1997 1998 1999 2000Winthrop SC Winthrop SC Winthrop SC Winthrop SC
# Percent SC Total Percent # Percent SC Total Percent # Percent SC Total Percent # Percent SC Total Percent
International 7 0.8% 135 1.1% 9 1.1% 151 1.2% 19 2.0% 179 1.4% 19 2.1%Black (Non-Hispanic) 206 22.6% 2,157 17.9% 200 23.9% 2,462 19.4% 231 23.8% 2,445 19.2% 216 23.8%Native American 3 0.3% 23 0.2% 5 0.6% 27 0.2% 5 0.5% 28 0.2% 0 0.0%Asian / Pacific Islander 14 1.5% 187 1.5% 9 1.1% 193 1.5% 15 1.5% 202 1.6% 3 0.3%Hispanic 10 1.1% 151 1.2% 8 1.0% 159 1.3% 6 0.6% 146 1.1% 12 1.3%White (Non-Hispanic) 672 73.7% 9,368 77.5% 605 72.4% 9,600 75.8% 695 71.6% 9,642 75.9% 656 72.4%Unknown 0 0.0% 63 0.5% 0 0.0% 73 0.6% 0 0.0% 67 0.5% 0 0.0%
Total 912 100.0% 12,084 100.0% 836 100.0% 12,665 100.0% 971 100.0% 12,709 100.0% 906 100.0%
RESIDENCY 1997 1998 1999 2000Winthrop SC Winthrop SC Winthrop SC Winthrop SC
# Percent SC Total Percent # Percent SC Total Percent # Percent SC Total Percent # Percent SC Total Percent
South Carolina Residents 776 85.1% 8,519 70.4% 751 89.8% 8,945 70.6% 850 87.5% 8,892 70.0% 784 86.5%Non-S.C. Residents 136 14.9% 3,590 29.6% 85 10.2% 3,720 29.4% 121 12.5% 3,817 30.0% 122 13.5%
Total 912 100.0% 12,109 100.0% 836 100.0% 12,665 100.0% 971 100.0% 12,709 100.0% 906 100.0%Note: SC figures refer to first-time freshmen at all S.C. Public 4-Year Institutions.
FIRST-TIME FRESHMEN CLASS PROFILEFALL 1997 - FALL 2000
SOURCE: INSTITUTIONAL RESEARCH AND CHE

FIRST-TIME FRESHMEN CLASS PROFILEFALL 1997 - FALL 2000
(Continued)
HIGH SCHOOL 1997 1998 1999 2000SENIOR CLASS RANK # Percent Cum. % # Percent Cum. % # Percent Cum. % # Percent Cum. %
Top Tenth 217 25.1% 25.1% 179 22.7% 22.7% 220 24.4% 24.4% 218 25.9% 25.9%Second Tenth 209 24.2% 49.2% 171 21.6% 44.3% 192 21.3% 45.7% 180 21.4% 47.2%Top Quarter 479 55.4% 55.4% 433 54.8% 54.8% 495 54.9% 55.1% 486 57.7%Third Tenth 150 17.3% 66.6% 145 18.4% 62.7% 171 19.0% 64.7% 155 18.4% 65.6%Fourth Tenth 118 13.6% 80.2% 124 15.7% 78.4% 129 14.3% 79.0% 119 14.1% 79.7%Fifth Tenth 97 11.2% 91.4% 85 10.8% 89.1% 93 10.3% 89.3% 91 10.8% 90.5%Bottom 50% 74 8.6% 100.0% 86 10.9% 100.0% 96 10.7% 100.0% 80 9.5% 100.0%
Subtotal 865 100.0% 790 100.0% 901 100.0% 843 100.0%
Unknown 47 5.2% 46 5.5% 70 7.2% 63 7.0%
Total 912 836 971 906
SCHOOL 1997 1998 1999 2000BACKGROUND Winthrop SC Winthrop SC Winthrop SC Winthrop SC
# Percent SC Total Percent # Percent SC Total Percent # Percent SC Total Percent # Percent SC Total Percent
S.C. High School 765 83.9% 8,228 67.9% 735 87.9% 8,643 68.2% 834 85.9% 8,598 67.7% 761 84.0%Out-of-State H.S./GED 140 15.4% 3,649 30.1% 87 10.4% 3,747 29.6% 118 12.2% 3,794 29.9% 124 13.7%Foreign H.S./GED 6 0.7% 132 1.1% 11 1.3% 163 1.3% 16 1.6% 198 1.6% 15 1.7%S.C. GED 0 0.0% 8 0.1% 1 0.1% 2 0.0% 2 0.2% 7 0.1% 2 0.2%Home School 1 0.1% 1 0.0% 1 0.1% 2 0.0% 1 0.1% 2 0.0% 4 0.4%Unknown High School 0 0.0% 91 0.8% 1 0.1% 108 0.9% 0 0.0% 110 0.9% 0 0.0%
Total 912 100.0% 12,109 100.0% 836 100.0% 12,665 100.0% 971 100.0% 12,709 100.0% 906 100.0%Note: SC figures refer to first-time freshmen at all S.C. Public 4-Year Institutions.
SOURCE: INSTITUTIONAL RESEARCH AND CHE

FIRST-TIME ENTERING FRESHMEN
FALL 1991 - FALL 2000
99-001991 1992 1993 1994 1995 1996* 1997* 1998* 1999* 2000* % Diff Diff
Total 1st-Time Freshmen 662 805 769 744 878 819 912 836 971 907 -6.6% -64
Winthrop's Average including provisionals, internationals, and age 22 & olderCOMBINED SAT 944 974 986 989 963 1051 1039 1043 1042 1056 1.3% 14Verb 453 469 470 471 462 530 528 526 525 532 1.3% 7Math 491 505 516 518 501 521 511 517 517 524 1.4% 7# students w/ SAT 557 716 648 582 671 721 803 742 822 763 -7.2% -59% 1st-Time Freshmen 84.1% 88.9% 84.3% 78.2% 76.4% 88.0% 88.0% 88.8% 84.7% 84.1% -0.6% 0
ACT 18 18 18 18 19 22 20 21 23 22 -4.3% -1# students w/ ACT 94 80 112 147 192 81 105 84 138 135 -2.2% -3% 1st-Time Freshmen 14.2% 9.9% 14.6% 19.8% 21.9% 9.9% 11.5% 10.0% 14.2% 14.9% 4.7% 0
# with no SAT or ACT Score 11 9 9 15 15 17 4 10 11 9 -18.2% -21.7% 1.1% 1.2% 2.0% 1.7% 2.1% 0.4% 1.2% 1.1% 1.0% -12.4% 0
State Average SAT 832 831 838 838 844 954 953 951 954 966 1.3% 12
National Average SAT 896 899 902 902 910 1013 1016 1017 1016 1019 0.3% 3
* The use of SAT or ACT scores for admission to Winthrop for all new freshmen is based on the highest score of the two tests.Note: State and National averages obtained from College Board. In 1996 the College Board recentered the SAT. The scores in the 1996-00 columns should not be compared with figures from previous years.
II - 5 SOURCE: INSTITUTIONAL RESEARCH

SOUTH CAROLINA HIGH SCHOOLSWHICH CONTRIBUTED TEN OR MORE STUDENTSTO WINTHROP'S FRESHMAN CLASS IN ONE YEAR
FALL 1996 - FALL 2000
Enrolled Enrolled Enrolled Enrolled Enrolled 5 YearS.C. High School of Graduation Fall 96 Fall 97 Fall 98 Fall 99 Fall 00 Total
Northwestern 28 31 32 42 38 171Fort Mill 27 25 37 25 29 143Rock Hill 28 14 20 24 23 109Irmo 14 27 22 15 18 96Sumter 13 14 13 31 12 83Clover 17 15 16 22 11 81Lexington 11 10 18 20 18 77Mauldin 18 14 10 14 16 72York Comprehensive 16 12 7 15 15 65Dutch Fork 11 10 2 22 14 59Lancaster 7 14 14 11 10 56Summerville 6 7 12 17 11 53Paul M. Dorman 8 10 8 12 13 51Spring Valley 10 14 10 8 7 49Chester 8 13 6 13 7 47Stratford 5 9 15 7 8 44Spartanburg 12 7 9 10 5 43North Augusta 8 11 9 11 4 43Richland Northeast 7 12 6 8 7 40Cheraw 13 2 10 4 10 39Wando 7 7 6 7 12 39Hartsville 1 5 14 7 8 35Lugoff-Elgin 2 6 3 18 6 35Hillcrest 4 6 7 10 7 34Wade Hampton 1 9 9 2 11 32Camden 2 12 4 9 4 31Fort Dorchester 3 10 4 10 4 31Dreher 4 5 3 6 13 31Greenwood 5 10 6 3 6 30Laurens 4 4 6 5 10 29Orangeburg-Wilkinson 3 6 3 5 12 29Beaufort 4 10 3 3 7 27Conway 3 6 12 4 1 26Lower Richland 4 2 4 3 10 23Eastside 6 0 0 1 10 17
II-6 SOURCE: INSTITUTIONAL RESEARCH

FIRST-TIME FRESHMEN ENROLLMENT BY MAJORFALL 1996 - FALL 2000
% OF 5COLLEGE / DEGREE PROGRAMS 1996 1997 1998 1999 2000 YEAR 99 TO 00 96 TO 00
TOTAL % DIFF. % DIFF.
ARTS & SCIENCES 281 334 300 344 338 34.0% -1.7% 20.3%Biology 71 74 76 78 95 8.3% 21.8% 33.8%Chemistry 9 12 15 9 7 1.1% -22.2% -22.2%English 31 28 29 17 19 2.9% 11.8% -38.7%General Communication Disorders * 20 15 16 7 1.3% -56.3% N/AHistory 13 17 15 27 14 2.0% -48.1% 7.7%Human Nutrition 6 11 8 3 11 0.7% 266.7% 83.3%Integrated Marketing Communication * 8 8 18 15 1.1% -16.7% N/AMass Communication 25 39 44 44 67 4.1% 52.3% 168.0%Mathematics (B.A.) 1 3 4 2 1 0.5% -50.0% 0.0%Mathematics (B.S.) 18 14 8 9 10 1.5% 11.1% -44.4%Medical Technology 2 3 3 2 1 0.3% -50.0% -50.0%Modern Languages 7 13 6 11 6 1.0% -45.5% -14.3%Philosophy & Religious Studies 0 1 1 1 1 0.1% 0.0% 100.0%Political Science 30 27 17 30 24 2.7% -20.0% -20.0%Psychology 37 48 31 49 50 4.5% 2.0% 35.1%Science Communications 2 0 0 1 0 0.1% -100.0% -100.0%Social Work 12 8 10 12 4 1.1% -66.7% -66.7%Sociology 7 8 10 15 6 1.0% -60.0% -14.3%Speech 10 0 ** ** ** 0.2% N/A N/A
BUSINESS ADMINISTRATION 168 182 161 208 201 19.0% -3.4% 19.6%Business Administration 136 151 134 139 126 14.9% -9.4% -7.4%Computer Science 32 23 19 39 45 3.1% 15.4% 40.6%Integrated Marketing Communication * 8 8 18 15 1.1% -16.7% N/ASport Management * * * 12 15 0.3% 25.0% N/A
EDUCATION 154 150 146 194 153 18.0% -21.1% -0.6%Business Education 3 1 2 0 0 0.2% 0.0% -100.0%Early Childhood Education 35 28 27 57 41 4.3% -28.1% 17.1%Elementary Education 71 80 80 97 83 9.1% -14.4% 16.9%Home Economics 0 1 ** ** ** 0.0% N/A N/AFamily & Consumer Science (HEED) 0 0 1 1 0 0.0% -100.0% 0.0%Physical Education 8 12 12 7 5 1.1% -28.6% -37.5%Special Education 37 28 24 20 9 3.0% -55.0% -75.7%Sport Management * * * 12 15 0.3% 25.0% N/A
VISUAL & PERFORMING ARTS 111 151 132 124 129 14.0% 4.0% 16.2%Art (B.A.) 15 21 21 23 34 2.7% 47.8% 126.7%Art (B.F.A.) 29 63 50 39 26 4.4% -33.3% -10.3%Art History (B.A.) 1 1 0 1 2 0.1% 100.0% 100.0%Dance 7 8 9 6 5 0.8% -16.7% -28.6%Music (B.A.) 13 7 9 11 8 0.9% -27.3% -38.5%Music Education (Choral) 7 8 8 7 12 1.0% 71.4% 71.4%Music Education (Instrumental) 14 18 17 13 15 1.6% 15.4% 7.1%Music (Performance) 12 4 1 7 7 0.6% 0.0% -41.7%Theatre 13 21 17 17 20 1.8% 17.6% 53.8%
PRE-MAJOR 106 105 107 131 116 12.2% -11.5% 9.4%
INTERDISCIPLINARY MAJORS * 8 8 30 30 1.0% 0.0% N/AIntegrated Marketing Communication * 8 8 18 15 1.1% -16.7% N/ASport Management * * * 12 15 0.3% 25.0% N/A* New program** Discontinued program
SOURCE: INSTITUTIONAL RESEARCH II-7

HEADCOUNT ENROLLMENT OF TRANSFERS AT WINTHROP BY S.C. INSTITUTIONS OF PREVIOUS ENROLLMENT
FALL 1996 - FALL 2000
Enrolled Enrolled Enrolled Enrolled Enrolled 5 Year %FICE TECHNICAL COLLEGES Fall 96 Fall 97 Fall 98 Fall 99 Fall 00 of Total
003996 York 75 65 88 76 84 60.3%003991 Greenville 7 14 15 18 11 10.1%003993 Midlands 13 5 12 16 30 11.8%004920 Trident - Palmer 0 0 0 8 5 2.0%008818 Trident 9 8 6 0 0 3.6%007602 Chesterfield-Marlboro 2 3 2 3 5 2.3%003994 Spartanburg 1 2 4 2 2 1.7%004926 Tri-County 1 5 1 4 5 2.5%003992 Piedmont 0 2 0 3 4 1.4%003995 Central Carolina 3 0 0 0 0 0.5%003990 Florence-Darlington 1 3 1 3 1 1.4%006815 Orangeburg-Calhoun 0 2 0 0 2 0.6%010056 Aiken 0 0 1 0 0 0.2%005363 Denmark 0 0 0 0 0 0.0%004925 Horry-Georgetown 1 0 1 1 5 1.2%009910 Tech. College of Low Country 0 0 0 0 0 0.0%009932 Williamsburg 0 2 0 0 0 0.3%
Subtotal 113 111 131 134 154 100.0%
Enrolled Enrolled Enrolled Enrolled Enrolled 5 Year %FICE PUBLIC SR COLLEGE & UNIV Fall 96 Fall 97 Fall 98 Fall 99 Fall 00 of Total
003453 USC-Lancaster 17 19 22 22 16 26.7%003448 USC-Columbia 14 11 14 12 13 17.8%003425 Clemson 3 8 7 7 6 8.6%009226 Francis Marion 2 1 5 1 8 4.7%006951 USC-Spartanburg 9 3 4 7 4 7.5%003435 Lander 6 1 6 3 4 5.6%012112 USC-Sumter 2 0 2 1 6 3.1%003428 College of Charleston 3 7 4 7 8 8.1%003451 Coastal Carolina 4 1 2 5 5 4.7%003446 S.C. State 3 0 5 3 2 3.6%003450 USC-Beaufort 2 1 3 1 1 2.2%003449 USC-Aiken 5 1 2 3 1 3.3%004927 USC-Union 2 2 2 1 1 2.2%003423 The Citadel 0 1 0 1 0 0.6%003454 USC-Salkehatchie 0 0 0 2 2 1.1%003438 Medical University of S.C. 0 0 0 0 0 0.0%
Subtotal 72 56 78 76 77 100.0%

HEADCOUNT ENROLLMENT OF TRANSFERS AT WINTHROP BY S.C. INSTITUTIONS OF PREVIOUS ENROLLMENT
FALL 1996 - FALL 200 (continued)
Enrolled Enrolled Enrolled Enrolled Enrolled 5 Year %FICE PRIVATE SR COLLEGES & UNIV Fall 96 Fall 97 Fall 98 Fall 99 Fall 00 of Total
003447 Spartanburg Methodist 10 12 8 6 16 31.0%003418 Anderson 3 2 5 4 2 9.5%003441 North Greenville 0 4 0 2 2 4.8%003430 Columbia 4 2 0 1 6 7.7%003440 Newberry 1 2 4 0 1 4.8%003445 Presbyterian 0 2 1 1 1 3.0%003419 Charleston Southern (Baptist) 3 1 5 2 3 8.3%003420 Benedict 0 2 2 1 1 3.6%003431 Converse 1 3 2 1 2 5.4%003432 Erskine 2 3 0 0 0 3.0%003436 Limestone 0 0 2 3 2 4.2%003439 Morris 3 3 2 0 2 6.0%003434 Furman 0 1 0 0 3 2.4%003422 Central Wesleyan 0 0 0 0 0 0.0%003427 Coker 0 0 0 1 0 0.6%003424 Claflin 0 0 0 0 3 1.8%003457 Wofford 0 1 0 2 1 2.4%003429 Columbia Bible 0 0 0 0 0 0.0%003421 Bob Jones 0 0 0 0 0 0.0%003417 Allen 0 1 1 0 0 1.2%003455 Voorhees 0 0 0 0 1 0.6%
Subtotal 27 39 32 24 46 100.0%
Enrolled Enrolled Enrolled Enrolled Enrolled 5 Year %SUMMARY Fall 96 Fall 97 Fall 98 Fall 99 Fall 00 of Total
Technical Colleges 113 111 131 134 154 37.0%Public Sr Colleges & Univ. 72 56 78 76 77 20.7%Private Sr Colleges & Univ. 27 39 32 24 46 9.7%Out-of-State 100 107 110 123 127 32.6%
Total 312 313 351 357 404 100.0%

HEADCOUNT ENROLLMENT OF FIRST-YEAR GRADUATE STUDENTS AT WINTHROP
BY S.C. INSTITUTIONS OF PREVIOUS ENROLLMENT FALL 1996 - FALL 2000
Enrolled Enrolled Enrolled Enrolled Enrolled 5 Year % 5 Year %FICE PUBLIC SR COLLEGE & UNIV Fall 96 Fall 97 Fall 98 Fall 99 Fall 00 SC Public of Total
003425 Clemson 13 6 0 4 8 8.1% 3.6%003451 Coastal Carolina 7 5 7 5 4 7.3% 3.2%003428 College of Charleston 3 1 3 3 3 3.4% 1.5%009226 Francis Marion 1 3 0 3 2 2.4% 1.0%003435 Lander 1 3 1 4 1 2.6% 1.2%003438 Medical University of S.C. 1 0 0 0 2 0.8% 0.3%003446 S.C. State 5 1 2 2 6 4.2% 1.8%003423 The Citadel 0 2 0 2 3 1.8% 0.8%003449 USC-Aiken 1 0 0 0 0 0.3% 0.1%003448 USC-Columbia 13 18 8 6 10 14.4% 6.3%006951 USC-Spartanburg 2 0 2 1 3 2.1% 0.9%003456 Winthrop 43 43 45 39 31 52.6% 23.2%
Subtotal 90 82 68 69 73 100.0% 44.0%
Enrolled Enrolled Enrolled Enrolled Enrolled 5 Year % 5 Year % FICE PRIVATE SR COLLEGE & UNIV Fall 96 Fall 97 Fall 98 Fall 99 Fall 00 SC Private of Total
003418 Anderson College 0 0 0 0 1 1.8% 0.1%003420 Benedict 0 1 0 0 0 1.8% 0.1%003421 Bob Jones 1 0 0 1 1 5.3% 0.3%003419 Charleston Southern 0 1 0 1 0 3.5% 0.2%003424 Claflin 0 0 0 1 0 1.8% 0.1%003427 Coker 3 0 1 0 0 7.0% 0.5%003430 Columbia 2 3 0 0 0 8.8% 0.6%003431 Converse 1 0 1 1 1 7.0% 0.5%003432 Erskine 1 2 2 0 2 12.3% 0.8%003434 Furman 1 1 0 0 0 3.5% 0.2%003436 Limestone 5 0 1 1 1 14.0% 0.9%003439 Morris 0 0 0 0 1 1.8% 0.1%003440 Newberry 0 0 0 2 2 7.0% 0.5%003445 Presbyterian 3 2 0 0 1 10.5% 0.7%003422 Southern Wesleyan 1 1 0 0 0 3.5% 0.2%003457 Wofford 1 0 2 2 1 10.5% 0.7%
Subtotal 19 11 7 9 11 100.0% 6.6%
SUMMARY
Enrolled Enrolled Enrolled Enrolled Enrolled 5 Year %SUMMARY Fall 96 Fall 97 Fall 98 Fall 99 Fall 00 of Total
Public Senior Colleges & Univ. 90 82 68 69 73 44.0%Private Senior Colleges & Univ. 19 11 7 9 11 6.6%Out-of-State 101 80 98 67 83 49.4%
Total 210 173 173 145 167 100.0%NOTE: Only students classified as fully-admitted, degree-seeking students are counted.
II-10 SOURCE: INSTITUTIONAL RESEARCH

HEADCOUNT ENROLLMENTBY GENDER, LEVEL & FULL/PART TIME
FALL 2000
2000LEVEL Male Female Total
Full-Time Undergraduate 1,244 2,788 4,032Part-Time Undergraduate 181 437 618Subtotal 1,425 3,225 4,650
Full-Time Graduate 117 172 289Part-Time Graduate 234 889 1,123Subtotal 351 1,061 1,412
Grand Total 1,776 4,286 6,062
HEADCOUNT ENROLLMENTBY GENDER & LEVELFALL 1991 - FALL 2000
1991 1992 1993 1994 1995LEVEL Male Female Male Female Male Female Male Female Male Female
Undergraduate 1,310 2,784 1,288 2,819 1,355 2,710 1,305 2,721 1,317 2,816Graduate 293 631 310 608 307 735 337 801 360 815
Total 1,603 3,415 1,598 3,427 1,662 3,445 1,642 3,522 1,677 3,631Percent 31.9% 68.1% 31.8% 68.2% 32.5% 67.5% 31.8% 68.2% 31.6% 68.4%
1996 1997 1998 1999 2000LEVEL Male Female Male Female Male Female Male Female Male Female
Undergraduate 1,337 2,845 1,346 2,948 1,342 2,998 1,380 3,231 1,425 3,225Graduate 347 873 351 929 317 934 306 923 351 1,061
Total 1,684 3,718 1,697 3,877 1,659 3,932 1,686 4,154 1,776 4,286Percent 31.2% 68.8% 30.4% 69.6% 29.7% 70.3% 28.9% 71.1% 29.3% 70.7%
SOURCE: INSTITUTIONAL RESEARCH III-1

HEADCOUNT ENROLLMENT BY GENDER, CLASS, ETHNICITY & FULL/PART TIME
FALL 2000FULL-TIME PART-TIME TOTAL
CLASS/ETHNICITY FEMALE MALE FEMALE MALE CLASSN % N % N % N % N %
FRESHMAN 745 100% 324 100% 26 100% 9 100% 1,104 100%International 8 1.1% 15 4.6% 0 0.0% 0 0.0% 23 2.1%Black(Non-Hispanic) 213 28.6% 73 22.5% 6 23.1% 1 11.1% 293 26.5%Native American 1 0.1% 1 0.3% 1 3.8% 0 0.0% 3 0.3%Asian 3 0.4% 1 0.3% 0 0.0% 0 0.0% 4 0.4%Hispanic 9 1.2% 4 1.2% 0 0.0% 0 0.0% 13 1.2%White(Non-Hispanic) 511 68.6% 230 71.0% 19 73.1% 8 88.9% 768 69.6%
SOPHOMORE 764 100% 315 100% 42 100% 25 100% 1,146 100%International 7 0.9% 10 3.2% 0 0.0% 0 0.0% 17 1.5%Black(Non-Hispanic) 210 27.5% 67 21.3% 15 35.7% 7 28.0% 299 26.1%Native American 2 0.3% 1 0.3% 1 2.4% 0 0.0% 4 0.3%Asian 12 1.6% 4 1.3% 1 2.4% 0 0.0% 17 1.5%Hispanic 6 0.8% 1 0.3% 0 0.0% 0 0.0% 7 0.6%White(Non-Hispanic) 527 69.0% 232 73.7% 25 59.5% 18 72.0% 802 70.0%
JUNIOR 622 100% 313 100% 74 100% 30 100% 1,039 100%International 5 0.8% 16 5.1% 0 0.0% 0 0.0% 21 2.0%Black(Non-Hispanic) 173 27.8% 74 23.6% 13 17.6% 4 13.3% 264 25.4%Native American 5 0.8% 0 0.0% 2 2.7% 1 3.3% 8 0.8%Asian 5 0.8% 4 1.3% 3 4.1% 1 3.3% 13 1.3%Hispanic 7 1.1% 4 1.3% 3 4.1% 0 0.0% 14 1.3%White(Non-Hispanic) 427 68.6% 215 68.7% 53 71.6% 24 80.0% 719 69.2%
SENIOR 649 100% 284 100% 116 100% 48 100% 1,097 100%International 10 1.5% 12 4.2% 1 0.9% 2 4.2% 25 2.3%Black(Non-Hispanic) 151 23.3% 64 22.5% 31 26.7% 5 10.4% 251 22.9%Native American 2 0.3% 1 0.4% 0 0.0% 0 0.0% 3 0.3%Asian 7 1.1% 4 1.4% 0 0.0% 0 0.0% 11 1.0%Hispanic 8 1.2% 0 0.0% 1 0.9% 1 2.1% 10 0.9%White(Non-Hispanic) 471 72.6% 203 71.5% 83 71.6% 40 83.3% 797 72.7%
UNDERGRADUATE SPECIAL 8 100% 8 100% 179 100% 69 100% 264 100%International 2 25.0% 3 37.5% 0 0.0% 0 0.0% 5 1.9%Black(Non-Hispanic) 0 0.0% 1 12.5% 21 11.7% 11 15.9% 33 12.5%Native American 0 0.0% 0 0.0% 1 0.6% 0 0.0% 1 0.4%Asian 1 12.5% 0 0.0% 1 0.6% 1 1.4% 3 1.1%Hispanic 0 0.0% 0 0.0% 0 0.0% 0 0.0% 0 0.0%White(Non-Hispanic) 5 62.5% 4 50% 156 87.2% 57 82.6% 222 84.1%
GRADUATE 143 100% 113 100% 280 100% 109 100% 645 100%International 12 8.4% 11 9.7% 3 1.1% 2 1.8% 28 4.3%Black(Non-Hispanic) 30 21.0% 14 12.4% 51 18.2% 22 20.2% 117 18.1%Native American 0 0.0% 0 0.0% 0 0.0% 0 0.0% 0 0.0%Asian 1 0.7% 2 1.8% 1 0.4% 1 0.9% 5 0.8%Hispanic 2 1.4% 3 2.7% 3 1.1% 0 0.0% 8 1.2%White(Non-Hispanic) 98 68.5% 83 73% 222 79.3% 84 77.1% 487 75.5%
GRADUATE SPECIAL 29 100% 4 100% 609 100% 125 100% 767 100%International 0 0.0% 0 0.0% 0 0.0% 0 0.0% 0 0.0%Black(Non-Hispanic) 5 17.2% 2 50.0% 67 11.0% 18 14.4% 92 12.0%Native American 0 0.0% 0 0.0% 0 0.0% 0 0.0% 0 0.0%Asian 0 0.0% 0 0.0% 2 0.3% 0 0.0% 2 0.3%Hispanic 0 0.0% 0 0.0% 2 0.3% 1 0.8% 3 0.4%White(Non-Hispanic) 24 82.8% 2 50% 538 88.3% 106 84.8% 670 87.4%
GRAND TOTAL 2,960 49% 1,361 22.5% 1,326 21.9% 415 6.8% 6,062 100%
III-2 SOURCE: INSTITUTIONAL RESEARCH

HEADCOUNT ENROLLMENT BY GENDER, CLASS, ETHNICITY & FULL/PART TIME
FALL 1999
FULL-TIME PART-TIME TOTALCLASS/ETHNICITY FEMALE MALE FEMALE MALE CLASS
N % N % N % N % N %
FRESHMAN 800 100% 295 100% 25 100% 13 100% 1,133 100%
International 10 1.3% 13 4.4% 0 0.0% 0 0.0% 23 2.0%
Black(Non-Hispanic) 201 25.1% 65 22.0% 6 24.0% 2 15.4% 274 24.2%
Native American 5 0.6% 1 0.3% 0 0.0% 0 0.0% 6 0.5%
Asian 12 1.5% 5 1.7% 0 0.0% 0 0.0% 17 1.5%
Hispanic 5 0.6% 2 0.7% 1 4.0% 0 0.0% 8 0.7%
White(Non-Hispanic) 567 70.9% 209 70.8% 18 72.0% 11 84.6% 805 71.1%
SOPHOMORE 694 100% 317 100% 60 100% 28 100% 1,099 100%
International 4 0.6% 11 3.5% 0 0.0% 0 0.0% 15 1.4%
Black(Non-Hispanic) 193 27.8% 83 26.2% 18 30.0% 4 14.3% 298 27.1%
Native American 5 0.7% 1 0.3% 1 1.7% 0 0.0% 7 0.6%
Asian 8 1.2% 5 1.6% 0 0.0% 1 3.6% 14 1.3%
Hispanic 7 1.0% 2 0.6% 0 0.0% 0 0.0% 9 0.8%
White(Non-Hispanic) 477 68.7% 215 67.8% 41 68.3% 23 82.1% 756 68.8%
JUNIOR 620 100% 284 100% 48 100% 22 100% 974 100%
International 7 1.1% 6 2.1% 0 0.0% 0 0.0% 13 1.3%
Black(Non-Hispanic) 139 22.4% 70 24.6% 8 16.7% 2 9.1% 219 22.5%
Native American 1 0.2% 1 0.4% 1 2.1% 0 0.0% 3 0.3%
Asian 10 1.6% 2 0.7% 0 0.0% 0 0.0% 12 1.2%
Hispanic 5 0.8% 3 1.1% 0 0.0% 0 0.0% 8 0.8%
White(Non-Hispanic) 458 73.9% 202 71.1% 39 81.3% 20 90.9% 719 73.8%
SENIOR 643 100% 267 100% 118 100% 68 100% 1,096 100%
International 7 1.1% 19 7.1% 1 0.8% 1 1.5% 28 2.6%
Black(Non-Hispanic) 162 25.2% 47 17.6% 26 22.0% 10 14.7% 245 22.4%
Native American 1 0.2% 0 0.0% 0 0.0% 0 0.0% 1 0.1%
Asian 2 0.3% 5 1.9% 0 0.0% 0 0.0% 7 0.6%
Hispanic 7 1.1% 3 1.1% 1 0.8% 1 1.5% 12 1.1%
White(Non-Hispanic) 464 72.2% 193 72.3% 90 76.3% 56 82.4% 803 73.3%
UNDERGRADUATE SPECIAL 11 100% 9 100% 213 100% 76 100% 309 100%
International 1 9.1% 4 44.4% 0 0.0% 0 0.0% 5 1.6%
Black(Non-Hispanic) 2 18.2% 1 11.1% 48 22.5% 9 11.8% 60 19.4%
Native American 0 0.0% 0 0.0% 1 0.5% 1 1.3% 2 0.6%
Asian 0 0.0% 0 0.0% 0 0.0% 1 1.3% 1 0.3%
Hispanic 1 9.1% 0 0.0% 0 0.0% 1 1.3% 2 0.6%
White(Non-Hispanic) 7 63.6% 4 44% 164 77.0% 64 84.2% 239 77.3%
GRADUATE 174 100% 93 100% 220 100% 81 100% 568 100%
International 10 5.7% 4 4.3% 2 0.9% 2 2.5% 18 3.2%
Black(Non-Hispanic) 41 23.6% 21 22.6% 37 16.8% 8 9.9% 107 18.8%
Native American 0 0.0% 0 0.0% 0 0.0% 1 1.2% 1 0.2%
Asian 2 1.1% 1 1.1% 0 0.0% 0 0.0% 3 0.5%
Hispanic 1 0.6% 2 2.2% 5 2.3% 1 1.2% 9 1.6%
White(Non-Hispanic) 120 69.0% 65 70% 176 80.0% 69 85.2% 430 75.7%
GRADUATE SPECIAL 8 100% 6 100% 521 100% 126 100% 661 100%
International 0 0.0% 0 0.0% 1 0.2% 1 0.8% 2 0.3%
Black(Non-Hispanic) 3 37.5% 2 33.3% 66 12.7% 20 15.9% 91 13.8%
Native American 0 0.0% 0 0.0% 1 0.2% 1 0.8% 2 0.3%
Asian 0 0.0% 0 0.0% 1 0.2% 2 1.6% 3 0.5%
Hispanic 0 0.0% 0 0.0% 3 0.6% 0 0.0% 3 0.5%
White(Non-Hispanic) 5 62.5% 4 67% 449 86.2% 102 81.0% 560 84.7%
GRAND TOTAL 2,950 51% 1,271 21.8% 1,205 20.6% 414 7.1% 5,840 100%III - 2 SOURCE: INSTITUTIONAL RESEARCH

HEADCOUNT ENROLLMENTBY ETHNIC CATEGORY & FULL/PART TIME
FALL 2000
FULL-TIME PART-TIME TOTALETHNIC CATEGORY N % N % N %
Undergraduate 4,032 100% 618 100% 4,650 100%White, non-Hispanic 2,825 70.1% 483 78.2% 3,308 71.1%Black, non-Hispanic 1,026 25.4% 114 18.4% 1,140 24.5%International 88 2.2% 3 0.5% 91 2.0%American Indian 13 0.3% 6 1.0% 19 0.4%Asian/Pacific Islander 41 1.0% 7 1.1% 48 1.0%Hispanic 39 1.0% 5 0.8% 44 0.9%
Graduate 289 100% 1,123 100% 1,412 100%White, non-Hispanic 207 71.6% 950 84.6% 1,157 81.9%Black, non-Hispanic 51 17.6% 158 14.1% 209 14.8%International 23 8.0% 5 0.4% 28 2.0%American Indian 0 0.0% 0 0.0% 0 0.0%Asian/Pacific Islander 3 1.0% 4 0.4% 7 0.5%Hispanic 5 1.7% 6 0.5% 11 0.8%
Total Students 4,321 100% 1,741 100% 6,062 100%White, non-Hispanic 3,032 70.2% 1,433 82.3% 4,465 73.7%Black, non-Hispanic 1,077 24.9% 272 15.6% 1,349 22.3%International 111 1.0% 8 0.5% 119 2.0%American Indian 13 0.3% 6 0.3% 19 0.3%Asian/Pacific Islander 44 1.0% 11 0.6% 55 0.9%Hispanic 44 1.0% 11 0.6% 55 0.9%
HEADCOUNT ENROLLMENTFALL 1991 - FALL 2000
N % N % N % N % N %
Total Students 5,018 100% 5,025 100% 5,107 100% 5,164 100% 5,308 100%White, non-Hispanic 4,064 81.0% 3,973 79.1% 3,948 77.3% 3,917 75.9% 4,010 75.5%Black, non-Hispanic 773 15.4% 833 16.6% 919 18.0% 1,000 19.4% 1,054 19.9%International 129 2.6% 140 2.8% 165 3.2% 153 3.0% 140 2.6%American Indian 8 0.2% 11 0.2% 6 0.1% 11 0.2% 11 0.2%Asian/Pacific Islander 25 0.5% 36 0.7% 29 0.6% 37 0.7% 46 0.9%Hispanic 19 0.4% 32 0.6% 40 0.8% 46 0.9% 47 0.9%
ETHNIC CATEGORY N % N % N % N % N %
Total Students 5,402 100% 5,574 100% 5,591 100% 5,840 100% 6,062 100%White, non-Hispanic 4,059 75.1% 4,158 74.6% 4,166 74.5% 4,312 73.8% 4,465 73.7%Black, non-Hispanic 1,114 20.6% 1,191 21.4% 1,198 21.4% 1,294 22.2% 1,349 22.3%International 119 2.2% 105 1.9% 96 1.7% 104 1.8% 119 2.0%American Indian 20 0.4% 22 0.4% 28 0.5% 22 0.4% 19 0.3%Asian/Pacific Islander 39 0.7% 44 0.8% 55 1.0% 57 1.0% 55 0.9%Hispanic 51 0.9% 54 1.0% 48 0.9% 51 0.9% 55 0.9%
1994
2000
1995ETHNIC CATEGORY
1996 1997 1998 1999
1991 1992 1993
III-4 SOURCE: INSTITUTIONAL RESEARCH

AVERAGE WINTHROP STUDENT AGE1991 - 2000
LEVEL 1991 1992 1993 1994 1995 1996 1997 1998 1999 2000
Undergraduate 22.1 21.8 21.8 21.9 21.6 21.4 21.4 21.3 21.6 21.6Graduate 32.7 33.7 33.7 34.5 34.1 32.7 33.5 32.5 33.5 34.3
UNDERGRADUATE HEADCOUNT ENROLLMENTBY AGE OF STUDENTS
FALL 1999
Winthrop State Winthrop State Winthrop State Winthrop StateAge FT # FT % FT % Cum FT % Cum FT % PT # PT % PT % Cum PT % Cum PT %
under 18 16 0.4% 0.8% 0.4% 0.8% 220 32.8% 13.9% 32.8% 13.9%18 - 19 1,547 39.3% 38.9% 39.7% 39.6% 46 6.9% 6.2% 39.6% 20.1%20 - 21 1,431 36.3% 35.4% 76.0% 75.1% 29 4.3% 11.2% 44.0% 31.3%22 - 24 679 17.2% 17.3% 93.2% 92.3% 76 11.3% 19.6% 55.3% 50.9%25 - 29 148 3.8% 4.5% 97.0% 96.8% 101 15.1% 16.0% 70.3% 66.9%30 - 34 48 1.2% 1.4% 98.2% 98.2% 48 7.2% 9.8% 77.5% 76.7%35 - 39 34 0.9% 0.8% 99.1% 99.0% 56 8.3% 7.6% 85.8% 84.3%40 - 49 29 0.7% 0.8% 99.8% 99.7% 59 8.8% 9.8% 94.6% 94.1%50 - 64 8 0.2% 0.2% 100.0% 99.9% 31 4.6% 3.9% 99.3% 98.0%65 and older 0 0.0% 0.0% 100.0% 99.9% 5 0.7% 1.9% 100.0% 99.8%Unknown 0 0.0% 0.1% 100.0% 100.0% 0 0.0% 0.2% 100.0% 100.0%
Total 3,940 100.0% 100.0% 100.0% 100.0% 671 100.0% 100.0% 100.0% 100.0%Note: State percentiles are for all S.C. Public Senior Institutions.
UNDERGRADUATE STUDENTS AGE 25 AND OLDERFALL 1994-2000
1994 1995 1996 1997 1998 1999 2000
Number 528 544 535 468 527 550 547Percent 13.11% 13.16% 12.79% 11% 12.14% 11.93% 11.73%
GRADUATE HEADCOUNT ENROLLMENTBY AGE OF STUDENTS
FALL 1999
Winthrop State Winthrop State Winthrop State Winthrop StateAge FT # FT % FT % Cum FT % Cum FT % PT # PT % PT % Cum PT % Cum PT %
under 18 0 0.0% 0.0% 0.0% 0.0% 0 0.0% 0.0% 0.0% 0.0%18 - 19 0 0.0% 0.0% 0.0% 0.0% 0 0.0% 0.0% 0.0% 0.0%20 - 21 2 0.7% 1.9% 0.7% 1.9% 1 0.1% 0.1% 0.1% 0.1%22 - 24 89 31.7% 34.8% 32.4% 36.7% 202 21.3% 10.2% 21.4% 10.3%25 - 29 106 37.7% 35.0% 70.1% 71.7% 212 22.4% 24.2% 43.8% 34.5%30 - 34 30 10.7% 13.6% 80.8% 85.4% 123 13.0% 14.3% 56.8% 48.8%35 - 39 28 10.0% 6.2% 90.7% 91.6% 85 9.0% 12.2% 65.7% 61.0%40 - 49 24 8.5% 6.6% 99.3% 98.2% 217 22.9% 25.7% 88.6% 86.7%50 - 64 1 0.4% 1.6% 99.6% 99.8% 103 10.9% 12.8% 99.5% 99.5%65 and older 1 0.4% 0.0% 100.0% 99.8% 5 0.5% 0.3% 100.0% 99.8%Unknown 0 0.0% 0.2% 100.0% 100.0% 1 0.1% 0.2% 100.1% 100.0%
Total 281 100.0% 100.0% 100.0% 100.0% 948 100.0% 100.0% 100.0% 100.0%Note: State percentiles are for all S.C. Public Senior Institutions.
SOURCE: INSTITUTIONAL RESEARCH III-5

HEADCOUNT ENROLLMENTBY CLASS & SEMESTER
FALL
LEVEL / CLASS 1990 1991 1992 1993 1994 1995 1996 1997 1998 1999 2000
Undergraduate 4,173 4,094 4,107 4,065 4,026 4,133 4,182 4,294 4,340 4,611 4,650New Freshmen 622 662 805 769 744 878 819 912 836 971 905Other Freshman 166 170 140 208 141 140 152 146 142 162 199Sophomore 1,218 983 892 1,006 1,032 975 1,043 1,028 1,121 1,099 1,146Junior 966 1,095 969 861 921 941 901 918 910 974 1,039Senior 982 952 1,078 987 915 1,006 999 993 1,025 1,096 1,097UG Special 219 232 223 234 273 193 268 297 306 309 264
Graduate 931 924 918 1,042 1,138 1,175 1,220 1,280 1,251 1,229 1,412
Total 5,104 5,018 5,025 5,107 5,164 5,308 5,402 5,574 5,591 5,840 6,062
SPRING
LEVEL / CLASS 1991 1992 1993 1994 1995 1996 1997 1998 1999 2000 2001
Undergraduate 3,730 3,715 3,653 3,620 3,613 3,798 3,748 3,885 3,984 4,182 4,337Freshman 636 664 781 852 686 772 752 813 754 848 831Sophomore 1,053 844 790 841 878 874 926 954 1,010 960 1,012Junior 968 1,058 898 847 978 913 887 929 926 1,043 1,056Senior 985 1,029 1,090 1,023 981 1,051 1,067 1,042 1,111 1,091 1,180UG Special 88 120 94 57 90 188 116 147 183 240 258
Graduate 1,151 1,202 1,317 1,302 1,749 1,402 1,121 1,002 957 947 937
Total 4,881 4,917 4,970 4,922 5,362 5,200 4,869 4,887 4,941 5,129 5,274
SUMMER
LEVEL / CLASS 1990 1991 1992 1993 1994 1995 1996 1997 1998 1999 2000
Undergraduate 1,451 1,312 1,384 1,242 1,179 1,108 1,103 1,064 1,049 1,142 1,176Freshman 46 31 31 31 29 24 21 31 23 32 22Sophomore 242 205 181 161 147 159 138 152 156 175 167Junior 393 383 373 299 318 264 267 275 282 325 338Senior 618 548 677 653 586 564 570 528 511 528 580UG Special 152 145 122 98 99 97 107 78 77 82 69
Graduate 981 1,201 1,145 1,219 1,438 1,302 1,304 1,124 1,352 1,087 1,006
Total 2,432 2,513 2,529 2,461 2,617 2,410 2,407 2,188 2,401 2,229 2,182

FULL-TIME/PART-TIME HEADCOUNT ENROLLMENT AND CREDIT HOUR PRODUCTION
FALL 1991 - FALL 2000
LEVEL 1991 1992 1993 1994 1995HC CHP HC CHP HC CHP HC CHP HC CHP
Undergraduate 4,094 56,000 4,107 55,777 4,065 55,805 4,026 54,582 4,133 56,647Full-Time 3,521 52,972 3,507 52,539 3,395 52,927 3,356 51,388 3,580 53,714Part-Time 573 3,028 600 3,238 670 2,878 670 3,194 553 2,933
Graduate 924 5,866 918 5,637 1,042 6,214 1,138 6,257 1,175 6,539Full-Time 315 3,445 307 3,290 342 3,774 325 3,520 323 3,423Part-Time 609 2,421 611 2,347 700 2,440 813 2,737 852 3,116
LEVEL 1996 1997 1998 1999 2000HC CHP HC CHP HC CHP HC CHP HC CHP
Undergraduate 4,182 56,490 4,294 58,518 4,340 59,049 4,611 62,943 4,650 64,354Full-Time 3,585 53,494 3,653 55,241 3,660 55,698 3,940 59,566 4,032 61,159Part-Time 597 2,996 641 3,277 680 3,351 671 3,377 618 3,195
Graduate 1,220 6,694 1,280 6,524 1,251 6,187 1,229 6,112 1,412 7,644Full-Time 317 3,335 267 2,843 251 2,636 281 2,870 289 2,978Part-Time 903 3,359 1,013 3,681 1,000 3,551 948 3,242 1,123 4,666
Note: Headcount and CHP by classification of student.
SOURCE: INSTITUTIONAL RESEARCH III-7

RESIDENCE HALL ENROLLMENTCOMPARED TO HEADCOUNT ENROLLMENT
BY CLASSFALL 2000
%
MALE FEMALE TOTAL HEADCOUNT RESIDENTS/
CLASS LEVEL RESIDENTS RESIDENTS RESIDENTS ENROLLMENT HEADCOUNT
Undergraduates 581 1,571 2,152 4,650 46.3%New Freshmen 232 583 815 898 90.8%Other Freshmen 17 47 64 206 31.1%Sophomore 165 496 661 1,146 57.7%Junior 101 254 355 1,039 34.2%Senior 58 183 241 1,097 22.0%Specials 8 8 16 264 6.1%
Graduates 7 16 23 1,412 1.6%
Grand Total 588 1,587 2,175 6,062 35.9%
FALL 1999
%
MALE FEMALE TOTAL HEADCOUNT RESIDENTS/
CLASS LEVEL RESIDENTS RESIDENTS RESIDENTS ENROLLMENT HEADCOUNT
Undergraduates 521 1,638 2,159 4,611 46.8%New Freshmen 203 671 874 971 90.0%Other Freshmen 30 33 63 162 38.9%Sophomore 124 460 584 1,099 53.1%Junior 95 274 369 974 37.9%Senior 65 188 253 1,096 23.1%Specials 4 12 16 309 5.2%
Graduates 4 15 19 1,229 1.5%
Grand Total 525 1,653 2,178 5,840 37.3%
UNDERGRADUATERESIDENCE/NON-RESIDENCE HALL ENROLLMENT
FALL 1991 - FALL 2000
RESIDENCY 1991 1992 1993 1994 1995 1996 1997 1998 1999 2000
Residence Hall 1,928 1,863 1,857 1,809 1,982 1,961 2,054 2,035 2,159 2,152% of Total 46.2% 45.4% 45.7% 44.9% 48.0% 46.9% 47.8% 46.9% 46.8% 46.3%
Non-Residence Hall 2,245 2,244 2,208 2,217 2,151 2,221 2,240 2,305 2,452 2,498% of Total 53.8% 54.6% 54.3% 55.1% 52.0% 53.1% 52.2% 53.1% 53.2% 53.7%
Total UG Enrollment 4,173 4,107 4,065 4,026 4,133 4,182 4,294 4,340 4,611 4,650
III-8 SOURCE: INSTITUTIONAL RESEARCH

HEADCOUNT ENROLLMENTBY STATE OF ORIGINFALL 1990 - FALL 2000
S.C. OUT-OF-STATE TOTALRESIDENTS RESIDENTS STUDENTS
YEAR UG GRAD TOTAL UG GRAD TOTAL UG GRAD TOTAL# % # % # % # % # % # % # % # % # %
1990 3,709 85.1% 647 14.9% 4,356 85.3% 464 62.0% 284 38.0% 748 14.7% 4,173 81.8% 931 18.2% 5,104 100%
1991 3,580 84.8% 642 15.2% 4,222 84.1% 514 64.6% 282 35.4% 796 15.9% 4,094 81.6% 924 18.4% 5,018 100%
1992 3,571 85.3% 614 14.7% 4,185 83.3% 536 63.8% 304 36.2% 840 16.7% 4,107 81.7% 918 18.3% 5,025 100%
1993 3,490 82.6% 737 17.4% 4,227 82.8% 575 65.3% 305 34.7% 880 17.2% 4,065 79.6% 1,042 20.4% 5,107 100%
1994 3,438 81.1% 802 18.9% 4,240 82.1% 588 63.6% 336 36.4% 924 17.9% 4,026 78.0% 1,138 22.0% 5,164 100%
1995 3,499 80.7% 836 19.3% 4,335 81.7% 634 65.2% 339 34.8% 973 18.3% 4,133 77.9% 1,175 22.1% 5,308 100%
1996 3,549 80.0% 885 20.0% 4,434 82.1% 633 65.4% 335 34.6% 968 17.9% 4,182 77.4% 1,220 22.6% 5,402 100%
1997 3,643 78.8% 978 21.2% 4,621 82.9% 651 68.3% 302 31.7% 953 17.1% 4,294 77.0% 1,280 23.0% 5,574 100%
1998 3,775 79.1% 998 20.9% 4,773 85.4% 565 69.1% 253 30.9% 818 14.6% 4,340 77.6% 1,251 22.4% 5,591 100%
1999 4,024 80.3% 990 19.7% 5,014 85.9% 587 71.1% 239 28.9% 826 14.1% 4,611 79.0% 1,229 21.0% 5,840 100%
2000 4,066 77.8% 1157 22.2% 5,223 86.8% 538 67.8% 255 32.2% 793 13.2% 4,604 76.5% 1,412 23.5% 6,016 100%
SOURCE: INSTITUTIONAL RESEARCH III-9

COUNTRY OF ORIGIN OF INTERNATIONAL STUDENTSFALL 1996 - FALL 2000
FALL FALL FALL FALL FALL % ofCOUNTRY 1996 1997 1998 1999 2000 5 Year Total
UG G Tot UG G Tot UG G Tot UG G Tot UG G Tot UG G Total
Albania 1 0 1 0 0 0 0 0 0 0 0 0 0 0 0 0.24% 0.00% 0.18%Australia 1 0 1 1 0 1 0 0 0 0 0 0 0 0 0 0.48% 0.00% 0.37%Austria 0 0 0 0 0 0 0 0 0 2 0 2 2 0 2 0.96% 0.00% 0.74%Bahamas 0 1 1 0 0 0 0 0 0 0 0 0 0 1 1 0.00% 1.60% 0.37%Belgium 0 0 0 0 0 0 1 0 1 0 0 0 0 0 0 0.24% 0.00% 0.18%Brazil 6 0 6 10 0 10 8 0 8 11 0 11 9 1 10 10.53% 0.80% 8.29%Bulgaria 1 1 2 1 0 1 1 0 1 5 0 5 5 0 5 3.11% 0.80% 2.58%Canada 12 2 14 18 1 19 17 1 18 19 2 21 17 3 20 19.86% 7.20% 16.94%China, Republic of 1 3 4 1 2 3 1 0 1 1 0 1 1 2 3 1.20% 5.60% 2.21%Colombia 1 0 1 0 1 1 2 1 3 3 1 4 3 2 5 2.15% 4.00% 2.58%Cyprus 1 0 1 0 0 0 0 0 0 0 0 0 0 0 0 0.24% 0.00% 0.18%Estonia 0 0 0 0 0 0 1 0 1 0 0 0 1 0 1 0.48% 0.00% 0.37%France 6 6 12 6 9 15 4 7 11 5 2 7 4 4 8 5.98% 22.40% 9.76%Gabon 0 1 1 0 0 0 1 0 1 2 0 2 1 1 2 0.96% 1.60% 1.10%Germany 2 0 2 2 0 2 1 0 1 2 0 2 3 0 3 2.39% 0.00% 1.84%Greece 1 0 1 1 0 1 0 1 1 0 0 0 0 0 0 0.48% 0.80% 0.55%Guinea 0 0 0 0 0 0 0 0 0 1 0 1 0 0 0 0.24% 0.00% 0.18%Haiti 1 0 1 2 0 2 2 0 2 0 0 0 1 0 1 1.44% 0.00% 1.10%Hong Kong 3 0 3 1 1 2 0 1 1 0 0 0 0 0 0 0.96% 1.60% 1.10%Hungary 1 0 1 1 0 1 1 0 1 1 1 2 1 1 2 1.20% 1.60% 1.29%Iceland 0 0 0 0 0 0 0 0 0 1 0 1 2 0 2 0.72% 0.00% 0.55%India 2 5 7 1 2 3 1 2 3 3 1 4 4 1 5 2.63% 8.80% 4.05%Iran 0 0 0 0 0 0 1 0 1 0 0 0 0 0 0 0.24% 0.00% 0.18%Ireland 1 0 1 0 0 0 1 0 1 1 0 1 1 0 1 0.96% 0.00% 0.74%Israel 1 0 1 0 0 0 0 0 0 0 0 0 0 0 0 0.24% 0.00% 0.18%Italy 0 1 1 0 0 0 0 0 0 0 0 0 0 0 0 0.00% 0.80% 0.18%Ivory Coast 0 0 0 0 0 0 1 0 1 1 0 1 1 0 1 0.72% 0.00% 0.55%Jamaica 0 0 0 0 0 0 0 0 0 0 0 0 1 0 1 0.24% 0.00% 0.18%Japan 5 1 6 4 1 5 2 1 3 2 2 4 1 1 2 3.35% 4.80% 3.68%Kenya 1 0 1 0 0 0 0 0 0 0 0 0 1 0 1 0.48% 0.00% 0.37%Korea, Republic of 0 1 1 0 1 1 0 0 0 1 0 1 0 0 0 0.24% 1.60% 0.55%Liberia 0 0 0 0 0 0 1 0 1 0 0 0 0 0 0 0.24% 0.00% 0.18%Lithuania 0 0 0 0 0 0 0 0 0 0 1 1 0 1 1 0.00% 1.60% 0.37%Malaysia 4 2 6 3 0 3 1 0 1 0 0 0 0 1 1 1.91% 2.40% 2.03%Mauritius 1 0 1 1 0 1 1 0 1 1 0 1 0 0 0 0.96% 0.00% 0.74%Mexico 0 1 1 0 0 0 0 0 0 0 0 0 0 0 0 0.00% 0.80% 0.18%Monaco 0 0 0 0 0 0 1 0 1 0 0 0 0 0 0 0.24% 0.00% 0.18%Morocco 0 0 0 0 1 1 0 0 0 1 0 1 0 1 1 0.24% 1.60% 0.55%Netherlands/Antilles 1 0 1 0 0 0 0 0 0 0 0 0 0 0 0 0.24% 0.00% 0.18%New Zealand 1 0 1 0 0 0 0 0 0 0 0 0 1 0 1 0.48% 0.00% 0.37%Nigeria 0 0 0 0 0 0 0 1 1 1 2 3 1 1 2 0.48% 3.20% 1.10%Norway 0 1 1 0 0 0 0 0 0 3 0 3 1 0 1 0.96% 0.80% 0.92%Peru 3 1 4 3 0 3 0 0 0 1 1 2 1 1 2 1.91% 2.40% 2.03%Philippines 0 0 0 0 0 0 0 0 0 1 1 2 1 1 2 0.48% 1.60% 0.74%Poland 0 0 0 2 0 2 1 0 1 0 0 0 1 0 1 0.96% 0.00% 0.74%Portugal 1 0 1 1 0 1 2 0 2 0 0 0 0 0 0 0.96% 0.00% 0.74%Romania 0 1 1 0 0 0 0 0 0 0 0 0 0 0 0 0.00% 0.80% 0.18%Saudi Arabia 1 0 1 1 0 1 1 0 1 1 0 1 1 0 1 1.20% 0.00% 0.92%Sierra Leone 1 0 1 0 0 0 0 0 0 0 0 0 0 0 0 0.24% 0.00% 0.18%Slovakia 0 1 1 0 0 0 0 1 1 0 1 1 0 0 0 0.00% 2.40% 0.55%South Africa 2 2 4 1 1 2 1 0 1 0 0 0 1 0 1 1.20% 2.40% 1.47%Spain 9 0 9 12 2 14 13 0 13 6 1 7 10 1 11 11.96% 3.20% 9.94%Sri Lanka 0 0 0 0 0 0 0 0 0 0 0 0 1 0 1 0.24% 0.00% 0.18%Sweden 4 0 4 3 0 3 6 1 7 4 0 4 5 0 5 5.26% 0.80% 4.24%Taiwan 1 0 1 0 0 0 0 0 0 1 0 1 1 0 1 0.72% 0.00% 0.55%Thailand 0 3 3 0 1 1 0 0 0 0 0 0 0 0 0 0.00% 3.20% 0.74%Trinidad/Tobago 1 0 1 1 0 1 0 0 0 0 0 0 0 0 0 0.48% 0.00% 0.37%Ukraine 0 1 1 1 0 1 1 0 1 1 0 1 2 0 2 1.20% 0.80% 1.10%United Kingdom 6 0 6 3 0 3 3 0 3 1 2 3 4 2 6 4.07% 3.20% 3.87%Venezuela 0 0 0 0 1 1 0 1 1 0 1 1 0 2 2 0.00% 4.00% 0.92%Yugoslavia 0 0 0 0 0 0 0 0 0 0 1 1 0 0 0 0.00% 0.80% 0.18%Zimbawee 0 0 0 0 0 0 0 0 0 1 0 1 1 0 0 0.48% 0.00% 0.18%
TOTAL 84 35 119 81 24 105 78 18 96 84 20 104 91 28 119 100.0% 100.0% 100.0%* Permanent residents not counted.
III-10 SOURCE: INSTITUTIONAL RESEARCH

GEOGRAPHICAL DISTRIBUTION OF STUDENTSBY STATE
FALL 1996 - FALL 2000
FALL FALL FALL FALL FALL % ofSTATE 1996 1997 1998 1999 2000 5 Year Total
UG G Total UG G Total UG G Total UG G Total UG G Total UG G Total
Alabama 1 0 1 1 1 2 3 1 4 4 0 4 1 0 1 0.05% 0.03% 0.04%Alaska 0 0 0 0 0 0 0 0 0 0 0 0 0 0 0 0.00% 0.00% 0.00%Arizona 0 0 0 1 0 1 1 1 2 1 0 1 1 0 1 0.02% 0.02% 0.02%Arkansas 0 0 0 0 0 0 0 0 0 0 1 1 0 0 0 0.00% 0.02% 0.00%California 7 1 8 6 1 7 5 1 6 5 2 7 4 1 5 0.12% 0.09% 0.12%Colorado 2 0 2 1 0 1 2 0 2 3 0 3 2 0 2 0.05% 0.00% 0.04%Connecticut 3 0 3 3 1 4 1 0 1 4 0 4 4 1 5 0.07% 0.03% 0.06%Delaware 1 0 1 0 0 0 2 0 2 2 0 2 1 0 1 0.03% 0.00% 0.02%Florida 64 4 68 72 2 74 60 7 67 72 3 75 71 4 75 1.54% 0.31% 1.26%Georgia 79 5 84 75 5 80 57 6 63 64 6 70 62 8 70 1.53% 0.47% 1.29%Hawaii 1 0 1 0 0 0 0 0 0 0 0 0 0 0 0 0.00% 0.00% 0.00%Idaho 0 0 0 0 0 0 0 0 0 1 0 1 1 0 1 0.01% 0.00% 0.01%Illinois 0 1 1 1 1 2 4 1 5 6 0 6 5 0 5 0.07% 0.05% 0.07%Indiana 2 1 3 4 1 5 4 1 5 5 0 5 4 1 5 0.09% 0.06% 0.08%Iowa 0 1 1 1 0 1 2 0 2 0 0 0 0 0 0 0.01% 0.02% 0.01%Kansas 1 0 1 0 0 0 0 0 0 0 0 0 1 0 1 0.01% 0.00% 0.01%Kentucky 5 0 5 6 0 6 4 1 5 6 1 7 7 1 8 0.13% 0.05% 0.11%Louisiana 0 0 0 2 0 2 2 0 2 4 0 4 5 1 6 0.06% 0.02% 0.05%Maine 2 0 2 2 0 2 2 0 2 1 0 1 0 1 1 0.03% 0.02% 0.03%Maryland 44 0 44 49 1 50 37 1 38 39 2 41 39 4 43 0.94% 0.13% 0.76%Massachusetts 7 0 7 5 0 5 4 0 4 4 0 4 7 1 8 0.12% 0.02% 0.10%Michigan 17 0 17 12 0 12 11 0 11 14 0 14 7 1 8 0.28% 0.02% 0.22%Minnesota 7 0 7 6 0 6 5 0 5 4 0 4 2 0 2 0.11% 0.00% 0.08%Mississippi 1 0 1 0 0 0 0 0 0 1 0 1 1 0 1 0.01% 0.00% 0.01%Missouri 4 0 4 4 0 4 2 0 2 3 0 3 1 0 1 0.06% 0.00% 0.05%Nebraska 1 0 1 1 0 1 1 1 2 1 1 2 0 2 2 0.02% 0.06% 0.03%Nevada 1 0 1 1 0 1 0 0 0 0 0 0 0 0 0 0.01% 0.00% 0.01%New Hampshire 1 1 2 2 1 3 3 1 4 2 3 5 2 2 4 0.05% 0.13% 0.06%New Jersey 25 0 25 21 2 23 21 4 25 18 2 20 15 2 17 0.45% 0.16% 0.39%New Mexico 2 0 2 0 1 1 0 0 0 0 1 1 3 0 3 0.02% 0.03% 0.02%New York 30 3 33 34 3 37 18 4 22 25 2 27 25 3 28 0.60% 0.23% 0.52%North Carolina 128 273 401 133 247 380 112 189 301 98 171 269 103 169 272 2.60% 16.41% 5.70%Ohio 28 1 29 30 2 32 34 2 36 29 1 30 23 5 28 0.65% 0.17% 0.54%Oklahoma 2 0 2 2 0 2 1 0 1 0 1 1 0 0 0 0.02% 0.02% 0.02%Oregon 0 1 1 0 0 0 1 0 1 3 0 3 1 0 1 0.02% 0.02% 0.02%Pennsylvania 11 0 11 17 1 18 20 1 21 16 1 17 20 3 23 0.38% 0.09% 0.32%Rhode Island 1 0 1 2 0 2 1 0 1 1 0 1 2 0 2 0.03% 0.00% 0.02%South Carolina 3,549 885 4,434 3,643 978 4,621 3,775 998 4,773 4,024 990 5,014 4,066 1,157 5,223 86.32% 78.35% 84.53%South Dakota 0 0 0 1 0 1 0 0 0 0 0 0 0 0 0 0.00% 0.00% 0.00%Tennessee 7 0 7 8 0 8 6 0 6 5 2 7 7 1 8 0.15% 0.05% 0.13%Texas 7 0 7 5 0 5 5 1 6 3 2 5 3 1 4 0.10% 0.06% 0.09%Vermont 2 0 2 2 0 2 2 0 2 2 0 2 3 0 3 0.05% 0.00% 0.04%Utah 1 0 1 3 0 3 1 0 1 1 0 1 0 0 0 0.03% 0.00% 0.02%Virginia 47 7 54 47 5 52 44 7 51 45 9 54 45 8 53 1.03% 0.56% 0.93%Washington 0 0 0 1 0 1 1 0 1 1 0 1 2 0 2 0.02% 0.00% 0.02%West Virginia 4 1 5 3 1 4 2 0 2 4 1 5 7 1 8 0.09% 0.06% 0.08%Wisconsin 3 0 3 5 0 5 4 1 5 2 1 3 3 1 4 0.08% 0.05% 0.07%Wyoming 0 0 0 0 0 0 0 0 0 0 0 0 1 0 1 0.00% 0.00% 0.00%
Total U.S. States 4,098 1,185 5,283 4,212 1,254 5,466 4,260 1,229 5,489 4,523 1,203 5,726 4,557 1,379 5,936 98.07% 97.78% 98.00%Dist. of Columbia 0 0 0 0 0 0 0 0 0 0 0 0 1 0 1 0.00% 0.00% 0.00%International 84 35 119 81 24 105 78 18 96 84 20 104 91 28 119 1.89% 1.96% 1.91%Puerto Rico 0 0 0 1 0 1 0 0 0 1 0 1 0 0 0 0.01% 0.00% 0.01%Virgin Islands of the U.S 0 0 0 0 0 0 0 0 0 0 1 1 0 1 1 0.00% 0.03% 0.01%Unknown 0 0 0 0 2 2 2 4 6 3 5 8 0 4 4 0.02% 0.23% 0.07%
Grand Total 4,182 1,220 5,402 4,294 1,280 5,574 4,340 1,251 5,591 4,611 1,229 5,840 4,649 1,412 6,061 100.0% 100.0% 100.0%
SOURCE: INSTITUTIONAL RESEARCH III-11

GEOGRAPHICAL DISTRIBUTION OF STUDENTSBY S.C. COUNTY
FALL 1996 - FALL 2000
FALL FALL FALL FALL FALL % ofCOUNTY 1996 1997 1998 1999 2000 5 Year Total
UG G Total UG G Total UG G Total UG G Total UG G Total UG G Total
Abbeville 5 2 7 5 1 6 5 1 6 8 4 12 9 3 12 0.14% 0.17% 0.15%Aiken 62 19 81 66 11 77 85 9 94 98 4 102 108 5 113 1.90% 0.75% 1.64%Allendale 6 0 6 5 0 5 5 0 5 7 0 7 8 2 10 0.14% 0.03% 0.12%Anderson 90 3 93 78 7 85 73 21 94 74 11 85 66 10 76 1.73% 0.81% 1.52%Bamberg 11 0 11 10 0 10 7 0 7 4 0 4 3 1 4 0.16% 0.02% 0.13%Barnwell 13 0 13 14 0 14 9 2 11 13 0 13 10 5 15 0.27% 0.11% 0.23%Beaufort 49 4 53 52 10 62 59 30 89 56 21 77 66 23 89 1.28% 1.38% 1.30%Berkeley 72 3 75 77 6 83 75 9 84 82 10 92 88 4 92 1.78% 0.50% 1.50%Calhoun 9 1 10 8 2 10 8 1 9 8 0 8 6 0 6 0.18% 0.06% 0.15%Charleston 132 15 147 161 18 179 172 23 195 188 18 206 197 19 216 3.85% 1.45% 3.31%Cherokee 39 9 48 32 5 37 28 9 37 35 9 44 29 29 58 0.74% 0.95% 0.79%Chester 133 37 170 138 28 166 133 29 162 140 36 176 113 77 190 2.98% 3.24% 3.03%Chesterfield 75 12 87 64 41 105 79 20 99 83 36 119 68 20 88 1.67% 2.02% 1.75%Clarendon 13 15 28 13 6 19 14 4 18 15 9 24 17 10 27 0.33% 0.69% 0.41%Colleton 7 1 8 8 2 10 15 5 20 25 1 26 29 1 30 0.38% 0.16% 0.33%Darlington 34 5 39 39 12 51 50 10 60 53 8 61 57 13 70 1.06% 0.75% 0.99%Dillon 19 10 29 16 19 35 18 10 28 16 11 27 16 11 27 0.39% 0.95% 0.51%Dorchester 63 1 64 58 2 60 62 4 66 81 3 84 88 5 93 1.59% 0.23% 1.29%Edgefield 13 7 20 9 8 17 7 6 13 9 4 13 6 5 11 0.20% 0.47% 0.26%Fairfield 26 7 33 37 10 47 36 13 49 24 18 42 19 16 35 0.64% 1.00% 0.72%Florence 74 33 107 69 22 91 69 20 89 87 23 110 88 14 102 1.75% 1.75% 1.75%Georgetown 15 7 22 16 11 27 28 6 34 22 5 27 36 4 40 0.53% 0.52% 0.53%Greenville 295 13 308 290 20 310 281 23 304 272 38 310 293 32 325 6.48% 1.97% 5.47%Greenwood 33 18 51 38 12 50 35 30 65 42 30 72 40 21 61 0.85% 1.74% 1.05%Hampton 13 0 13 7 0 7 8 0 8 7 3 10 8 5 13 0.19% 0.13% 0.18%Horry 48 68 116 57 36 93 69 39 108 74 36 110 74 39 113 1.46% 3.41% 1.90%Jasper 8 0 8 6 1 7 5 1 6 5 1 6 6 1 7 0.14% 0.06% 0.12%Kershaw 54 9 63 60 7 67 83 26 109 80 24 104 78 45 123 1.61% 1.74% 1.64%Lancaster 175 50 225 200 27 227 150 44 194 162 39 201 135 47 182 3.72% 3.24% 3.61%Laurens 32 3 35 36 4 40 42 8 50 37 7 44 43 5 48 0.86% 0.42% 0.76%Lee 10 0 10 11 2 13 11 1 12 12 2 14 14 5 19 0.26% 0.16% 0.24%Lexington 170 43 213 179 49 228 178 81 259 193 60 253 214 72 286 4.23% 4.77% 4.35%Marion 15 1 16 14 11 25 27 3 30 24 5 29 25 3 28 0.48% 0.36% 0.45%Marlboro 4 0 4 4 0 4 20 5 25 21 5 26 5 1 6 0.24% 0.17% 0.23%McCormick 28 16 44 32 10 42 5 0 5 4 0 4 25 2 27 0.43% 0.44% 0.43%Newberry 21 4 25 26 19 45 26 5 31 24 4 28 20 3 23 0.53% 0.55% 0.53%Oconee 24 2 26 36 15 51 33 39 72 41 33 74 41 13 54 0.79% 1.60% 0.97%Orangeburg 48 7 55 47 26 73 54 7 61 53 5 58 53 15 68 1.16% 0.94% 1.11%Pickens 56 4 60 50 5 55 43 10 53 37 11 48 44 7 51 1.04% 0.58% 0.94%Richland 219 33 252 230 44 274 234 49 283 286 53 339 324 58 382 5.86% 3.71% 5.37%Saluda 4 0 4 9 3 12 5 2 7 5 0 5 8 2 10 0.14% 0.11% 0.13%Spartanburg 155 18 173 160 26 186 169 16 185 165 22 187 155 23 178 3.64% 1.64% 3.19%Sumter 66 4 70 78 25 103 84 23 107 137 7 144 113 13 126 2.17% 1.13% 1.93%Union 29 3 32 29 5 34 29 4 33 35 5 40 32 8 40 0.70% 0.39% 0.63%Williamsburg 18 21 39 18 13 31 17 3 20 12 3 15 12 4 16 0.35% 0.69% 0.43%York 1,064 377 1,441 1,051 397 1,448 1,130 347 1,477 1,168 366 1,534 1,177 456 1,633 25.32% 30.40% 26.46%
Total S.C. 3,549 885 4,434 3,643 978 4,621 3,775 998 4,773 4,024 990 5,014 4,066 1,157 5,223 86.32% 78.35% 84.53%Out-of-State 549 300 849 570 278 848 487 235 722 503 219 722 492 227 719 11.78% 19.70% 13.56%International 84 35 119 81 24 105 78 18 96 84 20 104 91 28 119 1.89% 1.96% 1.91%
Grand Total 4,182 1,220 5,402 4,294 1,280 5,574 4,340 1,251 5,591 4,611 1,229 5,840 4,649 1,412 6,061 100.0% 100.0% 100.0%
III-12 SOURCE: INSTITUTIONAL RESEARCH

UNDERGRADUATE HEADCOUNT ENROLLMENTFALL 1996 - FALL 2000
% OF 5COLLEGE / DEGREE PROGRAMS 1996 1997 1998 1999 2000 YEAR 99 TO 00 96 TO 00
TOTAL % DIFF. % DIFF.
ARTS & SCIENCES 1,568 1,607 1,626 1,638 1,710 36.6% 4.4% 9.1%Biology 266 249 228 233 274 5.6% 17.6% 3.0%Chemistry 27 44 59 60 54 1.1% -10.0% 100.0%English 134 141 136 107 105 2.8% -1.9% -21.6%General Communication Disorders * 12 55 86 88 1.1% 2.3% 100.0%History 126 139 139 136 132 3.0% -2.9% 4.8%Human Nutrition 79 66 55 46 47 1.3% 2.2% -40.5%Integrated Marketing Communication * 32 60 103 119 1.4% 15.5% 100.0%Mass Communication 177 167 164 152 186 3.8% 22.4% 5.1%Mathematics (B.A.) 24 18 19 17 14 0.4% -17.6% -41.7%Mathematics (B.S.) 49 36 35 32 26 0.8% -18.8% -46.9%Medical Technology 14 14 7 11 11 0.3% 0.0% -21.4%Modern Languages 41 47 55 44 37 1.0% -15.9% -9.8%Philosophy & Religious Studies 19 15 23 18 19 0.4% 5.6% 0.0%Political Science 123 133 110 127 131 2.8% 3.1% 6.5%Pre-Engineering 12 12 10 14 10 0.3% -28.6% -16.7%Psychology 221 212 216 230 235 5.0% 2.2% 6.3%Science Communications 6 3 4 5 5 0.1% 0.0% -16.7%Social Work 136 137 140 139 121 3.0% -12.9% -11.0%Sociology 57 76 89 87 92 1.8% 5.7% 61.4%Speech** 57 54 22 5 4 0.6% -20.0% -93.0%
BUSINESS ADMINISTRATION 887 991 1,012 1,174 1,218 23.7% 3.7% 37.3%Business Administration 796 876 876 927 912 19.7% -1.6% 14.6%Computer Science 91 83 76 97 104 2.0% 7.2% 14.3%Integrated Marketing Communication * 32 60 103 119 1.4% 15.5% 100.0%Sport Manangement * * * 47 83 0.6% 76.6% 100.0%
EDUCATION 778 745 749 792 812 17.4% 2.5% 4.4%Business Education 23 25 20 13 8 0.4% -38.5% -65.2%Early Childhood Education 181 164 164 166 187 3.9% 12.7% 3.3%Elementary Education 317 319 311 339 336 7.3% -0.9% 6.0%Home Economics 7 2 ** ** ** 0.0% N/A N/AFamily & Consumer Science 7 9 22 34 40 0.5% 17.6% 471.4%Physical Education 90 97 115 90 88 2.2% -2.2% -2.2%Special Education 153 129 117 103 70 2.6% -32.0% -54.2%Sport Manangement * * * 47 83 0.6% 76.6% 100.0%
VISUAL & PERFORMING ARTS 536 577 625 648 672 13.7% 3.7% 25.4%Art (B.A.) 78 73 80 91 113 2.0% 24.2% 44.9%Art (B.F.A.) 209 240 255 250 254 5.4% 1.6% 21.5%Art History (B.A.) 11 9 11 10 9 0.2% -10.0% -18.2%Dance 22 34 33 42 38 0.8% -9.5% 72.7%Music (B.A.) 47 38 49 53 52 1.1% -1.9% 10.6%Music Education (Choral) 32 33 40 36 35 0.8% -2.8% 9.4%Music Education (Instrumental) 39 46 51 51 49 1.1% -3.9% 25.6%Music (Performance) 36 28 21 19 24 0.6% 26.3% -33.3%Theatre 62 76 85 96 98 1.9% 2.1% 58.1%
PRE-NURSING 13 18 6 8 13 0.3% 62.5% 0.0%
PRE-MAJOR 454 446 459 487 427 10.2% -12.3% -5.9%
INTERDISCIPLINARY MAJORS * 32 60 150 202 2.0% 34.7% 100.0%Integrated Marketing Communication * 32 60 103 119 1.4% 15.5% 100.0%Sport Management * * * 47 83 0.6% 76.6% 100.0%Note: Counts include double majors and students working toward two degrees.* New program** Discontinued program
SOURCE: INSTITUTIONAL RESEARCH III-13

UNDERGRADUATE HEADCOUNT ENROLLMENTSPRING 1997 - SPRING 2001
% OF 5COLLEGE / DEGREE PROGRAMS 1997 1998 1999 2000 2001 YEAR 00 TO 01 97 TO 01
TOTAL % DIFF. % DIFF.
ARTS & SCIENCES 1,457 1,523 1,549 1,617 1,634 37.7% 1.1% 12.1%Biology 229 204 195 215 221 5.2% 2.8% -3.5%Chemistry 27 41 55 71 49 1.2% -31.0% 81.5%General Communication Disorders * 24 67 92 85 1.3% -7.6% 100.0%English 121 129 119 106 95 2.8% -10.4% -21.5%Govt. and Public Service 1 ** ** ** ** 0.0% 0.0% -100.0%History 129 135 144 141 129 3.3% -8.5% 0.0%Human Nutrition 71 66 44 41 40 1.3% -2.4% -43.7%Integrated Marketing Communication 8 47 79 102 124 1.7% 21.6% 1450.0%Mass Communication 151 144 141 142 161 3.6% 13.4% 6.6%Mathematics (B.A.) 22 23 20 18 13 0.5% -27.8% -40.9%Mathematics (B.S.) 32 28 26 27 18 0.6% -33.3% -43.8%Medical Technology 13 7 10 9 11 0.2% 22.2% -15.4%Modern Languages 47 53 52 45 36 1.1% -20.0% -23.4%Philosophy & Religious Studies 18 18 23 23 27 0.5% 17.4% 50.0%Political Science 119 116 131 120 144 3.1% 20.0% 21.0%Pre-Engineering 9 9 6 9 7 0.2% -22.2% -22.2%Psychology 200 218 210 227 243 5.3% 7.0% 21.5%Science Communications 4 4 3 6 7 0.1% 16.7% 75.0%Social Work 134 143 141 133 135 3.3% 1.5% 0.7%Sociology 64 74 75 85 87 1.9% 2.4% 35.9%Speech 58 40 8 5 2 0.5% -60.0% -96.6%
BUSINESS ADMINISTRATION 852 935 1,008 1,093 1,168 24.5% 6.9% 37.1%Business Administration 768 821 856 849 883 20.2% 4.0% 15.0%Computer Science 76 67 73 86 84 1.9% -2.3% 10.5%Integrated Marketing Communication 8 47 79 102 124 1.7% 21.6% 1450.0%Sport Management * * * 56 77 0.6% 37.5% 100.0%
EDUCATION 756 717 722 734 779 18.0% 6.1% 3.0%Business Education 22 23 24 11 6 0.4% -45.5% -72.7%Early Childhood Education 179 169 152 160 192 4.1% 20.0% 7.3%Elementary Education 306 286 295 297 302 7.2% 1.7% -1.3%Home Economics 4 2 ** ** ** 0.0% 0.0% -100.0%Family & Consumer Science (HEED) 8 15 24 38 48 0.6% 26.3% 500.0%Physical Education 97 99 123 87 83 2.4% -4.6% -14.4%Special Education 140 123 104 85 71 2.5% -16.5% -49.3%Sport Management * * * 56 77 0.6% 37.5% 100.0%
VISUAL & PERFORMING ARTS 496 551 585 589 589 13.6% 0.0% 18.8%Art (B.A.) 75 66 60 78 89 1.8% 14.1% 18.7%Art (B.F.A.) 186 221 245 224 223 5.3% -0.4% 19.9%Art History (B.A.) 11 12 10 14 12 0.3% -14.3% 9.1%Dance 28 28 30 36 38 0.8% 5.6% 35.7%Music (B.A.) 39 37 41 50 41 1.0% -18.0% 5.1%Music Education (Choral) 31 36 37 33 33 0.8% 0.0% 6.5%Music Education (Instrumental) 39 42 46 45 43 1.0% -4.4% 10.3%Music (Performance) 30 26 22 19 23 0.6% 21.1% -23.3%Theatre 57 83 94 90 87 2.0% -3.3% 52.6%
PRE-NURSING 7 14 6 7 9 0.2% 28.6% 28.6%
PRE-MAJOR 251 258 282 376 360 7.4% -4.3% 43.4%
INTERDISCIPLINARY MAJORS 8 47 79 158 201 2.4% 27.2% 2412.5%Sport Management * * * 56 77 0.6% 37.5% 100.0%Integrated Marketing Communication 8 47 79 102 124 1.7% 21.6% 1450.0%Note: Counts include double majors and students working toward two degrees.* New program** Discontinued program
III-14 SOURCE: INSTITUTIONAL RESEARCH

GRADUATE HEADCOUNT ENROLLMENTFALL 1996 - FALL 2000
% OFCOLLEGE / DEGREE PROGRAMS 1996 1997 1998 1999 2000 5-YEAR 99 TO 00 95 TO 00
TOTAL % DIFF. % DIFF.
ARTS AND SCIENCES 178 161 145 145 127 11.8% -12.4% -28.7%Biology 18 16 15 11 8 1.1% -27.3% -55.6%English 23 20 12 15 10 1.3% -33.3% -56.5%Human Nutrition 46 42 35 37 28 2.9% -24.3% -39.1%History 13 10 8 13 16 0.9% 23.1% 23.1%Liberal Arts 42 36 36 32 27 2.7% -15.6% -35.7%Mathematics 4 5 8 5 4 0.4% -20.0% 0.0%School Psychology 24 22 22 23 25 1.8% 8.7% 4.2%Spanish 8 10 9 9 9 0.7% 0.0% 12.5%
BUSINESS ADMINISTRATION 215 186 168 170 202 14.7% 18.8% -6.0%Business Administration 174 152 115 143 161 11.7% 12.6% -7.5%Executive MBA 41 34 53 27 41 3.1% 51.9% 0.0%
EDUCATION 279 320 300 231 319 22.7% 38.1% 14.3%Business Education (MS) 22 5 12 5 *** 0.7% -100.0% -100.0%Business Education (MAT) 13 17 11 4 4 0.8% 0.0% -69.2%Counseling & Dev (Guidance) 57 50 42 38 54 3.8% 42.1% -5.3%Curriculum and Instruction 2 3 2 0 *** 0.1% 0.0% -100.0%Educational Adm. & Supervision (MEd)* 26 39 40 23 13 2.2% -43.5% -50.0%Educational Administration (EdS) 22 47 51 28 5 2.4% -82.1% -77.3%Educational Leadership ** ** ** 14 69 1.3% 392.9% 100.0%Educational Media*** 29 32 20 11 *** 1.4% N/A N/AElementary Education 14 19 10 16 22 1.3% 37.5% 57.1%Family and Consumer Science 6 5 5 1 *** 0.3% -100.0% -100.0%Middle Level Education ** ** ** ** 13 0.2% 100.0% 100.0%Physical Education 5 5 7 6 10 0.5% 66.7% 100.0%Reading 19 22 22 24 57 2.3% 137.5% 200.0%Secondary Education (MAT) 42 49 54 37 47 3.6% 27.0% 11.9%Secondary Education (MEd) 8 10 8 12 10 0.8% -16.7% 25.0%Special Education 14 17 16 12 15 1.2% 25.0% 7.1%
VISUAL & PERFORMING ARTS 37 27 18 16 23 1.9% 43.8% -37.8%Art Education 10 12 7 2 2 0.5% 0.0% -80.0%Conducting ** ** ** ** 3 0.0% 100.0% 100.0%Fine Arts 10 5 4 4 6 0.5% 50.0% -40.0%Music Education 7 2 3 4 5 0.3% 25.0% -28.6%Music Performance 10 8 4 6 7 0.5% 16.7% -30.0%
UNDESIGNATED/UNASSIGNED 511 586 620 667 741 48.9% 11.1% 45.0%
TOTAL 1,220 1,280 1,251 1,229 1,412 100.0% 14.9% 15.7%* MEd EDAS changed to MEd EDLD in Fall 1999** New program*** Discontinued program
SOURCE: INSTITUTIONAL RESEARCH III-15

GRADUATE HEADCOUNT ENROLLMENTSPRING 1997 - SPRING 2001
% OFCOLLEGE / DEGREE PROGRAMS 1997 1998 1999 2000 2001 5-YEAR 00 TO 01 97 TO 01
TOTAL % DIFF. % DIFF.
ARTS AND SCIENCES 177 161 140 156 132 15.4% -15.4% -25.4%Biology 16 14 11 11 11 1.3% 0.0% -31.3%English 20 11 9 16 12 1.4% -25.0% -40.0%Human Nutrition 56 56 44 47 37 4.8% -21.3% -33.9%History 12 12 8 12 14 1.2% 16.7% 16.7%Liberal Arts 40 32 31 34 19 3.1% -44.1% -52.5%Mathematics 5 6 7 5 3 0.5% -40.0% -40.0%School Psychology 23 21 22 23 25 2.3% 8.7% 8.7%Spanish 5 9 8 8 11 0.8% 37.5% 120.0%
BUSINESS ADMINISTRATION 207 146 153 168 197 17.5% 17.3% -4.8%Business Administration 164 118 126 143 143 14.0% 0.0% -12.8%Executive MBA 43 28 27 25 35 3.2% 40.0% -18.6%
EDUCATION 264 323 280 247 297 28.4% 20.2% 12.5%Business Education (MS) 19 7 7 4 0 1.3% -100.0% -100.0%Business Education (MAT) 7 15 5 0 0 4.8% 0.0% -100.0%Counseling & Dev (Guidance) 50 49 40 36 36 4.4% 0.0% -28.0%Curriculum and Instruction 4 3 1 0 0 3.2% 0.0% -100.0%Educational Adm. & Sup. (MEd)** 23 51 46 20 10 5.6% -50.0% -56.5%Educational Administration (EdS) 23 52 37 14 1 6.2% -92.9% -95.7%Educational Leadership * * * 25 70 5.0% 180.0% 100.0%Educational Media*** 29 33 21 4 0 3.1% -100.0% -100.0%Elementary Education 17 8 12 14 15 1.5% 7.1% -11.8%Family Consumer Science 5 1 3 1 0 1.2% -100.0% -100.0%Middle Level Education * * * * 17 4.5% 100.0% 100.0%Physical Education 3 6 5 8 10 4.2% 25.0% 233.3%Reading 18 24 23 43 68 8.8% 58.1% 277.8%Secondary Education (MAT) 44 48 58 58 51 6.2% -12.1% 15.9%Secondary Education (MEd) 10 9 9 9 10 0.9% 11.1% 0.0%Special Education 12 17 13 11 9 1.2% -18.2% -25.0%
VISUAL & PERFORMING ARTS 31 23 15 15 21 2.1% 40.0% -32.3%Art Education 10 10 4 0 2 0.5% 100.0% -80.0%Conducting * * * * 3 0.1% 100.0% 100.0%Fine Arts 8 5 5 4 4 0.5% 0.0% -50.0%Music Education 5 2 3 3 6 0.4% 100.0% 20.0%Music Performance 8 6 3 8 6 0.6% -25.0% -25.0%
UNDESIGNATED/UNASSIGNED 442 349 369 361 290 36.5% -19.7% -34.4%ACRT 11 4 3 3 4 0.5% 33.3% -63.6%GNDG 394 309 345 244 275 31.6% 12.7% -30.2%ICRT 5 1 3 4 0.3% 33.3% -20.0%RCRT 0 6 3 74 6 1.8% -91.9% 100.0%TRNS 2 4 2 4 1 0.3% -75.0% -50.0%Degree Programs (GS Class) 30 25 16 33 0 2.1% -100.0% -100.0%
TOTAL 1,121 1,002 957 947 937 100.0% -1.1% -16.4%* New program** MEd EDAS changed to MEd EDLD in Fall 1999*** Program discontinued
III-16 SOURCE: INSTITUTIONAL RESEARCH

Ratio of FTE Students to FTE Teaching FacultyFALL 1996 - FALL 2000
(Performance Funding Indicator 3A)
FALL FALL FALL FALL FALL
1996 1997 1998 1999 2000
Credit Hour Production 62,842 64,715 65,026 68,792 71,462
Undergraduate 56,619 58,588 59,249 63,156 64,389
Graduate 6,223 6,127 5,777 5,636 7,073
FTE Students* 4,293 4,416 4,431 4,680 4,882
Undergraduate 3,775 3,906 3,950 4,210 4,293
Graduate 519 511 481 470 589
FTE Teaching Faculty** 298 281 303 328 324
FTE Students/FTE Faculty 14.4 15.7 14.6 14.3 15.1
* FTE Students = CHP divided by 15 for undergraduates & 12 for graduates.
** FTE Teaching Faculty=Headcount FT Instructional Faculty(who teach at least 3 hrs Fall) and FTE
of Part-time faculty.

CREDIT HOUR PRODUCTION BY DEPARTMENT
FALL 1996 - FALL 2000
99 TO 00 96 TO 00
DEPARTMENT FALL 1996 FALL 1997 FALL 1999 % DIFF. % DIFF.
UG G UG G UG G UG G UG G UG G UG G
Arts and Sciences 33,567 1,504 33,038 1,421 33,602 1,325 36,139 1,314 37,440 1,202 3.6% -8.5% 11.5% -20.1%
Biology 3,864 125 3,642 123 3,999 139 4,248 112 4,461 95 5.0% -15.2% 15.5% -24.0%
BIOL 3,576 125 3,381 123 3,858 133 4,061 108 4,105 95 1.1% -12.0% 14.8% -24.0%
SCIE 288 0 261 0 141 6 187 4 356 0 90.4% -100.0% 23.6% 0.0%
Chemistry 2,568 6 2,333 12 2,460 3 2,539 15 2,479 21 -2.4% 40.0% -3.5% 250.0%
CHEM 991 6 1,068 12 1,102 3 1,385 15 1,029 21 -25.7% 40.0% 3.8% 250.0%
GEOL 814 0 738 0 714 0 678 0 759 0 11.9% 0.0% -6.8% 0.0%
PHSC 483 0 196 0 373 0 193 0 355 0 83.9% 0.0% -26.5% 0.0%
PHYS 280 0 331 0 271 0 283 0 336 0 18.7% 0.0% 20.0% 0.0%
Engish 5,978 249 6,058 207 6,155 183 6,306 210 6,392 144 1.4% -31.4% 6.9% -42.2%
ANTH 426 0 396 0 549 0 507 0 555 0 9.5% 0.0% 30.3% 0.0%
ENGL 2,081 222 1,971 171 1,950 153 1,809 156 1,893 114 4.6% -26.9% -9.0% -48.6%
ENGE N/A N/A N/A N/A 32 0 44 9 40 12 -9.1% 33.3% N/A N/A
WRIT 3,471 27 3,691 36 3,624 30 3,946 45 3,904 18 -1.1% -60.0% 12.5% -33.3%
History 3,592 162 3,434 147 3,538 87 3,515 142 3,919 148 11.5% 4.2% 9.1% -8.6%
HIST 3,568 144 3,428 126 3,522 72 3,496 108 3,883 120 11.1% 11.1% 8.8% -16.7%
SCST 24 18 6 21 16 15 19 34 36 28 89.5% -17.6% 50.0% 55.6%
Human Nutrition 1,114 243 1,356 192 1,289 204 1,272 162 1,141 132 -10.3% -18.5% 2.4% -45.7%
NUTR 718 243 540 192 497 204 468 162 487 132 4.1% -18.5% -32.2% -45.7%
GEOG 396 0 816 0 792 0 804 0 654 0 -18.7% 0.0% 65.2% 0.0%
Mass Communication 1,011 0 997 0 1,065 0 1,259 0 1,169 0 -7.1% 0.0% 15.6% 0.0%
MCOM 1,011 0 966 0 1,027 0 1,201 0 1,130 0 -5.9% 0.0% 11.8% 0.0%
IMCO 0 0 31 0 38 0 58 0 39 0 -32.8% 0.0% 100.0% 0.0%
Mathematics 4,284 108 4,314 144 4,198 75 4,428 63 4,244 39 -4.2% -38.1% -0.9% -63.9%
MAED 30 57 18 42 16 3 16 0 0 0 -100.0% 0.0% -100.0% -100.0%
MATH 4,254 51 4,296 102 4,182 72 4,412 63 4,244 39 -3.8% -38.1% -0.2% -23.5%
Modern & Classical Lang. 2,047 84 2,180 54 2,285 51 2,543 67 3,347 42 31.6% -37.3% 63.5% -50.0%
CHIN 36 0 21 0 21 0 30 0 32 0 6.7% 0.0% -11.1% 0.0%
FLAN 5 0 0 0 0 0 0 0 0 0 0.0% 0.0% -100.0% 0.0%
FREN 522 0 533 6 475 0 601 12 671 0 11.6% -100.0% 28.5% 0.0%
GERM 192 0 180 0 201 0 195 0 236 0 21.0% 0.0% 22.9% 0.0%
ITAL 0 0 0 0 0 0 126 0 144 0 14.3% 0.0% 100.0% 0.0%
JAPN 42 0 66 0 51 0 42 0 48 0 14.3% 0.0% 14.3% 0.0%
LATN 60 0 78 0 78 0 57 0 80 0 40.4% 0.0% 33.3% 0.0%
MLAN 12 6 9 0 32 0 20 4 12 0 -40.0% -100.0% 0.0% -100.0%
RUSS 0 0 42 0 30 0 0 0 0 0 0.0% 0.0% 0.0% 0.0%
SPAN 1,178 78 1,251 48 1,397 51 1,472 51 2,124 42 44.3% -17.6% 80.3% -46.2%
Philosophy & Religion 859 0 990 0 872 0 1,002 0 1,070 0 6.8% 0.0% 24.6% 0.0%
PHIL 433 0 570 0 459 0 493 0 505 0 2.4% 0.0% 16.6% 0.0%
RELG 426 0 420 0 413 0 509 0 565 0 11.0% 0.0% 32.6% 0.0%
Political Science 2,413 30 2,375 15 2,154 6 2,400 9 2,550 12 6.3% 33.3% 5.7% -60.0%
PLSC 2,413 30 2,375 15 2,154 6 2,400 9 2,550 12 6.3% 33.3% 5.7% -60.0%
Psychology 2,343 359 2,203 404 2,301 448 2,743 432 2,723 442 -0.7% 2.3% 16.2% 23.1%
PSYC 2,343 359 2,203 404 2,301 448 2,743 432 2,723 442 -0.7% 2.3% 16.2% 23.1%
Sociology 1,798 15 1,530 3 1,605 12 1,948 15 2,131 6 9.4% -60.0% 18.5% -60.0%
GRNT 57 0 0 0 3 0 3 0 3 0 0.0% 0.0% -94.7% 0.0%
SOCL 1,741 15 1,500 3 1,548 12 1,894 15 2,050 6 8.2% -60.0% 17.7% -60.0%
WMST 0 0 30 0 54 0 51 0 78 0 52.9% 0.0% 100.0% 0.0%
Social Work 965 0 914 0 973 9 1,022 9 909 48 -11.1% 433.3% -5.8% 100.0%
CMVS N/A N/A N/A N/A N/A N/A 3 0 0 0 -100.0% 0.0% N/A N/A
SCWK 965 0 914 0 973 9 1,019 9 909 48 -10.8% 433.3% -5.8% 100.0%
Speech 714 0 686 0 684 0 837 0 831 16 -0.7% 100.0% 16.4% 100.0%
SPCH 714 0 686 0 684 0 837 0 795 0 -5.0% 0.0% 11.3% 0.0%
SPDC N/A N/A N/A N/A N/A N/A N/A N/A 36 16 N/A N/A N/A N/A
Other 17 123 26 120 24 108 77 78 74 57 -3.9% -26.9% 335.3% -53.7%
HONR 11 0 16 0 24 0 38 0 53 0 39.5% 0.0% 381.8% 0.0%
INAS 6 0 10 0 0 0 39 0 21 0 -46.2% 0.0% 250.0% 0.0%
LART 0 123 0 120 0 108 0 78 0 57 0.0% -26.9% 0.0% -53.7%
FALL 1998 FALL 2000
SOURCE: INSTITUTIONAL RESEARCH

CREDIT HOUR PRODUCTION BY DEPARTMENT
FALL 1996 - FALL 2000
99 TO 00 96 TO 00
DEPARTMENT FALL 1996 FALL 1997 Fall 1999 Fall 2000 % DIFF. % DIFF.
UG G UG G UG G UG G UG G UG G UG G
Business Admin. 8,754 1,749 9,848 1,513 9,750 1,360 10,787 1,317 10,798 2,009 0.1% 52.5% 23.3% 14.9%
Acct, Finance, & Econ. 3,288 348 3,789 306 3,654 306 4,121 291 4,011 537 -2.7% 84.5% 22.0% 54.3%
ACCT 1,197 264 1,287 171 1,329 189 1,550 246 1,449 435 -6.5% 76.8% 21.1% 64.8%
ECON 1,389 6 1,713 30 1,563 30 1,788 3 1,806 3 1.0% 0.0% 30.0% -50.0%
FINC 702 78 789 105 762 87 783 42 756 99 -3.4% 135.7% 7.7% 26.9%
Com. Sci. & Quan. Meth. 2,310 96 2,371 75 2,359 117 2,399 57 2,441 105 1.8% 84.2% 5.7% 9.4%
CSCI 1,530 0 1,582 0 1,537 0 1,679 0 1,670 18 -0.5% 100.0% 9.2% 100.0%
QMTH 780 96 789 75 822 117 720 57 771 87 7.1% 52.6% -1.2% -9.4%
Management & Mktg. 3,156 1,305 3,657 1,132 3,699 937 4,209 969 4,307 1,367 2.3% 41.1% 36.5% 4.8%
BADM 405 927 516 790 642 601 663 756 755 1,055 13.9% 39.6% 86.4% 13.8%
HLAD/HLSM 363 0 318 0 279 321 0 285 0 -11.2% 0.0% -21.5% 0.0%
MGMT 1,692 369 1,956 330 1,914 330 1,923 213 2,160 309 12.3% 45.1% 27.7% -16.3%
MKTG 696 9 867 12 864 6 1,080 0 921 3 -14.7% 100.0% 32.3% -66.7%
SPMA N/A N/A N/A N/A N/A N/A 222 0 186 0 -16.2% 0.0% N/A N/A
Integrated Mktg.Com. 0 0 31 0 38 0 58 0 39 0 -32.8% 0.0% 100.0% 0.0%
IMCO 0 0 31 0 38 0 58 0 39 0 -32.8% 0.0% 100.0% 0.0%
Education 6,632 2,670 7,109 3,024 6,993 2,904 6,948 2,849 7,198 3,714 3.6% 30.4% 8.5% 39.1%
Center for Pedagogy 2,499 444 3,279 417 2,960 1,179 3,206 1,250 3,159 603 -1.5% -51.8% 26.4% 35.8%
EDUC 2,499 444 3,279 417 2,960 1,179 3,206 1,250 3,159 603 -1.5% -51.8% 26.4% 35.8%
Curriculum & Inst. 2,462 600 2,215 645 2,282 441 1,861 330 1,957 345 5.2% 4.5% -20.5% -42.5%
ECED 591 0 515 0 486 0 278 3 453 0 62.9% -100.0% -23.4% 0.0%
EDCI N/A N/A N/A N/A N/A N/A 51 0 150 66 194.1% 100.0% N/A N/A
EDMD 96 135 117 177 90 90 81 30 99 21 22.2% -30.0% 3.1% -84.4%
ELEM 547 48 509 39 655 0 492 3 396 0 -19.5% -100.0% -27.6% -100.0%
READ 511 81 549 120 446 117 464 84 405 150 -12.7% 78.6% -20.7% 85.2%
SCED 0 123 0 177 0 132 0 111 0 9 0.0% -91.9% 0.0% -92.7%
SPED 480 129 387 96 445 66 361 84 293 87 -18.8% 3.6% -39.0% -32.6%
VCED 237 84 138 36 160 36 134 15 161 12 20.1% -20.0% -32.1% -85.7%
Counsel. & Leadership 0 1,377 0 1,368 0 759 0 633 0 702 0.0% 10.9% 0.0% -49.0%
ADSP 0 465 0 567 0 522 0 0 0 0 0.0% 0.0% 0.0% -100.0%
CSDV 0 912 0 801 0 237 0 270 0 240 0.0% -11.1% 0.0% -73.7%
EDLD N/A N/A N/A N/A N/A N/A 0 363 0 462 0.0% 27.3% N/A N/A
Physical Education 1,671 63 1,600 78 1,751 75 1,881 636 2,082 2,064 10.7% 224.5% 24.6% 3176.2%
HLTH 396 9 342 36 366 27 390 21 420 12 7.7% -42.9% 6.1% 33.3%
PHED 1,275 54 1,258 42 1,385 48 1,269 63 1,464 79 15.4% 25.4% 14.8% 46.3%
SPMA N/A N/A N/A N/A N/A N/A 222 0 186 0 -16.2% 0.0% N/A N/A
WPDC N/A N/A N/A N/A N/A N/A 0 552 12 1,973 100.0% 257.4% N/A N/A
Other 0 186 15 516 0 450 0 0 0 0 0.0% 0.0% 0.0% -100.0%
WSDT 0 186 15 516 0 450 0 0 0 0 0.0% 0.0% 0.0% -100.0%
Visual & Perf.Arts 6,858 294 7,715 166 8,117 188 8,599 156 8,762 226 1.9% 44.9% 27.8% -23.1%
Art & Design 3,331 159 4,177 84 4,181 114 4,648 67 4,802 86 3.3% 28.4% 44.2% -45.9%
ARTE 57 54 114 39 110 51 103 34 96 22 -6.8% -35.3% 68.4% -59.3%
ARTH 714 48 891 6 858 21 1,035 0 1,005 9 -2.9% 100.0% 40.8% -81.3%
ARTS 1,830 57 2,247 30 2,320 39 2,464 33 2,603 55 5.6% 66.7% 42.2% -3.5%
ARTT 372 0 499 0 478 0 458 0 483 0 5.5% 0.0% 29.8% 0.0%
INDS 358 0 426 9 415 3 588 0 615 0 4.6% 0.0% 71.8% 0.0%
Dance/Theatre 1,390 0 1,499 3 1,671 0 1,792 8 1,724 7 -3.8% -12.5% 24.0% 100.0%
DANA 173 0 250 0 219 0 261 0 270 0 3.4% 0.0% 56.1% 0.0%
DANT 156 0 154 0 255 0 271 0 310 4 14.4% 100.0% 98.7% 100.0%
THRA 600 0 602 0 651 0 722 3 617 3 -14.5% 0.0% 2.8% 100.0%
THRT 461 0 493 3 546 0 538 5 527 0 -2.0% -100.0% 14.3% 0.0%
Music 2,137 135 2,039 79 2,265 74 2,159 81 2,236 133 3.6% 64.2% 4.6% -1.5%
MUSA 652 40 706 33 731 20 682 25 698 61 2.3% 144.0% 7.1% 52.5%
MUST 1,485 95 1,333 46 1,534 54 1,477 56 1,538 72 4.1% 28.6% 3.6% -24.2%
Other 0 0 0 0 0 0 0 0 0 0 0.0% 0.0% 0.0% 0.0%
VPAS 0 0 0 0 0 0 0 0 0 0 0.0% 0.0% 0.0% 0.0%
Interdisciplinary 814 0 943 0 863 0 1,243 0 1,162 0 -6.5% 0.0% 42.8% 0.0%
CISM 814 0 912 0 825 0 963 0 937 0 -2.7% 0.0% 15.1% 0.0%
IMCO 0 0 31 0 38 0 58 0 39 0 -32.8% 0.0% 100.0% 0.0%
SPMA N/A N/A N/A N/A N/A N/A 222 0 186 0 -16.2% 0.0% N/A N/A
Grand Total 56,625 6,217 58,591 6,124 59,249 5,777 63,156 5,636 64,910 7,151 2.8% 26.9% 14.6% 15.0%
FALL 1998
SOURCE: INSTITUTIONAL RESEARCH

CREDIT HOUR PRODUCTION BY DEPARTMENTSPRING 1997 - SPRING 2001
SPRING 1997 SPRING 1998 SPRING 1999 SPRING 2000 SPRING 2001 00 TO 01 % DIFF. 97 TO 01 % DIFF.UNIT/DEPARTMENT UG G UG G UG G UG G UG G UG G UG G
Arts and Sciences 29,887 1,383 30,265 1,362 30,572 1,087 32,505 1,139 34,631 1,003 6.5% -11.9% 15.9% -27.5%Biology 3,520 100 3,188 91 3,438 79 3,894 88 4,159 71 6.8% -19.3% 18.2% -29.0%
BIOL 3,250 100 3,038 91 3,261 79 3,792 88 3,931 71 3.7% -19.3% 21.0% -29.0%SCIE 270 150 177 102 228 123.5% 0.0% -15.6% 0.0%
Chemistry 2,550 15 2,478 12 2,141 15 2,202 3 2,028 3 -7.9% 0.0% -20.5% -80.0%CHEM 882 15 844 12 824 15 1,117 3 708 3 -36.6% 0.0% -19.7% -80.0%GEOL 1,028 728 647 618 821 32.8% 0.0% -20.1% 0.0%PHSC 292 521 284 96 220 129.2% 0.0% -24.7% 0.0%PHYS 348 385 386 371 279 -24.8% 0.0% -19.8% 0.0%
English 5,329 279 5,647 261 5,331 168 5,677 225 5,223 174 -8.0% -22.7% -2.0% -37.6%ANTH 399 540 624 577 331 -42.6% 0.0% -17.0% 0.0%ENGL 2,049 213 2,041 195 1,816 108 1,968 195 1,725 120 -12.3% -38.5% -15.8% -43.7%WRIT 2,881 66 3,066 66 2,891 60 3,132 30 3,167 54 1.1% 80.0% 9.9% -18.2%
History 2,949 120 2,913 114 3,264 81 3,441 142 3,576 108 3.9% -23.9% 21.3% -10.0%HIST 2,949 120 2,913 111 3,264 81 3,441 142 3,576 108 3.9% -23.9% 21.3% -10.0%SCST 3 0.0% 0.0% 0.0% 0.0%
Human Nutrition 1,050 261 1,207 254 1,101 225 1,209 194 1,307 162 8.1% -16.5% 24.5% -37.9%NUTR 474 261 373 254 360 216 438 194 486 162 11.0% -16.5% 2.5% -37.9%GEOG 576 834 741 9 771 821 6.5% 0.0% 42.5% 0.0%
Mass Communication 850 9 846 6 956 0 1,050 0 1,345 0 28.1% 0.0% 58.2% 0.0%MCOM 850 9 834 6 925 981 1,255 27.9% 0.0% 47.6% -100.0%IMCO 12 31 69 90 30.4% 0.0% 100.0% 0.0%
Mathematics 3,035 84 3,008 66 3,103 57 3,057 27 3,414 27 11.7% 0.0% 12.5% -67.9%MAED/MPDC 12 9 15 3 9 3 72 87 6 20.8% 100.0% 625.0% -33.3%
MATH 3,023 75 2,993 63 3,094 54 2,985 27 3,327 21 11.5% -22.2% 10.1% -72.0%Modern & Classical Lang. 1,893 75 2,094 51 2,163 54 2,256 51 3,112 48 37.9% -5.9% 64.4% -36.0%
CHIN 21 18 12 12 20 66.7% 0.0% -4.8% 0.0%FLAN 3 0.0% 0.0% -100.0% 0.0%FREN 580 18 564 6 561 6 633 6 703 3 11.1% -50.0% 21.2% -83.3%GERM 174 165 168 147 196 33.3% 0.0% 12.6% 0.0%ITAL 66 88 33.3% 0.0% 100.0% 0.0%JAPN 42 48 36 39 44 12.8% 0.0% 4.8% 0.0%LATN 24 36 36 27 48 77.8% 0.0% 100.0% 0.0%MLAN 18 -100.0% 0.0% 0.0% 0.0%RUSS 21 18 0.0% 0.0% 0.0% 0.0%SPAN 1,049 57 1,242 45 1,332 48 1,314 45 2,013 45 53.2% 0.0% 91.9% -21.1%
Philosophy & Religion 1,066 0 1,005 0 1,101 0 1,144 0 1,129 0 -1.3% 0.0% 5.9% 0.0%PHIL 591 543 608 603 637 5.6% 0.0% 7.8% 0.0%RELG 475 462 493 541 492 -9.1% 0.0% 3.6% 0.0%
Political Science 2,044 15 2,029 9 2,006 15 1,989 6 2,247 0 13.0% -100.0% 9.9% -100.0%PLSC 2,044 15 2,029 9 2,006 15 1,989 6 2,247 13.0% -100.0% 9.9% -100.0%
Psychology 2,235 308 2,163 375 2,342 297 2,364 328 2,482 340 5.0% 3.7% 11.1% 10.4%PSYC 2,235 308 2,163 375 2,342 297 2,364 328 2,482 340 5.0% 3.7% 11.1% 10.4%
Sociology 1,584 24 1,758 24 1,721 3 2,030 12 2,068 10 1.9% -16.7% 30.6% -58.3%GRNT 66 75 48 -100.0% 0.0% 0.0% 0.0%SOCL 1,539 24 1,692 24 1,646 3 1,982 12 2,068 10 4.3% -16.7% 34.4% -58.3%WMST 45 0.0% 0.0% -100.0% 0.0%
Social Work 956 6 1,109 21 1,047 12 1,083 6 1,148 9 6.0% 50.0% 20.1% 50.0%CMVS 21 63 200.0% 0.0% 100.0% 0.0%SCWK 956 6 1,109 21 1,047 12 1,062 6 1,085 9 2.2% 50.0% 13.5% 50.0%
Speech 702 0 705 0 741 0 942 0 843 0 -10.5% 0.0% 20.1% -100.0%SPCH 702 705 741 942 843 -10.5% 0.0% 20.1% 0.0%
Other 124 87 115 78 117 81 167 57 550 51 229.3% -10.5% 343.5% -41.4%AAMS 66 63 93 93 90 -3.2% 0.0% 36.4% 0.0%GNED 411 100.0% 0.0% 100.0% 0.0%HONR 19 33 18 59 46 -22.0% 0.0% 142.1% 0.0%INAS 39 19 6 15 3 -80.0% 0.0% -92.3% 0.0%LART 87 78 81 57 51 0.0% -10.5% 0.0% -41.4%

CREDIT HOUR PRODUCTION BY DEPARTMENTSPRING 1997 - SPRING 2001
SPRING 1997 SPRING 1998 SPRING 1999 SPRING 2000 SPRING 2001 00 TO 01 % DIFF. 97 TO 01 % DIFF.UNIT/DEPARTMENT UG G UG G UG G UG G UG G UG G UG G
Business Administration 8,830 1,626 9,077 1,302 9,852 1,171 10,087 1,284 10,839 1,782 7.5% 38.8% 22.8% 9.6%Account, Finance, & Economics 3,303 267 3,474 219 3,747 216 3,843 306 4,246 258 10.5% -15.7% 28.5% -3.4%
ACCT 1,248 168 1,302 117 1,356 117 1,404 165 1,378 93 -1.9% -43.6% 10.4% -44.6%ECON 1,428 24 1,491 1,707 9 1,674 6 1,923 9 14.9% 50.0% 34.7% -62.5%FINC 627 75 681 102 684 90 765 135 945 156 23.5% 15.6% 50.7% 108.0%
Computer Sci. & Quantitative Meth. 2,114 66 2,193 84 2,187 45 2,264 87 2,353 126 3.9% 44.8% 11.3% 90.9%CSCI 1,424 1,473 1,446 1,457 6 1,555 27 6.7% 350.0% 9.2% 100.0%
QMTH 690 66 720 84 741 45 807 81 798 99 -1.1% 22.2% 15.7% 50.0%Management & Marketing 3,413 1,293 3,398 999 3,887 910 3,911 891 4,150 1,398 6.1% 56.9% 21.6% 8.1%
BADM 365 858 374 654 560 643 608 612 715 1,074 17.6% 75.5% 95.9% 25.2%HLAD/HLSM 294 39 252 255 192 225 17.2% 0.0% -23.5% -100.0%
MGMT 1,953 378 1,893 327 1,998 255 1,929 270 2,118 324 9.8% 20.0% 8.4% -14.3%MKTG 801 18 879 18 1,074 12 1,161 9 1,065 -8.3% -100.0% 33.0% -100.0%SPMA 21 27 28.6% 0.0% 100.0% 0.0%
Integrated Marketing Comm 12 31 69 90 30.4% 0.0% 100.0% 0.0%IMCO 12 31 69 90 30.4% 0.0% 100.0% 0.0%
Education 6,636 2,529 7,265 2,352 7,054 2,397 6,881 2,067 6,999 2,206 1.7% 6.7% 5.5% -12.8%Center for Pedagogy 3,176 465 3,743 420 3,703 490 3,652 422 3,427 549 -6.2% 30.1% 7.9% 18.1%
EDUC 3,176 465 3,743 420 3,703 490 3,652 422 3,427 549 -6.2% 30.1% 7.9% 18.1%Curriculum & Instruction 1,654 600 1,576 651 1,546 642 1,411 825 1,559 867 10.5% 5.1% -5.7% 44.5%
EDCI 0 3 72 168 66 133.3% 100.0% 0.0% 100.0%ECED 246 6 256 3 277 141 78 -44.7% 0.0% -68.3% -100.0%EDLD 480 501 0.0% 4.4% 0.0% 100.0%EDMD 108 159 126 210 123 159 96 96 -100.0% -100.0% -100.0% -100.0%ELEM 259 6 235 311 30 277 54 286 6 3.2% -88.9% 10.4% 0.0%READ 490 24 468 42 427 42 381 39 495 183 29.9% 369.2% 1.0% 662.5%SCED 231 279 264 12 0.0% -100.0% 0.0% -100.0%SPED 378 60 303 69 198 138 189 102 279 102 47.6% 0.0% -26.2% 70.0%VCED 173 114 188 48 210 6 255 42 253 9 -0.8% -78.6% 46.2% -92.1%
Counseling & Leadership 0 921 0 927 0 741 0 261 0 390 0.0% 49.4% 0.0% -57.7%ADSP 525 675 459 0.0% 0.0% 0.0% -100.0%CSDV 396 252 282 261 390 0.0% 49.4% 0.0% -1.5%
Physical Education 1,806 75 1,946 75 1,802 68 1,818 104 2,013 91 10.7% -12.5% 11.5% 21.3%HLTH/WELL 381 36 435 36 489 21 435 24 501 9 15.2% -62.5% 31.5% -75.0%
PHED 1,425 39 1,511 39 1,313 47 1,362 80 1,485 82 9.0% 2.5% 4.2% 110.3%SPMA 21 27 28.6% 0.0% 100.0% 0.0%
Other 468 279 3 456 0 455 0 309 0.0% -32.1% 0.0% -34.0%WSDT/WPDC 468 279 3 456 455 309 0.0% -32.1% 0.0% -34.0%
Visual & Performing Arts 6,553 228 7,160 151 7,574 162 7,740 187 8,024 181 3.7% -3.2% 22.4% -20.6%Art & Design 3,290 120 3,674 66 4,054 111 4,254 77 4,439 60 4.3% -22.1% 34.9% -50.0%
ARTE 171 33 159 18 180 42 183 12 180 12 -1.6% 0.0% 5.3% -63.6%ARTH 750 3 960 15 900 24 1,116 3 1,140 15 2.2% 400.0% 52.0% 400.0%ARTS 1,668 78 1,890 30 2,147 42 2,099 59 2,268 33 8.1% -44.1% 36.0% -57.7%ARTT 359 311 356 400 425 6.3% 0.0% 18.4% 0.0%INDS 342 6 354 3 471 3 456 3 426 -6.6% -100.0% 24.6% -100.0%
Dance/Theatre 1,508 0 1,734 0 1,624 0 1,594 3 1,637 0 2.7% -100.0% 8.6% 0.0%DANA 207 197 227 236 279 18.2% 0.0% 34.8% 0.0%DANT 289 230 291 290 257 -11.4% 0.0% -11.1% 0.0%THRA 578 690 647 643 588 -8.6% 0.0% 1.7% 0.0%THRT 434 617 459 425 3 513 20.7% -100.0% 18.2% 0.0%
Music 1,755 99 1,752 67 1,896 48 1,892 107 1,948 118 3.0% 10.3% 11.0% 19.2%MUSA 637 33 665 28 628 12 607 32 642 59 5.8% 84.4% 0.8% 78.8%MUST 1,118 66 1,087 39 1,268 36 1,285 75 1,306 59 1.6% -21.3% 16.8% -10.6%
Other 0 9 0 18 0 3 0 0 0 3 0.0% 100.0% 0.0% 0.0%VPAS 9 18 3 3 0.0% 100.0% 0.0% -66.7%
Interdisciplinary 9 12 31 90 117 30.0% 0.0% 1200.0% 0.0%CISM 9 0.0% 0.0% -100.0% 0.0%IMCO 12 31 69 90 30.4% 0.0% 100.0% 0.0%SPMA 21 27 28.6% 0.0% 100.0% 0.0%
GRAND TOTAL 51,915 5,766 53,755 5,167 55,021 4,817 57,123 4,677 60,376 5,172 5.7% 10.6% 16.3% -10.3%

CREDIT HOUR PRODUCTION BY DEPARTMENTSUMMER 1996 - SUMMER 2000
99 TO 00 96 TO 00DEPARTMENT SUM 1996 SUM 1997 SUM 1998 SUM 1999 SUM 2000 % DIFF. % DIFF.
Arts and Sciences UG G UG G UG G UG G UG G UG G UG GBiology 479 67 378 54 451 7 548 3 505 4 -7.8% 33.3% 5.4% -94.0%
BIOL 317 67 291 54 322 7 368 3 349 4 -5.2% 33.3% 10.1% -94.0%SCIE 162 0 87 0 129 180 156 -13.3% 0.0% -3.7% 0.0%
Chemistry 746 66 573 6 590 33 481 0 585 0 21.6% 0.0% -21.6% -100.0%CHEM 400 24 285 6 288 33 229 336 46.7% 0.0% -16.0% -100.0%GEOL 80 0 1 0 87 105 114 8.6% 0.0% 42.5% 0.0%PHSC 211 0 225 0 161 66 69 4.5% 0.0% -67.3% 0.0%PHYS 55 42 62 54 81 66 -18.5% 0.0% 20.0% -100.0%
Engish 623 402 639 210 558 177 786 132 870 162 10.7% 22.7% 39.6% -59.7%ANTH 93 0 60 63 102 147 44.1% 0.0% 58.1% 0.0%ENGL 292 318 303 114 267 96 420 78 357 84 -15.0% 7.7% 22.3% -73.6%WRIT 238 84 276 96 228 81 264 54 366 78 38.6% 44.4% 53.8% -7.1%
History 232 45 309 57 264 33 319 72 294 99 -7.8% 37.5% 26.7% 120.0%HIST 232 45 309 57 264 33 319 72 294 99 -7.8% 37.5% 26.7% 120.0%
Human Nutrition 87 100 75 157 238 127 237 150 251 124 5.9% -17.3% 188.5% 24.0%NUTR 12 100 75 157 142 127 78 150 116 124 48.7% -17.3% 866.7% 24.0%GEOG 75 0 96 159 135 -15.1% 0.0% 80.0% 0.0%
Mass Communication 22 17 18 29 6 42 9 69 0 64.3% -100.0% 213.6% 0.0%MCOM 22 0 17 18 29 6 42 9 69 64.3% -100.0% 213.6% 0.0%
Mathematics 600 90 522 27 540 15 660 15 486 45 -26.4% 200.0% -19.0% -50.0%MAED 0 81 0.0% 0.0% 0.0% -100.0%MATH 600 9 522 27 540 15 660 15 486 45 -26.4% 200.0% -19.0% 400.0%
Modern & Classical Lang. 183 30 312 81 201 45 186 24 298 48 60.2% 100.0% 62.8% 60.0%CHIN 15 0 0.0% 0.0% -100.0% 0.0%CLAS 0 0 0 0 0.0% 0.0% 0.0% 0.0%FREN 18 0 90 0 57 66 3 39 -40.9% -100.0% 116.7% 0.0%MLAN 60 18 93 6 100.0% 100.0% 100.0% 100.0%SPAN 150 30 162 63 144 45 120 21 166 42 38.3% 100.0% 10.7% 40.0%
Philosophy & Religion 99 184 183 180 219 21.7% 0.0% 121.2% 0.0%PHIL 33 88 78 114 105 -7.9% 0.0% 218.2% 0.0%RELG 66 96 105 66 114 72.7% 0.0% 72.7% 0.0%
Political Science 205 9 153 27 228 6 184 3 213 0 15.8% -100.0% 3.9% -100.0%PLSC 205 9 153 27 228 6 184 3 213 15.8% -100.0% 3.9% -100.0%
Psychology 303 474 303 399 201 351 252 306 268 123 6.3% -59.8% -11.6% -74.1%PSYC 303 474 303 399 201 351 252 306 268 123 6.3% -59.8% -11.6% -74.1%
Sociology 151 9 216 0 131 0 267 3 220 3 -17.6% 0.0% 45.7% -66.7%GRNT 3 -100.0% 0.0% 0.0% 0.0%SOCL 151 9 216 131 264 3 220 3 -16.7% 0.0% 45.7% -66.7%
Social Work 219 6 299 6 248 0 262 0 281 0 7.3% 0.0% 28.3% -100.0%SCWK 219 6 299 6 248 262 281 7.3% 0.0% 28.3% -100.0%
Speech 84 0 120 0 150 0 159 0 162 0 1.9% 0.0% 92.9% 0.0%SPCH 84 0 120 0 150 0 159 0 162 0 1.9% 0.0% 92.9% 0.0%
Other 3 9 0 0 0 0 6 0 3 0 -50.0% 0.0% 0.0% -100.0%INAS 3 9 0 0 0 0 6 0 3 -50.0% 0.0% 0.0% -100.0%
SOURCE: INSTITUTIONAL RESEARCH

CREDIT HOUR PRODUCTION BY DEPARTMENTSUMMER 1996 - SUMMER 2000
99 TO 00 96 TO 00DEPARTMENT SUM 1996 SUM 1997 SUM 1998 SUM 1999 SUM 2000 % DIFF. % DIFF.
Business Administration UG G UG G UG G UG G UG G UG G UG GAccount, Finance, & Economics 411 360 414 267 411 201 624 261 621 393 -0.5% 50.6% 51.1% 9.2%
ACCT 177 60 135 72 162 96 213 99 237 231 11.3% 133.3% 33.9% 285.0%ECON 159 165 186 102 150 60 270 105 201 108 -25.6% 2.9% 26.4% -34.5%FINC 75 135 93 93 99 45 141 57 183 54 29.8% -5.3% 144.0% -60.0%
Computer Sci. & Quantitative Meth. 240 36 174 33 218 81 249 45 248 108 -0.4% 140.0% 3.3% 200.0%CSCI 63 0 60 0 80 45 99 83 30 -16.2% 100.0% 31.7% 100.0%QMTH 177 36 114 33 138 36 150 45 165 78 10.0% 73.3% -6.8% 116.7%
Management & Marketing 552 480 564 549 597 435 697 333 753 258 8.0% -22.5% 36.4% -46.3%BADM 3 168 6 129 9 183 58 27 48 6 -17.2% -77.8% 1500.0% -96.4%
HLAD/HLSM 63 0 75 0 72 42 69 64.3% 0.0% 9.5% 0.0%MGMT 339 312 360 420 408 252 507 306 426 252 -16.0% -17.6% 25.7% -19.2%MKTG 147 0 123 0 108 90 180 100.0% 0.0% 22.4% 0.0%SPMA N/A N/A N/A N/A N/A N/A N/A N/A 30 100.0% 0.0% 100.0% 0.0%
EducationCenter for Pedagogy 1,080 495 930 498 386 444 310 468 270 369 -12.9% -21.2% -75.0% -25.5%
EDUC 1,080 495 930 498 386 444 310 468 270 369 -12.9% -21.2% -75.0% -25.5%Curriculum & Instruction 345 729 249 630 297 936 300 861 240 741 -20.0% -13.9% -30.4% 1.6%
CNPG 0 0 0 0 0.0% 0.0% 0.0% 0.0%ECED 33 27 -18.2% 0.0% 100.0% 0.0%EDCI 312 216 0.0% -30.8% 0.0% 100.0%
EDMD 39 111 51 168 63 105 54 24 33 6 -38.9% -75.0% -15.4% -94.6%ELEM 111 120 75 84 84 129 57 51 57 36 0.0% -29.4% -48.6% -70.0%READ 105 207 75 174 108 255 132 225 84 285 -36.4% 26.7% -20.0% 37.7%SCED 0 84 0 102 123 24 45 0.0% 87.5% 0.0% -46.4%SPED 54 75 30 66 249 3 189 135 -100.0% -28.6% -100.0% 80.0%VCED 36 132 18 36 42 75 21 36 39 18 85.7% -50.0% 8.3% -86.4%
Counseling & Leadership 771 681 0 756 0 597 0 625 0.0% 4.7% 0.0% -18.9%ADSP 294 345 453 333 0.0% -100.0% 0.0% -100.0%CSDV 477 336 303 264 307 0.0% 16.3% 0.0% -35.6%EDLD N/A N/A N/A N/A N/A N/A N/A N/A 318 0.0% 100.0% 0.0% 100.0%
Physical Education 124 48 119 33 181 21 180 1,259 329 904 82.8% -28.2% 165.3% 1783.3%HLTH 24 3 48 48 0.0% 0.0% 100.0% -100.0%PHED 100 45 119 33 181 21 129 9 242 6 87.6% -33.3% 142.0% -86.7%SPMA N/A N/A N/A N/A N/A N/A N/A N/A 30 100.0% 0.0% 100.0% 0.0%WPDC 0 3 1,250 9 898 200.0% -28.2% 100.0% 100.0%
Other 19 1,076 8 950 6 1,872 0 0 0 0.0% 0.0% -100.0% -100.0%WSDT 19 1,076 8 950 6 1,872 0.0% 0.0% -100.0% -100.0%
Visual & Performing ArtsArt & Design 144 168 150 117 189 87 152 90 147 48 -3.3% -46.7% 2.1% -71.4%
ARTE 0 60 0 57 45 15 30 0.0% 100.0% 0.0% -50.0%ARTH 6 45 3 54 6 33 39 36 15 18 -61.5% -50.0% 150.0% -60.0%ARTS 117 63 129 6 150 6 113 33 132 16.8% -100.0% 12.8% -100.0%ARTT 3 18 0.0% 0.0% 0.0% 0.0%INDS 21 0 15 0 15 3 6 0.0% -100.0% -100.0% 0.0%
Dance/Theatre 0 0 4 72 46 0 61 0 24 3 -60.7% 100.0% 100.0% 100.0%DANA 0 0 0 0 4 0 0.0% 0.0% 0.0% 0.0%DANT 40 13 6 3 -53.8% 100.0% 100.0% 100.0%THRA 0 0 1 0 48 -100.0% 0.0% 0.0% 0.0%THRT 0 0 3 72 2 18 100.0% 0.0% 100.0% 0.0%
Music 9 153 23 58 21 39 109 91 59 100 -45.9% 9.9% 555.6% -34.6%MUSA 6 3 5 1 9 7 1 2 1 -71.4% 0.0% -66.7% -66.7%MUST 3 150 18 57 12 39 102 90 57 99 -44.1% 10.0% 1800.0% -34.0%
Other 18 0 0 0 87 0.0% 100.0% 0.0% 383.3%VPAS 0 18 87 0.0% 100.0% 0.0% 383.3%
Critical Issues Symposium 0 0 0 0 0 0.0% 0.0% 0.0% 0.0%CISM 0 0 0 0 0.0% 0.0% 0.0% 0.0%
GRAND TOTAL 6,960.0 5,641.0 6,735.0 4,930.0 6,364.0 5,672.0 7,251.0 4,722.0 7,385.0 4,244.0 1.8% -10.1% 6.1% -24.8%
SOURCE: INSTITUTIONAL RESEARCH

Average Number of Student Credit Hours Taught by Full-Time Teaching Faculty*(Performance Funding Indicator 3B)
FALL 1996 FALL 1997 FALL 1998 FALL 1999 FALL 2000 5-YEAR AVERAGECOLLEGE/DEPARTMENT headcount avg. hrs. headcount avg. hrs. headcount avg. hrs. headcount avg. hrs. headcount avg. hrs. headcount avg. hrs.
ARTS & SCIENCES 119 241.39 120 232.53 118 229.89 123 230.75 118 233.33 119.6 233.6Biology 12 227.42 13 232.53 13 200.08 12 191.75 12 209.83 12.4 212.3Chemistry and Physics 10 255.10 11 195.91 10 215.40 11 193.82 12 171.83 10.8 206.4English 20 209.70 22 203.68 20 192.35 22 209.09 21 214.00 21.0 205.8History 10 357.90 10 349.80 10 349.40 8 363.75 9 349.56 9.4 354.1Human Nutrition 4 160.75 4 124.00 5 172.00 5 193.20 5 217.40 4.6 173.5Mass Communication 6 157.00 6 161.50 6 167.50 5 205.60 5 180.00 5.6 174.3Mathematics 15 285.00 14 283.79 13 281.69 13 282.92 14 288.71 13.8 284.4Modern and Classical Lang. 8 174.13 8 206.50 7 208.57 10 159.20 7 176.86 8.0 185.1Philosophy & Religious Studies 3 311.67 2 364.50 3 307.67 3 335.00 3 362.67 2.8 336.3Political Science 6 297.67 7 314.71 6 290.33 6 280.17 5 232.00 6.0 283.0Psychology 12 202.17 11 195.55 12 201.00 13 218.46 12 238.83 12.0 211.2Social Work 5 210.80 4 191.00 4 245.50 5 184.00 4 132.00 4.4 192.7Sociology 6 302.17 5 246.20 6 224.67 7 293.29 7 225.29 6.2 258.3Speech 2 203.00 3 193.00 3 212.33 3 225.33 2 238.50 2.6 214.4
BUSINESS ADMINISTRATION 38 250.47 39 255.21 37 246.11 39 269.82 37 254.78 38.0 255.3Accounting, Finance & Econ. 15 244.27 14 252.86 15 237.40 15 253.47 13 243.92 14.4 246.4Computer Science & Quan. Meth. 9 274.11 9 275.00 9 284.44 9 306.89 10 275.50 9.2 283.2Management & Marketing 14 241.93 16 246.13 13 229.62 15 263.93 14 250.07 14.4 246.3
EDUCATION 41 162.88 39 184.46 38 179.16 40 162.43 37 162.80 39.0 170.3Center for Pedagogy 9 212.00 9 231.22 12 206.58 13 186.77 10 162.80 10.6 157.5Counseling and Leadership 8 116.25 7 111.57 6 125.33 7 104.29 5 85.20 6.6 108.5Curriculum and Instruction 16 156.69 15 198.87 13 179.15 13 157.15 14 191.50 14.2 176.7Health and Physical Education 8 166.63 8 168.63 7 178.29 7 185.14 8 203.00 7.6 180.3
VISUAL & PERFORMING ARTS 38 122.61 40 137.18 40 146.23 41 148.83 39 135.33 39.6 138.0Art and Design 18 128.50 18 150.89 18 155.50 18 157.78 18 146.46 18.0 147.8Music 13 105.69 14 105.00 15 118.80 15 113.60 14 107.14 14.2 110.0Theatre And Dance 7 138.86 8 162.63 7 181.14 8 194.75 7 164.14 7.4 168.3
TOTAL 236 212.68 238 210.09 233 212.34 243 209.84 231 210.85 236.2 211.2
*NOTE: For this performance indicator full-time teaching faculty is defined as full-time, unclassified faculty at the rank of instructor, assistant professor, associate professor, professor at institutions, who teach at least three credit hours, measured in the fall semester. Unclassified employees who hold positions above department chair, such as deans, vice presidents, and presidents are excluded.
SOURCE: INSTITUTIONAL RESEARCH AND PERFORMANCE FUNDING IV-8

AVERAGE CLASS SIZE OF LECTURE/LAB BY DISCIPLINE AND LEVEL
Program Discipline 1996 1997 1998 1999 2000Code Lower Div. Upper Div. Lower Div. Upper Div. Lower Div. Upper Div. Lower Div. Upper Div. Lower Div. Upper Div.0900 Communications 23.20 15.63 23.67 12.41 21.57 15.13 24.50 15.38 24.71 14.871100 Computer and Information Sciences 21.60 12.83 23.24 9.50 23.53 13.00 24.19 15.20 23.69 15.831300 Education 24.90 18.79 24.45 18.22 22.37 18.94 20.24 15.59 23.70 17.401600 Foreign Languages and Literatures 19.72 7.46 19.91 12.29 19.03 12.50 18.81 6.80 18.42 7.141900 Home Economics 44.00 18.20 41.00 17.18 35.00 17.00 44.00 14.30 48.00 14.452300 English Language and Literatures 20.18 13.71 20.50 15.10 21.97 15.03 21.49 17.03 21.09 15.062600 Biological Sciences/Life Sciences 33.59 16.23 31.87 16.74 35.33 16.65 33.25 17.78 35.06 14.712700 Mathematics 33.31 9.43 36.92 12.33 34.00 11.50 38.58 8.30 37.60 7.833000 Multi/Interdisciplinary Studies 15.81 19.00 15.72 10.00 16.04 18.00 17.41 8.50 15.68 10.673100 Sport Management * * * * * * 74.00 * 55.00 7.003800 Philosophy and Religion 35.40 18.33 34.67 30.50 36.20 20.20 36.75 26.57 35.80 35.404000 Physical Sciences 25.39 11.67 21.05 15.50 21.81 14.69 24.56 14.61 20.08 12.884200 Psychology 31.62 18.81 32.92 16.73 26.20 19.37 34.93 21.94 36.71 22.714400 Public Administration and Services 25.50 23.88 25.50 17.27 25.50 17.33 19.00 16.20 41.00 12.444500 Social Sciences and History 39.70 19.21 40.06 18.89 38.74 19.42 41.52 19.49 40.97 18.695000 Visual and Performing Arts 23.89 8.98 23.59 14.68 25.22 16.90 26.92 13.64 27.31 12.105200 Business Management and Admin. 36.74 24.93 39.62 27.46 41.76 25.21 38.12 29.60 37.85 27.74
University Total Average 26.10 16.97 26.17 18.38 26.19 18.61 27.20 17.96 26.85 17.51* New program

GRADUATE DEGREES CONFERREDBY DEGREE PROGRAM & SEMESTER
1994 - 2000
1994 1994 1995 1995 1995 1996 1996 1996 1997 1997 1997 1998 1998 1998 1999 1999 1999 2000 2000DEGREE PROGRAM SUM FALL SPR SUM FALL SPR SUM FALL SPR SUM FALL SPR SUM FALL SPR SUM FALL SPR SUM
ARTS & SCIENCES 4 13 24 9 20 33 9 17 31 14 19 36 6 17 32 7 11 35 11M.S. Biology 2 1 1 4 1 1 4 3 1 3 0 4 2 2M.A. English 1 3 5 3 3 3 1 3 2 4 6 4 2 1 2 0 4 1M.S. Human Nutrition 1 4 1 4 5 4 5 1 1 6 4 1 4 3 3 8 4 4M.A. History 2 1 1 2 4 2 1 1 4 1 1 3 0 1 1M.L.A. Liberal Arts 1 3 3 9 7 3 8 4 6 11 5 0 2 9MMTH Mathematics 1 1 1 1 1 1 0 3 0 1M.S. School Psychology 6 5 3 5 1 6 0 5 0 8 1S.S.P. School Psychology 5 1 5 9 6 0 6 1 6M.A. Spanish 1 3 2 1 1 3 1 2 2 0 1 1 2 3
BUSINESS ADMINISTRATION 14 30 44 11 22 39 15 27 39 18 27 40 26 22 31 17 30 34 12M.B.A. Business Administration 14 28 30 10 22 20 15 27 22 18 25 21 25 22 17 16 30 22 12Executive MBA 2 14 1 19 17 2 19 1 0 14 1 12
EDUCATION 33 33 56 30 36 48 41 26 49 33 16 49 44 26 56 53 33 32 24M.S. Business Education 1 1 1 1 2 12 1 1 0 4 2 4M.A.T. Business Education 1 2 1 5 1 1 1 1 1 1 3 3 1 0 4M. Ed. Counseling & Development 8 13 27 3 9 14 10 11 12 5 1 20 5 1 15 7 1Ed. S. Curriculum and Instruction 1 1 1 2 1 0 1M. Ed. Educ. Adm. and Supervision 3 3 3 2 9 9 9 3 6 6 4 3 8 4 10 21 10 1 4Ed. S. Educational Administration 1 4 3 4 1 1 2 3 4 1 2 3 7 1 2 4 9 3M. Ed. Educational Media 5 4 4 3 2 1 3 3 1 7 4 0 6 5 5 4M. Ed. Elementary Education 6 4 5 3 3 2 1 1 2 2 2 5 2 1 1 2 1M.S. Family Consumer Science 1 1 1 1 1 2 1 2M.S. Physical Education 1 1 2 1 1 1 0 1 0M. Ed. Reading 3 1 1 8 1 7 9 2 0 8 1 2 6M. Ed. Secondary Education 1 3 1 1 2 2 2 1 1 1 1 2M.A.T. Secondary Education 3 6 8 7 4 14 4 1 5 4 5 12 2 2 17 0 3 12 3M. Ed. Special Education 1 2 5 1 1 1 3 1 0 2 1 5
VISUAL & PERFORMING ARTS 1 6 11 1 1 5 2 2 6 2 3 7 2 2 5 4 1 3 0M.F.A Art and Design 1 2 1 3 3 1 0 2 0 1M.A. Art Education 1 2 2 2 2 0 4 1M.M.E. Music Education 1 2 3 1 1 1 1 1 1 0 2 0 1M.M. Music Performance 3 6 1 1 2 1 5 0 1 0 1
TOTAL 52 82 135 51 79 125 67 72 125 67 65 132 78 67 124 81 75 104 47
SOURCE: INSTITUTIONAL RESEARCH V-3

SOURCE: INSTITUTIONAL RESEARCH V-1
LEVEL/SEMESTER 90-91 91-92 92-93 93-94 94-95 95-96 96-97 97-98 98-99 99-00 00-01
Undergraduate 743 676 807 741 700 692 698 723 671 769 724
Summer 92 81 107 124 128 86 79 88 78 95 79
Fall 245 198 245 227 206 208 209 227 202 261 217
Spring 406 397 455 390 366 398 410 408 391 413 428
Graduate 266 275 278 277 269 255 264 264 269 260 219
Summer 66 70 82 79 52 51 64 67 78 81 50
Fall 88 76 77 73 82 79 72 65 67 75 77
Spring 112 129 119 125 135 125 128 132 124 104 92
Total UG & G 1,009 951 1,085 1,018 969 947 962 987 940 1,029 943
Summer 158 151 189 203 180 137 143 155 156 176 129
Fall 333 274 322 300 288 287 281 292 269 336 294
Spring 518 526 574 515 501 523 538 540 515 517 520
DEGREES CONFERREDBY LEVEL & SEMESTER
1990 - 2001

SOURCE: INSTITUTIONAL RESEARCH V-2
UNDERGRADUATE DEGREES CONFERREDBY DEGREE PROGRAM & SEMESTER
1995 - 20011995 1995 1996 1996 1996 1997 1997 1997 1998 1998 1998 1999 1999 1999 2000 2000 2000 2001 2001
DEGREE PROGRAM SUM FALL SPR SUM FALL SPR SUM FALL SPR SUM FALL SPR SUM FALL SPR SUM FALL SPR SUM
ARTS & SCIENCES 50 84 161 43 98 174 52 103 162 42 94 166 48 97 170 49 92 207 44 348 47.35%B.S. Biology 7 11 23 6 15 34 8 12 19 3 10 24 5 8 22 5 10 21 3 36 4.90%B.S. Chemistry 2 5 1 1 2 1 2 5 1 7 1 1 7 4 9 1.22%B.A. English 8 7 16 1 4 18 4 7 10 1 6 20 3 5 17 1 3 17 2 21 2.86%B.S. Human Nutrition 2 1 2 4 8 5 8 5 3 9 3 2 5 2 4 2 6 0.82%B.S. Integrated Marketing Comm. 2 1 0 6 0 4 10 3 9 15 7 27 3.67%B.A. History 3 6 17 7 9 10 4 14 13 4 11 16 4 8 14 8 10 10 7 28 3.81%B.A. Mass Communication 2 12 14 11 16 2 19 16 2 7 19 2 11 8 1 12 18 2 31 4.22%B.A. Communication Disorders 4 1 3 0 4 9 2 5 29 2 36 4.90%B.A. Mathematics 1 1 3 1 1 4 1 1 5 1 1 2 5 3 1 1 2 0.27%B.S. Mathematics 1 2 1 1 6 1 1 0 0 1 3 2 2 0.27%B.S. Medical Technology 1 2 0 0.00%B.A. Modern Languages 1 2 6 2 3 10 1 2 1 4 7 0 4 6 4 1 5 1 10 1.36%B.A. Philosophy & Religion 1 1 3 2 8 1 2 1 1 1 0 3 1 1 3 4 0.54%B.A. Political Science 6 5 14 5 11 10 7 6 10 4 5 17 5 9 18 1 9 15 1 25 3.40%B.A. Psychology 7 11 31 9 17 23 7 10 36 7 13 18 4 15 23 8 12 33 6 53 7.21%B.S. Science Communication 1 1 1 0 1 0 1 0 0.00%B.S.W. Social Work 9 15 14 7 14 14 7 12 21 9 17 15 13 14 19 12 8 18 7 38 5.17%B.A. Sociology 4 7 2 5 4 1 7 11 6 9 2 7 7 2 6 10 2 18 2.45%B.A. Speech 2 4 4 1 8 2 4 8 1 0 1 2 2 0.27%
0 0.00%BUSINESS ADMINISTRATION 12 75 84 15 65 74 14 84 89 22 68 83 27 78 102 22 62 95 15 179 24.35%B.S. Business Administration 12 71 78 14 61 71 14 78 86 22 64 81 26 76 96 20 59 94 15 173 23.54%B.S. Computer Science 4 6 1 4 3 6 3 4 2 1 2 6 2 3 1 6 0.82%
0 0.00%EDUCATION 14 23 98 16 24 123 11 18 122 7 18 102 6 47 90 6 35 77 11 118 16.05%B.S. Business Education 1 3 2 1 1 3 2 0 4 0 1 2 1 3 4 0.54%B.S. Early Childhood Education 2 4 20 2 6 30 3 1 43 2 25 2 12 21 2 1 21 2 24 3.27%B.S. Elementary Education 1 9 34 3 12 52 3 7 43 3 5 38 2 16 36 13 27 40 5.44%B.S. Home Economics 1 1 1 2 2 2 1 0 0.00%B.S. Family Consumer Sciences 2 1 2 2 1 2 0 4 4 1 8 9 1 18 2.45%B.S. Physical Education 2 6 2 5 14 4 4 12 6 16 1 5 11 1 7 11 5 19 2.59%B.S. Special Education 6 2 37 4 4 21 5 19 1 4 17 1 9 16 2 5 5 1 12 1.63%B.S. Sport Management 1 2 1 0.14%
0 0.00%VISUAL & PERFORMING ARTS 10 26 55 5 22 39 11 22 35 7 22 40 14 39 51 14 27 49 9 90 12.24%B.A. Art 3 4 13 2 5 7 1 2 6 4 3 3 5 1 2 4 5 1 11 1.50%B.A. Art History 1 2 1 2 1 0 1 3 1 2 3 0.41%B.F.A. Art 1 16 19 2 8 15 1 15 14 4 9 18 6 18 19 2 14 9 2 25 3.40%B.A. Dance 1 2 1 1 1 1 0 6 6 2 3 1 5 0.68%B.A. Music 3 1 1 2 2 2 3 1 3 1 1 3 4 2 4 4 1 10 1.36%B.M.E. Music Education (Choral) 1 2 3 1 2 1 2 2 2 1 2 4 1 6 0.82%B.M.E. Music Education (Instrumental) 4 1 1 3 1 1 1 1 2 3 1 5 6 0.82%B.M. Music Performance 1 3 2 2 1 3 0 4 2 2 0.27%B.A. Theatre 2 3 12 4 10 1 6 1 3 11 0 3 10 3 4 15 3 22 2.99%
0 0.00%TOTAL 86 208 398 79 209 410 88 227 408 78 202 391 95 261 413 91 216 428 79 735 100.00%

WINTHROP UNIVERSITY RETENTION & GRADUATION RATES
ALL FULL-TIME FIRST-TIME FRESHMEN
Retention Rate Cumulative Graduation & Continuation RateFall Headcount after Within Five Years Within Six Years
One Year Two Years Three Years Graduated Continued Graduated Continued
1989 946 75.8% 62.9% 57.8% 47.5% 6.9% 51.5% 3.2%
1990 602 80.2% 69.6% 63.4% 52.7% 6.5% 57.1% 2.2%
1991 654 74.9% 65.0% 60.7% 47.9% 6.7% 51.2% 3.7%
1992 801 76.5% 63.0% 56.6% 49.3% 6.0% 53.2% 2.4%
1993 764 75.0% 65.4% 60.0% 50.8% 6.7% 55.0% 2.5%
1994 725 77.2% 65.7% 59.0% 50.2% 5.9% 53.8% 2.2%
1995 868 75.9% 64.4% 59.6% 51.4% 5.7%
1996 812 75.9% 66.4%
1997 909 75.2% 66.8%
1998 826 77.1% 67.4%
1999 965 77.8%
ATHLETIC GRADUATION RATE & ENROLLMENT SUMMARY
FRESHMEN COHORT GRADUATION RATES
Winthrop All NCAA Public Division I**94-95 Freshman Rate 4-Year Average* 94-95 Freshman Rate 4-Year Average*
# % # % # % # %
FULL-TIME Black 165 52% 690 54% 51,484 35% 198,657 34%White 533 53% 2,158 54% 306,214 55% 1,215,801 55%Other 27 48% 40 42% 66,738 52% 248,098 52%Total 725 53% 2,888 54% 424,436 52% 1,662,556 52%
STUDENT ATHLETES (who received athletics aid)Black 7 43% 22 32% 2,768 43% 11,028 41%White 25 80% 93 71% 6,657 59% 26,186 58%Other 5 80% 25 48% 1,077 63% 4,003 52%Total 37 73% 140 61% 10,502 54% 41,217 53%Note: 4-Year average is six year graduation time for 89-90, 90-91, 91-92, 92-93 first-time freshmen cohorts.** N=210
UNDERGRADUATE ENROLLMENT
FULL-TIME STUDENTS ENROLLED FALL 1999
Male Female TotalAll FT UG Athletes All FT UG Athletes All FT UG Athletes
Black 266 16 697 10 963 26White 823 43 1,973 56 2,796 99Other 74 28 87 14 161 42Total 1,163 87 2,757 80 3,920 167
V-4 SOURCE: GRADUATION RATE SURVEY AND 2001 NCAA DIV. I GRAD. RATES REPORT

WINTHROP GRADE POINT AVERAGESBY LEVEL & SEMESTER
1991 - 2001
1991-92 1992-93 1993-94 1994-95 1995-96FALL SPRING FALL SPRING FALL SPRING FALL SPRING FALL SPRING
Undergraduate Avg GPA 2.66 2.70 2.73 2.71 2.80 2.72 2.85 2.78 2.83 2.80 Freshmen Avg GPA 2.48 2.46 2.61 2.43 2.65 2.35 2.68 2.46 2.67 2.37
Graduate Avg GPA 3.58 3.60 3.59 3.63 3.63 3.64 3.57 3.69 3.56 3.64
1996-97 1997-98 1998-99 1999-00 2000-01FALL SPRING FALL SPRING FALL SPRING FALL SPRING FALL SPRING
Undergraduate Avg GPA 2.86 2.85 2.92 2.87 2.90 2.89 2.89 2.87 2.96 2.92 Freshmen Avg GPA 2.67 2.53 2.72 2.48 2.69 2.52 2.72 2.51 2.75 2.64
Graduate Avg GPA 3.60 3.63 3.63 3.66 3.62 3.67 3.65 3.65 3.63 3.63

Full-Time Employees By EEO Occupational Category
Fall 00 Fall 99 Fall 98 Fall 97 Fall 96
Full-Time Faculty 9/10 month 254 244 242 243 245
Full-Time Faculty 11/12 month 17 19 18 23 20
Full-Time Faculty - Total 271 263 260 266 265
Executive/Administrative & Managerial 40 39 37 39 44
Other Professionals 133 125 124 115 109
Technical & Paraprofessionals 77 75 73 69 68
Clerical & Secretarial 94 92 92 104 106
Skilled Crafts 35 31 34 38 38
Service/Maintenance 75 78 78 77 81
Total 725 703 698 708 711Note: Headcount as of October 1--Not positions.

TOTAL FULL-TIME FACULTY HEADCOUNTFALL 1991 - FALL 2000
Fall Fall Fall Fall Fall Fall Fall Fall Fall FallCOLLEGE/DEPARTMENT 1991 1992 1993 1994 1995 1996 1997 1998 1999 2000
ARTS & SCIENCES 133 132 127 129 133 133 133 132 134 138Biology 12 13 13 13 13 13 13 13 13 13Chemistry and Physics 11 11 10 9 10 10 11 11 11 12English 24 24 23 26 26 25 24 22 24 25History 9 9 9 9 10 11 10 10 8 11Human Nutrition 4 3 4 5 5 5 5 6 6 6Mass Communication 7 7 6 6 6 6 6 6 6 6Mathematics 16 16 15 15 15 15 15 14 13 14Modern and Classical Languages 9 9 8 7 8 9 9 9 11 10Philosophy and Religious Studies 4 4 3 3 3 3 3 3 3 3Political Science 7 7 7 7 7 7 8 8 7 8Psychology 15 15 15 15 15 15 15 15 16 14Social Work 6 5 5 5 6 6 5 6 6 6Sociology 5 6 6 6 6 6 6 6 7 7Speech 4 3 3 3 3 2 3 3 3 3
BUSINESS ADMINISTRATION* 53 50 48 47 47 46 47 45 46 51Accounting, Finance & Economics 17 16 16 15 15 15 17Computer Science & Quant. Methods 11 10 9 10 10 10 11Management and Marketing 19 21 21 22 20 21 23
EDUCATION* 61 55 49 54 54 56 53 48 50 53Center for Pedagogy 12 12 11 14 16 16Counseling and Leadership 13 9 9 9 9 9 8 7 8 7Curriculum and Instruction 37 35 30 35 26 27 25 20 19 21Health and Physical Education 11 11 10 10 7 8 9 7 7 9
VISUAL & PERFORMING ARTS 45 46 45 46 46 44 46 48 49 49Art and Design 21 21 20 20 21 20 21 22 22 23Music 17 19 19 19 18 17 17 17 18 17Theatre and Dance 7 6 6 7 7 7 8 9 9 9
LIBRARY 14 14 12 14 13 14 14 13 14 14
ACADEMIC AFFAIRS 3 1 1 1 1 1
TOTAL 306 297 281 290 296 294 294 287 294 306* In the College of Education and the College of Business Administration, faculty have moved between departments during the 9-year period shown.
SOURCE: INSTITUTIONAL RESEARCH VI-1

COMPARISION OF FALL 1999 AND FALL 2000TOTAL FULL-TIME FACULTY
TENURED, DOCTORATE, AND TERMINAL DEGREE
TENURED TERMINAL DEGREE DOCTORATE DEGREE2000 1999 2000 1999 2000 1999
COLLEGE/DEPARTMENT % OF % OF % OF % OF % OF % OF# FT # FT # FT # FT # FT # FT
ARTS & SCIENCES 82 59.4% 79 59.0% 120 87.0% 112 83.6% 120 87.0% 112 83.6%Biology 10 76.9% 9 69.2% 13 100.0% 13 100.0% 13 100.0% 13 100.0%Chemistry & Physics 7 58.3% 7 63.6% 11 91.7% 11 100.0% 11 91.7% 11 100.0%English 15 60.0% 16 66.7% 18 72.0% 17 70.8% 18 72.0% 17 70.8%History 4 36.4% 3 37.5% 11 100.0% 8 100.0% 11 100.0% 8 100.0%Human Nutrition 4 66.7% 4 66.7% 5 83.3% 5 83.3% 5 83.3% 5 83.3%Mass Communication 4 66.7% 4 66.7% 3 50.0% 2 33.3% 3 50.0% 2 33.3%Mathematics 8 57.1% 8 61.5% 12 85.7% 8 61.5% 12 85.7% 8 61.5%Modern & Classical Lang. 5 50.0% 5 45.5% 8 80.0% 7 63.6% 8 80.0% 7 63.6%Phil. and Religious Studies 2 66.7% 2 66.7% 3 100.0% 3 100.0% 3 100.0% 3 100.0%Political Science 5 62.5% 3 42.9% 8 100.0% 7 100.0% 8 100.0% 7 100.0%Psychology 7 50.0% 7 43.8% 14 100.0% 16 100.0% 14 100.0% 16 100.0%Social Work 3 50.0% 3 50.0% 6 100.0% 6 100.0% 6 100.0% 6 100.0%Sociology 6 85.7% 6 85.7% 6 85.7% 6 85.7% 6 85.7% 6 85.7%Speech 2 66.7% 2 66.7% 2 66.7% 3 100.0% 2 66.7% 3 100.0%
BUSINESS ADMIN. 26 51.0% 28 60.9% 37 72.5% 35 76.1% 37 72.5% 35 76.1%Acc., Finance & Econ. 12 70.6% 12 80.0% 13 76.5% 12 80.0% 13 76.5% 12 80.0%Comp. Sci. & Quant. Meth. 6 54.5% 6 60.0% 8 72.7% 7 70.0% 8 72.7% 7 70.0%Management & Marketing 8 34.8% 10 47.6% 16 69.6% 16 76.2% 16 69.6% 16 76.2%
EDUCATION 21 39.6% 25 50.0% 38 71.7% 39 78.0% 38 71.7% 39 78.0%Center for Pedagogy 4 25.0% 6 37.5% 11 68.8% 12 75.0% 11 68.8% 12 75.0%Counseling & Leadership 5 71.4% 5 62.5% 7 100.0% 8 100.0% 7 100.0% 8 100.0%Curriculum & Instruction 10 47.6% 11 57.9% 14 66.7% 12 63.2% 14 66.7% 12 63.2%Health & Physical Edu. 2 22.2% 3 42.9% 6 66.7% 7 100.0% 6 66.7% 7 100.0%
VISUAL & PERF. ARTS 29 59.2% 30 61.2% 37 75.5% 37 75.5% 21 42.9% 22 44.9%Art & Design 13 56.5% 12 54.5% 18 78.3% 16 72.7% 6 26.1% 5 22.7%Music 12 70.6% 13 72.2% 13 76.5% 14 77.8% 13 76.5% 14 77.8%Theatre and Dance 4 44.4% 5 55.6% 6 66.7% 7 77.8% 2 22.2% 3 33.3%
LIBRARY 10 71.4% 9 64.3% 14 100.0% 14 100.0% 1 7.1% 1 7.1%
TOTAL 168 54.9% 171 58.2% 246 80.4% 237 80.6% 217 70.9% 209 71.1%
SOURCE: INSTITUTIONAL RESEARCH

COMPARISION OF FALL 1999 AND FALL 2000FULL-TIME INSTRUCTIONAL FACULTY
TENURED, DOCTORATE, AND TERMINAL DEGREE
TENURED TERMINAL DEGREE DOCTORATE DEGREE2000 1999 2000 1999 2000 1999
COLLEGE/DEPARTMENT % OF % OF % OF % OF % OF % OF# FT # FT # FT # FT # FT # FT
ARTS & SCIENCES 82 61.7% 74 58.7% 115 86.5% 104 82.5% 115 86.5% 104 82.5%Biology 10 76.9% 8 66.7% 13 100.0% 12 100.0% 13 100.0% 12 100.0%Chemistry & Physics 7 58.3% 7 63.6% 11 91.7% 11 100.0% 11 91.7% 11 100.0%English 15 62.5% 16 69.6% 17 70.8% 16 69.6% 17 70.8% 16 69.6%History 4 36.4% 3 37.5% 11 100.0% 8 100.0% 11 100.0% 8 100.0%Human Nutrition 5 100.0% 3 60.0% 4 80.0% 4 80.0% 4 80.0% 4 80.0%Mass Communication 6 100.0% 4 66.7% 3 50.0% 2 33.3% 3 50.0% 2 33.3%Mathematics 8 57.1% 8 61.5% 12 85.7% 8 61.5% 12 85.7% 8 61.5%Modern & Classical Lang. 5 50.0% 5 45.5% 8 80.0% 7 63.6% 8 80.0% 7 63.6%Phil. and Religious Studies 2 66.7% 2 66.7% 3 100.0% 3 100.0% 3 100.0% 3 100.0%Political Science 4 57.1% 2 33.3% 7 100.0% 6 100.0% 7 100.0% 6 100.0%Psychology 6 46.2% 6 46.2% 13 100.0% 13 100.0% 13 100.0% 13 100.0%Social Work 2 40.0% 2 40.0% 5 100.0% 5 100.0% 5 100.0% 5 100.0%Sociology 6 85.7% 6 85.7% 6 85.7% 6 85.7% 6 85.7% 6 85.7%Speech 2 66.7% 2 66.7% 2 66.7% 3 100.0% 2 66.7% 3 100.0%
BUSINESS ADMIN. 25 59.5% 27 69.2% 35 83.3% 33 84.6% 35 83.3% 33 84.6%Acc., Finance & Econ. 12 75.0% 12 80.0% 13 81.3% 12 80.0% 13 81.3% 12 80.0%Comp. Sci. & Quant. Meth. 6 60.0% 6 66.7% 8 80.0% 7 77.8% 8 80.0% 7 77.8%Management & Marketing 7 43.8% 9 60.0% 14 87.5% 14 93.3% 14 87.5% 14 93.3%
EDUCATION 20 46.5% 24 60.0% 34 79.1% 37 92.5% 34 79.1% 37 92.5%Center for Pedagogy 3 25.0% 5 38.5% 9 75.0% 11 84.6% 9 75.0% 11 84.6%Counseling & Leadership 5 83.3% 5 71.4% 6 100.0% 7 100.0% 6 100.0% 7 100.0%Curriculum & Instruction 10 58.8% 11 84.6% 13 76.5% 12 92.3% 13 76.5% 12 92.3%Health & Physical Edu. 2 25.0% 3 42.9% 6 75.0% 7 100.0% 6 75.0% 7 100.0%
VISUAL & PERF. ARTS 26 59.1% 27 62.8% 33 75.0% 32 74.4% 19 43.2% 19 44.2%Art & Design 12 57.1% 11 57.9% 16 76.2% 14 73.7% 5 23.8% 4 21.1%Music 10 66.7% 11 68.8% 12 80.0% 12 75.0% 12 80.0% 12 75.0%Theatre and Dance 4 50.0% 5 62.5% 5 62.5% 6 75.0% 2 25.0% 3 37.5%
TOTAL 153 79.3% 152 61.3% 217 82.8% 206 83.1% 203 77.5% 193 77.8%
SOURCE: INSTITUTIONAL RESEARCH

FULL-TIME INSTRUCTIONAL* FACULTYBY RANK AND DEPARTMENT
FALL 1998 - FALL 2000
PROFESSOR ASSOCIATE PROFESSOR ASSISTANT PROFESSOR INSTRUCTORCOLLEGE/DEPARTMENT 2000 1999 1998 2000 1999 1998 2000 1999 1998 2000 1999 1998
ARTS & SCIENCES 36 35 34 40 35 38 39 38 39 18 17 12Biology 3 2 3 7 6 5 3 4 5 0 0 0Chemistry & Physics 3 3 3 4 4 4 3 3 3 2 1 1English 8 9 8 7 7 7 3 2 3 6 5 2History 2 2 2 2 1 2 7 5 6 0 0 0Human Nutrition 1 1 1 1 1 1 2 2 1 1 1 2Mass Communication 1 1 1 3 2 3 2 2 2 0 1 0Mathematics 2 2 1 4 3 4 4 4 4 4 4 5Modern & Classical Lang. 2 2 2 3 3 3 2 1 1 3 4 2Phil. and Religious Studies 2 2 2 0 0 0 1 1 1 0 0 0Political Science 1 1 1 2 1 2 4 4 4 0 0 0Psychology 4 4 4 3 2 2 6 7 6 0 0 0Social Work 2 2 2 1 1 1 2 2 2 0 0 0Sociology 4 3 3 2 3 3 0 0 0 1 1 0Speech 1 1 1 1 1 1 0 1 1 1 0 0
BUSINESS ADMIN. 12 11 11 19 19 17 10 8 10 1 1 0Acc., Finance & Econ. 5 4 4 10 9 8 1 2 3 0 0 0Comp. Sci. & Quant. Method 3 3 3 4 4 3 3 2 3 0 0 0Management & Marketing 4 4 4 5 6 6 6 4 4 1 1 0
EDUCATION 12 13 11 9 13 15 14 12 10 4 2 2Center for Pedagogy 1 2 2 3 4 4 5 5 4 2 2 2Counseling & Leadership 4 3 3 1 3 3 1 1 0 0 0 0Curriculum & Instruction 5 5 4 5 5 6 4 3 3 0 0 0Health & Physical Education 2 3 2 0 1 2 4 3 3 2 0 0
VISUAL & PERF. ARTS 16 12 13 14 18 19 12 12 10 2 1 1Art & Design 7 4 5 8 10 11 6 5 4 0 0 0Music 7 6 7 3 4 4 4 5 3 1 1 1Theatre and Dance 2 2 1 3 4 4 2 2 3 1 0 0
LIBRARY 3 2 2 4 5 4 7 7 7 0 0 0
TOTAL 79 73 71 86 90 93 82 77 76 25 21 15* Includes Library.
SOURCE: INSTITUTIONAL RESEARCH VI-4

FULL-TIME INSTRUCTIONAL* FACULTY HEADCOUNTBY GENDER AND DEPARTMENT
FALL 1998 - FALL 2000
MALE FEMALECOLLEGE/DEPARTMENT 2000 1999 1998 2000 1999 1998
ARTS & SCIENCES 77 72 72 56 54 51Biology 9 8 9 4 4 4Chemistry & Physics 9 7 7 3 4 4English 10 10 9 14 13 11History 7 6 7 4 2 3Human Nutrition 2 2 1 3 3 4Mass Communication 4 4 5 2 2 1Mathematics 11 11 11 3 2 3Modern & Classical Lang. 4 4 3 6 7 5Phil. and Religious Studies 3 3 3 0 0 0Political Science 4 3 4 3 3 3Psychology 7 7 6 6 6 6Social Work 2 2 2 3 3 3Sociology 4 4 4 3 3 2Speech 1 1 1 2 2 2
BUSINESS ADMIN. 29 29 29 13 10 9Acc., Finance & Econ. 13 12 12 3 3 3Comp. Sci. & Quant. Method 9 9 9 1 0 0Management & Marketing 7 8 8 9 7 6
EDUCATION 15 19 18 28 21 20Center for Pedagogy 4 5 4 8 8 8Counseling & Leadership 5 6 5 1 1 1Curriculum & Instruction 4 5 6 13 8 7Health & Physical Education 2 3 3 6 4 4
VISUAL & PERF. ARTS 28 29 25 16 14 18Art & Design 15 15 12 6 4 8Music 11 12 11 4 4 4Theatre and Dance 2 2 2 6 6 6
LIBRARY 5 5 6 9 9 7
TOTAL 154 154 150 122 108 105* Includes Library.
SOURCE: INSTITUTIONAL RESEARCH VI-5

Fall 1996 Fall 1997 Fall 1998 Fall 1999 Fall 2000COLLEGE/DEPARTMENT # TT # TT # TT # TT # TT
ARTS & SCIENCES 123 103 124 102 123 105 126 104 133 112Biology 13 13 13 13 13 11 12 11 13 12Chemistry and Physics 10 8 11 9 11 10 11 10 12 10English 23 18 22 17 20 18 23 18 24 18History 10 9 10 9 10 9 8 7 11 10Human Nutrition 4 3 4 3 5 3 5 4 5 4Mass Communication 6 4 6 4 6 4 6 5 6 6Mathematics 15 10 15 10 14 9 13 9 14 10Modern and Classical Languages 8 6 8 6 8 6 11 6 10 6Philosophy and Religious Studies 3 2 3 3 3 3 3 2 3 3Political Science 6 6 7 6 7 6 6 5 7 7Psychology 12 11 12 10 12 12 13 13 13 13Social Work 5 5 4 3 5 5 5 5 5 5Sociology 6 6 6 6 6 6 7 6 7 6Speech 2 2 3 3 3 3 3 3 3 2
BUSINESS ADMINISTRATION** 39 35 39 37 38 36 39 36 42 39Accounting, Finance, & Economics 15 15 14 14 15 15 15 15 16 16Computer Science & Quant. Meth. 9 7 9 8 9 8 9 8 10 9Management and Marketing 15 13 16 15 14 13 15 13 16 14
EDUCATION** 41 35 39 32 38 31 40 33 43 29Center for Pedagogy 9 7 9 6 12 9 13 9 12 8Counseling and Leadership 8 8 7 7 6 6 7 7 6 6Curriculum and Instruction 16 15 15 13 13 11 13 11 17 11Health and Physical Education 8 5 8 6 7 5 7 6 8 4
VISUAL & PERFORMING ARTS 40 37 42 38 43 39 43 38 44 37Art and Design 18 18 19 19 20 19 19 17 21 18Music 15 13 15 13 15 14 16 15 15 14Theatre and Dance 7 6 8 6 8 6 8 6 8 5
LIBRARY 12 11 14 12 13 11 14 13 14 12
TOTAL 255 221 258 221 255 222 262 224 276 229* Includes Library.** In the College of Education and the College of Business Administration, faculty have moved between departments during the 5-year period shown.Notes: # is headcount employed as of October 1; TT is number tenured or holding tenure track appointment. Faculty on leave without pay are not counted;
FULL-TIME INSTRUCTIONAL* FACULTYBY DEPARTMENT
FALL 1996 - FALL 2000
VI-6 SOURCE: INSTITUTIONAL RESEARCH

FALL 1996 FALL 1997 FALL 1998 FALL 1999 FALL 2000 DIFF 96-00COLLEGE/DEPARTMENT # FTE # FTE # FTE # FTE # FTE # FTE
ARTS & SCIENCES 53 22.32 53 22.82 57 26.31 57 27.97 56 26.08 3 3.76Biology 4 2.50 4 2.00 5 2.82 6 4.32 5 2.91 1 0.41Chemistry and Physics 6 2.15 3 0.91 6 1.83 6 2.16 7 1.99 1 -0.16English 13 8.00 13 7.25 15 9.30 14 7.55 13 8.22 0 0.22History 2 0.50 2 0.50 2 0.50 5 1.74 4 1.00 2 0.50Human Nutrition 3 0.75 4 1.25 4 2.24 3 1.25 3 0.75 0 0.00Mass Communication 1 0.25 1 0.33 1 0.33 2 1.00 4 1.33 3 1.08Mathematics 1 0.50 1 1.00 2 1.49 2 1.41 1 0.25 0 -0.25Modern and Classical Languages 8 3.39 10 3.00 10 3.74 9 4.23 7 5.89 -1 2.50Philosophy and Religious Studies 0 0.00 1 0.75 0 0.00 0 0.00 0 0.00 0 0.00Political Science 6 1.53 2 0.50 4 1.00 3 1.74 3 0.75 -3 -0.78Psychology 6 1.50 8 3.00 7 2.24 4 1.00 4 1.49 -2 -0.01Social Work 0 0.00 2 0.75 0 0.00 2 0.75 4 1.00 4 1.00Sociology 1 0.25 1 1.00 1 0.83 0 0.00 1 0.50 0 0.25Speech 2 1.00 1 0.58 0 0.00 1 0.83 0 0.00 -2 -1.00
BUSINESS ADMINISTRATION* 12 3.00 10 3.42 13 3.98 8 2.99 11 3.81 -1 0.81Accounting, Finance & Econ. 3 0.75 4 1.25 5 1.74 3 1.25 1 0.25 -2 -0.50Computer Sci. & Quan. Meth. 0 0.00 0 0.00 1 0.25 1 0.50 1 0.49 1 0.49Management and Marketing 9 2.25 6 2.17 7 1.99 4 1.25 9 3.07 0 0.82
EDUCATION* 31 8.18 30 8.42 37 12.37 40 15.36 36 13.93 5 5.75Center for Pedagogy 2 0.75 4 1.42 8 2.74 18 6.23 5 1.74 3 0.99Counseling and Leadership 15 4.00 16 4.25 9 2.99 1 0.25 1 0.49 -14 -3.51Curriculum and Instruction 8 2.35 5 1.67 14 4.48 7 3.90 5 1.91 -3 -0.44Health and Physical Education 6 1.08 5 1.08 6 2.16 14 4.98 7 1.99 1 0.91Professional Development * * * * * * * * 18 7.80 18 7.80
VISUAL & PERFORMING ARTS 34 15.64 33 15.94 34 16.93 38 20.00 35 17.43 1 1.79Art and Design 16 6.73 17 7.17 17 6.64 24 11.21 18 8.63 2 1.90Music 13 6.56 13 7.44 15 8.96 11 7.89 13 6.81 0 0.25Theatre and Dance 5 2.35 3 1.33 2 1.33 3 0.91 4 1.99 -1 -0.36
Critical Issues Symposium 0 0.00 0 0.00 0 0.00 0 0.00 1 0.17 1 0.17
PART-TIME TOTAL 130 49.14 126 50.60 141 59.59 143 66.32 139 62.25 9 13.11* In the College of Education and the College of Business Administration, faculty have moved between departments during the 5-year period shown.Notes: # is headcount employed as of October 1; FTE is teaching FTE only.
PART-TIME INSTRUCTIONAL FACULTY AND FTEBY DEPARTMENT
FALL 1996 - FALL 2000
SOURCE: INSTITUTIONAL RESEARCH VI-7

AVERAGE FACULTY SALARY COMPARISONS9-MONTH FACULTY
(IN THOUSANDS OF DOLLARS)1996 - 2000
RANK 1996-97 1997-98 1998-99 1999-00 2000-01Salary 1-Yr Inc Salary 1-Yr Inc Salary 1-Yr Inc Salary 1-Yr Inc Salary 1-Yr Inc
Professor
Winthrop** 51.1 4.6% 52.3 2.5% 52.9 3.0% 55.3 4.8% 56.6 2.4%
AAUP* 60.5 2.8% 61.8 3.0% 63.8 2.7% 66.7 4.6% 68.8 3.8%
Associate Professor
Winthrop** 42.2 4.4% 43.0 2.7% 44.0 3.6% 45.8 4.6% 48.0 4.8%
AAUP* 48.5 2.9% 49.6 2.7% 51.0 2.8% 53.1 4.1% 54.8 3.8%
Assistant Professor
Winthrop** 36.7 5.1% 37.0 3.2% 39.2 4.1% 40.0 4.0% 41.4 3.5%
AAUP* 40.2 2.5% 40.8 2.4% 42.0 2.9% 43.4 3.8% 45.1 3.9%
Instructor
Winthrop** 27.3 6.4% 29.3 6.3% 29.3 6.5% 29.7 4.0% 31.1 4.7%
AAUP* 31.3 3.6% 31.1 0.8% 31.9 3.6% 33.2 4.0% 34.4 3.9%
All Ranks
Winthrop** 42.7 4.7% 43.1 2.9% 44.3 3.6% 45.4 4.5% 46.8 3.1%
AAUP* 48.9 2.7% 49.9 2.5% 51.3 2.5% 53.0 3.6% 54.4 3.1%* AAUP: American Association of University Professors Salary Survey for Comprehensive Public Institutions. Public Comprehensive Institutions** From IPEDS Report: Salaries & Tenure of Full-Time Instructional Faculty.
VI-8 SOURCE: INSTITUTIONAL RESEARCH AND AAUP

NUMBER AND PERCENT OF FULL-TIME BLACK INSTRUCTIONAL FACULTY AT
S.C. PUBLIC COLLEGES AND UNIVERSITIES
1996 1997 1998 1999 2000 96-00# # % # # % # # % # # % # # % Change in
INSTITUTIONS Black Total Black Black Total Black Black Total Black Black Total Black Black Total Black %
The Citadel 2 151 1.3% 2 150 1.3% 4 155 2.6% 4 151 2.6% 4 146 2.7% 1.4%Clemson 41 911 4.5% 42 922 4.6% 40 1,032 3.9% 34 1,040 3.3% 36 1,080 3.3% -1.2%Coastal Carolina 5 176 2.8% 5 187 2.7% 5 185 2.7% 3 181 1.7% 4 180 2.2% -0.6%College of Charleston 14 368 3.8% 14 368 3.8% 11 409 2.7% 15 430 3.5% 15 448 3.3% -0.5%Francis Marion 5 154 3.2% 6 161 3.7% 6 161 3.7% 5 159 3.1% 6 163 3.7% 0.4%Lander 6 132 4.5% 5 134 3.7% 5 134 3.7% 5 127 3.9% 4 123 3.3% -1.3%S.C. State 144 227 63.4% 153 236 64.8% 144 224 64.3% 131 217 60.4% 143 227 63.0% -0.4%USC-Aiken 4 118 3.4% 4 96 4.2% 7 132 5.3% 8 134 6.0% 9 137 6.6% 3.2%USC-Columbia 55 1,407 3.9% 54 1,421 3.8% 55 1,460 3.8% 59 1,453 4.1% 59 1,436 4.1% 0.2%USC-Spartanburg 10 130 7.7% 13 107 12.1% 12 148 8.1% 13 145 9.0% 13 157 8.3% 0.6%Winthrop 17 265 6.4% 17 266 6.4% 14 260 5.4% 16 263 6.1% 15 274 5.5% -0.9%
Subtotal 276 3,644 7.6% 285 3,675 7.8% 277 3,892 7.1% 264 3,892 6.8% 280 3,940 7.1% -0.5%
VI-9 SOURCE: IPEDS FALL STAFF SURVEY

DEFINITIONS FOR FINANCIAL INFORMATION
The following schedules provides information taken from the IPEDS reports submitted by Winthrop for the four years
1995-1996 through 1999-2000. Information is grouped by type of funding and program.
Provided on the expenditure schedule is the percentage each program in the Educational and General Operations is (E&G) of
total Educational and General Fund Revenue. If the total percentage of E&G expenditures exceeds 100%, this is an
indication that revenue other than E&G revenue was used to support E&G activities.
Funding is summarized by Unrestricted and Restricted funds. Restricted funds are those funds received for specific purposes
and not available to be used in general operations of the University.
Program descriptions are as follows:
INSTRUCTION: Expenditures for academic, vocational, remedial, and technical instruction.
LIBRARY: Expenditures for organized activities that directly support the operation catalogued or otherwise classified collection.
ACADEMIC SUPPORT: Expenditures to provide support services for instruction, services that directly assist the academic function,
media support, academic administration, and course/curriculum development.
RESEARCH: Expenditures for activities specifically organized to produce research outcomes, whether commissioned by an agency
external to the University or separately budgeted by the University.
PUBLIC SERVICE: Expenditures in providing noninstructional services beneficial to individuals and groups external to the
institution.
STUDENT SERVICES: Expenditures for the office of admission, registrar and those activities whose primary purpose is to
contribute to the student's emotional and physical well-being and to his or her intellectual, cultural and social development
outside the context of the formal instruction program.
INSTITUTIONAL SUPPORT: Expenditures for the following categories: Central executive-level activities concerned with management
and long-range planning of the entire institution; fiscal operations including accounting and payroll; administrative data
processing; space management; employee personnel and records; logistical activities that provide procurement, storerooms,
safety, security, printing and transportation services; support services to faculty and staff that are not operated as auxiliary
enterprises; and community and alumni relations, including development and funding raising.
OPERATIONS AND MAINTENANCE OF PLANT: Expenditures of current operating funds for the operation and maintenance of physic
plant follows: Physical plant administration; building maintenance; custodial services; utilities; landscaping and ground
maintenance; and major repairs and renovations.
SCHOLARSHIPS AND FELLOWSHIPS: Expenditures for scholarships and fellowships in the form of out-right grants to students
selected by the institution and financed from current funds, restricted or unrestricted.
MANDATORY TRANSFERS: Transfers from current fund groups to other fund groups arising from binding legal agreements related to
the financing of educational plant facilities and grant agreements with agencies of the federal government, donors and other
organizations to match gifts and grants to loan and other funds.
NONMANDATORY TRANSFERS: Transfer from the current fund groups for purposed such as additions to loan funds, general or
specific plant additions, voluntary renewals and replacements of plant and prepayments on debt principal.
AUXILIARY OPERATIONS: An entity that exists to furnish goods and services to students, faculty or staff and that charges as fee
directly related to, although no necessarily equal to, the cost of the goods or services. Examples of auxiliary operations at
Winthrop are as follows: Housing, Cafeteria and health center, vending operations and laundry, and print shop.
SOURCE: INTEGRATED POSTSECONDARY EDUCATION DATA SYSTEM (IPEDS) VII-1

IPEDS REPORT - CURRENT FUND REVENUE
SOURCE OF FUNDS 1999-2000 1998-1999 1997-1998 1996-1997 1995-1996
$ Amount $ Amount $ Amount $ Amount $ Amount REVENUES-UNRESTRICTEDTuition & Fees $19,981,339 $19,086,025 $18,822,392 $18,072,505 $18,205,081Government Appropriation Federal State $23,687,729 $21,982,640 $21,092,103 $20,238,031 $19,758,726 LocalGovernment Grants and Contracts Federal $78,763 $112,335 $70,270 $43,712 $120,507 State Local Private Gifts, Grants & Contracts $391,694 $213,955 $214,055 $132,474 $351,775Endowment Income Sales & Services $1,509,293 $1,450,865 $1,382,637 $1,453,564 $1,517,576HospitalsOther Sources $1,479,271 $1,503,171 $912,650 $1,022,697 $839,546Total Educational & General Revenues $47,128,089 $44,348,991 $42,494,107 $40,962,983 $40,793,211Auxiliary Enterprises $9,848,000 $9,323,578 $9,266,157 $9,030,301 $8,791,817Total Current Unrestricted Revenues $56,976,089 $53,672,569 $51,760,264 $49,993,284 $49,585,028
REVENUES-RESTRICTEDTuition & Fees Government Appropriation Federal State $2,809,215 $2,580,816 $844,331 $841,146 LocalGovernment Grants and Contracts Federal $3,430,905 $3,425,259 $3,116,473 $2,768,390 $12,957,115 State $1,892,992 $1,571,740 $1,636,463 $1,535,615 $1,712,301 Local $94,557 $91,462 $79,070 $123,564 $77,004Private Gifts, Grants & Contracts $646,123 $612,581 $549,428 $521,891 $466,348Endowment Income $28,565 $60,638 $63,549 $59,971 $52,908Sales & Services HospitalsOther Sources Total Educational & General Revenues $8,902,357 $8,342,496 $6,289,314 $5,850,577 $15,265,676Auxiliary EnterprisesTotal Current Restricted Revenues $8,902,357 $8,342,496 $6,289,314 $5,850,577 $15,265,676
REVENUES-TOTALTuition & Fees $19,981,339 $19,086,025 $18,822,392 $18,072,505 $18,205,081Government Appropriation Federal State $26,496,944 $24,563,456 $21,936,434 $21,079,177 $19,758,726 LocalGovernment Grants and Contracts
Federal $3,509,668 $3,537,594 $3,186,743 $2,812,102 $13,077,622
State $1,892,992 $1,571,740 $1,636,463 $1,535,615 $1,712,301
Local $94,557 $91,462 $79,070 $123,564 $77,004Private Gifts, Grants & Contracts $1,037,817 $826,536 $763,483 $654,365 $818,123Endowment Income $28,565 $60,638 $63,549 $59,971 $52,908Sales & Services $1,509,293 $1,450,865 $1,382,637 $1,453,564 $1,517,576HospitalsOther Sources $1,479,271 $1,503,171 $912,650 $1,022,697 $839,546Total Educational & General Revenues $56,030,446 $52,691,487 $48,783,421 $46,813,560 $56,058,887
Auxiliary Enterprises $9,848,000 $9,323,578 $9,266,157 $9,030,301 $8,791,817
Total Current Revenues $65,878,446 $62,015,065 $58,049,578 $55,843,861 $64,850,704
VII-2 SOURCE: IPEDS FINANCE REPORT
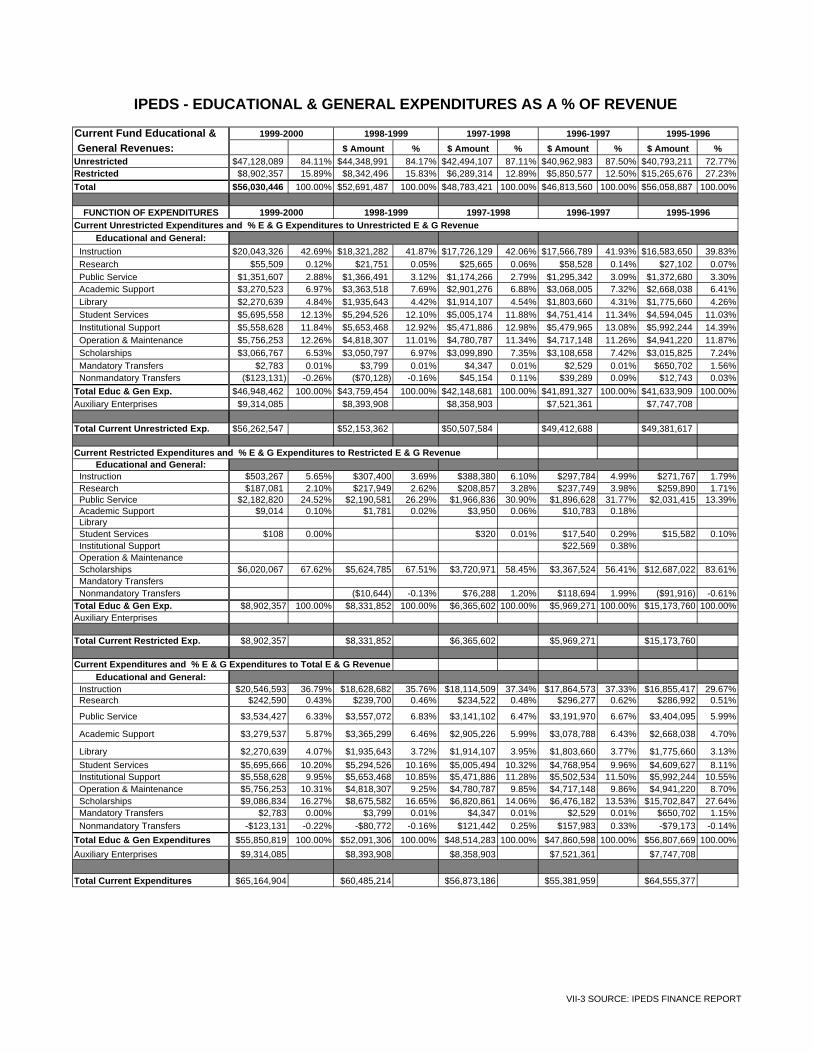
IPEDS - EDUCATIONAL & GENERAL EXPENDITURES AS A % OF REVENUE
Current Fund Educational & 1999-2000 1998-1999 1997-1998 1996-1997 1995-1996
General Revenues: $ Amount % $ Amount % $ Amount % $ Amount %Unrestricted $47,128,089 84.11% $44,348,991 84.17% $42,494,107 87.11% $40,962,983 87.50% $40,793,211 72.77%Restricted $8,902,357 15.89% $8,342,496 15.83% $6,289,314 12.89% $5,850,577 12.50% $15,265,676 27.23%Total $56,030,446 100.00% $52,691,487 100.00% $48,783,421 100.00% $46,813,560 100.00% $56,058,887 100.00%
FUNCTION OF EXPENDITURES 1999-2000 1998-1999 1997-1998 1996-1997 1995-1996Current Unrestricted Expenditures and % E & G Expenditures to Unrestricted E & G Revenue
Educational and General:
Instruction $20,043,326 42.69% $18,321,282 41.87% $17,726,129 42.06% $17,566,789 41.93% $16,583,650 39.83% Research $55,509 0.12% $21,751 0.05% $25,665 0.06% $58,528 0.14% $27,102 0.07% Public Service $1,351,607 2.88% $1,366,491 3.12% $1,174,266 2.79% $1,295,342 3.09% $1,372,680 3.30% Academic Support $3,270,523 6.97% $3,363,518 7.69% $2,901,276 6.88% $3,068,005 7.32% $2,668,038 6.41% Library $2,270,639 4.84% $1,935,643 4.42% $1,914,107 4.54% $1,803,660 4.31% $1,775,660 4.26% Student Services $5,695,558 12.13% $5,294,526 12.10% $5,005,174 11.88% $4,751,414 11.34% $4,594,045 11.03% Institutional Support $5,558,628 11.84% $5,653,468 12.92% $5,471,886 12.98% $5,479,965 13.08% $5,992,244 14.39% Operation & Maintenance $5,756,253 12.26% $4,818,307 11.01% $4,780,787 11.34% $4,717,148 11.26% $4,941,220 11.87% Scholarships $3,066,767 6.53% $3,050,797 6.97% $3,099,890 7.35% $3,108,658 7.42% $3,015,825 7.24% Mandatory Transfers $2,783 0.01% $3,799 0.01% $4,347 0.01% $2,529 0.01% $650,702 1.56% Nonmandatory Transfers ($123,131) -0.26% ($70,128) -0.16% $45,154 0.11% $39,289 0.09% $12,743 0.03%Total Educ & Gen Exp. $46,948,462 100.00% $43,759,454 100.00% $42,148,681 100.00% $41,891,327 100.00% $41,633,909 100.00%Auxiliary Enterprises $9,314,085 $8,393,908 $8,358,903 $7,521,361 $7,747,708
Total Current Unrestricted Exp. $56,262,547 $52,153,362 $50,507,584 $49,412,688 $49,381,617
Current Restricted Expenditures and % E & G Expenditures to Restricted E & G Revenue
Educational and General: Instruction $503,267 5.65% $307,400 3.69% $388,380 6.10% $297,784 4.99% $271,767 1.79% Research $187,081 2.10% $217,949 2.62% $208,857 3.28% $237,749 3.98% $259,890 1.71% Public Service $2,182,820 24.52% $2,190,581 26.29% $1,966,836 30.90% $1,896,628 31.77% $2,031,415 13.39% Academic Support $9,014 0.10% $1,781 0.02% $3,950 0.06% $10,783 0.18% Library Student Services $108 0.00% $320 0.01% $17,540 0.29% $15,582 0.10% Institutional Support $22,569 0.38% Operation & Maintenance Scholarships $6,020,067 67.62% $5,624,785 67.51% $3,720,971 58.45% $3,367,524 56.41% $12,687,022 83.61% Mandatory Transfers Nonmandatory Transfers ($10,644) -0.13% $76,288 1.20% $118,694 1.99% ($91,916) -0.61%Total Educ & Gen Exp. $8,902,357 100.00% $8,331,852 100.00% $6,365,602 100.00% $5,969,271 100.00% $15,173,760 100.00%Auxiliary Enterprises
Total Current Restricted Exp. $8,902,357 $8,331,852 $6,365,602 $5,969,271 $15,173,760
Current Expenditures and % E & G Expenditures to Total E & G Revenue
Educational and General: Instruction $20,546,593 36.79% $18,628,682 35.76% $18,114,509 37.34% $17,864,573 37.33% $16,855,417 29.67% Research $242,590 0.43% $239,700 0.46% $234,522 0.48% $296,277 0.62% $286,992 0.51%
Public Service $3,534,427 6.33% $3,557,072 6.83% $3,141,102 6.47% $3,191,970 6.67% $3,404,095 5.99%
Academic Support $3,279,537 5.87% $3,365,299 6.46% $2,905,226 5.99% $3,078,788 6.43% $2,668,038 4.70%
Library $2,270,639 4.07% $1,935,643 3.72% $1,914,107 3.95% $1,803,660 3.77% $1,775,660 3.13% Student Services $5,695,666 10.20% $5,294,526 10.16% $5,005,494 10.32% $4,768,954 9.96% $4,609,627 8.11% Institutional Support $5,558,628 9.95% $5,653,468 10.85% $5,471,886 11.28% $5,502,534 11.50% $5,992,244 10.55% Operation & Maintenance $5,756,253 10.31% $4,818,307 9.25% $4,780,787 9.85% $4,717,148 9.86% $4,941,220 8.70% Scholarships $9,086,834 16.27% $8,675,582 16.65% $6,820,861 14.06% $6,476,182 13.53% $15,702,847 27.64% Mandatory Transfers $2,783 0.00% $3,799 0.01% $4,347 0.01% $2,529 0.01% $650,702 1.15% Nonmandatory Transfers -$123,131 -0.22% -$80,772 -0.16% $121,442 0.25% $157,983 0.33% -$79,173 -0.14%
Total Educ & Gen Expenditures $55,850,819 100.00% $52,091,306 100.00% $48,514,283 100.00% $47,860,598 100.00% $56,807,669 100.00%
Auxiliary Enterprises $9,314,085 $8,393,908 $8,358,903 $7,521,361 $7,747,708
Total Current Expenditures $65,164,904 $60,485,214 $56,873,186 $55,381,959 $64,555,377
VII-3 SOURCE: IPEDS FINANCE REPORT

% OF TOTAL REVENUE & EXPENDITURESSOUTH CAROLINA
1998-99College of Francis Coastal SCCharleston Marion Carolina State
Tuition & Fees 30.78% 40.54% 33.44% 32.85% 46.02% 19.85% 19.09% 31.80%Federal AppropriationsState Appropriations 39.61% 31.05% 43.27% 38.83% 26.79% 29.99% 39.31% 35.55%Federal Contracts 5.70% 5.68% 6.94% 6.70% 8.01% 2.15% 22.60% 8.26%State Contracts 2.53% 0.72% 0.15% 0.22% 3.08% 0.05% 0.74% 1.07%Local Contracts 0.15% 0.02% 0.00% 0.78% 0.24%Gifts & Contracts 1.33% 1.15% 2.92% 3.79% 1.75% 7.88% 1.30% 2.87%Endowment Income 0.10% 0.01% 0.04% 0.02% 1.74% 0.06% 0.33%Sales & Services 2.34% 0.47% 1.32% 0.63% 1.19%Auxiliary Enterprises 15.03% 18.56% 12.45% 16.48% 10.76% 34.13% 15.50% 17.56%Other Sources 2.42% 1.80% 0.78% 1.13% 1.46% 4.21% 0.77% 1.80%Independent Operations
Total Revenues 100.00% 100.00% 100.00% 100.00% 100.00% 100.00% 100.00% 100.00%
Educational & General Instruction 30.80% 32.28% 29.81% 32.17% 34.69% 21.72% 28.17% 29.95% Research 0.40% 2.50% 0.10% 0.05% 2.57% 0.32% 3.69% 1.38% Public Service 5.88% 1.12% 0.98% 0.51% 1.47% 1.75% 4.87% 2.37%Academic Support 5.60% 4.43% 3.80% 2.75% 3.79% 5.98% 8.24% 4.94%
Library 3.16% 3.17% 3.87% 2.38% 2.49% 2.40% 2.71% 2.88%
Student Services 8.75% 4.27% 7.31% 8.59% 10.83% 8.25% 5.18% 7.60%Institutional Support 9.35% 8.49% 10.30% 9.10% 10.28% 9.47% 9.23% 9.46%
Operation & Maintenance 7.97% 7.98% 8.45% 8.75% 7.36% 8.17% 6.02% 7.81%
Scholarships 14.34% 10.25% 13.99% 14.57% 16.40% 9.67% 14.33% 13.36%Mandatory Transfers 0.01% 0.96% 0.21% 0.03% 0.04% 0.25%Nonmandatory Transfers -0.13% 7.42% 4.85% 2.29% 3.61%
Total Educ & Gen Exp 86.12% 82.88% 83.68% 78.91% 89.92% 70.01% 82.43% 83.61%
Auxiliary Enterprises 13.88% 17.12% 16.32% 21.09% 10.08% 29.99% 17.57% 18.01%Independent Operations
Total Expenditures 100.00% 100.00% 100.00% 100.00% 100.00% 100.00% 100.00% 100.00%
Average
Source of Funds (as % of total revenues)
Funds Expenditures & Transfers (as % of total expenditures)
Winthrop Lander Citadel

ACADEMIC YEAR STUDENT FEES1990-2000
STUDENT FEES 1990-91 1991-92 1992-93 1993-94 1994-95 1995-96 1996-97 1997-98 1998-99 1999-00 2000-01
TUITIONIn-State 2,568 2,826 3,112 3,470 3,620 3,716 3,818 3,918 4,032 4,126 4,262% Difference 10.9% 10.0% 10.1% 11.5% 4.3% 2.7% 2.7% 2.6% 2.9% 2.3% 3.3%
Out-of-State 4,612 5,038 5,512 6,110 6,400 6,672 6,860 7,046 7,250 7,434 7,680% Difference 12.0% 9.2% 9.4% 10.8% 4.7% 4.3% 2.8% 2.7% 2.9% 2.5% 3.3%
ROOM & BOARDRoom 1,708 1,810 1,900 1,990 2,058 2,110 2,216 2,260 2,360 2,420 2,500% Difference 21.3% 6.0% 5.0% 4.7% 3.4% 2.5% 5.0% 2.0% 4.4% 2.5% 3.3%
Board 960 1,120 1,232 1,290 1,334 1,378 1,446 1,504 1,544 1,602 1,656% Difference 11.1% 16.7% 10.0% 4.7% 3.4% 3.3% 4.9% 4.0% 2.7% 3.8% 3.4%
TOTAL FEESIn-State 5,236 5,756 6,244 6,750 7,012 7,204 7,480 7,682 7,936 8,148 8,418% Difference 14.1% 9.9% 8.5% 8.1% 3.9% 2.7% 3.8% 2.7% 3.3% 2.7% 3.3%
Out-of-State 7,280 7,968 8,644 9,390 9,792 10,160 10,522 10,810 11,154 11,456 11,836% Difference 13.9% 9.5% 8.5% 8.6% 4.3% 3.8% 3.6% 2.7% 3.2% 2.7% 3.3%
Note: % Difference is the percent change from the previous year to the current year.
SOURCE: FINANCE AND BUSINESS VII-5

AID AWARDED TO ENROLLED UNDERGRADUATE FOR AY1999-2000
Need-based aid Non-need-based aidScholarship/Grant Total Dollars Total Dollars
Federal $2,776,127 $0State $1,383,682 $2,442,712Other external scholarship/grants administered by college $212,078 $636,236Institutional $734,645 $2,203,935
Total Scholarships/Grants* $5,106,532 $5,282,883
Self-HelpStudent loans $6,416,851 $4,408,133Federal work study $200,000State and other work study/ employment $0 $1,215,608
Total Self help* $6,616,851 $5,623,741Parent loans $0 $1,215,608Tuition Waivers $0 $98,730Athletic Awards $242,105 $363,158
NUMBER OF ENROLLED STUDENTS RECEIVING AID FOR FALL 1999
First-time, full- Full-time Less thantime freshman Undergraduate full-time
A. # of degree-seeking students. 903 4,016 470B. # of students in line A who were financial aid applicants. 626 2,836 188C. # of students in line B who were determined to have financial need. 479 2,188 142D. # of students in line C who received any financial aid. 455 2,079 128E. # of students in line D who received any need-based gift aid. 363 1,599 95F. # of students in line D who received any need-based self-help aid. 428 1,847 133G. # of students in line D who received anynon-need-based gift aid. 172 520 7H. # of students in line D whose need was fully met. 160 686 31I. On average, the % of need that was met ofstudents who received any need-based aid. Exclude any resources that were awarded to replace EFC. 66% 72% 55%J. The average financial aid package of those in line c. Exclude any resources that were awarded to replace EFC. $5,201 $5,639 $3,700K. Average need-based gift award of those in line D. $3,201 $3,194 $1,250L. Average need-based self-help award (excludingPLUS loans and private alternative loans) of those inin line D. $3,116 $3,582 $3,100M. Average need-based loan (excluding PLUS loansand private alternative loans) of those in line D. $2,882 $3,472 $3,100N. Number of students in line A who had no financialneed who received non-need-based aid (excludethose receiving athletic awards and tuition benefits). 189 642 14O. Average award to students in line N. $3,400 $3,400 $300P. Number of students in line A who received anon-need-based athletic award. 27 80 0Q. Average non-need-based athletic award to thosein line P. $3,000 $3,200 $0Note: Students may be counted in more than one row, and full-time freshmen should also be counted asfull-time undergraduates.
VII-6 FINANCIAL RESOURCE CENTER AND COMMON DATA SET

Distribution of Loans
Year / Type of Loan Number** $ Amount % of # % of $
1996-1997 Total 4,514 $11,736,127 100.0% 100.0%
Direct Loan Program* 3,707 $10,016,306 82.1% 85.3%
Perkins Loan 459 $385,024 10.2% 3.3%
PLUS Program 191 $699,195 4.2% 6.0%
Teachers Loan Program 157 $635,602 3.5% 5.4%
1997-1998 Total 4,704 $12,661,085 100.0% 100.0%
Direct Loan Program* 3,871 $10,772,763 82.3% 85.1%
Perkins Loan 426 $294,474 9.1% 2.3%
PLUS Program 249 $959,410 5.3% 7.6%
Teachers Loan Program 158 $634,438 3.4% 5.0%
1998-1999 Total 4,985 $13,047,204 100.0% 100.0%
Direct Loan Program* 3,956 $10,847,489 79.4% 83.1%
Perkins Loan 563 $397,034 11.3% 3.0%
PLUS Program 296 $1,219,490 5.9% 9.3%
Teachers Loan Program 170 $583,191 3.4% 4.5%
1999-2000 Total 4,933 $14,306,919 100.0% 100.0%
Direct Loan Program* 4,104 $12,296,475 83.2% 85.9%
Perkins Loan 455 $415,380 9.2% 2.9%
PLUS Program 221 $1,063,070 4.5% 7.4%
Teachers Loan Program 153 $531,994 3.1% 3.7%
2000-2001 Total 4,677 $13,904,292 100.0% 100.0%
Direct Loan Program* 3,909 $11,631,157 83.6% 83.7%
Perkins Loan 366 $393,050 7.8% 2.8%
PLUS Program 228 $1,253,472 4.9% 9.0%
Teachers Loan Program 174 $626,613 3.7% 4.5%
* Represents # of Subsidized Loan and Unsubsidized Loans made, not actual # of recipients. Actual # of recipients would be a smaller number.** Counts are duplicated and reflect multiple loans.
SOURCE: FINANCIAL RESOURCE CENTER VII-7

MAJOR BUILDINGS ON CAMPUS
LATEST TOTAL CLASSROOMS RES HALL CLASS-BUILDINGS COMPLETED RENOVATION SQ. FEET & LABS OFFICES BEDS ROOMS LABS
Academic Computing Center 1939 1986 6,718 2 4 0 0 2Bancroft Building 1909 1985 86,796 15 116 0 10 7Breazeale Hall 1924 1977 58,255 - - - - -Byrnes Auditorium 1939 1969 68,422 1 1 0 0 1Canterbury House 1937 1983 3,295 0 6 0 0 0Culp Chiller Plant 1969 1995 5,508 0 0 0 0 0Central Energy Facility 1964 15,583 0 0 0 0 0Central Warehouse & Maintenance 1967 23,675 0 7 0 0 0Columbia Seminary Chapel 1936 1,339 - - -Conservatory of Music 1939 1994 35,662 48 7 0 4 48Crawford Health Center 1896 1983 16,038 0 22 0 0 0Dacus Library 1969 90,612 1 7 0 1 0Dinkins Student Center 1966 46,450 0 24 0 0 0Good Building 1950 1991 2,810 0 1 0 0 0Johnson Hall 1920 1993 62,425 13 18 0 5 6Joynes Conference Center 1926 1985 30,077 0 5 0 0 0Kinard Hall 1929 1987 77,156 38 62 0 28 11Lee Wicker Hall 1962 1971 69,382 0 2 290 0 0Life Sciences Building 1999 65,417 0 26 0 2 12McBryde Hall 1894 1990 44,903 0 5 0 0 0McLaurin Hall 1901 1985 53,660 51 60 0 0 45Margaret Nance Hall 1895 1987 59,352 0 8 223 0 0Peabody Gymnasium 1915 1978 53,118 14 20 0 6 1Phelps Hall 1943 1990 90,799 0 1 402 0 0President's Home 1890 1983 9,151 0 0 0 0 0Richardson Hall 1966 87,020 1 1 417 0 41Roddey Apartments 1920 1989 62,118 0 1 96 0 0Rutledge Building 1906 1989 52,289 22 1 0 2 18Sellars 1930 1995 2,020 0 0 0 0 0Shack 1900 1960 5,836 0 0 0 0 0Sims Hall 1961 1968 57,696 31 24 0 5 25Stewart House 1895 1990 8,307 0 8 0 0 0Sykes House 1900 1979 5,627 0 13 0 0 0Thomson Cafeteria 1964 1988 26,859 0 3 0 0 0Thomson Hall 1964 1988 85,434 0 6 325 0 0Thurmond Building 1939 62,057 15 72 0 12 2Tillman Hall 1894 1989 115,264 2 119 0 1 1Winthrop Coliseum 1982 166,441 0 26 0 0 0Winthrop Lodge 1966 1980 35,763 0 2 202 0 0Withers / WTS Building 1892 1996 106,076 16 81 0 17 3Wofford Hall 1967 92,794 0 1 417 0 0
Total 2,048,204 270 760 2,372 93 223
LAND AREA OF CAMPUS
Total Area: 418 AcresMain Campus: 94 Acres
BOOK VALUE OF CAMPUS
Equipment: $5,237,134Land & Improvement: $1,131,020
Buildings: $81,236,081Library Books: $8,898,323
Construction in Progress: $13,183,623Equipment Under Capital Lease: $168,484
TOTAL: $109,854,665
VII-8 SOURCE: FINANCE AND BUSINESS

RESIDENCE HALL OCCUPANCYFALL 2000
TOTALRESIDENCE UNDERGRAD GRADUATE as % of
HALL/APARTMENT CAPACITY MEN WOMEN MEN WOMEN TOTAL CAPACITY
RESIDENCE HALLS 2,256 547 1,527 4 9 2,087 92.5%Lee Wicker 290 0 277 0 1 278 95.9%Margaret Nance 223 0 208 0 1 209 93.7%Phelps 399 0 381 0 3 384 96.2%Richardson 412 376 0 0 0 376 91.3%Thomson* 325 111 198 0 1 310 95.4%Winthrop Lodge* 192 60 80 4 2 146 76.0%Wofford 415 0 383 0 1 384 92.5%
APARTMENTRoddey 88 34 44 3 7 88 100.0%
GRAND TOTAL 2,344 581 1,571 7 16 2,175 92.8%
* COED CAPACITY FOR Men Women THOMSON 132 193 WINTHROP LODGE 91 100
RESIDENCE HALL OCCUPANCYFALL 1999
TOTALRESIDENCE UNDERGRAD GRADUATE as % of
HALL/APARTMENT CAPACITY MEN WOMEN MEN WOMEN TOTAL CAPACITY
RESIDENCE HALLS 2,254 499 1,594 4 10 2,107 93.5%Lee Wicker 290 0 285 0 1 286 98.6%Margaret Nance 223 0 211 0 4 215 96.4%Phelps 399 0 391 0 2 393 98.5%Richardson 411 339 0 2 0 341 83.0%Thomson* 325 103 197 0 2 302 92.9%Winthrop Lodge* 191 57 104 2 0 163 85.3%Wofford 415 0 406 0 1 407 98.1%
APARTMENTRoddey 71 24 42 0 5 71 100.0%
GRAND TOTAL 2,325 523 1,636 4 15 2,178 93.7%
* COED CAPACITY FOR Men Women THOMSON 132 193 WINTHROP LODGE 91 100
VII-9 SOURCE: INSTITUTIONAL RESEARCH

DESCRIPTION 1993-94 1994-95 1995-96 1996-97 1997-98 1998-99 1999-2000
LIBRARY STAFF 32.25 32.25 32.25 32.25 32.25 32.25 31
Professional Librarians 14 14 14 14 14 14 14
Para-Professionals 16.75 16.75 16.75 16.75 16.75 18.75 16
Clericals 1.50 1.50 1.50 1.50 1.50 1.50 1
HOLDINGSVolumes in Book Stock 357,110 363,606 369,149 369,149 377,664 381,168 420,320
Shelving Capacity (Volumes) 400,000 400,000 400,000 400,000 400,000 400,000 400,000
U.S. Government Documents 171,443 176,145 180,008 180,008 182,380 182,380 0***
Units of Microtext 1,026,572 1,060,158 1,099,337 1,099,337 1,153,075 1,206,630 1,215,640
Audio Recordings (Discs & Cassettes) 1,755 1,761 1,783 1,763 1,798 1,826 1,539
Maps 2,388 2,391 2,420 2,420 2,465 2,501 2,515
CD-ROM Titles 58 60 71 71 117 155 224
Total Bound Periodicals & Serials 70,037 71,996 73,819 73,819 73,605 74,906 75,665
Total Current SubscriptionSerial Titles Regularly Received 3,891 2,367** 2,707** 2,707** 2667** 2706** 2639**
Archives (Approximate Piece Count) 2,343,301 2,363,185 2,377,350 2,377,350 2,506,675 2,550,920 2,575,074
TOTAL OPERATING EXPENDITURES $1,598,604 $1,687,599 $1,775,660 $1,803,660 $1,914,107 $1,935,643 2,108,750$
STUDENTSStudent Headcount Enrollment (Fall) 5,107 5,165 5,308 5,402 5,574 5,591 5,840
Expenditures per Student $313 $327 $309 $334 $343 $346 $361
Volumes in Book Stock per Student 70 70 70 68 68 68 72
Students per Library Staff Member 158 160 165 168 173 173 188
Students per Librarian 365 369 379 386 398 399 417
** Not comparable with years earlier than 1994-95 due to change in definitions.***U.S. Government Documents are now included in the total volume
WINTHROP UNIVERSITY LIBRARY STATISTICS1993 - 2000
SOURCE: DACUS LIBRARY AND 1999 FINANCE REPORT VIII-1

INFORMATION TECHNOLOGY
ACADEMIC COMPUTING
Winthrop University Academic Computing supports the instructional and research functions of theUniversity. Within the Division of Information Technology, Academic Computing provides access to diverse computing resources. These resources includes a 500 MHz DEC UNIX AlphaServer, other DEC UNIXservers and workstations, Windows NT microcomputer networks, laboratories with stand-alone microcomputers, and access to DEC VMS clustered AlphaServers. Over 15 computer laboratories supporting PC and Macintosh standards are available on campus for open access and instructional needs.
Winthrop's host computers have an assortment of programming languages such as Ada, BASIC, C, C++,COBOL, Fortran, Java, LISP, and Pascal. Two major statistical and computational packages, SAS andMathematica, are also available. Microcomputer networks and laboratories provide computing resourcesfor support of instructional and research applications. Typical applications include desktop publishing,database management, spreadsheet analysis, graphics, communications, Internet, and word processing.
Dial-up services provide students and faculty with 24 hour access to Winthrop's network and computingfacilities. All main campus buildings are directly connected to the campus network through fiber optic cable.Winthrop is also a node on the Internet. Faculty, staff, and students are provided access to e-mail and Internet. The Academic Computing Center also provides computer access for visually impaired students, as well as Braille printing services.
General operational hours for the Academic Computing Center are Monday through Thursday, 8:00a.m -1:00a.m.; Friday, 8:00a.m. - 5:00p.m.; Saturday, Noon - 5:00p.m.; and Sunday, Noon - 1:00a.m.
DISTANCE LEARNING
Winthrop University is a leader in instructional technology, featuring the Distance Education Classroom inthe College of Business Thurmond Building. Utilizing a T1 digital configuration, classes in Winthrop'sDistance Education Classroom are fully interactive between Winthrop and the remote site. Students andteachers communicate with each other simultaneously in classrooms outfitted with robotic cameras, TVmonitors, desk microphones, and a fully equipped television control room.
MBA candidates at Coastal Carolina University in Conway, SC, are already online with Winthrop to takeadvantage of this learning opportunity. Winthrop's MBA degree is the same AACSB accredited programthat has enjoyed more than 20 years of success serving the Charlotte Metrolina region. Dual credit courses are also offered over the T1 circuit and through the BEACON network to local area high schools using an ATM fiber network.
VIII-2 SOURCE: INFORMATION TECHNOLOGY

CAREER SERVICES
NUMBER OF CO-OP/INTERNSHIPS
SCHOOL/COLLEGE 1992-93 1993-94 1994-95 1995-96 1996-97 1997-98 1998-99 1999-00
ARTS & SCIENCES 12 25 24 56 62 46 40 41BUSINESS ADMINISTRATION 55 57 46 42 58 65 47 55EDUCATION 6 12 6 5 4 2 6 21VISUAL & PERFORMING ARTS 17 36 24 32 20 26 21 27
TOTAL 90 130 100 135 144 139 114 144
NUMBER OF CO-OP EMPLOYERS
YEAR A&S Business Education VPA Total
1999-00 30 38 16 16 1001998-99 37 40 6 25 1081997-98 44 57 2 26 1291996-97 55 48 4 19 1261995-96 50 35 5 32 1221994-95 16 56 2 14 881993-94 21 52 11 10 941992-93 11 43 6 17 77
TOTAL 264 369 52 159 844
CO-OP CREDIT HOURS
A&S Business Education VPA Total1999-00 # of Students 32 22 20 25 99 Credit Hours Earned 49 51 63 75 238 Tuition ($172/credit hour) $8,428 $8,772 $10,836 $12,900 $40,9361998-99 # of Students 27 28 5 18 78 Credit Hours Earned 55 67 15 54 191 Tuition ($168/credit hour) $9,240 $11,256 $2,520 $9,072 $32,0881997-98 # of Students 28 22 1 23 74 Credit Hours Earned 51.0 60.0 3.0 69.0 183.0 Tuition ($160/credit hour) $8,160 $9,600 $480 $11,040 $29,2801996-97 # of Students 34 21 4 18 77 Credit Hours Earned 68.0 45.0 15.0 54.0 182.0 Tuition ($159/credit hour) $10,812 $7,155 $2,385 $8,586 $28,9381995-96 # of Students 43 27 5 30 105 Credit Hours Earned 62.0 44.0 10.0 90.0 206.0 Tuition ($145/credit hour) $9,548 $6,776 $1,540 $13,860 $31,7241994-95 # of Students 21 43 6 23 93 Credit Hours Earned 32.0 53.0 14.0 69.0 168.0 Tuition ($145/credit hour) $4,640 $7,685 $2,030 $10,005 $24,360
JOB FIND
1992-93 1993-94 1994-95 1995-96 1996-97 1997-98 1998-99 1999-00
Total Employers 311 371 476 450 411 361 547 480 First-Time Employers 126 137 226 184 283 223 224 203
Repeat Employers 185 234 250 266 128 138 323 277
# of Jobs Posted 318 460 542 684 935 1104 1,042 600# of Students Placed 311 321 259 310 240 259 324 118
Total Earnings* $1,377,021 $1,438,727 $807,447 $1,241,167 $535,430 $783,563 $1,054,503 $416,541Yearly Avg. Earned per Student $3,349 $4,482 $3,118 $4,004 $2,231 $3,025 $3,255 $3,255
Avg. Hourly Wage per Student $4.81 $5.00 $6.00 $5.30 $5.47 $5.13 $6.27 $5.59Avg. Hrs. Worked per Week per Stu. 25.24 19.13 20.00 20.00 15.00 15.50 26.24 14.57*Estimated earnings based on average hours worked and money earned per week for each student placed.Note: Students no longer register with open board system
JOB LISTINGS POSTED AT CAREER SERVICES
# General # of Co-op # Job Find # Resume On Campus TotalYEAR Job Listings Listings Referrals Referrals Recruiters Jobs Listed
1999-00 43,009 128 660 342 24 44,1631998-99 34,843 230 1042 375 21 36,5111997-98 33,184 348 1104 112 24 34,7721996-97 21,604 396 935 110 28 23,0731995-96 25,000 227 684 61 22 25,9941994-95 23,218 117 542 59 45 23,9811993-94 12,346 120 460 140 59 13,1251992-93 11,121 140 318 196 53 11,828
TOTAL 204,325 1,706 5,745 1,395 276 213,447
SOURCE: CAREER SERVICES VIII-3