your presentation title - home - cme manitoba - canadian...
TRANSCRIPT

Presentation Title
Gary Downs, Lean Master, Shell Canada
your
organization
logo here

LEAN2012.COM
Shell Canada
• Please provide information on your organization - overview and history
(slide 1 - who we are)

LEAN2012.COM
Shell’s Canadian Oil Sands Assets

LEAN2012.COM
Continuous Improvement through Kaizen Events
• Shell Canada uses Kaizen Events as the tool of choice as it uses the intellect of the organization rather than the brains of the few.
• The Kaizen events are carried out at the place of work( Gemba)
• This is a great tool to help start to influence culture within an organization

LEAN2012.COM
TMB
Vendor
Supplier Customer
Procurement Control
Platform Control
Logistics Control
Stock Replenishment
Stock Level ( Work Order )
Create Requirement
Receive
Hold
Prep for Ship Dispatch
HOLD 9000 Lines
13 Million GBP
VLA
Maint Dept
Platform Engineer Team
Platform Maint Team
Platform Project Team
Wells Team
INV Team
Preserve Stock
Containers > 21 days
79 Containers
8951 Days ( 24 k )
Avg Sailings : 46
Avg Containers : 2080
Avg Air Freight : 275
Goods Receipted : 1600
Containers Packed @ AOB : 220
Failed Goods : 30 / 1600
Weight per Container ( May ): 1700
Total Weight ( may ) 5872 t
Avg Weight per Container 3 . 45 t
Total 16740 Lines
109 Million GBP
ROS ( Required on Site )
Attainment 39 %
Feasibility 39 %
Maint 14144 Lines
20 . 9 Million GBP
Preserve 341 Lines
2 . 36 Million GBP
Transportation Inventory Motion Waiting OverProduction OverProcess Defects
Outbound Logistics Current State
T1 InterLocation Moves (Edzell, Yarbrough)
T2 Deck Utilization
T3 Round Trip To Platform
T4 % Direct to Torry Dock/Storage
I1 Excess Hold Inventory
I2 Excess Stock
I3 Excess Prevention
I4 Excess VLA
M1 Moves between Stock/Hold
M2 Open Box Policy
W1 Container in VLA In/Out
W2 Idle time of Vessel
W3 Container Rental Time
W4 1 Month Test Window
W5 Unused (aged) Hold Material
W6 Platform Not Ready (Crew not Available)
W7 Waiting for Material that did not make shipment
W8 Waiting on PO/Release
OPD1Material Unconsumed by Work Order
(Platform/VLA/Hold)
OPD2 Failed Automation Order
OPG1 Use of Space in Vendor Container / Our Container
OPG2 Inspection/Open of Return Container
OPG3 Open-Box Policy- 100% Sample
OPG4 Use of Generics results in Expedite
OPG5Order New Material on Generics when item is in
Stock
D1 Inventory of material not directly linked to Install
D2 Schedule Attainment
D3 Defects of Incorrect Specifications
D4 Unavailable Stock (StockOuts)
D5 % Defective found during Inspection
D6 Vendor Compliance for Lead time, quality
D7 VLA flagging process (eliminate errors)
D8 Container hire costs (21 days free)
High Turn Items
Ordered By Platform
Issue order to Vendor
Physical Receipt
Long Term Any Platform
Short Term A Platform
Maint Items
Move to VLA
Load and Manifest
Deck Utilization:
Overall: 69% Utilised
85% Permitted
Idle Time 2008: 17213hrs
$723 per Hour
12.5M Total Costs Annually
1.1M Avg per Month
T1
T2
T3
T4
I1
I2 I3
I4
M1 M2
W1
W2
W3
W4
W5
W6 W7
W8
OPD 1
OPD 1
OPD 1
OPD 2
OPG 1
OPG 2
OPG 3
OPG 4
OPG 5
D1
D2
D4
D5
D6
D7
D8

LEAN2012.COM
7
Less Labor Requirements
Less Space Requirements
Increased Flexibility
Decreased Costs
Improved Quality
Improved Responsiveness
Increased Innovation
Increased Employee Enthusiasm
Benefits & Expectations of Reducing Waste
Why Kaizen? “Show me the Waste”
• Waste Comes in many forms, described using the “Seven Wastes”: Transportation
Inventory
Motion
Waiting
Over production
Over processing
Defects/Rework
– Remembered using the acronym T.I.M.W.O.O.D.( do not forget, the waste of Intellect)
– Another waste is: People (untapped and/or misused resources)
LEAN2012.COM
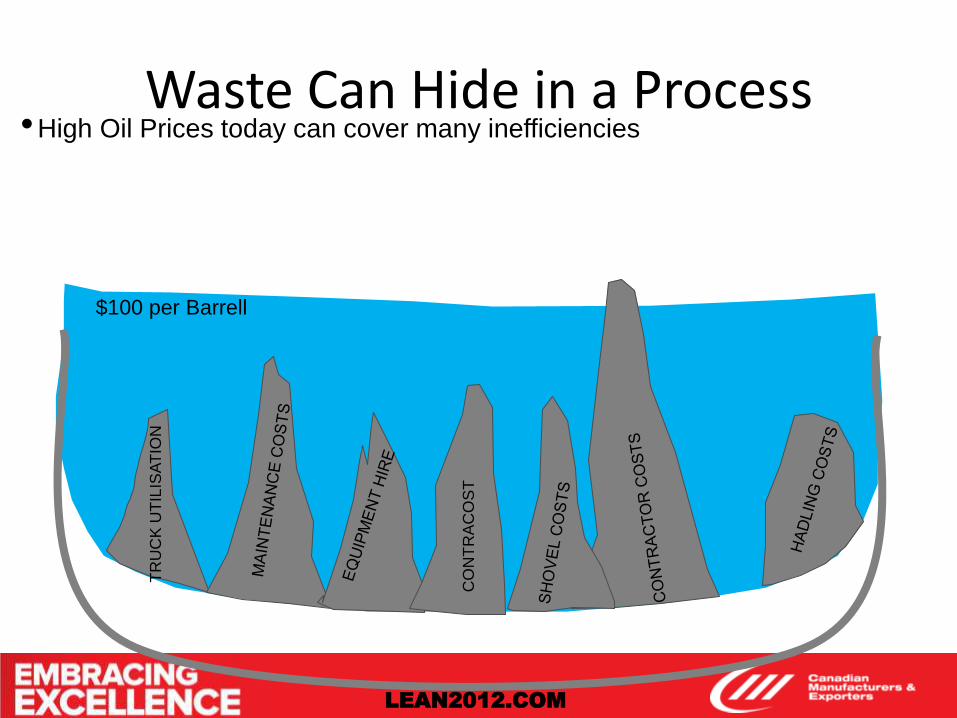
Waste Can Hide in a Process
$100 per Barrell
TR
UC
K U
TIL
ISA
TIO
N
CO
NT
RA
CO
ST
•High Oil Prices today can cover many inefficiencies

LEAN2012.COM
Waste Can Hide in a Process
$40 per Barrel
TR
UC
K U
TIL
ISA
TIO
N
CO
NT
RA
CO
ST
•When Oil prices fell, then true performance was shown

LEAN2012.COM
10
What is a Kaizen Event? • The Kaizen is a vehicle to execute improvements quickly
A. Pre-Event Preparation: Identify and plan the narrow-scoped event Define the problem with a clear problem statement Measure the baseline and establish goal(s) Determine that a solution is possible and that the stakeholders are aligned and supportive Plan the timing if execution of the event by team
B. Execute the Kaizen: Engage the team to validate the problem, gather the elements of the solution, get an OK then test and Implement do-now solutions during the Kaizen
C. Sustain with Follow-up Action Items: Follow-up actions typically end 21 days following the Kaizen
Pre-Event Prep (1 day) 3 wks before event
Kaizen Event ! (3-5 days)
Event Follow-up (15-21 workdays)
Kaizen Timeline (Can be 2 months from Start of Preparation, Execution of the Event, then
to Sustaining Follow-up)

LEAN2012.COM 11
Kaizen Change Readiness
Process x Acceptance = Results ( P x A = R )
Rate the new process from 1 to 10
Rate the level of acceptance from 1 to 10
Multiply the two numbers
P9 X A2 Results = 18
P7 X A5 Results = 35
Conclusion: You will get better results with a good process that has buy-in from the process participants than a better process without buy-in…especially applies to long term results
(control phase).

LEAN2012.COM 12
Development Roadmap for Kaizen Certification
Lean & Kaizen Training
Train as Kaizen Leader?
Kaizen Co-delivery
10%
Kaizen Co-Delivery
50%
Kaizen Delivery
90%
Kaizen Leader
Certified
Co-deliver Lean & Kaizen Training 1
Co-deliver Lean & Kaizen Training 2
Kaizen Facilitator
Certified

LEAN2012.COM
Lessons Learned
Central CI team versus Being run in the Line –or is there a compromise?
–Just starting on the Lean journey
–Been on the Lean journey for a few years –Well on its way

LEAN2012.COM

LEAN2012.COM
A Few Tips!
• Tell your journey like a story, including lots of photographs in your PowerPoint
• Limit information about your company to 2 minutes – Spend your time on the journey
• Talk about “the good, the bad and the ugly” – Talk about the success and what “key lessons” were
learned to get there
– Talk about what you would you do differently
• Show examples of the tools used – eg. tracking sheets, performance metrics
• Talk about the details of your best practices
• Talk about how the results were achieved
15

The Previous Approach to Replication...and Why it Did Not Work
Direct BI support ends handed over to the line
Time
Performanc
e
Area A
Area B
Area C
Area B
Area C
Area A
Negative emotions created by focussing on poor performers
Force fitting approach to replication
Highlighting non-conformance used as mechanism to enforce replication
Tracked replication
progress through
spreadsheet
Replication pack from Area A
Area A Area B Area C
Project 1
Project 2
Area B
Area C
Gap
Gap

The DSA Approach to Replication and Why it is Working
Area A Area B Area C
Celebrate success of high performing areas Menu approach used to tailor replication projects to fit
specific area needs
Potential Improvement Manual from
Area C
Area B
Area A
work tor “Discovers” the
critical success factors
that enable an Area
perform well
Tailor replication to fit Area B
Tailor replication to fit Area A
BI support implementation of improvements and
capture any further lessons
Replication area picks
what critical success
factors they want to
implement
Area A Area B
Area C
Time
Performance
End result: Positive approach to improve
the performance of multiple areas
Direct BI support all the way through
replication

Apply Example of one of the 18 Potential Improvements
Visual Representation:
Successful outcome of implementation:
Satellite stores are placed in strategic locations near the point of
use. These stores are used to store lube oil products, including
sealed jugs.
Benefits of successful implementation:
Reduce motion waste by having lube oil close to equipments that
use it
Reduce chance of contamination by holding lube oil in dry
sealed area
Reduce amount of time spent looking for oil around plant
How to put suggested solution in place (one-off exercise to
implement):
From lube oil schedule and plot plan, work out strategic position
for satellite stores from equipment locations
Place satellite store cabinets in identified location
Place sealed jugs in satellite stores
Take photos and put sustainment charts in place
Who should put suggested solution in place:
Rotating Equipment Engineer/Operations
How to use suggested solution:
Satellite stores are used by operations to store oil for the area
5S audit should be in place to ensure the store is maintained to
standards
Oil is taken from the satellite store whenever needed for the job
Oil is then placed back in the satellite store after use
Who should use suggested solution:
Operations
Maintenance
Lube oil delivery person
How to detect suggested solution is in place:
Satellite store is in place
8. Satellite Stores

Continuous Improvement Additional learning's during replication, these are updated in the potential improvements manual
Shearwater implement this differently to St.Fergus but still successfully. Pictures captured and added to potential improvement manual
8. Satellite Stores
Work with reliability engineers to fully determine how to implement this and think about how we can error proof the sampling process
Further worked and defined critical success factor with help from functional teams 18. Notification of Oil Spec Change
Critical success factor removed as realised its encompassed in 18. Notification of Oil Change
Standard processes from St.Fergus tailored to an offshore environment. Collated in potential improvement manual to use on the next offshore replication
‘How to implement solution’ documented fully in potential improvement manual through capturing screen shots and a how-to guide developed during workshop
3. Stock Level Controlled through
SAP
4. Knowledge to use SAP MRP
5. Standardised Stock Audit Routine
13. Lube Oil Top-up Process
17. Performance Tracking through Lube Oil Analyst
XX. Feedback Loop (Platform to
Function)
3. Stock Level Controlled through
SAP

LEAN2012.COM
Questions & Answers
Maximum: 10 minutes
Type organization name here

LEAN2012.COM
Closing slide
• Gary Downs
• Gary.Downs@Shell .com
• Session title and number
Please return your completed session evaluation form to the room host

LEAN2012.COM
Please contact your Value Stream Leader or Ian Marshall, Program Chair [email protected] if you have questions on preparing your presentation.
VS1 John Chaput [email protected] VS2 Rod Smith [email protected] VS3 Kenneth Leung [email protected] VS4 Vern Campbell [email protected]
Contact Information