1hfy2021 interim presentation
TRANSCRIPT
0
26 February 2021
1HFY2021
INTERIM PRESENTATIONANALYST BRIEFING
1
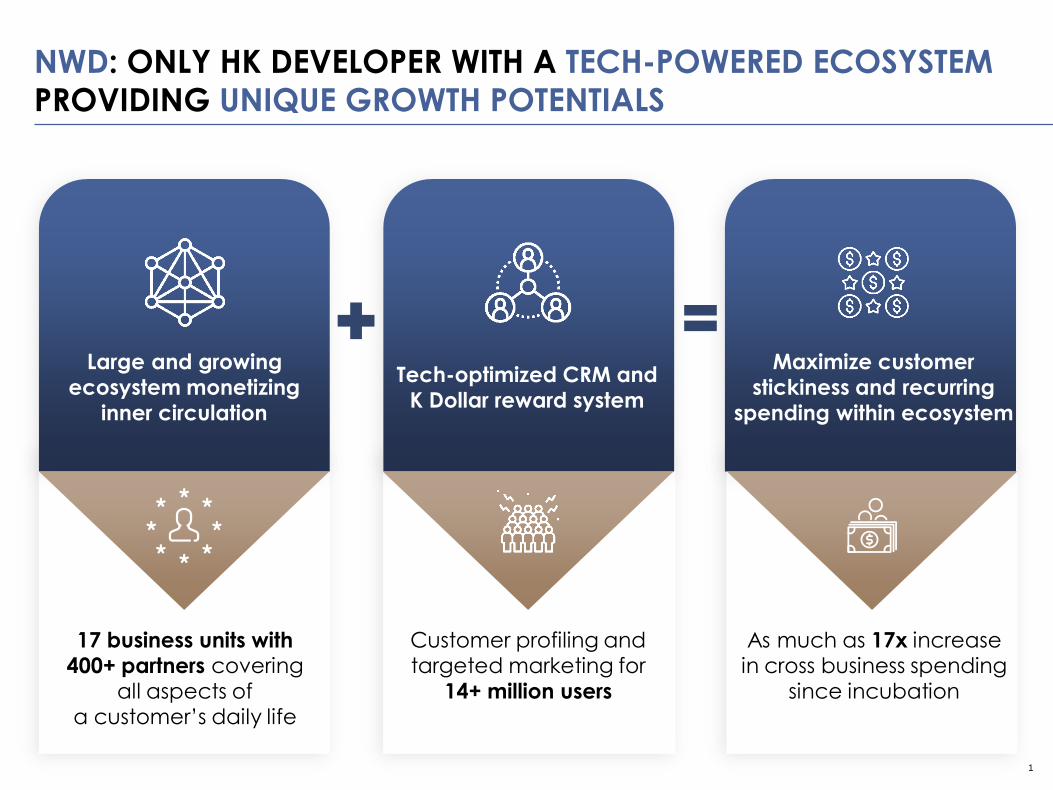
NWD: ONLY HK DEVELOPER WITH A TECH-POWERED ECOSYSTEM
PROVIDING UNIQUE GROWTH POTENTIALS
17 business units with 400+ partners covering
all aspects of a customer’s daily life
Customer profiling and targeted marketing for
14+ million users
As much as 17x increasein cross business spending
since incubation
Tech-optimized CRM and K Dollar reward system
Large and growing ecosystem monetizing
inner circulation
Maximize customer stickiness and recurring
spending within ecosystem

2
BROAD AND RAPIDLY EXPANDING ECOSYSTEM
CAPITALIZES ON INNER DEMAND CIRCULATION
14M+ total members in private domain traffic
Exponential growth potentials
from absorbing public domain
traffic into our ecosystem
Public Domain
Strategic partnerships including
internet companies and banks
Large ecosystem covering all aspects of customer’s daily life
Expansion through business connectivity and internal circulation

3
Artificial intelligenceData analysis and customer
profiling
K11 GO & K11 AppPersonalized program
K Dollar & KPOSInstant earn and burn
Proprietary ecosystem
currency
Recurring spending
Pin-pointed recommendations
and experience
Inner loop ecosystem
Know Your Customer
CRM and Big Data Online offline touch points
K
NWD 4 TECH PILLARS: FULLY UTILIZING TECHNOLOGY FOR CRM
OPTIMIZATION
Leveraging AI and big data analysis to learn customer habit and boost recurring spending
4
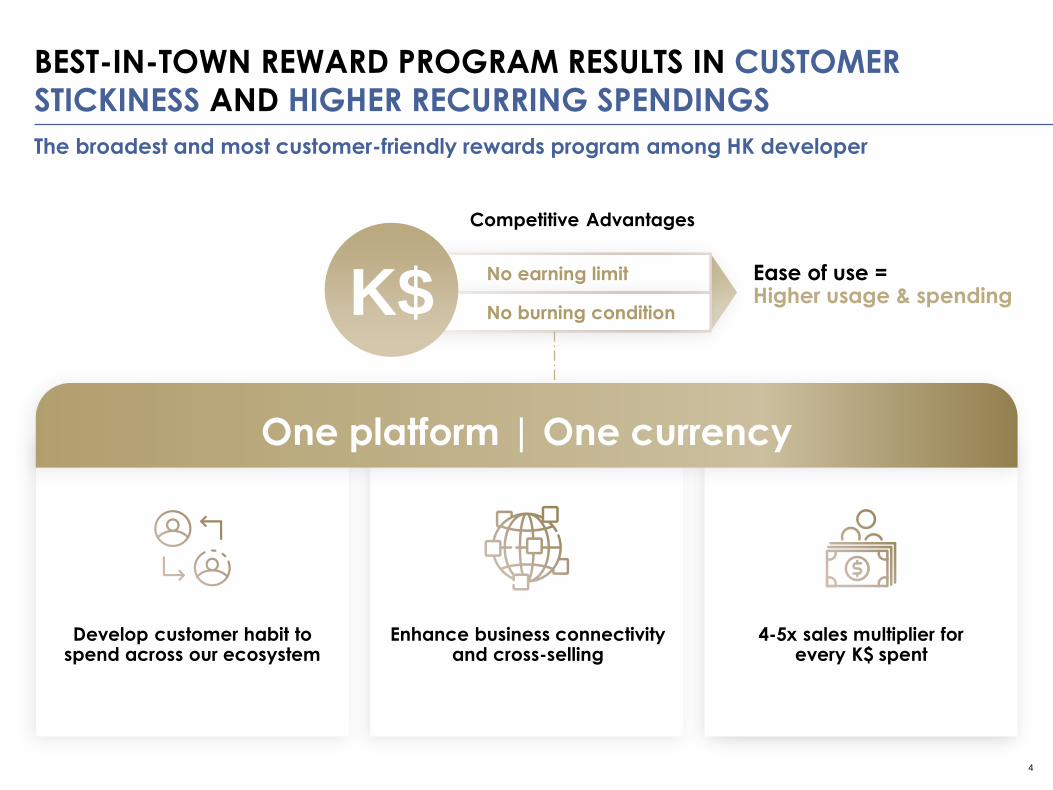
BEST-IN-TOWN REWARD PROGRAM RESULTS IN CUSTOMER
STICKINESS AND HIGHER RECURRING SPENDINGS
The broadest and most customer-friendly rewards program among HK developer
No earning limit
No burning condition
Competitive Advantages
Higher repeat spending with 4-5x multiplier
Ease of use = Higher usage & spending
Develop customer habit to spend across our ecosystem
Enhance business connectivity and cross-selling
4-5x sales multiplier forevery K$ spent
One platform | One currency
K$
5
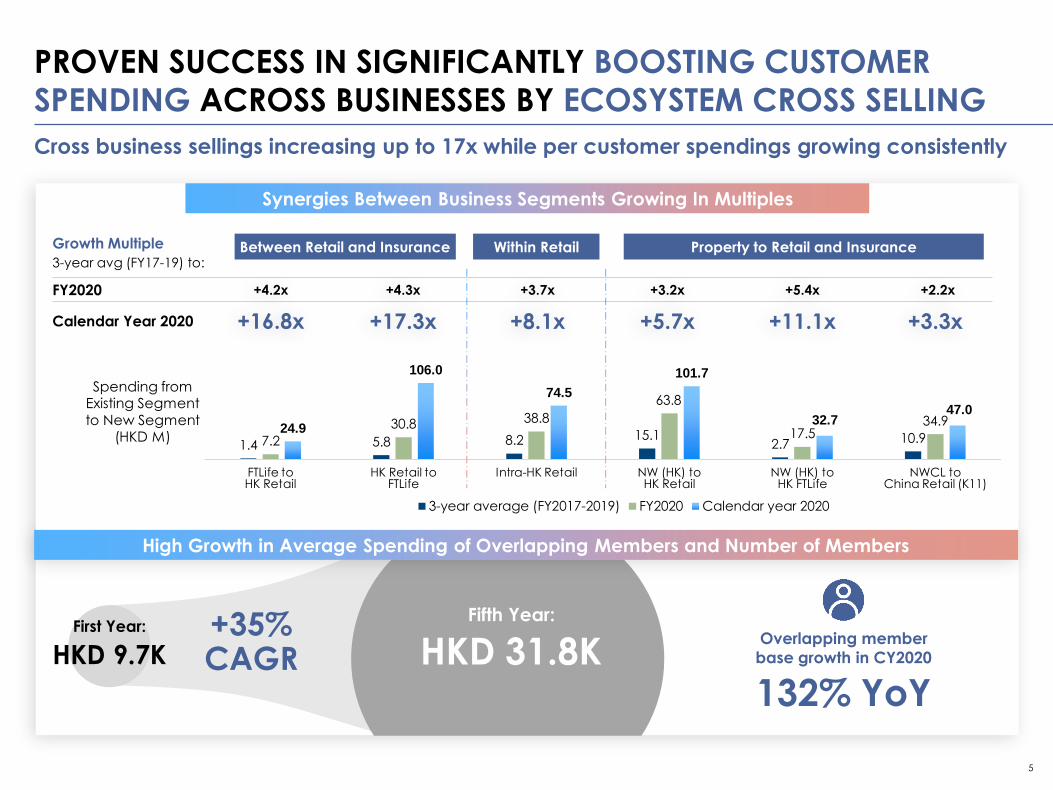
First Year:
HKD 9.7K
Synergies Between Business Segments Growing In Multiples
1.4 5.8 8.2 15.12.7 10.97.2
30.8 38.8
63.8
17.534.9
24.9
106.0
74.5
101.7
32.747.0
FTLife to HK Retail
HK Retail to FTLife
Intra-HK Retail NW (HK) to HK Retail
NW (HK) to HK FTLife
NWCL to China Retail (K11)
3-year average (FY2017-2019) FY2020 Calendar year 2020
Spending from Existing Segment
to New Segment (HKD M)
Between Retail and Insurance Within Retail Property to Retail and Insurance
High Growth in Average Spending of Overlapping Members and Number of Members
Fifth Year:
HKD 31.8K+35% CAGR
Growth Multiple
3-year avg (FY17-19) to:
Calendar Year 2020
FY2020
+16.8x +17.3x +8.1x +5.7x +11.1x
+4.2x
+3.3x
+4.3x +3.7x +3.2x +5.4x +2.2x
Overlapping member
base growth in CY2020
132% YoY
PROVEN SUCCESS IN SIGNIFICANTLY BOOSTING CUSTOMER
SPENDING ACROSS BUSINESSES BY ECOSYSTEM CROSS SELLING
Cross business sellings increasing up to 17x while per customer spendings growing consistently
6
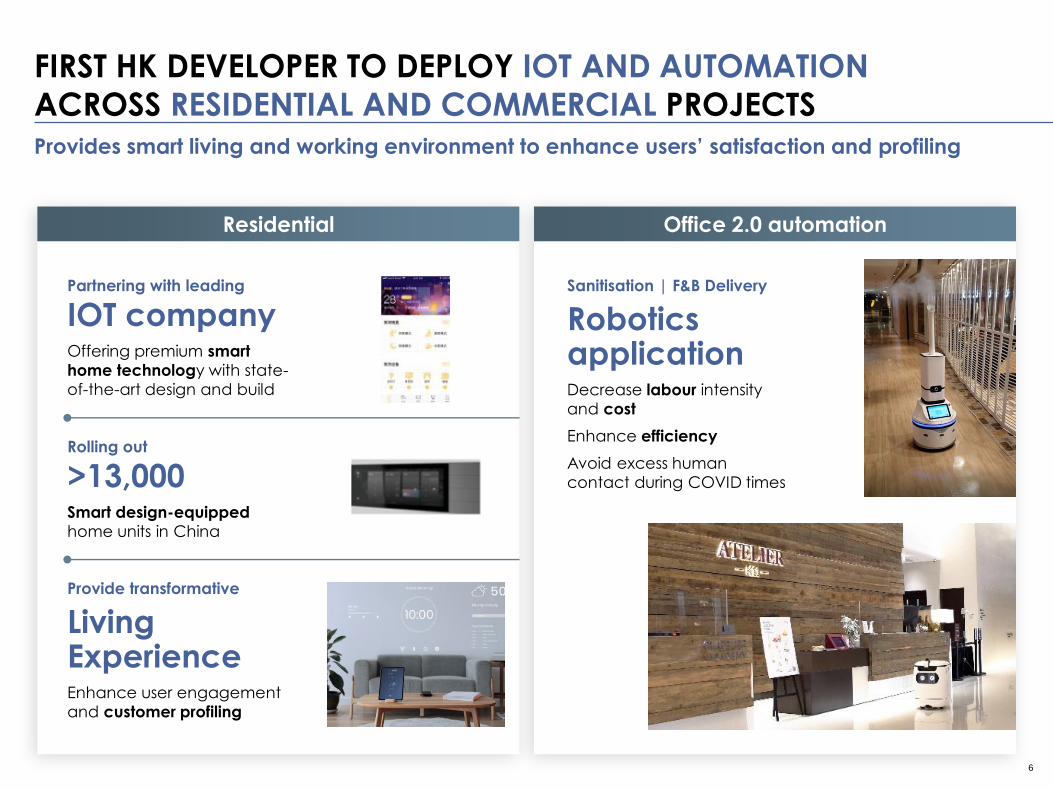
Residential
Partnering with leading
IOT companyOffering premium smart
home technology with state-
of-the-art design and build
FIRST HK DEVELOPER TO DEPLOY IOT AND AUTOMATION
ACROSS RESIDENTIAL AND COMMERCIAL PROJECTSProvides smart living and working environment to enhance users’ satisfaction and profiling
Rolling out
>13,000Smart design-equipped
home units in China
Provide transformative
Living ExperienceEnhance user engagement
and customer profiling
Office 2.0 automation
Sanitisation | F&B Delivery
Robotics applicationDecrease labour intensity
and cost
Enhance efficiency
Avoid excess human
contact during COVID times

7
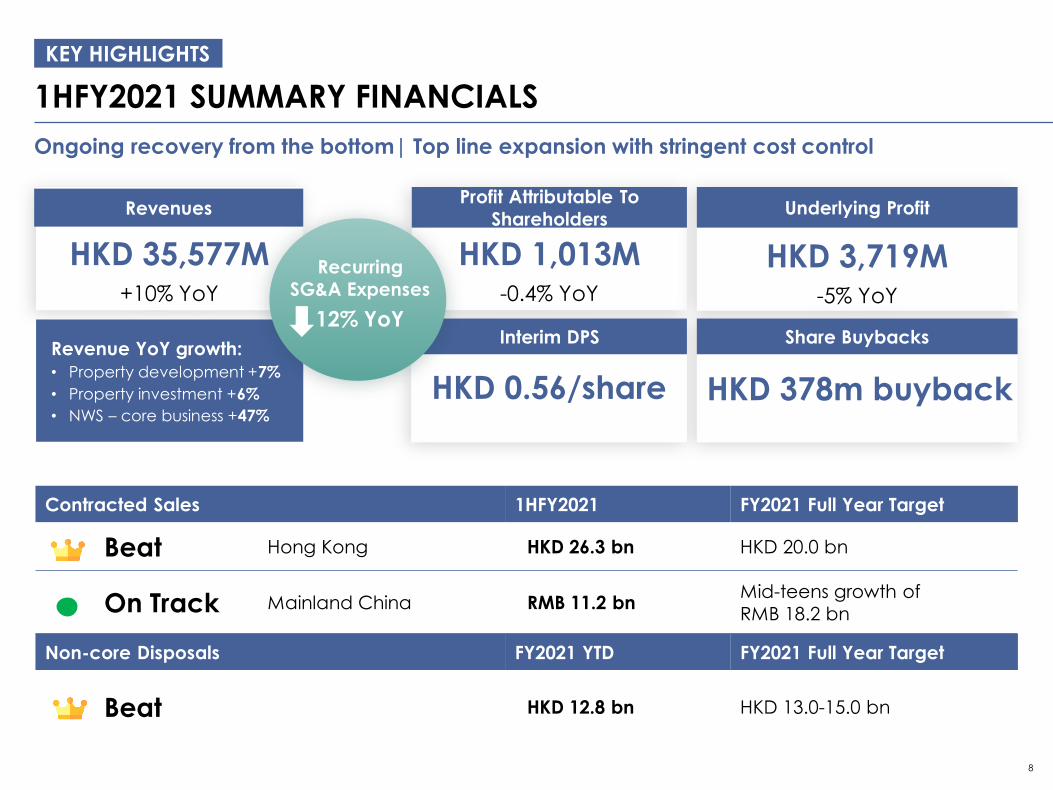
KEY HIGHLIGHTS
8
KEY HIGHLIGHTS
HKD 35,577M+10% YoY
HKD 1,013M-0.4% YoY
HKD 3,719M-5% YoY
RevenuesProfit Attributable To
ShareholdersUnderlying Profit
1HFY2021 SUMMARY FINANCIALS
Ongoing recovery from the bottom| Top line expansion with stringent cost control
Share Buybacks
HKD 0.56/share
Interim DPSRevenue YoY growth:
• Property development +7%
• Property investment +6%
• NWS – core business +47%
Contracted Sales 1HFY2021 FY2021 Full Year Target
Beat Hong Kong HKD 26.3 bn HKD 20.0 bn
On Track Mainland China RMB 11.2 bnMid-teens growth of
RMB 18.2 bn
Non-core Disposals FY2021 YTD FY2021 Full Year Target
Beat HKD 12.8 bn HKD 13.0-15.0 bn
Recurring
SG&A Expenses
12% YoY
HKD 378m buyback
9
PROPERTY DEVELOPMENT

10
Revenue by Region
Decrease in segment results due
to lower GP margin from non-
GBA projects
Overall GP margin at 32%
GBA (excluding Hong Kong) GP
margin remained strong at 66%
3,667 2,765
8,320 10,030
1HFY2020 1HFY2021
HK Mainland China
11,98712,795
Revenue increase
7% YoYPrimarily driven by Ningbo New
World Plaza Land (寧波新世界)
1,777 1,058
5,024
3,057
1HFY2020 1HFY2021
HK Mainland China
6,801
4,115
PROPERTY DEVELOPMENT
RESILIENT PERFORMANCE
Healthy revenue growth amidst challenging environment
Segment Results by Region
Major booking in 2HFY2021
• HK: Artisan Garden; Atrium House, Timber House
• PRC: Shenzhen Prince Bay (深圳太子灣); Wuhan Guanggu office tower (武漢光谷); 寧波新世界;瀋陽新世界;鞍山新世界;廣佛新世界
11
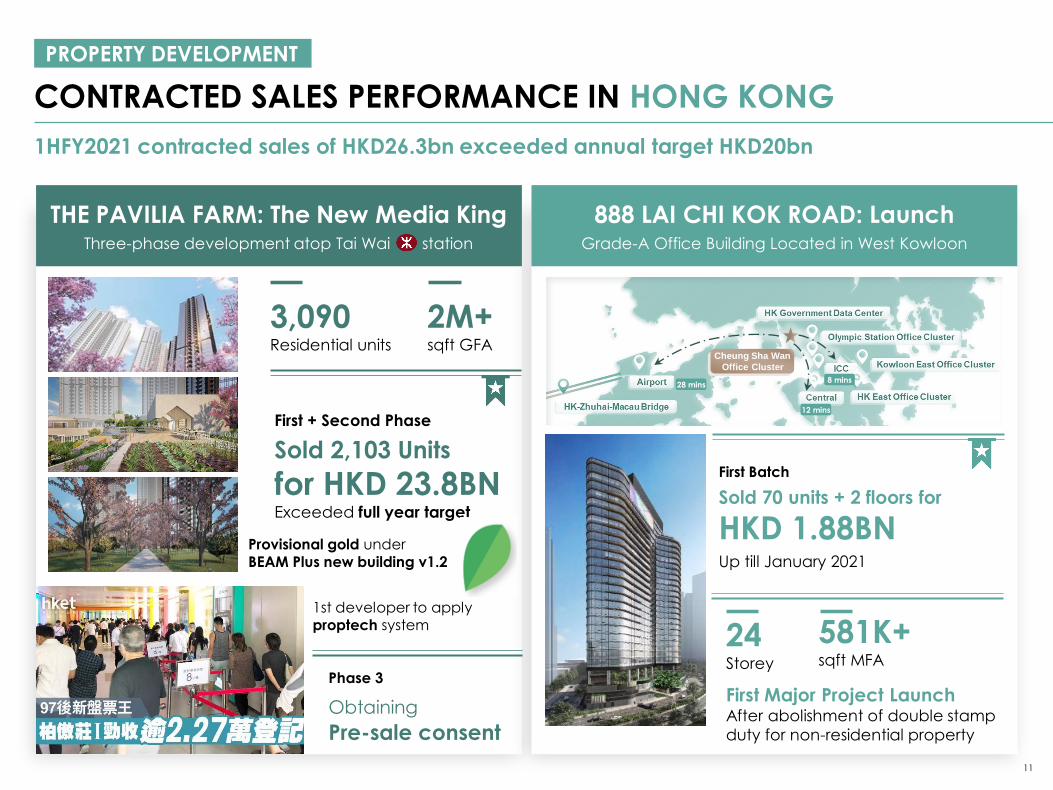
PROPERTY DEVELOPMENT
CONTRACTED SALES PERFORMANCE IN HONG KONG
1HFY2021 contracted sales of HKD26.3bn exceeded annual target HKD20bn
First + Second Phase
Sold 2,103 Units
for HKD 23.8BNExceeded full year target
THE PAVILIA FARM: The New Media KingThree-phase development atop Tai Wai station
3,090Residential units
Phase 3
Obtaining
Pre-sale consent
2M+sqft GFA
888 LAI CHI KOK ROAD: LaunchGrade-A Office Building Located in West Kowloon
Cheung Sha Wan
Office Cluster
28 mins
12 mins
8 mins
24Storey
581K+sqft MFA
First Batch
Sold 70 units + 2 floors for
HKD 1.88BNUp till January 2021
First Major Project LaunchAfter abolishment of double stamp
duty for non-residential property
Provisional gold underBEAM Plus new building v1.2
1st developer to apply proptech system
12
PROPERTY DEVELOPMENT
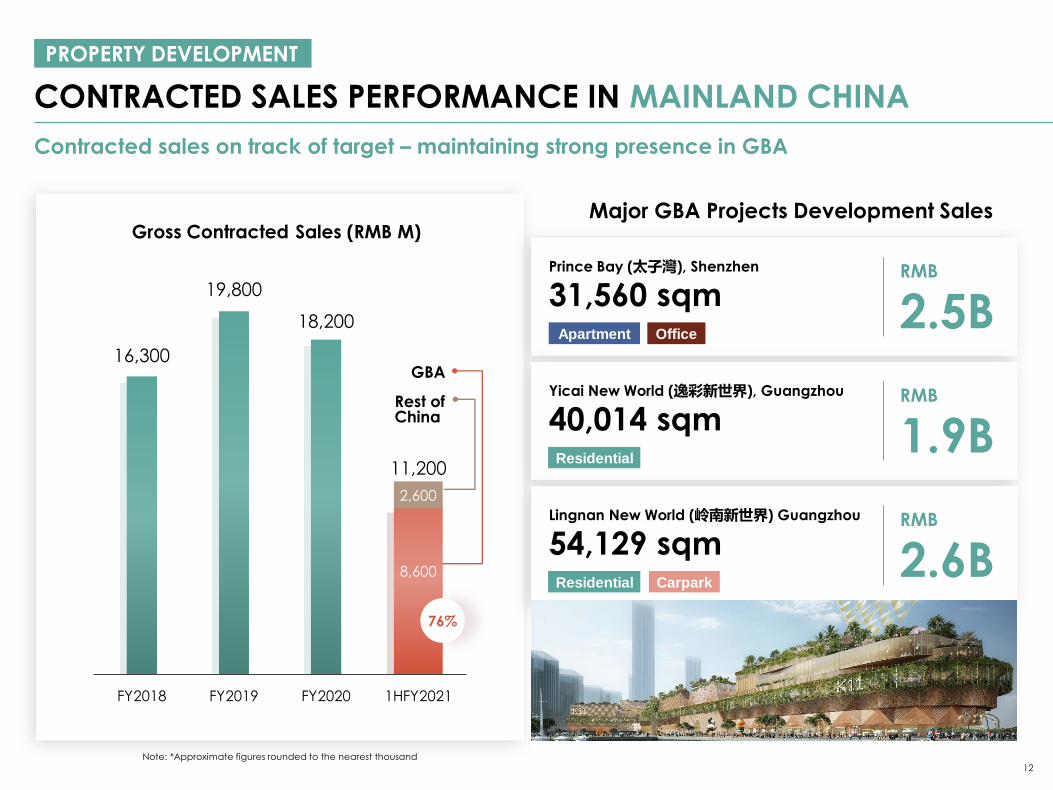
CONTRACTED SALES PERFORMANCE IN MAINLAND CHINA
Contracted sales on track of target – maintaining strong presence in GBA
Gross Contracted Sales (RMB M)
16,300
19,800
18,200
8,600
Note: *Approximate figures rounded to the nearest thousand
FY2018 FY2019 FY2020 1HFY2021
GBA
Rest of China
11,200
2,600
76%
Major GBA Projects Development Sales
Prince Bay (太子灣), Shenzhen
31,560 sqm Apartment Office
RMB
2.5B
Yicai New World (逸彩新世界), Guangzhou
40,014 sqm Residential
RMB
1.9B
Lingnan New World (岭南新世界) Guangzhou
54,129 sqm Residential
RMB
2.6BCarpark
13
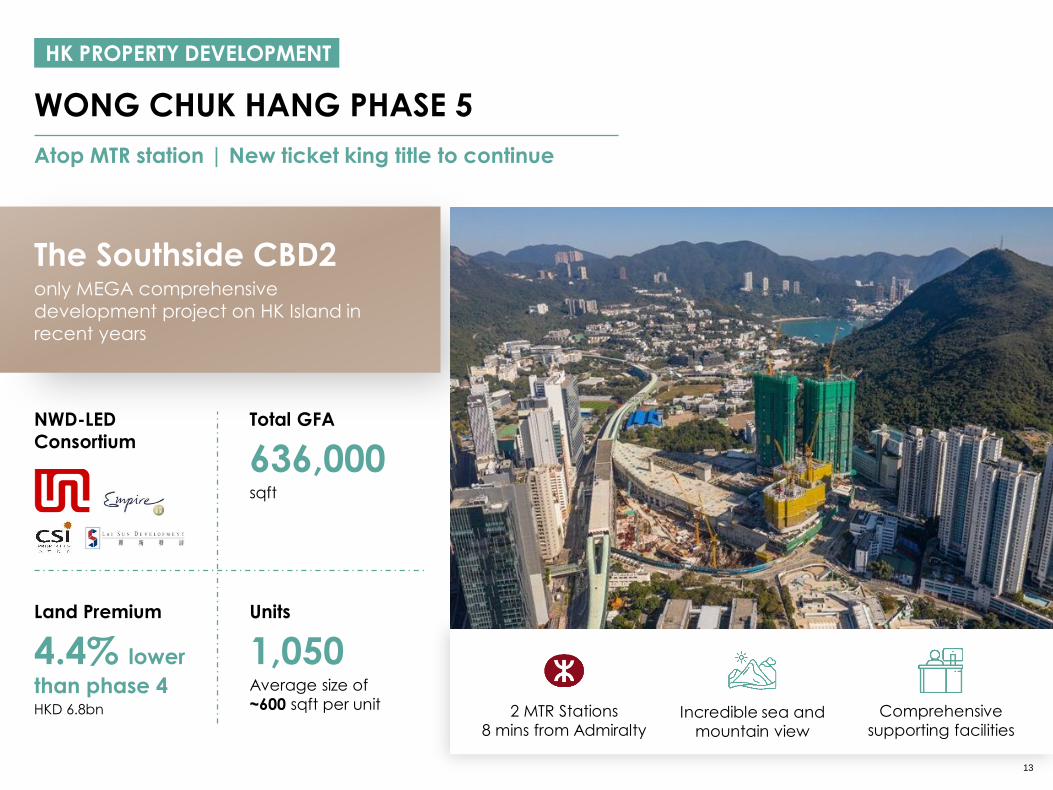
WONG CHUK HANG PHASE 5
Atop MTR station | New ticket king title to continue
HK PROPERTY DEVELOPMENT
The Southside CBD2only MEGA comprehensive
development project on HK Island in
recent years
NWD-LED
Consortium
Land Premium
4.4% lower
than phase 4HKD 6.8bn
Total GFA
636,000 sqft
Units
1,050 Average size of
~600 sqft per unit 2 MTR Stations
8 mins from AdmiraltyIncredible sea and
mountain view
Comprehensive
supporting facilities
14
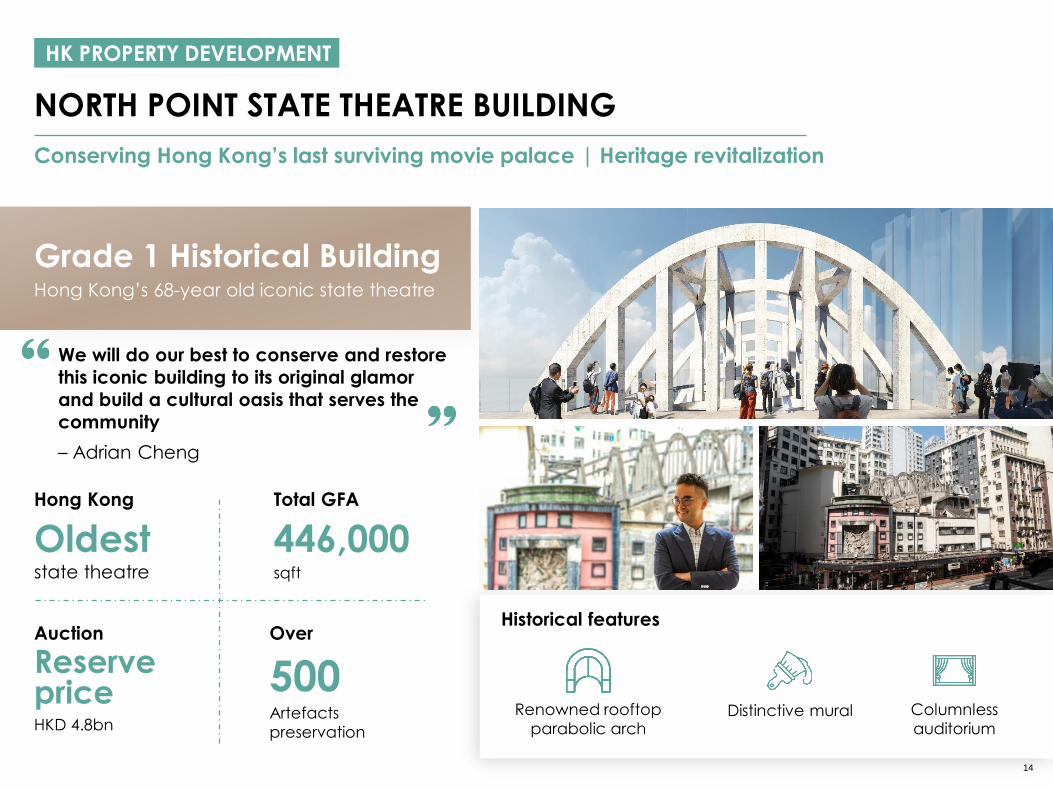
Grade 1 Historical BuildingHong Kong’s 68-year old iconic state theatre
NORTH POINT STATE THEATRE BUILDING
Conserving Hong Kong’s last surviving movie palace | Heritage revitalization
HK PROPERTY DEVELOPMENT
Auction
Reserve priceHKD 4.8bn
Total GFA
446,000 sqft
Hong Kong
Oldeststate theatre
Renowned rooftop
parabolic archDistinctive mural Columnless
auditorium
Historical featuresOver
500Artefacts
preservation
We will do our best to conserve and restore
this iconic building to its original glamor
and build a cultural oasis that serves the
community
– Adrian Cheng
15
PROPERTY INVESTMENT
16
PROPERTY INVESTMENT
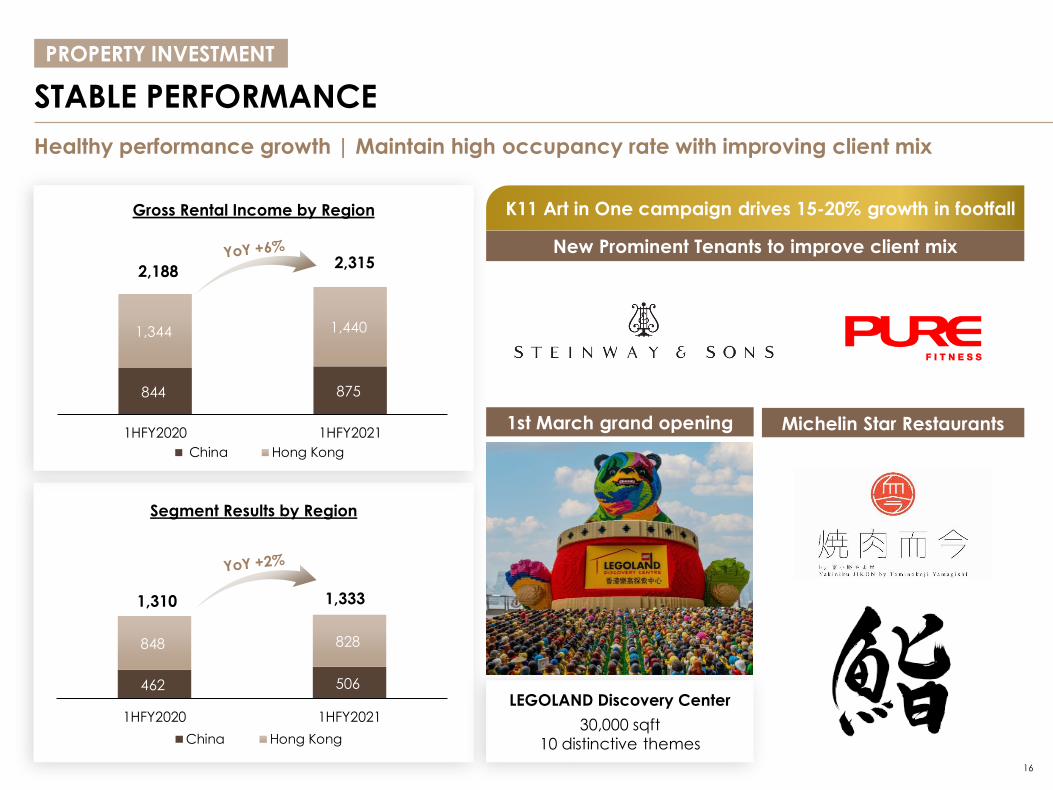
STABLE PERFORMANCE
Gross Rental Income by Region
844 875
1,344 1,440
1HFY2020 1HFY2021
China Hong Kong
2,1882,315
Segment Results by Region
462 506
848 828
1HFY2020 1HFY2021
China Hong Kong
1,310 1,333
Healthy performance growth | Maintain high occupancy rate with improving client mix
LEGOLAND Discovery Center
30,000 sqft
10 distinctive themes
K11 Art in One campaign drives 15-20% growth in footfall
1st March grand opening Michelin Star Restaurants
New Prominent Tenants to improve client mix
17
PROPERTY INVESTMENT
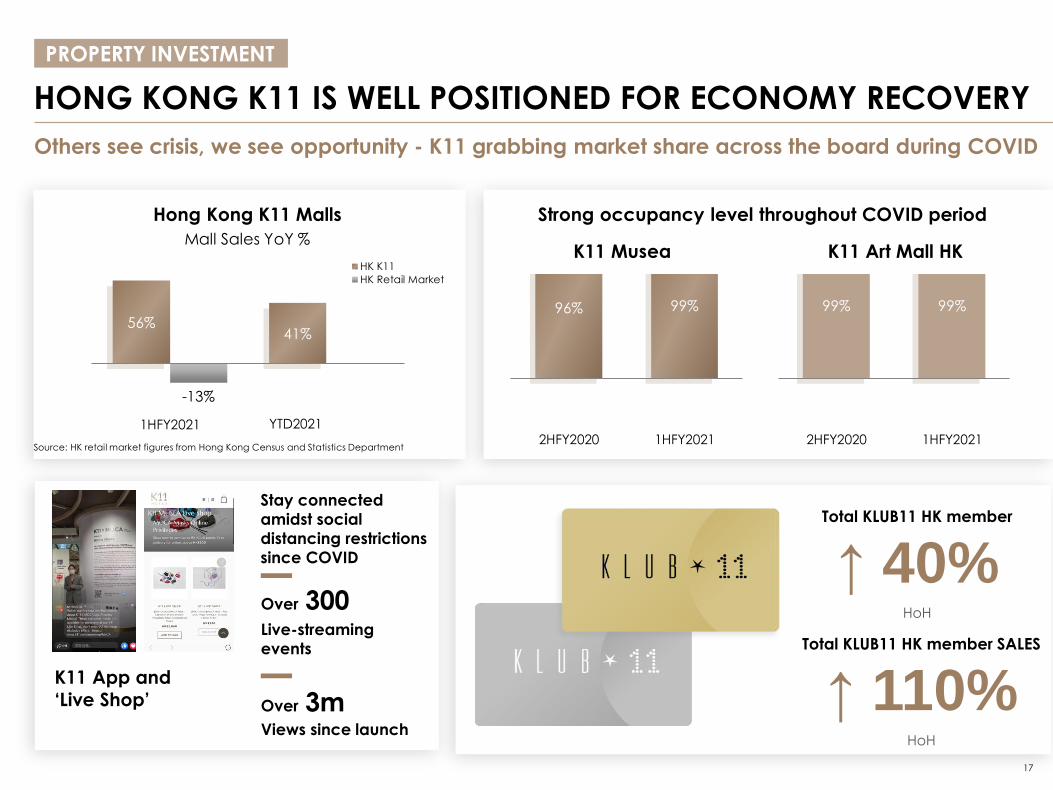
HONG KONG K11 IS WELL POSITIONED FOR ECONOMY RECOVERY
Others see crisis, we see opportunity - K11 grabbing market share across the board during COVID
Hong Kong K11 Malls
Mall Sales YoY %
Source: HK retail market figures from Hong Kong Census and Statistics Department
96% 99%
2HFY2020 1HFY2021
K11 Musea
99% 99%
2HFY2020 1HFY2021
K11 Art Mall HK
Strong occupancy level throughout COVID period
K11 App and
‘Live Shop’
Stay connected
amidst social
distancing restrictions
since COVID
Over 300Live-streaming
events
Over 3mViews since launch
Total KLUB11 HK member
↑ 40%HoH
Total KLUB11 HK member SALES
↑ 110%HoH
56%41%
-13%
1HFY2021 YTD2021
HK K11
HK Retail Market
YTD2021
18
PROPERTY INVESTMENT
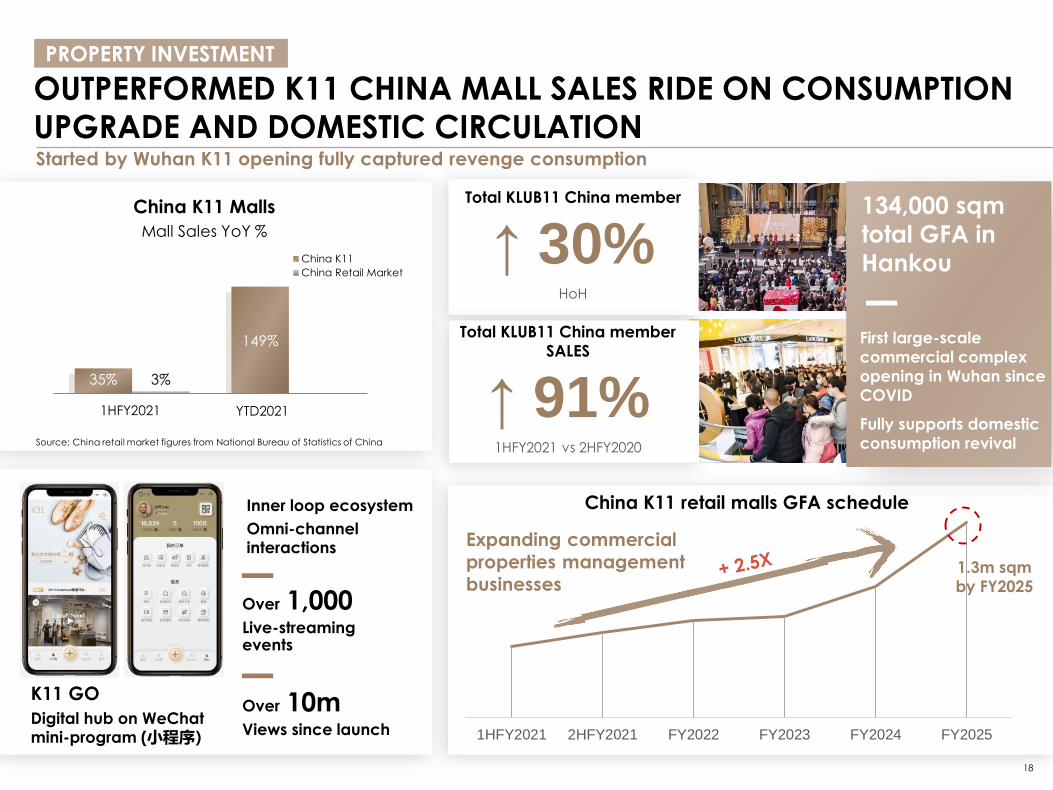
OUTPERFORMED K11 CHINA MALL SALES RIDE ON CONSUMPTION
UPGRADE AND DOMESTIC CIRCULATIONStarted by Wuhan K11 opening fully captured revenge consumption
China K11 Malls
Mall Sales YoY %
Source: China retail market figures from National Bureau of Statistics of China
1HFY2021 2HFY2021 FY2022 FY2023 FY2024 FY2025
1.3m sqm
by FY2025
China K11 retail malls GFA schedule
Expanding commercial
properties management
businesses
Inner loop ecosystem
Omni-channel interactions
Over 1,000Live-streaming events
Over 10mViews since launch
K11 GO
Digital hub on WeChat mini-program (小程序)
134,000 sqm
total GFA in
Hankou
First large-scale
commercial complex
opening in Wuhan since
COVID
Fully supports domestic
consumption revival
Total KLUB11 China member
↑ 30%HoH
Total KLUB11 China member
SALES
↑ 91%1HFY2021 vs 2HFY2020
35%
149%
3%
1HFY2021 YTD2021
China K11
China Retail Market
YTD2021
19
PROPERTY INVESTMENT
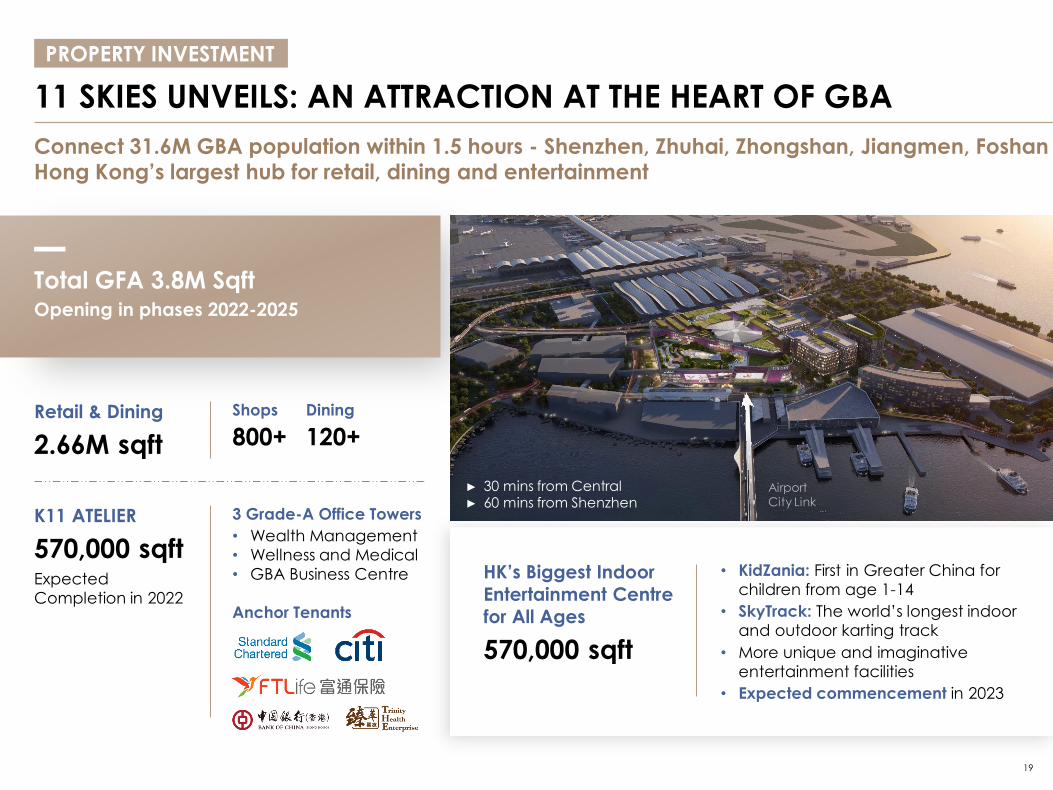
11 SKIES UNVEILS: AN ATTRACTION AT THE HEART OF GBA
Connect 31.6M GBA population within 1.5 hours - Shenzhen, Zhuhai, Zhongshan, Jiangmen, FoshanHong Kong’s largest hub for retail, dining and entertainment
Total GFA 3.8M SqftOpening in phases 2022-2025
Retail & Dining
2.66M sqft
Shops
800+
Dining
120+
K11 ATELIER
570,000 sqftExpected
Completion in 2022
3 Grade-A Office Towers
• Wealth Management
• Wellness and Medical
• GBA Business Centre
Anchor Tenants
HK’s Biggest Indoor
Entertainment Centre
for All Ages
570,000 sqft
• KidZania: First in Greater China for
children from age 1-14
• SkyTrack: The world’s longest indoor
and outdoor karting track
• More unique and imaginative
entertainment facilities
• Expected commencement in 2023
► 30 mins from Central► 60 mins from Shenzhen
20
PROPERTY INVESTMENT
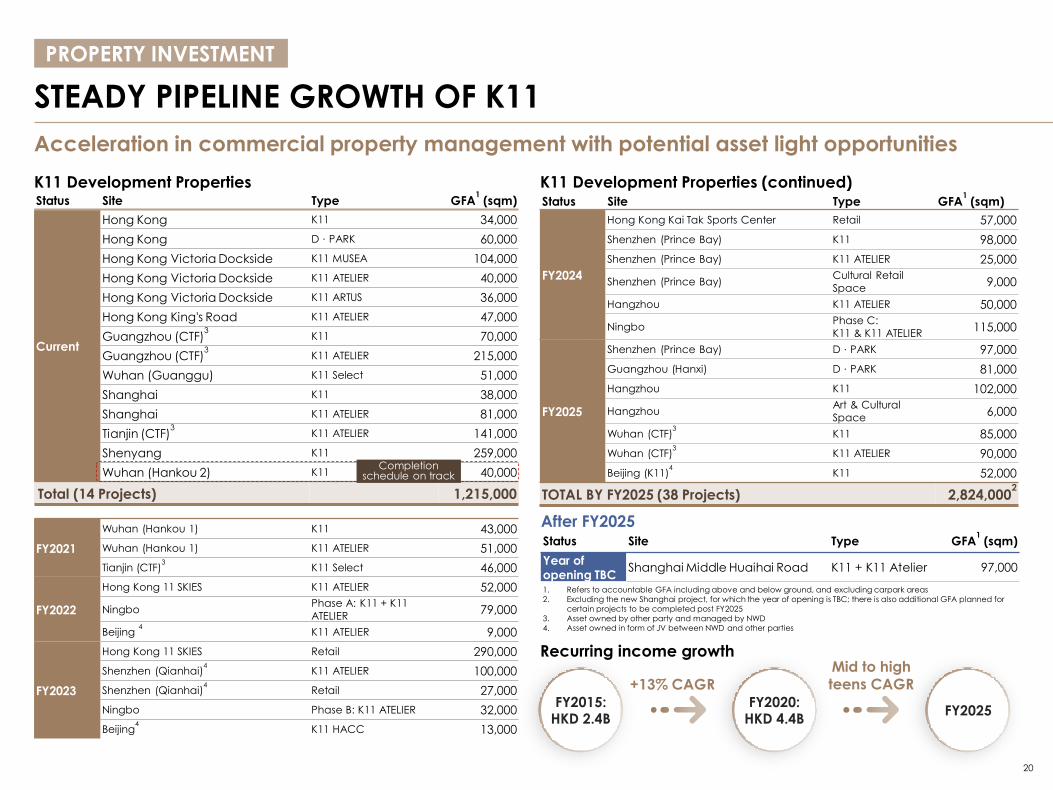
STEADY PIPELINE GROWTH OF K11
Status Site Type GFA1
(sqm)
Current
Hong Kong K11 34,000
Hong Kong D · PARK 60,000
Hong Kong Victoria Dockside K11 MUSEA 104,000
Hong Kong Victoria Dockside K11 ATELIER 40,000
Hong Kong Victoria Dockside K11 ARTUS 36,000
Hong Kong King's Road K11 ATELIER 47,000
Guangzhou (CTF)3
K11 70,000
Guangzhou (CTF)3
K11 ATELIER 215,000
Wuhan (Guanggu) K11 Select 51,000
Shanghai K11 38,000
Shanghai K11 ATELIER 81,000
Tianjin (CTF)3
K11 ATELIER 141,000
Shenyang K11 259,000
Wuhan (Hankou 2) K11 40,000
Total (14 Projects) 1,215,000
FY2021
Wuhan (Hankou 1) K11 43,000
Wuhan (Hankou 1) K11 ATELIER 51,000
Tianjin (CTF)3
K11 Select 46,000
FY2022
Hong Kong 11 SKIES K11 ATELIER 52,000
NingboPhase A: K11 + K11
ATELIER79,000
Beijing 4
K11 ATELIER 9,000
FY2023
Hong Kong 11 SKIES Retail 290,000
Shenzhen (Qianhai)4
K11 ATELIER 100,000
Shenzhen (Qianhai)4
Retail 27,000
Ningbo Phase B: K11 ATELIER 32,000
Beijing4
K11 HACC 13,000
Status Site Type GFA1
(sqm)
FY2024
Hong Kong Kai Tak Sports Center Retail 57,000
Shenzhen (Prince Bay) K11 98,000
Shenzhen (Prince Bay) K11 ATELIER 25,000
Shenzhen (Prince Bay)Cultural Retail
Space9,000
Hangzhou K11 ATELIER 50,000
NingboPhase C:
K11 & K11 ATELIER115,000
FY2025
Shenzhen (Prince Bay) D · PARK 97,000
Guangzhou (Hanxi) D · PARK 81,000
Hangzhou K11 102,000
HangzhouArt & Cultural
Space6,000
Wuhan (CTF)3
K11 85,000
Wuhan (CTF)3
K11 ATELIER 90,000
Beijing (K11)4
K11 52,000
TOTAL BY FY2025 (38 Projects) 2,824,0002
K11 Development Properties
1. Refers to accountable GFA including above and below ground, and excluding carpark areas
2. Excluding the new Shanghai project, for which the year of opening is TBC; there is also additional GFA planned for
certain projects to be completed post FY2025
3. Asset owned by other party and managed by NWD
4. Asset owned in form of JV between NWD and other parties
Completion schedule on track
Acceleration in commercial property management with potential asset light opportunities
K11 Development Properties (continued)
Status Site Type GFA1
(sqm)
Year of opening TBC
Shanghai Middle Huaihai Road K11 + K11 Atelier 97,000
After FY2025
FY2015:HKD 2.4B
Recurring income growth
FY2020:HKD 4.4B
+13% CAGR
Mid to high teens CAGR
FY2025

21
CORPORATE ACTIONS
22
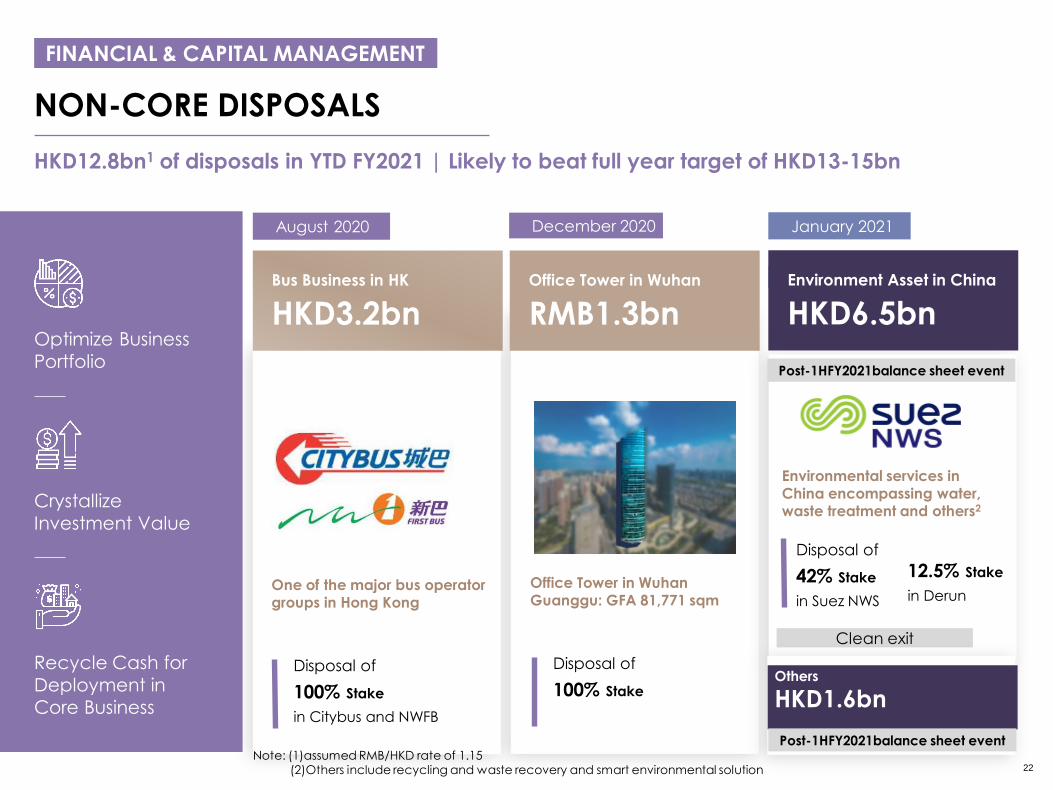
NON-CORE DISPOSALS
HKD12.8bn1 of disposals in YTD FY2021 | Likely to beat full year target of HKD13-15bn
FINANCIAL & CAPITAL MANAGEMENT
Bus Business in HK
HKD3.2bn
Disposal of
100% Stake
in Citybus and NWFB
Office Tower in Wuhan
RMB1.3bn
One of the major bus operator groups in Hong Kong
Office Tower in Wuhan Guanggu: GFA 81,771 sqm
Disposal of
100% Stake
August 2020 January 2021
Note: (1)assumed RMB/HKD rate of 1.15(2)Others include recycling and waste recovery and smart environmental solution
Optimize Business
Portfolio
Crystallize
Investment Value
Recycle Cash for
Deployment in
Core Business
Post-1HFY2021balance sheet event
December 2020
Environment Asset in China
HKD6.5bn
Environmental services in China encompassing water, waste treatment and others2
Disposal of
42% Stake
in Suez NWS
12.5% Stake
in Derun
Clean exit
Residential property management business in Northern China
RMB432M
Others
HKD1.6bn
Post-1HFY2021balance sheet event
Post-1HFY2021balance sheet event
23
CORPORATE ACTIONS
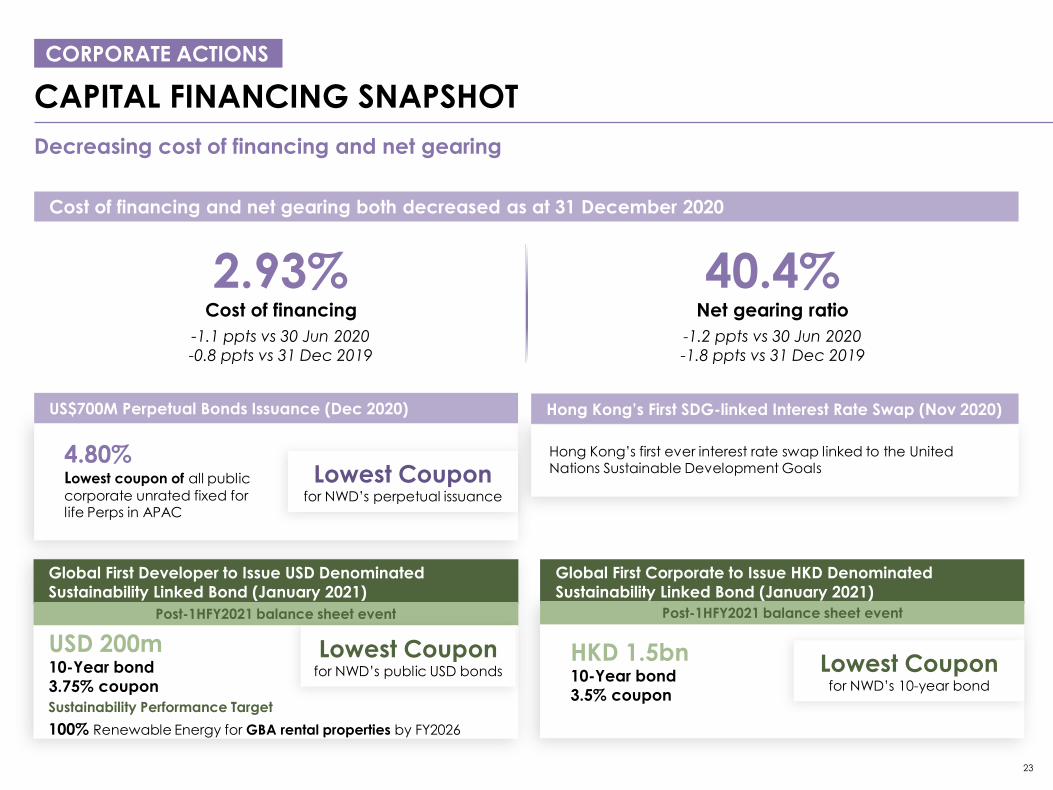
CAPITAL FINANCING SNAPSHOT
Decreasing cost of financing and net gearing
Cost of financing and net gearing both decreased as at 31 December 2020
40.4%Net gearing ratio
-1.2 ppts vs 30 Jun 2020
-1.8 ppts vs 31 Dec 2019
2.93%Cost of financing
-1.1 ppts vs 30 Jun 2020
-0.8 ppts vs 31 Dec 2019
Global First Corporate to Issue HKD Denominated
Sustainability Linked Bond (January 2021)
HKD 1.5bn 10-Year bond
3.5% coupon
Lowest Couponfor NWD’s 10-year bond
Post-1HFY2021 balance sheet event
US$700M Perpetual Bonds Issuance (Dec 2020)
4.80%Lowest coupon of all public
corporate unrated fixed for life Perps in APAC
Hong Kong’s First SDG-linked Interest Rate Swap (Nov 2020)
Hong Kong’s first ever interest rate swap linked to the United Nations Sustainable Development GoalsLowest Coupon
for NWD’s perpetual issuance
Global First Developer to Issue USD Denominated
Sustainability Linked Bond (January 2021)
Post-1HFY2021 balance sheet event
Lowest Couponfor NWD’s public USD bonds
USD 200m10-Year bond
3.75% coupon
Sustainability Performance Target
100% Renewable Energy for GBA rental properties by FY2026
24
ESG
25
ESG
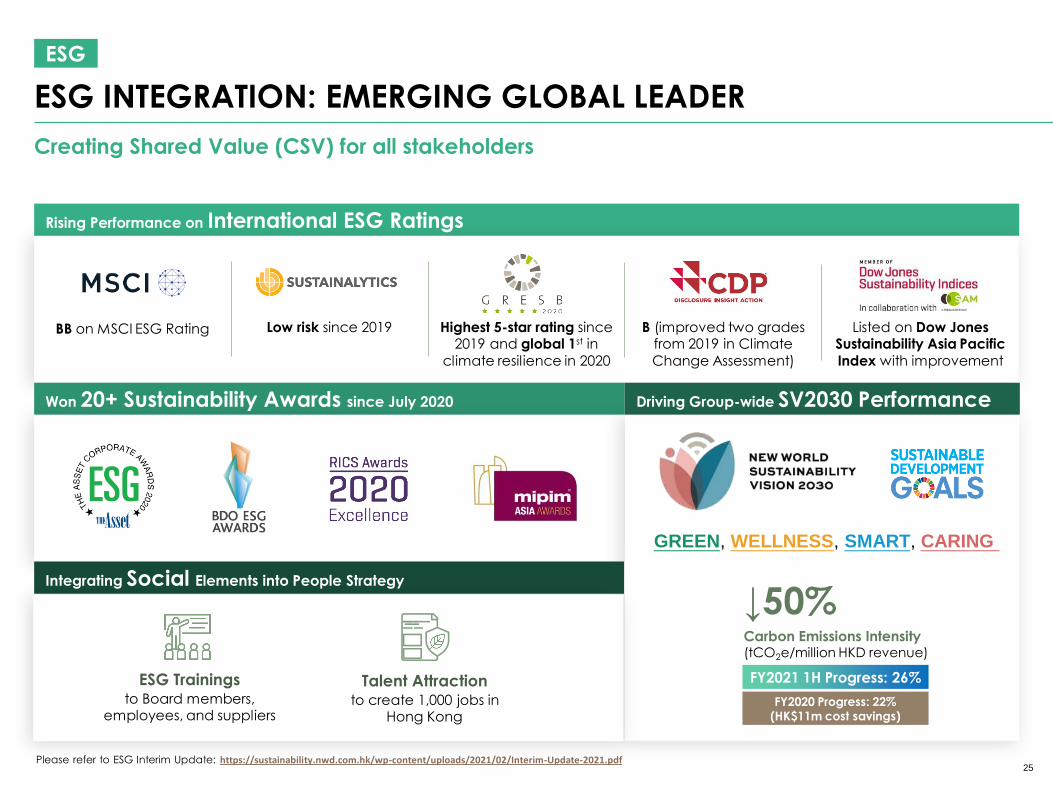
ESG INTEGRATION: EMERGING GLOBAL LEADER
Creating Shared Value (CSV) for all stakeholders
Rising Performance on International ESG Ratings
Highest 5-star rating since 2019 and global 1st in
climate resilience in 2020
Listed on Dow Jones Sustainability Asia Pacific
Index with improvement
Low risk since 2019 B (improved two grades from 2019 in Climate
Change Assessment)
BB on MSCI ESG Rating
Won 20+ Sustainability Awards since July 2020 Driving Group-wide SV2030 Performance
↓50%Carbon Emissions Intensity(tCO2e/million HKD revenue)
FY2021 1H Progress: 26%
Integrating Social Elements into People Strategy
Please refer to ESG Interim Update: https://sustainability.nwd.com.hk/wp-content/uploads/2021/02/Interim-Update-2021.pdf
ESG Trainingsto Board members,
employees, and suppliers
Talent Attractionto create 1,000 jobs in
Hong KongFY2020 Progress: 22%
(HK$11m cost savings)
GREEN, WELLNESS, SMART, CARING
26
ESG
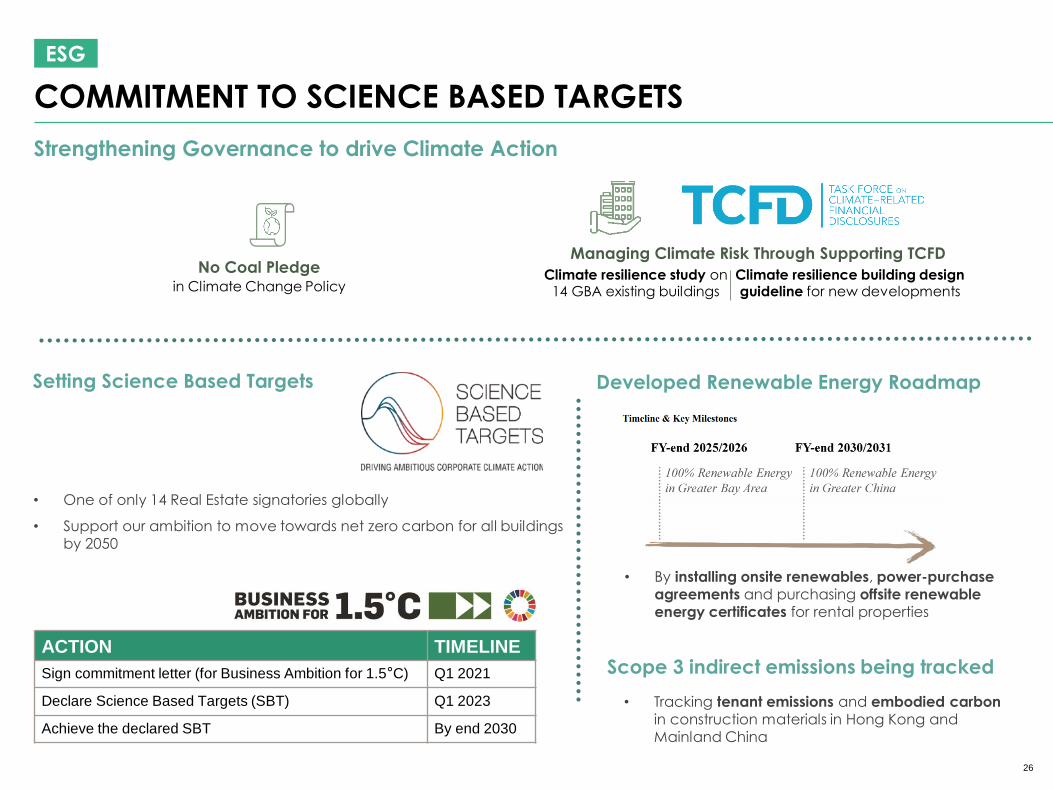
COMMITMENT TO SCIENCE BASED TARGETS
Scope 3 indirect emissions being tracked
Developed Renewable Energy Roadmap
• By installing onsite renewables, power-purchase agreements and purchasing offsite renewable energy certificates for rental properties
• Tracking tenant emissions and embodied carbonin construction materials in Hong Kong and Mainland China
ACTION TIMELINE
Sign commitment letter (for Business Ambition for 1.5°C) Q1 2021
Declare Science Based Targets (SBT) Q1 2023
Achieve the declared SBT By end 2030
• One of only 14 Real Estate signatories globally
• Support our ambition to move towards net zero carbon for all buildings by 2050
Setting Science Based Targets
Strengthening Governance to drive Climate Action
Managing Climate Risk Through Supporting TCFD
Climate resilience study on 14 GBA existing buildings
Climate resilience building design guideline for new developments
No Coal Pledge in Climate Change Policy
27
Thank you
28
Appendix
29
9,672
6,801
1,310 (425)
2,346 (360)
Property… Property… Hotel… NWS -… Others Total
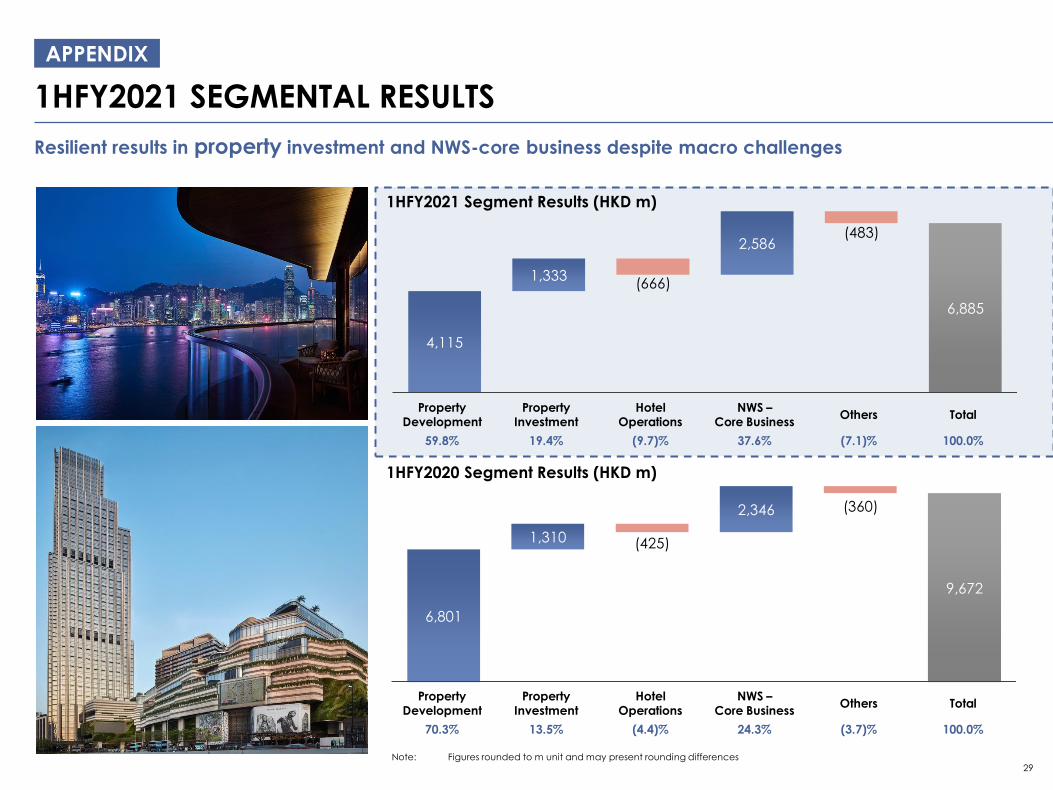
APPENDIX
1HFY2021 SEGMENTAL RESULTS
Resilient results in property investment and NWS-core business despite macro challenges
6,885
4,115
1,333(666)
2,586(483)
Property… Property… Hotel… NWS -… Others Total
1HFY2021 Segment Results (HKD m)
Property Development
PropertyInvestment
Hotel Operations
NWS –Core Business
Others Total
59.8% 19.4% (9.7)% 37.6% (7.1)% 100.0%
Property Development
PropertyInvestment
Hotel Operations
NWS –Core Business
Others Total
70.3% 13.5% (4.4)% 24.3% (3.7)% 100.0%
1HFY2020 Segment Results (HKD m)
Note: Figures rounded to m unit and may present rounding differences
30
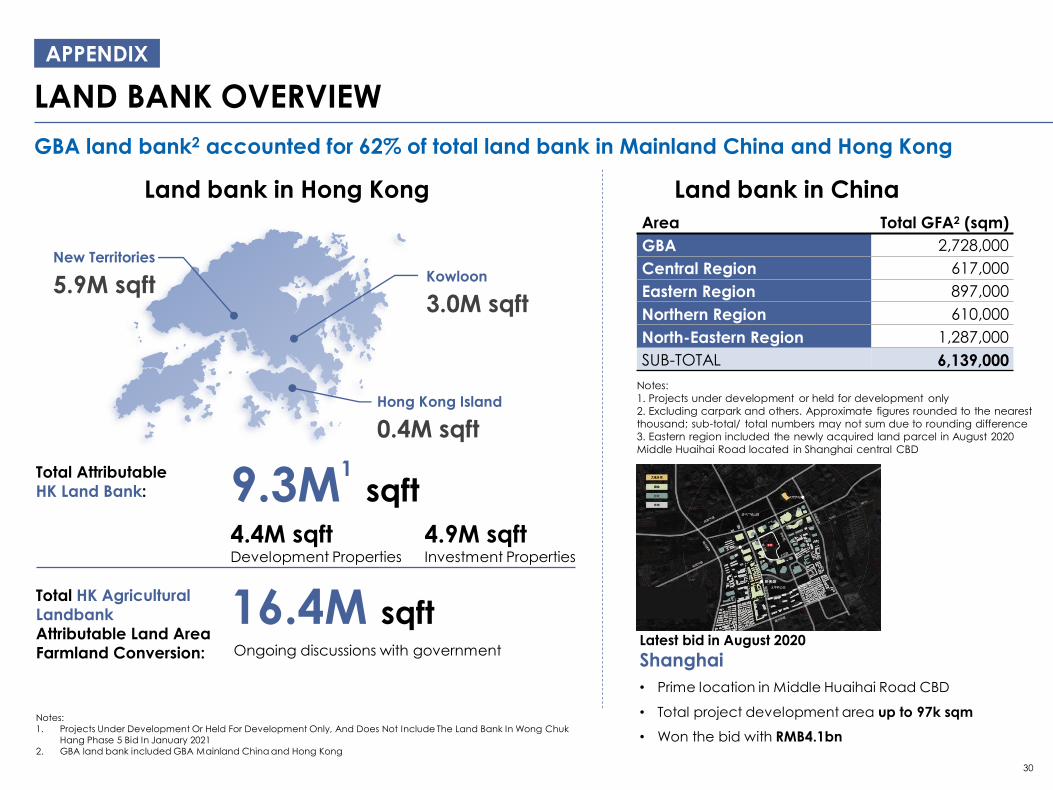
APPENDIX
LAND BANK OVERVIEW
GBA land bank2 accounted for 62% of total land bank in Mainland China and Hong Kong
Kowloon
3.0M sqft
Hong Kong Island
0.4M sqft
New Territories
5.9M sqft
Notes:
1. Projects Under Development Or Held For Development Only, And Does Not Include The Land Bank In Wong Chuk
Hang Phase 5 Bid In January 2021
2. GBA land bank included GBA Mainland China and Hong Kong
Total Attributable
HK Land Bank:
4.4M sqftDevelopment Properties
4.9M sqftInvestment Properties
9.3M1
sqft
Total HK Agricultural
Landbank
Attributable Land Area
Farmland Conversion: Ongoing discussions with government
16.4M sqft
Area Total GFA2 (sqm)
GBA 2,728,000
Central Region 617,000
Eastern Region 897,000
Northern Region 610,000
North-Eastern Region 1,287,000
SUB-TOTAL 6,139,000
Land bank in Hong Kong
Latest bid in August 2020
Shanghai
• Prime location in Middle Huaihai Road CBD
• Total project development area up to 97k sqm
• Won the bid with RMB4.1bn
Land bank in China
Notes:
1. Projects under development or held for development only
2. Excluding carpark and others. Approximate figures rounded to the nearest
thousand; sub-total/ total numbers may not sum due to rounding difference
3. Eastern region included the newly acquired land parcel in August 2020
Middle Huaihai Road located in Shanghai central CBD
31
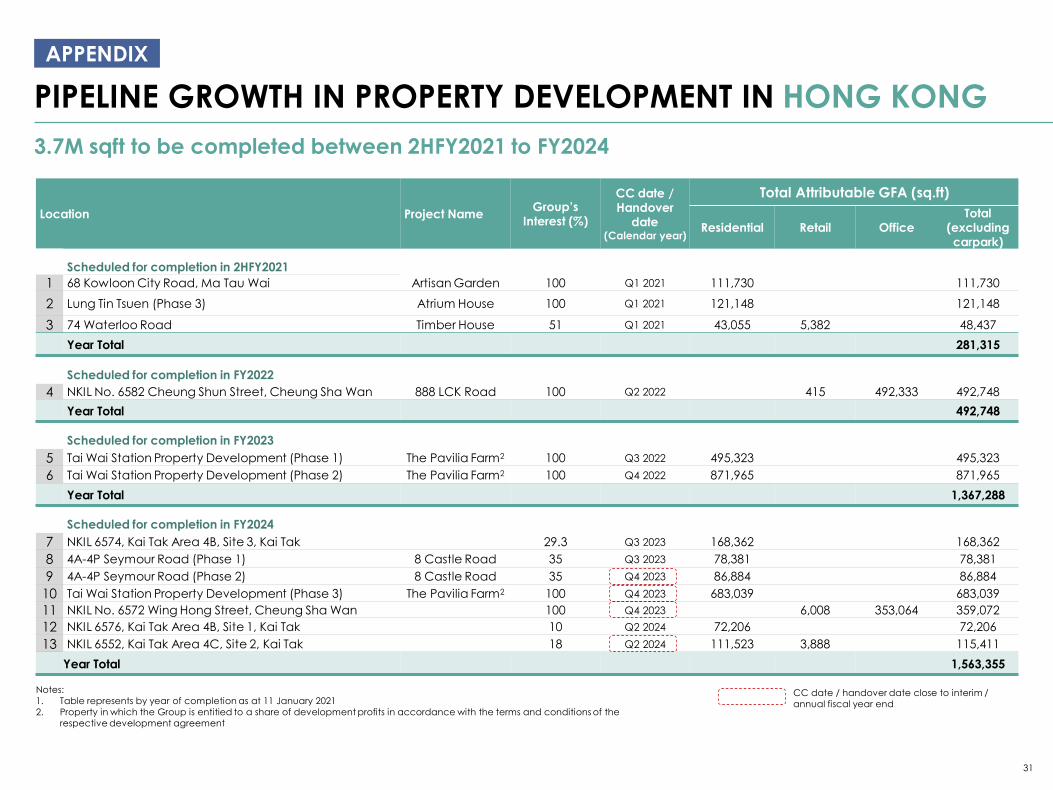
PIPELINE GROWTH IN PROPERTY DEVELOPMENT IN HONG KONG
3.7M sqft to be completed between 2HFY2021 to FY2024
Location Project NameGroup’s
Interest (%)
CC date / Handover
date(Calendar year)
Total Attributable GFA (sq.ft)
Residential Retail OfficeTotal
(excludingcarpark)
Scheduled for completion in 2HFY2021
1 68 Kowloon City Road, Ma Tau Wai Artisan Garden 100 Q1 2021 111,730 111,730
2 Lung Tin Tsuen (Phase 3) Atrium House 100 Q1 2021 121,148 121,148
3 74 Waterloo Road Timber House 51 Q1 2021 43,055 5,382 48,437
Year Total 281,315
Scheduled for completion in FY2022
4 NKIL No. 6582 Cheung Shun Street, Cheung Sha Wan 888 LCK Road 100 Q2 2022 415 492,333 492,748
Year Total 492,748
Scheduled for completion in FY2023
5 Tai Wai Station Property Development (Phase 1) The Pavilia Farm2 100 Q3 2022 495,323 495,323
6 Tai Wai Station Property Development (Phase 2) The Pavilia Farm2 100 Q4 2022 871,965 871,965
Year Total 1,367,288
Scheduled for completion in FY2024
7 NKIL 6574, Kai Tak Area 4B, Site 3, Kai Tak 29.3 Q3 2023 168,362 168,362
8 4A-4P Seymour Road (Phase 1) 8 Castle Road 35 Q3 2023 78,381 78,381
9 4A-4P Seymour Road (Phase 2) 8 Castle Road 35 Q4 2023 86,884 86,884
10 Tai Wai Station Property Development (Phase 3) The Pavilia Farm2 100 Q4 2023 683,039 683,039
11 NKIL No. 6572 Wing Hong Street, Cheung Sha Wan 100 Q4 2023 6,008 353,064 359,072
12 NKIL 6576, Kai Tak Area 4B, Site 1, Kai Tak 10 Q2 2024 72,206 72,206
13 NKIL 6552, Kai Tak Area 4C, Site 2, Kai Tak 18 Q2 2024 111,523 3,888 115,411
Year Total 1,563,355
Notes:
1. Table represents by year of completion as at 11 January 2021
2. Property in which the Group is entitied to a share of development profits in accordance with the terms and conditions of the
respective development agreement
CC date / handover date close to interim /
annual fiscal year end
APPENDIX
32
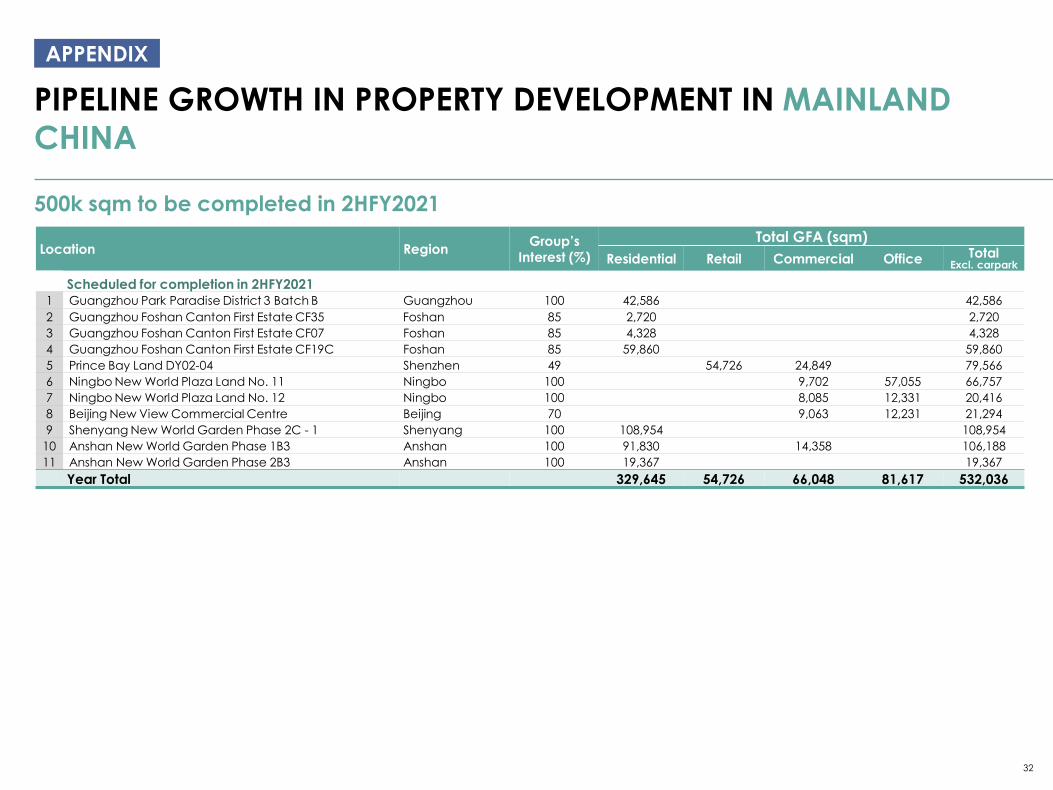
PIPELINE GROWTH IN PROPERTY DEVELOPMENT IN MAINLAND
CHINA
500k sqm to be completed in 2HFY2021
Location RegionGroup’s
Interest (%)
Total GFA (sqm)
Residential Retail Commercial Office Total Excl. carpark
Scheduled for completion in 2HFY20211 Guangzhou Park Paradise District 3 Batch B Guangzhou 100 42,586 42,586
2 Guangzhou Foshan Canton First Estate CF35 Foshan 85 2,720 2,720
3 Guangzhou Foshan Canton First Estate CF07 Foshan 85 4,328 4,328
4 Guangzhou Foshan Canton First Estate CF19C Foshan 85 59,860 59,860
5 Prince Bay Land DY02-04 Shenzhen 49 54,726 24,849 79,566
6 Ningbo New World Plaza Land No. 11 Ningbo 100 9,702 57,055 66,757
7 Ningbo New World Plaza Land No. 12 Ningbo 100 8,085 12,331 20,416
8 Beijing New View Commercial Centre Beijing 70 9,063 12,231 21,294
9 Shenyang New World Garden Phase 2C - 1 Shenyang 100 108,954 108,954
10 Anshan New World Garden Phase 1B3 Anshan 100 91,830 14,358 106,188
11 Anshan New World Garden Phase 2B3 Anshan 100 19,367 19,367
Year Total 329,645 54,726 66,048 81,617 532,036
How much if GBA?? Should mention in the script
APPENDIX
33
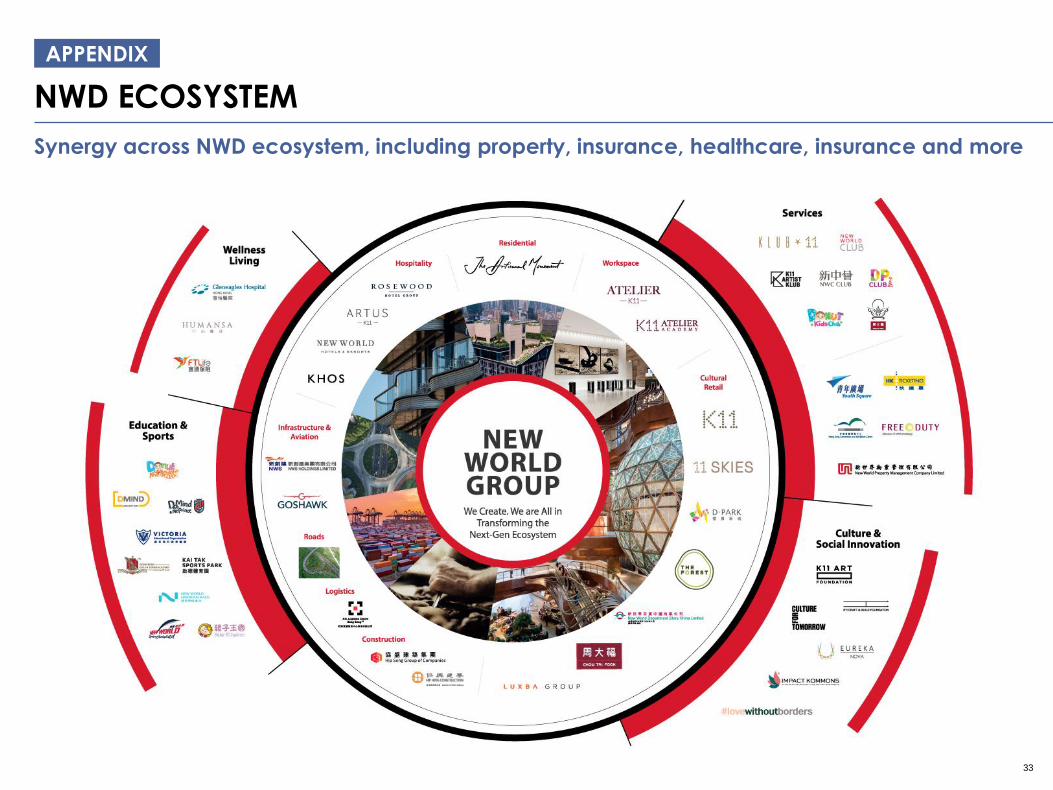
APPENDIX
NWD ECOSYSTEM
Synergy across NWD ecosystem, including property, insurance, healthcare, insurance and more
34
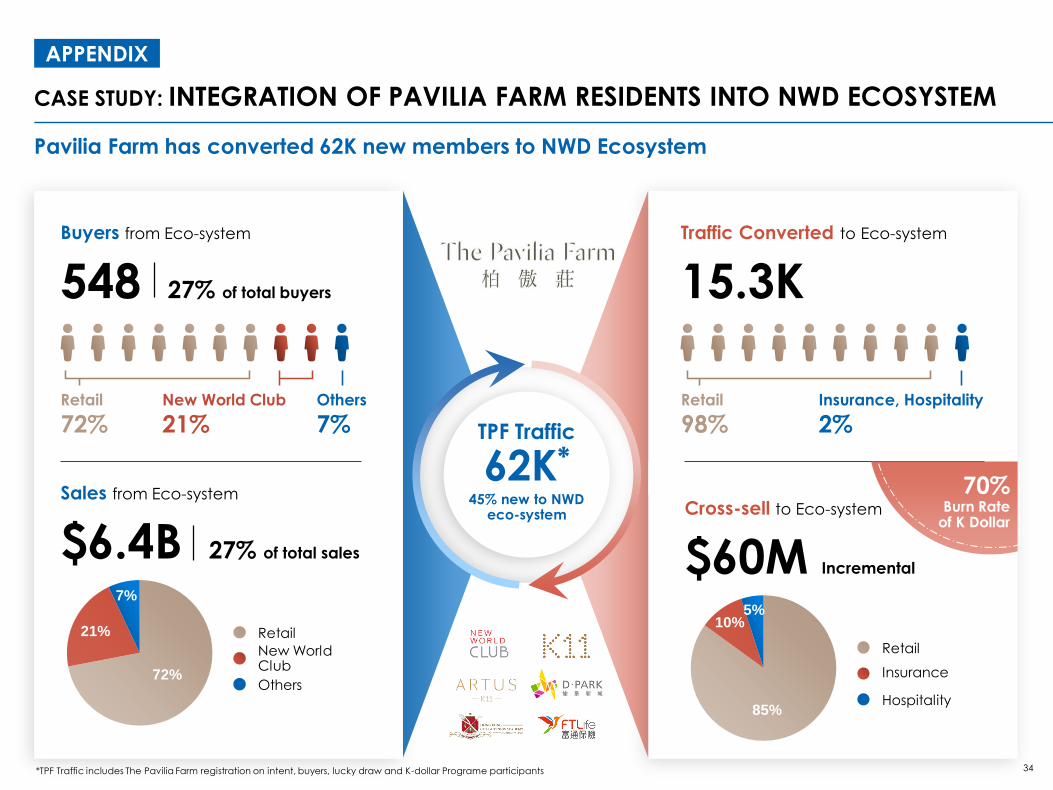
Traffic Converted to Eco-system
15.3K
Retail
98%Insurance, Hospitality
2%
Cross-sell to Eco-system
$60M Incremental
85%
10%5%
Retail
Insurance
Hospitality
APPENDIX
CASE STUDY: INTEGRATION OF PAVILIA FARM RESIDENTS INTO NWD ECOSYSTEM
Pavilia Farm has converted 62K new members to NWD Ecosystem
Buyers from Eco-system
548 27% of total buyers
Retail
72%New World Club
21%Others
7%
Sales from Eco-system
$6.4B 27% of total sales
72%
21%
7%
Retail
New WorldClub
Others
NWD Ecosystem
TPF Traffic
62K*
45% new to NWD eco-system
*TPF Traffic includes The Pavilia Farm registration on intent, buyers, lucky draw and K-dollar Programe participants
70% Burn Rate
of K Dollar
35
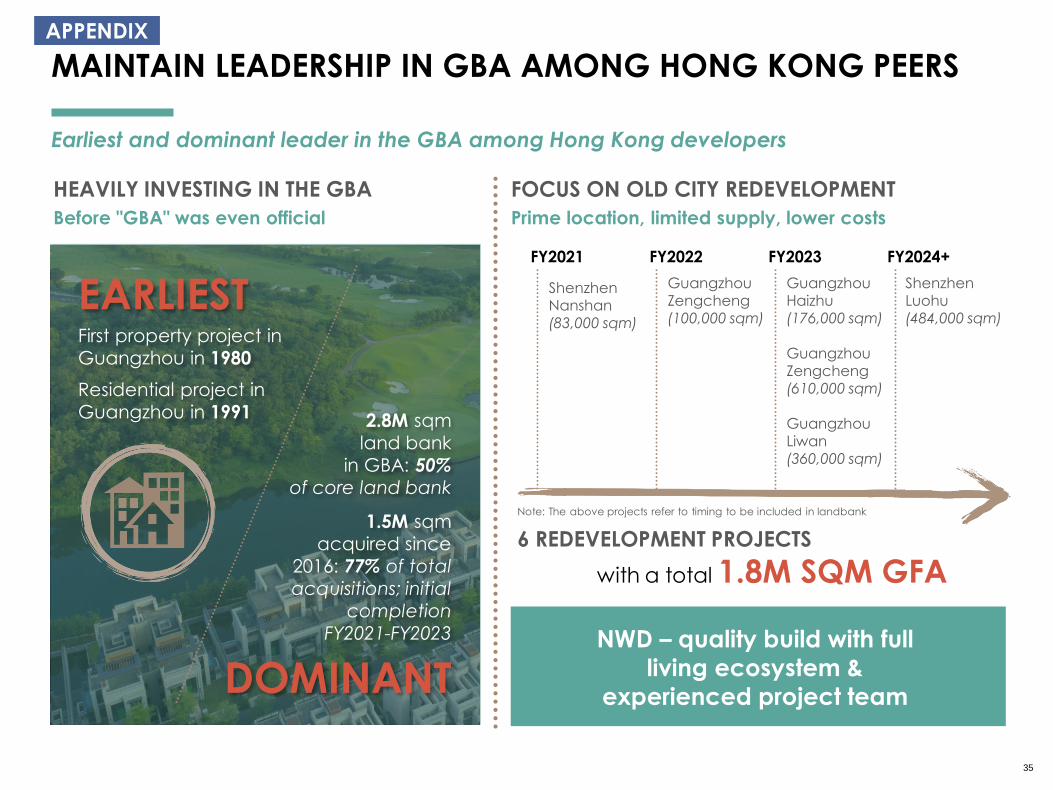
FY2022
Guangzhou Zengcheng (100,000 sqm)
FY2023
Guangzhou Haizhu(176,000 sqm)
Guangzhou Zengcheng (610,000 sqm)
Guangzhou Liwan (360,000 sqm)
FY2024+
Shenzhen Luohu(484,000 sqm)
FY2021
Shenzhen Nanshan(83,000 sqm)
Earliest and dominant leader in the GBA among Hong Kong developers
MAINTAIN LEADERSHIP IN GBA AMONG HONG KONG PEERS
HEAVILY INVESTING IN THE GBA
Before "GBA" was even official
FOCUS ON OLD CITY REDEVELOPMENT
Prime location, limited supply, lower costs
EARLIEST
DOMINANT
First property project in
Guangzhou in 1980
Residential project in
Guangzhou in 1991 2.8M sqm
land bank
in GBA: 50%
of core land bank
1.5M sqm
acquired since
2016: 77% of total
acquisitions; initial
completion
FY2021-FY2023
6 REDEVELOPMENT PROJECTS
with a total 1.8M SQM GFA
NWD – quality build with full
living ecosystem &
experienced project team
Note: The above projects refer to timing to be included in landbank
APPENDIX
36
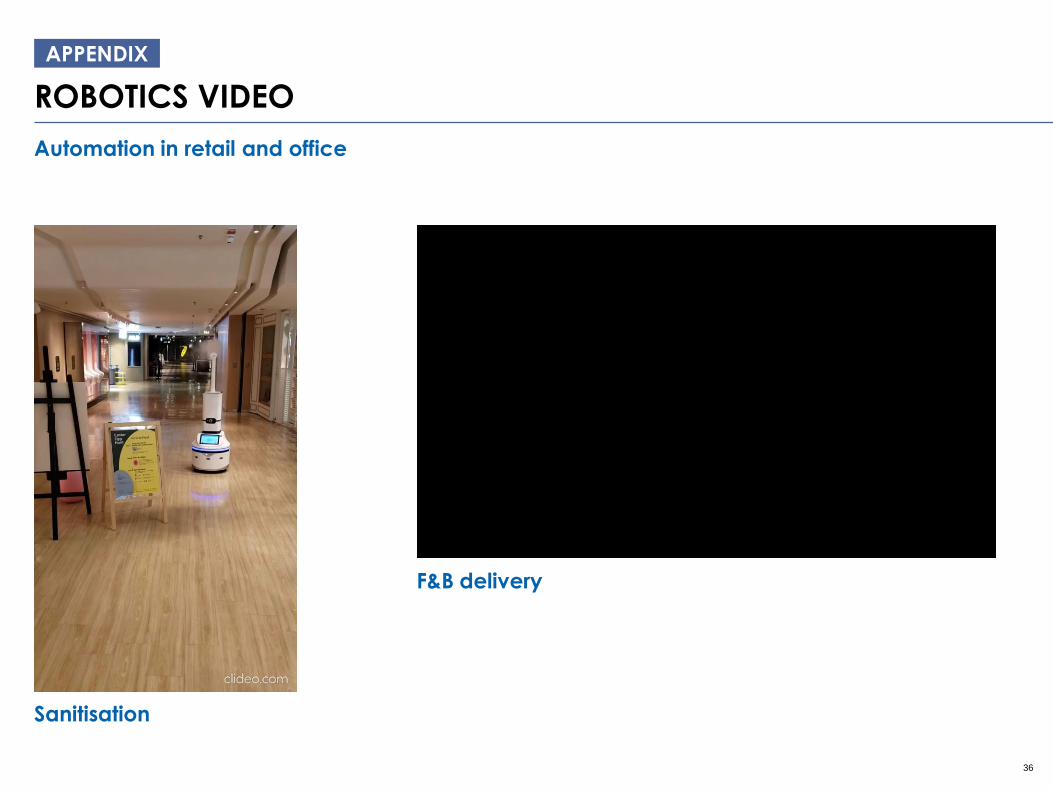
APPENDIX
ROBOTICS VIDEO
Sanitisation
F&B delivery
Automation in retail and office
37
APPENDIX
INTERNET OF THINGS (IOT)
LifeSmart, Create a Smarter and Better Life
38
DISCLAIMER
Important notice
The information contained in these materials is intended for reference and general information purposes only. Neither the information nor any opinion contained in these materials constitutes an offer or advice, or a solicitation, inducement, invitation, recommendation or suggestion by New World Development Company Limited (“NWD”) or its subsidiaries, associated or affiliated companies, or any of their respective directors, employees, agents, representatives or associates to buy or sell or otherwise deal in any shares, bonds, investment products, securities, futures, options, derivatives or other financial products and instruments (whether as principal or agent) or the provision of any investment advice or securities related services. Readers of these materials must, and agree that they will, make their own investment decisions based on their specific investment objectives and financial positions, and shall consult their own independent professional advisors as necessary or appropriate.
NWD, its subsidiaries, associated or affiliated companies or any of their respective directors, employees, agents, representatives or associates cannot and does not represent, warrant or guarantee the accuracy, validity, timeliness, completeness, reliability or otherwise of any information contained in these materials. NWD, its subsidiaries, associated or affiliated companies or any of their respective directors, employees, agents, representatives or associates expressly excludes and disclaims any conditions or representations or warranties of merchantabi lity or fitness for a particular purpose or duties of care or otherwise regarding the information. All information is provided on an "as is" basis, and is subject to change without prior notice.
In no event will NWD, its subsidiaries, associated or affiliated companies or any of their respective directors, employees, agents, representatives or associates be responsible or liable for damages of whatever kind or nature (whether based on contract, tort or otherwise, and whether direct, indirect, special, consequential, incidental or otherwise)resulting from access to or use of any information contained in these materials including (without limitation) damages resulting from the act or omission of any third party or otherwise arising in connection with the information contained in these material, even if NWD, its subsidiaries, associated or affiliated companies or any of their respective directors, employees, agents, representatives or associates has been advised of the possibility thereof.
NWD, its subsidiaries, associated or affiliated companies or any of their respective directors, employees, agents, representatives or associates is not responsible for the information contained in these materials which are provided by other third party (“Third Party Materials”). The inclusion of these Third Party Materials does not indicate, expressly or impliedly, any endorsement by NWD, its subsidiaries, associated or affi liated companies or any of their respective directors, employees, agents, representatives or associates as to the accuracy or reliability of its content. Access to and use of such information is at the user's own risk and subject to any terms and conditions applicable to such access/use. NWD, its subsidiaries, associated or affiliated companies or any of their respective directors, employees, agents, representatives or associates is not responsible for any losses or damages caused by any defects or omissions that may exist in the services, information or other content provided by such other third party, whether actual, alleged, consequential, punitive, or otherwise. NWD, its subsidiaries, associated or affiliated companies or any of their respective directors, employees, agents, representatives or associates makes no guarantees or representations or warranties as to, and shall have no responsibility or liability for, any content provided by any third party or have any responsibility or liability for, including without limitation, the accuracy, subject matter, quality or timeliness of any such content.
By participating in this Presentation or by receiving or accepting any copy of the slides presented, you agree to be bound by the foregoing limitations.