2013-26 geophysical survey at fulham palace - … geophysical survey at fulham... · geoarch report...
TRANSCRIPT

GeoArch Report 2013/26
Geophysical survey of part of ‘The Paddock’, Fulham Palace
Dr Tim Young
30th November 2013

Geophysical survey of part of
‘The Paddock’, Fulham Palace
Dr T.P. Young
Abstract This report details geophysical surveying, using ground resistivity techniques, in the area to the west of Fulham Palace, known as ‘The Paddock’. The primary aim of the survey was to try to locate a former octagonal dovecote. Although possible structural elements were imaged in the appropriate area, no clear recognition of the footprint of the dovecote could be made. Tentative proposals for its location based on the resistivity anomalies are made. They lie to the NW of the locations suggested by the georeferencing of 18
th century plans,
which are themselves unlikely, because they were cut by a soak-away trench dug under archaeological supervision. An area of slightly raised resistivity to the SE of the location of the dovecote is interpreted as a possible path towards the dovecote from the SE, across the line of the earlier medieval ditches. The major ditches are evidenced by slightly discontinuities in the superficial resistivity, but since the resistivity is being measured well above the level of the actual ditches themselves, the significance of these ‘edges’ remains unclear. To the north and west of the likely location of the dovecote, the geophysical data comprise numerous features on an oblique alignment to the extant palace. It is unclear whether these anomalies are associated with a formal garden on an oblique alignment, or whether they are indicative of features within the earlier medieval ‘sub-moat’ enclosure. The northern part of the surveyed area shows somewhat elevated resistivity compared with the southern, with the two areas partially demarked by a zone of strongly elevated resistivity, approximately 3m wide, running NW-SE across the site, towards the entrance to the Chaplain’s Garden. This feature is cut by what appears to be service pipe in a trench, which forms one of the set of ‘oblique’ features.
Contents Abstract .............................................. 1 Methods Survey rationale and background ............ 1 Survey layout .......................................... 2 Ground resistivity ..................................... 2 Magnetic gradiometery ........................... 3 Results .............................................. 3 Interpretation .............................................. 3 Discussion ............................................. 4 References .............................................. 5 Figure Captions .............................................. 6 Figures .............................................. 7
Methods
Survey rationale and background
The survey was undertaken on behalf of Fulham Palace Trust and commissioned by Eleanor Sier (Learning Officer) and Sîan Harrington (Chief Executive). It was undertaken as a part of a Community Engagement project. The site lies on lawns (known as ‘The Paddock’) to the west of the Palace buildings, extending westwards into the gardens to the rear of the ‘Fledglings at the Palace’ nursery (Figure 1). The primary purpose of this geophysical survey was to attempt to clarify the location and extent of any surviving buried archaeological remains of a former octagonal dovecote recorded on early maps and plans of the palace. The likely location of this structure had previously been modelled by the georeferencing of Leadbetter’s plan of 1762-64, to suggest two possible locations, one using evidence dominantly from the area to the east of the dovecote (the southern range of the west court and the Chaplain’s Garden) and the other using evidence from the farm range to the north (shown in red and blue respectively on Figure 1). To facilitate examination of these target areas a small

GeoArch Report 2013/26: Geophysical survey at Fulham Palace
2
area of the laurel hedge was kindly cleared by the Palace’s estates staff during the second day of the survey. The major previous archaeological intervention within the survey area (Figure 1: Tr14, Tr15, Tr16, Tr18a, Tr18b) was the excavation of a trench for a drainage soak-away (Leary 2009). These trenches revealed levelling deposits over large medieval ditches forming part of an enclosed ‘sub-moat’ to the W and SW of the present Palace, that has been interpreted as the site of the pre-13
th century palace. Two ditches were
revealed: the inner [252] approximately 7m wide and an outer ditch [242] (recut as [243]) of uncertain overall width. The recent archaeological activities on the site were described by Leary (2009) and are being reworked by Bright (in prep.) Previous surveys of the Paddock area include a pioneering geophysical survey undertaken by North East London Polytechnic in 1976, which provided evidence for the double-ditched ‘sub-moat’ (Emery & Mayo 2008). A resistivity survey by the English Heritage Ancient Monuments Laboratory, undertaken in 1989, remains unpublished, but the results were reproduced in the reporting by Stratascan (Heard 2005). Part of the AML survey is reproduced here as Figure 13c (after Heard 2005 Figure 8, but with the greyscale inverted to parallel the greyscales used in this report). The surveys by Stratascan undertaken in 2005 (Heard 2005) included magnetic gradiometery, ground resistivity and ground-penetrating radar. Of these, the magnetic gradiometery showed very little in the present area of interest and the ground resistivity produced uneven results suggestive of equipment malfunction in the present area of interest, but the ground penetrating radar (GPR) produced a more useful dataset (of which one timeslice is reproduced here in Figure 13b, after Heard 2005 Figure 13). The site lies with the Grade II* registered gardens (under the Historic Buildings and Ancient Monuments Act 1953) of Fulham Palace (No. 1000133). The gardens are approximately co-terminal with the Scheduled Ancient Monument (under the Ancient Monuments and Archaeological Areas Act 1979 ) of Fulham Palace moated site (No. 1001964). English Heritage granted a license to undertake the geophysical survey (Case No:SL00065372) under S42 of the 1979 Act. The survey was conducted on the 5
th and 6
th of
November 2013 in wet (intermittent moderately heavy rain) conditions. The site lies on a terrace formed by the Kempton Park Gravel Formation, which overlies the London Clay Formation In all cases where a high degree of certainty on the presence/absence of archaeological features is required, or a high level of interpretation of those features, then additional investigations, usually including intrusive testing through trial excavation, may be required. Geophysical survey results should not be relied on, on their own, to provide unambiguous interpretations.
Survey layout
The survey was intended to be laid-out using a Trimble 4700 survey-grade RTK GPS system. An arbitrary base-station was created to the southwest side of the Palace driveway on the first day of the survey. GPS data were logged by a Trimble 4700 receiver for 20 minutes. Data were converted to RINEX format and
were (together with RINEX files from the five closest OS passive net stations) backdated using the RinexDates utility to permit baseline processing in Trimble Geomatics Office. The data files were then post-processed to give a location for the base-station accurate to within a few millimetres. The location of the base station (STN1) was determined as: E= 523973.930 N= 176158.695 Z = 3.736 The survey grids were designed, based on a baseline extending from the survey base-station, passing over the western corner of a manhole-cover (Figure 1, ‘a’). The easternmost grid marker was established at 3.00m from STN1, allowing the next grid marker to the SSW along the baseline to be established at a point with a clear line-of-sight across the fence and into the nursery school garden. This perpendicular grid line was determined to include a grid point (Figure 1, ‘b’) at 2.70m from the face of the wall, on the S side of the gate to the Chaplain’s Garden, adjacent to the outer face of the timber edging to the gravel. The principal base-line was determined to have an orientation of 026.3° with respect to grid north through fitting of the survey to these mapped points. The grid locations are shown in Figure 1.
Ground resistivity
The ground resistivity survey was undertaken with a Geoscan RM15 resistivity meter, operating with a ‘parallel twin electrode’ configuration, employing three electrodes with 0.5m probe spacing on a PA5 frame, via an MPX15 multiplexer. In the principal configuration, the mobile electrodes were configured as 2 pairs with a 0.5m spacing (giving the main component of the response from 0.5-0.7m depth), and with 0.5m between centres, to give a 0.5m effective traverse interval. Data were collected with 0.5m sample interval (i.e. raw data grid has 0.5 x 0.5m node spacing) on grids walked in a zig-zag pattern. Grids were walked in WNW-ESE direction. A small area of particular interest, including an area of hedge that was cleared specifically for the survey, was also surveyed using the outside probes only on the mobile frame, thus having a 1m probe spacing (giving a main response from 1.0-1.5m depth). Data were collected on 0.5m sample intervals on traverses 1.0m apart (i.e. raw data grid has 0.5 x 1.0m node spacing) on grids walked in a zig-zag pattern. Data were downloaded from the instrument using Geoscan Research’s ‘Geoplot’ software. Data were downloaded and collated separately for the 20m wide and 10m wide grids. Data processing in Geoplot was minimal, involving removal of a few minor data spikes (mainly due to poor electrode contact over the gravel paths) using the ‘despike’ function’. Data were then exported from Geoplot and imported to Golden Software’s ‘Surfer’. The data were interpolated using kriging to a node-spacing of 0.125m for production of the final, less pixelated, image.

GeoArch Report 2013/26: Geophysical survey at Fulham Palace
3
Magnetic gradiometry
Magnetic gradiometry was planned, but initial results from the ground resistivity quickly led to the conclusion that the dovecote had lain very close to the path of the modern steel fence between the gardens and the nursery. Since this meant that it would not be possible to acquire data of direct relevance to the issue of the site of the dovecote, the magnetic survey was not pursued.
Results The survey results are illustrated in figures 2-7. The resistivity data are of good quality, but with some slight striping of the data due to slight imbalance between the electrode pairs, probably due to minor shorting through the frame in the wet survey conditions. The ground resistivity data collected with a 0.5m mobile probe spacing are presented in Figure 2 (as a raw bitmapped images from Geoplot), Figure 3 (as bitmapped images from Geoplot of the despiked data), Figure 4 (as the interpolated data from Surfer) and Figure 5 (as the interpolated data from Surfer, with an enhanced non-linear colour scale). The ground resistivity data collected with a 1.0m mobile probe spacing are presented in Figure 6 (as a raw bitmapped images from Geoplot), Figure 7 (as the interpolated data from Surfer) and Figure 8 (as the interpolated data from Surfer overlain on the data from 0.5m-spaced survey). Figures 9 and 10 show the resistivity data georeferenced on the modern basemap.
Interpretation The purpose of the survey was to locate, if possible, the site of the dovecote which formerly stood in the area of ‘The Paddock’. As described above, the likely location of the structure had previously been modelled by the georeferencing of Leadbetter’s plan of 1762-64, to suggest two possible locations, one using evidence dominantly from the area to the east of the dovecote (the southern range of the west court and the Chaplain’s Garden) and the other using evidence from the farm range to the north. Overlaying those locations on the present survey (Figure 1) shows that both these modelled locations would have been intersected by the NE-SW run of the soak-away trench (FLB03, Trench 15). Records of the archaeological watching brief on that trench show no evidence for any structures. Attempts to identify the location of the dovecote therefore focussed on areas to the west of the trench. The soak-away trench itself was well imaged (Figure 14, ‘i’) by the resistivity survey (both at 0.5m- and 1.0m-spacings for the mobile probes) as a positive anomaly (compared with the area to its east; 60-63Ω measured resistance at 0.5m- mobile probe spacing and 47.5-50Ω measured resistance at 1.0m-spaced mobile probes). This anomaly varied in width between 1.8m and 2.6m with the 0.5m mobile probe spacing and rather less at 1.0m mobile probe spacing, which
compares well with the recorded width of the trench as 2.3m at surface, stepping in to 0.9m wide at 0.6m below surface. The resistivity of the area that had been under the laurel hedge to the west of the soak-away trench until that area was cleared immediately in advance of the survey (Figure 14 ‘o’), shows a variable, but elevated resistivity at 0.5m probe spacing (61-66Ω measured resistance), but slightly lower than the adjacent trench at 1.0m spaced mobile probes (46.5-47.5Ω measured resistance). This suggests that the variability in the resistivity at 0.5m mobile probe spacing is a superficial effect. Although the majority of the area west of the soak-away trench is of relatively constant resistivity as measured with the1.0m mobile probe spacing (46.5-47.5Ω measured resistance), the northern section of the cleared area shows some intermittent higher values (48-51Ω measured resistance). The difference is low in absolute terms, but may be significant. This area is very close to the location for the dovecote as modelled by the georeferencing of Leadbetter’s plan. A tentative fit of the footprint of the dovecote to this location is shown in yellow on Figure 15. An additional small area of stronger variation in resistivity is seen in the dataset from the 0.5m-spaced mobile probes, lying just to the SW of the area mentioned above, and on the opposite side of the fence in the nursery garden. The short length of elevated resistivity lies approximately parallel to the fence and may therefore possibly be associated with its construction. If however, this anomaly does represent a wall of the dovecote, then an alternative location can be proposed, incorporating the evidence for elevated resistivity on both sides of the fence. This model is marked in green on Figure 15. Neither of these suggested locations contains certain evidence for walls with the geometry of an octagonal structure, but this area does show significant, and locally linear, variability in resistivity that is suggestive of structural control, even if the detail is uncertain. On a broader scale, the general pattern of resistivity at 0.5m probe spacing shows marked similarity with the Stratascan Ground Penetrating Radar (GPR) time-sliced at approximately 0.5m depth with 0.2m thickness (Figure 13b; Heard 2005, Figure 13). There are many features in common with the English Heritage ground resistivity survey (Figure 13c; Heard 2005, Figure 26), although the EH survey was undertaken at rather low resolution (1.0 x 1.0m node spacing). In contrast, the Stratascan (Heard 2005, Figure 8) resistivity survey over the southern part of the paddock shows poor data-matching between adjacent traverses and is likely to have suffered from equipment malfunction. In particular, the three coherent surveys (Figure 13) show a differentiation of the NE part of the lawn from the SW part (higher resistivity to the NE and a high energy GPR return at approximately 0.5m depth, Figure 14 area ‘a’). This area is bounded to the SW by a high resistance feature (Figure 14, ‘b’) that is slightly irregular, but typically approximately 3m wide. A lesser degree of elevated resistivity continues over the area to the SW of this line (Figure 14 area ‘c’). The coincidence of the projected line of Feature ‘b’ with the SW side of the Tudor Palace may be significant, as may be its apparent eastern termination on the line of the inner margin of the early sub-moat. In the area of the NE-SW soak-away, the recorded trench section (Leary 2009, Trench 15) can be
GeoArch Report 2013/26: Geophysical survey at Fulham Palace
4
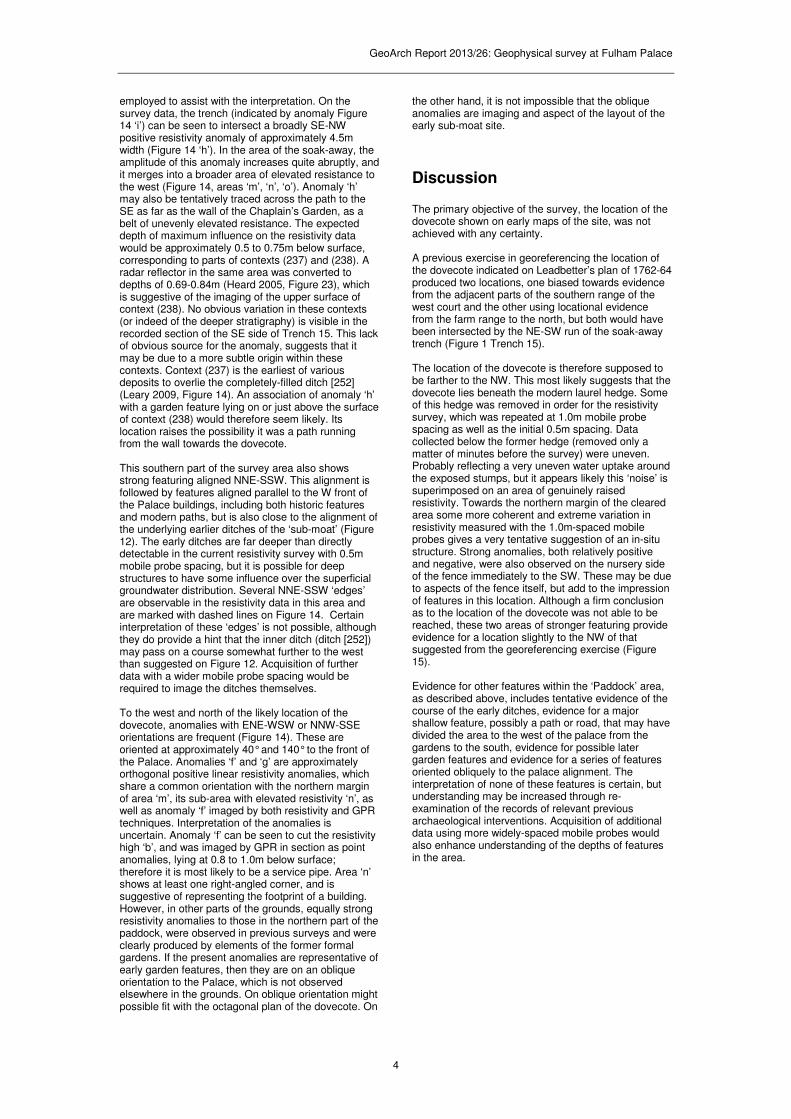
employed to assist with the interpretation. On the survey data, the trench (indicated by anomaly Figure 14 ‘i’) can be seen to intersect a broadly SE-NW positive resistivity anomaly of approximately 4.5m width (Figure 14 ‘h’). In the area of the soak-away, the amplitude of this anomaly increases quite abruptly, and it merges into a broader area of elevated resistance to the west (Figure 14, areas ‘m’, ‘n’, ‘o’). Anomaly ‘h’ may also be tentatively traced across the path to the SE as far as the wall of the Chaplain’s Garden, as a belt of unevenly elevated resistance. The expected depth of maximum influence on the resistivity data would be approximately 0.5 to 0.75m below surface, corresponding to parts of contexts (237) and (238). A radar reflector in the same area was converted to depths of 0.69-0.84m (Heard 2005, Figure 23), which is suggestive of the imaging of the upper surface of context (238). No obvious variation in these contexts (or indeed of the deeper stratigraphy) is visible in the recorded section of the SE side of Trench 15. This lack of obvious source for the anomaly, suggests that it may be due to a more subtle origin within these contexts. Context (237) is the earliest of various deposits to overlie the completely-filled ditch [252] (Leary 2009, Figure 14). An association of anomaly ‘h’ with a garden feature lying on or just above the surface of context (238) would therefore seem likely. Its location raises the possibility it was a path running from the wall towards the dovecote. This southern part of the survey area also shows strong featuring aligned NNE-SSW. This alignment is followed by features aligned parallel to the W front of the Palace buildings, including both historic features and modern paths, but is also close to the alignment of the underlying earlier ditches of the ‘sub-moat’ (Figure 12). The early ditches are far deeper than directly detectable in the current resistivity survey with 0.5m mobile probe spacing, but it is possible for deep structures to have some influence over the superficial groundwater distribution. Several NNE-SSW ‘edges’ are observable in the resistivity data in this area and are marked with dashed lines on Figure 14. Certain interpretation of these ‘edges’ is not possible, although they do provide a hint that the inner ditch (ditch [252]) may pass on a course somewhat further to the west than suggested on Figure 12. Acquisition of further data with a wider mobile probe spacing would be required to image the ditches themselves. To the west and north of the likely location of the dovecote, anomalies with ENE-WSW or NNW-SSE orientations are frequent (Figure 14). These are oriented at approximately 40° and 140° to the front of the Palace. Anomalies ‘f’ and ‘g’ are approximately orthogonal positive linear resistivity anomalies, which share a common orientation with the northern margin of area ‘m’, its sub-area with elevated resistivity ‘n’, as well as anomaly ‘f’ imaged by both resistivity and GPR techniques. Interpretation of the anomalies is uncertain. Anomaly ‘f’ can be seen to cut the resistivity high ‘b’, and was imaged by GPR in section as point anomalies, lying at 0.8 to 1.0m below surface; therefore it is most likely to be a service pipe. Area ‘n’ shows at least one right-angled corner, and is suggestive of representing the footprint of a building. However, in other parts of the grounds, equally strong resistivity anomalies to those in the northern part of the paddock, were observed in previous surveys and were clearly produced by elements of the former formal gardens. If the present anomalies are representative of early garden features, then they are on an oblique orientation to the Palace, which is not observed elsewhere in the grounds. On oblique orientation might possible fit with the octagonal plan of the dovecote. On
the other hand, it is not impossible that the oblique anomalies are imaging and aspect of the layout of the early sub-moat site.
Discussion The primary objective of the survey, the location of the dovecote shown on early maps of the site, was not achieved with any certainty. A previous exercise in georeferencing the location of the dovecote indicated on Leadbetter’s plan of 1762-64 produced two locations, one biased towards evidence from the adjacent parts of the southern range of the west court and the other using locational evidence from the farm range to the north, but both would have been intersected by the NE-SW run of the soak-away trench (Figure 1 Trench 15). The location of the dovecote is therefore supposed to be farther to the NW. This most likely suggests that the dovecote lies beneath the modern laurel hedge. Some of this hedge was removed in order for the resistivity survey, which was repeated at 1.0m mobile probe spacing as well as the initial 0.5m spacing. Data collected below the former hedge (removed only a matter of minutes before the survey) were uneven. Probably reflecting a very uneven water uptake around the exposed stumps, but it appears likely this ‘noise’ is superimposed on an area of genuinely raised resistivity. Towards the northern margin of the cleared area some more coherent and extreme variation in resistivity measured with the 1.0m-spaced mobile probes gives a very tentative suggestion of an in-situ structure. Strong anomalies, both relatively positive and negative, were also observed on the nursery side of the fence immediately to the SW. These may be due to aspects of the fence itself, but add to the impression of features in this location. Although a firm conclusion as to the location of the dovecote was not able to be reached, these two areas of stronger featuring provide evidence for a location slightly to the NW of that suggested from the georeferencing exercise (Figure 15). Evidence for other features within the ‘Paddock’ area, as described above, includes tentative evidence of the course of the early ditches, evidence for a major shallow feature, possibly a path or road, that may have divided the area to the west of the palace from the gardens to the south, evidence for possible later garden features and evidence for a series of features oriented obliquely to the palace alignment. The interpretation of none of these features is certain, but understanding may be increased through re-examination of the records of relevant previous archaeological interventions. Acquisition of additional data using more widely-spaced mobile probes would also enhance understanding of the depths of features in the area.

GeoArch Report 2013/26: Geophysical survey at Fulham Palace
5
References BRIGHT, I., (in prep). An assessment of archaeological
investigations undertaken during Phase 1 & 2 of the Restoration and Revival Project at Fulham Palace, Bishop’s Avenue, London SW6 6EA, London Borough of Hammersmith and Fulham. Pre-Construct Archaeology Ltd (PCA), unpublished report no. R11540
EMERY, P. & MAYO, C. 2008. Archaeology and the
Fulham Palace Refurbishment Project: managing expectations. London Archaeologist, 11, 327-333.
HEARD, H., 2005. Geophysical Survey Report,
Fulham Palace, London. Stratascan, Unpublished report J1984.
LEARY, K., 2009. An Assessment of An
Archaeological Watching Brief of Phase 1 of the Refurbishment Project of Fulham Palace, Bishops Avenue, London SW6, London Borough of Hammersmith and Fulham. Pre-Construct Archaeology Ltd (PCA), unpublished report

GeoArch Report 2013/26: Geophysical survey at Fulham Palace
6
Figure Captions
Figure 1. Figure 1. Location of survey grids, on current OS base mapping (© Crown copyright and database rights 2013 Ordnance Survey), showing selected previous archaeological interventions in the area (after Leary 2009). Note: Trench 13 actually continues, unornamented, along modern path to the south of the survey area. Survey base-station labelled STN1, points ‘a’ and ‘b’ defined the survey orientation. Figure 2. Ground resistivity survey, 0.5m mobile probe spacing, raw data as bitmapped images from Geoplot.
(a) Western parcel (gardens of ‘Fledglings at the Palace’ nursery.
(b) Eastern parcel (lawns of ‘The Paddock’) Greyscale: 20Ω measured resistance (black) to 120Ω (white) Figure 3. Ground resistivity survey, 0.5m mobile probe spacing, despiked data as bitmapped images from Geoplot.
(a) Western parcel (gardens of ‘Fledglings at the Palace’ nursery.
(b) Eastern parcel (lawns of ‘The Paddock’) Greyscale: 20Ω measured resistance (black) to 120Ω (white) Figure 4. Ground resistivity survey, 0.5m mobile probe spacing (as the interpolated data from Surfer). Linear greyscale 45Ω measured resistance (black) to 135Ω (white) Figure 5. Ground resistivity survey, 0.5m mobile probe spacing (as the interpolated data from Surfer). Non-linear colour scale as shown to show additional detail. Figure 6.Ground resistivity survey, 1.0m mobile probe spacing, raw data as bitmapped images from Geoplot. Greyscale: 39Ω measured resistance (black) to 54Ω (white) Figure 7. Ground resistivity survey, 1.0m mobile probe spacing (as the interpolated data from Surfer). Linear greyscale 40Ω measured resistance (black) to 50Ω (white) Figure 8. Ground resistivity survey, 0.5m mobile probe spacing data overlain by 1.0m mobile probe spacing. Greyscales/colour scales as in figures 6 and 7. Figure 9. Ground resistivity survey, 0.5m mobile probe spacing data overlain by 1.0m mobile probe spacing. Greyscales/colour scales as in figures 6 and 7. Survey data overlain on current OS base mapping. © Crown copyright and database rights 2013 Ordnance Survey Figure 10. As Figure 5, but enlarged view of survey area for comparison with figures 11, 12, 14 and 15. Figure 11. As Figure 5, but with selected previous archaeological interventions (after Leary 2009).
Figure 12. As Figure 5, but with simplified archaeological interpretation of the soak-away trench with extrapolation of the line of the sub-moat ditches (after Leary 2009). Figure 13. Comparison of present survey data with results of previous surveys: a. As Figure 9 b. Stratascan GPR data 2005, time-sliced to approximately 0.5m with 0.2m thickness (after Heard 2005, Figure 13).
c. EH resistivity survey 1989, greyscale -2Ω (black) to
+2Ω (white) (after Heard 2005, Figure 26, but with greyscale inverted to ease comparison). Figure 14. Summary interpretation of survey data. Positive areal resistivity anomalies shown in grey tone, positive linear anomalies shown in orange, ‘edges’ in resistivity data shown as dashed lines. Pale blue line f-f marks a poorly imaged negative linear resistivity anomaly, better seen in the EH survey data and as a strong point response at 0.8-1.0m depth in the Stratascan GPR survey. Dark blue line in the S of the area marks the inner edge of the moat as depicted on the 1
st Edition OS
mapping. For detailed explanation of lettering, see text. Figure 15. As Figure 14, showing tentatively suggested possible locations for the dovecote. Outline in yellow based on evidence from the east of the fence, outline in green is an alternative which also employs evidence from very close to, but west of, the fence.

523930 523940 523950 523960 523970 523980 523990 524000 524010
176100
176110
176120
176130
176140
176150
176160
176170
Tr24
Tr19
Tr309
Tr16
Tr10
Tr24
Tr19
Tr18A
Tr13 North
Tr15
Tr18B
Tr224
Tr184
Tr309Tr308
0
20
40
20
40
60
Figure 1
© Crown copyright and database rights 2013 Ordnance Survey
a
b
STN1

Figure 2
0 20
mN

Figure 3
0 20
mN

0 20 40
20
40
60
Figure 4
N

0 20 40
20
40
60
Figure 5
N

Figure 6
0 20
mN

0 20 40
20
40
60
Figure 7
N

Figure 8
0 20 40
20
40
60
N

523900 523910 523920 523930 523940 523950 523960 523970 523980 523990 524000 524010 524020 524030
176090
176100
176110
176120
176130
176140
176150
176160
176170
176180
176190
176200
176210
176220
0
20
40
20
40
60
Figure 9
© Crown copyright and database rights 2013 Ordnance Survey

523930 523940 523950 523960 523970 523980 523990 524000 524010
176100
176110
176120
176130
176140
176150
176160
176170
0
20
40
20
40
60
Figure 10
© Crown copyright and database rights 2013 Ordnance Survey

523930 523940 523950 523960 523970 523980 523990 524000 524010
176100
176110
176120
176130
176140
176150
176160
176170
0
20
40
20
40
60
Tr24
Tr19
Tr309
Tr16
Tr10
Tr24
Tr19
Tr18A
Tr13 North
Tr15
Tr18B
Tr224
Tr184
Tr309Tr308
Figure 11
© Crown copyright and database rights 2013 Ordnance Survey

523930 523940 523950 523960 523970 523980 523990 524000 524010
176100
176110
176120
176130
176140
176150
176160
176170
0
20
40
20
40
60
Tr18A
Tr14
Tr18B
Figure 12
© Crown copyright and database rights 2013 Ordnance Survey

Figure 13
© Crown copyright and database rights 2013 Ordnance Survey
a
c
b

523930 523940 523950 523960 523970 523980 523990 524000 524010
176100
176110
176120
176130
176140
176150
176160
176170
former m
oat
m
m
mn
o
p
q
0
20
40
20
40
60
a
bc
de f
f
g
h
ij
k
l
l
Figure 14
© Crown copyright and database rights 2013 Ordnance Survey

523930 523940 523950 523960 523970 523980 523990 524000 524010
176100
176110
176120
176130
176140
176150
176160
176170
0
20
40
20
40
60
Figure 15
© Crown copyright and database rights 2013 Ordnance Survey

GeoArch
geoarchaeological, archaeometallurgical & geophysical investigations
Office: Mobile:
Fax:
Unit 6,
Western Industrial Estate, Caerphilly, CF83 1BQ
029 20881431 07802 413704 08700 547366
E-Mail: Web:
[email protected] www.GeoArch.co.uk