a low-cost tracking system for running race applications
TRANSCRIPT
sensors
Article
A Low-Cost Tracking System for Running RaceApplications Based on Bluetooth LowEnergy Technology
David Perez-Diaz-de-Cerio 1 ID , Ángela Hernández-Solana 2,* ID , Antonio Valdovinos 2 ID
and Jose Luis Valenzuela 1 ID
1 Signal Theory and Communications Department, Universitat Politècnica de Catalunya, Esteve Terrades 7,08860 Castelldefels, Spain; [email protected] (D.P.-D.-d.-C.); [email protected] (J.L.V.)
2 Aragon Institute for Engineering Research (I3A), University of Zaragoza, 50018 Zaragoza, Spain;[email protected]
* Correspondence: [email protected]; Tel.: +34-976-762362
Received: 28 February 2018; Accepted: 14 March 2018; Published: 20 March 2018
Abstract: Timing points used in running races and other competition events are generally based onradio-frequency identification (RFID) technology. Athletes’ times are calculated via passive RFID tagsand reader kits. Specifically, the reader infrastructure needed is complex and requires the deploymentof a mat or ramps which hide the receiver antennae under them. Moreover, with the employedtags, it is not possible to transmit additional and dynamic information such as pulse or oximetrymonitoring, alarms, etc. In this paper we present a system based on two low complex schemesallowed in Bluetooth Low Energy (BLE): the non-connectable undirected advertisement processand a modified version of scannable undirected advertisement process using the new capabilitiespresent in Bluetooth 5. After fully describing the system architecture, which allows full real-timeposition monitoring of the runners using mobile phones on the organizer side and BLE sensors onthe participants’ side, we derive the mobility patterns of runners and capacity requirements, whichare determinant for evaluating the performance of the proposed system. They have been obtainedfrom the analysis of the real data measured in the last Barcelona Marathon. By means of simulations,we demonstrate that, even under disadvantageous conditions (50% error ratio), both schemes performreliably and are able to detect the 100% of the participants in all the cases. The cell coverage of thesystem needs to be adjusted when non-connectable process is considered. Nevertheless, throughsimulation and experimental, we show that the proposed scheme based on the new events availablein Bluetooth 5 is clearly the best implementation alternative for all the cases, no matter the coveragearea and the runner speed. The proposal widely exceeds the detection requirements of the realscenario, surpassing the measured peaks of 20 sensors per second incoming in the coverage area,moving at speeds that range from 1.5 m/s to 6.25 m/s. The designed real test-bed shows that thescheme is able to detect 72 sensors below 600 ms, fulfilling comfortably the requirements determinedfor the intended application. The main disadvantage of this system would be that the sensors areactive, but we have proved that its consumption can be so low (9.5 µA) that, with a typical buttoncell, the sensor battery life would be over 10,000 h of use.
Keywords: BLE; RFID; running races; tracking; monitoring; Bluetooth 5
1. Introduction
According to the statistics analyzed by Running USA, a nonprofit group that provides industryanalysis to help promote long-distance races, during 2016 more than 30 thousand races were heldalong the U.S. with near 17 million of runners finishing them [1]. In fact, nowadays, the success is such
Sensors 2018, 18, 922; doi:10.3390/s18030922 www.mdpi.com/journal/sensors
Sensors 2018, 18, 922 2 of 17
that someone based in, or near a big city, has a lot of chances to be spoilt for choices when it comesto race options (marathons, half marathons, 5 Ks, obstacle races, . . . ). This exponential increase risesnew related technological problems, for example, how to track and manage the great amount of runnersin a race.
Traditionally, the tracking systems used in this kind of events are based on RFID. These systemshave been present in thousands of events since the Berlin Marathon in September 1994 [2] and are thetracking systems used in Spain as well as in other countries. These systems require each runner to weara passive RFID sensor (tag). Additionally, the organizers must place the corresponding readers at thepoints where is necessary to control the time. Generally, the antennae of these readers are placed underanti-slip mats or ramps over which all the participants must go through. The tags, on their side, areusually placed on the participants’ shoes to allow a minimum distance between the tag and the readerantenna. The advantages of these systems is that are well-proven, high precision and accurate locationsolutions [3,4]. The sensors are low-cost and passive so they do not need any type of maintenance.The participants can rent the sensors before each race or buy them in property and use them for anuncountable number of races. However, the main disadvantages are present on the organizer side.These solutions are not suitable for small competitions and are expensive to buy for small races [5].Additionally, they are bound to specific hardware and all the components of the system must belongto the same ecosystem in order to work. Third-party or mixed solutions are hard to configure, and it iseven common that a person from the tracking equipment company comes to monitor the deploymentand handle the tracking system, increasing in this way the cost. Additionally, the deployment is notvery flexible: a single 205 × 100 × 1 cm mat weighs around 12 kg and this does not take into accountthe equipment that must be connected to it. Usually more than one mat is needed per checkpoint and,moreover, placing these checkpoints can be difficult depending of the nature of the race, for example,in cross-country races. Some low-cost RFID-based platforms have been proposed for jogging andrunning events. In order to reduce the cost, these systems use low-frequency (LF) RFID devices and alow-cost, but whereas typical race systems use ultra-high frequency (UHF) RFID readers, in whichthe range is 5–30 m, LF RFID readers present a range of only 10–20 cm [6]. Other solutions proposean identification mechanism that uses Ultra Wide Band (UWB) ranging information to improve thespeed of identification [7], but increasing the complexity and the cost of the system. In any case,RFID technology, as most of radiofrequency technologies, does not intrinsically provide aptitudes forhigh spatial resolution and to identify the time of presence of the tag on a specific place with highprecision, particularly in complex propagation environments. In fact, the RFID signal does not provideintrinsically a better spatial resolution than the Bluetooth signal. In order to get good spatial accuracy inboth technologies, it is necessary to use complex systems, with several directional antenna or antennaarrays, obtaining the range information from parameters not always easily obtained, as the receivedsignal strength indication (RSSI), the time-difference-of-arrival (TDOA), the phase-difference-of-arrival(PDOA) or the round trip-of-flight (TOF), and determining the tag location by utilizing multipleknown reference points using methods as multilateration, multiangulation, etc. [8]. In typical systemsdeveloped for racing applications, the spatial accuracy is provided in RFID systems by casting the sendand receive antennas in thin tartan mats, which are located at the finish line and other timing locations.Since passive tags are used, the reader only receives the ID-number sent by the tag when they are veryclose each other (when the runner is over the mat). If a higher accuracy is required, a more sophisticatedtechnology has to be used, for instance, photofinish systems. This kind of systems are too expensiveto be considered for local jogging and running events, in which there is little budget. There are alsoprevious experiences in which Bluetooth Low Energy (BLE) has been used to provide crowd mobilitydetection by using a smartphone, with detectability rates of up to 90% [9]. Additionally, BLE has beenproved to provide a good tradeoff between discovery latency and energy consumption [10,11].
In this paper we propose a BLE-based tracking system which can be used as an enhancementor even as an alternative to the RFID-based solutions in scenarios in which it is not necessary toobtain precise time measurements, such as the presence control of the runners through intermediate

Sensors 2018, 18, 922 3 of 17
checkpoints. Spatial resolution can be improved by reducing the coverage distance, which can bedone in RFID by using passive tags, but also in Bluetooth by adjusting the power transmitted by theadvertisers. In any case, if the range of coverage is decreased, there is less time to discover all theadvertisers (runners) when they pass through the checkpoint. It is therefore necessary to achieve abalance between both aspects. Our proposal seeks to obtain a simple, easy to handle and cheap systemthat allows detecting reliably the passage of the runners by a certain point with a precision in themeasurement of time that is not critical, and can be of the order of a few seconds. Whereas RFID readersare specific and expensive devices, particularly passive RFID readers, in our proposal the Bluetoothreader is a simple Android smartphone, in which is easy to develop an application to configureand manage the system and provides accurate enough position information thanks to its integratedGPS receiver and a communication link with the server via a 3G/4G cellular network. Furthermore,Bluetooth offers the possibility of transmitting additional information to the mere identification of therunner, such as biometric data.
First, we will present the system architecture followed by the basics behind the BLE mechanismswhich enable the communications of all the system sensors. Specifically, we consider two lowcomplexity schemes based on the advertisement processes allowed in BLE. The first one uses thenon-connectable undirected advertisement mode. The second is a modified version of scannableundirected advertisement mode. This option is based on the ability to stop the transmissions usingone of the new Bluetooth 5 capabilities that was previously analyzed by the authors [12]. We alsoconsider that real devices present non-idealities in the scanning process that reduce the discoverycapabilities [12,13]. After the system description, we will analyze the requirements of this type ofevents using real data obtained from the 2017 Barcelona Marathon. With this analysis we will obtainreal mobility patterns of the runners such as speed or runner density at different points of the race.These values will be determining to set the requirements of the system under real conditions. Then, bymeans of simulations, we will check if the proposed system is able to meet the scenario requirements.We will determine the viability of detecting all the runners and the more appropriate parameters tobe configured, such as coverage range, time interval between transmitted packets, etc. In order toincrease the capacity of the system, the use of several readers is also considered. Although, in thepresent discussion the final application is the tracking of runners during a race, the results can easilybe extrapolated to other applications such as other kinds of races, tracking kids, cattle control, dronetracking and flight assistance, product chain control in an Industry 4.0 factory, etc.
The proposed alternative offers also additional capabilities not present in the current RFID solutionsas can be the real time monitoring of the participants’ health constants. Several works have studied thenot so rare cases of deaths during sports events. Their results show that 1.74 per 100,000 athletes havesuffered from a sudden cardiac death in triathlons [14] and this number can even be increased to1.9 per 100,000 runners in marathons [15], so, in this way some serious illnesses and even deaths couldbe prevented with the use of the proposed system.
2. System Architecture
As explained before, the systems based on RFID require that each runner buy or rent his/herown RFID tag (see Figure 1). Additionally, the organizers must install ramps or mats at the main racepoints, like the ones depicted on the right of Figure 1 to control when each participant passes throughthese points.
In our proposal, depicted in Figure 2, the participants are also required to wear a sensor, in thiscase, based on BLE. The dimensions of the sensor are similar to the RFID equivalent. However,the RFID ramps or mats are substituted by an application on a smartphone. The organizers usuallydesignate several people to stay along the track for security reasons and to control the successfuldevelopment of the race. Each, or some of this part of the staff members, as many as necessary, shouldwear a smartphone with the tracking application. These smartphones will act as receivers, known asscanners in BLE terminology.

Sensors 2018, 18, 922 4 of 17
Sensors 2018, 18, x FOR PEER REVIEW 4 of 17
Figure 1. RFID Solution.
Figure 2. System deployment.
The devices worn by the participants, on their side, transmit periodically a BLE beacon (advertisement) with the participant ID and any other supplementary data (blood pressure, heart rate, etc.). When they enter into the coverage area of one of the controlling member scanners these packets will be eventually received.
In the most basic mode, using the BLE non-connectable undirected advertisement mode it is necessary to transmit the frames frequently enough to ensure that the sensor it is detected. After a successful reception, the application will append to this information the current location of the smartphone and timestamp obtained by GPS/GLONASS/Galileo and it will be stored on the device and sent in real-time using an available data connection (3G/4G/WLAN) to an organization server on the cloud.
On an enhanced mode, we propose to use the BLE scannable undirected advertisement mode. In this case, after a successful reception of an advertisement, the scanners shall answer with another short packet which is used to acknowledge the reception. Thus, using one of the new Bluetooth 5 capabilities, once the advertiser receives this acknowledgement we force it to enter into a stand-by mode for a while to reduce interferences and, in this way, increase the capacity of the system as we will demonstrate later. Also, in order to enhance the performance of the system, several scanners are allowed to cover the same area as depicted in Figure 2.
The organizers may eventually allow the access to these data to authorized people, for example, friends or family of the participants so they can know during the progress of the race their precise location and race position in real-time. Additionally, based on the monitored data received it is also
Figure 1. RFID Solution.
Figure 2. System deployment.
The devices worn by the participants, on their side, transmit periodically a BLE beacon(advertisement) with the participant ID and any other supplementary data (blood pressure, heart rate,etc.). When they enter into the coverage area of one of the controlling member scanners these packetswill be eventually received.
In the most basic mode, using the BLE non-connectable undirected advertisement mode it is necessary totransmit the frames frequently enough to ensure that the sensor it is detected. After a successful reception,the application will append to this information the current location of the smartphone and timestampobtained by GPS/GLONASS/Galileo and it will be stored on the device and sent in real-time using anavailable data connection (3G/4G/WLAN) to an organization server on the cloud.
On an enhanced mode, we propose to use the BLE scannable undirected advertisement mode. In thiscase, after a successful reception of an advertisement, the scanners shall answer with another shortpacket which is used to acknowledge the reception. Thus, using one of the new Bluetooth 5 capabilities,once the advertiser receives this acknowledgement we force it to enter into a stand-by mode for a whileto reduce interferences and, in this way, increase the capacity of the system as we will demonstratelater. Also, in order to enhance the performance of the system, several scanners are allowed to coverthe same area as depicted in Figure 2.
The organizers may eventually allow the access to these data to authorized people, for example,friends or family of the participants so they can know during the progress of the race their preciselocation and race position in real-time. Additionally, based on the monitored data received it is alsopossible to generate warnings if anomalous conditions of a determined participant are detected. Thus,the security staff could intervene to avoid dangerous situations, like cardiac arrests or sudden deaths.
Sensors 2018, 18, 922 5 of 17
3. BLE Fundamentals Review
In 2010, the Bluetooth Special Interest Group (SIG) incorporated the Low Energy specificationinto the Bluetooth specifications. Since then, several enhancements and modifications through variousrevisions have been performed until the last one, Bluetooth 5, which was released in December 2016.Bluetooth devices operate in the 2.4 GHz Industrial Scientific Medical (ISM) unlicensed band. Althoughclassic Bluetooth allows higher data rates, BLE compliant devices allow wireless communicationsbetween enabled devices with up to 1 Mbps over the air data rates (2 Mbps on Bluetooth 5).
In this section we review the basics of BLE technology, especially those aspects related to the intendedapplication, particularly, the device discovery procedures. For further details about BLE, a good summarycan be found in the work by Gomez et al. [16], and the publicly available specifications [17].
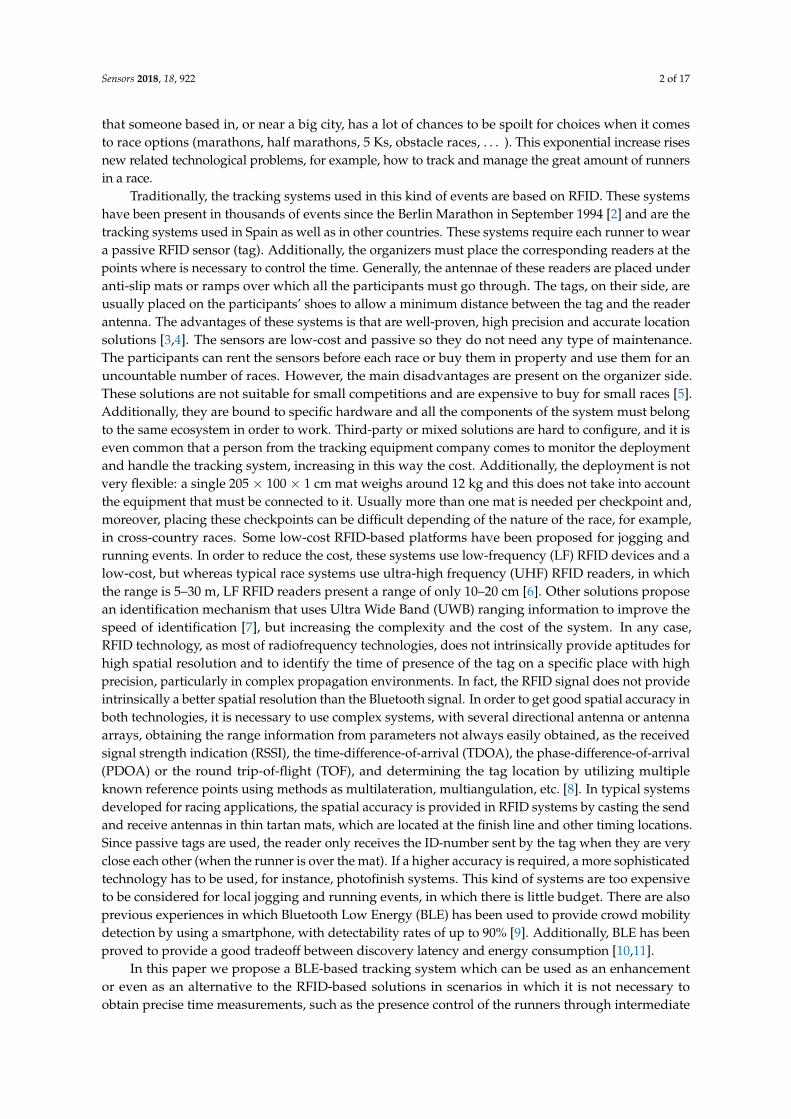
The basic communication mechanism to transmit data and discover devices in BLE is based onbroadcasting messages periodically (advertisement events, see Figure 3). These frames are transmitted,by an advertiser, on three predetermined channels: 37, 38 and 39, although a mask can be applied toselect any combination of these three channels. The advertisement events are transmitted every TadvEvent,a period which is composed by a fixed part, known as advertisement interval (TadvInterval), and arandom time between 0 and 10 ms, TadvDelay. This randomness is necessary to minimize consecutivecollisions between several advertisers. The amount of user data sent inside an advertisement canbe comprised between 1 byte and 26 bytes. So, the duration of the frames (TadvIND) must be in therange from 176 µs to 376 µs. This capacity is more than enough to transmit the monitoring data (bloodpressure, heart rate, etc.) that we have commented previously.
Sensors 2018, 18, x FOR PEER REVIEW 5 of 17
possible to generate warnings if anomalous conditions of a determined participant are detected. Thus, the security staff could intervene to avoid dangerous situations, like cardiac arrests or sudden deaths.
3. BLE Fundamentals Review
In 2010, the Bluetooth Special Interest Group (SIG) incorporated the Low Energy specification into the Bluetooth specifications. Since then, several enhancements and modifications through various revisions have been performed until the last one, Bluetooth 5, which was released in December 2016. Bluetooth devices operate in the 2.4 GHz Industrial Scientific Medical (ISM) unlicensed band. Although classic Bluetooth allows higher data rates, BLE compliant devices allow wireless communications between enabled devices with up to 1 Mbps over the air data rates (2 Mbps on Bluetooth 5).
In this section we review the basics of BLE technology, especially those aspects related to the intended application, particularly, the device discovery procedures. For further details about BLE, a good summary can be found in the work by Gomez et al. [16], and the publicly available specifications [17].
The basic communication mechanism to transmit data and discover devices in BLE is based on broadcasting messages periodically (advertisement events, see Figure 3). These frames are transmitted, by an advertiser, on three predetermined channels: 37, 38 and 39, although a mask can be applied to select any combination of these three channels. The advertisement events are transmitted every TadvEvent, a period which is composed by a fixed part, known as advertisement interval (TadvInterval), and a random time between 0 and 10 ms, TadvDelay. This randomness is necessary to minimize consecutive collisions between several advertisers. The amount of user data sent inside an advertisement can be comprised between 1 byte and 26 bytes. So, the duration of the frames (TadvIND) must be in the range from 176 µs to 376 µs. This capacity is more than enough to transmit the monitoring data (blood pressure, heart rate, etc.) that we have commented previously.
Figure 3. Non-connectable and scannable undirected advertisement detection procedure.
Advertisingevent
TadvInterval TadvIntervalTadvEvent TadvEvent
τadvDelay τadvDelay
ADV_SCAN_INDPDU
Channel 37 Channel 38
TadvIND
Scannable undirected advertising
Active scanner
Scan window
TscanInterval
Scan window Scan window
Channel 38Channel 37 Channel 39
TscanInterval
TIFSADV_SCAN_IND
PDURx
SCAN_REQPDU
TIFS TIFS SCAN_RSPPDU
TscanREQTadvIND TscanRSP
Advertisingevent
Advertisingevent
ADV_SCAN_INDPDU
TadvINDTIFS
Channel 39
RxADV_SCAN_IND
PDU
SCAN_REQPDU
TIFS TIFS RxSCAN_RSP
PDU
TscanWindow
Advertisingevent
Advertisingevent
Advertisingevent
Non connectable undirected advertising
Passive scanner
Scan window Scan window Scan window
Channel 38Channel 37 Channel 39
ADV_NONCONN_INDPDU
Channel 37
TadvIND
ADV_NONCONN_INDPDU
TadvIND
ADV_NONCONN_INDPDU
TadvIND
Channel 39Channel 38
TscanInterval TscanIntervalTscanWindow
TadvInterval TadvIntervalτadvDelay τadvDelay
Figure 3. Non-connectable and scannable undirected advertisement detection procedure.

Sensors 2018, 18, 922 6 of 17
On the receiver side, the scanner listens on one of the three advertisement channels during aconfigurable time period called scan window (TscanWindow). After a scan interval (TscanInterval), a timeperiod at least as long as TscanWindow, the scanner switches to the next advertisement channel in around-robin fashion. Real devices are not able to switch between frequencies instantaneously andintroduce a blind-time during while any received frame is not decoded. More information about thiseffect and others present in real devices can be found on [12,13].
The standard specifies several advertisement modes, in this work we will consider only two ofthem: non-connectable undirected advertisements and scannable undirected advertisements. When applyingthe first one, the advertiser just broadcasts the advertisements periodically on one direction withoutwaiting for a response. With scannable undirected advertisements after the end of the transmission ofan advertisement frame, the advertiser waits for 150 µs (TIFS) for a scan request. The duration ofthis frame (TscanREQ) is 176 µs. This request shall be transmitted on the same frequency by a scannerwhich has received the last transmitted advertisement. To achieve this, the scanner shall be configuredto be in active mode. Once a scan request is successfully received, the advertiser broadcasts, aftera TIFS, another frame (scan response) on the same channel. The duration of this frame (TscanRSP) isconfigurable between 128 µs (no data) and 376 µs. It is important to remark that the scan request isaddressed specifically to the advertiser that triggered the procedure.
Obviously, when using the scannable undirected advertisement mode, the amount of frames overthe air increases, and so do the probability of collisions and interferences between the system devices.However, with Bluetooth 5 a new event, not available in previous versions, is generated and passed tothe upper layers when the advertiser receives a scan request. In our proposal, we will use this eventto put the advertiser into a stand-by mode and stop any further transmissions until a configurabletimeout has passed. After this timeout, the device is reactivated to be detected again by the scanner onthe next checkpoint. Thus, the capacity of the system could be increased. The advertisers automaticallysend a scan response after a successful scan request. To reduce the amount of interference, we configurethe devices to send an empty scan response (TscanRSP = 128 µs).
Another point to be considered when using scannable undirected advertisements is the possibilitythat two scanners simultaneously transmit a scan request. The specifications suggest an example of abackoff algorithm for these special cases, however is the manufacturer which decides with algorithmto implement. Due to this degree of freedom, in our application, when we propose to use more thanone scanner to improve the capacity of the system under unfavorable BLER conditions, we will forcethe scanners to be unsynchronized. In this way, each scanner should be listening for advertisements ina different frequency than the others and the backoff algorithm should not be triggered.
4. Application Requirements
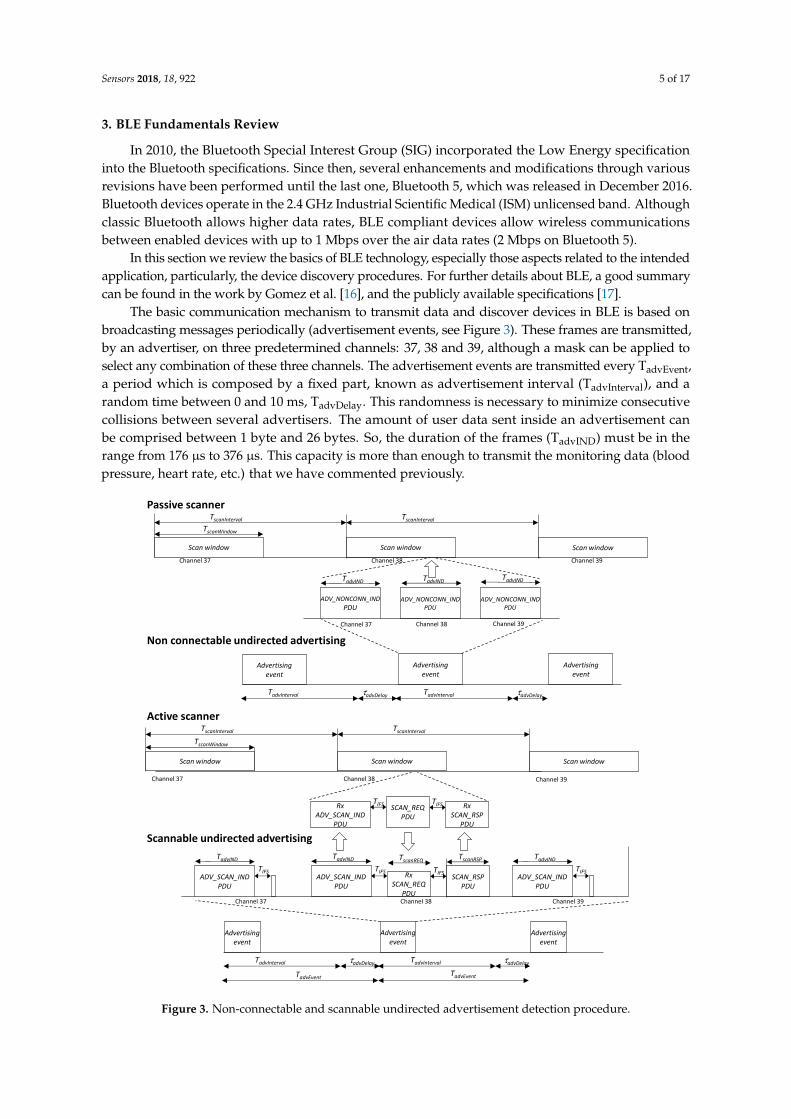
To obtain the application requirements, we have analyzed the data from the 2017 BarcelonaMarathon [18]. The Barcelona Marathon is a popular race, with near 15,000 participants in the lastedition. The stored data not only provides the race and real finish times, but also the participants’ timeat different checkpoints of the race. Without loss of generality, we will obtain the runners patterns anddifferent metrics analyzing the 5 km checkpoint data, see Figure 4.
The first metric we can extract from the data is the speed of the athletes, it ranges from 1.51 m/sup to 6.25 m/s. This value will allow us to calculate easily the amount of time under coverage of thesensors for a determined cell radius and also to work out the suitable off-periods of the sensors whenthey are detected to reduce interferences. Thus, the timeout before reactivating an advertiser can befully configurable. Given the separation between control points, measurements can be useful to set asecure value for the maximum time that a device can remain without sending advertisers. On the otherhand, an estimation of the holding time under the coverage area could be useful to set the minimumvalue for this time in order to prevent unnecessary interferences. For example, an athlete runningat 6.25 m/s, when entering into a 25 m diameter coverage cell, could turn off the transmitter once
Sensors 2018, 18, 922 7 of 17
detected for 4 s without interfering with other devices, whereas a slower runner (1.5 m/s) requires 17 sto be out of the coverage area. A minimum threshold of 30 s can be a suitable option.Sensors 2018, 18, x FOR PEER REVIEW 7 of 17
Figure 4. Runners under coverage at 5 km checkpoint for different coverage radii.
The second important metric is related to the system capacity, i.e., the number of sensors the scanner should detect under its coverage. Obviously, if the cell radius is increased, the number of participants under coverage is also increased. In Figure 4, we have highlighted four runner groups, which are some of the most interesting points of the figure. With the values selected in this case: group 4 and a cell radius of 25 m, which is the worst scenario, the number of sensors to be detected would be near 300. However, it is necessary to take into account also the speed of each group, because this will determine the time under coverage and the successful detection probability.
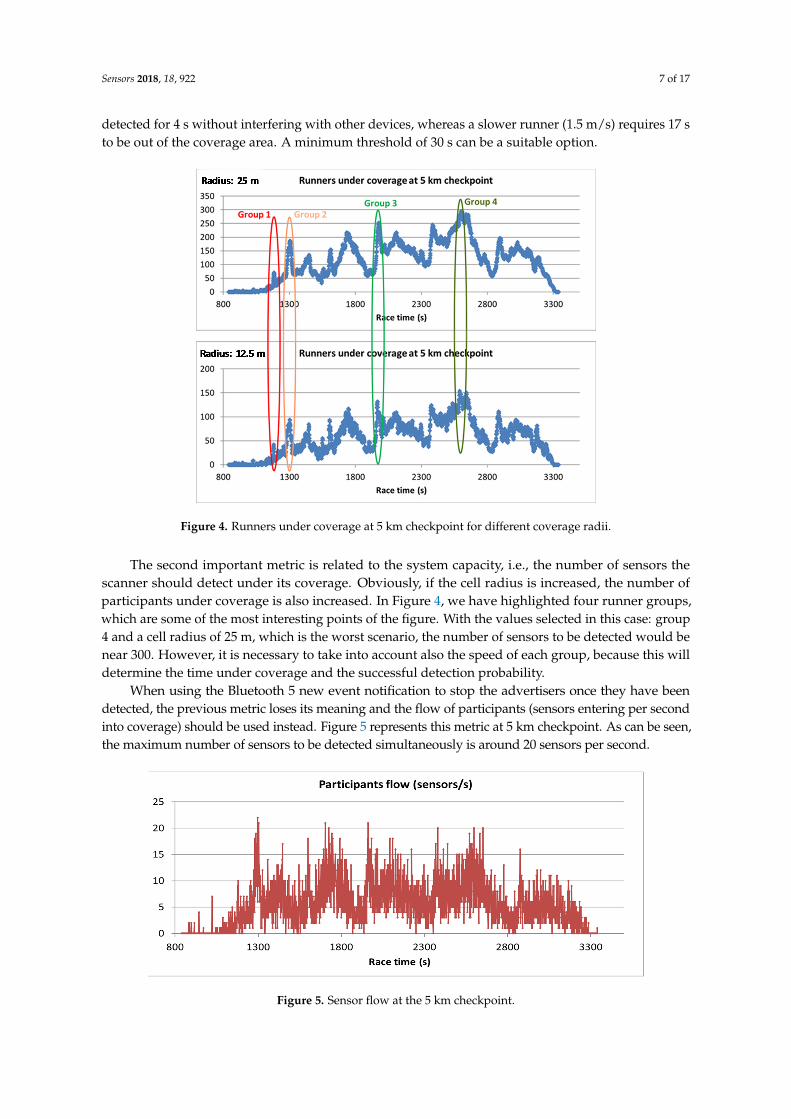
When using the Bluetooth 5 new event notification to stop the advertisers once they have been detected, the previous metric loses its meaning and the flow of participants (sensors entering per second into coverage) should be used instead. Figure 5 represents this metric at 5 km checkpoint. As can be seen, the maximum number of sensors to be detected simultaneously is around 20 sensors per second.
Figure 5. Sensor flow at the 5 km checkpoint.
Figure 4. Runners under coverage at 5 km checkpoint for different coverage radii.
The second important metric is related to the system capacity, i.e., the number of sensors thescanner should detect under its coverage. Obviously, if the cell radius is increased, the number ofparticipants under coverage is also increased. In Figure 4, we have highlighted four runner groups,which are some of the most interesting points of the figure. With the values selected in this case: group4 and a cell radius of 25 m, which is the worst scenario, the number of sensors to be detected would benear 300. However, it is necessary to take into account also the speed of each group, because this willdetermine the time under coverage and the successful detection probability.
When using the Bluetooth 5 new event notification to stop the advertisers once they have beendetected, the previous metric loses its meaning and the flow of participants (sensors entering per secondinto coverage) should be used instead. Figure 5 represents this metric at 5 km checkpoint. As can be seen,the maximum number of sensors to be detected simultaneously is around 20 sensors per second.
Sensors 2018, 18, x FOR PEER REVIEW 7 of 17
Figure 4. Runners under coverage at 5 km checkpoint for different coverage radii.
The second important metric is related to the system capacity, i.e., the number of sensors the scanner should detect under its coverage. Obviously, if the cell radius is increased, the number of participants under coverage is also increased. In Figure 4, we have highlighted four runner groups, which are some of the most interesting points of the figure. With the values selected in this case: group 4 and a cell radius of 25 m, which is the worst scenario, the number of sensors to be detected would be near 300. However, it is necessary to take into account also the speed of each group, because this will determine the time under coverage and the successful detection probability.
When using the Bluetooth 5 new event notification to stop the advertisers once they have been detected, the previous metric loses its meaning and the flow of participants (sensors entering per second into coverage) should be used instead. Figure 5 represents this metric at 5 km checkpoint. As can be seen, the maximum number of sensors to be detected simultaneously is around 20 sensors per second.
Figure 5. Sensor flow at the 5 km checkpoint.
Figure 5. Sensor flow at the 5 km checkpoint.

Sensors 2018, 18, 922 8 of 17
5. Tests and Results
Once determined the mobility patterns of the participants, in this section we evaluate if theproposed sensor network is suitable in terms of coverage, energy consumption, capacity, detectionprobability, etc.
5.1. Coverage Test
The coverage area of the different cells (see Figure 6) can be adjusted changing the transmittedpower of the sensors. In this way, we can control the precision of the tracking system and the numberof sensors which could be present in each cell.
Sensors 2018, 18, x FOR PEER REVIEW 8 of 17
5. Tests and Results
Once determined the mobility patterns of the participants, in this section we evaluate if the proposed sensor network is suitable in terms of coverage, energy consumption, capacity, detection probability, etc.
5.1. Coverage Test
The coverage area of the different cells (see Figure 6) can be adjusted changing the transmitted power of the sensors. In this way, we can control the precision of the tracking system and the number of sensors which could be present in each cell.
Figure 6. Cell coverage.
We have measured on the field the coverage for a static advertiser and a moving one at 25 km/h for all the range of transmitted power allowed by the device under test. The results are shown on Table 1 and go from coverage areas of 2 m up to 400 m.
Table 1. Maximum coverage (m) for static and moving sensors, changing the transmission power.
Tx Power (dBm) Static Sensors Sensors Moving at 25 km/h 4 dBm 400 m 185 m −8 dBm 160 m 70 m −20 dBm 23 m 10 m −40 dBm 6 m 2 m
5.2. Current Consumption Results
RFID tags are usually passive and require very low maintenance. BLE sensors, on the other hand, are usually battery operated, so, to reduce their maintenance, the power consumption of the devices should be kept to a minimum to be an acceptable alternative over RFID. BLE consumption when the device is not transmitting is so low that it can be neglected, so the main energy consumption depends on the number of transmissions done and their duration, i.e., the advertising interval and the packet size. We have tested the consumption of the devices at the laboratory taking into account these parameters and the results obtained are shown in Table 2. For example, with a CR-2032 lithium battery which has a 210 mAh capacity, the sensor battery life would be over 10,000 h of use.
Figure 6. Cell coverage.
We have measured on the field the coverage for a static advertiser and a moving one at 25 km/hfor all the range of transmitted power allowed by the device under test. The results are shown onTable 1 and go from coverage areas of 2 m up to 400 m.
Table 1. Maximum coverage (m) for static and moving sensors, changing the transmission power.
Tx Power (dBm) Static Sensors Sensors Moving at 25 km/h
4 dBm 400 m 185 m−8 dBm 160 m 70 m−20 dBm 23 m 10 m−40 dBm 6 m 2 m
5.2. Current Consumption Results
RFID tags are usually passive and require very low maintenance. BLE sensors, on the otherhand, are usually battery operated, so, to reduce their maintenance, the power consumption of thedevices should be kept to a minimum to be an acceptable alternative over RFID. BLE consumptionwhen the device is not transmitting is so low that it can be neglected, so the main energy consumptiondepends on the number of transmissions done and their duration, i.e., the advertising interval and thepacket size. We have tested the consumption of the devices at the laboratory taking into account theseparameters and the results obtained are shown in Table 2. For example, with a CR-2032 lithium batterywhich has a 210 mAh capacity, the sensor battery life would be over 10,000 h of use.
Sensors 2018, 18, 922 9 of 17
Table 2. Sensor current consumption for different packet sizes and advertisement intervals.
Advertisement Interval 1 Data Byte 10 Data Bytes 26 Data Bytes
100 ms 17.5 µA 19.5 µA 20.25 µA300 ms 10.5 µA 11 µA 12 µA500 ms 9.5 µA 9.7 µA 9.9 µA
5.3. Flow Absorption Test
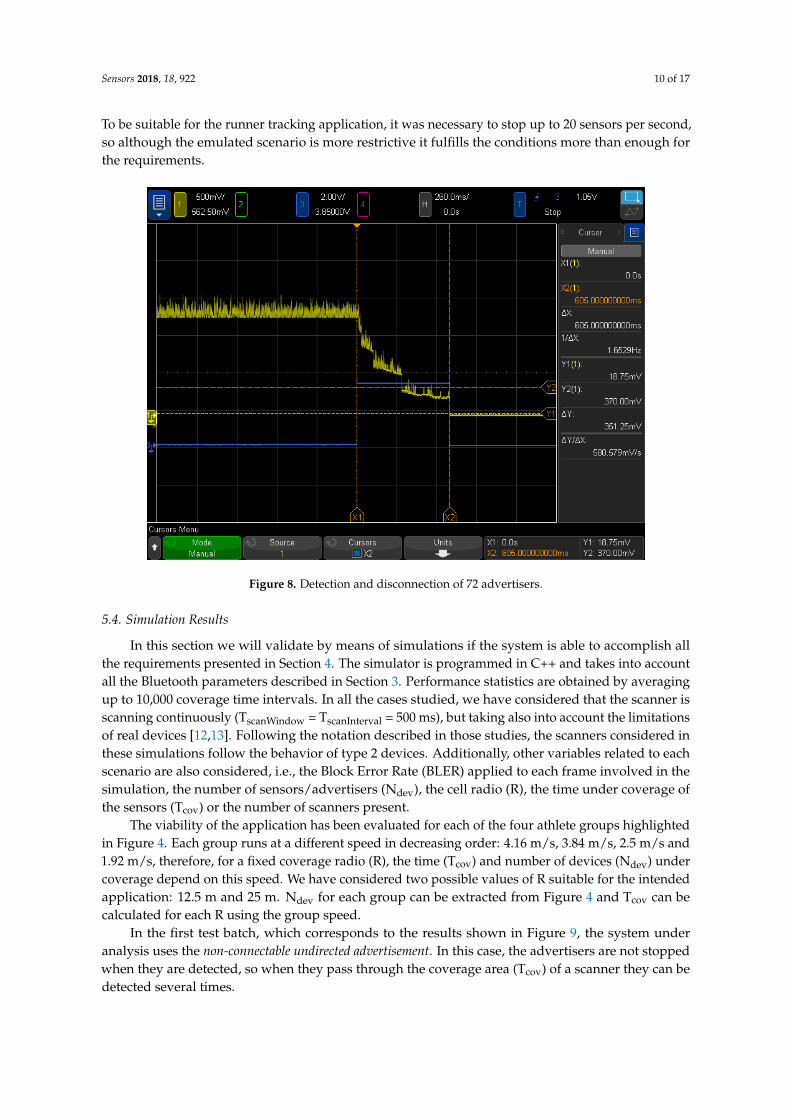
We also designed a laboratory test to determine if the system was able to detect and stop enoughtransmitters to meet the requirements presented on Section 4. Our proposal suggests to turn off theadvertisers when receiving a scan request using the new Bluetooth 5 notification event. However,at the moment of doing the experiment, we did not have real Bluetooth 5 devices to realize the test.So, we implemented the set up shown in Figure 7 which emulates a more restrictive case. Thus, if theresults obtained fulfill the requirements so will the original proposal.
Sensors 2018, 18, x FOR PEER REVIEW 9 of 17
Table 2. Sensor current consumption for different packet sizes and advertisement intervals.
Advertisement Interval 1 Data Byte 10 Data Bytes 26 Data Bytes 100 ms 17.5 µA 19.5 µA 20.25 µA 300 ms 10.5 µA 11 µA 12 µA 500 ms 9.5 µA 9.7 µA 9.9 µA
5.3. Flow Absorption Test
We also designed a laboratory test to determine if the system was able to detect and stop enough transmitters to meet the requirements presented on Section 4. Our proposal suggests to turn off the advertisers when receiving a scan request using the new Bluetooth 5 notification event. However, at the moment of doing the experiment, we did not have real Bluetooth 5 devices to realize the test. So, we implemented the set up shown in Figure 7 which emulates a more restrictive case. Thus, if the results obtained fulfill the requirements so will the original proposal.
Figure 7. Test-bed setup.
This test-bed is composed of 72 Redbear nano [19] BLE advertisers. The scanner is a Raspberry pi 3. We can control the power lines of the advertisers through the Raspberry pi GPIO pins which are connected to several shift registers in a daisy chain configuration. Each shift register controls a row of eight advertisers. In this case, the advertisers cannot disconnect themselves, so we map the position and address of each of the advertisers and is the Raspberry pi which disconnects them. When the Raspberry-integrated Bluetooth transceiver receives an advertisement, it sends the corresponding scan request. Then, if the scan response is received successfully, it turns off the advertiser involved in that frame exchange.
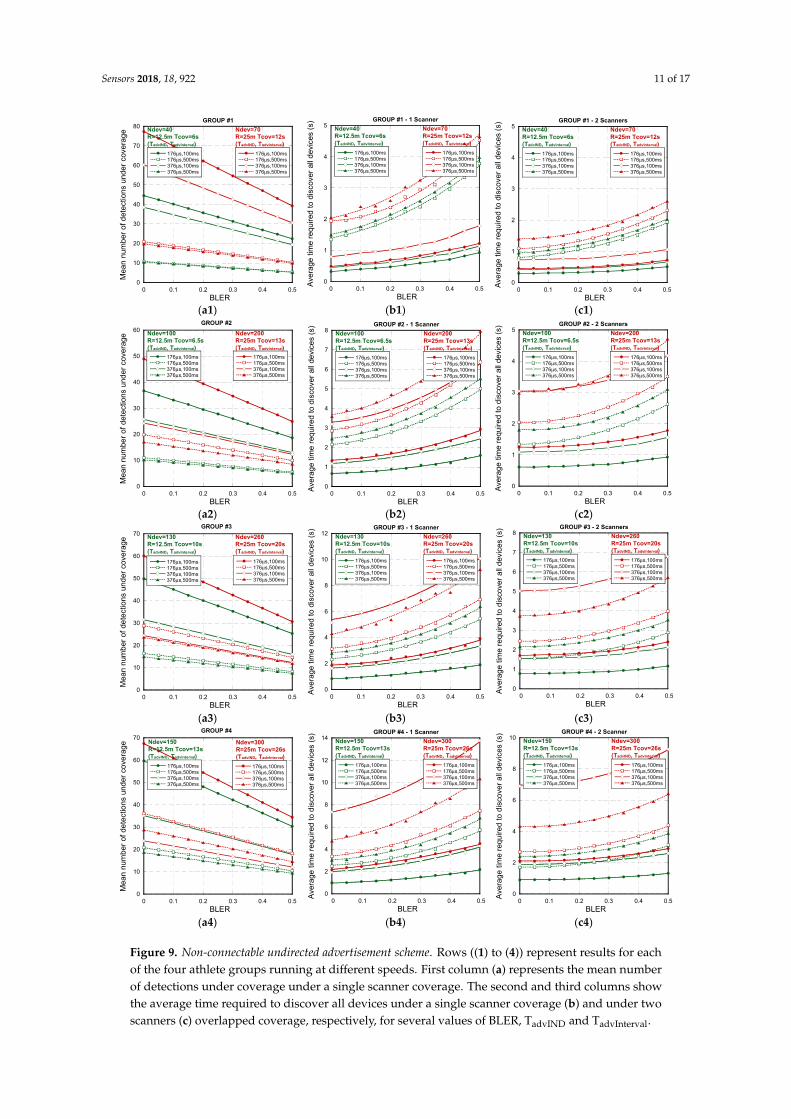
To measure the response of the system we monitored the consumption of the whole board with a current monitor connected to an oscilloscope. An example of the results for this experiment is shown in Figure 8. There it can be seen that the system is able to disconnect the 72 devices in around 600 ms. To be suitable for the runner tracking application, it was necessary to stop up to 20 sensors per second, so although the emulated scenario is more restrictive it fulfills the conditions more than enough for the requirements.
Figure 7. Test-bed setup.
This test-bed is composed of 72 Redbear nano [19] BLE advertisers. The scanner is a Raspberry pi 3.We can control the power lines of the advertisers through the Raspberry pi GPIO pins which areconnected to several shift registers in a daisy chain configuration. Each shift register controls a row ofeight advertisers. In this case, the advertisers cannot disconnect themselves, so we map the positionand address of each of the advertisers and is the Raspberry pi which disconnects them. When theRaspberry-integrated Bluetooth transceiver receives an advertisement, it sends the corresponding scanrequest. Then, if the scan response is received successfully, it turns off the advertiser involved in thatframe exchange.
To measure the response of the system we monitored the consumption of the whole board with acurrent monitor connected to an oscilloscope. An example of the results for this experiment is shownin Figure 8. There it can be seen that the system is able to disconnect the 72 devices in around 600 ms.
Sensors 2018, 18, 922 10 of 17
To be suitable for the runner tracking application, it was necessary to stop up to 20 sensors per second,so although the emulated scenario is more restrictive it fulfills the conditions more than enough forthe requirements.Sensors 2018, 18, x FOR PEER REVIEW 10 of 17
Figure 8. Detection and disconnection of 72 advertisers.
5.4. Simulation Results
In this section we will validate by means of simulations if the system is able to accomplish all the requirements presented in Section 4. The simulator is programmed in C++ and takes into account all the Bluetooth parameters described in Section 3. Performance statistics are obtained by averaging up to 10,000 coverage time intervals. In all the cases studied, we have considered that the scanner is scanning continuously (TscanWindow = TscanInterval = 500 ms), but taking also into account the limitations of real devices [12,13]. Following the notation described in those studies, the scanners considered in these simulations follow the behavior of type 2 devices. Additionally, other variables related to each scenario are also considered, i.e., the Block Error Rate (BLER) applied to each frame involved in the simulation, the number of sensors/advertisers (Ndev), the cell radio (R), the time under coverage of the sensors (Tcov) or the number of scanners present.
The viability of the application has been evaluated for each of the four athlete groups highlighted in Figure 4. Each group runs at a different speed in decreasing order: 4.16 m/s, 3.84 m/s, 2.5 m/s and 1.92 m/s, therefore, for a fixed coverage radio (R), the time (Tcov) and number of devices (Ndev) under coverage depend on this speed. We have considered two possible values of R suitable for the intended application: 12.5 m and 25 m. Ndev for each group can be extracted from Figure 4 and Tcov can be calculated for each R using the group speed.
In the first test batch, which corresponds to the results shown in Figure 9, the system under analysis uses the non-connectable undirected advertisement. In this case, the advertisers are not stopped when they are detected, so when they pass through the coverage area (Tcov) of a scanner they can be detected several times.
Figure 8. Detection and disconnection of 72 advertisers.
5.4. Simulation Results
In this section we will validate by means of simulations if the system is able to accomplish allthe requirements presented in Section 4. The simulator is programmed in C++ and takes into accountall the Bluetooth parameters described in Section 3. Performance statistics are obtained by averagingup to 10,000 coverage time intervals. In all the cases studied, we have considered that the scanner isscanning continuously (TscanWindow = TscanInterval = 500 ms), but taking also into account the limitationsof real devices [12,13]. Following the notation described in those studies, the scanners considered inthese simulations follow the behavior of type 2 devices. Additionally, other variables related to eachscenario are also considered, i.e., the Block Error Rate (BLER) applied to each frame involved in thesimulation, the number of sensors/advertisers (Ndev), the cell radio (R), the time under coverage ofthe sensors (Tcov) or the number of scanners present.
The viability of the application has been evaluated for each of the four athlete groups highlightedin Figure 4. Each group runs at a different speed in decreasing order: 4.16 m/s, 3.84 m/s, 2.5 m/s and1.92 m/s, therefore, for a fixed coverage radio (R), the time (Tcov) and number of devices (Ndev) undercoverage depend on this speed. We have considered two possible values of R suitable for the intendedapplication: 12.5 m and 25 m. Ndev for each group can be extracted from Figure 4 and Tcov can becalculated for each R using the group speed.
In the first test batch, which corresponds to the results shown in Figure 9, the system underanalysis uses the non-connectable undirected advertisement. In this case, the advertisers are not stoppedwhen they are detected, so when they pass through the coverage area (Tcov) of a scanner they can bedetected several times.
Sensors 2018, 18, 922 11 of 17Sensors 2018, 18, x FOR PEER REVIEW 11 of 17
(a1) (b1) (c1)
(a2) (b2) (c2)
(a3) (b3) (c3)
(a4) (b4) (c4)
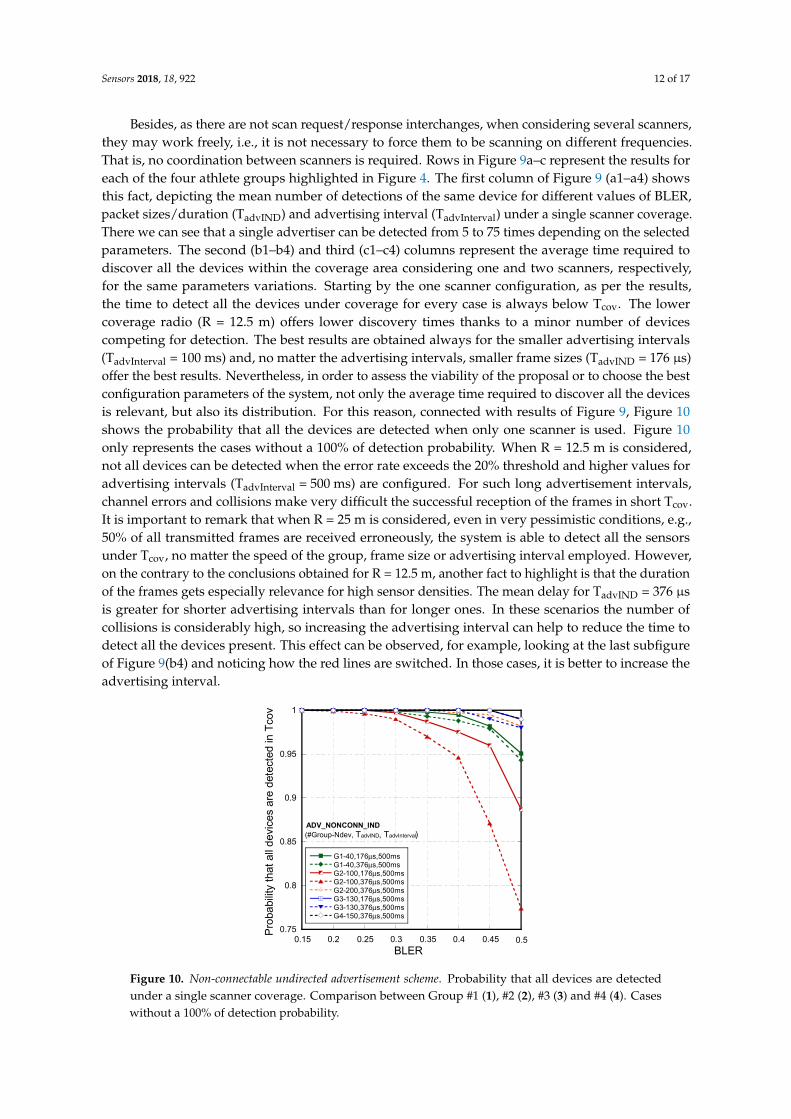
Figure 9. Non-connectable undirected advertisement scheme. Rows ((1) to (4)) represent results for each of the four athlete groups running at different speeds. First column (a) represents the mean number of detections under coverage under a single scanner coverage. The second and third columns show the average time required to discover all devices under a single scanner coverage (b) and under two scanners (c) overlapped coverage, respectively, for several values of BLER, TadvIND and TadvInterval.
0
10
20
30
40
50
60
70
80
0 0.1 0.2 0.3 0.4 0.5
GROUP #1
176μs,100ms176μs,500ms376μs,100ms376μs,500ms
176μs,100ms176μs,500ms376μs,100ms376μs,500ms
Mea
n n
umb
er o
f det
ectio
ns u
nde
r co
vera
ge
BLER
Ndev=40R=12.5m Tcov=6s(TadvIND, TadvInterval)
Ndev=70R=25m Tcov=12s(TadvIND, TadvInterval)
0
1
2
3
4
5GROUP #1 - 1 Scanner
176μs,100ms176μs,500ms376μs,100ms376μs,500ms
176μs,100ms176μs,500ms376μs,100ms376μs,500ms
Ave
rage
tim
e re
quir
ed t
o di
scov
er a
ll d
evic
es
(s)
BLER
Ndev=40R=12.5m Tcov=6s(TadvIND, TadvInterval)
Ndev=70R=25m Tcov=12s(TadvIND, TadvInterval)
0 0.1 0.2 0.3 0.4 0.50
1
2
3
4
5GROUP #1 - 2 Scanners
176μs,100ms176μs,500ms376μs,100ms376μs,500ms
176μs,100ms176μs,500ms376μs,100ms376μs,500ms
Ave
rag
e tim
e re
quire
d to
dis
cove
r al
l de
vice
s (s
)
BLER
Ndev=40R=12.5m Tcov=6s(TadvIND, TadvInterval)
Ndev=70R=25m Tcov=12s(TadvIND, TadvInterval)
0 0.1 0.2 0.3 0.4 0.5
0
10
20
30
40
50
60
0 0.1 0.2 0.3 0.4 0.5
176μs,100ms176μs,500ms376μs,100ms376μs,500ms
176μs,100ms176μs,500ms376μs,100ms376μs,500ms
Ndev=100R=12.5m Tcov=6.5s(TadvIND, TadvInterval)
Ndev=200R=25m Tcov=13s(TadvIND, TadvInterval)
BLER
Me
an n
umbe
r of
det
ectio
ns u
nder
cov
erag
e
GROUP #2
0
1
2
3
4
5
6
7
8GROUP #2 - 1 Scanner
176μs,100ms176μs,500ms376μs,100ms376μs,500ms
176μs,100ms176μs,500ms376μs,100ms376μs,500ms
Ave
rag
e tim
e re
quire
d to
dis
cove
r al
l de
vice
s (s
)
BLER
Ndev=100R=12.5m Tcov=6.5s(TadvIND, TadvInterval)
Ndev=200R=25m Tcov=13s(TadvIND, TadvInterval)
0 0.1 0.2 0.3 0.4 0.50
1
2
3
4
5GROUP #2 - 2 Scanners
176μs,100ms176μs,500ms376μs,100ms376μs,500ms
176μs,100ms176μs,500ms376μs,100ms376μs,500ms
Ave
rag
e tim
e re
quire
d to
dis
cove
r al
l de
vice
s (s
)BLER
Ndev=100R=12.5m Tcov=6.5s(TadvIND, TadvInterval)
Ndev=200R=25m Tcov=13s(TadvIND, TadvInterval)
0 0.1 0.2 0.3 0.4 0.5
0
10
20
30
40
50
60
70
0 0.1 0.2 0.3 0.4 0.5
176μs,100ms176μs,500ms376μs,100ms376μs,500ms
176μs,100ms176μs,500ms376μs,100ms376μs,500ms
BLER
Mea
n n
umb
er o
f de
tect
ion
s un
de
r co
vera
ge
GROUP #3
Ndev=130R=12.5m Tcov=10s(TadvIND, TadvInterval)
Ndev=260R=25m Tcov=20s(TadvIND, TadvInterval)
0
2
4
6
8
10
12GROUP #3 - 1 Scanner
176μs,100ms176μs,500ms376μs,100ms376μs,500ms
176μs,100ms176μs,500ms376μs,100ms376μs,500ms
Ave
rage
tim
e re
quir
ed t
o di
scov
er a
ll d
evic
es
(s)
BLER
Ndev=130R=12.5m Tcov=10s(TadvIND, TadvInterval)
Ndev=260R=25m Tcov=20s(TadvIND, TadvInterval)
0 0.1 0.2 0.3 0.4 0.50
1
2
3
4
5
6
7
8GROUP #3 - 2 Scanners
176μs,100ms176μs,500ms376μs,100ms376μs,500ms
176μs,100ms176μs,500ms376μs,100ms376μs,500ms
Ave
rag
e tim
e re
quire
d to
dis
cove
r al
l dev
ices
(s)
BLER
Ndev=130R=12.5m Tcov=10s(TadvIND, TadvInterval)
Ndev=260R=25m Tcov=20s(TadvIND, TadvInterval)
0 0.1 0.2 0.3 0.4 0.5
0
10
20
30
40
50
60
70
0 0.1 0.2 0.3 0.4 0.5
176μs,100ms176μs,500ms376μs,100ms376μs,500ms
176μs,100ms176μs,500ms376μs,100ms376μs,500ms
BLER
Mea
n n
umb
er o
f de
tect
ion
s un
de
r co
vera
ge
GROUP #4
Ndev=150R=12.5m Tcov=13s(TadvIND, TadvInterval)
Ndev=300R=25m Tcov=26s(TadvIND, TadvInterval)
0
2
4
6
8
10
12
14GROUP #4 - 1 Scanner
176μs,100ms176μs,500ms376μs,100ms376μs,500ms
176μs,100ms176μs,500ms376μs,100ms376μs,500ms
Ave
rag
e tim
e re
quire
d to
dis
cove
r al
l dev
ices
(s)
BLER
Ndev=150R=12.5m Tcov=13s(TadvIND, TadvInterval)
Ndev=300R=25m Tcov=26s(TadvIND, TadvInterval)
0 0.1 0.2 0.3 0.4 0.50
2
4
6
8
10GROUP #4 - 2 Scanner
176μs,100ms176μs,500ms376μs,100ms376μs,500ms
176μs,100ms176μs,500ms376μs,100ms376μs,500ms
Ave
rag
e tim
e re
quire
d to
dis
cove
r a
ll de
vice
s (s
)
BLER
Ndev=150R=12.5m Tcov=13s(TadvIND, TadvInterval)
Ndev=300R=25m Tcov=26s(TadvIND, TadvInterval)
0 0.1 0.2 0.3 0.4 0.5
Figure 9. Non-connectable undirected advertisement scheme. Rows ((1) to (4)) represent results for eachof the four athlete groups running at different speeds. First column (a) represents the mean numberof detections under coverage under a single scanner coverage. The second and third columns showthe average time required to discover all devices under a single scanner coverage (b) and under twoscanners (c) overlapped coverage, respectively, for several values of BLER, TadvIND and TadvInterval.
Sensors 2018, 18, 922 12 of 17
Besides, as there are not scan request/response interchanges, when considering several scanners,they may work freely, i.e., it is not necessary to force them to be scanning on different frequencies.That is, no coordination between scanners is required. Rows in Figure 9a–c represent the results foreach of the four athlete groups highlighted in Figure 4. The first column of Figure 9 (a1–a4) showsthis fact, depicting the mean number of detections of the same device for different values of BLER,packet sizes/duration (TadvIND) and advertising interval (TadvInterval) under a single scanner coverage.There we can see that a single advertiser can be detected from 5 to 75 times depending on the selectedparameters. The second (b1–b4) and third (c1–c4) columns represent the average time required todiscover all the devices within the coverage area considering one and two scanners, respectively,for the same parameters variations. Starting by the one scanner configuration, as per the results,the time to detect all the devices under coverage for every case is always below Tcov. The lowercoverage radio (R = 12.5 m) offers lower discovery times thanks to a minor number of devicescompeting for detection. The best results are obtained always for the smaller advertising intervals(TadvInterval = 100 ms) and, no matter the advertising intervals, smaller frame sizes (TadvIND = 176 µs)offer the best results. Nevertheless, in order to assess the viability of the proposal or to choose the bestconfiguration parameters of the system, not only the average time required to discover all the devicesis relevant, but also its distribution. For this reason, connected with results of Figure 9, Figure 10shows the probability that all the devices are detected when only one scanner is used. Figure 10only represents the cases without a 100% of detection probability. When R = 12.5 m is considered,not all devices can be detected when the error rate exceeds the 20% threshold and higher values foradvertising intervals (TadvInterval = 500 ms) are configured. For such long advertisement intervals,channel errors and collisions make very difficult the successful reception of the frames in short Tcov.It is important to remark that when R = 25 m is considered, even in very pessimistic conditions, e.g.,50% of all transmitted frames are received erroneously, the system is able to detect all the sensorsunder Tcov, no matter the speed of the group, frame size or advertising interval employed. However,on the contrary to the conclusions obtained for R = 12.5 m, another fact to highlight is that the durationof the frames gets especially relevance for high sensor densities. The mean delay for TadvIND = 376 µsis greater for shorter advertising intervals than for longer ones. In these scenarios the number ofcollisions is considerably high, so increasing the advertising interval can help to reduce the time todetect all the devices present. This effect can be observed, for example, looking at the last subfigureof Figure 9(b4) and noticing how the red lines are switched. In those cases, it is better to increase theadvertising interval.
Sensors 2018, 18, x FOR PEER REVIEW 12 of 17
Besides, as there are not scan request/response interchanges, when considering several scanners, they may work freely, i.e., it is not necessary to force them to be scanning on different frequencies. That is, no coordination between scanners is required. Rows in Figure 9a–c represent the results for each of the four athlete groups highlighted in Figure 4. The first column of Figure 9 (a1–a4) shows this fact, depicting the mean number of detections of the same device for different values of BLER, packet sizes/duration (TadvIND) and advertising interval (TadvInterval) under a single scanner coverage. There we can see that a single advertiser can be detected from 5 to 75 times depending on the selected parameters. The second (b1–b4) and third (c1–c4) columns represent the average time required to discover all the devices within the coverage area considering one and two scanners, respectively, for the same parameters variations. Starting by the one scanner configuration, as per the results, the time to detect all the devices under coverage for every case is always below Tcov. The lower coverage radio (R = 12.5 m) offers lower discovery times thanks to a minor number of devices competing for detection. The best results are obtained always for the smaller advertising intervals (TadvInterval = 100 ms) and, no matter the advertising intervals, smaller frame sizes (TadvIND = 176 µs) offer the best results. Nevertheless, in order to assess the viability of the proposal or to choose the best configuration parameters of the system, not only the average time required to discover all the devices is relevant, but also its distribution. For this reason, connected with results of Figure 9, Figure 10 shows the probability that all the devices are detected when only one scanner is used. Figure 10 only represents the cases without a 100% of detection probability. When R = 12.5 m is considered, not all devices can be detected when the error rate exceeds the 20% threshold and higher values for advertising intervals (TadvInterval = 500 ms) are configured. For such long advertisement intervals, channel errors and collisions make very difficult the successful reception of the frames in short Tcov. It is important to remark that when R = 25 m is considered, even in very pessimistic conditions, e.g., 50% of all transmitted frames are received erroneously, the system is able to detect all the sensors under Tcov, no matter the speed of the group, frame size or advertising interval employed. However, on the contrary to the conclusions obtained for R = 12.5 m, another fact to highlight is that the duration of the frames gets especially relevance for high sensor densities. The mean delay for TadvIND = 376 µs is greater for shorter advertising intervals than for longer ones. In these scenarios the number of collisions is considerably high, so increasing the advertising interval can help to reduce the time to detect all the devices present. This effect can be observed, for example, looking at the last subfigure of Figure 9(b4) and noticing how the red lines are switched. In those cases, it is better to increase the advertising interval.
Figure 10. Non-connectable undirected advertisement scheme. Probability that all devices are detected under a single scanner coverage. Comparison between Group #1 (1), #2 (2), #3 (3) and #4 (4). Cases without a 100% of detection probability.
G1-40,176μs,500msG1-40,376μs,500msG2-100,176μs,500msG2-100,376μs,500msG2-200,376μs,500msG3-130,176μs,500msG3-130,376μs,500msG4-150,376μs,500ms
0.75
0.8
0.85
0.9
0.95
1
0.15 0.2 0.25 0.3 0.35 0.4 0.45 0.5
(#Group-Ndev, TadvIND, TadvInterval)ADV_NONCONN_IND
Pro
babi
lity
that
all
dev
ices
are
det
ecte
d in
Tco
v
BLER
Figure 10. Non-connectable undirected advertisement scheme. Probability that all devices are detectedunder a single scanner coverage. Comparison between Group #1 (1), #2 (2), #3 (3) and #4 (4). Caseswithout a 100% of detection probability.
Sensors 2018, 18, 922 13 of 17
The third column of Figure 9 shows that the introduction of just one more scanner can reducesignificantly the average time needed to detect all the devices under coverage for every case. On theother hand, the system is able to detect all the sensors under Tcov no matter the speed of the group,frame size or advertising interval employed, with the exception of the Ndev = 100, TadvIND = 376 µsand TadvInterval = 500 ms, with above 99%.
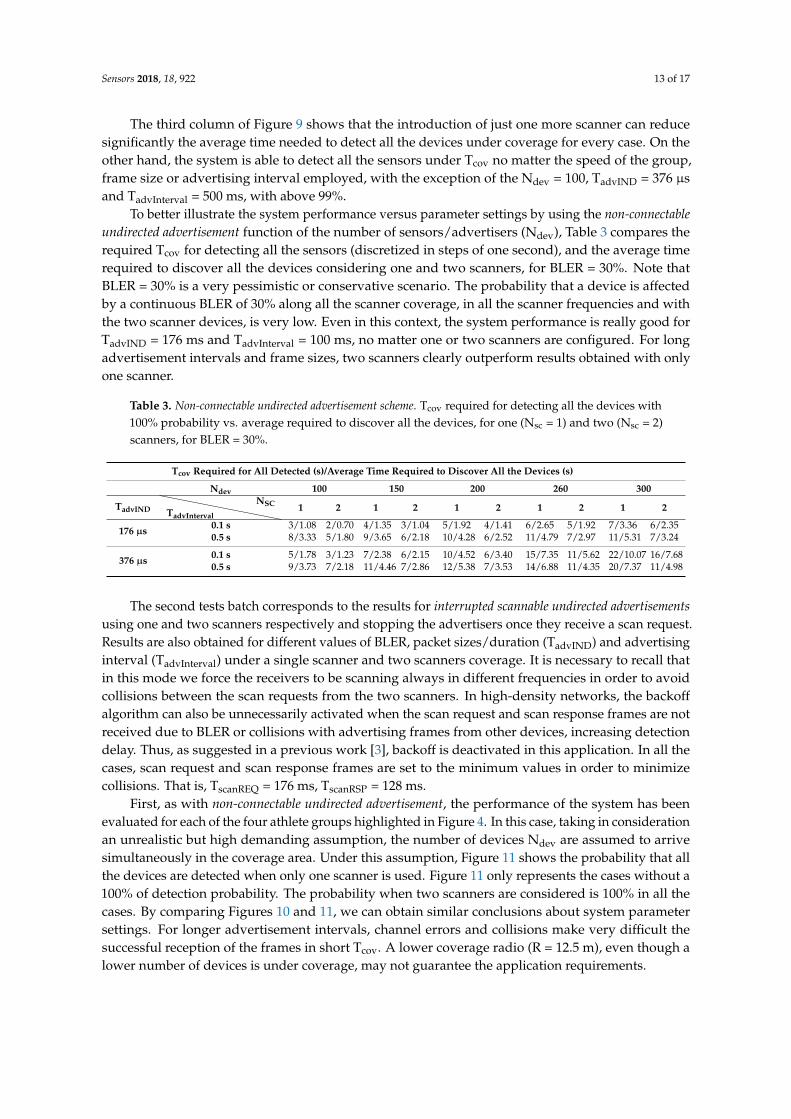
To better illustrate the system performance versus parameter settings by using the non-connectableundirected advertisement function of the number of sensors/advertisers (Ndev), Table 3 compares therequired Tcov for detecting all the sensors (discretized in steps of one second), and the average timerequired to discover all the devices considering one and two scanners, for BLER = 30%. Note thatBLER = 30% is a very pessimistic or conservative scenario. The probability that a device is affectedby a continuous BLER of 30% along all the scanner coverage, in all the scanner frequencies and withthe two scanner devices, is very low. Even in this context, the system performance is really good forTadvIND = 176 ms and TadvInterval = 100 ms, no matter one or two scanners are configured. For longadvertisement intervals and frame sizes, two scanners clearly outperform results obtained with onlyone scanner.
Table 3. Non-connectable undirected advertisement scheme. Tcov required for detecting all the devices with100% probability vs. average required to discover all the devices, for one (Nsc = 1) and two (Nsc = 2)scanners, for BLER = 30%.
Tcov Required for All Detected (s)/Average Time Required to Discover All the Devices (s)
Ndev 100 150 200 260 300
TadvIND 1 2 1 2 1 2 1 2 1 2TadvInterval
NSC
176 µs 0.1 s 3/1.08 2/0.70 4/1.35 3/1.04 5/1.92 4/1.41 6/2.65 5/1.92 7/3.36 6/2.350.5 s 8/3.33 5/1.80 9/3.65 6/2.18 10/4.28 6/2.52 11/4.79 7/2.97 11/5.31 7/3.24
376 µs 0.1 s 5/1.78 3/1.23 7/2.38 6/2.15 10/4.52 6/3.40 15/7.35 11/5.62 22/10.07 16/7.680.5 s 9/3.73 7/2.18 11/4.46 7/2.86 12/5.38 7/3.53 14/6.88 11/4.35 20/7.37 11/4.98
The second tests batch corresponds to the results for interrupted scannable undirected advertisementsusing one and two scanners respectively and stopping the advertisers once they receive a scan request.Results are also obtained for different values of BLER, packet sizes/duration (TadvIND) and advertisinginterval (TadvInterval) under a single scanner and two scanners coverage. It is necessary to recall thatin this mode we force the receivers to be scanning always in different frequencies in order to avoidcollisions between the scan requests from the two scanners. In high-density networks, the backoffalgorithm can also be unnecessarily activated when the scan request and scan response frames are notreceived due to BLER or collisions with advertising frames from other devices, increasing detectiondelay. Thus, as suggested in a previous work [3], backoff is deactivated in this application. In all thecases, scan request and scan response frames are set to the minimum values in order to minimizecollisions. That is, TscanREQ = 176 ms, TscanRSP = 128 ms.
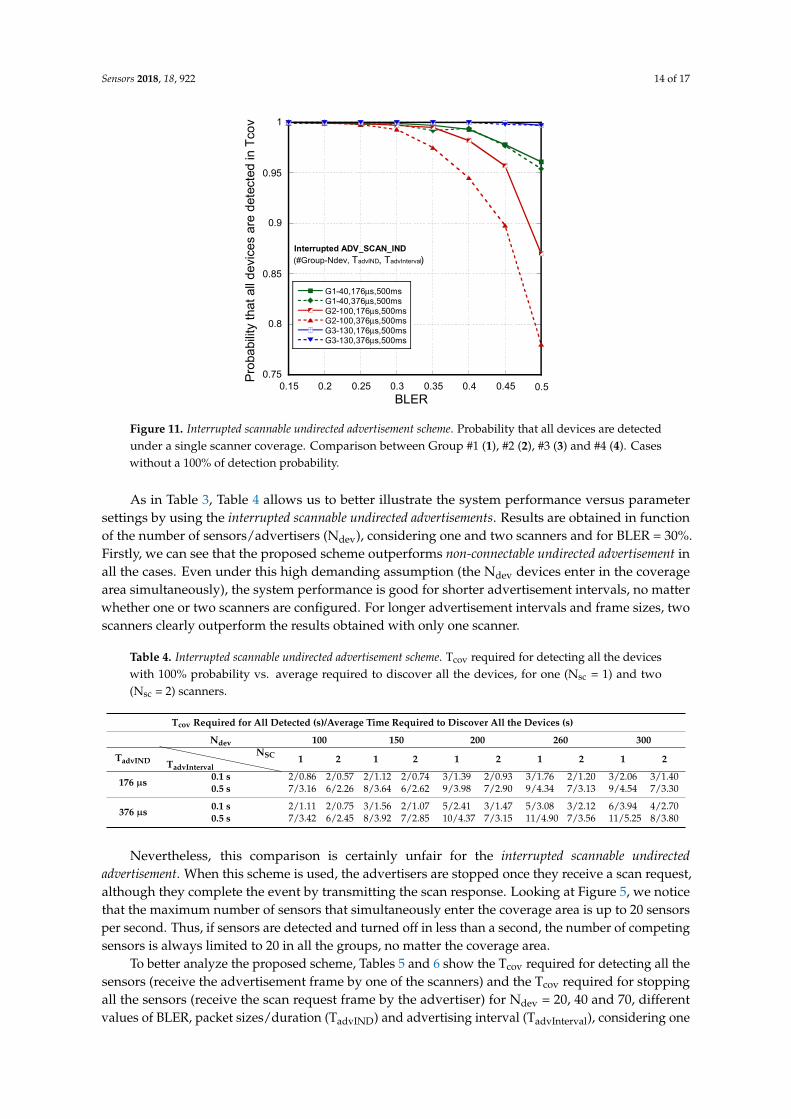
First, as with non-connectable undirected advertisement, the performance of the system has beenevaluated for each of the four athlete groups highlighted in Figure 4. In this case, taking in considerationan unrealistic but high demanding assumption, the number of devices Ndev are assumed to arrivesimultaneously in the coverage area. Under this assumption, Figure 11 shows the probability that allthe devices are detected when only one scanner is used. Figure 11 only represents the cases without a100% of detection probability. The probability when two scanners are considered is 100% in all thecases. By comparing Figures 10 and 11, we can obtain similar conclusions about system parametersettings. For longer advertisement intervals, channel errors and collisions make very difficult thesuccessful reception of the frames in short Tcov. A lower coverage radio (R = 12.5 m), even though alower number of devices is under coverage, may not guarantee the application requirements.
Sensors 2018, 18, 922 14 of 17
Sensors 2018, 18, x FOR PEER REVIEW 14 of 17
Figure 11. Interrupted scannable undirected advertisement scheme. Probability that all devices are detected under a single scanner coverage. Comparison between Group #1 (1), #2 (2), #3 (3) and #4 (4). Cases without a 100% of detection probability.
As in Table 3, Table 4 allows us to better illustrate the system performance versus parameter settings by using the interrupted scannable undirected advertisements. Results are obtained in function of the number of sensors/advertisers (Ndev), considering one and two scanners and for BLER = 30%. Firstly, we can see that the proposed scheme outperforms non-connectable undirected advertisement in all the cases. Even under this high demanding assumption (the Ndev devices enter in the coverage area simultaneously), the system performance is good for shorter advertisement intervals, no matter whether one or two scanners are configured. For longer advertisement intervals and frame sizes, two scanners clearly outperform the results obtained with only one scanner.
Table 4. Interrupted scannable undirected advertisement scheme. Tcov required for detecting all the devices with 100% probability vs average required to discover all the devices, for one (Nsc = 1) and two (Nsc = 2) scanners.
Tcov Required for All Detected (s)/Average Time Required to Discover All the Devices (s) Ndev 100 150 200 260 300
TadvIND NSC
TadvInterval 1 2 1 2 1 2 1 2 1 2
176 µs 0.1 s 2/0.86 2/0.57 2/1.12 2/0.74 3/1.39 2/0.93 3/1.76 2/1.20 3/2.06 3/1.40 0.5 s 7/3.16 6/2.26 8/3.64 6/2.62 9/3.98 7/2.90 9/4.34 7/3.13 9/4.54 7/3.30
376 µs 0.1 s 2/1.11 2/0.75 3/1.56 2/1.07 5/2.41 3/1.47 5/3.08 3/2.12 6/3.94 4/2.70 0.5 s 7/3.42 6/2.45 8/3.92 7/2.85 10/4.37 7/3.15 11/4.90 7/3.56 11/5.25 8/3.80
Nevertheless, this comparison is certainly unfair for the interrupted scannable undirected advertisement. When this scheme is used, the advertisers are stopped once they receive a scan request, although they complete the event by transmitting the scan response. Looking at Figure 5, we notice that the maximum number of sensors that simultaneously enter the coverage area is up to 20 sensors per second. Thus, if sensors are detected and turned off in less than a second, the number of competing sensors is always limited to 20 in all the groups, no matter the coverage area.
To better analyze the proposed scheme, Tables 5 and 6 show the Tcov required for detecting all the sensors (receive the advertisement frame by one of the scanners) and the Tcov required for stopping all the sensors (receive the scan request frame by the advertiser) for Ndev = 20, 40 and 70, different values of BLER, packet sizes/duration (TadvIND) and advertising interval (TadvInterval), considering one and two scanners, respectively. Both values are integers because we have considered a granularity of one second. Tcov required for stopping all the sensors can be equal or higher to the
G1-40,176μs,500msG1-40,376μs,500msG2-100,176μs,500msG2-100,376μs,500msG3-130,176μs,500msG3-130,376μs,500ms
Pro
babi
lity
that
all
devi
ces
are
dete
cted
in T
cov
BLER
(#Group-Ndev, TadvIND, TadvInterval)Interrupted ADV_SCAN_IND
0.75
0.8
0.85
0.9
0.95
1
0.15 0.2 0.25 0.3 0.35 0.4 0.45 0.5
Figure 11. Interrupted scannable undirected advertisement scheme. Probability that all devices are detectedunder a single scanner coverage. Comparison between Group #1 (1), #2 (2), #3 (3) and #4 (4). Caseswithout a 100% of detection probability.
As in Table 3, Table 4 allows us to better illustrate the system performance versus parametersettings by using the interrupted scannable undirected advertisements. Results are obtained in functionof the number of sensors/advertisers (Ndev), considering one and two scanners and for BLER = 30%.Firstly, we can see that the proposed scheme outperforms non-connectable undirected advertisement inall the cases. Even under this high demanding assumption (the Ndev devices enter in the coveragearea simultaneously), the system performance is good for shorter advertisement intervals, no matterwhether one or two scanners are configured. For longer advertisement intervals and frame sizes, twoscanners clearly outperform the results obtained with only one scanner.
Table 4. Interrupted scannable undirected advertisement scheme. Tcov required for detecting all the deviceswith 100% probability vs. average required to discover all the devices, for one (Nsc = 1) and two(Nsc = 2) scanners.
Tcov Required for All Detected (s)/Average Time Required to Discover All the Devices (s)
Ndev 100 150 200 260 300
TadvIND 1 2 1 2 1 2 1 2 1 2TadvInterval
NSC
176 µs 0.1 s 2/0.86 2/0.57 2/1.12 2/0.74 3/1.39 2/0.93 3/1.76 2/1.20 3/2.06 3/1.400.5 s 7/3.16 6/2.26 8/3.64 6/2.62 9/3.98 7/2.90 9/4.34 7/3.13 9/4.54 7/3.30
376 µs 0.1 s 2/1.11 2/0.75 3/1.56 2/1.07 5/2.41 3/1.47 5/3.08 3/2.12 6/3.94 4/2.700.5 s 7/3.42 6/2.45 8/3.92 7/2.85 10/4.37 7/3.15 11/4.90 7/3.56 11/5.25 8/3.80
Nevertheless, this comparison is certainly unfair for the interrupted scannable undirectedadvertisement. When this scheme is used, the advertisers are stopped once they receive a scan request,although they complete the event by transmitting the scan response. Looking at Figure 5, we noticethat the maximum number of sensors that simultaneously enter the coverage area is up to 20 sensorsper second. Thus, if sensors are detected and turned off in less than a second, the number of competingsensors is always limited to 20 in all the groups, no matter the coverage area.
To better analyze the proposed scheme, Tables 5 and 6 show the Tcov required for detecting all thesensors (receive the advertisement frame by one of the scanners) and the Tcov required for stoppingall the sensors (receive the scan request frame by the advertiser) for Ndev = 20, 40 and 70, differentvalues of BLER, packet sizes/duration (TadvIND) and advertising interval (TadvInterval), considering one
Sensors 2018, 18, 922 15 of 17
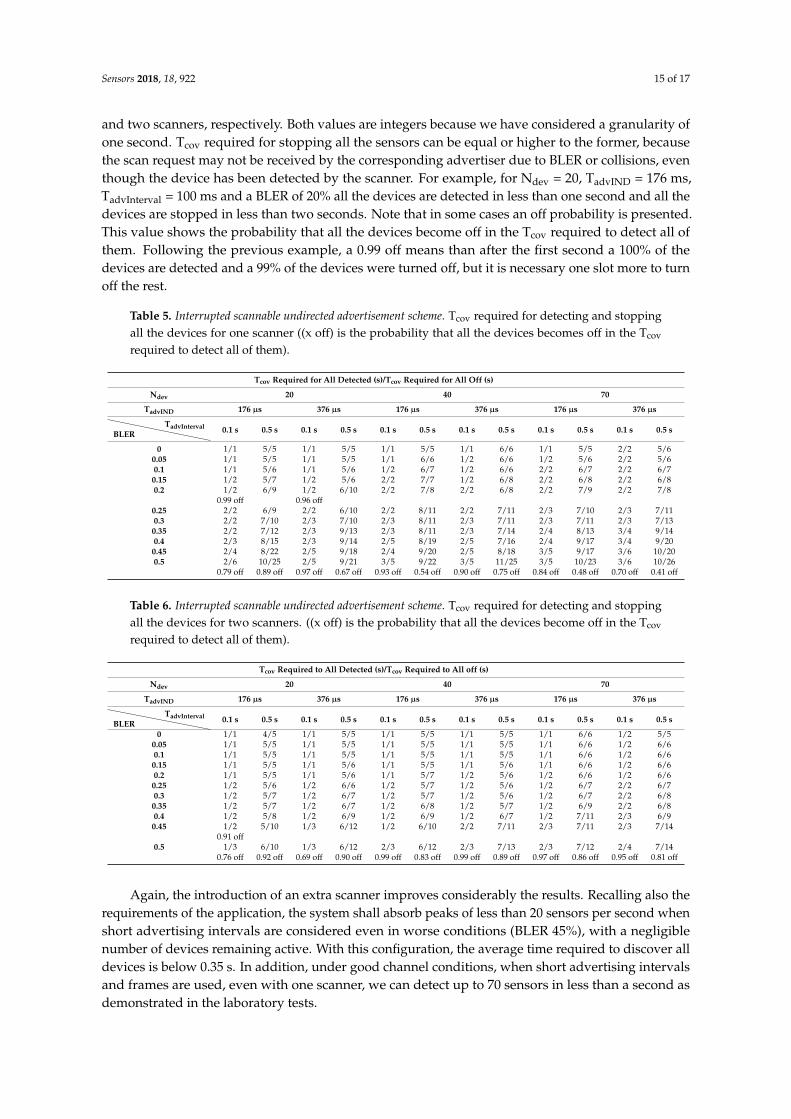
and two scanners, respectively. Both values are integers because we have considered a granularity ofone second. Tcov required for stopping all the sensors can be equal or higher to the former, becausethe scan request may not be received by the corresponding advertiser due to BLER or collisions, eventhough the device has been detected by the scanner. For example, for Ndev = 20, TadvIND = 176 ms,TadvInterval = 100 ms and a BLER of 20% all the devices are detected in less than one second and all thedevices are stopped in less than two seconds. Note that in some cases an off probability is presented.This value shows the probability that all the devices become off in the Tcov required to detect all ofthem. Following the previous example, a 0.99 off means than after the first second a 100% of thedevices are detected and a 99% of the devices were turned off, but it is necessary one slot more to turnoff the rest.
Table 5. Interrupted scannable undirected advertisement scheme. Tcov required for detecting and stoppingall the devices for one scanner ((x off) is the probability that all the devices becomes off in the Tcov
required to detect all of them).
Tcov Required for All Detected (s)/Tcov Required for All Off (s)
Ndev 20 40 70
TadvIND 176 µs 376 µs 176 µs 376 µs 176 µs 376 µs
0.1 s 0.5 s 0.1 s 0.5 s 0.1 s 0.5 s 0.1 s 0.5 s 0.1 s 0.5 s 0.1 s 0.5 sBLERTadvInterval
0 1/1 5/5 1/1 5/5 1/1 5/5 1/1 6/6 1/1 5/5 2/2 5/60.05 1/1 5/5 1/1 5/5 1/1 6/6 1/2 6/6 1/2 5/6 2/2 5/60.1 1/1 5/6 1/1 5/6 1/2 6/7 1/2 6/6 2/2 6/7 2/2 6/7
0.15 1/2 5/7 1/2 5/6 2/2 7/7 1/2 6/8 2/2 6/8 2/2 6/80.2 1/2 6/9 1/2 6/10 2/2 7/8 2/2 6/8 2/2 7/9 2/2 7/8
0.99 off 0.96 off0.25 2/2 6/9 2/2 6/10 2/2 8/11 2/2 7/11 2/3 7/10 2/3 7/110.3 2/2 7/10 2/3 7/10 2/3 8/11 2/3 7/11 2/3 7/11 2/3 7/13
0.35 2/2 7/12 2/3 9/13 2/3 8/11 2/3 7/14 2/4 8/13 3/4 9/140.4 2/3 8/15 2/3 9/14 2/5 8/19 2/5 7/16 2/4 9/17 3/4 9/20
0.45 2/4 8/22 2/5 9/18 2/4 9/20 2/5 8/18 3/5 9/17 3/6 10/200.5 2/6 10/25 2/5 9/21 3/5 9/22 3/5 11/25 3/5 10/23 3/6 10/26
0.79 off 0.89 off 0.97 off 0.67 off 0.93 off 0.54 off 0.90 off 0.75 off 0.84 off 0.48 off 0.70 off 0.41 off
Table 6. Interrupted scannable undirected advertisement scheme. Tcov required for detecting and stoppingall the devices for two scanners. ((x off) is the probability that all the devices become off in the Tcov
required to detect all of them).
Tcov Required to All Detected (s)/Tcov Required to All off (s)
Ndev 20 40 70
TadvIND 176 µs 376 µs 176 µs 376 µs 176 µs 376 µs
0.1 s 0.5 s 0.1 s 0.5 s 0.1 s 0.5 s 0.1 s 0.5 s 0.1 s 0.5 s 0.1 s 0.5 sBLERTadvInterval
0 1/1 4/5 1/1 5/5 1/1 5/5 1/1 5/5 1/1 6/6 1/2 5/50.05 1/1 5/5 1/1 5/5 1/1 5/5 1/1 5/5 1/1 6/6 1/2 6/60.1 1/1 5/5 1/1 5/5 1/1 5/5 1/1 5/5 1/1 6/6 1/2 6/6
0.15 1/1 5/5 1/1 5/6 1/1 5/5 1/1 5/6 1/1 6/6 1/2 6/60.2 1/1 5/5 1/1 5/6 1/1 5/7 1/2 5/6 1/2 6/6 1/2 6/6
0.25 1/2 5/6 1/2 6/6 1/2 5/7 1/2 5/6 1/2 6/7 2/2 6/70.3 1/2 5/7 1/2 6/7 1/2 5/7 1/2 5/6 1/2 6/7 2/2 6/8
0.35 1/2 5/7 1/2 6/7 1/2 6/8 1/2 5/7 1/2 6/9 2/2 6/80.4 1/2 5/8 1/2 6/9 1/2 6/9 1/2 6/7 1/2 7/11 2/3 6/9
0.45 1/2 5/10 1/3 6/12 1/2 6/10 2/2 7/11 2/3 7/11 2/3 7/140.91 off
0.5 1/3 6/10 1/3 6/12 2/3 6/12 2/3 7/13 2/3 7/12 2/4 7/140.76 off 0.92 off 0.69 off 0.90 off 0.99 off 0.83 off 0.99 off 0.89 off 0.97 off 0.86 off 0.95 off 0.81 off
Again, the introduction of an extra scanner improves considerably the results. Recalling also therequirements of the application, the system shall absorb peaks of less than 20 sensors per second whenshort advertising intervals are considered even in worse conditions (BLER 45%), with a negligiblenumber of devices remaining active. With this configuration, the average time required to discover alldevices is below 0.35 s. In addition, under good channel conditions, when short advertising intervalsand frames are used, even with one scanner, we can detect up to 70 sensors in less than a second asdemonstrated in the laboratory tests.
Sensors 2018, 18, 922 16 of 17
We can conclude that interrupted scannable undirected advertisement is clearly the best implementationalternative for all the cases, no matter the coverage area and the runner speed. On the other hand, it isimportant to remark that the scheme is more flexible to handle the presence under coverage of runnerswith different speeds. For instance, group 4 is associated to the pass through the 5 km checkpoint of aslow runner group. However, it may be possible that a runner assigned to one group actually does notbelong to it. For example, a runner passing with group 4 at the 5 km checkpoint, may have startedthe race at the last positions and the speed of this runner is significantly higher. In this case, whennon-connectable undirected advertisement is used, this sensor may not be detected because it passes toofast through the coverage area and there are too many interferences from the rest of the sensors insidethe coverage area avoiding its detection. Nevertheless, stopping the advertisers once they are detectedcan solve this problem.
6. Conclusions
Throughout the paper we have seen that the use of BLE as a supplementary system to the currentRFID solutions or even as an alternative is completely viable. One disadvantage of our proposalis that RFID systems usually employ passive sensors, whereas ours are active, although the energyconsumption of the sensors is very low and they only require a minimum maintenance.
Substituting the sensors worn by the runners by Bluetooth advertisers allows to use a simplesmartphone with an application as a detector. These sensors can send not only identification data,but also additional data, such as blood oxygen levels, cardiovascular monitoring, etc.
The smartphone application synchronizes all data using GPS/GLONASS/GALILEO and mayemploy 3G/4G or Wi-Fi networks to communicate the data to the central server. This configurationenables new services which can be offered to the users: live tracking of the race by friends and family,medical monitoring of the participants, reduction of possible cheating during the race, etc.
The proposed solutions allow for an easier deployment reducing the race costs. The system is ableto detect a high number of devices, fulfilling the requirements present in real races. Additionally, wehave demonstrated that with the use of a second smartphone in the same area we are able to increasethe detection reliability.
Acknowledgments: This work has been supported in part by the MINECO/FEDER under the projectsTEC2014-58341-C4-2-R and TEC2014-60258-C2-2-R.
Author Contributions: All authors have contributed in all of the sections of the paper. Specially: Jose Luis Valenzuelaconceived the application; David Perez-Diaz-de-Cerio and Jose Luis Valenzuela designed the experiments andobtained the experimental data; Ángela Hernández-Solana and Antonio Valdovinos designed the analysis bysimulation, developed the simulation tool and obtained the results. All authors contributed to the analysis of theresults and wrote the paper. All authors read and approved the final manuscript.
Conflicts of Interest: The authors declare no conflict of interest.
References
1. Running USA. U.S. Road Race Trends. 2017. Available online: http://www.runningusa.org/2017-us-road-race-trends (accessed on 28 December 2017).
2. ChampionChip: Home. Available online: http://www.championchip.com.my/home/ (accessed on14 February 2018).
3. Innovative Timing Systems. Jaguar RFID Chip Race Timing Products. Available online: http://www.innovativetimingsystems.com/ (accessed on 14 March 2018).
4. Race Result AG. Timing and Scoring of Sports Events. Available online: https://www.raceresult.com/en/home/index.php (accessed on 14 March 2018).
5. Joolrat, S.; Saikaew, K.R.; Tengrungroj, M.; Jiranuwattanawong, P.; Janpanich, C.; Sornsakda, K. RFID dataprocessing in a real-time monitoring system for marathons. Eng. Appl. Sci. Res. 2016, 43, 94–99.
Sensors 2018, 18, 922 17 of 17
6. Satitsuksanoh, P.; Jiamthapthaksin, R.; Kim, S.W.; Setthawong, P. A cost-effective interactive platform forthe management of a small scale lap-based jogging competition using low-frequency RFID technology.In Proceedings of the 2017 3rd International Conference on Science in Information Technology (ICSITech),Bandung, Indonesia, 25–26 October 2017; pp. 360–365.
7. Alesii, R.; Di Marco, P.; Santucci, F.; Savazzi, P.; Valentini, R.; Vizziello, A. Backscattering UWB/UHFhybrid solutions for multi-reader multi-tag passive RFID systems. EURASIP J. Embed. Syst. 2016, 2016, 10.[CrossRef]
8. Subedi, S.; Pauls, E.; Zhang, Y.D. Accurate Localization and Tracking of a Passive RFID Reader Based onRSSI Measurements. IEEE J. Radio Freq. Identif. 2017, 1, 144–154. [CrossRef]
9. Basalamah, A. Sensing the Crowds Using Bluetooth Low Energy Tags. IEEE Access 2016, 4, 4225–4233.[CrossRef]
10. Jeon, W.S.; Dwijaksara, M.H.; Jeong, D.G. Performance Analysis of Neighbor Discovery Process in BluetoothLow Energy Networks. IEEE Trans. Veh. Technol. 2016, 66, 1865–1871. [CrossRef]
11. Cho, K.; Park, G.; Cho, W.; Seo, J.; Han, K. Performance analysis of device discovery of Bluetooth Low Energy(BLE) networks. Comput. Commun. 2015, 81, 72–85. [CrossRef]
12. Hernández-Solana, Á.; Perez-Diaz-de-Cerio, D.; Valdovinos, A.; Valenzuela, J.L. Proposal and Evaluation ofBLE Discovery Process Based on New Features of Bluetooth 5.0. Sensors 2017, 17, 1988. [CrossRef] [PubMed]
13. Perez Diaz de Cerio, D.; Hernandez, A.; Valenzuela, J.L.; Valdovinos, A. Analytical and experimentalperformance evaluation of BLE neighbor discovery process including non-idealities of real chipsets. Sensors2017, 17, 499. [CrossRef] [PubMed]
14. Harris, K.M.; Creswell, L.L.; Haas, T.S.; Thomas, T.; Tung, M.; Isaacson, E.; Garberich, R.F.; Maron, B.J. Deathand Cardiac Arrest in U.S. Triathlon Participants, 1985 to 2016. Ann. Intern. Med. 2017, 167, 529. [CrossRef][PubMed]
15. Waite, O.; Smith, A.; Madge, L.; Spring, H.; Noret, N. Sudden cardiac death in marathons: A systematicreview. Phys. Sportsmed. 2016, 44, 79–84. [CrossRef] [PubMed]
16. Gomez, C.; Oller, J.; Paradells, J. Overview and Evaluation of Bluetooth Low Energy: An EmergingLow-Power Wireless Technology. Sensors 2012, 12, 11734–11753. [CrossRef]
17. Bluetooth SIG. Bluetooth Core Specification 5.0. Available online: https://www.bluetooth.com/specifications/adopted-specifications (accessed on 15 August 2017).
18. ChampionChip. Barcelona Marathon Results. 2017. Available online: https://xipgroc.cat/ca/curses/MaratoBCN2017/42k/resultats (accessed on 19 February 2018).
19. Red Bear Company. BLE Nano. Available online: http://redbearlab.com/blenano/ (accessed on 14 March 2018).
© 2018 by the authors. Licensee MDPI, Basel, Switzerland. This article is an open accessarticle distributed under the terms and conditions of the Creative Commons Attribution(CC BY) license (http://creativecommons.org/licenses/by/4.0/).