alumni entrepreneurs druid€¦ · since 2014, data analytics firm pitchbook has produced rankings...
TRANSCRIPT
Paper to be presented at DRUID19Copenhagen Business School, Copenhagen, Denmark
June 19-21, 2019
Creating High-Potential Alumni Entrepreneurs: The Imprinting Effect of Student WorkTerms
Margaret DalzielUniversity of Waterloo
Conrad School of Entrepreneurship and [email protected]
Nada BasirUniversity of Waterloo
Conrad School of Entrepreneurship and [email protected]
AbstractHow do high-potential young entrepreneurs identify promising entrepreneurial opportunities? Weinvestigate the technological antecedents of the equity-financed ventures founded by University ofWaterloo (UW) alumni entrepreneurs identified by Pitchbook, a consultancy. UW operates Canada’sfirst and the world’s largest cooperative education program, and ranks highly in the Pitchbook rankingof entrepreneurial universities. Our hypothesis is that student work terms will have an imprintingeffect on the ventures of alumni entrepreneurs. Based on an analysis of the references of over 150,000US patents, and employing a proven knowledge proximity measure, we find that the patent portfoliosof alumni ventures are more proximate to the patent portfolios of work term employers than to thoseof control group firms. Our tracing of the technological imprinting effects of student work terms onsubsequently-founded ventures provides objective evidence of the unanticipated entrepreneurship-related impacts of a program designed for other purposes.

Creating High-Potential Alumni Entrepreneurs
Creating High-Potential Alumni Entrepreneurs: The Imprinting Effect of Student Work Terms
Most jurisdictions invest in business incubators and accelerators in the interests of
supporting entrepreneurs and fostering economic development and job creation. Despite high
hopes, results on the effectiveness of programs is mixed (Amezcua, 2010; Cumming & Fischer,
2012). Variability in the performance of graduating firms is due, in no small part, to variability
in the quality of incoming entrepreneurial teams and their ideas. Asymmetrical information on
business possibilities is essential to the discovery of opportunities (Shane, 2000; Shane &
Venkataraman, 2000), and while mature entrepreneurs benefit from prior experience as an
entrepreneur, employee, or user (Agarwal et al., 2004; Westhead et al., 2009; Shah & Tripsas,
2007), for many young entrepreneurs, their only exposure to the world of business, health care,
or transportation is as a consumer, patient, or passenger. In cases where an initial idea is
wanting, the prospects of a successful venture may remain limited despite pivots and enabling
inputs such as coaching and financing. An important question is therefore: How can young
entrepreneurs get good ideas?
We begin with a sample of alumni entrepreneurs that have been identified as having raised
venture capital financing by Pitchbook, a venture capital (VC) analytics firm, and investigate the
sources of their ideas, focusing on the work terms in which they engaged while undergraduate
students. Our hypothesis is that student work terms will have an imprinting effect on the
ventures of alumni entrepreneurs. Our sample of alumni entrepreneurs are graduates of the
University of Waterloo (UW), in Canada. UW has been identified as an exceptional university
due to its inventor-owned intellectual property policy (Kenney & Patton, 2009) and its effect on
local economic development (Bramwell & Wolfe, 2008). According to Pitchbook, UW ranks 1st

Creating High-Potential Alumni Entrepreneurs
in Canada and 21st in the world in terms of its ability to produce VC-funded alumni
entrepreneurs (Pitchbook, 2018).
We analyze the technological antecedents of the ventures of the UW alumni entrepreneurs
identified by Pitchbook. Restricting our analysis to the ventures with patents, we hypothesize
that the student’s work term employment experiences will have a technological imprinting effect
on their ventures. Specifically, we hypothesize that the patent portfolios of the alumni ventures
will be more proximate to the patent portfolios of their work term employers than to those of
control group firms. Our sample consists of 157 employer-venture pairs and up to 413 control
group firm-venture pairs. We use over 150,000 USTPO patents to test our hypotheses, finding
support.
Our contributions are four. First, while entrepreneurship scholars investigating
opportunity identification acknowledge the importance of available opportunities and
asymmetric information relevant to those opportunities (Shane, 2000; Shane & Venkataraman,
2000), there is little empirical evidence on the relationship between idea sources and subsequent
ventures, likely because of the fluid and tacit nature of the ideation process. To this literature we
contribute evidence of the technological antecedents of a sample of VC-backed ventures, based
on an examination of patents and their references (backward citations). Second, in so doing, we
bring knowledge proximity measures, frequently used in studies of technological diversification
and clustering, to the field of entrepreneurship and demonstrate the use of a knowledge
proximity measure of proven reliability (Yan & Luo, 2017). Third, for the imprinting literature
we provide evidence of a novel source of imprinting and the first consideration of the minimum
magnitude of the “stamping” (Ellis et al., 2017) required for an imprinting effect. Finally, for

Creating High-Potential Alumni Entrepreneurs
policy makers interested in enhancing the viability of the ventures of young entrepreneurs, we
point to the potential of cooperative education programs in enabling entrepreneurship, while
simultaneously preparing students for the workforce and providing employers with fresh talent.
In the next section we present the Pitchbook rankings of the top 50 universities in terms of
VC-financed alumni entrepreneurs and regress the rankings on indicators of university size,
quality, and wealth and the entrepreneurialness of the ecosystem in which the university is
located. This allows us to identify outlier universities, one of which is UW, whose ability to
create VC-financed entrepreneurs exceeds the expectations of our model. We then describe UW
and its mission to “connect with industry”, focusing on its commitment to cooperative education
(Needles, 1956). In our theory section we explain why we expect student work terms to have an
imprinting effect on subsequently founded ventures. We then describe our methods and results
and conclude with a discussion of the contributions and limitations of our work, and possibilities
for future research.
The Pitchbook Rankings
Since 2014, data analytics firm Pitchbook has produced rankings of the top 50 universities
by the number of alumni entrepreneurs that attract VC-financing. Not surprisingly, universities
such as Stanford, the University of California (Berkeley), MIT, and Harvard are consistently at
the top of the list (Pitchbook, 2016, 2018). Jurisdictions that want to leverage the power of
universities to promote entrepreneurship and economic development might ask themselves, why
are some universities better than others at producing VC-backed entrepreneurs?
We respond to this question by regressing the Pitchbook measures on a number of
variables that might be expected to have an association with a university’s ability to produce VC-

Creating High-Potential Alumni Entrepreneurs
backed entrepreneurs. Several of variables that we consider, particularly the measures of
university wealth and the entrepreneurialness of the ecosystem, are co-evolutionary with the
ability of a university to produce VC-backed entrepreneurs, and so we claim only association,
not causation. For example, while a large endowment will allow the university to provide
enhanced opportunities for its students, including those who later become entrepreneurs, a
university that is good at producing entrepreneurs might have several wealthy individuals among
its alumni who enrich its endowment.
The Pitchbook rankings provide three indicators of a university’s ability to produce VC-
backed entrepreneurs: the number of VC-financed entrepreneurs amongst its alumni, the number
of VC-backed ventures founded by alumni entrepreneurs, and the total amount of VC raised by
the entrepreneurs. The 2016 rankings that we use in our analysis consider VC raised between
January 1st 2006 and August 16th, 2016. We consider university size (number of students;
number of faculty), age, wealth (endowment; annual budget per student), and quality (Shanghai
Jiao Tong Ranking (2017)-reverse coded; R&D funding), as well as the entrepreneurialness of
the ecosystem in which the university is embedded (Startup Genome Ranking (2017)-reverse
coded). We used the annual reports of universities and compilations of university statistics to
gather data and we center all variables and log skewed variables to avoid biasing our results
(Kraemer & Blasey, 2004). Table 1 provides the descriptive statistics and Table 2 shows the
results.
*************************** Insert Tables 1 and 2 about here. ***************************

Creating High-Potential Alumni Entrepreneurs
With an adjusted R2s of 0.50, 0.52, and 0.54, our models explain much of the variability in
the ability of universities to produce VC-backed entrepreneurs. Significant explanatory variables
in all three models are endowment, annual budget per student, and Startup Genome Ranking.
Our results show that universities with money, and regional entrepreneurial success, are better at
producing VC-backed entrepreneurs than less well-endowed (literally) universities.
These results are not especially helpful to jurisdictions that want to bootstrap the
entrepreneurial capacity of their university and so we give further consideration to universities
who out-perform the predictions of our models. Table 3 shows the top 10 universities in terms of
the difference between the actual values of the Pitchbook indicators and the values predicted by
our model. Some of the universities shown in Table 3 score highly both in terms of the actual
values of the Pitchbook indicators, and in terms of the degree to which the actual values exceed
the values predicted by our models. These universities, such as the University of California
(Berkeley) and Stanford, both in Silicon Valley, are the stars of entrepreneurship world and
clearly our model fails to capture the full range of their assets. Other universities, such as
Cornell, Michigan, and the University of Maryland are strong US universities located in regions
that do not score highly in terms of entrepreneurialness. The final group of universities that
appear in each of the three tables in Table 3 are non-US universities, the University of Waterloo,
in Canada, and Trinity College Dublin, in Ireland.
********************* Insert Table 3 about here. ********************* Only eight non-US universities appear in the Pitchbook ranking of the top universities for
VC-backed entrepreneurs (Pitchbook 2016, 2018). In 2016, these included four Canadian
universities (Waterloo, #20; McGill University, #32; the University of Toronto, tied for #33; the

Creating High-Potential Alumni Entrepreneurs
University of British Columbia, #49); three Israeli universities (Tel Aviv University #9; the
Technion, #16; Hebrew University, tied for #33), and one Irish university (Trinity College
Dublin, #48). The nationalities of these universities reflect the countries, outside the US, China,
and India, where venture capital is relatively available (World Economic Forum, 2015). It is
likely that the Pitchbook ranking does not fully capture the performance of universities outside
North America and Israel. Given the relatively high placement of the University of Waterloo,
both in the Pitchbook ranking and in our ranking of universities by the degree to which their
actual performance exceeds their predicted performance, it seems reasonable to ask: What’s in
the water in Waterloo?
The University of Waterloo
I also spoke with Sam Altman, the president of Y Combinator, one of the best-known providers of first-step seed money for tech start-ups. I asked him if any one school stood out in terms of students and graduates whose ideas took off. “Yes,” he responded, and I was sure of the name I’d hear next: Stanford. It’s his alma mater, though he left before he graduated, and it’s famous as a feeder of Silicon Valley success. But this is what he said: “The University of Waterloo.” (Frank Bruni, The New York Times, 2015)
UW was founded in 1957 on the initiative of industrialists who perceived an urgent need
for engineers and technicians on the part of Canadian industry. In his 1956 speech, Ira Needles,
president of BF Goodrich Canada, a tire company, described the Waterloo Plan (Needles, 1956).
With the collaboration of Canadian industry, the university would offer a cooperative education
program in which students alternated between academic semesters and semesters working for
companies in the region and across Canada. Cooperative education programs were offered in
Europe and the US, but UW’s was the first cooperative education program in Canada
(McLaughlin, 2015). It is now the world’s largest cooperative program with over 20,000

Creating High-Potential Alumni Entrepreneurs
placements per year (UW Cooperative Education Annual Report, 2018). For students,
cooperative education provides hands-on experience and income, for the employer companies it
provides apprentice employees, and once the students graduate, employees with both academic
training and experience. It would also be economical for the University, as it could train twice as
many students with the same buildings and equipment, given that students would spend alternate
semesters off campus.
While the UW cooperative education approach was initially regarded with derision by
some, it has proven popular with both students and employers and the uniqueness of the
university and the region has come to attract the attention of researchers (Bramwell et al., 2008;
Bramwell & Wolfe, 2008; Colapinto, 2007; Kenney & Patton, 2009; Nelles et al., 2005).
Bramwell and Wolfe (2008) described the ways in which UW contributes to the regional
economy, pointing to the importance of the cooperative education program in this regard.
Kenney and Patton (2009) show that, relative to five US schools of a similar size and R&D
intensity, UW generates more spin-offs. They credit UW’s inventor-owned intellectual property
(IP) policy for this exceptional performance. But while few US schools have inventor-owned IP
policies such policies are not uncommon in Canada and Europe (Asterbro et al., 2012). And
while an inventor-owned IP policy can be expected to incentivize faculty and staff spin-offs, it is
unlikely to have a direct effect on ventures launched by undergraduate students who generally do
not conduct funded research and who have no obligation or incentive to report their business
activities. We believe that it is UW’s cooperative education program that explains its ability to
produce VC-backed entrepreneurs.

Creating High-Potential Alumni Entrepreneurs
Cooperative Education and Alumni Entrepreneurs
How and why some people, and not others, identify entrepreneurial opportunities is one of
the fundamental questions of entrepreneurship research (Shane & Venkataraman, 2000).
Information asymmetries that arise as a consequence of past experiences that vary across
individuals are part of the explanation (Ardichvili et al., 2003; Shane, 2000). Former work
experience provides entrepreneurs with knowledge of technological solutions, customer
preferences, and business practices (Agarwal et al., 2004; Sapienza et al., 2004), prior experience
as an entrepreneur with superior opportunity identification capabilities (Westhead et al., 2009),
and in some industries, it is prior experience as a user that is critical to understanding the
importance of the problem and the nature of potential solutions (Shah & Tripsas, 2007; von
Hippel, 1986).
We focus on the learning effects of student work terms and draw on imprinting theory to
characterize the process. Stinchcombe (1965) is credited with the first articulation of imprinting
theory, although he did not refer to it as such. Stinchcombe observed that new organizations are
shaped by the social and institutional environment to which they are exposed, and that the effect
may persist over the lifetime of the organization, explaining similarities amongst the behaviours
of firms in the same industry that were founded in the same era. In a review of the imprinting
literature, Marquis and Tilcsik (2013: 201), define imprinting as “a process whereby, during a
brief period of susceptibility, a focal entity develops characteristics that reflect prominent
features of the environment, and these characteristics continue to persist despite significant
environmental changes in subsequent periods.”

Creating High-Potential Alumni Entrepreneurs
Imprinting is not the passive absorption of environmental conditions but depends on the
agency of entrepreneurs. Documenting the creation of the Paris Opera, Johnson (2007) shows
that cultural entrepreneurs, including both founders and influential stakeholders, select the
elements of the environment that shape the new organization. Research explaining the
persistence of initial condition effects shows that the proclivity of Israeli entrepreneurs in the
ICT (information and communications sector) to found ventures is influenced by the proclivity
of ancestor entrepreneurs (founders of the parent firm) to found ventures (Ellis et al., 2017).
Imprinting has been shown to affect organizational strategy and target markets (Boeker, 1988),
patterns of employment (Hannan et al., 1996), organizational networks (Marquis, 2003), the
capabilities of spin-offs (Agarwal et al., 2004; Sapienza et al., 2004), entrepreneurial exit
(DeTienne, 2010), entrepreneurial decision-making (Mathias et al., 2015), and the commercial
orientation of scientists (Azoulay et al., 2017).
Research is silent on the extent of exposure to a particular environment that is required for
imprinting to have an effect. The post-docs in Azoulay et al.’s study of the effect of academic
supervisor patenting on the subsequent patenting behaviour of the post-doc, are the in post-doc
relationship for a median of five years (Azoulay et al., 2017). Similarly, the entrepreneurs in
Ellis et al.’s study of entrepreneurial proclivity and in Agarwal et al.’s study of spin-offs are in
the working relationship with the ancestor entrepreneurs for multiple years (Agarwal et al., 2004;
Ellis et al., 2017). In our case, the imprinting period is only four months long, and there are
multiple work terms and multiple academic terms—layers of imprint (Marquis and Tilcsik,
2013)—at play, all of which may or may not have an imprinting effect.

Creating High-Potential Alumni Entrepreneurs
We use information within patents to trace the technological imprinting of work term
employment on alumni entrepreneurs. Patent counts and citation-weighted patent counts have
been used to measure (Zucker et al., 2002) and predict (Shane & Stuart, 2002) entrepreneurial
success. Within the imprinting literature, Azoulay et al. (2017) show that scientists that do post-
docs with academic supervisors who patent are more likely to patent. We go beyond an
examination of the propensity to patent or a count of the number of patents, to consider the
similarity of venture and work term employer patent portfolios. While an invention is, by
definition, novel, it builds upon previous knowledge. We consider the similarity in backward
citations, that is, the degree to which employer and venture patents reference the same
previously-patented inventions, as an objective indicator of technology imprinting. Such
knowledge proximity measures have been used to examine the diversification and technological
trajectories of firms (Breschi et al., 2003; Luo et al., 2017) and cities (Boschma et al., 2014;
Rigby, 2015), and the effect of research consortia on participating firms (Branstetter &
Sakakibara, 2002). If the venture builds on knowledge bases that are distinct from those of the
work term employer, then the set of references in common will be modest, relative to the total set
of references of the two patent portfolios. But if the knowledge bases are overlapping, then there
will likely be a substantial number of patents that are referenced by both the patents of the
venture and those of the work term employer. Formally,
Hypothesis 1: The patent portfolio of the venture will be closer to the patent portfolio of the entrepreneur’s work term employer than it will be to the patent portfolio of a similar firm with which the entrepreneur did not have a working relationship.
We also expect a dosage effect, that is, that later work terms and multiple work terms at
the same employer will have a greater imprinting effect. First, while the entrepreneurs-to-be are
smart and often well-versed technologically, they may lack the absorptive capacity (Cohen &

Creating High-Potential Alumni Entrepreneurs
Levinthal, 1990) required to internalize the specific technologies under development at the work
term employer. We expect that the capacity of students to learn from work terms will increase
over time such that later work terms will be more impactful than earlier work terms. Second,
more time with the same employer will enable greater transmission of knowledge and
perspectives, and an employer that provides a good learning opportunity is both more likely to
attract returning students and to have an impact on those students. So, we expect that multiple
work terms at the same employer will enhance the imprinting effect.
Hypothesis 2: Later work terms and multiple work terms at the same employer will have an enhanced imprinting effect.
Methods
PitchBook shared with us a list of the names, ventures, and graduation dates of 346 unique
entrepreneurs who attended UW and who raised a first round of venture capital (VC) financing
between January 1st, 2006 and August 15th, 2016. While PitchBook reports 361 VC financed
entrepreneurs from UW, these are actually 360 unique entrepreneur-venture pairs, as one person
did not attend UW, and 346 unique entrepreneurs, as 14 entrepreneurs founded two VC-backed
ventures. We first characterize this set of entrepreneurs and their ventures, and then describe the
sample of observations used to test our hypotheses.
Alumni Entrepreneurs
Based on data from the UW registrar’s office we determined that the entrepreneurs
graduated from UW between 1972 and 2017, 46 prior to 1990, 54 in the 1990s, 149 in the 2000s,
and the remainder (97) in 2010 or later. A majority (197) studied engineering of which 75
studied software, 40 electrical, 34 mechatronics, 27 systems design, and 11 nanotechnology.

Creating High-Potential Alumni Entrepreneurs
Another 75 studied mathematics and the remainder were distributed across a range of disciplines.
Given the graduation dates, we expect these entrepreneurs ranged in age from early twenties to
late sixties when their ventures were financed. At the time of their undergraduate studies, most
(308) were Canadian citizens, 27 were permanent residents and 11 had student visas. Only 15 of
the entrepreneurs are women.
UW has complete information on work terms for the 183 entrepreneurs who graduated
after 2004. Of these, 164 (90%) did at least one four-month work term, and 82% did between
four and eight work terms. An engineering student is expected to complete six work terms,
while students enrolled in programs where participation in co-operative education is optional
complete four work terms to fulfil the cooperative education requirements. Ninety percent of the
entrepreneurs in our sample have participated in cooperative education, while the participation
rate across the university is 50%. This association between participation in cooperative
education and the likelihood of becoming a VC-funded entrepreneur is likely due to both
selection and treatment effects. Entrepreneurially-minded students choose to attend UW and to
participate in cooperative education or study engineering where work terms are mandatory, and
participation in cooperative education enables entrepreneurship.
According to PitchBook, all of the entrepreneurs have raised VC financing. PitchBook
identified 275 unique ventures founded by these entrepreneurs—some of the entrepreneurs have
founded multiple ventures and some ventures have multiple UW alumni as founders (PitchBook,
2016). PitchBook reports that these entrepreneurs raised a total of $5,067 million in venture
capital between January 1st 2006 and August 15th 2016 (PitchBook, 2016), which we were able
to confirm as a minimum using CrunchBase and other online data sources. The total amounts of

Creating High-Potential Alumni Entrepreneurs
venture capital raised by each venture between January 1st 2006 and August 15th 2016 ranges
from less than $100,000 in the case of 70 ventures (not typically considered to be venture capital
but we retained these firms in the dataset to benefit from the objectivity of the PitchBook
identification of funded entrepreneurs), to over $1 billion in the case of two ventures. During
this ten-year time period, the 275 ventures raised an average of $18.4 million and a median of
$1.5 million in financing. Of the 183 students who graduated after 2004, approximately one-third
(62) have US patents assigned to their ventures or on which they are listed as inventors.
Eighteen have only one patent, four entrepreneurs have more than 10 patents, and one
entrepreneur/venture has 103 patents. Together the 62 entrepreneurs have 343 patents, average
of 5.5 patents per entrepreneur.
Study Sample
Our unit of analysis is a pair of firms: the venture—work term employer, in the case of
treatment group pairs, and the venture—control group firm, in the case of control group pairs.
Our dependent variable is a patent-based measure of the distance between the patent portfolios of
the pair of firms. Our treatment group consists of 157 venture—work term employer pairs. To
be included in the treatment group the entrepreneur had to graduate after 2004 for work term data
to be available, and had to have done at least one work term. Also, their venture had to be
assigned a US patent, or they had to be listed as an inventor on a US patent that they were
awarded prior to the launch of their venture. We considered both assigned and awarded patents
as possible evidence of technological imprinting. Finally, their work term employer also had to
be assigned at least one US patent.
In testing Hypothesis 1, we took two approaches to identifying control group firms that were
similar to work term employers to ensure that our results are robust to alternative matching

Creating High-Potential Alumni Entrepreneurs
schemes. We used 1:1 case control matching in which we identified 157 control group pairs, and
1:5 case control matching in which we identified 413 control group pairs, up to five control
group firms for each treatment group firm. This yields a total of 314 observations in the first
case and 570 observations in the second case. These observations involve 55 unique
entrepreneurs, 101 unique work term employers, and up to 237 unique control group firms,
matched to employers on the basis of founding date (within a 15-year window), industrial sector
(same 3-digit industry subsector based on the North American Industry Classification System),
and the log of the number of employees (to one order of magnitude). Where the employer was a
university, it was matched with a similar university on the basis of a ranking of Canadian
universities (Macleans, 2018). Where it was a hospital or a unique firm, matching was done
manually. For example, Amazon was manually matched with Ebay and American Express was
manually matched with Bank of America and Mastercard. To test Hypothesis 2 on the dosage
effect we use only the 157 treatment group pairs.
Measures
Dependent variable: Technological proximity. Technological proximity is a measure
of the similarity of the patent portfolio of the entrepreneur-venture and the portfolio of the work
term employer or control group firm. The portfolios of the employers and control group firms
are based on patents granted to the firm within the 13-year window that begins 10 years before
the year of the respective work term relationship and ends three years after, because the student-
entrepreneur is most likely to have been exposed to technologies patented within this window.
We use InnoGPS to identify US patents, create patent portfolios, and measure the
proximity between pairs of patent portfolios (Luo et al., 2017). InnoGPS is a design ideation and

Creating High-Potential Alumni Entrepreneurs
innovation opportunity exploration platform that utilizes the complete USPTO patent database of
6,025,637 utility patents granted between 1976 and 2017. A number of knowledge proximity
measures have been used in the literature. Some consider citations between patents while others
consider the co-occurrence of patent classes, leveraging the fact that patents are often classified
in multiple patent classes. Jaffe (1986) used a cosine similarity index to compare the distribution
of firm patents across 49 patent categories at two points in time to measure changes in
technological position and Leydesdorff et al. (2014) used a cosine similarity index to map
relations between patent portfolios using the entire USPTO database. Yan & Luo (2017)
analyzed 12 alternative knowledge proximity measures in terms of consistency and granularity
and proposed a novel Jaccard index, the class-to-patent based on references index, which
performs better than all other measures, and which is used by InnoGPS, (Yan & Luo, 2017). In
the Jaccard class-to-patent based on references index, the distance between pairs of portfolios is
the count of all patents referenced by at least one patent in each portfolio, normalized by the total
count of all patents referenced by patents in either of the two portfolios. Formally,
Technological proximity = !𝑃# ∩ 𝑃%! !𝑃# ∪ 𝑃%!
where Pi and Pj are the sets of the references of the patents in portfolios i and j; !𝑃# ∩ 𝑃%! is
the number of patents referenced in both portfolios, and !𝑃# ∪ 𝑃%! is the number of patents
referenced in either portfolio. Technological proximity ranges from 0 to 1.
For example, one of the students in our dataset did four work terms, and his venture was
assigned a single patent that references seven earlier US patents as prior art. Comparing the
references cited by this patent to the references cited by the patents in the portfolios of his work
term employers (control group firms), we find that technological proximity is 0.01 (0.06), 0.39

Creating High-Potential Alumni Entrepreneurs
(0.12), 0.35 (0.41), and 0.56 (0.23) for the four work terms, respectively. In the case of the
second and fourth work terms, where the first number is higher than the second number, the prior
art cited by the venture patent is closer to the prior art cited by the employer patents than to the
prior art cited by the control group firm patents, as hypothesized (H1). In the case of the first
and third work terms, the reverse is true.
The patent portfolios in our sample contain a total of over 150,000 unique patents and a
much larger number of references. While most patents include between zero and 20 references
(backward citations), five percent of patents include over 100 references (Kuhn et al., 2018). We
assume that the average patent in our dataset includes 20 references and estimate that a total of
some 3 million patent references are employed in our analysis.
Independent variables. Our independent variables of interest are work term and work
term dosage. Work term is a binary variable that is 1 if the venture-firm pair was treated by a
work term relationship and 0 otherwise. The work term dosage variable ranges from 2 to 10 and
is the sum of the work term rank, which ranges from 1 to 8 according to the position of the work
term in the student’s sequence of work terms, and the number of repeat work terms with the
same employer, which ranges from 1 to 4. We treat work term dosage as a continuous variable
to preserve the sequential information. Treating ordinal variables as continuous does not
compromise the reliability of results if the sample size and number of ordinal categories are
sufficient, that is, greater than four (Johnson & Creech, 1983), or five (Rhemtulla et al., 2012).
We control for five other types of proximity between the venture and employer or control
group firm. Founding year proximity indicates the differences in founding years of the two
firms. Firms founded in the same era are more likely to have similar technological capabilities.

Creating High-Potential Alumni Entrepreneurs
Recently founded employers are more likely to develop technologies similar to those being
developed by the entrepreneurs in our sample, relative to employers that were founded several
years ago. Founding year proximity is reverse coded (it will have the largest negative value for
pairs of firms that are furthest apart in founding years) so we expect it to have a positive
relationship with technological proximity.
We control for industry proximity because firms in similar industries are more likely to
create similar technologies. As is common, we use a standard industry classification system to
identify industry proximity. The North American Industry Classification System (NAICS) that
we use classifies broadly similar firms in the same 2-digit sector, and increasingly similar firms
in the same 3-digit subsector, 4-digit industry group, and 5-digit industry. Our industry
proximity values range from 1 for pairs of firms in different sectors to 5 for pairs of firms in the
same 5-digit industry and we expect this variable to have a positive effect on technological
proximity.
We also control for two measures of proximity in terms of scale. Numpatents proximity
captures differences in the scale of the patent portfolios of the two firms. It is the difference
between the number of patents in the employer or control group firm portfolio minus the number
of patents in the venture portfolio. Numemployees proximity captures differences in the scale of
the two firms. It is the difference between the number of employees in the employer or control
group firm minus the number of employees in the venture. We expect both variables to be
positively related to technological proximity.

Creating High-Potential Alumni Entrepreneurs
Finally, we control for geographic proximity which may capture a number of other ways
in which the pairs of firms are similar. Our geographic proximity variable ranges from a value of
1 for firms whose headquarters are on different continents, to 6 for firms that are in the same
city. Intermediate values are 2 for the same continent, 3 for the same country, 4 for the same
state or province, and 5 for the same metropolitan area. We expect geographic proximity to have
a positive effect on technological proximity. Both our industry proximity and our geographic
proximity variables are ordinal that we treat as continuous in order to retain the ordinal
information.
Table 4, below, presents the descriptive statistics and correlations for the 1:1 matching
sample, the 1:5 matching sample, and the dosage sample that consists of only the 157 treatment
group pairs. All variables are centered for the correlations and the analysis that follows in the
interest of unbiased and easily interpreted results (Kraemer & Blasey, 2004).
********************* Insert Table 4 about here
*********************
Results
We hypothesize that the patent portfolio of the entrepreneur-venture will be closer to the
patent portfolio of the entrepreneur’s work term employer than it will be to the patent portfolio of
a similar firm with which the entrepreneur did not have a working relationship. While we are
positing an effect of a work term relationship, we must consider the possibility of reverse
causality. That is, it may be that an inherent but possibly not-yet-manifested technological
proximity may cause the entrepreneur and the employer to choose to establish an employee-
employer relationship rather than the relationship causing the subsequent technological

Creating High-Potential Alumni Entrepreneurs
proximity between the venture and the employer. This would be the case, for example, if the
entrepreneur had an interest and some expertise in a particular technological domain prior to
selecting a work term employer. We follow Azoulay et al., (2017) in using data on the sequence
of events to argue against the likelihood of reverse causality. While it is likely that the
entrepreneurs in our sample have a general sense of their interests and abilities prior to enrolling
in university, and that this leads them to choose particular domains of study and employers, it is
unlikely that they have identified the particular technologies that they subsequently develop, and
that are represented in their patent portfolios, prior to enrolling in university or choosing work
term employers.
In some cases however, an entrepreneur may have undertaken inventive activity that led to
a US patent or may have launched their venture prior to engaging in the work term relationship.
We test for this possibility by checking the temporal sequence of the year of graduation
(conservative because it is subsequent to all work term relations), the year of first patent award,
and the launch of the venture, as indicated by the year of first financing. We find that in all but
two cases, graduation precedes patenting and financing, and that the average period between
events is 4.9 years for patenting and 2.8 years for financing. In the two cases where graduation
is subsequent to entrepreneurial events, the entrepreneurs dropped out of school to launch their
ventures and subsequently returned to school to complete their degrees. As graduation, and
therefore work terms, generally precedes venture founding and patenting, it likely that in
practice, the causality runs in the predicted direction.
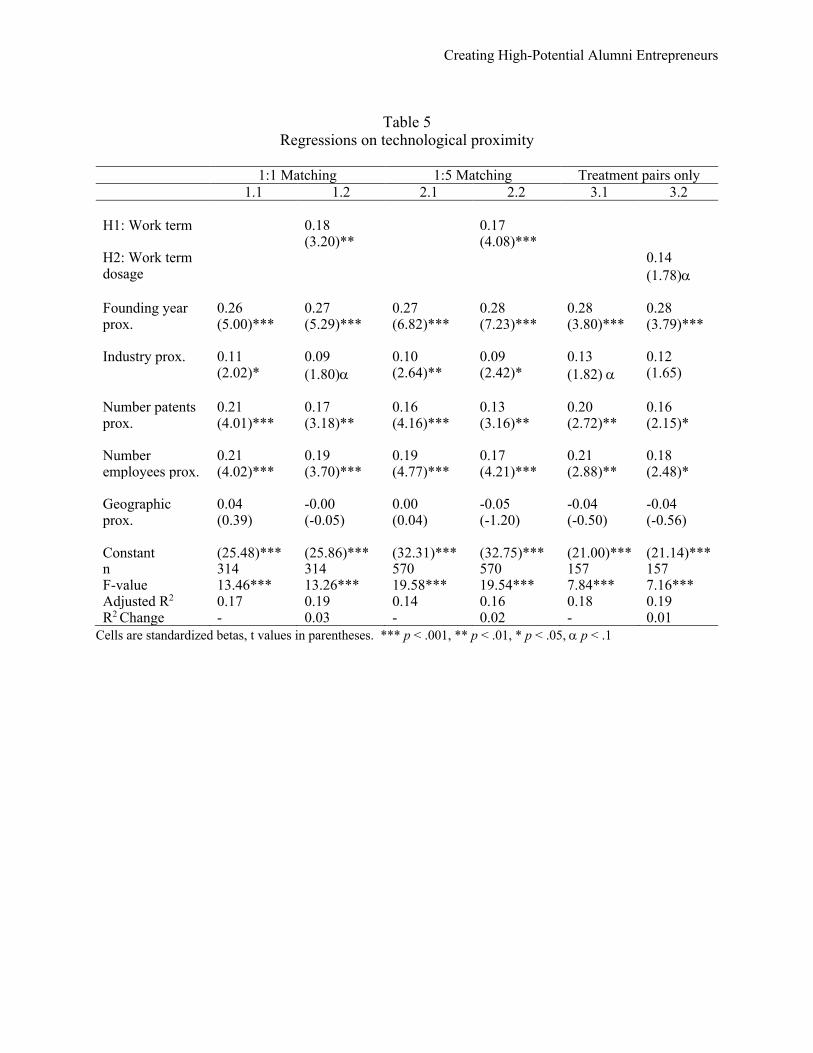
Table 5, below, shows our results. The first two models employ 1:1 matching, the next
two models employ 1:5 matching, and the final two models use only the treatment group pairs.

Creating High-Potential Alumni Entrepreneurs
The results are substantially the same across the first two sets of models showing that our results
are robust to alternative matching schemes. In both cases, the adjusted R2s increase as the work
term predictor is added to the model. As we hypothesized (Hypothesis 1), Models 1.2 and 2.2
show that a work term relationship is a significant predictor of technological proximity (p <
.001). The patent portfolios of the entrepreneurs’ ventures are closer to those of their employers
than to those of control group firms. Model 3.2 shows a modest dosage effect as the work term
dosage variable is weakly significant (p < .1), and Model 3.2 has a marginally higher explanatory
power than Model 3.1 All of our controls, with the exception of geographic proximity, are
significant predictors of technological proximity.
********************* Insert Table 5 about here
*********************
Discussion
Research on entrepreneurs is as varied as the phenomenon itself. Research on VC-
financed entrepreneurs is especially compelling because while VC-financed ventures comprise
less than 1% of all ventures in the US and fewer elsewhere, such firms have a disproportionate
effect on the economy (Puri & Zarutskie, 2012). High growth ventures are the primary source of
new jobs and benefits such innovative system vitality (Brown et al., 2014; Criscuolo et al.,
2014). Our results show that the pursuits of the VC-backed alumni entrepreneurs in our sample
are traceable to the formative work term experiences they had as students. Our results are
important because they are objective evidence of the technological antecedents of high-potential
ventures.

Creating High-Potential Alumni Entrepreneurs
Many studies of the genesis of ventures look to establish a measure of the distance
between a venture and a spawning organization, be it a university or a former employer of the
founders (Agarwal et al., 2004; Azoulay et al, 2017). To this endeavour we introduce a
knowledge proximity measure of proven superiority, the Jaccard reference-based measure, that is
based on the distance between patent portfolios (Yan & Luo, 2017). As far as we know, despite
the widespread use of patent-based distance measures in economics and innovation studies, they
have not previously been used in a study of entrepreneurship. Such approaches will be useful in
situations where researchers want to examine the technological antecedents of spin-offs of
established firms, universities, and research institutes (Shane, 2004; Wright, 2007).
The imprinting literature has shown that ventures bear the imprints of the past experiences
of the entrepreneurs that found them. But it has been silent on the necessary duration and
strength of the formative experience. The work term experiences to which our entrepreneurs
were exposed were only four months in duration and competed with other formative experiences
to create an impression. Our results set a minimum threshold for the duration of a source of
imprint and show that timing and duration of imprinting are also important.
For entrepreneurs our results point to the importance of prior experience to the
identification and pursuit of opportunities (Westhead et al., 2009). The value of venture ideas is
difficult to discern a priori, but would-be entrepreneurs without a claim to valuable prior
experiences need to be rigorous and unbiased in the evaluation of their ideas. Valuable prior
experiences may take a wide range of shapes. As a single mother and restaurant worker, Cora
Tsouflidou, the founder of Cora’s (a chain of breakfast restaurants), was gathering the
knowledge and perspectives she needed to invent and build a thriving business (Cora, 2019).

Creating High-Potential Alumni Entrepreneurs
But entrepreneurs with no background in the field of their venture are less likely to come up with
well-grounded ideas. This is likely why Paul Graham, the founder of Y Combinator, advises
young entrepreneurs to “live in the future” and to solve a problem that they are personally
experiencing (Graham, 2012).
For policy makers that want to enable entrepreneurship broadly, inclusively, and at low
cost, cooperative education programs are attractive. While UW employs over 200 people to
manage the recruitment and reporting processes of both cooperative education and post-
graduation employment, the costs of the cooperative education program are largely borne by
students (UW Cooperative Education, 2019). In addition to facilitating entrepreneurship,
cooperative education programs enhance the local economy—one of the original purposes of
UW’s cooperative approach to education (Bramwell & Wolfe, 2008; Needles, 1956). This is in
contrast to the thousands of government-supported incubators and accelerators around the world
that may have modest impacts on the firms they serve.
Our findings complement those of Kenney and Patton (2009) who examine spin-offs at
UW. Kenney and Patton credit UW’s IP policy as the explanation for the high number of UW
spin-offs, while we show that the cooperative education program leaves its mark on the ventures
of high-potential alumni entrepreneurs. We posit that for student entrepreneurs, the cooperative
education program is of greater importance than the IP policy.
The degree to which our results can be generalized is limited by the fact that our study is
based on a single case, VC-backed ventures founded by graduates of the University of Waterloo.
UW’s cooperative education program is the world’s largest and the benefits attributable to it may

Creating High-Potential Alumni Entrepreneurs
not materialize where programs are smaller, or where the participating students or companies are
of lower quality. Our study is also limited by the fact that we can only examine the proximity of
ventures to work term employers in cases where both entities have patents, and by well-known
and newly-discovered limitations in patent data (Kuhn et al, 2018; Lerner & Seru, 2017).
Finally, we are restricted to examining the ventures of alumni who graduated after 2004, due to
incomplete data on student work terms in earlier years.
Future research on the identification of entrepreneurial opportunities will benefit from
reliable descriptors of ideas. This is difficult where ideas are not patented, as in our study, or
measurable, as in studies of spin-offs in the disk drive industry (Agarwal et al., 2004). But as
Shane and Venkataraman (2000) emphasize, understanding opportunity identification requires an
understanding both entrepreneurs and opportunities. Future studies of the effects of cooperative
education will benefit from data on the nature of cooperative education programs across
universities.

Creating High-Potential Alumni Entrepreneurs
References
Agarwal, R., Echambadi, R., Franco, A. M., & Sarkar, M. B. (2004). Knowledge transfer through inheritance: Spin-out generation, development, and survival. Academy of Management Journal, 47(4), 501-522.
Amezcua, A. S. (2010). Boon or boondoggle? business incubation as entrepreneurship policy Syracuse University.
Ardichvili, A., Cardozo, R., & Ray, S. (2003). A theory of entrepreneurial opportunity identification and development. Journal of Business Venturing, 18(1), 105-123.
Åstebro, T., Bazzazian, N., & Braguinsky, S. (2012). Startups by recent university graduates and their faculty: Implications for university entrepreneurship policy. Research Policy, 41(4), 663-677.
Azoulay, P., Liu, C. C., & Stuart, T. E. (2017). Social influence given (partially) deliberate matching: Career imprints in the creation of academic entrepreneurs. American Journal of Sociology, 122(4), 1223-1271.
Boeker, W. (1988). Organizational origins: Entrepreneurial and environmental imprinting of the time of founding.
Boschma, R., Balland, P., & Kogler, D. F. (2014). Relatedness and technological change in cities: The rise and fall of technological knowledge in US metropolitan areas from 1981 to 2010. Industrial and Corporate Change, 24(1), 223-250.
Bramwell, A., Nelles, J., & Wolfe, D. A. (2008). Knowledge, innovation and institutions: Global and local dimensions of the ICT cluster in waterloo, canada. Regional Studies, 42(1), 101-116.
Bramwell, A., & Wolfe, D. A. (2008). Universities and regional economic development: The entrepreneurial university of waterloo. Research Policy, 37(8), 1175-1187.
Branstetter, L. G., & Sakakibara, M. (2002). When do research consortia work well and why? evidence from japanese panel data. American Economic Review, 92(1), 143-159.
Breschi, S., Lissoni, F., & Malerba, F. (2003). Knowledge-relatedness in firm technological diversification. Research Policy, 32(1), 69-87.
Brown, R., Mason, C., & Mawson, S. (2014). Increasing'the vital 6 percent': Designing effective public policy to support high growth firms.
Cohen, S., & Hochberg, Y. (2014). Accelerating startups: The seed accelerator phenomenon. Cohen, W. M., & Levinthal, D. A. (1990). Absorptive capacity: A new perspective on learning
and innovation. Administrative Science Quarterly, , 128-152. Colapinto, C. (2007). A way to foster innovation: A venture capital district from silicon valley
and route 128 to waterloo region. International Review of Economics, 54(3), 319-343. Cora. (2019). Our history. Retrieved from https://www.chezcora.com/en/about-cora Criscuolo, C., Gal, P. N., & Menon, C. (2014). The dynamics of employment growth. Cumming, D. J., & Fischer, E. (2012). Publicly funded business advisory services and
entrepreneurial outcomes. Research Policy, 41(2), 467-481. DeTienne, D. R. (2010). Entrepreneurial exit as a critical component of the entrepreneurial
process: Theoretical development. Journal of Business Venturing, 25(2), 203-215. Ellis, S., Aharonson, B. S., Drori, I., & Shapira, Z. (2017). Imprinting through inheritance: A
multi-genealogical study of entrepreneurial proclivity. Academy of Management Journal, 60(2), 500-522.
Graham, P. (2012, ). How to get startup ideas. Retrieved from http://paulgraham.com/startupideas.html

Creating High-Potential Alumni Entrepreneurs
Hannan, M. T., Burton, M. D., & Baron, J. N. (1996). Inertia and change in the early years: Employment relations in young, high technology firms. Industrial and Corporate Change, 5(2), 503-536.
Jaffe, A. B. (1986). Technological Opportunity and Spillovers of R&D: Evidence from Firms' Patents, Profits and Market Value,
Johnson, D. R., & Creech, J. C. (1983). Ordinal measures in multiple indicator models: A simulation study of categorization error. American Sociological Review, , 398-407.
Johnson, V. (2007). What is organizational imprinting? cultural entrepreneurship in the founding of the paris opera. American Journal of Sociology, 113(1), 97-127.
Kenney, M., & Patton, D. (2009). Reconsidering the bayh-dole act and the current university invention ownership model. Research Policy, 38(9), 1407-1422.
Kraemer, H. C., & Blasey, C. M. (2004). Centring in regression analyses: A strategy to prevent errors in statistical inference. International Journal of Methods in Psychiatric Research, 13(3), 141-151.
Kuhn, J. M., Younge, K. A., & Marco, A. C. (2018). Patent citations reexamined. Available at SSRN 2714954,
Lerner, J., & Seru, A. (2017). The use and Misuse of Patent Data: Issues for Corporate Finance and Beyond,
Leydesdorff, L., Kushnir, D., & Rafols, I. (2014). Interactive overlay maps for US patent (USPTO) data based on international patent classification (IPC). Scientometrics, 98(3), 1583-1599.
Luo, J., Yan, B., & Wood, K. (2017). InnoGPS for data-driven exploration of design opportunities and directions: The case of google driverless car project. Journal of Mechanical Design, 139(11), 111416.
Macleans. (2018, University rankings 2018. Retrieved from https://www.macleans.ca/education/university-rankings/university-rankings-2018/
Marquis, C. (2003). The pressure of the past: Network imprinting in intercorporate communities. Administrative Science Quarterly, 48(4), 655-689.
Marquis, C., & Tilcsik, A. (2013). Imprinting: Toward a multilevel theory. Academy of Management Annals, 7(1), 195-245.
Mathias, B. D., Williams, D. W., & Smith, A. R. (2015). Entrepreneurial inception: The role of imprinting in entrepreneurial action. Journal of Business Venturing, 30(1), 11-28.
McLaughlin, K. (2015). Innovation and entrepreneurship are in the waterloo genome University of Waterloo.
Needles, I. (1956). The waterloo plan. (). Retrieved from http://digital.library.uwaterloo.ca/uwdl-79b98afa-269a-46b7-82d9-04632abd5d4b/wanted-150000-engineers-and-technicians-waterloo-plan#page/10/mode/2up
Nelles, J., Bramwell, A., & Wolfe, D. A. (2005). History, culture and path dependency: Origins of the waterloo ICT cluster. Global Networks and Local Linkages: The Paradox of Cluster Development in an Open Economy, 227, 252.
Pitchbook. (2016). Pitchbook universities 2016-2017 report. Retrieved from https://pitchbook.com/news/reports/2016-2017-pitchbook-universities
Pitchbook. (2018). Pitchbook universities 2018-2019 report. Retrieved from https://pitchbook.com/news/reports/2018-pitchbook-universities-2018-2019-edition
Puri, M., & Zarutskie, R. (2012). On the life cycle dynamics of venture‐capital‐and non‐venture‐capital‐financed firms. The Journal of Finance, 67(6), 2247-2293.

Creating High-Potential Alumni Entrepreneurs
Rhemtulla, M., Brosseau-Liard, P. É., & Savalei, V. (2012). When can categorical variables be treated as continuous? A comparison of robust continuous and categorical SEM estimation methods under suboptimal conditions. Psychological Methods, 17(3), 354.
Rigby, D. L. (2015). Technological relatedness and knowledge space: Entry and exit of US cities from patent classes. Regional Studies, 49(11), 1922-1937.
Sapienza, H. J., Parhankangas, A., & Autio, E. (2004). Knowledge relatedness and post-spin-off growth. Journal of Business Venturing, 19(6), 809-829.
Shah, S. K., & Tripsas, M. (2007). The accidental entrepreneur: The emergent and collective process of user entrepreneurship. Strategic Entrepreneurship Journal, 1(1‐2), 123-140.
Shane, S. (2000). Prior knowledge and the discovery of entrepreneurial opportunities. Organization Science, 11(4), 448-469.
Shane, S. A. (2004). Academic entrepreneurship: University spinoffs and wealth creation Edward Elgar Publishing.
Shane, S., & Stuart, T. (2002). Organizational endowments and the performance of university start-ups. Management Science, 48(1), 154-170.
Shane, S., & Venkataraman, S. (2000). The promise of entrepreneurship as a field of research. Academy of Management Review, 25(1), 217-226.
Shanghai Jiao Tong Ranking. (2017). Shanghai jiao tong university ranking. (). Retrieved from https://cwur.org/2018-19/Shanghai-Jiao-Tong-University.php
Startup Genome Ranking. (2017). Global startup ecosystem report. (). Retrieved from https://startupgenome.com/report2017/
Stinchcombe, A. L., & March, J. G. (1965). Social structure and organizations. Handbook of Organizations, 7, 142-193.
UW Cooperative Education. (2019). Contacts. Retrieved from https://uwaterloo.ca/co-operative-education/about/people
UW Cooperative Education Annual Report. (2018). University of waterloo, 2018 cooperative education annual report. (). Retrieved from https://uwaterloo.ca/co-operative-education-annual-report/
Von Hippel, E. (1986). Lead users: A source of novel product concepts. Management Science, 32(7), 791-805.
Westhead, P., Ucbasaran, D., & Wright, M. (2009). Information search and opportunity identification: The importance of prior business ownership experience. International Small Business Journal, 27(6), 659-680.
World Economic Forum. (2015). Which countries have the most venture capital investments. (). Retrieved from https://www.weforum.org/agenda/2015/07/which-countries-have-the-most-venture-capital-investments/
Wright, M. (2007). Academic entrepreneurship in europe Edward Elgar Publishing. Yan, B., & Luo, J. (2017). Measuring technological distance for patent mapping. Journal of the
Association for Information Science and Technology, 68(2), 423-437. Zucker, L. G., Darby, M. R., & Armstrong, J. S. (2002). Commercializing knowledge:
University science, knowledge capture, and firm performance in biotechnology. Management Science, 48(1), 138-153.

Creating High-Potential Alumni Entrepreneurs
Table 1 Descriptive statistics and correlations
1. 2. 3. 4. 5. 6. 7. 8. 9. 10. 11. 1. #Entrepreneurs 2. #Companies .99 3. Total VC .93 .94 4. #Students -.25 -.25 -.39 5. #Faculty -.15 -.14 -.18 .63 6. Endowment (log)
.57 .59 .61 -.24 .08
7. Annual budget per student
.62 .64 .66 -.38 -.05 .71
8. Shanghai ranking
.37 .41 .37 .20 .34 .48 .46
9. Annual R&D spending (log)
.29 .33 .27 .31 .42 .56 .52 .79
10. Age .16 .19 .32 -.26 .04 .62 .45 .18 .28 11. Ecosystem ranking
.31 .30 .29 .02 -.16 -.08 .04 .10 -.08 -.22
Min 185 159 0.7 6409 565 8.3 10999.6 -350 7.6 59 -35 Max 1006 881 18.2 88766 14038 10.6 407770.5 -1 9.2 380 -1 Mean 371.0 332.6 4.8 33827.7 3248.3 9.4 105273.8 -78.2 8.7 168.2 -22 sd 199.6 171.9 3.8 16786.7 2510.8 0.5 84788.3 78.7 0.4 61.4 14
Descriptive statistics use original values, correlations use centered values. Correlations whose absolute value is greater than .28 are significant at the .05 level.
Table 2 Regressions on Pitchbook rankings
#Entrepreneurs #Companies Total VC #Students .13(.70) .10(.60) -.11(-.66) #Faculty -.16(-1.09) -.16(-1.11) -.06(-.42) Endowment (log) .53(3.01)** .50(2.90)** .42(2.46)* Annual budget per student .45(2.56)* .42(2.44)* .34(2.00)a Shanghai ranking (reverse coded) .19(1.11) .21(1.24) .21(1.28) Annual R&D spending (log) -.28(-1.28) -.24(-1.10) -.22(-1.05) Age -.25(-1.84)a -.21(-1.56) -.05(-.36) Ecosystem ranking (reverse coded) .21(1.85)a .21(1.89)a .25(2.33)* Constant (18.69)*** (19.67)*** (13.13)*** n 50 50 50 F-value 6.79*** 7.18*** 7.74*** Adjusted R2 .50 .52 .54
Cells are standardized betas, t values in parentheses. *** p < .001, ** p < .01, * p < .05, a p < .1

Creating High-Potential Alumni Entrepreneurs
Table 3 Residual values for universities whose actual performance
exceeds predicted performance by the widest margin University Actual Value
(Pitchbook, 2016) Predicted Value Residual Residual Rank
Number of Entrepreneurs University of California (Berkeley) 997 484 513 1 Harvard University 762 553 209 2 Cornell University 635 453 182 3 University of Michigan 607 426 181 4 University of Waterloo 361 213 148 5 University of Maryland 291 146 145 6 Stanford University 1006 868 138 7 University of Texas 561 425 136 8 Tel Aviv University 515 383 132 9 Trinity College Dublin 192 77 115 10
Number of Companies University of California (Berkeley) 881 434 447 1 Cornell University 585 406 179 2 University of Michigan 546 384 162 3 Harvard University 673 512 161 4 University of Texas 511 377 134 5 University of Maryland 267 146 121 6 Tel Aviv University 429 323 106 7 Trinity College Dublin 180 76 104 8 Stanford University 850 752 98 9 University of Waterloo 275 177 98 10 Total Venture Capital Raised ($ billions) University of California (Berkeley) 14.2 6.8 7.5 1 Harvard University 17.2 10.6 6.6 2 Stanford University 18.1 13.4 4.8 3 Cornell University 10.8 6.4 4.4 4 University of Waterloo 3.8 0.9 2.9 5 Trinity College Dublin 2.2 -0.4 2.5 6 University of Maryland 3.2 0.9 2.2 7 University of Michigan 7.8 5.5 2.2 8 McGill University 3.3 1.8 1.5 9 University of Arizona 1.9 0.4 1.5 10

Creating High-Potential Alumni Entrepreneurs
Table 4 Descriptive statistics and correlations
Descriptive statistics Correlations Min Max Mean sd 1. 2. 3. 4. 5. 6. 1:1 Matching (n=314) 1. Technological prox. 0.00 1.00 0.45 0.34 2. Work term 0 1 0.50 0.50 .22 3. Founding year prox. -377 -2 -46.01 50.61 .27 -.07 4. Industry prox. 1 5 1.15 .67 .10 .03 .07 5. Numpatents prox. -101 21901 919.66 2991.87 .24 .24 .00 -.02 6. Numemployees prox. -2925 613269 36979.02 95241.35 .23 .12 .01 -.06 .15 7. Geographic prox. 1 6 2.77 1.18 .01 .25 -.04 -.08 -.03 -.06 1:5 Matching (n=570) 1. Technological prox. 0.00 1.00 0.42 0.34 2. Work term 0 1 0.28 0.45 .19 3. Founding year prox. -377 -2 -42.02 45.04 .26 -.10 4. Industry prox. 1 5 1.16 0.66 .10 .02 .06 5. Numpatents prox. -101 21901 644.04 2388.96 .19 .26 -.03 -.02 6. Numemployees prox. -2932 613269 28125.51 76388.00 .20 .16 -.04 -.05 .17 7. Geographic prox. 1 6 2.55 1.09 -.02 .30 -.05 -.09 .04 -.03 Treatment pairs only (n=157) 1. Technological prox. 0.00 1.00 0.53 0.35 2. Work term dosage 2 10 4.99 1.93 .25 3. Founding year prox. -377 -2 -42.42 55.80 .30 .05 4. Industry prox. 1 5 1.17 0.74 .14 .07 .08 5. Numpatents prox. -101 21901 1630.00 4022.08 .24 .29 .05 -.03 6. Numemployees prox. -2925 613269 48066.15 122440.63 .21 .22 .04 -.06 .13 7. Geographic prox. 1 6 3.07 1.34 -.09 -.02 .02 -.13 -.11 -.08
Descriptive statistics use original values, correlations use centered values. Correlations whose absolute value is greater than .15 are significant at the .01 level.
Creating High-Potential Alumni Entrepreneurs
Table 5
Regressions on technological proximity
1:1 Matching 1:5 Matching Treatment pairs only 1.1 1.2 2.1 2.2 3.1 3.2
H1: Work term 0.18
(3.20)** 0.17
(4.08)***
H2: Work term dosage
0.14 (1.78)a
Founding year prox.
0.26 (5.00)***
0.27 (5.29)***
0.27 (6.82)***
0.28 (7.23)***
0.28 (3.80)***
0.28 (3.79)***
Industry prox. 0.11
(2.02)* 0.09 (1.80)a
0.10 (2.64)**
0.09 (2.42)*
0.13 (1.82) a
0.12 (1.65)
Number patents prox.
0.21 (4.01)***
0.17 (3.18)**
0.16 (4.16)***
0.13 (3.16)**
0.20 (2.72)**
0.16 (2.15)*
Number employees prox.
0.21 (4.02)***
0.19 (3.70)***
0.19 (4.77)***
0.17 (4.21)***
0.21 (2.88)**
0.18 (2.48)*
Geographic prox.
0.04 (0.39)
-0.00 (-0.05)
0.00 (0.04)
-0.05 (-1.20)
-0.04 (-0.50)
-0.04 (-0.56)
Constant (25.48)*** (25.86)*** (32.31)*** (32.75)*** (21.00)*** (21.14)*** n 314 314 570 570 157 157 F-value 13.46*** 13.26*** 19.58*** 19.54*** 7.84*** 7.16*** Adjusted R2 0.17 0.19 0.14 0.16 0.18 0.19 R2 Change - 0.03 - 0.02 - 0.01
Cells are standardized betas, t values in parentheses. *** p < .001, ** p < .01, * p < .05, a p < .1