analysts and investors conference - romande...
TRANSCRIPT

11
Analysts and Investors Analysts and Investors ConferenceConference7 April 20067 April 2006
PierrePierre--Alain Urech, CEOAlain Urech, CEODenis Matthey, CFODenis Matthey, CFO
2005 Results2005 Results

22
CONTENTS OF PRESENTATION CONTENTS OF PRESENTATION
1. 2005 RESULTS
• Key figures• Dividend
2. ENTEPRISE VALUE AND FINANCIAL POLICY
3. A LOOK AT THE MARKET
4. ROMANDE ENERGIE READY FOR CHANGE
• Our vision• Our mission• Our strategy
5. NEW ARTICLES OF ASSOCIATION

33
FOUR SIGNIFICANT ELEMENTSFOUR SIGNIFICANT ELEMENTS
20052005
A good year despite difficult A good year despite difficult conditionsconditions
Price cutsPrice cuts
Increase in cost of Increase in cost of energy suppliesenergy supplies
Cost control
More revenue from products and
services

44
1. RESULTS 2005
Pressure on gross margin

55
EQUITY ALLOCATED TO PARENT COMPANYEQUITY ALLOCATED TO PARENT COMPANYSHAREHOLDERS REPRESENTS 70% OF T0TAL ASSETSSHAREHOLDERS REPRESENTS 70% OF T0TAL ASSETS
1.
Condensed Condensed consolidatedconsolidatedbalance sheetbalance sheet
CHF 000 (IFRS) 31.12.2005 31.12.2004
ASSETS
Current assets 415 253 319 502
Non-current assets 1 226 004 1 164 570
Total assets 1 641 257 1 484 072
LIABILITIES AND SHAREHOLDERS' EQUITY
Current liabilities 161 103 139 419
Non-current liabilitiesLong-term loans 134 320 135 979 Deferred tax liabilities 151 479 149 029 Long-term provisions 6 797 4 447
Total non-current liabilities 292 596 289 455
Total liabilities 453 699 428 874
Shareholders' equity allocated to parent company shareholders 1 147 680 1 022 781 Minority interests 39 878 32 417 Total shareholders' equity 1 187 558 1 055 198
Total liabilities and shareholders' equity 1 641 257 1 484 072

66
1.
Cash flowsCash flows
HIGH CASH LEVELS IN ANTICIPATION OFHIGH CASH LEVELS IN ANTICIPATION OFELECTRICITY MARKET LIBERALIZATIONELECTRICITY MARKET LIBERALIZATION
2005 2004
116 208 118 508
Reversal of non-cash items, interest and taxes paid 25 795 26 973
142 003 145 481
Allocation to / (use of) restructuring provision - ( 22 100) 15 500 12 079
157 503 135 460
Purchases of tangible fixed assets ( 52 430) ( 46 592)Sales / purchases of investment securities 55 656 ( 23 389)Other changes 1 079 ( 26 163)
4 305 ( 96 144)
( 19 110) ( 22 463) 142 698 16 853
Cash and cash equivalents at beginning of year 113 656 96 803 256 354 113 656 Cash and cash equivalents at end of year
Net cash provided by operating activities
Net cash provided by (used in) investing activities
Net cash used in financing activitiesNet increase / (decrease) in cash and cash equivalents
CHF 000 (IFRS)
Net income for the year allocated to parent company shareholders
Cash flows before change in working capital and provisions (cash)
Change in current assets and other cash flows from operating activities

77
KEY FIGURESKEY FIGURES 1.
CHF 000 (IFRS)31.12.2005 31.12.2004 31.12.2003
restated31.12.2002
restated31.12.2001
Net revenues 482 096 480 192 477 837 453 657 438 910
Gross margin 292 482 323 315 322 396 317 419 234 292 As % of net revenues 60.67% 67.33% 67.47% 69.97% 53.38%
Operating expenses ( 130 537) ( 140 822) ( 140 409) ( 140 077) ( 127 127)Financial restructuring costs - - - - ( 160 000)
EBITDA 161 945 182 493 181 987 177 342 ( 52 835)As % of net revenues 33.59% 38.00% 38.09% 39.09% -12.04%
EBIT 135 729 138 565 109 524 132 099 ( 93 667)As % of net revenues 28.15% 28.86% 22.92% 29.12% -21.34%
Equity in net income of affiliated companies 9 523 12 489 48 969 35 687 47 861
Net income / (net loss) 124 605 121 194 123 804 130 819 ( 31 855)As % of net revenues 25.85% 25.24% 25.91% 28.84% -7.26%

88
1.KEY FIGURESKEY FIGURES
CHF 000 (IFRS)31.12.2005 31.12.2004 31.12.2003
restated31.12.2002
restated31.12.2001
Free Cash Flow (FCF) 103 696 84 663 ( 4 964) 85 000 n.a.
Non-current assetsoperating assets 729 726 707 241 713 137 744 904 689 956 financial assets 496 278 457 329 409 037 347 510 249 649
1 226 004 1 164 570 1 122 174 1 092 414 939 605
Net cash / (net debt) 133 520 40 677 ( 4 412) ( 5 461) ( 42 195)
Shareholders' equity 1 187 558 1 055 198 945 739 799 384 602 881 As % of total assets 72.35% 68.90% 65.20% 53.40% 46.10%

99
PROFITABILITY RATIOSPROFITABILITY RATIOS 1.
1) Group net income / total shareholders' equity2) NOPAT / (Working capital + operating assets)
31.12.2005 31.12.2004 31.12.2003 restated
31.12.2002 restated
EBITDA as % of net revenues 33.59% 38.00% 38.09% 39.09%
EBIT as % of net revenues 28.15% 28.86% 22.92% 29.12%
Group net income as % of net revenues 25.85% 25.24% 25.91% 28.84%
Earnings per share in CHF 106 107 115 109
Return on Equity 10.49% 11.50% 13.10% 16.40%
Return on Capital Employed (AT) 15.00% 15.50% 12.80% 17.70%
Average staff numbers (FTEs) 738 741 725 709
1)
2)

1010
2. ENTERPRISE VALUEand FINANCIAL POLICY

1111
ENTERPRISE VALUEENTERPRISE VALUE 2.
CHF 000 (IFRS) 31.12.2005 31.12.2004 31.12.2003
Market capitalization 1 414 561 1 271 454 977 295 Minority interests 39 878 32 417 30 667 Net debt / (net cash) ( 133 520) ( 40 677) 4 412
Entreprise Value including financial assets 1 320 919 1 263 194 1 012 374
Less financial assets ( 496 278) ( 457 329) ( 409 037)
Enterprise Value excludingfinancial assets 824 641 805 865 603 337
1212
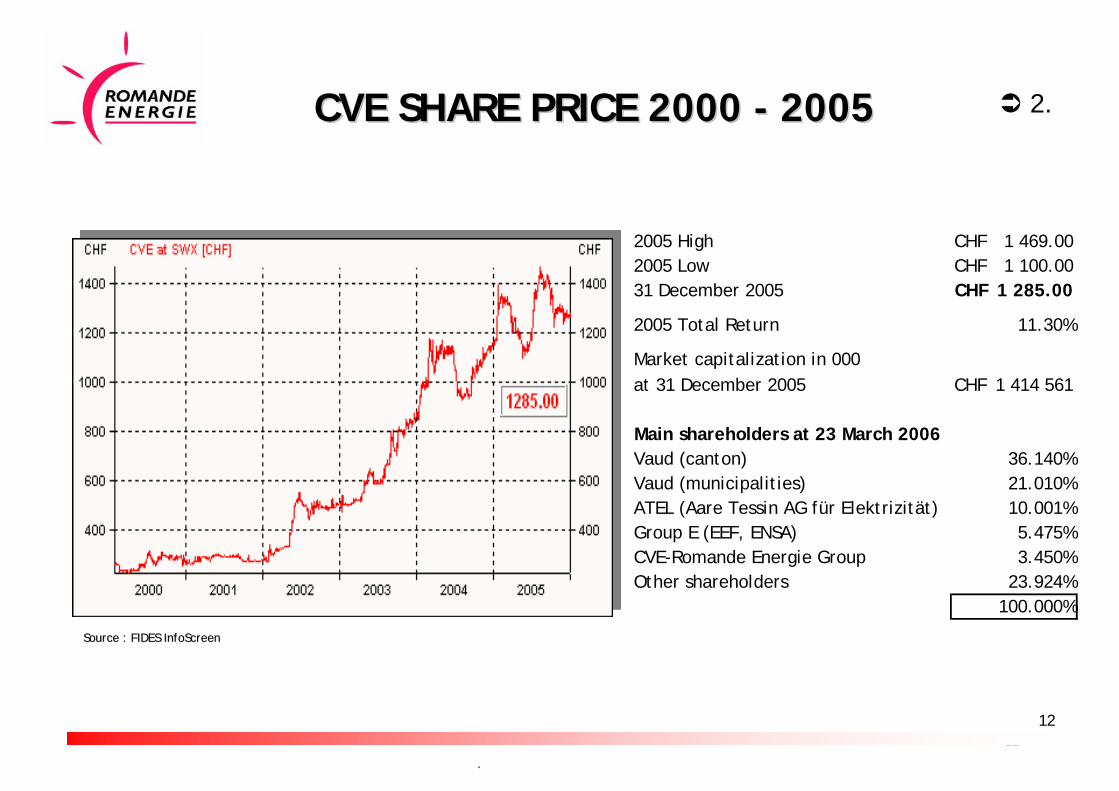
CVE SHARE PRICE 2000 CVE SHARE PRICE 2000 -- 20052005
..
Source : FIDES InfoScreenSource : FIDES InfoScreen
2.
2005 High 1 469.00CHF 2005 Low 1 100.00CHF 31 December 2005 1 285.00CHF
2005 Total Return 11.30%
Market capitalization in 000at 31 December 2005 1 414 561CHF
Main shareholders at 23 March 2006Vaud (canton) 36.140%Vaud (municipalities) 21.010%ATEL (Aare Tessin AG für Elektrizität) 10.001%Group E (EEF, ENSA) 5.475%CVE-Romande Energie Group 3.450%Other shareholders 23.924%
100.000%

1313
VALUATION RATIOSVALUATION RATIOS 2.
31.12.2005 31.12.2004 31.12.2003 restated
31.12.2002 restated
PER 12.1 9.7 6.9 3.9
Price / FCF 13.6 15.0 n/a 6.6
Price / Book Value 1.2 1.2 1.1 0.7
Enterprise Value / EBITDA 5.1 4.4 3.3 1.5

1414
*Benchmark = listed Swiss electricity companies (source: Bloombe*Benchmark = listed Swiss electricity companies (source: Bloomberg)rg)
PAYOUT RATIOPAYOUT RATIO 2.
DESPITE PRESSURE ON ITS MARGINS, ROMANDE ENERGIE IS INCREASING ITS DIVIDEND FOR 2005. THE GROUP'S LONG-TERM OBJECTIVE IS TO BE IN LINE WITH THE BENCHMARK* 25.3 % IN 2005

1515
FINANCIAL POLICYFINANCIAL POLICY
..
2.
Selecting investments with a higher profitability than the average cost of capital
Growing faster than the market
Reducing expenditure and sticking to our cost-down program
Maintaining and promoting good relations between management and employees
Ensuring our balance sheet stays sound
Our main goal is to create value for our shareholders, with the support of the other stakeholders and our employees, by:

1616
OUR GOALOUR GOAL: CREATING SHAREHOLDER : CREATING SHAREHOLDER VALUE OVER THE LONG TERM VALUE OVER THE LONG TERM
Market capitalization at 31 December 2005 (CHF 000): 1 414 561
2.

1717
FINANCIAL CALENDAR 2006
6 April Results for 2005
7 April Analysts/Investors Presentation of Results for 2005
19 May Annual General Meeting
24 May Ex dividend
13 September First-Half Results for 2006

1818
3. A LOOK AT THE MARKET
The new challenges:• Liberalization• Supplies

1919
MARKET LIBERALIZATION: SWITZERLAND AND THE REST OF EUROPE
MARKET LIBERALIZATION: SWITZERLAND AND THE REST OF EUROPE
3.
2006200688% of consumers 88% of consumers have a choicehave a choice
1.07.20071.07.2007100% of consumers will100% of consumers willhave a choicehave a choice
Source: Eurelectric, 1.1.2005 (Europe of the 15)
Greece (62 %)
Portugal (100 %) Spain
(100 %)
France (70 %)
Ireland (56 %)
United Kingdom (100 %)
Belgique (90 %) Germany (100 %)
Austria (100 %)
Italy(79 %)
Denmark (100 %)Sweden (100 %)
Finland (100 %)
Netherlands (100 %)
Luxembourg (57 %)
Norway(100 %)
The onlynon-deregulatedcountry
2020
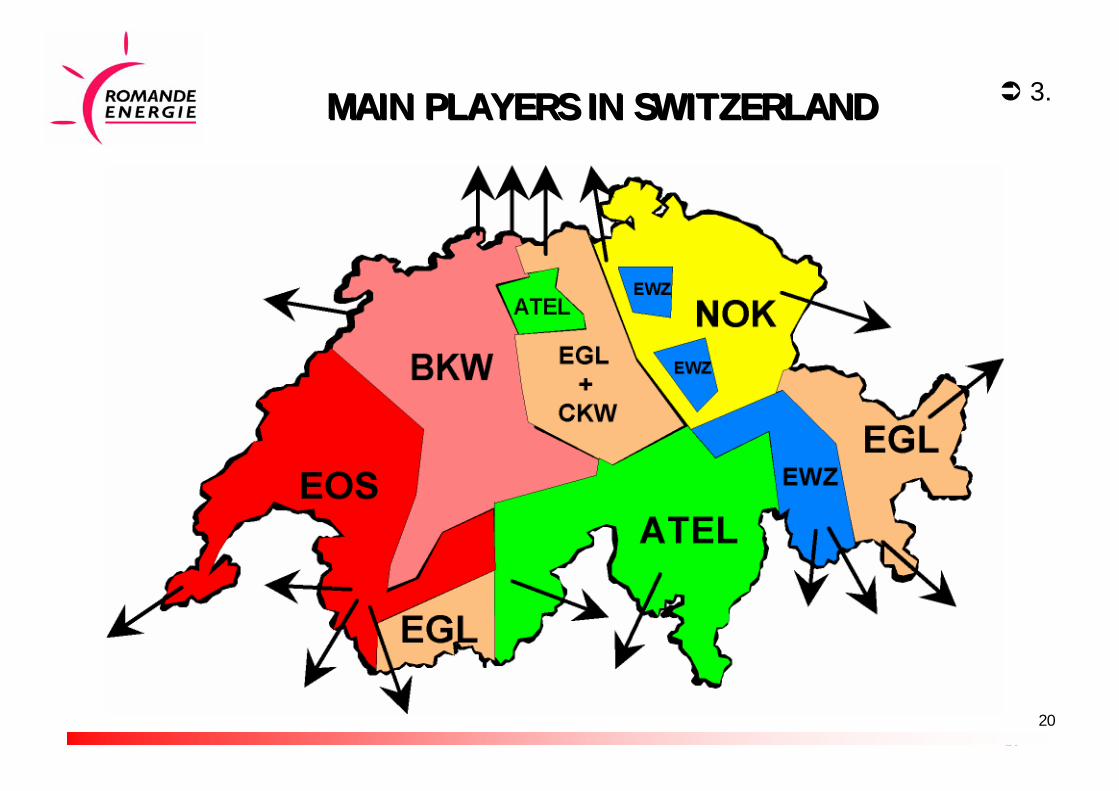
MAIN PLAYERS IN SWITZERLAND MAIN PLAYERS IN SWITZERLAND 3.

2121
LApEl: MARKET DEREGULATION IN 2 STAGESLApEl: MARKET DEREGULATION IN 2 STAGES
1st stage 2nd stage
Partial deregulationPartial deregulation Electricity supply Electricity supply model assuredmodel assured
Large customers >100 MWh free
Small captive customers
Large customers >100 MWh free
Final customers with freedom of choice
Optional referendum ?
1.7.07 2012 temps
3.

2222
• End of national monopolies• Regulatory pressures on transmission and
distribution• Markets with more products and more competitors• Fierce global competition
• Price ?• Margin
CONSEQUENCES OF MARKET DEREGULATION IN SWITZERLAND
CONSEQUENCES OF MARKET DEREGULATION IN SWITZERLAND
A. In general
3.

2323
• New strategies to be developed for• Production• Transmission (THT)• Distribution (HT / MT / LT)• Sales
Critical mass to be found for each activity
• "Colleagues" will have to learn to be competitors • Alliances, acquisitions and mergers will offer companies
different ways to increase their size• Customer services will expand differentiation
B. For electricity companies
CONSEQUENCES OF MARKET DEREGULATION (2)
CONSEQUENCES OF MARKET DEREGULATION (2)
3.

2424
• More frequent price movements (up and down)• Transparent costs• Relations with several operators :
• Energy sales• Energy distribution
C. For the consumer
• The consumer is treated as a genuine clientclient
CONSEQUENCES OF MARKET DEREGULATION (3)
CONSEQUENCES OF MARKET DEREGULATION (3)
3.

2525
Supply guaranteed Supply guaranteed for how long ?for how long ?
SECURITY OF SUPPLYSECURITY OF SUPPLY 3.

2626Source: VGB – Figures and Facts about Electricity Generation 2004
DEVELOPMENT OF ELECTRICITY GENERATION IN EUROPE
DEVELOPMENT OF ELECTRICITY GENERATION IN EUROPE
3.

2727
GROWTH IN CONSUMPTIONGROWTH IN CONSUMPTION
In Switzerland: average growth of 1.8% over the past 10 yearsEnergie 2000 + Suisse Energie efforts insufficient due to:
Increase in economic activityDemographic pressureLevel of household electrical fittings
2005 = first year in which Switzerland imported more energy thanit exported
Switzerland already dependent on other countriesConsumption forecast to rise (20-30 years)
Sources: AXPO, OFEN, AES
3.

2828
RESPONSIBILITY OF ELECTRICITY COMPANIESRESPONSIBILITY OF ELECTRICITY COMPANIES
Guarantee a supply of electricity that meets the needs ofbusinesses andhouseholds
As far as possible, give preference to primary energies with thesmallest environmental impact
3.
At least twofold:

2929
New sources of supply are necessary because of:Higher consumptionExpiry of long-term import contractsDecommissioning of the first nuclear power plants
Recent studies have highlightedSupply shortfalls over the medium term: from 2012 or 2028 onwards, depending on the scenario
Sources: AXPO, OFEN, AES
PROGRAMMED SHORTFALLSPROGRAMMED SHORTFALLS 3.

3030
WHAT ARE THE SOLUTIONS ?WHAT ARE THE SOLUTIONS ?
The "supply mix ":
Stabilization of demand for electricity => public awarenessRenewal and strengthening of long-term import contractsDevelopment of new forms of renewable energyDevelopment of hydraulic energyReplacement and development of nuclear power stationsConstruction of power stations combined cycle gas turbine (CCGT)
All these measuresMust be carried out simultaneouslyRequire implementation periods which are variable, but generally longHave their limits, taken individually
3.

3131
4. HOW DO WE MEET THESECHALLENGES ?
ROMANDE ENERGIEIS READY FOR CHANGE:
• Our vision• Our mission• Our strategy

3232
OUR VISIONOUR VISION 4.
We want to expand our operations:
• as a key player in the Swiss electricity market,
• in the tradingtrading and distribution distribution of electricity,
• while enhancing the valuevalue and imageimageof our company.

3333
OUR MISSIONOUR MISSION 4.
• We help companies improve their performanceperformanceand contribute to people’s comfort.
• We guarantee toptop--qualityquality public service public service in the distributiondistribution of electricity, in an open marketopen market, at competitive pricescompetitive prices.
• We ensure profitability profitability in line with theexpectations of our shareholdersshareholders.

3434
THE MAIN LINES OF OUR STRATEGYTHE MAIN LINES OF OUR STRATEGY
Taking care of the environment
A producer and distributor
Excelling on the sales front
On a growth track
At the regional and national level
Contributing to the comfort and security of its customers
Romande Energie wants to strengthen its role as a leadingplayer in the electricity sector
4.

3535
O S E RO S E R
OUR VISION AND MISSION SYMBOLIZEDIN ONE WORD:
4.
3636
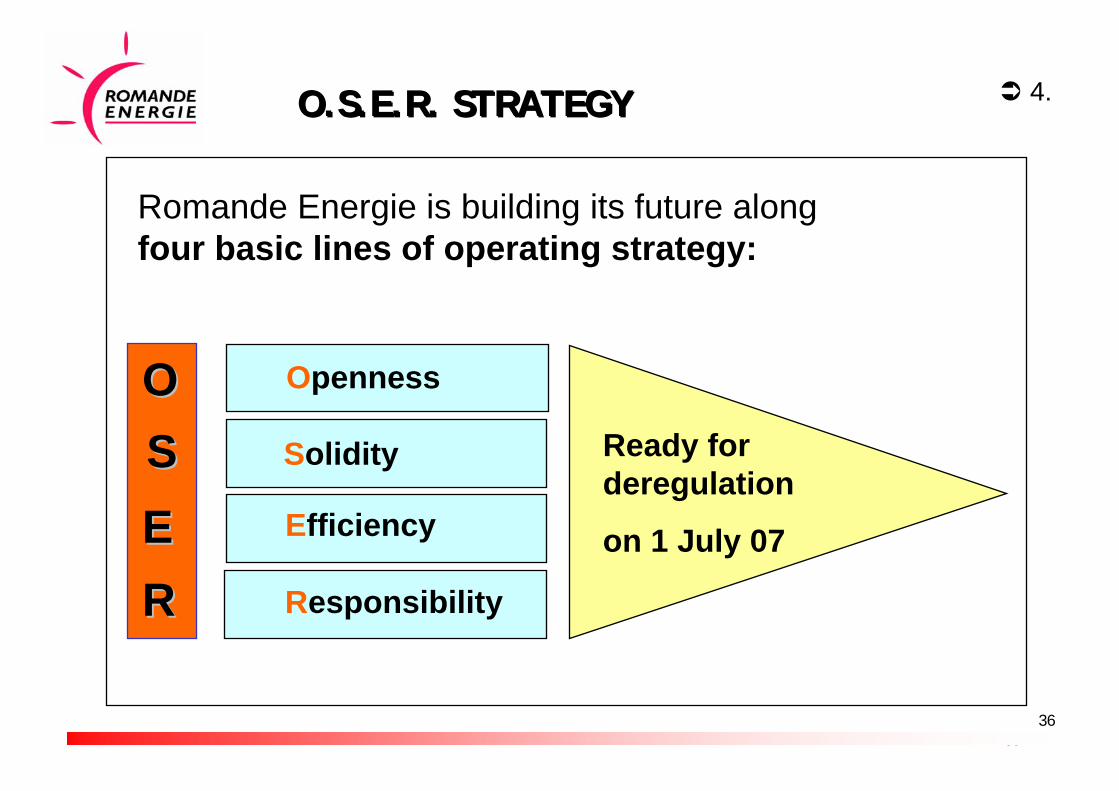
O.S.E.R. STRATEGY O.S.E.R. STRATEGY 4.
Romande Energie is building its future alongfour basic lines of operating strategy:
Responsibility
Efficiency
Solidity
Openness
Ready for deregulation
on 1 July 07
OOSSEERR

3737
OPENNESSOPENNESS
Some examples
Development of relations with existing and potential partners, including those outside the canton where appropriate
Preparation for winning new clients
Development of activities in new fields (services, renewable energy sources, etc.)
4.

3838
SOLIDITYSOLIDITY
Some examples
Stepping up own-power generation capacity
Strengthening relations with production partners
Medium- and long-term supply strategy on the market
4.

3939
EFFICIENCYEFFICIENCY
Some examples
Enhancing our operational and financial performance:
Stepping up profitability (products, operating costs, overheads, etc.)Sound asset management
Continuing efforts to create synergies with other electricity companies (partnerships)
Promotion of kWh: for example, PAC
4.
4040
RESPONSIBILITYRESPONSIBILITY
Some examples
Guaranteeing safe and easily accessible energy supplies
Promoting the use of renewable forms of energy
Being a modern and attractive employer
4.

4141
BUSINESS SEGMENTS UNDERPINNING OUR STRATEGY
BUSINESS SEGMENTS UNDERPINNING OUR STRATEGY
4.
Marketing
Distribution
Production
Mastering our future
The OSEROSER strategy revolves around three strong and complementary business areas

4242
5. NEW ARTICLES OFASSOCIATION
• Registered shares• Number of directors• Corporate name

4343
Replacement of bearer shares by registered sharesReduction in number of directors from15 to 11Vaud Cantonal Government continues to appoint :
6, including 2 representatives of municipalitiesNew corporate name for the Group :
Romande Energie Holding SA
NEW ARTICLES OF ASSOCIATIONNEW ARTICLES OF ASSOCIATION
Main changes
5.

4444
Thank you for your kindattention
We would be pleased toanswer your questions

4545
THIS PRESENTATION IS NOT BEING ISSUED IN THE UNITED STATES OF AMERICA AND SHOULD NOT BE DISTRIBUTED TO UNITED STATES PERSONS OR PUBLICATIONS WITH A GENERAL CIRCULATION IN THE UNITED STATES. THIS DOCUMENT DOES NOT CONSTITUTE AN OFFER OR INVITATION TO SUBSCRIBE FOR OR PURCHASE ANY SECURITIES. IN ADDITION, THE SECURITIES OF ROMANDE ENERGIE SA HAVE NOT BEEN REGISTERED UNDER THE UNITED STATES SECURITIES LAWS AND MAY NOT BE OFFERED, SOLD OR DELIVERED WITHIN THE UNITED STATES OR TO U.S. PERSONS ABSENT FROM REGISTRATION UNDER AN APPLICABLE EXEMPTION FROM THE REGISTRATION REQUIREMENTS OF THE UNITED STATES LAWS.
Contact:Groupe CVE-Romande Energie SARue de Lausanne 53Case postaleCH-1110 Morges 1
Investor Relations:René LaucknerPhone: +41 21 802 95 24Fax: + 41 21 802 95 18E-Mail: [email protected]
This English translation is based on the French original. In casThis English translation is based on the French original. In case of doubt the original French text shall prevail.e of doubt the original French text shall prevail.