annual report 2011 - kuehne + nagel...annual report 2011 network and product portfolio kuehne +...
TRANSCRIPT

ANNUAL REPORT 2011
NET WORK AND PRODUCT PORTFOLIO
KUEHNE + NAGEL ACCELERATES EXPANSION

READ MORE IN THIS PUBLIC ATION �
The international growth markets are a decisive factor forfuture success. At the same time, state-of-the-art logisticsservices are crucial for emerging markets. For that reasonwe are expanding our global network and product port-folio continuously. For our customers. For our investors. And for the world of tomorrow.
COLOMBIA
CHINA
INDIA
BRAZIL
EXPANSION OF OUR NET WORK AND PRODUCT PORTFOLIO 2011

COLOMBIA_BRAZIL
GROWTH IN BRAZIL*: 2010 2011 2012 2013
GDP in % 7.49 3.77 3.63 4.15
EXPORTS OF GOODS in % 9.44 8.45 6.14 7.51
POPULATION in millions 193.25 194.93 196.53 198.04
GROWTH IN COLOMBIA*: 2010 2011 2012 2013
GDP in % 4.29 4.87 4.46 4.46
EXPORTS OF GOODS in % 1.45 10.85 6.22 6.98
POPULATION in millions 45.51 46.05 46.60 47.15
*Source: International Monetary Fund, World Economic Outlook Database September 2011
PERFECTLY POSITIONEDKUEHNE + NAGEL MOBILISES NEW MARKETS
EXPANSION NET WORK AND PRODUCT PORTFOLIO
HIGH-CL ASS LOGISTICS FOR A FAST-GROWING CONTINENT
ON THE CARIBBEAN COAST OF COLOMBIA IN THE NORTH OF THE COUNTRY,
KUEHNE + NAGEL BROUGHT A MODERN LOGISTICS FACILIT Y INTO SERVICE IN 2011.
ALSO IN 2011, THREE COMPANIES SPECIALISING IN LOGISTICS SERVICES FOR
PERISHABLES WERE ACQUIRED IN COLOMBIA AND ECUADOR. IN ADDITION,
THE BRAZILIAN GRUPO EICHENBERG BECAME A MEMBER OF THE GROUP. KUEHNE + NAGEL
CAN NOW OFFER INTEGRATED DOOR-TO-DOOR LOGISTICS SOLUTIONS AND SPEED
UP THE STRATEGICALLY IMPORTANT EXPANSION OF ITS ACTIVITIES IN BRAZIL.

CARTAGENA / COLOMBIA
SÃO PAULO / BRAZIL

EXPANSION NET WORK AND PRODUCT PORTFOLIO
THE COLOMBIAN COASTAL CIT Y OF CARTAGENA HAS BEEN ON THE WAY TOBECOMING A GLOBAL LOGISTICS HUB.THERE, KUEHNE + NAGEL HAS BROUGHTA FUTURE-ORIENTED LOGISTICS CENTREIN OPERATION IN 2011.
The state-of-the-art facility was completed in
just 12 months and is located inside the port
of Contecar in Cartagena. The logistics and
distribution centre serves the South American
Kuehne + Nagel organisation as a regional
hub and a base for a wide range of contract
logistics services.

The port of Contecar is of crucial strategic
importance, since from 2013 it will be able to
handle Postpanamax ships with a capacity of
up to 12,000 TEU. This advantage will fully
materialise in 2014 – the year the widening
of the nearby Panama Canal is due to be
completed.
Since 2011, the Colombian companies Trans-
lago S.A.S. and Agencia de Aduanas Excelsia
Ltda. and Mastertransport S.A., Ecuador, all
of them leading specialists in perishables
logistics, are members of the Kuehne + Nagel
Group. This has made Kuehne + Nagel South
America’s leading provider of logistics services
for perishables.
COLOMBIA
EXPANSION NET WORK AND PRODUCT PORTFOLIO
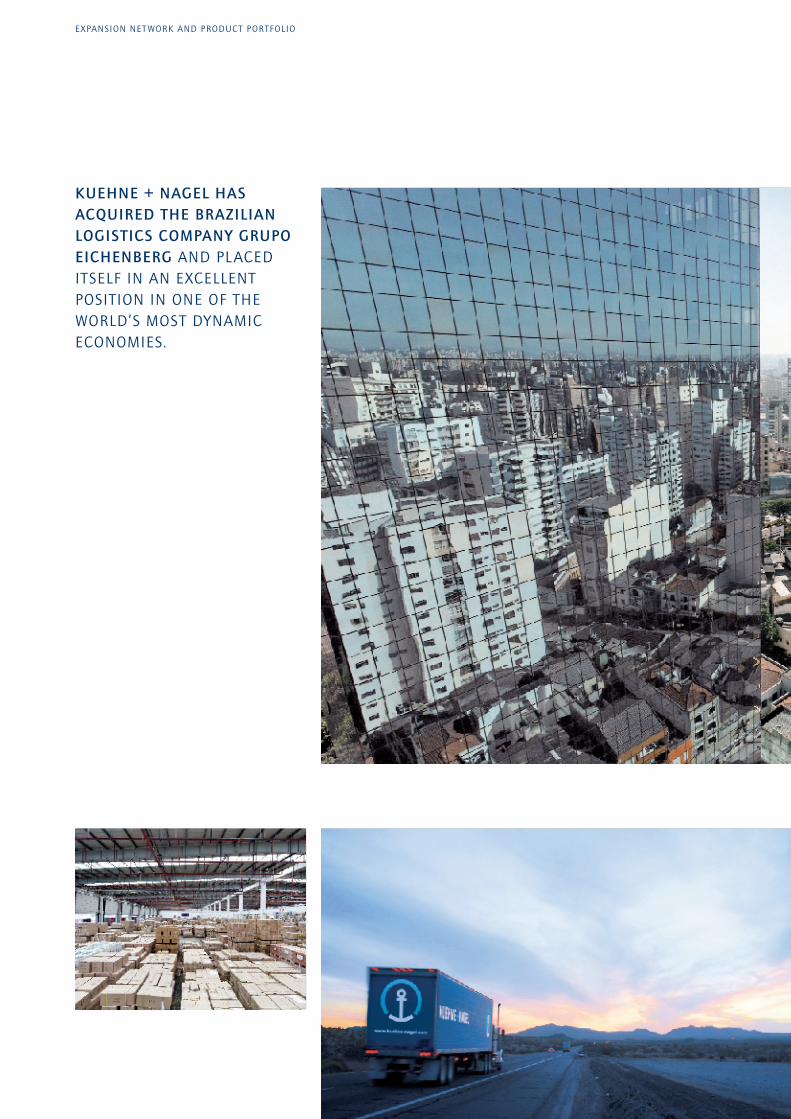
KUEHNE + NAGEL HAS ACQUIRED THE BRAZILIAN LOGISTICS COMPANY GRUPOEICHENBERG AND PLACED ITSELF IN AN EXCELLENT POSITION IN ONE OF THEWORLD’S MOST DYNAMIC ECONOMIES.

Grupo Eichenberg, headquartered in Porto
Alegre, can look back on a 75-year history.
Managed by the family’s third generation the
company is one of the leading overland trans-
port providers in both the domestic market
and in trade with Mercosur countries, where,
for instance, it provides daily services to and
from Argentina, Chile and Uruguay.
Grupo Eichenberg is also a highly successful
player in the Brazilian airfreight business –
a logistics sector that plays a leading role in a
country that occupies the world’s fifth largest
land area.
BRAZIL
In Brazil, Kuehne + Nagel partners with
a globally operating event management
specialist. Thus, Kuehne + Nagel is well
positioned for the major sports events in
2014 and 2016.

COLOMBIA
EC.
PORTO ALEGRE
QUITO
BOGOTÁ
C ARTAGENAINT. DISTRIBUTION CENTER
PERISHABLES:
REGUL AR AIRFREIGHT
SERVICES TO ASIA ,
NORTH AMERIC A AND
EUROPE
HOUSTON
BABEL-MANDAB
HORMUZ
GIBRALTAR
MAGELL AN
C APE OF
GOOD HOPE
SUEZ C ANAL
PANAMA C ANAL
SALVADOR
SÃO PAULO
CURITIBA
ITAJAI
ALL MAJOR SHIPPING
COMPANIES L INK
C ARTAGENA WITH PORTS
IN SOUTH AMERIC A ,
CENTRAL AMERIC A
AND THE C ARIBBEAN
BRAZIL
EXPANSION NET WORK AND PRODUCT PORTFOLIO
IMPORTANT HUBS
OF WORLD TRADE
KUEHNE + NAGEL ACCELERATES EXPANSION IN COLOMBIA AND BRAZIL

EXPANSION NET WORK AND PRODUCT PORTFOLIO
TRUE GREATNESS SHOWS IN THE DETAILKUEHNE + NAGEL GROWS WITH ITS CHALLENGES
CHINA AND INDIA:
EXPANSION IN ASIA’S LEADING COUNTRIES
KUEHNE + NAGEL HAS STARTED TO ESTABLISH OVERL AND TRANSPORT
ACTIVITIES IN CHINA. AT THE SAME TIME, NEW LOCATIONS HAVE BEEN ADDED TO
THE EXISTING NETWORK. IN INDIA, TOO, THE DEMAND FOR INDUSTRY-SPECIFIC
LOGISTICS SOLUTIONS IS CONSTANTLY INCREASING. KUEHNE + NAGEL HAS RESPONDED
TO THIS DEMAND BY ESTABLISHING AN AUTOMOTIVE COMPETENCE CENTRE IN PUNE
AND SELECTIVELY EXPANDS ITS ACTIVITIES ON THE SUBCONTINENT.
INDIA_CHINA
GROWTH IN CHINA*: 2010 2011 2012 2013
GDP in % 10.33 9.47 9.04 9.49
EXPORTS OF GOODS in % 24.16 15.56 12.15 14.40
POPULATION in billions 1.341 1.348 1.355 1.361
GROWTH IN INDIA*: 2010 2011 2012 2013
GDP in % 10.09 7.84 7.53 8.10
EXPORTS OF GOODS in % 19.85 15.36 14.54 11.90
POPULATION in billions 1.190 1.207 1.223 1.239
*Source: International Monetary Fund, World Economic Outlook Database September 2011

BEIJING / CHINA
MUMBAI / INDIA

EXPANSION NET WORK AND PRODUCT PORTFOLIO
BY THE END OF 2011, KUEHNE + NAGEL EXTENDED ITS PRESENCE TO 36 CHINESE CITIES. THIS DYNAMIC PROCESS WILL CONTINUE IN 2012.
NEW KUEHNE + NAGEL
LOC ATIONS IN CHINA 2011:
CHANGSHA
FUZHOU
KUNMING
LUOYANG
MIANYANG
TAIC ANG
WUXI
YANGZHOU
YINCHUAN
ZENGZHOU

CHINA
Kuehne + Nagel offers an extensive service
portfolio in all parts of China. This includes
international sea and airfreight, contract
logistics, industry-specific solutions, overland
transport and value-added services.
An important element in this comprehensive
logistics package is the regular road logistics
service between Shanghai and Tianjin which
Kuehne + Nagel has offered since April 2011.
The route with a length of more than
1,200 kilometres is covered by three services
per week in each direction. Currently, regular
services exist between eight major Chinese
cities.
EXPANSION NET WORK AND PRODUCT PORTFOLIO
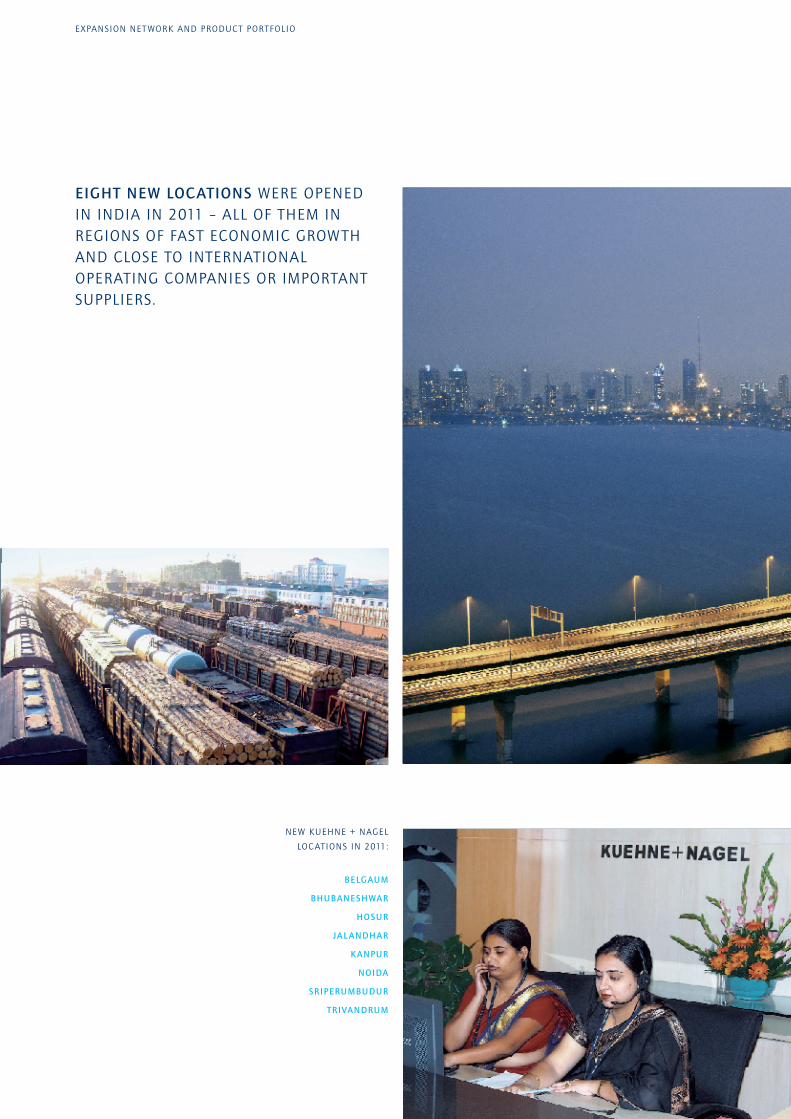
EIGHT NEW LOCATIONS WERE OPENED IN INDIA IN 2011 – ALL OF THEM IN REGIONS OF FAST ECONOMIC GROWTHAND CLOSE TO INTERNATIONAL OPERATING COMPANIES OR IMPORTANTSUPPLIERS.
NEW KUEHNE + NAGEL
LOC ATIONS IN 2011:
BELGAUM
BHUBANESHWAR
HOSUR
JAL ANDHAR
KANPUR
NOIDA
SRIPERUMBUDUR
TRIVANDRUM

The new automotive competence centre in
Pune is based on the model of the facilities in
Bremen and Shanghai. The choice of this
location was a far-sighted one, for the city is
increasingly developing into the centre of
India’s automobile industry and many manu-
facturers and component suppliers are head-
quartered or have production plants there.
Out of Pune, Kuehne + Nagel’s dedicated
automotive logistics team develops and imple-
ments a comprehensive range of tailor-made
services. The spectrum of services extends
from just-in-time and just-in-sequence deliveries
to inventory management (Vendor Managed
Inventory) and emergency logistics.
INDIA

HONG KONG
DELHI
SHANGHAI
ZHENGZHOU
TAICANGYANGZHOUCHINA
INDIA
TIANJIN
QINGDAO
BELGAUM
AGRA
PANIPAT
MANESAR
MUMBAI
JAL ANDHAR
CHENGDU
CHONGQING
BEIJING
HAMBURG
ROTTERDAM
ANT WERP
PIRAEUS
SUEZ C ANAL
SINGAPORE
BABEL-MANDAB
HORMUZ
RUDRAPUR
EXISTING NET WORK
ADDITIONS TO NET WORK
EXPANSION NET WORK AND PRODUCT PORTFOLIO
KUEHNE + NAGEL EXPANDS ITS NETWORKIN CHINA AND INDIA
IMPORTANT HUBS
OF WORLD TRADE

KUEHNE + NAGEL GROUP KEY DATA
CHF million 2007 1 2008 2009 2010 2011
Invoiced turnover 20,975 21,599 17,406 20,261 19,596
Gross Profit 6,014 6,253 5,863 5,958 5,898
% of turnover 28.7 29.0 33.7 29.4 30.1
EBITDA 1,019 1,020 885 1.004 978
% of gross profit 16.9 16.3 15.1 16.9 16.6
EBIT 693 736 594 765 750
% of gross profit 11.5 11.8 10.1 12,8 12.7
EBT 708 764 610 767 766
% of gross profit 11.8 12.2 10.4 12.9 13.0
Earnings for the year (Kuehne + Nagel share) 536 585 467 601 601
% of gross profit 8.9 9.4 8.0 10.1 10.2
Depreciation, amortisation and impairment
of intangible assets and goodwill 326 284 291 239 228
% of gross profit 5.4 4.5 5.0 4.0 3.9
Operational cash flow 1,043 1,015 893 992 978
% of gross profit 17.3 16.2 15.2 16.6 16.6
Capital expenditures for fixed assets 231 245 264 134 207
% of operational cash flow 22.1 24.1 29.6 13.5 21.2
Total assets 6,438 5,555 5,933 5,941 6,141
Non-current assets 2,119 1,864 2,456 2,058 2,239
Equity 2,367 2,073 2,290 2,378 2,405
% of total assets 36.8 37.3 38.6 40.0 39.2
Total headcount at year end 51,075 53,823 54,680 57,536 63,110
Personnel expenses 3,396 3,518 3,341 3,391 3,386
% of gross profit 56.5 56.3 57.0 56.9 57.4
Gross profit in CHF 1,000 per FTE 118 116 107 104 93
Personnel expenses in CHF 1,000 per FTE 66 65 61 59 54
Basic earnings per share (nominal CHF 1) in CHF
Consolidated earnings for the year
(Kuehne + Nagel share) 2 4.54 4.96 3.95 5.06 5.04
Distribution in the following year 1.90 2.30 2.30 2.75 3.85
in % of the consolidated net income for the year 41.8 46.4 58.2 54.6 76.4
Development of share price
SIX Swiss Exchange (high/low in CHF) 131/91 113/57 104/53 137/92 139/92
Average trading volume per day 195,916 331,536 295,884 190,910 170,427
1 Restated for comparison purposes.
2 Excluding treasury shares.
3 Excluding extraordinary dividend.
4 Excluding payment of capital contribution reserves.
3 4

CONTENTS
KUEHNE + NAGEL GROUP
KEY DATA
REPORT OF THE BOARD OF DIRECTORS
REPORT OF THE MANAGEMENT BOARD
STATUS REPORT
Turnover
Income
Financial position
Investments, depreciation and amortisation
Planned investments in 2012
Shareholder return
REPORTS OF THE BUSINESS UNITS
Seafreight
Airfreight
Road & Rail Logistics
Contract Logistics
Real Estate
Insurance Broker
SUSTAINABILIT Y
Human Resources
Kuehne Foundations
Quality, Safety, Health
and Environment
Information Technology
GLOBAL NETWORK
3
8
13
13
13
16
17
19
20
22
22
24
26
28
30
32
34
34
36
39
41
42
44
56
56
57
58
59
60
61
71
113
114
120
120
121
122
131
132
CORPORATE GOVERNANCE
CONSOLIDATED FINANCIAL
STATEMENTS 2011 OF THE
KUEHNE + NAGEL GROUP
Income Statement
Statement of Comprehensive Income
Balance Sheet
Statement of Changes in Equity
Cash Flow Statement
Notes to the Consolidated
Financial Statements
Other Notes
Report of the Statutory Auditors
on the Consolidated Financial
Statements
Significant Subsidiaries and
Joint Ventures
FINANCIAL STATEMENTS
2011 OF KUEHNE + NAGEL
INTERNATIONAL AG
Income Statement
Balance Sheet
Notes to the Financial Statements 2011
Report of the Statutory Auditors
Corporate Timetable 2012
�

The Board of Directors2
KARL GERNANDT, Chairman of the Board of Directors

Klaus-Michael Kuehne assigns Chairman function to Karl Gernandt and is elected Honorary ChairmanAt a meeting following the Annual General Meeting of May 10,
2011, the Board of Directors elected Karl Gernandt as Chairman
of the Board of Directors in accordance with the recommen-
dation of Klaus-Michael Kuehne. With this step the Honorary
Chairman of Kuehne + Nagel International AG, Klaus-Michael
Kuehne, continued the implementation of his personal succes-
sion plan.
Board of DirectorsAt the Annual General Meeting in May 2011, Juergen Fitschen,
Karl Gernandt, Hans-Joerg Hager, Klaus-Michael Kuehne,
3REPORT OF THE BOARD OF DIRECTORS
Strong volume growthNet profit up by 12.2 per cent in local currencies
Ladies and Gentlemen
The year 2011 was marked by currency and market turbulences, political unrest and devastating natural disasters which resulted in far-reaching social and economic changes. In this challenging environment the Kuehne + Nagel Group firmly stayed on course for its strategic objectives. The company concentrated on further increasing the attractiveness of its industry-specific logistics offering, and focused its investments on regions with a largemarket potential. The Group made complementary acquisitions and, at the same time, main-tained a high level of internal efficiency as measured by the ratio between gross profit andEBIT. Net earnings were slightly above the previous year and reached with CHF 606 million a new record high (currency adjusted: increase of 12.2 per cent). Due to the strong SwissFranc, turnover decreased by 3.3 per cent to CHF 19,596 million (currency adjusted: increaseof 9.3 per cent). The Board of Directors is satisfied with the results 2011 and is confident that the implementation of the global strategy will again contribute to the positive deve-lopment of the Group in 2012.
Hans Lerch, Dr. Wolfgang Peiner, Dr. Thomas Staehelin,
Dr. Joerg Wolle and Bernd Wrede were re-elected for a further
one-year term. Dr. Joachim Hausser and Dr. Georg Obermeier,
whose terms of office expired with the Annual General Meeting,
did not stand for re-election.
Dr. Renato Fassbind, a Swiss citizen, was elected to the Board of
Directors for a one-year term. By his election an experienced
financial expert is member of the highest decision-making body
of the Kuehne + Nagel Group. Dr. Fassbind was Chief Financial
Officer of the Credit Suisse Group AG and Credit Suisse AG from
2004 until October 2010. In this function he was a member of
the Executive Boards of the Credit Suisse Group AG and Credit
Suisse AG from 2004 onwards.

Board committeesThe Board of Directors’ regular committees are the Audit, the
Chairman’s and the Nomination and Compensation Committee.
In 2011, the committees took place quarterly with the respective
chairmen reporting on issues at subsequent meetings of the
Board of Directors.
Risk assessmentTogether with the Management Board the Audit Committee
makes a regular assessment of the Group’s business risks.
This assessment also includes investigations by international
competition authorities, in which Kuehne + Nagel has been
involved amongst others. On November 4, 2011, the United
States District Court for the District of Columbia has approved
the plea agreement between Kuehne + Nagel International AG
and the U.S. Department of Justice previously entered into on
September 30, 2010. Under this agreement Kuehne + Nagel
agreed to pay a fine of approximately USD 9.9 million to resolve
allegations that international freight forwarders coordinated
their activities with respect to establishing certain surcharges.
In approving the plea agreement and the recommended fine the
Department of Justice and the Court recognised that Kuehne +
Nagel provided substantial assistance to the U.S. authorities
through its early and extensive cooperation with the investi-
gation.
Management BoardAs of September 1, 2011, the Board of Directors newly
structured the responsibilities in the Management Board. Horst-
Joachim Schacht (responsible for seafreight) and Tim Scharwath
(responsible for airfreight) were appointed to the Management
Board of Kuehne + Nagel International AG. Peter Ulber, who
had been responsible for sea and airfreight previously, left the
company for personal reasons in September 2011. The assign-
ment of responsibility to two members of the Management
Board underscores the relevance of these two business units for
the company. At the end of 2011 the Management Board con-
sisted of seven members chaired by Reinhard Lange as Chief
Executive Officer (CEO).
Shareholder structureAt the end of 2011 the shareholder structure of Kuehne + Nagel
International AG was as follows:
— Kuehne Holding AG 53.3 per cent
— Free float 46.1 per cent
— Treasury shares 0.6 per cent
100.0 per cent
Economic environmentThe further recovery of the world economy softened in the
course of the year. According to 2011 figures available to date
global gross domestic product (GDP) was at 2.8 per cent (pre-
vious year: 4.0 per cent). The debt crisis in the Euro zone, the
structural problems in the USA, the earthquake disaster in
Japan, and, not least, the insecurity resulting from political
unrest in the Middle East and North Africa influenced the global
economic development. On the other hand the big emerging
countries in Asia and South America proved to be power houses
of growth. In China, for instance, GDP increased by 9.2 per cent
in 2011 although a loss of impetus became apparent in the
fourth quarter. Also worth mentioning is the robust state of
the German economy in 2011. According to initial calculations,
Germany's GDP grew by 3 per cent, a rate twice as high as in
the rest of the Euro zone.
Report of the Board of Directors4

Significant developments in overland transport were the growth
in volume resulting from the further increased density of the
European network and building-up of activities in growth mar-
kets (Brazil and Mercosur). A transaction of major strategic
importance was the acquisition of Drude Logistik, Bad Hersfeld,
whose highly functional hub facility will ensure efficiency and
productivity in the European groupage network. The RH Freight
Group in the UK, which was also acquired in the year under
review, contributed substantial transport volumes as well as
regular network services.
In contract logistics the year 2011 was marked by highly diver-
gent developments. The situation in North America was
improved by an effective restructuring, the closure of unprof-
itable locations and new business wins. Contract logistics activi-
ties in Germany developed very favourably, while in a number of
West European countries business suffered as a result of the con-
siderable decline in demand in trade and the consumer goods
industry. Particularly in France, the difficult development of the
results necessitated extensive restructuring measures. These will
continue to have some impact in the current fiscal year.
The internal efficiency of the Kuehne + Nagel Group, in combi-
nation with optimised IT-based processes, was the foundation
of its solid and sustained profitability. Growth in the net profit
was reduced by 12.2 per cent as a result of currency effects
amounting to CHF 74 million.
DividendIn view of the solid development of business and the sustainable
high cash flow of the Kuehne + Nagel Group, the Board of Direc-
tors will propose to the Annual General Meeting of May 8, 2012,
Logistics industry While transport and logistics volumes developed very positively in
the first half of 2011, growth steadily slowed in the second half of
the year. The disruption of supply chains following the disaster in
Japan and the marked rise in price of oil, had a negative impact.
Exceptions were individual regional and industry-specific market
segments which showed a constant growth in volume throughout
the year. These benefited logistics providers like Kuehne + Nagel
with a focus on appropriate regions or sectors and those who
were able to rapidly adapt their structures to the changing
volume situation.
The general trend towards consolidation in the logistics industry
continued, particularly during the first half of 2011. However,
there were no transactions on such a scale as to transform the
structure of the industry. The highly fragmented logistics industry
is still experiencing persistent pressure on profit margins. This sit-
uation induced the Kuehne + Nagel Group to make some notable
acquisitions in line with the strategy of focusing on specific
regions and industries which it has pursued since 2010.
Performance and resultsDue to the consistent implementation of the selective growth
programme, the Kuehne + Nagel Group outpaced the volume
growth of the market in all fields of activity. The performances
of the seafreight and airfreight business units were again the
main pillars of success. In both areas high internal productivity
and strict cost management compensated for the costs of
investments made in technology and product development and
strengthening of niche segments. The EBITDA margin in rela-
tion to the gross profit remained stable at the previous year's
level.
5Report of the Board of Directors

the distribution of a dividend increased by 40.0 per cent to
CHF 3.85 per share (previous year: CHF 2.75 per share), thus lift-
ing the payout ratio from 55 to 77 per cent. This reflects the
clear commitment of performance which is a driving force of the
Kuehne + Nagel Group in all business fields.
Summary and outlookIn 2011, under fluctuating market conditions, the Kuehne +
Nagel Group continued to pursue its strategic growth pro-
gramme and reached an important milestone. The company
substantially improved its competitive position, and in the
growth markets of Asia and South America future-oriented
investments were made in expanding the service portfolio.
The successful implementation of the business plans in road
logistics and the niche segment of perishables should also be
underlined. The Board of Directors and the Management Board
assume that the return of these investments will positively
impact the development of turnover and earnings in the years
to come. Efficiency increases are also expected from the
upgraded IT systems in sea and airfreight, which will be
brought into service in a substantially improved version in the
current business year.
Due to the still smouldering European debt and bank crisis
uncertainties still persist with regard to the economic develop-
ment in 2012. Particularly in the first half of the year, world
economy is expected to perform less dynamically. In this situa-
Report of the Board of Directors6
tion Kuehne + Nagel will rely on the optimisation of its invest-
ments and its ability to act with certainty and circumspection
in difficult situations and to support its customers as an indis-
pensable partner in the creation of greater added value.
The Board of Directors thanks all members of the management
and all employees for their committed and valuable contribu-
tions to the Group’s development and to the results in the year
2011, which are a remarkable achievement in view of the
macroeconomic situation. Thanks are also extended to all cus-
tomers and partners for their confidence in Kuehne + Nagel
and the good business relations the Group enjoyed with them.
Yours sincerely
Karl Gernandt
Chairman

THE BOARD OF DIRECTORS
Front row from the left:
JUERGEN FITSCHEN
BERND WREDE Vice Chairman
KARL GERNANDT Chairman
KLAUS-MICHAEL KUEHNE Honorary Chairman
DR. THOMAS STAEHELIN
Back row from the left:
HANS LERCH
HANS-JOERG HAGER
DR. RENATO FASSBIND
DR. JOERG WOLLE
DR. WOLFGANG PEINER
As of December 31, 2011
7Report of the Board of Directors

REPORT OF THE MANAGEMENT BOARD
Stronger global competitive positionThe Kuehne + Nagel Group achieved a number of important objectives in 2011:In sea and airfreight highly profitable growth above market average was realised. In overland transport strategic acquisitions contributed to the increase in tonnage, while in contract logistics the foundations were laid for a sustained improvement of profitability. The investments made in 2011 in emerging countries such as Brazil, China and Colombia fostered the extension of Kuehne + Nagel’s global competitive position. Although the result for the year was adversely affected by the strong Swiss franc, it underlines the Group’s strengths and capabilities.
For globally operating logistics providers like Kuehne + Nagel
numerous business opportunities presented themselves in emer -
ging countries, whose economies continued to grow at a
dynamic rate.
Growth programme implementation well on track –future-oriented investments In 2010, Kuehne + Nagel launched a strategic growth programme.
Its aim is to outpace market growth in all business units, and
substantially expand the business activities by 2014. The expan-
sion plans are supported by investments in product develop-
ment, sales and in the extension of activities in emerging coun-
tries and niche segments. In addition, a substantial increase of
the overland transport operations is envisaged.
Economic environmentIn 2011, the Kuehne + Nagel Group operated in a market envi-
ronment which was influenced by divergent economic develop-
ments, political unrest and natural disasters. This called for high
flexibility and operational efficiency in the provision of services,
a clear focus on growth regions and segments, and a synchroni-
sation of activities in the global network. Whereas at the begin-
ning of the year, market volumes in sea and airfreight were in
line with forecasts, growth slowed from the second quarter
onwards. Overcapacities resulted in a deterioration of freight
rates in sea and air transport, which in turn increased the pres-
sure on margins. In overland transport, capacity shortages led to
higher prices. In contract logistics the growing uncertainty
which affected planning in trade and consumer sectors was
reflected in the reduction in the movement of goods.
8

THE MANAGEMENT BOARD
From the left:
GERARD VAN KESTEREN Chief Financial Officer
MARTIN KOLBE Information Technology
REINHARD LANGE Chief Executive Officer
DIRK REICH Contract Logistics and Road & Rail
LOTHAR HARINGS Human Resources
TIM SCHARWATH Airfreight
HORST-JOACHIM SCHACHT Seafreight
As of December 31, 2011
9Report of the Managament Board

Kuehne + Nagel strengthened its global sales force by hiring
500 additional specialists. Through its selective recruiting the
company widened its industry-specific know-how base. Focal
point in the field of product development was an innovative,
integrated logistics solution for the pharmaceutical industry
whose market introduction is planned for the current year.
By the acquisition of the Brazilian logistics company Grupo
Eichenberg as of September 1, 2011, Kuehne + Nagel gained
access to the South American overland transport market and, at
the same time, expanded the presence and service portfolio of
its national company.
The inauguration of a new logistics facility in Cartagena in
October 2011 provides support for Kuehne + Nagel's develop-
ment plans in Colombia. The location in the Contecar port in
Cartagena will enable Kuehne + Nagel to quickly and efficiently
benefit from business opportunities arising from the expansion
of the Panama Canal.
Kuehne + Nagel expanded its service portfolio in the dynami-
cally growing markets China and India. According to the
Chinese “Go West“ strategy Kuehne + Nagel opened new loca-
tions in the Western provinces.
Kuehne + Nagel made substantial progress towards its aim of
establishing a global network for perishables logistics through
the acquisition of specialised companies Translago S.A.S. and
Agencia de Aduanas Excelsia Ltda. in Colombia and Master-
transport S.A. in Ecuador and the purchase of J. van de Put
Fresh Cargo Handling in the Netherlands. In seafreight reefer
container services were strengthened by the acquisition of Cool-
tainer, the leading operator in New Zealand.
Since April 1, 2011, RH Freight, the market leader for groupage
freight between continental Europe and the United Kingdom, is
a member of the Kuehne + Nagel Group. This transaction
increased the density of Kuehne + Nagel's European overland
network and expanded its range of regular services.
Development of the business units In seafreight Kuehne + Nagel recorded a volume growth of
11 per cent, a remarkable achievement in view of the difficult
market conditions. The number of containers handled by
Kuehne + Nagel passed the 3 million mark for the first time.
Despite substantial investments made in sales and product
development, the EBITDA to gross profit margin remained stable
at the previous year’s level. This was due to strict cost manage-
ment and high productivity.
Report of the Managament Board10

In airfreight, the tonnage increase of 13 per cent exceeded
expectations, particularly in view of the continuous decline in
market demand during the course of the year. The outstanding
performance is based on the targeted expansion – accelerated
by acquisitions – of perishables logistics activities, and the suc-
cessful provision of industry-specific airfreight solutions. Despite
substantial investments the EBITDA to gross profit margin
improved to 31.7 per cent. Cost efficiency and productivity
increases contributed to the remarkable result.
Groupage activities were boosted by the acquisition of RH Freight
leading to an above market volume growth of 10 per cent.
Volumes in the full and part load and industry-specific distribu-
tion segments developed favourably, too.
Improvements in efficiency are expected from the further
increase in the density of the overland network in 2012, the
start-up of the Eurohub in Bad Hersfeld and the further stan-
dardisation of IT systems.
The contract logistics business unit had to cope with special
challenges in 2011. The currency-adjusted increase in net turn-
over of 7.8 per cent (market growth: 3 per cent) and the double-
digit expansion of order volume did not compensate for the
pressure on margins. In particular, the operational result was
adversely affected by the costs of restructuring measures taken
in North America and France. In future, the focus will be placed
on the improvement of profitability by selective growth. Of key
importance is the pursuit of the campus strategy, which increas-
es efficiency and generates synergies by concentrating different
facilities in a central location.
Development of business in the regionsThe Asia-Pacific region achieved good business results in 2011.
Particularly in seafreight, increased volumes were achieved.
In order to meet the strong demand for logistics services in the
Chinese domestic market, Kuehne + Nagel commenced the
establishment of overland operations and expanded its contract
logistics portfolio.
Despite the debt crisis and divergent economic environments,
Kuehne + Nagel performed well in the Europe region. Germany
recorded an outstanding development of turnover and earnings.
The results of the national companies in Italy, Spain and Portu-
gal were satisfactory despite the difficult economic environ-
ment. In France the economic slowdown clearly impacted the
result of the national company. Here, an extensive structural
reorganisation was initiated in the contract logistics business
11Report of the Managament Board

Report of the Managament Board12
unit. In Eastern Europe the consistent implementation of the
growth strategy led to a very good result in 2011.
In North America Kuehne + Nagel's international forwarding
business expanded despite the volatile development of the
economy and the restrained consumer behaviour. The restruc-
turing of the contract logistics business unit led to improved
results.
Due to the targeted investments in the expansion of activities,
the South American national companies were able to benefit
over-proportionally from the region’s dynamic economic develop-
ment and achieved a substantial improvement in volume and
earnings in relation to the preceding year.
Business in the Middle East was adversely affected by the
political unrest in the region. Nevertheless, the result was
maintained at previous year’s level, thanks largely to new
business in the United Arab Emirates and Saudi Arabia.
In Africa the oil & gas and project businesses were once more a
positive force for the company's activities. The overall result
showed a substantial improvement over the previous year.
Outlook for 2012Investments in 2011 were geared to achieve sustained growth
and a further positive development of earnings. In 2012, focal
point will be the successful and efficient integration of the com-
panies acquired during the year under review.
The effectiveness of the company's strategy was confirmed by the
results for 2011, and the business plan for 2012 accordingly envis-
ages profitable growth which outpaces the market in all business
units. Kuehne + Nagel is facing up to the uncertain development
of the economy by consistent cost management, process optimisa-
tion and increased productivity in all business units.
Reinhard Lange
Chairman of the Management Board
STATUS REPORT
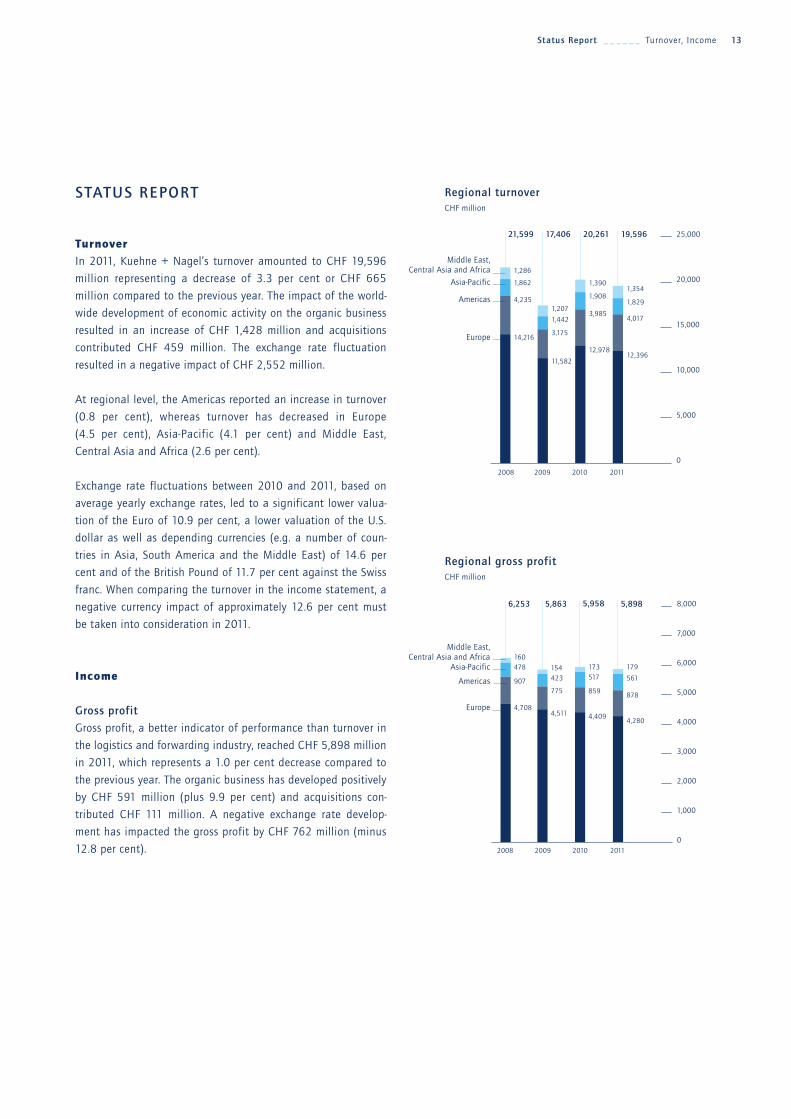
TurnoverIn 2011, Kuehne + Nagel’s turnover amounted to CHF 19,596
million representing a decrease of 3.3 per cent or CHF 665
million compared to the previous year. The impact of the world-
wide development of economic activity on the organic business
resulted in an increase of CHF 1,428 million and acquisitions
contributed CHF 459 million. The exchange rate fluctuation
resulted in a negative impact of CHF 2,552 million.
At regional level, the Americas reported an increase in turnover
(0.8 per cent), whereas turnover has decreased in Europe
(4.5 per cent), Asia-Pacific (4.1 per cent) and Middle East,
Central Asia and Africa (2.6 per cent).
Exchange rate fluctuations between 2010 and 2011, based on
average yearly exchange rates, led to a significant lower valua-
tion of the Euro of 10.9 per cent, a lower valuation of the U.S.
dollar as well as depending currencies (e.g. a number of coun-
tries in Asia, South America and the Middle East) of 14.6 per
cent and of the British Pound of 11.7 per cent against the Swiss
franc. When comparing the turnover in the income statement, a
negative currency impact of approximately 12.6 per cent must
be taken into consideration in 2011.
Income
Gross profit
Gross profit, a better indicator of performance than turnover in
the logistics and forwarding industry, reached CHF 5,898 million
in 2011, which represents a 1.0 per cent decrease compared to
the previous year. The organic business has developed positively
by CHF 591 million (plus 9.9 per cent) and acquisitions con-
tributed CHF 111 million. A negative exchange rate develop-
ment has impacted the gross profit by CHF 762 million (minus
12.8 per cent).
13
Regional turnoverCHF million
25,000
20,000
15,000
10,000
5,000
0
2008 2009 2010 2011
21,599
4,235
1,862
1,286
12,396
19,596
4,017
1,829
1,354
Europe
Americas
Asia-Pacific
Middle East, Central Asia and Africa
Regional gross profitCHF million
Status Report _ _ _ _ _ _ Turnover, Income
Europe
8,000
7,000
6,000
5,000
4,000
3,000
2,000
1,000
0
4,409
2008 2009 2010 2011
5,958
859
517173
4,280
5,898
878
561
179
4,511
5,863
775
423154
4,708
6,253
907
478160
Americas
Asia-Pacific
Middle East, Central Asia and Africa
12,978
20,261
3,985
1,908
1,390
11,582
17,406
3,175
1,442
1,207
14,216

In Asia-Pacific, gross profit increased by 8.5 per cent, in Middle
East, Central Asia and Africa by 3.5 per cent and in the Americas
by 2.2 per cent. In the Europe region gross profit decreased by
2.9 per cent, whereby a negative currency impact of 11.9 per cent
was recorded.
Operational cash flow
The operational cash flow, the sum of the net income for
the year plus/minus non-cash-related transactions, decreased by
CHF 14 million to CHF 978 million (for further information,
please refer to the cash flow statement on page 60).
EBITDA
The earnings before interest, tax, depreciation, amortisation and
impairment of property, plant and equipment, goodwill and other
intangible assets decreased by CHF 26 million or 2.5 per cent
compared to the previous year; the organic business in creased by
CHF 82 million and acquisitions contributed CHF 14 million,
whereas the negative exchange rate development accounted
for CHF 122 million. Europe generated the largest EBITDA contri-
bution of CHF 564 million (57.6 per cent) followed by Asia-
Pacific with CHF 227 million (23.2 per cent), the Americas with
CHF 149 million (15.2 per cent) and the Middle East, Central
Asia and Africa with CHF 38 million (4.0 per cent).
Status Report _ _ _ _ _ _ Income14
The EBITDA margin was maintained at 5.0 per cent compared to
2010. Personnel expenses decreased by CHF 5 million or 0.1 per
cent attributable to an increase of the number of employees hand-
ling substantial volume increases demonstrating a stringent cost
management and productivity monitoring.
EBIT ⁄ Earnings for the year
The decrease of earnings before interest and tax (EBIT) by
CHF 15 million was due to a strong organic business increase
(CHF 84 million), but also impacted by a negative exchange
rate development (CHF 94 million).
EBIT in Asia-Pacific increased by CHF 8 million (3.9 per cent),
whereas in Europe EBIT decreased by CHF 19 million (4.8 per cent),
in the Americas by CHF 3 million (2.3 per cent) and in the Middle
East, Central Asia and Africa by CHF 1 million (3.2 per cent).
Driven by the overall volume increases and the high operational
efficiency, the EBIT margin (in per cent of invoiced turnover) was
maintained at 3.8 per cent compared to the previous year.
The earnings for the year increased by CHF 1 million to CHF
606 million compared to the previous year, whereby the margin
increased to 3.1 per cent (in per cent of the invoiced turnover)
compared to the previous year’s 3.0 per cent.

15Status Report _ _ _ _ _ _ Income
Operational cash flowCHF million
1,250
1,000
750
500
250
02008 2009 2010 2011
992
EBITDACHF million
1,250
1,000
750
500
250
02008 2009 2010 2011
1,004
Operational expensesCHF million
Earnings for the year CHF million
8931,015 9788851,020
605 606471588
978
800
600
400
200
0
2008 2009 2010 2011
6,000
5,000
4,000
3,000
2,000
1,000
0
3,391
2008 2009 2010 2011
4,975
697
158
524205
3,341
4,959
729
151
532206
3,518
5,249
727
202
560242
3,386
4,928
633
160
535214
Personnel expenses
Facility expenses
Communication, travel, and selling expenses
Vehicle and operational expensesAdministrative expenses

Financial positionTotal assets and liabilities of the Group increased by CHF 200
million to CHF 6,141 million compared to 2010. The changes are
mainly an increase in property, plant and equipment, and other
intangibles assets due to acquisitions; details can be found in
notes 27 and 28 to the Consolidated Financial Statements.
Cash and cash equivalents decreased by CHF 480 million main-
ly due to investment in Financial Instruments (CHF 252 million),
increased investing activities, repayment of capital contribution
and dividend payout; for further information, refer to the cash
flow statement on page 60.
Trade receivables amounting to CHF 2,278 million represent the
most significant asset of the Kuehne + Nagel Group. The days
outstanding of 42.2 days in 2011 increased from 37.8 days in
2010.
The equity of the Group has increased by CHF 35 million to
CHF 2,405 million; this represents an equity ratio of 39.2 per
cent (2010: 40.0 per cent). Developments of other key figures
on capital structure are shown in the following table:
Kuehne + Nagel Group key figures on capital structure
Status Report _ _ _ _ _ _ Financial position16
2008 2009 2010 2011
1 Equity ratio (in per cent) 37.3 38.6 40.0 39.22 Return on equity (in per cent) 24.8 21.2 25.5 24.93 Debt ratio (in per cent) 62.7 61.4 60.0 60.84 Short-term ratio of indebtedness (in per cent) 54.1 49.5 49.7 51.25 Intensity of long-term indebtedness (in per cent) 8.6 11.9 10.3 9.66 Fixed assets coverage ratio (in per cent) 136.9 122.0 145.1 133.97 Working capital (in CHF million) 632 540 929 7588 Receivables terms (in days) 37.6 40.6 37.8 42.29 Vendor terms (in days) 44.0 53.9 48.0 51.210 Intensity of capital expenditure (in per cent) 33.6 41.4 34.6 36.5
1 Total equity in relation to total assets at the end of the year.
2 Net earnings for the year in relation to share + reserves + retained earnings as of January 1 of the current year less dividend
paid during the current year as of the date of distribution + capital increase (incl. share premium) as of the date of payment.
3 Total liabilities – equity in relation to total assets.
4 Short-term liabilities in relation to total assets.
5 Long-term liabilities in relation to total assets.
6 Total equity (including non-controlling interests) + long-term liabilities in relation to non-current assets.
7 Total current assets less current liabilities.
8 Turnover in relation to receivables outstanding at the end of the current year.
9 Expenses for services from third parties in relation to trade liabilities ⁄accrued trade expenses at the end of the current year.
10 Non-current assets in relation to total assets.

Investments, depreciation and amortisationIn 2011, the Kuehne + Nagel Group spent a total of CHF 207
million for fixed assets. All capital expenditures in 2011 were
financed by the operational cash flow of CHF 978 million gener-
ated during 2011.
Investments in properties and buildings amounted to CHF 72
million, and CHF 135 million were spent for other fixed assets,
operating and office equipment.
17Status Report _ _ _ _ _ _ Investments, depreciation and amortisation
AssetsCHF million
LiabilitiesCHF million
Investments in fixed assets /
depreciationCHF million
500
400
300
200
100
0
134
2008 2009 2010 2011
164
207
154
264
184
245
169Depreciation
Investments
Cash and marketable securities
Receivables and other current assets
Non-current assets
8,000
7,000
6,000
5,000
4,000
3,000
2,000
1,000
0
1,331
2008 2009 2010 2011
5,941
2,552
2,058
981
5,933
2,496
2,456
1,039
5,555
2,652
1,864
1,103
6,141
2,799
2,239Equity (incl. non-
controlling interests)
8,000
7,000
6,000
5,000
4,000
3,000
2,000
1,000
0
3,230
2008 2009 2010 2011
5,941
49284
2,378
3,280
5,933
56307
2,290
3,137
5,555
77268
2,073
3,396
6,141
44296
2,405
Bank liabilities
Trade, tax and other liabilities
Provisions for pension plans and
severance payments

In 2011 the following major investments were made in properties
and buildings:
The allocation of investments in other fixed assets, operating
and office equipment by category is as follows:
The allocation by region is as follows:
Region/Location CHF million
Reims, France 4 New logistics and distribution centre
Various locations, France 3 Extension of logistics and distribution centre
Geel, Belgium 4 Extension of logistics and distribution centre
Contern, Luxembourg 2 Extension of logistics and distribution centre
Utrecht, The Netherlands 14 Extension of logistics and distribution centre
Duisburg, Germany 25 Extension of logistics and distribution centre
Rennerod, Germany 14 Purchase of logistics and distribution centre
Leipzig, Germany 1 Land for new logistic and distribution centre
Dubai 3 Extension of logistics and distribution centre
Kenya 2 Land for new logistic and distribution centre
72
Status Report _ _ _ _ _ _ Investments, depreciation and amortisation18
CHF million
Operating equipment 51
Vehicles 19
Leasehold improvements 26
IT hardware 30
Office furniture and equipment 9
Total 135
CHF million
Europe 92
Americas 22
Asia-Pacific 14
Middle East, Central Asia and Africa 7
Total 135
Statements. Impairment of intangible assets amounted to
CHF 5 million and is allocated in the income statement.
Depreciation and amortisation in 2011 amounted to CHF
223 million and are allocated in the profit and loss statement
as indicated in notes 27 and 28 to the Consolidated Financial

Planned investments in 2012In 2012 the Kuehne + Nagel Group plans to invest about
CHF 218 million in fixed assets compared to a spending of
CHF 207 million in 2011.
Development of capital expenditure and depreciation of fixed assets over a period of four years
Planned investment per category
CHF million
Properties and buildings 70
Operating equipment 41
Vehicles 24
Leasehold improvements 24
IT hardware 40
Office furniture and equipment 19
Total 218
Expected allocation per business segment
CHF million
Seafreight 28
Airfreight 19
Road & Rail Logistics 69
Contract Logistics 30
Real Estate 72
Total 218
19Status Report _ _ _ _ _ _ Planned investments in 2012
CHF million 2008 2009 2010 2011
Capital expenditure
Fixed assets
Properties and buildings 93 161 28 72
Operating and office equipment 152 103 106 135
Intangible assets
Goodwill in consolidated companies – 139 – 121
Other intangibles through acquisitions 26 151 2 88
IT software 34 22 17 11
305 576 153 427
Depreciation and amortisation
Fixed assets
Buildings 21 24 24 27
Operating and office equipment 148 160 140 127
Intangible assets
Impairment of goodwill 6 – – –
Amortisation/impairment of other intangible assets 109 107 75 74
284 291 239 228

In 2012 the depreciation of fixed assets is estimated at CHF
164 million and the amortisation of intangible assets at CHF
70 million (excluding potential acquisitions of companies).
Planned acquisitions
In order to reach the strategic goals in the Road & Rail Logistics
business segment, further acquisitions in Italy, Spain and Eastern
European countries can be expected within the next year.
Shareholder returnIn 2011, the Kuehne + Nagel share outperformed the BEUTRAN
Index, whereas it performed lower than the SMI and the SPI.
Expected investments per region
CHF million
Europe 155
Americas 22
Asia-Pacific 22
Middle East, Central Asia and Africa 19
Total 218
Share price and market capitalisation (as of December 31)
Total shareholder return development
Status Report _ _ _ _ _ _ Shareholder return20
2011 2010 per cent change
Share price (CHF) 105.50 130.0 –23.2
Market capitalisation (in CHF million) 12,660 15,600 –23.2
in CHF 2011 2010
Increase/(decrease) year over year –24.50 29.50
Dividend per share 4.25 1 2.30
Total return –20.25 31.80
1 Dividend payment of CHF 2.75 per share plus repayment of capital contribution reserves of CHF 1.50 per share.

Kuehne + Nagel SMI
SPI BEUTRAN Index
Dividend
The Board of Directors is proposing a dividend per share for
2011 amounting to CHF 3.85 per share for approval at the
Annual General Meeting. If the dividend proposal is approved
by shareholders, dividend payments on the shares will amount
to CHF 460 million (2010: CHF 328 million) resulting in a pay-
out ratio of 76.5 per cent (2010: 54.6 per cent). Based on the
share price at year-end 2011 the dividend yield on the Kuehne +
Nagel share is 3.6 per cent (2010: 2.1 per cent).
Kuehne + Nagel share price compared with SMI, SPI and Bloomberg Europe Transportation Index December 2006 – December 2011
21Status Report _ _ _ _ _ _ Shareholder return
160.0
140.0
120.0
100.0
80.0
60.0
40.0
20.0
Dec
. 31,
20
06
Apr
il 30
, 200
7
Aug
. 31,
200
7
Dec
. 31,
20
07
Apr
il 30
, 200
8
Aug
. 31,
200
8
Dec
. 31,
20
08
Apr
il 30
, 200
9
Aug
. 31,
200
9
Dec
. 31,
20
09
Apr
il 30
, 201
0
Aug
. 31,
201
0
Dec
. 31,
201
0
Apr
il 30
, 201
1
Aug
. 31,
201
1
Dec
. 31,
201
1

22 REPORT OF THE BUSINESS UNITS
Slowdown of growth in international container traffic
After the strong recovery in 2010, the global container market
recorded a volume growth of between 5 and 6 per cent in 2011,
with stronger gains in the first half of the year.
The volatile economy in the United States resulted in a de -
creased container volume from Asia, but, on the other hand,
American shippers were able to increase their export business to
Europe, Asia and Latin America by more than 7 per cent.
The world’s biggest market, intra-Asia, grew in terms of volume
by roughly 9 per cent. Growth on the trade lanes from Asia to
Europe amounted to just around 3 per cent, whereas container
traffic from Europe to the Far East increased by 8 per cent.
The Latin American trades again achieved double-digit growth
on both the import and export side, the latter being driven by
the high demand for South American agricultural products.
Shipping companies
Global vessel carrying capacity expanded by approximately
9 per cent in 2011. Numerous shipping lines launched vessels
with capacities in excess of 13,000 TEU. As a result, particularly
in the trade lanes from Asia to Europe, growth of capacity out-
stripped demand.
The high oil price forced carriers to operate under the “slow
steaming” programme. Although this measure lengthens transit
times, the positive effect is a substantial cut in CO2 emissions,
particularly for the largest vessels. Kuehne + Nagel is making
increased use of these services for its customers.
Freight rates
Slowing demand in combination with additional capacity led to
a significant decline of freight rates in almost all trades during
2011.
Impressive growth of Kuehne + Nagel transport volume
Kuehne + Nagel again achieved double-digit growth in 2011. The
increase in volume in most trade lanes is largely a result of net-
work expansion, innovative IT solutions and major new business
wins. Highest growth rates were recorded in the Asian trades. In
the transpacific lane, Kuehne + Nagel expanded its volume by
more than 15 per cent despite market contraction. In non-Euro-
pean trade lanes, a volume increase of 16 per cent was achieved,
which is mainly attributable to the company's global network and
its focused sales efforts.
LCL
The LCL (Less-than-Container-Load) segment, an important part
of the seafreight business unit, performed very well in 2011
thanks to the establishment of new gateways in Asia, North and
South America and Europe. The Group’s own network and the
associated new routes were more closely meshed, resulting in a
more efficient cost structure, a shortening of transit times and
improved data quality.
River shipping
In 2011, Kuehne + Nagel’s river shipping organisation again made
an essential contribution to the environment-friendly management
of the growing volume of goods traffic. Improved results were
achieved in both container and dry goods shipping. In addition,
the company focused on the expansion of the Rhine-Main-Danube
services as far as the Black Sea.
Specialised services
Kuehne + Nagel's services for special product groups are well
accepted by the market. In the worldwide shipment of forestry
products (paper, cellulose and timber), the company continued
its growth course in 2011.
By acquiring a 75 per cent share in Cooltainer, New Zealand's
leading operator in reefer container transportation, Kuehne +
Seafreight: Number of TEU handled exceeds 3 million mark for the first timeIn 2011, Kuehne + Nagel maintained its growth momentum in seafreight, handling more than 3 million TEU; an increase of 327,000 TEU (11 per cent) compared with the previous year. With a growth rate twice as high as the market and its high operational productivity, the company was able to compensate for currency effects and costs of investments in growth initiatives. The operational result was stable at the previous year's level.

Nagel strengthened its activities in this segment. New Zealand
is of key importance for the export of perishable goods to Aus-
tralia and the islands of the South Pacific. The transaction was
part of Kuehne + Nagel’s strategy to globally expand its perish-
ables logistics business and, at the same time, it complements
the Group’s overall business activities in Australia and New
Zealand.
Oil, gas and project business
Kuehne + Nagel strengthened its position as a leading operator
in this business segment in 2011. Investments were made in the
expansion of infrastructure, the emphasis being North and
South America, China and West Africa. In view of the good order
situation, a further positive development of business can be
expected in the current business year.
Emergency and relief logistics
With its special know-how Kuehne + Nagel supports well-known
international aid organisations in crisis areas on the basis of
long-term contracts. In 2011, its activities in emergency and
relief logistics centred on the organisation of shipments to
Somalia.
Forward-looking e-business strategy
Kuehne + Nagel has a forward-looking IT strategy in seafreight.
Customer needs are changing quickly and getting more and
more complex. A key factor for providing high transparency
throughout the supply chain is the consolidation and standardi-
sation of all processes in Kuehne + Nagel’s single, comprehen-
sive IT system. In 2011, investments concentrated on the deve-
lopment of a new state-of-the-art system.
Good progress was made in the electronic interchange of ship-
ment and order level data with customers and suppliers. Togeth-
er with INTTRA, the internet portal of the industry, Kuehne +
Nagel created and implemented an application which permits
electronic invoicing in addition to electronic container booking.
The shipment ‘Visibility‘ features offered by KN Login, a system
greatly valued by customers, were further enhanced. Customers
can now use new modules for process analysis and optimisation.
Outlook for 2012
Experts forecast the international container market to grow
between 4 and 5 per cent in 2012. The supply of additional ves-
sel capacity and the uncertain development of demand will
again result in challenges in the current business year.
Kuehne + Nagel aims to achieve a volume growth exceeding
market average in 2012 with the focus on areas, where it now
has a comparatively small market share such as the Pacific
routes or the intra-Asian trades. In order to maintain its strict
cost management, it is planned to cope with the expected
volume growth through further productivity increases.
23Report of the Business Units _ _ _ _ _ _ Seafreight
CHF million 2011 Margin 2010 Margin Variance per cent per cent 2011/2010
per cent
Turnover 8,330 100.0 8,996 100.0 –7.4
Gross profit 1,254 15.1 1,224 13.6 2.5
EBITDA 438 5.3 441 4.9 –0.7
EBIT 411 4.9 416 4.6 –1.2
Number of operational staff 8,561 7,588 12.8
TEU '000 3,274 2,945 11.2
Performance Seafreight

Development of market and rates
The global airfreight market experienced a divergent develop-
ment in 2011. A strong first quarter was quickly followed by a
downward trend which became more accentuated in the follow-
ing months. Volumes in the fourth quarter were 2.5 per cent
lower than in the previous year’s period. In particular, Asia, the
growth engine for airfreight exports in the past years, began to
clearly splutter. As a result of the restrained consumer demand
in the U.S.A and large parts of Europe, the “peak season” failed
to materialise.
The volume decline was accompanied by falling rates in almost
all trades and the airlines’ concurrent deployment of new capac-
ity did not ease this situation. In addition, the even-faster spi-
ralling of the oil price due to the political unrest in the Middle
East also presented serious problems for the airlines.
Development of Kuehne + Nagel’s airfreight business
Kuehne + Nagel increased its tonnage on almost all routes and
achieved a new volume record by handling 1,073 million tons of
airfreight. Particularly strong growth was achieved in exports
from North America to Europe and South America and on the
trade lanes from Europe to North America and Asia. The fall in
demand in Asia did also affect Kuehne + Nagel’s activities;
freight volumes, particularly on the routes to Europe, consider-
ably declined in comparison with the previous year.
Strong growth in industry-specific solutions
In 2011, the portfolio of industry-specific airfreight solutions
again proved to be a significant factor for success. Kuehne +
Nagel concentrated on developing tailor-made services for specif-
Report of the Business Units _ _ _ _ _ _ Air freight
Airfreight: On course for growth despite strong headwindsKuehne + Nagel’s excellent performance in airfreight is based on its strong position ingrowth markets, the expansion of its industry-specific solutions and intensified salesefforts. In 2011, the company increased its tonnage by 13 per cent in a contracting market.
24
ic segments such as the automotive and pharmaceutical industry
and for high-value consumer and perishable goods, which bring
benefits for customers in terms of quality, offer high transparen-
cy and are also cost-efficient. In addition, increased sales activi-
ties contributed to the favourable business performance.
Perishables Logistics
The global expansion of perishables logistics for goods such as
flowers, fruit and vegetables is a significant element of the
Kuehne + Nagel growth strategy. In 2011, by the acquisition of
three companies specialising in logistics services for perishables,
namely Translago S.A.S. and Agencia de Aduanas Excelsia Ltda.
in Colombia and Mastertransport S.A. in Ecuador, Kuehne +
Nagel opened up two key South American markets for the
export of perishables and at the same time reinforced its posi-
tion in the regional airfreight market.
In Europe Kuehne + Nagel strengthened its activities in this
segment by the acquisition of the Dutch company J. van de Put
Fresh Cargo Handling. This company, which is domiciled at
Amsterdam Schipol airport, concentrates on logistics, customs
clearance, handling and added value services for perishables.
As a result of this transaction, Kuehne + Nagel is now able to
offer integrated door-to-door services for perishable goods from
a single source. In the first year the new members of the
Kuehne + Nagel Group already contributed 8 per cent to the
volume growth.
Pharma Logistics
A high-quality service is crucial for the pharmaceutical segment.
Today, in addition to shipment tracking and management via
the IT platform KN Login, Kuehne + Nagel provides its cus-
tomers with an uninterrupted documentary record of the tem-
perature along the supply chain. In the year under review the
company developed a tailor-made concept that opens up a new
dimension with regard to transparency in the transport of tem-
perature-sensitive goods. This solution, which is unique in the
industry, will shortly be ready for rollout.
Aviation/Aerospace Logistics
In the field of spare parts logistics and maintenance, Kuehne +
Nagel gained new customers in 2011 and recorded a satis-
factory growth in volume. The continuing trend towards out-
sourcing in the aerospace sector will provide the company with
further opportunities for growth in the current business year.
Hotel Logistics
The hotel logistics segment offers turnkey logistics solutions to
leading global hotel chains. In 2011, Kuehne + Nagel managed
numerous projects associated with hotel construction and reno-
vation projects, and strengthened its position in this segment.
Marine Logistics
The experts in the marine logistics segment ensure a seamless
operation of the spare parts supply chain for commercial ships.
Ship owners and ship management agencies are making increas-
ing use of Kuehne + Nagel's special know-how. In 2011, Kuehne +
Nagel expanded activities in this segment, and added a new
ship management software to the portfolio.
Process improvement and quality assurance
In order to further improve the quality of service, investments
were again made in the training and further education of the
staff in the airfreight business unit. New software, which will be
implemented worldwide in 2012 will increase efficiency by
process optimisation and standardisation. The airfreight busi-
ness unit’s improved operational result in 2011 reflects the
increases in productivity and strict management of costs.
Outlook for 2012
The forecasts for the global airfreight market in 2012 are not
very encouraging. A further decline in demand is expected, par-
ticularly in the first half of the current business year. The
increase in capacity – new cargo aircraft are ready for delivery
to the airlines – will also not ease the situation.
Kuehne + Nagel is facing up to these challenges and again aims
to grow at a faster rate than the market. The company is con-
centrating on efficiency and operational excellence and increas-
ing its efforts to market its portfolio of high value-added air-
freight services.
25Report of the Business Units _ _ _ _ _ _ Air freight
CHF million 2011 Margin 2010 Margin Variance per cent per cent 2011/2010
per cent
Turnover 4,020 100.0 4,044 100.0 –0.6
Gross profit 795 19.8 749 18.5 6.1
EBITDA 252 6.3 234 5.8 7.7
EBIT 232 5.8 216 5.3 7.4
Number of operational staff 5,073 4,244 19.5
Tons '000 1,073 948 13.2
Performance Airfreight
Development of European road transport
While volumes in the European overland transport market
increased in the first half of the year, a reduced demand was
experienced in the second half, resulting in a market growth of
around 5 per cent in 2011. Providers had to cope with high price
pressure as a result of the constant rise in fuel costs, and short-
age of both transport capacity and drivers.
Kuehne + Nagel recorded a favourable volume development in
European overland transport. The expansion of the service port-
folio and the customer-oriented services in the groupage, full
and part load and industry-specific distribution segments con-
tributed towards a 10 per cent volume increase. The investments
in further enhancing the density of its overland transport net-
work, product development and process optimisation, however,
affected the operational result.
European groupage network
In 2011, Kuehne + Nagel increased its volume by 15 per cent
(groupage market: 5 per cent) and handled 17 million national
and international groupage shipments.
The main impetus for the above-average volume growth came
from the British groupage provider RH Freight, acquired in April
2011 and consolidated since that month. RH Freight, which is
represented in 17 locations in the United Kingdom, handles
roughly 425,000 shipments each year at its two freight termi-
nals in Nottingham and South East London and operates daily
services to 32 European destinations. In addition, Kuehne +
Nagel benefited from further improvements in its service offer-
ing. The unified Europe-wide product portfolio “KN Euroline”,
which targets the individual customer needs, was launched in
January 2011 and met with rapid acceptance. The increased
number of scheduled international lines from 300 to 370 resulted
Road & Rail Logistics: Consistent strategy implementation leads to substantial volume growthThe targeted expansion of activities in the segments groupage, full and part load and industry-specific distribution is reflected in the net turnover, which in local currencies increased by 19 per cent compared with the preceding year.
Report of the Business Units _ _ _ _ _ _ Road & Rail Logistics26
in a higher departure frequency and shortening of transit times
within the network.
Establishment of a Eurohub in Bad Hersfeld
In October 2011, through the acquisition of Carl Drude GmbH &
Co. KG, Kuehne + Nagel gained access to a highly capable hub
operation for international groupage activities in Hauneck/Bad
Hersfeld in the German state of Hesse.
From mid-2012, daily lines to 50 European economic centres will
be operated via this central hub. Consistent cargo consolidation
and overnight transhipment operations will increase departure
frequencies and reduce lead times. In addition, capacity utilisa-
tion will be optimised.
Development of land transport outside Europe
Kuehne + Nagel invested not only in increasing the density of
its European groupage network, but also in the expansion of its
road logistics services in growth regions. With the acquisition of
the Brazilian Grupo Eichenberg it made an entry into the South
American overland transport market. This company, headquar-
tered in Porto Alegre, is one of the leading providers of overland
transport services in the Brazilian domestic market as well as in
the Mercosur zone to and from Argentina, Chile and Uruguay. In
China Kuehne + Nagel started to develop a national network. At
present, there are regular services between eight major Chinese
cities; further lines will be added in the course of the current
business year.
Full and part loads
The investments made in the continuous expansion of the full and
part load business are bearing fruit. In 2011, the transported
tonnage increased by more than 17 per cent, corresponding to
120,000 full loads. In addition, roughly 1.2 million part loads were

27Report of the Business Units _ _ _ _ _ _ Road & Rail Logistics
handled. Due to the optimised processes and standardised IT sys-
tems, an improvement was achieved in both the efficiency and the
quality of the service to the customers. The clear focus on specific
customer segments also proved conducive to the growth of busi-
ness. New customers were gained, for instance, in the consumer
goods sector, and the scope of existing contracts was widened.
Greater transparency as a result of a uniform IT solution and a
closer interlinking of the transportation control centers resulted
in a higher utilisation of transport capacity and a reduction in
the number of empty vehicle kilometres.
Industry-specific distribution services
Specialised distribution networks are the third pillar of Kuehne +
Nagel's overland transport operations. In the year under review
new business, notably in the high-tech industry, compensated
for most of the pressure on margins.
A distribution system was developed for customers of the pharma-
ceutical and health care industry. The new pharma hub in Luxem-
bourg is of major importance. It conforms to the quality standard
of the pharmaceutical industry and is an essential requirement for
the temperature-controlled transport of pharmaceutical products.
It is planned to establish further hubs in 2012.
Fairs and exhibition logistics
The KN Expo Service segment specialises in the transport and
handling of trade fair goods and event logistics. Due to the
increasing demand in the event logistics segment, its resources
were strengthened and a number of new locations were opened,
among other places in India. In Hanover, Düsseldorf and
Munich, where Kuehne + Nagel is accredited as a trade fair for-
warder, an innovative forklift guidance system improves the effi-
ciency of order handling and helps to reduce CO2 emissions. The
system will also be introduced in other trade fair locations in the
current business year.
Rail transport
In 2011, European rail transport suffered from the further cut-
back in the single wagon load traffic offered by the state rail-
ways. In order to maintain its quality of service and competitive-
ness, Kuehne + Nagel strengthened the intermodal (road/rail)
services which it offers to its customers. In future, a still higher
priority will be assigned to the development of these intermodal
transport solutions.
Outlook for 2012
In 2012, Kuehne + Nagel again aims to grow faster than the
European overland transport market and to improve profita-
bility. In this business unit, the company's policy is to expand by
organic growth and selective acquisitions. Kuehne + Nagel
expects the start-up of the Eurohub in Bad Hersfeld and a fur-
ther increased density of its European groupage network to
result in substantial increases in the efficiency. It is aimed to
maintain the growth momentum in the full and part load busi-
ness and develop the special networks in line with the speci-
fic needs of customers. In rail transport, the emphasis will be
laid on the development of intermodal transport solutions.
CHF million 2011 Margin 2010 Margin Variances per cent per cent 2011/2010
per cent
Tunrover 2,967 100.0 2,776 100.0 6.9
Gross profit 857 28.9 825 29.7 3.9
EBITDA 42 1.4 43 1.5 –2.3
EBIT –13 –0.4 –17 –0.6 23.5
Number of operational staff 8,500 7,255 17.2
Performance Road & Rail Logistics

Global contract logistics market
The main factors opposed to a revival of the global contract
logistics market were the volatile economies in North America
and a number of European countries together with growing pres-
sure on prices in trade and the consumer goods sector. The
rising demand for production supply services for industrial
companies, however, stimulated market demand. In relation to
the previous year the global contract logistics market grew by
approximately 3 per cent.
Differences in development of business
between the Kuehne + Nagel regions
Insufficient utilisation of warehouse capacity in Canada and the
weak demand in the USA as a result of the economic situation
prevented a sustained improvement in the result in North Ameri-
ca, although the restructuring measures, started in the previous
year, proved to be effective. The proportion of idle space was
substantially reduced due to new business and the closure of
unprofitable locations.
In South America, the contract logistics activities were expan-
ded. The new facility, taken into operation in Cartagena, Colom-
bia in October 2011, and the acquisition of Grupo Eichenberg in
Brazil, improved the range of integrated logistics services in this
region of dynamic economic growth.
Contract logistics: Large regional variations in development of businessIn correlation with the uneven world economic development, the contract logistics business unit was confronted by a number of challenges. Fluctuations in demand and highprice pressure impacted the business. While the currency-adjusted net turnover increased by 7.8 per cent due to new business wins, the operational result was adversely affected bythe costs of restructuring measures.
Report of the Business Units _ _ _ _ _ _ Contract Logistics28
In Europe, the situation of demand was extremely uneven. The
contract logistics business of the German and Dutch Kuehne +
Nagel organisations experienced an above-average development.
New customers were gained, and contracts with major multi-
national customers substantially expanded. The mix of industries
with different cyclical sensitivities proved advantageous.
After the completion of the third and fourth expansion phases,
the enlarged logistics campus in Duisburg – with a total area of
160,000 sqm – was officially opened. The continuing strong
demand in this strategic location calls for a further expansion of
capacity. In the current business year, an additional warehouse
will be established and managed for a major customer of the
consumer goods industry.
Whereas in the United Kingdom results remained stable, the
economic situation in France resulted in pressure on margins,
deterioration in contract logistics results and the need for an
extensive restructuring. Capacity utilisation was good in Sout-
hern Europe, but the national companies were subjected to enor-
mous pressure on prices. The investments in the development of
contract logistics all over Eastern Europe led to a number of suc-
cessful business transactions, primarily with customers from the
automotive and consumer goods industries. In this region too,
the integrated business model will have a positive effect on the
result.

In the Asia-Pacific region, Kuehne + Nagel's warehousing and
distribution services were utilised by new customers in the enter-
tainment electronics and industrial goods segments. Growth
momentum slowed in the Middle East due to the political unrest
in the area, but the highly specialised portfolio of services for
the aerospace industry enabled Kuehne + Nagel to win new
important business.
Lead Logistics: Innovation and increased
efficiency in response to growing pressure on margins
The integrated management and optimisation of transport
chains, warehousing and networks are the core of Kuehne +
Nagel's offering in the field of lead logistics. The positive
demand has continued as a stable trend, but margins have
come under substantial pressure due to stronger competition in
this attractive market segment. In 2011, newly gained busines-
ses in Asia, Eastern Europe and South America, did not compen-
sate the pressure on margins.
In 2012, it is aimed to achieve greater efficiency by the develop-
ment of innovative services, in particular for inbound logistics,
and by intensified utilisation of the eight Logistics Control Cen-
tres. In these centres, services of a similar kind such as central
customer service, transport planning and reporting are pro-
vided for all lead logistics customers.
Measures to achieve a sustained
improvement in profitability
The pursuit of the campus principle is a key factor for the impro-
vement of profitability. The concentration of different facilities
and highly qualified experts at a single strategic location enab-
les Kuehne + Nagel to handle demand peaks in a flexible man-
ner. In other words, the available resources can be ideally adap-
ted to customers from different sectors and with different
seasonal demand patterns. Furthermore, the concept optimises
operational processes and creates synergies, also in the field of
distribution, which are to the benefit of all involved parties.
Examples of facilities in line with this concept are those in Duis-
burg, Germany and in Milton Keynes, England.
The global implementation of the production system (KNPS) is
aimed to reduce costs and increase productivity.
Outlook for 2012
The year 2012 will be a period of consolidation. In terms of
selective profitable growth, Kuehne + Nagel will focus more
strongly on selected customers, specific countries and industry
segments. A further reduction of unprofitable locations, the effi-
cient implementation of new business, the high quality of ser-
vices and strict cost management will all contribute to increase
the EBITDA margin.
29Report of the Business Units _ _ _ _ _ _ Contract Logistics
CHF million 2011 Margin 2010 Margin Variances per cent per cent 2011/2010
per cent
Turnover 4,168 100.0 4,316 100.0 –3.4
Gross profit 2,954 70.9 3,119 72.3 –5.3
EBITDA 161 3.9 188 4.4 –14.4
EBIT 63 1.5 77 1.8 –18.2
Number of operational staff 30,238 29,057 4.1
Performance Contract Logistics

Strategy
The professional management and continuous expansion of its
global portfolio of high-value logistics and office buildings con-
tinue to be core elements of Kuehne + Nagel’s real estate strategy,
whose overriding aim is to support the company's business
activities. High priority is also attached to sustainable project
development and a high quality of planning and execution in
both leased and owned facilities.
Global real estate portfolio
At the end of 2011, Kuehne + Nagel's global portfolio comprised
124 logistics facilities and office buildings in 21 countries.
Real Estate: Focus on sustainabilityIn the management and expansion of its global real estate portfolio, Kuehne + Nagelfocuses on sustainability. In 2011, new logistics facilities were brought into service andfurther projects were initiated.
Usable area (sqm)
Germany, Leipzig
1st phase of logistics facility 10,000
United Arab Emirates, Dubai
2nd phase of logistics facility 14,000
Facilities under construction in 2011
Report of the Business Units _ _ _ _ _ _ Real Estate30
Usable area (sqm)
Germany, Duisburg
3rd phase of Logport logistics facility 26,000
4th phase of Logport logistics facility 14,000
France, Reims
Cross-dock facility 6,000
Facilities brought into service in 2011
All new buildings incorporate sustainability aspects and the
economical use of natural resources; the facilities in Duisburg
and Reims, for instance, are equipped with large-area photo-
voltaic solar power installations.
Market development
In the second half of 2011 the debt crisis and the economic
slowdown also impacted the real estate market and the beha-
viour of its principal actors – banks, investors and property
developers. The climate for project financing deteriorated, par-
ticularly in Southern Europe and notably in France. In such an
environment, however, more opportunities, presented them-
selves to acquire attractive properties in favourable locations.

When concluding lease agreements, the creditworthiness of the
lessees and the duration of the lease were of key importance.
There was a clear trend for shorter lease periods to be associat-
ed with significantly higher rent levels.
The supply of large sites ready for the construction of logistics
campus facilities was limited, particularly in Western Europe. It
remains to be seen whether the uncertain economic situation
will result in an easing of the market for industrial building land.
Strategic success factors
Despite the volatile situation in the global market for logistics
real estate, the strategic success factors for Kuehne + Nagel are
fundamentally unchanged. A sustainable real estate strategy
should look ahead so as to anticipate cyclical variations, and
should also permit counter-cyclical and value-creating action to
be taken in line with the opportunities that arise:
— With a view to the maintenance and development of a high-
value portfolio of company-owned real estate in strategic
locations in established markets, ownership is to be given pre-
ference over leasing, provided there is a lasting need and an
investment in an owned property is a more economic proposi-
tion than a rental solution.
— The conclusion of relatively long leases on favourable terms in
cyclically difficult periods is also an attractive measure in
order to counteract a rise in rents for a certain period of time
in a subsequent upturn phase.
Outlook for 2012
In the current business year the main objectives in the real
estate sector are once more to identify and secure the space
required for Kuehne + Nagel's business activities on either a
lease or an ownership basis, always taking the global markets
and their individual characteristics into consideration.
31Report of the Business Units _ _ _ _ _ _ Real Estate
CHF million 2011 2010 Variances 2011/2010
per cent
Turnover 76 82 –7.3
EBITDA 66 79 –16.5
EBIT 39 54 –27.8
Performance Real Estate

Insurance market
In 2011, the insurance industry faced a continued soft market in
which premium levels overall did not increase. Particularly cargo
insurance premium rates were under pressure as a result of
continuing fierce competition. Property damage insurance rate
levels stabilised throughout the year.
Development of business in 2011
The Nacora Group strengthened its position in its European core
markets. In particular, the national companies in Germany, France
and the Netherlands achieved above-average growth. The integra-
tion of the book of business of the Cologne-based insurance
broking firm, Grolman, which was acquired 2011, contributed to
the favourable performance in Germany. The overall result of the
Nacora Group already takes account of the costs of this trans-
action.
Cargo insurance sales results stabilised in North America com-
pared with the preceding year, whereas commission income in
Insurance broker: Stable development of businessThe business of the globally operating Nacora Group continued to develop at a stable level in 2011. In a challenging market environment Nacora's international network and high service level proved to be of advantage.
Report of the Business Units _ _ _ _ _ _ Insurance Broker32
South Africa and New Zealand fell short of expectations. The
Nacora companies in Brazil and Eastern Europe developed
favourably and justified the previous year’s investments in staff
and infrastructure.
Industry specific cargo insurance solutions
The Nacora Group’s activities are focussed on cargo insurance for
small and medium-sized companies in trade, industry, transport
and logistics. Its broking activity is progressively being extended
to other lines of commercial insurance with the aim of providing
comprehensive insurance solutions with a high quality of service
and consultancy.
The development of industry-specific insurance solutions was
enforced during the year 2011.The portfolio of the Nacora Group
now includes specialised cargo insurances for the segments per-
ishables, beverages/wines/spirits, oil & gas as well as for the
shipbuilding, aviation and high-tech industries. There was an
increased interest in comprehensive risk management solutions
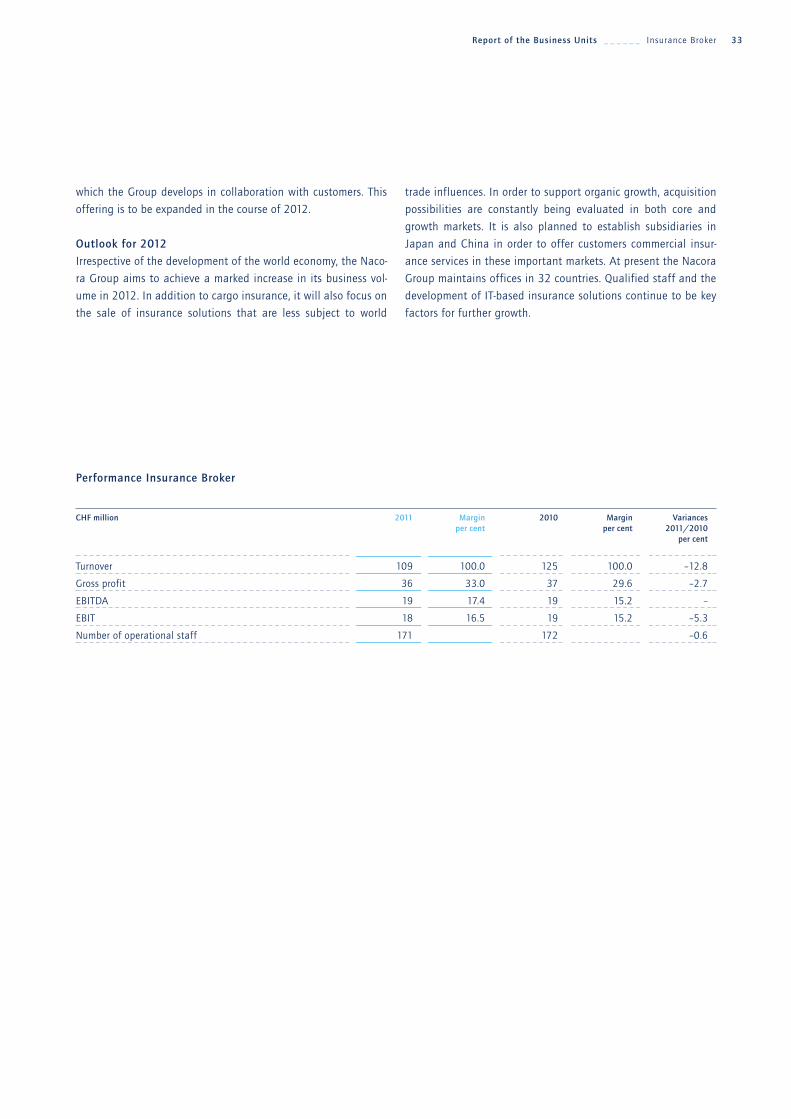
which the Group develops in collaboration with customers. This
offering is to be expanded in the course of 2012.
Outlook for 2012
Irrespective of the development of the world economy, the Naco-
ra Group aims to achieve a marked increase in its business vol-
ume in 2012. In addition to cargo insurance, it will also focus on
the sale of insurance solutions that are less subject to world
trade influences. In order to support organic growth, acquisition
possibilities are constantly being evaluated in both core and
growth markets. It is also planned to establish subsidiaries in
Japan and China in order to offer customers commercial insur-
ance services in these important markets. At present the Nacora
Group maintains offices in 32 countries. Qualified staff and the
development of IT-based insurance solutions continue to be key
factors for further growth.
33Report of the Business Units _ _ _ _ _ _ Insurance Broker
CHF million 2011 Margin 2010 Margin Variances per cent per cent 2011/2010
per cent
Turnover 109 100.0 125 100.0 –12.8
Gross profit 36 33.0 37 29.6 –2.7
EBITDA 19 17.4 19 15.2 –
EBIT 18 16.5 19 15.2 –5.3
Number of operational staff 171 172 –0.6
Performance Insurance Broker

Human resources
The human resources strategy of the Kuehne + Nagel Group
focuses on the sustained further development and training of its
staff and management in line with the company’s philosophy. It
is also dedicated to advancing organisational structures and
management principles.
Kuehne + Nagel's human resources department plays a key role
in the successful implementation of the global growth pro-
gramme. The year 2011 was marked by extensive activities to
recruit the necessary experts and managers, the integration of
seven acquired firms with a workforce of more than two thou-
sand employees, and the continuation of the various talent man-
agement programmes.
The globally harmonised HR processes and systems, which were
introduced in the year 2011 supported the value proposition of
the human resources department to the success of the company.
Recruitment and development of talent
The objective is to ensure a harmonious and continuous deve-
lopment process from induction training to the appointment to
senior managerial functions.
In 2011, major steps were made towards synchronising and
interlinking the various development programmes and levels all
over the world.
The global e-recruitment solution, which was developed in 2010,
was introduced in 51 countries and linked to 11 global job
portals. This enabled Kuehne + Nagel to reach a substantially
larger number of talented people as well as to significantly
speed up recruitment processes and, at the same time, reduce
costs.
Apprentices
Kuehne + Nagel has a strong apprenticeship programme in
place for which it received a number of awards in the year under
review. In Germany, for example, 887 young people are serving
an apprenticeship in 12 different fields of specialisation; this
represents an increase of 8.5 per cent over the previous year.
High Potentials
On the basis of local and regional young talent programmes, the
global High Potential programme, realigned in 2010, was
continued. A main focal point was the realisation of the next
development steps in the careers of the 80 participants. The can-
didates classified as “ready to move” (around 30 per cent) were
assigned within four months to their next appropriate career
function.
Training and development
In 2011 as well, Kuehne + Nagel invested in staff training and
development. More than 12,000 training and further education
courses were held all over the world. In this connection the num-
ber of computer-based training (CBT) courses increased by more
than 50 per cent with more than 60,000 participants.
Employee development at Kuehne + Nagel is based on the fol-
lowing key elements:
— Early transfer of top performers to different functions and
regions,
— Early assumption of business responsibility,
— Filling of key positions primarily from the company's own ranks.
The career and further development opportunities offered by
the company contribute to the high attractiveness of Kuehne +
Nagel as an employer. This is also reflected in the low attrition
rate among top performers, which remains unchanged at
around 3 per cent.
Increasing productivity
The personnel-intensive services in the logistics industry offer a
potential for increases in productivity. In addition to targeted
selection, special attention is paid to the successful integration
of new staff by rapid and intensive training in all relevant work
processes.
A major part of the functional trainings is accounted for by
QSHE (Quality, Safety, Health and Environment). This underlines
the company's commitment to sustainability.
SUSTAINABILIT Y
Sustainability _ _ _ _ _ _ Human Resources34

The globally uniform and direct system of recording employees'
reasons for leaving the company now permits, among other
things, a systematic identification of weaknesses in the organi-
sation or personnel management. Unwanted attrition was sub-
stantially reduced in the year under review.
Performance assessment is one of the most important means of
ascertaining the commitment and productivity of employees. In
2011, the target agreement and performance monitoring
processes was extended to further management levels of the
Group. The utilisation of the Human Capital Management Sys-
tems (HCM), an innovative IT solution, supports the process of
systematic performance measurement and management.
Knowledge management extension
To make better use of the employees’ expert knowledge, 7,300
virtual web meetings were held. This represents an increase of
40 per cent over the preceding year. In each management semi-
nar a central problem is dealt with by the participants from dif-
ferent levels of management. In 2011, the combined knowledge
of more than 100 members of the managerial staff led to con-
crete process improvements which are being implemented in the
company throughout the world.
The specialists of the Kuehne + Nagel Group can also network
and exchange knowledge through the modern communication
media of the intranet (wikis, blogs, forums). This is in line with
the general corporate philosophy of creating space for indivi-
dual initiative and value creation.
Compliance – acting according to the rules
The training campaigns on the topics of “competition law” and
“corruption and illicit payments” were continued in the year
under review. Immediately after joining the company all new
employees go through a multimedia and computer-based train-
ing at the end of which they take a final test. In addition, a
third compliance training campaign entitled “Code of Conduct”
has been developed. This will be introduced on a worldwide
basis in the current business year.
Number of employees
In 2011, the number of employees increased from 57,536 to
63,110, a rise of almost 10 per cent.
35Sustainability _ _ _ _ _ _ Human Resources
Employees: as per Dec. 31, 2011Per cent
68 Men
32 Women
Duration of employmentPer cent
18 < 1 year 27 1–3 years
15 4–5 years
19 6–10 years
18 11–25 years
3 > 25 years
Personnel structurePer cent
8 Management
48 Salaried
44 Waged

Sustainability _ _ _ _ _ _ Kuehne Foundations 36
Kuehne Foundations: An enduring commitment to training and further educationThe Kuehne Foundation, which was founded in Switzerland in 1976, has gained high esteem for its initiatives to promote training, further education and researchin the fields of logistics and transport. At the same time, it supports projects in cultural and medical areas. The Kuehne Foundation is operationally active and initiates almost all of the projects it funds. The sole donor of this public trust foundation, Prof. Dr. h. c. Klaus-Michael Kuehne, regards his commitment to quality and sustainability as an important part of his social responsibility as an entrepreneur.
Grants in the field of logistics
In addition to the financing of the Kühne Logistics University,
Hamburg, the following logistics institutes, professorships and
projects were supported in 2011:
— Professorship of Logistics Management at the Federal Insti-
tute of Technology (ETH), Zurich
— Professorship and Kuehne Centre for Logistics Management at
WHU – Otto Beisheim School of Management, Vallendar
— Hochschule für Internationale Wirtschaft und Logistik (HIWL)/
German Foreign Trade and Transport Academy (DAV), Bremen
— Professorship for Logistics Management at Tongji University,
Shanghai
— Research project “Humanitarian Logistics” at the Technical
University (TU) Berlin and establishment of a Centre for
Humanitarian Logistics at the domicile of the Foundation in
Schindellegi, Switzerland
Kühne Logistics University (KLU), Hamburg
2011 was a year of development for the Kühne Logistics Univer-
sity (KLU). Nine professors are now teaching in the faculty, and
their publications in renowned scientific journals support the
claim of KLU to an international position as a research-oriented
university. KLU currently offers two master programmes in glob-
al logistics and management. These are characterised by a cos-
mopolitan student community which now numbers more than
60, together with an excellent staff-student-ratio and a first
class network. In addition, the university offers further educa-
tion courses for managerial staff.
In November 2011, together with the leading international busi-
ness school INSEAD, KLU opened a research centre devoted to
humanitarian logistics with the joint aim of developing humani-
tarian logistics by research and innovation. The researchers will
initially concentrate on three main areas: emergency aid, global
health logistics and vehicle fleet management. Research will
also focus on the question of what humanitarian logistics can
learn from commercial logistics.
Professorship of Logistics Management at the
Federal Institute of Technology (ETH), Zurich
The Kuehne Foundation began sponsoring the Professorship of
Logistics Management at the Federal Institute of Technology
already in 2008. Apart from courses on the subjects of supply
chain management, procurement management and the manage-
ment of logistics companies as part of the regular master pro-
grammes of the ETH Zurich, the department is responsible for an
accredited further education programme, the Executive MBA in
Supply Chain Management, which is the only one of its kind in
Europe. The course, in which 25 managers receive a targeted
preparation for their next career step over an 18-month period,
started for the ninth time in September 2011. The participants
also have the opportunity to become acquainted with companies
and universities in China, Japan, Russia and the USA.
The research activities of the professorship rest on three main pil-
lars: First, problems of practical relevance are studied by scientif-
ic methods and in close collaboration with industry experts. As a
consequence, it is possible to offer logistics companies practica-
ble solutions for the optimisation of supply chains. Second, out-
standing results in research and teaching are achieved by inten-
sive collaboration with first-class partners. This requires
cooperation with appropriate institutes in Europe, the USA or
Asia, and also demands active participation in academic and
industry associations. Finally, progress is increasingly achieved
on the basis of an interdisciplinary approach, and for this reason

Grant of the Hochschule für Internationale Wirtschaft
und Logistik (HIWL)/German Foreign Trade and Transport
Academy (DAV), Bremen
At the Hochschule für Internationale Wirtschaft und Logistik
(HIWL) the Kuehne Foundation supports the Professorship for
Logistics Systems and Processes. This academy is located on the
campus of the German Logistics Association in Bremen, and
offers the dual bachelor courses in logistics and international
business studies which were accredited in 2011. They are a part
of the overall concept of “lifelong learning” which is jointly
realised by the institutions of the BVL campus, i.e. HIWL, the
German Foreign Trade and Transport Academy (DAV) and the
German Logistics Association (BVL).
Chair of Logistics Management
at the Tongji University, Shanghai
This professorship focuses on the optimisation of supply chains,
the formulation of contracts for the optimisation of supply chain
performance, and risk control. Special focus is on national and
international networking and cooperation, either with other pro-
fessorships supported by the Kuehne Foundation or with busi-
ness undertakings.
Humanitarian logistics
The H.E.L.P. Centre, which was established by the Kuehne Foun-
dation in October 2010, is devoted to training and further edu-
cation as well as consultancy in the field of humanitarian logis-
tics. In February 2011, the first African Logistics Conference was
held in Dar es Salaam in Tanzania in cooperation with the Tech-
nical University Berlin. In July 2011, the Technical University
Berlin presented the concluding report of a two-year research
project which dealt with the transfer of knowledge from Europe
to Africa. The consultancy project for the International Organisa-
tion for Migration (IOM) was completed in the year under review
and resulted in substantial savings and improvements in the
supply chain. At the same time, courses of instruction in the
field of supply chain management were held for the IOM man-
agement. The Swiss Red Cross also makes use of the consultancy
services of H.E.L.P., since the cost optimisation in logistics
enables more resources to be made available for people in need.
NetloP-Seminar –
Network management for logistics processes
In the past 11 years this series of seminars has established itself
as a firm part of German-language further training in logistics
management. More than 320 participants have now completed
the instruction courses. The holistic character of the approach to
37Sustainability _ _ _ _ _ _ Kuehne Foundations
the institute’s researchers may well elaborate questions relating
to logistics and supply chain management with methods adopt-
ed from financial management, psychology or other fields.
In June 2011, the Kuehne Foundation extended its grant of this
chair for a further four years with a donation of CHF 1.1 million
per annum.
Professorship and Kuehne Centre for Logistics
Management at WHU – Otto Beisheim School of
Management, Vallendar, Germany
The research activities at the chair of logistics management con-
centrate on the areas of sustainability and risk management in
supply chains and logistics networks. In the context of sustain-
ability, strategies for the reduction of CO2 emissions are devel-
oped and quantitatively evaluated with the use of real option
methodology. These include fleet modernisation, trading in
emission certificates and redesign of the supply chain network.
Risk management embraces operational risks as well as disrup-
tive events such as natural disasters. In this connection the sys-
tematic identification, evaluation, control of risks and their rep-
resentation in formal analytical models are important. All
research activities are conducted in cooperation with leading
logistics providers and industrial companies.
The activities of the professorship for logistics and service provi-
sion management, which has been sponsored since March 2011,
centre on the analysis of vertical and horizontal supply chain
relations, the management of logistics undertakings and servic-
es, and logistics and supply chain controlling. Special impor-
tance is attached to strategic alliances and other forms of hori-
zontal cooperation between logistics providers. At present,
studies are focusing on issues relating to governance and the
measurement and control of results in these cooperation sys-
tems. It is aimed to bring about the practical application of the
knowledge acquired in this way through studies, workshops and
day events. The elaboration and utilisation of logistics key fig-
ures in the context of controlling are addressed in a comprehen-
sive study which is being conducted in cooperation with the
German Logistics Association (BVL). The eighth annual WHO
Campus for Supply Chain Management, which is also supported
by the Kuehne Foundation, took place in March 2011 under the
motto “Managing Sustainability – Redefining Future Strategy”.
In lectures and workshops held by representatives of companies
and academics, new developments and challenges in supply
chain management were examined from the angle of sustain-
ability.

logistics logically leads to the development of cross-company
processes for whose optimisation the creation of networks is an
essential requirement. The Kuehne Foundation has entrusted
a group of distinguished experts with the development of
the challenging training programme. The seminar is currently
supported by the following teaching institutions: ETH Zurich,
Vienna University of Economics and Business, Kühne Logistics
University, Hamburg, Technical University Berlin, Kuehne Centre
for Logistics Management at the WHU and the German Foreign
Trade and Transport Academy, Bremen.
Logistics Day of the Kuehne Foundation
The Logistics Day of the Kuehne Foundation, which was held for
the tenth time in 2011, was organised by the ETH Zurich and its
Professorship for Logistics Management which is sponsored
by the Kuehne Foundation. Under the motto “Entrepreneurial
Orientation in Logistics and Supply Chain Management” it was
attended in June by more than 200 leading logistics experts
and prominent guests from trade and industry.
In addition to training and further education in the field of
logistics, the Kuehne Foundation also supports activities in the
medical and cultural fields:
CK-CARE – Allergy research
CK-CARE is an international centre which is devoted to allergy
research and education in the field of allergy. The centre, locat-
ed in Davos, was established by the Kuehne Foundation two
years ago. It carries out research in the following five areas,
which cover the most important problems of allergic diseases:
— Environment, allergies and exposure
— Immunoepidemiology of allergic diseases in childhood
— Innovative diagnosis and therapy
— Mechanisms of severe allergies
— Therapy and rehabilitation
The transfer of scientific and clinical knowledge to medical prac-
titioners, affected persons and the public is of great signi-
ficance. Increasing efforts are being made to provide doctors
and students, and also patients, with appropriate instruction. In
July 2011, CK-CARE enabled the first Global Allergy Forum
(GAF) to be held in Davos. In five working groups, more than 40
experts with a worldwide reputation in the field of allergy and
related research disciplines met to discuss urgent problems, new
solutions and possible plans of action.
Harbour Front Literature Festival in Hamburg
Logistics and literature both demand creativity and versatility.
These parallels motivated the Klaus-Michael Kuehne Founda-
tion, together with the Hamburg Senate, to create the Harbour
Front Literature Festival. For the third time, from 14 to 24 Sep-
tember 2011, German and international authors and publicists
presented themselves to a total of 22,000 friends of literature
in various venues against the backdrop of the port. For the
second time the Klaus-Michael Kuehne Prize for young authors
was awarded at the “Debütantensalon”. The donor presented
the prize at a grand finale event.
Lucerne Festival
In 2011, the Kuehne Foundation again supported the Lucerne Fes-
tival, one of the most renowned events in the field of classical
music, which attracted more than 95,000 visitors in the summer.
The festival, which was held under the motto “Night”, presented a
highly varied programme which included a performance of Ben-
jamin Britten’s turbulent opera based on Shakespeare's “Midsum-
mer Night’s Dream”.
The Kuehne Foundation is a supporter of other cultural events
and institutions, which include the Music Summer on the Lake of
Zurich, the Mecklenburg-West Pomerania Music Festival, the
Hamburg State Opera, St. Catherine’s Church Hamburg, and the
“Literaturhaus Hamburg”. The Foundation is also committed
to the preservation of the cultural heritage. With a donation of
CHF 1 million it enabled the renovation of St. Meinrad's Chapel,
which belongs to the Monastery of Einsiedeln (Canton of Schwyz).
Located on the Way of St. James to Santiago de Compostela, it
has long been regularly visited by pilgrims.
The sole donor of the Kuehne Foundations is
Prof. Dr. h.c. Klaus-Michael Kuehne.
Sustainability _ _ _ _ _ _ Kuehne Foundations 38

39Sustainability _ _ _ _ _ _ Quality, Safety, Health and Environment
Quality, Safety, Health and Environment
QSHE – the basis for all three pillars of sustainability
In 2011, the Kuehne + Nagel Group again fulfilled its entrepre-
neurial responsibility with regard to the three pillars of sustain-
ability by its integrated management in the areas of quality,
safety, health and environment:
— from the economic viewpoint, for instance, through quality
and efficiency improvements, which helped to enhance custo-
mer satisfaction and data quality and to reduce nonconfor-
mity costs;
— from the ecological viewpoint, by environmental measures
such as a reduction of CO2 emissions or the conservation of
valuable natural resources; and
— from the social viewpoint, above all by high work safety and
health protection standards.
Certification as a basis for continuous improvements
In 2011, Bureau Veritas Certifications, a global leader in con-
formity assessment and certification services, again attested
that the international management systems of the Kuehne +
Nagel Group conform to international standards in the fields of
quality, environment and work safety. 630 locations in 83 coun-
tries are now certified according to the latest quality standard
ISO 9001:2008, more than 270 locations in 46 countries con-
form to environmental standards ISO 14001, and more than
230 locations in 41 countries meet the standards relating to
work safety and health (OSHAS). At the end of 2011, Kuehne +
Nagel held 1,200 certificates with a validity of three years. The
company carried out internal audits prior to the successful new
certifications and recertification. For the first time, the QSHE-
Audit Tool (QAT) was used for the standard quality testing of all
QSHE areas in 532 locations.
In addition, Kuehne + Nagel also fulfils the special quality
standards of specific industries. Examples include the high-tech
and aerospace industries as well as the chemical and food sec-
tors. To meet the high quality demands of the pharmaceutical
and health care industries worldwide training and audit pro-
grammes were initiated in the year under review. Correspon-
ding location certifications are planned for the current business
year.
Recognition for quality
In 2011, the globally operating Kuehne +Nagel Group again
received a number of awards that testified to its high quality
level. In Asia Thailand's labour ministry conferred the “Best
Practice Workplace on Labour Relations and Labour Welfare
Award 2011” on the company, while the trade magazine “Supply
Chain Asia” nominated Kuehne + Nagel as “Seafreight For-
warder of the Year” and at the same time honoured it with the
“Supply Chain Risk Management Award”. The outstanding quali-
ty of Kuehne + Nagel's services was also honoured by the com-
pany's nomination as “Global Logistics Supplier of the Year” by
one of the world's leading technology companies, and world-
wide medical equipment manufacturer Hill-Rom Holdings Inc.
presented its “Emerging Global Partnership Award” to Kuehne +
Nagel in the USA. In recognition of its system transparency and
integrated approach, the Italian Kuehne + Nagel organisation
received the “Logistics Award of the Year 2011” from Assologis-
tica, Euromercie Assologistica Cultura e Formazione. In Turkey a
wordwide well known garment manufacturer recognised the
quality of Kuehne + Nagel's services, and the Croatian national
company was proud to receive the distinction of “Employer of
the Year for Persons with Disabilities”.
Work safety and health
For Kuehne + Nagel the health and safety of its employees is
crucial. The company endeavours to achieve sustained and con-
tinuously improved work safety and health protection, and acts
in accordance with the international standard OSHAS 18001. At
the same time, the Kuehne + Nagel corporate culture encour-
ages a high sense of responsibility and the minimisation of risks.

Sustainability _ _ _ _ _ _ Quality, Safety, Health and Environment40
Preventive training courses were held for employees working in
various fields in order to avoid accidents and damage. Targeted
health promotion measures are also offered to interested staff
members on an external basis.
In 2011, further 20 locations in seven countries were certified in
accordance with OSHAS 18001, underscoring the commitment
of Kuehne + Nagel in this field.
Security throughout the supply chain
Kuehne + Nagel is taking a number of steps to meet the growing
demands of its customers for security along the entire supply
chain. By now, 17 of its European national organisations have
achieved AEO (Authorized Economic Operator) status to strength-
en security of customs clearance. National organisations all over
the world are also recognised, inter alia, as “Regulated Agent”,
“Account Consignor” or “Known Consignor”. Kuehne + Nagel pro-
vides services for high-value goods in special high-security loca-
tions which conform to the criteria of TAPA (Transported Asset
Protection Association). Logistics centres which are certified
according to TAPA level A meet the most exacting security
requirements of customers.
Sustainable environmental management
Kuehne + Nagel’s environmental management policy is to pro-
mote sustainable economic development in all regions, business
units and industries, while, at the same time, endeavouring to:
— measure the impact of activities on the environment and
improve the results in terms of their environment-friendliness;
— lessen the consumption of natural resources by re-use, recyc-
ling or reduced use of materials, and using products that are
recyclable or come from sustainable sources;
— offer environment-friendly product alternatives (in transport
and warehousing) so as to enable customers to meet their
own sustainability obligations.
In 2011, 64 locations were newly certified in accordance with
the environmental standard ISO 14001. A global team of
experts (Quality Expert Team Environment) took care of the inte-
gration of the environmental strategy in all business units.
Global Facility Carbon Calculator (GFCC)
The GFCC system, which was introduced in 2008, was replaced
by a faster and more user-friendly version in the year under
review. The system offers greater transparency and can readily be
adapted to changes in regulations and customer requirements
relating to the calculation of emissions. It is an important tool
for monitoring the success of programmes for reducing energy,
fuel and water consumption as well as the volume of waste and
carbon dioxide emissions. In comparison with the previous year:
— energy and fuel consumption was reduced by 2.6 per cent
(40,316 KWh);
— water consumption was down by 12.3 million litres;
— the volume of waste diminished by 25.7 per cent (56,841
tonnes);
— emissions of carbon dioxide (CO2) were reduced by 2.8 per cent
(13.116 tonnes).
Global Transport Carbon Calculator (GTCC)
In the year under review there was a leap of 150 per cent in
customer interest in transport route CO2 calculations. Thanks to
the Global Transport Carbon Calculator and the high degree of
standardisation of its operational IT systems, Kuehne + Nagel
now offers emission calculations for all fields of logistics.
Go Clean – Go Green
Together with its partners, Kuehne + Nagel constantly endeav-
ours to develop new solutions for the reduction of CO2 emissions.
With “Go Clean – Go Green” the company has launched an
appropriate initiative as well as joining together with 14 ship-
ping lines and 12 multinational customers to form the Clean
Cargo Working Group (CCWG). One aim of CCWG is to
calculate fuel consumption and carbon dioxide emissions ex -
pressed in terms of emission/TEU/km and to publish the results.
A further example is the Kuehne + Nagel “Climate Neutral Serv-
ices” initiative, in which, under the motto “Avoid – Reduce –
Compensate”, customers follow a climate compensation concept
and “neutralise” CO2 emissions in defined, sustainable environ-
mental projects. This concept has been successfully implement-
ed in the Swiss national company. Last year, in collaboration
with customers, more than 300 tonnes of CO2 emissions were
offset in this way.
Outlook for 2012
In 2012, QSHE activities will again focus on sustainability, the
further development of safety management and the expansion
of reporting.

41Information Technology
Information technology
Further development of the IT strategy/IT-based products
Kuehne + Nagel’s IT strategy concentrates on the creation of a
new, robust and flexible information platform. For that reason
the whole IT architecture is being overhauled and reconfigured
on a modular basis. The aim is to standardise and improve the
efficiency of all business processes, and customer systems dis-
played, resulting in higher quality, minimisation of different
sources of error and an increase in the productivity of the indi-
vidual users.
Important milestones were reached in 2011, in particular in the
field of service orientation. This concerns “communication and
interaction” between the different IT programs. It is the goal to
achieve the highest possible level of re-utilisation and a flexible
shell consisting of a number of modules or sub-programs. These
modules, which can be individually further developed, are mutu-
ally complementary and can each be used for a number of appli-
cations. As a result of the high level of re-utilisation, a flexible
platform with a very long time horizon is being created which
allows an efficient adaptation to the needs of individual users.
It supports all areas of the company from administration to the
finance department and the operational business units. In 2011,
more than 40 new modules were incorporated into the new
technology.
In order to contribute to the further improvement of the Group’s
productivity automation and standardisation of processes con-
tinued. The more processes are standardised and automated,
the more intermediate steps are eliminated or performed more
quickly. A good example of this is the registration of customer
and shipment data. A greater number of orders can be recorded
and processed with the same number of employees. In addition,
process automation is crucial for another important objective,
the paperless office. This is another important factor for a high-
er quality of service, as customers are able to access documents
online at any time. Furthermore, Kuehne + Nagel staff is
relieved of many time-consuming routine tasks and can fully
concentrate on value-creating work in direct contact with
customers.
Streamlining of the IT-Organisation
Good progress was made in streamlining the global IT organisa-
tion structure through a move to centralisation. Whereas corpo-
rate IT was supported by a number of regional IT teams, the
organisation is now being adapted to the new demands of a
modern IT architecture and increased centralisation of the
regional teams. As a result, synergies will be created and dupli-
cations eliminated in line with the modular IT architecture. In
addition, the new structure allows a faster response to changes
in market demands.
New internet – presentation and improvement
of online services
The global internet presentation of Kuehne + Nagel has been
completely redesigned. Due to a customer-friendly, unified user
shell and navigation system all products are presented in a sim-
ple and clearly structured manner.
The information logistics platform KN Login has been further
developed. Empty container management has been added to
interactive container planning. Furthermore, the different trans-
port routes are now electronically linked in such a way that
orders can be permanently monitored in association with the
existing process. The making-out and processing of booking doc-
uments has also been substantially simplified.
To meet the growing demand for mobile solutions, Kuehne +
Nagel has introduced a mobile application into the market. Cus-
tomers can follow logistics processes at all times with online
applications such as smartphones, iPads and similar equipment.
Also, in this case the modular principle supported a cost-effi-
cient development. Apart from classic tracking, the multilingual
application also allows the tracking and tracing of sea- or air-
freight shipments on the basis of the customer's own references.
Objectives for 2012
The introduction of the first modules of the new sea- and air-
freight systems, in particular in the airfreight import and price
quotation fields is of great importance in 2012. In addition, an
innovative IT solution dedicated to the pharmaceutical industry
will be provided.
With the introduction of the new IT architecture, important sys-
tem components will be integrated into a “disaster recovery” con-
cept with global coverage, substantially improving the security of
the system. In the event of a catastrophic event, i.e. the failure of
one of the global computing centres due to a power failure,
flooding or other disaster, IT production can quickly be restored.
In this way, account is taken of the demand for an ever higher
availability of information technology in the work process.
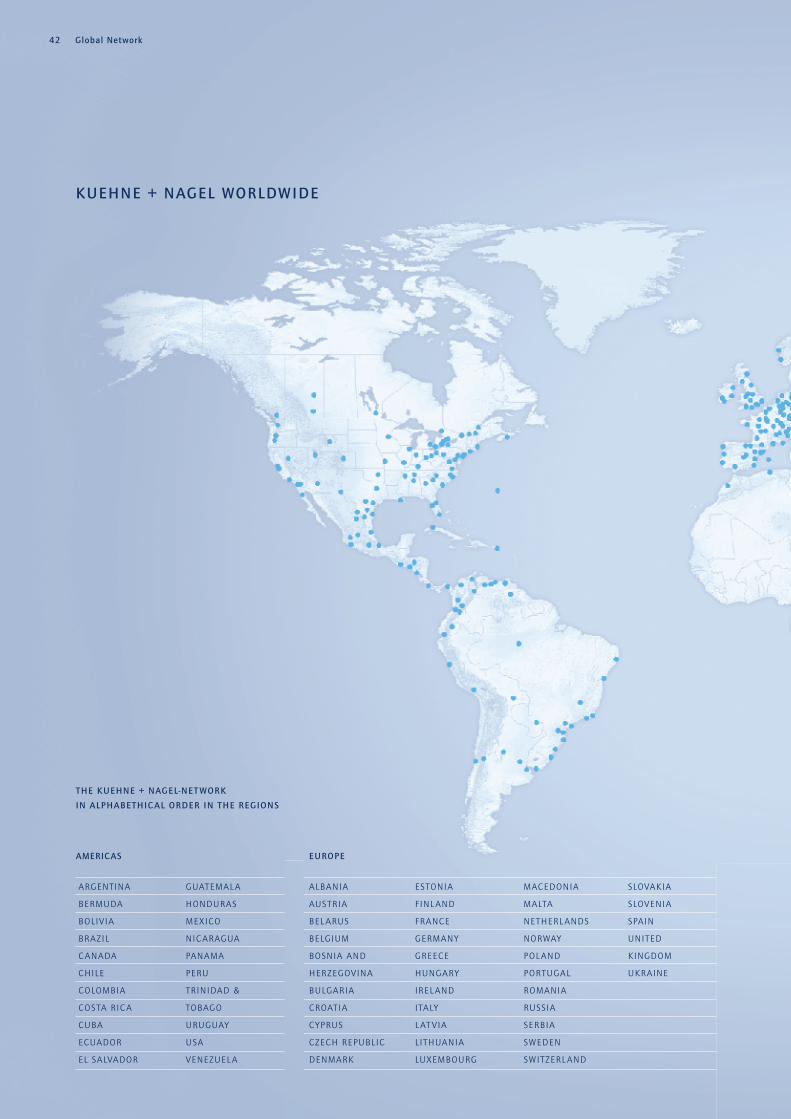
THE KUEHNE + NAGEL-NET WORK
IN ALPHABETHIC AL ORDER IN THE REGIONS
ARGENTINA
BERMUDA
BOLIVIA
BRAZIL
C ANADA
CHILE
COLOMBIA
COSTA RIC A
CUBA
ECUADOR
EL SALVADOR
GUATEMAL A
HONDURAS
MEXICO
NIC ARAGUA
PANAMA
PERU
TRINIDAD &
TOBAGO
URUGUAY
USA
VENEZUEL A
ALBANIA
AUSTRIA
BEL ARUS
BELGIUM
BOSNIA AND
HERZEGOVINA
BULGARIA
CROATIA
CYPRUS
CZECH REPUBLIC
DENMARK
ESTONIA
FINL AND
FRANCE
GERMANY
GREECE
HUNGARY
IREL AND
ITALY
L AT VIA
LITHUANIA
LUXEMBOURG
MACEDONIA
MALTA
NETHERL ANDS
NORWAY
POL AND
PORTUGAL
ROMANIA
RUSSIA
SERBIA
SWEDEN
SWITZERL AND
SLOVAKIA
SLOVENIA
SPAIN
UNITED
KINGDOM
UKRAINE
KUEHNE + NAGEL WORLDWIDE
AMERICAS
Global Network42
EUROPE

LEBANON
MAURITIUS
MOZAMBIQUE
NAMIBIA
NIGERIA
QATAR
SAUDI ARABIA
SOUTH AFRICA
SYRIA
TANZANIA
TURKEY
UGANDA
UNITED ARAB
EMIRATES
UZBEKISTAN
ZAMBIA
ZIMBABWE
AFGHANISTAN
AUSTRALIA
BANGL ADESH
C AMBODIA
CHINA
INDIA
INDONESIA
JAPAN
KOREA
MAC AU
MAL AYSIA
MALDIVES
NEW ZEAL AND
PAKISTAN
PHILIPPINES
SINGAPORE
SRI L ANKA
TAIWAN
THAIL AND
ASIA -PACIFIC
43Global Network
MIDDLE EAST, CENTRAL ASIA AND AFRIC A
ANGOL A
BAHRAIN
EGYPT
EQUATORIAL
GUINEA
IRAN
ISRAEL
JORDAN
KAZAKHSTAN
KENYA
KUWAIT

Group structure and shareholdersUnder Swiss company law the Group is organised as limited
company that has issued shares of common stock to investors.
Kuehne + Nagel International AG is the ultimate holding com-
pany of the Group.
Operational group structure
The operational structure of the Group is divided into the
following segments:
Reportable segments consisting of the business units:
— Seafreight
— Airfreight
— Road & Rail Logistics
— Contract Logistics
— Real Estate
— Insurance Brokers
Geographical information relating to the regions:
— Europe
— Americas
— Asia-Pacific
— Middle East, Central Asia and Africa
Business performance is reported according to this operational
structure. For further information on the business units, please
refer to sections “Reports of the Business Units” and the
“Consolidated Financial Statements” respectively.
CORPORATE GOVERNANCE
Kuehne + Nagel is committed to good corporate governanceGood corporate governance is an important and integral part of the management culture of the Kuehne + Nagel Group (the Group). The principles of corporate governance, as defined in the Directive on Information Relating to Corporate Governance (RLCG) of the SIX Swiss Exchange, are laid down in the Articles of Association, the Organisational Rules, and the Committee Regulations of the holding company of the Group, Kuehne + Nagel International AG, Schindellegi, Switzerland (the Company). The Group follows best practice recommendations and standards established in the “Swiss Code of Best Practice for Corporate Governance”.
44
Listed companies of the Group
Kuehne + Nagel International AG, the ultimate holding company,
is the only company listed within the scope of the Group’s consoli-
dation. Kuehne + Nagel International AG has its registered office
in Schindellegi, Switzerland, and its shares are listed on the SIX
Swiss Exchange, Zurich. The company’s market capitalisation on the
closing date (December 31, 2011) amounted to CHF 12,660 million
(120 million registered shares at CHF 105.50 per share).
Of the total Kuehne + Nagel International AG share capital
on the closing date:
— the free float consisted of 55,408,099 shares
= 46.1 per cent and
— treasury shares consisted of 691,901 shares
= 0.6 per cent
Kuehne + Nagel International AG shares are traded under the
symbol “KNIN”, the security number is 2’523’886 and ISIN is
CH0025238863.
Non-listed companies in the Group's consolidation
The main subsidiaries and associated companies of the Group
are disclosed in the appendix “Significant subsidiaries and joint
ventures” to the Consolidated Financial Statements (pages 114
to 119), including particulars as to the country, name of the com-
pany, location, share capital, and the Group’s stake in per cent.

Main shareholders
The main shareholder of the Group is Kuehne Holding AG,
Schindellegi, Switzerland, which holds 53.3 per cent of the
Kuehne + Nagel International AG share capital and is 100 per
cent owned by Mr. Klaus-Michael Kuehne.
The Kuehne Foundation held 4.3 per cent of the Kuehne +
Nagel International AG share capital as at the closing date.
Cross-shareholdings
On the closing date there were no cross-shareholdings in place.
Capital structure
Ordinary share capital on the closing date
The ordinary share capital of Kuehne + Nagel International AG
amounts to CHF 120 million and is divided into 120 million
registered shares of a nominal value of CHF 1 each.
Authorised and conditional share capital
The Annual General Meeting held on May 18, 2010 extended its
authorisation of authorised share capital up to a maximum of
CHF 20 million by a further two years until May 8, 2012.
The Annual General Meeting held on May 2, 2005 approved
a conditional share capital increase up to a maximum of
CHF 12 million and to add the respective section in the Articles
of Association.
So far no use has been made of these rights. There is no resolu-
tion of the Board of Directors outstanding for further issuance
of either authorised or conditional capital.
For a description of the group of beneficiaries and of the terms
and conditions of the issue of authorised and conditional share
capital, please refer to the Articles of Incorporation Art. 3.3 and
3.4, which are available on the Company website (http://
www.kn-portal.com/about_us/investor_relations/corporate_
governance/).
At the Annual General Meeting held on May 2, 2006 the share-
holders approved a 1:5 split of the registered shares and a com-
mensurate increase in the number of Kuehne + Nagel shares.
At the same time the nominal value per share relating to the
approved share capital and conditional share capital was also
lowered from CHF 5 to CHF 1.
Change in capital over the past three years
During the years 2009 through 2011 no changes in capital
occurred other than related to approved share capital as out-
lined above.
Shares and participating certificates
On the closing date 120 million registered shares of a nominal
value of CHF 1 each were outstanding. At the same date, no
participating certificates were outstanding.
Profit sharing certificates
There were no profit sharing certificates outstanding as at the
closing date.
Limitations on transferability and nominee registrations
Each share has one vote. All shares have equal voting rights and
no preferential rights or similar entitlements exist. The Articles of
Association do not provide for any limitations on the transfer of
shares. Nominees are entered in the share register only upon their
written agreement to declare the names, addresses, and share-
holdings of the respective persons on whose account they are
holding shares.
Convertible bonds and warrants/options
No convertible bonds, warrants or options were outstanding
as at the closing date other than related to the Group’s Em-
ployee Share Purchase and Option Plan. For details to the
Group’s Employee Share Purchase and Option Plan, please refer
to note 37 of the Consolidated Financial Statements on pages
94 to 96.
Board of DirectorsAt the Annual General Meeting of May 10, 2011, Mr. Klaus-
Michael Kuehne, Mr. Bernd Wrede, Mr. Karl Gernandt, Mr. Juergen
Fitschen, Mr. Hans-Joerg Hager, Mr. Hans Lerch, Dr. Wolfgang
Peiner, Dr. Thomas Staehelin and Dr. Joerg Wolle were re-elected
to the Board of Directors for a one-year term. Dr. Renato Fassbind
has been newly elected to the Board of Directors for a one-year
term. Dr. Joachim Hausser and Dr. Georg Obermeier whose man-
dates expired at the Annual General Meeting, retired from the
Board.
On the closing date the Board of Directors comprised ten
members. Their biographical particulars are as follows:
45Corporate Governance

Klaus-Michael Kuehne, Honorary Chairman, German, 1937
Commercial apprenticeship in banking industry.
Other significant activities: Chairman of the board of trustees of
the Kuehne Foundation, Schindellegi, and the Klaus-Michael
Kuehne Foundation, Hamburg.
Positions within the Kuehne + Nagel Group:
1958 Entrance into the family business followed
by various management positions
1966–1975 Chief Executive Officer of the Group
1975–1992 Delegate and member of the Board
of Directors
1992–2009 Executive Chairman of the Board
of Directors
Chairman of the Nomination and
Compensation Committee
2009–2011 Chairman of the Board of Directors
Chairman of the Nomination and
Compensation Committee
2010–2011 Chairman of the Chairman’s Committee
2011–today Honorary Chairman of Kuehne + Nagel
International AG
Member of the Board of Directors
elected until the Annual General
Meeting 2012
Member of the Nomination and
Compensation Committee
Member of the Chairman’s Committee
Karl Gernandt, Chairman, German, 1960
After completing his studies in business administration at the Uni-
versity of St. Gallen, Switzerland, Karl Gernandt worked for
Deutsche Bank AG from 1988 to 1995. There he held positions in-
cluding that of assistant to the Head of the Board of Management
and Chairman of the Supervisory Board as well as functions in
international banking in Germany, Asia and the USA. From 1996
to 1999 he set his mark on the Financial Institution Group of A.T.
Kearney GmbH. In 1999 Gernandt moved to Holcim (Deutschland)
AG as Chairman of the Board of Management and was, at the
same time, a member of the European Management Team of Hol-
cim Ltd., Switzerland. In March 2007 he became CEO of Holcim
Western Europe, based in Brussels. Since October 1, 2008 Karl
Gernandt has been nominated as CEO of Kuehne Holding AG,
Schindellegi, and board member of the Kuehne Foundation. He is
also Managing Director of the Klaus-Michael Kuehne Foundation
in Hamburg.
Other significant activities: Member of the Board of Directors of
HCI Capital AG, Hamburg; Executive Vice Chairman of the Board
of Directors of Hapag-Lloyd AG, Hamburg, and Member of the
Board of Directors of Holcim (Deutschland) AG, Hamburg.
Positions within the Kuehne + Nagel Group:
2008–2011 Member of the Board of Directors
2009–2011 Executive Vice Chairman and
Delegate of the Board of Directors
2010–2011 Member of the Chairman’s Committee
2011–today Chairman of the Board of Directors
elected until the Annual General
Meeting 2012
Chairman of the Chairman’s Committee
Member of the Nomination and
Compensation Committee
Member of the Audit Committee
Bernd Wrede, Vice Chairman, German, 1943
Graduated in business administration from the Universitiy of
Wuerzburg. From 1982 to 2001 member of the Board of Hapag-
Lloyd AG, Hamburg, and its Chairman as of 1993. Currently an
independent management consultant.
Other significant activities: Member of the Supervisory Board of
HSH Nordbank AG, Hamburg; Advisory Director of Investcorp
International Ltd., London, and member of the Board of Trustees
of the ZEIT Foundation, Hamburg.
Positions within the Kuehne + Nagel Group:
1999–2002 Member of the Board of Directors
2002–today Vice Chairman of the Board of Directors
elected until the Annual General Meeting
2012
2008–2009 Member of the Investment Committee
Chairman of the Economic Council
2003–2006/ Member of the Audit Committee
2008–today
2003–today Member of the Nomination and
Compensation Committee
2010–today Member of the Chairman’s Committee
Corporate Governance46

Hans-Joerg Hager, German, 1948
Since 1988 Hager holds a bachelor degree from the Wuerttemberg
Administration and Business Academy in Stuttgart and completed
successfully the “TOP International Management Program” at
INSEAD/Fontainebleau in 1998. Since January 2009 Hager is
the president of the UCS (entrepreneurs-colloquium forwarding).
Hager held various board positions at Schenker AG from 1996 to
2008. In 2000 he was appointed chairman of Schenker AG, Ger-
many which position he held until 2008. From 2001 to 2004 and
from 2006 to 2008 Hager was a member of the Board of the
Schenker AG responsible for the Europe region and the overland
transportation business.
Position within the Kuehne + Nagel Group:
2009–today Member of the Board of Directors
elected until the Annual General
Meeting 2012
Hans Lerch, Swiss, 1950
Commercial apprenticeship in tourist industry with a 35 years
career at Kuoni Travel Holding Ltd., assignments in the Far East
from 1972–1985, various responsibilities at the company’s head-
quarters in Zurich, President and CEO from 1999–2005. Chair-
man and CEO of SR Technics in Zurich from 2005–2008. Vice
Chairman and CEO of Hotelplan Holding Ltd., Zurich, since 2010.
Other significant activities: Executive Director of Abercrombie &
Kent Group of companies, London; Chairman of the Board of
Directors of the International School of Tourism Management,
Zurich; Vice Chairman of the Board of Directors of New Ven-
turetec Ltd., Zug; Chairman of the Board of Trustees of the
move>med Foundation, Zurich.
Positions within the Kuehne + Nagel Group:
2005–today Member of the Board of Directors elected
until the Annual General Meeting 2012
2006–2010 Member of the Nomination and
Compensation Committee
Dr. Renato Fassbind, Swiss, 1955
After graduating from his studies in economics at the University
of Zurich, Dr. Renato Fassbind worked as an assistant in the “In-
stitut für Schweizerisches Bankwesen” at the University of Zurich
between 1979 and 1982. In 1984 he joined Hoffmann-La Roche
AG in Basel and advanced to the Head of Internal Audit. In 1990
he joined ABB AG being the Chiel Financial Officer from 1997
until 2002; from 2002 until 2004 he was the Chief Executive
Officer of Diethelm Keller Holding AG, Zurich.
In 2004 Dr. Renato Fassbind joined the Credit Suisse Group as the
Chief Financial Officer of the Credit Suisse Group AG and the
Credit Suisse AG until October 2010. In his function he was mem-
ber of the Executive Boards of Credit Suisse Group AG and of
Credit Suisse AG since 2004.
Other significant activities: Member of the Board of Directors of
Swiss Re. Ltd., Zurich; Member of the Board of Directors of the
Swiss Federal Audit Oversight Authority (FAOA), Bern, and Senior
Advisor of Credit Suisse Group, Zurich.
Positions within the Kuehne + Nagel Group:
2011–today Member of the Board of Directors
elected until the Annual General
Meeting 2012
2011–today Member of the Audit Committee
Juergen Fitschen, German, 1948
Trained as a wholesale and export trader, then graduated in busi-
ness administration from Hamburg University, joined Deutsche
Bank AG in 1987 and was promoted to the Group Executive Com-
mittee in 2002. He is Global Head of Regional Management and,
since 2005, also serves as CEO of Deutsche Bank Germany and
Chairman of the Management Committee Germany. In these func-
tions Fitschen was appointed to Deutsche Bank Management
board in 2009.
Other significant activities: Member of the Supervisory Board of
Metro AG and Schott AG.
Positions within the Kuehne + Nagel Group:
2008–today Member of the Board of Directors
elected until the Annual General
Meeting 2012
2008–2009 Member of the Economic Council
47Corporate Governance

Dr. Wolfgang Peiner, German, 1943
Studied business administration at the Universities of Hamburg
and Lawrence, Kansas, USA, and holds a Master in Accounting
and Finance. He was member and Chairman of the Management
Board of Gothaer Insurance Group from 1984 to 2001 and Head
of the Ministry of Finance of the Free and Hanseatic City of Ham-
burg from 2001 to 2006.
Other significant activities: Chairman of the Board of Directors
of Germanischer Lloyd AG; since 2009 Chairman/Deputy Chair-
man of the Board of Directors of Norddeutscher Rundfunk NDR;
Member of the Board of Directors of Maxingvest AG; Member of
the Board of Trustees of the Kuehne Foundation and of the Board
of Directors of Kuehne Holding AG; President of the Kuehne
Logistics University.
Positions within the Kuehne + Nagel Group:
2000–2001 Member of the Board of Directors
2007–today Member of the Board of Directors
elected until the Annual General
Meeting 2012
Dr. Thomas Staehelin, Swiss, 1947
Holds a PhD in law from the University of Basel; Lawyer.
Dr. Thomas Staehelin is a Swiss Corporate and Tax Attorney and Part-
ner in the Basel based law firm Fromer Advokatur und Notariat.
Other significant activities (among others): Chairman of the
Board of Directors of Kuehne Holding AG, Schindellegi; Vice
Chairman of Kuehne Foundation; Vice Chairman of the Board of
Directors of Siegfried Holding AG, Zofingen; Member of the Board
of Directors and Chairman of the Audit Committee of Inficon
Holding AG, Bad Ragaz; Chairman of the Board of Directors of
Swissport International SA, Opfikon, and of Scobag Privatbank
AG, Basel; Chairman of the Board of Directors of Lantal Textiles,
Langenthal and of Stamm Bau AG, Binningen; Member of the
Board of Directors of economiesuisse (Swiss Business Federation);
President of the Basel Chamber of Commerce; Chairman of Verei-
nigung der Privaten Aktiengesellschaften; and member of the
Swiss Foundation for Accounting and Reporting Recommenda-
tions (SWISS GAAP FER).
Positions within the Kuehne + Nagel Group:
1978–today Member of the Board of Directors
elected until the Annual General
Meeting 2012
2006–today Chairman of the Audit Committee
Corporate Governance48
Dr. Joerg Wolle, German/Swiss, 1957
Holds a PhD in Mechanical Engineering. Since June 2002 Presi-
dent and CEO of DKSH Group which resulted from the merger of
the Asian activities of Diethelm Keller and SiberHegner. Previously
he worked since 2000 in the same function at SiberHegner. From
1991 to 1995 Dr. Joerg Wolle worked as Director of Marketing and
Sales at SiberHegner in Hong Kong and in 1995 became a mem-
ber of the management board of SiberHegner in Zurich.
Other significant activities: Honorary Professor for “Intercultural
Communication” at the University of Applied Sciences, Zwickau,
Germany. Member of the management board of the German Asia-
Pacific Business Association and member of the Board of Direc-
tors of the Diethelm Keller Holding.
Positions within the Kuehne + Nagel Group:
2010–today Member of the Board of Directors
elected until the Annual General
Meeting 2012
2011–today Chairman of the Nomination and
Compensation Committee
With the exception of the Chairman of the Board of Directors,
Karl Gernandt, all members of the Board of Directors are non-
executive directors, none of them serves as a member of the
Management Board and with the exception of the Honorary
Chairman, Klaus-Michael Kuehne, none of them has important
business connections with Kuehne + Nagel.
Election and duration of tenure
Board members are elected for a period of one year. There are
no limits regarding the number of terms of service or the age of
the incumbents. The election for Board membership is carried
out whenever the tenure expires. Instead of summary election of
the whole Board of Directors, individual re-elections are held for
each member. This allows shareholders to judge the contribu-
tion of each member of the Board of Directors separately.
Internal organisation, Board committees
and meetings in 2011
According to the Articles of Association and the Swiss corporate
law the main tasks of the Board of Directors comprise:
— strategic direction and management of the Company,
— accounting matters,
— financial control and planning,
— appointing and dismissing Management Board members and
other senior executives,

— supervisory control of business operations, and
— submission of proposals to the Annual General Meeting, in
particular the KNI and Group Financial Statements.
The Board of Directors has elected Karl Gernandt as the Chair-
man of the Board of Directors as of May 10, 2011, and has
named Klaus-Michael Kuehne as Honorary Chairman of Kuehne
+ Nagel International AG. The entire Board of Directors, however,
is responsible for decisions on such above-mentioned aspects
that are of significant importance to the Group. The scope of
responsibilities of the Board of Directors, the Chairman and the
Vice Chairman are stipulated in the Organisational Rules.
The Board of Directors usually convenes for one full-day meeting
quarterly with the Management Board being at least represented
by the CEO and the CFO. The Board of Directors has the discre-
tion to invite other members of the Management Board to attend
these meetings.
The Board of Directors takes decisions during the meetings or by
written circular resolutions.
All Committees meet as often as required, but usually quarterly.
Audit Committee
The Audit Committee consists of three to five non-executive, pre-
dominantly independent members of the Board of Directors
elected for a period of one year. Re-election as member of the
Audit Committee is allowed. Members of the Management
Board cannot be members of the Audit Committee.
The Audit Committee reviews the quarterly financial statements
prior to publication. As part of the regular contacts between the
Audit Committee and both the internal and external auditors,
the quality and functioning of the internal control mechanisms
and the risk assessments are reviewed and evaluated continually
on the basis of written reports from the internal audit depart-
ment as well as of management letters from the external audi-
tors based on their interim audits in order to set priorities for
the year-end audit. Furthermore, a regular contact with the exter-
nal auditors throughout the year enables the Audit Committee
to obtain knowledge of problem areas at an early stage. This
allows proposing the timely introduction of any corrective meas-
ures to the Management Board.
49Corporate Governance
Dr. Thomas Staehelin was the Chairman of the Audit Committee
as at the closing date, assisted by its members Karl Gernandt,
Bernd Wrede and Dr. Renato Fassbind.
The Audit Committee holds at least four meetings annually. The
Honorary Chairman can take part in the meetings as an advisor.
Unless otherwise determined by the Audit Committee, the CEO,
the CFO and the audit partner in charge take part in all meet-
ings, whilst the head of internal audit is invited as an advisor
whenever needed. In 2011 the audit partner in charge attended
three meetings of the Audit Committee. The Committee’s Chair-
man reports to the other members of the Board of Directors
about the topics discussed in detail and decisions taken and/or
to be submitted to the entire Board of Directors for approval.
Nomination and Compensation Committee
The Nomination and Compensation Committee consists of three
to five members of the Board of Directors elected for a period of
one year. Re-election is allowed. The Chairman of the Board of
Directors is permitted to be part of the Nomination and Com-
pensation Committee as long as the majority consists of non-
executive and independent members.
The Committee is responsible for nominating and securing the
competent staffing of the Management Board. For this purpose
the Committee, on the one hand, develops guidelines and crite-
ria for the selection of candidates and on the other hand, pro-
vides initial gathering of information as well as review of poten-
tial new candidates according to the guidelines mentioned
above. The Committee prepares the adoption of a final resolu-
tion, which is reserved to the Board of Directors.
In the field of compensation the Committee defines the princi-
ples of compensation for the members of both the Board of
Directors and the Management Board. The Committee recom-
mends the amounts of compensation for each member of the
Board of Directors. Moreover, it evaluates the individual per-
formance of each member of the Management Board and
approves their compensation in amount and composition.
On the closing date, Dr. Joerg Wolle was the Chairman of the
Nomination and Compensation Committee; Klaus-Michael
Kuehne, Karl Gernandt, Bernd Wrede and Hans Lerch were
members.

On invitation of the Chairman, the Nomination and Compensa-
tion Committee convenes as often as business requires, but at
least three times a year. Members of the Management Board
can take part in the Nomination and Compensation Committee
meetings by invitation.
The Board of Directors is informed by the Chairman of the Nom-
ination and Compensation Committee about all issues dis-
cussed, in particular, about all decisions taken within the com-
petence of the Board of Directors.
Chairman’s Committee
The Chairman’s Committee consists of the Chairman, the Vice
Chairman and the Honorary Chairman of the Board of Directors
for the period of their tenure in the Board of Directors. The Chair-
man’s Committee advises the Board of Directors on the financial
performance of the Group, its economical development and
measures of optimisation as well as of any other significant
developments within the Group. In its advisory role the Chair-
man’s Committee reports to the Board of Directors for decisions.
On the closing date, Karl Gernandt was the Chairman of the
Chairman’s Committee and Klaus-Michael Kuehne and Bernd
Wrede were members.
On invitation of the Chairman, the Chairman’s Committee con-
venes as often as business requires, but typically four times a
year. The Board of Directors has the discretion to invite Mem-
bers of the Management Board being at least represented
by the CEO and the CFO and to invite other members of the
Management Board to attend these meetings.
The Board of Directors is informed by the Chairman of the Chair-
man’s Committee about all issues discussed, in particular, about
all decisions to be taken within the competence of the Board of
Directors.
Rules of competence between the Board of Directors
and the Management Board
The Board of Directors executes the non-transferable and
inalienable duties of the ultimate management of the Group. As
far as the non-transferable and inalienable duties of the Board
of Directors are not concerned, the management responsibility
Corporate Governance50
of the Kuehne + Nagel Group is an obligation of the Chairman
of the Board of Directors. He is entitled to transfer responsibili-
ties and competences relating to the operational management
to the Management Board. The Management Board is respon-
sible for the development, execution and supervision of the day-
to-day operations of the Group and the Group companies to the
extent they are not allocated to the Annual General Meeting,
the Statutory Auditor, the Board of Directors or the Chairman of
the Board of Directors by law, by the Articles of Association or
by the Organisational Rules. The Organisational Rules define
which businesses are able to be approved by the Management
Board and which businesses require the approval of the Chair-
man of the Board of Directors pursuant to approval require-
ments based on the extent and kind of the respective business.
The following businesses require, although delegated to the
Management Board, the approval of the Chairman of the Board
of Directors:
— General guidelines for corporate policy, management, organi-
sation, quality principles and catalogues of competences
— Determination and change of Corporate Identity
— Substantial acquisition or foundation of subsidiaries or affili-
ates respectively their sale, encumbrance or liquidation as well
as substantial purchase and sale of properties and buildings
— Substantial capital increases and capital restructuring of sub-
sidiaries
— Substantial lease and rent commitments
— Yearly target setting process as well as any amendments
thereto
— Initiation or execution of lawsuits/legal proceedings and
other official procedures with a significant dispute value or
exposure.
Information and control system of the Management Board
The Management Board informs the Board of Directors on a
regular and timely basis about the course of business by means
of a comprehensive financial Management Information System
(MIS) report which provides monthly worldwide consolidated
results by segment and country including comparative actual,
budgeted and prior-year figures as well as consolidated Balance
Sheet and Cash Flow analysis two weeks after a month’s end at
the latest.

The Chairman of the Board of Directors takes part in the Manage-
ment Board meetings regularly, while the CEO and the CFO are
generally invited to meetings of the Board of Directors, the Audit
Committee as well as to the meetings of the Chairman’s Commit-
tee. Members of the Management Board can take part in Nomi-
nation and Compensation Committee meetings by invitation.
Depending on the agenda, the Board of Directors has the discre-
tion to invite other members of the Management Board to attend
its meetings.
Risk management is a fundamental element of the Group’s busi-
ness practice on all levels and encompasses different types of
risks. At Group level, risk management is an integral part of the
business planning and controlling processes. Material risks are
monitored and regularly discussed with the Risk and Compliance
Committee of the Management Board and with the Audit Com-
mittee. The risk management system within the Group covers
both financial and operational risks.
51Corporate Governance
Furthermore, risk management is part of the Internal Control Sys-
tem (ICS). Preventive and risk-reducing measures to control risks
are proactively taken on different levels and are a fundamental
part of management responsibility. Finance and accounting
department conducts in collaboration with regional management
and Management Board a risk assessment at least once a year.
Details on risk management, including identified risks, are provid-
ed in the Consolidated Financial Statements, note 48 on pages
103 to 109.
Internal audit function reports directly to the Chairman of the
Board of Directors about ongoing activities and audit reports and
acts under the supervision of the Audit Committee (e.g. the annual
audit plan is approved by the Audit Committee). Kuehne +
Nagel’s Internal Audit is an independent, objective assurance and
consulting activity that assists Management in the effective excer-
cising of their responsibilities by assessing the adequancy and
effectiveness of internal controls.
Board of Audit Nomination and Chairman’s Directors Committee Compensation Committee
Committee
Number of meetings in 2011 5 6 5 7
Approximate duration of each meeting 10 hours 3 hours 1 hour 4 hours
Klaus-Michael Kuehne 5 5 7
Karl Gernandt 5 6 3 7
Bernd Wrede 4 5 4 7
Dr. Renato Fassbind 1 3 4
Juergen Fitschen 4
Hans-Joerg Hager 5
Dr. Joachim Hausser 2 3
Hans Lerch 5 5
Dr. Georg Obermeier 2 3 2 2
Dr. Wolfgang Peiner 5
Dr. Thomas Staehelin 5 5
Dr. Joerg Wolle 5 5
1 Elected to the Board of Directors on May 10, 2011.
2 Retired from the Board of Directors on May 10, 2011.
Board and committees: Membership, attendance, number and duration of meetings

Management BoardEffective September 1, 2011, Otto Schacht was appointed Execu-
tive Vice President Seafreight of the Group and Tim Scharwath
appointed Executive Vice President Airfreight of the Group.
Peter Ulber, Executive Vice President Sea & Air Logistics of the
Group, member of the Management Board until August 30,
2011, left the Group effective December 31, 2011.
At the closing date, the biographical particulars of the Manage-
ment Board are as follows:
Reinhard Lange, German, 1949
Apprenticeship and graduation in logistics.
Positions within the Kuehne + Nagel Group:
1971–1985 Head of Seafreight Import, Bremen,
Germany
1985–1990 Regional Director Seafreight
Asia-Pacific, Hong Kong
1990–1995 Member of the German Management
Board responsible for Seafreight and
industrial packing
1995–1999 President and Chief Executive Officer of
Kuehne + Nagel Ltd., Toronto, Canada
1999–2008 Chief Operating Officer (COO) Sea &
Air Logistics of the Group
2007–2008 Deputy CEO
2009–today Chief Executive Officer of the Group,
Chairman of the Management
Board of KNI
Gerard van Kesteren, Dutch, 1949
Chartered accountant. Spent 17 years at Sara Lee Corporation in
various management positions in finance, lastly as Director of
Financial Planning and Analysis.
Corporate Governance52
Positions within the Kuehne + Nagel Group:
1989–1999 Regional Financial Controller
Kuehne + Nagel Western Europe
1999–today Chief Financial Officer (CFO) of the Group
Lothar Harings, German, 1960
Lawyer (assessor iur.). Various national and international manage-
ment positions with Siemens, amongst others, Vice President
Human Resources Siemens AG for Enterprise & International HR
ICN from 1998 to 2002. Member of the Management Board of T-
Mobile International. Responsible for Global Human Resources
with T-Mobile AG and Deutsche Telekom from 2002 until March
2009.
Other significant activities: Member of the Board of Directors of
University Bonn; Member of the academic advisory board of Bon-
ner Akademie, Bonn, and National Curator of Deutsches Komitee
of AIESEC e. V., Bonn.
Positions within the Kuehne + Nagel Group:
01.04.2009–today Chief Human Resources Officer
(CHRO)
2010–today Company Secretary
Martin Kolbe, German, 1961
Graduated computer scientist. Positions in IT management in-
cluding CIO with Deutsche Post World Net from 2002 to 2005,
responsible for DHL Europe and DHL Germany as well as member
of the Supervisory Board in several DPWN-associated companies.
Other significant activities: Member of the certification commit-
tee ASIIN for degree courses in Business Informatics and member
of advisory board for degree courses in Business Informatics at
the Technical University Berlin.
Position within the Kuehne + Nagel Group:
2005–today Chief Information Officer
(CIO) of the Group

53Corporate Governance
Dirk Reich, Swiss-German double citizen, 1963
Graduated from the Koblenz School of Corporate Management in
Germany, followed by positions with Lufthansa AG and VIAG AG.
Positions within the Kuehne + Nagel Group:
1995–2001 Senior Vice President Corporate
Development
2001–today Executive Vice President Contract
Logistics of the Group
2008–2009 Company Secretary
2010–2011 Executive Vice President Road & Rail
and Contract Logistics of the Group
Horst-Joachim (Otto) Schacht, German, 1959
Graduated as a shipping agent.
From 1978 to 1997 various positions with Hapag-Lloyd, including
three years as United States Posting and Trade Manager Far East-
Europe.
Positions within the Kuehne + Nagel Group:
1997–1999 Member of the Management Board of
Kuehne + Nagel Germany, responsible
for Seafreight
1999–2011 Senior Vice President Global Seafreight
As of 01.09.2011 Executive Vice President Seafreight
of the Group
Board of Directors Guaranteed Additional Additional Additional Compensation Compensation Compensation Compensation
Audit Nomination and Chairman’sCommittee Compensation Committee
Committee in CHF
Chairman of the Board of Directors 1 300,000 15,000 10,000 –
Vice Chairman and members 2,133,333 45,000 83,611 22,500
Total 2,433,333 60,000 93,611 22,500
1 Compensations are included in remuneration to the Chairman and the Management Board;
refer to page 127, note 12 to the 2011 Financial Statements of Kuehne + Nagel International AG.
Tim Scharwath, German, 1965
Graduated from the University of Hamburg (Dipl. Kfm.)
Positions within the Kuehne + Nagel Group:
1992–2003 Various Management Positions within
the Kuehne + Nagel Group
2004–2007 Executive Vice President Airfreight
Central Europe
2007–2008 Managing Director of Kuehne + Nagel
Netherlands
2008–2011 Regional Director North West Europe
As of 01.09.2011 Executive Vice President Airfreight
of the Group
Compensation, shareholdings and loans
The compensation allowed to the Board of Directors and Man-
agement Board is regulated and reviewed by the Nomination
and Compensation Committee annually or when management
contract tenures expire.
The Board of Directors regulates the compensation, allocation
of shares and granting of loans to the Board of Directors, while
the Board of Directors’ Nomination and Compensation Commit-
tee regulates such matters for the Management Board.
In 2011 the members of the Board of Directors received a guar-
anteed cash compensation as well as a compensation for partic-
ipation in the respective committees as follows:

Corporate Governance54
The members of the Management Board receive a cash income
with a fixed component and a component linked to the Compa-
ny’s net earnings; furthermore they have the possibility to parti-
cipate in the Employee Share Purchase and Option Plan.
Remuneration accrued for and paid to members
of the Board of Directors and the Management Board
The total remuneration accrued for and paid to the members
of the Board of Directors and the Management Board in the
financial year 2011 amounted to CHF 17 million, of which CHF
15 million were paid to the sole executive member of the Board
of Directors and the members of the Management Board, and
CHF 2 million to the non-executive members of the Board of
Directors.
Further details on the remuneration accrued for and paid to the
members of the Board of Directors and the Management Board
can be found in note 12 to the 2011 Financial Statements
of KNI.
Shareholders’ participation
Restrictions and delegation of voting rights
Each share equals one voting right. Restrictions on voting rights
do not exist.
For resolutions concerning the discharge of the members of the
Board of Directors, persons who currently take part in the com-
pany’s management in any manner do not have a voting right.
This restriction does not apply to members of the external audit-
ing company.
Registered shares may only be represented by persons who are
entered in the share register as shareholders or beneficiaries and
who have a written power of attorney. Proxies for shares held in
safekeeping accounts according to Article 689d of the Swiss
Code of Obligations and representatives of executive bodies do
not need to be shareholders. Individual companies, partnerships
or legal entities may arrange to be represented by legal represen-
tatives or representatives pursuant to the Articles of Association
or by other authorised representatives, even if their represen-
tatives are not shareholders.
Statutory quorums
In general, the legal rules on quorums and terms apply. The fol-
lowing shall require a resolution to be passed by the General
Meeting by at least two thirds of the voting rights represented
and by a majority of the nominal value of the shares represented:
— The introduction or removal of restrictions on the transfer-
ability of registered shares;
— The conversion of registered shares into bearer shares or of
bearer shares into registered shares;
— The dismissal of more than one quarter of the members of the
Board of Directors.
Calling of an Annual General Meeting
The calling of an Annual General Meeting is guided by the law.
The agenda contains all necessary information needed to delib-
erate each item on the agenda. In particular, this includes infor-
mation for the appointment of new members to the Board of
Directors and, in the event of changes to an article of associa-
tion, the announcement of the new wording.
Agenda of the Annual General Meeting
Shareholders owning shares with a total nominal value of at
least CHF 1 million can request that items be added to the agenda
up to 45 days prior to the date fixed for the Annual General
Meeting by submitting details of their proposals in writing.
Registration of shareholders into the share register
Registered shares can only be represented at the Annual General
Meetings by either shareholders or beneficiary owners whose per-
sonal particulars and size of shareholdings have been entered in
the KNI share register. Such shareholders and/or beneficiary own-
ers who are not in a position to attend the Annual General Meet-
ing are entitled to nominate a representative by written proxy.
The share register remains closed for any movements during
eight calendar days preceding and including the date of the
Annual General Meeting.
55Corporate Governance
Changes of control and defence measures
Duty to make an offer
There are no opting-out or opting-in rules provided for in the
Articles of Association.
Clauses on changes of control
No member of either the Board of Directors or the Management
Board or other senior management staff has clauses on change
of control in their employment contracts.
Statutory auditors
Duration of the mandate and term
of office of the lead auditor
KPMG AG, Zurich, initially adopted the mandate for the busi-
ness year 2002 as per declaration of acceptance dated May 8,
2002. The re-election for the business year 2011 was confirmed
with the declaration of acceptance dated April 28, 2011. The
lead auditor, Marc Ziegler, took over the mandate starting with
the business year 2009. The rotation rhythm of the lead auditor
is seven years and thus corresponds with the legal rule.
Audit fees
According to the Group’s financial records the fees charged for
auditing services for the year 2011 amounted to CHF 3.8 million.
Additional fees
In addition to the fees mentioned above, the statutory auditors are
asked on a very restrictive basis to provide certain consulting serv-
ices beyond the mandate of the annual audit. In 2011 an amount
of CHF 1 million was incurred related to consulting services.
Supervisory and controlling instruments
towards the statutory auditors
The work performed by the external statutory auditors is super-
vised, controlled, and duly monitored by the Board of Directors’
Audit Committee. The statutory auditors report to the Audit
Committee regularly and in 2011 attended three Audit Commit-
tee meetings in the person of the audit partner in charge. In
2011 the audit partner in charge also attended one meeting of
the Board of Directors. The main criteria for the selection of the
external audit company are its worldwide network, its reputa-
tion, and its competitive pricing.
Information policyThe Kuehne + Nagel Group strives for ensuring a comprehensive
and consistent information policy. The ambition is to provide ana-
lysts, investors and other stakeholders with high levels of trans-
parency that meet best practice standards accepted worldwide.
To this end Kuehne + Nagel uses print media and, in particular,
its corporate website, www.kuehne-nagel.com, where up-to-date
information is available. This information contains an overall
presentation of the Group, detailed financial data as well as
information on environmental and security matters, which are of
increasing importance. Furthermore, Kuehne + Nagel provides
up-to-date information on significant, business-related occur-
rences and organisational changes, and updates all general
information on the Company continually.
The Annual Report covering the past financial year is available
for download in extracts or in its entirety in English and German
(http://www.kn-portal.com/about_us/investor_relations/an-
nual_reports/).
Kuehne + Nagel publishes its quarterly financial data on the
corporate website (http://www.kn-portal.com/about_us/inves-
tor_relations/financial_presentations/). Prior to the first quar-
terly results being released the financial calendar is published
announcing the dates of the upcoming quarterly reports as well
as of the Annual General Meeting (http://www.kn-portal.com/
about_us/investor_relations/financial_calendar/).
The contact address for Investor Relations is:
Kuehne + Nagel Management AG
Investor Relations
Dorfstrasse 50
P.O. Box 67
CH-8834 Schindellegi
Switzerland
Phone: +41 (0)44 786 95 61
In addition, detailed contact information per field of activity is
available on Kuehne + Nagel’s website, www.kuehne-nagel.com,
to any persons interested.

Income Statement
CHF million Note 2011 2010 Varianceper cent
Invoiced turnover 20 19,596 20,261 –3.3
Customs duties and taxes –3,378 –3,403
Net invoiced turnover 16,218 16,858 –3.8
Net expenses for services from third parties –10,320 –10,900
Gross profit 20 5,898 5,958 –1.0
Personnel expenses 21 –3,386 –3,391
Selling, general and administrative expenses 22 –1,542 –1,584
Other operating income/expenses, net 23 8 21
EBITDA 978 1,004 –2.6
Depreciation of property, plant and equipment 27 –154 –164
Amortisation of other intangibles 28 –69 –75
Impairment of other intangibles 28 –5 –
EBIT 750 765 –2.0
Financial income 24 20 6
Financial expenses 24 –8 –9
Result from joint ventures and associates 20 4 5
Earnings before tax (EBT) 766 767 –0.1
Income tax 25 –160 –162
Earnings for the year 606 605 0.2
Attributable to:
Equity holders of the parent company 601 601 0.0
Non-controlling interests 5 4
Earnings for the year 606 605 0.2
Basic earnings per share in CHF 26 5.04 5.06 –0.4
Diluted earnings per share in CHF 26 5.03 5.05 –0.4
CONSOLIDATED FINANCIAL STATEMENTS 2011OF THE KUEHNE + NAGEL GROUP
56

Statement of Comprehensive Income
CHF million Note 2011 2010
Earnings for the year 606 605
Other comprehensive income
Foreign exchange differences –75 –296
Actuarial gains/(losses) on defined benefit plans, net of tax 36/25 –18 –15
Total other comprehensive income, net of tax –93 –311
Total comprehensive income for the year 513 294
Attributable to:
Equity holders of the parent company 509 290
Non-controlling interests 4 4
57Consolidated Financial Statements 2011 _ _ _ _ _ _ Statement of Comprehensive Income

Balance Sheet
CHF million Note Dec. 31, 2011 Dec. 31, 2010
Assets
Property, plant and equipment 27 1,146 1,083
Goodwill 28 696 590
Other intangibles 28 196 176
Investments in joint ventures 29 39 43
Deferred tax assets 25 162 166
Non-current assets 2,239 2,058
Prepayments 97 93
Work in progress 30 275 253
Trade receivables 31 2,278 2,077
Other receivables 32 149 129
Financial investments 33 252 –
Cash and cash equivalents 33/34 851 1,331
Current assets 3,902 3,883
Total assets 6,141 5,941
Liabilities and equity
Share capital 120 120
Reserves and retained earnings 1,661 1,644
Earnings for the year 601 601
Equity attributable to the equity holders of the parent company 2,382 2,365
Non-controlling interests 23 13
Equity 35 2,405 2,378
Provisions for pension plans and severance payments 36 296 284
Deferred tax liabilities 25 156 173
Finance lease obligations 39 43 58
Non-current provisions 41 97 94
Non-current liabilities 592 609
Bank and other interest-bearing liabilities 38/39 44 49
Trade payables 40 1,285 1,201
Accrued trade expenses/deferred income 40 881 877
Current tax liabilities 106 114
Current provisions 41 64 69
Other liabilities 42 764 644
Current liabilities 3,144 2,954
Total liabilities and equity 6,141 5,941
Schindellegi, March 2, 2012
KUEHNE + NAGEL INTERNATIONAL AG
Reinhard Lange Gerard van Kesteren
CEO CFO
Consolidated Financial Statements 2011 _ _ _ _ _ _ Balance Sheet58

Statement of Changes in Equity
CHF million Share Share Treasury Cumulative Actuarial Retained Total equity Non- Totalcapital premium shares translation gains & earnings attributable controlling equity
adjustment losses to the interestsequity
holders of parentcompany
Balance as of January 1, 2010 120 684 –88 –345 –11 1,920 2,280 10 2,290
Earnings for the year – – – – – 601 601 4 605
Other comprehensive income
Foreign exchange differences – – – –296 – – –296 – –296
Actuarial gains/(losses) on
defined benefit plans, net of tax – – – – –15 – –15 – –15
Total other comprehensive income,
net of tax – – – –296 –15 – –311 – –311
Total comprehensive income for the year – – – –296 –15 601 290 4 294
Disposal of treasury shares – 21 37 – – – 58 – 58
Dividend paid 1 – – – – – –273 –273 –1 –274
Expenses for employee share purchase
and option plan – – – – – 10 10 – 10
Total transactions with owners – 21 37 – – –263 –205 –1 –206
Balance as of December 31, 2010 120 705 –51 –641 –26 2,258 2,365 13 2,378
Earnings for the year – – – – – 601 601 5 606
Other comprehensive income
Foreign exchange differences – – – –74 – – –74 –1 –75
Actuarial gains/(losses) on
defined benefit plans, net of tax – – – – –18 – –18 – –18
Total other comprehensive income,
net of tax – – – –74 –18 – –92 –1 –93
Total comprehensive income for the year – – – –74 –18 601 509 4 513
Purchase of treasury shares – – –13 – – – –13 – –13
Disposal of treasury shares – 9 19 – – – 28 – 28
Dividend paid 1 – – – – – –328 –328 –1 –329
Distribution from capital contribution reserves – –179 – – – – –179 – –179
Expenses for employee share purchase
and option plan – – – – – 7 7 – 7
Total contributions by and
distributions to owners – –170 6 – – –321 –485 –1 –486
Acquisition of subsidiaries
with non-controlling interests – – – – – 1 1 7 8
Transaction with non-controlling interests 2 – – – – – –8 –8 – –8
Total transactions with owners – –170 6 – – –328 –492 6 –486
Balance as of December 31, 2011 120 535 –45 –715 –44 2,531 2,382 23 2,405
1 CHF 2.75 per share (2010: CHF 2.30 per share).
2 The movement in retained earnings includes a put option for an acquisition of non-controlling interests in one of the Group's subsidiaries, see note 43.
59Consolidated Financial Statements 2011 _ _ _ _ _ _ Statement of Changes in Equity

Cash Flow Statement
CHF million Note 2011 2010
Cash flow from operating activities
Earnings for the year 606 605
Reversal of non-cash items:
Income tax 25 160 162
Financial income 24 –20 –6
Financial expenses 24 8 9
Result from joint ventures and associates 29 –4 –5
Depreciation of property, plant and equipment 27 154 164
Amortisation of other intangibles 28 69 75
Impairment of other intangibles 28 5 –
Expenses for employee share purchase and option plan 21 7 10
Gain on disposal of property, plant and equipment 23 –12 –30
Loss on disposal of property, plant and equipment 23 4 4
Net addition to provisions for pension plans and severance payments 1 4
Subtotal operational cash flow 978 992
(Increase)/decrease work in progress –27 –57
(Increase)/decrease trade and other receivables, prepayments –216 –329
Increase/(decrease) other liabilities 59 33
Increase/(decrease) provisions – 18
Increase/(decrease) trade payables, accrued trade expenses/deferred income 105 356
Income taxes paid –219 –148
Total cash flow from operating activities 680 865
Cash flow from investing activities
Capital expenditure
— Property, plant and equipment 27 –207 –147
— Other intangibles 28 –11 –19
Disposal of property, plant and equipment 18 56
Acquisition of subsidiaries, net of cash acquired 43 –174 –3
Purchase of financial investments 33 –281 –
Disposal of financial investments 33 30 –
Interest received 12 4
(Increase)/decrease of share capital in joint ventures 29 3 –36
Dividend received from joint ventures and associates 4 4
Total cash flow from investing activities –606 –141
Cash flow from financing activities
Proceeds from interest-bearing liabilities 4 –
Repayment of interest-bearing liabilities –37 –43
Interest paid –8 –7
Purchase of treasury shares 35 –13 –
Disposal of treasury shares 35 28 58
Dividend paid to equity holders of parent company 35 –328 –273
Distribution from capital contribution reserves 35 –179 –
Dividend paid to non-controlling interests –1 –1
Total cash flow from financing activities –534 –266
Exchange difference on cash and cash equivalents –20 –114
Increase/(decrease) in cash and cash equivalents –480 344
Cash and cash equivalents at the beginning of the year, net 34 1,315 971
Cash and cash equivalents at the end of the year, net 34 835 1,315
Consolidated Financial Statements 2011 _ _ _ _ _ _ Cash Flow Statement60

ACCOUNTING POLICIES
1 OrganisationKuehne + Nagel International AG (the Company) is incorporated
in Schindellegi (Feusisberg), Switzerland. The Company is one of
the world’s leading global logistics providers. Its strong market
position lies in seafreight, airfreight, the overland and contract
logistics businesses.
The Consolidated Financial Statements of the Company for the
year ended December 31, 2011, comprise the Company, its sub-
sidiaries (the Group) and its interests in joint ventures.
2 Statement of complianceThe Consolidated Financial Statements have been prepared in
accordance with International Financial Reporting Standards
(IFRSs).
3 Basis of preparation The Consolidated Financial Statements are presented in Swiss
francs (CHF) million and are based on the individual financial
statements of the consolidated companies as of December 31,
2011. Those financial statements have been prepared in accor-
dance with uniform accounting policies issued by the Group
which comply with the requirements of the International Finan-
cial Reporting Standards (IFRS) and Swiss law (Swiss Code of
Obligation). The Consolidated Financial Statements are pre-
NOTES TO THE CONSOLIDATED FINANCIAL STATEMENTS
61
pared on a historical cost basis except for certain financial
instruments which are stated at fair value. Non-current assets
and disposal groups held for sale are stated at the lower of the
carrying amount and fair value less costs to sell.
The preparation of financial statements in conformity with IFRS
requires management to make judgments, estimates and assump-
tions that affect the application of policies and reported amounts
of assets, liabilities, income and expenses. The actual result may
differ from these estimates. Judgments made by the manage-
ment in the application of IFRS that have a significant effect on
the Consolidated Financial Statements and estimates with a sig-
nificant risk of material adjustment in the next year are shown
in note 51.
The accounting policies are the same as those applied in the
Consolidated Financial Statements for the year ended December
31, 2010.
The amended standards and the new or amended interpreta-
tions that are effective for the 2011 reporting year are not appli-
cable to the Group or do not have a significant impact on the
Consolidated Financial Statements.
Adoption of new and revised standards and
interpretations in 2012 and later
The following new and revised standards and interpretations
have been issued but are not yet effective and not applied early
in the Consolidated Financial Statements. Their impact on the
Consolidated Financial Statements has not yet been systemati-
cally analysed. The expected effects as disclosed in the below
table reflect a first assessment by the Group Management.
Consolidated Financial Statements 2011 _ _ _ _ _ _ Notes to the Consolidated Financial Statements, Accounting Policies

4 Scope of consolidation The Group’s significant subsidiaries and joint ventures are
listed on pages 114 to 119. The more significant changes in the
scope of consolidation in 2011 relate to the following companies
(for further information on the financial impact of acquisitions
refer to note 43):
There were no significant divestments in the year 2011.
Capital share 1 Currency Share capital Acquisition/ acquired in per cent in 1,000 incorporation date equals voting rights
Acquisition
Rennies Investment Ltd., Great Britain 100 GBP < 1 April 1, 2011
Cooltainer Holdings Limited, New Zealand 75 NZD 1,200 April 1, 2011
Eichenberg Group, Brazil 100 BRL 5,349 September 1, 2011
K-Logistics, France 100 EUR 91 September 2, 2011
J. van de Put Fresh Cargo Handling B.V.,
the Netherlands 100 EUR 18 October 1, 2011
Carl Drude GmbH & Co. KG, Germany 100 EUR 250 October 24, 2011
Amex Ltd., Israel 2 12.5 ILS 2 December 1, 2011
Incorporation
Nacora S.A., Colombia 100 COP 20 April 1, 2011
Kuehne + Nagel Syria LLC, Syria 100 SYP 7,000 July 1, 2011
Masika Limited, Kenya 100 KES 40 October 1, 2011
KN Ibrakom Lojistik Hizmetleri Ltd. Sti., Turkey 60 TRY 945 November 1, 2011
1 For the capital share as per December 31, 2011, please refer to the list of the Group’s significant subsidiaries and joint ventures on pages 114 to 119.
2 The Group previously owned 75 per cent of the share capital and applied the full consolidation method.
Consolidated Financial Statements 2011 _ _ _ _ _ _ Accounting Policies62
Standard/interpretation Effective date Planned application
Amendments to IFRS 7 Disclosures – Transfers of Financial Assets 1 1 July 2011 reporting year 2012
Amendments to IAS 12 Deferred Tax: Recovery of Underlying Assets 1 1 January 2012 reporting year 2012
Amendments to IAS 1 Presentation of Items of Other Comprehensive Income 2 1 July 2012 reporting year 2013
Amended IAS 19 Employee Benefits 2 1 January 2013 reporting year 2013
IFRS 10 Consolidated Financial Statements 3 1 January 2013 reporting year 2013
IFRS 11 Joint Arrangements 1 1 January 2013 reporting year 2013
IFRS 12 Disclosure of Interests in Other Entities 2 1 January 2013 reporting year 2013
Amended IAS 28 Investments in Associates and Joint Ventures 1 1 January 2013 reporting year 2013
IFRS 13 Fair Value Measurement 2 1 January 2013 reporting year 2013
Amendments to IFRS 7 Disclosures – Offsetting Financial Assets and Financial Liabilities 1 1 January 2013 reporting year 2013
Amendments to IAS 32 – Offsetting Financial Assets and Financial Liabilities 1 1 January 2014 reporting year 2014
IFRS 9 Financial Instruments 3 1 January 2015 reporting year 2015
IFRS 9 Financial Instruments and related amendments to IFRS 7 regarding transition 1 1 January 2015 reporting year 2015
1 No or no significant impacts are expected on the Consolidated Financial Statements.
2 The impact on the Consolidated Financial Statements is expected to result in additional disclosures or changes in presentation.
3 The impact on the Consolidated Financial Statements can not yet be determined with sufficient reliability.

63Consolidated Financial Statements 2011 _ _ _ _ _ _ Accounting Policies
5 Principles of consolidation
Business combinations
Business combinations are accounted for by applying the acquisi-
tion method. The Group measures goodwill as the fair value of
the consideration transferred (including the fair value of any pre-
viously held equity interest in the acquiree) and the recognised
amount of any non-controlling interests in the acquiree, less the
net recognised amount (generally fair value) of the identifiable
assets acquired and liabilities assumed, all measured as of the
acquisition date. When the excess is negative, a bargain pur-
chase gain is recognised immediately in profit or loss.
The Group elects on a transaction-by-transaction basis whether
to measure non-controlling interest at its fair value or at its pro-
portionate share of the recognised amount of the identifiable
net assets, at the acquisition date.
Consideration transferred includes the fair values of the assets
transferred, liabilities incurred by the Group to the previous own-
ers of the acquiree, equity interests issued by the Group and the
fair value of any contingent consideration. If the contingent con-
sideration is classified as equity, it is not re-measured, and settle-
ment is accounted for within equity. Otherwise, subsequent
changes to the fair value of the contingent consideration are
recognised in profit or loss. The consideration transferred does not
include amounts related to the settlement of pre-existing relation-
ships. Such amounts are generally recognised in profit or loss.
Capital share 1 Currency Share capital Acquisition/ acquired in per cent in 1,000 incorporation date equals voting rights
Acquisition
Nacora Insurance Brokers Ltd., Taiwan 2 30 TWD 6,000 June 18, 2010
Incorporation
Kuehne + Nagel Management ME FZE,
United Arab Emirates 100 AED 1,000 January 1, 2010
Stute Stahlservice GmbH, Germany 100 EUR 25 February 1, 2010
Kuehne + Nagel Management S.A., Panama 100 USD 10 December 1, 2010
1 For the capital share as per December 31, 2010, please refer to the list of the Group’s significant subsidiaries and joint ventures on pages 114 to 119.
2 The Group previously owned 70 per cent of share capital and applied the full consolidation method. The main activity is Insurance Brokers.
There were no significant divestments in the year 2010. Transaction costs, other than those associated with the issue of
debt or equity securities, incurred in connection with a business
combination are expensed as incurred.
Written put options held by non-controlling shareholders
When the Group has a potential obligation to purchase shares
in a subsidiary from a non-controlling shareholder through a
written put option, a liability is recognised at fair value, against
equity. When a non-controlling shareholder still has present
access to the economic benefits associated with the underlying
ownership interest, the non-controlling interest in the subsidiary
continues to be recognised as a separate component in equity.
The liability is re-estimated at each reporting date. Any subse-
quent changes in the liability’s carrying amount are recognised
in profit or loss.
Acquisitions and disposals of non-controlling interests
Changes in the parent’s ownership interest in a subsidiary after
having obtained control that do not result in a loss of control
are accounted for as transactions with owners in their capacity
as owners, and the effect of such transactions is recognised in
equity. No goodwill is recognised as a result of acquisition of
non-controlling interests, and no gain or loss on disposals of
non-controlling interests is recognised in profit or loss. The
adjustments to non-controlling interests are based on a propor-
tionate amount of the net assets of the subsidiary.
The more significant changes in the scope of consolidation for
the year 2010 are related to the following companies:

Subsidiaries
Subsidiaries are companies controlled, directly or indirectly, by
the Group, where control is defined as the power to govern
financial and operating policies of a company so as to obtain
benefits from its activities. This control is normally evidenced
when the Group owns, either directly or indirectly, more than
50 per cent of the voting rights whereby potential voting rights
of a company are also considered. Subsidiaries are included in
the Consolidated Financial Statements by the full consolidation
method as from the date on which control is transferred to the
Group until the date control ceases. The non-controlling inter-
ests in equity as well as earnings for the period are reported sep-
arately in the Consolidated Financial Statements.
Associates and joint ventures
Investments in associates and joint ventures are accounted for
by the equity method. Associates are companies over which the
Group exercises significant influence but which it does not con-
trol. Significant influence is normally evidenced when the Group
owns 20 per cent or more of the voting rights. Potential voting
rights of a company are also considered. Joint ventures are enti-
ties that are subject to contractually established joint control.
The Group’s share of income and expenses of associates and
joint ventures is included in the income statement from the date
significant influence or joint control commences until the date
significant influence or joint control ceases.
Income statement and cash flow statement (average rates for the year)
2011 Variance 2010CHF per cent CHF
EUR 1.– 1.2350 –10.9 1.3864
USD 1.– 0.8908 –14.6 1.0430
GBP 1.– 1.4226 –11.7 1.6119
2011 Variance 2010CHF per cent CHF
EUR 1.– 1.2222 –2.8 1.2578
USD 1.– 0.9353 –1.9 0.9532
GBP 1.– 1.4632 –0.5 1.4712
Balance sheet (year-end rates)
Consolidated Financial Statements 2011 _ _ _ _ _ _ Accounting Policies64
Transactions eliminated on consolidation
Intra-group balances, transactions, income and expenses are
eliminated in preparing the Consolidated Financial Statements.
Foreign exchange translation
Year-end financial statements of consolidated companies are pre-
pared in their respective functional currencies and translated
into CHF (the Group’s presentation currency) as of year-end.
Assets and liabilities, including goodwill and fair value adjust-
ments arising on consolidation, are translated at year-end
exchange rates and all items included in the income statement
are translated at average exchange rates for the year, which
approximate actual rates. Exchange differences originating from
such translation methods have no impact on the income state-
ment since they are recognised in other comprehensive income.
Transactions in foreign currencies in individual subsidiaries are
translated into the functional currency at actual rates of the
transaction day. Monetary assets and liabilities are translated at
year-end rates. Non-monetary assets and liabilities that are
stated at historical cost are translated at actual rates of the
transaction day. Non-monetary assets and liabilities that are
stated at fair value, are translated at the rate at the date the
values are determined. Exchange differences arising on the
translation are included in the income statement.
The major foreign currency conversion rates applied are as follows:
6 Financial assets and liabilitiesThe accounting policy applied to financial instruments depends
on how they are classified. The Group’s financial assets and lia-
bilities are classified into the following categories:
— The category financial assets or liabilities at fair value
through profit or loss includes financial assets or liabilities
held for trading and financial assets designated as such upon
initial recognition. There are no financial liabilities that, upon
initial recognition, have been designated at fair value through
profit or loss.
— Loans and receivables are carried at amortised cost, calcu-
lated using the effective interest rate method, less allowances
for impairment.
— Financial assets/investments available for sale include all
financial assets/investments not assigned to one of the above
mentioned categories. These could include investments in affili-
ates that are not associates or joint ventures and investments
in bonds and notes. Financial assets/investments available for
sale are recognised at fair value, changes in value (after tax) are
recognised directly in other comprehensive income until the
assets are sold, at which time the amount reported in other
comprehensive income is transferred to the income statement.
As of December 31, 2011 and 2010, the Group did not have
any financial assets/investments available for sale.
— Financial liabilities that are not at fair value through profit
or loss, are carried at amortised cost calculated using the
effective interest rate method.
Derivatives and hedge accounting
Derivative financial instruments (foreign exchange contracts)
are used to hedge the foreign exchange exposures on outstand-
ing balances in the Group's internal clearing system, centralised
at head office. Given that the Group's hedging activities are lim-
ited to hedges of recognised foreign currency monetary items,
the Group does not apply hedge accounting under IAS 39.
Derivatives are carried at fair value, and all changes in fair
value are recognised immediately in the income statement as
part of financial income or expenses. All derivatives with a posi-
tive fair value are disclosed as derivative assets and included in
the line “financial investments” on the balance sheet, while all
derivatives with a negative fair value are disclosed as derivative
liabilities and included in the line current “other liabilities”.
65Consolidated Financial Statements 2011 _ _ _ _ _ _ Accounting Policies
Impairment of financial assets
If there is any indication that a financial asset (loans and receiv-
ables) or financial assets/investments available for sale may be
impaired, its recoverable amount is calculated. The recoverable
amount of the Group’s loans and receivables is calculated as the
present value of expected future cash flows, discounted at the
original effective interest rate inherent in the asset. Receivables
with a short duration are not discounted.
Trade receivables are reported at their anticipated recoverable
amounts. The allowance for bad debts is determined based on
an individual basis or on a portfolio basis, where there is objec-
tive evidence that impairment losses have been incurred. The
allowance account is used to record impairment losses unless
the Group is satisfied that no recovery of the amount due is
possible; at that point the amount considered irrecoverable is
written off against the financial assets directly.
Where an asset’s recoverable amount is less than its carrying
amount, the asset is written down to its recoverable amount. All
resultant impairment losses (after reversing previous revalua-
tions recognised in other comprehensive income of available for
sale equity securities) are recognised in the income statement.
An impairment loss in respect of a financial asset is reversed if
there is a subsequent increase in recoverable amount that can
be related objectively to an event occurring after the impair-
ment loss was recognised. Reversals of impairment losses are
recognised in the income statement, with the exception for
reversals of impairment losses on available for sale equity secu-
rities, for which any reversals are recognised in other compre-
hensive income.
7 Segment reportingAn operating segment is a component of the Group that engages
in business activities from which it may earn revenues and incur
expenses, including revenues and expenses that relate to transac-
tions with any of the Group’s other components. Refer to note 20
for additional information about the segments in the Group.

8 Property, plant and equipmentProperty, plant and equipment are included in the Consolidated
Financial Statements at cost less accumulated depreciation and
accumulated impairment losses. The depreciation is calculated
on a straight line basis considering the expected useful life of
the individual assets. The estimated useful lives for the major
categories are:
When parts of an item of property, plant and equipment have dif-
ferent useful lives, they are accounted for as separate items of
property, plant and equipment. Subsequent expenditure is capi-
talised only if it is probable that the future economic benefits
associated with the item will flow to the Group and the cost of
the item can be measured reliably. All other expenditure is recog-
nised in the income statement as an expense as incurred.
9 LeasesLeases that transfer substantially all the risks and rewards of
ownership of the leased asset to the Group are classified as
finance leases. Other leases are classified as operating leases.
Assets leased under finance leases are included at the present
value of the future minimum lease payments or their fair value if
lower, less accumulated depreciation and accumulated impair-
ment losses. If there is a reasonable certainty that the Group will
obtain ownership by the end of the lease term, leased assets are
Consolidated Financial Statements 2011 _ _ _ _ _ _ Accounting Policies66
depreciated over their useful life. Otherwise, leased assets are
depreciated over the shorter of the lease term and their useful
life. The interest portion of the lease payments is expensed
through the income statement based on the effective interest
rate inherent in the lease.
Operating lease payments are treated as operating cost and
charged to the income statement on a straight line basis over the
lease period unless another basis is more appropriate to reflect
the pattern of benefits to be derived from the leased asset.
Any gain or loss from sale and lease-back transaction resulting in
operating leases is taken directly to the income statement if the
transaction is established at fair value. If the transaction is estab-
lished below fair value, any loss that is compensated by future
lease payments at below market price is deferred and amortised
over the length of the period the asset is expected to be used. Any
other loss is recognised in the income statement immediately. If
the transaction is established above fair value the gain arising on
the transaction is deferred and amortised over the period the
asset is expected to be used. If the fair value at the time of the
sale and lease-back transaction is less than the carrying amount
of the asset, a loss equal to the difference between the carrying
amount and the fair value is recognised immediately.
10 Intangibles
Goodwill
All business combinations are accounted for by applying the
acquisition method. Goodwill arising on an acquisition repre-
sents the fair value of the consideration transferred (including
the fair value of any previously held equity interest in the
acquiree) and the recognised amount of any non-controlling
interests in the acquiree, less the net recognised amount (gener-
ally fair value) of the identifiable assets acquired and liabilities
assumed. Goodwill is allocated to cash generating units.
Years
Buildings 40
Vehicles 4–10
Leasehold improvements 3
Office machines 4
IT hardware 3
Office furniture 5

Calculation of a recoverable amount
The recoverable amount of an asset is the greater of its fair
value less costs to sell and its value in use. In assessing value in
use, the estimated future cash flows are discounted to their
present value using a pre-tax discount rate that reflects current
market assessments of the time value of money and the risks
specific to the asset. For an asset that does not generate largely
independent cash inflows, the recoverable amount is deter-
mined for the cash-generating unit to which the asset belongs.
Reversals of impairment losses
An impairment loss in respect of goodwill is not reversed. In
respect to other assets, an impairment loss is reversed if there
has been a change in the estimates used to determine the recover-
able amount. An impairment loss is reversed only to the extent
that the asset’s carrying amount does not exceed the carrying
amount that would have been determined, net of depreciation
or amortisation, if no impairment loss had been recognised.
13 Share capital
Shares
Shares are classified as equity. Incremental costs directly attribut-
able to the issue of shares and share options are recognised as a
deduction from equity.
Treasury shares
When share capital recognised as equity is repurchased, the
amount of the consideration paid, which includes directly attrib-
utable costs, net of any tax effects, is recognised as a deduction
from equity. Repurchased shares are classified as treasury shares
and are presented as a deduction from total equity. When treas-
ury shares are sold or reissued subsequently, the amount
received is recognised as an increase in equity, and the resulting
surplus or deficit on the transaction is transferred to/from the
share premium.
67Consolidated Financial Statements 2011 _ _ _ _ _ _ Accounting Policies
Goodwill is stated at cost less accumulated impairment losses.
Goodwill is tested annually for impairment at year-end. How-
ever, if there is an indication that goodwill would be impaired at
any other point in time, an impairment test is performed.
Other intangibles
Other identifiable intangibles (i.e. software, customer lists,
customer contracts etc.) purchased from third parties or acquired
in a business combination are separately recognised as intangi-
bles, and are stated at cost less accumulated amortisation and
accumulated impairment losses. Intangibles acquired in a busi-
ness combination are recognised separately from goodwill if
they are subject to contractual or legal rights or are separately
transferable and their fair value can be reliably estimated. Soft-
ware is amortised over its estimated useful life, three years maxi-
mum. Other intangibles are amortised on a straight line basis
over their estimated useful life (up to ten years maximum).
There are no intangibles with indefinite useful life recognised in
the Group’s balance sheet.
11 Cash and cash equivalentsCash and cash equivalents comprise cash at banks and in hand
as well as short-term deposits and highly liquid investments with
a term of three months or less that are readily convertible to
known amounts of cash and that are subject to an insignificant
risk of changes in value. For the purpose of the consolidated
cash flow statement, cash and cash equivalents consist also of
bank overdrafts that are repayable on demand as forming an
integral part of the Group’s cash management.
12 ImpairmentThe carrying amounts of the Group’s investments in associates
and joint ventures, its intangibles and property, plant and equip-
ment, are reviewed at each balance sheet date to determine
whether there is any indication of impairment. If any such indica-
tion exists, the asset’s recoverable amount is estimated. Goodwill
is tested for impairment every year. An impairment loss is recog-
nised whenever the carrying amount of an asset or its cash-
generating unit exceeds its recoverable amount.

Consolidated Financial Statements 2011 _ _ _ _ _ _ Accounting Policies68
14 ProvisionsProvisions are recognised when the Group has a present obliga-
tion (legal or constructive) as a result of a past event if it is
probable that an outflow of resources will be required to settle
the obligation and the amount of the obligation can be estimated
reliably. If the effect is material, provisions are determined by
discounting the expected future cash flows at a pre-tax rate that
reflects current market assessments of the time value of money
and, where appropriate, the risks specific to the liability.
15 Pension plans, severance payments and share participation plans
Some consolidated companies maintain pension plans in favour
of their personnel in addition to the legally required social insur-
ance schemes. The pension plans partly exist as independent
trusts and are operated either under a defined contribution or a
defined benefit plan.
Defined benefit plans
The Group’s net obligation in respect of defined benefit pension
plans is calculated separately for each plan by estimating the
amount of future benefit that employees have earned in return
for their service in the current and previous periods; that benefit
is discounted to determine the present value, and the fair value
of any plan assets is deducted. The discount rate is the yield at
the reporting date on “AA” credit-rated bonds that have maturity
dates approximating the terms of the Group’s obligations and
that are denominated in the same currency in which benefits
are expected to be paid. The calculation is performed by an
independent, qualified actuary using the projected unit credit
method.
All actuarial gains and losses arising from defined benefit plans
are recognised immediately in other comprehensive income.
Defined contribution plans
Obligations for contributions to defined contribution pension
plans are recognised in the income statement as an expense in
the periods during which services are rendered by the employees.
Severance payments
The Group provides severance benefits to employees as legally
required in certain countries, which are accounted for as defined
benefit plans if material.
Share-based compensation
The Group has a share purchase and option plan that allows
Group employees to acquire shares of the Company. The employ-
ees can buy shares at a reduced price at a cut-off date. For each
share purchased under this plan, the company grants two
options to the participants. Each option entitles the participant
to purchase one share of Kuehne + Nagel International AG at a
pre-defined price. A service condition must be met to be eligible
to receive options. For further details about the programmes,
refer to note 37.
For the share purchase plan, the difference between the fair
value of the shares at purchase date and the purchase price of
the shares is recognised as a personnel expense with a corre-
sponding increase in equity. The fair value of the shares granted
is measured at the market price of the Company’s shares, adjust-
ed to take into account terms and conditions upon which the
shares were granted.

69Consolidated Financial Statements 2011 _ _ _ _ _ _ Accounting Policies
The fair value of options granted is recognised as a personnel
expense with a corresponding increase in equity. The fair value
of the granted options is calculated using the lattice binomial
model, taking into account the terms and conditions upon
which the options were granted. The fair value of the options is
measured at grant date and spread over the relevant vesting
periods. The amount recognised as a personnel expense is adjust-
ed to reflect actual and expected levels of vesting.
16 Revenue recognitionThe Company generates its revenues from five principal services:
1) Seafreight, 2) Airfreight, 3) Road & Rail Logistics, 4) Contract
Logistics and 5) Insurance Brokers. Revenues reported in each of
these reportable segments include revenues generated from the
principal service as well as revenues generated from services like
customs clearance, export documentation, import documentation,
door-to-door service and arrangement of complex logistics supply
movement, that are incidental to the principal service.
In Seafreight, Airfreight and Road & Rail Logistics the Group gen-
erates the majority of its revenues by purchasing transportation
services from direct (asset-based) carriers and selling a combina-
tion of those services to its customers. In its capacity of arranging
carrier services, the Group issues to customers a contract of car-
riage. Revenues related to shipments are recognised based upon
the terms in the contract of carriage. Revenues from other services
involving providing services at destination are recognised when
the service is completed and invoiced.
In Contract Logistics the principal services are related to customer
contracts for warehouse and distribution activities. Based on the
customer contracts, revenues are recognised when service is ren-
dered and invoiced.
In Insurance Brokers, the principal service is the brokerage of insur-
ance coverage, mainly marine liability. Revenues are recognised,
when a policy is issued and invoiced.
When a service is completed and not invoiced, related costs are
deferred as work in progress.
A better indication of performance in the logistics industry com-
pared to the turnover is the gross profit. The gross profit represents
the difference between the turnover and the cost of services ren-
dered by third parties for all reportable segments.
17 Interest expenses and incomeInterest income is recognised as it accrues using the effective
interest method.
Borrowing costs that are not directly attributable to an acquisi-
tion, construction or production of a qualifying asset are recog-
nised in the income statement using the effective interest
method. The Group has not capitalised any borrowing costs as it
does not have any qualifying assets.

18 Income taxes Income tax on earnings for the year comprises current and
deferred tax. Both current and deferred tax are recognised in the
income statement, except to the extent that the tax relates to
business combinations or items recognised directly in equity or
in other comprehensive income.
Current tax is the expected tax payable or receivable on the tax-
able income or loss for the year, using tax rates enacted or sub-
stantially enacted at the balance sheet date and any adjust-
ment to tax payable for previous years.
Deferred tax is recognised based on the balance sheet liability
method, on temporary differences between the carrying
amounts of assets and liabilities for financial reporting purposes
and their tax base. The following temporary differences are not
accounted for: Initial recognition of goodwill, initial recognition
of assets or liabilities that affects neither accounting nor tax-
able profit, and differences relating to investments in sub-
sidiaries to the extent that they will probably not reverse in the
foreseeable future. The amount of deferred tax recognised is
based on the expected manner of realisation or settlement of
the carrying amount of assets and liabilities, using tax rates
enacted or substantially enacted at the balance sheet date.
A deferred tax asset in respect of temporary differences or
unused tax losses is recognised only to the extent it is probable
that future taxable profits will be available against which the
Consolidated Financial Statements 2011 _ _ _ _ _ _ Accounting Policies70
asset can be utilised. Deferred tax assets are reduced to the
extent it is no longer probable that the related tax benefit will
be realised.
19 Non-current assets held for sale and discontinued operations
Non-current assets (or disposal groups) are classified as held for
sale if their carrying amount will be recovered principally
through a sale transaction rather than from continuing use. The
asset (or disposal group) must be available for immediate sale
in its present condition and the sale must be highly probable.
Immediately before classification as held for sale, the measure-
ment of the assets (and all assets and liabilities in a disposal
group) is updated in accordance with applicable IFRS. Then,
on initial classification as held for sale, non-current assets and
disposal groups are recognised at the lower of carrying amount
and fair value less costs to sell. Impairment losses on initial
classification as held for sale are included in the income
statement. Intangible assets and property, plant and equip-
ment once classified as held for sale are not amortised or
depreciated.
A discontinued operation is a component of the Group’s busi-
ness that represents a separate major line of business or geo-
graphical area of operations, or is a company acquired exclu-
sively with a view to resale. Classification as a discontinued
operation occurs upon disposal or, if earlier, when the opera-
tion meets the criteria to be classified as held for sale.

tion. In the reportable segment Real Estate, activities mainly
related to internal rent of facilities are reported. Under Insu-
rance Brokers, activities exclusively related to brokerage of insu-
rance coverage, mainly marine liability, are reported.
Pricing between segments is determined on an arm’s length
basis. The accounting policies of the reportable segments are
the same as applied in the Consolidated Financial Statements.
Information about the reportable segments is presented on the
next pages. Segment performance is based on EBIT as reviewed
by the CODM. The column “elimination” is eliminations of
turnover and expenses between segments. All operating
expenses are allocated to the segments and included in the
EBIT.
b) Geographical information
The Group is operating on a worldwide basis in the following geo-
graphical areas: Europe, Americas, Asia-Pacific and Middle East,
Central Asia and Africa. All products and services are provided in
each of these geographical regions. The segment revenue is based
on the geographical location of the customers invoiced, and seg-
ment assets are based on the geographical location of assets.
c) Major customers
There is no single customer who represents more than 10 per
cent of the Group’s total revenue.
71
20 Segment Reporting
a) Reportable segments
The Group provides integrated logistics solutions across cus-
tomer’s supply chains using its global logistics network. The
business is divided into six operating segments namely
Seafreight, Airfreight, Road & Rail Logistics, Contract Logis-
tics, Real Estate and Insurance Brokers. These six reportable
segments reflect the internal management and reporting struc-
ture to the Management Board (the chief operating decision
maker, CODM) and are managed through specific organisational
structures. The CODM reviews internal management reports on
a monthly basis. Each segment is a distinguishable business
unit and is engaged in providing and selling discrete products
and services.
The discrete distinction between Seafreight, Airfreight and Road
& Rail Logistics is the usage of the same transportation mode
within a reportable segment. In addition to common business
processes and management routines, mainly transportation mode
is the same within a reportable segment. For the reportable seg-
ment Contract Logistics the services performed are related to
customer contracts for warehouse and distribution activities,
whereby services performed are storage, handling and distribu-
OTHER NOTES
Consolidated Financial Statements 2011 _ _ _ _ _ _ Other Notes

Total Group Seafreight Airfreight Road & Rail Logistics
CHF million 2011 2010 2011 2010 2011 2010 2011 2010
Invoiced turnover (external customers) 19,596 20,261 8,330 8,996 4,020 4,044 2,967 2,776
Invoiced inter-segment turnover – – 1,582 1,752 2,305 2,281 1,185 855
Customs duties and taxes –3,378 –3,403 –2,231 –2,265 –616 –692 –282 –233
Net invoiced turnover 16,218 16,858 7,681 8,483 5,709 5,633 3,870 3,398
Net expenses for services from third parties –10,320 –10,900 –6,427 –7,259 –4,914 –4,884 –3,013 –2,573
Gross profit 5,898 5,958 1,254 1,224 795 749 857 825
Total expenses –4,920 –4,954 –816 –783 –543 –515 –815 –782
EBITDA 978 1,004 438 441 252 234 42 43
Depreciation of property,
plant and equipment –154 –164 –17 –16 –10 –12 –30 –34
Amortisation of other intangibles –69 –75 –8 –9 –7 –6 –25 –26
Impairment of other intangibles –5 – –2 – –3 – – –
EBIT (segment profit/(loss)) 750 765 411 416 232 216 –13 –17
Financial income 20 6
Financial expenses –8 –9
Result from joint ventures and associates 4 5 2 3 – – 1 2
Earnings before tax (EBT) 766 767
Income tax –160 –162
Earnings for the year 606 605
Attributable to:
Equity holders of the parent company 601 601
Non-controlling interests 5 4
Earnings for the year 606 605
Additional information
not regularly reported to CODM
Non-current segment assets 2,239 2,058 121 61 65 37 364 283
Segment assets 6,141 5,941 1,186 1,087 642 492 770 658
Segment liabilities 3,736 3,563 1,110 1,088 641 568 580 511
Allocation of goodwill 696 590 45 23 39 14 217 152
Allocation of other intangibles 196 176 25 20 26 11 94 73
Capital expenditure property,
plant and equipment 207 134 22 13 15 10 81 21
Capital expenditure other intangibles 11 17 2 5 2 3 1 3
Property, plant and equipment,
goodwill and intangibles through
business combinations 263 3 47 – 53 – 157 3
Non-cash expenses 104 119 15 15 11 12 17 18
a) Reportable segments
Consolidated Financial Statements 2011 _ _ _ _ _ _ Other Notes72

TotalContract Logistics Real Estate Insurance Brokers Reportable Segments Eliminations Unallocated corporate
2011 2010 2011 2010 2011 2010 2011 2010 2011 2010 2011 2010
4,168 4,316 2 4 109 125 19,596 20,261 – – – –
151 115 74 78 58 60 5,355 5,141 –5,355 –5,141 – –
–249 –213 – – – – –3,378 –3,403 – – – –
4,070 4,218 76 82 167 185 21,573 21,999 –5,355 –5,141 – –
–1,116 –1,099 – – –131 –148 –15,601 –15,963 5,281 5,063 – –
2,954 3,119 76 82 36 37 5,972 6,036 –74 –78 – –
–2,793 –2,931 –10 –3 –17 –18 –4,994 –5,032 74 78 – –
161 188 66 79 19 19 978 1,004 – – – –
–70 –77 –27 –25 – – –154 –164 – – – –
–28 –34 – – –1 – –69 –75 – – – –
– – – – – – –5 – – – – –
63 77 39 54 18 19 750 765 – – – –
1 – – – – – 4 5 – – – –
573 596 915 872 – – 2,038 1,849 – – 201 209
1,308 1,270 919 883 12 11 4,837 4,401 – – 1,304 1,540
984 933 14 15 58 54 3,387 3,169 – – 349 394
395 401 – – – – 696 590 – – – –
51 72 – – – – 196 176 – – – –
17 56 72 34 – – 207 134 – – – –
6 6 – – – – 11 17 – – – –
5 – – – 1 – 263 3 – – – –
47 59 – – 14 15 104 119 – – – –
73Consolidated Financial Statements 2011 _ _ _ _ _ _ Other Notes

b) Geographical information
Consolidated Financial Statements 2011 _ _ _ _ _ _ Other Notes74
Total Europe Americas
CHF million 2011 2010 2011 2010 2011 2010
Invoiced turnover (external customers) 19,596 20,261 12,396 12,978 4,017 3,985
Invoiced inter-region turnover – – 3,186 2,811 676 665
Customs duties and taxes –3,378 –3,403 –1,971 –1,986 –720 –688
Net invoiced turnover 16,218 16,858 13,611 13,803 3,973 3,962
Net expenses for services
from third parties –10,320 –10,900 –9,331 –9,394 –3,095 –3,103
Gross profit 5,898 5,958 4,280 4,409 878 859
Total expenses –4,920 –4,954 –3,716 –3,816 –729 –707
EBITDA 978 1,004 564 593 149 152
Depreciation of property,
plant and equipment –154 –164 –119 –129 –19 –19
Amortisation of other intangibles –69 –75 –62 –67 –4 –4
Impairment of other intangibles –5 – –5 – – –
EBIT 750 765 378 397 126 129
Financial income 20 6
Financial expenses –8 –9
Result from joint ventures and associates 4 5 4 5 – –
Earnings before tax (EBT) 766 767
Income tax –160 –162
Earnings for the year 606 605
Attributable to:
Equity holders of the parent company 601 601
Non-controlling interests 5 4
Earnings for the year 606 605
Non-current assets 2,239 2,058 1,678 1,588 233 181
Additional information
not regularly reported to CODM
Segment assets 6,141 5,941 3,408 3,179 821 712
Segment liabilities 3,736 3,563 2,382 2,294 538 445
Allocation of goodwill 696 590 555 500 114 84
Allocation of other intangibles 196 176 165 176 21 –
Capital expenditure property,
plant and equipment 207 134 157 93 22 26
Capital expenditure other intangibles 11 17 10 15 – –
Property, plant and equipment,
goodwill and intangibles through
business combinations 263 3 160 – 59 –
Non-cash expenses 104 119 81 105 15 10

75Consolidated Financial Statements 2011 _ _ _ _ _ _ Other Notes
Middle East, UnallocatedAsia-Pacific Central Asia and Africa Eliminations corporate
2011 2010 2011 2010 2011 2010 2011 2010
1,829 1,908 1,354 1,390 – – – –
1,190 1,303 229 207 –5,281 –4,986 – –
–202 –197 –485 –532 – – – –
2,817 3,014 1,098 1,065 –5,281 –4,986 – –
–2,256 –2,497 –919 –892 5,281 4,986 – –
561 517 179 173 – – – –
–334 –296 –141 –135 – – – –
227 221 38 38 – – – –
–10 –10 –6 –6 – – – –
–2 –4 –1 – – – – –
– – – – – – – –
215 207 31 32 – – – –
– – – – – – – –
81 37 46 43 – – 201 209
343 278 265 232 – – 1,304 1,540
305 295 162 135 – – 349 394
21 – 6 6 – – – –
10 – – – – – – –
15 8 13 7 – – – –
1 2 – – – – – –
43 3 1 – – – – –
6 2 2 2 – – – –

21 Personnel expenses
CHF million 2011 2010
Salaries and wages 2,711 2,696
Social expenses and employee benefits 588 598
Expenses for employee share purchase and option plans 7 10
Pension plan expenses
— defined benefit plans 20 21
— defined contribution plans 49 48
Other 11 18
Total 3,386 3,391
.
22 Selling, general and administrative expenses
CHF million 2011 2010
Administration 201 192
Communication 74 78
Travel and promotion 86 80
Vehicles 293 325
Operating expenses 242 199
Facilities 633 697
Bad debt and collection expenses 13 13
Total 1,542 1,584
2011 2010
CHF million Non-current Invoiced Non-current Invoicedassets turnover assets turnover
Switzerland 1 6 352 6 265
Germany 1 511 3,984 482 4,155
USA 2 114 2,029 129 2,114
China 3 6 603 4 659
South Africa 4 2 459 2 492
1 Part of region Europe.
2 Part of region Americas.
3 Part of region Asia-Pacific.
4 Part of region Middle East, Central Asia and Africa.
b) Geographical information
Country information
Consolidated Financial Statements 2011 _ _ _ _ _ _ Other Notes76

23 Other operating income/expenses, net
CHF million 2011 2010
Gain on disposal of property, plant and equipment 12 30
Loss on disposal of property, plant and equipment –4 –4
Provision for competition investigations and associated legal expenses 1 – –5
Total 8 21
1 See also notes 41 and 45.
24 Financial income and expenses
CHF million 2011 2010
Interest income 10 4
Net change in fair value of financial investments, including derivative instruments 2 –
Exchange differences, net 8 2
Financial income 20 6
Interest expenses –8 –9
Financial expenses –8 –9
Net financial result 12 –3
25 Income tax
CHF million 2011 2010
Current tax expense
— in current year 173 185
— under/(over)-provided in previous years 1 1
174 186
Deferred tax expense from
— changes in temporary differences 4 –9
— impact of deferred tax assets not recognised previously –18 –15
–14 –24
Income tax 160 162
Income tax of CHF 1 million (2010: CHF –3 million) relating
to actuarial gains and losses of CHF 17 million before tax
77Consolidated Financial Statements 2011 _ _ _ _ _ _ Other Notes
(2010: CHF 18 million) arising from defined benefit plans is
recognised in other comprehensive income.

CHF million 2011 per cent 2010 per cent
Earnings before tax according to the income statement 766 767
Income tax/expected tax rate 154 20.1 159 20.7
Tax effect on
— tax exempt (income)/expenses 12 1.6 15 2.0
— tax losses (utilised)/expired –7 –0.9 –10 –1.3
— change of deferred tax assets not recognised –18 –2.3 –15 –2.0
— under/(over)-provided in previous years 1 0.1 1 0.1
— withholding taxes 9 1.2 7 0.9
— other 9 1.2 5 0.7
Income tax/effective tax rate 160 20.9 162 21.1
Deferred tax assets and liabilities
Reconciliation of the effective tax rate
Assets 1 Liabilities 1 Net 1
CHF million Dec. 31, 2011 Dec. 31, 2010 Dec. 31, 2011 Dec. 31, 2010 Dec. 31, 2011 Dec. 31, 2010
Property, plant and equipment 34 36 –73 –98 –39 –62
Goodwill and other intangibles 24 18 –54 –50 –30 –32
Trade receivables 17 15 –4 –2 13 13
Other receivables 4 5 –23 –21 –19 –16
Finance lease obligations 19 30 – – 19 30
Provisions for pension plans and
severance payments 8 9 –1 – 7 9
Other liabilities 50 46 –1 –2 49 44
Tax value of loss carry-forwards
recognised 6 7 – – 6 7
Tax assets/(liabilities) 162 166 –156 –173 6 –7
1 of which acquired in business
combinations (opening balance sheet) 4 – –18 – –14 –
The recognised deferred tax assets relating to tax losses carried
forward are expected to be used by the end of the next two
years at the latest.
Consolidated Financial Statements 2011 _ _ _ _ _ _ Other Notes78

It is not probable that future taxable profits will be available
against which the unrecognised deferred tax assets can be used.
The substantial part of unrecognised deferred tax assets is relat-
ing to tax losses that do not expire.
CHF million Dec. 31, 2011 Dec. 31, 2010
On tax losses 59 39
Deductible temporary differences 23 42
Total 82 81
Unrecognised deferred tax assets
2011 2010
Earnings for the year attributable to the equity holders
of the parent company in CHF million 601 601
Weighted average number of ordinary shares outstanding during the year 119,257,580 118,735,266
Dilutive effect on shares:
Share options 179,875 267,504
Adjusted weighted number of ordinary shares applicable to diluted earnings per share 119,437,455 119,002,770
Basic earnings per share in CHF 5.04 5.06
Diluted earnings per share in CHF 5.03 5.05
79Consolidated Financial Statements 2011 _ _ _ _ _ _ Other Notes
26 Earnings per shareThe following reflects the data used in the basic and dilut-
ed earnings per share computations for the years ending
December 31.
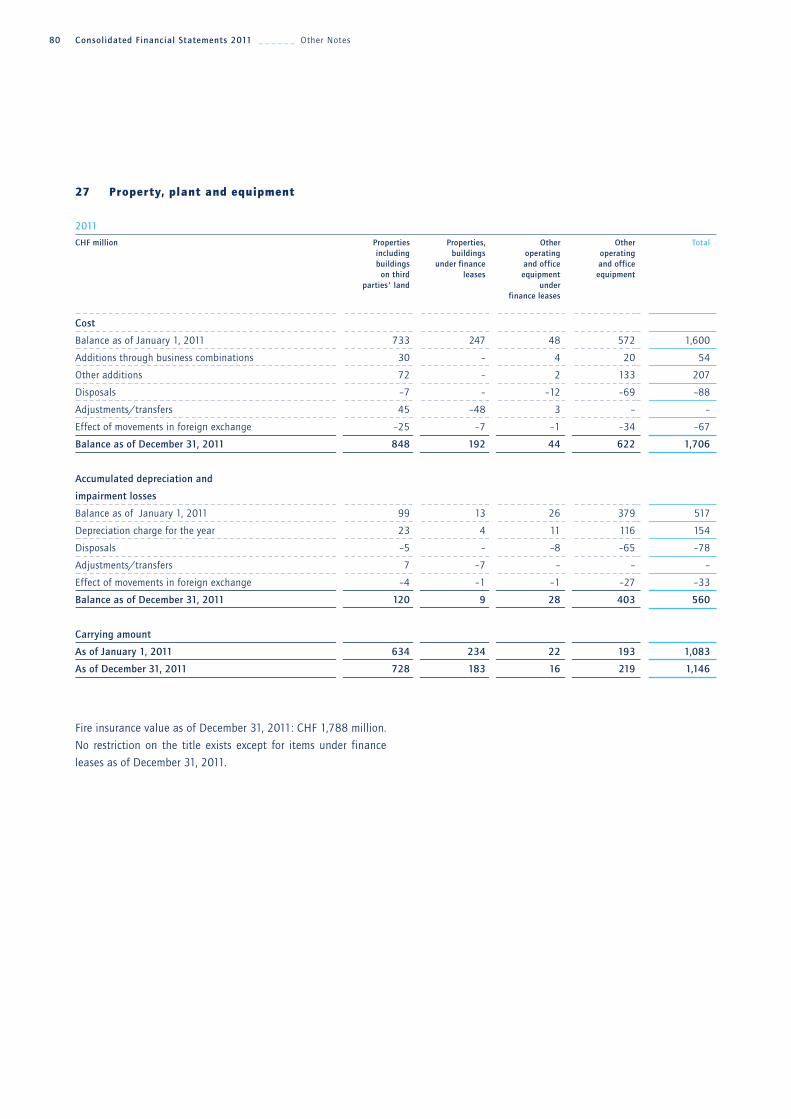
27 Property, plant and equipment
2011
CHF million Properties Properties, Other Other Totalincluding buildings operating operating buildings under finance and office and office
on third leases equipment equipmentparties' land under
finance leases
Cost
Balance as of January 1, 2011 733 247 48 572 1,600
Additions through business combinations 30 – 4 20 54
Other additions 72 – 2 133 207
Disposals –7 – –12 –69 –88
Adjustments/transfers 45 –48 3 – –
Effect of movements in foreign exchange –25 –7 –1 –34 –67
Balance as of December 31, 2011 848 192 44 622 1,706
Accumulated depreciation and
impairment losses
Balance as of January 1, 2011 99 13 26 379 517
Depreciation charge for the year 23 4 11 116 154
Disposals –5 – –8 –65 –78
Adjustments/transfers 7 –7 – – –
Effect of movements in foreign exchange –4 –1 –1 –27 –33
Balance as of December 31, 2011 120 9 28 403 560
Carrying amount
As of January 1, 2011 634 234 22 193 1,083
As of December 31, 2011 728 183 16 219 1,146
Fire insurance value as of December 31, 2011: CHF 1,788 million.
No restriction on the title exists except for items under finance
leases as of December 31, 2011.
Consolidated Financial Statements 2011 _ _ _ _ _ _ Other Notes80
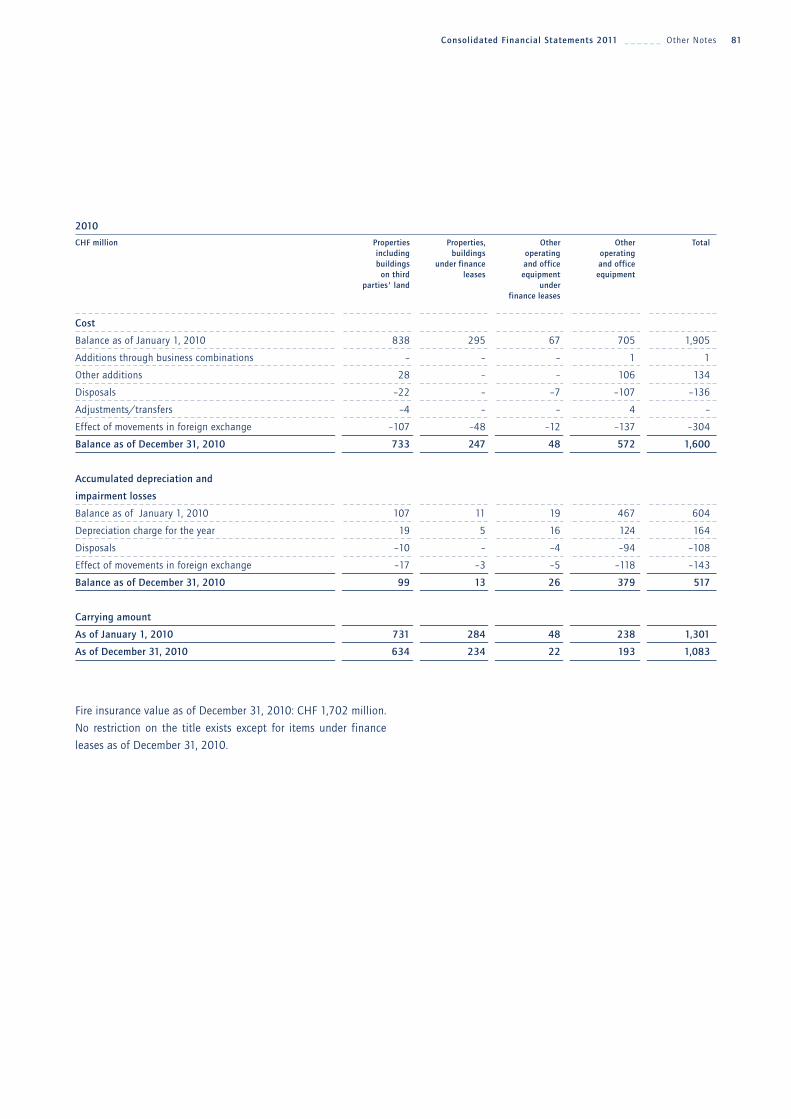
Fire insurance value as of December 31, 2010: CHF 1,702 million.
No restriction on the title exists except for items under finance
leases as of December 31, 2010.
2010
CHF million Properties Properties, Other Other Totalincluding buildings operating operating buildings under finance and office and office
on third leases equipment equipmentparties' land under
finance leases
Cost
Balance as of January 1, 2010 838 295 67 705 1,905
Additions through business combinations – – – 1 1
Other additions 28 – – 106 134
Disposals –22 – –7 –107 –136
Adjustments/transfers –4 – – 4 –
Effect of movements in foreign exchange –107 –48 –12 –137 –304
Balance as of December 31, 2010 733 247 48 572 1,600
Accumulated depreciation and
impairment losses
Balance as of January 1, 2010 107 11 19 467 604
Depreciation charge for the year 19 5 16 124 164
Disposals –10 – –4 –94 –108
Effect of movements in foreign exchange –17 –3 –5 –118 –143
Balance as of December 31, 2010 99 13 26 379 517
Carrying amount
As of January 1, 2010 731 284 48 238 1,301
As of December 31, 2010 634 234 22 193 1,083
81Consolidated Financial Statements 2011 _ _ _ _ _ _ Other Notes

28 Goodwill and other intangibles
2011
CHF million Goodwill Other intangibles
Cost
Balance as of January 1, 2011 615 556
Addition through business combinations 121 88
Other additions – 11
Deletions – –2
Effect of movements in foreign exchange –19 –14
Balance as of December 31, 2011 717 639
Accumulated amortisation and impairment losses
Balance as of January 1, 2011 25 380
Amortisation charge for the year – 69
Impairment loss – 5
Deletions – –2
Effect of movements in foreign exchange –4 –9
Balance as of December 31, 2011 21 443
Carrying amount
As of January 1, 2011 590 176
As of December 31, 2011 696 196
1 Other intangibles mainly comprise customer contracts/lists and software.
2 The impairment charge of CHF 5 million relates to other intangibles pertaining to reportable segments
Seafreight and Airfreight recognised upon the acquisition of J. Martens Group, Norway, due to loss of customer contracts.
1
2
Consolidated Financial Statements 2011 _ _ _ _ _ _ Other Notes82

2010
CHF million Goodwill Other intangibles
Cost
Balance as of January 1, 2010 726 660
Addition through business combinations – 2
Other additions – 17
Deletions – –24
Effect of movements in foreign exchange –111 –99
Balance as of December 31, 2010 615 556
Accumulated amortisation and impairment losses
Balance as of January 1, 2010 45 387
Amortisation charge for the year – 75
Deletions – –14
Effect of movements in foreign exchange –20 –68
Balance as of December 31, 2010 25 380
Carrying amount
As of January 1, 2010 681 273
As of December 31, 2010 590 176
1 Other intangibles mainly comprise customer contracts/lists and software.
1
83Consolidated Financial Statements 2011 _ _ _ _ _ _ Other Notes
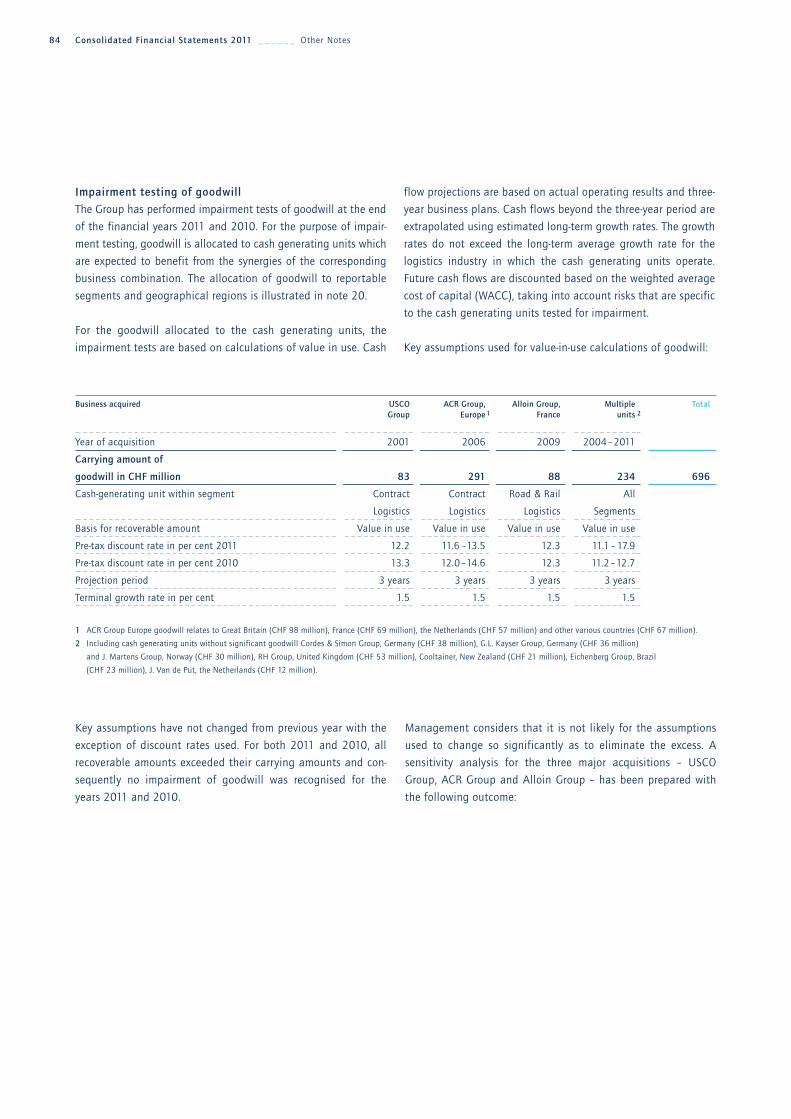
Impairment testing of goodwill
The Group has performed impairment tests of goodwill at the end
of the financial years 2011 and 2010. For the purpose of impair-
ment testing, goodwill is allocated to cash generating units which
are expected to benefit from the synergies of the corresponding
business combination. The allocation of goodwill to reportable
segments and geographical regions is illustrated in note 20.
For the goodwill allocated to the cash generating units, the
impairment tests are based on calculations of value in use. Cash
Business acquired USCO ACR Group, Alloin Group, Multiple TotalGroup Europe 1 France units 2
Year of acquisition 2001 2006 2009 2004–2011
Carrying amount of
goodwill in CHF million 83 291 88 234 696
Cash-generating unit within segment Contract Contract Road & Rail All
Logistics Logistics Logistics Segments
Basis for recoverable amount Value in use Value in use Value in use Value in use
Pre-tax discount rate in per cent 2011 12.2 11.6 –13.5 12.3 11.1 – 17.9
Pre-tax discount rate in per cent 2010 13.3 12.0–14.6 12.3 11.2–12.7
Projection period 3 years 3 years 3 years 3 years
Terminal growth rate in per cent 1.5 1.5 1.5 1.5
1 ACR Group Europe goodwill relates to Great Britain (CHF 98 million), France (CHF 69 million), the Netherlands (CHF 57 million) and other various countries (CHF 67 million).
2 Including cash generating units without significant goodwill Cordes & Simon Group, Germany (CHF 38 million), G.L. Kayser Group, Germany (CHF 36 million)
and J. Martens Group, Norway (CHF 30 million), RH Group, United Kingdom (CHF 53 million), Cooltainer, New Zealand (CHF 21 million), Eichenberg Group, Brazil
(CHF 23 million), J. Van de Put, the Netherlands (CHF 12 million).
Consolidated Financial Statements 2011 _ _ _ _ _ _ Other Notes84
flow projections are based on actual operating results and three-
year business plans. Cash flows beyond the three-year period are
extrapolated using estimated long-term growth rates. The growth
rates do not exceed the long-term average growth rate for the
logistics industry in which the cash generating units operate.
Future cash flows are discounted based on the weighted average
cost of capital (WACC), taking into account risks that are specific
to the cash generating units tested for impairment.
Key assumptions used for value-in-use calculations of goodwill:
Management considers that it is not likely for the assumptions
used to change so significantly as to eliminate the excess. A
sensitivity analysis for the three major acquisitions – USCO
Group, ACR Group and Alloin Group – has been prepared with
the following outcome:
Key assumptions have not changed from previous year with the
exception of discount rates used. For both 2011 and 2010, all
recoverable amounts exceeded their carrying amounts and con-
sequently no impairment of goodwill was recognised for the
years 2011 and 2010.

Sensitivity analysis of goodwill USCO Group
Amount of excess (+)/necessary impairment (–) in CHF million depending on:
Sensitivity analysis of goodwill ACR Group
Amount of excess (+)/necessary impairment (–) in CHF million depending on:
Sensitivity analysis of goodwill Alloin Group
Amount of excess (+)/necessary impairment (–) in CHF million depending on:
Discount rate
CHF million 12.0 per cent 13.0 per cent 14.0 per cent 15.0 per cent
Growth rate
0.0 per cent 26 18 10 4
0.5 per cent 30 21 13 6
1.0 per cent 34 24 16 8
1.5 per cent 38 27 18 11
Discount rate
CHF million 14.0 per cent 15.0 per cent 16.0 per cent 17.0 per cent
Growth rate
0.0 per cent 529 478 433 393
0.5 per cent 550 495 448 407
1.0 per cent 572 514 464 420
1.5 per cent 596 535 481 435
Discount rate
CHF million 13.0 per cent 14.0 per cent 15.0 per cent 16.0 per cent
Growth rate
0.0 per cent 46 33 22 12
0.5 per cent 51 37 26 16
1.0 per cent 57 42 30 19
1.5 per cent 63 47 34 23
85Consolidated Financial Statements 2011 _ _ _ _ _ _ Other Notes

29 Investments in joint venturesAs of December 31, 2011, the following investments in joint ven-
tures are held (all with 50 per cent voting rights/KN share):
— KN-ITS S.A.L., Lebanon
— Cologic S.A., Luxembourg
— Kuehne + Nagel Drinkflow Logistics, Ltd., Great Britain*
— Kuehne + Nagel Drinkflow Logistics (Holdings) Ltd.,
Great Britain
— Sindos Railcontainer Services S.A., Greece
* During 2010 additional share capital of CHF 36 million was contributed to close
existing long-term finance facilities.
CHF million Dec. 31, 2011 Dec. 31, 2010
Non-current assets 54 67
Current assets 59 36
Non-current liabilities – 2
Current liabilities 34 16
Net invoiced turnover 303 376
Earnings for the year – 1
Consolidated Financial Statements 2011 _ _ _ _ _ _ Other Notes86
The table below provides a summary of financial information on
joint ventures (100 per cent):
No investments in associates were held at December 31, 2011
and 2010.
30 Work in progressThe position increased from CHF 253 million in 2010 to
CHF 275 million in 2011 which represents a billing delay of
5 working days against the previous year’s 4.6 working days.
31 Trade receivables
No trade receivables in 2011 and 2010 are pledged.
The Group has a credit insurance program in place, covering
trade receivables, focusing mainly on small and medium expo-
sures. The credit insurance policy covers up to 80 per cent of the
approved customer credit limit, excluding any items more than
120 days past due. As a company policy, the Group excludes
companies meeting certain criteria (so-called blue chip compa-
nies) from its insurance program.
The Group establishes an impairment allowance that represents
its estimate of incurred losses in respect of trade receivables. The
two components of this impairment allowance of CHF 67 million
(2010: CHF 57 million) are:
— specific loss component that relates to individually significant
exposure
— collective loss component based on historical experience.
Trade receivables with credit insurance cover are not included in
the impairment allowance. The individual impairment allowance
relates to specifically identified customers representing extremely
high risk of being declared bankrupt, Chapter 11 companies in
the USA and customers operating with significant financial
difficulties (such as negative equity). The impairment allowance
for individually significant exposures is CHF 42 million at year-
end 2011 (2010: CHF 37 million).
The collective impairment allowance based on overdue trade
receivables is estimated considering past experience of payment
statistics. The Group has established a collective impairment
allowance of CHF 25 million (2010: CHF 20 million) which rep-
resents 2.6 per cent (2010: 2.3 per cent) of total outstanding
trade receivables, excluding trade receivables with insurance
cover (see above) and trade receivables included in the individual
impairment allowance.
The majority of the trade receivables not past due relates to
customers who have good track record with the Group and are
subject to yearly credit risk assessments. Therefore, the Group
does not believe that an additional impairment allowance for
these trade receivables is necessary.
CHF million 2011 2010
Trade receivables 2,345 2,134
Impairment allowance –67 –57
Total trade receivables 2,278 2,077
The majority of all billing is done in the respective Group com-
panies’ own functional currencies and is mainly in EUR 45.2 per
cent (2010: 47.4 per cent), USD 12.6 per cent (2010: 13.3 per
cent) and GBP 8.9 per cent (2010: 6.9 per cent).

The movement in the impairment allowance during the year was
as follows:
Trade receivables outstanding at year-end averaged 42.2 days
(2010: 37.8 days). 94.4 per cent (2010: 94.9 per cent) of
2011 2010
CHF million Gross Collective Collective Gross Collective Collective(excluding allowance allowance (excluding allowance allowance
insured per cent of insured per cent ofreceivables subtotal receivables subtotal
and andindividual individual
allowance) allowance)
Not past due 658 – – 610 – –
Past due 1–30 days 194 – – 176 – –
Past due 31–90 days 65 3 5 42 3 5
Past due 91–180 days 17 2 10 14 1 10
Past due 181–360 days 15 15 100 12 12 100
More than 1 year 5 5 100 4 4 100
Total 954 25 2.6 858 20 2.3
2011 2010
CHF million Individual Collective Total Individual Collective Totalallowance allowance allowance allowance allowance allowance
Balance as of January 1 37 20 57 52 20 72
Additions through business combinations – 3 3 – – –
Additional impairment losses recognised 18 7 25 13 4 17
Reversal of impairment losses
and write-offs –13 –5 –18 –28 –4 –32
Balance as of December 31 42 25 67 37 20 57
87Consolidated Financial Statements 2011 _ _ _ _ _ _ Other Notes
the total trade receivables were outstanding between 1 and
90 days.
32 Other receivables
The majority of the other receivables are held in the respective
Group companies’ own functional currencies which represents
EUR 45.9 per cent (2010: 49.3 per cent), USD 19 per cent
(2010: 17.6 per cent) and GBP 0.7 per cent (2010: 0.2 per cent).
CHF million Dec. 31, 2011 Dec. 31, 2010
Receivables from tax authorities 80 57
Deposits 29 29
Other 40 43
Total 149 129

2011 2010
CHF million Derivative Derivative Derivative Derivativeassets liabilities assets liabilities
Forward foreign exchange contracts
— fair value 2 –
— notional amount 259 –
Consolidated Financial Statements 2011 _ _ _ _ _ _ Other Notes88
The investments in debt securities are designated as assets at
fair value through profit or loss. Financial investments having a
CHF million Dec. 31, 2011 Dec. 31, 2010
Cash in hand 3 2
Cash at banks 694 755
Short-term deposits 93 574
Financial investments 61 –
Cash and cash equivalents 851 1,331
Bank overdraft –16 –16
Cash and cash equivalents in the cash flow statement, net 835 1,315
2011 2010
Maturity from date of acquisition < 3 months > 3 months Total < 3 months > 3 months TotalCHF million
Investments in sovereign debt securities
— denominated in foreign currency (EUR) 61 152 213 – – –
— denominated in Swiss francs (CHF) – 63 63 – – –
Investments in corporate debt securities
— denominated in foreign currency (EUR) – 35 35 – – –
Total 61 250 311 – – –
exposure. Most of the bank balances held by Group companies
are in their respective functional currencies, which are mainly in
CHF, EUR, USD and GBP.
33 Financial investments and derivative instruments
Financial investments
maturity date of 3 months or less from the date of acquisition
are presented in cash and cash equivalents.
The majority of the above mentioned amounts is held in commer-
cial banks and cash and cash equivalents are managed centrally
in order to limit currency risks. A netting system and a Group
cash pool are in place which also further reduce the currency
Derivative instruments
The remaining life of the derivative instruments is between 4
and 116 days.
34 Cash and cash equivalents

2011 Balance Dec. 31 Jan. 1
Main shareholders Registered CHF million Capital Voting Registeredshares share share shares
of nominal per cent per cent of nominalCHF 1 per CHF 1 per
share share
Kuehne Holding AG, Schindellegi (Feusisberg) 63,900,000 64 53.3 53.6 63,900,000
Public shareholders 55,408,099 55 46.1 46.4 55,222,520
Entitled to voting rights and dividends 119,308,099 119 99.4 100.0 119,122,520
Treasury shares 691,901 1 0.6 877,480
Total 120,000,000 120 100.0 120,000,000
35 Equity
Share capital and treasury shares 2011
Year per share CHF million
2012 CHF 3.85 459 (2011: CHF 2.75 per share amounting to CHF 328 million)
2010 Balance Dec. 31 Jan. 1
Main shareholders Registered CHF million Capital Voting Registeredshares share share shares
of nominal per cent per cent of nominalCHF 1 per CHF 1 per
share share
Kuehne Holding AG, Schindellegi (Feusisberg) 63,900,000 64 53.3 53.6 64,900,000
Public shareholders 55,222,520 55 46.0 46.4 53,574,249
Entitled to voting rights and dividends 119,122,520 119 99.3 100.0 118,474,249
Treasury shares 877,480 1 0.7 1,525,751
Total 120,000,000 120 100.0 120,000,000
89Consolidated Financial Statements 2011 _ _ _ _ _ _ Other Notes
In 2011 the Company sold 309,089 (2010: 648,271) treasury
shares for CHF 28 million (2010: CHF 58 million) under the
Employee Share Purchase and Option Plan. The Company also pur-
chased 123,510 treasury shares for CHF 13 million (2010: none).
On December 31, 2011, the Company had 691,901 treasury
shares (2010: 877,480), of which 691,901 (2010: 877,480) are
blocked under the Employee Share Purchase and Option Plan;
refer to note 37 for more information.
Dividends
The proposed dividend payment, subject to approval by the
Annual General Meeting, is as follows:
Capital contribution reserves distribution
During the year 2011 CHF 1.50 per share amounting to
CHF 179 million in total was distributed to the shareholders
from capital contribution reserves.
Share capital and treasury shares 2010

Authorised and conditional share capital
The Annual General Meeting held on May 18, 2010, extended its
authorisation of authorised share capital up to a maximum
of CHF 20 million by a further two years until May 8, 2012.
The Annual General Meeting held on May 2, 2005, approved a
conditional share capital increase up to a maximum of CHF 12 mil-
lion and to add a respective section in the articles of association.
So far no use has been made of these rights. There is no resolution
of the Board of Directors outstanding for further issuance of either
authorised or conditional capital.
At the Annual General Meeting held on May 2, 2006, the share-
holders approved a 1:5 split of the registered shares and a com-
mensurate increase in the number of Kuehne + Nagel shares. At
the same time the nominal value per share relating to approved
CHF million 2011 2010 2009 2008 2007
Total equity 2,405 2,378 2,290 2,073 2,367
Total assets 6,141 5,941 5,933 5,555 6,438
Equity ratio in per cent 39.2 40.0 38.6 37.3 36.8
Consolidated Financial Statements 2011 _ _ _ _ _ _ Other Notes90
share capital and conditional share capital was also lowered from
CHF 5 to CHF 1.
Capital Management
The Group defines the capital that it manages as the Group’s
total equity, including non-controlling interests. The Group’s
main objectives when managing capital are:
— To safeguard the Group’s ability to continue as a going concern,
so that it can continue to provide services to its customers;
— To provide an adequate return to investors based on the level
of risk undertaken;
— To have the necessary financial resources available to allow
the Group to invest in areas that may deliver future benefits
for customers and investors.
Capital is monitored on the basis of the equity ratio and its
development is shown in the table below:
The Group is not subject to regulatory capital adequacy require-
ments as known in the financial services industry.
36 Provisions for pension plans and severance payments
The Group maintains defined benefit pension plans predomi-
nantly in Germany, the Netherlands, the USA and Switzerland as
well as defined contribution plans in some other countries.
Retirement benefits vary from plan to plan reflecting applicable
local practices and legal requirements. Retirement benefits are
based on years of credited service and the compensation as
defined.

CHF million Pension plans Severance Totalpayments
Balance as of January 1, 2010 273 34 307
Addition through business combinations 1 – 1
Provisions made 21 11 32
Provisions used –22 –4 –26
Actuarial (gains)/losses recognised in equity, excluding tax 17 – 17
Effect of movements in foreign exchange –42 –5 –47
Balance as of December 31, 2010 248 36 284
Addition through business combinations – – –
Provisions made 20 2 22
Provisions used –17 –2 –19
Actuarial (gains)/losses recognised in equity, excluding tax 17 – 17
Effect of movements in foreign exchange –7 –1 –8
Balance as of December 31, 2011 261 35 296
2011 2010
CHF million Funded Unfunded Total Funded Unfunded Totalplans plans plans plans
Present value of obligations 161 218 379 126 220 346
Fair value of plan assets –118 – –118 –98 – –98
Present value of net obligations 43 218 261 28 220 248
Recognised liability for
defined benefit obligations 43 218 261 28 220 248
Pension plan assets
Debt securities 68 – 68 60 – 60
Equity securities 27 – 27 17 – 17
Property 9 – 9 8 – 8
Others 14 – 14 13 – 13
Total 118 – 118 98 – 98
The pension plan assets are held in multi-employer funded
plans. The Group is not in a position to state whether the funded
plans contain any investments in shares of Kuehne + Nagel
International AG or in any property occupied by the Group.
91Consolidated Financial Statements 2011 _ _ _ _ _ _ Other Notes

Consolidated Financial Statements 2011 _ _ _ _ _ _ Other Notes92
2011 2010
CHF million Funded Unfunded Total Funded Unfunded Totalplans plans plans plans
Movements of fair value
of plan assets
Opening fair value of plan assets 98 – 98 89 – 89
Contributions paid into the plan – Employer 7 – 7 8 – 8
Contributions paid into the plan – Employee 4 – 4 3 – 3
Actuarial gains/(losses) recognised
in other comprehensive income –6 – –6 2 – 2
Benefits paid by the plan –4 – –4 – – –
Expected return on plan assets 5 – 5 4 – 4
Assets assumed through business
combination 15 – 15 – – –
Amendments/settlements – – – –4 – –4
Exchange differences –1 – –1 –4 – –4
Closing fair value
of plan assets 118 – 118 98 – 98
Expected payments to defined
benefit plan in next year 7 – 7 11 – 11
Return on plan assets –1 – –1 6 – 6
The expected long-term rate of return on assets is based on the
portfolio of assets as a whole, rather than on individual asset
categories.

2011 2010
CHF million Funded Unfunded Total Funded Unfunded Totalplans plans plans plans
Movements of present value of
defined benefit obligations
Opening liability for defined
benefit obligations 126 220 346 122 240 362
Liabilities assumed through
business combinations 15 – 15 – 1 1
Employee contribution 4 – 4 3 – 3
Current service costs 6 4 10 5 4 9
Interest costs 5 10 15 5 11 16
Benefits paid by the plan –4 –10 –14 – –11 –11
Actuarial (gains)/losses recognised
in other comprehensive income 13 –2 11 5 14 19
Amendments/settlements –2 2 – –5 –2 –7
Curtailment –2 – –2 – – –
Exchange differences – –6 –6 –9 –37 –46
Closing liability for defined
benefit obligations 161 218 379 126 220 346
Expense recognised in the
income statement
Current service costs 6 4 10 5 4 9
Interest costs 5 10 15 5 11 16
Expected return on plan assets –5 – –5 –4 – –4
Expense recognised in
personnel expenses
(refer to note 21) 6 14 20 6 15 21
Actuarial gains/(losses)
recognised in other
comprehensive income
excluding tax
Cumulative amount as of January 1 –17 –8 –25 –14 7 –7
Recognised during the year –19 2 –17 –3 –14 –17
Exchange differences – – – – –1 –1
Cumulative amount
as of December 31 –36 –6 –42 –17 –8 –25
93Consolidated Financial Statements 2011 _ _ _ _ _ _ Other Notes

Principal weighted actuarial assumptions at the balance sheet date
2011 2010
Per cent Funded Unfunded Total Funded Unfunded Totalplans plans plans plans
Discount rate 3.6 4.8 4.3 3.8 4.8 4.7
Expected rate of return on plan assets 4.5 – 4.5 4.5 – 4.5
Future salary increases 0.9 2.0 1.5 1.1 2.0 1.9
Future pension increases 1.8 0.3 0.8 1.7 0.3 1.2
Historical information
2011 2010
CHF million Funded Unfunded Total Funded Unfunded Totalplans plans plans plans
Present value of the defined
benefit plan obligations 161 218 379 126 220 346
Fair value of plan assets 118 – 118 98 – 98
Surplus/(deficit) in the plan –43 –218 –261 –28 –220 –248
Experience adjustment arising
on plan liabilites – –2 –2 –2 14 12
Experience adjustment arising
on plan assets –1 – –1 2 – 2
2009 2008 2007
CHF million Funded Unfunded Total Funded Unfunded Total Funded Unfunded Totalplans plans plans plans plans plans
Present value of the defined
benefit plan obligations 122 240 362 104 227 331 110 236 346
Fair value of plan assets 89 – 89 87 – 87 94 – 94
Surplus/(deficit) in the plan –33 –240 –273 –17 –227 –244 –16 –236 –252
Experience adjustment arising
on plan liabilites – –1 –1 1 2 3 4 –2 2
Experience adjustment arising
on plan assets –1 – –1 –12 – –12 3 – 3
37 Employee Share Purchase and Option PlanIn 2001 the Company implemented an employee share purchase
and option plan. This plan allows Group employees to acquire
shares of the Company. The employees can buy shares at a
reduced price compared to the actual share price at a cut-off
date. The price of the shares offered is 90 – 96.5 per cent of the
share price corresponding to the average closing price of one
share at the SIX Swiss Exchange during the months April to June.
There are no vesting conditions. The shares are restricted for a
period of three years before being released to the employees.
For each share purchased under this plan, the Company grants
two options to the participants. Each option entitles the partici-
pant to purchase one share of the Company at a specified price.
Consolidated Financial Statements 2011 _ _ _ _ _ _ Other Notes94

95Consolidated Financial Statements 2011 _ _ _ _ _ _ Other Notes
The exercise price is 100 per cent of the share price correspon-
ding to the average closing price of one share at the SIX Swiss
Exchange during the months April to June. The options vest
three years after the grant date and can be exercised during the
three-year period starting on the vesting date. The options can-
not be settled in cash.
CHF per share 2011 2010
Fair value of shares granted at measurement date 127.60 111.80
The difference between the fair value of the shares at purchase
date and the purchase price of the shares is recognised as a
personnel expense (2011: none, 2010: CHF 1 million) with a
corresponding increase in equity.
Options
The terms and conditions of the options granted are as follows:
Grant date Exercise period Number Exercise Number Numberissued price CHF outstanding as outstanding as
of Dec. 31, 2011 of Dec. 31, 2010
June 30, 2005 July 1, 2008–June 30, 2011 451,230 51.80 – 54,400
June 30, 2006 July 1, 2009–June 30, 2012 538,154 87.14 160,785 285,398
June 30, 2007 July 1, 2010–June 30, 2013 605,990 110.71 370,410 486,199
June 30, 2008 July 1, 2011–June 30, 2014 25,756 107.27 21,468 21,468
June 30, 2009 July 1, 2012–June 30, 2015 307,802 82.12 278,240 289,240
June 30, 2010 July 1, 2013–June 30, 2016 447,398 111.37 415,298 444,398
June 30, 2011 July 1, 2014–June 30, 2017 37,374 131.15 37,374 –
Total 2,413,704 1,283,575 1,581,103
2011 2010
Weighted Number of Weighted Number of average Options average Options
exercise price exercise price (CHF) (CHF)
Options outstanding as of January 1 99.23 1,581,103 90.56 1,574,577
Options granted during the year 131.15 37,374 111.37 447,398
Options cancelled during the year 104.07 –44,500 97.38 –16,300
Options exercised during the year 89.56 –290,402 79.96 –424,572
Options outstanding as of December 31 102.18 1,283,575 99.23 1,581,103
Options exercisable as of December 31 552,663 825,997
The vesting condition is employment during the three-year
vesting period (service condition). The number and weighted
average exercise prices of shares options are as follows:
Shares granted
The fair value of the shares granted is measured at the market
price of the Company’s shares, adjusted to take into considera-
tion the conditions upon which the shares will be granted,
such as blocking periods. 18,687 shares were granted in 2011
(2010: 223,699).

The expected volatility is based on the historic volatility (calculated
based on the weighted average remaining life of the share options),
adjusted for any expected changes to future volatility due to pub-
CHF 2011 2010
Fair value of options granted at measurement date 29.96 31.44
Share price 127.60 111.80
Exercise price 131.15 111.37
Expected volatility in per cent 32.2 33.5
Expected option life 5 years 5 years
Dividend yield in per cent 2.2 2.1
Risk-free interest rate in per cent 1.07 0.85
CHF million 2011 2010
Employee expenses
Expense arising from employee share purchase plan – 1
Expense arising from employee option plan 7 9
Total expense for the Employee Share Purchase and Option Plan 7 10
CHF million Dec. 31, 2011 Dec. 31, 2010
Less than 1 year 44 49
Between 1–5 years – –
Total 44 49
The weighted average life of the options outstanding at December
31, 2011, is 2.9 years (2010: 3.5 years). The options outstanding at
December 31, 2011, have an exercise price in the range of
CHF 82.12 to CHF 131.15 (2010: CHF 51.80 to CHF 111.37).
licly available information. The share options are granted under a
service condition. Service conditions are not taken into account in
the grant date fair value measurement of the services received.
The current bank and other interest-bearing liabilities include
the short-term portion of non-current loans of CHF 5 million
(2010: none) and finance lease liabilities due for payment with-
in one year of CHF 23 million (2010: CHF 33 million). Current
bank and other interest-bearing liabilities also include bank
overdrafts of CHF 16 million (2010: CHF 16 million), which are
included in cash and cash equivalents for the purpose of the
consolidated cash flow statement.
38 Bank liabilities and other interest-bearing liabilities
Consolidated Financial Statements 2011 _ _ _ _ _ _ Other Notes96

97Consolidated Financial Statements 2011 _ _ _ _ _ _ Other Notes
CHF million Dec. 31, 2011 Dec. 31, 2010
Trade payables 1,285 1,201
Accrued trade expenses 736 745
Deferred income 145 132
Total 2,166 2,078
All loans and bank overdrafts are held in the respective Group
companies’ own functional currencies, which mainly is in EUR
60.6 per cent (2010: 67.6 per cent), GBP 28.6 per cent (2010:
None) and USD 7 per cent (2010: 25.4 per cent) on terms of
the prevailing market conditions. The majority of bank over-
draft facilities are repayable upon notice or within one year of
2011 2010
CHF million Payments Interest Principal Payments Interest Principal
Less than 1 year 25 2 23 35 2 33
Between 1–5 years 34 3 31 43 3 40
After 5 years 12 – 12 19 1 18
Total 71 5 66 97 6 91
the contractual term. The applicable interest rates are at prime
interest rates of the respective country.
The non-current portion of finance lease liabilities amounts to
CHF 43 million (2010: CHF 58 million) and is presented sepa-
rately on the face of the balance sheet.
39 Finance lease obligations
40 Trade payables/accrued trade expenses/deferred income
The majority of all trade payables is in the respective Group com-
panies’ own functional currencies, which is in EUR 51.8 per cent
(2010: 52.3 per cent), USD 14.3 per cent (2010: 17.0 per cent)
and GBP 8.7 per cent (2010: 8.3 per cent).

41 ProvisionsThe movements in provisions were as follows:
Consolidated Financial Statements 2011 _ _ _ _ _ _ Other Notes98
CHF million Claim Provision for Others 3 Total provisions1 deductible of provision
transport liability
insurance 2
Balance as of January 1, 2010 76 29 53 158
Provisions used –10 –12 –13 –35
Provisions reversed –8 –3 –7 –18
Provisions made 24 15 32 71
Effect of movements in foreign exchange –5 – –8 –13
Balance as of December 31, 2010 77 29 57 163
of which
— Current portion 38 6 25 69
— Non-current portion 39 23 32 94
Total provisions 77 29 57 163
Balance as of January 1, 2011 77 29 57 163
Additions through business combinations 1 – 1 2
Provisions used –19 –11 –13 –43
Provisions reversed –6 –2 –8 –16
Provisions made 23 14 20 57
Effect of movements in foreign exchange –1 – –1 –2
Balance as of December 31, 2011 75 30 56 161
of which
— Current portion 27 8 29 64
— Non-current portion 48 22 27 97
Total provisions 75 30 56 161
1 Some companies are involved in legal cases based on logistics services provided. Some legal cases have been settled in the reporting
period, and corresponding payments have been made. In addition, a provision has been made in respect of a civil class action law suit relating
to a competition investigation in the USA which itself has been settled in the meantime. The provision represents the best estimate of the
amount to settle the class action claim and the associated legal expenses, but acknowledges that the final amount required to pay all claims
and fines is subject to uncertainty. A detailed breakdown of the claim is not presented as it may seriously prejudice the position of the Group
in the pending litigations (see also note 23 and 45).
2 An additional provision for deductibles in case of transport liability has been recognised for the current year’s exposure.
3 Other provisions consist mainly of provisions for dilapidation costs amounting to CHF 22 million (2010: CHF 20 million) and of provisions
for onerous contracts amounting to CHF 14 million (2010: CHF 20 million).

99Consolidated Financial Statements 2011 _ _ _ _ _ _ Other Notes
42 Other liabilities
43 Acquisition of businesses/subsidiaries
2011 Acquisitions
The acquisition of businesses and subsidiaries, each individually
immaterial, had the following effect on the Group’s assets and
liabilities in 2011.
CHF million Dec. 31, 2011 Dec. 31, 2010
Personnel expenses (including social security) 426 389
Other tax liabilities 67 64
Other operating expenses 215 154
Other 56 37
Total 764 644
2011
CHF million Recognisedfair values
Property, plant and equipment 54
Other intangibles 88
Other non-current assets 4
Trade receivables 49
Other current assets 17
Acquired cash and cash equivalents –2
Subtotal assets 210
Trade payables –42
Other current liabilities –30
Non-current liabilities –34
Total identifiable assets and liabilities 104
Attributable to non-controlling interests, based on its fair value –7
Goodwill 121
Total consideration 218
Contingent and deferred consideration –46
Purchase price, paid in cash 172
Acquired cash and cash equivalents 2
Net cash outflow 174

Consolidated Financial Statements 2011 _ _ _ _ _ _ Other Notes100
All acquisitions in the year 2011 were in connection with the
implementation of the Group’s “Go for Growth” strategy.
Effective January 14, the Group acquired the perishable logistics
business (mainly customer list) from two companies in Colombia
and one in Ecuador. The business acquired is a specialised peri-
shable forwarding operation having 160 employees and
handling 75,000 tons of air export per annum. The purchase
price of CHF 21.8 million includes a contingent consideration
of CHF 10.9 million depending on the financial performance of
the acquired business in the next three years ending December
31, 2013. CHF 10.9 million has been paid in cash.
Effective March 24, the Group acquired the business (mainly cus-
tomer list) of Grolman & Co. GmbH and ASTRA Assekuranz GmbH.
The purchase price of CHF 0.6 million has been paid in cash.
Effective April 1, the Group acquired a 75 per cent stake of Cool -
tainer Holdings Limited, a leading reefer operator in New Zea land.
The purchase price of CHF 23.6 million has been paid in cash.
As part of the acquisition, the Group issued a written put
option, giving the non-controlling shareholder the right from
April 1, 2014, to sell its remaining shares in Cooltainer to the
Group at fair value. The Group has recognised a liability in the
amount of CHF 8 million for this potential obligation. The
Group has a call option on the shares held by the non-control-
ling shareholder with the same terms and conditions as the
written put option.
Effective April 1, the Group acquired Rennies Investment Limi-
ted (RH Freight), a European overland provider in the United
Kingdom. The purchase price of CHF 88 million has been paid
in cash.
Effective September 1, the Group acquired Eichenberg Group,
a Brazilian road logistics provider. The purchase price of
CHF 40.1 million includes a deferred consideration of CHF 18.1
million to be paid until April 2013 and a contingent considera-
tion of CHF 5.5 million depending on the financial perform-
ance of the acquired business until December 31, 2012.
CHF 16.5 million has been paid in cash.
Effective September 2, the Group acquired shares of K-Logistics,
a French co-packing service provider. The purchase price of CHF
1.7 million includes a contingent consideration of CHF 1.1 million
depending on the financial performance of the acquired business
until December 31, 2012. CHF 0.6 million has been paid in cash.
Effective October 1, the Group acquired J. van de Put Fresh Cargo
Handling B.V., a specialised operator in handling perishables
airfreight cargo in the Netherlands. The purchase price of CHF
27.3 million includes a deferred consideration of CHF 3 million
and a contingent consideration of CHF 7.3 million depending
on the financial performance of the acquired business until
April 30, 2013. CHF 17 million has been paid in cash.
Effective October 24, the Group acquired the shares of Carl
Drude GmbH & Co. KG, located in Bad Hersfeld (Hauneck),
Germany, specialised in hub operations for international
groupage networks. The purchase price of CHF 12.4 million has
been paid in cash.
The acquisitions contributed CHF 459 million of invoiced
turnover and CHF 4 million of loss to the consolidated invoiced
turnover and earnings for the year 2011 respectively. If all acqui-
sitions had occurred on January 1, 2011, the Group’s invoiced
turnover would have been CHF 19,816 million and consolidated
earnings for the period would have been CHF 597 million.

101Consolidated Financial Statements 2011 _ _ _ _ _ _ Other Notes
The trade receivables comprise gross contractual amounts due
of CHF 52 million, of which CHF 3 million were expected to be
uncollectible at the acquisition date.
Goodwill of CHF 121 million arose on these acquisitions
because certain intangible assets did not meet the IFRS 3 crite-
ria for the recognition as intangible assets at the date of acqui-
sition. These assets mainly consist of management expertise and
workforce. An amount of CHF 32 million of goodwill is expected
to be deductible for tax purposes. Other intangibles of CHF 88
million recognised on these acquisitions represent non-contrac-
tual customer lists having a useful life of 3 to 7 years.
In the 2011 three quarterly condensed consolidated financial
statements, the initial accounting for the acquisitions made in
2011 was only determined provisionally. No material adjust-
ments to the values previously reported were deemed necessary
after having finalised the acquisition accounting.
The initial accounting for the acquisitions made from October 1,
2011, and onwards has only been determined provisionally. It is
not feasible to provide detailed information about the assets
and liabilities at this stage.
Effective December 1, the Group acquired an additional 12.5 per
cent of the shares of Amex Ltd., Israel, in which the Group previ-
ously owned 75 per cent, for a purchase price of CHF 2 million,
which has been paid in cash. The difference between the pur-
chase price paid and the net assets acquired has been recognised
in equity.
2010 Acquisitions
There were no significant acquisitions of subsidiaries in the
year 2010.
Effective August 4, 2010, a business, mainly comprising a cus-
tomer list, was acquired from a domestic road transport opera-
tor in India. The purchase price paid in cash was CHF 3 million.
44 Personnel
Employees within the Group are defined as persons with valid
employment contracts as of December 31, on payroll of the Group.
Full-time equivalent is defined as all for the Kuehne + Nagel
Group – including part-time (monthly, weekly, daily or hourly) –
working persons with or without permanent contract of which all
expenses are recorded in the personnel expenses. Whereby pro
rata temporis employment, has been recalculated into the num-
ber of full-year employees. The number, derived as described, is
disclosed in the table above.
Number Dec. 31, 2011 Dec. 31, 2010
Europe 43,771 40,910
Americas 9,389 7,791
Asia-Pacific 7,195 6,363
Middle East,
Central Asia and Africa 2,755 2,472
Total employees (unaudited) 63,110 57,536
Full-time equivalent 71,884 66,045
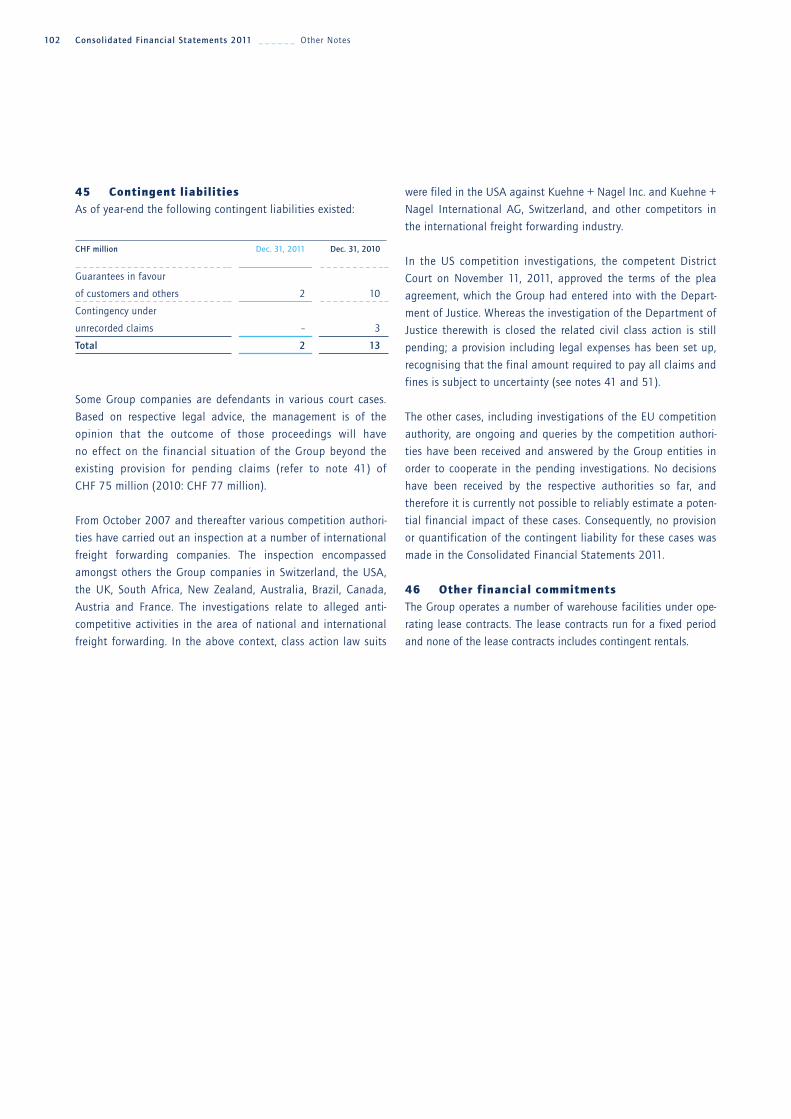
45 Contingent liabilitiesAs of year-end the following contingent liabilities existed:
Some Group companies are defendants in various court cases.
Based on respective legal advice, the management is of the
opinion that the outcome of those proceedings will have
no effect on the financial situation of the Group beyond the
existing provision for pending claims (refer to note 41) of
CHF 75 million (2010: CHF 77 million).
From October 2007 and thereafter various competition authori-
ties have carried out an inspection at a number of international
freight forwarding companies. The inspection encompassed
amongst others the Group companies in Switzerland, the USA,
the UK, South Africa, New Zealand, Australia, Brazil, Canada,
Austria and France. The investigations relate to alleged anti-
competitive activities in the area of national and international
freight forwarding. In the above context, class action law suits
were filed in the USA against Kuehne + Nagel Inc. and Kuehne +
Nagel International AG, Switzerland, and other competitors in
the international freight forwarding industry.
In the US competition investigations, the competent District
Court on November 11, 2011, approved the terms of the plea
agreement, which the Group had entered into with the Depart-
ment of Justice. Whereas the investigation of the Department of
Justice therewith is closed the related civil class action is still
pending; a provision including legal expenses has been set up,
recognising that the final amount required to pay all claims and
fines is subject to uncertainty (see notes 41 and 51).
The other cases, including investigations of the EU competition
authority, are ongoing and queries by the competition authori-
ties have been received and answered by the Group entities in
order to cooperate in the pending investigations. No decisions
have been received by the respective authorities so far, and
therefore it is currently not possible to reliably estimate a poten-
tial financial impact of these cases. Consequently, no provision
or quantification of the contingent liability for these cases was
made in the Consolidated Financial Statements 2011.
46 Other financial commitmentsThe Group operates a number of warehouse facilities under ope-
rating lease contracts. The lease contracts run for a fixed period
and none of the lease contracts includes contingent rentals.
Consolidated Financial Statements 2011 _ _ _ _ _ _ Other Notes102
CHF million Dec. 31, 2011 Dec. 31, 2010
Guarantees in favour
of customers and others 2 10
Contingency under
unrecorded claims – 3
Total 2 13

103Consolidated Financial Statements 2011 _ _ _ _ _ _ Other Notes
As of December 31, 2011
CHF million Properties Operating Totaland buildings and office
equipment
2012 339 79 418
2013–2016 637 112 749
Later 253 4 257
Total 1,229 195 1,424
As of December 31, 2010
CHF million Properties Operating Totaland buildings and office
equipment
2011 334 71 405
2012–2015 682 96 778
Later 258 3 261
Total 1,274 170 1,444
As of year-end the following financial commitments existed in
respect of non-cancellable long-term operating leases and rental
contracts:
The expense for operating leases recognised in the income state-
ment is CHF 548 million (2010: CHF 518 million).
47 Capital commitmentsAs of year-end the following capital commitments existed in
respect of non-cancellable purchase contracts.
CHF million Dec. 31, 2011 Dec. 31, 2010
Great Britain 2 2
France – 2
Others – 1
Total 2 5
48 Risk management, objectives and policies
Group risk management
Risk management is a fundamental element of the Group’s busi-
ness practice on all levels and encompasses different types of
risks. At Group level, risk management is an integral part of the
business planning and controlling processes. Material risks are
monitored and regularly discussed with the Management Board
and the Audit Committee.
In accordance with Article 663b of the Swiss Code of Obliga-
tions, the Group carries out an annual risk assessment. In refer-
ence to the “Swiss Code of Best Practice for Corporate Gover-
nance“, the risk management system within the Group covers

both financial and operational risks. A risk is defined as the
possibility of an adverse event which has a negative impact on
the achievement of the Group’s objectives.
Risk management as an integral part
of the Internal Control System
Risk management is part of the Internal Control System (ICS).
Preventive and risk-reducing measures to control risks are pro-
actively taken on different levels and are an integral part of
management responsibility. Operational risks are treated where
they occur in accordance with established competencies.
Conduct of a risk assessment in 2011
The analysis and assessment of financial risks was carried out by
the finance and accounting department. A specific risk assess-
ment procedure was adopted for operational risks. Applying an
interview methodology, risks were identified in collaboration
with regional management and included into a risk overview
which was discussed with the senior management. Strategic risks
and the adoption of countermeasures were dealt with at Man-
agement Board level. Within the framework of the corporate gov-
ernance process, the Audit Committee of the Board of Directors
was informed on the progress of the risk assessment.
Identified risks:
— Financial risks such as development of interest rate, credit
and financial markets and currency risks, which are all con-
stantly monitored and controlled by the finance and accoun-
ting department.
— The growing challenges of the economic development as well
as the uncertainties of the financial markets are of essential
importance from the risk-policy point of view, whereby this is
counteracted by appropriate risk diversification and avoid-
ance of regional and industry clustering. In this connec-
tion, risks relating to purchase of transportation services are
specifically monitored.
— Ensuring readiness of the operational network is paramount
for a global logistics company. Potential risks are mainly
caused by Force Majeure such as natural disasters and pan-
demics, but also in the socio-political environment. Various
activities in the area of Business Continuity, targeted training
and information to staff, safety measures and emergency
plans are set up to maintain operational availability.
— Further to the operational readiness, the IT network availa-
bility is in the focus. Permanent monitoring of systems, redun-
dant infrastructure, interlinked data centres with back-up
structures and business continuity plans are risk mitigating
measures of this area.
— Organised crime, terrorism, accompanied by increased density
of regulations, growing complexity and customer expectations
have led to rising security requirements which are taken into
consideration by using a holistic supply chain approach.
— In this connection, management intensified focus on IT
security, particularly data security and integrity.
— Special focus is given by senior management to risks com-
bined with the integration of new staff members in particular
following the acquisition of companies. Kuehne + Nagel has
further developed its precautionary measures in the area of
integration management.
— Increasing regulatory demands as well as growing complexity
and international interrelation of business relations increase
the trend towards contract and liability risks. These risks are
monitored primarily by the development of an integral IT-
supported contract management.
— Legal and compliance risks such as fraud and intentional and
unintentional violations of the law as well as adherence to
export regulations are counteracted by various activities.
The measures include inter alia comprehensive staff training
and a worldwide network of compliance officers to ensure
anchoring on regional and national management levels.
— Communication risks with respect to capital markets as well
as image and reputation risk, e.g. in connection with compli-
ance-related issues, are taken into consideration by a centrali-
sed approach towards corporate communications.
Consolidated Financial Statements 2011 _ _ _ _ _ _ Other Notes104

105Consolidated Financial Statements 2011 _ _ _ _ _ _ Other Notes
Organisation of risk management
A continuous dialogue between the Management Board, risk
management and the Audit Committee is maintained in order to
assure the Group’s effectiveness in this area. The risk manage-
ment system is governed by the Risk Assessment Guideline de-
fining the structure and the process of risk assessments. The risk
catalogue is reviewed regularly and critical analysis ensures a
continuous development of the risk management system.
Summarised assessment of the risk situation
In the 2011 business year there were no substantial risks identi-
fied that would have the potential to impact the Group and its
further development negatively.
Moreover, the Risk and Compliance Committee led by the Chair-
man of the Board of Directors and comprising the members of
the Management Board and heads of central administrative
departments, pays special attention to monitoring the risk pro-
file of the company, the observance and the development of
essential internal requirements and the potential interactions
between individual risks.
The major risk remains in the uncertainties of the global eco-
nomical development and the financial markets, therefore being
in constant focus of management and determining its actions.
Financial risk management
The Group is exposed to various financial risks arising from its
underlying operations and finance activities. The Group is pri-
marily exposed to market risk (i.e. interest rate and currency risk)
and to credit and liquidity risk.
Financial risk management within the Group is governed by
policies and guidelines approved by the senior management.
These policies and guidelines cover interest rate risk, currency
risk, credit risk and liquidity risk. Group policies and guidelines
also cover areas such as cash management, investment of
excess funds and the raising of short and long-term debt. Com-
pliance with the policies and guidelines is managed by segre-
gated functions within the Group. The objective of financial risk
management is to contain, where deemed appropriate, expo-
sures to the various types of financial risks mentioned above in
order to limit any negative impact on the Group’s results and
financial position.
In accordance with its financial risk policies, the Group
manages its market risk exposures through the use of financial
instruments when deemed appropriate. It is the Group’s policy
and practice not to enter into derivative transactions for tra-
ding or speculative purposes, nor for the purposes unrelated to
the underlying business.
Market risk
Market risk is the risk that market prices change due to interest
rates and foreign exchange rates risk affecting the Group’s
income or the value of its holdings of financial instruments.
Interest rate risk
Interest rate risk arises from movements in interest rates which
could have effects on the Group’s net income or financial posi-
tion. Changes in interest rates may cause variations in interest
income and expenses resulting from interest-bearing assets and
liabilities. Interest rate risk is the risk that the fair value or the
future cash flows of a financial instrument will fluctuate
because of changes in market interest rates. Loans and invest-
ments at variable interest rates expose the Group to cash flow
interest rate risk. Loans and investments at fixed interest rates
expose the Group to fair value interest rate risk.

Exposure
The Group’s exposure to changes in interest rates is limited
due to the short-term nature of investments of excess funds and
borrowings.
The Group’s exposure to interest rate risk relates primarily to the
Group’s bank loans and finance lease liabilities and to the
Group’s investments of its excess funds. The Group does not use
derivative financial instruments to hedge its interest rate risk in
respect of investments of excess funds or loans.
Profile
At the reporting date, the interest profile of the Group’s interest-
bearing financial assets and liabilities was as follows:
Fair value sensitivity analysis – fixed rate instruments
The Group’s investments in debt securities are fixed rate financial
assets at fair value through profit or loss. A change of 100 basis
points in interest rates at the reporting date would have
increased or decreased profit or loss by CHF 3 million (2010: nil)
due to the corresponding fair value change of these instruments.
Cash flow sensitivity analysis – variable rate instruments
A change of 100 basis points in interest rates on December 31,
2011, would have increased or decreased profit or loss by
CHF 7 million (2010: CHF 12 million) due to changed interest
payments on variable rate interest-bearing liabilities and assets.
The analysis assumes that all other variables, in particular
foreign exchange rates, remain constant.
Currency risk
Currency risk is the risk that the fair value or the future cash
flows of a financial instrument will fluctuate because of
changes in foreign exchange rates.
Exposure
The Group operates on a worldwide basis and, as a result, is
exposed to movements in foreign currency exchange rates of
mainly EUR, USD and GBP on sales, purchases, investments in
debt securities and borrowings that are denominated in a cur-
rency other than the respective functional currencies of the
Group entities. Monthly payments are conducted through a
Group clearing system in EUR and USD which facilitates moni-
toring and control of the group-wide foreign exchange rate
exposures.
Derivative financial instruments (foreign exchange contracts)
are, to a limited extent, in use to hedge the foreign exchange
exposure on outstanding balances in the Group’s internal clearing
Consolidated Financial Statements 2011 _ _ _ _ _ _ Other Notes106
Carrying amount
CHF million 2011 2010
Fixed rate instruments
Cash and cash equivalents 61 –
Financial investments 250 –
Total 311 –
Carrying amount
CHF million 2011 2010
Variable rate instruments
Cash and cash equivalents 787 1,329
Current bank and other
interest-bearing liabilities –44 –49
Non-current finance
lease obligations –43 –58
Total 700 1,222

107Consolidated Financial Statements 2011 _ _ _ _ _ _ Other Notes
system centralised at the head office. Given that the Group’s
hedging activities are limited to hedges of recognised foreign
currency monetary items, hedge accounting under IAS 39 is not
applied. The outstanding derivative contracts as of December
31, 2011, have mainly been entered into to off-set the foreign
exchange effect on investments in foreign currency debt instru-
ments (see note 33). As of the 2011 and 2010 year-end there
were no material derivative instruments outstanding. Forecast
transactions are not hedged. Likewise, investments in foreign
subsidiaries are not hedged as those currency positions are con-
sidered to be long-term in nature.
The Group’s exposure to foreign currency risk was as follows as
of year-end:
2011 2010
CHF million EUR USD GBP EUR USD GBP
Cash and cash equivalents 98 66 1 279 74 –
Financial investments 187 – – – – –
Trade receivables 29 223 8 26 193 1
Trade payables –33 –60 –4 –17 –87 –2
Gross balance sheet exposure 281 229 5 288 180 –1
The majority of all trade related billings and payments as well
as all payments of interest-bearing liabilities are done in the
respective functional currencies of the Group entities.
Sensitivity analysis
A 10 per cent strengthening of the CHF against the following
currencies on December 31, would have increased profit by the
amounts shown below. A 10 per cent weakening of the CHF
against the following currencies on December 31, would have
had the equal but opposite effect on the amounts shown below.
This analysis assumes that all other variables, in particular interest
rates, remain constant.
2011
CHF million 1 CHF/EUR 1 CHF/USD 1 GBP/EUR 1 GBP/USD 1 USD/EUR
Reasonably possible change +/–
in per cent 10.0 10.0 10.0 10.0 10.0
Positive effect on P/L 28.1 23.0 19.2 15.7 30.0
Negative effect on P/L –28.1 –23.0 –19.2 –15.7 –30.0
The impact on the profit or loss is mainly a result of foreign
exchange gains or losses arising on translation of trade recei-
vables, trade payables, investments in debt securities and cash
and cash equivalents in foreign currencies. The currency risk on
investments in foreign currency debt securities has mainly been
offset by foreign exchange contracts entered into. There would
not be an impact on other comprehensive income as the Group
does not have any securities classified as available for sale or
applies cash flow hedge accounting.

2010
CHF million 1 CHF/EUR 1 CHF/USD 1 GBP/EUR 1 GBP/USD 1 USD/EUR
Reasonably possible change +/–
in per cent 10.0 10.0 10.0 10.0 10.0
Positive effect on P/L 28.8 18.0 19.6 12.2 30.2
Negative effect on P/L –28.8 –18.0 –19.6 –12.2 –30.2
Consolidated Financial Statements 2011 _ _ _ _ _ _ Other Notes108
Foreign currency exchange rates applied
The major foreign currency exchange rates applied during the
year are as explained in note 5 (principles of consolidation).
Credit risk
Credit risk arises from the possibility that the counterparty to a
transaction may be unable or unwilling to meet its obligations,
causing a financial loss to the Group. Credit risk arises primarily
from the Group’s trade receivables.
Exposure
At the balance sheet date, the maximum exposure to credit risk
without taking into account any collateral held or other credit
enhancements was:
Trade receivables
Trade receivables are subject to a policy of active risk manage-
ment which focuses on the assessment of country risk, credit
availability, ongoing credit evaluation and account monitoring
procedures. There are no significant concentrations of credit
risk due to the Group’s large number of customers and their
wide geographical spread. For a large part of credit exposures
in critical countries, the Group has obtained credit insurance
from first class insurance companies (for further details refer to
note 31).
The maximum exposure to credit risk for trade receivables at
the reporting date by geographical area was:
CHF million 2011 2010
Trade receivables 2,278 2,077
Other receivables 69 68
Cash and cash equivalents 848 1,329
Financial investments 252 –
Total 3,447 3,474
CHF million 2011 2010
Europe 1,427 1,314
Americas 483 418
Asia-Pacific 202 194
Middle East, Central Asia & Africa 166 151
Total 2,278 2,077

109Consolidated Financial Statements 2011 _ _ _ _ _ _ Other Notes
It is considered that the credit insurance is sufficient to cover
potential credit risk concentrations (for additional information
refer to note 31).
Investments of excess funds
The Group considers its credit risk to be minimal in respect of
investments made of excess funds invested in short-term deposits
(with a maturity of less than three months) and in debt securities
with first-class financial institutions and countries with the close
coordination and management of Centralised Corporate Treasury
function. The Group does not invest in equity securities.
Liquidity risk
Liquidity risk is the risk that the Group will encounter difficul-
ties to meet obligations associated with its financial liabilities
that are settled by delivering cash or another financial asset.
Group companies require sufficient availability of cash to meet
their obligations. Individual companies are generally responsi-
ble for their own cash management, including the short-term
investment of cash surpluses and the raising of loans to cover
cash deficits subject to guidance by the Group and, in certain
cases, to approval at Group level. The Group maintains suffi-
cient reserves of cash to meet its liquidity requirements at all
times.
The following are the contractual maturities of financial liabili-
ties (undiscounted), including interest payments and excluding
the impact of netting agreements:
2011
CHF million Carrying Contractual Up to 6–12 months Over amounts cash flow 6 months 1 year
Bank and other interest-bearing liabilities 44 48 27 21 –
Trade payables 1,285 1,285 1,285 – –
Accrued trade expenses 736 736 736 – –
Other liabilities 263 263 236 27 –
Finance lease obligations (non-current) 43 46 – – 45
Total 2,371 2,378 2,284 48 45
2010
CHF million Carrying Contractual Up to 6–12 months Over amounts cash flow 6 months 1 year
Bank and other interest-bearing liabilities 49 51 33 18 –
Trade payables 1,201 1,201 1,201 – –
Accrued trade expenses 745 745 745 – –
Other liabilities 191 191 191 – –
Finance lease obligations (non-current) 58 62 – – 62
Total 2,244 2,250 2,170 18 62
It is not expected that the cash flow included in the above matu-
rity analysis could occur at significantly different points in time
or at significantly different amounts.

49 Fair value of financial assets and liabilitiesThe fair values of financial assets and liabilities carried at amor-
tised cost are approximately equal to the carrying amounts.
Cash and cash equivalents with a carrying amount of CHF 851
million (2010: CHF 1,331 million) as well as financial assets with a
carrying amount of CHF 2,347 million (2010: CHF 2,145 million)
classified as loans and receivables carried at amortised cost, are all
classified as current assets.
The Group has financial liabilities with a carrying amount of
CHF 2,371 million (2010: CHF 2,244 million) carried at amor-
tised cost. The majority of these financial liabilities are current
liabilities. At year-end 2011 and 2010 there were no non-
current fixed rate interest-bearing loans and other liabilities.
The Group has debt instruments designated as financial assets
at fair value through profit or loss upon initial recognition with
the carrying amount of CHF 250 million (2010: none) and deriv-
ative instruments with the carrying amount of CHF 2 million
(2010: none).
The Group’s financial instruments measured at fair value have
been categorised into the below levels, reflecting the signifi-
cance of the inputs used in estimating the fair values:
— Level 1: Quoted prices (unadjusted) in active markets for iden-
tical instruments.
— Level 2: Input other than quoted prices included within Level
1 that are observable for the instrument, either directly or
indirectly.
— Level 3: Valuation techniques using significant unobservable
inputs.
The Group’s debt instruments with the carrying amount of
CHF 250 million (2010: none) are categorised as level 1 invest-
Consolidated Financial Statements 2011 _ _ _ _ _ _ Other Notes110
ments. Derivative instruments in the amount of CHF 2 million
(2010: none) are categorised as level 2 investments.
The fair value of the debt instruments is based on their current
bid prices. The fair value of the derivative instruments (forward
foreign exchange contracts) is determined based on current and
available market data. Pricing models commonly used in the
market are used, taking into account relevant parameters such
as forward rates, spot rates, discount rates, yield curves and
volatility.
50 Related parties and transactionsThe Group has a related party relationship with its subsidiaries,
joint ventures and with its directors and executive officers.
The Group’s operations involve operating activities between the
parent company and its subsidiaries and between the sub-
sidiaries due to the nature of business. Overheads are to a cer-
tain extent also charged to the subsidiaries based on their use
of services provided. All these transactions are eliminated upon
consolidation. There were no significant transactions between
the Group and its joint ventures and other related parties.
Transactions with related parties are conducted at arm’s length.
The total remuneration paid to and accrued for the members of
the Board of Directors and the Management Board of Kuehne +
Nagel International AG, Schindellegi, Switzerland, amounted to:
— Management Board: CHF 12 million (2010: CHF 12 million)
— Board of Directors: CHF 5 million (2010: CHF 6 million)
As of December 31, 2011, no loans or any other commitments
were outstanding towards members neither of the Board of
Directors nor of the Management Board. Members of the Board
of Directors and the Management Board control 53.9 per cent
(2010: 53.8 per cent) of the voting shares of the Company.

111Consolidated Financial Statements 2011 _ _ _ _ _ _ Other Notes
Management Board Board of Directors
CHF million 2011 2010 2011 2010
Wages, salaries and other short-term employee benefits 11.4 10.1 4.7 4.9
Post-employment benefits 0.4 0.3 0.2 0.1
Equity compensation benefits 0.4 1.8 0.2 0.5
Total compensation 12.2 12.2 5.1 5.5
The following compensation has been paid to and accrued for
the Management Board and the Board of Directors:
Refer to pages 127 to 130; note 12 of the Financial Statements
of Kuehne + Nagel International AG for disclosure requirements
according to the Swiss law (Article 663 b/c CO). For other
related parties refer to note 35 outlining the shareholder’s
structure, and pages 114 to 119 listing the Group’s significant
subsidiaries and joint ventures.
51 Accounting estimates and judgmentsThe management has carefully considered the development,
selection and disclosure of the Group’s critical accounting poli-
cies and estimates as well as the application of these policies
and estimates.
Acquisition accounting
Intangible assets acquired in a business combination are
required to be recognised separately from goodwill and amor-
tised over their useful life if they are subject to contractual or
legal rights or are separately transferable and their fair value
can be reliably estimated. The Group has separately recognised
customer lists and customer contracts based on contractual
agreements in acquisitions made (see note 28).
The fair value of these acquired intangible assets is based on
valuation techniques. The valuation models require input based
on assumptions about the future. The management uses its best
knowledge to estimate fair value of acquired intangible assets
as of the acquisition date. The value of intangible assets is tested
for impairment when there is an indication that they might be
impaired (see below). The management must also make assump-
tions about the useful life of the acquired intangible assets
which might be affected by external factors such as in creased
competition.
Carrying amount of goodwill, other intangibles
and property, plant and equipment
The Group tests its goodwill with a total carrying amount of
CHF 696 million (2010: CHF 590 million) for impairment every
year as disclosed in note 12. No impairment loss on goodwill was
recognised in 2011 and 2010. The Group also assesses annually
any indicators that other intangible assets or property, plant and
equipment might be impaired. In such a case, the assets are tested
for impairment. An impairment loss on other intangible assets of
CHF 5 million was recognised in 2011 (2010: none). The carrying
amount of other intangibles is CHF 196 million (2010:
CHF 176 million), and of property, plant and equipment
CHF 1,146 million (2010: CHF 1,083 million).
The impairment tests are based on value-in-use calculations.
These calculations involve a variety of assumptions such as
estimates of future cash inflows and outflows and choice of a

discount rate. Actual cash flows might, for example, differ signifi-
cantly from management’s current best estimate. Changes in
assessed presence or absence of competitors, technological ob-
solescence etc. might have an impact on future cash flows and
result in recognition of impairment losses.
Defined benefit pension plans
The Group has recognised a liability for defined benefit pension
plans in the amount of CHF 261 million (2010: CHF 248 million).
A number of assumptions are made in order to calculate the
liability, including discount rate, rate of return on plan assets,
future salary and pension increases. A relatively minor change in
any of these assumptions can have a significant impact on the
carrying amount of the defined benefit obligation.
Accrued trade expenses and deferred income
Freight forwarding orders which are completed and for which the
costs are not fully received are accrued for expected costs based
on best estimate. For orders which are not complete on account of
pending service at cut-off date or orders for which revenue is
earned and relevant costs can not be estimated, the related
revenue is deferred. The Group management’s judgment is
involved in the estimate of costs and deferral of revenue and their
completeness.
Income tax
Judgment and estimates are required when determining
deferred as well as current tax assets and liabilities. The manage-
ment believes that its estimates, based on, for example, interpre-
tation of tax laws, are reasonable. Changes in tax laws and
rates, interpretations of tax laws, earnings before tax, taxable
profit etc. might have an impact on the amounts recognised as
tax assets and liabilities.
The Group has recognised a net deferred tax asset of
CHF 6 million (2010: Net deferred tax liability of CHF 7 million).
The Group furthermore has un recognised deferred tax assets
relating to unused tax losses and deductible temporary differ-
ences of CHF 82 million (2010: CHF 81 million). Based on esti-
mates of the probability of releasing these tax benefits, avail-
able taxable temporary differences, periods of reversals of such
differences etc., the management does not believe that the crite-
ria to recognise deferred tax assets are met (see note 25).
Provisions
The Group has recognised provisions for an amount of
CHF 161 million (2010: CHF 163 million) related to legal claims
and other exposures in the freight forwarding and logistics
operations (see note 41). The provisions represent the best esti-
mate of the risks, but the final amount required is subject to
uncertainty.
52 Post balance sheet eventsEffective February 2, 2012, the Group entered into an agreement
to take over the shares of the Australian freight forwarder Link
Logistics International Pty. Ltd, specialised in perishables logis-
tics. The acquired business is expected to be consolidated from
March 1, 2012. The estimated purchase price is CHF 5.4 million.
The Group is in the process of finalising the acquisition account-
ing and can therefore not provide any other reliable disclosure in
line with IFRS 3 at this stage.
There have been no other material events between December 31,
2011, and the date of authorisation of the Consolidated Finan-
cial Statements that would require adjustments of the Consoli-
dated Financial Statements or disclosure.
53 Resolution of the Board of DirectorsThe Consolidated Financial Statements of the Group were autho-
rised for issue by the Board of Directors on March 2, 2012. A
resolution to approve the Consolidated Financial Statements will
be proposed at the Annual General Meeting on May 8, 2012.
Consolidated Financial Statements 2011 _ _ _ _ _ _ Other Notes112

As statutory auditor, we have audited the accompanying consoli-
dated financial statements of Kuehne + Nagel International AG,
which comprise the income statement, statement of comprehen-
sive income, balance sheet, statement of changes in equity, cash
flow statement and notes on the pages 56 to 112 for the year
ended December 31, 2011.
Board of Directors’ Responsibility
The board of directors is responsible for the preparation and fair
presentation of the consolidated financial statements in accor-
dance with International Financial Reporting Standards (IFRS)
and the requirements of Swiss law. This responsibility includes
designing, implementing and maintaining an internal control
system relevant to the preparation and fair presentation of con-
solidated financial statements that are free from material mis-
statement, whether due to fraud or error. The board of directors
is further responsible for selecting and applying appropriate
accounting policies and making accounting estimates that are
reasonable in the circumstances.
Auditor’s Responsibility
Our responsibility is to express an opinion on these consolidated
financial statements based on our audit. We conducted our audit
in accordance with Swiss law and Swiss Auditing Standards as
well as International Standards on Auditing. Those standards
require that we plan and perform the audit to obtain reasonable
assurance whether the consolidated financial statements are free
from material misstatement.
An audit involves performing procedures to obtain audit evi-
dence about the amounts and disclosures in the consolidated
financial statements. The procedures selected depend on the
auditor’s judgment, including the assessment of the risks of
material misstatement of the consolidated financial statements,
whether due to fraud or error. In making those risk assessments,
the auditor considers the internal control system relevant to the
entity’s preparation and fair presentation of the consolidated
financial statements in order to design audit procedures that are
appropriate in the circumstances, but not for the purpose of
expressing an opinion on the effectiveness of the entity’s internal
control system. An audit also includes evaluating the appropri-
ateness of the accounting policies used and the reasonableness
of accounting estimates made, as well as evaluating the overall
presentation of the consolidated financial statements. We
believe that the audit evidence we have obtained is sufficient
and appropriate to provide a basis for our audit opinion.
Opinion
In our opinion, the consolidated financial statements for the
year ended December 31, 2011, give a true and fair view of the
financial position, the results of operations and the cash flows
in accordance with International Financial Reporting Standards
(IFRS) and comply with Swiss law.
Report on Other Legal Requirements
We confirm that we meet the legal requirements on licensing
according to the Auditor Oversight Act (AOA) and independence
(article 728 CO and article 11 AOA) and that there are no
circumstances incompatible with our independence.
In accordance with article 728a paragraph 1 item 3 CO and
Swiss Auditing Standard 890, we confirm that an internal
control system exists, which has been designed for the prepara-
tion of consolidated financial statements according to the
instructions of the board of directors.
We recommend that the consolidated financial statements sub-
mitted to you be approved.
KPMG AG
Marc Ziegler Lukas Marty
Licensed Audit Expert Licensed Audit Expert
Auditor in Charge
Zurich, March 2, 2012
113
REPORT OF THE STATUTORY AUDITOR ON THE CONSOLIDATED FINANCIAL STATEMENTS TO THE GENERAL MEETING OF SHAREHOLDERS OF KUEHNE + NAGEL INTERNATIONAL AG, SCHINDELLEGI , SWITZERL AND
Consolidated Financial Statements 2011 _ _ _ _ _ _ Repor t of the Statutory Auditors on the Consolidated Financial Statements

SIGNIFIC ANT SUBSIDIARIES AND JOINT VENTURES*
Holding and Management Companies
Country Name of the company Location Currency Share capital KN voting share
(in 1,000) (in per cent)
Switzerland Kuehne + Nagel International AG Schindellegi CHF 120,000 100
Kuehne + Nagel Management AG Schindellegi CHF 1,000 100
Kuehne + Nagel Liegenschaften AG Schindellegi CHF 500 100
Nacora Holding AG Schindellegi CHF 500 100
Nacora Agencies AG Schindellegi CHF 400 100
Kuehne + Nagel Real Estate Holding AG Schindellegi CHF 100 100
Operating Companies
South West EuropeCountry Name of the company Location Currency Share capital KN voting share
(in 1,000) (in per cent)
Belgium Kuehne + Nagel N.V. Antwerp EUR 6,338 100
Kuehne + Nagel Logistics N.V. Geel EUR 5,206 100
Nacora Insurance Brokers N.V. Brussels EUR 155 100
Logistics Kontich BVBA Antwerp EUR 50 100
Logistics Nivelles SA Nivelles EUR 1,521 100
Kuehne + Nagel Transport SA Nivelles EUR 889 100
France Kuehne + Nagel SAS Ferrières EUR 17,380 100
Kuehne + Nagel Immobilier SCI Ferrières EUR 4 100
Kuehne + Nagel Parts SASU Trappes EUR 87 100
Kuehne + Nagel DSIA SAS Nantes EUR 360 100
Kuehne + Nagel Management SAS Ferrières EUR 570 100
Nacora Courtage d’Assurances SASU Paris EUR 40 100
Kuehne + Nagel Aerospace & Industry SASU Ferrières EUR 37 100
Logistique Distribution Gasocogne SASU Ferrières EUR 37 100
Alloin Transport SAS Villefranche EUR 4,000 100
I.M. Alloin SARL Villefranche EUR 8 100
Alloin Logistique SAS Villefranche EUR 50 100
S.N.C. Almeca Villefranche EUR 32 100
Kuehne + Nagel Participations S.a.r.l. Ferrières EUR 203,630 100
K Logistics SAS Le Meux EUR 91 100
Italy Kuehne + Nagel Srl Milan EUR 4,589 100
Nacora S.R.L Milan EUR 104 70
Luxembourg Kuehne + Nagel S.a.r.l. Contern EUR 5,750 100
Kuehne und Nagel AG Contern EUR 31 100
Kuehne + Nagel Investment S.a.r.l. Contern EUR 200 100
*Cologic S.A. Contern EUR 32 50
Malta Kuehne + Nagel Limited Hamrun EUR 14 100
Portugal Kuehne + Nagel Lda. Porto EUR 165 100
Spain Kuehne & Nagel S.A. Madrid EUR 60 100
Kuehne & Nagel Investments S.L. Madrid EUR 3 100
Nacora Correduria de Seguros S.A. Madrid EUR 150 100
Kuehne & Nagel Network, S.L. Madrid EUR 60 100
114

North West EuropeCountry Name of the company Location Currency Share capital KN voting share
(in 1,000) (in per cent)
Denmark Kuehne + Nagel A/S Copenhagen DKK 5,200 100
Kuehne + Nagel Holding Denmark A/S Copenhagen DKK 750 100
Finland Oy Kuehne + Nagel Ltd Helsinki EUR 200 100
Ireland Kuehne & Nagel (Ireland) Limited Dublin EUR 500 100
Norway Kuehne + Nagel AS Oslo NOK 3,100 100
Sweden Kuehne & Nagel AB Stockholm SEK 500 100
Kuehne & Nagel Investment AB Stockholm EUR 112 100
Nacora International Insurance Brokers AB Stockholm SEK 100 100
United Kingdom Kuehne + Nagel (UK) Limited Uxbridge EUR 8,000 100
Kuehne + Nagel Limited Uxbridge GBP 8,867 100
Nacora Insurance Brokers Limited Uxbridge GBP 150 100
The RH Group Ltd Nottingham GBP 600 100
Kuehne + Nagel Drinks Logistics Limited Milton Keynes GBP – 100
*Kuehne + Nagel Drinkflow Logistics Limited Milton Keynes GBP 877 50
*Kuehne + Nagel Drinkflow Logistics
Holding Limited Milton Keynes GBP 6,123 50
Central EuropeCountry Name of the company Location Currency Share capital KN voting share
(in 1,000) (in per cent)
Germany Kuehne + Nagel (AG & Co.) KG Bremen EUR 15,000 100
Kuehne + Nagel Airlift GmbH Frankfurt EUR 256 100
Stute Verkehrs GmbH Bremen EUR 1,023 100
CS Parts Logistics GmbH Bremen EUR 426 50
Kuehne + Nagel Euroshipping GmbH Regensburg EUR 256 51
Pact GmbH Hamburg EUR 50 100
SPS Zweite Vermögensverwaltungs GmbH Hamburg EUR 25 90
Cargopack Verpackungsgesellschaft
für Industriegüter GmbH Bremen EUR 307 100
Kuehne + Nagel Beteiligungs-AG Bremen EUR 10,277 100
Nacora Versicherungsmakler GmbH Hamburg EUR 79 100
Gustav. F. Huebener GmbH Hamburg EUR 31 100
Kuehne + Nagel Logistics Langenau GmbH Langenau EUR 25 100
Carl Drude GmbH & Co. KG Hauneck EUR 250 100
The Netherlands Kuehne + Nagel N.V. Rotterdam EUR 3,325 100
Kuehne + Nagel Investments B.V. Rotterdam EUR 50 100
Nacora Assurantiekantoor B.V. Rotterdam EUR 45 100
Kuehne + Nagel Logistics B.V. Veghel EUR 63 100
J. van de Put Fresh Cargo Handling B.V Schiphol EUR 18 100
Switzerland Kuehne + Nagel AG Opfikon CHF 3,000 100
Nacora Insurance Brokers AG Opfikon CHF 100 100
115Consolidated Financial Statements 2011 _ _ _ _ _ _ Signif icant Subsidiaries and Joint Ventures

Eastern EuropeCountry Name of the company Location Currency Share capital KN voting share
(in 1,000) (in per cent)
Albania Transalbania Shpk. Tirana ALL 41,725 51
Austria Kuehne + Nagel Eastern Europe AG Vienna EUR 1,090 100
Kuehne + Nagel GmbH Vienna EUR 1,820 100
Nacora Insurance Brokers GmbH Vienna EUR 35 100
Belarus Kuehne + Nagel FPE Minsk BYR 286,000 100
Bosnia and Herzegovina Kuehne + Nagel doo Sarajevo BAM 95 100
Bulgaria Kuehne + Nagel EOOD Sofia BGN 365 100
Croatia Kuehne + Nagel d.o.o. Zagreb HRK 4,300 100
Cyprus Nakufreight Limited Nicosia EUR 17 100
Czech Republic Kuehne + Nagel spol. s.r.o. Prague CZK 21,000 100
Estonia Kuehne + Nagel AS Tallinn EEK 346 100
Greece Kuehne + Nagel Transportation & Logistics A.E Athens EUR 15,365 100
Arion SA Athens EUR 411 100
Nacora Brokins International S.A. Athens EUR 60 60
*Sindos Railcontainer Services A.E Thessaloniki EUR 3,038 50
Hungary Kuehne + Nagel Kft. Budapest HUF 134,600 100
Latvia Kuehne + Nagel Latvia SIA Riga LVL 100 100
Lithuania Kuehne & Nagel UAB Vilnius LTL 800 100
Macedonia Kuehne + Nagel d.o.o.e.l. Skopje MKD 8,232 100
Poland Kuehne + Nagel Poland sp.z.o.o. Poznan PLN 104,416 100
Romania Kuehne + Nagel S.R.L Bucharest RON 2,543 100
Russia OOO Kuehne + Nagel Moscow RUR 1,228,036 100
OOO Kuehne & Nagel Sakhalin Sakhalin RUR 500 100
OOO Nakutrans Moscow RUR 278 100
Serbia Kuehne + Nagel d.o.o. Belgrade RSD 3,039 100
Slovakia Kuehne + Nagel s.r.o. Bratislava EUR 470 100
Slovenia Kuehne + Nagel d.o.o. Ljubljana EUR 10 100
Ukraine Kuehne + Nagel Ltd. Kiev UAH 22,995 100
Consolidated Financial Statements 2011 _ _ _ _ _ _ Signif icant Subsidiaries and Joint Ventures116

North AmericaCountry Name of the company Location Currency Share capital KN voting share
(in 1,000) (in per cent)
Bermuda Kuehne + Nagel Ltd. Hamilton EUR 12 100
Canada Kuehne + Nagel Ltd. Toronto CAD 2,910 100
Nacora Insurance Brokers Ltd. Toronto CAD – 100
Kuehne + Nagel Real Estate Ltd. Toronto CAD – 100
Kuehne + Nagel Services Ltd. Vancouver USD – 100
Mexico Kuehne + Nagel S.A de C.V. México’ D.F. MXN 24,447 100
Almacenadora Kuehne + Nagel S.A. de C.V. México’ D.F. MXN 35,440 100
Kuehne + Nagel Servicios
Administrativos S.A. de C.V. México’ D.F. MXN 50 100
Agentes de Seguros S.A. de C.V. México’ D.F. MXN 50 100
USA Kuehne + Nagel Investment Inc. Jersey City USD 1,400 100
Kuehne + Nagel Inc. Jersey City USD 1,861 100
Nacora Insurance Brokers Inc. Jersey City USD 25 100
Kuehne + Nagel Special Logistics Inc. Dulles USD 30 100
Kuehne + Nagel Real Estate USA Inc. Jersey City USD – 100
South and Central AmericaCountry Name of the company Location Currency Share capital KN voting share
(in 1,000) (in per cent)
Argentina Kuehne + Nagel S.A. Buenos Aires ARS 3,208 100
Nacora S.A. Buenos Aires ARS 20 100
Bolivia Kuehne + Nagel Ltda. Santa Cruz BOB 260 100
Brazil Kuehne + Nagel Servicos Logisticos Ltda. São Paulo BRL 38,728 100
Nacora Corretagens de Seguros Ltda. São Paulo BRL 1,094 100
Transeich Armazens Gerais S.A. Porto Alegre BRL 2,479 100
Transeich Assessoria e Transportes S.A. Porto Alegre BRL 17,918 100
Chile Kuehne + Nagel Ltda. Santiago CLP 575,000 100
Colombia Kuehne + Nagel S.A. Bogotá COP 5,184,600 100
Agencia De Aduanas KN Colombia SAS. Nivel 2 Bogotá COP 595,000 100
Nacora S.A. Bogotá COP 20,000 100
Costa Rica Kuehne Nagel Logistic Services S.A. San José CRC 25,400 100
Kuehne + Nagel S.A. San José CRC – 100
Cuba Kuehne Nagel Logistic Services S.A. Havana CUC – 100
Ecuador Kuehne + Nagel S. A. Quito USD 7 100
El Salvador Kuehne + Nagel S.A. DE C.V. San Salvador USD 70 100
Guatemala Kuehne + Nagel S.A. Guatemala GTQ 4,245 100
Honduras Kuehne + Nagel S.A. San Pedro Sula HNL 25 100
Nicaragua Kuehne + Nagel S.A. Managua NIO 10 100
Panama Kuehne + Nagel S.A. Colon USD 1 100
Kuehne + Nagel Management S.A. Colon USD 10 100
Peru Kuehne + Nagel S.A. Lima PEN 654 100
Trinidad & Tobago Kuehne + Nagel Ltd. Port of Spain TTD 31 100
Uruguay Kuehne + Nagel S.A. Montevideo UYU 3,908 100
Venezuela Kuehne + Nagel S.A. Caracas VEF 1,000 100
KN Venezuela Aduanas C.A. Caracas VEF 2 100
Nacora S.A. Caracas VEF 60 100
117Consolidated Financial Statements 2011 _ _ _ _ _ _ Signif icant Subsidiaries and Joint Ventures
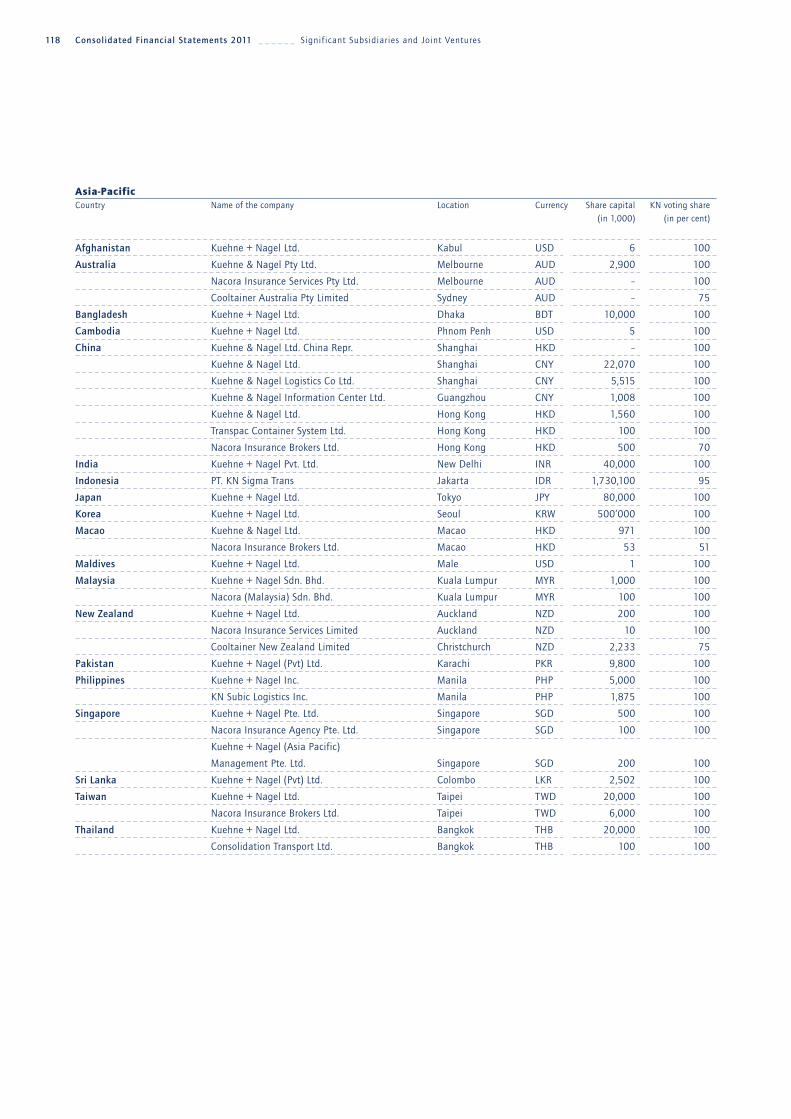
Asia-PacificCountry Name of the company Location Currency Share capital KN voting share
(in 1,000) (in per cent)
Afghanistan Kuehne + Nagel Ltd. Kabul USD 6 100
Australia Kuehne & Nagel Pty Ltd. Melbourne AUD 2,900 100
Nacora Insurance Services Pty Ltd. Melbourne AUD – 100
Cooltainer Australia Pty Limited Sydney AUD – 75
Bangladesh Kuehne + Nagel Ltd. Dhaka BDT 10,000 100
Cambodia Kuehne + Nagel Ltd. Phnom Penh USD 5 100
China Kuehne & Nagel Ltd. China Repr. Shanghai HKD – 100
Kuehne & Nagel Ltd. Shanghai CNY 22,070 100
Kuehne & Nagel Logistics Co Ltd. Shanghai CNY 5,515 100
Kuehne & Nagel Information Center Ltd. Guangzhou CNY 1,008 100
Kuehne & Nagel Ltd. Hong Kong HKD 1,560 100
Transpac Container System Ltd. Hong Kong HKD 100 100
Nacora Insurance Brokers Ltd. Hong Kong HKD 500 70
India Kuehne + Nagel Pvt. Ltd. New Delhi INR 40,000 100
Indonesia PT. KN Sigma Trans Jakarta IDR 1,730,100 95
Japan Kuehne + Nagel Ltd. Tokyo JPY 80,000 100
Korea Kuehne + Nagel Ltd. Seoul KRW 500’000 100
Macao Kuehne & Nagel Ltd. Macao HKD 971 100
Nacora Insurance Brokers Ltd. Macao HKD 53 51
Maldives Kuehne + Nagel Ltd. Male USD 1 100
Malaysia Kuehne + Nagel Sdn. Bhd. Kuala Lumpur MYR 1,000 100
Nacora (Malaysia) Sdn. Bhd. Kuala Lumpur MYR 100 100
New Zealand Kuehne + Nagel Ltd. Auckland NZD 200 100
Nacora Insurance Services Limited Auckland NZD 10 100
Cooltainer New Zealand Limited Christchurch NZD 2,233 75
Pakistan Kuehne + Nagel (Pvt) Ltd. Karachi PKR 9,800 100
Philippines Kuehne + Nagel Inc. Manila PHP 5,000 100
KN Subic Logistics Inc. Manila PHP 1,875 100
Singapore Kuehne + Nagel Pte. Ltd. Singapore SGD 500 100
Nacora Insurance Agency Pte. Ltd. Singapore SGD 100 100
Kuehne + Nagel (Asia Pacific)
Management Pte. Ltd. Singapore SGD 200 100
Sri Lanka Kuehne + Nagel (Pvt) Ltd. Colombo LKR 2,502 100
Taiwan Kuehne + Nagel Ltd. Taipei TWD 20,000 100
Nacora Insurance Brokers Ltd. Taipei TWD 6,000 100
Thailand Kuehne + Nagel Ltd. Bangkok THB 20,000 100
Consolidation Transport Ltd. Bangkok THB 100 100
Consolidated Financial Statements 2011 _ _ _ _ _ _ Signif icant Subsidiaries and Joint Ventures118

Middle East and Central AsiaCountry Name of the company Location Currency Share capital KN voting share
(in 1,000) (in per cent)
Bahrain Kuehne + Nagel W.L.L. Manama BHD 200 100
Egypt Kuehne + Nagel Ltd. Cairo EGP 1,000 100
Iran Kala Navgan Shargh Co. Ltd. Tehran IRR 2,000 60
Caspian Terminal Services Ltd. Bandar Abbas IRR 200,000 57
Israel Amex Ltd. Holon ILS 2 87.5
Jordan Kuehne and Nagel Jordan L.L.C. Amman JOD 300 100
Kazakhstan KN Ibrakom L.L.P. Almaty KZT 140,000 60
Kuwait Kuehne + Nagel Co. W.L.L. Kuwait KWD 150 100
Lebanon *KN-ITS S.A.L. Beirut LBP 113,000 50
Qatar Kuehne + Nagel L.L.C. Doha QAR 1,900 100
Saudi Arabia Kuehne + Nagel Limited Jeddah SAR 1,000 100
Syria Kuehne + Nagel Syria LLC Damascus SYP 7,000 100
Turkey Kuehne + Nagel Nakliyat Sti. Istanbul TRY 5,195 100
KN Ibrakom Lojistik Hizmetleri Ltd. Sti. Istanbul TRY 945 60
UAE Kuehne + Nagel L.L.C. Dubai AED 1,000 100
Kuehne + Nagel L.L.C. Abu Dhabi AED 1,000 100
Kuehne + Nagel DWC L.L.C Dubai AED 13,000 100
Kuehne + Nagel Management ME FZE Dubai AED 1,000 100
KN Ibrakom FZCO Jebel Ali USD 273 60
Ibrakom Cargo L.L.C Jebel Ali USD 82 60
Lloyds Maritime Trading Ltd. Jebel Ali USD – 60
Uzbekistan Kuehne + Nagel Ibrakom Tashkent Ltd. Tashkent UZS 14,000 60
AfricaCountry Name of the company Location Currency Share capital KN voting share
(in 1,000) (in per cent)
Angola Kuehne & Nagel (Angola) Transitarios Lda Luanda AON 7,824 100
Equatorial Guinea Kuehne + Nagel (Equatorial Guinea) Ltd. Malabo CFA 1,046 100
Kenya Kuehne + Nagel Limited Nairobi KES 63,995 100
Mauritius KN (Mauritius) Limited Port Louis MUR 4,000 100
Mozambique Kuehne & Nagel Mocambique Lda. Maputo MZN 133 100
Namibia Kuehne and Nagel (Pty) Ltd. Windhoek NAD 340 100
Nigeria Kuehne & Nagel (Nigeria) Ltd. Lagos NGN 10,000 100
South Africa Kuehne + Nagel (Pty) Limited Johannesburg ZAR 3,625 100
KN Tsepisa Logistics (Pty) Limited Johannesburg ZAR 100 92
Nacora Insurance Brokers (Pty) Limited Johannesburg ZAR 35 100
Tanzania Kuehne + Nagel Ltd. Dar Salaam TZS 525,000 100
Uganda Kuehne + Nagel Ltd. Kampala UGX 827,500 100
Zambia Kuehne + Nagel Zambia Limited Lusaka ZMK 85,000 100
Zimbabwe Kuehne + Nagel (Zimbabwe) (Private) Limited Harare ZWD – 100
119Consolidated Financial Statements 2011 _ _ _ _ _ _ Signif icant Subsidiaries and Joint Ventures

FINANCIAL STATEMENTS 2011OF KUEHNE + NAGEL INTERNATIONAL AG
Income Statement
120
CHF million Note 2011 2010
Income
Income from investments in Group companies 1 524 615
Sale of treasury shares 9 20
Interest income on loan receivables from Group companies 2 1
Other financial income 2 1
Exchange gains 10 –
Total income 547 637
Expenses
Operational –8 –6
Interest expenses on liabilities towards Group companies –2 –4
Losses from marketable securities – –2
Exchange losses –2 –2
Total expenses –12 –14
Earnings before tax (EBT) 535 623
Income Taxes –12 –31
Earnings for the year 523 592

121Financial Statements 2011 _ _ _ _ _ _ Balance Sheet
Balance Sheet
CHF million Note Dec. 31, 2011 Dec. 31, 2010
Assets
Investments 2 1,291 1,170
Non-current assets 1,291 1,170
Receivables from Group companies 3 53 98
Other receivables 2 1
Cash and cash equivalents 6 291 671
Financial investments 6 311 –
Treasury shares 5 45 51
Current assets 702 821
Total assets 1,993 1,991
Liabilities and Equity
Share capital 7 120 120
Reserves 8 60 60
Capital contribution reserves 8 6 185
Share premium from merger of subsidiaries – 89
Free reserves 8 6 –
Reserve for treasury shares 9 45 51
Retained earnings 10 744 391
Earnings for the year 523 592
Equity 1,504 1,488
Tax provision 12 25
Other provisions and accruals 6 5
Non-current liabilities 18 30
Liabilities towards Group companies 4 471 473
Current liabilities 471 473
Total liabilities 489 503
Total liabilities and equity 1,993 1,991
Schindellegi, March 2, 2012
KUEHNE + NAGEL INTERNATIONAL AG
Reinhard Lange Gerard van Kesteren
CEO CFO

General Kuehne + Nagel International AG directly or indirectly controls
all of the companies which are fully consolidated in the Group
Financial Statements. For financial and economic assessment
purposes, the Group Financial Statements are of importance.
Basis of preparation/Accounting policies
Investments
The investments in subsidiaries, associates and joint ventures
are recognised in the balance sheet at cost less valuation
allowance.
Receivables
— from Group companies
The balances outstanding are recorded at their nominal value
less valuation allowance at year-end.
NOTES TO THE FINANCIAL STATEMENTS 2011
NOTES TO THE INCOME STATEMENT
122
1 Income from investments in consolidated companies
The income from investments in consolidated companies relates
to dividends received.
— other
Other receivables are recorded at their nominal value less
valuation allowance at year-end.
Treasury shares
Treasury shares are valued at average cost or lower market
value. The “reserves for treasury shares” within equity are valued
at average cost of treasury shares.
Tax provision
Swiss taxes on income and capital are provided for at balance
sheet date.
Liabilities
— towards consolidated companies
Liabilities towards consolidated companies are recorded at
their nominal value at year-end.
Financial Statements 2011 _ _ _ _ _ _ Notes to the Financial Statements 2011, Notes to the Income Statement
CHF million 2011 2010
Income from investments and others 422 388
Trademark fee 102 105
Income on sale of investments (internal) – 122
Total 524 615

A schedule of the Group's main subsidiaries and Kuehne +
Nagel's share in the respective equity is shown on pages 114 to
119 of the Consolidated Financial Statements.
3 Receivables from Group companies
NOTES TO THE BAL ANCE SHEET
CHF million Investments in Investments in Totalconsolidated affiliated
companies companies
Cost
Balance as of January 1, 2011 2,130 2 2,132
Additions 292 – 292
Disposals –174 – –174
Balance as of December 31, 2011 2,248 2 2,250
Cumulative amortisation
Balance as of January 1, 2011 960 2 962
Additions 2 – 2
Disposals –5 – –5
Balance as of December 31, 2011 957 2 959
Carrying amount
As of January 1, 2011 1,170 – 1,170
As of December 31, 2011 1,291 – 1,291
123
2 Development of investments
Financial Statements 2011 _ _ _ _ _ _ Notes to the Balance Sheet
CHF million Dec. 31, 2011 Dec. 31, 2010
KN Ibrakom FZCO., Dubai 5 –
Kuehne + Nagel Ltd., Nairobi 4 –
Kuehne + Nagel Real Estate Holding AG, Schindellegi 4 4
Kuehne + Nagel Liegenschaften AG, Schindellegi 24 25
Kuehne + Nagel Investment AB, Stockholm – 1
Kuehne + Nagel S.A., Caracas – 1
Kuehne + Nagel GmbH, Vienna 7 9
Kuehne + Nagel Services Ltd., Vancouver – 52
Other Group companies 9 6
Total 53 98

4 Liabilities towards Group companies
5 Treasury shares
CHF million Dec. 31, 2011 Dec. 31, 2010
Kuehne + Nagel Ltd., Dublin 1 2
OY Kuehne + Nagel Ltd., Helsinki 4 13
Kuehne + Nagel S.a.r.l., Luxembourg 24 26
Kuehne + Nagel S.A.S., Paris 17 75
Kuehne + Nagel N.V., Rotterdam 24 11
Kuehne + Nagel NV/SA, Antwerp 13 15
Kuehne + Nagel Ltd., Toronto 37 –
Kuehne + Nagel spol.s.r.o., Prague 2 –
Kuehne + Nagel Investment S.a.r.l., Luxembourg 17 3
Kuehne + Nagel Investment SL, Madrid 40 35
Kuehne + Nagel Investment AB, Stockholm 2 –
Kuehne + Nagel (AG & Co.) KG, Hamburg 97 69
Kuehne + Nagel Inc., New York 65 52
Kuehne + Nagel Management AG, Schindellegi 22 16
Kuehne + Nagel AG, Zurich 31 24
Nacora Holding AG, Schindellegi 16 76
Nacora Agencies AG, Schindellegi 59 56
Total 471 473
Financial Statements 2011 _ _ _ _ _ _ Notes to the Balance Sheet124
Treasury shares are valued at average cost or lower market
value. The “reserves for treasury shares” within equity are valued
at average cost of treasury shares.
CHF million Dec. 31, 2011 Dec. 31, 2010
Treasury shares 1 45 51
Total 45 51
1 See note 9.

6 Cash, Cash equivalentsand financial investments
7 Share capital
At the Annual General Meeting held on May 2, 2006, the
shareholders approved a 1:5 split of the registered shares and a
corresponding increase in the number of Kuehne + Nagel
shares. At the same time, the nominal value per share relating
to approved share capital and conditional share capital was
also lowered from CHF 5 to CHF 1.
Approved and conditional share capital
The Annual General Meeting held on May 2, 2005 approved
the Board of Directors proposal to realise a conditional share
capital increase of 12 million registered shares up to a maxi-
CHF million Dec. 31, 2011 Dec. 31, 2010
The bank deposits are in the following currencies:
CHF 224 397
EUR 65 265
USD 2 9
Total 291 671
CHF million < 3 months > 3 months Dec. 31, 2011 Dec. 31, 2010
Bonds:
CHF – 63 63 –
EUR 61 187 248 –
Total 61 250 311 –
Registered shares CHF millionat nominal CHF 1 each
number
Balance as of December 31, 2011 120,000,000 120
125Financial Statements 2011 _ _ _ _ _ _ Notes to the Balance Sheet
mum of CHF 12 million and to add section 3.4 in the Articles of
Association.
The Annual General Meeting held on May 18, 2010 agreed to
the Board of Directors proposal to create an approved share
capital increase up to a maximum of CHF 20 million restricted
for two years. This option will expire on May 8, 2012.
So far no use has been made of these rights. There is no resolu-
tion of the Board of Directors outstanding for a further issuance
of either approved or conditional share capital.

126
8 Reserves
Financial Statements 2011 _ _ _ _ _ _ Notes to the Balance Sheet
CHF million Free Legal Capital Total reserves reserves reserves contribution
reserves
Balance as of January 1, 2011 – 60 185 245
Addition from release of reserves for treasury shares 1 6 – – 6
Distribution capital contribution to shareholders – – –179 –179
Balance as of December 31, 2011 6 60 6 72
1 See note 9.
9 Reserves for treasury shares
In agreement with the provisions of the Swiss commercial law
regarding the valuation of treasury shares, the company released
a reserve equivalent to the average cost of the treasury shares.
10 Retained earnings
number of shares CHF million
Balance as of January 1, 2011 877,480 51
Disposal of treasury shares –309,089 –19
Purchase of treasury shares 123,510 13
Balance as of December 31, 2011 691,901 45
CHF million
Balance as of January 1, 2011 (before income for the year and reclassification) 503
Reclassification of addition from merger of subsidiaries to retained earnings 89
Earnings for the year 2010 592
Retained earnings as of January 1, 2011 (prior to appropriation of available earnings) 1,184
Distribution to the shareholders (representing CHF 2.75 per share) –328
Transfer to capital contribution reserves –112
Subtotal (after appropriation of available earnings) 744
Earnings for the year 2011 523
Balance as of December 31, 2011 1,267
CHF million
Capital contribution reserves as of January 1, 2011 185
Distribution to the shareholders (CHF 1.50 per share) –179
Balance capital contribution reserves as of December 31, 2011 6

2011 2010
TCHF Compensation Compensation Social Total Totalfor Board of for Committees insurance
Directors
Klaus-Michael Kuehne (Honorary Chairman) 804 10 41 855 956
Karl Gernandt (Chairman) 3 300 25 – 325 150
Bernd Wrede (Vice Chairman) 225 48 – 273 250
Juergen Fitschen 150 – 9 159 159
Hans-Joerg Hager 150 – – 150 188
Hans Lerch 150 10 10 170 170
Dr. Wolfgang Peiner 150 – – 150 150
Dr. Thomas Staehelin 150 15 10 175 175
Dr. Joerg Wolle 150 50 12 212 107
Dr. Renato Fassbind 2 96 9 7 112 –
Dr. Georg Obermeier 1 54 9 – 63 175
Dr. Joachim Hausser 1 54 – 2 56 157
Total 2,433 176 91 2,700 2,637
1 Retired from the Board of Directors on May 10, 2011.
2 Since May 10, 2011.
3 Compensations are included in remuneration to the Chairman and the Management Board.
127
2011 2010
TCHF Salary Bonus Social Pension 2 Options Others 1 Total Totalinsurance
Karl Gernandt, Chairman 667 1,568 117 191 191 – 2,734 2,825
Reinhard Lange,
Chief Executive Officer 800 2,090 162 80 126 20 3,278 3,262
Management Board 3,368 4,396 406 339 307 75 8,891 8,925
Total 4,835 8,054 685 610 624 95 14,903 15,012
1 Other compensations comprise of company car, respectively of company car allowances for all members of the Management Board.
2 Including risk premium and savings contributions.
11 PersonnelThe company has no employees and therefore utilises the central
services of Kuehne + Nagel Management AG, Schindellegi
(Feusisberg) for its administrative requirements. The respective
costs are included in other operating expenses.
12 CompensationDue to Swiss law (Article 663b/c CO), additional disclosure of
information related to remuneration paid to and accrued for
members of the Board of Directors and the Management Board
is required.
Remuneration to the Board of Directors
Following compensation has been accrued for and paid to the
current members of the Board of Directors. Information related
to the compensation policy are disclosed as part of the Corporate
Governance section.
Remuneration to the Chairman and the Management Board
OTHER NOTES
Financial Statements 2011 _ _ _ _ _ _ Other Notes

Shareholdings by members
of the Board of Directors
As of December 31, 2011, the following number of shares was
held by members of the Board of Directors and/or parties closely
associated with them.
2011 2010
Number ofKNI shares
Reinhard Lange, Chief Executive Officer 35,811 23,710
Gerard van Kesteren, Chief Financial Officer 135,658 132,682
Martin Kolbe, Chief Information Officer 4,991 4,000
Dirk Reich, Executive Vice President Road & Rail and Contract Logistics 15,325 15,016
Lothar Harings, Chief Human Resources Officer 3,000 3,000
Tim Scharwath, Executive Vice President Airfreight 5,000 n/a
Horst Joachim Schacht, Executive Vice President Seafreight 7,780 n/a
Peter Ulber, former Executive Vice President Sea & Air Logistics n/a 5,000
Total 207,565 183,408
2011 2010
Number ofKNI shares
Klaus-Michael Kuehne (Honorary Chairman) 64,054,100 63,900,000
Karl Gernandt (Chairman) 23,500 16,560
Bernd Wrede (Vice Chairman) – –
Juergen Fitschen – –
Hans-Joerg Hager – –
Hans Lerch 5,000 5,000
Dr. Renato Fassbind 2 1,700 –
Dr. Wolfgang Peiner – –
Dr. Thomas Staehelin 10,000 10,000
Dr. Joerg Wolle 2,080 –
Dr. Joachim Hausser 1 – –
Dr. Georg Obermeier 1 – 500
Total 64,096,380 63,932,060
1 Resigned from Board of Directors on May 10, 2011.
2 Since May 10, 2011.
Financial Statements 2011 _ _ _ _ _ _ Other Notes128
Share allocation
In 2011 no shares were allocated to any members of either the
Board of Directors or the Management Board and/or to parties
closely associated with them other than disclosed under the
Employee Share Purchase and Option Plan (see page 94 to 96).
Board of Directors
Total shareholdings as of December 31:
Management Board
Total shareholdings as of December 31:

Options
In 2001 KNI introduced an Employee Share Purchase and
Option Plan for members of the KNI Management Board, by
which they have the option to purchase shares of KNI. As of the
balance sheet date, all members of the Management Board had
participated and the total amount of shares was purchased at
the agreed price of 90 per cent (plan 1 to 3), 95 per cent (plan
4), 96.5 per cent (plan 5) and 95 per cent (plan 6, 7, 8, 9 and
10) of the average share closing price quoted on the SIX Swiss
Exchange between April and June of the respective year of pur-
chase. The sale of the shares acquired under this plan is blocked
129Financial Statements 2011 _ _ _ _ _ _ Other Notes
for a period of three years after the date of purchase. Each share
purchased is linked with two options carrying the right to pur-
chase one KNI share for each option at the average price as out-
lined above. The option is blocked for three years from the date
of subscription and thereafter can be exercised within the period
of another three years. The option lapses after expiry of that
period.
The prices to exercise the above mentioned options are quoted
in note 37 to the Consolidated Financial Statements on pages
95 to 96.
Name Date of Number of Year of Expiryallocation Options of locked period
Karl Gernandt, Chairman of the Board of Directors 2009 17,120 2012
2010 16,000 2013
2011 6,376 2014
Reinhard Lange, Chief Executive Officer 2008 1,526 2011
2009 14,836 2012
2010 15,000 2013
2011 4,202 2014
Gerard van Kesteren, Chief Financial Officer 2008 2,938 2011
2009 14,176 2012
2010 15,000 2013
2011 5,952 2014
Martin Kolbe, Chief Information Officer 2009 2,000 2012
2010 6,000 2013
2011 1,982 2014
Dirk Reich, Executive Vice President Road & Rail and Contract Logistics 2008 1,694 2011
2009 13,338 2012
2010 15,000 2013
2011 2,312 2014
Lothar Harings, Chief Human Resources Officer 2009 9,963 2012
2010 2,000 2013
2011 – 2014
Tim Scharwath, Executive Vice President Airfreight 2011 – 2014
Horst Joachim Schacht, Executive Vice President Seafreight 2011 – 2014
Total options allocated 167,415

Loans
In 2011 no loans were granted to members of the Board of Direc-
tors or the Management Board of KNI nor to associated parties,
and no such loans were outstanding as of December 31, 2011.
13 Contingent liabilitiesFor further information regarding contingent liabilities refer
to note 45 of the Consolidated Financial Statements.
14 Risk management/Risk AssessmentThe detailed disclosures regarding risk management that are
required by Swiss law (Article 663b CO) are included in the
Kuehne + Nagel Group Consolidated Financial Statements on
pages 103 to 109.
Financial Statements 2011 _ _ _ _ _ _ Other Notes130
15 Proposal of the Board of Directors to the Annual General Meeting of May 08, 2012 regarding appropriation of the available earnings
CHF million
Balance as of January 1, 2011 (before income for the year) 744
Earnings for the year 2011 523
Available earnings as of December 31, 2011 1,267
Distribution to the shareholders (representing CHF 3.85 per share) 1 –459
Retained earnings as of December 31, 2011 (after appropriation of available earnings) 808
1 The total dividend amount covers all outstanding shares (as per December 31, 2011: 119,308,099 shares). However, shares held in treasury on the date of the dividend
declaration are not eligible for dividend payments. As a consequence, and if required the reported total dividend amount is adjusted accordingly.

131
internal control system. An audit also includes evaluating the
appropriateness of the accounting policies used and the reason-
ableness of accounting estimates made, as well as evaluating
the overall presentation of the financial statements. We believe
that the audit evidence we have obtained is sufficient and
appropriate to provide a basis for our audit opinion.
Opinion
In our opinion, the financial statements for the year ended
December 31, 2011, comply with Swiss law and the company’s
articles of incorporation.
Report on Other Legal Requirements
We confirm that we meet the legal requirements on licensing
according to the Auditor Oversight Act (AOA) and independence
(article 728 CO and article 11 AOA) and that there are no
circumstances incompatible with our independence.
In accordance with article 728a paragraph 1 item 3 CO and
Swiss Auditing Standard 890, we confirm that an internal control
system exists, which has been designed for the preparation of
financial statements according to the instructions of the board
of directors.
We further confirm that the proposed appropriation of available
earnings complies with Swiss law and the company’s articles
of incorporation. We recommend that the financial statements
submitted to you be approved.
KPMG AG
Marc Ziegler Lukas Marty
Licensed Audit Expert Licensed Audit Expert
Auditor in Charge
Zurich, March 2, 2012
As statutory auditor, we have audited the accompanying finan-
cial statements of Kuehne + Nagel International AG, which com-
prise the income statement, balance sheet and notes on the
pages 120 to 130 for the year ended December 31, 2011.
Board of Directors’ responsibility
The board of directors is responsible for the preparation of the
financial statements in accordance with the requirements of
Swiss law and the company’s articles of incorporation. This
responsibility includes designing, implementing and maintain-
ing an internal control system relevant to the preparation of
financial statements that are free from material misstatement,
whether due to fraud or error. The board of directors is further
responsible for selecting and applying appropriate accounting
policies and making accounting estimates that are reasonable
in the circumstances.
Auditor’s responsibility
Our responsibility is to express an opinion on these financial
statements based on our audit. We conducted our audit in
accordance with Swiss law and Swiss Auditing Standards. Those
standards require that we plan and perform the audit to obtain
reasonable assurance whether the financial statements are free
from material misstatement.
An audit involves performing procedures to obtain audit evi-
dence about the amounts and disclosures in the financial state-
ments. The procedures selected depend on the auditor’s judg-
ment, including the assessment of the risks of material
misstatement of the financial statements, whether due to fraud
or error. In making those risk assessments, the auditor considers
the internal control system relevant to the entity’s preparation
of the financial statements in order to design audit procedures
that are appropriate in the circumstances, but not for the pur-
pose of expressing an opinion on the effectiveness of the entity’s
REPORT OF THE STATUTORY AUDITORS TO THE ANNUAL GENERAL MEETING OF KUEHNE + NAGEL INTERNATIONAL AG,SCHINDELLEGI
Financial Statements 2011 _ _ _ _ _ _ Repor t of the Statutory Auditors

CORPORATE TIMETABLE 2012
March 5, 2012 Full year 2011 results
April 16, 2012 1st quarter 2012 results
May 8, 2012 Annual General Meeting
July 16, 2012 Half-year 2012 results
October 15, 2012 3rd quarter 2012 results

ANN
NET W
KUEHNE +
Kuehne + Nagel International AG
Kuehne + Nagel House
P.O. Box 67
CH-8834 Schindellegi
Telephone +41 (0) 44 786 95 11
Fax +41 (0) 44 786 95 95
www.kuehne-nagel.com
AN
NU
AL
RE
PO
RT
20
11
Umschlag_de_uk_RZ:Layout 1 12.04.2012 14:17 Uhr Seite 1