kuehne + nagel international ag analyst conference call ... · overview first quarter results 2016...
TRANSCRIPT

Kuehne + Nagel International AGAnalyst Conference Call – First quarter 2016 results
April 19, 2016 (CET 14.00)Schindellegi, Switzerland

This presentation contains forward-looking statements.
Such statements are subject to risks and uncertainties as various factors, many of which are beyond the control of Kuehne + Nagel International AG, may cause actual development and results to differ materially from the expectations contained in the presentation.
Reference is also made to our disclaimer on the last slide of this presentation.
Forward-looking statements
April 19, 2016Kuehne + Nagel Group - First quarter 2016 results p. 2

Overview first quarter results 2016
Appendices
Financial review
April 19, 2016Kuehne + Nagel Group - First quarter 2016 results p. 3

190
217219
2015 2016 2016 cc
1,497
1,5931,613
2015 2016 2016 cc
4,096
4,010
4,074
2015 2016 2016 cc
Gross profitin CHF million
EBITin CHF million
+ 6.4%
+ 7.7%
+ 14.2%
+ 15.3%
Net turnoverin CHF million
(0.5%)
(2.1%)
April 19, 2016Kuehne + Nagel Group - First quarter 2016 results p. 4
Overview first quarter 2016 results - Kuehne + Nagel Group

SeafreightEBIT: + 13.8%Volume: + 6%GP per TEU: + 1.4%Conversion rate: 30.7%

896
996 991 937
890
968 994 968 943
356 327
350 343 364 349 364 369 369
28.8 29.4
32.3
30.5
29.0
32.5
36.2
34.7
30.7
20.0
25.0
30.0
35.0
40.0
45.0
200
300
400
500
600
700
800
900
1'000
1'100
Q12014
Q22014
Q32014
Q42014
Q12015
Q22015
Q32015
Q42015
Q12016
TEU '000
GP/TEUin CHF
April 19, 2016Kuehne + Nagel Group - First quarter 2016 results p. 6
Seafreight - Performance of business unit
2016/2015 Growth Forex1
Turnover 2,244 1,972 (12.1%) (10.2%) (1.9%)
Gross profit 324 348 7.4% 9.9% (2.5%)
EBITDA 102 112 9.8% 10.8% (1.0%)
EBIT 94 107 13.8% 15.9% (2.1%)
EBIT in % of GP 29.0% 30.7%1 Foreign currency translation impact
VarianceYTD Mar 2016
Income statementin CHF million
YTD Mar 2015
‘000 TEU,CHF in %
Business drivers Market growth of max.
1%
FEWB and Intra Asia strong volume growth
Continuous rate volatility and overcapacity
Conversion Rate in %

AirfreightEBIT: + 7.4%Volume: in line with pyGP per 100kg: + 6.8%Conversion rate: 31.1%

285 295 297
317 304 306 312
328
303
77 75 75 69 73 73 73 70 78
28.3 27.3 27.0 25.6
30.8 30.4 28.8
27.4
31.1
10.0
15.0
20.0
25.0
30.0
35.0
40.0
50
100
150
200
250
300
350
Q12014
Q22014
Q32014
Q42014
Q12015
Q22015
Q32015
Q42015
Q12016
Tons '000
GP/100kgin CHF
Airfreight - Performance of business unit
‘000 Tons,CHF in %
April 19, 2016Kuehne + Nagel Group - First quarter 2016 results p. 8
2016/2015 Growth Forex1
Turnover 999 944 (5.5%) (3.0%) (2.5%)
Gross profit 221 235 6.3% 8.1% (1.8%)
EBITDA 72 77 6.9% 5.5% 1.4%
EBIT 68 73 7.4% 7.4% - %
EBIT in % of GP 30.8% 31.1%1 Foreign currency translation impact
YTD Mar 2016
Income statement in CHF million
YTD Mar 2015
Variance
Conversion Rate in %
Business drivers Market declined by
approx. 5%
Volume increase com-pensating the US West Coast boom from 2015
Continuous margin and conversion rate improvement

Development of volumes
896
996 991
937
890890
968
994
968
943
356
327
350 343
364
364349
364369 369
Q1 2015vs. 2014
Q2 2015vs. 2014
Q3 2015vs. 2014
Q4 2015vs. 2014
Q1 2016vs. 2015
Seafreight[TEU] ‘000
Volume increase of 6.0% or 53,000 TEUs yoy
Yield increase of 1.4% or CHF 5 GP/TEU yoy
Airfreight[TON] ‘000
Volume decrease of 0.3% or 1,000 tons yoy Yield increase of 6.8% or CHF 5 GP/100kg yoy
2016 GP/100kg in CHF2015 GP/100kg in CHF 2014 GP/100kg in CHF
2016 GP/TEU in CHF2015 GP/TEU in CHF 2014 GP/TEU in CHF
April 19, 2016Kuehne + Nagel Group - First quarter 2016 results p. 9
285295 297
317304304 306
312
328
303
77 75 75
69 73 73 73 73
70
78
Q1 2015vs. 2014
Q2 2015vs. 2014
Q3 2015vs. 2014
Q4 2015vs. 2014
Q1 2016vs. 2015

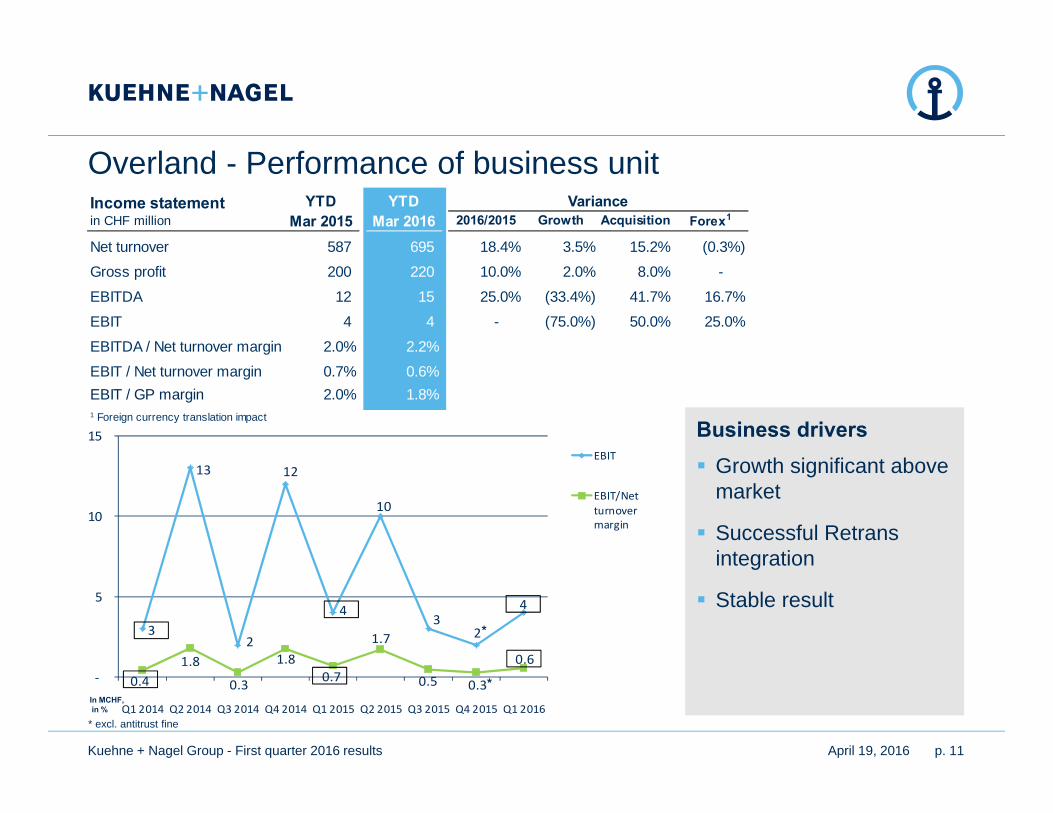
OverlandEBITDA: + 25%EBITDA/net TO margin: 2.2%EBIT: in line with pyAcquisition: EBIT CHF 2 million
3
13
2
12
4
10
3 2
4
0.4 1.8
0.3
1.8 0.7
1.7
0.5 0.3
0.6 ‐
5
10
15
Q1 2014 Q2 2014 Q3 2014 Q4 2014 Q1 2015 Q2 2015 Q3 2015 Q4 2015 Q1 2016
EBIT
EBIT/Netturnovermargin
* excl. antitrust fine
Overland - Performance of business unit
In MCHF,in %
*
*
April 19, 2016Kuehne + Nagel Group - First quarter 2016 results p. 11
2016/2015 Growth Acquisition Forex1
Net turnover 587 695 18.4% 3.5% 15.2% (0.3%)
Gross profit 200 220 10.0% 2.0% 8.0% -
EBITDA 12 15 25.0% (33.4%) 41.7% 16.7%
EBIT 4 4 - (75.0%) 50.0% 25.0%
EBITDA / Net turnover margin 2.0% 2.2%
EBIT / Net turnover margin 0.7% 0.6%EBIT / GP margin 2.0% 1.8%1 Foreign currency translation impact
Income statement in CHF million
YTD Mar 2015
YTD Mar 2016
Variance
Business drivers Growth significant above
market
Successful Retrans integration
Stable result
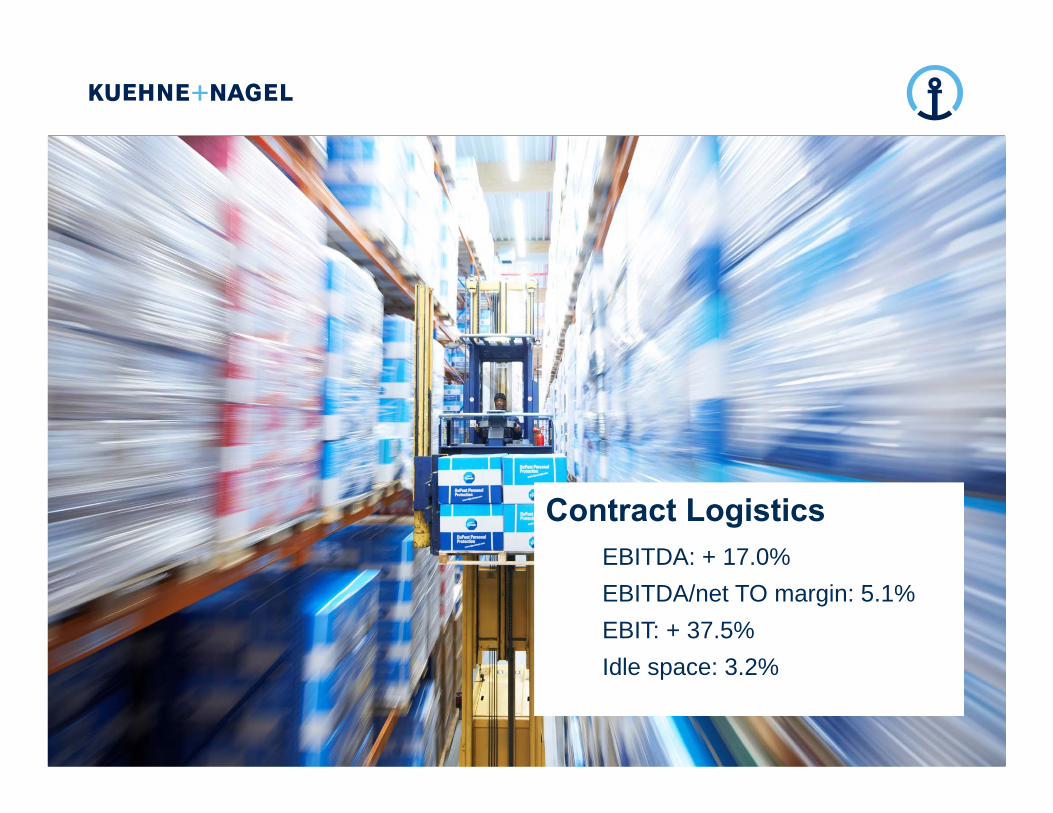
Contract LogisticsEBITDA: + 17.0%EBITDA/net TO margin: 5.1%EBIT: + 37.5%Idle space: 3.2%

33 37 37
46
24
32 30 33 33
3.2 3.4 3.3
3.9
2.4
3.0 2.8
2.9 3.1
‐
0.5
1.0
1.5
2.0
2.5
3.0
3.5
4.0
4.5
‐
10
20
30
40
50
60
70
Q12014
Q22014
Q32014
Q42014
Q12015
Q22015
Q32015
Q42015
Q12016
EBIT
EBIT/Netturnover margin
Contract Logistics - Performance of business unit
In MCHF
April 19, 2016Kuehne + Nagel Group - First quarter 2016 results p. 13
2015/2016 Growth Forex1
Net turnover 1,015 1,080 6.4% 7.4% (1.0%)
Gross profit 752 790 5.1% 6.2% (1.1%)
EBITDA 47 55 17.0% 19.1% (2.1%)
EBIT 24 33 37.5% 41.7% (4.2%)
EBITDA / Net turnover margin 4.6% 5.1%
EBIT / Net turnover margin 2.4% 3.1%1 Foreign currency translation impact
YTD Mar 2016
Income statement in CHF million
YTD Mar 2015
Variance
in %
Business drivers Substantial new
business implemented
Stabilisation of less profitable activities
Improvement of result

April 19, 2016Kuehne + Nagel Group - First quarter 2016 results p. 14
Overview first quarter results 2016
Appendices
Financial review

Income statement
Gross profit growth in cc2 + 7.7%
EBIT growth in cc + 15.3%
Earnings for the period growth in cc + 11.8%, showing high operating leverage
1 Foreign currency translation impact 2 cc (constant currencies)
Negative foreign currency translation impact of 1.3% on the earnings for the period
April 19, 2016Kuehne + Nagel Group - First quarter 2016 results p. 15
Q1 2016/2015 Q1 2016/2015 Growth Acquisition Forex1
Net turnover 4'096 16'731 4'010 (86) (2.1%) (2.7%) 2.2% (1.6%)
Gross profit 1'497 6'251 1'593 96 6.4% 6.6% 1.1% (1.3%)
Gross profit margin 36.5% 37.4% 39.7%
EBITDA 233 1'041 259 26 11.2% 8.7% 2.1% 0.4%
EBITDA margin 5.7% 6.2% 6.5%
EBIT 190 850 217 27 14.2% 14.2% 1.1% (1.1%)
EBIT margin 4.6% 5.1% 5.4%
EBT 196 878 220 24 12.2% 11.7% 1.5% (1.0%)
EBT margin 4.8% 5.2% 5.5%
Earnings for the period 153 679 169 16 10.5% 11.1% 0.7% (1.3%)
Variance in %Variance2016Q1
CHF million 2015Q1
YTD Dec 2015
Income Statement (average rates)Euro 1.0859 1.0910 0.5%
US Dollar 0.9502 0.9922 4.4% (1.3%)
British Pound 1.4498 1.4218 (1.9%)
Variance %Mar 2016Mar 2015Impact on
earnings for the year in %

Financial overview Q1 Financial targets 2016
WorkingCapital
Cash
Tax
Safeguarding a high cash position
Effective tax rate of approx. 23%
CAPEX 2016: CHF 215 million (2015: CHF 253 million)
Group EBIT margin to net turnover > 5%
Target to maintain working capital intensity at 3.5 to 4.0%
Profitability
April 19, 2016Kuehne + Nagel Group - First quarter 2016 results p. 16
CHF million 2015 2016
Net turnover 4,096 4,010
Gross profit 1,497 1,593
EBITDA 233 259
EBIT 190 217
EBIT margin to net turnover 4.6% 5.4%
Net earnings for the period 152 168
EPS (basic) in CHF 1.27 1.41
Total assets 6,317 6,330
Equity 2,414 2,268
Equity % of total assets 38.2% 35.8%
Cash and cash equivalents, net 1,238 912
Operational cash flow 236 256
Capex 44 42

Financial review - Balance sheet
April 19, 2016Kuehne + Nagel Group - First quarter 2016 results p. 17
CHF million31 December
201531 March
201631 December
201531 March
2016
Assets Liabilities and equity
Property, plant and equipment 1'142 1'142
Goodwill 767 759
Other intangibles 98 92 Non-controlling interests 5 6
Others 224 229 Total equity 2'126 2'268
Non-current assets 2'231 2'222 Non-current liabilities 601 628
Trade payables 1'449 1'357
Trade receivables 2'486 2'458 Accrued trade expenses/deferred income 919 951
Cash and cash equivalents 841 914 Bank and other interest-bearing liabilities 7 6
Others 541 736 Others 997 1'120
Current assets 3'868 4'108 Current liabilities 3'372 3'434
Total assets 6'099 6'330 Total liabilities and equity 6'099 6'330
Equity attributable to the equity holders of the parent company 2'121 2'262
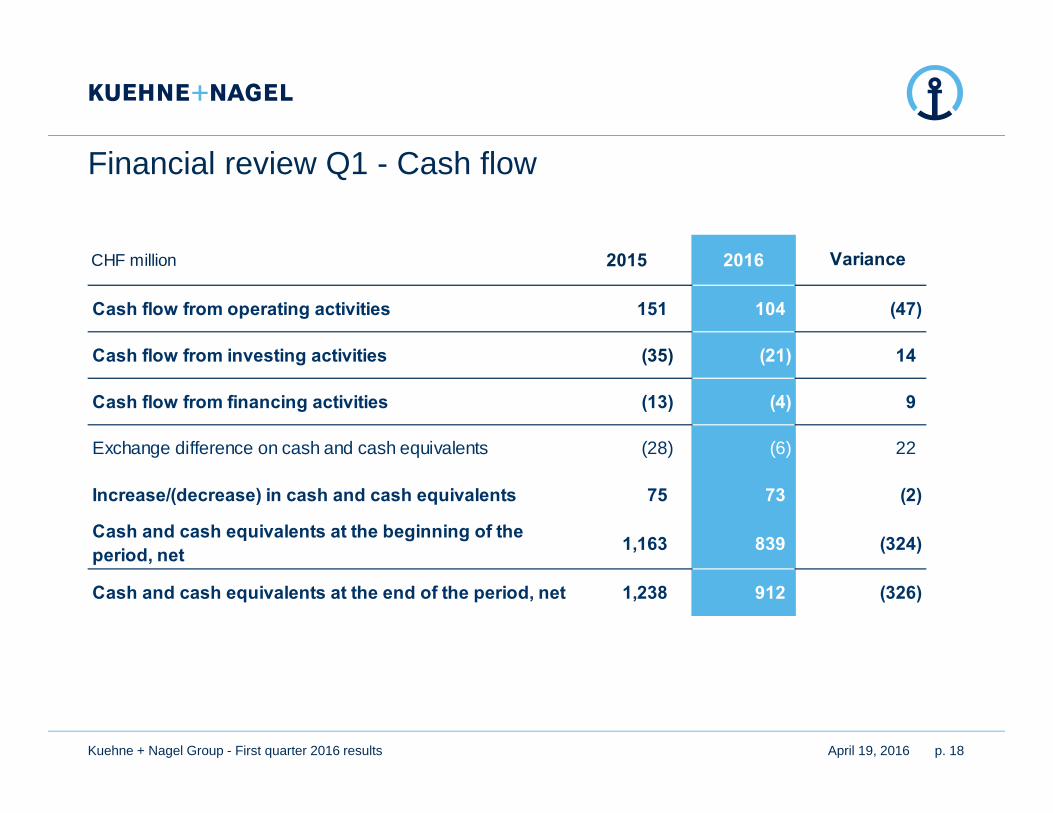
Financial review Q1 - Cash flow
April 19, 2016Kuehne + Nagel Group - First quarter 2016 results p. 18
CHF million 2015 2016
Cash flow from operating activities 151 104 (47)
Cash flow from investing activities (35) (21) 14
Cash flow from financing activities (13) (4) 9
Exchange difference on cash and cash equivalents (28) (6) 22
Increase/(decrease) in cash and cash equivalents 75 73 (2)
Cash and cash equivalents at the beginning of the period, net 1,163 839 (324)
Cash and cash equivalents at the end of the period, net 1,238 912 (326)
Variance
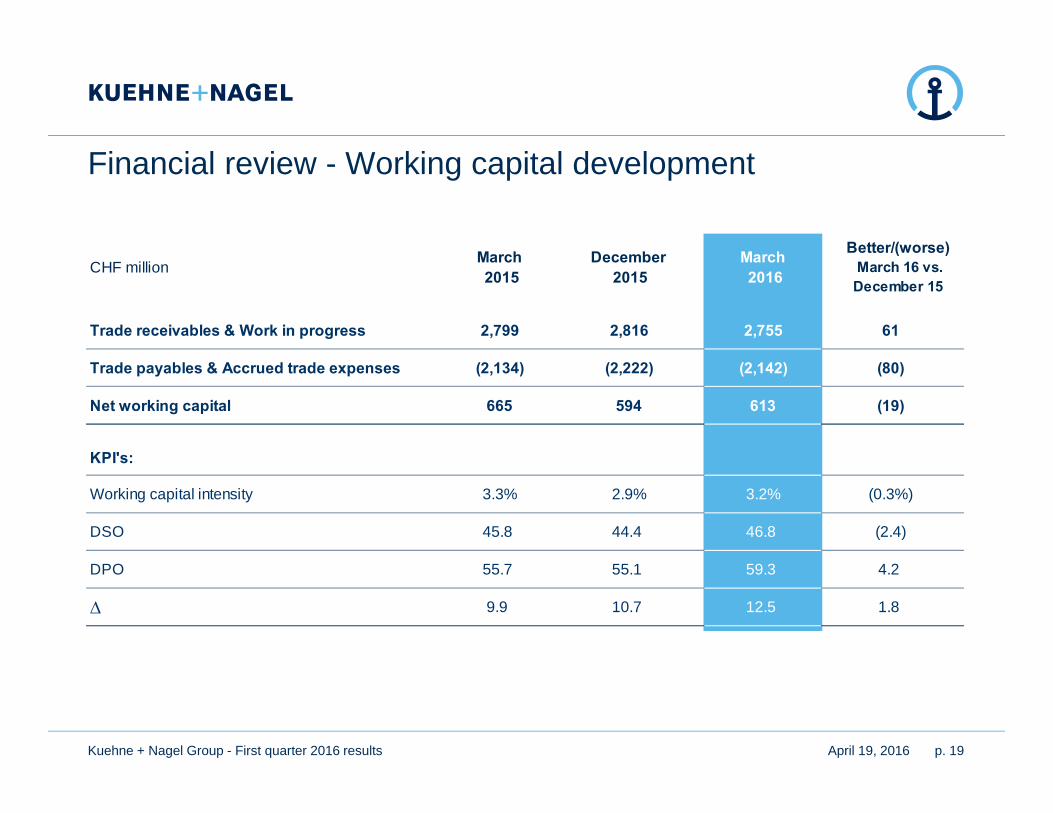
Financial review - Working capital development
April 19, 2016Kuehne + Nagel Group - First quarter 2016 results p. 19
CHF million March 2015
December 2015
March 2016
Trade receivables & Work in progress 2,799 2,816 2,755 61
Trade payables & Accrued trade expenses (2,134) (2,222) (2,142) (80)
Net working capital 665 594 613 (19)
KPI's:
Working capital intensity 3.3% 2.9% 3.2% (0.3%)
DSO 45.8 44.4 46.8 (2.4)
DPO 55.7 55.1 59.3 4.2
∆ 9.9 10.7 12.5 1.8
Better/(worse) March 16 vs. December 15

48%49%
51%
53%
55% 56%
58%
60%
64%
69% 70% 70% 69%
40%
42%
44%
46%
48%
50%
52%
54%
56%
58%
60%
62%
64%
66%
68%
70%
72%
Q1/2013 Q2/2013 Q3/2013 Q4/2013 Q1/2014 Q2/2014 Q3/2014 Q4/2014 Q1/2015 Q2/2015 Q3/2015 Q4/2015 Q1/2016
Return on capital employed
* Rolling EBIT excluding antitrust fine in Q4 2015
Calculation: Last four quarters EBIT (rolling EBIT) divided by the average of the last four quarters capital employed (rolling capital employed)
*
April 19, 2016Kuehne + Nagel Group - First quarter 2016 results p. 20
April 19, 2016Kuehne + Nagel Group - First quarter 2016 results p. 21
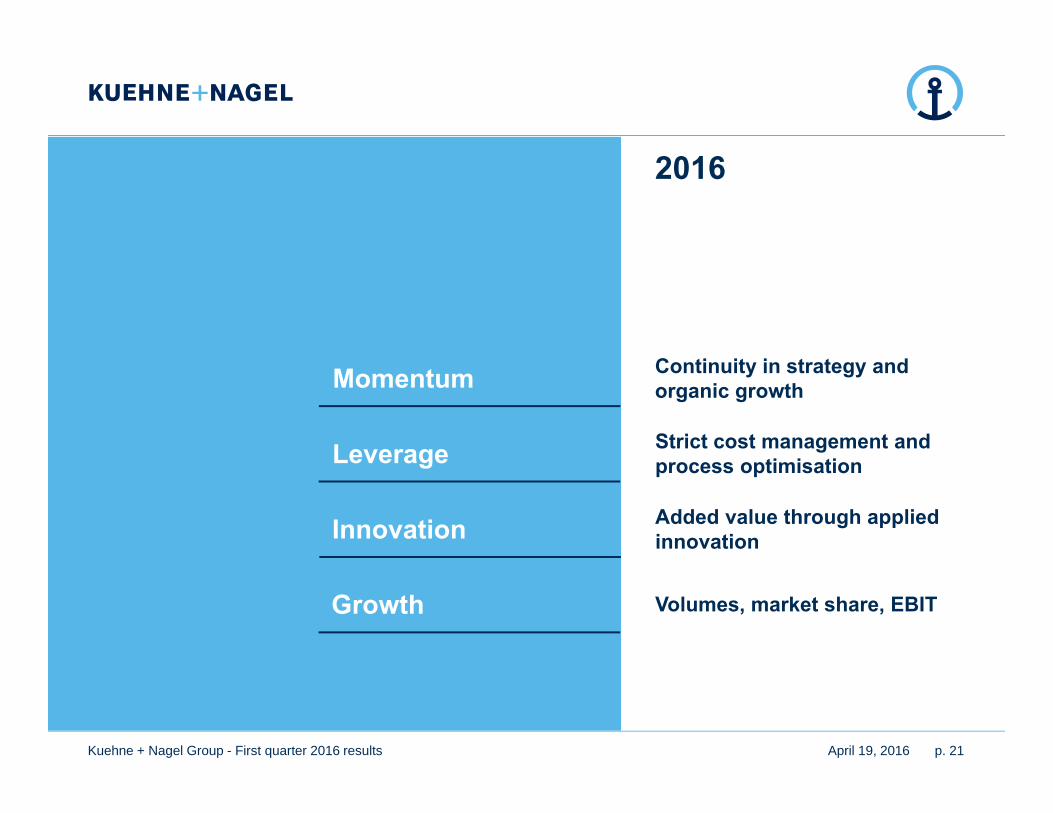
2016
Leverage
Innovation Added value through applied innovation
Continuity in strategy and organic growth
Strict cost management andprocess optimisation
Momentum
Growth Volumes, market share, EBIT


Upcoming events
April 19, 2016Kuehne + Nagel Group - First quarter 2016 results p. 23
Annual General MeetingMay 3, 2016
Dividend payment for 2015May 9, 2016
Half-year 2016 resultsJuly 19, 2016
October 18, 2016 Nine-months 2016 results
March 1, 2017 Full year 2016 results

Quarter over quarter 2016/2015
April 19, 2016Kuehne + Nagel Group - First quarter 2016 results p. 24
CHF millionQ1 Q1 Q1 Q1
1. SeafreightA) Income Statement
Turnover 1'972 2'244 (12.1) (272)Net Turnover 1'430 1'639 (12.8) (209)Gross Profit 348 324 +7.4 24Opex (236) (222) (6.3) (14)EBITDA 112 102 +9.8 10Depreciation and Amortisation (5) (8) +37.5 3EBIT 107 94 +13.8 13
B) KPIEBIT / GP conversion ratio 30.7% 29.0%Volume (TEU's '000) 943 890 +6.0 53GROSS PROFIT 369 364 +1.4 5EXPENSES CHF per TEU (256) (258) +0.8 2EBIT 113 106 +6.6 7
2. AirfreightA) Income Statement
Turnover 944 999 (5.5) (55)Net turnover 805 855 (5.8) (50)Gross Profit 235 221 +6.3 14Opex (158) (149) (6.0) (9)EBITDA 77 72 +6.9 5Depreciation and Amortisation (4) (4) 0.0 0EBIT 73 68 +7.4 5
B) KPIEBIT / GP conversion ratio 31.1% 30.8%Volume (TON's '000) 303 304 (0.3) (1)GROSS PROFIT 78 73 +6.8 5EXPENSES CHF per 100kg (53) (50) (6.0) (3)EBIT 25 23 +8.7 2
2016 20152016/2015
Change in %
2016/2015 Change in
mCHF

Quarter over quarter 2016/2015
April 19, 2016Kuehne + Nagel Group - First quarter 2016 results p. 25
CHF millionQ1 Q1 Q1 Q1
3. OverlandA) Income Statement
Turnover 749 644 +16.3 105Net Turnover 695 587 +18.4 108Gross Profit 220 200 +10.0 20Opex (205) (188) (9.0) (17)EBITDA 15 12 +25.0 3Depreciation and Amortisation (11) (8) (37.5) (3)EBIT 4 4 0.0 0
B) KPIEBITDA / Net turnover 2.2% 2.0%EBIT / Net turnover 0.6% 0.7%
4. Contract LogisticsA) Income Statement
Turnover 1'200 1'101 +9.0 99Net turnover 1'080 1'015 +6.4 65Gross Profit 790 752 +5.1 38Opex (735) (705) (4.3) (30)EBITDA 55 47 +17.0 8Depreciation and Amortisation (22) (23) +4.3 1EBIT 33 24 +37.5 9
B) KPIEBITDA / Net turnover 5.1% 4.6%EBIT / Net turnover 3.1% 2.4%
2016 2015 2016/2015 Change in %
2016/2015 Change in
mCHF

Quarter over quarter 2016/2015
April 19, 2016Kuehne + Nagel Group - First quarter 2016 results p. 26
CHF millionQ1 Q1 Q1 Q1
5. Kuehne + Nagel GroupA) Income Statement
Turnover 4'865 4'988 (2.5) (123)Customs duties and taxes (855) (892) +4.1 37Net Turnover 4'010 4'096 (2.1) (86)Net expenses for services from third parties (2'417) (2'599) +7.0 182Gross Profit 1'593 1'497 +6.4 96Opex (1'334) (1'264) (5.5) (70)EBITDA 259 233 +11.2 26Depreciation and Amortisation (42) (43) +2.3 1EBIT 217 190 +14.2 27Result from finance and associates 3 6 (50.0) (3)EBT 220 196 +12.2 24Income tax (51) (43) (18.6) (8)Earnings for the period 169 153 +10.5 16Non-controlling interests (1) (1) 0.0 0Net Earnings 168 152 +10.5 16
B) KPIGP / Net turnover 39.7% 36.5%EBITDA / Net turnover 6.5% 5.7%EBIT / Net turnover 5.4% 4.6%EBT / Net turnover 5.5% 4.8%Earnings for the period / Net turnover 4.2% 3.7%
2016 2015 2016/2015 Change in %
2016/2015 Change in
mCHF

p. 27April 19, 2016Kuehne + Nagel Group - First quarter 2016 results
ContactMarkus Blanka-Graff Andrea KobiCFO Investor [email protected] [email protected]: +41 (0)44 7869 644 Tel: +41 (0)44 7869 561
DisclaimerInvesting in the shares of Kuehne + Nagel International AG involves risks.Prospective investors are strongly requested to consult their investment advisors and taxadvisors prior to investing in shares of Kuehne + Nagel International AG.This document contains forward-looking statements which involve risks and uncertainties. Thesestatements may be identified by such words as “may”, “plans”, “expects”, “believes” and similarexpressions, or by their context. These statements are made on the basis of current knowledgeand assumptions. Various factors could cause actual future results, performance or events todiffer materially from those described in these statements. No obligation is assumed to updateany forward-looking statements. Potential risks and uncertainties include such factors as generaleconomic conditions, foreign exchange fluctuations, competitive product and pricing pressuresand regulatory developments.The information contained in this document has not been independently verified and norepresentation or warranty, express or implied, is made to, and no reliance should be placed on,the fairness, accuracy, completeness or correctness of the information or opinions containedherein. The information in this presentation is subject to change without notice, it may beincomplete or condensed, and it may not contain all material information concerning the Kuehne+ Nagel Group. None of Kuehne + Nagel International AG or their respective affiliates shall haveany liability whatsoever for any loss whatsoever arising from any use of this document, orotherwise arising in connection with this document.This presentation is not an offer of securities for sale in the United States. The offer and sale ofKuehne + Nagel International AG securities has not been, and will not be registered under theUnited States Securities Act of 1933, as amended. Kuehne + Nagel International AG securitiesmay not be offered or sold to anyone in the United States absent such registration, exceptpursuant to an appropriate exemption from registration. There will be no public offering ofKuehne + Nagel International AG securities in the United States.