appendix - b 2008 geophysical survey...
TRANSCRIPT

APPENDIX - B
2008 Geophysical Survey Report
1051 Columbia Avenue ● Lancaster, PA 17603 ● 717.396.8922 ● Fax 717.396.8746 ● [email protected] ● www.enviroscan.com
Final Report Geophysical Survey
Landfill Detection/Delineation 50 Acres Adjacent to Taxiway Tango
Martin State Airport Middle River, MD
Enviroscan Project Number 090710
Prepared For: Tetra Tech NUS, Inc. Prepared By: Enviroscan, Inc.
February 13, 2008
1051 Columbia Avenue ● Lancaster, PA 17603 ● 717.396.8922 ● Fax 717.396.8746 ● [email protected] ● www.enviroscan.com
February 13, 2008
Mr. Anthony Apanavage Tetra Tech NUS, Inc. 20251 Century Boulevard Suite 200 Germantown, MD 20874-7114
RE: Geophysical Survey Landfill Detection/Delineation 50 Acres Adjacent to Taxiway Tango Martin State Airport Middle River, MD Enviroscan Project Number 090710
Dear Mr. Apanavage: Pursuant to our proposal dated September 12, 2007, Enviroscan, Inc. (Enviroscan) has
completed a geophysical survey of the above-referenced site. The survey consisted of a reconnaissance-level electromagnetic (EM) survey and follow-up surficial gamma mapping survey. The methods and results of the survey are described below.
Survey Purpose and Site Description The primary purpose of the survey was to detect and delineate the horizontal boundaries
of reported landfill areas using electromagnetics (EM) beneath an area adjacent to Taxiway Tango at Martin State Airport, Middle River, Maryland. A follow-up surficial gamma survey was performed to further characterize suspected landfill areas for the possible presence of radioactive material.
The Taxiway Tango survey area surface conditions consisted mainly of low-cut grass
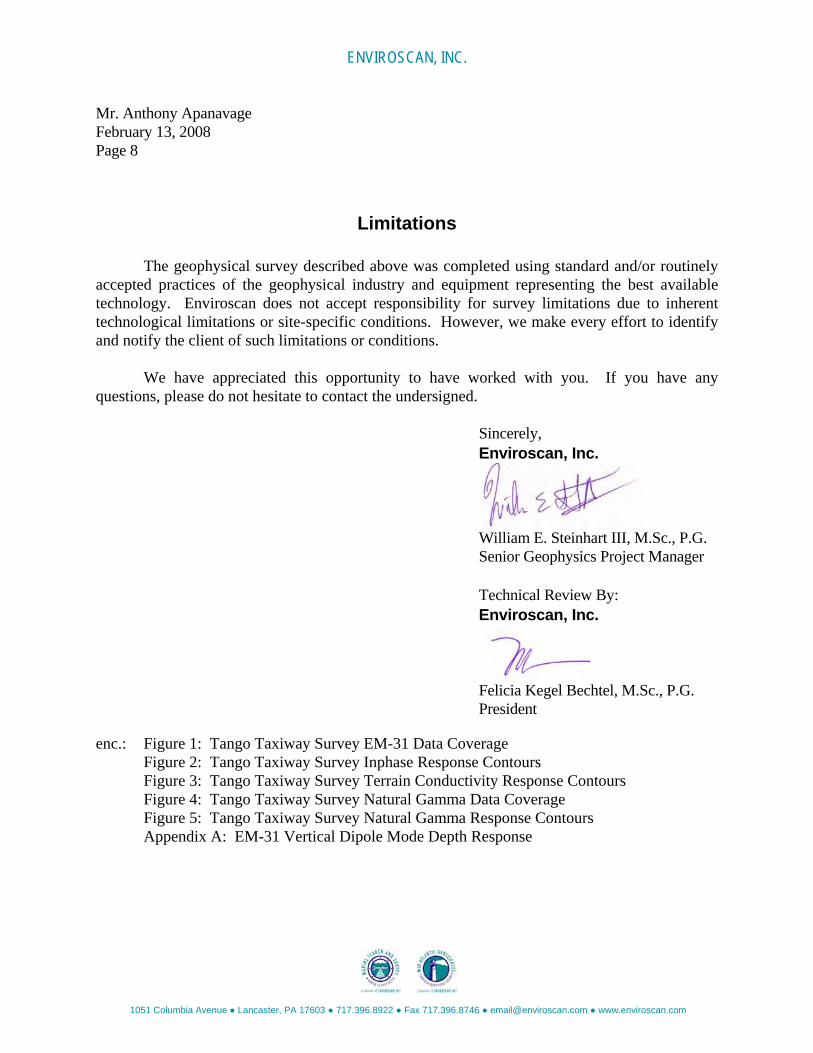
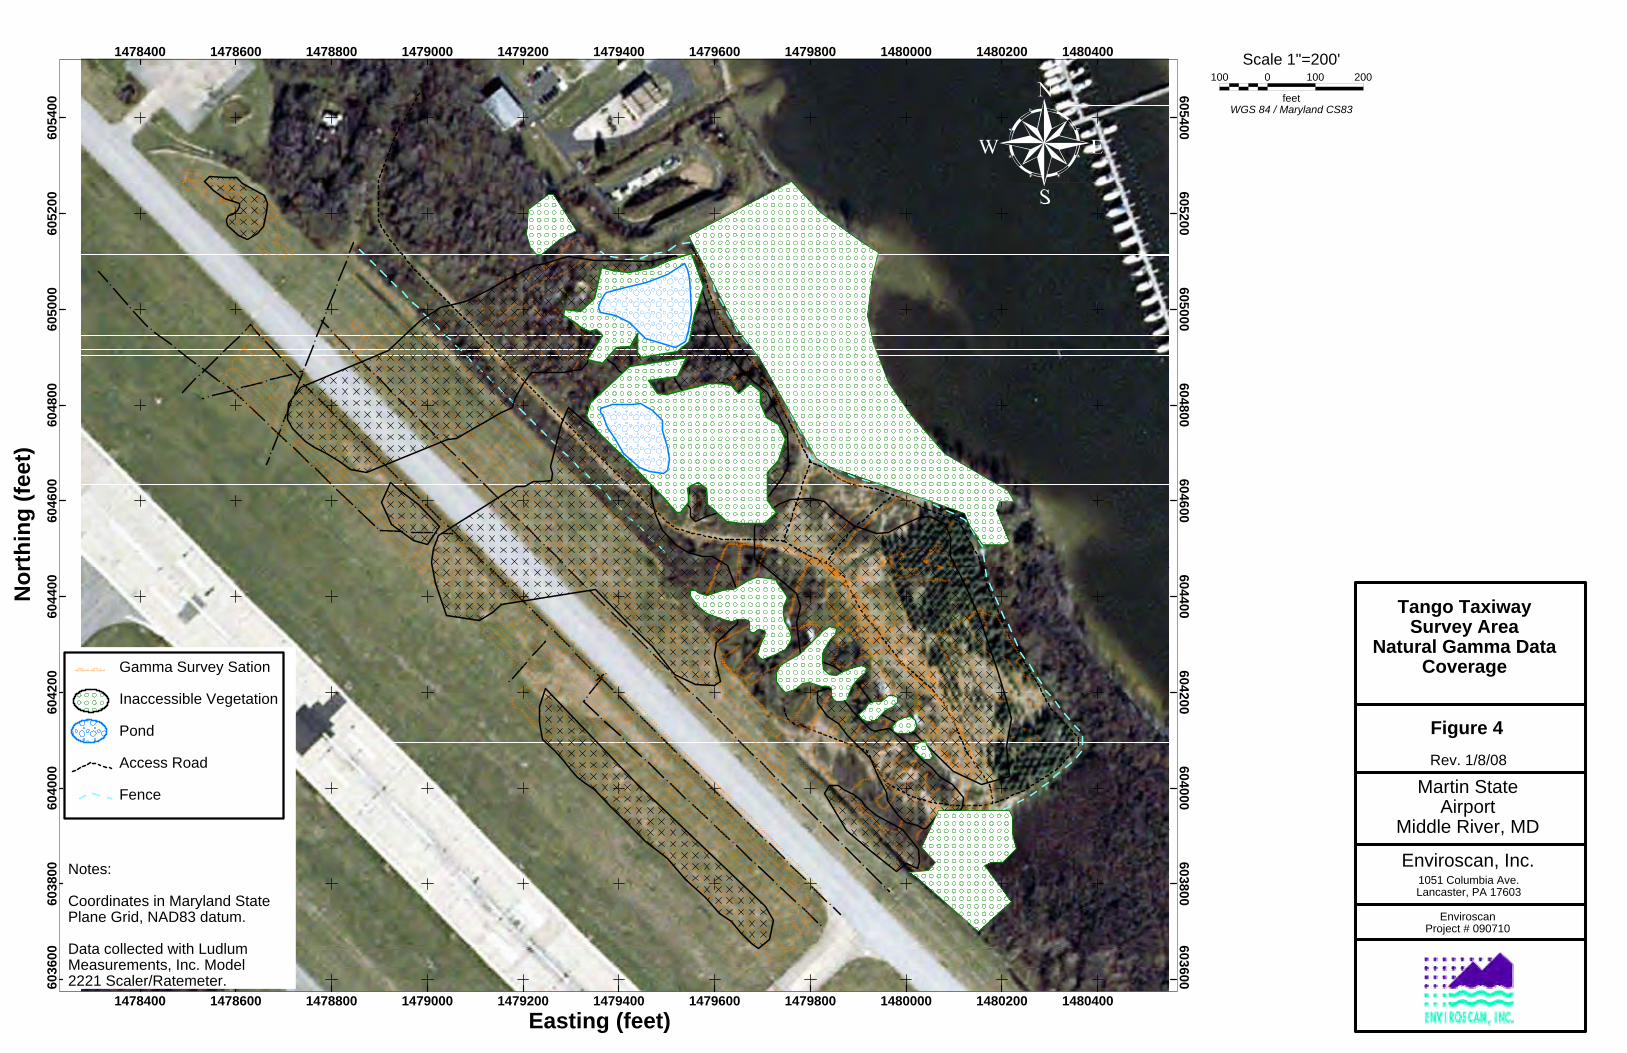
near the taxiway, variable-sized patches of phragmites, scrub brush, and moderately wooded sections. Following a site walk by Enviroscan (October 29, 2007), the client cut lanes through the thickest underbrush on roughly 25-foot centers. Figures 1 and 4 show the data coverage of EM and Gamma surveys of the Taxiway Tango survey area, respectively. Inaccessible areas are noted with a green-circle hatched pattern.

ENVIROSCAN, INC.
Mr. Anthony Apanavage February 13, 2008 Page 2
1051 Columbia Avenue ● Lancaster, PA 17603 ● 717.396.8922 ● Fax 717.396.8746 ● [email protected] ● www.enviroscan.com
The survey consisted of two techniques. The first involved a reconnaissance-level EM survey to detect and delineate the horizontal boundaries of the reported landfill areas and possible buried debris. The second consisted of a surficial gamma detection survey coincident with any anomalous areas identified during the EM survey.
Survey Methods
EM Enviroscan performed EM mapping of the site using a Geonics EM-31 instrument. The
EM-31 was selected since (as described below) it is sensitive to buried metal, but is also sensitive to minor changes in the electrical conductivity of subsurface materials in the absence of metal (i.e. due to non-metallic debris and/or anomalous ionic content of any soil moisture).
The EM-31 employs an electromagnetic transmitter coil to induce an electric current in
the earth. This current creates a secondary electromagnetic field that is measured by a receiver coil at a fixed separation of 3.7 meters from the transmitter coil. The secondary electromagnetic field has two components: the quadrature component, which is proportional to the bulk electrical conductivity or terrain conductivity (in millimhos per meter or mmho/m) of the subsurface materials, and the inphase component (in parts per thousand or ppt), which is primarily a measure of the relative concentration of metallic material in the subsurface. Note that in the presence of extremely high terrain conductivity material, the dynamic range of the EM-31 can be exceeded (or “saturated”), and the instrument will register spurious negative conductivities (a physical impossibility). These negative conductivities therefore actually represent very high positive conductivities. Similar saturation in the presence of significant metal can cause a spurious negative inphase response that should also be interpreted as a very high positive value.
ENVIROSCAN, INC.
Mr. Anthony Apanavage February 13, 2008 Page 3
1051 Columbia Avenue ● Lancaster, PA 17603 ● 717.396.8922 ● Fax 717.396.8746 ● [email protected] ● www.enviroscan.com
For this survey, Enviroscan employed an EM-31 in vertical dipole mode. The effective survey depth of the EM-31 is depicted in Appendix A. The instrument is almost completely insensitive to material at the ground surface, and has a peak sensitivity to material at a depth of approximately five feet (see incremental sensitivity curve in Appendix A). Below five feet, the sensitivity diminishes approximately logarithmically. The cumulative effect of this varying sensitivity is also depicted in Appendix A. As the cumulative sensitivity curve shows, approximately 80 percent of the signal originates at depths less than 25 feet. Therefore, the terrain conductivity or inphase response measured by the EM-31 in vertical dipole mode represents primarily subsurface electrical properties at a depth of five feet (plus or minus), with little contribution from material at the ground surface, and moderate (and diminishing) contribution from materials down to approximately 25 feet. The vertical dipole EM-31 was selected to screen out the potentially time-varying effects of surficial variations in ground cover (noted above), while maintaining a significant effective survey depth.
The EM survey was completed by collecting vertical dipole mode terrain conductivity and inphase data along profiles spaced approximately 20-30 feet apart. Along survey profiles, measurement stations were defined by automatically triggering matching inphase and conductivity readings at half-second intervals as the instrument was hand-carried or vehicle towed.
The actual location of each measurement station was digitally recorded using a
backpack-mounted Topcon Hyperlite RTK global positioning system (GPS) receiver. The EM stations are depicted as tiny yellow crosses in Figure 1. Please note that in the wooded areas the GPS coverage was at times inconsistent, such that full coverage in those areas was not possible.
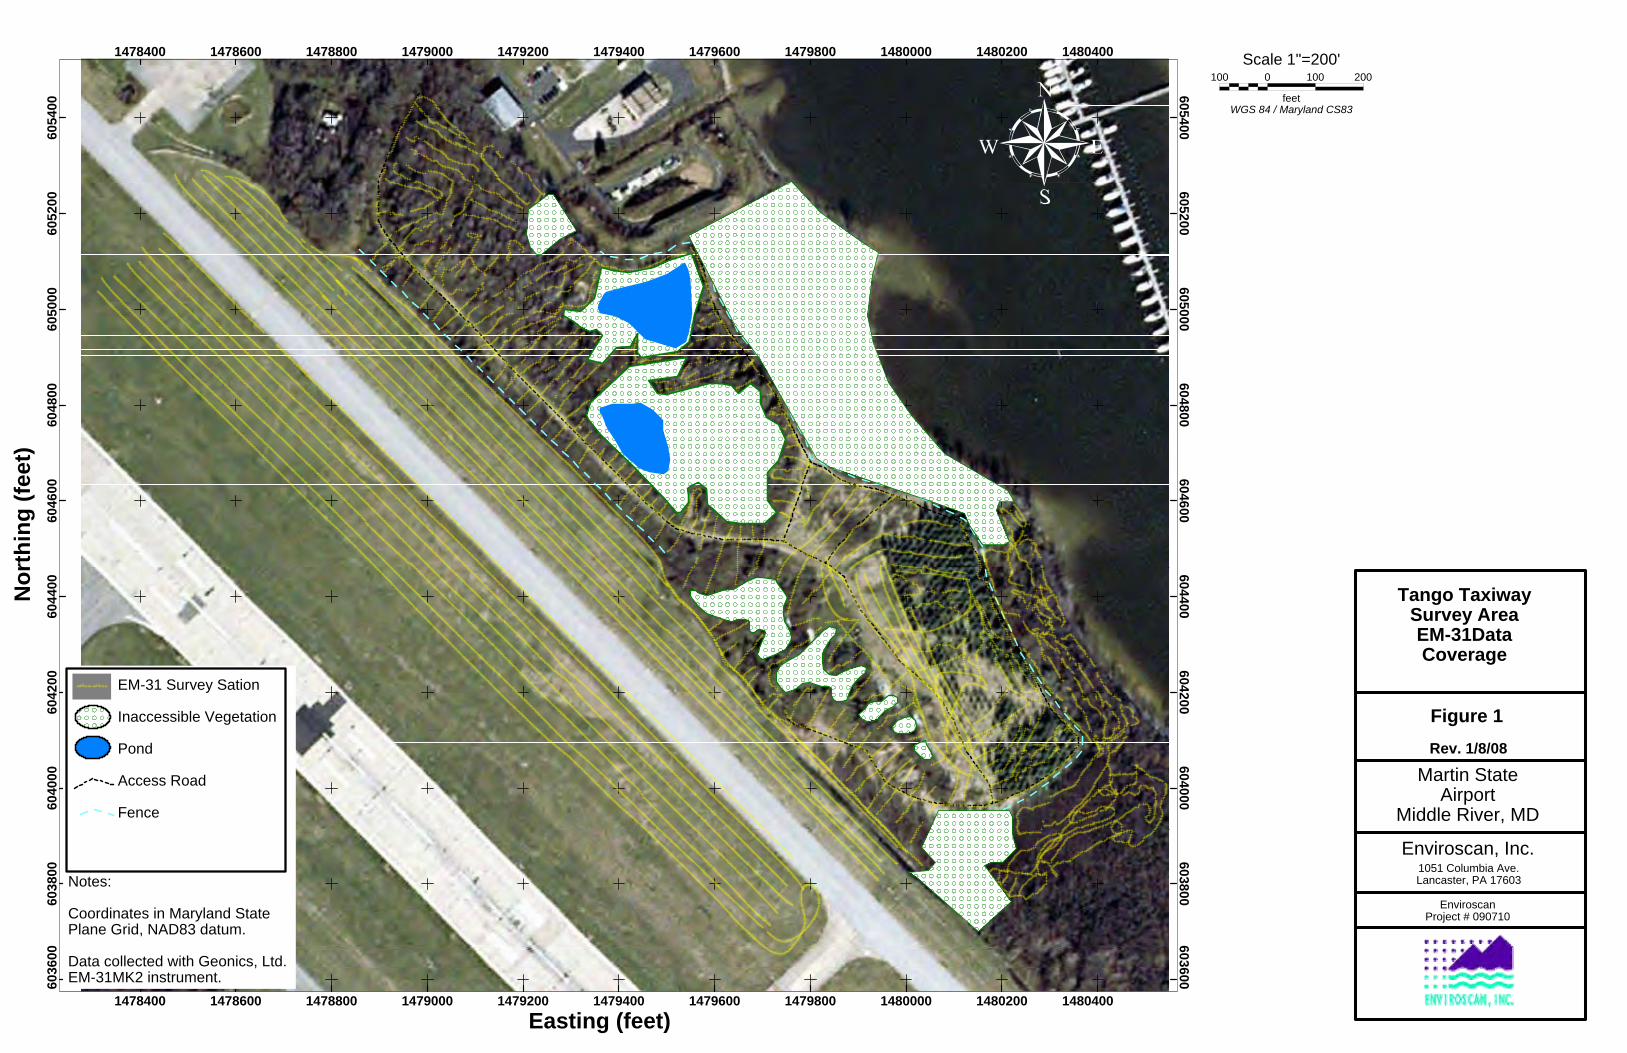
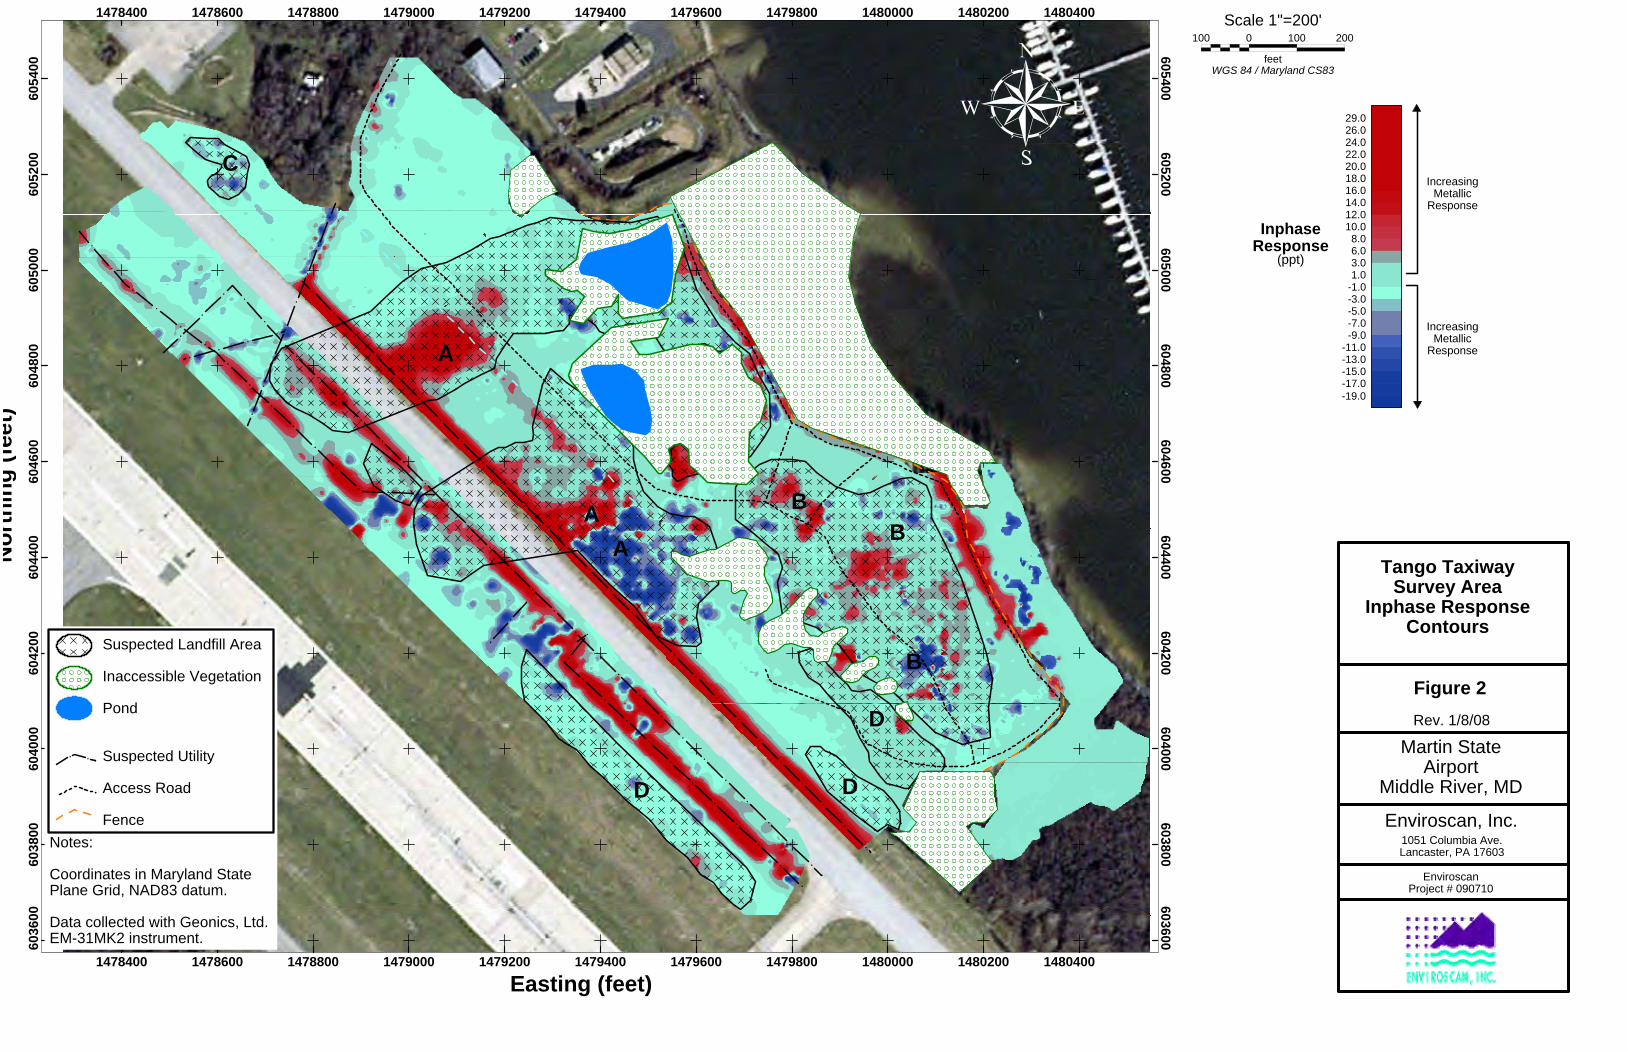
The EM inphase and terrain conductivity data were contoured using minimum curvature gridding routines in Geosoft Oasis Montaj ™. The inphase response and terrain conductivity color contours are depicted in Figures 2 and 3. The inphase contour levels are presented as shades of green to red for increasing positive values and green to blue for increasingly negative values (the equivalent of very high positive values — see above). The conductivity contour levels are presented as shades of green to yellow to red to pink for increasing positive values and green to blue for increasingly negative values (the equivalent of very high positive values — see above).
ENVIROSCAN, INC.
Mr. Anthony Apanavage February 13, 2008 Page 4
1051 Columbia Avenue ● Lancaster, PA 17603 ● 717.396.8922 ● Fax 717.396.8746 ● [email protected] ● www.enviroscan.com
Gamma Surface Survey
Enviroscan also performed surficial gamma mapping of the site using a Ludlum Model 2221 Scaler/Ratemeter combined with a Ludlum Model 44-10 Gamma Scintillater Probe. The 44-10 Probe is a sodium iodide (NaI) gamma scintillator primarily used for detecting high-energy gamma radiation in the range of 60 kiloelectron volts (keV) to 2 megaelectron volts (MeV). The probe consists of a 2”-diameter, 2”-thick NaI crystal coupled to a photomultiplier tube housed in an aluminum canister. The scintillator/photomultiplier sends a constant stream of data to the 2221 instrument. The electronics in the 2221 instrument then display and output the gross count rate in counts per minute at a rate of 1 Hertz (Hz). This is achieved by an on-board multiplication factor of 60 to the data from the scintillator.
For this survey, the 44-10 Probe was carried at a height of 18” above the ground surface
throughout the survey. The constant height above ground is important because the number of gamma rays encountering the scintillator, or gross count, falls off at a rate of 1/h2 where h is height of the sensor above a gamma source; therefore, to compare readings they must be collected at the same height above ground.
The 44-10 Probe was linked to the 2221 Scaler/Ratemeter which output readings at 1 Hz
via a serial connection to a Trimble TSC1 Datalogger. The TSC1 was receiving positioning data at 1 Hz from a Trimble Pro XRS GPS system in contact with 4-8 position-fixing satellites. The outputted gross gamma counts per minute (cpm) were merged with the coincident positional data in real time. The gamma stations are depicted as tiny orange crosses in Figure 4. Please note that in the wooded areas the GPS coverage was at times inconsistent; therefore, full coverage in those areas was not possible.
At the beginning and end of each field day a base station was occupied to ensure that the 2221 Ratemeter\44-10 Probe was working within specifications. During the base station readings the local background gamma counts were noted. The sensor was also tested with a Cesium 137 (137Cs) spike source to insure proper responses. Signal fall-off tests were also performed using a 137C spike source placed in the ground surface. The testing indicated that readings returned to background levels at a distance of 9 feet (horizontally) from the spike source.

ENVIROSCAN, INC.
Mr. Anthony Apanavage February 13, 2008 Page 5
1051 Columbia Avenue ● Lancaster, PA 17603 ● 717.396.8922 ● Fax 717.396.8746 ● [email protected] ● www.enviroscan.com
For this survey, the gamma data were collected mostly within identified anomalous EM areas. The survey line spacing was set to match the EM survey line spacing. In some locations that were open to the sky, and GPS signal was consistent, the traverse spacing was tightened to 10 feet.
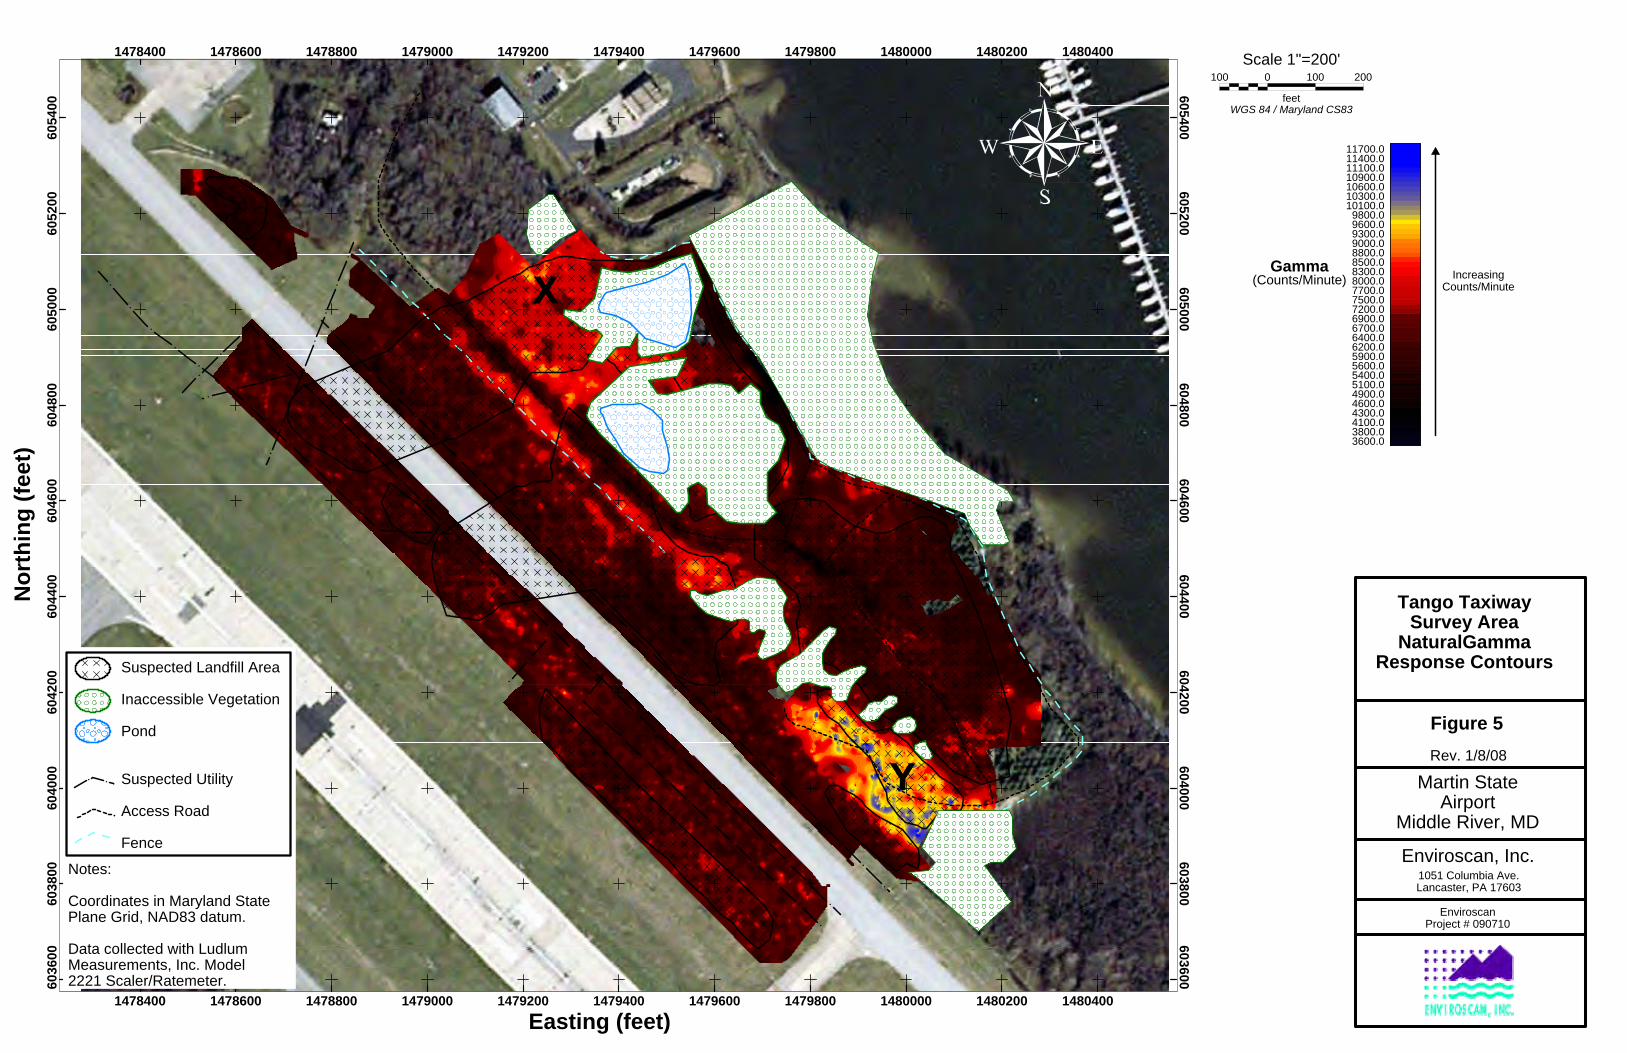
The gamma data were contoured using the minimum curvature gridding routines in Geosoft Oasis Montaj ™. The gamma data contours are depicted in Figure 5. The gamma contour levels are presented as shades of black to red to yellow to blue in increasing counts per minute.
Results
EM
The EM survey results are depicted in Figures 2 and 3, showing the inphase and terrain conductivity results, respectively. The inphase and terrain conductivity data were inspected to identify areas most likely to contain landfill material. The inphase data was examined for large aerially extensive anomalies that fall above 2 ppt and below -2 ppt, indicating the presence of subsurface metal. Two types of aerially extensive inphase anomalies were observed. The first is composed of a single, large anomaly that is most likely caused by high concentrations of subsurface metal throughout the anomalous area, such as the anomaly labeled A on Figure 2. The second is composed of many scattered inphase anomalies that can be grouped within a boundary, such as the anomalies labeled B on Figure 2.
The contoured terrain conductivity data was then examined to identify anomalies
coincident with the types of inphase anomalies described above. In many cases, the coincident terrain conductivity anomalies are larger or more cohesive (not scattered) because terrain conductivity highs result from not only subsurface metal, but any highly conductive material, such as nonmetallic landfill material (see anomalies labeled A1, A2, and B, Figure 3). Therefore, aerially extensive, coincident inphase and terrain conductivity anomalies are most likely related to subsurface landfill material. Small singular, nonlinear, inphase-only anomalies, such as the anomaly labeled C on Figures 2 and 3, may represent only buried metallic material. Terrain conductivity-only anomalies (see anomalies D1, D2, and D3 on Figure 3) may result from areas of naturally high soil conductivity or buried nonmetallic debris. Linear inphase and terrain conductivity anomalies are commonly caused by underground utilities.

ENVIROSCAN, INC.
Mr. Anthony Apanavage February 13, 2008 Page 6
1051 Columbia Avenue ● Lancaster, PA 17603 ● 717.396.8922 ● Fax 717.396.8746 ● [email protected] ● www.enviroscan.com
The EM survey delineated four types of anomalies (noted above) ranging from high to low probability of subsurface landfill material:
Anomalies A1, A2: High Probability Anomaly B: High Probability Anomaly C: Moderate Probability Anomalies D1, D2, and D3: Low Probability
Gamma
The surficial gamma survey results are depicted in Figure 5. The data show an average background reading of 6600 cpm. Two areas show significant positive deviation from that average, labeled X and Y on Figure 5. Although the count rates are not high, these two areas may contain radioactive material. Enviroscan was present when test pits were excavated at the gamma anomaly labeled Y and at a nearby area that showed background gamma levels. The excavation near the high gamma area uncovered only natural soil consisting mainly of saturated clay from a depth of about one foot to the bottom of the excavation at approximately five to six feet. The excavation in the background gamma area showed clay-rich soil from a depth of three feet to the bottom of the pit (five to six feet). Clay minerals which are high in potassium are enriched in radioactive Potassium 40 with respect to non-clay soils or fill material. In this case the clay-rich layer, present across most of the site (information from test pits and borings by the client), appears to be closer to the ground surface at Anomaly Y, thus decreasing the distance between the naturally radioactive clay and the 44-10 Probe and the thickness of the overburden shielding, both of which increase the gross gamma count. An area in which a clay layer, a highly conductive soil, was closer to the ground surface would appear as a D-type terrain conductivity anomaly (described above). Please note that on Figure 3 terrain conductivity Anomaly D3 is coincident with the area of Gamma Anomaly Y. Enviroscan was not present for any excavations near the anomalous area labeled X.
Although these test pits showed a natural source of the elevated gamma readings, further
test pitting should be considered in both these areas (X and Y) to eliminate the possibility of radioactive landfill material.
ENVIROSCAN, INC.
Mr. Anthony Apanavage February 13, 2008 Page 7
1051 Columbia Avenue ● Lancaster, PA 17603 ● 717.396.8922 ● Fax 717.396.8746 ● [email protected] ● www.enviroscan.com
Conclusions and Recommendations The EM inphase and conductivity data show several linear anomalies suspected to be
utilities (see linear anomalies on Figure 2). The survey delineated many areas of coincident elevated inphase and terrain conductivity readings (see black “X”-hatched areas labeled A1, A2, and B, Figures 2 and 3 and discussion above) that indicate the possible location of landfill material. One area of elevated inphase-only readings was identified at the northwestern end of the survey area (see black “X”-hatched area labeled C, Figure 2), which likely results from buried metallic debris. Three areas of terrain conductivity-only anomalies were identified on the southern end of the survey area (see black “X”-hatched areas labeled D1-D3 on Figure 3). Enviroscan recommends sample test pitting at all four types of anomalies (A-D) to ground-truth possible source material for the anomalies.
The surface gamma survey results show two areas (X and Y) of elevated, above
background, gross count gamma readings. The southern area may result from the natural occurrence of near-surface clay material rich in natural, radioactive Potassium 40. Enviroscan was not present for test-pitting in the northern area; however, note that neither Area (X and Y) is highly radioactive.
ENVIROSCAN, INC.
Mr. Anthony Apanavage February 13, 2008 Page 8
1051 Columbia Avenue ● Lancaster, PA 17603 ● 717.396.8922 ● Fax 717.396.8746 ● [email protected] ● www.enviroscan.com
Limitations The geophysical survey described above was completed using standard and/or routinely
accepted practices of the geophysical industry and equipment representing the best available technology. Enviroscan does not accept responsibility for survey limitations due to inherent technological limitations or site-specific conditions. However, we make every effort to identify and notify the client of such limitations or conditions.
We have appreciated this opportunity to have worked with you. If you have any questions, please do not hesitate to contact the undersigned.
Sincerely, Enviroscan, Inc.
William E. Steinhart III, M.Sc., P.G. Senior Geophysics Project Manager
Technical Review By: Enviroscan, Inc.
Felicia Kegel Bechtel, M.Sc., P.G. President
enc.: Figure 1: Tango Taxiway Survey EM-31 Data Coverage
Figure 2: Tango Taxiway Survey Inphase Response Contours Figure 3: Tango Taxiway Survey Terrain Conductivity Response Contours Figure 4: Tango Taxiway Survey Natural Gamma Data Coverage Figure 5: Tango Taxiway Survey Natural Gamma Response Contours Appendix A: EM-31 Vertical Dipole Mode Depth Response
6036
0060
3800
6040
0060
4200
6044
0060
4600
6048
0060
5000
6052
0060
5400
603600603800
604000604200
604400604600
604800605000
605200605400
1478400 1478600 1478800 1479000 1479200 1479400 1479600 1479800 1480000 1480200 1480400
1478400 1478600 1478800 1479000 1479200 1479400 1479600 1479800 1480000 1480200 1480400
Easting (feet)
Nor
thin
g (fe
et)
WGS 84 / Maryland CS83feet
100 0 100 200Scale 1"=200'
Tango TaxiwaySurvey AreaEM-31DataCoverage
Martin StateAirport
Middle River, MD
Figure 1Rev. 1/8/08
Enviroscan, Inc.1051 Columbia Ave.Lancaster, PA 17603
EnviroscanProject # 090710
EM-31 Survey Sation
Inaccessible Vegetation
Pond
Access Road
Fence
Notes:
Coordinates in Maryland StatePlane Grid, NAD83 datum.
Data collected with Geonics, Ltd.EM-31MK2 instrument.
6036
0060
3800
6040
0060
4200
6044
0060
4600
6048
0060
5000
6052
0060
5400
603600603800
604000604200
604400604600
604800605000
605200605400
1478400 1478600 1478800 1479000 1479200 1479400 1479600 1479800 1480000 1480200 1480400
1478400 1478600 1478800 1479000 1479200 1479400 1479600 1479800 1480000 1480200 1480400
Easting (feet)
Nor
thin
g (fe
et)
A
AA
BB
B
C
D D
D
WGS 84 / Maryland CS83feet
100 0 100 200Scale 1"=200'
Tango TaxiwaySurvey Area
Inphase ResponseContours
Martin StateAirport
Middle River, MD
Figure 2Rev. 1/8/08
Enviroscan, Inc.1051 Columbia Ave.Lancaster, PA 17603
EnviroscanProject # 090710
-19.0-17.0-15.0-13.0-11.0
-9.0-7.0-5.0-3.0-1.01.03.06.08.0
10.012.014.016.018.020.022.024.026.029.0
InphaseResponse
(ppt)
IncreasingMetallic
Response
IncreasingMetallic
Response
Suspected Landfill Area
Inaccessible Vegetation
Pond
Suspected Utility
Access Road
FenceNotes:
Coordinates in Maryland StatePlane Grid, NAD83 datum.
Data collected with Geonics, Ltd.EM-31MK2 instrument.
6036
0060
3800
6040
0060
4200
6044
0060
4600
6048
0060
5000
6052
0060
5400
603600603800
604000604200
604400604600
604800605000
605200605400
1478400 1478600 1478800 1479000 1479200 1479400 1479600 1479800 1480000 1480200 1480400
1478400 1478600 1478800 1479000 1479200 1479400 1479600 1479800 1480000 1480200 1480400
Easting (feet)
Nor
thin
g (fe
et)
A1
A2
A2
BB
B
C
D1 D2
D3
A2
A1
A1
WGS 84 / Maryland CS83feet
100 0 100 200Scale 1"=200'
Tango TaxiwaySurvey Area
Terrain ConductivityResponse Contours
Martin StateAirport
Middle River, MD
Figure 3Rev. 1/8/08
Enviroscan, Inc.1051 Columbia Ave.Lancaster, PA 17603
EnviroscanProject # 090710
-207.0-193.0-179.0-165.0-151.0-137.0-123.0-109.0-95.0-81.0-67.0-53.0-39.0-25.0-11.0
3.017.031.045.059.073.087.0
101.0115.0129.0143.0157.0171.0185.0199.0213.0
TerrainConductivity
Response(mmho/m)
IncreasingMetallic
Response
IncreasingMetallic
Response
"Normal" Soil
Notes:
Coordinates in Maryland StatePlane Grid, NAD83 datum.
Data collected with Geonics, Ltd.EM-31MK2 instrument.
Suspected Landfill Area
Inaccessible Vegetation
Pond
Suspected Utility
Access Road
Fence
6036
0060
3800
6040
0060
4200
6044
0060
4600
6048
0060
5000
6052
0060
5400
603600603800
604000604200
604400604600
604800605000
605200605400
1478400 1478600 1478800 1479000 1479200 1479400 1479600 1479800 1480000 1480200 1480400
1478400 1478600 1478800 1479000 1479200 1479400 1479600 1479800 1480000 1480200 1480400
Easting (feet)
Nor
thin
g (fe
et)
WGS 84 / Maryland CS83feet
100 0 100 200Scale 1"=200'
Notes:
Coordinates in Maryland StatePlane Grid, NAD83 datum.
Data collected with LudlumMeasurements, Inc. Model2221 Scaler/Ratemeter.
Tango TaxiwaySurvey Area
Natural Gamma DataCoverage
Martin StateAirport
Middle River, MD
Figure 4Rev. 1/8/08
Enviroscan, Inc.1051 Columbia Ave.Lancaster, PA 17603
EnviroscanProject # 090710
Gamma Survey Sation
Inaccessible Vegetation
Pond
Access Road
Fence
6036
0060
3800
6040
0060
4200
6044
0060
4600
6048
0060
5000
6052
0060
5400
603600603800
604000604200
604400604600
604800605000
605200605400
1478400 1478600 1478800 1479000 1479200 1479400 1479600 1479800 1480000 1480200 1480400
1478400 1478600 1478800 1479000 1479200 1479400 1479600 1479800 1480000 1480200 1480400
Easting (feet)
Nor
thin
g (fe
et)
WGS 84 / Maryland CS83feet
100 0 100 200Scale 1"=200'
Tango TaxiwaySurvey Area
NaturalGammaResponse Contours
Martin StateAirport
Middle River, MD
Figure 5Rev. 1/8/08
Enviroscan, Inc.1051 Columbia Ave.Lancaster, PA 17603
EnviroscanProject # 090710
3600.03800.04100.04300.04600.04900.05100.05400.05600.05900.06200.06400.06700.06900.07200.07500.07700.08000.08300.08500.08800.09000.09300.09600.09800.0
10100.010300.010600.010900.011100.011400.011700.0
Gamma(Counts/Minute) Increasing
Counts/Minute
Notes:
Coordinates in Maryland StatePlane Grid, NAD83 datum.
Data collected with LudlumMeasurements, Inc. Model2221 Scaler/Ratemeter.
Suspected Landfill Area
Inaccessible Vegetation
Pond
Suspected Utility
Access Road
Fence

ENVIROSCAN, INC.
1051 Columbia Avenue●Lancaster, Pennsylvania●717/396 8922●Fax 717/396 8746●[email protected]●www.enviroscan.com
Appendix A
EM-31 Vertical Dipole Mode Depth Response
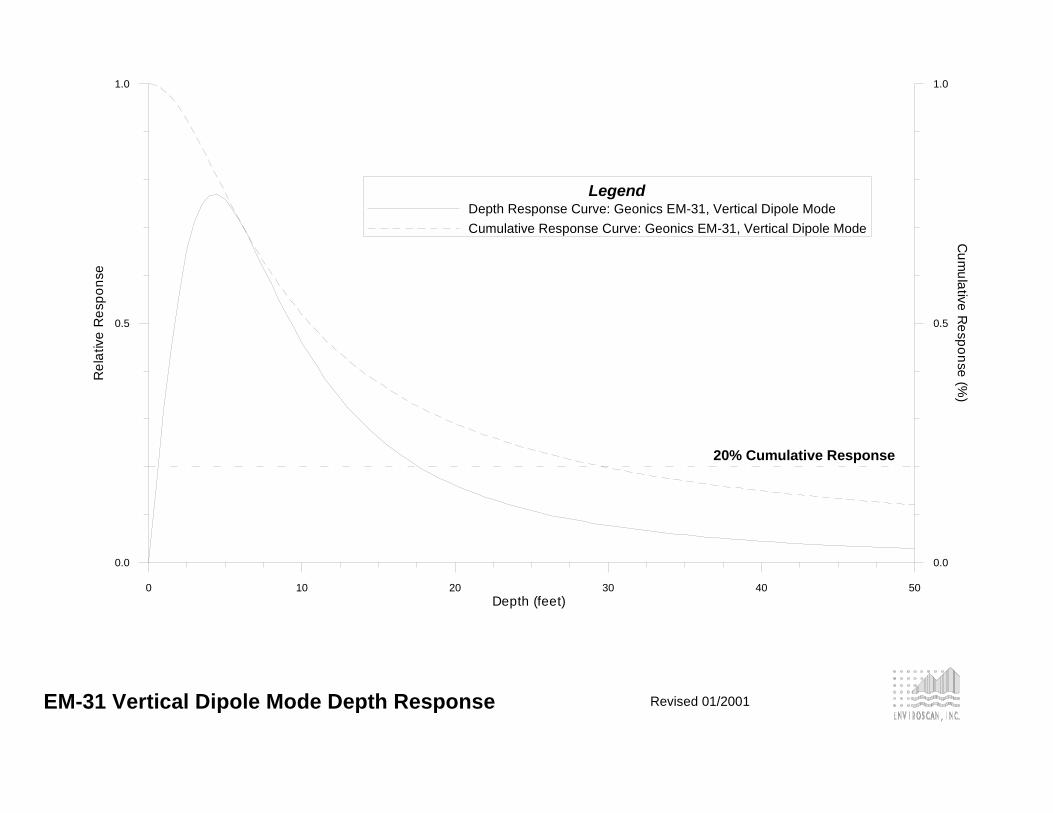
EM-31 Vertical Dipole Mode Depth Response
0 10 20 30 40 50
Depth (feet)
0.0
0.5
1.0
Re
lativ
e R
esp
on
se
LegendDepth Response Curve: Geonics EM-31, Vertical Dipole Mode
Cumulative Response Curve: Geonics EM-31, Vertical Dipole Mode
20% Cumulative Response
0.0
0.5
1.0C
um
ula
tive
Re
sp
on
se (%
)
Revised 01/2001