asia economic monitor - asia regional integration...
TRANSCRIPT

december 2011
Asia Economic Monitor


December 2011
Asia Economic Monitor

© 2011 Asian Development Bank
All rights reserved. Published 2011. Printed in the Philippines.
Printed on recycled paper.
Cataloging-In-Publication Data
ISBN 978-92-9092-509-5Publication Stock No. RPS114204
Asia Economic Monitor—December 2011Mandaluyong City, Philippines: Asian Development Bank, 2011.
1. Regionalism 2. Subregional cooperation 3. Economic development 4. AsiaI. Asian Development Bank.
The views expressed in this publication are those of the authors and do not necessarily reflect the views and policies of the Asian Development Bank (ADB) or its Board of Governors or the governments they represent. ADB does not guarantee the accuracy of the data included in this publication and accepts no responsibility for any consequence of their use. Use of the term “country” does not imply any judgment by the authors or ADB as to the legal or other status of any territorial entity. The symbol “$” represents the United States dollar unless otherwise indicated. “Asia” refers only to ADB’s Asian member economies. ADB encourages printing or copying information exclusively for personal and noncommercial use with proper acknowledgement of ADB. Users are restricted from reselling, redistributing, or creating derivative works for commercial purposes without the express, written consent of ADB.
Asian Development Bank6 ADB Avenue, Mandaluyong City1550 Metro Manila, PhilippinesTel: +63 2 632 4444Fax: +63 2 636 4444www.adb.org
The Asia Economic Monitor December 2011 (AEM) was prepared by ADB’s Office of Regional Economic Integration, headed by Iwan J. Azis, with Senior Director Ramesh Subramanian. The AEM team was led by Lei Lei Song and Thiam Hee Ng with support from the Asia Regional Integration Center led by James Villafuerte. Takaaki Nomoto compared Japan’s “lost decade” with the situation in the eurozone and US today. Guy Sacerdoti provided editorial assistance. Ariel Paelmo and Erickson Mercado produced the typesetting, layout, and cover design.
Download AEM at: http://www.aric.adb.org/asia-economic-monitor/
How to reach us: Asian Development Bank Office of Regional Economic Integration6 ADB Avenue, Mandaluyong City1550 Metro Manila, PhilippinesTelephone: +63 2 632 6265Facsimile: +63 2 636 2183E-mail: [email protected]

Highlights
PB July 2011 Asia Economic Monitor Asia Economic Monitor July 2011 iii
Emerging East Asia—A Regional Economic Update
Highlights . . . . . . . . . . . . . . . . . . . . . . . . . . . . . . . . . . . . . . . .2
Economic Performance . . . . . . . . . . . . . . . . . . . . . . . . . . . . . . .3 Growth and Inflation . . . . . . . . . . . . . . . . . . . . . . . . . . . . . . . . . . . . . . . .3 Balance of Payments . . . . . . . . . . . . . . . . . . . . . . . . . . . . . . . . . . . . . . . . 7 Financial Markets and Exchange Rates . . . . . . . . . . . . . . . . . . . . . . . . . 10 Monetary and Fiscal Policy . . . . . . . . . . . . . . . . . . . . . . . . . . . . . . . . . . 14 Financial Vulnerability . . . . . . . . . . . . . . . . . . . . . . . . . . . . . . . . . . . . . .16
Economic Outlook, Risks, and Policy Issues . . . . . . . . . . . . . 24 External Economic Environment . . . . . . . . . . . . . . . . . . . . . . . . . . . . . . 24 Regional Economic Outlook for 2012 . . . . . . . . . . . . . . . . . . . . . . . . . . 35 Risks to the Outlook . . . . . . . . . . . . . . . . . . . . . . . . . . . . . . . . . . . . . . . 39 Policy Issues . . . . . . . . . . . . . . . . . . . . . . . . . . . . . . . . . . . . . . . . . . . . . 40
Can East Asia Weather Another Global Economic Crisis? . . . 43 Introduction . . . . . . . . . . . . . . . . . . . . . . . . . . . . . . . . . . . . . . . . . . . . . 43 What are the risks of another global financial crisis? . . . . . . . . . . . . . . 44 How would another global financial crisis impact East Asia? . . . . . . . . 47 Estimating the impact of a new global crisis on East Asia . . . . . . . . . . . 53 Where can policymakers make a difference? . . . . . . . . . . . . . . . . . . . . . 56 Conclusion . . . . . . . . . . . . . . . . . . . . . . . . . . . . . . . . . . . . . . . . . . . . . . .58
Box1 . A eurozone and US “Lost Decade”: A Comparison with Japan . . . . . . . . 25
Contents
Emerging East Asia—A Regional Economic Update
iv July 2011 Asia Economic Monitor Asia Economic Monitor July 2011 PB
ADB Asian Development BankASEAN Association of Southeast Asian NationsASEAN-4 Indonesia, Malaysia, Philippines, and
ThailandASEAN-10 Brunei Darussalam, Cambodia, Indonesia,
Lao People’s Democratic Republic, Malaysia, Myanmar, Philippines, Singapore, Thailand, and Viet Nam
BI Bank IndonesiaBIS Bank for International SettlementsCBOE Chicago Board Options ExchangeCDS credit default swapsCMIM Chiang Mai Initiative MultilateralizationEEA Emerging East AsiaEMBI Emerging Markets Bond IndexERPD Economic Review and Policy DialogueEU European UnionG3 US, eurozone, and JapanGDP gross domestic productGIIPS Greece, Ireland, Italy, Portugal, and SpainICT information and communications
technologyIMF International Monetary FundISM Institute for Supply ManagementJCI Jakarta Composite IndexKLCI Kuala Lumpur Composite IndexKOSPI Korean Stock Price IndexLao PDR Lao People’s Democratic RepublicLIBOR London Interbank Offered RateM2 broad money
MSCI Morgan Stanley Capital International m-o-m month-on-month NIE newly industrialized economyOECD Organisation for Economic Co-operation
and DevelopmentOEF Oxford Economic Forecasting ModelOPEC Organization of the Petroleum Exporting
Countries PCOMP Philippine Composite IndexPRC People’s Republic of ChinaPMI purchasing managers’ indexq-o-q quarter-on-quarter repo reverse repurchasesaar seasonally adjusted annualized rate SET Stock Exchange of ThailandSIPMM Singapore Institute of Purchasing and
Materials ManagementSMEs small and medium enterprisesS&P Standard and Poor’sSTI Straits Times IndexTED treasury bill and eurodollar futures
contractTWSE Taipei,China’s stock exchangeUK United KingdomUS United StatesUV curve Beveridge curveVNINDEX Ho Chi Minh Stock IndexWB World Banky-o-y year-on-year $ US dollars unless otherwise indicated
Abbreviations and Acronyms

Asia Economic Monitor | December 2011 1
Highlights
Emerging East AsiaA Regional
Economic Update

2 December 2011 | Asia Economic Monitor
Emerging East Asia—A Regional Economic Update
Economic Performance
Economic growth in emerging East Asia moderated this year due to weaker external demand and tightened monetary policies to battle inflation; investment edged up, while consumption remained strong.
Inflation appears to have peaked, but remains a concern for several economies.
Balance of payments were mixed; the NIEs’ surplus narrowed on reduced current account surpluses, while those in the PRC and middle income ASEAN increased slightly.
Stock market indexes in emerging East Asia were volatile as investor sentiment swayed in tandem with the unfolding eurozone crisis and US economic uncertainty.
Currency movements were mixed; largely mimicking market reaction to events in the eurozone and US.
Bond yield curves flattened due to declines in long-term interest rates—meaning investors expect weaker growth.
Across the region, safeguarding growth is becoming the focus of policymakers as the global economy slows.
Although emerging East Asia’s financial systems remain sound, vulnerabilities exist.
Outlook and Risks
Since mid-2011, the external environment for emerging East Asia has worsened; no resolution of the eurozone sovereign debt crisis is in sight and the US recovery remains fragile.
Aggregate GDP in emerging East Asia is expected to grow 7.2% in 2012 after expanding 7.5% this year.
The cautiously optimistic outlook for emerging East Asia is subject to major downside risks: (i) a deep recession in both the eurozone and US; (ii) protectionism or tight trade finance; (iii) destabilizing capital flows; and (iv) persistent or resurgent inflation.
Policy Issues
The biggest policy challenge facing emerging East Asia is how to safeguard the region’s robust growth against the threat of another global economic crisis.
With the eurozone’s sovereign debt crisis unfolding and risks of faltering global recovery rising, macroeconomic policy must remain cautious and prudent.
With demand from the eurozone and US expected to remain weak for some time, emerging East Asia should continue to work toward increasing intraregional trade and financial integration, and expanding links with other emerging economies.
Emerging East Asia could accelerate regional policy cooperation to mitigate the effects of external shocks.
Can East Asia Weather Another Global Economic Crisis?
The eurozone sovereign debt crisis continues to worsen; it would have a serious yet manageable impact on East Asia should it evolve into a full–blown global financial and economic crisis.
The region should be able to weather a crisis if policymakers respond promptly, decisively, and collectively:
— They need to respond quickly and firmly by deploying financial, monetary, and fiscal policies to restore confidence, ensure financial stability, and support growth.
— Fiscal policy could be central to sustain growth, while monetary policy retains enough flexibility to allow stimulus while keeping inflationary expectations anchored.
— East Asia must intensify collective action in addressing the knock-on effects of another global financial crisis.
Regardless, emerging East Asia must prepare for a prolonged crisis and weak post-crisis recovery by implementing appropriate short-term macroeconomic responses and pursuing necessary long-term structural reform.
— National development agendas and the desire to rebalance sources of growth make targeted fiscal stimulus attractive.
— Emerging East Asia should cooperate more on efforts to accelerate rebalancing growth toward domestic and regional demand.
Highlights

Economic Performance
PB December 2011 | Asia Economic Monitor Asia Economic Monitor | December 2011 3
Economic PerformanceGrowth and Inflation
Economic growth in emerging East Asia is moderating in the second half of 2011 due to weaker external demand and tightened monetary policies to battle inflation.
Economic performance in emerging East Asia remained robust even as moderation continued. Export growth decelerated on weak external demand, while authorities generally maintained tight monetary policies to curb inflation. In the third quarter of 2011, aggregate gross domestic product (GDP) of the 10 largest emerging East Asian1 economies expanded 7.3%,2 down from 7.8% growth in the first half (Figure 1). The People’s Republic of China (PRC) remained the strongest economy in the region, growing 9.1% in the third quarter, slower than its first half 9.6% rate. The four middle-income economies of the Association of Southeast Asian Nations (ASEAN-4)3 are expected to grow 4.5% in the second half (against 4.9% in the first 6 months). The four newly industrialized economies (NIEs)4 expanded 3.8% in the third quarter—close to the 3.9% consolidated average annual growth rate between 2001 and 2010, but below its 4.6% first half performance. With leading indicators—exports, industrial production, and retail sales—more or less constant or
1The 10 largest economies in emerging East Asia are the People’s Republic of China; Hong Kong, China; Indonesia; the Republic of Korea; Malaysia; the Philippines; Singapore; Taipei,China; Thailand; and Viet Nam.2All comparative figures are year-on-year unless otherwise indicated.3Indonesia, Malaysia, the Philippines, and Thailand.4Hong Kong, China; the Republic of Korea; Singapore; and Taipei,China.
7.39.1
5.13.8
-10
-5
0
5
10
15
2007Q1 2007Q4 2008Q3 2009Q2 2010Q1 2010Q4 2011Q3
People's Republic of China
ASEAN-4
NIEs
Emerging East Asia
Figure 1: Regional GDP Growth1—Emerging East Asia2 (y-o-y,%)
ASEAN-4 = Indonesia, Malaysia, Philippines, and Thailand; GDP = gross domestic product; NIEs = Hong Kong, China; Republic of Korea; Singapore; and Taipei,China; y-o-y = year-on-year.1Weighted by gross national income (atlas method, current $).2Includes ASEAN-4, NIEs, Viet Nam, and People’s Republic of China.Source: ADB calculations using data from CEIC and national sources.
18.6
37.0
-24.7
10.6
-3.0
15.0
21.8
6.5
-30-20-10
01020304050
Jan-07
Sep-07
May-08
Jan-09
Sep-09
May-10
Jan-11
Sep-11
Exports
Industrial production3
Retail sales4
Figure 2: Merchandise Export, Industrial Production, and Retail Sales Growth1—Emerging East Asia2 (y-o-y, %)
y-o-y = year-on-year. Note: Exports in $ value; industrial production and retail sales in local currency.13-month moving average. Data on industrial production until Aug 2011 and retail sales until Jul 2011. 2Includes People’s Republic of China; Hong Kong, China; Indonesia; Republic of Korea; Malaysia; Philippines; Singapore; Taipei,China; Thailand; and Viet Nam.3Excludes Hong Kong, China as data unavailable. 4Excludes Malaysia and Philippines as data unavailable. Source: ADB calculations using data from CEIC.
slightly declining, economic growth in the region is expected to ease further during the remainder of the year (Figure 2).
Investment edged up, while consumption remained a strong driver of economic growth.
In the third quarter of 2011, domestic demand continued as the main source of economic growth in the NIEs and the ASEAN-4. Investment contributed an anemic 0.9%—barely up from its 0.8% second quarter contribution (Figure 3). Fixed investment in the NIEs contracted 1.4% in the third quarter, following a weak 1.6% rise in the second, while in the ASEAN-4 it grew to 4.9% from
Statistical discrepancyNet exportsInvestmentConsumptionGDP Growth (y-o-y, %)
2.8
0.9
0.9
-0.3
4.3
-8-6-4-202468
1012
2007Q1 2007Q4 2008Q3 2009Q2 2010Q1 2010Q4 2011Q3
Figure 3: Contributions to GDP Growth—Emerging East Asia1 ex PRC (percentage points2)
GDP = gross domestic product, PRC = People’s Republic of China, y-o-y = year-on-year.1Refers to ASEAN-4 (Indonesia, Malaysia, Philippines, and Thailand) plus NIEs (Hong Kong, China; Republic of Korea; Singapore; and Taipei,China). 2Based on y-o-y changes.Source: ADB calculations using data from CEIC.

4 December 2011 | Asia Economic Monitor Asia Economic Monitor | December 2011 5
Emerging East Asia—A Regional Economic Update
4 December 2011 | Asia Economic Monitor Asia Economic Monitor | December 2011 5
3.8% in the second quarter (Figures 4a, 4b). Growth in inventories in both the NIEs and the ASEAN-4, though positive, were quite small. In contrast, consumption growth held steady in the NIEs as consumer confidence was mixed (strong in Taipei,China; weak in Hong Kong, China) (Figures 5a, 5b). Consumption growth continued to increase slightly in the ASEAN-4 (except in Thailand). In the PRC, expanding consumption—proxied by retail sales—remained robust, but showed signs of easing gradually (Figure 6).
PRC’s economic growth moderated, on government efforts to cool the economy and manage a “soft landing.”
Economic expansion eased to 9.1% in the third quarter from 9.6% in the first half, primarily due to monetary tightening and weakening external demand. Since April, policy rates were raised twice and reserve requirements
3.6
-1.4
-15
-10
-5
0
5
10
15
20
2007Q1 2007Q4 2008Q3 2009Q2 2010Q1 2010Q4 2011Q3
Consumption
Fixed investment
Figure 4a: Domestic Demand Growth—NIEs (y-o-y, %)
NIE = newly industrialized economy (Hong Kong, China; Republic of Korea; Singapore; and Taipei,China); y-o-y = year-on-year.Source: ADB calculations using data from CEIC.
Fixed investment
5.4
4.9
-8
-4
0
4
8
12
16
2007Q1 2007Q4 2008Q3 2009Q2 2010Q1 2010Q4 2011Q3
Consumption
Figure 4b: Domestic Demand Growth—ASEAN-4 (y-o-y, %)
ASEAN-4 = Indonesia, Malaysia, Philippines, and Thailand; y-o-y = year-on-year.Source: ADB calculations using data from CEIC.
92.0
104.1
66.5
124.3
50
60
70
80
90
100
110
120
130
Jan-07
Sep-07
May-08
Jan-09
Sep-09
May-10
Jan-11
People's Republic of ChinaRepublic of Korea
Hong Kong, China
Taipei,China
Oct-11
Figure 5a: Consumer Confidence Indexes—People’s Republic of China and NIEs (January 2007 = 100)
NIE = newly industrialized economy.Source: Bloomberg and CEIC.
122.8
143.8
90.687.0
30
50
70
90
110
130
150
170
190
Jan-07
Sep-07
May-08
Jan-09
Sep-09
May-10
Jan-11
Indonesia
Malaysia1
Thailand
Philippines
Oct-11
Figure 5b: Consumer Confidence Indexes—ASEAN-4(January 2007 = 100)
1Latest data as of 2011Q2.Source: Bloomberg and CEIC.
16.7
13.7
25.7
0
5
10
15
20
25
30
Jan- 07
Sep- 07
May- 08
Jan- 09
Sep- 09
May- 10
Jan- 11
Oct- 11
Figure 6: Retail Sales Growth1—People’s Republic of China(y-o-y, %)
y-o-y = year-on-year.13-month moving average. Source: ADB calculations using data from CEIC.
4 December 2011 | Asia Economic Monitor Asia Economic Monitor | December 2011 5
Economic Performance
4 December 2011 | Asia Economic Monitor Asia Economic Monitor | December 2011 5
Oct-11
24.9
33.6
32.3
35.1
4.9
19.9
0
5
10
15
20
25
30
35
40
Jan-07
Sep-07
May-08
Jan-09
Sep-09
May-10
Jan-11
Fixed asset investment
Fixed asset investmentin real estate
Figure 7: Growth of Fixed Asset Investment—People’s Republic of China (nominal, year-to-date, y-o-y, %)
y-o-y = year-on-year.Source: CEIC.
2.30.5
1.2
-0.1
3.8
-8-6-4-202468
1012
2007Q1 2007Q4 2008Q3 2009Q2 2010Q1 2010Q4 2011Q3
Statistical discrepancyNet exportsInvestmentConsumptionGDP Growth (y-o-y, %)
Figure 8: Contributions to GDP Growth—NIEs (percentage points1)
GDP = gross domestic product; NIE = newly industrialized economy (Hong Kong, China; Republic of Korea; Singapore; and Taipei,China); y-o-y = year-on-year.1Based on y-o-y changes.Source: ADB calculations using data from CEIC.
0.30.8
-5-4-3-2-1012345
2007Q1 2007Q4 2008Q3 2009Q2 2010Q1 2010Q4 2011Q3
ASEAN-4
NIEs
Figure 9: Contribution of Changes in Inventories to GDP Growth—ASEAN-4 and NIEs (percentage points1)
ASEAN-4 = Indonesia, Malaysia, Philippines, and Thailand; GDP = gross domestic product; NIEs = newly industrialized economies (Hong Kong, China; Republic of Korea; Singapore; and Taipei,China).1Based on year-on-year changes.Source: ADB calculations using data from CEIC.
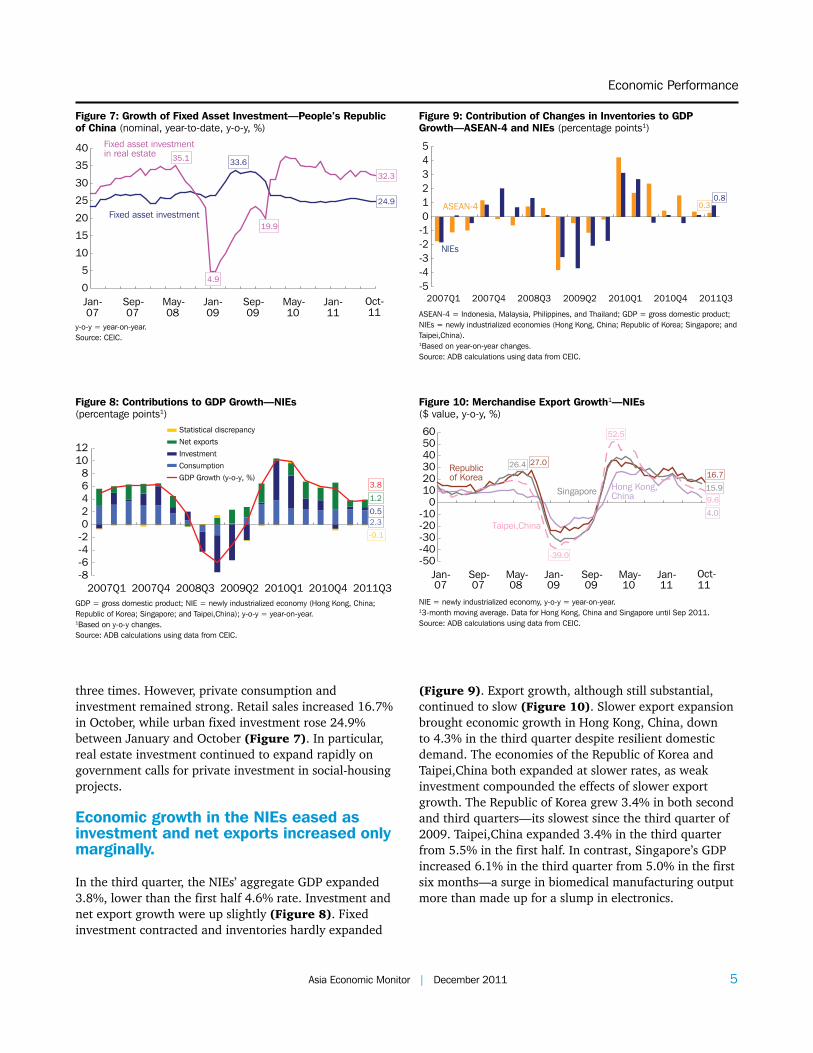
three times. However, private consumption and investment remained strong. Retail sales increased 16.7% in October, while urban fixed investment rose 24.9% between January and October (Figure 7). In particular, real estate investment continued to expand rapidly on government calls for private investment in social-housing projects.
Economic growth in the NIEs eased as investment and net exports increased only marginally.
In the third quarter, the NIEs’ aggregate GDP expanded 3.8%, lower than the first half 4.6% rate. Investment and net export growth were up slightly (Figure 8). Fixed investment contracted and inventories hardly expanded
Oct-
4.0
16.726.4
15.9
9.6
52.5
-39.0-50-40-30-20-10
0102030405060
Jan-07
Sep-07
May-08
Jan-09
Sep-09
May-10
Jan-11 11
Republic of Korea
Hong Kong,China
Taipei,China
Singapore
27.0
Figure 10: Merchandise Export Growth1—NIEs ($ value, y-o-y, %)
NIE = newly industrialized economy, y-o-y = year-on-year. 13-month moving average. Data for Hong Kong, China and Singapore until Sep 2011. Source: ADB calculations using data from CEIC.
(Figure 9). Export growth, although still substantial, continued to slow (Figure 10). Slower export expansion brought economic growth in Hong Kong, China, down to 4.3% in the third quarter despite resilient domestic demand. The economies of the Republic of Korea and Taipei,China both expanded at slower rates, as weak investment compounded the effects of slower export growth. The Republic of Korea grew 3.4% in both second and third quarters—its slowest since the third quarter of 2009. Taipei,China expanded 3.4% in the third quarter from 5.5% in the first half. In contrast, Singapore’s GDP increased 6.1% in the third quarter from 5.0% in the first six months—a surge in biomedical manufacturing output more than made up for a slump in electronics.

6 December 2011 | Asia Economic Monitor Asia Economic Monitor | December 2011 7
Emerging East Asia—A Regional Economic Update
6 December 2011 | Asia Economic Monitor Asia Economic Monitor | December 2011 7
Economic growth in the ASEAN-4 was sustained by resilient domestic demand.
The ASEAN-4 economy is expected to expand 4.5% in the second half of 2011, down from 4.9% in the first half. In the third quarter, growth in consumption returned to pre-crisis levels and fixed investment rebounded slightly from a second-quarter slowdown (Figure 11). Indonesia’s economy was the strongest, expanding 6.5% in each of the first three quarters due to continued strong domestic demand. In contrast, the Philippines—after 7.6% growth in 2010 (its fastest since 1976)—saw its economy expand 3.2% in the third quarter from 3.8% in the first half. Strong consumer spending made up for a sharp decline in gross exports. In Malaysia and Thailand, last year’s rapid growth (7.2% for Malaysia and 7.8% for Thailand) slowed to 5.8% for Malaysia and 3.5% for Thailand in the third quarter, even as they were recovering from supply chain disruptions caused by Japan’s March earthquake and tsunami.
Viet Nam’s economic growth accelerated in the first three quarters of the year, while other smaller ASEAN economies improved.
Viet Nam’s economy grew 5.4%, 5.7%, and 6.1% in the first three quarters, respectively, due to strong growth in industrial output and consumption. Cambodia’s GDP expanded 6.3% in 2010, up from 0.1% in 2009, on increased garment exports and tourism. In the Lao People’s Democratic Republic (Lao PDR), economic growth increased to 7.5% in 2010 from 7.3% in 2009, driven by expanding hydropower and mining. In Brunei Darussalam, growth was 2.0% in 2010, reversing a 1.8%
Statistical discrepancyNet exportsInvestmentConsumptionGDP Growth (y-o-y, %)
3.7
1.4
0.6
-0.6
5.1
-6
-4
-2
0
2
4
6
8
10
2007Q1 2007Q4 2008Q3 2009Q2 2010Q1 2010Q4 2011Q3
Figure 11: Contributions to GDP Growth—ASEAN-4 (percentage points1)
ASEAN-4 = Indonesia, Malaysia, Philippines, and Thailand; GDP = gross domestic product; y-o-y = year-on-year.1Based on year-on-year changes.Source: ADB calculations using data from CEIC.
contraction in 2009 on higher oil and gas production. Myanmar’s economy grew 5.3% in 2010, up from 5.1% in 2009 on higher investment and increased agricultural productivity.
Inflation appears to have peaked, but remains a concern for several economies.
In the PRC, headline inflation moderated for the third straight month in October (to 5.5%) as government measures began to take effect. Inflation in the NIEs have also begun to ease (Figure 12a). Inflation is down in Indonesia and below Thailand’s target (Figure 12b). But it remains above target in the PRC, the Philippines, and Viet Nam, and above official forecasts in Hong Kong, China; Malaysia; and Singapore (Figure 13). Despite rising world food prices—particularly rice—headline inflation should ease further as the region’s growth
5.5
5.8
4.25.4
1.2
-3
0
3
6
9
Jan-07
Jul-07
Jan-08
Jul-08
Jan-09
Jul-09
Jan-10
Jul-10
Jan-11
Jul-11
Nov-11
People's Republic of China
Singapore
Hong Kong,China
Taipei,China
Republic of Korea
Figure 12a: Headline Inflation1—PRC and NIEs (y-o-y, %)
NIE = newly industrialized economy, PRC = People’s Republic of China, y-o-y = year-on-year. 1Data until Oct 2011 except for the Republic of Korea, which is until Nov 2011.Source: ADB calculations using data from CEIC.
5.3
3.44.24.2
19.8
-8
-4048
121620242832
Indonesia
Philippines1
Malaysia1
Thailand
Viet Nam
Jan-07
Jul-07
Jan-08
Jul-08
Jan-09
Jul-09
Jan-10
Jul-10
Jan-11
Jul-11
Nov-11
Figure 12b: Headline Inflation—ASEAN-4 plus Viet Nam (y-o-y, %)
y-o-y = year-on-year. 1Data for Malaysia and Philippines until Oct 2011.Source: ADB calculations using data from CEIC.

6 December 2011 | Asia Economic Monitor Asia Economic Monitor | December 2011 7
Economic Performance
6 December 2011 | Asia Economic Monitor Asia Economic Monitor | December 2011 7
Figure 13: Inflation Performance1 (y-o-y, %)
y-o-y = year-on-year; INO = Indonesia; KOR = Republic of Korea; PHI = Philippines; THA = Thailand; VIE = Viet Nam; PRC = People’s Republic of China; SIN = Singapore; HKG = Hong Kong, China; MAL = Malaysia; and TAP = Taipei,China. 1Headline inflation against inflation target, government objective, or official forecast.2Core inflation.3October value except for INO, KOR, THA, and VIE which are October-November averages.Source: ADB calculations using data from CEIC and national sources.
INO KOR PHI THA2 VIE PRC SIN HKG MAL TAP
Inflationtarget
Governmentobjective
Officialforecast
Target/ Objective/ Forecast2011Q4 average inflation3
2011Q3 average inflation2011Q2 average inflation
-202468
1012141618202224
moderates and the global economy weakens. Similarly, core inflation is generally subsiding, but remains high in several countries paying relatively high prices for intermediate inputs—such as chemical products (the Republic of Korea), precious metals (Indonesia and Viet Nam), and primary commodities (Hong Kong, China) (Figures 14a, 14b).
3.83.9
2.9
4.4
-6-4-202468
1012
Jan-07
Jul-07
Jan-08
Jul-08
Jan-09
Jul-09
Jan-10
Jul-10
Jan-11
Jul-11
Nov-11
Philippines1
Thailand
Malaysia1
Indonesia2 7.7Viet Nam
Figure 14b: Core Inflation—ASEAN-4 plus Viet Nam (y-o-y, %)
y-o-y = year-on-year. Note: Official figures, except for Malaysia (excluding food, fuel, and utilities).1Data for Malaysia and Philippines until Oct 2011.2Series break due to unavailability of data. Source: ADB calculations using data from CEIC.
-2
0
2
4
6
8
Jan-07
Jul-07
Jan-08
Jul-08
Jan-09
Jul-09
Jan-10
Jul-10
Jan-11
Jul-11
Nov-11
3.5
2.3
6.3
1.0
Republic of KoreaSingapore
Hong Kong, China
Taipei,China
Figure 14a: Core Inflation1—NIEs (y-o-y, %)
NIE= newly industrialized economy, y-o-y = year-on-year. Note: Official figures, except for Hong Kong, China (excluding food and utilities) and Singapore (excluding food and private transport).1Data until Oct 2011 except for the Republic of Korea, which is until Nov 2011.Source: ADB calculations using data from CEIC.
Balance of Payments
The NIEs’ balance of payments surplus narrowed on reduced current account surpluses; those in the PRC and the ASEAN-4 plus Viet Nam increased slightly.
In the first half, the NIEs reported an overall balance of payments surplus of 2.9% of GDP—lower than the 4.8% in the second half of 2010. The PRC surplus was 9.0% of

8 December 2011 | Asia Economic Monitor Asia Economic Monitor | December 2011 9
Emerging East Asia—A Regional Economic Update
8 December 2011 | Asia Economic Monitor Asia Economic Monitor | December 2011 9
Table 1a: Balance of Payments—ASEAN-4 plus Viet Nam (% of GDP)
2007H1 2007H2 2008H1 2008H2 2009H1 2009H2 2010H1 2010H2 2011H12
Current Account 4.9 5.4 2.8 2.6 6.9 3.9 3.3 3.3 3.3
Net goods balance 7.0 7.3 4.9 5.5 7.8 6.1 5.8 5.5 5.8
Net services -1.7 -1.5 -1.8 -2.2 -0.9 -1.5 -1.2 -1.2 -1.1
Net income -3.0 -2.8 -2.7 -2.9 -2.5 -2.6 -3.0 -2.9 -2.9
Net transfers 2.6 2.3 2.4 2.2 2.4 2.0 1.8 1.8 1.5
Capital and Financial Account 2.6 -0.3 3.2 -4.9 -3.9 1.0 2.8 4.5 4.3
Capital account 0.0 0.1 0.1 0.0 0.0 0.0 0.0 0.0 0.0
Net direct investment 1.5 1.1 1.0 0.7 0.9 0.0 1.8 0.7 0.9
Net portfolio investment 4.5 -1.4 0.9 -5.3 -1.2 1.6 2.7 2.8 4.1
Net other investment1 -3.4 -0.1 1.3 -0.4 -3.6 -0.6 -1.8 1.0 -0.7
Net errors and omissions 0.0 -1.1 0.7 -1.2 -0.6 -1.4 -3.2 -1.5 -0.8
Overall Balance 7.5 4.0 6.7 -3.5 2.4 3.6 2.9 6.3 6.8
ASEAN-4 = Indonesia, Malaysia, Philippines, and Thailand. GDP = gross domestic product.1Includes financial derivatives.2Excludes Viet Nam in 2011Q2 as data unavailable. Source: ADB calculations using data from International Financial Statistics, International Monetary Fund; and CEIC.
Table 1b: Balance of Payments—NIEs (% of GDP)
2007H1 2007H2 2008H1 2008H2 2009H1 2009H2 2010H1 2010H2 2011H1
Current Account 6.9 7.4 4.6 5.5 9.2 7.0 6.5 7.4 5.7
Net goods balance 4.8 5.5 1.9 1.3 4.8 4.0 3.1 4.5 2.1
Net services 1.9 2.3 2.7 3.4 3.2 3.2 3.0 3.6 3.6
Net income 0.8 0.3 0.7 1.2 1.6 0.4 1.1 0.0 0.9
Net transfers -0.7 -0.7 -0.7 -0.5 -0.5 -0.7 -0.7 -0.8 -0.9
Capital and Financial Account -5.4 -5.4 -1.2 -7.0 1.0 7.3 1.6 -2.9 -2.5
Capital account -0.2 0.0 0.0 0.2 0.3 0.3 0.2 0.3 0.3
Net direct investment -0.4 -2.1 -1.4 1.1 -1.7 -2.3 -0.1 -1.6 0.7
Net portfolio investment -5.1 -4.2 -2.9 -5.3 -2.5 -0.1 -3.0 -3.8 -3.9
Net other investment1 0.3 0.9 3.2 -3.0 5.0 9.4 4.5 2.3 0.4
Net errors and omissions 0.6 0.8 -0.5 0.3 0.5 0.1 -0.2 0.3 -0.3
Overall Balance 2.2 2.8 2.9 -1.1 10.7 14.4 7.9 4.8 2.9
NIEs = Hong Kong, China; Republic of Korea; Singapore; and Taipei,China. GDP = gross domestic product.1Includes financial derivatives. Source: ADB calculations using data from International Financial Statistics, International Monetary Fund; and CEIC.
GDP, while the ASEAN-4 plus Viet Nam was 6.8%; both were larger than the second half of 2010 (Tables 1a, 1b, 1c). In the NIEs, a smaller current account surplus drove the overall surplus down. A narrower current account surplus in the PRC was compensated by an increase in the capital and financial account surplus. For the ASEAN-4 plus Viet Nam, the balance of payments accounts of the first half of this year were similar to
the second half of 2010. A small increase in the overall surplus was due in large part to a decline in errors and omissions during the first half. Healthy balance of payments allowed most emerging East Asia to continue adding to their ample foreign exchange reserves (Table 2).

8 December 2011 | Asia Economic Monitor Asia Economic Monitor | December 2011 9
Economic Performance
8 December 2011 | Asia Economic Monitor Asia Economic Monitor | December 2011 9
Table 1c: Balance of Payments—People’s Republic of China (% of GDP)
2007H1 2007H2 2008H1 2008H2 2009H1 2009H2 2010H1 2010H2 2011H1
Current Account 10.8 9.6 9.6 8.7 6.2 4.5 4.0 6.0 2.8
Net goods balance 9.0 9.0 6.7 9.0 5.5 4.6 3.5 4.9 2.8
Net services -0.2 -0.2 -0.2 -0.3 -0.8 -0.5 -0.5 -0.3 -0.6
Net income 0.9 -0.3 1.9 -0.8 0.8 -0.3 0.2 0.8 0.1
Net transfers 1.2 1.1 1.2 0.9 0.7 0.7 0.8 0.7 0.6
Capital and Financial Account 6.0 0.3 3.6 -1.0 2.8 4.2 3.6 3.9 5.8
Capital account 0.1 0.1 0.1 0.1 0.1 0.1 0.1 0.1 0.1
Net direct investment 3.4 4.6 2.0 3.2 0.7 1.9 2.4 1.9 2.9
Net portfolio investment -0.3 1.2 1.0 0.9 0.9 0.7 -0.3 0.9 0.3
Net other investment1 2.8 -5.6 0.5 -5.2 1.1 1.6 1.4 1.1 2.5
Net errors and omissions 0.9 -0.1 0.9 0.1 -0.4 -1.2 -0.7 -1.3 0.4
Overall Balance 17.7 9.7 14.1 7.8 8.6 7.5 7.0 8.7 9.0
GDP = gross domestic product. 1Includes financial derivatives. Source: ADB calculations using data from International Financial Statistics, International Monetary Fund; and CEIC.
Table 2: Total Reserves (excluding gold)
Value ($ billion) % Change (y-o-y) % Change (m-o-m)
Dec-10
Mar-11
Jun-11
Oct-11
Dec- 10
Mar- 11
Jun- 11
Oct- 11
Jul- 11
Aug-11
Sep-11
Oct-11
Brunei Darussalam 1.6 1.7 – – 15.2 29.8 – – – – – –
Cambodia 3.3 3.3 3.4 – 14.2 10.0 9.6 – 1.0 – – –
People’s Republic of China 2866.1 3067.2 3219.8 3223.04 18.6 24.5 30.3 20.94 1.5 0.5 -1.9 –
Hong Kong, China 268.6 272.5 277.1 277.54 5.0 5.3 7.9 4.34 0.6 0.3 -0.7 –
Indonesia 92.9 102.4 116.1 109.9 46.2 47.9 58.2 23.9 2.4 1.4 -8.2 -0.8
Republic of Korea 291.5 298.5 304.4 309.7 8.0 9.7 11.0 5.6 1.7 0.4 -2.8 2.5
Lao People’s Democratic Republic 0.7 – – – 15.6 – – – – – – –
Malaysia 104.9 112.2 132.6 132.9 9.9 19.3 42.1 28.0 0.8 0.6 -4.0 2.9
Myanmar – – – – – – – – – – – –
Philippines 55.4 58.9 61.4 67.9 42.8 48.6 46.7 34.9 4.6 6.5 -1.0 0.3
Singapore 225.8 234.2 242.3 245.4 20.2 18.8 21.2 10.9 2.8 0.0 -6.2 5.1
Taipei,China 382.0 392.6 400.3 393.3 9.7 10.6 10.5 2.5 0.1 -0.1 -2.8 1.1
Thailand 167.5 176.5 178.8 173.5 23.7 25.1 24.7 4.1 1.2 -0.4 -4.5 0.8
Viet Nam 12.5 12.2 – – -24.2 -11.8 – – – – – –
Emerging East Asia 4472.61 4732.32 4936.23 4933.15 16.71 21.12 25.93 9.55 1.43 0.55 -2.45 2.06
Japan 1061.5 1080.6 1100.8 1167.5 3.8 6.4 8.0 7.6 0.9 5.7 -1.1 0.6
East Asia 5534.11 5812.92 6036.93 6100.65 14.01 18.02 22.23 8.75 1.33 1.45 -2.25 1.46
– = data unavailable, m-o-m = month-on-month, y-o-y = year-on-year.1Excludes Myanmar as data unavailable. 2Excludes Lao People’s Democratic Republic and Myanmar as data unavailable. 3Excludes Brunei Darussalam, Lao People’s Democratic Republic, Myanmar, and Viet Nam as data unavailable. 4Data are for most recent month in which data are available. 5Excludes Brunei Darussalam, Cambodia, Lao People’s Democratic Republic, Myanmar, and Viet Nam as data unavailable. 6Excludes Brunei Darussalam; Cambodia; People’s Republic of China; Hong Kong, China; Lao People’s Democratic Republic; Myanmar; and Viet Nam as data unavailable.Source: CEIC; International Financial Statistics, International Monetary Fund; and national sources.

10 December 2011 | Asia Economic Monitor Asia Economic Monitor | December 2011 11
Emerging East Asia—A Regional Economic Update
10 December 2011 | Asia Economic Monitor Asia Economic Monitor | December 2011 11
43.1
20.6
-28.4
13.6
38.6
29.2
25.3
-40
-25
-10
5
20
35
50
Jan-07
Sep-07
May-08
Jan-09
Sep-09
May-10
Jan-11
Sep-11
PRC
NIEs
ASEAN-4 plus Viet Nam
Figure 15: Merchandise Export Growth1—PRC, ASEAN-4 plus Viet Nam, and NIEs ($ value, y-o-y, %)
ASEAN-4 = Indonesia, Malaysia, Philippines, and Thailand; NIEs = Hong Kong, China; Republic of Korea; Singapore; and Taipei,China; PRC = People’s Republic of China; y-o-y = year-on-year. 13-month moving average. Source: ADB calculations using data from CEIC.
16.425.0 21.4
41.7
-36.7
24.9
64.8
-50-40-30-20-10
010203040506070
Jan-07
Sep-07
May-08
Jan-09
Sep-09
May-10
Jan-11
Sep-11
NIEs
ASEAN-4 plus Viet NamPRC
Figure 16: Merchandise Import Growth1—PRC, ASEAN-4 plus Viet Nam, and NIEs ($ value, y-o-y, %)
ASEAN-4 = Indonesia, Malaysia, Philippines, and Thailand; NIEs = Hong Kong, China; Republic of Korea; Singapore; and Taipei,China; PRC = People’s Republic of China; y-o-y = year-on-year.13-month moving average. Data for ASEAN-4 plus Viet Nam until Aug 2011.Source: ADB calculations using data from CEIC.
0.3
-2.5
5.0
-0.6
3.5
5.8
-10-8-6-4-202468
1012
2002H1 2003H2 2005H1 2006H2 2008H1 2009H2 2011H1
Direct InvestmentOther Investment1
Portfolio InvestmentNet Financial Flows
Gross Inflows
Gross Outflows
Figure 17a: Gross and Net Financial Flows—People’s Republic of China (% of GDP)
GDP = gross domestic product.1Includes financial derivatives.Source: ADB calculations using data from national sources.
Current account surpluses in the NIEs and the PRC narrowed on lower trade surpluses.
In the NIEs, the trade surplus fell to 2.1% of GDP in the first half from 4.5% in the second half of 2010 (Figures 15, 16). In the PRC, all components of the current account narrowed—the trade surplus down most, to 2.8% of GDP in the first half from 4.9% the second half of 2010. In the ASEAN-4 plus Viet Nam, the current account surplus was unchanged—a slight increase in the trade surplus offset by lower net transfers.
The PRC and ASEAN-4 plus Viet Nam reported capital and financial account surpluses, but the NIEs recorded a deficit on portfolio investment outflows.
In the first half, the capital and financial account surplus of the PRC expanded to 5.8% of GDP (3.9% in the second half of 2010) on increased inflows in net direct investment and net “other investment” (Figure 17a). The ASEAN-4 plus Viet Nam also continued to draw net financial flows as larger net portfolio and direct investment offset net outflows in other investment (Figure 17b). But the NIEs continued to show a capital and financial account deficit—2.5% of GDP, slightly better than last year’s second half as net direct investment flows improved (Figure 17c). As the most open economies in the region, the NIEs continued to have net outflows of portfolio investments in response to the eurozone crisis.
Financial Markets and Exchange Rates
In the months to November, composite equity indexes in emerging East Asia were volatile as investor sentiment swayed in tandem with the unfolding eurozone crisis and US economic uncertainty.
In general, stock price indexes remained within or above pre-2008/09 crisis bands (Figures 18a, 18b, 18c). Compared with January levels, however, equity values have dropped significantly—the result of rising global financial uncertainty and the flight-to-safety market reactions (Figure 19). The exceptions were the Indonesian and Philippine markets.

10 December 2011 | Asia Economic Monitor Asia Economic Monitor | December 2011 11
Economic Performance
10 December 2011 | Asia Economic Monitor Asia Economic Monitor | December 2011 11
-0.4
0.7
2.0
-0.1
-0.9
1.9
3.3
-15
-10
-5
0
5
10
15
2007Q1 2007Q4 2008Q3 2009Q2 2010Q1 2010Q4
Direct InvestmentPortfolio InvestmentOther Investment2
Net Financial Flows
Gross Inflows
Gross Outflows
2011Q2
Figure 17b: Gross and Net Financial Flows1—ASEAN-4 plus Viet Nam (% of GDP)
GDP = gross domestic product. ASEAN-4 = Indonesia, Malaysia, Philippines, and Thailand. 1Does not include Malaysia from 2010Q1 to 2011Q2 as data on inflow-outflow breakdown for portfolio and other investment unavailable. Does not include Viet Nam in 2011Q2 as data unavailable. 2Includes financial derivatives.Source: ADB calculations using data from International Financial Statistics, International Monetary Fund; and national sources.
2011Q2
-13.4
14.8
3.2
-7.3
6.9
-7.2
-3.1
-60-50-40-30-20-10
01020304050
2007Q1 2007Q4 2008Q3 2009Q2 2010Q1 2010Q4
Direct InvestmentPortfolio InvestmentOther Investment1
Net Financial Flows
Gross Inflows
Gross Outflows
Figure 17c: Gross and Net Financial Flows—NIEs (% of GDP)
GDP = gross domestic product. NIEs = Hong Kong, China; Republic of Korea; Singapore; and Taipei,China. 1Includes financial derivatives.Source: ADB calculations using data from International Financial Statistics, International Monetary Fund; and national sources.
238.1
68.8
146.5
111.2
406080
100120140160180200220240260
02-Jan-07
04-Dec-07
04-Nov-08
02-Oct-09
03-Sep-10
05-Aug-11
11-Nov-11
Figure 18a: Composite Stock Price Index—People’s Republic of China1 (2 Jan 2007 = 100, local index)
1Daily stock price indexes of combined Shanghai and Shenzhen composites, weighted by respective market capitalizations.Source: ADB calculations using data from Reuters and Bloomberg.
154.4
129.8
155.8
94.2
49.9
95.6
93.0
40
60
80
100
120
140
160
Republic of KoreaHong Kong, China
SingaporeTaipei,China
02-Jan-07
04-Dec-07
04-Nov-08
02-Oct-09
03-Sep-10
05-Aug-11
11-Nov-11
Figure 18b: Composite Stock Price Indexes—NIEs1 (2 Jan 2007 = 100, local index)
NIE = newly industrialized economy.1Daily stock price indexes of Hang Seng (Hong Kong, China); KOSPI (Republic of Korea); STI (Singapore); and TWSE (Taipei,China).Source: ADB calculations using data from Reuters.
154.1
205.8
227.5
134.0
142.8
144.9156.3
34.1
Viet Nam53.5
0
50
100
150
200
250
02-Jan-07
04-Dec-07
04-Nov-08
02-Oct-09
03-Sep-10
05-Aug-11
Malaysia
Thailand
Philippines
11-Nov-11
Indonesia
Figure 18c: Composite Stock Price Indexes1—ASEAN-4 plus Viet Nam (2 Jan 2007 = 100, local index)
1Daily stock price indexes of JCI (Indonesia), KLCI (Malaysia), PCOMP (Philippines), SET (Thailand) and VNINDEX (Viet Nam).Source: ADB calculations using data from Reuters.
The region’s foreign exchange rates against the US dollar largely mimicked events in the eurozone and the US.
Since mid-year, exchange rate indexes in emerging East Asia showed increased volatility (Figures 20a, 20b). Against the US dollar, the renminbi appreciated the most, gaining 3.9% (Figure 21). Viet Nam’s dong depreciated the most, losing 7.2% given the large current account deficit and low foreign exchange reserves. In general, currencies that appreciated against the US dollar also appreciated against their baskets of trade-weighted currencies—whether unadjusted or adjusted for inflation (Figures 22, 23).

12 December 2011 | Asia Economic Monitor Asia Economic Monitor | December 2011 13
Emerging East Asia—A Regional Economic Update
12 December 2011 | Asia Economic Monitor Asia Economic Monitor | December 2011 13
-18.3
-16.5
4.1
-18.4
-18.2
-16.8
-13.7
-11.7
-10.0
-6.0
-6.0
-4.2
1.4
2.3
-22 -20 -18 -16 -14 -12 -10 -8 -6 -4 -2 0 2 4 6
Taipei,China (TWSE)Hong Kong, China (Hang Seng)
Viet Nam (VNINDEX)Japan (NIKKEI 225)
India (BSE 100)Singapore (STI)
PRC (Composite1)Rep. of Korea (KOSPI)
UK (FTSE 100)Thailand (SET)
Malaysia (KLCI)Indonesia (JCI)
Philippines (PCOMP)US (Dow Jones Ind Avg)
Figure 19: Growth in Stock Price Indexes (3 Jan 2011 to 11 Nov 2011, %)
PRC = People’s Republic of China, UK = United Kingdom, US = United States.1Daily stock price indexes of combined Shanghai and Shenzhen composites, weighted by respective market capitalizationsSource: ADB calculations using data from Bloomberg and Reuters.
123.2
107.3
92.3
119.5
82.2
59.9
100.0
5060708090
100110120130
People's Republic of China
Taipei,China
Singapore
Republic of Korea
Hong Kong, China
`
02-Jan-07
04-Dec-07
04-Nov-08
02-Oct-09
03-Sep-10
05-Aug-11
11-Nov-11
Figure 20a: Exchange Rate Indexes—People’s Republic of China and NIEs (local currency against $, 2 Jan 2007 = 100)
NIE = newly industrialized economy.Source: ADB calculations using data from Reuters.
100.2
74.0
112.3
95.1
112.9
121.5115.3
119.9
60
70
80
90
100
110
120
130Thailand
Indonesia
Philippines
Malaysia
02-Jan-07
04-Dec-07
04-Nov-08
02-Oct-09
03-Sep-10
05-Aug-11
11-Nov-11
Figure 20b: Exchange Rate Indexes—ASEAN-4(local currency against $, 2 Jan 2007 = 100)
Source: ADB calculations using data from Reuters.
3.9
1.1
0.3
0.2
-0.1
-0.2
-2.2
-2.5
-3.6
-7.2
-8 -4 0 4
PRC renminbiPhilippine peso
Singapore dollarIndonesian rupiahHong Kong dollar
Korean wonThai baht
Malaysian ringgitTaipei,China NT dollar
Vietnamese dong
PRC = People’s Republic of China.Note: Positive values indicate appreciation; negative values indicate depreciation.1Latest closing as of 11 Nov 2011, based on local currency value of the $.Source: ADB calculations using data from Reuters.
Figure 21: Exchange Rates against US dollar1
(3 Jan 2011 to 11 Nov 2011, % change)
-8 -4 0 4 8
Taipei,China
Malaysia
Korea, Republic of
Hong Kong, China
Thailand
Philippines
Singapore
Indonesia
PRCJan 2010–Dec 2010Jan 2011–Sep 2011
Figure 22: Change in Nominal Effective Exchange Rate (%)
PRC = People’s Republic of China.Source: ADB calculations using data from Bank for International Settlements.

12 December 2011 | Asia Economic Monitor Asia Economic Monitor | December 2011 13
Economic Performance
12 December 2011 | Asia Economic Monitor Asia Economic Monitor | December 2011 13
Bond yield curves flattened due to declines in long-term interest rates—meaning investors expect weaker growth.
Between December 2010 and November this year, yields-to-maturity on 10-year bonds fell 0.3 percentage points in the PRC, Malaysia, and Thailand; 0.7 percentage points in the Republic of Korea; 1.6 percentage points in Hong Kong, China; and 2.1 percentage points in Indonesia (Figures 24a, 24b, 24c, 24d, 24e, 24f). The flattening occurred due to lower inflationary expectations on weak economic prospects. In the Republic of Korea and Thailand, short-term interest rates rose as well, as monetary authorities raised policy rates to counter inflationary pressures (although Thailand lowered its policy rate on November 30).
-8 -4 0 4 8
Taipei,China
Hong Kong, China
Malaysia
Korea, Republic of
Thailand
Indonesia
Philippines
Singapore
PRCJan 2010–Dec 2010Jan 2011–Sep 2011
Figure 23: Change in Real Effective Exchange Rate1 (%)
PRC = People’s Republic of China.1Consumer price index-based.Source: ADB calculations using data from Bank for International Settlements.
2.5
3.63.5
3.9
2.7
3.9
3.2
3.9
2.0
2.5
3.0
3.5
4.0
4.5
0 1 2 3 4 5 6 7 8 9 10
13-Nov-201130-Jun-201131-Mar-201131-Dec-2010
Years to maturity
Figure 24a: Benchmark Yields—People’s Republic of China(% per annum)
Source: Bloomberg.
1.3
2.3
2.72.9
0.0
0.5
1.0
1.5
2.0
2.5
3.0
0 1 2 3 4 5 6 7 8 9 10
13-Nov-201130-Jun-201131-Mar-201131-Dec-2010
Years to maturity
Figure 24b: Benchmark Yields—Hong Kong, China (% per annum)
Source: Bloomberg.
5.1
7.2
5.8
8.7
6.7
9.3
5.4
9.3
4
6
8
10
0 1 2 3 4 5 6 7 8 9 10 15 20
13-Nov-201130-Jun-201131-Mar-201131-Dec-2010
Years to maturity
Figure 24c: Benchmark Yields—Indonesia (% per annum)
Source: Bloomberg.
3.3
4.0
3.3
4.4
3.0
4.6
2.5
4.7
2
3
4
5
0 1 2 3 5 6 7 8 9 10 20
13-Nov-201130-Jun-201131-Mar-201131-Dec-2010
Years to maturity
Figure 24d: Benchmark Yields—Republic of Korea (% per annum)
Source: Bloomberg.

14 December 2011 | Asia Economic Monitor Asia Economic Monitor | December 2011 15
Emerging East Asia—A Regional Economic Update
14 December 2011 | Asia Economic Monitor Asia Economic Monitor | December 2011 15
2.8
3.7
3.0
3.9
2.9
4.1
2.9
4.0
2.5
3.0
3.5
4.0
4.5
0 1 2 3 4 5 6 7 8 9 10
13-Nov-201130-Jun-201131-Mar-201131-Dec-2010
Years to maturity
Figure 24e: Benchmark Yields—Malaysia(% per annum)
Source: Bloomberg.
3.33.7
3.53.9
2.8
4.0
2.4
4.0
1
2
3
4
5
0 1 2 3 4 5 6 7 8 9 10 15
Years to maturity
13-Nov-201130-Jun-201131-Mar-201131-Dec-2010
Figure 24f: Benchmark Yields—Thailand(% per annum)
Source: Bloomberg.
Monetary and Fiscal Policy
Across the region, safeguarding growth is becoming the focus of policymakers as the global economy slows.
Output gaps are mixed, though they generally narrowed in the third quarter, suggesting they remain close to potential (Table 3). Slowing global economic growth and weakening external demand imply that safeguarding growth is becoming a greater concern for policymakers as inflation begins to slow—prices may also drop as growth eases.
Table 3: Output Gap (%)
Economy
Hodrick-Prescott Filter Baxter-King Band-Pass Filter
2011Q1 2011Q2 2011Q3 2011Q1 2011Q2 2011Q3
People’s Republic of China 0.4 0.2 0.0 0.4 0.3 0.2
Hong Kong, China 1.4 0.1 -0.9 0.9 0.5 0.2
Indonesia -0.1 0.0 0.0 0.1 0.1 0.0
Republic of Korea 0.1 0.0 -0.2 0.0 -0.1 -0.2
Malaysia 0.4 0.1 -0.1 0.2 0.1 0.0
Philippines 0.3 -0.3 -0.2 0.3 -0.1 -0.4
Singapore 4.3 1.2 0.2 1.5 0.5 -0.1
Taipei,China 2.2 1.3 0.1 0.9 0.3 -0.1
Thailand 0.3 -0.6 -1.0 -0.3 -0.5 -0.4
Viet Nam -1.1 -0.4 0.0 0.1 -0.1 -0.2 Note: Output gap is computed as the percentage deviation between actual and trend real gross domestic product (GDP). A positive value denotes that actual output is above trend. Seasonally adjusted real GDP series from 1999 to 2011 and extended to 2013 using forecasts from Consensus Economics and International Monetary Fund’s World Economic Outlook (for Viet Nam), except for People’s Republic of China (PRC); Indonesia; Malaysia; and Viet Nam where original series are seasonally adjusted using Census X12.Source: ADB calculations using data from CEIC; World Economic Outlook (September 2011), International Monetary Fund; and Oxford Economics for PRC data only.
Most of the region’s policymakers eased monetary policy or adopted a “wait-and-see” stance on concerns over the health of the global economy.
More concerned with the effects of a possible global slowdown than inflationary pressures, Bank Indonesia and Bank of Thailand cut their policy rates, the People’s Bank of China lowered its reserve requirement ratio, while the Monetary Authority of Singapore switched to a slower rate of currency appreciation on the premise that risks of imported inflation have subsided (Figures 25a, 25b). Authorities in the PRC, the Republic of Korea, Malaysia, and the Philippines maintained policy rates.

14 December 2011 | Asia Economic Monitor Asia Economic Monitor | December 2011 15
Economic Performance
14 December 2011 | Asia Economic Monitor Asia Economic Monitor | December 2011 15
3.25
5.25
6.56
7.47
0.50
6.75
1.88
2.75
0
2
4
6
8
Jan-07
Jul-07
Dec-07
Jun-08
Dec-08
Jun-09
Dec-09
Jun-10
Dec-10
Apr-11
Republic of Korea
People’s Republic of China
Hong Kong, China
Taipei,China
Nov-11
Figure 25a: Policy Rates1—People’s Republic of China and NIEs (% per annum)
NIE = newly industrialized economy.1One-year lending rate (People’s Republic of China), Hong Kong base rate (Hong Kong, China), Korea base rate (Republic of Korea), and discount rate (Taipei,China).Source: Bloomberg and Datastream.
Nov-11
3.5
3.0
7.5
4.5
9.5
6.05.0
3.25
15.0 15.0
02468
10121416
Jan-07
Aug-07
Apr-08
Dec-08
Aug-09
Apr-10
Dec-10
Jun-11
Indonesia
Philippines
Thailand Malaysia
Viet Nam
Figure 25b: Policy Rates1—ASEAN-4 plus Viet Nam (% per annum)
ASEAN = Association of Southeast Asian Nations.1Bank Indonesia rate (Indonesia); overnight policy rate (Malaysia); reverse repurchase (repo) rate (Philippines); 1-day repo rate (Thailand); and refinancing rate (Viet Nam).Source: Bloomberg, Datastream, and State Bank of Viet Nam.
The sole exception was Viet Nam, which raised interest rates and reserve requirements on foreign currency holdings to contain inflation and stabilize the economy.
Governments also adopted administrative measures to protect consumers while continuing the inflation fight.
Some governments maintained or imposed price controls on fuel to counter high global oil prices (the PRC and Viet Nam), extended the coverage period or increased the amount of fuel subsidies (Indonesia, Malaysia, and Thailand). Malaysia also delayed implementing a goods-and-services tax, while Viet Nam set price ceilings on a wide range of commodities, including electricity, drugs, and agricultural produce. In addition, the PRC; Hong Kong, China; and Singapore undertook measures to address housing shortages, which have been driving up property prices.
Governments fine-tuned fiscal policies to safeguard growth.
Most governments in emerging East Asia continued to maintain fiscal deficits. Changes in fiscal positions from 2010 were marginal (Table 4). There were four exceptions: Viet Nam reduced its budgetary deficit—to 4.5% of GDP from 8.0% in 2010—as part of its fight against inflation. Hong Kong, China, is projected to fall into deficit (of 0.5% of GDP) in 2011 from a 4.2%
Table 4: Fiscal Balance of Central Government (% of GDP)
2000–2004 Average
2005 2006 2007 2008 2009 2010 20112
Cambodia -5.7 -2.5 -2.7 -2.9 -2.8 -6.4 -6.0 -6.2
China, People’s Rep. of -2.2 -1.2 -0.8 0.6 -0.4 -2.9 -2.1 -2.1
Hong Kong, China1 -2.4 1.0 4.0 7.7 0.1 1.6 4.2 -0.5
Indonesia -1.5 -0.5 -0.9 -1.3 -0.1 -1.6 -0.7 -2.1
Korea, Rep. of -1.3 -2.5 -2.6 0.4 -2.0 -5.1 -2.3 -2.0
Malaysia -5.0 -3.6 -3.3 -3.2 -4.8 -7.0 -5.6 -5.4
Philippines -4.1 -2.6 -1.0 -0.2 -0.9 -3.7 -3.5 -2.4
Singapore1 -0.1 0.7 0.0 2.9 0.1 -0.3 -0.1 0.0
Taipei,China1 -2.5 -0.6 -0.7 -0.1 -0.9 -3.5 -3.0 -2.5
Thailand1 -1.2 0.2 0.1 -1.1 -0.3 -4.7 -2.0 -1.5
Viet Nam -4.9 -3.6 -1.2 -4.6 -3.1 -10.6 -8.0 -4.5 GDP = gross domestic product.1Fiscal year.22011 figures are ADB forecasts, budget estimates and government targets of respective economies. Figures as of 25 Nov 2011.Source: Asian Development Outlook (various issues), ADB; Article IV Consultation reports, International Monetary Fund; CEIC; and national sources.

16 December 2011 | Asia Economic Monitor Asia Economic Monitor | December 2011 17
Emerging East Asia—A Regional Economic Update
16 December 2011 | Asia Economic Monitor Asia Economic Monitor | December 2011 17
surplus in 2010. Indonesia increased budget outlays relative to national government revenues, while the Philippines decreased its deficit—from 3.5% of GDP in 2010 to 2.4%—reflecting greater fiscal consolidation efforts. To stimulate growth, the PRC offered credit and tax breaks to small and medium enterprises (SMEs), raised the threshold on taxable income, and began a massive building program to increase affordable housing supply. Indonesia provided cash transfers to low-income families, increased government salaries, and increased public spending on transportation and social services. The Philippines provided for a second stimulus package to fund critical infrastructure projects; housing, relocation, and resettlement programs; and healthcare insurance for indigents. Thailand reallocated 10% of the government’s budget for flood relief and rehabilitation programs.
Jan-03
Jun-04
Nov-05
Mar-07
Mar-08
Mar-09
Mar-10
Feb-11
Malaysia
Thailand
Philippines
Indonesia
Viet Nam
Nov-11
B+
CCCCCC+
BBB-BB+
A-BBB+BBB
BB
A
BB-
B-B
Figure 26a: S&P Sovereign Ratings—ASEAN-4 plus Viet Nam (long-term, foreign currency)
S&P = Standard and Poor’s.Source: Bloomberg.
Jan-03
Jun-04
Nov-05
Mar-07
Mar-08
Mar-09
Mar-10
Feb-11
Singapore
Republic of Korea
Hong Kong, China
People's Republic of China
Nov-11
Taipei,China
BBB+
AA+
BBB-
AA-
AA+AA
AAA
A-
BBB
Figure 26b: S&P Sovereign Ratings—People’s Republic of China and NIEs (long-term, foreign currency)
NIE = newly industrialized economy, S&P = Standard and Poor’s.Source: Bloomberg.
Jan-03
Jun-04
Nov-05
Mar-07
Mar-08
Mar-09
Mar-10
Feb-11
Malaysia
Thailand
Philippines
Indonesia
Viet Nam
Nov-11
B2B1Ba3Ba2
Caa1B
Ba1
Baa2Baa3
A2
Baa1A3
Figure 26c: Moody’s Sovereign Ratings—ASEAN-4 plus Viet Nam (long-term, foreign currency)
Source: Bloomberg.
Jan-03
Jun-04
Nov-05
Mar-07
Mar-08
Mar-09
Mar-10
Feb-11
Singapore
Republic of Korea
Hong Kong, China
People's Republic of China
Taipei,China
Nov-11
Baa1
A2A1
Baa3Baa2
Aa3
Aa1Aa2
Aaa
A3
Figure 26d: Moody’s Sovereign Ratings—People’s Republic of China and NIEs (long-term, foreign currency)
NIE = newly industrialized economy.Source: Bloomberg.
Financial Vulnerability
Although emerging East Asia’s financial systems remain sound, vulnerabilities exist.
In general, the region’s economies continue to maintain comfortable external and fiscal positions (Tables 5, 6a, 6b). Rating agencies have also kept sovereign debt ratings unchanged, unlike in other regions (Figures 26a, 26b, 26c, 26d). Except for Cambodia, Lao PDR, Myanmar, and Viet Nam, the rest of emerging East Asia continues to run current account surpluses. As a result of fiscal stimulus, however, most economies are now running fiscal deficits, with those in Cambodia and Malaysia above 5% of GDP. Brunei Darussalam; Hong

16 December 2011 | Asia Economic Monitor Asia Economic Monitor | December 2011 17
Economic Performance
16 December 2011 | Asia Economic Monitor Asia Economic Monitor | December 2011 17
Table 5: Public and External Debt (% of GDP)
2000–2004
Average 2004 2005 2006 2007 2008 2009 2010
Public Sector Debt
People’s Republic of China 19.3 18.5 17.6 16.2 19.6 17.0 17.7 36.0p
Hong Kong, China 0.7 2.4 2.2 1.8 1.5 1.3 3.4 4.7
Indonesia1 70.8 55.8 46.3 40.4 36.9 33.2 28.6 27.4
Republic of Korea1 20.4 23.7 27.6 30.1 29.7 29.0 32.5 31.9
Lao People’s Democratic Rep. 77.6 88.2 79.7 64.6 60.7 55.2 57.2e 60.9p
Malaysia2 42.1 45.7 43.8 42.2 41.5 41.4 53.3 53.1
Philippines3 81.9 90.7 78.8 70.5 60.9 61.7 62.4 58.5
Singapore 94.4 98.0 95.8 89.4 87.6 95.3 109.3 105.8
Taipei,China1 27.6 29.6 30.2 29.6 28.8 30.0 33.1 33.5
Thailand 52.9 48.0 46.4 40.3 37.4 38.2 43.9 42.4
Viet Nam 38.5 42.4 44.5 42.9 45.6 43.9 49.0 51.3e
External Debt
Brunei Darussalam 9.6 8.7 7.7 7.0 7.5 7.9 11.8 14.5
Cambodia 27.2 25.7 24.6 21.5 23.1 19.7 22.0 17.9e
People’s Republic of China 8.3 8.0 7.9 7.1 6.8 5.2 4.4 6.3
Hong Kong, China 128.9 138.6 141.6 153.6 173.1 176.1 184.8 235.3
Indonesia 57.5 42.5 40.5 29.2 26.9 27.0 18.4 17.2
Republic of Korea 22.3 20.3 19.1 23.1 26.7 26.4 34.4 28.8
Lao People’s Democratic Rep. 64.9 59.9 62.7 55.1 58.1 48.9 41.0 39.0e
Malaysia 43.2 44.4 44.7 41.5 39.4 28.9 31.6 28.6
Myanmar 59.5 52.4 42.7 35.7 24.6 18.2 4.1 3.7e
Philippines 78.0 76.9 73.9 60.1 50.2 42.5 38.4 38.5
Singapore 266.6 270.9 261.4 238.3 264.2 265.1 248.1 237.6
Taipei,China 14.1 24.6 22.2 18.3 19.4 15.7 14.8 20.5
Thailand 38.3 26.3 24.8 22.3 17.0 14.3 13.8 15.8
Viet Nam 29.3 33.2 31.7 31.4 35.5 40.6 29.2 34.0 e = estimate, GDP = gross domestic product, p = projection.1Central government debt.2Federal government debt.3National government debt.Source: Article IV Consultations, International Monetary Fund; CEIC (Public Debt); and Joint External Debt Hub database (External Debt).

18 December 2011 | Asia Economic Monitor Asia Economic Monitor | December 2011 19
Emerging East Asia—A Regional Economic Update
18 December 2011 | Asia Economic Monitor Asia Economic Monitor | December 2011 19
Table 6a: Assessment of Financial Vulnerabilities (%)
Inflation Rate (latest
available)
Fiscal Balance/
GDP (2010)1
Public Sector
Debt/GDP2 (2010)3
Loans/Deposits of Banks4
(latest available)
Bank Lending Growth5 (y-o-y, latest available)
Brunei Darussalam 2.7 (Sep11) 8.0 – 53.0 (May11) -0.3 (May11)
Cambodia 6.4 (Aug11) -6.0 – 80.1 (Aug11) 25.6 (Jul11)
People’s Republic of China 5.5 (Oct11) -2.1 36.0 73.5 (Aug11) 15.8 (Oct11)
Hong Kong, China 5.8 (Oct11) 4.2 4.7 62.5 (Jul11) 21.9 (Sep11)
Indonesia 4.2 (Nov11) -0.7 27.4 90.8 (Aug11) 23.0 (Aug11)
Republic of Korea 4.2 (Nov11) -2.3 31.9 117.5 (Jul11) 7.0 (Sep11)
Lao People’s Democratic Republic 6.6 (Oct11) -4.8 60.9 71.1 (Dec10) 43.8 (Dec10)
Malaysia 3.4 (Oct11) -5.6 53.1 94.4 (Aug11) 13.7 (Sep11)
Myanmar 3.3 (Aug11) – – 39.7 (Jun11) 56.9 (Jun11)
Philippines 5.3 (Oct11) -3.5 58.5 64.5 (Aug11) 21.7 (Sep11)
Singapore 5.4 (Oct11) -0.1 105.8 86.1 (Aug11) 24.0 (Sep11)
Taipei,China 1.2 (Oct11) -3.0 33.5 63.4 (Sep11) 7.4 (Sep11)
Thailand 4.2 (Nov11) -2.0 42.4 95.8 (Aug11) 16.5 (Sep11)
Viet Nam 19.8 (Nov11) -8.0 51.3 107.3 (May11) 32.7 (Apr11)
Note: Green font implies an improvement from Aug 2008 for monthly data, Q3 2008 for quarterly data, or 2008 for annual data. Red font implies a deterioration from the same base periods. GDP = gross domestic product, y-o-y = year-on-year, – = unavailable.1Latest International Monetary Fund Article IV Consultation estimates of overall primary balance (excludes interest and investment income) for Brunei Darussalam and overall balance (including grants) for Lao People’s Democratic Republic (Lao PDR). Data for Hong Kong, China; Lao PDR; Singapore; Taipei,China; and Thailand are fiscal year. 2Central government debt for Indonesia; Republic of Korea; and Taipei,China; federal government debt for Malaysia; and national government debt for the Philippines.3Data are projections for People’s Republic of China and Lao PDR; and estimates for Viet Nam from IMF Article IV Consultation reports.4Loans to private sector and non-financial institutions, and deposits (demand, time, savings, foreign currency), bonds, and money market instruments (where available) of banking institutions, deposit money banks, and other depository corporations of each economy.5Data for Brunei Darussalam and Cambodia refer to claims on private sector and nonbank financial institutions of other depository corporations; for People’s Republic of China to financial institution loans; Hong Kong, China to domestic credit; Indonesia to commercial bank loans; Republic of Korea to loans of commercial and specialized banks; Lao PDR to claims on private sector of deposit money banks; Malaysia to commercial bank loans and advances; Philippines to commercial and universal bank loans net of reverse repurchase arrangements; Singapore to loans and advances of domestic banking units; Taipei,China to domestic banks’ loans and advances; Thailand to commercial bank loans; and Viet Nam to claims on private sector of banking institutions.Source: ADB calculations using data from CEIC; national sources; Asian Development Outlook Update 2011, Asian Development Bank; Joint External Debt Hub, BIS-IMF-OECD-WB; International Financial Statistics, Direction of Trade Statistics, World Economic Outlook and Article IV Consultations, International Monetary Fund.
Kong, China; the Republic of Korea; Singapore; and Viet Nam also hold short-term external debt above 60% of foreign reserves—although in the case of Hong Kong, China, and Singapore, the high ratios reflect their role as regional financial centers. Low levels of foreign reserves in the Lao PDR and Viet Nam, covering about a mere 2 months of imports, are a cause for concern.
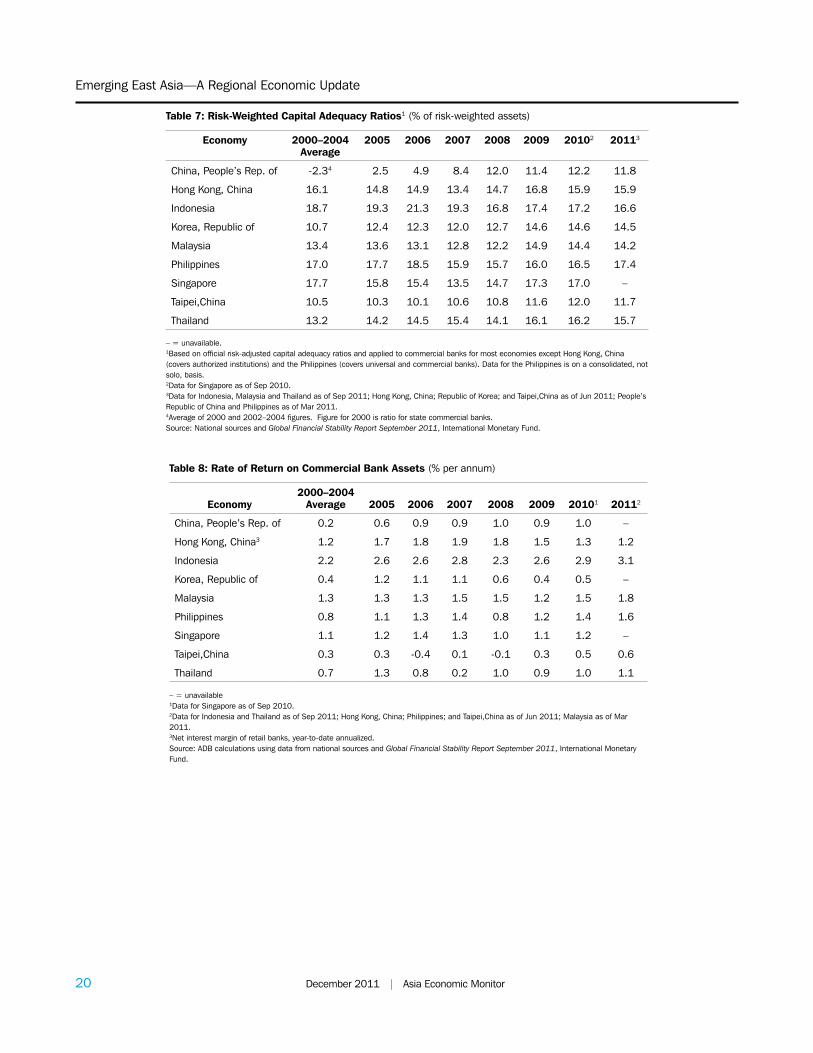
Thus far, the region’s banking systems have been little affected by the economic problems in the eurozone and US; they continue to maintain high capital adequacy ratios, healthy returns, and declining nonperforming assets.
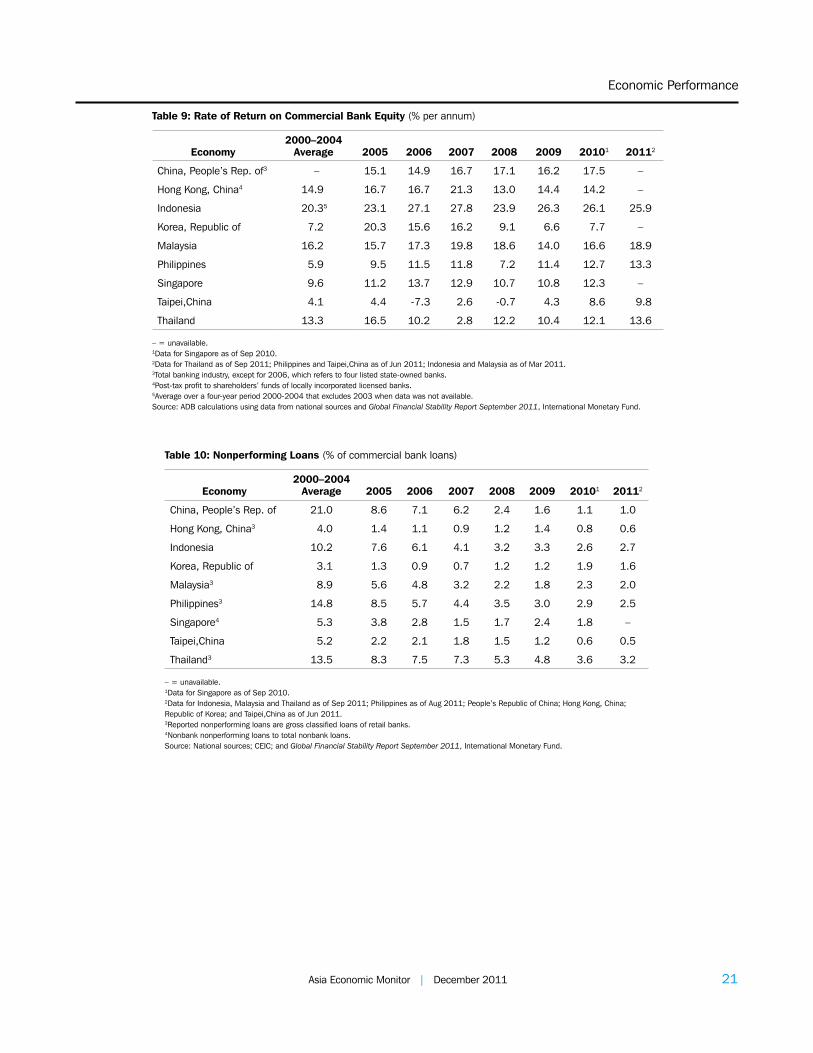
Bank capital in the PRC, NIEs, and ASEAN-4 remains strong with risk-weighted capital adequacy ratios well above 10% (Table 7). The region’s robust economies have led to improved bank profitability (Tables 8, 9). And prudent risk management has thus far seen nonperforming loans continue to decline (Table 10). In the PRC, however, informal credit, off-balance sheet lending, and government-directed lending have been

18 December 2011 | Asia Economic Monitor Asia Economic Monitor | December 2011 19
Economic Performance
18 December 2011 | Asia Economic Monitor Asia Economic Monitor | December 2011 19
Table 6b: Assessment of External Vulnerabilities (%)
Current Acct./ GDP
(latest available)
ExternalDebt/GDP1
(2010)
Short-Term External Debt/
Reserves (Q12011)2
Broad Money3/Foreign
Reserves (latest available)
Foreign Reserves (number of months
of imports)4
Foreign Liabilities/
Foreign Assets5 (latest available)
Brunei Darussalam 42.6 (2010) 14.5 113.6 6.3 (Mar11) 4.8 (Mar11) 4.0 (May11)
Cambodia -12.3 (2010) 17.9 3.6 1.6 (Jul11) 5.5 (Jul11) 47.9 (Aug11)
People’s Republic of China 1.9 (H111) 6.3 11.9 3.7 (Aug11) 23.2 (Sep11) 37.9 (Aug11)
Hong Kong, China 1.0 (Q211) 235.3 66.8 3.6 (Aug11) 7.0 (Sep11) 75.6 (Jul11)
Indonesia 0.1 (Q311) 17.2 46.5 2.5 (Aug11) 7.8 (Oct11) 156.0 (Sep11)
Republic of Korea 1.9 (Q211) 28.8 60.3 5.2 (Jul11) 7.2 (Oct11) 203.9 (Jul11)
Lao People’s Democratic Republic -9.0 (2010) 39.0 9.5 3.7 (Dec10) 2.2 (Dec10) 75.3 (Dec10)
Malaysia 11.2 (Q211) 28.6 32.0 2.8 (Aug11) 8.6 (Oct11) 92.6 (Aug11)
Myanmar -2.2 (2010) 3.7 11.4 – 2.8 (Jun07) –
Philippines 3.7 (Q211) 38.5 27.8 2.0 (Apr11) 13.6 (Oct11) 101.8 (Sep11)
Singapore 18.2 (Q211) 237.6 73.2 1.4 (Aug11) 8.3 (Oct11) 105.8 (Aug11)
Taipei,China 7.8 (Q211) 20.5 20.4 2.7 (Sep11) 16.6 (Oct11) 72.0 (Sep11)
Thailand 1.6 (Q211) 15.8 11.1 2.4 (Aug11) 9.4 (Oct11) 128.4 (Aug11)
Viet Nam -4.9 (Q111) 34.0 70.1 9.9 (May11) 1.6 (May11) 135.2 (May11)
Note: Green font implies an improvement from Aug 2008 for monthly data, Q3 2008 for quarterly data, or 2008 for annual data. Red font implies a deterioration from the same base periods. Black font implies no change.GDP = gross domestic product, y-o-y = year-on-year, – = unavailable.1Data are estimates for Cambodia, Lao People’s Democratic Republic (Lao PDR), and Myanmar.2Short-term external debt includes loans and credits due and debt securities due within a year as defined in the Joint External Debt Hub. Total reserves data for Lao PDR as of Dec 2010; Myanmar as of Jun 2007.3Data for Brunei Darussalam; Philippines; Taipei,China; and Thailand refer to broad money; for Cambodia; People’s Republic of China; Hong Kong, China; Indonesia; Republic of Korea; Lao PDR; and Malaysia refer to M2; for Myanmar and Viet Nam to money plus quasi-money.4Refers to reserves minus gold over a 12-month moving average of imports (cost of insurance, freight). Latest month when data is available. Import data may be earlier, the same, or later than period indicated.5Foreign liabilities and assets of banking institutions, deposit money banks, and other depository corporations.Source: ADB calculations using data from CEIC; national sources; Asian Development Outlook Update 2011, Asian Development Bank; Joint External Debt Hub, BIS-IMF-OECD-WB; International Financial Statistics, Direction of Trade Statistics, World Economic Outlook and Article IV Consultations, International Monetary Fund.
Oct-11
17.2
14.6
34.4
15.8
05
10152025303540
Jan-07
Sep-07
May-08
Jan-09
Sep-09
May-10
Jan-11
Figure 27: Bank Lending Growth1—People’s Republic of China (y-o-y, %)
y-o-y = year-on-year.1Data refer to financial institution loans.Source: CEIC.
4.0
9.2
4.5
13.0
6.5
-15
-10
-5
0
5
10
15
20
2007Q1 2007Q4 2008Q3 2009Q2 2010Q1 2010Q4 2011Q3
Thailand
Indonesia
Malaysia
PRC2
Figure 28: Growth of Housing Prices1—PRC, Indonesia, Malaysia, Thailand (y-o-y, %)
PRC = People’s Republic of China, y-o-y = year-on-year.1Data for Indonesia refer to residential property price index; Malaysia to house price index; and Thailand to housing price index. Data for Thailand until 2011Q2.2Data for PRC refer to house price index for newly-built residential buildings until 2010Q4, and to year-on-year growth of house prices (total) until present. Series break after 2010Q4.Source: ADB calculations using data from CEIC and Reuters.
20 December 2011 | Asia Economic Monitor Asia Economic Monitor | December 2011 21
Emerging East Asia—A Regional Economic Update
20 December 2011 | Asia Economic Monitor Asia Economic Monitor | December 2011 21
Table 8: Rate of Return on Commercial Bank Assets (% per annum)
Economy2000–2004
Average 2005 2006 2007 2008 2009 20101 20112
China, People’s Rep. of 0.2 0.6 0.9 0.9 1.0 0.9 1.0 –
Hong Kong, China3 1.2 1.7 1.8 1.9 1.8 1.5 1.3 1.2
Indonesia 2.2 2.6 2.6 2.8 2.3 2.6 2.9 3.1
Korea, Republic of 0.4 1.2 1.1 1.1 0.6 0.4 0.5 –
Malaysia 1.3 1.3 1.3 1.5 1.5 1.2 1.5 1.8
Philippines 0.8 1.1 1.3 1.4 0.8 1.2 1.4 1.6
Singapore 1.1 1.2 1.4 1.3 1.0 1.1 1.2 –
Taipei,China 0.3 0.3 -0.4 0.1 -0.1 0.3 0.5 0.6
Thailand 0.7 1.3 0.8 0.2 1.0 0.9 1.0 1.1
– = unavailable 1Data for Singapore as of Sep 2010.2Data for Indonesia and Thailand as of Sep 2011; Hong Kong, China; Philippines; and Taipei,China as of Jun 2011; Malaysia as of Mar 2011.3Net interest margin of retail banks, year-to-date annualized.Source: ADB calculations using data from national sources and Global Financial Stability Report September 2011, International Monetary Fund.
Table 7: Risk-Weighted Capital Adequacy Ratios1 (% of risk-weighted assets)
Economy 2000–2004 Average
2005 2006 2007 2008 2009 20102 20113
China, People’s Rep. of -2.34 2.5 4.9 8.4 12.0 11.4 12.2 11.8
Hong Kong, China 16.1 14.8 14.9 13.4 14.7 16.8 15.9 15.9
Indonesia 18.7 19.3 21.3 19.3 16.8 17.4 17.2 16.6
Korea, Republic of 10.7 12.4 12.3 12.0 12.7 14.6 14.6 14.5
Malaysia 13.4 13.6 13.1 12.8 12.2 14.9 14.4 14.2
Philippines 17.0 17.7 18.5 15.9 15.7 16.0 16.5 17.4
Singapore 17.7 15.8 15.4 13.5 14.7 17.3 17.0 –
Taipei,China 10.5 10.3 10.1 10.6 10.8 11.6 12.0 11.7
Thailand 13.2 14.2 14.5 15.4 14.1 16.1 16.2 15.7
– = unavailable.1Based on official risk-adjusted capital adequacy ratios and applied to commercial banks for most economies except Hong Kong, China (covers authorized institutions) and the Philippines (covers universal and commercial banks). Data for the Philippines is on a consolidated, not solo, basis.2Data for Singapore as of Sep 2010.3Data for Indonesia, Malaysia and Thailand as of Sep 2011; Hong Kong, China; Republic of Korea; and Taipei,China as of Jun 2011; People’s Republic of China and Philippines as of Mar 2011.4Average of 2000 and 2002–2004 figures. Figure for 2000 is ratio for state commercial banks.Source: National sources and Global Financial Stability Report September 2011, International Monetary Fund.
20 December 2011 | Asia Economic Monitor Asia Economic Monitor | December 2011 21
Economic Performance
20 December 2011 | Asia Economic Monitor Asia Economic Monitor | December 2011 21
Table 9: Rate of Return on Commercial Bank Equity (% per annum)
Economy2000–2004
Average 2005 2006 2007 2008 2009 20101 20112
China, People’s Rep. of3 – 15.1 14.9 16.7 17.1 16.2 17.5 –
Hong Kong, China4 14.9 16.7 16.7 21.3 13.0 14.4 14.2 –
Indonesia 20.35 23.1 27.1 27.8 23.9 26.3 26.1 25.9
Korea, Republic of 7.2 20.3 15.6 16.2 9.1 6.6 7.7 –
Malaysia 16.2 15.7 17.3 19.8 18.6 14.0 16.6 18.9
Philippines 5.9 9.5 11.5 11.8 7.2 11.4 12.7 13.3
Singapore 9.6 11.2 13.7 12.9 10.7 10.8 12.3 –
Taipei,China 4.1 4.4 -7.3 2.6 -0.7 4.3 8.6 9.8
Thailand 13.3 16.5 10.2 2.8 12.2 10.4 12.1 13.6
– = unavailable. 1Data for Singapore as of Sep 2010.2Data for Thailand as of Sep 2011; Philippines and Taipei,China as of Jun 2011; Indonesia and Malaysia as of Mar 2011.3Total banking industry, except for 2006, which refers to four listed state-owned banks.4Post-tax profit to shareholders’ funds of locally incorporated licensed banks.5Average over a four-year period 2000-2004 that excludes 2003 when data was not available.Source: ADB calculations using data from national sources and Global Financial Stability Report September 2011, International Monetary Fund.
Table 10: Nonperforming Loans (% of commercial bank loans)
Economy2000–2004
Average 2005 2006 2007 2008 2009 20101 20112
China, People’s Rep. of 21.0 8.6 7.1 6.2 2.4 1.6 1.1 1.0
Hong Kong, China3 4.0 1.4 1.1 0.9 1.2 1.4 0.8 0.6
Indonesia 10.2 7.6 6.1 4.1 3.2 3.3 2.6 2.7
Korea, Republic of 3.1 1.3 0.9 0.7 1.2 1.2 1.9 1.6
Malaysia3 8.9 5.6 4.8 3.2 2.2 1.8 2.3 2.0
Philippines3 14.8 8.5 5.7 4.4 3.5 3.0 2.9 2.5
Singapore4 5.3 3.8 2.8 1.5 1.7 2.4 1.8 –
Taipei,China 5.2 2.2 2.1 1.8 1.5 1.2 0.6 0.5
Thailand3 13.5 8.3 7.5 7.3 5.3 4.8 3.6 3.2 – = unavailable. 1Data for Singapore as of Sep 2010.2Data for Indonesia, Malaysia and Thailand as of Sep 2011; Philippines as of Aug 2011; People’s Republic of China; Hong Kong, China; Republic of Korea; and Taipei,China as of Jun 2011.3Reported nonperforming loans are gross classified loans of retail banks.4Nonbank nonperforming loans to total nonbank loans. Source: National sources; CEIC; and Global Financial Stability Report September 2011, International Monetary Fund.

22 December 2011 | Asia Economic Monitor Asia Economic Monitor | December 2011 23
Emerging East Asia—A Regional Economic Update
22 December 2011 | Asia Economic Monitor Asia Economic Monitor | December 2011 23
42.4
18.6
14.3
5.5
4.9
2.0
15.6
8.0
26.9
0 5 10 15 20 25 30 35 40 45
Taipei,China
Hong Kong, China
China, People's Rep. of
Singapore
Philippines
Korea, Republic of
Thailand
Malaysia
Indonesia
2009201020112
Figure 29: Real Estate Loans1 (% of total loans)
1Data for People’s Republic of China includes loans for commercial real estate development of major financial institutions as percent of total renminbi and foreign currency loans of all financial institutions; for Hong Kong, China, loans of all authorized institutions for building, construction, property development over total loans and advances for use in Hong Kong, China; for Indonesia, real estate property loans as percent of outstanding loans in rupiah and foreign currency of commercial and rural banks; for Republic of Korea, real estate, renting and leasing loans over total loans of commercial and specialized banks; for Malaysia, real estate loans as percent of total loans of the banking system; for the Philippines, real estate, renting, and business activities loans over total loans of the banking system; for Singapore, business loans for building and construction as percent of total loans and advances of domestic banking units; for Taipei,China, loans and discounts at all banks for real estate; and for Thailand, real estate activities, renting and business credits as percent of total credits of all commercial banks.2Data as of Sep 2011 except for Republic of Korea and Philippines which are as of Jun 2011. Source: ADB calculations using data from People’s Bank of China, Hong Kong Monetary Authority, Bank Indonesia, Bank Negara Malaysia, Bangko Sentral ng Pilipinas (Philippines), Monetary Authority of Singapore, the Central Bank of the Republic of China (Taipei,China), Bank of Thailand, and CEIC.
-30
-20
-10
0
10
20
30
40
50
2007Q1 2007Q4 2008Q3 2009Q2 2010Q1 2010Q4 2011Q43
-13.6
30.3
19.3
26.9
-10.7
-2.60.9
-6.5
31.2
-24.9
38.2
17.6
8.5
Republic of Korea Singapore
Hong Kong, China
Figure 30: Growth of Housing Prices1—NIEs (y-o-y, %)2
NIE = newly industrialized economy, y-o-y = year-on-year.1Data for Hong Kong, China refer to property price index of domestic premises; Singapore to residential property price index; and Republic of Korea to housing price index. 2Average of three months for Hong Kong, China and Republic of Korea. Data for Hong Kong, China and Singapore until 2011Q3.3Average of October and November for Republic of Korea.Source: ADB calculations using data from CEIC.
rising. These are not easily monitored or regulated, and can lead to deterioration in the quality of bank assets, increased exposure to unsecured debt, the fanning of asset property bubbles, and greater economic imbalances.
Bank lending, while continuing to grow across the region, moderated somewhat on easing economic growth.
Weaker economic prospects have softened property markets in some of the region’s economies, resulting in moderation in loan growth. The PRC scaled back new credit after a major surge in 2009. Nevertheless, as of October this year, growth in bank lending remained strong at 15.8% (Figure 27). Measures to cool property markets appear to be working as the PRC housing price inflation slowed to 4.0% in the third quarter, although the share of real estate loans to total loans still increased marginally (Figures 28, 29). Weaker property markets also slowed bank lending growth in both Hong Kong, China—where bank lending peaked in May—and in Singapore, where lending growth currently appears to have stabilized (Figures 30, 31a). However, property price inflation in Hong Kong, China remains high at 19.3% in the third quarter. In response, authorities are increasing the land supply and announced the
construction of more public housing. A special stamp duty was also introduced to curb short-term speculative transactions on residential properties, and measures to ensure prudent bank mortgage underwriting practices were adopted. Bank lending growth in Thailand appears to be slowing, but continues to expand in Indonesia, Malaysia, Philippines, and Viet Nam (Figure 31b).

22 December 2011 | Asia Economic Monitor Asia Economic Monitor | December 2011 23
Economic Performance
22 December 2011 | Asia Economic Monitor Asia Economic Monitor | December 2011 23
21.9
24.1
-4.4
24.0
5.8
7.0
7.43.3
-10-505
101520253035
Jan-07
Sep-07
May-08
Jan-09
Sep-09
May-10
Jan-11
Sep-11
Singapore
Hong Kong, China
Republic of Korea
Taipei,China
Figure 31a: Bank Lending Growth1—NIEs (y-o-y, %)
NIE = newly industrialized economy, y-o-y = year-on-year.1Data for Hong Kong, China refer to authorized institutions’ loans and advances; Republic of Korea to commercial and specialized bank loans; Singapore to domestic banking unit loans and advances; and Taipei,China to domestic bank loans and advances.Source: ADB calculations using data from CEIC and Bank of Korea.
2.4
21.7
13.7
23.0
16.5
32.7
-100
10203040506070
Jan-07
Sep-07
May-08
Jan-09
Sep-09
May-10
Jan-11
Sep-11
Thailand
Indonesia
MalaysiaPhilippines
Viet Nam
Figure 31b: Bank Lending Growth1—ASEAN-4 plus Viet Nam (y-o-y, %)
y-o-y = year-on-year.1Data for Indonesia refer to commercial bank loans; Malaysia to commercial bank loans and advances; Philippines to commercial and universal bank loans net of reverse repurchase agreements; Thailand to commercial bank loans; and Viet Nam to claims on private sector of banking institutions. Data for Indonesia until Aug 2011; Viet Nam until April 2011.Source: ADB calculations using data from CEIC.

24 December 2011 | Asia Economic Monitor Asia Economic Monitor | December 2011 25
Emerging East Asia—A Regional Economic Update
24 December 2011 | Asia Economic Monitor Asia Economic Monitor | December 2011 25
Economic Outlook, Risks, and Policy IssuesExternal Economic Environment
Since mid-2011, the external environment for emerging East Asia has worsened; no resolution of the eurozone sovereign debt crisis is in sight and the US recovery remains fragile.
In the eurozone, there is rising concern of crisis contagion—Italy being the latest. In the US, the political impasse over economic policy ahead of the 2012 presidential elections—most recently the congressional deficit-reduction super committee’s failure to reach an agreement—suggests large stimulus measures are unlikely. Household spending remains weak as deleveraging consumer debt and home mortgages continue. High unemployment remains (Box 1). Global financial markets have been volatile as events over the debt crisis in Europe unfold. TED spreads—the difference between interbank rates and US Treasury bill rates—have risen sharply in the US but particularly in the eurozone since July on concerns over the health of European banking system (Figure 32). Credit default swap indexes, which measure the insurance costs of corporate defaults, have also increased in Europe and the US (Figure 33). Stock price indexes are down, though they have recently recovered somewhat (Figure 34). In addition, the Chicago Board Options Exchange (CBOE) Volatility Index or VIX—which measures US stock price volatility—has risen significantly (to 31.1 index points after starting to rise in July), as have emerging market bond spreads (to 357.8 index points) (Figure 35).
66.1
9.6
73.0
233.9
107.8
240.2
463.6
45.5
0
100
200
300
400
500
United States
Japan
eurozone
Jan-07
Aug-07
Apr-08
Dec-08
Aug-09
Apr-10
Nov-10
Jul- Nov-1111
Figure 32: TED Spreads1—G3 (basis points)
eurozone = Austria, Belgium, Cyprus, Estonia, Finland, France, Germany, Greece, Ireland, Italy, Luxembourg, Malta, Netherlands, Portugal, Slovakia, Slovenia, and Spain.1Difference between 3-month LIBOR (London Interbank Offered Rate) and 3-month government debt (e.g. Treasury bills).Source: ADB calculations using data from Bloomberg and Datastream.
149
635
456
101
237
560
136
279
117
0
100
200
300
400
500
600
700
iTRAXX Asia ex Japan iTRAXX Japan
iTRAXX Europe
CDX North America
Jan-08
Jul-08
Feb-09
Aug-09
Mar-10
Sep-10
Apr-11
Nov-11
Figure 33: Credit Default Swap Indexes (investment grade, senior 5-year)
Source: Bloomberg.
80
71
39
79
88
109
120
54
4550
24
93
77
20
60
100
140
Emerging Latin America
US Dow JonesIndustrial Average
Emerging Asia1
Emerging Europe
Jan-08
Jul-08
Feb-09
Aug-09
Mar-10
Sep-10
Apr-11
Nov-11
Figure 34: MSCI Indexes (2 Jan 2008 = 100)
Source: Morgan Stanley Capital International (MSCI) Barra and Datastream.
856.7
230.9
357.8
16.5
80.9
15.6
45.8
31.1
0100200300400500600700800900
1,000
Jan-08
Jul-08
Feb-09
Aug-09
Mar-10
Sep-10
Apr-11
Nov-11
0
30
60
90
JP Morgan EMBI+
VIX
JP Morgan EMBI+ VIX
Figure 35: Equity Market Volatility and Bond Spreads
JP Morgan EMBI + = JP Morgan Emerging Market Bond Indices Plus; VIX = Chicago Board Options Exchange Volatility Index.Source: Bloomberg.
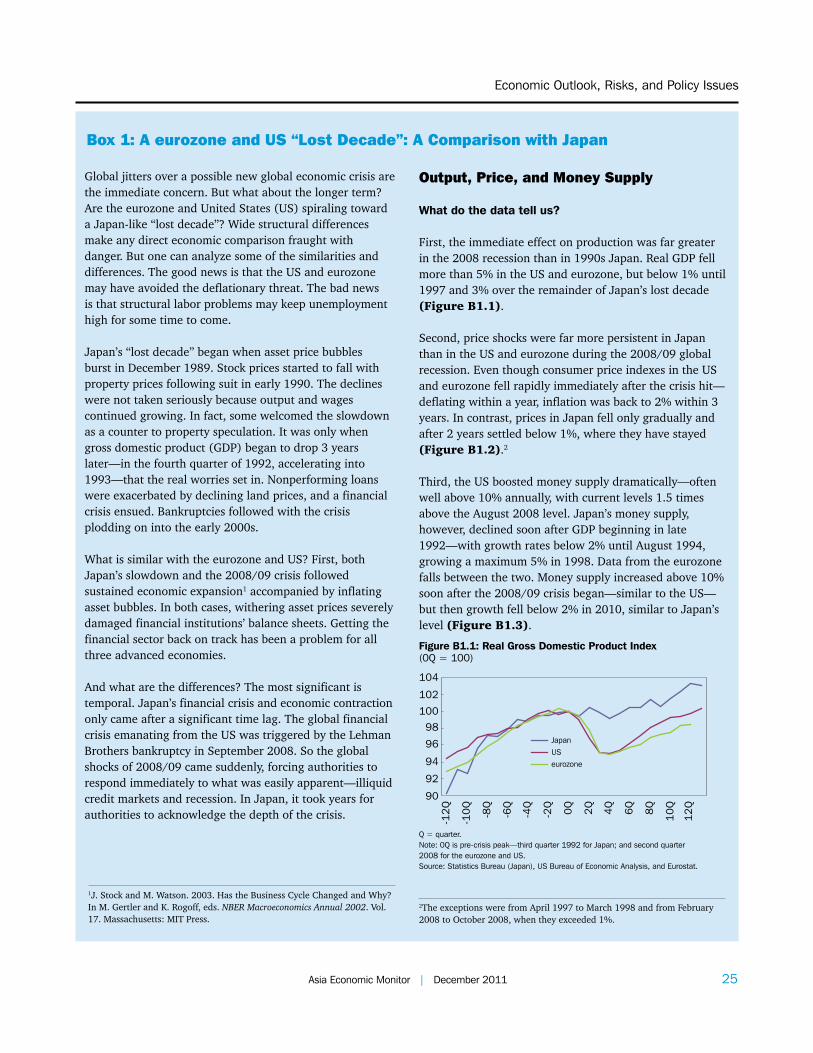
24 December 2011 | Asia Economic Monitor Asia Economic Monitor | December 2011 25
Economic Outlook, Risks, and Policy Issues
24 December 2011 | Asia Economic Monitor Asia Economic Monitor | December 2011 25
Global jitters over a possible new global economic crisis are the immediate concern. But what about the longer term? Are the eurozone and United States (US) spiraling toward a Japan-like “lost decade”? Wide structural differences make any direct economic comparison fraught with danger. But one can analyze some of the similarities and differences. The good news is that the US and eurozone may have avoided the deflationary threat. The bad news is that structural labor problems may keep unemployment high for some time to come.
Japan’s “lost decade” began when asset price bubbles burst in December 1989. Stock prices started to fall with property prices following suit in early 1990. The declines were not taken seriously because output and wages continued growing. In fact, some welcomed the slowdown as a counter to property speculation. It was only when gross domestic product (GDP) began to drop 3 years later—in the fourth quarter of 1992, accelerating into 1993—that the real worries set in. Nonperforming loans were exacerbated by declining land prices, and a financial crisis ensued. Bankruptcies followed with the crisis plodding on into the early 2000s.
What is similar with the eurozone and US? First, both Japan’s slowdown and the 2008/09 crisis followed sustained economic expansion1 accompanied by inflating asset bubbles. In both cases, withering asset prices severely damaged financial institutions’ balance sheets. Getting the financial sector back on track has been a problem for all three advanced economies.
And what are the differences? The most significant is temporal. Japan’s financial crisis and economic contraction only came after a significant time lag. The global financial crisis emanating from the US was triggered by the Lehman Brothers bankruptcy in September 2008. So the global shocks of 2008/09 came suddenly, forcing authorities to respond immediately to what was easily apparent—illiquid credit markets and recession. In Japan, it took years for authorities to acknowledge the depth of the crisis.
Box 1: A eurozone and US “Lost Decade”: A Comparison with Japan
Output, Price, and Money Supply
What do the data tell us?
First, the immediate effect on production was far greater in the 2008 recession than in 1990s Japan. Real GDP fell more than 5% in the US and eurozone, but below 1% until 1997 and 3% over the remainder of Japan’s lost decade (Figure B1.1).
Second, price shocks were far more persistent in Japan than in the US and eurozone during the 2008/09 global recession. Even though consumer price indexes in the US and eurozone fell rapidly immediately after the crisis hit—deflating within a year, inflation was back to 2% within 3 years. In contrast, prices in Japan fell only gradually and after 2 years settled below 1%, where they have stayed (Figure B1.2).2
Third, the US boosted money supply dramatically—often well above 10% annually, with current levels 1.5 times above the August 2008 level. Japan’s money supply, however, declined soon after GDP beginning in late 1992—with growth rates below 2% until August 1994, growing a maximum 5% in 1998. Data from the eurozone falls between the two. Money supply increased above 10% soon after the 2008/09 crisis began—similar to the US—but then growth fell below 2% in 2010, similar to Japan’s level (Figure B1.3).
90
92
94
96
98
100
102
104
-12
Q
-10
Q
-8Q
-6Q
-4Q
-2Q
0Q
2Q
4Q
6Q
8Q
10
Q
12
Q
JapanUSeurozone
Figure B1.1: Real Gross Domestic Product Index (0Q = 100)
Q = quarter.Note: 0Q is pre-crisis peak—third quarter 1992 for Japan; and second quarter 2008 for the eurozone and US. Source: Statistics Bureau (Japan), US Bureau of Economic Analysis, and Eurostat.
1J. Stock and M. Watson. 2003. Has the Business Cycle Changed and Why? In M. Gertler and K. Rogoff, eds. NBER Macroeconomics Annual 2002. Vol. 17. Massachusetts: MIT Press.
2The exceptions were from April 1997 to March 1998 and from February 2008 to October 2008, when they exceeded 1%.
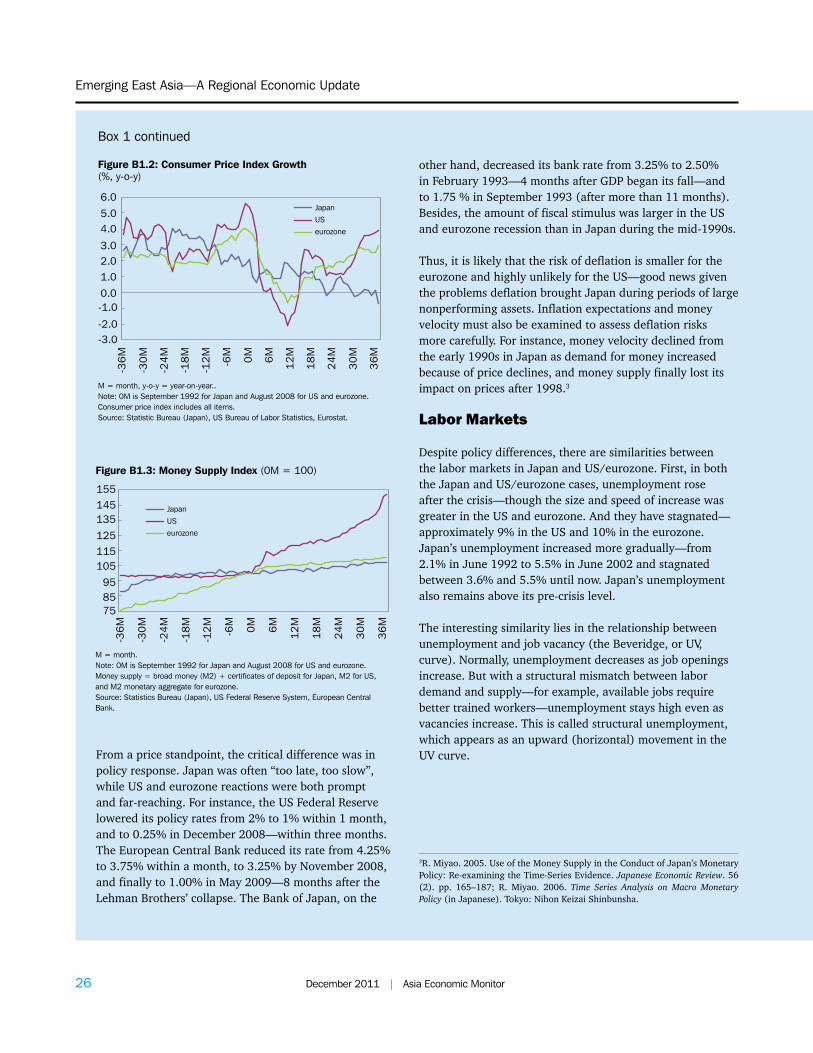
26 December 2011 | Asia Economic Monitor Asia Economic Monitor | December 2011 27
Emerging East Asia—A Regional Economic Update
26 December 2011 | Asia Economic Monitor Asia Economic Monitor | December 2011 27
JapanUSeurozone
-3.0-2.0
-1.00.0
1.02.03.0
4.05.0
6.0
-36
M
-30
M
-24
M
-18
M
-12
M
-6M
0M
6M
12
M
18
M
24
M
30
M
36
M
Figure B1.2: Consumer Price Index Growth (%, y-o-y)
M = month, y-o-y = year-on-year.. Note: 0M is September 1992 for Japan and August 2008 for US and eurozone. Consumer price index includes all items. Source: Statistic Bureau (Japan), US Bureau of Labor Statistics, Eurostat.
Box 1 continued
JapanUSeurozone
758595
105115125
135145155
-36
M
-30
M
-24
M
-18
M
-12
M
-6M
0M
6M
12
M
18
M
24
M
30
M
36
M
Figure B1.3: Money Supply Index (0M = 100)
M = month.Note: 0M is September 1992 for Japan and August 2008 for US and eurozone. Money supply = broad money (M2) + certificates of deposit for Japan, M2 for US, and M2 monetary aggregate for eurozone. Source: Statistics Bureau (Japan), US Federal Reserve System, European Central Bank.
From a price standpoint, the critical difference was in policy response. Japan was often “too late, too slow”, while US and eurozone reactions were both prompt and far-reaching. For instance, the US Federal Reserve lowered its policy rates from 2% to 1% within 1 month, and to 0.25% in December 2008—within three months. The European Central Bank reduced its rate from 4.25% to 3.75% within a month, to 3.25% by November 2008, and finally to 1.00% in May 2009—8 months after the Lehman Brothers’ collapse. The Bank of Japan, on the
other hand, decreased its bank rate from 3.25% to 2.50% in February 1993—4 months after GDP began its fall—and to 1.75 % in September 1993 (after more than 11 months). Besides, the amount of fiscal stimulus was larger in the US and eurozone recession than in Japan during the mid-1990s.
Thus, it is likely that the risk of deflation is smaller for the eurozone and highly unlikely for the US—good news given the problems deflation brought Japan during periods of large nonperforming assets. Inflation expectations and money velocity must also be examined to assess deflation risks more carefully. For instance, money velocity declined from the early 1990s in Japan as demand for money increased because of price declines, and money supply finally lost its impact on prices after 1998.3
Labor Markets
Despite policy differences, there are similarities between the labor markets in Japan and US/eurozone. First, in both the Japan and US/eurozone cases, unemployment rose after the crisis—though the size and speed of increase was greater in the US and eurozone. And they have stagnated—approximately 9% in the US and 10% in the eurozone. Japan’s unemployment increased more gradually—from 2.1% in June 1992 to 5.5% in June 2002 and stagnated between 3.6% and 5.5% until now. Japan’s unemployment also remains above its pre-crisis level.
The interesting similarity lies in the relationship between unemployment and job vacancy (the Beveridge, or UV, curve). Normally, unemployment decreases as job openings increase. But with a structural mismatch between labor demand and supply—for example, available jobs require better trained workers—unemployment stays high even as vacancies increase. This is called structural unemployment, which appears as an upward (horizontal) movement in the UV curve.
3R. Miyao. 2005. Use of the Money Supply in the Conduct of Japan’s Monetary Policy: Re-examining the Time-Series Evidence. Japanese Economic Review. 56 (2). pp. 165–187; R. Miyao. 2006. Time Series Analysis on Macro Monetary Policy (in Japanese). Tokyo: Nihon Keizai Shinbunsha.
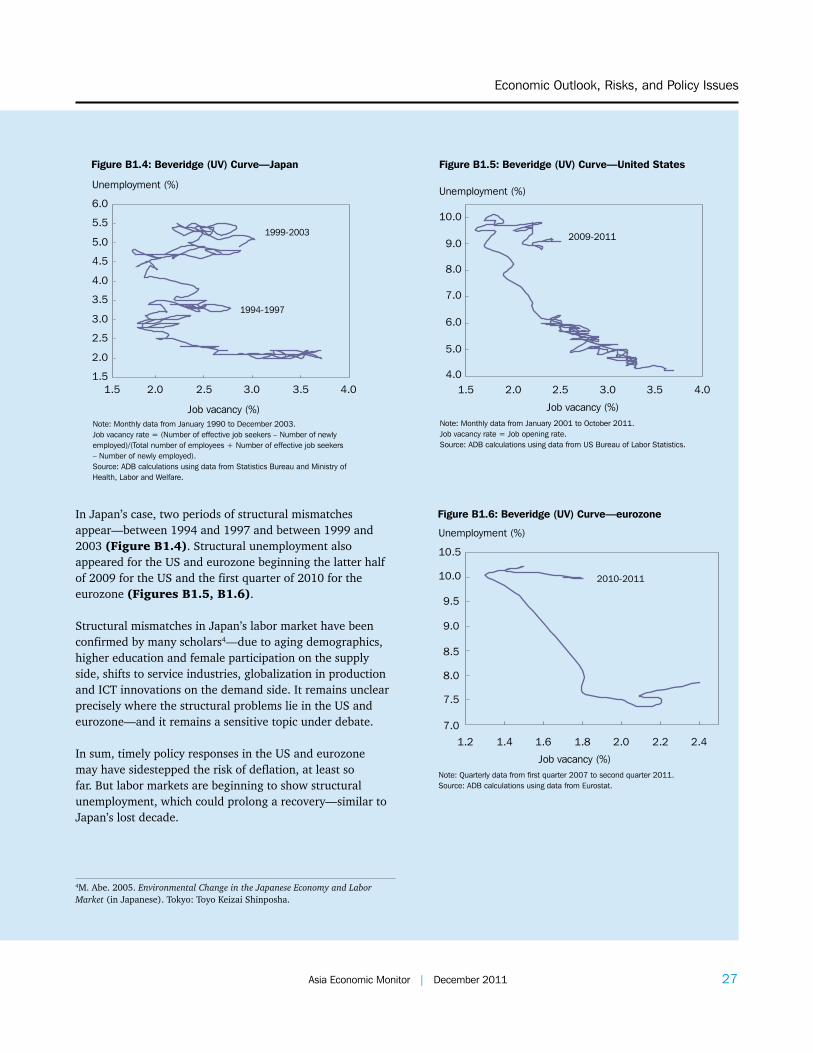
26 December 2011 | Asia Economic Monitor Asia Economic Monitor | December 2011 27
Economic Outlook, Risks, and Policy Issues
26 December 2011 | Asia Economic Monitor Asia Economic Monitor | December 2011 27
1.5
2.0
2.5
3.0
3.5
4.0
4.5
5.0
5.5
6.0
1.5 2.0 2.5 3.0 3.5 4.0
Job vacancy (%)
Unemployment (%)
1994-1997
1999-2003
Figure B1.4: Beveridge (UV) Curve—Japan
Note: Monthly data from January 1990 to December 2003.Job vacancy rate = (Number of effective job seekers – Number of newly employed)/(Total number of employees + Number of effective job seekers – Number of newly employed).Source: ADB calculations using data from Statistics Bureau and Ministry of Health, Labor and Welfare.
In Japan’s case, two periods of structural mismatches appear—between 1994 and 1997 and between 1999 and 2003 (Figure B1.4). Structural unemployment also appeared for the US and eurozone beginning the latter half of 2009 for the US and the first quarter of 2010 for the eurozone (Figures B1.5, B1.6).
Structural mismatches in Japan’s labor market have been confirmed by many scholars4—due to aging demographics, higher education and female participation on the supply side, shifts to service industries, globalization in production and ICT innovations on the demand side. It remains unclear precisely where the structural problems lie in the US and eurozone—and it remains a sensitive topic under debate.
In sum, timely policy responses in the US and eurozone may have sidestepped the risk of deflation, at least so far. But labor markets are beginning to show structural unemployment, which could prolong a recovery—similar to Japan’s lost decade.
4.0
5.0
6.0
7.0
8.0
9.0
10.0
1.5 2.0 2.5 3.0 3.5 4.0
Job vacancy (%)
Unemployment (%)
2009-2011
Figure B1.5: Beveridge (UV) Curve—United States
Note: Monthly data from January 2001 to October 2011.Job vacancy rate = Job opening rate.Source: ADB calculations using data from US Bureau of Labor Statistics.
7.0
7.5
8.0
8.5
9.0
9.5
10.0
10.5
1.2 1.4 1.6 1.8 2.0 2.2 2.4
Job vacancy (%)
Unemployment (%)
2010-2011
Figure B1.6: Beveridge (UV) Curve—eurozone
Note: Quarterly data from first quarter 2007 to second quarter 2011. Source: ADB calculations using data from Eurostat.
4M. Abe. 2005. Environmental Change in the Japanese Economy and Labor Market (in Japanese). Tokyo: Toyo Keizai Shinposha.

28 December 2011 | Asia Economic Monitor Asia Economic Monitor | December 2011 29
Emerging East Asia—A Regional Economic Update
28 December 2011 | Asia Economic Monitor Asia Economic Monitor | December 2011 29
1.8
2.5
0.81.2 0.8
-0.5-1
0
1
2
3
4
Jan-07
Aug-07
Apr-08
Dec-08
Aug-09
Apr-10
Nov-10
Jul-
eurozone
United StatesUnited Kingdom
Japan
Nov-1111
1.0
-0.3
3.22.9
1.7
1.5 1.4
Figure 36: 10-year and 2-year Government Bond Yield Spreads (% per annum)
eurozone = Austria, Belgium, Cyprus, Estonia, Finland, France, Germany, Greece, Ireland, Italy, Luxembourg, Malta, Netherlands, Portugal, Slovakia, Slovenia, and Spain.Source: Datastream.
-8.9
3.8
2.0
0.4
-10
-7
-4
-1
2
5
2007Q1 2007Q4 2008Q3 2009Q2 2010Q1 2010Q4 2011Q32
Personal consumptionGovernment consumptionPrivate domestic investmentNet exportsGDP growth (saar, q-o-q, %)
Figure 37: Contributions to GDP Growth—US (percentage points1)
GDP = gross domestic product, q-o-q = quarter-on-quarter, saar = seasonally adjusted annualized rate, US = United States. 1Based on saar, q-o-q changes.2Second estimate as of 22 Nov 2011.Source: US Bureau of Economic Analysis.
Spreads between 10-year and 2-year bond yields in the US and the UK have converged (to 1.8% and 1.7%, respectively), while those in the eurozone declined to 1.4% (Figure 36). The narrowing yield spreads in the eurozone may indicate that investors expect austerity and monetary tightening will continue for the foreseeable future.
The US recovery is edging forward, but remains fragile.
The US economy grew 2.0% in the third quarter on a quarter-on-quarter (q-o-q) seasonally adjusted annualized rate (saar) from 1.3% (q-o-q, saar) in the second quarter, pushing the economy above its pre-global financial crisis
6.4
4.9
1.5
0.5
0.7
0.0
0.8
1.6
2.4
3.2
4.0
4.8
5.6
6.4
7.2
Jan-07
Jul-07
Jan-08
Jul-08
Jan-09
Jul-09
Jan-10
Jul-10
Jan-11
Jul-11
Sep-11
0.0
0.4
0.8
1.2
1.6
Sales
Sales
Starts
Starts
Figure 38: Private Housing Starts1 and Existing Home Sales2—United States (million units)
1Seasonally adjusted levels.2Seasonally adjusted and annualized.Source: CEIC.
peak (Figure 37). The third quarter expansion came largely from stronger growth in personal consumption (2.3% in the third quarter compared to 0.7% in the second), nonresidential fixed investment (14.8% from 10.3%), and exports (4.3% against 3.6%). Nonetheless, leading indicators suggest the economy remains frail. Housing starts continue to languish, existing home sales remain relatively low, and housing prices are well below pre-crisis levels (Figures 38, 39). From a bullish first quarter, business and consumer confidence have weakened (Figure 40). Similarly, while non-farm employment has been rising, monthly increments have been below first half levels and unemployment remains stubbornly high (Figure 41). Moreover, real disposable income has been declining (2.1% in the third

28 December 2011 | Asia Economic Monitor Asia Economic Monitor | December 2011 29
Economic Outlook, Risks, and Policy Issues
28 December 2011 | Asia Economic Monitor Asia Economic Monitor | December 2011 29
203.7
141.5 140.6
100
120
140
160
180
200
220
Jan-07
Aug-07
Apr-08
Dec-08
Aug-09
Apr-10
Nov-10
Jul- Aug-1111
Figure 39: Standard and Poor’s/Case-Shiller Home Price Index1—United States
120-city composite index, seasonally adjusted.Source: Standard and Poor’s.
53
67
55
42
50
112
27
72
40
20
30
40
50
60
70
0
20
40
60
80
100
120
Business Confidence Index Consumer Confidence Index
24
Jan-07
Aug-07
Apr-08
Dec-08
Aug-09
Apr-10
Nov-10
Jul- Oct-1111
Figure 40: Business and Consumer Confidence Indexes—United States
Note: Consumer confidence (1985 = 100). A business confidence index above 50 means there are more positive than negative responses. Consumer confidence index is monthly; business confidence index is quarterly.Source: Datastream.
80
-192
458
-820
127
-49
9.0
9.810.1
4.9
4.6
-900
-700
-500
-300
-100
100
300
500
700
Jan-07
Apr-07
Jul-07
Oct-07
Jan-08
Apr-08
Jul-08
Oct-08
Jan-09
Apr-09
Jul-09
Oct-09
Jan-10
Apr-10
Jul-10
Oct-10
Jan-11
Apr-11
Jul-11
Oct-11
-18
-13
-8
-3
2
7
12
m-o-m, thousands %
Change in non-farmemployment
Unemployment Rate
Figure 41: Unemployment Rate and Change in Non-Farm Employment—United States1
m-o-m = month-on-month.1Change in non-farm employment figures for Sept and Oct 2011 are preliminary.Source: ADB calculations using data from the US Bureau of Labor Statistics.
quarter on top of a 0.5% fall in the second quarter). Capacity utilization, though rising, remains below the pre-crisis level of 80%, while growth in industrial production has dropped to 3.2% from its 7.7% peak in June 2010 (Figure 42). The Purchasing Managers’ Index increased to 52.7 in November 2011 from 50.8 in October, suggesting that manufacturing is only inching up. Economic growth in 2011 is estimated at 1.6%, while weak consumer confidence and continued high unemployment levels will limit the upward expansion to 2.1% in 2012.
74.367.3
77.4
3.1
-8.6
-14.8
7.7
3.2
0102030405060708090
-20
-15
-10
-5
0
5
10
% growth, y-o-y%
Industrial Production
Capacity Utilization
Jan-07
Aug-07
Apr-08
Dec-08
Aug-09
Apr-10
Nov-10
Jul- Sep-1111
Figure 42: Industrial Production Growth and Capacity Utilization Rate—United States
y-o-y = year-on-year.Source: Board of Governors of the US Federal Reserve System.

30 December 2011 | Asia Economic Monitor Asia Economic Monitor | December 2011 31
Emerging East Asia—A Regional Economic Update
30 December 2011 | Asia Economic Monitor Asia Economic Monitor | December 2011 31
3.13.8
-0.8
-10.2
2.4
-12-10
-8-6-4-20246
2007Q1 2007Q4 2008Q3 2009Q2 2010Q1 2010Q4
Private consumptionGovernment consumptionInvestmentNet exportsStatistical discrepancyGDP growth (saar, q-o-q, %)
2011Q32
0.6
Figure 43: Contributions to GDP Growth—eurozone(percentage points1)
eurozone = Austria, Belgium, Cyprus, Estonia, Finland, France, Germany, Greece, Ireland, Italy, Luxembourg, Malta, Netherlands, Portugal, Slovakia, Slovenia, and Spain; GDP = gross domestic product; q-o-q = quarter-on-quarter; saar = seasonally adjusted annualized rate.1Based on saar, q-o-q changes.2Flash estimate as of 15 Nov 2011.Source: Eurostat.
Uncertainty over the unresolved eurozone sovereign debt crisis will likely keep economic growth anemic.
Eurozone economies eked out 0.6% (q-o-q, saar) growth in the third quarter, down from 0.7% (q-o-q, saar) in the second quarter. However, there were sharp divisions between individual economies, with Germany and France growing 2.0% and 1.6%, respectively, against Spain with zero growth. Decelerating investment growth contributed to the weak performance (Figure 43). Business and consumer confidence continue to wane with the economic sentiment indicator declining to 94.8 points in October from its 108.0 point peak in February (Figure 44). Other leading indicators are also weak. August growth in exports and industrial production slumped to 7.2% and 4.2%, respectively, while retail sales has been contracting since April (Figures 45, 46). With their fiscal health already under close scrutiny, eurozone economies have limited options for stimulus. This, combined with the fragile health of the banking system, suggests the slowdown in growth may be prolonged. Low business and consumer confidence, together with the tight fiscal stance, will likely push eurozone growth down to 1.7% in 2011, further falling to 0.5% in 2012.
Despite the announced “comprehensive” rescue package, eurozone tension remains the paramount global economic threat.
The main concern is that a potential Greek default could have ramifications beyond its borders. Other highly indebted eurozone economies—such as Spain, Portugal, Ireland, and Italy—will fall under closer market scrutiny.
109.5
72.5
108.0
94.8
60
70
80
90
100
110
120
Jan-07
Jul-07
Jan-08
Jul-08
Jan-09
Jul-09
Jan-10
Jul-10
Jan-11
Jul-11
Oct-11
Figure 44: Economic Sentiment Indicator1—eurozone
eurozone = Austria, Belgium, Cyprus, Estonia, Finland, France, Germany, Greece, Ireland, Italy, Luxembourg, Malta, Netherlands, Portugal, Slovakia, Slovenia, and Spain.1The economic sentiment indicator is a composite index of business and consumer confidence indicators based on surveys of economic assessments and expectations. Source: Datastream.
9.6
-22.7
24.2
9.4
-30
-20
-10
0
10
20
30
Jan-07
Jul-07
Jan-08
Jul-08
Jan-09
Jul-09
Jan-10
Jul-10
Jan-11
Sep-11
Figure 45: Export Growth1—eurozone (y-o-y, %)
eurozone = Austria, Belgium, Cyprus, Estonia, Finland, France, Germany, Greece, Ireland, Italy, Luxembourg, Malta, Netherlands, Portugal, Slovakia, Slovenia, and Spain; 1Year-on-year (y-o-y) growth of 3-month moving averages of export values.Source: ADB calculations usind data from Datastream.
This has led eurozone governments to piece together a Greek rescue package designed to insulate other economies from possible fallout. However, economic and political leaders remain divided on the details of the plan. And the lack of clear collective action in the eurozone keeps resolution of the Greek debt crisis uncertain. It also casts doubt over the future of eurozone sovereign debt in general. It has driven up sovereign bond yields, particularly in Portugal and, most recently, Italy, and credit default swap indexes (Figures 47a, 47b, 48). A consequence thus far on emerging East Asia has been that eurozone banks’ recall of loan funds resulted in net outflows of “other investments” in the Republic of Korea. To stem a creeping liquidity crunch, the US Federal Reserve, the European Central Bank, and the central banks of Canada, Japan, Switzerland, and the United Kingdom agreed to extend the terms and lower the costs of reciprocal currency arrangements (or swap lines) among them, as well as increase the funds for these

30 December 2011 | Asia Economic Monitor Asia Economic Monitor | December 2011 31
Economic Outlook, Risks, and Policy Issues
30 December 2011 | Asia Economic Monitor Asia Economic Monitor | December 2011 31
-19.8
9.3
4.2
2.2 1.5
-0.6
-20
-15
-10
-5
0
5
10
Jan-07
Jul-07
Jan-08
Jul-08
Jan-09
Jul-09
Jan-10
Jul-10
Jan-11
Jul-11
Sep-11
Retail sales
Industrial production
%
Figure 46: Growth of Retail Sales and Industrial Production1—eurozone (y-o-y, %)
eurozone = Austria, Belgium, Cyprus, Estonia, Finland, France, Germany, Greece, Ireland, Italy, Luxembourg, Malta, Netherlands, Portugal, Slovakia, Slovenia, and Spain; y-o-y = year-on-year.1Working-day adjusted, year-on-year growth rate of 3-month moving averages. Retail sales data until Sep 2011. Industrial production data until Aug 2011. Source: ADB calculations using data from CEIC.
13.313.6
41.9
7.1
4.15.2
05
1015202530354045
Jan-08
Aug-08
Apr-08
Dec-08
Aug-09
Apr-10
Dec-10
Aug-11
PortugalGreece
Ireland
Spain
Italy
Nov-11
Figure 47b: Sovereign Bond Yield Spreads1—Selected European economies (%, 5-year)
1Spread from German sovereign bond yields of the same tenor. Source: Bloomberg.
14.3
1.0
43.0
8.2
5.26.3
05
101520253035404550
Jan- 08
Jul- 08
Feb- 09
Aug- 09
Mar- 10
Sep- 10
Apr- 11
Nov- 11
Portugal
Germany
GreeceIreland
Spain
Italy
Figure 47a: Sovereign Bond Yields—Selected European economies (%, 5-year)
Source: Bloomberg.
transactions. As the central banks can lend currencies “borrowed” using this facility to cash-strapped banks in their countries at lower than market rates, it will likely ensure the flow of credit to businesses and households. However, the swap lines on their own do not solve the sovereign debt crisis of the eurozone.
Japan’s economy is forecast to bounce back from the effects of its natural disasters.
The Japanese economy showed zero growth in the third quarter after contracting 1.0% in the first half. But quarter-on-quarter, GDP rebounded 6.0% (saar) in the third quarter after contracting three consecutive quarters. Private consumption and private investment both recovered strongly (Figure 49). Rebuilt supply chains
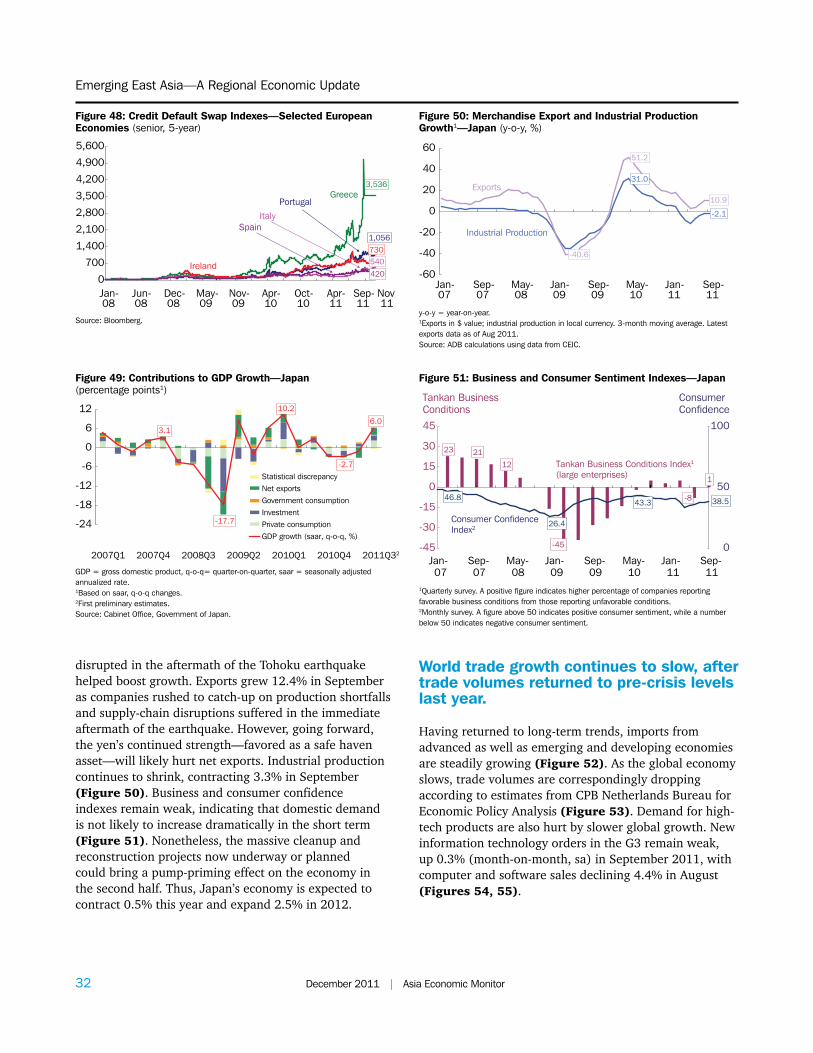
32 December 2011 | Asia Economic Monitor Asia Economic Monitor | December 2011 33
Emerging East Asia—A Regional Economic Update
32 December 2011 | Asia Economic Monitor Asia Economic Monitor | December 2011 33
3,536
1,056
540730
4200
700
1,400
2,100
2,800
3,500
4,200
4,900
5,600
Jan-08
Jun-08
Dec-08
May-09
Nov-09
Apr-10
Oct-10
Apr-11
Sep-11
Greece
Ireland
Portugal
SpainItaly
Nov-11
Figure 48: Credit Default Swap Indexes—Selected European Economies (senior, 5-year)
Source: Bloomberg.
-2.7
10.2
-17.7
3.16.0
-24
-18
-12
-6
0
6
12
2007Q1 2007Q4 2008Q3 2009Q2 2010Q1 2010Q4 2011Q32
Statistical discrepancyNet exportsGovernment consumptionInvestmentPrivate consumptionGDP growth (saar, q-o-q, %)
Figure 49: Contributions to GDP Growth—Japan (percentage points1)
GDP = gross domestic product, q-o-q= quarter-on-quarter, saar = seasonally adjusted annualized rate.1Based on saar, q-o-q changes.2First preliminary estimates.Source: Cabinet Office, Government of Japan.
disrupted in the aftermath of the Tohoku earthquake helped boost growth. Exports grew 12.4% in September as companies rushed to catch-up on production shortfalls and supply-chain disruptions suffered in the immediate aftermath of the earthquake. However, going forward, the yen’s continued strength—favored as a safe haven asset—will likely hurt net exports. Industrial production continues to shrink, contracting 3.3% in September (Figure 50). Business and consumer confidence indexes remain weak, indicating that domestic demand is not likely to increase dramatically in the short term (Figure 51). Nonetheless, the massive cleanup and reconstruction projects now underway or planned could bring a pump-priming effect on the economy in the second half. Thus, Japan’s economy is expected to contract 0.5% this year and expand 2.5% in 2012.
31.0
-2.1
-40.6
10.9
51.2
-60
-40
-20
0
20
40
60
Jan-07
Sep-07
May-08
Jan-09
Sep-09
May-10
Jan-11
Sep-11
Industrial Production
Exports
Figure 50: Merchandise Export and Industrial Production Growth1—Japan (y-o-y, %)
y-o-y = year-on-year. 1Exports in $ value; industrial production in local currency. 3-month moving average. Latest exports data as of Aug 2011.Source: ADB calculations using data from CEIC.
21
12
1
-8
23
-45
38.546.8
26.4
43.3
-45
-30
-15
0
15
30
45
Jan- 07
Sep- 07
May- 08
Jan- 09
Sep- 09
May- 10
Jan- 11
Sep- 11
0
50
100
Tankan Business Conditions Index1
(large enterprises)
Consumer ConfidenceIndex2
Tankan BusinessConditions
ConsumerConfidence
Figure 51: Business and Consumer Sentiment Indexes—Japan
1Quarterly survey. A positive figure indicates higher percentage of companies reporting favorable business conditions from those reporting unfavorable conditions. 2Monthly survey. A figure above 50 indicates positive consumer sentiment, while a number below 50 indicates negative consumer sentiment.
World trade growth continues to slow, after trade volumes returned to pre-crisis levels last year.
Having returned to long-term trends, imports from advanced as well as emerging and developing economies are steadily growing (Figure 52). As the global economy slows, trade volumes are correspondingly dropping according to estimates from CPB Netherlands Bureau for Economic Policy Analysis (Figure 53). Demand for high-tech products are also hurt by slower global growth. New information technology orders in the G3 remain weak, up 0.3% (month-on-month, sa) in September 2011, with computer and software sales declining 4.4% in August (Figures 54, 55).

32 December 2011 | Asia Economic Monitor Asia Economic Monitor | December 2011 33
Economic Outlook, Risks, and Policy Issues
32 December 2011 | Asia Economic Monitor Asia Economic Monitor | December 2011 33
Aug-11
994.0
36.3
-29.4
25.5
18.9
24.3
-31.2
-1200
-600
0
600
1200
Jan-07
Apr-07
Jul-07
Oct-07
Jan-08
Apr-08
Jul-08
Oct-08
Jan-09
Apr-09
Jul-09
Oct-09
Jan-10
Apr-10
Jul-10
Oct-10
Jan-11
Apr-11
-50
-25
0
25
50
Emerging and developingeconomies ($ billion, LHS)
Advanced economies ($ billion, LHS)
Emerging and developingeconomies (%, RHS)
$ billiony-o-y, %growth1
Advanced economies (%, RHS)
Figure 52: Imports—Advanced Economies; Emerging and Developing Economies
LHS = left-hand scale, RHS = right-hand scale, y-o-y = year-on-year.1Growth rates of 3-month moving average. Data for emerging and developing economies until Jun 2011.Source: International Financial Statistics, International Monetary Fund.
167
135.0
3.6
18.3
-18.3
7.7
5.6
19.6
-18.1
7.7
-200
-150
-100
-50
0
50
100
150
200
Jan-07
Apr-07
Jul-07
Oct-07
Jan-08
Apr-08
Jul-08
Oct-08
Jan-09
Apr-09
Jul-09
Oct-09
Jan-10
Apr-10
Jul-10
Oct-10
Jan-11
Apr-11
-25
0
25
15
-15
5
-5
y-o-y, %growth
World Trade Volume
World Imports(% change)
World Exports(% change)
Index (2000=100)
Aug-11
Figure 53. World Trade Volume (seasonally adjusted index, % growth)
y-o-y = year-on-year.Source: ADB calculations using data from CPB Netherlands Bureau for Economic Policy Analysis.

34 December 2011 | Asia Economic Monitor Asia Economic Monitor | December 2011 35
Emerging East Asia—A Regional Economic Update
34 December 2011 | Asia Economic Monitor Asia Economic Monitor | December 2011 35
0.3
-6.8
5.8
-8-6-4-202468
Jan-07
Sep-07
May-08
Sep-09
Jan-09
May-10
Sep-11
Jan-11
Figure 54: Growth of New Information Technology Orders—G31
(seasonally adjusted, m-o-m, %)2
m-o-m = month-on-month.1eurozone, Japan, and United States. 23-month moving average.Source: ADB calculations using data from national sources.
Figure 55: Computer and Software Sales Growth—G31 (y-o-y, %)
Aug-11
0.8 1.3
-13.2
11.9
-4.4
-20
-15
-10
-5
0
5
10
15
20
Jan-07
Jul-07
Jan-08
Jul-08
Jan-09
Jul-09
Jan-10
Jul-10
Jan-11
y-o-y = year-on-year.13-month moving average of y-o-y growth in sales values. G3 refers to eurozone, Japan and United States.Source: Datastream and Eurostat.
Weak economic prospects and high unemployment in the US and the eurozone suggest that inflation is unlikely to rise further.
Since 2010, headline inflation has been rising due to the accelerating prices of food and energy (Figure 56). But core inflation, while edging up, remains low (Figure 57). Excess capacity in advanced economies should help put downward pressure on prices. Unemployment rates have stayed stubbornly high in the US and the eurozone, and capacity utilization in the US is still below pre-crisis levels (Figure 58; see Figure 42). In the US and France, implied inflationary expectations—estimated by the yield difference between 10-year bonds and 10-year inflation-linked bonds—have fallen slightly (Figure 59).
2.7
1.5 1.2
2.0
-1.5-1.0
0.6
-0.5
3.0
2.1
-0.4
-2
-1
0
1
2
3
Jan-07
Jul-07
Jan-08
Jul-08
Jan-09
Jul-09
Jan-10
Jul-10
Jan-11
Jul-11
Oct-11
United States
Japan
eurozone
Figure 57: Core Inflation—eurozone, Japan, and United States (y-o-y, %)
eurozone=Austria, Belgium, Cyprus, Estonia, Finland, France, Germany, Greece, Ireland, Italy, Luxembourg, Malta, Netherlands, Portugal, Slovakia, Slovenia, and Spain; y-o-y = year-on-year.Source: ADB calculations using data from CEIC.
4.5
10.1
9.09.3
10.2
3.94.1
2
4
6
8
10
12
Jan-07
Jul-07
Jan-08
Jul-08
Jan-09
Jul-09
Jan-10
Jul-10
Jan-11
Jul-11
Oct-11
eurozone
United States
Japan
Figure 58: Unemployment Rate—eurozone1, Japan, and United States (seasonally adjusted, % of labor force)
eurozone = Austria, Belgium, Cyprus, Estonia, Finland, France, Germany, Greece, Ireland, Italy, Luxembourg, Malta, Netherlands, Portugal, Slovakia, Slovenia, and Spain. 1Data for US until Oct 2011; data for eurozone and Japan until Sep 2011.Source: US Bureau of Labor Statistics, European Central Bank, and CEIC.
3.3
-2.5
5.6
United States
eurozoneJapan
3.5
-0.2
3.0
-3-2-101234567
Jan-07
Jul-07
Jan-08
Jul-08
Jan-09
Jul-09
Jan-10
Jul-10
Jan-11
Jul-11
Oct-11
2.7
-0.6
Figure 56: Headline Inflation—eurozone, Japan, and United States (y-o-y, %)
eurozone = Austria, Belgium, Cyprus, Estonia, Finland, France, Germany, Greece, Ireland, Italy, Luxembourg, Malta, Netherlands, Portugal, Slovakia, Slovenia, and Spain; y-o-y = year-on-year.Source: ADB calculations using data from CEIC.
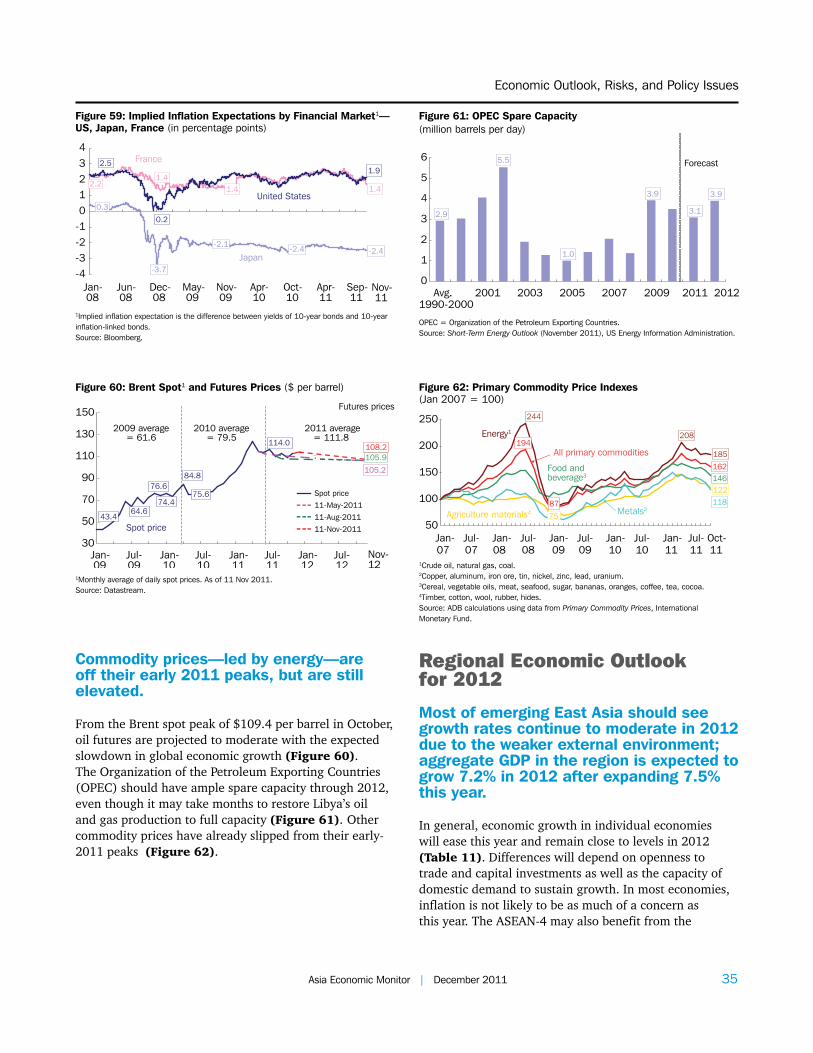
34 December 2011 | Asia Economic Monitor Asia Economic Monitor | December 2011 35
Economic Outlook, Risks, and Policy Issues
34 December 2011 | Asia Economic Monitor Asia Economic Monitor | December 2011 35
0.3
-3.7
-2.1-2.4 -2.4
2.21.4
1.4 1.4
2.5
0.2
1.9
-4-3-2-101234
Jan-08
Jun-08
Dec-08
May-09
Nov-09
Apr-10
Oct-10
Apr-11
Sep-11
United States
Japan
France
Nov-11
Figure 59: Implied Inflation Expectations by Financial Market1—US, Japan, France (in percentage points)
1Implied inflation expectation is the difference between yields of 10-year bonds and 10-year inflation-linked bonds.Source: Bloomberg.
Commodity prices—led by energy—are off their early 2011 peaks, but are still elevated.
From the Brent spot peak of $109.4 per barrel in October, oil futures are projected to moderate with the expected slowdown in global economic growth (Figure 60). The Organization of the Petroleum Exporting Countries (OPEC) should have ample spare capacity through 2012, even though it may take months to restore Libya’s oil and gas production to full capacity (Figure 61). Other commodity prices have already slipped from their early-2011 peaks (Figure 62).
43.464.6
76.6
74.4
84.8
75.6
114.0
105.2
105.9
30
50
70
90
110
130
150
Jan-09
Jul-09
Jan-10
Jul-10
Jan-11
Jul-11
Jan-12
Jul-12
Spot price11-May-201111-Aug-201111-Nov-2011
Futures prices
Spot price
2009 average = 61.6
2010 average = 79.5
Nov-12
2011 average= 111.8
108.2
Figure 60: Brent Spot1 and Futures Prices ($ per barrel)
1Monthly average of daily spot prices. As of 11 Nov 2011.Source: Datastream.
2.9
1.0
3.9
3.1
3.9
5.5
0
1
2
3
4
5
6
Avg. 2001 2003 2005 2007 2009 2011 20121990-2000
Forecast
Figure 61: OPEC Spare Capacity (million barrels per day)
OPEC = Organization of the Petroleum Exporting Countries.Source: Short-Term Energy Outlook (November 2011), US Energy Information Administration.
87
194
162146
75
122
118
208
244
185
50
100
150
200
250
Jan- Jul-07
Jan- Jul-08
Jan- Jul-09
Jan- Jul-10
Jan- Jul-11
All primary commodities
Metals2
Food andbeverage3
Agriculture materials4
Energy1
Oct-1107 08 09 10 11
Figure 62: Primary Commodity Price Indexes (Jan 2007 = 100)
1Crude oil, natural gas, coal. 2Copper, aluminum, iron ore, tin, nickel, zinc, lead, uranium. 3Cereal, vegetable oils, meat, seafood, sugar, bananas, oranges, coffee, tea, cocoa. 4Timber, cotton, wool, rubber, hides. Source: ADB calculations using data from Primary Commodity Prices, International Monetary Fund.
Regional Economic Outlook for 2012
Most of emerging East Asia should see growth rates continue to moderate in 2012 due to the weaker external environment; aggregate GDP in the region is expected to grow 7.2% in 2012 after expanding 7.5% this year.
In general, economic growth in individual economies will ease this year and remain close to levels in 2012 (Table 11). Differences will depend on openness to trade and capital investments as well as the capacity of domestic demand to sustain growth. In most economies, inflation is not likely to be as much of a concern as this year. The ASEAN-4 may also benefit from the

36 December 2011 | Asia Economic Monitor Asia Economic Monitor | December 2011 37
Emerging East Asia—A Regional Economic Update
36 December 2011 | Asia Economic Monitor Asia Economic Monitor | December 2011 37
Table 11: Annual GDP Growth Rates (y-o-y, %)
2001–2010
Average 2006 2007 2008 2009 20102011Q1-Q3 2011Q1 2011Q2 2011Q3
ADB September Forecast
Revised Forecast
2011 2012 2011 2012
Emerging East Asia1,2 7.4 9.3 10.4 6.8 5.8 9.4 7.6 8.1 7.4 7.3 7.6 7.5 7.5 7.2
ASEAN1,2,3 4.8 6.1 6.6 4.3 1.3 7.9 5.1 5.8 4.2 5.3 5.4 5.6 4.8 5.3
Brunei Darussalam4 1.5 4.4 0.2 -1.9 -1.8 2.0 – – – – 1.7 1.8 1.7 1.8
Cambodia4 8.0 10.8 10.2 6.7 0.1 6.3 – – – – 6.8 6.5 6.8 6.5
Indonesia 5.1 5.5 6.3 6.0 4.6 6.1 6.5 6.5 6.5 6.5 6.6 6.8 6.6 6.5
Lao PDR4 6.7 8.1 7.9 7.2 7.3 7.5 – – – – 8.1 7.6 8.1 7.6
Malaysia 4.3 5.8 6.5 4.8 -1.6 7.2 5.1 5.2 4.3 5.8 4.8 5.1 4.8 4.7
Myanmare 7.7 7.0 5.5 3.6 5.1 5.3 – – – – 5.3 5.4 5.3 5.4
Philippines 4.6 5.2 6.6 4.2 1.1 7.6 3.6 4.6 3.1 3.2 4.7 5.1 3.7 4.8
Thailand 4.2 5.1 5.0 2.5 -2.3 7.8 3.1 3.2 2.7 3.5 4.0 4.5 2.0 4.5
Viet Nam 7.2 8.2 8.5 6.3 5.3 6.8 5.8 5.4 5.7 6.1 5.8 6.5 5.8 6.3
Newly Industrialized Economies1
3.9 5.8 5.8 1.9 -0.6 8.2 4.3 5.7 3.7 3.8 4.7 4.5 4.2 4.0
Hong Kong, China 3.8 7.0 6.4 2.3 -2.7 7.0 5.6 7.5 5.3 4.3 5.5 4.7 5.0 4.0
Republic of Korea 4.1 5.2 5.1 2.3 0.3 6.2 3.7 4.2 3.4 3.4 4.3 4.3 3.7 3.9
Singapore 5.1 8.7 8.8 1.5 -0.8 14.5 5.4 9.4 1.0 6.1 5.5 4.8 5.1 4.0
Taipei,China 3.4 5.4 6.0 0.7 -1.8 10.7 4.8 6.6 4.5 3.4 4.8 4.7 4.6 4.1
People’s Republic of China
10.3 12.7 14.2 9.6 9.2 10.4 9.4 9.7 9.5 9.1 9.3 9.1 9.3 8.8
Japan 0.7 2.0 2.4 -1.2 -6.3 4.1 -0.7 -1.0 -1.1 0.0 -0.5 2.8 -0.5 2.5
US5 1.5 2.7 1.9 -0.3 -3.5 3.0 1.8 2.2 1.6 1.6 1.6 2.2 1.6 2.1
eurozone6 1.3 3.2 3.0 0.4 -4.2 1.8 1.8 2.4 1.6 1.4 1.7 1.3 1.7 0.5
– = unavailable, e = ADB estimates, FY = fiscal year, GDP = gross domestic product, Lao PDR = Lao People’s Democratic Republic, US = United States, and y-o-y= year-on-year.1Aggregates are weighted according to gross national income levels (atlas method, current $) from the World Bank’s World Development Indicators.2Excludes Myanmar for all years as weights are unavailable. Quarterly figures exclude Brunei Darussalam, Cambodia, Lao PDR, and Myanmar for which quarterly data is not available.3Includes Brunei Darussalam, Cambodia, Indonesia, Lao PDR, Malaysia, Philippines, Singapore, Thailand, and Viet Nam. 4Figures from Asian Development Outlook 2011 Update, Asian Development Bank, published in September. 5Seasonally adjusted.6Flash estimate, seasonally adjusted for 2011Q3.Source: Asian Development Outlook 2011 Update, Asian Development Bank; Eurostat website (eurozone); Economic and Social Research Institute (Japan); Bureau of Economic Analysis (US); and CEIC.

36 December 2011 | Asia Economic Monitor Asia Economic Monitor | December 2011 37
Economic Outlook, Risks, and Policy Issues
36 December 2011 | Asia Economic Monitor Asia Economic Monitor | December 2011 37
Japan’s recovery, particularly as reconstruction shifts from publicly-funded infrastructure to private business recapitalization. An additional boost should come from the restoration of supply chains in Malaysia and Thailand. Should the US and the eurozone suffer severe recessions, the region’s growth will naturally be expected to worsen.
PRC’s economic growth is expected to moderate as government efforts to cool the economy and achieve a soft landing bear fruit.
PRC’s economic expansion eased this year due to tight monetary policy and the accelerated weakening of external demand. Leading indicators suggest, however, that economic growth may be rebalancing toward domestic sources. Net exports in the third quarter were below last year’s, as import growth outpaced exports
Oct-11
43.1
-23.6
20.618.9
5.613.5
25.7
17.3
-30-20-10
01020304050
Jan-07
Sep-07
May-08
Jan-09
Sep-09
May-10
Jan-11
ExportsIndustrial production
Retail sales
Figure 63: Merchandise Export, Industrial Production, and Retail Sales Growth1—People’s Republic of China (y-o-y, %)
y-o-y = year-on-year. Note: Exports in $ value; industrial production and retail sales in local currency.13-month moving average. Exports and retail sales until Sep 2011.Source: ADB calculations using data from CEIC.
Table 12: Manufacturing Purchasing Managers’ Index (PMI)—Selected Economies (2011)
Jul Aug Sep Oct
People’s Republic of China 49.3 49.9 49.9 51.0
Hong Kong, China1 51.4 47.8 45.9 49.0
Republic of Korea 51.3 49.7 47.5 48.0
Singapore 49.3 49.4 48.3 49.5
Taipei,China 46.1 45.2 44.5 43.7
1PMI Composite Index.Source: Markit Financial Information Services, except for Singapore which is from Singapore Institute of Purchasing & Materials Management (SIPMM).
29.6
5.112.0
-23.8
53.4
-5.6
14.2
-34.3
3.2
-40-30-20-100
102030405060
Jan- 07
Sep- 07
May- 08
Jan- 09
Sep- 09
May- 10
Jan- 11
Sep- 11
Singapore
Republic of Korea
Taipei,China
Figure 64: Industrial Production Growth1—NIEs2 (y-o-y, %)
NIE = newly industrialized economy, y-o-y = year-on-year.13-month moving average.2Does not include Hong Kong, China as monthly data unavailable.Source: ADB calculations using data from CEIC.
(Figure 63). The Purchasing Managers’ Index fell to 51.0 in October, and further to a 32-month low in November at 47.7, implying a contraction in manufacturing output (Table 12). Growth in industrial production was less steady at 13.5% in October. But retail sales and fixed investment remain strong. Taken together, growth is expected to slow to 9.3% this year and 8.8% in 2012.
After a strong 2010 rebound and moderate growth this year, further easing in the NIEs is expected due to deteriorating global economic conditions.
Leading indicators for the NIEs generally point to continued moderation into 2012. September industrial production in the Republic of Korea and Taipei,China grew 5.1% and 3.2%, respectively, their weakest since November 2009. Singapore’s was buoyed only by
-12.7
35.8
8.5
24.1
4.7 4.4
9.3
-4.0
4.7
-8.4
11.0
3.8
-20-15-10-505
10152025303540
Jan- 07
Sep- 07
May- 08
Jan- 09
Sep- 09
May- 10
Jan- 11
Sep- 11
Hong Kong, China
Republic of Korea
Taipei,China Singapore
Figure 65: Retail Sales Growth1—NIEs (y-o-y, %)
y-o-y = year-on-year.13-month moving average except for Hong Kong, China.Source: ADB calculations using data from CEIC.

38 December 2011 | Asia Economic Monitor Asia Economic Monitor | December 2011 39
Emerging East Asia—A Regional Economic Update
38 December 2011 | Asia Economic Monitor Asia Economic Monitor | December 2011 39
biomedical manufacturing (Figure 64). Although retail sales growth in Hong Kong, China remained robust at 24.1% in September, it is slower than in the last six months. In the Republic of Korea, retail sales grew 4.4% in September—lower than the 7.5% growth in the same period last year. In Singapore, retail sales increased a mere 4.7% in September due to a drop in motor vehicle sales and a slowdown in spending at supermarkets and department stores (Figure 65). Overall, economic growth in the NIEs is forecast to be 4.2% this year and 4.0% in 2012. After growing 5.0% this year, the Hong Kong, China, economy is forecast to grow 4.0% in 2012; the Republic of Korea economy from 3.7% this year to 3.9% in 2012; Singapore by 5.1% in 2011 and 4.0% in 2012; and Taipei,China by 4.6% this year and 4.1% in 2012.
Growth in ASEAN’s middle-income economies will likely improve, with Indonesia sustaining growth momentum and Thailand recovering from supply disruptions caused by recent floods.
The Indonesian economy will continue to be buoyed by strong domestic demand supported by accommodative monetary policy. In September, retail sales grew a robust 25.1%, and industrial output expanded 5.6% (Figures 66, 67). Consumer confidence is also rising (see Figure 5b). The economy should grow 6.6% this year and 6.5% in 2012, primarily driven by domestic demand. Similarly, robust domestic demand from strong remittance inflows will likely sustain growth in the Philippines—3.7% this year and 4.8% in 2012. Malaysia and Thailand, the more open ASEAN economies, are expected to bounce back from supply chain disruptions
-15.6
12.2
1.9
2.6
13.4
-22.8
31.2
1.8
5.6
20.3 21.9
4.4
-25
-15
-5
5
15
25
35
Jan-07
Jul-07
Jan-08
Jul-08
Jan-09
Jul-09
Jan-10
Jul-10
Jan-11
Jul-11
Oct-11
Indonesia
ThailandPhilippinesMalaysia
Viet Nam
Figure 67: Industrial Production Growth1—ASEAN-4 plus Viet Nam (y-o-y, %)
y-o-y = year-on-year.13-month moving average. Latest data for Indonesia, Malaysia, and Thailand as of Sep 2011; and Philippines as of Aug 2011.Source: ADB calculations using data from CEIC.
25.1
11.9
-17.2
24.0
5.9
20.4
39.6
22.3
-30
-20
-10
0
10
20
30
40
Jan-07
Jul- 07
Jan-08
Jul- 08
Jan-09
Jul- 09
Jan-10
Jul- 10
Jan-11
Jul- 11
Oct-11
Indonesia
Viet Nam
Thailand
Figure 66: Retail Sales Growth1—Selected ASEAN Economies (y-o-y, %)
y-o-y = year-on-year.13-month moving average. Latest data for Indonesia as of Sep 2011; Thailand as of Jul 2011.Source: ADB calculations using data from CEIC.
caused by Japan’s earthquake and tsunami, but may see a slump in exports to the eurozone and the US (Figure 68). The forecast for Malaysia is 4.8% growth this year and 4.7% in 2012. For Thailand, the effects of extensive flooding will likely cause further interruption in industrial output. Thailand’s GDP is now forecast to grow 2.0% this year and 4.5% in 2012.
Viet Nam’s economy is expected to pick up as the macroeconomy stabilizes, while the smaller ASEAN economies will continue to improve.
Economic growth in Viet Nam is forecast at 5.8% this year and 6.3% in 2012. Monetary tightening moderated the pace of economic expansion in 2011, but will push growth up in 2012 once macroeconomic stability sets in. Cambodia’s economy is expected to grow 6.8% this year
Oct-11
40.3
16.4
-14.9
29.0
33.4
-50
-30
-10
10
30
50
70
Jan-07
Sep-07
May-08
Jan-09
Sep-09
May-10
Jan-11
Indonesia
Philippines
Thailand
Malaysia
Viet Nam39.4
54.9
-40.0
Figure 68: Merchandise Export Growth1—ASEAN-4 plus Viet Nam ($ value, y-o-y, %)
ASEAN-4 = Indonesia, Malaysia, Philippines, and Thailand; y-o-y = year-on-year.13-month moving average. Latest data for Indonesia, Malaysia, Philippines, and Thailand as of Sep 2011.Source: ADB calculations using data from CEIC.

38 December 2011 | Asia Economic Monitor Asia Economic Monitor | December 2011 39
Economic Outlook, Risks, and Policy Issues
38 December 2011 | Asia Economic Monitor Asia Economic Monitor | December 2011 39
and 6.5% in 2012, due to policy initiatives in agriculture, real estate, and finance—intended to diversify the economy beyond garment exports and tourism. In the Lao PDR, economic growth should remain robust with continued expansion in mining and hydropower. GDP is expected to expand 8.1% this year and 7.6% in 2012. Brunei Darussalam’s economy will continue to recover, as both oil-and-gas and other sectors continue to rebound. GDP is expected to grow 1.7% this year and 1.8% in 2012. The economy of Myanmar will expand 5.3% this year and 5.4% in 2012, supported by improving agriculture, increased tourism revenues, and larger remittances.
Inflation appears to have peaked, but remains a concern in several economies.
Inflationary expectations should remain steady. Core inflation may slow as global demand for intermediate inputs weakens. Domestic sources of inflation, such as housing shortages and high demand for real estate, are not expected to add pressure as government administrative measures reduce their inflationary impact.
The region’s balance of payments surpluses continue to narrow on reduced export demand and lower capital inflows.
Emerging East Asian economies are expected to retain positive, though narrowing, current account balances—as weakening export markets coupled with strong domestic demand lead to smaller trade surpluses or, in some cases, deficits. Foreign capital may continue to flow into ASEAN-4, given their strong growth and relatively higher interest rates (Figures 69, 70). The NIEs, however, will likely register net capital outflows, particularly portfolio investments. Given the high level of uncertainty in
31.3
24.6
10.210.9
0
5
10
15
20
25
30
35
Mar-07
Sep-07
Mar-08
Sep-08
Mar-09
Sep-09
Mar-10
Sep-10
Mar-11
Sep-11
Indonesia
Republic of KoreaMalaysia
Thailand
Figure 69: Foreign Holdings of Local Currency Government Bonds1 (% of total)
1Latest data as of June 2011 for the Republic of Korea and Malaysia.Source: ADB AsianBondsOnline.
11
-37.3
24.719.8
-5.4
8.02.6
-50
-40
-30
-20
-10
0
10
20
30
Jan-07
Sep-07
May-08
Jan-09
Sep-09
May-10
Jan-11
Oct-
Republic of Korea
Indonesia, Philippines, Thailand
Figure 70: Net Foreign Portfolio Investment in Equities—Selected Emerging East Asian Economies ($ billion)
Source: Bloomberg and CEIC.
global financial markets, capital inflows to the region are expected to be volatile.
Risks to the Outlook
The cautiously optimistic outlook for emerging East Asia is subject to much greater downside risks now than just a few months ago.
The main risks include (i) a deep recession in both the eurozone and the US; (ii) protectionism or overly restrictive financial policies that unintentionally disrupt trade finance; (iii) destabilizing capital flows; and (iv) persistent or resurgent inflation.
The global economic recovery could flounder if the eurozone and the US fall back into recession, causing another global financial crisis.
Uncertainty continues over the euro as (i) eurozone leaders continue to grapple with the overall debt crisis, (ii) Greece tries to settle both political and economic fallout from the late October rescue agreement, and (iii) Italy’s new government attempts to calm markets with a credible economic reform package. Any disorderly result could spook markets, spark financial contagion and, in turn, cause a global liquidity crunch. To complicate matters, the US recovery could be disrupted for many reasons, such as falling business and consumer confidence, political gridlock ahead of the 2012 presidential elections, or lack of job growth at the same time that households reduce consumer spending to continue deleveraging. The worst-case scenario is for both the US and eurozone to fall back into recession, pushing the global economy into a deep slump.

40 December 2011 | Asia Economic Monitor Asia Economic Monitor | December 2011 41
Emerging East Asia—A Regional Economic Update
40 December 2011 | Asia Economic Monitor Asia Economic Monitor | December 2011 41
Protectionism or a liquidity crunch in trade finance could significantly reduce global trade.
Trade protectionism has been on the rise since the global economy began to recover from the 2008/09 financial crisis—even if its effect on world trade thus far has been marginal. Nonetheless, several countries have either (i) reintroduced export subsidies or levied higher import tariffs on specified products, (ii) newly subsidized vulnerable or distressed domestic industries, (iv) established additional non-tariff barriers (such as restricting entry points for imports or imposing additional licensing requirements), and (v) lodged anti-dumping complaints with the World Trade Organization and introduced export bans. Disputes over who should bear the cost of global rebalancing could trigger higher trade barriers—or political recrimination that damages global trade. Also, financial tensions could spawn tighter policies that—while intended to help financial institutions through tough times—could force banks to restrict credit lines to businesses, drying up trade finance. Politically motivated protectionism could spark a trade war; a credit crunch would choke business. Either or both may lead to a slump in world trade or, worse, another global recession.
Large and destabilizing capital flows could complicate the region’s macroeconomic management and jeopardize economic growth.
The cautiously optimistic growth outlook for emerging East Asia compared with those of the eurozone and the US suggests that capital should continue to flow to the region. However, the lingering eurozone debt crisis could boost risk aversion among investors, with rapid swings in risk appetite boosting capital flow volatility beyond the spurts and stops seen in the third quarter of this year. Consequently, exchange rate volatility would follow from large but fickle capital movements. And large capital flows could also destabilize the real economy, posing major challenges for macroeconomic managers. Excessive capital inflows could lead to undue credit expansion, with adverse macroeconomic consequences, as occurred during the 1997/98 Asian financial crisis. Moreover, abrupt changes in risk sentiment could bring sudden capital flow reversals, damaging the region’s growth prospects or exposing otherwise hidden vulnerabilities.
5.5
4.33.5
5.0
-2
0
2
4
6
8
10
12
People's Republicof China
ASEAN-4
NIEs
Emerging East Asia1
11Jan-07
Sep-07
May-08
Jan-09
Sep-09
May-10
Jan-11
Oct-
Figure 71: Headline Inflation (y-o-y, %)
ASEAN-4 = Indonesia, Malaysia, Philippines, and Thailand; NIE = Hong Kong, China; Republic of Korea; Singapore; and Taipei,China; y-o-y = year-on-year. 1Refers to ASEAN-4, NIEs, People’s Republic of China, and Viet Nam. Weighted using gross national income (atlas method, currrent $).Source: ADB calculations using data from CEIC.
Inflation remains a concern.
For many emerging East Asian economies, headline inflation accelerated since late 2009 on robust economic growth and rising food and energy prices. It is now only starting to ease (Figure 71). For some, headline inflation remains above targets or objectives. Output gaps generally narrowed in the third quarter over the second quarter, suggesting economies are close to potential output and can quickly heat up (see Table 3). More importantly, core inflation—excluding food and energy prices—continues edging up. With food and fuel prices still high—and the impact of recent flooding uncertain—inflation expectations could rise leading to dangerous price-wage spirals. Although the weakened external environment should reduce imported inflation somewhat, vigilance is required as rapid price movements imply less macroeconomic space to respond to a potential global slowdown.
Policy Issues
The biggest challenge facing policymakers in emerging East Asia is how to safeguard the region’s robust growth against the threat of another global economic crisis.
The region recovered strongly from the 2008/09 global financial crisis—even if economic growth moderated this year due to the effects of unwinding policy stimulus, slowing external demand, Japan’s earthquake, and flooding in Thailand. Despite the weaker external environment, robust growth should continue into next year—though at a slower pace. The recovery in advanced economies lost steam this year and they will continue to

40 December 2011 | Asia Economic Monitor Asia Economic Monitor | December 2011 41
Economic Outlook, Risks, and Policy Issues
40 December 2011 | Asia Economic Monitor Asia Economic Monitor | December 2011 41
struggle. While US economic growth could strengthen somewhat, the eurozone will likely fall into either a brief recession or a more severe long-term downturn. Emerging East Asia is certainly not immune to a major slowdown in advanced economies, which would hurt the region’s economic growth and pose significant policy challenges (“Can East Asia Weather Another Global Economic Crisis?”—page 43).
With the eurozone’s sovereign debt crisis unfolding and risks of faltering global recovery rising, macroeconomic policy must remain cautious and prudent.
Many of the region’s economies continued to unwind macroeconomic stimulus in the first half to counter price pressures. When the eurozone crisis, the gridlock in US politics, and the US credit rating downgrade began to unravel global financial markets in July, policymakers across the region largely chose a “wait and see” stance, momentarily halting further policy tightening. The People’s Bank of China lowered its reserve requirement ratio for the first time in three years as Bank Indonesia and Bank of Thailand cut their policy rates. Authorities may be concerned over the region’s high dependence on external demand, financial contagion, and the potential impact of an economic slowdown in the eurozone and the US. Robust domestic demand and lingering inflationary pressures in some economies may prevent policymakers in some countries from loosening macroeconomic policy.
Continued uncertainty over the eurozone debt crisis and recovery in the US underscores the need to retain sufficient flexibility to quickly fine-tune policy levers.
If the crisis does not worsen and the eurozone begins to orderly resolve its debt problems, prudent macroeconomic management is still required to boost domestic demand given the expectations of continued weak external demand—all the while containing risks from continued inflationary pressures. In economies with robust growth and lingering inflation, authorities may need to continue to unwind policy stimulus. In economies with relatively weak growth and low inflation, policymakers may be able to fine-tune policy to support growth.
Should the eurozone fall into a full-blown financial and economic crisis, emerging East Asian economies must respond promptly, decisively, and collectively.
Should the downside risks from the eurozone and US materialize, market reaction to the eurozone debt crisis could trigger financial contagion and a global liquidity crisis. The eurozone could fall into a deep and long recession, possibly of the same magnitude as in 2008/09, dragging the US into recession as well. As the special section explains, the impact of another deep recession in the eurozone and US would be significant yet manageable. The region’s policymakers will need to act promptly, nonetheless, to stem the threat to both their financial systems and the real economy. As in late 2008, they must be decisive in order to rebuild confidence among businesses and consumers. And they must cooperate and act collectively to minimize any damages further financial contagion could cause. As high public debt and fiscal deficits in many advanced economies may take many years to return to relatively healthy levels, policymakers in the region should also be prepared for a prolonged, weak recovery in advanced economies.
Policymakers must strive to ensure regional financial stability.
With the specter of severe financial contagion from Europe, policymakers in emerging East Asia will need to continue bolstering the foundations of financial stability and avoid any deterioration in market confidence. This could involve ring-fencing financial systems, providing adequate liquidity to financial institutions, and containing spillover effects from worsening financial or macroeconomic conditions on the region’s banking systems. Authorities have learned lessons well from previous crises and will address any weakness and vulnerability found in real economies, financial sectors, and the link between the two. The 2008/09 global financial crisis unmasked major regulatory and supervisory gaps related to institutional and market conduct, and the eurozone debt crisis illustrates how differences in competitiveness are transformed into vulnerabilities in finance (both private and public)—compounded by the single currency. Policymakers could consider the medium- to long-term agenda of improving and streamlining financial regulatory and supervisory regimes in conjunction with global efforts. The region must also play a greater role on the global stage to ensure the new financial architecture meets both the

42 December 2011 | Asia Economic Monitor Asia Economic Monitor | December 2011 PB
Emerging East Asia—A Regional Economic Update
challenges of globalized finance and the region’s financial development agenda.5
Regardless of short-term adjustments in responding to immediate economic events, emerging East Asia needs to continue its structural reforms and supply-side policies to sustain long-term growth.
The region’s future depends on developing new growth sources or drivers of the economy, and policymakers must be allowed to prioritize policies that foster factor accumulation and productivity growth. In particular, four areas stand out—human capital, infrastructure, financial development, and promoting small and medium enterprises (SMEs). These will augment growth by increasing available factors of production and supporting their efficient use.6 Increased investment in human capital will enhance economic capacity to import, adapt, and innovate technology. Recent empirical evidence suggests that infrastructure stocks positively impact economic growth—and galvanizing the massive investment required is a major challenge. Integrated and deeper financial systems (including capital market development) will promote better project risk-assessment and risk-management, which in turn will foster better intermediation of the region’s savings into productive investment. A large share of the region’s labor—clear majorities in many countries—are employed in SMEs, which often operate under difficult circumstances. Public policy can help SMEs become more productive by improving access to finance and helping SMEs adopt new technologies and access new markets.7
With demand from the eurozone and the US expected to remain weak for some time, emerging East Asia should continue to work toward increasing intraregional trade and financial integration, and expanding links with other emerging economies.
International trade has been the engine of growth for emerging East Asia. Its significance in raising living standards across the region has been widely
5ADB. 2009. Beyond the Crisis: Regulatory Reform in Emerging East Asia. Asia Economic Monitor July 2009. http://www.aric.adb.org/asia-economic-monitor/2009-July.
6ADB. 2010. The Future of Growth in Asia. Asian Development Outlook 2010 Update. Manila.
7ADB. 2009. Key Indicators 2009: Enterprises in Asia: Fostering Dynamism in SMEs. Manila.
acknowledged and substantiated. Increased intraregional and “South-South” trade will provide Asian exports more diversified markets, reducing dependence on advanced or more mature markets. The region’s production and trade networks can be adjusted to accommodate more domestic and regional consumption. Consequently, intraregional trade will expand in volume and scope. In addition, the region should also foster financial flows within the region to integrate and deepen the region’s financial markets. Furthermore, economic links between emerging economies has huge potential as a new source of growth for the region. To promote this expansion, structural weaknesses such as trade barriers, uncompetitive domestic industries, and poor trade-related infrastructure and logistics must be overcome.8
Emerging East Asia could accelerate regional policy cooperation to mitigate the effects of external shocks.
National policies can have significant spillover effects, or externalities, on other economies. This implies that externalities be taken into account in the decision-making process to reach a global or regional optimum. Policy coordination can ensure externalities are identified and taken into account. In particular, contingency plans for coordinated policy action should be formulated in case the external environment worsens. For example, monetary authorities could coordinate policies to boost domestic and regional demand, and ensure intraregional exchange rate stability while maintaining inter-regional exchange rate flexibility. Exchange rate cooperation could promote intraregional trade and investment and help rebalance the region’s sources of growth.9 Authorities should work toward further enhancing the Chiang Mai Initiative Multilateralization as a strong regional financial safety net with crisis-prevention capabilities. Policymakers could also collaborate at regional and global levels to avoid trade protectionism. The Asian Bond Market Initiative and Credit Guarantee and Investment Facility can also be further enhanced to facilitate capital market development in the region.
8ADB. 2011. South–South Economic Links. Asian Development Outlook 2011. Manila.
9ADB. 2010. Exchange Rate Cooperation: Is East Asia Ready? Asia Eco-nomic Monitor December 2010. http://www.aric.adb.org/asia-economic-monitor/2010-December.

Can East Asia Weather Another Global Economic Crisis?
PB December 2011 | Asia Economic Monitor Asia Economic Monitor | December 2011 43
Can East Asia10 Weather Another Global Economic Crisis?Introduction
There is rising concern that the unresolved eurozone sovereign debt crisis could10 spread, resulting in a wider, more severe financial crisis and a sharp global economic slowdown.
The already anemic global economic outlook could worsen should the Greek debt crisis spread to other larger highly indebted eurozone economies—such as Italy or Spain. Despite recent collaborative efforts to resolve the crisis, the threat of a disorderly debt default in Greece and ensuing contagion is rising. The heavily exposed eurozone banking system could suffer dramatically as a result of any sovereign default. There could be severe repercussions for eurozone financial systems and for economic growth (it has already begun to slow). More worrying, eurozone financial instability could spill over to markets in the United States (US) and elsewhere, further damaging global economic activity. With Europe focused on fiscal austerity, there is little scope for fiscal stimulus to support economies in the event of another recession.
The impact of a eurozone debt crisis could affect US financial institutions, disrupting the fragile recovery in the US.
While the US economy edges forward—with growth forecasts looking somewhat brighter—the recovery could falter as unemployment stays stubbornly high and the housing market remains moribund. A full-fledged European crisis could dampen US efforts given the close economic and financial ties between the two. Therefore, the risk of a double-dip recession in the US has also risen, with its high fiscal deficit and continued political deadlock in Congress limiting available responses to another economic downturn. On the monetary front, the US Federal Reserve has shown more willingness to adopt more expansionary policies. However, with policy rates close to zero, the two rounds of quantitative easing had limited impact and further easing would likely have minimal effect as well.
10Unless otherwise indicated, East Asia refers to emerging East Asia (Brunei Darussalam; Cambodia; People’s Republic of China; Hong Kong, China; Indonesia; Republic of Korea; Lao People’s Democratic Republic; Malaysia; Myanmar; Philippines; Singapore; Taipei,China; Thailand; and Viet Nam) plus Japan.
With the risk of another global financial crisis increasing, a critical question is whether East Asia has the means to withstand another global shock.
The threat of double-dip recessions in the eurozone and US has elevated concerns among the region’s policymakers over how another contraction would affect the region. Memories of the sharp slowdown from the 2008/09 global financial crisis remain fresh. Many East Asian economies suffered large declines in trade and output. In addition, the region’s financial sector and stock markets were battered as foreign investors fled to “safe havens” elsewhere. Still, the region recovered quickly—primarily because (i) its financial institutions held few toxic assets, (ii) the global financial system stabilized quickly—with sizable liquidity injections and government guarantees—and (iii) there was sufficient monetary and fiscal space for effective stimulus. The region has posted robust growth since.
This time around, however, any new global financial crisis would likely last longer—as weaker fiscal conditions in the eurozone and US limit their capacity to rescue financial systems.
With advanced economies’ sovereign credit ratings under scrutiny, the scope for rescuing troubled financial institutions is limited. Government guarantees are less valuable. This makes it more difficult to resolve any new global financial crisis quickly. This note assesses how East Asian economies would be affected by a new global financial crisis. It begins by identifying and examining the risks of another crisis. It then analyzes crisis transmission channels. It compares the region’s current economic position relative to that just prior to the 2008/09 crisis to isolate changing vulnerabilities. And to provide a quantitative estimate of the potential impact, it simulates the effects a new global financial crisis might have. The note continues with suggestions on how policymakers could respond.

44 December 2011 | Asia Economic Monitor Asia Economic Monitor | December 2011 45
Emerging East Asia—A Regional Economic Update
44 December 2011 | Asia Economic Monitor Asia Economic Monitor | December 2011 45
What are the risks of another global financial crisis?
The most pressing concern is whether the sovereign debt crisis in Europe will spread from Greece to other larger eurozone economies.
The European sovereign debt crisis will likely persist unless there is a much more determined effort to place a firewall around Greece. Bond markets have already factored in a Greek debt default. The latest European Union (EU) plan to resolve the crisis includes private investors taking a voluntary 50% haircut on the nominal value of Greek bonds. The main concern is that a Greek default could impact other highly indebted EU economies such as Portugal, Ireland, Italy, and Spain, which would likely come under further investor scrutiny. It is this fear of contagion that brought several attempts by eurozone governments to piece together a Greek rescue package that would prevent the crisis from spreading further. Most recently the fear has spread to Italy—the eurozone’s third largest economy—which, with a high public debt, has seen its sovereign debt rating downgraded and is grappling with rising bond yields. Belgium also had its rating downgraded recently. So far, the lack of decisive collective action has left the future of the Greek debt situation uncertain. It leaves a cloud hanging over the fate of other highly indebted eurozone economies.
Europe’s already fragile banking sector could be further destabilized by the spreading debt crisis—leading to reduced lending or possible bank failures.
The eurozone crisis is also affecting banking systems. Many European banks—especially French and German—hold large amounts of “periphery”11 country sovereign debt (Table 13). These exposures are potentially larger if one includes financial derivatives such as credit default swaps (CDS). The rescue of Dexia by France and Belgium underscored the fragility of Europe’s banks. Of particular concern was that Dexia ranked 12th best in recent stress tests by the European Banking Authority. Worries over the health of Europe’s banks have led to many bank downgrades (Table 14). A widening sovereign debt crisis would bring large losses for banks, eroding their capital base. With many European banks already facing capital shortfalls, there is urgency in raising new
11Peripheral countries include GIIPS (Greece, Ireland, Italy, Portugal, and Spain).
capital. However, with low investor confidence, it will likely be difficult and costly to raise amounts required. Therefore, banks may be forced to shrink their assets by reducing lending. This would reduce business lending stunting economic growth. In a worst case scenario, the deteriorating health of the eurozone economy and large losses on sovereign debt could lead to bank failures. This could in turn lead to panic and a lending freeze.
Crisis contagion in Europe will likely push the eurozone into a deep and prolonged recession.
Our baseline forecasts already envisage a gloomy outlook for the eurozone—the region’s economy is forecast to grow 1.7% this year and 0.5% in 2012 (see Table 11). Should the debt crisis spread to Italy or Spain, for example, the eurozone will likely fall into a deep recession. The widening crisis would batter already
Table 13: GIIPS Debt Exposure of French, German, and British Banks (as of June 2011, $ million)
Borrower
Lender
French Banks
German Banks
British Banks
Greece
Public sector 10,686 12,411 3,251
Banks 1,583 1,842 1,052
Non-bank private sector 43,470 7,119 8,339
Ireland
Public sector 2,896 3,470 3,709
Banks 9,841 21,532 16,868
Non-bank private sector 19,278 85,507 120,272
Italy
Public sector 106,764 47,624 17,430
Banks 44,657 48,338 8,898
Non-bank private sector 264,952 65,795 47,391
Portugal
Public sector 6,153 8,978 1,859
Banks 6,170 12,554 3,958
Non-bank private sector 13,339 14,320 19,622
Spain
Public sector 30,492 29,454 7,638
Banks 38,616 69,144 17,980
Non-bank private sector 81,784 78,867 75,263 GIIPS = Greece, Ireland, Italy, Portugal, and Spain.Source: Table 9E (Consolidated foreign claims and other potential exposures—ultimate risk basis), Bank for International Settlements.

44 December 2011 | Asia Economic Monitor Asia Economic Monitor | December 2011 45
Can East Asia Weather Another Global Economic Crisis?
44 December 2011 | Asia Economic Monitor Asia Economic Monitor | December 2011 45
Table 14: Long-Term Rating Downgrade of Top eurozone Banks1
Country
Number of banks
downgraded
Ratio to
rated banks
(%)
Total assets of
downgraded banks
($ billion)
Ratio to total
assets of all rated
banks (%)
Austria 1 25.0 275 34.2
Belgium 6 100.0 2,560 100.0
Finland 2 100.0 494 100.0
France 13 61.9 11,935 76.7
Germany 17 65.4 7,609 64.7
Greece 4 100.0 444 100.0
Ireland 6 100.0 1,285 100.0
Italy 10 100.0 3,603 100.0
Netherlands 6 75.0 4,341 90.6
Portugal 2 100.0 302 100.0
Spain 10 76.9 3,859 87.2
1Based on October 2011 assessment of Fitch Ratings. Top banks based on the 300 largest banks in Europe in terms of total assets in US dollars.Source: Bankscope.
fragile consumer confidence and prompting businesses to hold back on future investment. This will exacerbate already high unemployment. In addition, it could spark even more fiscal consolidation to calm financial markets, further dampening aggregate demand across the region.
Despite the huge economic challenges, the sheer size of fiscal deficits and public debt limit the ability of authorities to respond aggressively.
As eurozone economies slow due to continued uncertainty, there is limited scope for fiscal stimulus, as affected eurozone governments are already highly indebted and running large fiscal deficits (Table 15). Thus, should the eurozone slip into deep recession, governments will have few tools to respond. Eurozone governments continue to pursue fiscal austerity despite weakening economic conditions. In addition, the European Central Bank is unlikely to run a more expansionary monetary policy as it worries of stoking inflation—even if inflation currently remains low. Should the crisis escalate, there is limited scope for governments to reflate their economies.
Table 15. Eurozone Fiscal Balance and Public Debt (% of GDP)
Primary fiscal balance1
Gross public debt2
2005 2010 2005 2010
eurozone 0.5 -3.4 70.1 85.4
Austria 1.2 -1.7 64.2 71.8
Belgium 1.5 -0.7 92.0 96.2
Cyprus 1.1 -3.1 69.4 61.5
Estonia 1.8 0.4 4.6 6.7
Finland 4.3 -1.5 41.7 48.3
France -0.3 -4.6 66.4 82.3
Germany -0.5 -1.8 68.6 83.2
Greece -0.7 -5.0 100.0 144.9
Ireland 2.7 -28.2 27.2 94.9
Italy 0.2 -0.1 105.4 118.4
Luxembourg 0.2 -0.7 6.1 19.1
Malta 0.7 -0.6 69.7 69.0
Netherlands 2.1 -3.1 51.8 62.9
Portugal -3.4 -6.8 62.8 93.3
Slovakia -1.1 -6.3 34.2 41.0
Slovenia 0.1 -4.2 26.7 38.8
Spain 3.1 -7.4 43.1 61.0
GDP = gross domestic product.1Net borrowing/net lending less consolidated interest expenditure.2Consolidated gross debt.Source: Eurostat.
Should periphery members decide the cost of remaining in the eurozone is prohibitive, several could abandon the euro—leading to a potential catastrophic disruption of the global economy.
Facing unsustainable debt and many years of fiscal austerity and belt tightening, Greece could decide to abandon the euro. While unlikely—as eurozone leaders remain strongly committed to retaining Greek membership—the return of the drachma (or introducing a new currency) would carry the benefit of allowing devaluation to rebuild competitiveness. However, it would be at the cost of being shut out of global financial markets. There would also likely be a massive bank run in Greece as people rush to withdraw euro deposits before devaluation. To avoid this, capital controls would have to be imposed, breaking the EU rule on free flowing capital. While abandoning the euro might allow Greece to escape its heavy debt burden, it would have large spillover effects on other eurozone economies. Borrowing costs
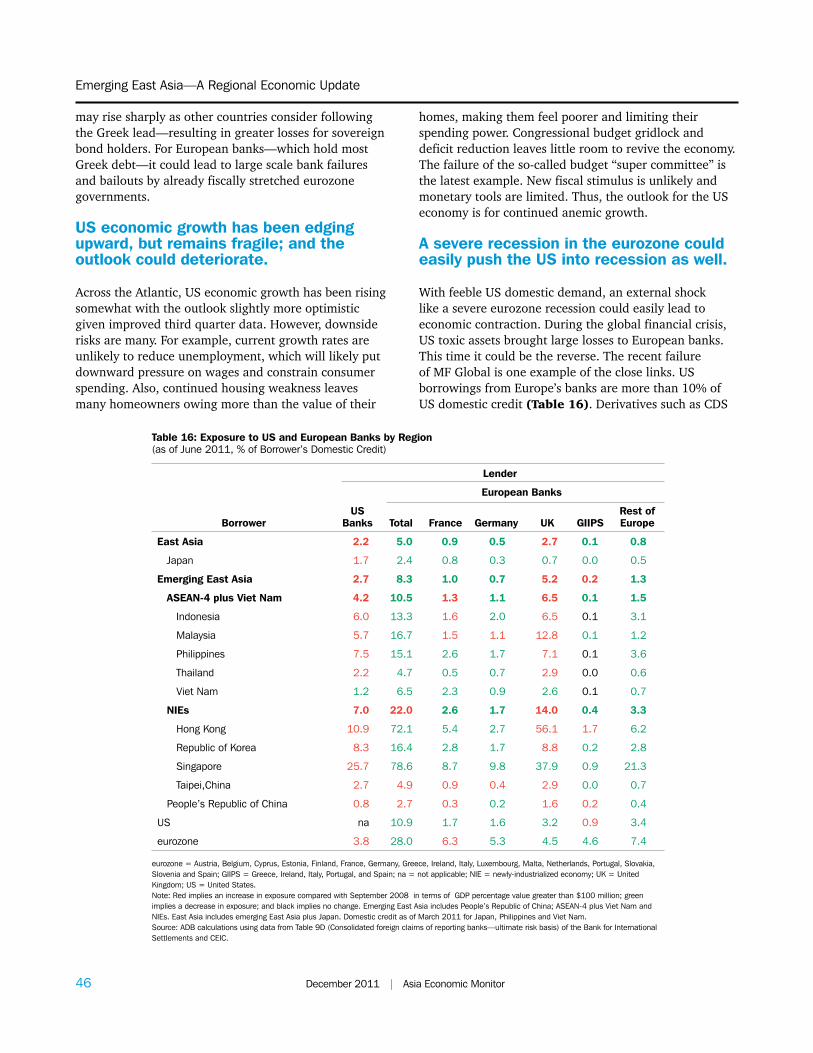
46 December 2011 | Asia Economic Monitor Asia Economic Monitor | December 2011 47
Emerging East Asia—A Regional Economic Update
46 December 2011 | Asia Economic Monitor Asia Economic Monitor | December 2011 47
may rise sharply as other countries consider following the Greek lead—resulting in greater losses for sovereign bond holders. For European banks—which hold most Greek debt—it could lead to large scale bank failures and bailouts by already fiscally stretched eurozone governments.
US economic growth has been edging upward, but remains fragile; and the outlook could deteriorate.
Across the Atlantic, US economic growth has been rising somewhat with the outlook slightly more optimistic given improved third quarter data. However, downside risks are many. For example, current growth rates are unlikely to reduce unemployment, which will likely put downward pressure on wages and constrain consumer spending. Also, continued housing weakness leaves many homeowners owing more than the value of their
homes, making them feel poorer and limiting their spending power. Congressional budget gridlock and deficit reduction leaves little room to revive the economy. The failure of the so-called budget “super committee” is the latest example. New fiscal stimulus is unlikely and monetary tools are limited. Thus, the outlook for the US economy is for continued anemic growth.
A severe recession in the eurozone could easily push the US into recession as well.
With feeble US domestic demand, an external shock like a severe eurozone recession could easily lead to economic contraction. During the global financial crisis, US toxic assets brought large losses to European banks. This time it could be the reverse. The recent failure of MF Global is one example of the close links. US borrowings from Europe’s banks are more than 10% of US domestic credit (Table 16). Derivatives such as CDS
Table 16: Exposure to US and European Banks by Region (as of June 2011, % of Borrower’s Domestic Credit)
Borrower
Lender
US Banks
European Banks
Total France Germany UK GIIPSRest of Europe
East Asia 2.2 5.0 0.9 0.5 2.7 0.1 0.8
Japan 1.7 2.4 0.8 0.3 0.7 0.0 0.5
Emerging East Asia 2.7 8.3 1.0 0.7 5.2 0.2 1.3
ASEAN-4 plus Viet Nam 4.2 10.5 1.3 1.1 6.5 0.1 1.5
Indonesia 6.0 13.3 1.6 2.0 6.5 0.1 3.1
Malaysia 5.7 16.7 1.5 1.1 12.8 0.1 1.2
Philippines 7.5 15.1 2.6 1.7 7.1 0.1 3.6
Thailand 2.2 4.7 0.5 0.7 2.9 0.0 0.6
Viet Nam 1.2 6.5 2.3 0.9 2.6 0.1 0.7
NIEs 7.0 22.0 2.6 1.7 14.0 0.4 3.3
Hong Kong 10.9 72.1 5.4 2.7 56.1 1.7 6.2
Republic of Korea 8.3 16.4 2.8 1.7 8.8 0.2 2.8
Singapore 25.7 78.6 8.7 9.8 37.9 0.9 21.3
Taipei,China 2.7 4.9 0.9 0.4 2.9 0.0 0.7
People’s Republic of China 0.8 2.7 0.3 0.2 1.6 0.2 0.4
US na 10.9 1.7 1.6 3.2 0.9 3.4
eurozone 3.8 28.0 6.3 5.3 4.5 4.6 7.4
eurozone = Austria, Belgium, Cyprus, Estonia, Finland, France, Germany, Greece, Ireland, Italy, Luxembourg, Malta, Netherlands, Portugal, Slovakia, Slovenia and Spain; GIIPS = Greece, Ireland, Italy, Portugal, and Spain; na = not applicable; NIE = newly-industrialized economy; UK = United Kingdom; US = United States. Note: Red implies an increase in exposure compared with September 2008 in terms of GDP percentage value greater than $100 million; green implies a decrease in exposure; and black implies no change. Emerging East Asia includes People’s Republic of China; ASEAN-4 plus Viet Nam and NIEs. East Asia includes emerging East Asia plus Japan. Domestic credit as of March 2011 for Japan, Philippines and Viet Nam. Source: ADB calculations using data from Table 9D (Consolidated foreign claims of reporting banks—ultimate risk basis) of the Bank for International Settlements and CEIC.

46 December 2011 | Asia Economic Monitor Asia Economic Monitor | December 2011 47
Can East Asia Weather Another Global Economic Crisis?
46 December 2011 | Asia Economic Monitor Asia Economic Monitor | December 2011 47
on eurozone sovereign debt could bring substantial losses in the event of a default—further deleveraging the US banking system. Given current congressional gridlock and monetary options, policy responses to shocks emanating from the eurozone are likely to be limited.
There are significant risks that both the eurozone and US could suffer a severe and prolonged recession should Europe’s financial crisis deepen significantly.
The eurozone and US economies are now weaker than before the 2008/09 global financial crisis. Their governments are also much more fiscally stretched than in 2008/09. Thus, they cannot afford to support any major bank recapitalization. Subsequent bank deleveraging would depress asset prices, reduce credit supply, and raise lending costs to businesses and consumers—thus dampening private demand. Fiscal austerity saps strength from the economy, while monetary policy cannot offer much traction. Also, financial system stress feeds recession, with the risk that the vicious cycle continues. All this suggests that should the eurozone and US fall into recession anew, it could be deeper, more persistent, and lead to weak and delayed recovery. Thus, it is prudent to examine worst case scenarios and analyze their impact on East Asian economies. An analysis of the impact of a eurozone breakup is beyond the scope of this note—as it could be catastrophic and not easily captured by the model.
How would another global financial crisis impact East Asia?
The region’s economies were severely affected during the global economic slowdown in 2008/09; but most rebounded rapidly.
The 2008/09 global financial crisis immediately hit East Asian markets to varying degrees with credit and equity markets battered—as risk aversion led to a major rise in capital outflows to safe haven assets. The spillover to the real economy led to large declines in trade and GDP growth. Nonetheless, the region recovered quickly and has posted rapid growth since—largely due to strong policy responses from authorities based on massive fiscal and monetary stimulus. East Asian banking systems had the wherewithal to withstand the financial turmoil as they were well capitalized and held few toxic assets. The rapid recovery was aided as global financial markets
stabilized quickly following US and eurozone government intervention to restore confidence.
Thus far, the eurozone’s sovereign debt crisis and anemic US recovery have had limited impact on the region’s economic growth.
While the region’s economic expansion has moderated this year, it remains robust roughly in line with recent historical trends. Exports and industrial production, while slowing, have continued to grow (Figure 72). The economic resilience is partly due to rebalancing sources of growth from external to domestic demand. Consumption and investment are growing in importance as drivers of growth (see Figure 3). Financial systems have been little affected by financial market volatility and have continued channeling funds for investment. Growth in bank lending, while slowing, remains robust.
Historically, the impact of eurozone and US recessions on East Asia has been increasing.
Both the US and eurozone are major markets for the region’s exports and significant sources of financial capital. Hence, any shock to both will have strong repercussions on the region. An examination of four previous episodes of US and eurozone recessions shows their impact on East Asia has been increasing (Table 17). In the two 1990s recessions, East Asia in aggregate
90
100
110
120
130
140
150
Jan-10 May-10 Sep-10 Jan-11 May-11 Sep-11
Total Exports (nominal, $)
Industrial Production Index(real, local currency)2
Retail Sales Index(real, local currency)2
Figure 72: Impact of Current Financial Crisis—Emerging East Asia1 (Jan 2010 = 100)
1Includes ASEAN-4 (Indonesia, Malaysia, Philippines, and Thailand), People’s Republic of China, NIEs (Hong Kong, China; Republic of Korea; Singapore; and Taipei,China), and Viet Nam.2Aggregates are computed using gross national income (Atlas method, current $) as weight. Excludes Hong Kong, China in industrial production index, and Malaysia in retail sales index as monthly data unavailable.Source: ADB calculations using data from CEIC; national sources; and World Development Indicators, World Bank.
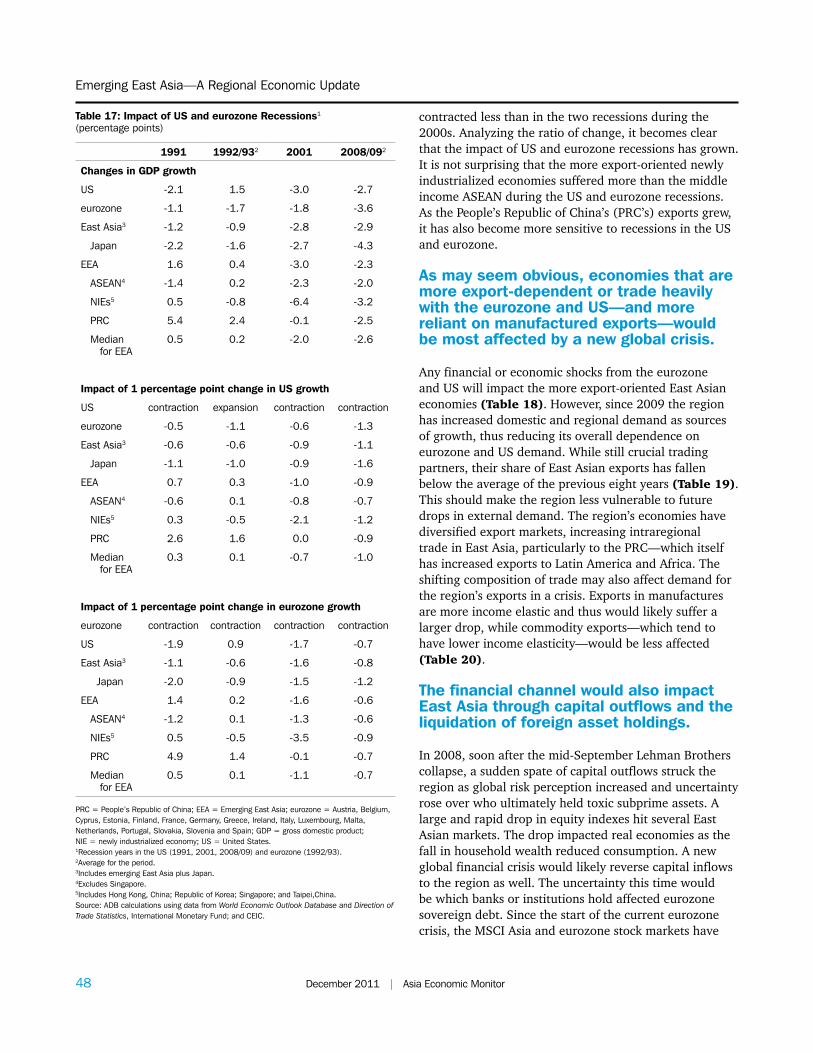
48 December 2011 | Asia Economic Monitor Asia Economic Monitor | December 2011 49
Emerging East Asia—A Regional Economic Update
48 December 2011 | Asia Economic Monitor Asia Economic Monitor | December 2011 49
contracted less than in the two recessions during the 2000s. Analyzing the ratio of change, it becomes clear that the impact of US and eurozone recessions has grown. It is not surprising that the more export-oriented newly industrialized economies suffered more than the middle income ASEAN during the US and eurozone recessions. As the People’s Republic of China’s (PRC’s) exports grew, it has also become more sensitive to recessions in the US and eurozone.
As may seem obvious, economies that are more export-dependent or trade heavily with the eurozone and US—and more reliant on manufactured exports—would be most affected by a new global crisis.
Any financial or economic shocks from the eurozone and US will impact the more export-oriented East Asian economies (Table 18). However, since 2009 the region has increased domestic and regional demand as sources of growth, thus reducing its overall dependence on eurozone and US demand. While still crucial trading partners, their share of East Asian exports has fallen below the average of the previous eight years (Table 19). This should make the region less vulnerable to future drops in external demand. The region’s economies have diversified export markets, increasing intraregional trade in East Asia, particularly to the PRC—which itself has increased exports to Latin America and Africa. The shifting composition of trade may also affect demand for the region’s exports in a crisis. Exports in manufactures are more income elastic and thus would likely suffer a larger drop, while commodity exports—which tend to have lower income elasticity—would be less affected (Table 20).
The financial channel would also impact East Asia through capital outflows and the liquidation of foreign asset holdings.
In 2008, soon after the mid-September Lehman Brothers collapse, a sudden spate of capital outflows struck the region as global risk perception increased and uncertainty rose over who ultimately held toxic subprime assets. A large and rapid drop in equity indexes hit several East Asian markets. The drop impacted real economies as the fall in household wealth reduced consumption. A new global financial crisis would likely reverse capital inflows to the region as well. The uncertainty this time would be which banks or institutions hold affected eurozone sovereign debt. Since the start of the current eurozone crisis, the MSCI Asia and eurozone stock markets have
Table 17: Impact of US and eurozone Recessions1 (percentage points)
1991 1992/932 2001 2008/092
Changes in GDP growth
US -2.1 1.5 -3.0 -2.7
eurozone -1.1 -1.7 -1.8 -3.6
East Asia3 -1.2 -0.9 -2.8 -2.9
Japan -2.2 -1.6 -2.7 -4.3
EEA 1.6 0.4 -3.0 -2.3
ASEAN4 -1.4 0.2 -2.3 -2.0
NIEs5 0.5 -0.8 -6.4 -3.2
PRC 5.4 2.4 -0.1 -2.5
Median for EEA
0.5 0.2 -2.0 -2.6
Impact of 1 percentage point change in US growth
US contraction expansion contraction contraction
eurozone -0.5 -1.1 -0.6 -1.3
East Asia3 -0.6 -0.6 -0.9 -1.1
Japan -1.1 -1.0 -0.9 -1.6
EEA 0.7 0.3 -1.0 -0.9
ASEAN4 -0.6 0.1 -0.8 -0.7
NIEs5 0.3 -0.5 -2.1 -1.2
PRC 2.6 1.6 0.0 -0.9
Median for EEA
0.3 0.1 -0.7 -1.0
Impact of 1 percentage point change in eurozone growth
eurozone contraction contraction contraction contraction
US -1.9 0.9 -1.7 -0.7
East Asia3 -1.1 -0.6 -1.6 -0.8
Japan -2.0 -0.9 -1.5 -1.2
EEA 1.4 0.2 -1.6 -0.6
ASEAN4 -1.2 0.1 -1.3 -0.6
NIEs5 0.5 -0.5 -3.5 -0.9
PRC 4.9 1.4 -0.1 -0.7
Median for EEA
0.5 0.1 -1.1 -0.7
PRC = People’s Republic of China; EEA = Emerging East Asia; eurozone = Austria, Belgium, Cyprus, Estonia, Finland, France, Germany, Greece, Ireland, Italy, Luxembourg, Malta, Netherlands, Portugal, Slovakia, Slovenia and Spain; GDP = gross domestic product; NIE = newly industrialized economy; US = United States.1Recession years in the US (1991, 2001, 2008/09) and eurozone (1992/93).2Average for the period.3Includes emerging East Asia plus Japan.4Excludes Singapore.5Includes Hong Kong, China; Republic of Korea; Singapore; and Taipei,China.Source: ADB calculations using data from World Economic Outlook Database and Direction of Trade Statistics, International Monetary Fund; and CEIC.

48 December 2011 | Asia Economic Monitor Asia Economic Monitor | December 2011 49
Can East Asia Weather Another Global Economic Crisis?
48 December 2011 | Asia Economic Monitor Asia Economic Monitor | December 2011 49
Table 19: Destination of Exports (% of GDP, period average)
Origin
Destination
United States eurozone JapanPeople’s Republic
of China Intraregional
2001-08
2009-10
2001-08
2009-10
2001-08
2009-10
2001-08
2009-10
2001-08
2009-10
East Asia1 5.3 4.0 3.5 3.2 2.2 3.2 3.6 4.2 12.2 12.7
Japan 3.0 2.1 1.5 2.5 na na 1.7 2.5 5.1 6.0
Emerging East Asia2 11.1 6.8 6.9 5.2 4.4 3.0 7.2 6.9 18.4 16.2
ASEAN-4 plus Viet Nam 8.5 5.1 5.7 4.0 7.5 5.1 3.6 5.4 5.1 5.0
Indonesia 3.4 2.0 3.0 2.1 6.2 3.5 1.7 2.2 2.5 2.6
Malaysia 17.6 9.6 9.4 7.4 10.1 8.3 6.7 14.6 9.1 9.5
Philippines 8.0 4.0 6.1 3.7 6.4 3.7 2.9 3.6 3.8 2.2
Thailand 9.4 6.3 6.2 4.5 8.0 6.2 4.6 6.4 7.1 8.3
Viet Nam 10.3 13.1 8.1 8.0 8.1 7.0 5.2 5.7 5.2 5.8
NIEs 9.8 7.4 6.4 6.0 4.4 4.0 15.5 22.1 8.9 9.3
Republic of Korea 5.3 4.5 3.8 3.7 2.8 2.6 6.5 11.4 4.5 5.0
Hong Kong, China 25.0 18.4 14.5 13.6 7.6 7.0 66.7 84.8 7.1 6.3
Singapore 18.8 10.0 15.0 11.2 9.8 7.0 13.1 15.4 25.7 27.5
Taipei,China 8.5 6.8 4.9 4.5 4.2 4.0 10.2 16.1 13.5 11.9
People’s Republic of China 6.0 4.6 0.7 1.5 3.6 2.6 na na 29.9 24.9
GDP = gross domestic product; NIE = newly industrialized economy.na = not applicable.1Includes emerging East Asia plus Japan.2Includes ASEAN-10 (Brunei Darussalam, Cambodia, Indonesia, Lao PDR, Malaysia, Myanmar, Philippines, Singapore, Thailand, and Viet Nam); People’s Republic of China; Hong Kong, China; Republic of Korea; and Taipei,China.Source: ADB calculations using data from Direction of Trade Statistics and World Economic Outlook Database September 2011, International Monetary Fund and CEIC.
Table 18: Trade Openness1 (% of GDP)
Economies 2005 2010
East Asia2 30.6 30.5
Japan 13.1 14.1
Emerging East Asia3 48.0 40.0
ASEAN4 53.8 42.4
Brunei Darussalam 59.1 66.7
Cambodia 47.9 47.9
Indonesia 30.0 22.3
Lao People’s Democratic Republic 25.5 34.0
Malaysia 102.1 83.6
Myanmar 30.9 14.3
Economies 2005 2010
Philippines 40.0 25.9
Thailand 62.5 61.3
Viet Nam 61.3 67.4
NIEs 66.3 78.8
Hong Kong, China 162.9 173.9
Republic of Korea 33.8 46.4
Singapore 183.1 158.8
Taipei,China 54.4 63.9
People’s Republic of China 33.8 26.9
NIE = newly industrialized economy.1Refers to merchandise exports in US dollars as percent of nominal gross domestic product.2Includes emerging East Asia plus Japan.3Includes ASEAN, NIEs, and People’s Republic of China. 4Excludes Singapore.Source: ADB calculations using data from Direction of Trade Statistics and World Economic Outlook Database September 2011, International Monetary Fund.

50 December 2011 | Asia Economic Monitor Asia Economic Monitor | December 2011 51
Emerging East Asia—A Regional Economic Update
50 December 2011 | Asia Economic Monitor Asia Economic Monitor | December 2011 51
Table 20: Composition of Exports1 (% of total, period average)
2001-2008 2009-2010
Manufacturing2 Others Manufacturing2 Others
East Asia3 88.7 11.3 87.2 12.8
Japan 92.8 7.2 89.8 10.2
Emerging East Asia4 87.5 12.5 86.7 13.3
ASEAN-4 plus Viet Nam 69.7 30.3 64.7 35.3
Indonesia 50.6 49.4 42.1 57.9
Malaysia 74.1 25.9 69.7 30.3
Philippines 90.0 10.0 87.3 12.7
Thailand 75.6 24.4 72.8 27.2
Viet Nam 51.4 48.6 59.1 40.9
NIEs 90.8 9.2 87.7 12.3
Hong Kong, China 96.0 4.0 94.4 5.6
Republic of Korea 91.6 8.4 90.3 9.7
Singapore 81.2 18.8 73.7 26.3
Taipei,China 93.2 6.8 91.0 9.0
People’s Republic of China 92.8 7.2 94.7 5.3
NIE = newly industrialized economy.1Based on first-digit level Standard International Trade Classification, Revision 3.2Refers to the sum of chemicals and related products, manufactured goods classified chiefly by material, machinery and transport equipment, and miscellaneous manufactured articles.3Includes emerging East Asia plus Japan.4Includes ASEAN-4 plus Viet Nam, NIEs, and People’s Republic of China.Source: ADB calculations using data from CEIC and United Nations Commodity Trade Database.
Jan: GRC unveils stability
program.
Apr: GRC asks for EU/IMF
package’s activation.
Jun: POR approves austerity package.
Sep: IMF to disburse additional standby
loan to GRC.
Aug: EU and IMF allow fresh tranche for GRC
bailout.
Nov: EU, IMF, IRE agree to rescue
deal.
Feb: EU finance ministers agree on permanent rescue
mechanism.
May: US debt ceiling reached. Aug: S&P cuts
US credit rating.
Oct: EU meets to discuss bailout fund.
Jul: EU grants GRC tentative bailout.
Oct: EU delays decision on giving
GRC next installment of bailout.
Figure 73: Current Financial Crisis Timeline
EU=European Union, GRC=Greece, IRE= Ireland, POR=Portugal, IMF=International Monetary Fund, S&P = Standard and Poor’s.1Designed to measure the equity performance of Asia, excluding Japan. It consists of the country indexes: People’s Republic of China; Hong Kong, China; India; Indonesia; Republic of Korea; Malaysia; Philippines; Singapore; Taipei,China; and Thailand.2MSCI Europe Index includes 16 developed market country indexes.Source: ADB compilation based on Datastream for MSCI Index data; and news articles.
250
300
350
400
450
500
550
600
Jan-10 Mar-10 Jun-10 Sep-10 Dec-10 Mar-11 May-11 Aug-11 Nov-11
MSCI Asia Index
1100
1200
1300
1400
1500
1600
1700MSCI Europe Index
MSCI Europe Index2
MSCI Asia Index1
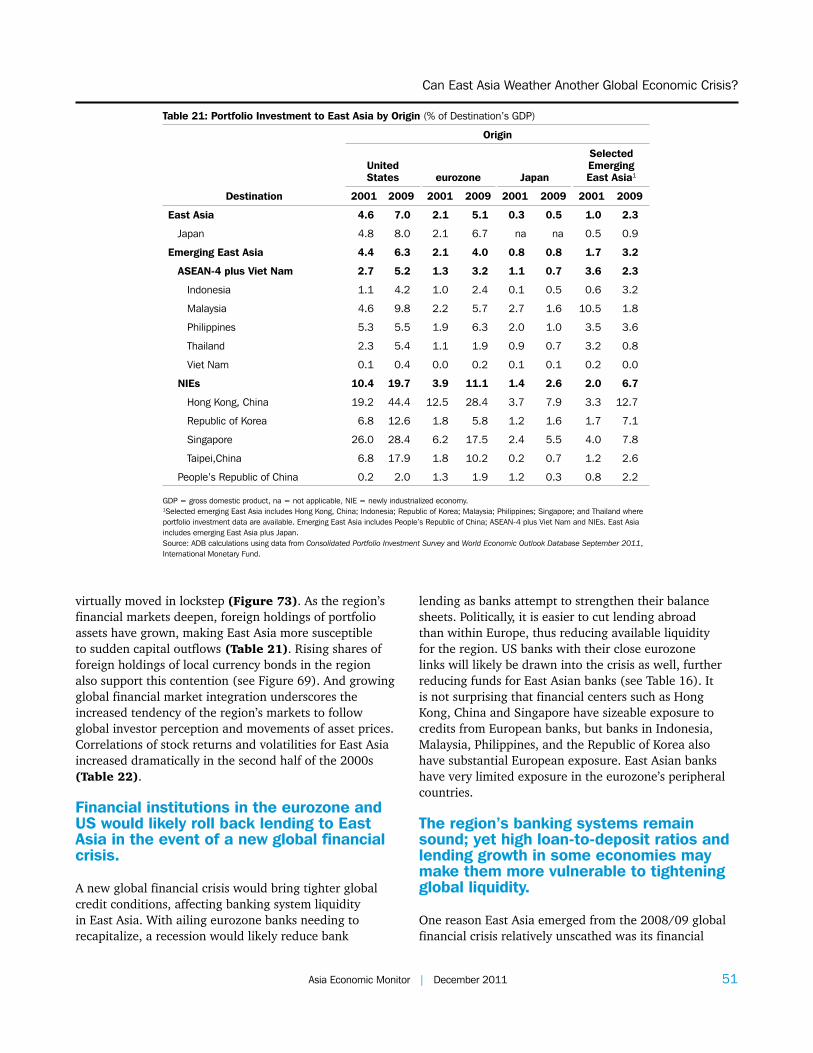
50 December 2011 | Asia Economic Monitor Asia Economic Monitor | December 2011 51
Can East Asia Weather Another Global Economic Crisis?
50 December 2011 | Asia Economic Monitor Asia Economic Monitor | December 2011 51
virtually moved in lockstep (Figure 73). As the region’s financial markets deepen, foreign holdings of portfolio assets have grown, making East Asia more susceptible to sudden capital outflows (Table 21). Rising shares of foreign holdings of local currency bonds in the region also support this contention (see Figure 69). And growing global financial market integration underscores the increased tendency of the region’s markets to follow global investor perception and movements of asset prices. Correlations of stock returns and volatilities for East Asia increased dramatically in the second half of the 2000s (Table 22).
Financial institutions in the eurozone and US would likely roll back lending to East Asia in the event of a new global financial crisis.
A new global financial crisis would bring tighter global credit conditions, affecting banking system liquidity in East Asia. With ailing eurozone banks needing to recapitalize, a recession would likely reduce bank
Table 21: Portfolio Investment to East Asia by Origin (% of Destination’s GDP)
Destination
Origin
United States eurozone Japan
Selected Emerging East Asia1
2001 2009 2001 2009 2001 2009 2001 2009
East Asia 4.6 7.0 2.1 5.1 0.3 0.5 1.0 2.3
Japan 4.8 8.0 2.1 6.7 na na 0.5 0.9
Emerging East Asia 4.4 6.3 2.1 4.0 0.8 0.8 1.7 3.2
ASEAN-4 plus Viet Nam 2.7 5.2 1.3 3.2 1.1 0.7 3.6 2.3
Indonesia 1.1 4.2 1.0 2.4 0.1 0.5 0.6 3.2
Malaysia 4.6 9.8 2.2 5.7 2.7 1.6 10.5 1.8
Philippines 5.3 5.5 1.9 6.3 2.0 1.0 3.5 3.6
Thailand 2.3 5.4 1.1 1.9 0.9 0.7 3.2 0.8
Viet Nam 0.1 0.4 0.0 0.2 0.1 0.1 0.2 0.0
NIEs 10.4 19.7 3.9 11.1 1.4 2.6 2.0 6.7
Hong Kong, China 19.2 44.4 12.5 28.4 3.7 7.9 3.3 12.7
Republic of Korea 6.8 12.6 1.8 5.8 1.2 1.6 1.7 7.1
Singapore 26.0 28.4 6.2 17.5 2.4 5.5 4.0 7.8
Taipei,China 6.8 17.9 1.8 10.2 0.2 0.7 1.2 2.6
People’s Republic of China 0.2 2.0 1.3 1.9 1.2 0.3 0.8 2.2 GDP = gross domestic product, na = not applicable, NIE = newly industrialized economy.1Selected emerging East Asia includes Hong Kong, China; Indonesia; Republic of Korea; Malaysia; Philippines; Singapore; and Thailand where portfolio investment data are available. Emerging East Asia includes People’s Republic of China; ASEAN-4 plus Viet Nam and NIEs. East Asia includes emerging East Asia plus Japan.Source: ADB calculations using data from Consolidated Portfolio Investment Survey and World Economic Outlook Database September 2011, International Monetary Fund.
lending as banks attempt to strengthen their balance sheets. Politically, it is easier to cut lending abroad than within Europe, thus reducing available liquidity for the region. US banks with their close eurozone links will likely be drawn into the crisis as well, further reducing funds for East Asian banks (see Table 16). It is not surprising that financial centers such as Hong Kong, China and Singapore have sizeable exposure to credits from European banks, but banks in Indonesia, Malaysia, Philippines, and the Republic of Korea also have substantial European exposure. East Asian banks have very limited exposure in the eurozone’s peripheral countries.
The region’s banking systems remain sound; yet high loan-to-deposit ratios and lending growth in some economies may make them more vulnerable to tightening global liquidity.
One reason East Asia emerged from the 2008/09 global financial crisis relatively unscathed was its financial

52 December 2011 | Asia Economic Monitor Asia Economic Monitor | December 2011 53
Emerging East Asia—A Regional Economic Update
52 December 2011 | Asia Economic Monitor Asia Economic Monitor | December 2011 53
Table 22: Average Simple Correlation of Stock Price Index (Weekly Returns and Volatility)
Economies Period
Weekly Returns
Period
Weekly Returns Volatiliy
East Asia EEA ASEAN-4 NIEs East Asia EEA ASEAN-4 NIEs
East Asia 2002-2005 0.36 0.36 0.35 0.41 2003-2005 0.22 0.20 0.18 0.30
2006-2011 0.61 0.61 0.61 0.66 2006-2011 0.74 0.74 0.75 0.78
Japan 2002-2005 0.40 0.40 0.37 0.50 2003-2005 0.35 0.35 0.30 0.57
2006-2011 0.60 0.60 0.58 0.71 2006-2011 0.68 0.68 0.68 0.74
EEA 2002-2005 0.36 0.35 0.35 0.40 2003-2005 0.20 0.18 0.17 0.26
2006-2011 0.61 0.61 0.62 0.66 2006-2011 0.74 0.75 0.76 0.79
ASEAN-4 2002-2005 0.35 0.35 0.36 0.37 2003-2005 0.18 0.17 0.15 0.20
2006-2011 0.61 0.62 0.66 0.65 2006-2011 0.75 0.76 0.78 0.78
NIEs 2002-2005 0.41 0.40 0.37 0.51 2003-2005 0.30 0.26 0.20 0.51
2006-2011 0.66 0.66 0.65 0.76 2006-2011 0.78 0.79 0.78 0.88
United States 2002-2005 0.30 0.29 0.20 0.43 2003-2005 0.22 0.20 -0.01 0.48
2006-2011 0.48 0.46 0.43 0.54 2006-2011 0.72 0.71 0.66 0.83
Europe 2002-2005 0.37 0.35 0.26 0.52 2003-2005 0.24 0.21 -0.02 0.55
2006-2011 0.59 0.58 0.56 0.67 2006-2011 0.71 0.71 0.65 0.83
ASEAN-4 = Indonesia, Malaysia, Philippines, and Thailand; EEA = Emerging East Asia; NIEs = Hong Kong, China; Republic of Korea; Singapore; and Taipei,China; and East Asia = EEA plus Japan.Note: Stock price index for each country is in local currency value. Weekly returns are computed as the natural log difference of a Wednesday closing stock price index from the previous Wednesday’s closing price. Correlations reported are taken as simple averages of individual cross-country correlations within a group, and as such, do not necessarily equal to one. Volatility is measured as a 12-week moving standard deviation. EEA includes People’s Republic of China (PRC), ASEAN-4 and NIEs. Data for Europe refer to MSCI Europe Index, which includes 16 developed market country indexes. PRC’s stock price index is computed by combining Shanghai and Shenzhen composites, weighted by respective market capitalizations.Source: ADB calculations using data from Reuters and Bloomberg. Accessed 6 Nov 2011.
system’s strength. A strong capital base and low levels of nonperforming loans left the region’s banking systems largely unaffected during the crisis. This overall soundness continues with high capital adequacy ratios and low nonperforming loans (see Tables 7, 10). As the region recovered from the 2008/09 global financial crisis, lending began to surge on expansionary monetary policy. The result has been growing loan-to-deposit ratios and high bank lending growth in several East Asian economies (see Table 6a). This has led to concerns over possible asset bubbles forming. In the event of a future financial crisis, credit conditions may tighten and bank lending will be constrained—possibly leading to falling asset prices that could damage the health of the banking system.
External vulnerabilities for East Asia appear lower than in 2007.
Another indicator of vulnerability is the current account balance. Economies with balance of payments surpluses will be less susceptible to future crises as they are less dependent on borrowings from abroad. East Asian economies generally show healthy current account
balances (see Table 6b). The region’s external debt position has also improved since 2008 and remains low. In addition, the region’s economies have accumulated substantial foreign reserves, which can comfortably cover import requirements and short-term external debt.
The trade channel is less exposed; but the financial channel remains just as vulnerable as in 2008.
Any impact of a global financial crisis will affect the region through trade and financial channels. The impact of the 2008/09 global financial crisis was transmitted mostly through the trade channel. Global trade flows collapsed and the more open East Asian economies suffered large declines in exports. The trade collapse in 2008 was also exacerbated by the lack of trade financing. Since then, the region has become less dependent on export markets in the eurozone and US. However, some of the decline in trade exposure was due to the weakness in those economies rather than anything structural. While there were large capital outflows in 2008 and 2009, capital soon returned. A new global financial crisis would likely cause a rise in global risk aversion, leading

52 December 2011 | Asia Economic Monitor Asia Economic Monitor | December 2011 53
Can East Asia Weather Another Global Economic Crisis?
52 December 2011 | Asia Economic Monitor Asia Economic Monitor | December 2011 53
Table 23: Fiscal Stimulus in 2008 and 2009 (% of GDP)
Fiscal stimulus
China, People’s Rep. of1 13.0
Hong Kong, China 3.6
Indonesia1 1.4
Japan1 2.0
Korea, Republic of1 4.0
Malaysia 1.0 (first), 9.0 (second)
Philippines 4.6
Singapore 8.0
Taipei,China 1.1
Thailand1 1.3
Viet Nam 1.1 (first), 21.0 (second)
GDP = gross domestic product.1Refers to first fiscal stimulus only; other stimulus packages not included.Source: Figures are based on Economic and Social Survey of Asia and the Pacific 2009, United Nations Economic and Social Commission for Asia and the Pacific; and Asia Capital Markets Monitor April 2009, ADB (for Hong Kong, China and Taipei,China).
0 50 100 150 200
Hong Kong, ChinaIndonesia
Korea, Rep. ofTaipei,China
PRCThailand
Viet NamMalaysia
PhilippinesSingapore
Japan
20102007
Figure 74: Public Debt1 (% of GDP)
PRC=People’s Republic of China, GDP = gross domestic product.1Central government debt for Indonesia; Japan; Republic of Korea; and Taipei,China; federal government debt for Malaysia; and national government debt for Philippines. 2010 values are projections for People’s Republic of China and estimates for Viet Nam.Source: Article IV Consultations, International Monetary Fund; and CEIC.
to implement massive fiscal and monetary stimulus (Table 23). Prudent budget management in response to the 1997/98 Asian financial crisis left ample fiscal space and low public debt except for Japan and Singapore (Figure 74). However, the cost of the macroeconomic stimulus in 2008/09 means economies in the region would face a new crisis with smaller room to maneuver. Fiscal deficits have increased, except in Indonesia (Figure 75). Public debt is also higher for most economies. Given the concerns over Europe’s sovereign debt, East Asian governments would be wary over increasing fiscal deficits. Despite some increases in policy rates, interest rates have not returned to pre-2008 levels, thus reducing the scope for renewed policy interest rate cuts (Figure 76).
Estimating the impact of a new global crisis on East Asia
The extent of the impact on East Asia depends on the severity and depth of the crisis in Europe and its contagion effect.
ADB’s baseline assumptions forecast 2012 growth in the eurozone and US at 0.5% and 2.1%, respectively. Should downside risks materialize, the eurozone could fall into a deep recession with the US economy dragged lower or possibly slip into recession itself. A low probability worst-case scenario would find both the eurozone and US in deep recession, with output reaching the economic troughs of 2009. Thus, three possible scenarios in 2012 are examined:
• Arecessionconfinedtotheeurozone,withtheeconomy contracting 3.9% for 2012 (4.4 percentage points below the ADB baseline). This would bring output to its 2009 level. Under this scenario the US economic growth would slow to 1.6% in 2012 (down 0.5 percentage point from the baseline);
• AdeeprecessionintheeurozoneandUS—astheUSnascent recovery is disrupted by the eurozone debt crisis. Under this scenario, the US economy would contract 0.1% in 2012, 2.2 percentage points below the baseline. A growth of slightly below zero implies the US would be in technical recession.
• AnewglobalcrisiswhereboththeeurozoneandUSoutput falls to the 2009 troughs.
investors to flee the region. Highly leveraged banks would cut lending, resulting in tighter credit conditions and destabilizing the region’s financial systems.
Nonetheless, the ability of East Asian authorities to respond to any immediate crisis has been reduced by limited policy space.
One reason the region escaped the worst impact of the 2008/09 global financial crisis was authorities’ prompt and decisive policy responses. They were able

54 December 2011 | Asia Economic Monitor Asia Economic Monitor | December 2011 55
Emerging East Asia—A Regional Economic Update
54 December 2011 | Asia Economic Monitor Asia Economic Monitor | December 2011 55
0 5-5-10 10
Hong Kong, China
Singapore
Indonesia
Korea, Rep. of
PRC
Thailand
Taipei,China
Philippines
Malaysia
Viet Nam
Japan
20102007
Figure 75: Fiscal Balance of Central Government1 (% of GDP)
GDP = gross domestic product, PRC = People’s Republic of China.1Fiscal year for Hong Kong, China; Singapore; Taipei,China; and Thailand.Source: Asian Development Outlook (various issues), ADB; Article IV Consultations, International Monetary Fund; CEIC; and national sources.
0 4 8 12 16
Japan
Taipei,China
Malaysia
Korea, Rep. of
Thailand
Philippines
Indonesia
PRC
Viet Nam
latest2008-2009 peak
Figure 76: Policy Rate1—Current Level and Pre-crisis Peak(% per annum)
PRC=People’s Republic of China.1One year lending rate (PRC); BI Rate (Indonesia); refinancing rate (Viet Nam); unsecured overnight call rate (Japan); Korea base rate (Republic of Korea); overnight policy rate (Malaysia); reverse repurchase (repo) rate (Philippines); discount rate (Taipei,China); and one-day repo rate (Thailand).Source: Bloomberg and Datastream.
The Oxford Economic Forecasting Model (OEF) is used to assess the potential impact on East Asia under the three scenarios.
The OEF model is a global macroeconomic model that combines elements of time-series and structural models.12 It comprises 46 country models—including 11 Asian country models—linked through trade, prices, exchange rates, and interest rates. Each country model is based on the income-expenditure accounting framework. The
12Oxford Economics. http://www.oxfordeconomics.com/.
model incorporates a natural long-run growth path determined by population and productivity growth. Supply-side policies determine the unemployment rate over the long term, while vertical Phillips curves imply that in the long run, demand policies only yield pressure on inflation and have no impact on real variables. The model also incorporates the Taylor rule for monetary policy for all country models.
Under the first scenario, with recession confined to the eurozone, the growth impact on East Asia ranges from 0.4 to 2.0 percentage points below the 2012 baseline forecast.
As expected, the two city economies—Hong Kong, China and Singapore—would be worst affected, with 2012 GDP growth 1.2 and 2.0 percentage points below their baseline forecasts, respectively (Figure 77). Similarly, those with large trade exposure to the eurozone—the PRC and Taipei,China—would fall about 1.2 percentage points below baseline projections. Japan would be somewhat cushioned by post-disaster reconstruction, with growth expected to fall 0.4 percentage point from its baseline. And possibly because of Japan’s relative resilience and the PRC’s continuing robust growth (above 7%), ASEAN’s major economies would suffer between 0.5 and 0.8 percentage point in 2012 GDP growth.
54 December 2011 | Asia Economic Monitor Asia Economic Monitor | December 2011 55
Can East Asia Weather Another Global Economic Crisis?
54 December 2011 | Asia Economic Monitor Asia Economic Monitor | December 2011 55
Figure 77: Impact of eurozone and US Crisis on 2012 GDP Growth1 (deviation from the baseline forecast, percentage points)
-4.0 -3.5 -3.0 -2.5 -2.0 -1.5 -1.0 -0.5 0.0
East Asia
Japan
Emerging East Asia
People's Republic of China
Taipei,China
Singapore
Republic of Korea
Hong Kong, China
Thailand
Philippines
Malaysia
Indonesiaeurozone recessionSevere recessionNew global crisis
GDP = gross domestic product.Note: Emerging East Asia includes People’s Republic of China (PRC); Hong Kong, China; Indonesia; Republic of Korea; Malaysia; Philippines; Singapore; Thailand; and Taipei,China. East Asia includes emerging East Asia and Japan. Eurozone, according to the OEF model, includes Austria, Belgium, Finland, France, Germany, Greece, Ireland, Italy, Luxembourg, Netherlands, Portugal, Slovakia, and Spain.1Eurozone recession refers to the case when eurozone 2012 GDP level settles at its 2009 trough. New global crisis refers to the case of a eurozone recession and a US 2012 GDP level settling at its 2009 trough. Severe recession refers to a eurozone recession and a technical recession in the US for the first two quarters of 2012. Source: ADB calculations using the Oxford Economics Forecasting Model.
Should the US economy fall into recession in 2012 from a deep eurozone recession and its own weakness, the impact on East Asia would be slightly larger, ranging from 0.5 to 2.5 percentage points below baseline.
Again, Hong Kong, China and Singapore would be hurt most, with 2012 GDP growth 1.6 and 2.5 percentage points below their baseline forecasts, respectively. PRC’s growth would be 1.5 percentage points from its baseline (0.3 percentage point lower than that under the first scenario), while Japan’s output would be 0.5 percentage point below its baseline (0.1 percentage point lower than that under the first scenario). The more open NIEs would grow 1.4 percentage points below the baseline. In contrast, output in ASEAN-4 economies with strong domestic sources of growth would fall an average of 0.7 percentage point from baseline forecasts.
If there is a new global crisis where eurozone and US GDP were to fall to 2009 levels next year, the impact on East Asia would be much more serious, though still less than in 2008/09.
In this extreme scenario, the US economy would be 5.8 percentage points below its 2012 baseline, forcing output growth in East Asia down by 1.2 percentage points from its baseline, or 0.5 percentage point lower than the eurozone-only recession scenario. While substantial, it is much smaller than the observed fall in output growth in the region between 2007 and 2009—when East Asia’s economic growth fell from 6.8% to 1.2%. This is partly due to the base effect: GDP growth in East Asia peaked in 2007 and therefore the 2008-2009 drop was larger. For 2011, East Asia’s GDP growth is estimated to be 4.4%, much lower than 2010’s 7.3%.

56 December 2011 | Asia Economic Monitor Asia Economic Monitor | December 2011 57
Emerging East Asia—A Regional Economic Update
56 December 2011 | Asia Economic Monitor Asia Economic Monitor | December 2011 57
The modest GDP growth impact in 2012 on East Asia from OEF model simulations may underestimate the potential effect of economic decline in the eurozone and US.
There are four reasons the simulations could underestimate the effect. First, macroeconometric models by their nature show shock effects averaging over the sample period as they are estimated in that period. While the 2008/09 crisis may carry a larger weight, the estimated model coefficients are also affected by past events, when the impact of output changes in the eurozone and US were smaller (see Table 17). Second, in the OEF model, countries are linked mainly through trade channels and financial links are limited. Therefore the impact of eurozone and US recessions through the financial channel may not be captured by model simulations. Third, the OEF model does not account for the impact of confidence. Confidence itself could be a major transmission channel through which financial markets affect the real economy immediately and financial panic spreads globally. During the global financial turmoil in late 2008 when Lehman Brothers collapsed, confidence among businesses and consumers dropped significantly, causing business investment and household consumption to fall, leading to an output slump. Finally, as mentioned earlier, Japan remains resilient in all simulations owing to the expected rebound from post-earthquake reconstruction—quite different from 2008/09 when Japan was also in recession. Without Japan’s positive growth in 2012, the rest of East Asia would see a larger decline from economic troubles in the eurozone and US.
Where can policymakers make a difference?
Authorities in East Asia need to respond promptly, decisively, and collectively should downside risks from the eurozone and US materialize and the current crisis morphs into a full-blown financial and economic crisis.
A deepening crisis would send the eurozone into a deep and prolonged recession—with the US possibly following suit. The most immediate challenge would relate to pressures on foreign currency liquidity and the risks of spillovers to the region’s financial systems. Slowing growth could also expose latent financial vulnerabilities, and contingency plans are needed to safeguard financial stability. Preemptive and proactive policies may help,
thus breaking a potentially vicious loop between financial weakness and the real economy. Policy specifics would naturally vary by economy, although short-term responses would broadly fall in three areas—financial, monetary, and fiscal.
Short-term responses are needed to bolster the foundations of financial stability and avoid deterioration in market confidence.
The region’s policymakers will need to ensure adequate and timely provisioning for foreign and domestic liquidity. This is to ensure that systemically important financial institutions are not pressured and credit is available for key economic activities, including trade. Crisis management frameworks can be strengthened and prepared for implementation, if required. Critically important are institutional arrangements for providing emergency liquidity—their scope and effectiveness must be adequate to deal with potentially troubled institutions. Policymakers should also encourage and help banks raise necessary capital to strengthen capital ratios, if needed, and provide full or partial guarantees to new lending. This would help contain the spillover effects from worsening financial conditions and the risks of financial contagion associated with the region’s financial systems.
Monetary policy must remain flexible to allow stimulus where appropriate, while keeping inflationary expectations firmly anchored.
While easing in many East Asian economies, inflation remains elevated in, for example, the PRC; Hong Kong, China; the Republic of Korea; Philippines; Singapore; Thailand; and Viet Nam. Although world commodity prices have fallen somewhat and capacity pressures are easing, currency depreciation from global financial turmoil could become an inflationary source for some economies. Moreover, prices may be less flexible downward as firms strive to maintain profitability in a weakening economic environment. Also, monetary policy may have less traction as banks may become more risk averse and reluctant to lend during a financial panic. Under these circumstances, monetary authorities will need to strike a careful balance to keep inflation under control, even though it limits room to respond to a slowing economy. In particular, the implications of inflation on the poor are important as much of the burden of heightened food and fuel prices disproportionately falls on the most vulnerable. With
56 December 2011 | Asia Economic Monitor Asia Economic Monitor | December 2011 57
Can East Asia Weather Another Global Economic Crisis?
56 December 2011 | Asia Economic Monitor Asia Economic Monitor | December 2011 57
present elevated price levels, diminishing employment opportunities, budgetary pressures on social programs, and the prospect of slowing growth in remittances, strains on the poor will likely intensify.
While extreme volatility (and over- or under-shooting) may warrant foreign exchange market intervention, excessive exchange rate support or foreign exchange reserve drawdowns could overly weaken macroeconomic fundamentals.
During financial panic, particularly when excess volatility and overshooting undermine currency markets and severely disrupt economic activity, there is merit in foreign exchange market intervention. Nonetheless, authorities should be mindful that excessive intervention eventually increases the risk of one-way currencies bets, exacerbating exchange rate volatility and likely forcing a more disruptive adjustment down the road. At the same time, authorities should also avoid competitive depreciation amid a rapidly deteriorating export outlook. It may help if East Asia works to ensure intraregional currency stability through exchange rate policy coordination. In some economies with relatively rigid currency regimes, introducing greater flexibility should help enhance the effectiveness of monetary and fiscal stimulus while rebalancing demand.
Should the eurozone plummet into a full-blown financial and economic crisis, fiscal policy could mitigate the adverse impact on East Asia’s growth prospects—much as it did in late 2008 and in 2009.
Experience from 2008/09 vindicates the critical role fiscal policy played in boosting domestic demand and growth. Since then, many economies in the region have started consolidating public finance and fiscal positions have improved. If spillovers from the eurozone and US hit East Asia again, fiscal and external positions in many economies should have sufficient scope to reintroduce fiscal stimulus to support growth—though not as large as in 2008/09. Also, with monetary policy possibly less effective, a financial panic might lead authorities to favor a more active fiscal response. Furthermore, authorities need to speed the implementation of fiscal stimulus to make it more effective in supporting domestic demand. When deploying fiscal stimulus, however, authorities must be mindful of medium- and long-term fiscal effects—particularly in economies where populations are aging quickly.
National development agendas and the desire to rebalance sources of growth make targeted fiscal stimulus attractive.
Authorities should carefully design fiscal support to cushion the most vulnerable from the immediate effects of a potential global downturn. In particular, they can widen safety nets to cover more of those directly affected by a global downturn or increase the support of these programs, for example, by increasing social security payouts. Also, given the massive deficit in public infrastructure and human resources in most of East Asia, expansionary fiscal policies can target trade and logistics networks on the one hand, and health and education on the other. Better road, sea, and air networks lower trade costs and foster further regional integration; better social services improve human capital. These investments lay the foundations for future growth and help rebalance the region’s sources of growth in the process.
Moreover, macroeconomic stimulus may need to be deployed gradually and judiciously to prepare for a prolonged crisis and weak post-crisis recovery in the eurozone and US.
In both advanced and emerging economies, there is much smaller macroeconomic space than in 2008/09 to respond to a new global financial crisis. The vicious cycle between economic recession and global financial stress would worsen and prolong a crisis, weakening and delaying recovery. The region’s policymakers should thus respond at a measured pace and deploy macroeconomic stimulus gradually and judiciously. As the difficult external environment may last for some time, economies will need to constantly support domestic demand, while continuing the structural adjustments required to adapt to a new environment of low global growth. To counter low demand from advanced economies, the region needs to develop new sources (or drivers) of economic growth by pursuing structural reforms and supply-side policies.
As a corollary, East Asia should cooperate more on efforts to accelerate rebalancing growth toward domestic and regional demand.
With the eurozone and US economies expected to struggle in the coming years, East Asia will have to rely more on regional and domestic demand to grow. To a certain extent, many in East Asia have already diversified export markets beyond the US and eurozone. The PRC

58 December 2011 | Asia Economic Monitor Asia Economic Monitor | December 2011 59
Emerging East Asia—A Regional Economic Update
58 December 2011 | Asia Economic Monitor Asia Economic Monitor | December 2011 59
in particular is expanding exports to Latin America and Africa. Even if the eurozone and US were to avoid severe and prolonged recessions, their growth will likely remain anemic in the near future. It may help for East Asia to consolidate many bilateral and plurilateral free trade agreements into a single, region-wide agreement and to accelerate the rebalancing process.13 Further investment in cross-border infrastructure—transport, communications, and energy systems—will provide the backbone for fostering greater integration.
East Asia must intensify collective action in addressing the knock-on effects of another global financial crisis.
Existing mechanisms under East Asia, particularly the Economic Review and Policy Dialogue (ERPD) and the Chiang Mai Initiative Multilateralization (CMIM), need to be strengthened and used should a new global crisis materialize. Aside from reviewing economic prospects and policy issues, ERPD can become a forum for discussion on coordinating policy responses to external shocks. East Asian policymakers should formulate regional strategies—such as on exchange rates, monetary, and fiscal policies—to counter the possible impact of another global crisis. The CMIM should be further strengthened by expanding its size, expanding its crisis prevention function, and deepening the role of swap lines among regional central banks. Moreover, East Asia could consider establishing an Asian Financial Stability Dialogue to coordinate efforts to address the financial crisis. This could work in parallel with the ERPD. The dialogue would include finance ministries, central banks, and other financial supervisors and regulators—to address financial market vulnerabilities, regulations, and integration efforts with private sector participation.
13ADB. 2008. Emerging Asian Regionalism: A Partnership for Shared Prosperity. Manila.
Conclusion
The eurozone sovereign debt crisis has continued to worsen, and would have serious yet manageable repercussions to East Asia should it evolve into a full-blown financial and economic crisis.
The region’s strong macroeconomic fundamentals allowed it to ride out the 2008/09 crisis despite large initial declines in output. Part of the reason was that it entered the crisis when growth rates were well above long-run averages. Today, growth rates are more aligned with their historical average, leaving the region less vulnerable. Macroeconomic stability will be key for the region to maintain growth momentum. Policymakers have been prudent in managing their economies—with many financial and external vulnerability indicators below those in 2007. Yet some financial vulnerabilities linger and policy space may be smaller today than in 2007. The OEF model simulations show the region’s GDP growth may fall between 0.5 to 2.5 percentage points from ADB baseline forecasts should the eurozone fall into deep recession similar to 2008/09 and the US is also dragged into recession. A deep recession in both the eurozone and US would have more serious impact on East Asia (yet still smaller than in 2008/09).
East Asia should be able to weather another global financial crisis if the region’s policymakers respond promptly, decisively, and collectively.
Policymakers are rightly cautious and prudent with the eurozone debt crisis still unfolding. If downside risks from the eurozone and the US materialize, a disorderly resolution of the eurozone debt crisis could trigger financial contagion and cause a worldwide liquidity crunch. The region’s policymakers need to respond quickly and firmly by deploying financial, monetary, and fiscal policies to restore confidence, ensure financial stability, and support growth. Fiscal policy could be central to support growth, while monetary policy retains enough flexibility to allow stimulus while keeping inflationary expectations anchored. Policymakers should also collaborate closely to prevent financial contagion from spreading further and maximize the positive impact of national policies on other economies in the region.
58 December 2011 | Asia Economic Monitor Asia Economic Monitor | December 2011 59
Can East Asia Weather Another Global Economic Crisis?
58 December 2011 | Asia Economic Monitor Asia Economic Monitor | December 2011 59
Nonetheless, the region must prepare for a prolonged crisis and weak post-crisis recovery by implementing appropriate short-term macroeconomic responses and pursuing necessary long-term structural reforms.
A new global economic crisis could be worse and more prolonged than the 2008/09 crisis. Financial systems would enter a new crisis already damaged. Governments and central banks have far diminished policy space given forced fiscal consolidation in the eurozone and US. The difficult external environment in the coming years suggests that structural reform should be combined with macroeconomic policies that provide needed and affordable support to domestic demand—and thus growth. As external demand is expected to remain sluggish for many years to come, East Asia must rebalance its sources of growth more toward domestic and regional demand.


Asia Economic Monitor December 2011
The Asia Economic Monitor is a semiannual review of emerging East Asia’s growth and policy issues. It covers the 10 members of the Association of Southeast Asian Nations; the People’s Republic of China; Hong Kong, China; Republic of Korea; and Taipei,China. This issue includes a special section: Can East Asia Weather Another Global Economic Crisis?
About the Asian Development Bank
ADB’s vision is an Asia and Pacific region free of poverty. Its mission is to help its developing member countries reduce poverty and improve the quality of life of their people. Despite the region’s many successes, it remains home to two-thirds of the world’s poor: 1.8 billion people who live on less than $2 a day, with 903 million struggling on less than $1.25 a day. ADB is committed to reducing poverty through inclusive economic growth, environmentally sustainable growth, and regional integration.
Based in Manila, ADB is owned by 67 members, including 48 from the region. Its main instruments for helping its developing member countries are policy dialogue, loans, equity investments, guarantees, grants, and technical assistance.
Asian Development Bank6 ADB Avenue, Mandaluyong City1550 Metro Manila, Philippineswww.adb.orgISBN 978-92-9092-509-5Publication Stock No. RPS114204
Printed on recycled paper. Printed in the Philippines9 789290 925095
ISBN 978-92-9092-509-5