bgc partners, inc.s1.q4cdn.com/.../bgcp-3q19-general-ir-ppt-vf-final-final.pdfon november 4, 2016,...
TRANSCRIPT

BGC PARTNERS, INC.NASDAQ: BGCPGeneral Investor Presentation
3Q 2019

DISCLAIMER
2
Discussion of Forward-Looking Statements about BGC
Statements in this document regarding BGC that are not historical facts are “forward-looking statements” that involve risks and uncertainties, which could
cause actual results to differ from those contained in the forward-looking statements. Except as required by law, BGC undertakes no obligation to update
any forward-looking statements. For a discussion of additional risks and uncertainties, which could cause actual results to differ from those contained in
the forward-looking statements, see BGC’s Securities and Exchange Commission filings, including, but not limited to, the risk factors and Special Note on
Forward-Looking Statements set forth in these filings and any updates to such risk factors and Special Note on Forward-Looking Statements contained in
subsequent Forms 10-K, Forms 10-Q or Forms 8-K.
Note Regarding Financial Tables and Metrics
Excel files with BGC’s quarterly financial results and metrics from the current period dating back to the full year 2017 are accessible in the various financial
results press releases at the “Investor Relations” section of http://www.bgcpartners.com. They are also available directly at http://ir.bgcpartners.com/news-
releases/news-releases.
Other Items of Note
“Cash segregated under regulatory requirements” increased mainly due to the acquisition of Ed Broking Group.
In February 2016, the FASB issued ASU No. 2016-02, Leases (Topic 842). This standard requires lessees to recognize a right-of-use (“ROU”) asset and lease
liability for all leases with terms of more than 12 months. Recognition, measurement and presentation of expenses will depend on classification as a
finance or operating lease. The amendments also require certain quantitative and qualitative disclosures. These impacts were approximately $176.1 million
and $193.1 million in Total Assets and Total Liabilities, respectively, as of June 30, 2019. For additional information regarding the adoption of ASC 842,
please see the section titled “New Accounting Pronouncements” in BGC’s Annual Reports on Form 10-K as filed with the Securities and Exchange
Commission.
© 2019 BGC Partners, Inc. All rights reserved.2

DISCLAIMER (CONTINUED)
3
For the purposes of this document, all of the Company’s fully electronic businesses may be collectively referred to as “Fenics”. Fenics includes revenues
from fully electronic brokerage, as well as data, software, and post-trade services. Fenics results do not include those of Trayport due to its sale to
Intercontinental Exchange, Inc. (“ICE”) for approximately 2.5 million ICE common shares in December of 2015. Fenics results do not include those of the
eSpeed business, which was sold to Nasdaq, Inc. (“Nasdaq”) in 2013.
On November 4, 2016, BGC acquired the 80 percent of LFI Holdings LLC (“Lucera”) interests not already owned by the Company. BGC’s financial statements
are presented to include the results of Lucera for all periods in this document prior to their acquisitions because these transactions involved
reorganizations of entities under common control.
Unless otherwise stated, all results provided in this document compare the second quarter 2019 with the year-earlier periods. Certain reclassifications may
have been made to previously reported amounts to conform to the current presentation and to show results on a consistent basis across periods. With the
exception of reporting Newmark as a discontinued operation, any such reclassifications would have had no impact on consolidated revenues or earnings
under GAAP and would leave consolidated pre- and post-tax Adjusted Earnings for the prior periods essentially unchanged all else being equal. Certain
numbers and percentage changes listed throughout this document may not sum due to rounding.
An investor presentation as well as Excel versions of certain tables in this document are available for download at http://ir.bgcpartners.com. The Excel
tables and presentation contain the results discussed in this document as well as other useful information that may not be contained herein. Those viewing
BGC’s financial results release online should see the link to the tables and presentation near the top of the page at http://ir.bgcpartners.com.
Newmark Spin-Off
The Spin-Off included the shares of Newmark Class A and Class B common stock owned by BGC, as well as the shares of Newmark common stock into
which the limited partnership units of Newmark Holdings, L.P. and Newmark Partners, L.P. owned by BGC were exchanged prior to and in connection with
the Spin-Off. For more information, see the press release titled “BGC Partners Announces Completion of Spin-Off of Newmark” dated November 30, 2018,
and the related filing on Form 8-K filed before market open on December 6, 2018. Unless otherwise stated, all the tables and financial results in this
document through the Outlook section reflect continuing operations of BGC and will not match the results and tables in the Company’s press release for
the second quarter of 2018 dated August 2, 2018. The financial results from continuing operations of BGC do not present a distinct corporate segment and
are generally comparable to the stand-alone results for BGC Partners excluding Newmark Group, referred to as “post-spin BGC” in previous documents.
Post-spin BGC represented what BGC financial results would have been had the Spin-Off of Newmark occurred prior to the Distribution date of November
30, 2018. Post-spin BGC can also be defined as the results for BGC’s Financial Services segment plus its pro-rata portion of corporate items.
© 2019 BGC Partners, Inc. All rights reserved.3

DISCLAIMER (CONTINUED)
4
Non-GAAP Financial Measures
This document contains non-GAAP financial measures that differ from the most directly comparable measures calculated and presented in accordance
with Generally Accepted Accounting Principles in the United States (“GAAP”). Non-GAAP financial measures used by the Company include “Adjusted
Earnings before noncontrolling interests and taxes”, which is used interchangeably with “Pre-tax Adjusted Earnings”; “Post-tax Adjusted Earnings to fully
diluted shareholders”, which is used interchangeably with “Post-tax Adjusted Earnings”; “Adjusted EBITDA”; and “Liquidity”. The definitions of these
terms are found later in this document. A summary of certain GAAP and non-GAAP items is below:
Highlights of Results from Continuing Operations
(USD millions) 2Q19 2Q18 Change
Revenues $551.2 $491.0 12.2%
GAAP income (loss) from continuing operations before income taxes 36.8 46.9 (21.7)%
GAAP net income (loss) from continuing operations for fully diluted shares 21.0 20.0 5.0%
Adjusted Earnings before noncontrolling interest in subsidiaries and taxes 102.3 101.5 0.8%
Post-tax Adjusted Earnings 89.8 87.5 2.6%
Adjusted EBITDA 116.6 119.7 (2.5)%
Per Share Results from Continuing Operations 2Q19 2Q18 Change
GAAP fully diluted earnings (loss) per share from continuing operations $0.04 $0.06 (33.3)%
Post-tax Adjusted Earnings per share $0.17 $0.18 (5.6)%

INTRODUCTION
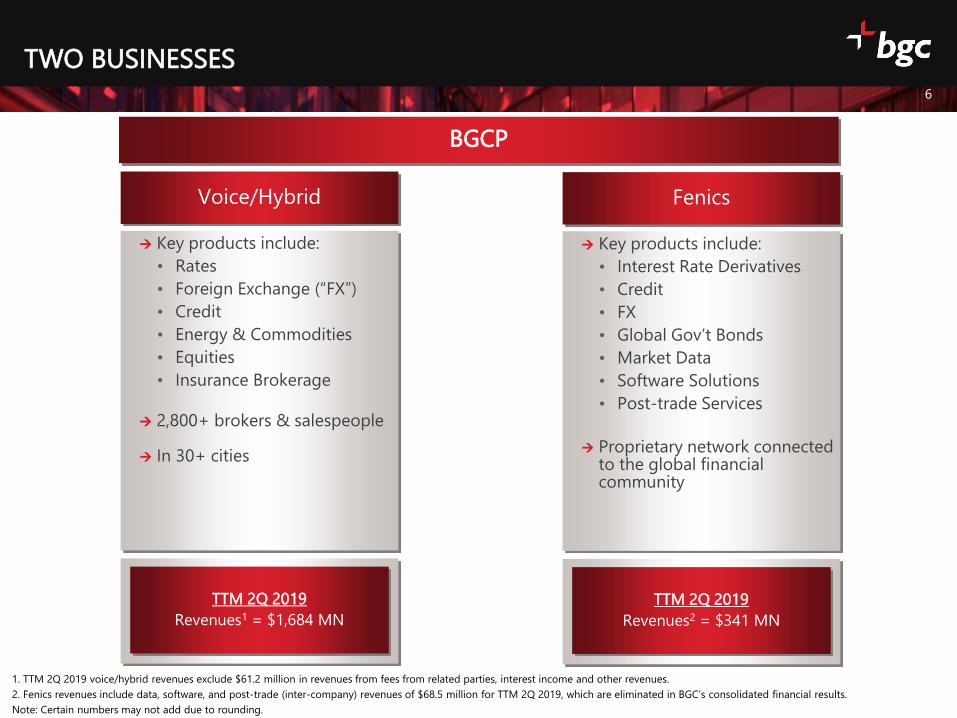
1. TTM 2Q 2019 voice/hybrid revenues exclude $61.2 million in revenues from fees from related parties, interest income and other revenues.
2. Fenics revenues include data, software, and post-trade (inter-company) revenues of $68.5 million for TTM 2Q 2019, which are eliminated in BGC’s consolidated financial results.
Note: Certain numbers may not add due to rounding.
TWO BUSINESSES
Key products include:
• Rates
• Foreign Exchange (“FX”)
• Credit
• Energy & Commodities
• Equities
• Insurance Brokerage
2,800+ brokers & salespeople
In 30+ cities
6
Voice/Hybrid
TTM 2Q 2019
Revenues1 = $1,684 MN
BGCP
Key products include:
• Interest Rate Derivatives
• Credit
• FX
• Global Gov’t Bonds
• Market Data
• Software Solutions
• Post-trade Services
Proprietary network connected to the global financial community
Fenics
TTM 2Q 2019
Revenues2 = $341 MN

SOLID BUSINESS WITH SIGNIFICANT OPPORTUNITIES
Intermediary-oriented, low-risk business model
Strong track record of accretive acquisitions and profitable hiring
History of maximizing shareholder returns and successfully building new brokerage
verticals
• Newmark spin-off
• Entry into insurance in 2017 with acquisition of Besso Insurance followed by recent
acquisition of Ed Broking
Diversified revenues by geography & product
Dividend of $0.14 per share for a 10.9% qualified dividend yield1
Significant product diversity across voice/hybrid brokerage and electronic brokerage
Continue to grow our highly profitable fully electronic Fenics business
Regulatory reforms and the end and/or tapering of QE are expected to result in increased
activity and higher volumes
BGCP earnings and revenue growth expected to continue over time
7
1. Yield based on BGCP’s closing price on August 9, 2019

DIVIDEND AND VALUATION OF BGC
8
BGC has a longstanding dividend policy of paying out at least 75 percent of post-tax Adjusted Earnings
per share3
3. Please see Dividend Policy section in BGC’s Form 10-Q for 2Q 2019 filed with the Securities and Exchange Commission for further information.
BGCP Stock Price1 $5.12
BGCP Quarterly Dividend $0.14
BGCP Dividend Yield 10.9%
Market Capitalization ($ MN)2 $2,679
2018 Post-tax Adjusted Earnings ($ MN) $341
2018 P/E Ratio 7.9 X
2018 Adjusted EBITDA ($ MN) $495
2018 EV/AEBITDA 6.9 X
1. BGCP closing price on August 9, 2019
2. Based on BGCP's closing price above and BGC's fully diluted spot sharecount on June 30, 2019
Note: Figures are for BGC's continuing operations.
BGC's Dividend Yield and Valuation (for illustrative purposes only)

BUSINESS OVERVIEW

TTM 2Q 2019 REVENUE BREAKDOWN BY ASSET CLASS
10
Rates, 28%
F/X, 20%
Credit, 15%
Energy &
Commodities, 13%
Equities, insurance,
and other asset
classes, 19%
Data, Software, Post-trade and
Other, 6%
TTM 2Q 2019
$2.02 billion
Note: Other includes fees from related parties, interest income and other revenues .
Percentages may not sum to 100% due to rounding.
BGC maintains a diverse
revenue base
Overall industry volumes
across Rates, F/X, Credit,
Energy & Commodities, and
Equities typically seasonally
strongest in 1st quarter,
weakest in 4th quarter
BGC’s Businesses at a Glance

REVENUE BREAKDOWN BY GEOGRAPHY
11
Total Americas revenue up 3% in TTM 2Q 2019 compared to prior year period
Europe, Middle East & Africa revenue up 8% in TTM 2Q 2019
Asia Pacific revenue up 19% in TTM 2Q 2019
Note: Percentages may not sum to 100% due to rounding.
EMEA54%
Americas30%
APAC16%
FY18TTM 2Q 2019
Global Revenues

BGC BREADTH: WHY BIGGER REALLY IS BETTER
12
BGC’s global presence is covered via many brands across all major geographies
BGC operates a number of wholesale and interdealer brands covering investment banks
BGC also operates a number of agency brands covering institutional clients and asset managers
AGENCY(Institutional and
End-Users)
IDB(Investment
Banks)
(all brands
independently
serviced by)

TWO BUSINESSES - MANY BRANDS: MIGRATION TO ELECTRONIC
13
Voice
Hybrid
Electronic
Extent of
Migration

BGC’S FRONT OFFICE HEADCOUNT & PRODUCTIVITY
Average revenue per front office employee was $188,000 in 2Q2019, down 3% from a year earlier
BGC’s revenue per front office employee has generally fallen after meaningful increases in headcount
due to acquisitions and/or hires
As the integration of recent acquisitions continues, recently hired brokers ramp up production, and as
more voice and hybrid revenue is converted to more profitable fully electronic trading, the Company
expects broker productivity to grow
FRONT OFFICE HEADCOUNT
Note: The figures in the above table include total brokerage revenues from continuing operations and revenues from data, software and post-trade. The average revenues for all producers are
approximate and based on the relevant revenues divided by the average number of producers for the period.
FRONT OFFICE PRODUCTIVITY
733 737676
756
TTM2Q18
TTM2Q19
FY 2017 FY 2018
(period-average, USD Thousands)(as of period-end)
2,465 2,486 2,6542,840 2,819
2Q 2018 3Q 2018 4Q 2018 1Q 2019 2Q 2019
Financial Brokerage
14

Drivers
Revenue Highlights
1. Data, software, and post-trade excludes inter-company revenues.
Note: See the section titled “Non-GAAP Financial Measures” on page 4.
BUSINESS OVERVIEW 2Q 2019 VS. 2Q 2018
$141,400 $152,959
$102,307 $101,899
$75,526 $78,166
$56,277$73,430
$87,965
$104,947$15,370
$18,741
2Q 2018 2Q 2019
Other
Data, software, and post-
trade Equities, Insurance & Other
Energy and commodities
Credit
Foreign exchange
Rates
$12,198
2Q 2019 Revenue Breakdown
Revenue Breakdown
$491,043
$551,187$21,045
Fenics1
13%
Voice / Hybrid &
Other
87%
(USD $000s) Total revenues increased 12% YoY
31% revenue growth in energy and commodities
19% revenue growth in equities, insurance and
other asset classes
22% revenue growth in data, software, and post-
trade revenues
Revenues would have been at least $9 million
higher, but for the strengthening of the U.S. dollar
relative to other major currencies
Increased revenue growth in energy and
commodities business, led by organic growth and
the acquisitions of Poten and Ginga Petroleum,
partially offset by the sale of CSC Commodities
Revenues from equities, insurance, and other asset
classes increased due largely to the acquisition of
Ed Broking
15

$48 $71 $78 $81
$101
$192 $209
$223
$261 $273
FY10 FY11 FY12 FY13 FY14 FY15 FY16 FY17 FY18 TTM
2Q19
Fenics Net Revenue Growth1 2Q 2019 Fenics Revenue Breakdown2
Net 2Q19 Fenics revenues up 5% year-over-year, and total Fenics revenues (including inter-company) up 10% to $92.9 million
Data, software and post-trade revenues up 22% to $18.7 million in 2Q 2019
Fenics revenues comprised 14% of total revenues in 1H2019 versus approximately 4% in 2010 (net of inter-company
eliminations)
1. Excludes inter-company revenues, revenues related to eSpeed (sold in June 2013), and revenues related to Trayport (sold in December 2015).
2. Excludes a relatively small amount of revenues related to equities and other products and energy and commodities. Inter-company revenues are eliminated in consolidation.
Note: Percentages may not sum to 100% due to rounding. BGC’s revenues prior to 2014 are Financial Services segment revenues. BGC’s revenues from 2014 are from Continuing Operations.
BUSINESS OVERVIEW: FENICS
(USD millions)
16
Rates
26%Credit
20%
FX
9%
Data, software and
post trade (inter-
company)
23%
Data, software
and post trade
20% Equities
and other
2%

Across U.S.
Municipal Bonds
Wolfe & Hurst
Paris
Credit, Swaps
Ginalfi
U.K.
Rates
Sterling
Environmental
brokerage
CO2e
Global
Commodities
Rates
FX
Credit
Equities
GFI Group
1. BGC acquired the rights of these businesses
New York / New
Jersey / Florida
Regional Power
Markets / Nat Gas
Mexico
Rates
Bonds
Remate Lince
London
Rates, FX
R.P. Martin1
HEAT Energy1
20132011 2012 2014 2015 2016
Electronic Fixed
Income / Futures
Trading
Perimeter
Technology Infra-
structure for OTC
Financial Markets
Lucera
Primarily Equity
Derivatives
Sunrise
Maxcor/Eurobrokers (2005)
ETC Pollack (2005)
Aurel Leven (2006)
AS Menkul (2006)
Marex Financial1 (2007)
Radix Energy (2008)
Liquidez (2009)
Mint Partners / Mint Equities1
8 Acquisitions
20172005 - 2010
Insurance
brokerage
Besso
Rates, Credit, FX
South Africa
Micromega
Securities
Electronic trading
Emerging Markets
Bond Exchange Ltd
2018
Real-time pricing
and analytics
software
Kalahari Limited
STRONG RECORD OF SUCCESSFUL, ACCRETIVE ACQUISITIONS
17
Shipping brokerage
Poten & Partners
2019
Energy Brokerage
Ginga Petroleum
Insurance
Brokerage
Ed Broking Group

CONCLUSION

SOLID BUSINESS WITH SIGNIFICANT OPPORTUNITIES
Intermediary-oriented, low-risk business model
Strong track record of accretive acquisitions and profitable hiring
History of maximizing shareholder returns and successfully building new brokerage
verticals
• Newmark spin-off
• Entry into insurance in 2017 with acquisition of Besso Insurance followed by recent
acquisition of Ed Broking
Diversified revenues by geography & product
Dividend of $0.14 per share for a 10.9% qualified dividend yield1
Significant product diversity across voice/hybrid brokerage and electronic brokerage
Continue to grow our highly profitable fully electronic Fenics business
Regulatory reforms and the end and/or tapering of QE are expected to result in increased
activity and higher volumes
BGCP earnings and revenue growth expected to continue over time
19
1. Yield based on BGCP’s closing price on August 9, 2019

GAAP FINANCIAL RESULTS

BGC PARTNERS, INC. CONDENSED CONSOLIDATED STATEMENTS OF FINANCIAL CONDITION (IN THOUSANDS, EXCEPT PER SHARE DATA) (UNAUDITED) (UNDER GAAP)
21
June 30, December 31,
2019 2018
Assets
Cash and cash equivalents $ 399,429 $ 336,535
Cash segregated under regulatory requirements 216,690 80,243
Securities owned 62,085 58,408
Marketable securities 12,772 32,064
Receivables from broker-dealers, clearing organizations, customers and related broker-dealers 2,273,726 941,866
Accrued commissions and other receivables, net 602,279 516,091
Loans, forgivable loans and other receivables from employees and partners, net 259,400 216,868
Fixed assets, net 179,324 157,169
Investments 36,661 35,403
Goodwill 560,284 504,646
Other intangible assets, net 310,751 298,779
Receivables from related parties 6,279 7,748
Other assets 472,138 246,937
Total assets $ 5,391,818 $ 3,432,757
Liabilities, Redeemable Partnership Interest, and Equity
Short-term borrowings $ 5,219 $ 5,162
Repurchase agreements 1,100 986
Securities loaned 12,290 15,140
Accrued compensation 205,405 195,234
Payables to broker-dealers, clearing organizations, customers and related broker-dealers 2,107,383 769,833
Payables to related parties 66,743 40,155
Accounts payable, accrued and other liabilities 1,055,082 754,819
Notes payable and other borrowings 1,062,221 763,548
Total liabilities 4,515,443 2,544,877
Redeemable partnership interest 24,929 24,706
Equity
Stockholders' equity:
Class A common stock, par value $0.01 per share; 750,000 shares authorized; 348,374
and 341,745 shares issued at June 30, 2019 and December 31, 2018,
respectively; and 297,871 and 291,475 shares outstanding at
June 30, 2019 and December 31, 2018, respectively 3,484 3,417
Class B common stock, par value $0.01 per share; 150,000 shares authorized;
45,884 shares issued and outstanding at June 30, 2019 and
December 31, 2018, respectively, convertible into Class A common stock 459 459
Additional paid-in capital 2,228,854 2,208,221
Treasury stock, at cost: 50,503 and 50,270 shares of Class A common stock at
June 30, 2019 and December 31, 2018, respectively (315,210 ) (314,240 )
Retained deficit (1,124,860 ) (1,105,019 )
Accumulated other comprehensive income (loss) (26,390 ) (24,465 )
Total stockholders' equity 766,337 768,373
Noncontrolling interest in subsidiaries 85,109 94,801
Total equity 851,446 863,174
Total liabilities, redeemable partnership interest and equity $ 5,391,818 $ 3,432,757

BGC PARTNERS, INC. CONDENSED CONSOLIDATED STATEMENTS OF OPERATIONS (IN THOUSANDS, EXCEPT PER SHARE DATA) (UNAUDITED) (UNDER GAAP)
22
Three Months Ended June 30,
2019 2018
Revenues:
Commissions $ 420,969 $ 378,487
Principal transactions 90,432 84,988
Total brokerage revenues 511,401 463,475
Fees from related parties 7,221 5,934
Data, software and post-trade 18,741 15,370
Interest income 7,813 4,940
Other revenues 6,011 1,324
Total revenues 551,187 491,043
Expenses:
Compensation and employee benefits 290,071 252,250
Equity-based compensation and allocations of net income
to limited partnership units and FPUs 43,752 45,602
Total compensation and employee benefits 333,823 297,852
Occupancy and equipment 45,109 34,365
Fees to related parties 6,457 5,882
Professional and consulting fees 23,347 20,001
Communications 29,974 30,729
Selling and promotion 21,491 17,855
Commissions and floor brokerage 16,791 15,345
Interest expense 14,985 10,028
Other expenses 21,765 14,548
Total non-compensation expenses 179,919 148,753
Total expenses 513,742 446,605
Other income (losses), net:
Gain (loss) on divestiture and sale of investments (1,619 ) —
Gains (losses) on equity method investments 738 1,011
Other income (loss) 194 1,481
Total other income (losses), net (687 ) 2,492
Income (loss) from continuing operations before income taxes 36,758 46,930
Provision (benefit) for income taxes 14,993 14,571
Consolidated net income (loss) from continuing operations 21,765 32,359
Consolidated net income (loss) from discontinued operations, net of tax — 17,631
Consolidated net income (loss) $ 21,765 $ 49,990
Less: Net income (loss) from continuing operations attributable to
noncontrolling interest in subsidiaries 8,154 12,358
Less: Net income (loss) from discontinued operations attributable to
noncontrolling interest in subsidiaries — 2,429
Net income (loss) available to common stockholders $ 13,611 $ 35,203

BGC PARTNERS, INC. CONDENSED CONSOLIDATED STATEMENTS OF OPERATIONS - CONTINUED (IN THOUSANDS, EXCEPT PER SHARE DATA) (UNAUDITED) (UNDER GAAP)
23
Three Months Ended June 30,
2019 2018
Per share data:
Basic earnings (loss) per share from continuing operations
Net income (loss) from continuing operations available to common stockholders $ 13,611 $ 20,001
Basic earnings (loss) per share from continuing operations $ 0.04 $ 0.06
Basic weighted-average shares of common stock outstanding 341,272 321,199
Fully diluted earnings (loss) per share from continuing operations
Net income (loss) from continuing operations for fully diluted shares $ 21,010 $ 20,001
Fully diluted earnings (loss) per share from continuing operations $ 0.04 $ 0.06
Fully diluted weighted-average shares of common stock outstanding 522,984 322,720

MIGRATION TO FULLY ELECTRONIC
BUSINESSES

CONVERSION TO FULLY ELECTRONIC BROKERAGE BY ASSET CLASS
25
* 2010 excludes eSpeed
** Total fully electronic brokerage revenues includes revenue from energy and commodities and equities, insurance, and other asset classes
3%
5%7%
4%4%
16%
26%
8%
16%
11%
13 17 13
42
89
77
31
196
0
50
100
150
200
250
0%
5%
10%
15%
20%
25%
30%
Rates Credit F/X Rates,
Credit and
FX
Total Fully
Electronic
Brokerage
Revenues
**
Rates Credit F/X Total
(Rates,
Credit and
F/X)
FY 2010* TTM 2Q2019 $ MN
Fully Electronic Brokerage Revenues (% of Total Brokerage Revenues)
Fully Electronic Brokerage Revenues ($ MN)

13 13 12 14 13 13 14 18 16 15 15 17 21
14 13 13 13 13 14 1415 15 17 18 18
19
4136 35
46 45 40 38
53 5343
46
59 53
69
61 60
73 7167 66
86 85
7580
93 93
0
10
20
30
40
50
60
70
80
90
100
2Q2016 3Q2016 4Q2016 1Q2017 2Q2017 3Q2017 4Q2017 1Q2018 2Q2018 3Q2018 4Q2018 1Q2019 2Q2019
Data, software and post-trade (inter-company)
Data, software and post-trade
Total Fully Electronic Brokerage
Quarterly Fenics Revenues1 (2Q2016-2Q2019)
Overall Fenics net revenues up 5%2 in 2Q 2019, and total revenues (including
inter-company) up10%
1. “Fenics” results include data, software, and post-trade (inter-company) revenues, which are eliminated in BGC’s consolidated financial results.
2. Excludes intercompany revenues
FENICS REVENUES
26
(USD millions)
Note: Certain numbers may not add due to rounding.
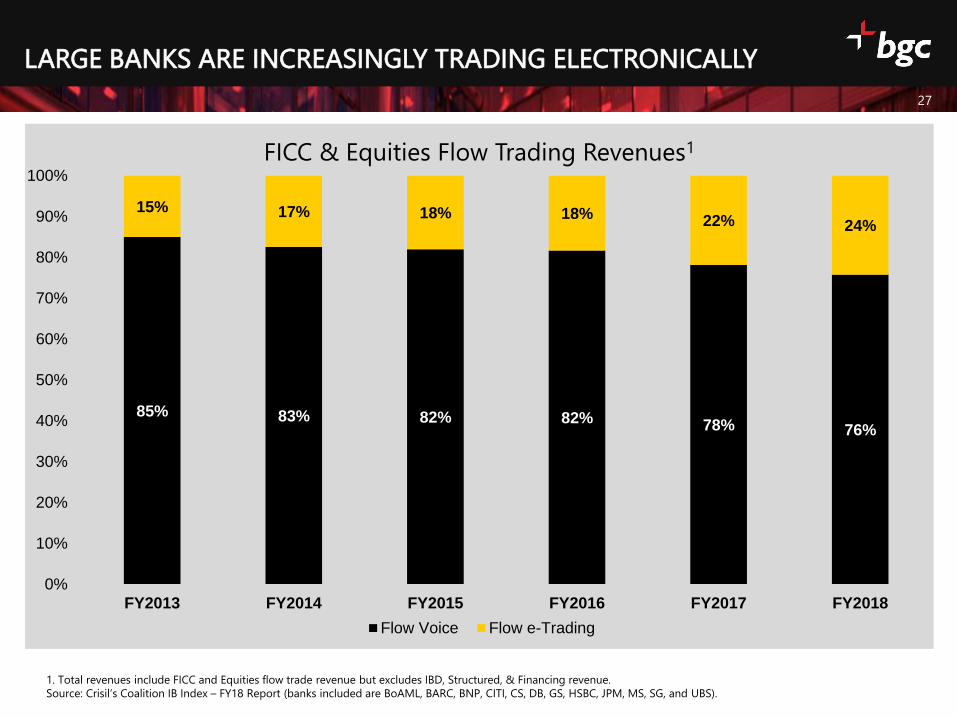
LARGE BANKS ARE INCREASINGLY TRADING ELECTRONICALLY
27
85% 83% 82% 82% 78% 76%
15% 17% 18% 18% 22% 24%
0%
10%
20%
30%
40%
50%
60%
70%
80%
90%
100%
FY2013 FY2014 FY2015 FY2016 FY2017 FY2018
FICC & Equities Flow Trading Revenues1
Flow Voice Flow e-Trading
1. Total revenues include FICC and Equities flow trade revenue but excludes IBD, Structured, & Financing revenue.
Source: Crisil’s Coalition IB Index – FY18 Report (banks included are BoAML, BARC, BNP, CITI, CS, DB, GS, HSBC, JPM, MS, SG, and UBS).

INDUSTRY IS EMBRACING ELECTRONIFICATION
Source: The Trade – April 17, 2018
Source: Bloomberg, February 15, 2018
28
Source: Financial Times – May 9, 2018
Source: Bloomberg – January 17, 2018
Source: Greenwich Associates – February 6, 2018
Source: Bloomberg, March 20, 2018
Source: JPMorgan Chase 2019 Investor Day Corporate &
Investment Bank presentation, February 26, 2019
Source: Bloomberg – March 7, 2019

OPPORTUNITY (REPORTED 2018 REVENUE)
29
* BGC’s data, software and post-trade revenues
** Converted at a £/$ exchange rate of 1.34
*** Converted at a £/$ exchange rate of 1.33
**** Includes market data revenues generated by NEX subsequent to the acquisition of NEX by CME on November 2, 2018
Fenics
SolutionsTP ICAP
Information
$157 MN**
NEX
Optimisation
$346 MN*** $450 MN****
CME Group
(Market Data &
Information Services)
IHS Markit
(Financial Services)ICE
Data Services
$1,420 MN $2,115 MN$65 MN*
Source: Company reports.

FENICS MARKETS FULLY ELECTRONIC NEW OPPORTUNITIES
30
BUSINESS MODEL OF NON-BANK LIQUIDITY PROVIDERS
30
Note: Total revenues exclude Core Prime Brokerage, Commodities and Munis
Source: Oliver Wyman and Morgan Stanley report on Wholesale Banks and Asset Managers, March 17, 2017
Extent of e-trading
Primarily electronic
Short-term Risk Warehousing
Primarilyvoice
EM credit
Illiquid credit
Single name CDS
IG bonds
Illiquid cash equities
Equity swaps
CDS index
G10 govies
Cleared IRS
G10 FX swaps & fwds
EM FX spot
Listed futures and options
~25BN
~30BN
~30BN
Total industryrevenue ($)
~55BN
G10 spot
Liquid cashequities
HY bonds
Structured derivatives
OTC equity options
EM rates
FX options
Uncleared IRS
US Treasuries
Most
accessible
Accessibly for
nonbank
liquidity
providers
Least
accessible
Long-term Risk Risk Warehousing Warehousing

APPENDIX

SMALL SLICE OF GLOBAL EXECUTION REVENUES = HUGE POTENTIAL FOR TRADITIONAL IDBs AND WHOLESALE BROKERS
BGC, $1.9
All Other Wholesale Broker &
Execution Peers, $7.9
IB FICC, $100.0
IB Equities, $64.0 Wholesale &
Execution, $9.9
Other, $50.8
2018 Global Sales & Trading Revenues ≈ $225(in USD billions)
32
Source: Morgan Stanley, Oliver Wyman, Coalition IB Index – FY18 for FICC and Equities, company filings, industry reports, and BGC estimates. “Other” = exchanges, CCPs, all other execution
venues, market data, technology providers, CSDs, or custodians and other 3rd parties. The total FICC and Equities revenues for 2018 are based on estimates from Morgan Stanley and Oliver
Wyman. The breakup for the individual categories within FICC (G-10 rates, G-10 FX, EM, Credit and Securitized, and Commodities) and Equities (Cash equities, Derivatives, and Prime and
synthetics) are based on estimates from Coalition. Major Wholesale & Execution companies include BGC and BGC’s estimates in areas such as rates, credit, FX, equity, energy, and commodity
brokerages of GFI, NEX Group (analyst estimate for FY ended 3/31/2019 on 11/2/2018) TP/ICAP, Tradition, ICE’s CDS execution business from 2017, Marex Spectron, ITG, Tradeweb,
MarketAxess, Thomson Reuters’ Financial Risk Transactions/Refinitiv revenue, FC Stone, and other non-public IDB and wholesale broker estimated revenues. Note: figures may not sum due to
rounding.
FY 2018 Wholesale Broker & Execution
Revenues(in USD billions)
BGC, other wholesale financial brokerages, and their execution
peers currently comprise only a small percentage of the total
global sales & trading market
Reductions in bank balance sheets may provide opportunities for
BGC’s business
FICC (USD billions) Equities (USD billions)
G-10 rates G-10 FX EMCredit and
SecuritizedCommodities Cash equities Derivatives
Prime and
synthetics
29 12 20 33 6 13 26 25

Bank to Client Market Opportunity $ BN
G-10 rates 29
G-10 FX 12
EM 20
Credit and Securitized 33
Commodities 6
a FICC 100
Cash equities 13
Derivatives 26
Prime and synthetics 25
b Equities 64
c=a + b FICC + Equities 164
d Wholesale Broker & Execution Peers 10
e Banks and Broker Dealers 29
f Exchange Execution 13
g Other Market Infrastructure (non-bank liquidity providers ) 9
h=f + g Market Infrastructure 22
i=e + h Market Connectivity: Banks and Broker Dealers, and Market Infrastructure 51
j=c + d + i Traditional IDBs and Wholesale Brokers (from previous page) 225
Non-Traditional Market Opportunity $ BN
k Shipping* 2
l Insurance Brokerage* 55
m=k + l Non-Traditional Market Opportunity 57
j + m Traditional and Non-Traditional Market Opportunity ($ BN) 281
TRADITIONAL AND NON-TRADITIONAL OPPORTUNITY FOR IDBs AND WHOLESALE BROKERS (2018)
33
Source: Morgan Stanley, Oliver Wyman, Coalition IB Index – FY18 for FICC and Equities, company filings, industry reports, and BGC estimates. “Other” = exchanges, CCPs, all other execution
venues, market data, technology providers, CSDs, or custodians and other 3rd parties. The total FICC and Equities revenues for 2018 are based on estimates from Morgan Stanley and Oliver
Wyman. The breakup for the individual categories within FICC (G-10 rates, G-10 FX, EM, Credit and Securitized, and Commodities) and Equities (Cash equities, Derivatives, and Prime and
synthetics) are based on estimates from Coalition. Major Wholesale & Execution companies include BGC and BGC’s estimates in areas such as rates, credit, FX, equity, energy, and commodity
brokerages of GFI, NEX Group (analyst estimate for FY ended 3/31/2019 on 11/2/2018) TP/ICAP, Tradition, ICE’s CDS execution business from 2017, Marex Spectron, ITG, Tradeweb,
MarketAxess, Thomson Reuters’ Financial Risk Transactions/Refinitiv revenue, FC Stone, and other non-public IDB and wholesale broker estimated revenues. Note: figures may not sum due to
rounding.
$3 BN could move
to non-bank
liquidity providers
such as HFTs and
algo trading firms
that utilize
electronic trading,
per Morgan Stanley
and Oliver Wyman

STRONGLY CAPITALIZED; INVESTMENT GRADE CREDIT PROFILE
34
(USD $000s)
BGC Partners, Inc. As of 6/30/2019
Cash and Cash Equivalents $399,429
Repurchase Agreements (1,100)
Securities Owned 62,085
Marketable Securities (net) 482
Total Liquidity1 $460,896
Maturity
Unsecured senior revolving credit agreement 11/28/2020 278,680
5.125% Senior Notes 05/27/2021 298,251
Collateralized Borrowings5/31/2021, 4/8/2023,
and 4/19/202340,458
5.375% Senior Notes 07/24/2023 444,832
Total Notes payable and other borrowings $1,062,221
Credit Ratios (Adj. EBITDA and Ratios as of TTM Q2 2019)
Adjusted EBITDA $494,044
Leverage Ratio: Total Notes payable and other borrowings / Adjusted EBITDA 2.2x
Net Leverage Ratio: Net Notes payable and other borrowings / Adjusted EBITDA 1.2x
Adjusted EBITDA / Interest Expense 9.8x
(1) As of June 30, 2019, $12.3 million of Marketable securities on our balance sheet were lent out in Securities loaned transactions
and therefore are not included as part of our Liquidity Analysis.

1. Class A shares owned by board members or executives and restricted shares owned by other employees. Any Class A share owned by an employee without restriction is included in the
“Class A owned by Public”.
2. Partnership units owned by employees include founding/working partner units and limited partnership units. In conjunction with the spin-off of Newmark, the Partnership units are owned
by employees of both Newmark and BGC. Over time, virtually all of the partners of Newmark are expected to only own units and/or shares of Newmark and virtually all of the partners of
BGC are expected to only own units and/or shares of BGC. Going forward, partners of BGC will be compensated with BGC partnership units and partners of Newmark will be compensated
with Newmark partnership units.
3. These primarily represent contingent shares and/or units for which all necessary conditions have been satisfied except for the passage of time.
4. Includes 15.8 million Cantor distribution rights.
BGC’S FULLY DILUTED SHARE COUNT SUMMARY AS OF JUNE 30, 2019
35
(share count in millions)
BGC Partners, Inc. Fully Diluted Share Count SummaryFully-diluted
Shares (MN )
Ownership
(%)
Class A owned by Public 279.0 53%
Class A owned by executives, board members and employees(1) 18.3 3%
Partnership units owned by employees(2) 126.1 24%
Other owned by employees(3) 1.6 0%
Class A owned by Cantor 0.0 0%
Class B owned by Cantor 45.9 9%
Partnership units owned by Cantor (4) 52.4 10%
Total 523.3 100%
BGC Partners, Inc. Fully Diluted Share Count SummaryFully-diluted
Shares (MN )
Ownership
(%)
Public 279.0 53%
Employees 146.0 28%
Cantor 98.3 19%

THERE IS SOME CORRELATION BETWEEN BGC’S BROKERAGE REVENUES AND CERTAIN INDUSTRY METRICS
36
Note: Correlation and R-Squared periods measured are quarterly from 1Q2007 through 4Q2018 except for CME FX Futures (1Q2008 through 4Q2018) and Fed Primary Dealer Positions for
Corporate Securities (1Q2009 through 4Q2018). Correlation and R-Squared between rates and FX revenues of BGC and NEX/CME are measured based on quarterly revenues from 2013-2018
and 2015-2018, respectively.
Sources: Bloomberg, Eurex, CME, OCC and Federal Reserve
Asset Class Industry Metric Correlation R2
BGC Rates Revenues vs. Fed UST Primary Dealer Volume 55.0% 30.2%
BGC Rates Revenues vs. EUREX Interest Rate Derivatives 67.2% 45.2%
FX BGC FX Revenues vs. CME FX Futures Volume 62.3% 38.8%
CreditBGC Credit Revenues vs. Fed Primary Dealer Corporate
Bond Inventory49.2% 24.2%
Rates BGC Rates Revenues vs. BrokerTec (NEX/CME) Volume 43.4% 18.8%
FX BGC FX Revenues vs.EBS (NEX/CME) Volume 30.9% 9.5%
Small correlation or R squared 0.1 - 0.3, medium 0.31 - 0.5, large if above 0.5.
Rates
Equities and Other
Asset Classes40.7%63.8%
BGC Equities and Other Asset Classes Revenues vs. OCC
Total Industry Equity Option Volume
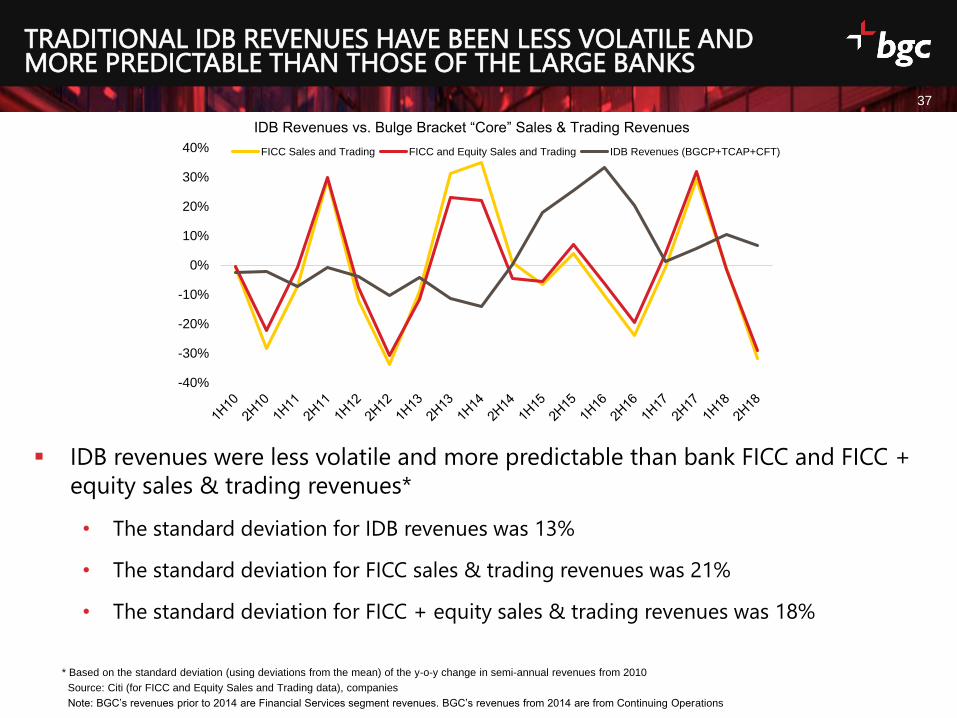
TRADITIONAL IDB REVENUES HAVE BEEN LESS VOLATILE AND MORE PREDICTABLE THAN THOSE OF THE LARGE BANKS
37
IDB revenues were less volatile and more predictable than bank FICC and FICC +
equity sales & trading revenues*
• The standard deviation for IDB revenues was 13%
• The standard deviation for FICC sales & trading revenues was 21%
• The standard deviation for FICC + equity sales & trading revenues was 18%
-40%
-30%
-20%
-10%
0%
10%
20%
30%
40%
IDB Revenues vs. Bulge Bracket “Core” Sales & Trading Revenues
FICC Sales and Trading FICC and Equity Sales and Trading IDB Revenues (BGCP+TCAP+CFT)
* Based on the standard deviation (using deviations from the mean) of the y-o-y change in semi-annual revenues from 2010
Source: Citi (for FICC and Equity Sales and Trading data), companies
Note: BGC’s revenues prior to 2014 are Financial Services segment revenues. BGC’s revenues from 2014 are from Continuing Operations

BGC’S REVENUES HAVE BEEN NEGATIVELY CORRELATED WITH THOSE OF THE LARGE BANKS
38
BGCP’s revenues had a correlation of negative 0.38 and negative 0.28 with bank FICC and
FICC + equity sales & trading revenues, respectively, from 2010
-60%
-40%
-20%
0%
20%
40%
60%
80%
1Q10 3Q10 1Q11 3Q11 1Q12 3Q12 1Q13 3Q13 1Q14 3Q14 1Q15 3Q15 1Q16 3Q16 1Q17 3Q17 1Q18 3Q18
BGCP Revenues vs. Bulge Bracket “Core” Sales & Trading Revenues
FICC Sales and Trading FICC and EquitySales and Trading
BGC Revenues from Continuing Operations
Source: Citi (for FICC and Equity Sales and Trading data)
Note: BGC’s revenues prior to 2014 are Financial Services segment revenues. BGC’s revenues from 2014 are from Continuing Operations

TRADITIONAL IDB REVENUES HAVE BEEN NEGATIVELY CORRELATED WITH THOSE OF THE LARGE BANKS
39
IDB revenues had a correlation of negative 0.23 and negative 0.15 with bank FICC and FICC
+ equity sales & trading revenues, respectively, from 2010
-40%
-30%
-20%
-10%
0%
10%
20%
30%
40%
1H10 2H10 1H11 2H11 1H12 2H12 1H13 2H13 1H14 2H14 1H15 2H15 1H16 2H16 1H17 2H17 1H18 2H18
IDB Revenues vs. Bulge Bracket “Core” Sales & Trading Revenues
FICC Sales and Trading FICC and Equity Sales and Trading IDB Revenues (BGCP+TCAP+CFT)
Source: Citi (for FICC and Equity Sales and Trading data), companies
Note: BGC’s revenues prior to 2014 are Financial Services segment revenues. BGC’s revenues from 2014 are from Continuing Operations. TP ICAP’s revenues prior to 2017 are Tullet Prebon’s
revenues.

DIFFERENCES BETWEEN NON-GAAP AND GAAP CONSOLIDATED RESULTS
40
Non-GAAP Financial Measures
This document contains non-GAAP financial measures that differ from the most directly comparable measures calculated and presented in accordance with
Generally Accepted Accounting Principles in the United States (“GAAP”). Non-GAAP financial measures used by the Company include “Adjusted Earnings before
noncontrolling interests and taxes”, which is used interchangeably with “pre-tax Adjusted Earnings”; “Post-tax Adjusted Earnings to fully diluted shareholders”,
which is used interchangeably with “post-tax Adjusted Earnings”; “Adjusted EBITDA”; and “Liquidity”. The definitions of these terms are below.
Adjusted Earnings Defined
BGC uses non-GAAP financial measures, including “Adjusted Earnings before noncontrolling interests and taxes” and “Post-tax Adjusted Earnings to fully diluted
shareholders”, which are supplemental measures of operating results used by management to evaluate the financial performance of the Company and its
consolidated subsidiaries. BGC believes that Adjusted Earnings best reflect the operating earnings generated by the Company on a consolidated basis and are
the earnings which management considers when managing its business.
As compared with “Income (loss) from continuing operations before income taxes” and “Net income (loss) from continuing operations for fully diluted shares”,
both prepared in accordance with GAAP, Adjusted Earnings calculations primarily exclude certain non-cash items and other expenses that generally do not
involve the receipt or outlay of cash by the Company and/or which do not dilute existing stockholders. In addition, Adjusted Earnings calculations exclude certain
gains and charges that management believes do not best reflect the ordinary results of BGC. Adjusted Earnings is calculated by taking the most comparable
GAAP measures and making adjustments for certain items with respect to compensation expenses, non-compensation expenses, and other income, as discussed
below.
Calculations of Compensation Adjustments for Adjusted Earnings and Adjusted EBITDA The Company’s Adjusted Earnings and Adjusted EBITDA measures exclude all GAAP charges included in the line item “Equity-based compensation and
allocations of net income to limited partnership units and FPUs” (or “equity-based compensation” for purposes of defining the Company’s non-GAAP results) as
recorded on the Company’s GAAP Consolidated Statements of Operations and GAAP Consolidated Statements of Cash Flows. These GAAP equity-based
compensation charges reflect the following items:
Charges with respect to grants of exchangeability, which reflect the right of holders of limited partnership units with no capital accounts, such as LPUs and
PSUs, to exchange these units into shares of common stock, or into partnership units with capital accounts, such as HDUs, as well as cash paid with respect
to taxes withheld or expected to be owed by the unit holder upon such exchange. The withholding taxes related to the exchange of certain non-
exchangeable units without a capital account into either common shares or units with a capital account may be funded by the redemption of preferred
units such as PPSUs.
Charges with respect to preferred units. Any preferred units would not be included in the Company’s fully diluted share count because they cannot be
made exchangeable into shares of common stock and are entitled only to a fixed distribution. Preferred units are granted in connection with the grant of
certain limited partnership units that may be granted exchangeability at ratios designed to cover any withholding taxes expected to be paid by the unit
holder upon exchange. This is an alternative to the common practice among public companies of issuing the gross amount of shares to employees, subject
to cashless withholding of shares, to pay applicable withholding taxes.
GAAP equity-based compensation charges with respect to the grant of an offsetting amount of common stock or partnership units with capital accounts in
connection with the redemption of non-exchangeable units, including PSUs and LPUs.
Charges related to amortization of RSUs and limited partnership units.
Charges related to grants of equity awards, including common stock or partnership units with capital accounts.

DIFFERENCES BETWEEN NON-GAAP AND GAAP CONSOLIDATED RESULTS [CONTINUED]
41
Allocations of net income to limited partnership units and FPUs. Such allocations represent the pro-rata portion of post-tax GAAP earnings available to such
unit holders.
The amount of certain quarterly equity-based compensation charges are based upon the Company’s estimate of such expected charges during the annual period,
as described further below under “Methodology for Calculating Adjusted Earnings Taxes.”
Virtually all of BGC’s key executives and producers have equity or partnership stakes in the Company and its subsidiaries and generally receive deferred equity or
limited partnership units as part of their compensation. A significant percentage of BGC’s fully diluted shares are owned by its executives, partners and employees.
The Company issues limited partnership units as well as other forms of equity-based compensation, including grants of exchangeability into shares of common
stock, to provide liquidity to its employees, to align the interests of its employees and management with those of common stockholders, to help motivate and
retain key employees, and to encourage a collaborative culture that drives cross-selling and revenue growth.
All share equivalents that are part of the Company’s equity-based compensation program, including REUs, PSUs, LPUs, HDUs, and other units that may be made
exchangeable into common stock, as well as RSUs (which are recorded using the treasury stock method), are included in the fully diluted share count when issued
or at the beginning of the subsequent quarter after the date of grant. Generally, limited partnership units other than preferred units are expected to be paid a pro-
rata distribution based on BGC’s calculation of Adjusted Earnings per fully diluted share.
Compensation charges are also adjusted for certain other non-cash items, including those related to the amortization of GFI employee forgivable loans granted
prior to the closing of the January 11, 2016 back-end merger with GFI.
Calculation of Non-Compensation Adjustments for Adjusted Earnings Adjusted Earnings calculations may also exclude items such as:
Non-cash GAAP charges related to the amortization of intangibles with respect to acquisitions;
Acquisition related costs;
Certain non-cash charges of amortized rents;
Non-cash GAAP asset impairment charges; and
Various other GAAP items that management views as not reflective of the Company’s underlying performance.
Calculation of Adjustments for Other (income) losses for Adjusted Earnings Adjusted Earnings calculations also exclude certain other non-cash, non-dilutive, and/or non-economic items, which may, in some periods, include:
Gains or losses on divestitures;
Fair value adjustment of investments;
Certain other GAAP items, including gains or losses related to BGC's investments accounted for under the equity method; and
Any unusual, one-time, non-ordinary, or non-recurring gains or losses.

DIFFERENCES BETWEEN NON-GAAP AND GAAP CONSOLIDATED RESULTS [CONTINUED]
42
Methodology for Calculating Adjusted Earnings Taxes
Although Adjusted Earnings are calculated on a pre-tax basis, BGC also reports post-tax Adjusted Earnings to fully diluted shareholders. The Company
defines post-tax Adjusted Earnings to fully diluted shareholders as pre-tax Adjusted Earnings reduced by the non-GAAP tax provision described below
and net income (loss) attributable to noncontrolling interest for Adjusted Earnings.
The Company calculates its tax provision for post-tax Adjusted Earnings using an annual estimate similar to how it accounts for its income tax provision
under GAAP. To calculate the quarterly tax provision under GAAP, BGC estimates its full fiscal year GAAP income (loss) from continuing operations before
income taxes and noncontrolling interests in subsidiaries and the expected inclusions and deductions for income tax purposes, including expected equity-
based compensation during the annual period. The resulting annualized tax rate is applied to BGC’s quarterly GAAP income (loss) from operations before
income taxes and noncontrolling interests in subsidiaries. At the end of the annual period, the Company updates its estimate to reflect the actual tax
amounts owed for the period.
To determine the non-GAAP tax provision, BGC first adjusts pre-tax Adjusted Earnings by recognizing any, and only, amounts for which a tax deduction
applies under applicable law. The amounts include charges with respect to equity-based compensation; certain charges related to employee loan
forgiveness; certain net operating loss carryforwards when taken for statutory purposes; and certain charges related to tax goodwill amortization. These
adjustments may also reflect timing and measurement differences, including treatment of employee loans; changes in the value of units between the
dates of grants of exchangeability and the date of actual unit exchange; variations in the value of certain deferred tax assets; and liabilities and the
different timing of permitted deductions for tax under GAAP and statutory tax requirements.
After application of these adjustments, the result is the Company’s taxable income for its pre-tax Adjusted Earnings, to which BGC then applies the
statutory tax rates to determine its non-GAAP tax provision. BGC views the effective tax rate on pre-tax Adjusted Earnings as equal to the amount of its
non-GAAP tax provision divided by the amount of pre-tax Adjusted Earnings.
Generally, the most significant factor affecting this non-GAAP tax provision is the amount of charges relating to equity-based compensation. Because the
charges relating to equity-based compensation are deductible in accordance with applicable tax laws, increases in such charges have the effect of
lowering the Company’s non-GAAP effective tax rate and thereby increasing its post-tax Adjusted Earnings.
BGC incurs income tax expenses based on the location, legal structure and jurisdictional taxing authorities of each of its subsidiaries. Certain of the
Company’s entities are taxed as U.S. partnerships and are subject to the Unincorporated Business Tax (“UBT”) in New York City. Any U.S. federal and state
income tax liability or benefit related to the partnership income or loss, with the exception of UBT, rests with the unit holders rather than with the
partnership entity. The Company’s consolidated financial statements include U.S. federal, state and local income taxes on the Company’s allocable share
of the U.S. results of operations. Outside of the U.S., BGC is expected to operate principally through subsidiary corporations subject to local income taxes.
For these reasons, taxes for Adjusted Earnings are expected to be presented to show the tax provision the consolidated Company would expect to pay if
100 percent of earnings were taxed at global corporate rates.

DIFFERENCES BETWEEN NON-GAAP AND GAAP CONSOLIDATED RESULTS [CONTINUED]
43
Calculations of Pre- and Post-Tax Adjusted Earnings per Share
BGC’s pre- and post-tax Adjusted Earnings per share calculations assume either that:
The fully diluted share count includes the shares related to any dilutive instruments, but excludes the associated expense, net of tax, when the impact
would be dilutive; or
The fully diluted share count excludes the shares related to these instruments, but includes the associated expense, net of tax.
The share count for Adjusted Earnings excludes certain shares and share equivalents expected to be issued in future periods but not yet eligible to receive
dividends and/or distributions. Each quarter, the dividend payable to BGC’s stockholders, if any, is expected to be determined by the Company’s Board of
Directors with reference to a number of factors, including post-tax Adjusted Earnings per share. BGC may also pay a pro-rata distribution of net income to limited
partnership units, as well as to Cantor for its noncontrolling interest. The amount of this net income, and therefore of these payments per unit, would be
determined using the above definition of Adjusted Earnings per share on a pre-tax basis.
The declaration, payment, timing and amount of any future dividends payable by the Company will be at the discretion of its Board of Directors using the fully
diluted share count. For more information on any share count adjustments, see the table titled “Fully Diluted Weighted-Average Share Count under GAAP and for
Adjusted Earnings from Continuing Operations”.
Management Rationale for Using Adjusted Earnings
BGC’s calculation of Adjusted Earnings excludes the items discussed above because the Company views doing so as a better reflection of BGC’s ongoing
operations. Management uses Adjusted Earnings in part to help it evaluate, among other things, the overall performance of the Company’s business, to make
decisions with respect to the Company’s operations, and to determine the amount of dividends payable to common stockholders and distributions payable to
holders of limited partnership units. Dividends payable to common stockholders and distributions payable to holders of limited partnership units are included
within “Dividends to stockholders” and “Earnings distributions to limited partnership interests and noncontrolling interests,” respectively, in our unaudited,
condensed, consolidated statements of cash flows.
The term “Adjusted Earnings” should not be considered in isolation or as an alternative to GAAP net income (loss). The Company views Adjusted Earnings as a
metric that is not indicative of liquidity, or the cash available to fund its operations, but rather as a performance measure. Pre- and post-tax Adjusted Earnings, as
well as related measures, are not intended to replace the Company’s presentation of its GAAP financial results. However, management believes that these
measures help provide investors with a clearer understanding of BGC’s financial performance and offer useful information to both management and investors
regarding certain financial and business trends related to the Company’s financial condition and results of operations. Management believes that the GAAP and
Adjusted Earnings measures of financial performance should be considered together.
For more information regarding Adjusted Earnings, see the sections of this document and/or the Company’s most recent financial results press release titled
“Reconciliation of GAAP Income (Loss) from Continuing Operations before Income Taxes to Adjusted Earnings from Continuing Operations and GAAP Fully
Diluted EPS from Continuing Operations to Post-Tax Adjusted EPS from Continuing Operations”, including the related footnotes, for details about how BGC’s
non-GAAP results are reconciled to those under GAAP.

DIFFERENCES BETWEEN NON-GAAP AND GAAP CONSOLIDATED RESULTS [CONTINUED]
44
Adjusted EBITDA Defined
BGC also provides an additional non-GAAP financial performance measure, “Adjusted EBITDA”, which it defines as GAAP “Net income (loss) from continuing
operations available to common stockholders”, adjusted to add back the following items:
Provision (benefit) for income taxes;
Net income (loss) from continuing operations attributable to noncontrolling interest in subsidiaries;
Interest expense;
Fixed asset depreciation and intangible asset amortization;
Equity-based compensation and allocations of net income to limited partnership units and FPUs;
Impairment of long-lived assets;
(Gains) losses on equity method investments; and
Certain other non-cash GAAP items, such as non-cash charges of amortized rents incurred by the Company for its new UK based headquarters.
The Company’s management believes that its Adjusted EBITDA measure is useful in evaluating BGC’s operating performance, because the calculation of this
measure generally eliminates the effects of financing and income taxes and the accounting effects of capital spending and acquisitions, which would include
impairment charges of goodwill and intangibles created from acquisitions. Such items may vary for different companies for reasons unrelated to overall
operating performance. As a result, the Company’s management uses this measure to evaluate operating performance and for other discretionary purposes. BGC
believes that Adjusted EBITDA is useful to investors to assist them in getting a more complete picture of the Company’s financial results and operations.
Since BGC’s Adjusted EBITDA is not a recognized measurement under GAAP, investors should use this measure in addition to GAAP measures of net income
when analyzing BGC’s operating performance. Because not all companies use identical EBITDA calculations, the Company’s presentation of Adjusted EBITDA may
not be comparable to similarly titled measures of other companies. Furthermore, Adjusted EBITDA is not intended to be a measure of free cash flow or GAAP
cash flow from operations because the Company’s Adjusted EBITDA does not consider certain cash requirements, such as tax and debt service payments.
For more information regarding Adjusted EBITDA, see the section of this document and/or the Company’s most recent financial results press release titled
“Reconciliation of GAAP Income (Loss) from Continuing Operations Available to Common Stockholders to Adjusted EBITDA from Continuing Operations”,
including the footnotes to the same, for details about how BGC’s non-GAAP results are reconciled to those under GAAP.
Timing of Outlook for Certain GAAP and Non-GAAP Items
BGC anticipates providing forward-looking guidance for GAAP revenues and for certain non-GAAP measures from time to time. However, the Company does not
anticipate providing an outlook for other GAAP results. This is because certain GAAP items, which are excluded from Adjusted Earnings and/or Adjusted EBITDA,
are difficult to forecast with precision before the end of each period. The Company therefore believes that it is not possible for it to have the required
information necessary to forecast GAAP results or to quantitatively reconcile GAAP forecasts to non-GAAP forecasts with sufficient precision without
unreasonable efforts. For the same reasons, the Company is unable to address the probable significance of the unavailable information. The relevant items that
are difficult to predict on a quarterly and/or annual basis with precision and may materially impact the Company’s GAAP results include, but are not limited, to
the following:

DIFFERENCES BETWEEN NON-GAAP AND GAAP CONSOLIDATED RESULTS [CONTINUED]
45
Certain equity-based compensation charges that may be determined at the discretion of management throughout and up to the period-end;
Unusual, one-time, non-ordinary, or non-recurring items;
The impact of gains or losses on certain marketable securities, as well as any gains or losses related to associated mark-to-market movements
and/or hedging. These items are calculated using period-end closing prices;
Non-cash asset impairment charges, which are calculated and analyzed based on the period-end values of the underlying assets. These amounts
may not be known until after period-end;
Acquisitions, dispositions and/or resolutions of litigation, which are fluid and unpredictable in nature.
Liquidity Defined
BGC may also use a non-GAAP measure called “liquidity”. The Company considers liquidity to be comprised of the sum of cash and cash equivalents,
reverse repurchase agreements (if any), securities owned, and marketable securities, less securities lent out in securities loaned transactions and
repurchase agreements (if any). The Company considers liquidity to be an important metric for determining the amount of cash that is available or that
could be readily available to the Company on short notice.
For more information regarding Liquidity, see the section of this document and/or the Company’s most recent financial results press release titled
“Liquidity Analysis from Continuing Operations”, including any footnotes to the same, for details about how BGC’s non-GAAP results are reconciled to
those under GAAP.

RECONCILIATION OF GAAP INCOME (LOSS) FROM CONTINUING OPERATIONS BEFORE INCOME TAXES TO ADJUSTED EARNINGS FROM
CONTINUING OPERATIONS AND GAAP FULLY DILUTED EPS FROM CONTINUING OPERATIONS TO POST-TAX ADJUSTED EPS FROM CONTINUING
OPERATIONS (IN THOUSANDS, EXCEPT PER SHARE DATA) (UNAUDITED)
46
Please see footnotes to this table on the next page.
Q2 2019 Q2 2018
GAAP income (loss) from continuing operations before income taxes 36,758$ 46,930$
Pre-tax adjustments:
Compensation adjustments:
Equity-based compensation and allocations of net income to limited partnership units and FPUs (1) 43,752 45,602
Other Compensation charges (2) 1,141 907
Total Compensation adjustments 44,893 46,509
Non-Compensation adjustments:
Amortization of intangibles (3) 8,312 6,307
Acquisition related costs 1,418 360
Amortization of rent expense (4) 2,247 -
Impairment charges 896 -
Other (5) 4,795 1,773
Total Non-Compensation adjustments 17,668 8,440
Other income (losses), net adjustments:
Losses (gains) on divestitures 1,619 -
Fair value adjustment of investments (6) - (432)
Other net (gains) losses (7) 1,338 10
Total other income (losses), net adjustments 2,957 (422)
Total pre-tax adjustments 65,518 54,527
Adjusted Earnings from continuing operations before noncontrolling interest in subsidiaries and taxes 102,276$ 101,457$
GAAP net income (loss) from continuing operations available to common stockholders 13,611$ 20,001$
Allocation of net income (loss) from continuing operations to noncontrolling interest in subsidiaries (8) 7,636 9,642
Total pre-tax adjustments (from above) 65,518 54,527
Income tax adjustment to reflect adjusted earnings taxes (9) 3,061 3,358
Post-tax adjusted earnings from continuing operations 89,826$ 87,528$
Per Share Data
GAAP net income (loss) from continuing operations for fully diluted shares 0.04$ 0.06$
Less: Allocations of net income (loss) from continuing operations to limited partnership units, FPUs, and noncontrolling interest
in subsidiaries, net of tax - -
Total pre-tax adjustments (from above) 0.13 0.11
Income tax adjustment to reflect adjusted earnings taxes 0.01 0.01
Post-tax adjusted earnings per share from continuing operations 0.17$ 0.18$
Fully diluted weighted-average shares of common stock outstanding 522,984 481,461
Dividends declared per share of common stock 0.14$ 0.18$
Dividends declared and paid per share of common stock 0.14$ 0.18$
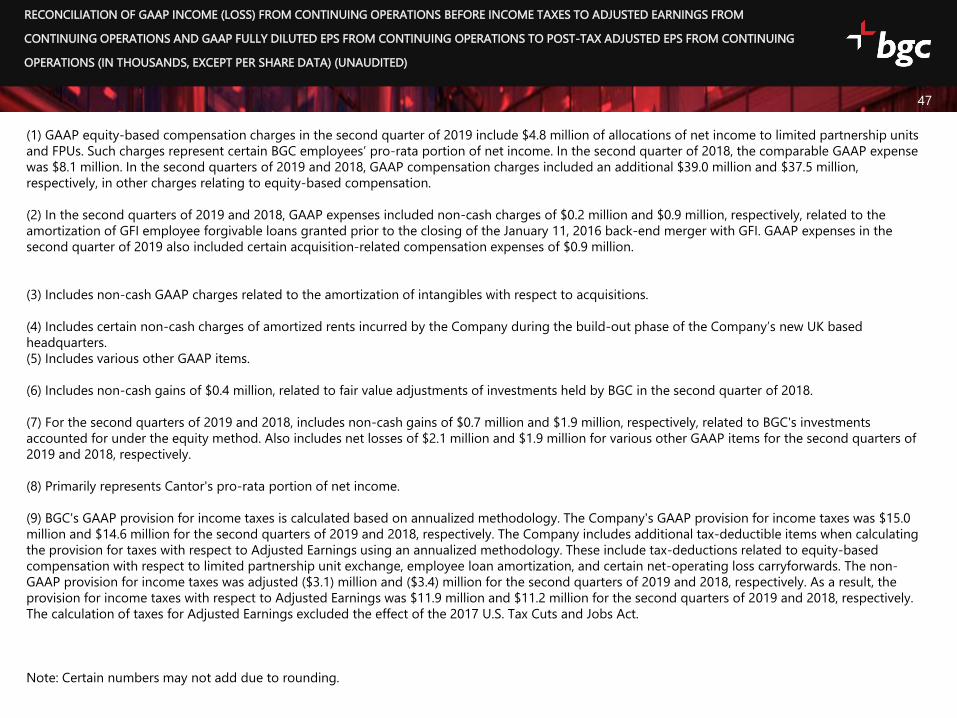
47
(1) GAAP equity-based compensation charges in the second quarter of 2019 include $4.8 million of allocations of net income to limited partnership units
and FPUs. Such charges represent certain BGC employees’ pro-rata portion of net income. In the second quarter of 2018, the comparable GAAP expense
was $8.1 million. In the second quarters of 2019 and 2018, GAAP compensation charges included an additional $39.0 million and $37.5 million,
respectively, in other charges relating to equity-based compensation.
(2) In the second quarters of 2019 and 2018, GAAP expenses included non-cash charges of $0.2 million and $0.9 million, respectively, related to the
amortization of GFI employee forgivable loans granted prior to the closing of the January 11, 2016 back-end merger with GFI. GAAP expenses in the
second quarter of 2019 also included certain acquisition-related compensation expenses of $0.9 million.
(3) Includes non-cash GAAP charges related to the amortization of intangibles with respect to acquisitions.
(4) Includes certain non-cash charges of amortized rents incurred by the Company during the build-out phase of the Company’s new UK based
headquarters.
(5) Includes various other GAAP items.
(6) Includes non-cash gains of $0.4 million, related to fair value adjustments of investments held by BGC in the second quarter of 2018.
(7) For the second quarters of 2019 and 2018, includes non-cash gains of $0.7 million and $1.9 million, respectively, related to BGC's investments
accounted for under the equity method. Also includes net losses of $2.1 million and $1.9 million for various other GAAP items for the second quarters of
2019 and 2018, respectively.
(8) Primarily represents Cantor's pro-rata portion of net income.
(9) BGC's GAAP provision for income taxes is calculated based on annualized methodology. The Company's GAAP provision for income taxes was $15.0
million and $14.6 million for the second quarters of 2019 and 2018, respectively. The Company includes additional tax-deductible items when calculating
the provision for taxes with respect to Adjusted Earnings using an annualized methodology. These include tax-deductions related to equity-based
compensation with respect to limited partnership unit exchange, employee loan amortization, and certain net-operating loss carryforwards. The non-
GAAP provision for income taxes was adjusted ($3.1) million and ($3.4) million for the second quarters of 2019 and 2018, respectively. As a result, the
provision for income taxes with respect to Adjusted Earnings was $11.9 million and $11.2 million for the second quarters of 2019 and 2018, respectively.
The calculation of taxes for Adjusted Earnings excluded the effect of the 2017 U.S. Tax Cuts and Jobs Act.
Note: Certain numbers may not add due to rounding.
RECONCILIATION OF GAAP INCOME (LOSS) FROM CONTINUING OPERATIONS BEFORE INCOME TAXES TO ADJUSTED EARNINGS FROM
CONTINUING OPERATIONS AND GAAP FULLY DILUTED EPS FROM CONTINUING OPERATIONS TO POST-TAX ADJUSTED EPS FROM CONTINUING
OPERATIONS (IN THOUSANDS, EXCEPT PER SHARE DATA) (UNAUDITED)

RECONCILIATION OF GAAP NET INCOME (LOSS) FROM CONTINUING OPERATIONS TO ADJUSTED EBITDA FROM CONTINUING OPERATIONS(IN THOUSANDS) (UNAUDITED)
48
(1) Primarily represents Cantor's pro-rata portion of net income.
(2) Represents BGC employees' pro-rata portion of net income and non-cash and non-dilutive charges relating to equity-based compensation.
(3) Non-cash gains related to BGC's investments accounted for under the equity method.
(4) Non-cash charges of amortized rents incurred by the Company during the build-out phase of the Company’s new UK based headquarters.
Q2 2019 Q2 2018
GAAP net income (loss) from continuing operations available to common stockholders 13,611$ 20,001$
Add back:
Provision (benefit) for income taxes 14,993 14,571
Net income (loss) from continuing operations attributable to noncontrolling interest in subsidiaries (1) 8,154 12,358
Interest expense 14,985 10,028
Fixed asset depreciation and intangible asset amortization 20,070 16,275
Impairment of long-lived assets 684 1,835
Equity-based compensation and allocations of net income to limited partnership units and FPUs (2) 43,752 45,602
(Gains) losses on equity method investments (3) (738) (1,011)
Other non-cash GAAP items (4) 1,110 -
Adjusted EBITDA from continuing operations 116,621$ 119,659$

LIQUIDITY ANALYSIS FROM CONTINUING OPERATIONS (IN THOUSANDS) (UNAUDITED)
49
(1) As of June 30, 2019 and December 31, 2018, $12.3 million and $15.1 million, respectively, of Marketable securities on our
balance sheet were lent out in Securities loaned transactions and therefore are not included as part of our Liquidity Analysis.
June 30, 2019 December 31, 2018
Cash and cash equivalents 399,429$ 336,535$
Repurchase agreements (1,100) (986)
Securities owned 62,085 58,408
Marketable securities (1) 482 16,924
Total Liquidity 460,896$ 410,881$

FULLY DILUTED WEIGHTED-AVERAGE SHARE COUNT UNDER GAAP AND FOR ADJUSTED EARNINGS FROM CONTINUING OPERATIONS (IN THOUSANDS) (UNAUDITED)
50
Q2 2019 Q2 2018
Common stock outstanding 341,272 321,199
Limited partnership units 115,433 —
Cantor units 52,363 —
Founding partner units 12,483 —
RSUs 57 311
Other 1,376 1,210
Fully diluted weighted-average share count under GAAP from continuing
operations 522,984 322,720
Non-GAAP Adjustments:
Limited partnership units — 96,162
Cantor units — 50,439
Founding partner units — 12,140
Fully diluted weighted-average share count for Adjusted Earnings from continuing
operations 522,984 481,461

5151
ir.bgcpartners.com
twitter.com/bgcpartners
linkedin.com/company/bgc-partners
Media Contact:
Karen Laureano-Rikardsen
+1 212-829-4975
Investor Contact:
Ujjal Basu Roy Jason McGruder
+1 212-610-2426 +1 212-610-2426